| | | FREE WRITING PROSPECTUS |
| | | FILED PURSUANT TO RULE 433 |
| | | REGISTRATION FILE NO.: 333-255934-06 |
| Dated July 19, 2023 | BMO 2023-5C1 |
Structural and Collateral Term Sheet |
BMO 2023-5C1 Mortgage Trust |
$766,291,091 (Approximate Mortgage Pool Balance) |
| |
$[ ] (Approximate Offered Certificates) |
| |
BMO Commercial Mortgage Securities LLC Depositor |
| |
Commercial Mortgage Pass-Through Certificates, Series 2023-5C1 |
Bank of Montreal 3650 Real Estate Investment Trust 2 LLC Citi Real Estate Funding Inc. Societe Generale Financial Corporation German American Capital Corporation Goldman Sachs Mortgage Company Starwood Mortgage Capital LLC LMF Commercial, LLC KeyBank National Association Sponsors and Mortgage Loan Sellers |
BMO Capital
Markets | Citigroup | Société
Générale | Goldman
Sachs &
Co. LLC | KeyBanc
Capital
Markets | Deutsche
Bank
Securities |
| Co-Lead Managers and Joint Bookrunners |
Bancroft Capital, LLC
Co-Manager | Drexel Hamilton
Co-Manager |
| THE INFORMATION IN THIS STRUCTURAL AND COLLATERAL TERM SHEET IS NOT COMPLETE AND MAY BE AMENDED PRIOR TO THE TIME OF SALE. THIS TERM SHEET IS NOT AN OFFER TO SELL THESE SECURITIES AND IT IS NOT A SOLICITATION OF AN OFFER TO BUY THESE SECURITIES IN ANY JURISDICTION WHERE THE OFFER OR SALE IS NOT PERMITTED. |
| Dated July 19, 2023 | BMO 2023-5C1 |
This material is for your information, and none of BMO Capital Markets Corp., Citigroup Global Markets Inc., Deutsche Bank Securities Inc., Goldman Sachs & Co. LLC, KeyBanc Capital Markets Inc., SG Americas Securities, LLC, Bancroft Capital, LLC and Drexel Hamilton, LLC (the “Underwriters”) are soliciting any action based upon it. This material is not to be construed as an offer to sell or the solicitation of any offer to buy any security in any jurisdiction where such an offer or solicitation would be illegal.
The depositor has filed a registration statement (including the prospectus) with the Securities and Exchange Commission (File No. 333-255934) for the offering to which this communication relates. Before you invest, you should read the prospectus in the registration statement and other documents the depositor has filed with the Securities and Exchange Commission for more complete information about the depositor, the issuing entity and this offering. You may get these documents for free by visiting EDGAR on the SEC website at www.sec.gov. Alternatively, the depositor or BMO Capital Markets Corp., any other underwriter, or any dealer participating in this offering will arrange to send you the prospectus if you request it by calling 1-866-864-7760. The Offered Certificates referred to in these materials, and the asset pool backing them, are subject to modification or revision (including the possibility that one or more Classes of Certificates may be split, combined or eliminated at any time prior to issuance or availability of a final prospectus) and are offered on a “when, as and if issued” basis. You understand that, when you are considering the purchase of these Certificates, a contract of sale will come into being no sooner than the date on which the relevant Class has been priced and we have verified the allocation of Certificates to be made to you; any “indications of interest” expressed by you, and any “soft circles” generated by us, will not create binding contractual obligations for you or us.
Neither this document nor anything contained in this document shall form the basis for any contract or commitment whatsoever. The information contained in this document is preliminary as of the date of this document, supersedes any previous such information delivered to you and will be superseded by any such information subsequently delivered prior to the time of sale. These materials are subject to change, completion or amendment from time to time. The information should be reviewed only in conjunction with the entire offering document relating to the Commercial Mortgage Pass-Through Certificates, Series 2023-5C1 (the “Offering Document”). All of the information contained herein is subject to the same limitations and qualifications contained in the Offering Document. The information contained herein does not contain all relevant information relating to the underlying mortgage loans or mortgaged properties. Such information is described elsewhere in the Offering Document. The information contained herein will be more fully described elsewhere in the Offering Document. The information contained herein should not be viewed as projections, forecasts, predictions or opinions with respect to value. Prior to making any investment decision, prospective investors are strongly urged to read the Offering Document its entirety. Neither the Securities and Exchange Commission nor any state securities commission has approved or disapproved of these securities or determined if this free writing prospectus is truthful or complete. Any representation to the contrary is a criminal offense.
This document has been prepared by the Underwriters for information purposes only and does not constitute, in whole or in part, a prospectus for the purposes of Regulation (EU) 2017/1129 (as amended or superseded) and/or Part VI of the Financial Services and Markets Act 2000 (as amended) or other offering document.
The attached information contains certain tables and other statistical analyses (the “Computational Materials”) which have been prepared in reliance upon information furnished by the Mortgage Loan Sellers. Numerous assumptions were used in preparing the Computational Materials, which may or may not be reflected herein. As such, no assurance can be given as to the Computational Materials’ accuracy, appropriateness or completeness in any particular context; or as to whether the Computational Materials and/or the assumptions upon which they are based reflect present market conditions or future market performance. The Computational Materials should not be construed as either projections or predictions or as legal, tax, financial or accounting advice. You should consult your own counsel, accountant and other advisors as to the legal, tax, business, financial and related aspects of a purchase of these Certificates. Any weighted average lives, yields and principal payment periods shown in the Computational Materials are based on prepayment and/or loss assumptions, and changes in such prepayment and/or loss assumptions may dramatically affect such weighted average lives, yields and principal payment periods. In addition, it is possible that prepayments or losses on the underlying assets will occur at rates higher or lower than the rates shown in the attached Computational Materials. The specific characteristics of the Certificates may differ from those shown in the Computational Materials due to differences between the final underlying assets and the preliminary underlying assets used in preparing the Computational Materials. The principal amount and designation of any security described in the Computational Materials are subject to change prior to issuance. None of the Underwriters or any of their respective affiliates make any representation or warranty as to the actual rate or timing of payments or losses on any of the underlying assets or the payments or yield on the Certificates. The information in this presentation is based upon management forecasts and reflects prevailing conditions and management’s views as of this date, all of which are subject to change. In preparing this presentation, we have relied upon and assumed, without independent verification, the accuracy and completeness of all information available from public sources or which was provided to us by or on behalf of the Mortgage Loan Sellers or which was otherwise reviewed by us.
This document contains forward-looking statements. If and when included in this document, the words “expects”, “intends”, “anticipates”, “estimates” and analogous expressions and all statements that are not historical facts, including statements about our beliefs or expectations, are intended to identify forward-looking statements. Any forward-looking statements are made subject to risks and uncertainties which could cause actual results to differ materially from those stated. Those risks and uncertainties include, among other things, declines in general economic and business conditions, increased competition, changes in demographics, changes in political and social conditions, regulatory initiatives and changes in consumer preferences, many of which are beyond our control and the control of any other person or entity related to this offering. The forward-looking statements made in this document are made as of the date hereof. We have no obligation to update or revise any forward-looking statement.
BMO Capital Markets is a trade name used by BMO Financial Group for the wholesale banking businesses of Bank of Montreal, BMO Harris Bank N.A. (member FDIC), Bank of Montreal Europe p.l.c, and Bank of Montreal (China) Co. Ltd, the institutional broker dealer business of BMO Capital Markets Corp. (Member FINRA and SIPC) and the agency broker dealer business of Clearpool Execution Services, LLC (Member FINRA and SIPC) in the U.S., and the institutional broker dealer businesses of BMO Nesbitt Burns Inc. (Member Investment Industry Regulatory Organization of Canada and Member Canadian Investor Protection Fund) in Canada and Asia, Bank of Montreal Europe p.l.c. (authorized and regulated by the Central Bank of Ireland) in Europe and BMO Capital Markets Limited (authorized and regulated by the Financial Conduct Authority) in the UK and Australia.
Securities and investment banking activities in the United States are performed by Deutsche Bank Securities Inc., a member of NYSE, FINRA and SIPC, and its broker-dealer affiliates. Lending and other commercial banking activities in the United States are performed by Deutsche Bank AG and its banking affiliates.
IMPORTANT NOTICE RELATING TO AUTOMATICALLY-GENERATED EMAIL DISCLAIMERS
Any legends, disclaimers or other notices that may appear at the bottom of any email communication to which this document is attached relating to (1) these materials not constituting an offer (or a solicitation of an offer), (2) no representation that these materials are accurate or complete and may not be updated or (3) these materials possibly being confidential, are not applicable to these materials and should be disregarded. Such legends, disclaimers or other notices have been automatically generated as a result of these materials having been sent via Bloomberg or another system.
| THE INFORMATION IN THIS STRUCTURAL AND COLLATERAL TERM SHEET IS NOT COMPLETE AND MAY BE AMENDED PRIOR TO THE TIME OF SALE. THIS TERM SHEET IS NOT AN OFFER TO SELL THESE SECURITIES AND IT IS NOT A SOLICITATION OF AN OFFER TO BUY THESE SECURITIES IN ANY JURISDICTION WHERE THE OFFER OR SALE IS NOT PERMITTED. |
| | 2 | |
| Dated July 19, 2023 | BMO 2023-5C1 |
THE CERTIFICATES REFERRED TO IN THESE MATERIALS ARE SUBJECT TO MODIFICATION OR REVISION (INCLUDING THE POSSIBILITY THAT ONE OR MORE CLASSES OF CERTIFICATES MAY BE SPLIT, COMBINED OR ELIMINATED AT ANY TIME PRIOR TO ISSUANCE OR AVAILABILITY OF A FINAL PROSPECTUS) AND ARE OFFERED ON A “WHEN, AS AND IF ISSUED” BASIS.
THE UNDERWRITERS MAY FROM TIME TO TIME PERFORM INVESTMENT BANKING SERVICES FOR, OR SOLICIT INVESTMENT BANKING BUSINESS FROM, ANY COMPANY NAMED IN THESE MATERIALS. THE UNDERWRITERS AND/OR THEIR AFFILIATES OR RESPECTIVE EMPLOYEES MAY FROM TIME TO TIME HAVE A LONG OR SHORT POSITION IN ANY CERTIFICATE OR CONTRACT DISCUSSED IN THESE MATERIALS.
| THE INFORMATION IN THIS STRUCTURAL AND COLLATERAL TERM SHEET IS NOT COMPLETE AND MAY BE AMENDED PRIOR TO THE TIME OF SALE. THIS TERM SHEET IS NOT AN OFFER TO SELL THESE SECURITIES AND IT IS NOT A SOLICITATION OF AN OFFER TO BUY THESE SECURITIES IN ANY JURISDICTION WHERE THE OFFER OR SALE IS NOT PERMITTED. |
| | 3 | |
| Structural and Collateral Term Sheet | | BMO 2023-5C1 |
| Collateral Characteristics |
Mortgage Loan Seller | Number of Mortgage Loans | Number of Mortgaged Properties | Aggregate
Cut-off Date Balance | | Roll-up Aggregate Cut-off Date Balance | Roll-up Aggregate % of Cut-off Date Balance |
| BMO | 5 | 10 | $94,092,102 | 12.3% | $153,592,102 | 20.0% |
| 3650 REIT | 3 | 9 | $124,800,000 | 16.3% | $153,300,000 | 20.0% |
| CREFI | 4 | 49 | $80,920,000 | 10.6% | $100,920,000 | 13.2% |
| SGFC | 4 | 5 | $100,250,000 | 13.1% | $100,250,000 | 13.1% |
| GACC | - | - | - | - | $83,500,000 | 10.9% |
| GSMC | 1 | 1 | $62,500,000 | 8.2% | $75,000,000 | 9.8% |
| SMC | 2 | 2 | $19,178,989 | 2.5% | $44,178,989 | 5.8% |
| LMF | - | - | - | - | $35,000,000 | 4.6% |
| KeyBank | 2 | 4 | $20,550,000 | 2.7% | $20,550,000 | 2.7% |
| LMF, BMO | 1 | 1 | $62,500,000 | 8.2% | - | - |
| GACC, 3650 REIT | 1 | 1 | $62,500,000 | 8.2% | - | - |
| GACC, BMO | 1 | 1 | $52,000,000 | 6.8% | - | - |
| GACC, GSMC | 1 | 1 | $30,000,000 | 3.9% | - | - |
| BMO, SMC | 1 | 1 | $27,000,000 | 3.5% | - | - |
| CREFI, BMO | 1 | 1 | $30,000,000 | 3.9% | - | - |
| Total: | 27 | 86 | $766,291,091 | 100.0% | $766,291,091 | 100.0% |
| Loan Pool | |
| | Initial Pool Balance (“IPB”): | $766,291,091 |
| | Number of Mortgage Loans: | 27 |
| | Number of Mortgaged Properties: | 86 |
| | Average Cut-off Date Balance per Mortgage Loan: | $28,381,152 |
| | Weighted Average Current Mortgage Rate: | 7.13502% |
| | 10 Largest Mortgage Loans as % of IPB: | 67.0% |
| | Weighted Average Remaining Term to Maturity: | 58 months |
| | Weighted Average Seasoning: | 2 months |
| | | |
| Credit Statistics | |
| | Weighted Average UW NCF Debt Service Coverage Ratio (“DSCR”): | 1.65x |
| | Weighted Average UW NOI Debt Yield (“DY”): | 12.2% |
| | Weighted Average Cut-off Date Loan-to-Value Ratio (“LTV”): | 51.3% |
| | Weighted Average Maturity Date/ARD LTV: | 51.2% |
| | | |
| Other Statistics | |
| | % of Mortgage Loans with Additional Debt: | 29.4% |
| | % of Mortgage Loans with Single Tenants(1): | 21.3% |
| | % of Mortgage Loans secured by Multiple Properties: | 20.0% |
| | |
| Amortization | |
| | Weighted Average Original Amortization Term: | 360 months |
| | Weighted Average Remaining Amortization Term: | 359 months |
| | % of Mortgage Loans with Interest-Only: | 97.4% |
| | % of Mortgage Loans with Amortizing Balloon: | 2.6% |
| | | |
| Lockboxes | |
| | % of Mortgage Loans with Hard Lockboxes: | 63.4% |
| | % of Mortgage Loans with Springing Lockboxes: | 20.2% |
| | % of Mortgage Loans with No Lockboxes: | 7.6% |
| | % of Mortgage Loans with Soft (Residential); Hard (Commercial) Lockboxes: | 5.4% |
| | % of Mortgage Loans with Soft Lockboxes: | 3.5% |
| | | |
| Reserves | |
| | % of Mortgage Loans Requiring Monthly Tax Reserves: | 63.6% |
| | % of Mortgage Loans Requiring Monthly Insurance Reserves: | 36.2% |
| | % of Mortgage Loans Requiring Monthly CapEx Reserves: | 65.4% |
| | % of Mortgage Loans Requiring Monthly TI/LC Reserves(2): | 38.2% |
(1) Excludes mortgage loans that are secured by multiple properties with multiple tenants and includes two mortgage loans that are partially secured by single tenant.
(2) Calculated only with respect to the Cut-off Date Balance of mortgage loans secured or partially secured by office, industrial, retail, multifamily (with commercial tenants), and mixed use properties.
| THE INFORMATION IN THIS STRUCTURAL AND COLLATERAL TERM SHEET IS NOT COMPLETE AND MAY BE AMENDED PRIOR TO THE TIME OF SALE. THIS TERM SHEET IS NOT AN OFFER TO SELL THESE SECURITIES AND IT IS NOT A SOLICITATION OF AN OFFER TO BUY THESE SECURITIES IN ANY JURISDICTION WHERE THE OFFER OR SALE IS NOT PERMITTED. |
| | 4 | |
| Structural and Collateral Term Sheet | | BMO 2023-5C1 |
| Collateral Characteristics |
| Ten Largest Mortgage Loans |
| No. | Loan Name | City, State | Mortgage Loan Seller | No.
of Prop. | Cut-off Date Balance | % of IPB | Square Feet / Rooms / Units | Property Type | UW
NCF DSCR | UW NOI Debt Yield | Cut-off Date LTV | Maturity Date/ARD LTV |
| 1 | Gateway Center South | Brooklyn, NY | GACC, 3650 REIT | 1 | $62,500,000 | 8.2% | 355,033 | Retail | 1.21x | 8.5% | 59.9% | 59.9% |
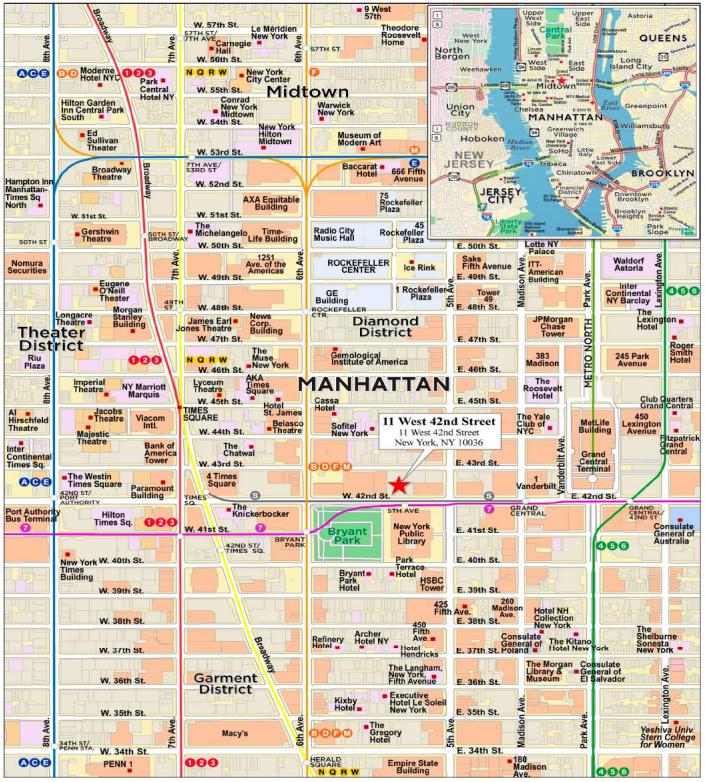
| 2 | 11 West 42nd Street | New York, NY | LMF, BMO | 1 | $62,500,000 | 8.2% | 960,568 | Office | 1.39x | 11.6% | 49.4% | 49.4% |
| 3 | Short Pump Town Center | Richmond, VA | GSMC | 1 | $62,500,000 | 8.2% | 635,494 | Retail | 1.61x | 14.3% | 47.6% | 47.6% |
| 4 | Brookview Commons | Danbury, CT | 3650 REIT | 1 | $58,000,000 | 7.6% | 264 | Multifamily | 1.45x | 8.9% | 57.0% | 57.0% |
| 5 | ICP/IRG Holdings Portfolio | Various, Various | 3650 REIT | 7 | $52,800,000 | 6.9% | 4,662,982 | Various | 1.39x | 10.7% | 58.5% | 58.5% |
| 6 | California High Tech Logistics | Riverside, CA | SGFC | 1 | $52,000,000 | 6.8% | 596,090 | Industrial | 1.33x | 11.2% | 43.4% | 43.4% |
| 7 | Cumberland Mall | Atlanta, GA | GACC, BMO | 1 | $52,000,000 | 6.8% | 709,318 | Retail | 1.66x | 13.8% | 48.9% | 48.9% |
| 8 | Gilardian NYC Portfolio II | New York, NY | BMO | 5 | $41,000,000 | 5.4% | 201 | Multifamily | 2.88x | 12.3% | 39.2% | 39.2% |
| 9 | Four Points Flushing | Queens, NY | CREFI | 1 | $40,100,000 | 5.2% | 210 | Mixed Use | 1.96x | 16.6% | 50.1% | 50.1% |
| 10 | Back Bay Office | Boston, MA | GACC, GSMC | 1 | $30,000,000 | 3.9% | 1,283,670 | Office | 2.55x | 16.3% | 33.7% | 33.7% |
| | | | | | | | | | | | | |
| | Top 3 Total/Weighted Average | 3 | $187,500,000 | 24.5% | | | 1.40x | 11.5% | 52.3% | 52.3% |
| | Top 5 Total/Weighted Average | 11 | $298,300,000 | 38.9% | | | 1.41x | 10.8% | 54.3% | 54.3% |
| | Top 10 Total/Weighted Average | 20 | $513,400,000 | 67.0% | | | 1.65x | 12.1% | 49.9% | 49.9% |
| | Non-Top 10 Total/Weighted Average | 66 | $252,891,091 | 33.0% | | | 1.65x | 12.4% | 54.0% | 53.8% |
| Structural and Collateral Term Sheet | | BMO 2023-5C1 |
| Collateral Characteristics |
| Pari Passu Companion Loan Summary |
No. | Loan Name | | Trust Cut-off Date Balance | Aggregate Pari Passu Loan Cut-off Date Balance | Controlling Pooling/Trust & Servicing Agreement | Master Servicer | Special Servicer | Related Pari Passu Loan(s) Securitizations | Related Pari Passu Loan(s) Original Balance |
| 1 | Gateway Center South | GACC, 3650 REIT | $62,500,000 | $100,000,000 | BMO 2023-5C1 | KeyBank | 3650 REIT | BMARK 2023-V3 Future Securitization(s) | $50,000,000 $50,000,000 |
| 2 | 11 West 42nd Street | LMF, BMO | $62,500,000 | $211,500,000 | BMO 2023-5C1(1) | KeyBank(1) | 3650 REIT(1) | Future Securitization(s) | $211,500,000 |
| 3 | Short Pump Town Center | GSMC | $62,500,000 | $117,500,000 | BMO 2023-5C1(1) | KeyBank(1) | 3650 REIT(1) | Future Securitization(s) | $117,500,000 |
| 5 | ICP/IRG Holdings Portfolio | 3650 REIT | $52,800,000 | $127,200,000 | BMARK 2023-V2 | Midland | 3650 REIT | BANK5 2023-5YR2 BMARK 2023-V2 | $52,200,000 $75,000,000 |
| 6 | California High Tech Logistics | SGFC | $52,000,000 | $18,000,000 | BMO 2023-5C1 | KeyBank | 3650 REIT | Future Securitization(s) | $18,000,000 |
| 7 | Cumberland Mall | GACC, BMO | $52,000,000 | $128,000,000 | BMARK 2023-V2 | Midland | 3650 REIT | BMARK 2023-V2 MSWF 2023-1 Future Securitization(s) | $65,000,000 $30,000,000 $33,000,000 |
| 8 | Gilardian NYC Portfolio II | BMO | $41,000,000 | $13,000,000 | BMO 2023-5C1 | KeyBank | 3650 REIT | Future Securitization(s) | $13,000,000 |
| 10 | Back Bay Office | GACC, GSMC | $30,000,000 | $445,000,000 | BMARK 2023-B39 | Midland | Situs | New York Life TIAA BMARK 2023-V3 BMARK 2023-B39 BANK5 2023-5YR2 Future Securitization(s) | $137,500,000 $100,000,000 $45,000,000 $50,000,000 $60,000,000 $52,500,000 |
| 11 | Harborside 2-3 | CREFI, BMO | $30,000,000 | $195,000,000 | BMARK 2023-V2 | Midland | 3650 REIT | BMARK 2023-V2
BMO 2023-C5
BMARK 2023-B39
BMARK 2023-V3
Future Securitization(s) | $65,000,000
$30,000,000
$25,000,000
$27,500,000
$47,500,000 |
| 12 | The Widener Building | BMO, SMC | $27,000,000 | $23,000,000 | BMO 2023-5C1 | KeyBank | 3650 REIT | BMARK 2023-V3 | $23,000,000 |
| 14 | Oxmoor Center | SGFC | $22,500,000 | $67,500,000 | BMARK 2023-V3(2) | Midland | Greystone | BBCMS 2023-C20 BMARK 2023-V3 | $22,500,000 $45,000,000 |
| 15 | Heritage Plaza | BMO | $20,000,000 | $152,000,000 | BMARK 2023-V2(3) | Midland(3) | 3650 REIT(3) | BANK5 2023-5YR2 MSWF 2023-1 BMARK 2023-V2 BMARK 2023-V3 Future Securitization(s) | $22,000,000 $20,000,000 $40,000,000 $32,000,000 $38,000,000 |
| 17 | Riverview Tower | BMO | $17,592,102 | $9,995,512 | BMO 2023-5C1 | KeyBank | 3650 REIT | BMARK 2023-V3 | $10,000,000 |
| 18 | Museum Tower | SMC | $17,000,000 | $30,000,000 | MSWF 2023-1 | Wells Fargo | Argentic | MSWF 2023-1 | $30,000,000 |
| (1) | In the case of Loan Nos. 2 and 3, until the securitization of the related controlling pari passu companion loan, the related whole loan will be serviced and administered pursuant to the pooling and servicing agreement for the BMO 2023-5C1 securitization transaction by the parties thereto. Upon the securitization of the related controlling pari-passu companion loan, servicing of the related whole loan will shift to the servicers under the servicing agreement with respect to such future securitization transaction, which servicing agreement will become the Controlling Pooling/Trust & Servicing Agreement. |
| (2) | Based on a publicly available prospectus. The BMARK 2023-V3 transaction is expected to close prior to the closing of this securitization transaction. |
| (3) | In the case of Loan No. 15, until the securitization of the related controlling pari passu companion loan, the related whole loan will be serviced and administered pursuant to the pooling and servicing agreement for the BMARK 2023-V2 securitization transaction by the parties thereto. Upon the securitization of the related controlling pari-passu companion loan, servicing of the related whole loan will shift to the servicers under the servicing agreement with respect to such future securitization transaction, which servicing agreement will become the Controlling Pooling/Trust & Servicing Agreement. |
| Structural and Collateral Term Sheet | | BMO 2023-5C1 |
| Collateral Characteristics |
| Pari Passu Companion Loan Summary |
No. | Loan Name | | Trust Cut-off Date Balance | Aggregate Pari Passu Loan Cut-off Date Balance | Controlling Pooling/Trust & Servicing Agreement | Master Servicer | Special Servicer | Related Pari Passu Loan(s) Securitizations | Related Pari Passu Loan(s) Original Balance |
| 20 | RH HQ | 3650 REIT | $14,000,000 | $15,000,000 | 3650R 2022-PF2 | Midland | 3650 REIT | 3650R 2022-PF2 | $15,000,000 |
| 21 | Select Parking NYC Portfolio | BMO | $10,000,000 | $34,000,000 | BMARK 2023-V3(2) | Midland | Greystone | BMARK 2023-V3 | $34,000,000 |
| 22 | Prime Storage Portfolio #3 | CREFI | $10,000,000 | $395,870,000 | CGCMT 2023-PRM3 | Berkadia | Mount Street US (Georgia) LLP | CGCMT 2023-PRM3(4)
Future Securitization(s) | $405,000,000(4) $55,000,000 |
| 24 | Green Acres | BMO | $5,500,000 | $364,500,000 | BMARK 2023-V2 | Midland | 3650 REIT | BMO 2023-C4 BBCMS 2023-C19 BMARK 2023-V2 BMARK 2023-V3 BMARK 2023-B38 FIVE 2023-V1 BANK5 2023-5YR1 BANK 2023-BNK45 | $26,000,000 $46,500,000 $50,000,000 $27,000,000 $50,000,000 $75,000,000 $70,000,000 $20,000,000 |
| (4) | In the case of Loan No. 22, the B note of $64,130,000 was securitized in the CGMCT 2023-PRM3 along with the A note of $340,870,000. |
| Structural and Collateral Term Sheet | | BMO 2023-5C1 |
| Collateral Characteristics |
| Mortgaged Properties by Type |
| | | | | | Weighted Average |
| Property Type | Property Subtype | Number of Properties | Cut-off Date Principal Balance | % of IPB | UW
NCF DSCR | UW
NOI DY | Cut-off Date LTV | Maturity Date/ARD LTV |
| Retail | Super Regional Mall | 3 | $80,000,000 | 10.4 | % | 1.65x | 13.6% | 52.1% | 52.1% |
| | Anchored | 1 | 62,500,000 | 8.2 | | 1.21x | 8.5% | 59.9% | 59.9% |
| | Open-Air Lifestyle Center | 1 | 62,500,000 | 8.2 | | 1.61x | 14.3% | 47.6% | 47.6% |
| | Subtotal: | 5 | $205,000,000 | 26.8 | % | 1.50x | 12.3% | 53.1% | 53.1% |
| Office | CBD | 6 | $177,092,102 | 23.1 | % | 1.80x | 13.2% | 49.2% | 49.0% |
| | Suburban | 2 | 21,656,000 | 2.8 | | 1.81x | 11.2% | 64.8% | 64.8% |
| | Subtotal: | 8 | $198,748,102 | 25.9 | % | 1.80x | 13.0% | 50.9% | 50.7% |
| Industrial | Warehouse/Distribution | 8 | $124,662,000 | 16.3 | % | 1.32x | 10.8% | 50.2% | 50.2% |
| | Manufacturing/Warehouse | 1 | 13,464,000 | 1.8 | | 1.39x | 10.7% | 58.5% | 58.5% |
| | Warehouse | 1 | 10,568,000 | 1.4 | | 1.89x | 14.6% | 32.0% | 32.0% |
| | Flex | 1 | 3,168,000 | 0.4 | | 1.39x | 10.7% | 58.5% | 58.5% |
| | Subtotal: | 11 | $151,862,000 | 19.8 | % | 1.37x | 11.1% | 49.8% | 49.8% |
| Multifamily | Mid Rise | 5 | $69,952,926 | 9.1 | % | 1.61x | 9.7% | 53.3% | 53.3% |
| | High Rise | 3 | 34,979,074 | 4.6 | | 2.88x | 12.3% | 39.2% | 39.2% |
| | Garden | 1 | 7,600,000 | 1.0 | | 1.39x | 9.8% | 64.4% | 64.4% |
| | Subtotal: | 9 | $112,532,000 | 14.7 | % | 1.99x | 10.5% | 49.7% | 49.7% |
| Mixed Use | Hospitality/Retail | 1 | $40,100,000 | 5.2 | % | 1.96x | 16.6% | 50.1% | 50.1% |
| | Office/Retail/Court | 1 | 27,000,000 | 3.5 | | 1.65x | 13.5% | 53.9% | 53.9% |
| | Subtotal: | 2 | $67,100,000 | 8.8 | % | 1.84x | 15.4% | 51.6% | 51.6% |
| Self Storage | Self Storage | 48 | $18,870,000 | 2.5 | % | 1.66x | 11.5% | 51.0% | 51.0% |
| Other | Parking Garage | 2 | $10,000,000 | 1.3 | % | 1.35x | 10.9% | 61.0% | 61.0% |
| Manufactured Housing | Manufactured Housing | 1 | $2,178,989 | 0.3 | % | 1.20x | 10.6% | 45.0% | 43.1% |
| Total / Weighted Average: | 86 | $766,291,091 | 100.0 | % | 1.65x | 12.2% | 51.3% | 51.2% |
| THE INFORMATION IN THIS STRUCTURAL AND COLLATERAL TERM SHEET IS NOT COMPLETE AND MAY BE AMENDED PRIOR TO THE TIME OF SALE. THIS TERM SHEET IS NOT AN OFFER TO SELL THESE SECURITIES AND IT IS NOT A SOLICITATION OF AN OFFER TO BUY THESE SECURITIES IN ANY JURISDICTION WHERE THE OFFER OR SALE IS NOT PERMITTED. |
| | 8 | |
| Structural and Collateral Term Sheet | | BMO 2023-5C1 |
| No. 1 – Gateway Center South |
| THE INFORMATION IN THIS STRUCTURAL AND COLLATERAL TERM SHEET IS NOT COMPLETE AND MAY BE AMENDED PRIOR TO THE TIME OF SALE. THIS TERM SHEET IS NOT AN OFFER TO SELL THESE SECURITIES AND IT IS NOT A SOLICITATION OF AN OFFER TO BUY THESE SECURITIES IN ANY JURISDICTION WHERE THE OFFER OR SALE IS NOT PERMITTED. |
| | 9 | |
| Structural and Collateral Term Sheet | | BMO 2023-5C1 |
| No. 1 – Gateway Center South |
| THE INFORMATION IN THIS STRUCTURAL AND COLLATERAL TERM SHEET IS NOT COMPLETE AND MAY BE AMENDED PRIOR TO THE TIME OF SALE. THIS TERM SHEET IS NOT AN OFFER TO SELL THESE SECURITIES AND IT IS NOT A SOLICITATION OF AN OFFER TO BUY THESE SECURITIES IN ANY JURISDICTION WHERE THE OFFER OR SALE IS NOT PERMITTED. |
| | 10 | |
| Structural and Collateral Term Sheet | | BMO 2023-5C1 |
| No. 1 – Gateway Center South |
| Mortgage Loan Information | | Property Information |
| Mortgage Loan Seller: | GACC, 3650 REIT | | Single Asset / Portfolio: | Single Asset |
| Original Principal Balance(1): | $62,500,000 | | Title: | Fee |
| Cut-off Date Principal Balance(1): | $62,500,000 | | Property Type – Subtype: | Retail – Anchored |
| % of IPB: | 8.2% | | Net Rentable Area (SF): | 355,033 |
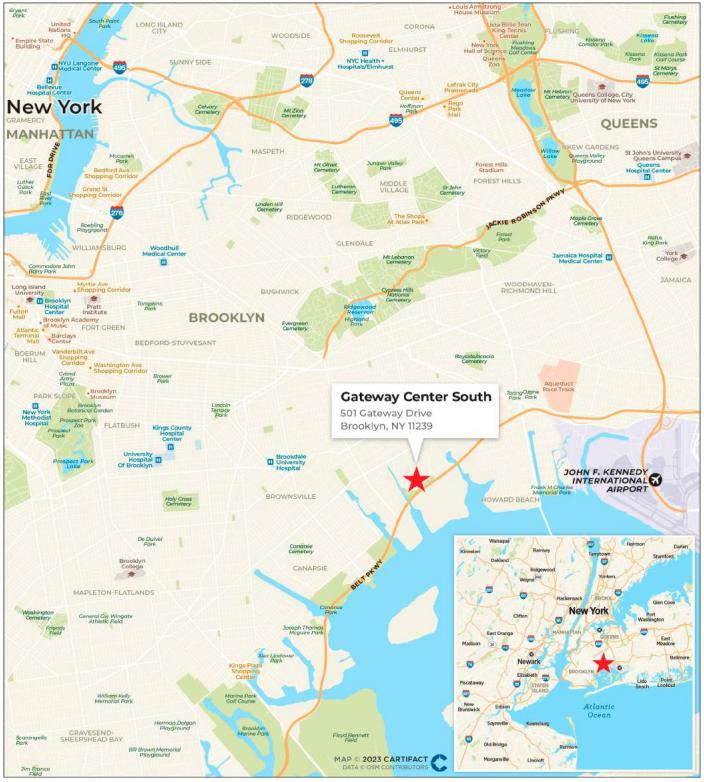
| Loan Purpose: | Refinance | | Location: | Brooklyn, NY |
| Borrower: | Gateway Center Properties I, L.L.C. | | Year Built / Renovated: | 2002 / NAP |
| Borrower Sponsor: | The Related Companies, L.P. | | Occupancy(3): | 89.4% |
| Interest Rate: | 6.87300% | | Occupancy Date: | 5/5/2023 |
| Note Date: | 5/24/2023 | | 4th Most Recent NOI (As of): | $14,472,895 (12/31/2020) |
| Maturity Date: | 6/5/2028 | | 3rd Most Recent NOI (As of): | $15,270,696 (12/31/2021) |
| Interest-only Period: | 60 months | | 2nd Most Recent NOI (As of): | $15,168,827 (12/31/2022) |
| Original Term: | 60 months | | Most Recent NOI (As of): | $15,195,185 (TTM 3/31/2023) |
| Original Amortization Term: | None | | UW Economic Occupancy: | 93.5% |
| Amortization Type: | Interest Only | | UW Revenues: | $24,271,069 |
| Call Protection: | L(23),YM1(3),DorYM1(27),O(7) | | UW Expenses: | $10,532,015 |
| Lockbox / Cash Management: | Hard / Springing | | UW NOI: | $13,739,054 |
| Additional Debt(1): | Yes | | UW NCF: | $13,703,551 |
| Additional Debt Balance(1): | $100,000,000 | | Appraised Value / Per SF: | $271,100,000 / $764 |
| Additional Debt Type(1): | Pari Passu | | Appraisal Date: | 3/11/2023 |
| | | | | |
| Escrows and Reserves(2) | | Financial Information(1) |
| | Initial | Monthly | Initial Cap | | Cut-off Date Loan / SF: | $458 |
| Taxes: | $0 | $436,789 | N/A | | Maturity Date Loan / SF: | $458 |
| Insurance: | $0 | Springing | N/A | | Cut-off Date LTV: | 59.9% |
| Replacement Reserves: | $0 | $2,959 | N/A | | Maturity Date LTV: | 59.9% |
| TI/LC: | $0 | $29,586 | $1,000,000 | | UW NCF DSCR: | 1.21x |
| | | | | | UW NOI Debt Yield: | 8.5% |
| | | | | | | |
| | | | | | | |
| Sources and Uses |
| Sources | Proceeds | % of Total | | Uses | Proceeds | % of Total |
| Whole Loan(1) | $162,500,000 | 97.1 | % | | Existing Loan Payoff(4) | $157,685,240 | 94.2 | % |
| Borrower Sponsor Equity | 4,938,409 | 2.9 | | | Closing Costs | 9,753,170 | 5.8 | |
| Total Sources | $167,438,409 | 100.0 | % | | Total Uses | $167,438,409 | 100.0 | % |
| (1) | The Gateway Center South Mortgage Loan (as defined below) is part of a whole loan evidenced by eight pari passu notes with an outstanding original principal balance as of the Cut-off Date of $162,500,000. The financial information presented in the chart above is based on the Gateway Center South Whole Loan (as defined below). The Cut-off Date Principal Balance of $62,500,000 represents the controlling note A-1 and non-controlling note A-5, contributed by GACC in the aggregate amount of $34,000,000, and non-controlling note A-3 contributed by 3650 REIT and totaling $28,500,000. |
| (2) | See “Escrows and Reserves” below. |
| (3) | Bed Bath & Beyond (10.6% of NRA) is in bankruptcy, has ceased paying rent and is dark in its space, and has been underwritten as vacant, resulting in an occupancy of 89.4%. |
| (4) | The prior loan matured on March 6, 2023, and the Gateway Center South Mortgage Loan was funded on May 24, 2023. The prior loan payoff included default interest and special servicing fees. |
The Loan. The largest mortgage loan (the “Gateway Center South Mortgage Loan”) is part of a whole loan (the “Gateway Center South Whole Loan”) evidenced by eight pari passu notes with an aggregate outstanding principal balance as of the Cut-off Date of $162,500,000. The Gateway Center South Whole Loan is secured by a first mortgage lien on the borrower’s fee interest a 355,033 SF retail center anchored by a BJ’s Wholesale Club store located in Brooklyn, New York (the “Gateway Center South Property”). The Gateway Center South Mortgage Loan, which is evidenced by the controlling Note A-1 and non-controlling Notes A-3 and A-5, has an aggregate outstanding principal balance as of the Cut-off Date of $62,500,000 and represents approximately 8.2% of the Initial Pool Balance. The Cut-off Date Principal Balance of $62,500,000 represents the controlling note A-1 and non-controlling note A-5, contributed by GACC in the aggregate amount of $34,000,000, and non-controlling note A-3 contributed by 3650 REIT and totaling $28,500,000.
The Gateway Center South Whole Loan was co-originated by DBR Investments Co. Limited and Wells Fargo Bank, National Association on May 24, 2023, accrues interest at the rate of 6.87300% per annum, had an original principal balance of $162,500,000 and has an outstanding principal balance as of the Cut-off Date of $162,500,000. The proceeds of the Gateway Center South Whole Loan along with
| THE INFORMATION IN THIS STRUCTURAL AND COLLATERAL TERM SHEET IS NOT COMPLETE AND MAY BE AMENDED PRIOR TO THE TIME OF SALE. THIS TERM SHEET IS NOT AN OFFER TO SELL THESE SECURITIES AND IT IS NOT A SOLICITATION OF AN OFFER TO BUY THESE SECURITIES IN ANY JURISDICTION WHERE THE OFFER OR SALE IS NOT PERMITTED. |
| | 11 | |
| Structural and Collateral Term Sheet | | BMO 2023-5C1 |
| No. 1 – Gateway Center South |
approximately $4,938,409 of equity contributed by the borrower sponsor was primarily used to pay off existing debt on the Gateway Center South Property and pay origination costs.
The Gateway Center South Whole Loan had an initial term of 60 months and has a remaining term of 58 months as of the Cut-off Date. The Gateway Center South Whole Loan requires monthly payments of interest only for the entire term. The scheduled maturity date of the Gateway Center South Whole Loan is June 5, 2028. Voluntary prepayment of the Gateway Center South Whole Loan in whole (but not in part) is permitted on or after the payment date occurring in December 2027 (the “Open Prepayment Date”) without payment of any prepayment premium. Defeasance of the Gateway Center South Whole Loan in whole (but not in part) is permitted after the date that is the earlier to occur of (i) the third anniversary of the first monthly payment date and (ii) at any time after the date that is two years after the closing date of the securitization that includes the last note to be securitized. In addition, on any business day on and after June 5, 2025, voluntary prepayment of the Gateway Center South Whole Loan in whole (but not in part) is permitted, together with, if such voluntary prepayment occurs prior to the Open Prepayment Date, a prepayment fee equal to the greater of (x) 1.00% of the principal amount of the Gateway Center South Whole Loan being prepaid and (y) a yield maintenance premium.
The table below summarizes the promissory notes that comprise the Gateway Center South Whole Loan. The relationship between the holders of the Gateway Center South Whole Loan will be governed by a co-lender agreement as described under “Description of the Mortgage Pool— The Whole Loans—The Serviced Pari Passu Whole Loans” in the Preliminary Prospectus.
| Whole Loan Summary |
| Note | Original Balance | Cut-off Date Balance | Note Holder | Controlling Piece |
| A-1 | $30,000,000 | $30,000,000 | BMO 2023-5C1 | Yes |
| A-2 | $25,000,000 | $25,000,000 | Benchmark 2023-V3 | No |
| A-3 | $28,500,000 | $28,500,000 | BMO 2023-5C1 | No |
| A-4 | $15,000,000 | $15,000,000 | Benchmark 2023-V3 | No |
| A-5 | $4,000,000 | $4,000,000 | BMO 2023-5C1 | No |
| A-6 | $10,000,000 | $10,000,000 | Benchmark 2023-V3 | No |
| A-7 | $40,000,000 | $40,000,000 | WFBNA(1) | No |
| A-8 | $10,000,000 | $10,000,000 | WFBNA(1) | No |
| Whole Loan | $162,500,000 | $162,500,000 | | |
| (1) | Expected to be contributed to one or more future securitization trusts. |
The Property.
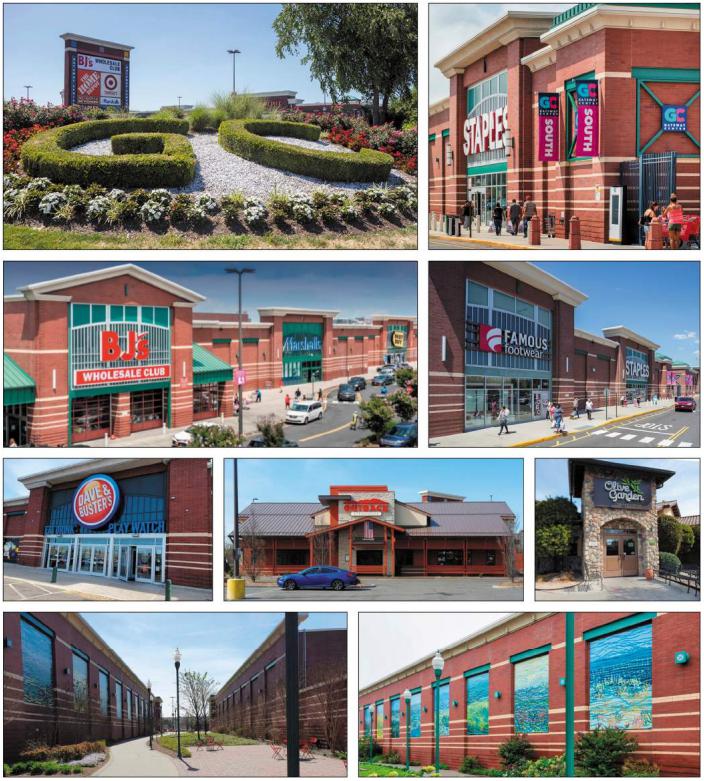
The Gateway Center South Property is a Class A retail property located at 501 Gateway Drive in Brooklyn, New York. The Gateway Center South Property was completed in 2002 and was the first phase of the larger Gateway Center, also developed by the borrower sponsor, which includes Gateway Center North, a 639,143 SF expansion that is separately capitalized and is not included in the collateral, and two separate non-collateral self-owned anchor stores, Target and Home Depot. The borrower sponsor indirectly owns both the Gateway Center South Property and Gateway Center North, operating both components as one retail shopping center. As of May 5, 2023, the Gateway Center South Property was 100.0% physically occupied by eleven retail tenants with a 5.2-year weighted average lease term remaining. The Gateway Center South Property has remained consistently 100.0% occupied since its inception in 2002 until the recent departure of Bed Bath & Beyond. Bed Bath & Beyond (10.6% of NRA) is in bankruptcy, has ceased paying rent and is dark in its space, and has been underwritten as vacant, resulting in an occupancy of 89.4%. 67.9% of the tenants are original tenants at the Gateway Center South Property and have been at the Gateway Center South Property for over 20 years. The Gateway Center South Property has a parking ratio of 4.37 spaces per 1,000 SF. Gateway Center North, the expansion portion of the Gateway Center, which is not included in the collateral, is 100% occupied and is grocery-anchored by ShopRite and ALDI and includes national retailers such as TJ Maxx and Nordstrom Rack. The Gateway Center South Property offers direct on/off access to the Belt Parkway (Exit 15) and there are approximately 2,800 open parking spaces, which are shared with the non-collateral Target and Home Depot anchor stores pursuant to the OEA (as defined below). The Gateway Center is the second most visited power center in the country, with a combined 16.5 million annual visitors and anchored by the second most-visited BJ’s Wholesale Club location in the United States.
The Gateway Center South Property is subject to an Operation and Easement Agreement by and among Home Depot U.S.A., Inc., Target Corporation and Gateway Center Properties, LLC, an affiliate of the borrower (the “OEA”). The common areas are maintained by an affiliate of the borrower sponsor and each party to the OEA pays its share of common area maintenance costs. The OEA also allows the non-collateral Target Corporation and Home Depot U.S.A., Inc. anchor stores usage of the parking spaces located on the Gateway Center South Property.
Major Tenants. The three largest tenants based on underwritten base rent are BJ’s Wholesale Club, Best Buy and Dave & Buster’s.
BJ’s Wholesale Club (“BJ’s”) (128,995 square feet; 36.3% of net rentable area (“NRA”); 35.2% of underwritten base rent) is a leading warehouse club operator on the East Coast of the United States. BJ’s provides a curated assortment focused on perishable products, refreshed general merchandise, gas and other ancillary services. BJ’s is traded on the New York Stock Exchange and reported a market capitalization of $8.41 billion as of June 27, 2023, with a credit rating of BB+ (S&P) and Ba1 (Moody’s). BJ’s lease expires September
| THE INFORMATION IN THIS STRUCTURAL AND COLLATERAL TERM SHEET IS NOT COMPLETE AND MAY BE AMENDED PRIOR TO THE TIME OF SALE. THIS TERM SHEET IS NOT AN OFFER TO SELL THESE SECURITIES AND IT IS NOT A SOLICITATION OF AN OFFER TO BUY THESE SECURITIES IN ANY JURISDICTION WHERE THE OFFER OR SALE IS NOT PERMITTED. |
| | 12 | |
| Structural and Collateral Term Sheet | | BMO 2023-5C1 |
| No. 1 – Gateway Center South |
20, 2027. BJ’s has been at the Gateway Center South Property since 2002 and has four remaining five-year extension options, and no termination options. If all four extension options are exercised, BJ’s will also have one final option of four years and ten months.
Best Buy (31,679 square feet; 8.9% of NRA; 13.8% of underwritten base rent), is a multi-national retailer of electronic products. The company’s product offerings include consumer electronics, computing and mobile phones, appliances, entertainment products, and home office products. It also offers services including consultation, design, set-up, technical support, warranty related services, heath related services and memberships, educational classes, delivery and installation for home theater, mobile audio, and appliances. The company operates across the United States, Canada, and Mexico and is headquartered in Richfield, Minnesota. Best Buy became a tenant at the Gateway Center South Property when it acquired Circuit City Store, Inc.’s lease interest at auction for $10.5 million in November 2009. Best Buy recently exercised its five-year renewal option, which began in January of 2023. Best Buy’s lease expires January 31, 2028. Best Buy has three remaining five-year extension options, and no termination options. Best Buy is traded on the New York Stock Exchange and reported a market capitalization of $18.09 billion as of June 27, 2023, with a credit rating of BBB+ (S&P) and A3 (Moody’s).
Dave & Buster’s (37,060 square feet; 10.4% of NRA; 11.6% of underwritten base rent) is a nationwide chain of large, adult-oriented complexes that combine restaurants and bars with dinner theater and games ranging from pocket billiards and shuffleboard to high-tech arcade games to simulated golf and virtual reality space combat. The company has 152 locations in the United States including two in Puerto Rico and an additional two in Canada. Dave & Buster’s has been at the Gateway Center South Property since 2020 and has two five-year extension options, and no termination options. Dave & Buster’s reports sales of $364.59 PSF as of January 31, 2023 outpacing national sales of $290 PSF. The Dave & Buster’s lease expires January 31, 2036. Dave & Buster’s is traded on the New York Stock Exchange and reported a market capitalization of $1.88 billion as of June 27, 2023, with a credit rating of B (S&P), and B1 (Moody’s).
Environmental. According to a Phase I environmental report, dated May 19, 2023, there is a controlled recognized environmental condition at the Gateway Center South Property related to historic use as a landfill. See “Description of the Mortgage Loan—Environmental Considerations” in the Preliminary Prospectus.
The following table presents certain information relating to the historical occupancy of the Gateway Center South Property:
| Historical and Current Occupancy(1) |
| 2020 | 2021 | 2022 | Current(2)(3) |
| 100.0% | 100.0% | 100.0% | 89.4% |
| (1) | Historical Occupancies are as of December 31 of each respective year, unless otherwise specified. |
| (2) | Based on the underwritten rent roll dated May 5, 2023. |
| (3) | Bed Bath & Beyond (10.6% of NRA) is in bankruptcy, has ceased paying rent and is dark in its space, and has been underwritten as vacant, resulting in an underwritten occupancy of 89.4%. |
| THE INFORMATION IN THIS STRUCTURAL AND COLLATERAL TERM SHEET IS NOT COMPLETE AND MAY BE AMENDED PRIOR TO THE TIME OF SALE. THIS TERM SHEET IS NOT AN OFFER TO SELL THESE SECURITIES AND IT IS NOT A SOLICITATION OF AN OFFER TO BUY THESE SECURITIES IN ANY JURISDICTION WHERE THE OFFER OR SALE IS NOT PERMITTED. |
| | 13 | |
| Structural and Collateral Term Sheet | | BMO 2023-5C1 |
| No. 1 – Gateway Center South |
The following table presents certain information relating to the major tenants (of which, certain tenants may have co-tenancy provisions) at the Gateway Center South Property:
| Top Tenant Summary(1) |
| Tenant | Ratings
Moody’s/S&P/Fitch(2) | Net Rentable Area (SF) | % of
Total NRA | UW
Base Rent PSF(3) |
UW
Base Rent(3) | % of Total
UW Base Rent(3) | Lease
Exp. Date |
| BJ's Wholesale Club | Ba1/BB+/NR | 128,995 | | 36.3 | % | $40.09 | | $5,171,410 | 35.2 | % | 9/20/2027 |
| Best Buy | A3/BBB+/NR | 31,679 | | 8.9 | | $64.03 | | 2,028,406 | 13.8 | | 1/31/2028 |
| Dave & Buster's | B1/B/NR | 37,060 | | 10.4 | | $46.00 | | 1,704,760 | 11.6 | | 1/31/2036 |
| Old Navy(1) | Ba3/BB/NR | 26,861 | | 7.6 | | $56.30 | | 1,512,274 | 10.3 | | 1/31/2027 |
| Marshalls(1) | A2/A/NR | 35,021 | | 9.9 | | $36.76 | | 1,287,372 | 8.8 | | 9/30/2027 |
| Staples | B3/B/NR | 22,712 | | 6.4 | | $43.56 | | 989,335 | 6.7 | | 11/30/2027 |
| Outback Steakhouse | Ba3/BB-/NR | 7,347 | | 2.1 | | $112.29 | | 824,995 | 5.6 | | 10/30/2027 |
| Famous Footwear | NR/NR/NR | 11,466 | | 3.2 | | $50.00 | | 573,300 | 3.9 | | 10/31/2028 |
| Red Lobster | NR/NR/NR | 8,096 | | 2.3 | | $36.17 | | 292,832 | 2.0 | | 10/14/2027 |
| Olive Garden | NR/NR/NR | 8,062 | | 2.3 | | $36.32 | | 292,812 | 2.0 | | 10/14/2027 |
| Ten Largest Owned Tenants | | 317,299 | | 89.4 | % | $46.26 | | $14,677,496 | 100.0 | % | |
| Remaining Owned Tenants | | 0 | | 0.0 | | $0.00 | | 0 | 0.0 | | |
| Total Occupied | | 317,299 | | 89.4 | % | $46.26 | | $14,677,496 | 100.0 | % | |
| Vacant Spaces (Owned Space)(3) | | 37,734 | | 10.6 | % | | | | |
| Totals / Wtd. Avg. All Owned Tenants | | 355,033 | | 100.0 | % | | | | |
| (1) | Based on the underwritten rent roll dated May 5, 2023. See “Description of the Mortgage Pool—Lease Expirations and Terminations—Terminations” in the Preliminary Prospectus for a description of co-tenancy provisions applicable to Old Navy and Marshalls. Other tenants also have co-tenancy provisions. |
| (2) | Certain ratings are those of the parent company whether or not the parent guarantees the lease. |
| (3) | Bed Bath & Beyond (10.6% of NRA) is in bankruptcy, has ceased paying rent and is dark in its space, and has been underwritten as vacant, resulting in an underwritten occupancy of 89.4%. |
The following table presents certain information relating to the lease rollover schedule at the Gateway Center South Property:
| Lease Rollover Schedule(1)(2) |
| Year | Number of Leases Expiring | Net Rentable Area Expiring | % of NRA Expiring | UW Base Rent Expiring | % of UW Base Rent Expiring | Cumulative Net Rentable Area Expiring | Cumulative
% of NRA
Expiring | Cumulative UW Base Rent Expiring | Cumulative % of UW Base Rent Expiring |
| Vacant(3) | NAP | 37,734 | 10.6 | % | NAP | NA | P | 37,734 | | 10.6% | | NAP | NAP | |
| 2023 | 0 | 0 | 0.0 | | 0 | 0.0 | % | 37,734 | | 10.6% | | $0 | 0.0% | |
| 2024 | 0 | 0 | 0.0 | | 0 | 0.0 | | 37,734 | | 10.6% | | $0 | 0.0% | |
| 2025 | 0 | 0 | 0.0 | | 0 | 0.0 | | 37,734 | | 10.6% | | $0 | 0.0% | |
| 2026 | 0 | 0 | 0.0 | | 0 | 0.0 | | 37,734 | | 10.6% | | $0 | 0.0% | |
| 2027 | 7 | 237,094 | 66.8 | | 10,371,029 | 70.7 | | 274,828 | | 77.4% | | $10,371,029 | 70.7% | |
| 2028 | 2 | 43,145 | 12.2 | | 2,601,706 | 17.7 | | 317,973 | | 89.6% | | $12,972,736 | 88.4% | |
| 2029 | 0 | 0 | 0.0 | | 0 | 0.0 | | 317,973 | | 89.6% | | $12,972,736 | 88.4% | |
| 2030 | 0 | 0 | 0.0 | | 0 | 0.0 | | 317,973 | | 89.6% | | $12,972,736 | 88.4% | |
| 2031 | 0 | 0 | 0.0 | | 0 | 0.0 | | 317,973 | | 89.6% | | $12,972,736 | 88.4% | |
| 2032 | 0 | 0 | 0.0 | | 0 | 0.0 | | 317,973 | | 89.6% | | $12,972,736 | 88.4% | |
| 2033 & Beyond | 1 | 37,060 | 10.4 | | 1,704,760 | 11.6 | | 355,033 | | 100.0% | | $14,677,496 | 100.0% | |
| Total | 10 | 355,033 | 100.0 | % | $14,677,496 | 100.0 | % | | | | |
| (1) | Based on the underwritten rent roll dated May 5, 2023. |
| (2) | Certain tenants may have termination options that are exercisable prior to the originally stated expiration date of the subject lease and that are not considered in the Lease Rollover Schedule. |
| (3) | Bed Bath & Beyond (10.6% of NRA) is in bankruptcy, has ceased paying rent and is dark in its space, and has been underwritten as vacant, resulting in an underwritten occupancy of 89.4%. |
| THE INFORMATION IN THIS STRUCTURAL AND COLLATERAL TERM SHEET IS NOT COMPLETE AND MAY BE AMENDED PRIOR TO THE TIME OF SALE. THIS TERM SHEET IS NOT AN OFFER TO SELL THESE SECURITIES AND IT IS NOT A SOLICITATION OF AN OFFER TO BUY THESE SECURITIES IN ANY JURISDICTION WHERE THE OFFER OR SALE IS NOT PERMITTED. |
| | 14 | |
| Structural and Collateral Term Sheet | | BMO 2023-5C1 |
| No. 1 – Gateway Center South |
The following table presents certain information relating to the underwritten cash flows of the Gateway Center South Property:
| Operating History and Underwritten Net Cash Flow |
| | 2020 | 2021 | 2022 | TTM 3/31/2023 | Underwritten | Per Square Foot | %(1) |
| Rents in Place(2) | $14,840,158 | $15,645,183 | $15,791,984 | $15,791,237 | $14,677,496 | $41.34 | | 57.1 | % |
| Rent Steps(3) | 0 | 0 | 0 | 0 | 82,507 | 0.23 | | 0.3 | |
| Vacant Income | 0 | 0 | 0 | 0 | 1,698,030 | 4.78 | | 6.6 | |
| Gross Potential Rent | $14,840,158 | $15,645,183 | $15,791,984 | $15,791,237 | $16,458,033 | $46.36 | | 64.0 | % |
| Total Reimbursements | 6,494,668 | 8,120,067 | 8,333,311 | 8,526,910 | 9,250,280 | 26.05 | | 36.0 | |
| Net Rental Income | $21,334,825 | $23,765,250 | $24,125,295 | $24,318,147 | $25,708,313 | $72.41 | | 100.0 | % |
| Other Income | 359,923 | 254,127 | 217,521 | 211,574 | 260,786 | 0.73 | | 1.0 | |
| (Vacancy/Credit Loss)(4) | 0 | 0 | 0 | 0 | (1,698,030) | (4.78) | | (6.6 | ) |
| Effective Gross Income | $21,694,749 | $24,019,377 | $24,342,817 | $24,529,721 | $24,271,069 | $68.36 | | 94.4 | % |
| Total Expenses(5) | 7,221,854 | 8,748,681 | 9,173,990 | 9,334,536 | 10,532,015 | 29.66 | | 43.4 | |
| Net Operating Income | $14,472,895 | $15,270,696 | $15,168,827 | $15,195,185 | $13,739,054 | $38.70 | | 56.6 | % |
| Total TI/LC, Capex/RR | 0 | 0 | 0 | 0 | 35,503 | 0.10 | | 0.1 | |
| Net Cash Flow | $14,472,895 | $15,270,696 | $15,168,827 | $15,195,185 | $13,703,551 | $38.60 | | 56.5 | % |
| (1) | % column represents percent of Net Rental Income for all revenue lines and represents percent of Effective Gross Income for the remainder of fields. |
| (2) | Underwritten Base Rent is based on the underwritten rent roll dated May 5, 2023. |
| (3) | Rent Steps underwritten through May 1, 2024. |
| (4) | Bed Bath & Beyond (10.6% of NRA) is currently a tenant at the Gateway Center South Property, but this space has been underwritten as vacant because of the tenant’s bankruptcy and upcoming lease expiration in January 2024, resulting in an underwritten occupancy of 89.4%. |
| (5) | The Gateway Center South Property benefits from an ICIP tax abatement, which provides for a 50% exemption in the 2022/2023 and 2023/2024 tax years, which then phases down by 10% annually, resulting in a 40% exemption in the 2024/2025 tax year, a 30% exemption in the 2025/2026 tax year, a 20% exemption in the 2026/2027 tax year, and a 10% exemption in the 2027/2028 tax year, and expires thereafter. The Gateway Center South Whole Loan was underwritten based on the abated taxes. |
The Market. The Gateway Center South Property is located in Brooklyn, New York. Within the Brooklyn retail market, according to a third-party market report, there are 17,744 retail units spanning approximately 103.6 million SF of retail space as of the fourth quarter of 2022. The average asking rent in the Brooklyn retail market has displayed moderate growth over the last five years; as of the fourth quarter of 2022, the asking rent in the market was $51.06 PSF. Over the most recent five-year period, rents in the Brooklyn retail market have grown by 4.4%. In the fourth quarter of 2022, the vacancy rate in the market was 3.5%, decreasing 20-basis points from the previous quarter. Similarly, the availability rate in the market decreased 10 basis points in the fourth quarter of 2022, to 4.5%. The Gateway Center South Property is in the North Brooklyn retail submarket. The North Brooklyn retail submarket reported average retail asking rents of $53.31 PSF as of the fourth quarter of 2022. Average asking rental rates in the North Brooklyn retail submarket have increased, ranging from $46.88 per SF in 2020 to $53.55 PSF in the third quarter of 2022. The vacancy rate in the North Brooklyn retail submarket at the end of the fourth quarter of 2022 was 3.0%.
According to the appraisal, the comparable anchor retail leases indicate rents ranging from $31.00 to $41.00 PSF. All comparable leases were signed during 2017 through 2022, and are generally reflective of current market conditions.
The following table presents certain information relating to comparable anchor retail centers for the Gateway Center South Property:
| Comparable Anchor Retail Leases(1) |
| Property | Tenant | Lease Area | Lease Date | Lease Term | Base Rent (PSF) |
| Gateway Center South(2) | BJ’s Wholesale Club | 128,995 | Sep-02 | 25.0 Yrs. | $40.09 |
48-18 Northern Boulevard Long Island City, NY 11101 | H-Mart | 63,525 | Nov-22 | 15.0 Yrs. | $31.00 |
45-10 48th Street Long Island City, NY 11377 | BJ’s Wholesale Club | 70,000 | Mar-21 | NAV | $40.00 |
61-01 Junction Boulevard Rego Park, NY 11374 | At Home | 129,228 | Oct-20 | 11.0 Yrs. | $38.00 |
399 Sands Street Brooklyn, NY 11201 | Wegmans | 85,113 | Jan-19 | 25.0 Yrs. | $40.00 |
8973 Bay Parkway Brooklyn, NY 11214 | Target | 88,000 | Jan-19 | 20.0 Yrs. | $41.00 |
850 Third Avenue Brooklyn, NY 11232 | Bed Bath and Beyond | 120,000 | Jan-17 | 15.0 Yrs. | $39.00 |
| (2) | Based on the undewritten rent roll as of May 5, 2023. |
The Borrower. The borrower is Gateway Center Properties I, L.L.C., a Delaware limited liability company. The borrower is structured to be a single purpose bankruptcy-remote entity, with two independent directors in its organizational structure. Legal counsel to the borrower delivered a non-consolidation opinion in connection with the origination of the Gateway Center South Whole Loan.
| THE INFORMATION IN THIS STRUCTURAL AND COLLATERAL TERM SHEET IS NOT COMPLETE AND MAY BE AMENDED PRIOR TO THE TIME OF SALE. THIS TERM SHEET IS NOT AN OFFER TO SELL THESE SECURITIES AND IT IS NOT A SOLICITATION OF AN OFFER TO BUY THESE SECURITIES IN ANY JURISDICTION WHERE THE OFFER OR SALE IS NOT PERMITTED. |
| | 15 | |
| Structural and Collateral Term Sheet | | BMO 2023-5C1 |
| No. 1 – Gateway Center South |
The Borrower Sponsor. The borrower sponsor and non-recourse carve-out guarantor is The Related Companies, L.P. (“Related”). Related is a global real estate and lifestyle company and a privately owned real estate firm in the United States. Formed 50 years ago, Related is a fully integrated, diversified real estate company with experience in most aspects of development, acquisition, management, finance, marketing, and sales. Headquartered in New York City, Related has offices and major developments in Boston, Chicago, Los Angeles, San Francisco, West Palm Beach, Miami, Washington, D.C., Abu Dhabi and London, and boasts a team of approximately 4,000 professionals. Related has over $60 billion in assets owned, under management, or under development including the 28-acre Hudson Yards neighborhood on Manhattan’s West Side, The Square in Downtown West Palm Beach, The Grand LA and Related Santa Clara in California, and the 78 in Chicago.
Property Management. The Gateway Center South Property is managed by Related Management Company, L.P., an affiliate of the borrower sponsor.
Escrows and Reserves.
Tax Escrows – On each monthly payment date, the borrower is required to deposit an amount equal to 1/12th of the estimated annual real estate taxes (currently estimated to be $436,789) into the tax reserve account.
Insurance Escrows – On each monthly payment date, the borrower is required to deposit into an insurance reserve an amount equal to 1/12th of estimated insurance premiums, unless the borrower maintains a blanket policy in accordance with the Gateway Center South Whole Loan documents and no event of default has occurred.
Replacement Reserve – On each monthly payment date, the borrower is required to deposit $2,959 into a replacement reserve.
Rollover Reserve – On each monthly payment date, the borrower is required to deposit $29,586 into a rollover reserve, capped at $1,000,000.
Lockbox / Cash Management. The Gateway Center South Whole Loan is structured with a hard lockbox and springing cash management. At origination of the Gateway Center South Whole Loan, the borrower was required to direct each tenant to remit all rents directly to a lender-controlled lockbox account. In addition, the borrower was required to cause all cash revenues relating to the Gateway Center South Property and all other money received by the borrower or the property manager with respect to the Gateway Center South Property (other than tenant security deposits and cash revenues released to the borrower) to be deposited into the lender-controlled lockbox account within two business days following receipt. During the continuance of a Cash Sweep Event (as defined below), any transfers to the borrower’s operating account are required to cease and such sums on deposit in the lockbox account are to be transferred on a daily basis to a cash management account controlled by the lender, to be applied to payment of all monthly amounts due under the Gateway Center South Whole Loan (including, without limitation, taxes and insurance, debt service and required reserves and approved property operating expenses), with any excess funds being deposited into an excess cash flow account to be held by the lender as additional collateral for the Gateway Center South Whole Loan. Subject to the lender’s reasonable approval and provided that no event of default is continuing, the funds in the excess cash flow account may be used by the borrower to fund reserves and to pay debt service, in each case to the extent that the current gross operating income is insufficient to satisfy the same, as well as to pay operating expenses, capital expenses and other expenses outlined in the Gateway Center South Whole Loan documents to the extent that sums on deposit in the applicable reserve account are insufficient for the payment thereof.
A “Cash Sweep Event” means (i) an event of default, (ii) any bankruptcy action of the borrower or (iii) the debt service coverage ratio falling below 1.10x (a “Cash Sweep DSCR Trigger Event”).
A Cash Sweep Event will cease (a) if the Cash Sweep Event is caused solely by the occurrence of an event of default, upon a cure of the event of default that gave rise to such Cash Sweep Event or such event of default is waived in writing by the lender; provided that the lender has not exercised any of its rights to accelerate the Gateway Center South Whole Loan, or to appoint a receiver, liquidator, assignee, trustee, sequestrator, custodian or any other similar official or commence a foreclosure action; (b) if the Cash Sweep Event is caused solely by the occurrence of any bankruptcy action of the borrower and is solely as a result of the filing of an involuntary petition, case or proceeding against the borrower with respect to which none of the borrower, guarantor or any affiliate of the borrower or guarantor solicited or actively facilitated the solicitation of petitioning creditors or consented to or otherwise joined in such involuntary petition, case or proceeding, upon the same being discharged or dismissed within 90 days of such filing; and (c) if the Cash Sweep Event is caused solely by the occurrence of a Cash Sweep DSCR Trigger Event, once the debt service coverage ratio is greater than 1.10x for one calendar quarter.
A Cash Sweep DSCR Trigger Event will not be deemed to have commenced so long as (x) no event of default and no other Cash Sweep Event has occurred and is continuing and (y) within 10 business days of the borrower’s receipt of notice of the commencement of such Cash Sweep DSCR Trigger Event or any time thereafter during the continuance of such Cash Sweep Event, the borrower delivers to the lender cash collateral or a letter of credit complying with the terms and conditions of the Gateway Center South Whole Loan documents in an amount, that, if applied to reduce the outstanding principal balance of the Gateway Center South Whole Loan, would result in a debt service coverage ratio of at least 1.10x (on such date of determination).
| THE INFORMATION IN THIS STRUCTURAL AND COLLATERAL TERM SHEET IS NOT COMPLETE AND MAY BE AMENDED PRIOR TO THE TIME OF SALE. THIS TERM SHEET IS NOT AN OFFER TO SELL THESE SECURITIES AND IT IS NOT A SOLICITATION OF AN OFFER TO BUY THESE SECURITIES IN ANY JURISDICTION WHERE THE OFFER OR SALE IS NOT PERMITTED. |
| | 16 | |
| Structural and Collateral Term Sheet | | BMO 2023-5C1 |
| No. 1 – Gateway Center South |
Subordinate and Mezzanine Debt. None.
Partial Release. None.
Ground Lease. None.
| THE INFORMATION IN THIS STRUCTURAL AND COLLATERAL TERM SHEET IS NOT COMPLETE AND MAY BE AMENDED PRIOR TO THE TIME OF SALE. THIS TERM SHEET IS NOT AN OFFER TO SELL THESE SECURITIES AND IT IS NOT A SOLICITATION OF AN OFFER TO BUY THESE SECURITIES IN ANY JURISDICTION WHERE THE OFFER OR SALE IS NOT PERMITTED. |
| | 17 | |
| Structural and Collateral Term Sheet | | BMO 2023-5C1 |
| No. 2 – 11 West 42nd Street |
| THE INFORMATION IN THIS STRUCTURAL AND COLLATERAL TERM SHEET IS NOT COMPLETE AND MAY BE AMENDED PRIOR TO THE TIME OF SALE. THIS TERM SHEET IS NOT AN OFFER TO SELL THESE SECURITIES AND IT IS NOT A SOLICITATION OF AN OFFER TO BUY THESE SECURITIES IN ANY JURISDICTION WHERE THE OFFER OR SALE IS NOT PERMITTED. |
| | 18 | |
| Structural and Collateral Term Sheet | | BMO 2023-5C1 |
| No. 2 – 11 West 42nd Street |
| THE INFORMATION IN THIS STRUCTURAL AND COLLATERAL TERM SHEET IS NOT COMPLETE AND MAY BE AMENDED PRIOR TO THE TIME OF SALE. THIS TERM SHEET IS NOT AN OFFER TO SELL THESE SECURITIES AND IT IS NOT A SOLICITATION OF AN OFFER TO BUY THESE SECURITIES IN ANY JURISDICTION WHERE THE OFFER OR SALE IS NOT PERMITTED. |
| | 19 | |
| Structural and Collateral Term Sheet | | BMO 2023-5C1 |
| No. 2 – 11 West 42nd Street |
| THE INFORMATION IN THIS STRUCTURAL AND COLLATERAL TERM SHEET IS NOT COMPLETE AND MAY BE AMENDED PRIOR TO THE TIME OF SALE. THIS TERM SHEET IS NOT AN OFFER TO SELL THESE SECURITIES AND IT IS NOT A SOLICITATION OF AN OFFER TO BUY THESE SECURITIES IN ANY JURISDICTION WHERE THE OFFER OR SALE IS NOT PERMITTED. |
| | 20 | |
| Structural and Collateral Term Sheet | | BMO 2023-5C1 |
| No. 2 – 11 West 42nd Street |
| Mortgage Loan Information | | Property Information |
| Mortgage Loan Seller: | LMF, BMO | | Single Asset / Portfolio: | Single Asset |
| Original Principal Balance(1): | $62,500,000 | | Title: | Fee |
| Cut-off Date Principal Balance(1): | $62,500,000 | | Property Type – Subtype: | Office - CBD |
| % of IPB: | 8.2% | | Net Rentable Area (SF): | 960,568 |
| Loan Purpose: | Refinance | | Location: | New York, NY |
| Borrower: | 11 West 42 Realty Investors, L.L.C. | | Year Built / Renovated: | 1927 / 2018 |
| Borrower Sponsors(2): | Tishman Speyer Properties, L.P. and Silverstein Properties, LLC | | Occupancy: | 98.6% |
| Interest Rate: | 7.44000% | | Occupancy Date: | 5/1/2023 |
| Note Date: | 6/30/2023 | | 4th Most Recent NOI (As of): | $27,010,956 (12/31/2020) |
| Maturity Date: | 7/6/2028 | | 3rd Most Recent NOI (As of): | $26,436,280 (12/31/2021) |
| Interest-only Period: | 60 months | | 2nd Most Recent NOI (As of): | $26,673,211 (12/31/2022) |
| Original Term: | 60 months | | Most Recent NOI (As of)(6): | $26,697,022 (TTM 3/31/2023) |
| Original Amortization Term: | None | | UW Economic Occupancy: | 95.0% |
| Amortization Type: | Interest Only | | UW Revenues: | $70,904,067 |
| Call Protection(3): | L(23),YM1(2),DorYM1(28),O(7) | | UW Expenses: | $39,203,449 |
| Lockbox / Cash Management: | Hard / Springing | | UW NOI(6): | $31,700,618 |
| Additional Debt(1): | Yes | | UW NCF: | $28,626,800 |
| Additional Debt Balance(1): | $211,500,000 / $56,000,000 | | Appraised Value / Per SF: | $555,000,000 / $578 |
| Additional Debt Type(1)(4): | Pari Passu / Mezzanine | | Appraisal Date: | 4/19/2023 |
| | | | | |
| Escrows and Reserves(5) | | Financial Information(7) |
| | Initial | Monthly | Initial Cap | | | Whole Loan | Total Debt |
| Taxes: | $0 | Springing | N/A | | Cut-off Date Loan / SF: | $285 | $344 |
| Insurance: | $0 | Springing | N/A | | Maturity Date Loan / SF: | $285 | $344 |
| Replacement Reserves: | $0 | Springing | $288,170 | | Cut-off Date LTV: | 49.4% | 59.5% |
| TI/LC Reserve: | $10,000,000 | $240,142 | N/A | | Maturity Date LTV: | 49.4% | 59.5% |
| Free Rent Reserve: | $5,685,544 | $0 | N/A | | UW NCF DSCR: | 1.39x | 1.00x |
| Landlord Obligation Reserve: | $13,479,707 | $0 | N/A | | UW NOI Debt Yield: | 11.6% | 9.6% |
| | | | | | | | |
| Sources and Uses |
| Sources | Proceeds | % of Total | | | Uses | Proceeds | % of Total | |
| Whole Loan | $274,000,000 | 79.7 | % | | Loan Payoff | $301,013,950 | 87.5 | % |
| Mezzanine Loan | 56,000,000 | 16.3 | | | Reserves | 29,165,251 | 8.5 | |
| Borrower Sponsor Equity | 13,988,916 | 4.1 | | | Closing Costs: | 13,809,715 | 4.0 | |
| Total Sources | $343,988,916 | 100.0 | % | | Total Uses | $343,988,916 | 100.0 | % |
| (1) | The 11 West 42nd Street Mortgage Loan (as defined below) is part of a whole loan evidenced by 24 pari passu notes with an aggregate original principal balance as of the Cut-off Date of $274.0 million (the “11 West 42nd Street Whole Loan”). |
| (2) | There is no non-recourse carveout guarantor or environmental indemnitor for the 11 West 42nd Street Whole Loan separate from the borrower. |
| (3) | The borrower has the option to prepay the 11 West 42nd Street Whole Loan in whole but not in part (i) on or after the payment date occurring in January 2028 without the payment of any prepayment premium or (ii) beginning on the payment date in July 2025 with the payment of a yield maintenance premium. Defeasance of the 11 West 42nd Street Whole Loan in whole but not in part is permitted after the date that is the earlier of (i) two years from the closing date of the securitization that includes the last note of the 11 West 42nd Street Whole Loan to be securitized and (ii) August 6, 2026. The assumed defeasance lockout period of 25 payments is based on the anticipated closing date of the BMO 2023-5C1 securitization trust in August 2023. The actual lockout period may be longer. |
| (4) | For a full description of the mezzanine loan see “Mezzanine Debt” below. |
| (5) | For a full description of Escrows and Reserves, see “Escrows and Reserves” below. |
| (6) | The increased UW NOI compared to the TTM 3/31/2023 Most Recent NOI is mainly due to recent leasing activities. |
| (7) | The information presented under the Financial Information chart above reflects the Cut-off Date balance of the 11 West 42nd Street Whole Loan and the aggregate of the Cut-off Date balance of the 11 West 42nd Street Whole Loan and a $56.0 million mezzanine loan. |
The Loan. The second largest mortgage loan (the “11 West 42nd Street Mortgage Loan”) is part of a fixed rate whole loan secured by the borrower’s fee simple interest in a 960,568 square foot office property located in New York, New York (the “11 West 42nd Street Property”). The 11 West 42nd Street Whole Loan consists of twenty-four pari passu notes and accrues interest at a rate of 7.44000% per annum. The 11 West 42nd Street Whole Loan has a five-year term and is interest-only for the term of the loan. The 11 West 42nd Street Whole Loan was co-originated on June 30, 2023 by Bank of America N.A. (“BANA”), UBS AG, by and through its branch office at 1285 Avenue of the Americas, New York, New York (“UBS AG”) and LMF Commercial, LLC (“LMF”). On July 7, 2023, LMF transferred Notes A-3-2, A-3-4, A-3-6 and A-3-8, in the aggregate original principal amount of $45,666,666, to Bank of Montreal (“BMO”). The non-
| THE INFORMATION IN THIS STRUCTURAL AND COLLATERAL TERM SHEET IS NOT COMPLETE AND MAY BE AMENDED PRIOR TO THE TIME OF SALE. THIS TERM SHEET IS NOT AN OFFER TO SELL THESE SECURITIES AND IT IS NOT A SOLICITATION OF AN OFFER TO BUY THESE SECURITIES IN ANY JURISDICTION WHERE THE OFFER OR SALE IS NOT PERMITTED. |
| | 21 | |
| Structural and Collateral Term Sheet | | BMO 2023-5C1 |
| No. 2 – 11 West 42nd Street |
controlling Notes A-3-1, A-3-2 and A-3-3, with an original aggregate principal amount of $62,500,000, will be included in the BMO 2023-5C1 securitization trust. The remaining notes are currently held by BMO, BANA, UBS AG, and LMF or their respective affiliates and are expected to be contributed to one or more securitization trust(s). The 11 West 42nd Street Whole Loan will be serviced pursuant to the pooling and servicing agreement for the BMO 2023-5C1 securitization trust until the controlling Note A-1-1 is securitized, whereupon the 11 West 42nd Street Mortgage Whole Loan will be serviced pursuant to the pooling and servicing agreement for such future securitization. See “Description of the Mortgage Pool—The Whole Loans—The Serviced Pari Passu Whole Loans” and “Pooling and Servicing Agreement” in the Preliminary Prospectus.
| Whole Loan Summary |
| Note | Original Balance | Cut-off Date Balance | Note Holder | Controlling Piece |
| A-1-1 | $30,000,000 | $30,000,000 | BANA | Yes |
| A-1-2 | $25,000,000 | $25,000,000 | BANA | No |
| A-1-3 | $15,000,000 | $15,000,000 | BANA | No |
| A-1-4 | $11,333,334 | $11,333,334 | BANA | No |
| A-1-5 | $10,000,000 | $10,000,000 | BANA | No |
| A-2-1 | $6,333,333 | $6,333,333 | UBS AG | No |
| A-2-2 | $20,000,000 | $20,000,000 | UBS AG | No |
| A-2-3 | $10,000,000 | $10,000,000 | UBS AG | No |
| A-2-4 | $10,000,000 | $10,000,000 | UBS AG | No |
| A-2-5 | $10,000,000 | $10,000,000 | UBS AG | No |
| A-2-6 | $10,000,000 | $10,000,000 | UBS AG | No |
| A-2-7 | $5,000,000 | $5,000,000 | UBS AG | No |
| A-2-8 | $5,000,000 | $5,000,000 | UBS AG | No |
| A-2-9 | $5,000,000 | $5,000,000 | UBS AG | No |
| A-2-10 | $5,000,000 | $5,000,000 | UBS AG | No |
| A-2-11 | $5,000,000 | $5,000,000 | UBS AG | No |
| A-3-1 | $25,000,000 | $25,000,000 | BMO 2023-5C1 | No |
| A-3-2 | $27,500,000 | $27,500,000 | BMO 2023-5C1 | No |
| A-3-3 | $10,000,000 | $10,000,000 | BMO 2023-5C1 | No |
| A-3-4 | $7,500,000 | $7,500,000 | BMO | No |
| A-3-5 | $5,000,000 | $5,000,000 | LMF | No |
| A-3-6 | $5,000,000 | $5,000,000 | BMO | No |
| A-3-7 | $5,666,667 | $5,666,667 | LMF | No |
| A-3-8 | $5,666,666 | $5,666,666 | BMO | No |
| Whole Loan | $274,000,000 | $274,000,000 | | |
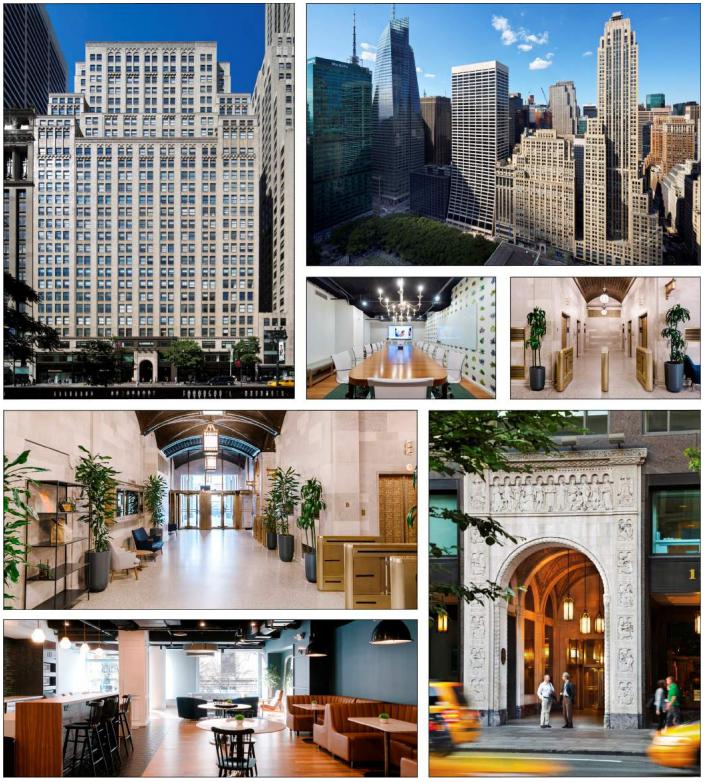
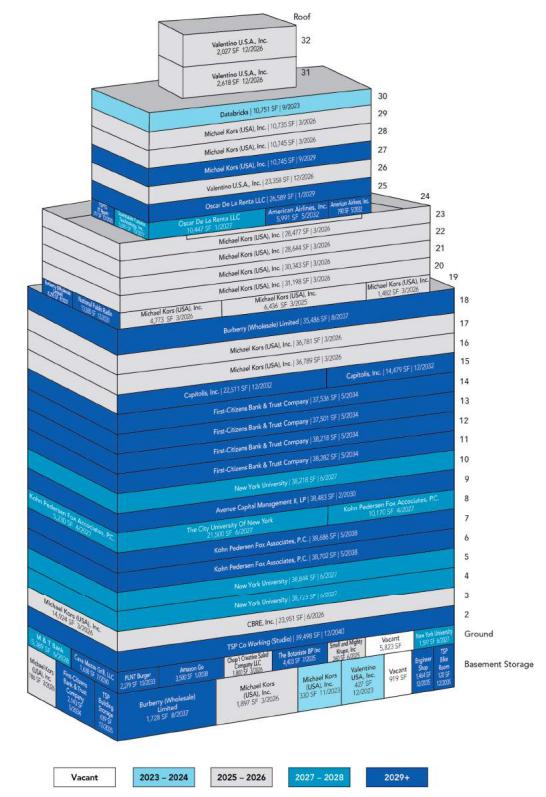
The Property. The 11 West 42nd Street Property is a 32-story, LEED Silver certified, Class A- office tower located in New York, New York totaling 960,568 SF. Originally constructed in 1927, the 11 West 42nd Street Property is located two blocks west of Grand Central Station and overlooks the New York Public Library and Bryant Park. The 11 West 42nd Street Property features a unique H-shaped layout, which allows for eight corner offices per floor and an abundance of natural light. Since 2018, the borrower sponsors have spent approximately $38.2 million in renovations which include improvements to the lobby, elevators, entrances and windows. Since 2021, the borrower sponsors have executed a total of 321,255 SF in lease renewals, extensions and new leases. The 11 West 42nd Street Property is 98.6% leased to a diverse roster of tenants and has a weighted average remaining lease term of over seven years.
The 11 West 42nd Street Property consists of 891,270 SF of office space, 20,866 SF of retail space, 39,498 SF of co-working space, and 8,934 SF of storage space. Most of the retail tenants at the 11 West 42nd Street Property are fast casual food chains. In May 2021, the borrower sponsors began their offering of the Studio by Tishman co-working space (the “Studio”) at the 11 West 42nd Street Property (4.1% of NRA). The Studio is a flexible and modern co-working space that caters to both individual professionals and corporate clients. Owned and operated by Tishman, the Studio offers a wide range of options for its members, including private offices, customized suites and hot desks. The Studio has 15 different locations with approximately 400 desks, which were 87.7% occupied as of April 2023, with 98% of occupied desks belonging to corporate clients.
The 11 West 42nd Street Property has maintained strong occupancy levels over the past five years, averaging 93.4% occupancy. Investment-grade rated tenants or their affiliates occupy 64.3% of SF at the 11 West 42nd Street Property and contribute 65.5% of underwritten base rent. Major tenants at the 11 West 42nd Street Property include Michael Kors (USA), Inc. (“Michael Kors”), First-Citizens Bank & Trust Company (“First-Citizens Bank”) and New York University (“NYU”). In addition, several tenants use the 11 West 42nd Street Property as headquarters space and have made significant investments in their spaces. The 11 West 42nd Street Property
| THE INFORMATION IN THIS STRUCTURAL AND COLLATERAL TERM SHEET IS NOT COMPLETE AND MAY BE AMENDED PRIOR TO THE TIME OF SALE. THIS TERM SHEET IS NOT AN OFFER TO SELL THESE SECURITIES AND IT IS NOT A SOLICITATION OF AN OFFER TO BUY THESE SECURITIES IN ANY JURISDICTION WHERE THE OFFER OR SALE IS NOT PERMITTED. |
| | 22 | |
| Structural and Collateral Term Sheet | | BMO 2023-5C1 |
| No. 2 – 11 West 42nd Street |
is the corporate headquarters for Michael Kors, Kohn Pedersen Fox Associates, P.C. (“KPF”), Avenue Capital Management II, LP (“Avenue Capital”), Oscar De La Renta LLC and Capitolis, Inc. (“Capitolis”).
Major Tenants.
Michael Kors (USA), Inc (254,485 square feet; 26.5% of NRA; 27.4% of underwritten base rent; Ba1/BBB-/BBB-; Moody’s/S&P/Fitch) is a luxury fashion brand founded by designer Michael Kors in 1981. The Michael Kors brand has a global reach, with a strong presence in major fashion markets around the world and is popular among celebrities and fashion-conscious consumers. The 11 West 42nd Street Property serves as the worldwide headquarters for Michael Kors. The Michael Kors lease is guaranteed by the publicly traded parent company, Capri Holdings, which also manages other brands such as Versace and Jimmy Choo. As of July 2023, Capri Holdings had an equity market capitalization of approximately $4.3 billion.
Michael Kors currently occupies 252,072 SF of office and 2,413 SF of storage space. Michael Kors first leased space at the 11 West 42nd Street Property in 2003 and since has expanded into 16 suites. The tenant has no non-standard termination options, outstanding allowances or free rent. Michael Kors has 236,974 SF expiring on March 31, 2026, 10,745 SF expiring on September 30, 2029, 6,436 SF expiring on March 31, 2025 and 330 SF expiring on November 30, 2023. The tenant has one 5-year renewal option on all non-basement suites, with a 15 to 24-month notice period varying across suites. Michael Kors currently subleases three spaces (totaling 28,107 SF, 11.0% of Michael Kors’ NRA) to Aston Martin, Lagonda of North America, Inc., ExpandEd Schools, Inc. and National Public Radio, Inc. (“NPR”). According to the borrower sponsors, if a proposed lease amendment between the borrower and NPR is executed, NPR will directly lease at least an additional 4,888 SF of the Michael Kors subleased space and add it to their existing leased premises (13,580 SF), all with a lease expiration of December 2031. We cannot assure you that this amendment will be signed as expected or at all.
According to the borrower sponsors, Michael Kors is currently renovating its space at the tenant’s sole cost and is in discussions with the borrower sponsors for an early renewal of a portion of its lease. If this proposed lease amendment is executed, Michael Kors would renew 204,481 SF of its expiring space (202,068 SF of office and 2,413 SF of storage), terminate the non-subleased portion of its lease on the 22nd floor (19,238 SF), vacate 14,924 SF on the third floor in March 2026, vacate 6,436 SF on the 19th floor in March 2025 (at least 4,888 SF of the 6,436 SF will switch to a direct lease to NPR), and vacate 9,406 SF of subleased space on the 22nd floor in March 2026. We cannot assure you that this amendment will be signed as expected or at all.
First-Citizens Bank & Trust Company (153,680 square feet; 16.0% of NRA; 16.0% of underwritten base rent; Baa2/BBB/NR; Moody’s/S&P/Fitch) is a financial institution that provides a wide range of banking and financial services to individuals, businesses and organizations. Founded in 1898, First-Citizens Bank is a full-service bank that offers a variety of products and services. First-Citizens Bank has a strong presence in the southeastern United States, with branches located in North Carolina, South Carolina, Virginia, Tennessee and Georgia, as well as 16 other states. As of July 2023, First-Citizens Bank had an equity market capitalization of $18.6 billion.
First Citizens Bank currently occupies 151,537 SF of office and 2,143 SF of storage space, with a lease expiration date of May 31, 2034 and two 5-year renewal options (or one 10-year renewal option) on all of its suites with a 16-month notice period. First-Citizens Bank first leased space at the 11 West 42nd Street Property in 2006 and since has expanded into five suites. The tenant has no non-standard termination options, outstanding allowances or free rent.
New York University (117,382 square feet; 12.2% of NRA; 11.4% of underwritten base rent; Aa2/AA-/NR; Moody’s/S&P/Fitch) (“NYU”) was established in 1831 and is one of the largest and most prestigious universities in the United States, with a student body of over 65,000 students and an endowment of over $5.3 billion as of August 2022. The NYU Midtown Center, located at the 11 West 42nd Street Property, is home to many graduate programs within the School of Professional Studies. The 11 West 42nd Street Property provides access for NYU students, faculty and staff to the Jack Brause Library, one of NYU’s most coveted libraries, a computer science lab, design labs and classrooms for its students. Additionally, NYU added its own entrance on the 43rd Street side of the 11 West 42nd Street Property to help regulate ingress and egress of the student base.
NYU currently occupies 115,785 SF of office and 1,597 SF of retail space, with a lease expiration of June 30, 2027 and one 5-year renewal option on all of its suites with a 22-month notice period at 2% rent increases per annum. NYU has leased space at the 11 West 42nd Street Property since the 1970s and has renewed multiple times. NYU is currently occupying four suites, and most recently renewed its lease in October 2021. The tenant has no non-standard termination options. NYU has approximately $1.65 million in outstanding landlord obligations and two months of free rent totaling approximately $1,125,423 ($557,140 in December 2023 and $568,283 in December 2024). All outstanding landlord obligations and free rent was reserved at origination.
See “Description of the Mortgage Pool—Tenant Issues” in the Preliminary Prospectus.
Environmental. According to the Phase I environmental assessment dated April 24, 2023, there was no evidence of any recognized environmental conditions at the 11 West 42nd Street Property.
| THE INFORMATION IN THIS STRUCTURAL AND COLLATERAL TERM SHEET IS NOT COMPLETE AND MAY BE AMENDED PRIOR TO THE TIME OF SALE. THIS TERM SHEET IS NOT AN OFFER TO SELL THESE SECURITIES AND IT IS NOT A SOLICITATION OF AN OFFER TO BUY THESE SECURITIES IN ANY JURISDICTION WHERE THE OFFER OR SALE IS NOT PERMITTED. |
| | 23 | |
| Structural and Collateral Term Sheet | | BMO 2023-5C1 |
| No. 2 – 11 West 42nd Street |
The following table presents certain information relating to the historical and current occupancy of the 11 West 42nd Street Property:
| Historical and Current Occupancy |
| 2020(1) | 2021(1) | 2022(1) | Current(2) |
| 88.0% | 89.6% | 98.9% | 98.6% |
| (1) | Historical occupancies are as of December 31 of each respective year. |
| (2) | Current occupancy is as of May 1, 2023. |
The following table presents certain information relating to the largest tenants at of the 11 West 42nd Street Property:
| Tenant Summary(1) |
| Tenant | Ratings
Moody’s/S&P/Fitch(2) | Net Rentable Area (SF) | % of
Total NRA | UW Base Rent PSF | UW Base Rent | % of Total
UW Base Rent | Lease
Expiration Date |
| Michael Kors (USA), Inc(3) | Ba1/BBB-/BBB- | 254,485 | 26.5 | % | $62.89 | $16,003,389 | 27.4 | % | Various(3) |
| First-Citizens Bank & Trust Company | Baa2/BBB/NR | 153,680 | 16.0 | | $60.80 | 9,343,789 | 16.0 | | 5/31/2034 |
| New York University | Aa2/AA-/NR | 117,382 | 12.2 | | $56.95 | 6,685,426 | 11.4 | | 6/30/2027 |
| Kohn Pedersen Fox Associates, P.C.(4) | NR/NR/NR | 92,788 | 9.7 | | $61.13 | 5,672,095 | 9.7 | | Various(4) |
| Burberry (Wholesale) Limited(5) | Baa2/NR/NR | 45,509 | 4.7 | | $62.78 | 2,857,280 | 4.9 | | 8/31/2037 |
| Major Tenants | | 663,844 | 69.1 | % | $61.10 | $40,561,979 | 69.3 | % | |
| | | | | | | | |
| Other Tenants(6) | | 283,752 | 29.5 | | $63.20 | 17,932,301 | 30.7 | | |
| Occupied Collateral Total / Wtd. Avg. | | 947,596 | 98.6 | % | $61.73 | $58,494,280 | 100.0 | % | |
| Vacant Space(7) | | 12,972 | 1.4 | % | | | | |
| | | | | | | | |
| Collateral Total | | 960,568 | 100.0 | % | | | | |
| | | | | | | | |
| (1) | Information is based on the underwritten rent roll dated May 1, 2023 and is inclusive of rent steps through August 2024 and straight-lined rent for investment-grade tenants or their affiliates averaged to earlier of lease expiration or loan maturity. |
| (2) | In certain instances, ratings provided are those of the parent company of the entity shown, whether or not the parent company guarantees the lease. |
| (3) | Michael Kors leases 236,974 SF expiring on March 31, 2026, 10,745 SF expiring on September 30, 2029, 6,436 SF expiring on March 31, 2025 and 330 SF expiring on November 30, 2023. Michael Kors currently subleases three spaces (totaling 28,107 SF) to Aston Martin, Lagonda of North America, Inc., ExpandEd Schools, Inc. and NPR. According to the borrower sponsors, Michael Kors is currently renovating its space at the tenant's sole cost and is in discussions with the borrower sponsors for an early renewal of a portion of its lease. See "Major Tenants" above. |
| (4) | KPF leases 77,388 SF expiring on May 31, 2038 and 15,400 SF expiring on April 30, 2027. |
| (5) | Burberry (Wholesale) Limited has the option to terminate its lease on December 31, 2033, upon 20 months’ notice and payment of a termination fee. |
| (6) | Other Tenants is inclusive of 39,498 SF of space operated by Tishman as the Studio and 1,894 SF of ground level retail (NYU entrance) and office space (IT room and bike room) for which no rent is associated or underwritten. |
| (7) | Vacant Space includes 6,742 SF of retail space and 6,230 SF of office space. |
| THE INFORMATION IN THIS STRUCTURAL AND COLLATERAL TERM SHEET IS NOT COMPLETE AND MAY BE AMENDED PRIOR TO THE TIME OF SALE. THIS TERM SHEET IS NOT AN OFFER TO SELL THESE SECURITIES AND IT IS NOT A SOLICITATION OF AN OFFER TO BUY THESE SECURITIES IN ANY JURISDICTION WHERE THE OFFER OR SALE IS NOT PERMITTED. |
| | 24 | |
| Structural and Collateral Term Sheet | | BMO 2023-5C1 |
| No. 2 – 11 West 42nd Street |
The following table presents certain information relating to the tenant lease expirations of the 11 West 42nd Street Property:
| Lease Rollover Schedule(1)(2) |
| Year | Number of Leases Expiring(3) | Net Rentable Area Expiring(3) | % of NRA Expiring | UW Base Rent Expiring | % of UW Base Rent Expiring | Cumulative Net Rentable Area Expiring | Cumulative % of NRA Expiring | Cumulative UW Base Rent Expiring | Cumulative % of UW Base Rent Expiring |
| Vacant(4) | 0 | 12,972 | | 1.4 | % | NAP | NA | P | 12,972 | 1.4% | NAP | NAP | |
| 2023 & MTM | 3 | 11,508 | | 1.2 | | $980,400 | 1.7 | % | 24,480 | 2.5% | $980,400 | 1.7% | |
| 2024 | 0 | 0 | | 0.0 | | 0 | 0.0 | | 24,480 | 2.5% | $980,400 | 1.7% | |
| 2025 | 2 | 6,696 | | 0.7 | | 434,430 | 0.7 | | 31,176 | 3.2% | $1,414,830 | 2.4% | |
| 2026 | 18 | 290,728 | | 30.3 | | 19,008,777 | 32.5 | | 321,904 | 33.5% | $20,423,607 | 34.9% | |
| 2027 | 9 | 169,812 | | 17.7 | | 9,621,168 | 16.4 | | 491,716 | 51.2% | $30,044,775 | 51.4% | |
| 2028 | 1 | 5,389 | | 0.6 | | 1,141,927 | 2.0 | | 497,105 | 51.8% | $31,186,702 | 53.3% | |
| 2029 | 2 | 37,334 | | 3.9 | | 2,268,817 | 3.9 | | 534,439 | 55.6% | $33,455,519 | 57.2% | |
| 2030 | 3 | 43,621 | | 4.5 | | 4,016,068 | 6.9 | | 578,060 | 60.2% | $37,471,587 | 64.1% | |
| 2031 | 1 | 13,580 | | 1.4 | | 570,360 | 1.0 | | 591,640 | 61.6% | $38,041,947 | 65.0% | |
| 2032 | 4 | 43,771 | | 4.6 | | 2,556,130 | 4.4 | | 635,411 | 66.1% | $40,598,077 | 69.4% | |
| 2033 | 1 | 2,279 | | 0.2 | | 414,299 | 0.7 | | 637,690 | 66.4% | $41,012,376 | 70.1% | |
| 2034 & Beyond | 18 | 322,878 | | 33.6 | | 17,481,904 | 29.9 | | 960,568 | 100.0% | $58,494,280 | 100.0% | |
| Total | 62 | 960,568 | | 100.0 | % | $58,494,280 | 100.0 | % | | | | |
| (1) | Based on the underwritten rent roll dated May 1, 2023. |
| (2) | The 11 West 42nd Property has 24 tenants in total, and certain tenants are subject to more than one lease. Certain tenants may have lease termination options that are exercisable prior to the originally stated expiration date of the subject lease and that are not considered in the lease rollover schedule. |
| (3) | Number of Leases Expiring and Net Rentable Area Expiring includes 39,498 SF of space operated by Tishman as the Studio, 4,636 SF of storage space and 1,894 SF of ground level retail (NYU entrance) and office space (IT room and bike room) for which no rent is associated or underwritten. |
| (4) | Vacant space includes 6,742 SF of retail space and 6,230 SF of office space. |
| THE INFORMATION IN THIS STRUCTURAL AND COLLATERAL TERM SHEET IS NOT COMPLETE AND MAY BE AMENDED PRIOR TO THE TIME OF SALE. THIS TERM SHEET IS NOT AN OFFER TO SELL THESE SECURITIES AND IT IS NOT A SOLICITATION OF AN OFFER TO BUY THESE SECURITIES IN ANY JURISDICTION WHERE THE OFFER OR SALE IS NOT PERMITTED. |
| | 25 | |
| Structural and Collateral Term Sheet | | BMO 2023-5C1 |
| No. 2 – 11 West 42nd Street |
The following table presents certain information relating to the underwritten cash flows of the 11 West 42nd Street Property:
| Operating History and Underwriting Net Cash Flow |
| | 2019 | 2020 | 2021 | 2022 | T12 March 2023 | Underwritten | Per Square Foot | %(1) |
| In Place Rent(2) | $45,151,694 | $51,735,865 | $49,799,980 | $50,036,067 | $50,307,751 | $58,494,280 | $60.90 | | 86.3 | % |
| Vacancy Gross Up | 0 | 0 | 0 | 0 | 0 | 928,565 | 0.97 | | 1.4 | |
| Straight Line Rent(3) | 0 | 0 | 0 | 0 | 0 | 291,133 | 0.30 | | 0.4 | |
| Percentage Rent | 0 | 0 | 0 | 0 | 0 | 12,675 | 0.01 | | 0.0 | |
| Gross Potential Rent | $45,151,694 | $51,735,865 | $49,799,980 | $50,036,067 | $50,307,751 | $59,726,653 | $62.18 | | 88.1 | % |
| Total Reimbursements | 6,811,606 | 9,169,515 | 7,612,544 | 5,612,853 | 6,247,574 | 8,092,259 | 8.42 | | 11.9 | |
| Total Gross Income | $51,963,300 | $60,905,380 | $57,412,524 | $55,648,921 | $56,555,325 | $67,818,913 | $70.60 | | 100.0 | % |
| Other Income(4) | 4,035,185 | 2,906,507 | 3,547,401 | 5,519,818 | 6,127,949 | 6,476,088(5) | 6.74 | | 9.1 | |
| (Vacancy/Credit Loss) | 0 | 0 | 0 | 0 | 0 | (3,390,934) | (3.53) | | (4.8) | |
| Effective Gross Income | $55,998,485 | $63,811,888 | $60,959,925 | $61,168,739 | $62,683,274 | $70,904,067 | $73.81 | | 100.0 | % |
| Total Expenses | 32,041,491 | 36,800,932 | 34,523,645 | 34,495,528 | 35,986,252 | 39,203,449 | 40.81 | | 55.3 | |
| Net Operating Income | $23,956,994 | $27,010,956 | $26,436,280 | $26,673,211 | $26,697,022 | $31,700,618 | $33.00 | | 44.7 | % |
| Capital Expenditures | 0 | 0 | 0 | 0 | 0 | 192,114 | 0.20 | | 0.3 | |
| TI/LC | 0 | 0 | 0 | 0 | 0 | 2,881,704 | 3.00 | | 4.1 | |
| Net Cash Flow | $23,956,994 | $27,010,956 | $26,436,280 | $26,673,211 | $26,697,022 | $28,626,800 | $29.80 | | 40.4 | % |
| (1) | % column represents percent of Total Gross Income for all revenue lines and represents percent of Effective Gross Income for the remainder of fields. |
| (2) | Underwritten In Place Rent includes rent steps through August 1, 2024. |
| (3) | Includes straight-lined rent for investment-grade tenants or their affiliates averaged to earlier of lease expiration or loan maturity. |
| (4) | Other Income includes income and fees from various sources such as concierge, licensing, HVAC, amenity space, cleaning, special events, tenant water and condenser, etc. |
| (5) | Underwritten Other Income includes $3,424,954 of income from the Studio that is based on the borrower sponsors’ budget. The Studio is a Tishman owned co-working space that was incorporated in 2021. The Studio has approximately 400 desks, which were 87.7% occupied as of April 2023, with 98% of occupied desks belonging to corporate tenants. The rest of the Underwritten Other Income includes income and fees from various sources such as concierge, licensing, HVAC, amenity space, cleaning, special events, tenant water and condenser, etc. |
The Market. The 11 West 42nd Street Property is situated on the north side of West 42nd Street between Fifth Avenue and Avenue of the Americas, in the Grand Central office submarket of Midtown Manhattan. The 11 West 42nd Street Property is located across from the New York Public Library and Bryant Park and has accessibility to a large transportation network comprised of subways, railroads and buses. Bryant Park is accessible from several major Manhattan commuter transportation hubs. Nearby subway stations include the Bryant Park station that provides access to five different subway lines (7, B, D, F, and M trains), the Times Square/42nd Street/Eighth Avenue station that provides access to 12 different subway lines (1, 2, 3, 7, A, C, E, N, Q, R, S and W trains) and Grand Central Terminal that provides access to five different subway lines (4, 5, 6, 7 and S trains), providing for accessible commutes from all five boroughs. Metro North railroad at Grand Central Terminal also provides access to New York suburbs and Connecticut.
According to the appraisal, leasing activity has been strong in the Grand Central office submarket and properties near regional transportation nodes have experienced an increase in demand and positive leasing. The 11 West 42nd Street Property presents a lower-cost alternative to other Class A space in the Grand Central office submarket. As of the first quarter of 2023, the Grand Central office submarket had 81.7% of Class A space, with an inventory of 37,423,446 SF, a vacancy rate of 17.6% and average rental rate of $75.87 PSF.
The 11 West 42nd Street Property benefits from the area’s population density. According to the appraisal, the estimated 2022 population in New York City was approximately 8,130,800. The estimated 2022 average household income in New York City was $110,634.
| THE INFORMATION IN THIS STRUCTURAL AND COLLATERAL TERM SHEET IS NOT COMPLETE AND MAY BE AMENDED PRIOR TO THE TIME OF SALE. THIS TERM SHEET IS NOT AN OFFER TO SELL THESE SECURITIES AND IT IS NOT A SOLICITATION OF AN OFFER TO BUY THESE SECURITIES IN ANY JURISDICTION WHERE THE OFFER OR SALE IS NOT PERMITTED. |
| | 26 | |
| Structural and Collateral Term Sheet | | BMO 2023-5C1 |
| No. 2 – 11 West 42nd Street |
The following table presents certain information relating to comparable office properties to the 11 West 42nd Street Property:
| Competitive Building Summary(1) |
Property Name | Year Built / Renovated | Rentable Area (SF) | Stories | Occupancy | Asking Rent Low PSF | Asking Rent High PSF |
| 11 West 42nd Street | 1927 / 2018 | 960,568(2) | 32 | 98.6%(1) | $42.00(2)(3) | $90.00(2)(3) |
| 4 Bryant Park | 1920 / NAP | 150,000 | 12 | 100.0% | NAV | NAV |
| 1065 Avenue of the Americas | 1958 / NAP | 536,524 | 34 | 75.2% | $72.00 | $105.00 |
| 1120 Avenue of the Americas | 1951 / 2005 | 400,000 | 21 | 98.1% | NAV | NAV |
| 500 Fifth Avenue | 1938 / NAP | 721,702 | 59 | 85.8% | $79.00 | $92.00 |
| 125 Park Avenue | 1923 / 2004 | 445,437 | 26 | 99.2% | NAV | NAV |
| 420 Lexington Avenue | 1927 / 1999 | 1,112,424 | 31 | 78.5% | $62.00 | $65.00 |
| (2) | Information is based on the underwritten rent roll dated May 1, 2023. |
| (3) | Asking Rent Low PSF and Asking Rent High PSF is based on the UW Rent PSF range for office tenants at the 11 West 42nd Street Property. |
The following table presents certain information relating to comparable office rental properties for the 11 West 42nd Street Property:
| Comparable Office Rental Summary(1) |
| Property Name/Location | Year Built/ Renovated | Rentable Area (SF) | Tenant | Lease Type | Suite Size (SF) | Commencement | Rent (PSF)) | TIs (PSF) / Free Rent (Months) | Escalations |
11 West 42nd Street 11 West 42nd Street New York, NY | 1927/2018 | 960,568(2) | Burberry (Wholesale) Limited(2) | Modified Gross(3) | 45,509 | | $62.78(2) | $140 / 15(2) | $1.00 / year(2) |
10 East 40th Street 10 East 40th Street New York, NY | 1929/2008 | 347,000 | Alpha Square Group | Modified Gross | 8,770 | Apr-23 | $71.00 | $0 / 8.5 | Flat |
10 East 40th Street 10 East 40th Street New York, NY | 1929/2008 | 347,000 | Hart Howerton | Modified Gross | 27,211 | Feb-23 | $70.00 | $120 / 18 | $75 PSF in year 7 |
60 East 42nd Street 60 East 42nd Street New York, NY | 1929/NAP | 1,110,005 | Morici & Morici LLP | Modified Gross | 5,717 | Jul-22 | $71.00 | $135 / 5 | Flat |
530 Fifth Avenue 530 Fifth Avenue New York, NY | 1957/NAP | 484,152 | APFM, Inc. | Modified Gross | 7,803 | Jan-23 | $79.00 | $150 / 6 | N/A |
535 Fifth Avenue 535 Fifth Avenue New York, NY | 1926/2014 | 255,455 | Prima Gems USA | Modified Gross | 4,848 | Jan-23 | $60.00 | $40 / 6 | $1.50 / year |
340 Madison Avenue 340 Madison Avenue New York, NY | 1920/NAP | 714,869 | Carlyle Group | Modified Gross | 40,542 | Sep-22 | $66.00 | $152 / 9 | $71 PSF in year 6 |
521 Fifth Avenue 521 Fifth Avenue New York, NY | 1929/NAP | 339,901 | Genpact | Modified Gross | 17,796 | Sep-22 | $74.00 | $150 / 8 | $79 PSF in year 7 |
292 Madison Avenue 292 Madison Avenue New York, NY | 1923/NAP | 178,097 | Lightbox OOH Video Network | Modified Gross | 11,113 | Jul-22 | $65.00 | $110 / 1 | $70 PSF in year 5 |
| (2) | Based on the underwritten rent roll dated May 1, 2023. |
| (3) | Information is provided by the borrower sponsors. |
| THE INFORMATION IN THIS STRUCTURAL AND COLLATERAL TERM SHEET IS NOT COMPLETE AND MAY BE AMENDED PRIOR TO THE TIME OF SALE. THIS TERM SHEET IS NOT AN OFFER TO SELL THESE SECURITIES AND IT IS NOT A SOLICITATION OF AN OFFER TO BUY THESE SECURITIES IN ANY JURISDICTION WHERE THE OFFER OR SALE IS NOT PERMITTED. |
| | 27 | |
| Structural and Collateral Term Sheet | | BMO 2023-5C1 |
| No. 2 – 11 West 42nd Street |
The following table presents certain information relating to comparable retail rental properties for the 11 West 42nd Street Property:
| Comparable Retail Rental Summary(1) |
| Property Name/Location | Year Built/ Renovated | Size (SF) | Tenant | Suite Size (SF) | Rent PSF | Commencement | Lease Term (Months) |
11 West 42nd Street 11 West 42nd Street New York, NY | 1927/2018 | 960,568(2) | M&T Bank(2) | 5,389(2) | $211.90(2) | Dec-07(2) | 246(2) |
445 Fifth Avenue 445 Fifth Avenue New York, NY | NAP | NAP | Caffe Italia | 1,100 | $202.00 | Feb-23 | 120 |
1 Vanderbilt Avenue 1 Vanderbilt Avenue New York, NY | NAP | NAP | Watches of Switzerland | 2,875 | $260.00 | Feb-23 | 120 |
130 West 42nd Street 130 West 42nd Street New York, NY | NAP | NAP | NY Gifts | 4,180 | $159.00 | Jan-23 | 84 |
1166 Avenue of the Americas 1166 Avenue of the Americas New York, NY | NAP | NAP | Citibank | 3,637 | $375.00 | Sep-22 | 60 |
475 Fifth Avenue 475 Fifth Avenue New York, NY | NAP | NAP | Penske Media Corporation | 3,375 | $296.00 | May-22 | 143 |
| (2) | Based on the underwritten rent roll dated May 1, 2023. |
The following table presents certain information relating to the appraisal’s market rent conclusion for the 11 West 42nd Street Property:
| Market Rent Summary |
| Type (Floors) | Market Rent PSF | Lease Term (Years) | Rent Increase Projection | Lease Type |
| Major Office (2-7): | $59.00 | 15 plus free rent | 10.0% every 5 years | Modified Gross |
| Minor Office (2-7): | $59.00 | 10 plus free rent | 10.0% every 5 years | Modified Gross |
| Major Office (8-12): | $61.00 | 15 plus free rent | 10.0% every 5 years | Modified Gross |
| Minor Office (8-12): | $61.00 | 10 plus free rent | 10.0% every 5 years | Modified Gross |
| Major Office (13-19): | $65.00 | 15 plus free rent | 10.0% every 5 years | Modified Gross |
| Minor Office (13-19): | $65.00 | 10 plus free rent | 10.0% every 5 years | Modified Gross |
| Major Office (20-26): | $69.00 | 15 plus free rent | 10.0% every 5 years | Modified Gross |
| Minor Office (20-26): | $69.00 | 10 plus free rent | 10.0% every 5 years | Modified Gross |
| Major Office (27-30): | $72.00 | 15 plus free rent | 10.0% every 5 years | Modified Gross |
| Minor Office (27-30): | $72.00 | 10 plus free rent | 10.0% every 5 years | Modified Gross |
| Major Office (31-32): | $62.00 | 15 plus free rent | 10.0% every 5 years | Modified Gross |
| Minor Office (31-32): | $62.00 | 10 plus free rent | 10.0% every 5 years | Modified Gross |
| THE INFORMATION IN THIS STRUCTURAL AND COLLATERAL TERM SHEET IS NOT COMPLETE AND MAY BE AMENDED PRIOR TO THE TIME OF SALE. THIS TERM SHEET IS NOT AN OFFER TO SELL THESE SECURITIES AND IT IS NOT A SOLICITATION OF AN OFFER TO BUY THESE SECURITIES IN ANY JURISDICTION WHERE THE OFFER OR SALE IS NOT PERMITTED. |
| | 28 | |
| Structural and Collateral Term Sheet | | BMO 2023-5C1 |
| No. 2 – 11 West 42nd Street |
The following table presents certain information relating to comparable sales for the 11 West 42nd Street Property:
Comparable Sales(1) |
| Property Location | Sale Date | Total NRA (SF) | Total Occupancy | Sale Price | Sale Price PSF | Adjusted Sales Price PSF |
11 West 42nd Street 11 West 42nd Street New York, NY | NAP | 960,568(2) | 98.6% | (2) | NAP | NAP | NAP |
Tower 56 126 East 56th Street New York, NY | Apr-2023 | 186,884 | 80.0% | | $113,000,000 | $604.65 | $634.89 |
1330 Sixth Avenue 1330 Avenue of the Americas New York, NY | Nov-2022 | 534,203 | 81.0% | | $310,278,784 | $580.83 | $667.95 |
830 3rd Avenue 830 3rd Avenue New York, NY | Sep-2022 | 147,068 | 33.0% | | $72,000,000 | $489.57 | $550.77 |
Farmers Loan & Trust Co. Building 475 Fifth Avenue New York, NY | May-2022 | 276,078 | 94.0% | | $291,000,000 | $1,054.05 | $592.90 |
110 East 42nd Street 110 East 42nd Street New York, NY | Dec-2021 | 222,935 | 89.0% | | $117,075,000 | $525.15 | $578.98 |
Springs Building 104 West 40th Street New York, NY | Aug-2021 | 210,428 | 72.0% | | $127,500,000 | $605.91 | $640.75 |
| (2) | Based on the underwritten rent roll dated May 1, 2023. |
The Borrower. The borrower is 11 West 42 Realty Investors, L.L.C., a Delaware limited liability company and single purpose entity with two independent directors. Legal counsel to the borrower delivered a non-consolidation opinion in connection with the origination of the 11 West 42nd Street Whole Loan. There is no non-recourse carveout guarantor or environmental indemnitor for the 11 West 42nd Street Whole Loan separate from the borrower. See “Description of the Mortgage Pool—Non-Recourse Carveout Limitations” in the Preliminary Prospectus.
The Borrower Sponsors. The borrower sponsors are a joint venture between Tishman Speyer Properties, L.P. (“Tishman”) and Silverstein Properties, LLC (“Silverstein”). The borrower sponsors have owned the 11 West 42nd Street Property since 1978.
Tishman is a leading owner, developer, operator and fund manager of real estate around the world. Founded in 1978, Tishman is active across the United States, Europe, Latin America and Asia, building and managing office, residential, life science and retail space in 33 key global markets. Tishman’s signature assets include New York City's Rockefeller Center, São Paulo's Torre Norte, The Springs in Shanghai, Paris Bourse in Paris, and Frankfurt’s OpernTurm and TaunusTurm. Tishman operates and owns a portfolio of over 82 million SF, worth over $68 billion.
Silverstein, founded in 1957, is a privately held, vertically integrated, full-service real estate development, investment and management firm based in New York City. Silverstein has developed, owned and managed over 40 million SF of office, residential, hotel, retail and mixed-use properties. Silverstein owns and operates a portfolio of assets valued at over $10 billion, with nearly 10 million SF of commercial, residential and retail space across ten office towers, a luxury hotel and two luxury rental buildings.
Property Management. The 11 West 42nd Street Property is managed by Tishman Speyer Properties, L.L.C., an affiliate of the borrower.
Escrows and Reserves. At origination, the borrower deposited into escrow $10,000,000 for TI/LC reserves, approximately $5,685,544 for free rent reserves, and approximately $13,479,707 for landlord obligation reserves.
Tax Escrows – The borrower is required to deposit monthly to a real estate tax reserve 1/12 of the annual estimated real estate taxes (i) during a Cash Sweep Period (as defined below), or (ii) upon the borrower’s failure to provide the lender evidence of timely payment of taxes.
Insurance Escrows – The borrower is required to deposit monthly 1/12 of the annual estimated insurance premiums to the insurance reserve (i) during a Cash Sweep Period, or (ii) upon the borrower’s failure to provide the lender evidence of the renewal of a blanket policy to the extent the borrower maintains insurance pursuant to a blanket policy.
Replacement Reserves – During a Cash Sweep Period, the borrower is required to deposit monthly amounts of approximately $16,009 into a reserve for replacements for the 11 West 42nd Street Property, subject to a cap of approximately $288,170.
TI/LC Reserve – At loan origination, the borrower deposited $10,000,000 into a general TI/LC reserve. The borrower is required to deposit monthly amounts of approximately $240,142 into the TI/LC reserve, and during a Leasing True-Up Period (as defined below), the borrower is required to deposit monthly all excess cash flows into the TI/LC reserve.
| THE INFORMATION IN THIS STRUCTURAL AND COLLATERAL TERM SHEET IS NOT COMPLETE AND MAY BE AMENDED PRIOR TO THE TIME OF SALE. THIS TERM SHEET IS NOT AN OFFER TO SELL THESE SECURITIES AND IT IS NOT A SOLICITATION OF AN OFFER TO BUY THESE SECURITIES IN ANY JURISDICTION WHERE THE OFFER OR SALE IS NOT PERMITTED. |
| | 29 | |
| Structural and Collateral Term Sheet | | BMO 2023-5C1 |
| No. 2 – 11 West 42nd Street |
Free Rent Reserve and Landlord Obligation Reserve – At loan origination, the borrower deposited approximately $5,685,544 into a free rent reserve and $13,479,707 into a landlord obligation reserve. Funds in the landlord obligation reserve are to be used to pay for tenant improvements of approximately $12,478,243 and qualified leasing commissions of approximately $1,001,464 relating to specified tenants as set forth in the 11 West 42nd Street Whole Loan documents.
Lockbox / Cash Management. The 11 West 42nd Street Whole Loan is structured with a hard lockbox and springing cash management. All rents from the 11 West 42nd Street Property are required to be deposited directly to the lockbox account and, so long as a Cash Sweep Period is not continuing, the borrower is permitted to use the lockbox account as borrower’s operating account. During a Cash Sweep Period, the borrower will not have access to the funds in the lockbox account and such funds will be transferred to the lender-controlled cash management account and disbursed according to the 11 West 42nd Street Whole Loan documents. During a Cash Sweep Period, all excess cash is required to be (a) if a Leasing True-Up Period (as defined below) is continuing, deposited into the leasing reserve or (b) otherwise, held by the lender as additional security for the 11 West 42nd Street Whole Loan; provided that so long as no event of default exists, excess cash will be available to the borrower to fund shortfalls in debt service on the 11 West 42nd Street Whole Loan or 11 West 42nd Street Mezzanine Loan, shortfalls in required reserve deposits, qualified leasing expenses, operating expenses and capital expenditures set forth in the annual budget, extraordinary expenses, payment of default interest or late fees and certain other amounts as set forth in the 11 West 42nd Street Whole Loan documents. During a Cash Sweep Period, the borrower may post cash or an acceptable letter of credit or utilize excess cash in an amount necessary to achieve the applicable debt yield or debt service coverage ratio if drawn and hypothetically applied to reduce principal. Such cash or letter of credit will be released to the borrower following the discontinuance of a Cash Sweep Period.
A “Cash Sweep Period” will commence upon the earlier to occur of (i) an event of default under the 11 West 42nd Street Whole Loan documents or the 11 West 42nd Street Mezzanine Loan (as defined below) documents, (ii) the debt yield falling below 9.25% on a trailing 12 month basis (tested quarterly), (iii) after July 6, 2024, the debt service coverage ratio falling below 1.10x on a trailing 12 month basis (tested quarterly), (iv) the commencement of a Lease Sweep Period (as defined below), or (v) the commencement of a Leasing True-Up Period and will terminate upon (a) with respect to clause (i) the cure of such event of default, (b) with respect to clause (ii), the debt yield being at least 9.25% on a trailing 12 month basis (tested quarterly for two consecutive quarters), (c) with respect to clause (iii), the debt service coverage ratio being at least 1.10x on a trailing 12 month basis (tested quarterly for two consecutive quarters), (d) with respect to clause (iv), the occurrence of a Lease Sweep Trigger Cure Event (as defined below), and (e) with respect to clause (v), the cessation of the Leasing True-Up Period.
A “Lease Sweep Period” will occur upon the earliest to occur of (i) the date that is the earlier of (a) 12 months prior to the expiration of the applicable Lease Sweep Lease (as defined below), (b) the expiration date of any extension option contained within any such Lease Sweep Lease, and (c) the date the subject Lease Sweep Tenant (as defined below) gives notice, in accordance with the applicable Lease Sweep Lease, of its intention not to extend the applicable Lease Sweep Lease as to more than 50% of the total rentable SF of the subject Lease Sweep Lease, in each case of (a), (b), and (c), unless the subject Lease Sweep Tenant has given notice of renewal or extension of the applicable Lease Sweep Lease in accordance with the terms thereof; (ii) the date on which a Lease Sweep Tenant terminates or gives a valid notice to terminate as to more than 50% of the total rentable SF of the subject Lease Sweep Lease and such termination is to occur within 12 months thereafter; provided, however, that no Lease Sweep Trigger will occur if the borrower simultaneously or theretofore enters into one or more replacement leases in accordance with the 11 West 42nd Street Whole Loan documents covering all or substantially all of the terminated space (or an equivalent amount of space elsewhere in the building); (iii) the date on which a Lease Sweep Tenant goes dark (unless such Lease Sweep Tenant or any replacement tenant is investment-grade rated) as to more than 50% of its total rentable square footage; (iv) a monetary default or material non-monetary default by a Lease Sweep Tenant under its lease; or (v) a Lease Sweep Tenant or guarantor becomes subject to insolvency proceedings.
A "Lease Sweep Lease” means any lease which, individually or when aggregated with all other leases with the same tenant or its affiliates demises more than 115,000 SF of the 11 West 42nd Street Property’s net rentable area (excluding any unexercised expansion rights or unexercised preferential rights to lease additional space contained in such lease).
A “Lease Sweep Tenant” means each tenant under a Lease Sweep Lease.
A “Lease Sweep Trigger Cure Event” will occur upon the earliest of, (a) with respect to clauses (i),(ii), (iii), (iv) and (v) of the definition of Lease Sweep Period, entry into one or more replacement leases in accordance with the 11 West 42nd Street Whole Loan documents covering substantially all of the applicable SF (or an equivalent amount of space elsewhere in the 11 West 42nd Street Property); (b) with respect to clause (iii) of the definition of Lease Sweep Trigger, the date on which the Lease Sweep Tenant re-opens within at least 50% of its total rentable SF, (c) with respect to clause (iv) of the definition of Lease Sweep Trigger, the date on which the default has been cured; or (d) with respect to clause (v) of the definition of Lease Sweep Trigger, the Lease Sweep Tenant or guarantor insolvency proceedings have terminated and the Lease Sweep Lease or the applicable guaranty has been affirmed, assumed, or assigned in a manner satisfactory to the lender. The amounts collected during a Cash Sweep Period for a Lease Sweep Trigger will be capped at $75 PSF of affected space (and upon first achieving the same, the applicable Cash Sweep Period shall cease assuming no other Cash Sweep Period is continuing).
A “Leasing True-Up Period” means a period (A) commencing if, at any point after July 6, 2026, (x) the anticipated amount of qualified leasing expenses to be incurred by borrower during the remainder of the 11 West 42nd Street Whole Loan term (tested on July 6, 2026,
| THE INFORMATION IN THIS STRUCTURAL AND COLLATERAL TERM SHEET IS NOT COMPLETE AND MAY BE AMENDED PRIOR TO THE TIME OF SALE. THIS TERM SHEET IS NOT AN OFFER TO SELL THESE SECURITIES AND IT IS NOT A SOLICITATION OF AN OFFER TO BUY THESE SECURITIES IN ANY JURISDICTION WHERE THE OFFER OR SALE IS NOT PERMITTED. |
| | 30 | |
| Structural and Collateral Term Sheet | | BMO 2023-5C1 |
| No. 2 – 11 West 42nd Street |
and every 12th month anniversary thereafter, as determined by borrower in the exercise of commercially reasonable judgment and approved by lender, such approval not to be unreasonably withheld, conditioned, or delayed by lender so long as such determination is supported by market data provided by borrower to lender (such anticipated amount, the “Remaining Leasing Expense Amount”) is in excess of (y) the sum of (i) the amount of funds then on deposit in the TI/LC Reserve plus (ii) the aggregate amount of scheduled monthly deposits remaining to be made to the TI/LC Reserve during the remainder of the 11 West 42nd Street Whole Loan term (the sum of the foregoing (i) and (ii) as of any given date, the “Available Leasing Reserve Funds”) and (B) terminating upon the date upon which the amount of Available Leasing Reserve Funds equals the Remaining Leasing Expense Amount.
Subordinate Debt. None. However, the borrower will be permitted to enter into a single (x) “property-assessed clean energy loan” or (y) any other indebtedness, without regard to the name given to such indebtedness, which is (i) incurred for improvements to the 11 West 42nd Street Property for the purpose of increasing energy efficiency, increasing use of renewable energy sources, resource conservation, or a combination of the foregoing, and (ii) repaid through multi-year tax assessments against the 11 West 42nd Street Property in an amount not to exceed $10,000,000, subject to the lender’s prior written approval of the terms and structure (which approval may be conditioned upon receipt of a rating agency confirmation). See “Description of the Mortgage Pool—Additional Indebtedness” in the Preliminary Prospectus.
Mezzanine Debt. Concurrently with the funding of the 11 West 42nd Street Whole Loan, BANA originated a mezzanine loan in the amount of $56.0 million (the “11 West 42nd Street Mezzanine Loan”). The 11 West 42nd Street Mezzanine Loan is secured by the direct equity interests in the borrower and is coterminous with the 11 West 42nd Street Whole Loan. The 11 West 42nd Street Mezzanine Loan accrues interest at a rate of 14.00000% per annum. A mezzanine intercreditor agreement was executed at loan origination. Subsequent to loan origination, the mezzanine loan was sold by BANA to an affiliate of Taconic Capital.
| 11 West 42nd Street Mezzanine Loan Summary(1) |
| | Original Principal Balance | Interest Rate | Original Term (mos) | Original Amortization Term (mos) | Original IO Term (mos) | Total Debt UW NCF DSCR | Total Debt UW NOI Debt Yield | Total Debt Cut-off Date LTV |
| 11 West 42nd Street Mezzanine Loan | $56,000,000 | 14.0000% | 60 | 0 | 60 | 1.00x | 9.6% | 59.5% |
| (1) | Total debt reflects the aggregate of the Cut-off Date balance of the 11 West 42nd Street Whole Loan and the 11 West 42nd Street Mezzanine Loan. |
Partial Release. Not permitted.
Ground Lease. None.
| THE INFORMATION IN THIS STRUCTURAL AND COLLATERAL TERM SHEET IS NOT COMPLETE AND MAY BE AMENDED PRIOR TO THE TIME OF SALE. THIS TERM SHEET IS NOT AN OFFER TO SELL THESE SECURITIES AND IT IS NOT A SOLICITATION OF AN OFFER TO BUY THESE SECURITIES IN ANY JURISDICTION WHERE THE OFFER OR SALE IS NOT PERMITTED. |
| | 31 | |
| Structural and Collateral Term Sheet | | BMO 2023-5C1 |
| No. 3 – Short Pump Town Center |
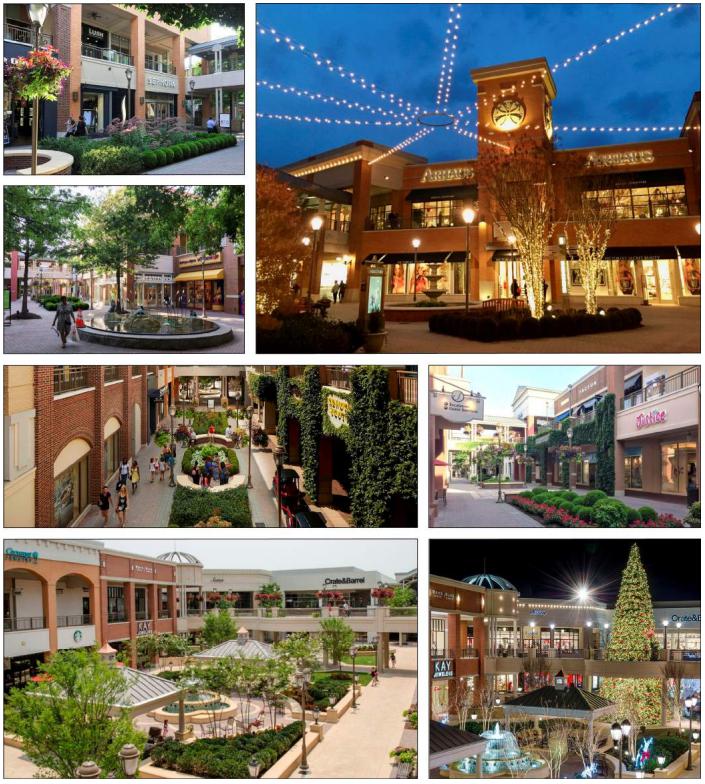
| THE INFORMATION IN THIS STRUCTURAL AND COLLATERAL TERM SHEET IS NOT COMPLETE AND MAY BE AMENDED PRIOR TO THE TIME OF SALE. THIS TERM SHEET IS NOT AN OFFER TO SELL THESE SECURITIES AND IT IS NOT A SOLICITATION OF AN OFFER TO BUY THESE SECURITIES IN ANY JURISDICTION WHERE THE OFFER OR SALE IS NOT PERMITTED. |
| | 32 | |
| Structural and Collateral Term Sheet | | BMO 2023-5C1 |
| No. 3 – Short Pump Town Center |
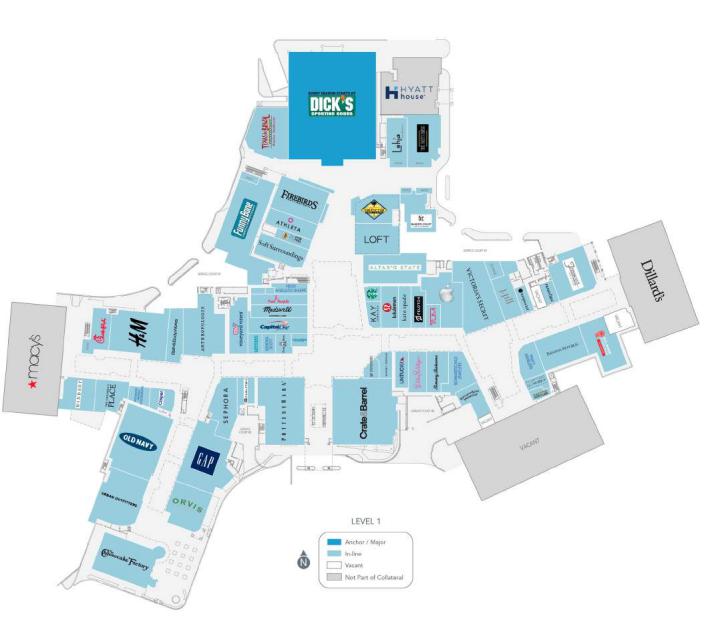
| THE INFORMATION IN THIS STRUCTURAL AND COLLATERAL TERM SHEET IS NOT COMPLETE AND MAY BE AMENDED PRIOR TO THE TIME OF SALE. THIS TERM SHEET IS NOT AN OFFER TO SELL THESE SECURITIES AND IT IS NOT A SOLICITATION OF AN OFFER TO BUY THESE SECURITIES IN ANY JURISDICTION WHERE THE OFFER OR SALE IS NOT PERMITTED. |
| | 33 | |
| Structural and Collateral Term Sheet | | BMO 2023-5C1 |
| No. 3 – Short Pump Town Center |
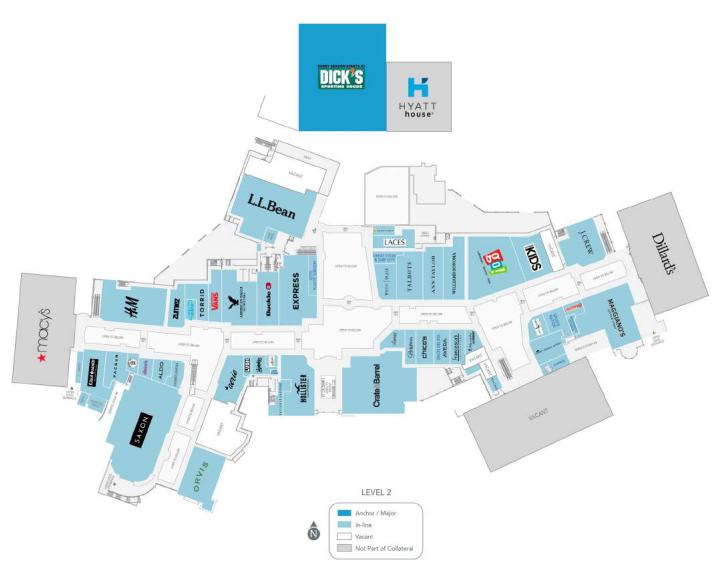
| THE INFORMATION IN THIS STRUCTURAL AND COLLATERAL TERM SHEET IS NOT COMPLETE AND MAY BE AMENDED PRIOR TO THE TIME OF SALE. THIS TERM SHEET IS NOT AN OFFER TO SELL THESE SECURITIES AND IT IS NOT A SOLICITATION OF AN OFFER TO BUY THESE SECURITIES IN ANY JURISDICTION WHERE THE OFFER OR SALE IS NOT PERMITTED. |
| | 34 | |
| Structural and Collateral Term Sheet | | BMO 2023-5C1 |
| No. 3 – Short Pump Town Center |
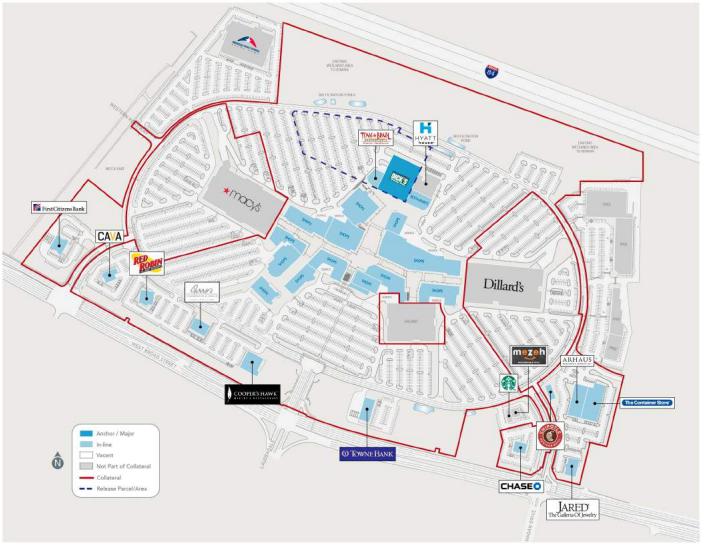
| THE INFORMATION IN THIS STRUCTURAL AND COLLATERAL TERM SHEET IS NOT COMPLETE AND MAY BE AMENDED PRIOR TO THE TIME OF SALE. THIS TERM SHEET IS NOT AN OFFER TO SELL THESE SECURITIES AND IT IS NOT A SOLICITATION OF AN OFFER TO BUY THESE SECURITIES IN ANY JURISDICTION WHERE THE OFFER OR SALE IS NOT PERMITTED. |
| | 35 | |
| Structural and Collateral Term Sheet | | BMO 2023-5C1 |
| No. 3 – Short Pump Town Center |
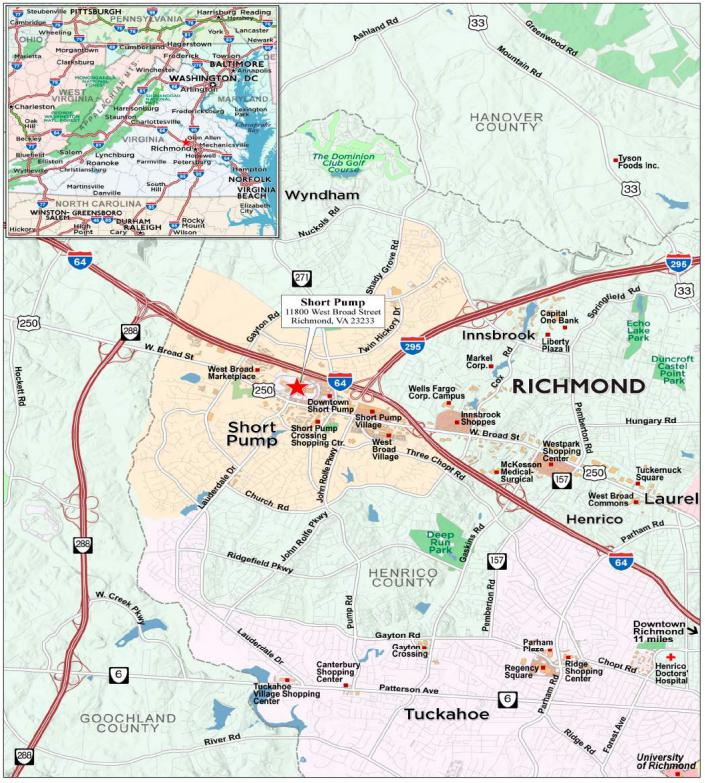
| THE INFORMATION IN THIS STRUCTURAL AND COLLATERAL TERM SHEET IS NOT COMPLETE AND MAY BE AMENDED PRIOR TO THE TIME OF SALE. THIS TERM SHEET IS NOT AN OFFER TO SELL THESE SECURITIES AND IT IS NOT A SOLICITATION OF AN OFFER TO BUY THESE SECURITIES IN ANY JURISDICTION WHERE THE OFFER OR SALE IS NOT PERMITTED. |
| | 36 | |
| Structural and Collateral Term Sheet | | BMO 2023-5C1 |
| No. 3 – Short Pump Town Center |
| Mortgage Loan Information | | Property Information |
| Mortgage Loan Seller: | GSMC | | Single Asset / Portfolio: | Single Asset |
| Original Principal Balance(1): | $62,500,000 | | Title: | Fee |
| Cut-off Date Principal Balance(1): | $62,500,000 | | Property Type – Subtype: | Retail – Open-Air Lifestyle Center |
| % of IPB: | 8.2% | | Net Rentable Area (SF)(6): | 635,494 |
| Loan Purpose: | Refinance | | Location: | Richmond, Virginia |
| Borrower: | Short Pump Town Center, LLC | | Year Built / Renovated: | 2003 / 2014 |
| Borrower Sponsors(2): | Forest City Realty Trust, LLC, MJGT Associates, LLC and Queensland Investment Corporation | | Occupancy(6): | 94.4% |
| Interest Rate: | 8.3030% | | Occupancy Date: | 6/20/2023 |
| Note Date: | 7/6/2023 | | 4th Most Recent NOI (As of): | $22,078,334 (12/31/2020) |
| Maturity Date: | 8/1/2028 | | 3rd Most Recent NOI (As of): | $21,869,622 (12/31/2021) |
| Interest-only Period: | 60 months | | 2nd Most Recent NOI (As of): | $26,000,838 (12/31/2022) |
| Original Term: | 60 months | | Most Recent NOI (As of): | $27,940,835 (TTM 5/31/2023) |
| Original Amortization Term: | None | | UW Economic Occupancy: | 94.2% |
| Amortization Type: | Interest Only | | UW Revenues: | $34,231,796 |
| Call Protection(3): | L(24),D(29),O(7) | | UW Expenses: | $8,446,932 |
| Lockbox / Cash Management: | Hard / Springing | | UW NOI(6): | $25,784,865 |
| Additional Debt(1): | Yes | | UW NCF: | $24,386,778 |
| Additional Debt Balance(1): | $117,500,000 | | Appraised Value / Per SF(7): | $378,000,000 / $595 |
| Additional Debt Type(1): | Pari Passu | | Appraisal Date(7): | 6/7/2023 |
| | | | | |
| Escrows and Reserves(4) | | Financial Information |
| | Initial | Monthly | Initial Cap | | Cut-off Date Loan / SF(6): | $283 |
| Taxes: | $0 | Springing | N/A | | Maturity Date Loan / SF(6): | $283 |
| Insurance: | $0 | Springing | N/A | | Cut-off Date LTV(1)(7): | 47.6% |
| Replacement Reserves: | $0 | Springing | $254,198 | | Maturity Date LTV(1)(7): | 47.6% |
| TI/LC: | $0 | Springing | $2,541,976 | | UW NCF DSCR(1): | 1.61x |
| Other(5): | $6,881,215 | $0 | N/A | | UW NOI Debt Yield(1): | 14.3% |
| | | | | | | |
| | | | | | | |
| Sources and Uses |
| Sources | Proceeds | % of Total | | Uses | Proceeds | % of Total |
| Whole Loan Amount(1) | $180,000,000 | 99.8 | % | | Loan Payoff | $171,903,023 | 95.3 | % |
| Cash Equity Contribution | 320,557 | 0.2 | | | Reserves | 6,881,215 | 3.8 | |
| | | | | | Closing Costs | 1,536,319 | 0.9 | |
| Total Sources | $180,320,557 | 100.0 | % | | Total Uses | $180,320,557 | 100.0 | % |
| (1) | The Short Pump Town Center Mortgage Loan (as defined below) is part of the Short Pump Town Center Whole Loan (as defined below), which is evidenced by eight pari passu promissory notes with an aggregate principal balance of $180,000,000. The Cut-off Date Loan/SF, Maturity Date Loan/SF, UW NOI Debt Yield, UW NOI Debt Yield at Maturity, UW NCF DSCR, Cut-off Date LTV and Maturity Date LTV numbers presented above are based on the aggregate principal balance of the promissory notes comprising the Short Pump Town Center Whole Loan. |
| (2) | The borrower sponsors are affiliated with the borrower sponsors of the Cumberland Mall Mortgage Loan, the Oxmoor Center Mortgage Loan and the Heritage Plaza Mortgage Loan, which are also being contributed to the BMO 2023-5C1 transaction. |
| (3) | Defeasance of the Short Pump Town Center Whole Loan is permitted at any time after the earlier to occur of (a) the end of the two-year period commencing on the closing date of the securitization of the last portion of the Short Pump Town Center Whole Loan to be securitized and (b) July 6, 2026. The assumed defeasance lockout period of 24 payments is based on the closing date of this transaction in August 2023. The actual lockout period may be longer. |
| (4) | See “Escrows and Reserves” below for further discussion of reserve information. |
| (5) | Other Reserves is comprised of $6,639,981 for outstanding landlord obligations, and $241,234 for gap and free rent. |
| (6) | Net Rentable Area, UW NOI and Occupancy exclude the Release Parcels (as defined below). Two tenants (Perry’s Steakhouse and Grill (11,207 SF) and Francesca’s (2,249 SF)) have signed leases, but not taken occupancy yet. Property occupancy excluding these tenants is 92.2%. We cannot assure you that either tenant will take occupancy or begin paying rent as expected or at all. |
| (7) | The Appraised Value represents Hypothetical As-Is Value which excludes the value attributed to Release Parcels. Based on the actual As-Is value of $392,000,000, the Cut-off Date LTV and Maturity Date LTV are 45.9%. See “Partial Release” below. |
The Loan. The third largest mortgage loan (the “Short Pump Town Center Mortgage Loan”) is part of a whole loan (the “Short Pump Town Center Whole Loan”) that is evidenced by eight pari passu promissory notes in the aggregate original principal amount of
| THE INFORMATION IN THIS STRUCTURAL AND COLLATERAL TERM SHEET IS NOT COMPLETE AND MAY BE AMENDED PRIOR TO THE TIME OF SALE. THIS TERM SHEET IS NOT AN OFFER TO SELL THESE SECURITIES AND IT IS NOT A SOLICITATION OF AN OFFER TO BUY THESE SECURITIES IN ANY JURISDICTION WHERE THE OFFER OR SALE IS NOT PERMITTED. |
| | 37 | |
| Structural and Collateral Term Sheet | | BMO 2023-5C1 |
| No. 3 – Short Pump Town Center |
$180,000,000 and secured by a first priority fee mortgage encumbering a 635,494 SF open-air lifestyle center located in Richmond, Virginia (the “Short Pump Town Center Property”). The Short Pump Town Center Whole Loan was co-originated by Bank of America, N.A. and Goldman Sachs Bank USA. The Short Pump Town Center Mortgage Loan is evidenced by the non-controlling Note A-5, non-controlling Note A-6 and non-controlling Note A-7-1 with an aggregate original principal balance of $62,500,000. The remaining promissory notes comprising the Short Pump Town Center Whole Loan are summarized in the below table. The Short Pump Town Center Whole Loan will initially be serviced under the BMO 2023-5C1 pooling and servicing agreement, but upon securitization of the controlling note A-1, the Short Pump Town Center Whole Loan will be serviced under the pooling and servicing agreement for such future securitization transaction. See “The Pooling and Servicing Agreement” in the Preliminary Prospectus.
The table below summarizes the promissory notes that comprise the Short Pump Town Center Whole Loan. The relationship between the holders of the Short Pump Town Center Whole Loan will be governed by a co-lender agreement as described under “Description of the Mortgage Pool—The Whole Loans—The Serviced Pari Passu Whole Loans” and “—The Whole Loans—The Outside Serviced Mortgage Loans” in the Preliminary Prospectus.
| Whole Loan Summary |
| Note | Original Balance | Cut-off Date Balance | Note Holder | Controlling Piece |
| A-1 | $65,000,000 | $65,000,000 | Bank of America, N.A. | Yes |
| A-2 | $15,000,000 | $15,000,000 | Bank of America, N.A. | No |
| A-3 | $10,000,000 | $10,000,000 | Bank of America, N.A. | No |
| A-4 | $10,000,000 | $10,000,000 | Bank of America, N.A. | No |
| A-5 | $30,000,000 | $30,000,000 | BMO 2023-5C1 | No |
| A-6 | $25,000,000 | $25,000,000 | BMO 2023-5C1 | No |
| A-7-1 | $7,500,000 | $7,500,000 | BMO 2023-5C1 | No |
| A-7-2 | $17,500,000 | $17,500,000 | Goldman Sachs Bank USA | No |
| Whole Loan | $180,000,000 | $180,000,000 | | |
The Mortgaged Property.
The Short Pump Town Center Property is a 635,494 SF open-air lifestyle center located in Richmond, Virginia. The Short Pump Town Center Property opened in 2003, was renovated in 2014 and has direct access to three major thruways in the market (I-295, I-64 and US-250). The Short Pump Town Center Property is anchored by non-collateral tenants Dillard’s and Macy’s, and has many other well-known national tenants including Dick’s Sporting Goods, Arhaus, Pottery Barn, Victoria’s Secret, H&M, Crate & Barrel, Apple and lululemon. Additionally, the Short Pump Town Center Property has a diverse mix of dining offerings, with operators such as Cheesecake Factory, Maggiano’s, Firebirds Wood Fired Grill, Texas de Brazil and Perry’s Steakhouse.
The Short Pump Town Center Property has a granular rent roll with no tenant occupying more than 5.4% of total rentable SF or contributing greater than 2.7% of the total underwritten rent. The top 10 tenants at the Short Pump Town Center Property represent 28.6% of total SF and generate 18.3% of total underwritten rent. The Short Pump Town Center Property was 94.4% occupied as of June 20, 2023 (96.4% occupied including temporary tenants) by over 117 unique tenants.
In the 2014 renovation of the Short Pump Town Center Property, the borrower sponsors invested approximately $15 million into common area improvements including updating the interior of the main plaza, adding elevators, creating a rotunda bridge, new water features and seating areas, as well as adding approximately 100,000 SF for new tenants. Since 2020, the borrower sponsor has invested approximately $15.7 million in capital expenditures, tenant improvements and leasing commissions. In 2021 and 2022, the borrower sponsors executed 17 leases (4 new and 13 renewals) comprising 79,895 SF.
The Dick’s Sporting Goods and Texas de Brazil parcels, including their related parking spaces, (“Release Parcels”), are permitted to be freely released by the borrower, therefore all SF and any rent for those tenants has been excluded in the lender’s underwriting and no value has been given to either parcel in the appraised value. The information relating to the Short Pump Town Center Property in this term sheet does not include the Release Parcels, unless otherwise expressly stated herein. See “Partial Release” below.
Over the trailing-12 months ended April 30, 2023, the Short Pump Town Center Property generated total sales of over $351 million, which is approximately 1.8% higher than 2022 sales, approximately 20.6% higher than 2021 sales and approximately 58.5% higher than 2020 sales. Over the same time period, inline tenants (less than 10,000 SF) generated sales of approximately $862 PSF (occupancy cost of 8.5%). The Short Pump Town Center Property is the only location for Apple within 85 miles and the tenant has performed well generating over $58 million in sales as of TTM April 2023 ($8,533 PSF).
| THE INFORMATION IN THIS STRUCTURAL AND COLLATERAL TERM SHEET IS NOT COMPLETE AND MAY BE AMENDED PRIOR TO THE TIME OF SALE. THIS TERM SHEET IS NOT AN OFFER TO SELL THESE SECURITIES AND IT IS NOT A SOLICITATION OF AN OFFER TO BUY THESE SECURITIES IN ANY JURISDICTION WHERE THE OFFER OR SALE IS NOT PERMITTED. |
| | 38 | |
| Structural and Collateral Term Sheet | | BMO 2023-5C1 |
| No. 3 – Short Pump Town Center |
The following table contains sales history for the Short Pump Town Center Property(1):
| | 2020(2) | 2021 | 2022 | TTM April 2023 |
| Gross Mall Sales(3) | $222,055,899 | $291,709,853 | $345,707,423 | $351,933,477 |
| Estimated Dillard's Sales(4) | $13,800,000 | $24,800,000 | $28,500,000 | $28,500,000 |
| Estimated Macy’s Sales(4) | $20,200,000 | $31,700,000 | $40,700,000 | $40,700,000 |
| Sales PSF (Inline < 10,000 SF) | $537 | $735 | $855 | $862 |
| Sales PSF (Inline < 10,000 SF, Excluding Apple) | $368 | $567 | $659 | $662 |
| Occupancy Cost (Inline < 10,000 SF) | 11.0% | 8.7% | 8.5% | 8.5% |
| Occupancy Cost (Inline < 10,000 SF, Excluding Apple) | 16.0% | 11.3% | 11.0% | 11.0% |
| (1) | Information is as of April 30, 2023, as provided by the borrower sponsors, and only includes tenants reporting sales. |
| (2) | The Short Pump Town Center Property closed due to the COVID-19 pandemic from March 29, 2020 through May 23, 2020. |
| (3) | Includes the Release Parcels but exclude estimated sales for the non-collateral tenants, Dillard’s and Macy’s. |
| (4) | Represents estimated sales as per the appraisal. TTM April 2023 sales are shown as of year-end 2022. |
Major Tenants. The three largest tenants based on underwritten base rent are Cooper’s Hawk Winery & Restaurant, Arhaus Furniture and The Container Store.
Cooper’s Hawk Winery & Restaurant (10,973 square feet; 1.7% of net rentable area; 2.5% of underwritten base rent) is a modern casual restaurant and winery chain. Founded by Tim McEnery in 2005, the restaurant has 55 locations located across the United States, making in the country’s largest wine club.
Arhaus Furniture (15,000 square feet; 2.4% of net rentable area; 2.3% of underwritten base rent) is an American retail chain that designs and sells home furnishings online and through its retail stores and catalogs. Founded in 1986, the company has more than 80 showroom and design center locations located across the United States.
The Container Store (18,942 square feet; 3.0% of net rentable area, 2.2% of underwritten base rent) is an American retail chain that offers storage and organization products, custom closets and in-home services. The retailer offers more than 10,000 products through its stores and website. The Container Store operates more than 95 stores with an average size of approximately 25,000 square feet in 33 states and the District of Columbia.
Environmental. According to a Phase I environmental report dated May 15, 2023, there are no recognized environmental conditions or recommendations for further action at the Short Pump Town Center Property.
The following table presents certain information relating to the historical occupancy of the Short Pump Town Center Property:
| Historical and Current Occupancy(1) |
| 2020 | 2021 | 2022 | Current(2) |
| 87.6% | 92.1% | 93.5% | 94.4% |
| (1) | Historical Occupancies are as of December 31 of each respective year, unless otherwise specified. |
| (2) | Based on the underwritten rent roll dated June 20, 2023. |
| THE INFORMATION IN THIS STRUCTURAL AND COLLATERAL TERM SHEET IS NOT COMPLETE AND MAY BE AMENDED PRIOR TO THE TIME OF SALE. THIS TERM SHEET IS NOT AN OFFER TO SELL THESE SECURITIES AND IT IS NOT A SOLICITATION OF AN OFFER TO BUY THESE SECURITIES IN ANY JURISDICTION WHERE THE OFFER OR SALE IS NOT PERMITTED. |
| | 39 | |
| Structural and Collateral Term Sheet | | BMO 2023-5C1 |
| No. 3 – Short Pump Town Center |
The following table presents certain information relating to the major tenants (of which, certain tenants may have co-tenancy provisions) at the Short Pump Town Center Property:
| Top Tenant Summary(1) |
| Tenant | Ratings
Moody’s/S&P/Fitch(2) | Net Rentable Area (SF) | % of
Total NRA | UW
Base Rent PSF |
UW
Base Rent | % of Total
UW Base Rent | Lease
Exp. Date |
| Cooper's Hawk Winery & Restaurant | NR/NR/NR | 10,973 | | 1.7 | % | $55.00 | $603,515 | | 2.5 | % | 11/30/2029 |
| Arhaus Furniture | NR/NR/NR | 15,000 | | 2.4 | | 38.00 | 570,000 | | 2.3 | | 1/31/2031 |
| The Container Store | NR/NR/NR | 18,942 | | 3.0 | | 29.00 | 549,318 | | 2.2 | | 2/29/2032 |
| Perry's Steakhouse and Grill(3) | NR/NR/NR | 11,207 | | 1.8 | | 46.85 | 525,000 | | 2.1 | | 10/31/2038 |
| Altar'd State | NR/NR/NR | 7,798 | | 1.2 | | 65.81 | 513,150 | | 2.1 | | 6/30/2032 |
| The Cheesecake Factory | NR/NR/NR | 10,100 | | 1.6 | | 45.00 | 454,500 | | 1.9 | | 1/31/2025 |
| H&M | NR/BBB/NR | 21,334 | | 3.4 | | 20.34 | 433,949 | | 1.8 | | 4/30/2026 |
| J Crew | Caa3/NR/NR | 6,811 | | 1.1 | | 63.70 | 433,861 | | 1.8 | | 1/31/2026 |
| Victoria's Secret | Ba3/BB-/NR | 10,215 | | 1.6 | | 42.00 | 429,030 | | 1.8 | | 1/31/2025 |
| Crate & Barrel | NR/NR/NR | 34,597 | | 5.4 | | 12.14 | 420,000 | | 1.7 | | 1/31/2024 |
| Ten Largest Owned Tenants | | 146,977 | | 23.1 | % | $33.56 | $4,932,322 | | 20.2 | % | |
| Remaining Owned Tenants | | 452,612 | | 71.2 | | 40.05 | 18,125,987 | | 74.1 | | |
| Total Occupied | | 599,589 | | 94.4 | % | $38.46 | $23,058,309 | | 94.3 | % | |
| Vacant Spaces (Owned Space) | | 35,905 | | 5.6 | | 39.18 | 1,406,620 | | 5.7 | | |
| Totals/ Wtd. Avg. All Owned Tenants | | 635,494 | | 100.0 | % | $38.50 | $24,464,929 | | 100.0 | % | |
| (1) | Based on the underwritten rent roll dated June 20, 2023, inclusive of rent steps through July 2024 and overage and percent in lieu rent as of the trailing twelve months ended April 2023 sales for certain tenants. Annual UW Rent for Non-Collateral Anchors represents expense reimbursements. |
| (2) | Certain ratings are those of the parent company whether or not the parent guarantees the lease. |
| (3) | Expected to take occupancy in October or November 2023. We cannot assure you that the Perry's Steakhouse and Grill Tenant will take occupancy or begin paying rent as expected or at all. |
The following table presents certain information relating to the lease rollover schedule at the Short Pump Town Center Property:
| Lease Rollover Schedule(1)(2) |
| Year | Number of Leases Expiring(3) | Net Rentable Area Expiring | % of NRA Expiring | UW Base Rent Expiring | % of UW Base Rent Expiring | Cumulative Net Rentable Area Expiring | Cumulative % of NRA Expiring | Cumulative UW Base Rent Expiring | Cumulative % of UW Base Rent Expiring |
| Vacant | 0 | 35,905 | 5.6 | % | $1,406,620 | 5.7 | % | 35,905 | | 5.6% | | $1,406,620 | 5.7% |
| 2023 | 8 | 24,783 | 3.9 | | 398,284 | 1.6 | | 60,688 | | 9.5% | | 1,804,904 | 7.4% |
| 2024 | 12 | 97,470 | 15.3 | | 2,411,839 | 9.9 | | 158,158 | | 24.9% | | 4,216,743 | 17.2% |
| 2025 | 24 | 95,208 | 15.0 | | 4,759,727 | 19.5 | | 253,366 | | 39.9% | | 8,976,470 | 36.7% |
| 2026 | 22 | 116,966 | 18.4 | | 4,479,449 | 18.3 | | 370,332 | | 58.3% | | 13,455,919 | 55.0% |
| 2027 | 10 | 45,209 | 7.1 | | 1,852,417 | 7.6 | | 415,541 | | 65.4% | | 15,308,336 | 62.6% |
| 2028 | 13 | 59,136 | 9.3 | | 2,329,957 | 9.5 | | 474,677 | | 74.7% | | 17,638,293 | 72.1% |
| 2029 | 9 | 42,724 | 6.7 | | 1,930,487 | 7.9 | | 517,401 | | 81.4% | | 19,568,780 | 80.0% |
| 2030 | 4 | 13,683 | 2.2 | | 773,938 | 3.2 | | 531,084 | | 83.6% | | 20,342,718 | 83.2% |
| 2031 | 4 | 29,278 | 4.6 | | 1,243,523 | 5.1 | | 560,362 | | 88.2% | | 21,586,240 | 88.2% |
| 2032 | 6 | 49,650 | 7.8 | | 1,777,077 | 7.3 | | 610,012 | | 96.0% | | 23,363,317 | 95.5% |
| 2033 | 3 | 6,275 | 1.0 | | 351,612 | 1.4 | | 616,287 | | 97.0% | | 23,714,929 | 96.9% |
| 2034 & Beyond | 4 | 19,207 | 3.0 | | 750,000 | 3.1 | | 635,494 | | 100.0% | | 24,464,929 | 100.0% |
| Total | 119 | 635,494 | 100.0 | % | $24,464,929 | 100.0 | % | | | | |
| (1) | Based on the underwritten rent roll dated June 20, 2023, inclusive of rent steps through July 2024 and overage and percent in lieu rent as of the trailing twelve months ended April 2023 sales for certain tenants. |
| (2) | Certain tenants may have lease termination options that are exercisable prior to the originally stated expiration date of the related lease and are not considered in the rollover schedule. |
| (3) | Includes non-collateral anchors and outparcel spaces which have no SF or UW Rent associated but are paying expense reimbursements. |
| THE INFORMATION IN THIS STRUCTURAL AND COLLATERAL TERM SHEET IS NOT COMPLETE AND MAY BE AMENDED PRIOR TO THE TIME OF SALE. THIS TERM SHEET IS NOT AN OFFER TO SELL THESE SECURITIES AND IT IS NOT A SOLICITATION OF AN OFFER TO BUY THESE SECURITIES IN ANY JURISDICTION WHERE THE OFFER OR SALE IS NOT PERMITTED. |
| | 40 | |
| Structural and Collateral Term Sheet | | BMO 2023-5C1 |
| No. 3 – Short Pump Town Center |
The following table presents certain information relating to the underwritten cash flows of the Short Pump Town Center Property:
| Operating History and Underwritten Net Cash Flow(1) |
| | 2020 | 2021 | 2022 | TTM May 2023 | Underwritten | Per Square Foo | %(1) |
| Rents in Place(2)(3) | $21,178,034 | $21,836,597 | $24,652,680 | $25,468,765 | 25,711,400 | $40.46 | | 72.5 | |
| Rent Steps | 0 | 0 | 0 | 0 | 0 | 0 | | 0.0 | |
| Vacant Income | 0 | 0 | 0 | 0 | 1,901,662 | ��2.99 | | 5.4 | |
| Gross Potential Rent | 21,178,034 | 21,836,597 | 24,652,680 | 25,468,765 | 27,613,062 | 43.45 | | 77.9 | % |
| Total Reimbursements | 9,883,959 | 7,120,665 | 6,906,182 | 7,390,825 | 7,850,678 | 12.35 | | 22.1 | |
| Net Rental Income | 31,061,993 | 28,957,261 | 31,558,862 | 32,859,590 | 35,463,740 | 55.80 | | 100.0 | % |
| Other Income(4) | 1,055,531 | 930,993 | 1,646,896 | 3,438,171 | 840,292 | 1.32 | | 2.4 | |
| (Vacancy/Credit Loss) | (1,261,591) | (220,089) | 302,922 | 42,636 | (2,072,235) | (3.26) | | -5.8 | |
| Effective Gross Income | 30,855,933 | 29,668,166 | 33,508,680 | 36,340,397 | 34,231,796 | 53.87 | | 96.5 | % |
| Total Expenses(5) | 8,777,600 | 7,798,544 | 7,507,842 | 8,399,562 | 8,446,932 | 13.29 | | 23.8 | % |
| Net Operating Income | 22,078,334 | 21,869,622 | 26,000,838 | 27,940,835 | 25,784,865 | 40.57 | | 72.7 | % |
| Total TI/LC, Capex/RR | 0 | 0 | 0 | 0 | 127,099 | 0.20 | | 0.4 | |
| Net Cash Flow | $22,078,334 | $21,869,622 | $26,000,838 | $27,940,835 | $25,657,766 | $40.37 | | 72.3 | % |
| (1) | Historical cash flows and occupancy include revenue, expense items and SF associated with the Release Parcels. |
| (2) | Underwritten Base Rent is based on the underwritten rent roll dated June 20, 2023, inclusive of rent steps through July 2024 and excludes rent associated with the Release Parcels. |
| (3) | Includes Underwritten Overage Rent and Underwritten Percent In Lieu, which are based on the terms of applicable leases using TTM April 2023 sales figures. |
| (4) | Underwritten Other Income includes trash pad rentals, valet parking income, other miscellaneous income and excludes lease termination income. |
| (5) | Underwritten Total Expenses includes Real Estate Taxes of approximately $2,269,994 and Insurance expense of approximately $292,030. Underwritten Real Estate Taxes excludes approximately $355,621 of taxes associated with the Release Parcels. |
The Market. The Short Pump Town Center Property is located in Richmond, Virginia, approximately 17 miles northwest of the Richmond Central Business District and serves a trade area of over 386,743 households encompassing over 982,000 residents with an average household income of over $100,000. Richmond is the third largest metropolitan statistical area in Virginia and features a population of over 1.3 million people. The Short Pump Town Center Property is located at the intersection of I-295, I-64, and US-250, approximately 25 miles northwest of the Richmond International Airport, which serves over four million passengers annually.
The top employers in Richmond are Virginia Commonwealth University Health System (with 13,500 employees), Capital One Financial Corp. (with 13,000 employees) and HCA Virginia Health (with 11,000 employees). The Short Pump Town Center Property is approximately nine miles from the University of Richmond, a private liberal arts college, and 15 miles from Virginia Commonwealth University, a public research university with approximately 32,000 students. Richmond has a stable and diverse economy that includes eight Fortune 500 headquarters, ranking second for the total number of firms compared to peer cities.
Innsbrook Corporate Center is located approximately two miles east of the Short Pump Town Center Property. The 850-acre, upscale mixed-use corporate community was established in 1979, and is the largest and most successful corporate park in the Richmond area, comprised of over 400 companies with an aggregate workforce of over 20,000 employees. The surrounding area also contains 23 hotels, 40 museums, and 35 festivals throughout the year. The local area is expected to continue to grow with several nearby residential developments in process and over 10,000 new homes scheduled to be constructed within two miles of the Short Pump Town Center Property by 2027, increasing the trade area population by a projected 5.4% over the next 5 years.
According to the 2022 population within a 5-, 10- and 15-mile radius of the Short Pump Town Center Property was 137,768, 329,065 and 702,066, respectively. The 2022 average household income within the same radii was $136,997, $128,797 and $106,307, respectively.
| THE INFORMATION IN THIS STRUCTURAL AND COLLATERAL TERM SHEET IS NOT COMPLETE AND MAY BE AMENDED PRIOR TO THE TIME OF SALE. THIS TERM SHEET IS NOT AN OFFER TO SELL THESE SECURITIES AND IT IS NOT A SOLICITATION OF AN OFFER TO BUY THESE SECURITIES IN ANY JURISDICTION WHERE THE OFFER OR SALE IS NOT PERMITTED. |
| | 41 | |
| Structural and Collateral Term Sheet | | BMO 2023-5C1 |
| No. 3 – Short Pump Town Center |
The following table presents certain information relating to comparable retail centers for the Short Pump Town Center Property:
| Comparable Office Leases(1) |
| Property Name/Location | Year Built/ Renovated | NRA (SF) | Occupancy | Estimated # of Customers | Anchor / Major Tenants |
| Short Pump Town Center | 2003 / 2008, 2014 | 635,494(2) | 94.4% | 2.1M | Dillard’s; Macy’s; Dick’s Sporting Goods |
| Chesterfield Towne Center | 1975 / 2008, 2015 | 1,038,263 | 97.0% | 1.1M | At Home; JC Penney; Macy’s |
| Stony Point Fashion Park | 1975 / 2003 | 679,403 | 60.0% | 498.4K | Dillard’s; Saks Fifth Avenue |
| Regency Square Mall | 1975 / 2003 | 820,060 | 70.0% | 424.6K | NOVA of Virginia Aquatics Center; Surge Adventure Park |
| The Shops at Willow Lawn | 1957 / 2005 | 476,000 | 92.0% | 725.2K | Kroger; Dick’s Sporting Goods; Gold’s Gym; Ross Dress for Less |
| Southpark Mall | 1988 / 2007 | 685,675 | 98.0% | 593.8K | Dick’s Sporting Goods; JC Penney; Macy’s; Regal Cinema |
| Wtd. Avg. Competitive Set | | | 85.3%(4) | 5.4M | |
| (1) | Source: Appraisal, unless otherwise indicated. |
| (2) | Information is based on the underwritten rent roll dated June 20, 2023. |
The Borrowers. The borrower is Short Pump Town Center, LLC, a Virginia limited liability company and single purpose entity with two independent directors. Legal counsel to the borrower delivered a non-consolidation opinion in connection with the origination of the Short Pump Town Center Whole Loan. The borrower sponsor is affiliated with the borrower sponsors of the Cumberland Mall Mortgage Loan, the Oxmoor Center Mortgage Loan and the Heritage Plaza Mortgage Loan, which are also being contributed to the BMO 2023-5C1 transaction.
The Borrower Sponsor. The borrower sponsor is a joint venture between Forest City Realty Trust, LLC (34.0%), MJGT Associates, LLC, (33.33%) and Queensland Investment Corporation (“QIC”) (32.67%). The non-recourse carveout guarantor is Forest City Realty Trust LLC. The liability of Forest City Realty Trust LLC (and any affiliate that may become guarantor) is with respect to full recourse events only (not loss carveouts) and is limited to 20% ($36,000,000) of the original principal amount of the Short Pump Town Center Whole Loan plus all of the reasonable out-of-pocket costs and expenses (including court costs and reasonable attorneys’ fees) incurred by the lender in the enforcement of the related guaranty or the preservation of the lender’s rights under such guaranty. The borrower sponsor is affiliated with the borrower sponsors of the Cumberland Mall Mortgage Loan, the Oxmoor Center Mortgage Loan and the Heritage Plaza Mortgage Loan, which are also being contributed to the BMO 2023-5C1 transaction.
Forest City Realty Trust, LLC was acquired by Brookfield Asset Management (“Brookfield”) in December 2018. Brookfield is a diversified global real estate company that owns, operates and develops office, retail, multifamily, industrial, hospitality, triple net lease, student housing and manufactured housing assets. Brookfield owns more than 200 retail assets across seven countries, totaling approximately 130 million SF.
MJGT Associates, LLC is a family operated real estate development company that developed the Short Pump Town Center Property with its original partners, Forest City Enterprises Inc. of Cleveland.
Queensland Investment Corporation is an investment company owned by the Australian state of Queensland. Founded in 1991, QIC serves the long-term investment responsibilities of the Queensland government through infrastructure, real estate and private capital, managing over AU$98.7bn (US$67.9bn) as of June 30th, 2022. In 2013, QIC purchased a 25% interest in the Short Pump Town Center Property, as part of a larger $2.05 billion deal including eight regional malls owned or partly owned by Forest City Enterprises Inc. of Cleveland.
Property Management. The Short Pump Town Center Property is managed by Brookfield Properties Retail Inc., an affiliate of the borrower sponsor.
Escrows and Reserves. At origination, the borrowers deposited approximately $6,639,981 into a reserve for outstanding landlord obligations and $241,234 into a reserve for gap and free rent.
Tax Escrows – During a Reserve Period (as defined below) the borrower is required to deposit monthly to a real estate tax reserve 1/12 of the annual estimated real estate taxes.
Insurance Escrows – During a Reserve Period, the borrower is required to deposit monthly 1/12 of the annual estimated insurance premiums to the insurance reserve unless the Short Pump Town Center Property is maintained under a blanket policy.
| THE INFORMATION IN THIS STRUCTURAL AND COLLATERAL TERM SHEET IS NOT COMPLETE AND MAY BE AMENDED PRIOR TO THE TIME OF SALE. THIS TERM SHEET IS NOT AN OFFER TO SELL THESE SECURITIES AND IT IS NOT A SOLICITATION OF AN OFFER TO BUY THESE SECURITIES IN ANY JURISDICTION WHERE THE OFFER OR SALE IS NOT PERMITTED. |
| | 42 | |
| Structural and Collateral Term Sheet | | BMO 2023-5C1 |
| No. 3 – Short Pump Town Center |
Replacement Reserve – During a Reserve Period, the borrower is required to deposit monthly approximately $10,592 to a reserve for replacements to the Short Pump Town Center Property, subject to a cap of approximately $254,198.
TI/LC Escrows – During a Reserve Period, the borrower is required to deposit monthly approximately $105,916 for lease rollover expenditures, subject to a cap of $2,541,976.
Landlord Obligations Reserve – The Short Pump Town Center Whole Loan documents provide for an upfront reserve of $6,639,981 for outstanding tenant improvement allowances and leasing commissions.
Gap and Free Rent Reserve – The Short Pump Town Center Whole Loan documents provide for an upfront reserve of $241,234 for gap and free rent reserves.
A “Reserve Period” will commence upon the date on which the lender determines that the debt yield is less than 12.0% as of the end of any two consecutive calendar quarters, and will terminate upon the date that the debt yield is equal to or in excess of 12.0% as of the end of any two consecutive calendar quarters.
Lockbox / Cash Management. The Short Pump Town Center Whole Loan is structured with a hard lockbox and springing cash management. All rents from the Short Pump Town Center Property are required to be deposited directly to the lockbox by tenants upon delivery of a tenant direction letter. During a Cash Management Period (as defined below), funds will be transferred to the lender-controlled cash management account on each business day and disbursed according to the Short Pump Town Center Whole Loan documents. During a Cash Management Period, all excess cash is required to be held by the lender as additional security for the Short Pump Town Center Whole Loan; provided that excess cash will be disbursed at the direction of the borrower in the event of shortfalls in certain monthly expense items, so long as no event is continuing for which the lender has initiated an enforcement action.
A “Cash Management Period” will occur during the existence of any of: (i) an event of default, (ii) a Debt Yield Event (as defined below), or (iii) an Anchor Trigger Event (as defined below).
“Anchor Tenant Trigger Event” will commence when any Anchor Tenant (as defined below): (i) (A) has “gone dark”, other than a temporary closure in connection with (x) restoration, repair or renovation, (y) compliance with applicable law, regulations and/or governmental mandates or (z) an event of force majeure or (B) has vacated its anchor parcel; or (ii) is the subject of a bankruptcy action, and will expire (i) with respect to a trigger under clause (i) above, such Anchor Tenant operates the demised premises (to the extent not subject to any permitted subletting) for a period of no less than 30 consecutive operating days; (ii) with respect to a trigger under clause (ii) above, such bankruptcy action is dismissed or the Anchor Tenant has emerged from such bankruptcy action; (iii) for any trigger event, the Anchor Tenant parcel or a substantial portion thereof becomes owned or leased by one or more replacement occupants reasonably approved by the lender; or (iv) for any trigger event, the borrower delivers to the lender an officer’s certificate stating that the applicable trigger event does not result in the violation of co-tenancy requirements in leases representing more than 15% of the aggregate rent payable under leases at the Short Pump Town Center Property (or if such violation did occur, such violation has now been cured or waived).
An “Anchor Tenant” includes the non-collateral anchors, Dillard’s or Macy’s, and any replacement tenant which occupies all or substantially all of either such anchor space.
An “Anchor Trigger Event” means any Anchor Tenant (as defined below): (i) (A) has “gone dark”, other than a temporary closure in connection (x) with a restoration, repair or renovation, (y) compliance with applicable law, regulations and/or governmental mandates or (z) an event of force majeure or (B) has vacated its anchor parcel; or (ii) is the subject of a bankruptcy action.
Subordinate and Mezzanine Debt. None.
Partial Release. The borrower is entitled to release (i) one or more parcels or outlots, (ii) the Dick’s Parcel (as defined below), or (iii) one or more Acquired Parcels (as defined below) or Acquired Expansion Parcels (as defined below) (each a “Release Parcel”) in connection with the expansion or other development of the Short Pump Town Center Property upon satisfaction of the following conditions by the borrower: (a) the borrower provides notice of the details of the proposed release to the lender not less than ten days prior to the date of the release; (b) except with respect to a release of the Dick’s Parcel (as defined below), the Release Parcel is (i) not necessary for the borrower’s operation or use of the remaining Short Pump Town Center Property and (ii) may be readily separated from the applicable Short Pump Town Center Property without a material diminution in the value of the Short Pump Town Center Property; (c) no event of default is continuing; (d) the borrower delivers evidence to the lender that (i) the Release Parcel has been legally subdivided from the remainder of the Short Pump Town Center Property, (ii) the balance of the Short Pump Town Center Property after the release conforms to all legal requirements and constitutes a separate tax lot and (iii) except with respect to a release of the Dick’s Parcel, the Release Parcel is not necessary for the Short Pump Town Center Property to comply in any material respect with any zoning, building, land use, parking or other legal requirements; (e) except with respect to a release of the Dick’s Parcel, a title insurance endorsement is obtained with respect to the remainder of the Short Pump Town Center Property; (f) the borrower provides evidence that any such release of a Release Parcel will not result in an event of default or breach by the borrower under any material leases; (g) except with respect to a release of the Dick’s Parcel, the remaining Short Pump Town Center Property remains physically open and available to the public; (h) except with respect to a release of the Dick’s Parcel or Acquired Expansion Parcel (as defined below), the Release Parcel is vacant, non-
| THE INFORMATION IN THIS STRUCTURAL AND COLLATERAL TERM SHEET IS NOT COMPLETE AND MAY BE AMENDED PRIOR TO THE TIME OF SALE. THIS TERM SHEET IS NOT AN OFFER TO SELL THESE SECURITIES AND IT IS NOT A SOLICITATION OF AN OFFER TO BUY THESE SECURITIES IN ANY JURISDICTION WHERE THE OFFER OR SALE IS NOT PERMITTED. |
| | 43 | |
| Structural and Collateral Term Sheet | | BMO 2023-5C1 |
| No. 3 – Short Pump Town Center |
income producing and unimproved (unless these requirements are waived by the lender) or non-income producing and improved only by landscaping, utility facilities that are not required for the use of the remaining Short Pump Town Center Property (or such utility facilities will continue to serve the remaining Short Pump Town Center Property in place or be readily relocatable) or non-income producing surface parking areas; (i) the loan-to-value ratio immediately after the release of the Release Parcel remains less than or equal to 125%; and (j) the borrower has paid all reasonable out-of-pocket costs and expenses incurred by the lender in connection with the release of the Release Parcel and, after a securitization but except with respect to a release of the Dick’s Parcel, the borrower pays to the lender a fee in the amount of $10,000.
An “Acquired Parcel” is a fee simple or leasehold interest to a parcel of the Short Pump Town Center Property that is acquired in a substitution in accordance with the Short Pump Town Center Whole Loan documents.
An “Acquired Expansion Parcel” means any parcel of land, together with any improvements thereon located, (a) constituting an integral part of, or adjoining to, or proximately located near, the shopping center of which the Short Pump Town Center Property is a part, (b) that is not owned by the borrower on the origination date and (c) is not an Acquired Parcel and is acquired by the borrower after the origination date.
The “Dick’s Parcel” means that certain area more particularly set forth on that certain subdivision plat map dated June 28, 2023 (as described in the Short Pump Town Center Whole Loan documents) (the relevant page of which is attached to the Short Pump Town Center loan agreement), including the real property, improvements on the real property and all rights and appurtenances thereto.
An “Expansion Parcel” is any parcel of land, together with any improvements thereon (a) constituting an integral part of, or adjoining to, or proximately located near, the shopping center of which the Short Pump Town Center Property is a part, (b) not owned by the borrower on the origination date and (c) is not an Acquired Parcel.
Ground Lease. None.
Terrorism Insurance. The borrower is required to obtain and maintain property insurance and business interruption insurance for 24 months plus a 365-day extended period of indemnity. Such insurance is required to cover perils of terrorism and acts of terrorism; provided that (a) the borrower is permitted to maintain terrorism coverage with a licensed captive insurance company that is affiliated with the borrower sponsor if certain conditions set forth in the related Short Pump Town Center Whole Loan documents are satisfied, and (b) the borrower will only be required to pay for terrorism insurance up to a maximum of two times the annual insurance premiums payable for the Short Pump Town Center Property at the time with respect to the property and business income or rental income insurance interruption policies (excluding the terrorism and earthquake components of such premiums). See “Risk Factors—Risks Relating to the Mortgage Loans—Terrorism Insurance May Not Be Available for All Mortgaged Properties” in the prospectus.
| THE INFORMATION IN THIS STRUCTURAL AND COLLATERAL TERM SHEET IS NOT COMPLETE AND MAY BE AMENDED PRIOR TO THE TIME OF SALE. THIS TERM SHEET IS NOT AN OFFER TO SELL THESE SECURITIES AND IT IS NOT A SOLICITATION OF AN OFFER TO BUY THESE SECURITIES IN ANY JURISDICTION WHERE THE OFFER OR SALE IS NOT PERMITTED. |
| | 44 | |
| Structural and Collateral Term Sheet | | BMO 2023-5C1 |
| No. 4 – Brookview Commons |
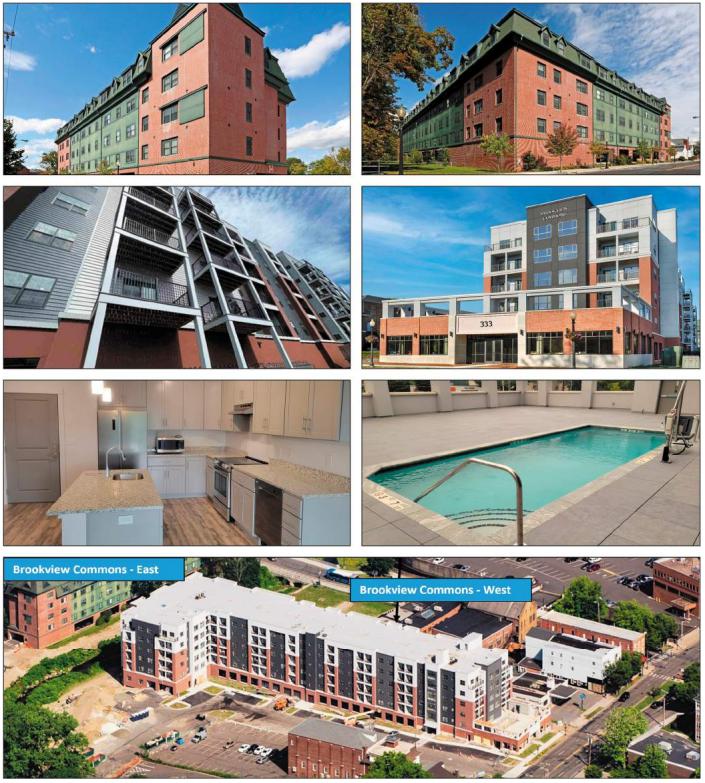
| THE INFORMATION IN THIS STRUCTURAL AND COLLATERAL TERM SHEET IS NOT COMPLETE AND MAY BE AMENDED PRIOR TO THE TIME OF SALE. THIS TERM SHEET IS NOT AN OFFER TO SELL THESE SECURITIES AND IT IS NOT A SOLICITATION OF AN OFFER TO BUY THESE SECURITIES IN ANY JURISDICTION WHERE THE OFFER OR SALE IS NOT PERMITTED. |
| | 45 | |
| Structural and Collateral Term Sheet | | BMO 2023-5C1 |
| No. 4 – Brookview Commons |
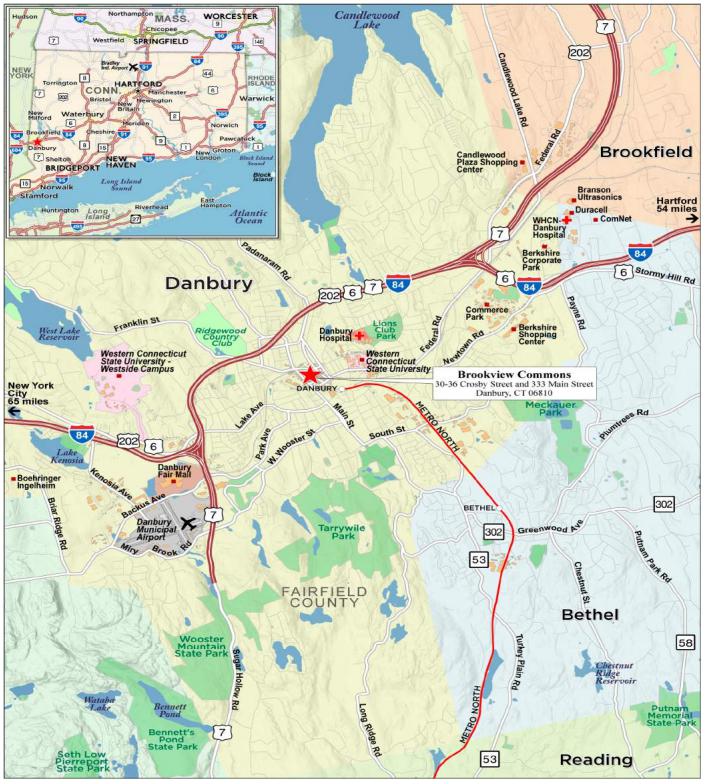
| THE INFORMATION IN THIS STRUCTURAL AND COLLATERAL TERM SHEET IS NOT COMPLETE AND MAY BE AMENDED PRIOR TO THE TIME OF SALE. THIS TERM SHEET IS NOT AN OFFER TO SELL THESE SECURITIES AND IT IS NOT A SOLICITATION OF AN OFFER TO BUY THESE SECURITIES IN ANY JURISDICTION WHERE THE OFFER OR SALE IS NOT PERMITTED. |
| | 46 | |
| Structural and Collateral Term Sheet | | BMO 2023-5C1 |
| No. 4 – Brookview Commons |
| Mortgage Loan Information | | Property Information |
| Mortgage Loan Seller: | 3650 REIT | | Single Asset / Portfolio: | Single Asset |
| Original Principal Balance: | $58,000,000 | | Title: | Fee |
| Cut-off Date Principal Balance: | $58,000,000 | | Property Type – Subtype: | Multifamily – Mid Rise |
| % of IPB: | 7.6% | | Net Rentable Area (Units): | 264 |
| Loan Purpose: | Refinance | | Location: | Danbury, CT |
| Borrowers: | BRT Brookview, LLC and BRT Brookview Commons, LLC | | Year Built / Renovated: | 2007, 2023 / NAP |
| Borrower Sponsors: | Barry J. Bertram and John L. DiMarco, Sr. | | Occupancy: | 96.2% |
| Interest Rate: | 6.00000% | | Occupancy Date: | 4/17/2023 |
| Note Date: | 5/11/2023 | | 4th Most Recent NOI (As of)(2): | NAV |
| Maturity Date: | 6/5/2028 | | 3rd Most Recent NOI (As of)(2): | NAV |
| Interest-only Period: | 60 months | | 2nd Most Recent NOI (As of)(2): | NAV |
| Original Term: | 60 months | | Most Recent NOI (As of)(3): | $4,305,051 (T-3 Annualized 3/31/2023) |
| Original Amortization Term: | None | | UW Economic Occupancy: | 95.0% |
| Amortization Type: | Interest Only | | UW Revenues: | $5,995,537 |
| Call Protection: | L(26),D(30),O(4) | | UW Expenses: | $1,535,869 |
| Lockbox / Cash Management: | NAP | | UW NOI: | $4,459,668 |
| Additional Debt: | No | | UW NCF: | $4,420,068 |
| Additional Debt Balance: | N/A | | Appraised Value / Per Unit: | $87,700,000 / $332,197 |
| Additional Debt Type: | N/A | | Appraisal Date: | 3/27/2023 |
| | | | | |
| | | | | |
| Escrows and Reserves(1) | | Financial Information(4) |
| | Initial | Monthly | Initial Cap | | Cut-off Date Loan / Unit: | $219,697 | | |
| Taxes: | $27,566 | $29,689 | N/A | | Maturity Date Loan / Unit: | $219,697 | | |
| Insurance: | $0 | $12,391 | N/A | | Cut-off Date LTV: | 57.0% | | |
| Replacement Reserve: | $0 | $3,300 | N/A | | Maturity Date LTV: | 57.0% | | |
| Earn-out Reserve: | $8,000,000 | N/A | N/A | | UW NCF DSCR: | 1.45x | | |
| | | | | | UW NOI Debt Yield: | 8.9% | | |
| | | | | | | | |
| Sources and Uses |
| Sources | Proceeds | % of Total | | Uses | Proceeds | % of Total |
| Mortgage Loan | $58,000,000 | 100.0% | | Loan Payoff | $40,402,225 | 69.7 | % |
| | | | | Earnout Reserves | 8,000,000 | 13.8 | |
| | | | | Return of Equity | 7,665,407 | 13.2 | |
| | | | | Closing Costs | 1,904,803 | 3.3 | |
| | | | | Upfront Reserves | 27,566 | 0.0 | |
| Total Sources | $58,000,000 | 100.0% | | Total Uses | $58,000,000 | 100.0 | % |
| (1) | For a full description of Escrows and Reserves, please refer to “Escrows and Reserves” below. |
| (2) | Historical data is not presented as the 30-36 Crosby Street Building (as defined below) and the 333 Main Street Building (as defined below), together the Brookview Commons Property (as defined below), were built in two separate phases. |
| (3) | Most Recent NOI represents T-3 annualized statements ending March 31, 2023. |
| (4) | The financial information in the chart above reflects the Brookview Commons Mortgage Loan (as defined below). In addition, the Cut-off Date LTV, Maturity Date LTV, UW NCF DSCR, and UW NOI Debt Yield are based on a $50,000,000 principal balance, which does not take the $8,000,000 earnout reserve into account. The Cut-off Date LTV, Maturity Date LTV, UW NCF DSCR, and UW NOI Debt Yield based on a $58,000,000 Cut-off Balance without netting the $8,000,000 earnout reserve are 66.1%, 66.1%, 1.25x, and 7.7%, respectively. |
The Loan. The fourth largest mortgage loan (the “Brookview Commons Mortgage Loan”) is secured by a first lien mortgage on the borrowers’ fee simple interest in two mid rise multifamily buildings totaling 264-units known as Brookview Commons (the “Brookview Commons Property”) located in Danbury, Connecticut. The Brookview Commons Mortgage Loan was originated by 3650 Real Estate Investment Trust 2 LLC and has an outstanding principal balance as of the Cut-off Date of $58.0 million (the “Brookview Commons Mortgage Loan”). The Brookview Commons Mortgage Loan has a 5-year term and is interest only for the full term of the loan and accrues interest on an actual/360 basis.
| THE INFORMATION IN THIS STRUCTURAL AND COLLATERAL TERM SHEET IS NOT COMPLETE AND MAY BE AMENDED PRIOR TO THE TIME OF SALE. THIS TERM SHEET IS NOT AN OFFER TO SELL THESE SECURITIES AND IT IS NOT A SOLICITATION OF AN OFFER TO BUY THESE SECURITIES IN ANY JURISDICTION WHERE THE OFFER OR SALE IS NOT PERMITTED. |
| | 47 | |
| Structural and Collateral Term Sheet | | BMO 2023-5C1 |
| No. 4 – Brookview Commons |
The Property. The Brookview Commons Property is a 264-unit mid rise Class A multi-family complex, with 1,800 square feet of ground-floor retail space situated on a 5.97-acre site located in Danbury, Connecticut. Built in two phases, the Brookview Commons Property is comprised of two multifamily buildings located at 30-36 Crosby Street (the “30-36 Crosby Street Building”), which was developed in 2007 and renovated in 2023, and 333 Main Street (the “333 Main Street Building”), which was developed in 2023. The buildings are connected via an elevated pedestrian walkway, as well as a newly built vehicular bridge. The 333 Main Street Building was constructed with amenities including an outdoor swimming pool with a terrace sun deck, furnished roof terrace, a 24-hour fitness center with cardio & strength training equipment, a community lounge equipped with a full kitchen, an outdoor patio with propane grills, a dog park and dog washing station, multiple electric car charging stations, covered & gated on-site resident garage parking, and a package delivery management system. The 30-36 Crosby Street Building will have full access to all of the newly built amenities at the 333 Main Street Building. The borrower sponsor intends to implement a $50 monthly amenity fee starting in September 2023. The City of Danbury is located in the northern portion of Fairfield County, located approximately 48 miles west of Hartford, Connecticut and 56 miles north of New York City, New York. The Brookview Commons Property is adjacent to the Danbury commuter rail station on the Metro-North Railroad which is an approximate 2-hour commute to New York City.
The 30-36 Crosby Street Building is a 4-story residential building over a single-story garage containing 115 units. The 30-36 Crosby Street Building is 98.3% occupied and features studio, one and two-bedroom units with a weighted average unit size of 701 square feet.
The 333 Main Street Building is a 5-story residential building over a single-story garage containing 149 units. The 333 Main Street Building is 94.6% occupied and features studio, one and two-bedroom units with a weighted average unit size of 875 square feet. The 333 Main Street Building contains 1,800 square feet of rentable retail area on the ground-floor, which is currently vacant. The underwritten cash flows and the borrower sponsors’ budget omit any revenue from the existing commercial space.
The Brookview Commons Property is in the aggregate currently 96.2% occupied and consists of 65 studios, 126 one-bedroom units, and 73 two-bedroom units. The Brookview Commons Property has a total of 370 surface and garage parking spaces at a parking ratio of 1.4 spaces per unit.
The following table presents detailed information with respect to the occupied and market rate units at the Brookview Commons Property:
| As Is Market Rate Unit Summary(1) |
| Unit Type | No. of Units | % of Total | Average Unit Size (SF) | Average Monthly Rental Rate(2) | Average Monthly Rental Rate per SF(2) | Average Monthly Market Rental Rate | Average Monthly Market Rental Rate per SF(2) |
| Studio | 65 | 24.6 | % | 554 | $1,508 | $2.72 | $1,552 | $2.80 |
| 1 BR | 126 | 47.7 | | 724 | $1,791 | $2.47 | $1,843 | $2.55 |
| 2 BR | 73 | 27.7 | | 1,148 | $2,362 | $2.07 | $2,386 | $2.08 |
| Total/Wtd. Avg. | 264 | 100.0 | % | 799 | $1,879 | $2.34 | $1,921 | $2.48 |
| (1) | Based on the underwritten rent roll as of April 17, 2023. |
| (2) | Based only on occupied units. |
Environmental. According to the Phase I environmental reports dated May 30, 2023 and June 8, 2023 (the “ESAs”), there is no evidence of any recognized environmental conditions (“RECs”) at the Brookview Commons Property. However, the applicable ESAs did identify certain controlled RECs and historical RECs at the Brookview Commons Property. See “Description of the Mortgage Pool—Environmental Considerations” in the Preliminary Prospectus.
The following table presents certain information relating to the historical and current occupancy of the Brookview Commons Property:
| Historical and Current Multifamily Occupancy(1) |
| 2020 | 2021 | 2022 | Current(2) |
| NAV | NAV | NAV | 96.2% |
| (1) | Historical data is not presented as the 30-36 Crosby Street Building and the 333 Main Street Building were built in two separate phases. The average occupancies for the 30-36 Crosby Street Building in 2020, 2021, and 2022 were 94.1%, 94.8%, and 92.9%, respectively. |
| (2) | Current occupancy is as of April 17, 2023. |
| THE INFORMATION IN THIS STRUCTURAL AND COLLATERAL TERM SHEET IS NOT COMPLETE AND MAY BE AMENDED PRIOR TO THE TIME OF SALE. THIS TERM SHEET IS NOT AN OFFER TO SELL THESE SECURITIES AND IT IS NOT A SOLICITATION OF AN OFFER TO BUY THESE SECURITIES IN ANY JURISDICTION WHERE THE OFFER OR SALE IS NOT PERMITTED. |
| | 48 | |
| Structural and Collateral Term Sheet | | BMO 2023-5C1 |
| No. 4 – Brookview Commons |
The following table presents certain information relating to the operating history and underwritten cash flows of the Brookview Commons Property:
| Operating History and Underwritten Net Cash Flow |
| | T-3(1) | Underwritten | Per Unit | %(3) |
| Base Rent(2) | $5,038,376 | $5,972,880 | $22,625 | 100.0% |
| Gross Potential Rent | $5,038,376 | $5,972,880 | $22,625 | 100.0% |
| (Vacancy/Credit Loss) | 0 | (298,644) | (1,131) | (5.0) |
| Net Rental Income | $5,038,376 | $5,674,236 | $21,493 | 94.6% |
| Parking Income | 35,890 | 33,207 | 126 | 0.6 |
| Other Income | 232,892 | 288,095 | 1,091 | 4.8 |
| Effective Gross Income | $5,307,157 | $5,995,537 | $22,710 | 100.0% |
| Total Expenses | 1,002,106 | 1,535,869 | 5,818 | 25.6 |
| Net Operating Income | $4,305,051 | $4,459,668 | $16,893 | 74.4% |
| Replacement Reserves | 0 | 39,600 | 150 | 0.7 |
| Net Cash Flow | $4,305,051 | $4,420,068 | $16,743 | 73.7% |
| (1) | T-3 represents the trailing 3 months ending March 2023. |
| (2) | Base Rent is based on the underwritten rent roll dated April 17, 2023. |
| (3) | % column represents percent of Net Rental Income for all revenue lines and represents percent of Effective Gross Income for the remainder of the fields. |
The Market. The Brookview Commons Property is located in Danbury within Fairfield County, which is located in the southwest corner of the State of Connecticut’s panhandle, bordered by the Long Island Sound to the south and the State of New York to the west. Fairfield County is located approximately 50 miles northwest of New York City and is both economically and culturally tied to the metro area. According to a third-party market research provider, the county is home to a significant commuter population that travels into Manhattan. Fairfield County’s proximity to New York City and office space make it a destination for corporate headquarters and regional offices. The regional economy is home to a diverse industry mix but maintains its identity as a financial hub. Fairfield County is home to the corporate headquarters and large offices of many companies including Charter Communications, Sikorsky Aircraft Corporation, WWE, Spectrum Community and People’s United Bank, a subsidiary of M&T Bank. According to a third-party market research provider, Fairfield County has one of the highest standards of living in the country.
According to a third-party market research provider, Fairfield County offers a diverse mix of industry employment with the trade, transportation & utilities and professional & business services sectors accounting for 17.7% and 16.6% of total employment, respectively. Together, these three industries comprise 52.6% of the region’s share of employment. The largest employers in Fairfield County include Frontier Communications Parent, Inc. (16,200 employees), Harman International Industries, Inc. (15,206 employees), Sikorsky Aircraft Corporation (8,735 employees), Xerox Holdings, Inc. (5,400 employees) and Nuvance Health (5,048 employees).
The Brookview Commons Property is located within the primary downtown commercial area of Danbury. The subject neighborhood is bounded by Garamella Boulevard, industrial use, condominium and single-family residential use to the north, commercial uses, Crosby Street and a river to the south, a church, multiple grocery markets and restaurants to the east and Main Street (Route 53), a variety of commercial uses and apartment buildings to the west.
The Brookview Commons Property’s immediate area is primarily characterized by commercial and residential land uses. Main Street (Route 53) travels in the northwest-southeast direction and is lined with retail and restaurant use, along with the surrounding and intersecting streets. The area is also categorized by its proximity to Western Connecticut State University, which lies less than 0.5 miles east of the Brookview Commons Property. Interstate 84 is just over a 0.5 mile to the north and west, and the Danbury Fair Shopping Mall and Danbury Municipal Airport are less than 2 miles to the southwest of the Brookview Commons Property, respectively. The Danbury Fair Mall and big-box development along Federal Road are the primary retail areas within the Greater Danbury region. Secondary retail corridors include Newtown Road and Mill Plain Road/Lake Avenue Extension.
According to a third-party market research provider, as of year-end 2022 the Fairfield County apartment market contains 43,065 rental units in 290 buildings, with a vacancy rate of 6.8%, down from year-end 2021 vacancy of 8.5%. A total of 551 units were completed and delivered in 2022. The asking rental rate in the market stood at $2,571 per unit in 2022, an increase from $2,398 per unit as of the previous year. The market experienced a positive net absorption of 1,233 units.
| THE INFORMATION IN THIS STRUCTURAL AND COLLATERAL TERM SHEET IS NOT COMPLETE AND MAY BE AMENDED PRIOR TO THE TIME OF SALE. THIS TERM SHEET IS NOT AN OFFER TO SELL THESE SECURITIES AND IT IS NOT A SOLICITATION OF AN OFFER TO BUY THESE SECURITIES IN ANY JURISDICTION WHERE THE OFFER OR SALE IS NOT PERMITTED. |
| | 49 | |
| Structural and Collateral Term Sheet | | BMO 2023-5C1 |
| No. 4 – Brookview Commons |
The following table presents certain information relating to comparable multifamily rental properties to the Brookview Commons Property:
| | | Comparable Rental Summary(1) | Average SF per Unit | Average Rent per SF | Average Rent per Unit |
| Property Address | Year Built | Occupancy | # of Units | Unit Mix |
| Brookview Commons (2) | 2007 & 2023 | 96.2% | 264 | Studio | 554 | $2.72 | $1,508 |
| 30-36 Crosby Street | 1 Bed /1 Bath | 724 | $2.47 | $1,791 |
| 333 Main Street | 2 Bed/2 Bath | 1,148 | $2.07 | $2,362 |
| Danbury, CT | | | | |
| Abbey Lane | 2013 | NA | 470 | 1 Bed/1 Bath | 865 | $2.65 | $2,293 |
| 15 Abbey Ln | | | | 2 Bed/2 Bath | 1,117 | $2.20 | $2,461 |
| Danbury, CT | | | | | | | |
| Willow Grove | 1999 | 91.7% | 135 | 1 Bed/1 Bath | 1,117 | $2.12 | $2,365 |
| 101 Avalon Lake Rd | | | | 2 Bed/2 Bath | 1,294 | $2.00 | $2,585 |
| Danbury, CT | | | | | | | |
| Covered Bridge | 2018 | 99.9% | 210 | 1 Bed/1 Bath | 751 | $2.35 | $1,765 |
| 9 Covered Bridge Rd | | | | 2 Bed/2 Bath | 1,226 | $2.25 | $2,754 |
| Newtown, CT | | | | | | | |
| Barnbeck Place | 2015 | 98.9% | 139 | Studio | 510 | $3.20 | $1,633 |
| 398 Federal Rd | | | | 1 Bed/1 Bath | 615 | $2.95 | $1,817 |
| Brookfield, CT | | | | 2 Bed/2 Bath | 1,106 | $2.22 | $2,455 |
| 1 Kennedy Flats | 2015 | 93.5% | 374 | Studio | 571 | $3.48 | $1,988 |
| 1 Kennedy Ave | | | | 1 Bed/1 Bath | 870 | $2.37 | $2,064 |
| Danbury, CT | | | | 2 Bed/2 Bath | 1,109 | $2.46 | $2,731 |
| The Point at Still River | 2005 | 94.7% | 234 | 1 Bed/1 Bath | 785 | $2.62 | $2,058 |
| 2 Mountainview Ter | | | | 2 Bed/2 Bath | 1,173 | $2.21 | $2,598 |
| Danbury, CT | | | | | | | |
| Ashwood Valley Luxury Apartments | 1999 | 92.9% | 268 | 1 Bed/1 Bath | 852 | $2.27 | $1,930 |
| 53 Sand Pit Rd | | | | 2 Bed/2 Bath | 1,291 | $1.82 | $2,350 |
| Danbury, CT | | | | | | | |
| Crown Point Apartments | 2011 | 92.9% | 466 | 1 Bed/1 Bath | 764 | $2.79 | $2,134 |
| 50 Saw Mill Rd | | | | 2 Bed/2 Bath | 1,186 | $2.27 | $2,690 |
| Danbury, CT | | | | | | | |
| (2) | Based on underwritten rent roll dated as of April 17, 2023. Average Rent per SF and Average Rent per Unit reflect average monthly in-place rent for occupied units. |
The Borrowers. The borrowers are BRT Brookview, LLC and BRT Brookview Commons, LLC, each a single-purpose limited liability company with one independent director. Legal counsel to the borrowers delivered a non-consolidation opinion in connection with the origination of the Brookview Commons Mortgage Loan.
The Borrower Sponsors. The borrower sponsors are Barry J. Bertram and John L. DiMarco, Sr. Barry Bertram, an engineer and former Marine Corps fighter pilot, founded BRT Companies in 1971. Under Mr. Bertram’s leadership, BRT developed and acquired thousands of multifamily units in the northeast. BRT is headquartered in Danbury, Connecticut and is currently run by Barry’s son, Dan Bertram.
The DiMarco Group was founded in 1910 and is a full-service development company which includes the following companies: DiMarco Constructors (general construction/construction management), Baldwin Real Estate (property management), J. DiMarco Builders (facility maintenance), JD Aviation (private jet charters) and ADMAR Construction Equipment and Supplies (rental, sales, service, and parts). The DiMarco Group is headquartered in Rochester, NY and is currently run by John L. DiMarco II who is part of the fourth generation to be involved in the family-owned business. The non-recourse carve out guarantors are Barry J. Bertram and John L. DiMarco, Sr.
Property Management. The Brookview Commons Property is managed by BRT General Corporation, an affiliate of the borrowers.
| THE INFORMATION IN THIS STRUCTURAL AND COLLATERAL TERM SHEET IS NOT COMPLETE AND MAY BE AMENDED PRIOR TO THE TIME OF SALE. THIS TERM SHEET IS NOT AN OFFER TO SELL THESE SECURITIES AND IT IS NOT A SOLICITATION OF AN OFFER TO BUY THESE SECURITIES IN ANY JURISDICTION WHERE THE OFFER OR SALE IS NOT PERMITTED. |
| | 50 | |
| Structural and Collateral Term Sheet | | BMO 2023-5C1 |
| No. 4 – Brookview Commons |
Escrows and Reserves.
Tax Escrows – At origination of the Brookview Commons Mortgage Loan, the borrowers deposited approximately $27,566 into a real estate tax reserve account. The borrowers are required to deposit into a real estate tax reserve, on a monthly basis, 1/12th of the taxes that the lender estimates will be payable over the next-ensuing 12-month period (initially estimated to be approximately $29,689).
Insurance Escrows – The borrowers are required to deposit into an insurance reserve, on a monthly basis, 1/12th of the amount which will be sufficient to pay the insurance premiums due for the renewal of coverage afforded by such policies (initially estimated to be approximately $12,391).
Replacement Reserve – The borrowers are required to deposit an amount equal to $3,300 into a replacement reserve, on a monthly basis for replacement costs at the Brookview Commons Property.
Earn-out Reserve Funds – At loan origination, the borrowers deposited $8,000,000 into an earnout reserve fund as additional collateral for the Brookview Commons Mortgage Loan. Provided no event of default is continuing, the lender will disburse the earnout reserve funds to the borrowers within ten (10) business days after the borrowers’ satisfaction of the following conditions:
(i) Delivery by the borrowers to the lender of a written request therefor in accordance with the terms of the Brookview Commons Loan documents, which request may not be made (x) more than once per calendar month during the period from the origination date to December 5, 2023, (y) more than one time in any calendar quarter during the period from December 5, 2023 to July 5, 2025, or (z) later than July 5, 2025;
(ii) In the event that the earnout reserve funds are requested (x) on or after the earlier to occur of (1) September 5, 2023, and (2) the final securitization involving the Brookview Commons Mortgage Loan and (y) prior to December 5, 2023, then the lender will make a one-time disbursement of all of the earnout reserve funds upon satisfaction of the following conditions: (A) the borrowers have delivered to the lender (1) a rent roll for the prior month, based upon which the lender will have determined that the residential gross potential rent is no less than $5,900,000 and that the Brookview Commons Property has a vacancy of no more than 5%, and (2) a certification that there are no rent concessions provided to any tenants at the Brookview Commons Property as of the date of such request; (B) the lender has determined that the sum of (i) annualized other income ( e.g. income from parking, amenities, pet fees, laundry, water and sewer, etc. ), based upon the trailing three (3) month financial statements, plus (ii) the annualized rent payable under the amenities lease, if any, is not less than $664,000 annually; and (C) the lender has received evidence that the borrowers have obtained the tax benefits for the 333 Main Street Building as described under “Description of the Mortgage Pool—Real Estate and Other Tax Considerations” in the Preliminary Prospectus and that such tax benefits are in effect. Although it is anticipated that the 333 Main Street Building will benefit from a deferral of any assessment increases with respect to the related improvements for a 7-year period (the “333 Main Street Tax Benefits”) pursuant to a tax deferral agreement between one of the related borrowers, BRT Brookview Commons, LLC (the “333 Main Street Borrower”) and the City of Danbury, the 333 Main Street Tax Benefits have not yet been granted pending satisfaction of certain remaining conditions by the 333 Main Street Borrower. There can be no assurance that the 333 Main Street Tax Benefits will be obtained as expected or at all.
(iii) In the event that the earnout reserve funds are requested on or after December 5, 2023 (but before July 5, 2025), then the lender will make periodic disbursements (no more than quarterly) of the earnout reserve funds upon satisfaction of the following conditions: (A) the borrowers submit a written request to the lender for a disbursement of earnout reserve funds, (B) after giving effect to the requested disbursement, the Performance Debt Yield Condition (as defined below) has been satisfied; and (C) the lender has received evidence that the 333 Main Street Borrower has obtained the 333 Main Street Tax Benefits and that 333 Main Street Tax Benefits are in effect.
No disbursement of the earnout reserve funds will be requested by borrowers or disbursed by the lender prior to the earlier to occur of (i) September 5, 2023 and (ii) the final securitization involving the Brookview Commons Mortgage Loan. After the earnout reserve expiration date (i.e., July 5, 2025), any earnout reserve funds on deposit in the earnout reserve subaccount as of such date will be held as additional collateral for the Brookview Commons Mortgage Loan and applied toward the prepayment of the debt on the open period start date.
“Performance Debt Yield Condition” means that the lender has determined that the debt yield based on the Net Loan Amount is no less than 8.6%.
| THE INFORMATION IN THIS STRUCTURAL AND COLLATERAL TERM SHEET IS NOT COMPLETE AND MAY BE AMENDED PRIOR TO THE TIME OF SALE. THIS TERM SHEET IS NOT AN OFFER TO SELL THESE SECURITIES AND IT IS NOT A SOLICITATION OF AN OFFER TO BUY THESE SECURITIES IN ANY JURISDICTION WHERE THE OFFER OR SALE IS NOT PERMITTED. |
| | 51 | |
| Structural and Collateral Term Sheet | | BMO 2023-5C1 |
| No. 4 – Brookview Commons |
“Net Loan Amount” means (i) the outstanding principal balance of the Brookview Commons Mortgage Loan, less (ii) the amount of earnout reserve funds then remaining on deposit.
Lockbox / Cash Management. None.
Subordinate Debt. None.
Mezzanine Debt. None.
Partial Release. Not permitted.
Ground Lease. None.
| THE INFORMATION IN THIS STRUCTURAL AND COLLATERAL TERM SHEET IS NOT COMPLETE AND MAY BE AMENDED PRIOR TO THE TIME OF SALE. THIS TERM SHEET IS NOT AN OFFER TO SELL THESE SECURITIES AND IT IS NOT A SOLICITATION OF AN OFFER TO BUY THESE SECURITIES IN ANY JURISDICTION WHERE THE OFFER OR SALE IS NOT PERMITTED. |
| | 52 | |
| Structural and Collateral Term Sheet | | BMO 2023-5C1 |
| No. 5 – ICP/IRG Holdings Portfolio |
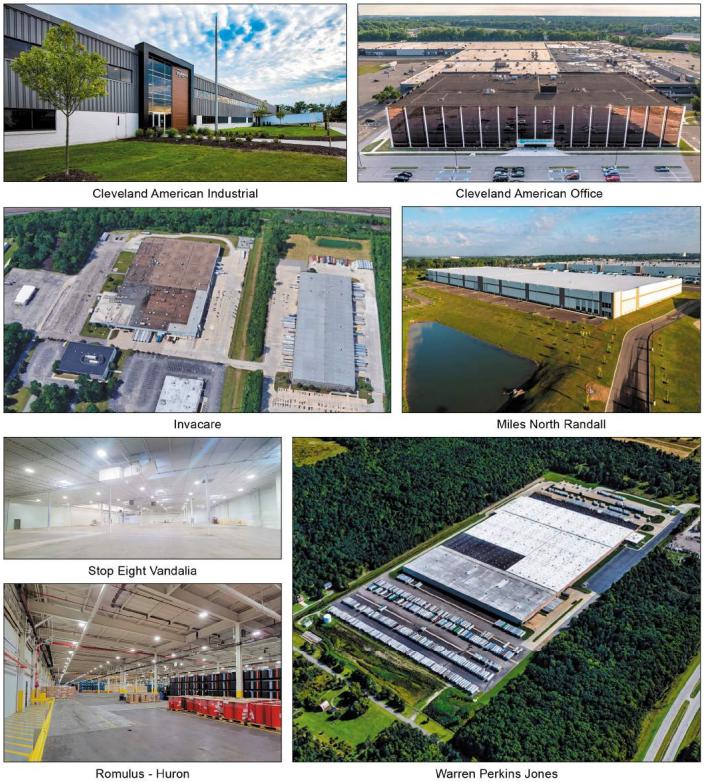
| THE INFORMATION IN THIS STRUCTURAL AND COLLATERAL TERM SHEET IS NOT COMPLETE AND MAY BE AMENDED PRIOR TO THE TIME OF SALE. THIS TERM SHEET IS NOT AN OFFER TO SELL THESE SECURITIES AND IT IS NOT A SOLICITATION OF AN OFFER TO BUY THESE SECURITIES IN ANY JURISDICTION WHERE THE OFFER OR SALE IS NOT PERMITTED. |
| | 53 | |
| Structural and Collateral Term Sheet | | BMO 2023-5C1 |
| No. 5 – ICP/IRG Holdings Portfolio |
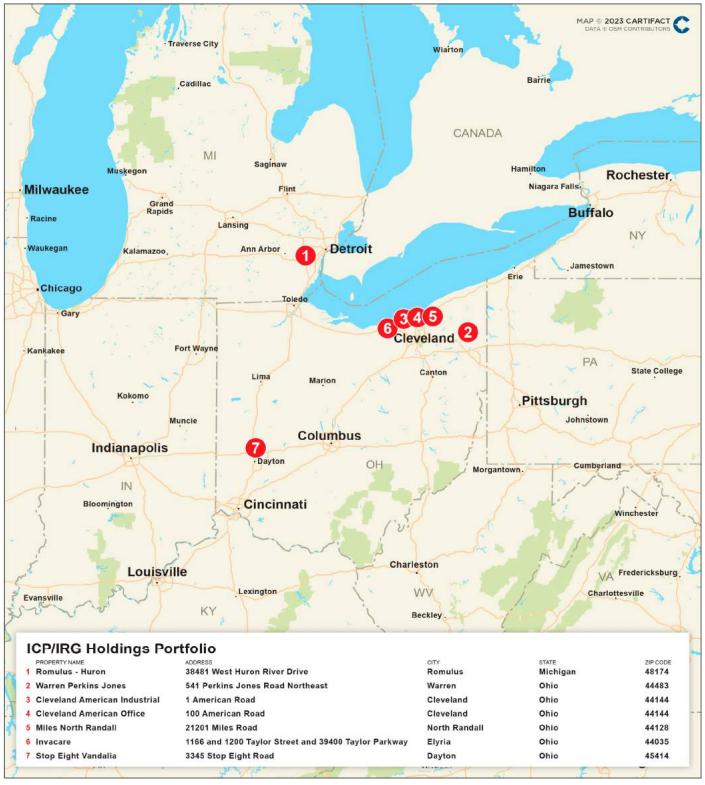
| THE INFORMATION IN THIS STRUCTURAL AND COLLATERAL TERM SHEET IS NOT COMPLETE AND MAY BE AMENDED PRIOR TO THE TIME OF SALE. THIS TERM SHEET IS NOT AN OFFER TO SELL THESE SECURITIES AND IT IS NOT A SOLICITATION OF AN OFFER TO BUY THESE SECURITIES IN ANY JURISDICTION WHERE THE OFFER OR SALE IS NOT PERMITTED. |
| | 54 | |
| Structural and Collateral Term Sheet | | BMO 2023-5C1 |
| No. 5 – ICP/IRG Holdings Portfolio |
Mortgage Loan Information | | Property Information |
| Mortgage Loan Seller: | 3650 REIT | | Single Asset / Portfolio: | Portfolio |
| Original Principal Balance(1): | $52,800,000 | | Title: | Fee |
| Cut-off Date Principal Balance(1): | $52,800,000 | | Property Type – Subtype: | Various – Various |
| % of IPB: | 6.9% | | Net Rentable Area (SF): | 4,662,982 |
| Loan Purpose: | Refinance | | Location: | Various |
| Borrowers(2): | Various | | Year Built / Renovated: | Various / Various |
| Borrower Sponsors: | Industrial Commercial Properties | | Occupancy: | 94.2% |
| | and Industrial Realty Group | | | |
| Interest Rate: | 7.35000% | | Occupancy Date: | 3/31/2023 |
| Note Date: | 4/20/2023 | | 4th Most Recent NOI (As of)(6): | NAV |
| Maturity Date: | 5/1/2028 | | 3rd Most Recent NOI (As of)(6): | NAV |
| Interest-only Period: | 60 months | | 2nd Most Recent NOI (As of): | $15,683,939 (12/31/2022) |
| Original Term: | 60 months | | Most Recent NOI (As of): | $15,899,293 (TTM 1/31/2023) |
| Original Amortization Term: | None | | UW Economic Occupancy: | 92.9% |
| Amortization Type: | Interest Only | | UW Revenues: | $28,073,041 |
| Call Protection(3): | L(24),YM1(3),DorYM1(27),O(6) | | UW Expenses: | $8,814,659 |
| Lockbox / Cash Management: | Hard / Springing | | UW NOI: | $19,258,383 |
| Additional Debt(1): | Yes | | UW NCF: | $18,640,621 |
| Additional Debt Balance(1): | $127,200,000 | | Appraised Value / Per SF: | $307,750,000 / $66 |
| Additional Debt Type(1): | Pari Passu | | Appraisal Date: | Various |
| | | | | |
| Escrows and Reserves(4) | | Financial Information(1) |
| | Initial | Monthly | Initial Cap | | Cut-off Date Loan / SF: | $39 |
| Taxes: | $907,455 | $247,190 | N/A | | Maturity Date Loan / SF: | $39 |
| Insurance: | $0 | Springing | N/A | | Cut-off Date LTV: | 58.5% |
| Replacement Reserves: | $0 | $58,287 | N/A | | Maturity Date LTV: | 58.5% |
| TI/LC Reserve: | $3,000,000 | Springing | $1,830,000(5) | | UW NCF DSCR: | 1.39x |
| Immediate Repairs: | $851,224 | $0 | N/A | | UW NOI Debt Yield: | 10.7% |
| | | | | | | |
| Sources and Uses |
| Sources | Proceeds | % of Total | | Uses | Proceeds | % of Total |
| Whole Loan(1) | $180,000,000 | 100.0% | | Loan Payoff | $132,024,335 | 73.3 | % |
| | | | | Return of Equity | 33,346,195 | 18.5 | |
| | | | | Closing Costs | 9,870,791 | 5.5 | |
| | | | | Upfront Reserves | 4,758,679 | 2.6 | |
| Total Sources | $180,000,000 | 100.0% | | Total Uses | $180,000,000 | 100.0 | % |
| (1) | The ICP/IRG Holdings Portfolio Mortgage Loan (as defined below) is part of a whole loan evidenced by nine pari passu notes with an aggregate outstanding principal balance as of the Cut-off Date of $180.0 million. The financial Information in the chart above reflects the ICP/IRG Holdings Portfolio Whole Loan (as defined below). For additional information, see “The Loan” below. |
| (2) | See “The Borrowers” below for more information. |
| (3) | The ICP/IRG Holdings Portfolio Whole Loan is prepayable on or after the second anniversary of the first payment date with payment of a yield maintenance premium, if the ICP/IRG Holdings Portfolio Whole Loan is prepaid before December 1, 2027 (the “Open Prepayment Date”). Prepayment of the ICP/IRG Holdings Portfolio Whole Loan without payment of a yield maintenance premium is permitted on or after the Open Prepayment Date. Defeasance of the ICP/IRG Holdings Portfolio Whole Loan is permitted at any time after the date that is the earlier of two years after the closing date of the securitization that includes the last note to be securitized and the third anniversary of the first payment date. The assumed defeasance lockout period of 27 payments is based on the anticipated closing date of the BMO 2023-5C1 securitization trust in August 2023. The actual lockout period may be longer. |
| (4) | For a full description of Escrows and Reserves, see “Escrows and Reserves” below. |
| (5) | TI/LC Reserve Initial Cap amount of $1,830,000 excludes the initial deposit of $3,000,000. |
| (6) | 4th Most Recent NOI and 3rd Most Recent NOI are unavailable as most of the ICP/IRG Holdings Portfolio Properties (as defined below) were renovated from 2020 through 2022. |
| THE INFORMATION IN THIS STRUCTURAL AND COLLATERAL TERM SHEET IS NOT COMPLETE AND MAY BE AMENDED PRIOR TO THE TIME OF SALE. THIS TERM SHEET IS NOT AN OFFER TO SELL THESE SECURITIES AND IT IS NOT A SOLICITATION OF AN OFFER TO BUY THESE SECURITIES IN ANY JURISDICTION WHERE THE OFFER OR SALE IS NOT PERMITTED. |
| | 55 | |
| Structural and Collateral Term Sheet | | BMO 2023-5C1 |
| No. 5 – ICP/IRG Holdings Portfolio |
The Loan. The fifth largest mortgage loan (the “ICP/IRG Holdings Portfolio Mortgage Loan”) is part of a fixed rate whole loan (the “ICP/IRG Holdings Portfolio Whole Loan” secured by the borrowers’ fee interest in a 4,662,982 square foot portfolio of six industrial properties located in Ohio and Michigan and one office property located in Ohio (each, a “ICP/IRG Holdings Portfolio Property”, and collectively, the “ICP/IRG Holdings Portfolio Properties”). The ICP/IRG Holdings Portfolio Whole Loan consists of nine pari passu notes and accrues interest at a rate of 7.35000% per annum. The ICP/IRG Holdings Portfolio Whole Loan has a five-year term and is interest only for the entire term. The non-controlling Notes A-1-A-2, A-1-B-1 and A-1-B-2, with an aggregate principal balance of $52,800,000, will be included in the BMO 2023-5C1 securitization trust. The relationship between the holders of the ICP/IRG Holdings Portfolio Whole Loan is governed by a co-lender agreement as described under “Description of the Mortgage Pool—The Whole Loans” in the Preliminary Prospectus.
| Whole Loan Summary |
| Note | Original Balance | Cut-off Date Balance | | Note Holder | Controlling Piece |
| A-1-A-1 | $39,000,000 | $39,000,000 | | Benchmark 2023-V2 | Yes |
| A-1-A-2 | $8,500,000 | $8,500,000 | | BMO 2023-5C1 | No |
| A-1-B-1 | $30,000,000 | $30,000,000 | | BMO 2023-5C1 | No |
| A-1-B-2 | $14,300,000 | $14,300,000 | | BMO 2023-5C1 | No |
| A-2-A | $36,000,000 | $36,000,000 | | Benchmark 2023-V2 | No |
| A-2-B | $3,200,000 | $3,200,000 | | BANK5 2023-5YR2 | No |
| A-2-C | $25,000,000 | $25,000,000 | | BANK5 2023-5YR2 | No |
| A-2-D | $15,000,000 | $15,000,000 | | BANK5 2023-5YR2 | No |
| A-2-E | $9,000,000 | $9,000,000 | | BANK5 2023-5YR2 | No |
| Whole Loan | $180,000,000 | $180,000,000 | | | |
The Properties. The ICP/IRG Holdings Portfolio Properties consist of six industrial properties and a single-tenant office property located across four metropolitan statistical areas in Michigan and Ohio. The industrial properties are primarily comprised of multi-tenanted warehouse/distribution facilities. The ICP/IRG Holdings Portfolio Properties were constructed between 1956 and 2021 and have clear heights ranging from 19 feet to 44 feet. As of March 31, 2023, the ICP/IRG Holdings Portfolio Properties were approximately 94.2% leased to a diverse array of 22 tenants with a weighted average remaining lease term of approximately 6.4 years.
The ICP/IRG Holdings Portfolio Properties were strategically acquired by the borrower sponsors, who subsequently invested significant capital in the renovation and repositioning of the individual ICP/IRG Holdings Portfolio Properties, ultimately driving increased occupancy and rents. The ICP/IRG Holdings Portfolio Properties have benefited from approximately $57.7 million of capital expenditures, which included roof and façade replacement, modernization for multi-tenant use, LED light installation, tenant build outs, parking lot replacement and the addition of dock doors since being acquired by the borrower sponsors.
Romulus – Huron. The “Romulus - Huron Property” is a 1,112,004 square foot industrial (manufacturing/warehouse) property situated on a 156.14-acre site located in Romulus, Michigan. The clear heights of the improvements range from 19 to 44 feet and approximately 0.1% of NRA is comprised of office space. The improvements were constructed in 1956 and are currently 100.0% occupied. The borrower sponsors acquired the Romulus – Huron Property in 2015 and invested approximately $27.9 million in capital expenditures for upgrades/renovations and tenant build-outs. The Romulus - Huron Property features five grade level overhead doors, 27 dock high overhead doors and 400 open parking spaces. The largest tenant is Renaissance Global Logistics, LLC (“Renaissance”), occupying 826,604 square feet with 370,514 square feet under lease expiring on August 31, 2025, 185,870 square feet under lease expiring on October 31, 2026 and 270,220 square feet under a lease expiring on January 31, 2027.
Warren Perkins Jones. The “Warren Perkins Jones Property” is a 1,365,535 square foot industrial (warehouse/distribution) property situated on a 103.13-acre site located in Warren, Ohio. The clear heights of the improvements range from 22 to 32 feet and approximately 2.9% of NRA is comprised of office space. The improvements were constructed in 1982, renovated in 2022 and are currently 99.3% occupied. The borrower sponsors acquired the Warren Perkins Jones Property in 2019 and spent approximately $20.5 million on capital expenditures to the improvements and site. The Warren Perkins Jones Property features 6 grade level overhead doors, 78 dock high overhead doors and 300 open parking spaces. The largest tenant is The Step2 Company, LLC (“Step2”), occupying 586,000 square feet under a lease expiring in November 2030.
Cleveland American Industrial. The “Cleveland American Industrial Property” is a 1,142,265 square foot, industrial (warehouse/distribution) facility situated on a 95.37-acre site located in Cleveland, Ohio. The improvements feature 22-foot
| THE INFORMATION IN THIS STRUCTURAL AND COLLATERAL TERM SHEET IS NOT COMPLETE AND MAY BE AMENDED PRIOR TO THE TIME OF SALE. THIS TERM SHEET IS NOT AN OFFER TO SELL THESE SECURITIES AND IT IS NOT A SOLICITATION OF AN OFFER TO BUY THESE SECURITIES IN ANY JURISDICTION WHERE THE OFFER OR SALE IS NOT PERMITTED. |
| | 56 | |
| Structural and Collateral Term Sheet | | BMO 2023-5C1 |
| No. 5 – ICP/IRG Holdings Portfolio |
clear heights and approximately 26.0% of NRA is comprised of office space. The improvements were constructed in 1978, most recently renovated in 2022 and are currently 85.6% occupied. The borrower sponsors acquired the Cleveland American Industrial Property in 2014 and spent approximately $8.0 million in renovations for the various tenants. The Cleveland American Industrial Property is served by seven grade level overhead doors, 54 dock high overhead doors, three passenger elevators and 1,205 open parking spaces. The largest tenant is Graphic Packaging International, LLC, occupying 173,759 square feet, of which 23,016 square feet is occupied on a month-to-month basis and 150,743 square feet under a lease expiring on 11/30/2025.
Cleveland American Office. The “Cleveland American Office Property” is a 344,355 square foot, four-story, suburban office building situated on a 13.75-acre site located in Cleveland, Ohio. The improvements were constructed in 1978, most recently renovated in 2020 and are currently 100.0% occupied. The Cleveland American Office Property was originally constructed for American Greetings as its corporate headquarters. When the prior owner purchased the Cleveland American Office Property, it converted the industrial area into a multi-tenant industrial development. The office portion was then leased to Medical Mutual of Ohio in May 2018 via a 16-year lease. Amenities include a fitness center, full cafeteria, multiple break rooms, and outdoor eating area. The Cleveland American Office Property is served by multiple passenger elevators and 1,079 open parking spaces at 3.13 space per 1,000-square foot of net rentable area. The largest tenant is Medical Mutual of Ohio, occupying 344,355 square feet under a lease expiring in December 2035.
Miles North Randall. The “Miles North Randall Property” is a 302,400 square foot, industrial (warehouse/distribution) facility situated on a 23.44-acre site located in North Randall, Ohio. The improvements feature 36-foot clear heights and approximately 1.0% of NRA is comprised of office space. The improvements were constructed in 2021 and are currently 68.5% occupied. The borrower sponsors acquired the Miles North Randall Property in 2013 and spent roughly $21.2 million developing the Miles North Randall Property. The Miles North Randall Property features 3 grade level overhead doors, 50 dock high overhead doors and 171 surface parking spaces. The largest tenant is Pipeline Packaging Co., occupying 207,132 square feet under a lease expiring in April 2029.
Invacare. The “Invacare Property” is a 301,000 square foot, industrial (flex) facility situated on a 19.67-acre site located in Elyria, Ohio. The clear height of the improvements is 20 feet and approximately 25.4% of NRA is comprised of office space. The improvements were constructed in 1972 and renovated in 2013 and are currently 100.0% occupied. The borrower sponsors acquired the Invacare Property in 2015 and spent approximately $800,000 in repairs and buildouts. The Invacare Property features 450 open parking spaces. The sole tenant is Invacare Corporation, occupying the entire 301,000 square feet under a lease expiring in April 2028.
Stop Eight Vandalia. The “Stop Eight Vandalia Property” is a 95,423 square foot, industrial (warehouse/distribution) facility situated on a 12.43-acre site located in Vandalia, Ohio. The clear heights of the improvements range from 21 to 26 feet and approximately 18.53% of NRA is comprised of office space. The improvements were constructed in 1970, renovated in 2020 and are currently 100.0% occupied. When originally constructed, the Stop Eight Vandalia Property measured 208,230 square feet. However, after a tornado in 2019, 112,807 square feet of the improvements were razed (leaving only the foundation). Renovations completed include a new exterior wall (north elevation), new roof, new heaters, lighting and ESFR sprinkler system. The Stop Eight Vandalia Property features 3 grade level overhead doors, 6 dock high overhead doors and 127 surface parking spaces. The largest tenant is AMERI AmeriWater, LLC, occupying 65,057 square feet under a lease expiring in September 2025.
| THE INFORMATION IN THIS STRUCTURAL AND COLLATERAL TERM SHEET IS NOT COMPLETE AND MAY BE AMENDED PRIOR TO THE TIME OF SALE. THIS TERM SHEET IS NOT AN OFFER TO SELL THESE SECURITIES AND IT IS NOT A SOLICITATION OF AN OFFER TO BUY THESE SECURITIES IN ANY JURISDICTION WHERE THE OFFER OR SALE IS NOT PERMITTED. |
| | 57 | |
| Structural and Collateral Term Sheet | | BMO 2023-5C1 |
| No. 5 – ICP/IRG Holdings Portfolio |
The following table presents certain information relating to the ICP/IRG Holdings Portfolio Properties:
| Portfolio Summary |
| Property | City, State(1) | Year Built / Renovated(1) | Net Rentable Area (SF)(2) | Occupancy %(2) | Allocated Loan Amount | % of Allocated Loan Amount | Appraised Value(1) | UW NCF(2) | % of UW NCF(2) |
| Romulus – Huron | Romulus, MI | 1956 / NAP | 1,112,004 | 100.0% | $13,464,000 | 25.5 | % | $70,700,000 | $4,261,550 | 22.9 | % |
| Warren Perkins Jones | Warren, OH | 1982 / 2022 | 1,365,535 | 99.3% | $11,880,000 | 22.5 | | $60,900,000 | 4,210,462 | 22.6 | |
| Cleveland American Industrial | Cleveland, OH | 1978 / 2022 | 1,142,265 | 85.6% | $8,976,000 | 17.0 | | $65,800,000 | 4,431,158 | 23.8 | |
| Cleveland American Office | Cleveland, OH | 1978 / 2020 | 344,355 | 100.0% | $7,656,000 | 14.5 | | $46,600,000 | 2,955,777 | 15.9 | |
| Miles North Randall | North Randall, OH | 2021 / NAP | 302,400 | 68.5% | $6,864,000 | 13.0 | | $39,000,000 | 937,017 | 5.0 | |
| Invacare(3) | Elyria, OH | 1972 / 2013 | 301,000 | 100.0% | $3,168,000 | 6.0 | | $20,600,000 | 1,534,365 | 8.2 | |
| Stop Eight Vandalia | Vandalia, OH | 1970 / 2020 | 95,423 | 100.0% | $792,000 | 1.5 | | $4,150,000 | 310,292 | 1.7 | |
| Total | | | 4,662,982 | 94.2% | $52,800,000 | 100.0 | % | $307,750,000 | $18,640,621 | 100.0 | % |
| (2) | Based on the underwritten rent rolls dated March 31, 2023. |
| (3) | Invacare Corporation and two affiliated companies filed for Chapter 11 bankruptcy in January 2023 in the United States Bankruptcy Court for the Southern District of Texas. In May 2023 Invacare Corporation and such affiliated companies emerged from Chapter 11 bankruptcy. Concurrently with such emergence, Invacare Corporation executed the amended lease expiring in April 2028 (the prior lease was scheduled to expire in April 2035), requiring a base rent of approximately $1,505,000 (subject to consumer price index (“CPI”) based adjustments). UW NCF for the Invacare Property is based on the original Invacare Corporation lease, the terms of which are covered under the Payment Guaranty (as defined below), including any amounts of rental payments under the Original Invacare Corporation Lease exceeding the rental payments required under the Amended Lease. See “—Payment Guaranty” below. |
Major Tenants.
Renaissance. (826,604 square feet; 17.7% of portfolio NRA; 15.0% of portfolio underwritten base rent): Renaissance executed three triple-net leases at the Romulus - Huron Property between 2021 and 2022. Renaissance is a supply chain and logistics solution provider specializing in warehousing and value-add services. Founded in 1998 as a global export operation, Renaissance is a subsidiary of James Group International, a privately-held, minority-owned leading global provider of logistics, supply chain management and e-commerce services. In addition to Renaissance, James Group International has two other subsidiaries: Five Crowns Trucking, which offers freight transportation services to customers, and Magnolia Automotive Services, a partnership with Toyota providing subassembly, sequencing and inventory management. In 2021, James Group International was ranked as the 18th largest minority-owned business in Detroit by Crain’s Detroit Business. The current leases have expiration dates of August 31, 2025, October 31, 2026 and January 31, 2027, respectively, and have no renewal options or termination options.
Step2. (586,000 square feet; 12.6% of portfolio NRA; 10.3% of portfolio underwritten base rent): Step2 became one of four tenants at the Warren Perkins Jones Property after executing its 10.5-year lease in October 2019. Step2 is the largest American manufacturer of preschool and toddler toys and the world's largest rotational molder of plastics. Founded in 1991 with just five employees, Step2 has since grown to become an international business with over 800 full-time employees. Step2 has two large U.S. manufacturing plants in northern Ohio, one in Streetsboro and one in Perrysville. Step2 products are distributed to select retailers throughout the U.S., Canada, and over 70 other countries. The current lease expires on November 3, 2030 and has two, five-year renewal options remaining and a termination option with respect to any additionally leased Increments (as defined below).
Environmental. According to the Phase I environmental reports dated April 7, 2023 and April 10, 2023 (the “ESAs”), there are no recognized environmental conditions at the ICP/IRG Holdings Portfolio Properties. However, the applicable ESA identified a business environmental risk (“BER”) for the Invacare Property, in connection with potential soil, soil vapor and/or groundwater impacts due to historical industrial and manufacturing operations at the Invacare Property, including former plating operations and the former use of chlorinated solvents. The related environmental consultant prepared a remedial cost estimate to conduct a limited subsurface investigation to assess any subsurface impacts and perform any necessary remediation should any such action be required in the future, with a probable low estimate of $248,000 and a probable maximum estimate of $1,431,750. In addition, as a prudent practice to reduce possible risk associated with the business environmental risk, environmental insurance was obtained in the form of a $2.0 million lender’s policy from Great American E&S Insurance Company with a term of eight years (loan term plus three years). In the event of monetary default, the policy will pay the lesser of the outstanding loan balance or required cleanup costs (as required due to a release over a published legal standard). The policy also includes protection for third party bodily injury and property damage claims related to release
| THE INFORMATION IN THIS STRUCTURAL AND COLLATERAL TERM SHEET IS NOT COMPLETE AND MAY BE AMENDED PRIOR TO THE TIME OF SALE. THIS TERM SHEET IS NOT AN OFFER TO SELL THESE SECURITIES AND IT IS NOT A SOLICITATION OF AN OFFER TO BUY THESE SECURITIES IN ANY JURISDICTION WHERE THE OFFER OR SALE IS NOT PERMITTED. |
| | 58 | |
| Structural and Collateral Term Sheet | | BMO 2023-5C1 |
| No. 5 – ICP/IRG Holdings Portfolio |
of pollutants. At origination, the borrowers and the non-recourse carveout guarantor executed an environmental indemnity agreement covering the environmental covenants and related obligations under the ICP/IRG Holdings Portfolio Whole Loan documents. See “Description of the Mortgage Pool— Environmental Considerations” in the Preliminary Prospectus.
The following table presents certain information relating to the historical and current occupancy of the ICP/IRG Holdings Portfolio Properties:
| Historical and Current Occupancy(1) |
| 2020(2) | 2021(2) | 2022(3) | Current(3)(4) |
| NAV | NAV | 93.6% | 94.2% |
| (1) | As provided by the borrowers and reflects year-end occupancy for the indicated year ended December 31 unless specified otherwise. |
| (2) | Historical occupancy prior to 2022 is not available as the properties were in various stages of lease-up, renovation and re-positioning. |
| (3) | The increase in occupancy from 2022 through March 31, 2023 is attributable to significant renovations and repurposing of properties resulting in approximately 657,218 square feet of new leasing. |
| (4) | Current occupancy is as of March 31, 2023. |
Major Tenants.
The following table presents certain information relating to the largest tenants by square feet of the ICP/IRG Holdings Portfolio Properties:
| Top Tenant Summary(1) |
| Tenant | Property | Ratings
Moody’s/S&P/ Fitch(2) | Net Rentable Area (SF) | % of
Total NRA | UW Base Rent PSF(3) | UW Base Rent(3) | % of Total
UW Base Rent(3) | Lease
Expiration Date |
| Renaissance Global Logistics, LLC(4) | Romulus - Huron | NR/NR/NR | 826,604 | 17.7 | % | $3.76 | $3,106,898 | 15.0 | % | Various(4) |
| The Step2 Company, LLC(5) | Warren Perkins Jones | NR/NR/NR | 586,000 | 12.6 | | $3.62 | 2,123,470 | 10.3 | | 11/3/2030 |
| The HC Companies, Inc. | Warren Perkins Jones | A2/A/A | 413,395 | 8.9 | | $2.75 | 1,136,837 | 5.5 | | 5/31/2030 |
| Medical Mutual of Ohio | Various(6) | NR/NR/NR | 354,822 | 7.6 | | $8.79 | 3,120,282 | 15.1 | | 12/31/2035 |
| Invacare Corporation(7) | Invacare | NR/NR/NR | 301,000 | 6.5 | | $5.21 | 1,567,548 | 7.6 | | 4/30/2035(8) |
| Home Depot U.S.A., Inc. (9) | Romulus - Huron | NR/NR/NR | 285,400 | 6.1 | | $5.12 | 1,461,248 | 7.1 | | 1/31/2025 |
| Pipeline Packaging Co. | Miles North Randall | NR/NR/NR | 207,132 | 4.4 | | $6.40 | 1,325,645 | 6.4 | | 4/30/2029 |
| Hemasource, Inc. | Warren Perkins Jones | NR/NR/NR | 187,267 | 4.0 | | $4.89 | 915,736 | 4.4 | | 12/31/2033 |
| Graphic Packaging International, LLC | Cleveland American Industrial | NR/NR/NR | 173,759 | 3.7 | | $3.33 | 578,744 | 2.8 | | Various(10) |
| Berk Enterprises | Warren Perkins Jones | NR/NR/NR | 169,139 | 3.6 | | $4.64 | 784,805 | 3.8 | | 10/31/2025 |
| Total Major Tenants | | 3,504,518 | 75.2 | % | $4.60 | $16,121,213 | 77.8 | % | |
| | | | | | | | |
| Other Tenants | | 888,854 | 19.1 | | $5.16 | 4,588,323 | 22.2 | | |
| | | | | | | | |
| Occupied Collateral Total / Wtd. Avg. | 4,393,372 | 94.2 | % | $4.71 | $20,709,536 | 100.0 | % | |
| Vacant Space | | 269,610 | 5.8 | | | | | |
| | | | | | | | |
| Collateral Total | | $4,662,982 | 100.0 | % | | | | |
| | | | | | | | |
| (1) | Based on the underwritten rent rolls dated March 31, 2023. |
| (2) | In certain instances, ratings provided are those of the parent company of the entity shown, whether or not the parent company guarantees the lease. |
| (3) | UW Base Rent PSF, UW Base Rent and % of Total UW Base Rent are inclusive of contractual rent steps through April 2024. |
| (4) | Renaissance leases 370,514 square feet at the Romulus - Huron Property expiring on August 31, 2025, 185,870 square feet expiring on October 31, 2026 and 270,220 square feet expiring on January 31, 2027. |
| (5) | The Step2 Company, LLC has the option to exclusively lease additional space in increments of at least 25,000 square feet (each, an "Increment"), subject to the terms of its lease. In connection with the exercise of such option, both the landlord and tenant each have the right to terminate the lease as to all or a portion of the Increments leased to The Step2 Company, LLC upon 30 days prior written notice, and the portion of the Increments so terminated, but no other portion of the leased premises, will |
| THE INFORMATION IN THIS STRUCTURAL AND COLLATERAL TERM SHEET IS NOT COMPLETE AND MAY BE AMENDED PRIOR TO THE TIME OF SALE. THIS TERM SHEET IS NOT AN OFFER TO SELL THESE SECURITIES AND IT IS NOT A SOLICITATION OF AN OFFER TO BUY THESE SECURITIES IN ANY JURISDICTION WHERE THE OFFER OR SALE IS NOT PERMITTED. |
| | 59 | |
| Structural and Collateral Term Sheet | | BMO 2023-5C1 |
| No. 5 – ICP/IRG Holdings Portfolio |
expire on the last day of such 30 day period, provided, however, that the terminating party must terminate in increments of at least 25,000 SF of space.
| (6) | Medical Mutual of Ohio is a tenant at both the Cleveland American Office and the Cleveland American Industrial properties. |
| | (7) | Invacare Corporation and two affiliated companies filed for Chapter 11 bankruptcy in January 2023 in the United States Bankruptcy Court for the Southern District of Texas, Houston District. In May 2023 Invacare Corporation and such affiliated companies emerged from Chapter 11 bankruptcy. As of the Cut-off Date, Invacare Corporation is current with respect to all contractual rent obligations specific to the Invacare Property. Additionally, the borrower sponsors provided a Payment Guaranty of all rents due under the Invacare Corporation lease. See “—Payment Guaranty” below. |
| (8) | Invacare Corporation executed an amended lease on May 1, 2023 that, among other things, (i) reduced the term of its original lease by 7 years (from an original term expiring on April 30, 2035 to an amended term expiring on April 30, 2028) that requires a base rent of approximately $1,505,000 (subject to annual CPI based rent increases) and (ii) added a termination option with respect to a portion of its space totaling approximately 50,000 square feet with 60 days’ notice. |
| | (9) | Home Depot USA, Inc has a termination option with 30 days’ notice if it is required during the last 2 years of the lease term, by applicable legal requirements to make alterations or modifications of its premises estimated to cost in excess of $100,000. |
| | (10) | Graphic Packaging International, LLC leases 150,743 square feet at the Cleveland American Industrial Property expiring on November 30, 2025 and 23,016 square feet on month-to-month basis. |
The following table presents certain information relating to the tenant lease expirations of the ICP/IRG Holdings Portfolio Properties:
| Lease Rollover Schedule(1)(2) |
| Year | Number of Leases Expiring | Net Rentable Area Expiring | % of NRA Expiring | UW Base Rent Expiring(3) | % of UW Base Rent Expiring(3) | Cumulative Net Rentable Area Expiring | Cumulative % of NRA Expiring | Cumulative UW Base Rent Expiring(3) | Cumulative % of UW Base Rent Expiring(3) |
| Vacant | NAP | 269,610 | 5.8 | % | NAP | NA | P | 269,610 | 5.8% | | NAP | NAP | |
| MTM | 1 | 23,016 | 0.5 | | $75,262 | 0.4 | % | 292,626 | 6.3% | | $75,262 | 0.4% | |
| 2023 | 0 | 0 | 0.0 | | 0 | 0.0 | | 292,626 | 6.3% | | $75,262 | 0.4% | |
| 2024 | 2 | 184,080 | 3.9 | | 1,403,921 | 6.8 | | 476,706 | 10.2% | | $1,479,183 | 7.1% | |
| 2025 | 8 | 1,209,068 | 25.9 | | 5,051,173 | 24.4 | | 1,685,774 | 36.2% | | $6,530,356 | 31.5% | |
| 2026 | 1 | 185,870 | 4.0 | | 704,447 | 3.4 | | 1,871,644 | 40.1% | | $7,234,803 | 34.9% | |
| 2027 | 2 | 370,993 | 8.0 | | 1,491,731 | 7.2 | | 2,242,637 | 48.1% | | $8,726,534 | 42.1% | |
| 2028 | 0 | 0 | 0.0 | | 0 | 0.0 | | 2,242,637 | 48.1% | | $8,726,534 | 42.1% | |
| 2029 | 2 | 272,284 | 5.8 | | 1,648,708 | 8.0 | | 2,514,921 | 53.9% | | $10,375,242 | 50.1% | |
| 2030 | 3 | 1,066,644 | 22.9 | | 3,568,980 | 17.2 | | 3,581,565 | 76.8% | | $13,944,222 | 67.3% | |
| 2031 | 1 | 118,904 | 2.5 | | 506,052 | 2.4 | | 3,700,469 | 79.4% | | $14,450,274 | 69.8% | |
| 2032 | 1 | 38,706 | 0.8 | | 227,591 | 1.1 | | 3,739,175 | 80.2% | | $14,677,865 | 70.9% | |
| 2033 & Beyond | 5 | 923,807 | 19.8 | | 6,031,671 | 29.1 | | 4,662,982 | 100.0% | | $20,709,536 | 100.0% | �� |
| Total | 26 | 4,662,982 | 100.0 | % | $20,709,536 | 100.0 | % | | | | |
| (1) | Based on the underwritten rent rolls dated March 31, 2023. |
| (2) | Certain leases may have termination options that are exercisable prior to the originally stated expiration date of the lease and are not considered in this Lease Rollover Schedule. |
| (3) | UW Base Rent Expiring, % of UW Base Rent Expiring, Cumulative UW Base Rent Expiring and Cumulative % of UW Base Rent Expiring are inclusive of contractual rent steps through April 2024. |
| THE INFORMATION IN THIS STRUCTURAL AND COLLATERAL TERM SHEET IS NOT COMPLETE AND MAY BE AMENDED PRIOR TO THE TIME OF SALE. THIS TERM SHEET IS NOT AN OFFER TO SELL THESE SECURITIES AND IT IS NOT A SOLICITATION OF AN OFFER TO BUY THESE SECURITIES IN ANY JURISDICTION WHERE THE OFFER OR SALE IS NOT PERMITTED. |
| | 60 | |
| Structural and Collateral Term Sheet | | BMO 2023-5C1 |
| No. 5 – ICP/IRG Holdings Portfolio |
The following table presents certain information relating to the operating history and underwritten cash flows of the ICP/IRG Holdings Portfolio Properties:
| Operating History and Underwritten Net Cash Flow(1) |
| | 2022 | TTM(2) | Underwritten | Per Square Foot | %(3) |
| Base Rent(4) | $18,800,560 | $18,942,689 | $20,709,516 | $4.44 | 68.6 | % |
| Vacant Income | 0 | 0 | 1,478,785 | 0.32 | 4.9 | |
| Gross Potential Rent | $18,800,560 | $18,942,689 | $22,188,301 | $4.76 | 73.5 | % |
| Total Reimbursements | 6,528,362 | 6,623,044 | 7,818,554 | 1.68 | 25.9 | |
| Total Other Income | 102,557 | 101,667 | 201,150 | 0.04 | 0.7 | |
| Net Rental Income | $25,431,479 | $25,667,400 | $30,208,005 | $6.48 | 100.0 | % |
| (Vacancy/Credit Loss) | 0 | 0 | (2,134,964) | (0.46) | (7.1 | ) |
| Effective Gross Income | $25,431,479 | $25,667,400 | $28,073,041 | $6.02 | 92.9 | % |
| Total Expenses | 9,747,541 | 9,768,107 | 8,814,659 | 1.89 | 31.4 | |
| Net Operating Income | $15,683,939 | $15,899,293 | $19,258,383 | $4.13 | 68.6 | % |
| Total TI/LC, Capex/RR | 0 | 0 | 617,761 | 0.13 | 2.2 | |
| Net Cash Flow | $15,683,939 | $15,899,293 | $18,640,621 | $4.00 | 66.4 | % |
| (1) | Historical financials prior to 2022 are not available for the entire portfolio as the properties were in various stages of lease-up, renovation and repositioning. |
| (2) | TTM represents the trailing 12 months ending January 2023. |
| (3) | % column represents percent of Net Rental Income for all revenue lines and represents percent of Effective Gross Income for the remainder of the fields. |
| (4) | Base Rent is based on the underwritten rent rolls dated March 31, 2023. |
The Market.
The Romulus - Huron Property is located Romulus, Michigan within the Detroit-Warren-Dearborn, MI metropolitan statistical area (“Detroit MSA”). The Detroit MSA has a population of approximately 4.4 million with an average household income of $99,473 and a median household income of $69,077. The subject neighborhood is bounded by Interstate Highway 94 to the north, Eureka Road to the south, Beach Day Road to the east and Interstate Highway 275 to the west. Land uses within the subject neighborhood consist of a mixture of commercial (retail/office), industrial, airport, and residential developments. Primary access to the subject neighborhood is provided by Interstate Highway 94 and Interstate Highway 275. The commute to the Detroit central business district is approximately 20 minutes.
The Romulus - Huron Property is located in the Airport District warehouse submarket within the Detroit - MI warehouse market. The Airport District warehouse submarket consists of approximately 55.3 million square feet of inventory, with an occupancy rate of 97.8% as of the second quarter of 2022 and asking rent of $8.04 per square foot on a triple net basis.
The Warren Perkins Jones Property is located in Warren, Ohio and forms part of the Youngstown-Warren-Boardman, OH-PA metropolitan statistical area (“Youngstown MSA”), which has a population of 534,551 with an average household income of $72,724 and a median household income of $51,954. The city of Warren is situated in southwest Trumbull County, about 15 miles southwest of the Youngstown central business district ("Youngstown CBD"). Land uses within the subject neighborhood consist of a mixture of industrial and residential developments. To the east of the Warren Perkins Jones Property, along Elm Road, a Menards, a Wal-Mart and strip center known as Millennium Center were recently developed. The center includes Gamestop, Long John Silver, Five Guys, Springleaf Financial, Great Clips, Verizon Wireless and America’s Best Contacts and Eyeglasses. Regional access to the neighborhood is provided by State Route 82/State Route 5. Secondary access is provided by Elm Road NE, Mahoning Avenue NW, Austintown Warren Road, and Parkman Road NW. The commute to the Youngstown CBD is 25 minutes.
The Warren Perkins Jones Property is located in the Warren warehouse submarket within the Youngstown - OH warehouse market. As of the second quarter of 2022, the Warren warehouse submarket consists of approximately 5.8 million square feet of inventory, with an occupancy rate of 94.3% and asking rent of $4.55 per square foot on a triple-net basis.
The Cleveland American Industrial Property and the Cleveland American Office Property (“Cleveland American Properties”), the Miles North Randall Property and the Invacare Property are located within the Cleveland-Elyria, OH
| THE INFORMATION IN THIS STRUCTURAL AND COLLATERAL TERM SHEET IS NOT COMPLETE AND MAY BE AMENDED PRIOR TO THE TIME OF SALE. THIS TERM SHEET IS NOT AN OFFER TO SELL THESE SECURITIES AND IT IS NOT A SOLICITATION OF AN OFFER TO BUY THESE SECURITIES IN ANY JURISDICTION WHERE THE OFFER OR SALE IS NOT PERMITTED. |
| | 61 | |
| Structural and Collateral Term Sheet | | BMO 2023-5C1 |
| No. 5 – ICP/IRG Holdings Portfolio |
metropolitan statistical area, which has a population of 2,083,095 with an average household income of $89,612 and a median household income of $61,032. The top three industries within the area are Health Care/Social Assistance, Manufacturing and Retail Trade, which represent a combined total of 42% of the workforce. The Cleveland American Properties are located in the city of Cleveland and are situated in central Cuyahoga County, about 10 miles south of the Cleveland central business district (“Cleveland CBD”). Land use within the subject neighborhood consists of a mixture of industrial, commercial, and residential developments. Just to the north of the Cleveland American Properties is a 123,000 square foot Amazon distribution center that just recently came online. Primary access to the subject neighborhood is provided by Interstate I-71 to the north of the Cleveland American Properties that connects to the Cleveland CBD. Another access is the I-480 less than a mile to the south accessible through Tiedeman Road.
The Cleveland American Industrial Property is located in the Linndale/Westpark warehouse submarket within the Cleveland - OH warehouse market. As of the second quarter of 2022, the Linndale/Westpark warehouse submarket consists of approximately 16.0 million square feet of inventory, with an occupancy rate of 97.8% and asking rent of $5.44 per square foot on a triple net basis. The Cleveland American Office Property is located in the Southwest office submarket within the Cleveland - OH Office market. As of the second quarter of 2022, the Southwest office submarket consists of approximately 9.7 million square feet of inventory, with an occupancy rate of 93.8% and asking rent of $16.52 per square foot on a gross basis.
The Miles North Randall Property is located in the city of North Randall, a suburban location situated in southeastern Cuyahoga County, about 15 miles southeast of the Cleveland CBD. Land uses within the subject neighborhood consist of a complementary mixture of commercial and retail developments. Retail land uses are located along major commercial thoroughfares such as Northfield Road, Miles Road, Richmond Road, and Aurora Road. Growth patterns have occurred primarily along primary commercial thoroughfares such as Miles Road, Rockside Road, and Cannon Road. Significant other recent developments include a 144,000 square foot manufacturing facility for Nestle along Cannon Road, an 885,000 square foot Amazon distribution center along Miles Road, a 145,000 square foot flex building along Harvard Road, and a Townplace Suites hotel along Enterprise Parkway. Interstate 271 and U.S. Highway 422 provide primary access to the subject neighborhood. Solon Road, Cochran Road, Bainbridge Road, Som Center Road, and Cannon Road provide secondary access to the area.
The Miles North Randall Property is located in the Warrensville Hts warehouse submarket within the Cleveland - OH Warehouse market. As of the second quarter of 2022, the Warrensville Hts warehouse submarket consisted of approximately 14.0 million square feet of inventory, with an occupancy rate of 96.0% and asking rent of $5.93 per square foot on a triple net basis.
The Invacare Property is located in Elyria & North Ridgeville, a suburban location in northeast Lorain County, about 30 miles southwest of the Cleveland CBD. The subject neighborhood is bounded by Interstate I-80 to the north, Highway-10 to the south, and Black River to the west. Land uses within the subject neighborhood consist of a mixture of industrial, commercial, and residential developments. Land uses are predominantly residential supported by many shopping centers and recreational facilities. The immediate area surrounding the Invacare Property consists primarily of industrial and commercial uses on all sides. The main roads with commercial businesses and service facilities in the vicinity include Highway -10, E Broad Street and along interstate I-80. Shopping centers in the neighborhood include Elyria Shopping Center, Emerald Square, and Sheffield Village Plaza. The nearest cluster of retail and services is approximately four miles to the northwest of the Invacare Property around the junction of I-80 and Highway 57 that include Giant Eagle, Target, The Home Depot, Pet Supplies Plus, Courtyard by Marriott, Hampton Inn, and a number of restaurants like Applebee’s Girl, Olive Garden, and Golden Corral Buffet. Growth patterns in the neighborhood surrounding area have occurred along many throughfares including Center Ridge Road, Hatching Way, and E Broad Street. Many industrial, commercial, and residential developments have been constructed in the past five years including a 347,205 square foot warehouse in Center Ridge Road, 19,000 square foot industrial space on E Broad Street, 150 residential units on Hatching Way, and 17,680 square feet of storefront retail/office on Chestnut Commons Drive. Primary access to the subject neighborhood in the city of Elyria is provided by Interstate Highway I-80 to the north of the Invacare Property that traverses the neighborhood in a west-east direction and connects to the Cleveland CBD to the east with an approximate commute time of 30 minutes. Secondary access to the subject neighborhood in the city of Elyria is provided by Highway 57 to the west that traverses the neighborhood in a north-south direction.
| THE INFORMATION IN THIS STRUCTURAL AND COLLATERAL TERM SHEET IS NOT COMPLETE AND MAY BE AMENDED PRIOR TO THE TIME OF SALE. THIS TERM SHEET IS NOT AN OFFER TO SELL THESE SECURITIES AND IT IS NOT A SOLICITATION OF AN OFFER TO BUY THESE SECURITIES IN ANY JURISDICTION WHERE THE OFFER OR SALE IS NOT PERMITTED. |
| | 62 | |
| Structural and Collateral Term Sheet | | BMO 2023-5C1 |
| No. 5 – ICP/IRG Holdings Portfolio |
The Invacare Property is located in the Lorain/Avon Lake warehouse submarket within the Cleveland - OH Warehouse market. As of the second quarter of 2022, the Lorain/Avon Lake warehouse submarket consists of 29.6 million square feet of inventory, with an occupancy rate of 97.4% and asking rent of $5.11 per square foot on a triple net basis.
The Stop Eight Vandalia Property is located in Vandalia, Ohio and forms part of the Dayton, OH Metropolitan Statistical Area, which has a population of 1,216,225, with an average household income of $84,104 and a median household income of $61,342. The top three industries within the area are Manufacturing, Health Care/Social Assistance and Retail Trade, which represent a combined total of 44% of the workforce. The city of Vandalia is situated in southwest Montgomery County, about 9 miles north of the Dayton Central Business District. Land uses within the subject neighbourhood consists of commercial, industrial and residential developments. The Dayton International Airport is located approximately 5 miles northeast of Stop Eight Road. The Interstate 70 and 75 intersection is in close proximity, just north of the Stop Eight Vandalia Property. The immediate area surrounding the Stop Eight Vandalia Property consists of primarily of industrial and commercial development along Poe Avenue, Image, Space Drives, Stope Eight and Homestretch Road. Retail and office growth patterns have occurred along primary commercial thoroughfares such as W. National Road, Poe Avenue, Miller Avenue, Dixie Drive and Browns School Road. There is a significant amount of commercial development near the I-75 interchange with National Road. Primary access is provided by Interstate 75 and Interstate 70. Primary north/south routes include Dixie Drive, Brown School Road and Webster Street. East/west routes include National Road and Old Springfield Road. The commute to the Dayton Central Business District is about ten minutes, compared with the commute to Xenia, which is about a 30-minute drive. The James M. Cox Dayton International Airport is four miles to the northwest from the Stop Eight Vandalia Property.
The Stop Eight Vandalia Property is located in the North Dayton Warehouse submarket within the Dayton - OH warehouse market. As of the second quarter of 2022, the North Dayton submarket consists of approximately 49.8 million square feet of inventory, with an occupancy rate of 94.7% and asking rent of $4.96 per square foot on a triple net basis.
The following table presents certain market information with respect to the ICP/IRG Holdings Portfolio Properties:
| Market Area Summary(1) |
| Property Name | Market | Submarket | Submarket Vacancy | UW Base Rent PSF(2) | Market Rental Rate PSF |
| Romulus - Huron | Detroit - MI Warehouse | Airport District Warehouse | 2.20% | $4.11 | $8.15 | |
| Warren Perkins Jones | Youngstown - OH Warehouse | Warren Warehouse | 5.70% | $3.63 | $4.64 | |
| Cleveland American Industrial | Cleveland - OH Warehouse | Linndale/Westpark Warehouse | 2.20% | $4.29 | $5.66 | |
| Cleveland American Office | Cleveland - OH Office | Southwest Office | 6.20% | $8.95 | $19.18 | |
| Miles North Randall | Cleveland - OH Warehouse | Warrensville Hts Warehouse | 4.00% | $4.38 | $5.66 | |
| Invacare | Cleveland - OH Warehouse | Lorain/Avon Lake Warehouse | 2.60% | $5.21 | $5.66 | |
| Stop Eight Vandalia | Dayton - OH Warehouse | North Dayton Warehouse | 5.30% | $3.25 | $5.38 | |
| (1) | Source: Appraisal. Data as of the second quarter of 2022. |
| (2) | UW Base Rent PSF are updated per underwritten rent rolls dated March 31, 2023. |
The Borrowers. The borrowers are Holdings Cleveland American, LLC, Cleveland American, LLC, Miles North Randall, LLC, ICP Miles North Randall LLC, Stop Eight Vandalia LLC, SL Stop Eight Vandalia LLC, ICP Stop Eight Vandalia LLC, Holdings Warren Perkins Jones, LLC, ICP Warren Perkins Jones LLC, Holdings Romulus, LLC, Romulus Huron River Drive LLC, Elyria 1200 Taylor, LLC and ICP Elyria Taylor 1200 LLC (collectively, the “ICP/IRG Holdings Portfolio Borrowers”), each a Delaware limited liability company and single purpose entity with one independent director. Each ICP/IRG Holdings Portfolio Borrower owns one individual ICP/IRG Holdings Portfolio Property except Holdings Cleveland American, LLC, which owns both Cleveland American Properties. Legal counsel to the ICP/IRG Holdings Portfolio Borrowers delivered a non-consolidation opinion in connection with the origination of the ICP/IRG Holdings Portfolio Whole Loan.
The Borrower Sponsors. The borrower sponsors are Industrial Commercial Properties (“ICP”) and Industrial Realty Group (“IRG”), which is the affiliated management company for the guarantors’ investments. ICP is a real estate development company headquartered in Cleveland, Ohio, specializing in commercial and industrial rehabilitation, build-to-suits and economic redevelopment. ICP currently owns over 46.5 million square feet of industrial, office and commercial space. ICP was founded in 1996 and is led by Northeast Ohio native, Christopher Semarjian. IRG, through its affiliated partnerships and limited liability companies, operates a portfolio containing over 150 properties in 31 states with over 100.0 million square feet of rentable space. IRG provides specific emphasis in the development and management of large complicated mixed-use projects.
| THE INFORMATION IN THIS STRUCTURAL AND COLLATERAL TERM SHEET IS NOT COMPLETE AND MAY BE AMENDED PRIOR TO THE TIME OF SALE. THIS TERM SHEET IS NOT AN OFFER TO SELL THESE SECURITIES AND IT IS NOT A SOLICITATION OF AN OFFER TO BUY THESE SECURITIES IN ANY JURISDICTION WHERE THE OFFER OR SALE IS NOT PERMITTED. |
| | 63 | |
| Structural and Collateral Term Sheet | | BMO 2023-5C1 |
| No. 5 – ICP/IRG Holdings Portfolio |
The non-recourse carveout guarantors of the ICP/IRG Holdings Portfolio Whole Loan are Holdings Ohio, LLC and Christopher Semarjian.
Property Management. The ICP/IRG Holdings Portfolio Properties are managed by IRG Realty Advisors, LLC, an affiliate of the borrower sponsors.
Escrows and Reserves. At origination, the ICP/IRG Holdings Portfolio Borrowers deposited (i) $907,455 for real estate taxes, (ii) $3,000,000 for tenant improvements and leasing commissions and (iii) $851,224 for required repairs.
Tax Escrows – On a monthly basis, the ICP/IRG Holdings Portfolio Borrowers are required to deposit 1/12th of an amount which would be sufficient to pay taxes for the next ensuing 12 months (currently equivalent to approximately $247,190 a month).
Insurance Escrows – On a monthly basis, the ICP/IRG Holdings Portfolio Borrowers are required to deposit 1/12th of an amount which would be sufficient to pay insurance premiums for the renewal of coverages; provided, that such monthly deposits will be waived so long as the ICP/IRG Holdings Portfolio Borrowers maintain a blanket insurance policy in accordance with the ICP/IRG Holdings Portfolio Loan documents and no event of default under the ICP/IRG Holdings Portfolio Loan documents is continuing.
Replacement Reserve – On a monthly basis, the ICP/IRG Holdings Portfolio Borrowers are required to deposit $58,287 for replacement reserves.
TI/LC Reserve – Upon the occurrence and during the continuance of a Cash Sweep Event (as defined below), the ICP/IRG Holdings Portfolio Borrowers are required to deposit $116,575 on each payment date into a TI/LC reserve, subject to a cap of $1,830,000, excluding the initial deposit of $3,000,000.
Lockbox / Cash Management. The ICP/IRG Holdings Portfolio Whole Loan is structured with a hard lockbox and springing cash management. Revenues from the ICP/IRG Holdings Portfolio Properties are required to be deposited directly into the lockbox account or, if received by the ICP/IRG Holdings Portfolio Borrowers or the property manager, deposited within one business day of receipt. During the continuance of a Cash Sweep Event, all funds in the lockbox account are required to be swept each business day to a lender-controlled cash management account and disbursed in accordance with the ICP/IRG Holdings Portfolio Whole Loan documents, and all excess funds on deposit in the cash management account (after payment of required monthly reserve deposits, debt service payment on the ICP/IRG Holdings Portfolio Whole Loan, operating expenses and cash management bank fees) will be paid to the lender, which will be held by the lender as additional security for the ICP/IRG Holdings Portfolio Whole Loan. Upon the occurrence of a Cash Sweep Event cure, all excess cash flow reserve funds will be deposited into the cash management account to be disbursed in accordance with the cash management agreement. Any excess cash flow reserve funds remaining after the debt has been paid in full or the loan has been defeased will be paid to the ICP/IRG Holdings Portfolio Borrowers.
A “Cash Sweep Event” means the occurrence of: (a) an event of default; (b) any bankruptcy or insolvency action of an individual borrower or property manager; (c) a debt service coverage ratio based on the trailing three month period immediately preceding the date of such determination decreasing to less than 1.10x; or (d) the commencement of a Lease Sweep Period (as defined below).
A Cash Sweep Event may be cured upon the occurrence of the following: (i) with respect to clause (a) above, the acceptance by the lender of a cure of such event of default in accordance with the ICP/IRG Holdings Portfolio Whole Loan documents, (ii) with respect to clause (b) above solely with respect to the property manager, if the applicable individual borrower replaces such property manager with a “Qualified Manager” (as fully described in the ICP/IRG Holdings Portfolio Whole Loan documents) under a replacement management agreement acceptable to the lender within 60 days, (iii) with respect to clause (c) above, (x) if the debt service coverage ratio based on the trailing three month period immediately preceding the date of such determination for one calendar quarter is not less than 1.10x or (y) the borrowers deliver to the lender cash or a letter of credit in an amount which, when applied to the outstanding principal balance of the ICP/IRG Holdings Portfolio Whole Loan, would be sufficient to achieve the applicable debt service coverage ratio required under the ICP/IRG Holdings Portfolio Whole Loan documents, or (iv) with respect to clause (d) above, the Lease Sweep Period has ended; provided, however, (A) no event of default has occurred and is continuing under the ICP/IRG Holdings Portfolio Whole Loan documents, (B) the borrowers have paid all of the lender’s reasonable expenses incurred in connection with such Cash Sweep Event cure including reasonable attorney’s fees and expenses, and (C) in no event may the borrowers cure a Cash Sweep Event caused by a bankruptcy action caused by any of the borrowers filing a voluntary petition or arising from a
| THE INFORMATION IN THIS STRUCTURAL AND COLLATERAL TERM SHEET IS NOT COMPLETE AND MAY BE AMENDED PRIOR TO THE TIME OF SALE. THIS TERM SHEET IS NOT AN OFFER TO SELL THESE SECURITIES AND IT IS NOT A SOLICITATION OF AN OFFER TO BUY THESE SECURITIES IN ANY JURISDICTION WHERE THE OFFER OR SALE IS NOT PERMITTED. |
| | 64 | |
| Structural and Collateral Term Sheet | | BMO 2023-5C1 |
| No. 5 – ICP/IRG Holdings Portfolio |
person filing an involuntary petition against any of the borrowers and any such borrower has colluded with or otherwise assisted such person with the involuntary petition against the applicable borrower.
A “Lease Sweep Period” (a) will commence on the first payment date following the occurrence of any of the following: (i) with respect to the lease for Medical Mutual of Ohio, the largest tenant by underwritten base rent, or its replacement, as more fully described in the ICP/IRG Holdings Portfolio Whole Loan documents (each such lease, a “Lease Sweep Lease”), the earlier to occur of: (A) twelve months prior to the earliest stated expiration (including the stated expiration of any renewal term) of a Lease Sweep Lease; or (B) upon the date required under a Lease Sweep Lease by which the tenant thereunder is required to give notice of its exercise of a renewal option thereunder (and such renewal has not been so exercised); (ii) the date that a Lease Sweep Lease (or any material portion thereof) is surrendered, cancelled or terminated prior to its then current expiration date or the receipt by the ICP/IRG Holdings Portfolio borrowers or property manager of notice from any tenant under a Lease Sweep Lease of its intent to surrender, cancel or terminate the Lease Sweep Lease (or any material portion thereof prior to its then current expiration date); (iii) the date that any tenant under a Lease Sweep Lease discontinues its business (i.e., “goes dark”) at its premises, (the “Lease Sweep Space”) at the applicable individual ICP/IRG Holdings Portfolio Property (or any material portion thereof) or gives notice that it intends to discontinue its business at its Lease Sweep Space at the applicable individual ICP/IRG Holdings Portfolio Property (or any material portion thereof); (iv) upon a default under a Lease Sweep Lease by the tenant thereunder that continues beyond any applicable notice and cure period; or (v) the occurrence of a bankruptcy or insolvency of any tenant or its direct or indirect parent company; and (b) will end upon the first to occur of the following: (i) in the case of clauses (a)(i), (a)(ii), and (a)(iii) above, the entirety of the Lease Sweep Space (or applicable portion thereof) is leased pursuant to an acceptable replacement lease and, in lender’s judgment, sufficient funds have been accumulated in the lease sweep reserve account (during the continuance of the subject Lease Sweep Period) to cover all anticipated approved Lease Sweep Space leasing expenses, free rent periods, and/or rent abatement periods set forth in such acceptable replacement lease and any shortfalls in required payments under the ICP/IRG Holdings Portfolio Whole Loan documents or operating expenses as a result of any anticipated down time prior to the commencement of payments under such acceptable replacement lease; (ii) in the case of clause (a)(i) above, the date on which the subject tenant under the Lease Sweep Lease irrevocably exercises its renewal or extension option with respect to all of its Lease Sweep Space, and in the lender’s judgment, sufficient funds have been accumulated in the lease sweep reserve account (during the continuance of the subject Lease Sweep Period) to cover all anticipated approved Lease Sweep Space leasing expenses, free rent periods and/or rent abatement periods in connection with such renewal or extension; (iii) in the case of clause (a)(iv) above, the date on which the subject default has been cured, and no other default under such Lease Sweep Lease occurs for a period of six (6) consecutive months following such cure; and (iv) in the case of clause (i)(v) above, either (a) the applicable bankruptcy or insolvency proceeding has terminated and the applicable Lease Sweep Lease has been affirmed, assumed or assigned in a manner reasonably satisfactory to the lender or (b) the applicable Lease Sweep Lease has been assumed and assigned to a third party in a manner reasonably satisfactory to the lender.
Subordinate Debt. None.
Mezzanine Debt. None.
Partial Release. From and after a Payment Guaranty Release Event (as defined below) (but only after the permitted prepayment date or the permitted defeasance date, as applicable), if the ICP/IRG Holdings Portfolio Borrowers may elect to defease, or at the ICP/IRG Holdings Portfolio Borrowers’ election prepay, a portion of the ICP/IRG Holdings Portfolio Whole Loan in connection with the release of an individual ICP/IRG Holdings Portfolio Property and the requirements of the ICP/IRG Holdings Portfolio Property Loan documents have been satisfied, including, without limitation, the payment of any yield maintenance premium, and provided that no event of default or Cash Sweep Event is continuing, the ICP/IRG Holdings Portfolio Borrowers may obtain the release of an individual ICP/IRG Holdings Portfolio Property upon the satisfaction of certain conditions, including, but not limited to, the following: (i) the amount of the outstanding principal balance of the ICP/IRG Holdings Portfolio Whole Loan to be defeased or prepaid equals or exceeds 115% of the loan amount allocated to the ICP/IRG Holdings Portfolio Individual Property being released, (ii) subsequent to such release, each borrower continues to be a special purpose entity pursuant to, and in accordance with, the ICP/IRG Holdings Portfolio Whole Loan documents, (iii) the borrowers deliver an insolvency opinion, (iv) the borrowers deliver a rating agency confirmation, (v) after giving effect to the release of the applicable individual ICP/IRG Holdings Portfolio Property, the debt service coverage ratio for the ICP/IRG Holdings Portfolio Properties then remaining subject to the liens of the mortgages based on the trailing twelve (12) month period immediately preceding the release of the applicable individual ICP/IRG Holdings Portfolio Property are equal to or greater than the greater of (i) 1.31x and (ii) the debt service coverage ratio for all of the ICP/IRG Holdings Portfolio Properties then remaining subject to the liens of the mortgages (including the individual ICP/IRG Holdings Portfolio Property
| THE INFORMATION IN THIS STRUCTURAL AND COLLATERAL TERM SHEET IS NOT COMPLETE AND MAY BE AMENDED PRIOR TO THE TIME OF SALE. THIS TERM SHEET IS NOT AN OFFER TO SELL THESE SECURITIES AND IT IS NOT A SOLICITATION OF AN OFFER TO BUY THESE SECURITIES IN ANY JURISDICTION WHERE THE OFFER OR SALE IS NOT PERMITTED. |
| | 65 | |
| Structural and Collateral Term Sheet | | BMO 2023-5C1 |
| No. 5 – ICP/IRG Holdings Portfolio |
requested to be released) immediately preceding the release of the applicable individual ICP/IRG Holdings Portfolio Property; (B) if the loan is included in a REMIC Trust and the loan-to-value exceeds or would exceed 125% immediately after the release of the applicable individual ICP/IRG Holdings Portfolio Property, no release will be permitted unless the principal balance of the ICP/IRG Holdings Portfolio Whole Loan is prepaid by an amount not less than the greater of (i) the adjusted release amount or (ii) the least of one (1) of the following amounts: (A) only if the released individual ICP/IRG Holdings Portfolio Property is sold, the net proceeds of an arm’s length sale of the released individual property to an unrelated person, (B) the fair market value of the released individual ICP/IRG Holdings Portfolio Property at the time of the release, or (C) an amount such that the loan-to-value ratio (as so determined by lender) after the release of the applicable individual ICP/IRG Holdings Portfolio Property is not greater than the loan-to-value ratio of the ICP/IRG Holdings Portfolio Properties immediately prior to such release, unless lender receives an opinion of counsel that, if (ii) is not followed, the securitization will not fail to maintain its status as a REMIC Trust as a result of the release of the applicable individual ICP/IRG Holdings Portfolio Property.
Releases of Release Parcels. Upon the request of ICP/IRG Holdings Portfolio Borrowers, the ICP/IRG Holdings Portfolio Borrowers may obtain the release of certain specified non-income producing release parcels without any required prepayment, defeasance, prepayment fee, yield maintenance premium or otherwise upon the satisfaction of certain conditions, including, but not limited to, satisfaction of customary REMIC requirements.
Ground Lease. None.
Terrorism Insurance. The ICP/IRG Holdings Portfolio Borrowers are required to maintain terrorism insurance in an amount equal to the full replacement cost of the ICP/IRG Holdings Portfolio individual properties plus the cost of rental loss and/or business interruption coverage. For so long as TRIPRA is in effect and continues to cover both foreign and domestic acts, the lender must accept terrorism insurance with coverage against acts which are “certified” within the meaning of TRIPRA.
Payment Guaranty. In January 2023, Invacare Corporation reportedly commenced voluntary Chapter 11 bankruptcy proceedings in the United States Bankruptcy Court for the Southern District of Texas. Concurrently, Invacare Corporation reportedly entered into a Restructuring Support Agreement (the “RSA”) with substantially all of its debt holders, including its term loan lender, all of the holders of convertible senior secured notes and holders of a majority of its convertible senior unsecured notes. According to reports, the terms of the RSA will be implemented through its proposed plan of reorganization, which was filed with the court. Subsequently, in May 2023, Invacare Corporation successfully emerged from Chapter 11 bankruptcy and concurrently executed an amended and restated lease with the borrowers with an initial lease term expiring in April 2028 and base annual rent equal to approximately $1,505,000 (subject to CPI based adjustments) (the “Amended Lease”). Additionally, in connection with the Amended Lease, Invacare has the option to terminate its lease with respect to 50,000 SF (accounting for approximately 16.6% of base rent under the terms of the Amended Lease) with 60 days’ notice.
In connection with the foregoing and simultaneously with loan origination, Holdings Ohio, LLC and Christopher Semarjian (together with Holdings Ohio, LLC the “Payment Guarantor”) provided a payment guaranty of all rents due under the terms of the original Invacare Corporation lease (expiring on April 2035 and having an annual base rent in the amount of $1,567,548) (the “Original Invacare Corporation Lease”) on a joint and several basis (the “Payment Guaranty”). The Payment Guarantor is personally liable for all rents due under the Original Invacare Corporation Lease, including any amount of rental payments under the Original Invacare Corporation Lease exceeding the rental payments required under the amended lease, in the amount of up to 10% of the outstanding principal balance of the ICP/IRG Holdings Portfolio Whole Loan, plus all related reasonable costs and expenses incurred by the lender (including reasonable attorneys’ fees and expenses). The obligations under the Payment Guaranty will terminate on the earlier of (i) the indefeasible payment in full of the debt in accordance with the ICP/IRG Holdings Portfolio Whole Loan documents, (ii) full and complete payment and performance of the guaranteed obligations and (iii) a Payment Guaranty Release Event (as defined below). See “Description of the Mortgage Pool—Statistical Characteristics of the Mortgage Loans—Property Types—Industrial Properties” and “Description of the Mortgage Pool—Certain Terms of the Mortgage Loans—Single-Purpose Entity Covenants” in the Preliminary Prospectus for additional information.
A “Payment Guaranty Release Event” will occur, provided no event of default or Cash Sweep Event has occurred and is continuing, upon (a) the debt service coverage ratio based on the trailing three (3) month period immediately preceding the date of such determination is equal to or greater than 1.30x and (b) (i) court approval of the Invacare Corporation’s assumption of the lease, either through a separate court order or confirmation of the Invacare Corporation’s plan of
| THE INFORMATION IN THIS STRUCTURAL AND COLLATERAL TERM SHEET IS NOT COMPLETE AND MAY BE AMENDED PRIOR TO THE TIME OF SALE. THIS TERM SHEET IS NOT AN OFFER TO SELL THESE SECURITIES AND IT IS NOT A SOLICITATION OF AN OFFER TO BUY THESE SECURITIES IN ANY JURISDICTION WHERE THE OFFER OR SALE IS NOT PERMITTED. |
| | 66 | |
| Structural and Collateral Term Sheet | | BMO 2023-5C1 |
| No. 5 – ICP/IRG Holdings Portfolio |
reorganization, or (ii) in the event that the Invacare Corporation’s lease is rejected, an acceptable replacement lease is entered into and the tenant under the acceptable replacement lease is in occupancy and paying full unabated rent and there are no outstanding obligations with respect to such lease or such obligations have been reserved with lender.
| THE INFORMATION IN THIS STRUCTURAL AND COLLATERAL TERM SHEET IS NOT COMPLETE AND MAY BE AMENDED PRIOR TO THE TIME OF SALE. THIS TERM SHEET IS NOT AN OFFER TO SELL THESE SECURITIES AND IT IS NOT A SOLICITATION OF AN OFFER TO BUY THESE SECURITIES IN ANY JURISDICTION WHERE THE OFFER OR SALE IS NOT PERMITTED. |
| | 67 | |
| Structural and Collateral Term Sheet | | BMO 2023-5C1 |
| No. 6 – California High Tech Logistics |
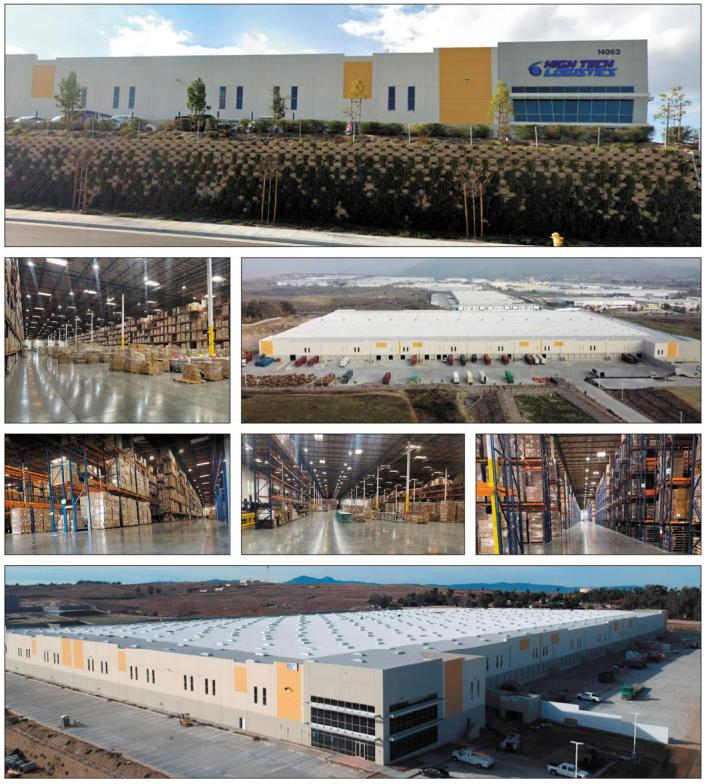
| THE INFORMATION IN THIS STRUCTURAL AND COLLATERAL TERM SHEET IS NOT COMPLETE AND MAY BE AMENDED PRIOR TO THE TIME OF SALE. THIS TERM SHEET IS NOT AN OFFER TO SELL THESE SECURITIES AND IT IS NOT A SOLICITATION OF AN OFFER TO BUY THESE SECURITIES IN ANY JURISDICTION WHERE THE OFFER OR SALE IS NOT PERMITTED. |
| | 68 | |
| Structural and Collateral Term Sheet | | BMO 2023-5C1 |
| No. 6 – California High Tech Logistics |
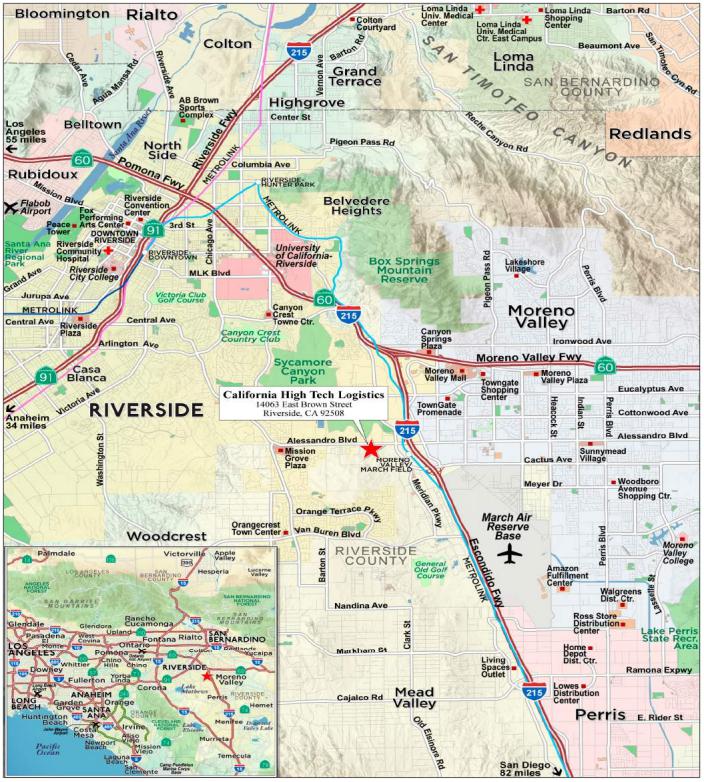
| THE INFORMATION IN THIS STRUCTURAL AND COLLATERAL TERM SHEET IS NOT COMPLETE AND MAY BE AMENDED PRIOR TO THE TIME OF SALE. THIS TERM SHEET IS NOT AN OFFER TO SELL THESE SECURITIES AND IT IS NOT A SOLICITATION OF AN OFFER TO BUY THESE SECURITIES IN ANY JURISDICTION WHERE THE OFFER OR SALE IS NOT PERMITTED. |
| | 69 | |
| Structural and Collateral Term Sheet | | BMO 2023-5C1 |
| No. 6 – California High Tech Logistics |
| Mortgage Loan Information | | Property Information |
| Mortgage Loan Seller: | SGFC | | Single Asset / Portfolio: | Single Asset |
| Original Principal Balance(1): | $52,000,000 | | Title: | Fee |
| Cut-off Date Principal Balance(1): | $52,000,000 | | Property Type – Subtype: | Industrial - Warehouse/Distribution |
| % of IPB: | 6.8% | | Net Rentable Area (SF): | 596,090 |
| Loan Purpose: | Acquisition | | Location: | Riverside, CA |
| Borrower: | Brown Street Acquisitions LLC | | Year Built / Renovated: | 2019 / NAP |
| Borrower Sponsors: | Moshe Kupferstein, Devi Alfaks, Edward Alfaks, Morris Alfaks, Dib Chaaya and Salim Mann | | Occupancy: | 100.0% |
| Interest Rate: | 8.12200% | | Occupancy Date: | 8/1/2023 |
| Note Date: | 3/31/2023 | | 4th Most Recent NOI (As of)(4): | NAV |
| Maturity Date: | 4/1/2028 | | 3rd Most Recent NOI (As of)(4): | NAV |
| Interest-only Period: | 60 months | | 2nd Most Recent NOI (As of)(4): | NAV |
| Original Term: | 60 months | | Most Recent NOI (As of)(4): | NAV |
| Original Amortization Term: | None | | UW Economic Occupancy: | 95.0% |
| Amortization Type: | Interest Only | | UW Revenues: | $9,291,231 |
| Call Protection: | L(12),YM(41),O(7) | | UW Expenses: | $1,434,983 |
| Lockbox / Cash Management: | Springing / Springing | | UW NOI: | $7,856,248 |
| Additional Debt(1): | Yes | | UW NCF: | $7,677,421 |
| Additional Debt Balance(1): | $18,000,000 / $10,000,000 | | Appraised Value / Per SF: | $161,200,000 / $270 |
| Additional Debt Type(1)(2): | Pari Passu / Mezzanine | | Appraisal Date: | 1/4/2023 |
| | | | | |
| Escrows and Reserves(3) | | Financial Information(1) |
| | Initial | Monthly | Initial Cap | | | Whole Loan | Total Debt |
| Taxes: | $88,186 | $88,186 | N/A | | Cut-off Date Loan / SF: | $117 | | $134 |
| Insurance: | $22,717 | $11,359 | N/A | | Maturity Date Loan / SF: | $117 | | $134 |
| Replacement Reserves: | $0 | $4,967 | N/A | | Cut-off Date LTV: | 43.4% | | 49.6% |
| TI/LC: | $0 | Springing | N/A | | Maturity Date LTV: | 43.4% | | 49.6% |
| Lease Security Deposit: | $800,000 | $0 | N/A | | UW NCF DSCR: | 1.33x | | 1.13x |
| | | | | | UW NOI Debt Yield: | 11.2% | | 9.8% |
| | | | | | | |
| Sources and Uses |
| Sources | Proceeds | % of Tota | l | | Uses | Proceeds | % of Total | |
| Mortgage Loan | $70,000,000 | 86.5 | % | | Purchase Price | $78,028,181 | 96.4 | % |
| Mezzanine Loan | 10,000,000 | 12.4 | | | Closing Costs | 1,987,711 | 2.5 | |
| Borrower Sponsor Equity | 926,795 | 1.1 | | | Reserves | 910,903 | 1.1 | |
| Total Sources | $80,926,795 | 100.0 | % | | Total Uses | $80,926,795 | 100.0 | % |
| (1) | The California High Tech Logistics Mortgage Loan (as defined below) is part of a whole loan evidenced by four pari passu notes with an aggregate original principal balance as of the Cut-off Date of $70.0 million (the “California High Tech Logistics Whole Loan”). The financial information presented in the chart above reflects the Cut-off Date balance of the California High Tech Logistics Whole Loan and the total debt inclusive of a $10.0 million mezzanine loan. |
| (2) | For a full description, see “Mezzanine Debt” below. |
| (3) | For a full description of Escrows and Reserves, please refer to “Escrows and Reserves” below. |
| (4) | Historical NOI is unavailable as the California High Tech Logistics Property (as defined below) was acquired by the borrower at the origination of the California High Tech Logistics Whole Loan, and the prior owner did not provide such information. |
The Loan. The sixth largest mortgage loan (the “California High Tech Logistics Mortgage Loan”) is part of a fixed rate whole loan secured by the borrower’s fee simple interest in a 596,090 square foot industrial property located in Riverside, California (the “California High Tech Logistics Property”). The California High Tech Logistics Whole Loan consists of four pari passu notes and accrues interest at a rate of 8.12200% per annum. The California High Tech Logistics Whole Loan has a five-year term and is interest-only for the term of the loan. The controlling Note A-1 and non-controlling Note A-2, with an original aggregate principal balance of $52,000,000, will be included in the BMO 2023-5C1 securitization trust. The remaining non-controlling Note A-3 and Note A-4 with an aggregate original principal balance of $18,000,000, are expected to be contributed to one or more securitization trust(s). The California High Tech Logistics Whole Loan will be serviced pursuant to the pooling and servicing agreement for the BMO 2023-5C1 securitization trust. See “Description of the Mortgage Pool—The Whole Loans—The Serviced Pari Passu Whole Loans” and “Pooling and Servicing Agreement” in the Preliminary Prospectus.
| THE INFORMATION IN THIS STRUCTURAL AND COLLATERAL TERM SHEET IS NOT COMPLETE AND MAY BE AMENDED PRIOR TO THE TIME OF SALE. THIS TERM SHEET IS NOT AN OFFER TO SELL THESE SECURITIES AND IT IS NOT A SOLICITATION OF AN OFFER TO BUY THESE SECURITIES IN ANY JURISDICTION WHERE THE OFFER OR SALE IS NOT PERMITTED. |
| | 70 | |
| Structural and Collateral Term Sheet | | BMO 2023-5C1 |
| No. 6 – California High Tech Logistics |
| Whole Loan Summary |
| Note | Original Balance | Cut-off Date Balance | Note Holder | Controlling Piece |
| A-1 | $38,000,000 | | $38,000,000 | | BMO 2023-5C1 | Yes |
| A-2 | $14,000,000 | | $14,000,000 | | BMO 2023-5C1 | No |
| A-3(1) | $13,000,000 | | $13,000,000 | | SGFC | No |
| A-4(1) | $5,000,000 | | $5,000,000 | | SGFC | No |
| Whole Loan | $70,000,000 | | $70,000,000 | | | |
| (1) | Expected to be contributed to one or more securitizations. |
The Property. The California High Tech Logistics Property is a 596,090 square foot, single-story class A industrial building situated on approximately 35.730-acres in Riverside, California. Built in 2019, the California High Tech Logistics Property is solely occupied by High Tech Logistics (“HTL”), an affiliate of the borrower sponsors. The California High Tech Logistics Property features 36-foot clear ceiling heights, 95 loading docks and 4 drive-in doors. The California High Tech Logistics Property also features 10,000 square feet (approximately 1.68% of the net rentable area) of office space. Parking is provided via 273 surface auto parking spaces resulting in a parking ratio of approximately 0.46 spaces per 1,000 square feet. In addition, there are 98 trailer parking spaces on the site. The California High Tech Logistics Property is currently used for warehouse space.
Sole Tenant. High Tech Logistics (596,090 square feet; 100% of NRA; 100% of underwritten base rent): HTL is a third-party logistics service with 22 years of experience which provides services through three primary channels: container pickup, special projects and trucking services. The container pickup channel has a fleet of trucks and trucking equipment that serve the Los Angeles and Long Beach Harbor areas. The special projects channel provides services for clients including item inspections, price ticketing, hanging, assorting, repacking and product labeling, while the trucking services channel makes deliveries to the Central California area. HTL has 150 employees and occupies 800,000 square feet of warehouse space across multiple locations throughout Southern California. HTL services clients such as Kohl’s, Walmart, TJ Maxx, Marshalls, HomeGoods, Burlington and Amazon. At origination, an affiliate of High Tech Logistics, LLC, Riverside Brown Street Tenant LLC (the “Riverside Brown Street”), entered into a new 20-year lease with no termination or contraction options. Additionally, HTL executed a lease guaranty and deposited $800,000 into a lease security reserve to serve as additional security for the lease.
Environmental. According to the Phase I environmental assessment dated January 4, 2023, there was no evidence of any recognized environmental conditions at the California High Tech Logistics Property.
The following table presents certain information relating to the historical and current occupancy of the California High Tech Logistics Property:
| Historical and Current Occupancy |
| 2020(1) | 2021(1) | 2022(1) | Current(2) |
| 100.0% | 100.0% | 100.0% | 100.0% |
| (1) | Historical Occupancies are based on the sole tenant being in occupancy at the California High Tech Logistics Property since 2019 and are as of December 31 of each respective year. |
| (2) | Current Occupancy is as of August 1, 2023. |
| THE INFORMATION IN THIS STRUCTURAL AND COLLATERAL TERM SHEET IS NOT COMPLETE AND MAY BE AMENDED PRIOR TO THE TIME OF SALE. THIS TERM SHEET IS NOT AN OFFER TO SELL THESE SECURITIES AND IT IS NOT A SOLICITATION OF AN OFFER TO BUY THESE SECURITIES IN ANY JURISDICTION WHERE THE OFFER OR SALE IS NOT PERMITTED. |
| | 71 | |
| Structural and Collateral Term Sheet | | BMO 2023-5C1 |
| No. 6 – California High Tech Logistics |
The following table presents certain information relating to the largest tenant at of the California High Tech Logistics Property:
| Tenant Summary(1) |
| Tenant | Ratings
Moody’s/S&P/Fitch | Net Rentable Area (SF) | % of
Total NRA | UW Base Rent PSF | UW Base Rent(2) | % of Total
UW Base Rent | Lease
Expiration Date |
| High Tech Logistics | NR/NR/NR | 596,090 | 100.0% | | $14.00 | $8,345,260 | 100.0% | 03/31/2043 |
| Occupied Collateral Total / Wtd. Avg. | | 596,090 | 100.0% | | $14.00 | $8,345,260 | 100.0% | |
| | | | | | | | |
| Vacant Space | | 0 | 0.0% | | | | | |
| | | | | | | | |
| Collateral Total | | 596,090 | 100.0% | | | | | |
| | | | | | | | |
| (1) | Based on the underwritten rent roll dated March 22, 2023. |
| (2) | The base rent will increase by 10% every five years with the next rent step beginning on April 1, 2028. |
The following table presents certain information relating to the tenant lease expiration of the California High Tech Logistics Property:
Lease Rollover Schedule(1) |
| Year | Number of Leases Expiring | Net Rentable Area Expiring | % of NRA Expiring | UW Base Rent Expiring | % of UW Base Rent Expiring | Cumulative Net Rentable Area Expiring | Cumulative % of NRA Expiring | Cumulative UW Base Rent Expiring | Cumulative % of UW Base Rent Expiring |
| Vacant | NAP | 0 | 0.0 | % | NAP | NA | P | 0 | | 0.0% | | NAP | NAP | |
| 2023 & MTM | 0 | 0 | 0.0 | | $0 | 0.0 | % | 0 | | 0.0% | | $0 | 0.0% | |
| 2024 | 0 | 0 | 0.0 | | 0 | 0.0 | | 0 | | 0.0% | | $0 | 0.0% | |
| 2025 | 0 | 0 | 0.0 | | 0 | 0.0 | | 0 | | 0.0% | | $0 | 0.0% | |
| 2026 | 0 | 0 | 0.0 | | 0 | 0.0 | | 0 | | 0.0% | | $0 | 0.0% | |
| 2027 | 0 | 0 | 0.0 | | 0 | 0.0 | | 0 | | 0.0% | | $0 | 0.0% | |
| 2028 | 0 | 0 | 0.0 | | 0 | 0.0 | | 0 | | 0.0% | | $0 | 0.0% | |
| 2029 | 0 | 0 | 0.0 | | 0 | 0.0 | | 0 | | 0.0% | | $0 | 0.0% | |
| 2030 | 0 | 0 | 0.0 | | 0 | 0.0 | | 0 | | 0.0% | | $0 | 0.0% | |
| 2031 | 0 | 0 | 0.0 | | 0 | 0.0 | | 0 | | 0.0% | | $0 | 0.0% | |
| 2032 | 0 | 0 | 0.0 | | 0 | 0.0 | | 0 | | 0.0% | | $0 | 0.0% | |
| 2033 | 0 | 0 | 0.0 | | 0 | 0.0 | | 0 | | 0.0% | | $0 | 0.0% | |
| 2034 & Beyond | 1 | 596,090 | 100.0 | | 8,345,260 | 100.0 | | 596,090 | | 100.0% | | $8,345,260 | 100.0% | |
| Total | 1 | 596,090 | 100.0 | % | $8,345,260 | 100.0 | % | | | | |
| (1) | Based on the underwritten rent roll dated March 22, 2023. |
| THE INFORMATION IN THIS STRUCTURAL AND COLLATERAL TERM SHEET IS NOT COMPLETE AND MAY BE AMENDED PRIOR TO THE TIME OF SALE. THIS TERM SHEET IS NOT AN OFFER TO SELL THESE SECURITIES AND IT IS NOT A SOLICITATION OF AN OFFER TO BUY THESE SECURITIES IN ANY JURISDICTION WHERE THE OFFER OR SALE IS NOT PERMITTED. |
| | 72 | |
| Structural and Collateral Term Sheet | | BMO 2023-5C1 |
| No. 6 – California High Tech Logistics |
The following table presents certain information relating to the underwritten cash flows of the California High Tech Logistics Property:
| Underwriting Net Cash Flow |
| | Underwritten | Per Square Foot | %(1) |
| Rents in Place | $8,345,260 | $14.00 | 85.3% |
| Vacant Income | 0 | $0.00 | 0.0 |
| Gross Potential Rent | $8,345,260 | $14.00 | 85.3% |
| Total Reimbursements | 1,434,983 | $2.41 | 14.7 |
| Net Rental Income | $9,780,243 | $16.41 | 100.0% |
| Other Income | 0 | $0.00 | 0.0 |
| (Vacancy/Credit Loss)(2) | (489,012) | (0.82) | (5.0) |
| Effective Gross Income | $9,291,231 | $15.59 | 95.0% |
| Total Expenses | 1,434,983 | 2.41 | 15.4 |
| Net Operating Income | $7,856,248 | $13.18 | 84.6% |
| Capital Expenditures | 59,609 | 0.10 | 0.6 |
| TI/LC | 119,218 | 0.20 | 1.3 |
| Net Cash Flow | $7,677,421 | $12.88 | 82.6% |
| (1) | % column represents percent of Net Rental Income for all revenue lines and represents percent of Effective Gross Income for the remainder of fields. |
| (2) | Underwritten Vacancy/Credit Loss represents the economic vacancy of 5.0%. |
The Market. The California High Tech Logistics Property is located in Riverside, California, within the Riverside-San Bernardino-Ontario Metropolitan Statistical Area (the “Riverside MSA”) in Riverside county. Riverside is situated along the Santa Ana River to the east of Los Angeles, California along Interstate 215. The Riverside MSA economy is driven by the services, retail, public administration, construction, transportation and utilities, manufacturing, finance, insurance, real estate and wholesale trade industries. Major employers in the Riverside MSA include Stater Brothers Markets, Arrowhead Regional Medical Center, U.S. Marine Corps. Air Ground Combat Center, Fort Irwin and Walmart Inc.
The California High Tech Logistics Property is located in the March Air Reserve Base community in the northwestern portion of Riverside County, west of Interstate 215. The area surrounding the California High Tech Logistics Property is viewed as suburban. Access to the area is provided via Interstate 215 (“I-215”) and the 60 Freeway. I-215 is located 0.5 miles east of the California High Tech Logistics Property via East Alessandro Boulevard. The Moreno Valley / March Field rail way station is located 0.8 miles southeast of the California High Tech Logistics Property. The commute into Downtown Riverside is approximately 9.0 miles, and the drive to the Ontario International Airport is approximately 23.0 miles. There are currently two new industrial properties under development near the California High Tech Logistics Property. One is a 200,000 square foot proposed industrial property located approximately 5.2 miles southwest of the California High Tech Logistics Property and is expected to be completed and delivered by June 2024. The other development is a 450,000 square foot proposed industrial property located approximately 5.7 miles southeast of the California High Tech Logistics Property and is expected to be completed and delivered by December 2023.
According to a third party market research report, the California High Tech Logistics Property is located within the Inland Empire industrial market and the Moreno Valley/Perris industrial submarket. As of the third quarter of 2022, the Inland Empire industrial market contained approximately 699.7 million square feet of industrial space with a vacancy rate of 1.7% and an average quoted rental rate of $15.37 per square foot. The Moreno Valley/Perris industrial submarket contained approximately 94 million square feet of industrial space with a vacancy rate of 1.3% and an average rental rate of $14.69 per square foot as of the third quarter of 2022. The Moreno Valley/Perris industrial submarket reported positive net absorption of approximately 4.8 million square feet and approximately 3.9 million square feet of completions for the trailing twelve months ending the third quarter of 2022.
The appraisal identified eight competitive properties built between 2016 and 2022 ranging in size from approximately 361,346 square feet to 1,138,800 square feet. The appraisal’s competitive set reported rent from $11.16 per square foot to $15.60 per square foot, with an average rent of $13.01 per square foot. The appraisal concluded a market rent of $14.04 per square foot on a triple-net lease for industrial/flex space.
| THE INFORMATION IN THIS STRUCTURAL AND COLLATERAL TERM SHEET IS NOT COMPLETE AND MAY BE AMENDED PRIOR TO THE TIME OF SALE. THIS TERM SHEET IS NOT AN OFFER TO SELL THESE SECURITIES AND IT IS NOT A SOLICITATION OF AN OFFER TO BUY THESE SECURITIES IN ANY JURISDICTION WHERE THE OFFER OR SALE IS NOT PERMITTED. |
| | 73 | |
| Structural and Collateral Term Sheet | | BMO 2023-5C1 |
| No. 6 – California High Tech Logistics |
The following table presents certain information relating to comparable industrial/flex rental properties for the California High Tech Logistics Property:
| Comparable Industrial/Flex Rental Summary(1) |
| Property Name/Location | Year Built | Occ. | Size (SF) | Tenant | Suite Size (SF) | Rent PSF(2) | Commencement | Lease Term (Months) |
California High Tech Logistics 14063 East Brown Street Riverside, CA | 2019 | 100.0%(3) | 596,090(3) | High Tech Logistics(3) | 596,090(3) | $14.00(3) | Apr-23(3) | 240(3) |
Columbia Business Park 300 Palmyrita Avenue Riverside, CA | 2022 | 100.0% | 374,000 | Logistics Plus, Inc. | 374,000 | $15.60 | Nov-22 | 62 |
Knox Logistics Center VI 23120 Oleander Avenue Perris, CA | 2022 | 100.0% | 418,000 | Weber Logistics | 418,000 | $14.40 | Aug-22 | 84 |
Magnon Business Park 6075 Lance Drive Riverside, CA | 2020 | 100.0% | 361,346 | Sketchers | 361,346 | $14.16 | Apr-22 | 60 |
Knox Logistics Center IV 22405 Oleander Avenue Perris, CA | 2022 | 100.0% | 410,350 | Burlington Distributions Corp | 410,350 | $13.20 | Jun-22 | 62 |
Knox Logistics Center VII 19115 Harvill Avenue Perris, CA | 2022 | 100.0% | 1,138,800 | Home Depot | 1,138,800 | $12.00 | Sep-22 | 86 |
Meridian Logistics Center 15801 Meridian Parkway Riverside, CA | 2016 | 100.0% | 486,000 | Port Logistics/Ryder | 486,000 | $12.36 | Mar-22 | 61 |
I-10 Logistics Center - Building A 36312 Cherry Valley Boulevard Cherry Valley, CA | 2022 | 100.0% | 814,822 | Style Link Logistics LLC | 814,822 | $11.16 | Apr-23 | 123 |
Meridian Business Park South Campus - Building D 20201 Caroline Way March Air Reserve Base, CA | 2022 | 100.0% | 782,209 | Republic National Distributing Company | 782,209 | $11.16 | Mar-22 | 122 |
| (2) | Appraisal rent per square foot has been adjusted to reflect annual amounts. |
| (3) | Based on the underwritten rent roll dated March 22, 2023. |
The following table presents certain information relating to comparable sales for the California High Tech Logistics Property:
| Comparable Sales(1) |
| Property Location | Sale Date | Total NRA (SF) | Total Occupancy | Sale Price | Sale Price PSF | Adjusted Sales Price PSF |
California High Tech Logistics 14063 East Brown Street Riverside, CA | NAP | 596,090(2) | 100.0 | %(2) | NAP | NAP | NAP |
Val Verde Logistics Center 19319 Harvill Avenue Perris, CA | Apr-2022 | 289,407 | 100.0 | % | $92,000,000 | $317.89 | $290.93 |
Freeway Business Center 2677 East Alessandro Boulevard Riverside, CA | Dec-2021 | 709,081 | 100.0 | % | $199,250,000 | $281.00 | $303.90 |
SRG Perris Logistics Center - Building 2 3900 Indian Avenue Perris, CA | Aug-2022 | 579,708 | 100.0 | % | $158,000,000 | $272.55 | $322.48 |
Rialto Logistics Center 12050 Agua Mansa Road Bloomington, CA | Aug-2021 | 505,906 | 100.0 | % | $107,250,000 | $212.00 | $231.37 |
Single Tenant Industrial Warehouse Property 251 East Rider Street Perris, CA | Dec-2022 | 354,810 | 100.0 | % | $90,000,000 | $253.66 | $263.80 |
Slover Distribution Center 18025 Slover Avenue Bloomington, CA | Jun-2022 | 344,360 | 100.0 | % | $102,000,000 | $296.20 | $302.04 |
Single Tenant Industrial Warehouse Property 100 Walnut Avenue Perris, CA | Dec-2022 | 205,589 | 100.0 | % | $59,275,000 | $288.32 | $236.42 |
| (2) | Based on the underwritten rent roll dated March 22, 2023. |
| THE INFORMATION IN THIS STRUCTURAL AND COLLATERAL TERM SHEET IS NOT COMPLETE AND MAY BE AMENDED PRIOR TO THE TIME OF SALE. THIS TERM SHEET IS NOT AN OFFER TO SELL THESE SECURITIES AND IT IS NOT A SOLICITATION OF AN OFFER TO BUY THESE SECURITIES IN ANY JURISDICTION WHERE THE OFFER OR SALE IS NOT PERMITTED. |
| | 74 | |
| Structural and Collateral Term Sheet | | BMO 2023-5C1 |
| No. 6 – California High Tech Logistics |
The Borrower. The borrowing entity for the California High Tech Logistics Mortgage Loan is Brown Street Acquisitions LLC, a single purpose entity with two independent directors. Legal counsel to the borrower delivered a non-consolidation opinion in connection with the origination of the California High Tech Logistics Whole Loan.
The Borrower Sponsors. The borrower sponsors and non-recourse carveout guarantors for the California High Tech Logistics Mortgage Loan are Moshe Kupferstein, Devi Alfaks, Edward Alfaks, Morris Alfaks, Dib Chaaya and Salim Mann. Devi Alfaks and Moshe Kupferstein co-founded and currently serve as co-CEOs of HTL. Edward Alfaks, Morris Alfaks, Dib Chaaya and Salim Mann are co-founders and partners in Apollo Apparel, a fashion apparel manufacturer.
Property Management. The California High Tech Logistics Property is managed by Riverside Brown Street Management LLC, an affiliate of the borrower sponsors.
Escrows and Reserves. At origination, the borrower deposited into escrow approximately $88,186 for real estate tax reserves, $22,717 for insurance reserves and $800,000 for a lease security deposit.
Tax Escrows – On a monthly basis, the borrower is required to escrow 1/12th of the annual estimated real estate tax payments, which currently equates to approximately $88,186.
Insurance Escrows – On a monthly basis, the borrower is required to escrow 1/12th of the annual estimated insurance payments, which currently equates to approximately $11,359.
Replacement Reserves – On a monthly basis, the borrower is required to escrow approximately $4,967.42 for replacement reserves (approximately $0.10 per square foot annually).
TI/LC Reserves – The borrower is not required to make monthly deposits into the rollover reserve subaccount so long as the following conditions are met (i) no event of default has occurred or is continuing, (ii) there are no defaults under the Riverside Brown Street lease and the Riverside Brown Street lease is in full force and effect, (iii) the Riverside Brown Street tenant remains obligated under the Riverside Brown Street lease to pay for and perform all repairs, tenant improvements and other work at the California High Tech Logistics Property and (iv) with respect to HTL, the net operating income for such entity plus (a) paid interest and tax expenses, (b) depreciation, (c) amortization, (d) other non-cash charges incurred during the applicable fiscal year, including, without limitation, non-cash impairment charges and (e) HTL’s corporate restructuring charges (the “EBITDA”) remain above $2,220,000.
Special Rollover Reserve – During the continuance of a Lease Sweep Period (as defined below) (provided no other Cash Management Period (as defined below) is then continuing), the borrower is required to deposit with the lender all available cash (or such portion of available cash allocated by the lender for deposit into the special rollover reserve subaccount). The borrower will also be required to deposit with the lender for transfer into the special rollover reserve subaccount (i) all fees, penalties, commissions or other payments made to the borrower in connection with or relating to the rejection, buy-out, termination, surrender or cancellation of any Major Lease (as defined below) (including in connection with any Major Tenant (as defined below) insolvency proceeding), (ii) any security deposits or proceeds of letters of credit held by the borrower in lieu of cash security deposits, which the borrower is permitted to retain pursuant to the applicable provisions of any Major Lease and (iii) any payments made to the borrower relating to unamortized tenant improvements and leasing commissions under any Major Lease.
Lockbox / Cash Management. The California High Tech Logistics Mortgage Loan is structured with a springing lockbox and springing cash management. Upon the occurrence and continuance of a Cash Management Period the borrower is required to establish a lender-controlled lockbox account and to cause all rents to be directly deposited into the lender-controlled cash management account. Within ten days following the occurrence of the Cash Management Period, the borrower or the lender will be required to deliver a tenant direction letter to each tenant at the California High Tech Logistics Property directing each tenant to pay all rents and other sums due under such lease into the cash management clearing account. In addition, from and after the occurrence of a Cash Management Period, simultaneously with the execution of any new lease, the borrower will be required to provide such new tenant a tenant direction letter. Any rents received by the borrower or property manager after the occurrence of a Cash Management Period are required to be deposited into the lockbox account within two business day of receipt. As long as no Cash Management Period is in effect, funds deposited into the lockbox account are required to be transferred to the borrower’s operating account on a daily basis. Upon the occurrence of a Cash Management Period, all sums on deposit in the lockbox account are required to be transferred on a daily basis to a cash management account controlled by the lender and applied and disbursed in accordance with the California High Tech Logistics Whole Loan documents. Available cash on deposit will be applied as follows: (a) if during the continuance of a Cash Management Period continuing solely as a result of a Lease Sweep Period, to the special rollover reserve subaccount, (b) if during the continuance of a Cash Management Period continuing solely as a result of an event of default under the California High Tech Logistics Mezzanine Loan (as defined below) documents and provided no other Cash Management Period has occurred or is continuing for any other reason, into the mezzanine subaccount, or (c) to the extent that a Cash Management Period is in effect (other than solely as a result of a Lease Sweep Period), to the cash collateral subaccount.
If a Cash Management Period has commenced solely as a result of clause (vi) of the Cash Management Period definition, the borrower will have the right (but not the obligation) to (i) deposit the EBITDAR Maintenance Funds (as defined below) with the lender for deposit
| THE INFORMATION IN THIS STRUCTURAL AND COLLATERAL TERM SHEET IS NOT COMPLETE AND MAY BE AMENDED PRIOR TO THE TIME OF SALE. THIS TERM SHEET IS NOT AN OFFER TO SELL THESE SECURITIES AND IT IS NOT A SOLICITATION OF AN OFFER TO BUY THESE SECURITIES IN ANY JURISDICTION WHERE THE OFFER OR SALE IS NOT PERMITTED. |
| | 75 | |
| Structural and Collateral Term Sheet | | BMO 2023-5C1 |
| No. 6 – California High Tech Logistics |
into the cash collateral subaccount, and in such event, the EBITDAR Maintenance Funds or the EBITDAR Maintenance Letter of Credit (as defined below) will be held by the lender as collateral and additional security for the payment of the California High Tech Logistics Whole Loan until returned to the borrower pursuant to and in accordance with, the terms and provisions of the California High Tech Logistics Whole Loan documents. Upon the occurrence and during the continuance of an event of default, the lender will have the right, at its option, to draw on all or any portion of such EBITDAR Maintenance Letter of Credit and to apply such amount drawn, or to apply the EBITDAR Maintenance Funds, as applicable, to payment of the California High Tech Logistics Whole Loan in such order, proportion or priority as the lender may determine (together with the applicable prepayment premium, if any, applicable). The borrower will not be entitled to draw upon any EBITDAR Maintenance Letter of Credit. Provided no event of default is continuing, in the event of a termination of the related Cash Management Period (as determined by the lender in its reasonable discretion and without giving credit for the EBITDAR Maintenance Funds or the face amount of any EBITDAR Maintenance Letter of Credit), the Lender will, promptly after written notice from the borrower to do so, return any EBITDAR Maintenance Funds or EBITDAR Maintenance Letter of Credit to the borrower within ten business days.
A “Cash Management Period” will commence upon (i) the stated maturity date of April 1, 2028, (ii) the occurrence of an event of default, (iii) the debt service coverage ratio being less than 1.10x as of any calendar quarter, (iv) the commencement of a Lease Sweep Period, (v) the occurrence of an event of default under the California High Tech Logistics Mezzanine Loan documents or (vi) the occurrence and continuance of an EBITDAR Event (as defined below), and will end, as applicable, if (x) the lender gives notice to the clearing bank that the sweeping of funds into the deposit account may cease, which notice will be required to be provided if (1) the California High Tech Logistics Whole Loan and all other obligations under the California High Tech Logistics Whole Loan documents have been repaid in full or (2) the stated maturity date has not occurred or (y) (a) with respect to clause (ii) above, the event of default has been cured and no other event of default has occurred and is continuing or (b) with respect to clause (iii) above, the debt service coverage ratio is at least equal to 1.15x for two consecutive calendar quarters, (c) with respect to clause (iv) above, such Lease Sweep Period has ended, (d) with respect to clause (v) above, the lender’s receipt of written notice from the California High Tech Logistics Mezzanine Loan lender that no event of default is then continuing under the California High Tech Logistics Mezzanine Loan documents or (e) with respect to clause (vi) above, the EBITDAR Event period has ended.
A “Lease Sweep Period” will commence on the first payment date following the occurrence of (i) the date that is twelve months prior to the end of the term of any Major Lease (including renewal terms), (ii) the date under a Major Lease by which the applicable Major Tenant is required to give notice of its exercise of a renewal option thereunder, and such renewal has not been exercised, (iii) any Major Lease is surrendered, cancelled or terminated prior to its current expiration date, (iv) any Major Tenant discontinues its business at or no longer occupy its premises (i.e., “goes dark”) or gives notice that it intends to discontinue its business or no longer occupy its demised premises, (v) the occurrence and continuance (beyond any applicable notice and cure periods) of a default under any Major Lease by the applicable Major Tenant or (vi) the occurrence of a Major Tenant insolvency proceeding.
A Lease Sweep Period will end upon the earlier to occur of (a) the reasonable determination by the lender that sufficient funds have been accumulated in the Special Rollover Reserve subaccount to pay for all anticipated expenses in connection with the re-leasing of the space under the applicable Major Lease that gave rise to the subject Lease Sweep Period, including brokerage commissions and tenant improvements and any anticipated shortfalls of payments required under the California High Tech Logistics Whole Loan documents during any period of time that rents are insufficient as a result of down-time or free rent periods, or (b) the occurrence of any of the following: (1) with respect to matters discussed in clauses (i) - (iv) above, upon the earlier to occur of (A) the date on which the Major Tenant exercises its renewal or extension option with respect to all of the space demised under its Major Lease and in the lender’s reasonable judgment, sufficient funds have been accumulated in the Special Rollover Reserve account to pay for all anticipated approved Major Lease leasing expenses for such Major Lease and any other anticipated expense in connection with such renewal or extension or; (B) the date on which all of the space demised under the subject Major Lease that gave rise to the Lease Sweep Period has been fully leased pursuant to a replacement lease or replacement leases approved by the lender, and entered into accordance with the California High Tech Logistics Whole Loan documents and all approved Major Lease leasing expenses (and any other expenses in connection with the re-tenanting of such space) have been paid in full; (2) with respect to clause (v) above, if the subject Major Tenant default has been cured and no other Major Tenant default has occurred for a period of six consecutive months; or (3) with respect to clause (vi) above, if (x) the applicable Major Lease has been affirmed, assumed or assigned in a manner satisfactory to the lender or (y) if the Major Lease was rejected in the bankruptcy proceeding, the date on which all of the space demised under the Major Lease has been fully leased pursuant to a replacement lease or replacement leases approved by the lender and entered into accordance with the California High Tech Logistics Whole Loan documents and all approved Major Lease leasing expenses (and any other expenses in connection with the re-tenanting of such space) have been paid in full.
An “EBITDAR Event ” means if the EBITDAR Ratio (as defined below) is less than 1.25x as of any calendar quarter from and after March 31, 2024, and will end, as applicable, if (a) the EBITDAR Ratio for HTL equals or exceeds 1.25x or (b) the borrower has delivered to the lender either the EBITDAR Maintenance Funds (as defined below) or a letter of credit in the face amount equal to the applicable amount of the EBITDAR Maintenance Funds (the “EBITDAR Maintenance Letter of Credit”).
The “EBITDAR Ratio” means a percentage reasonably determined by the lender (based on the financial and operating statements delivered by the borrower and/or HTL to the lender pursuant to the terms set forth within the California High Tech Logistics Whole Loan documents) on a trailing twelve (12) month basis as of the date of calculation, in which the EBITDAR Ratio will be calculated as follows:
| THE INFORMATION IN THIS STRUCTURAL AND COLLATERAL TERM SHEET IS NOT COMPLETE AND MAY BE AMENDED PRIOR TO THE TIME OF SALE. THIS TERM SHEET IS NOT AN OFFER TO SELL THESE SECURITIES AND IT IS NOT A SOLICITATION OF AN OFFER TO BUY THESE SECURITIES IN ANY JURISDICTION WHERE THE OFFER OR SALE IS NOT PERMITTED. |
| | 76 | |
| Structural and Collateral Term Sheet | | BMO 2023-5C1 |
| No. 6 – California High Tech Logistics |
(i) the EBITDAR (as defined below) for HTL plus any of the Riverside Brown Street tenant’s security deposit reserve funds then on deposit with the lender, divided by (ii) the annual debt service.
The “EBITDAR Maintenance Funds” means that so long as the HTL EBITDAR Ratio is below 1.25x, an amount sufficient to achieve an EBITDAR Ratio of 1.25x for HTL in which funds may come in the form of cash or an EBITDAR Maintenance Letter of Credit; provided, however, when determining the amount of EBITDAR Maintenance Funds required to terminate the Cash Management Period as of any calendar quarter, any existing EBITDAR Maintenance Funds held by the lender in the cash collateral subaccount will be taken into account when calculating the total amount of EBITDAR Maintenance Funds required to be deposited with the lender pursuant to the terms of the California High Tech Logistics Whole Loan documents. The EBITDAR Maintenance Funds (including any EBITDAR Maintenance Letter of Credit) will be returned to the borrower when the EBITDAR Ratio for HTL equals or exceeds 1.25x.
The “EBITDAR” means with respect to HTL, the net operating income for such entity plus (i) paid interest and tax expenses, (ii) depreciation, (iii) amortization, (iv) other non-cash charges incurred during the applicable fiscal year, including, without limitation, non-cash impairment charges and (v) rent for the California High Tech Logistics Property and corporate restructuring charges.
A “Major Lease” means the Riverside Brown Street Tenant LLC lease or any other lease which covers 100,000 square feet or more of net rentable square feet at the California High Tech Logistics Property.
A “Major Tenant” means any tenant under either a Major Lease, or under one or more leases (leased by such tenant and/or its affiliates), which, taken together, cover in the aggregate 100,000 square feet or more rentable square feet of the California High Tech Logistics Property.
Subordinate Debt. None.
Mezzanine Debt. Concurrently with the funding of the California High Tech Logistics Whole Loan, the lender funded a mezzanine loan in the amount of $10.0 million (the “California High Tech Logistics Mezzanine Loan”) The California High Tech Logistics Mezzanine Loan is secured by the direct equity interests in the California High Tech Logistics Whole Loan borrower and is coterminous with the California High Tech Logistics Whole Loan. The California High Tech Logistics Mezzanine Loan accrues interest at a rate of 10.25% per annum. Based on the California High Tech Logistics Whole Loan and the California High Tech Logistics Mezzanine Loan, the cumulative Cut-off Date LTV, UW NCF DSCR and UW NOI debt yield are 49.6%, 1.13x and 9.8%, respectively.
Partial Release. Not permitted.
Ground Lease. None.
| THE INFORMATION IN THIS STRUCTURAL AND COLLATERAL TERM SHEET IS NOT COMPLETE AND MAY BE AMENDED PRIOR TO THE TIME OF SALE. THIS TERM SHEET IS NOT AN OFFER TO SELL THESE SECURITIES AND IT IS NOT A SOLICITATION OF AN OFFER TO BUY THESE SECURITIES IN ANY JURISDICTION WHERE THE OFFER OR SALE IS NOT PERMITTED. |
| | 77 | |
| Structural and Collateral Term Sheet | | BMO 2023-5C1 |
| No. 7 – Cumberland Mall |

| THE INFORMATION IN THIS STRUCTURAL AND COLLATERAL TERM SHEET IS NOT COMPLETE AND MAY BE AMENDED PRIOR TO THE TIME OF SALE. THIS TERM SHEET IS NOT AN OFFER TO SELL THESE SECURITIES AND IT IS NOT A SOLICITATION OF AN OFFER TO BUY THESE SECURITIES IN ANY JURISDICTION WHERE THE OFFER OR SALE IS NOT PERMITTED. |
| | 78 | |
| Structural and Collateral Term Sheet | | BMO 2023-5C1 |
| No. 7 – Cumberland Mall |
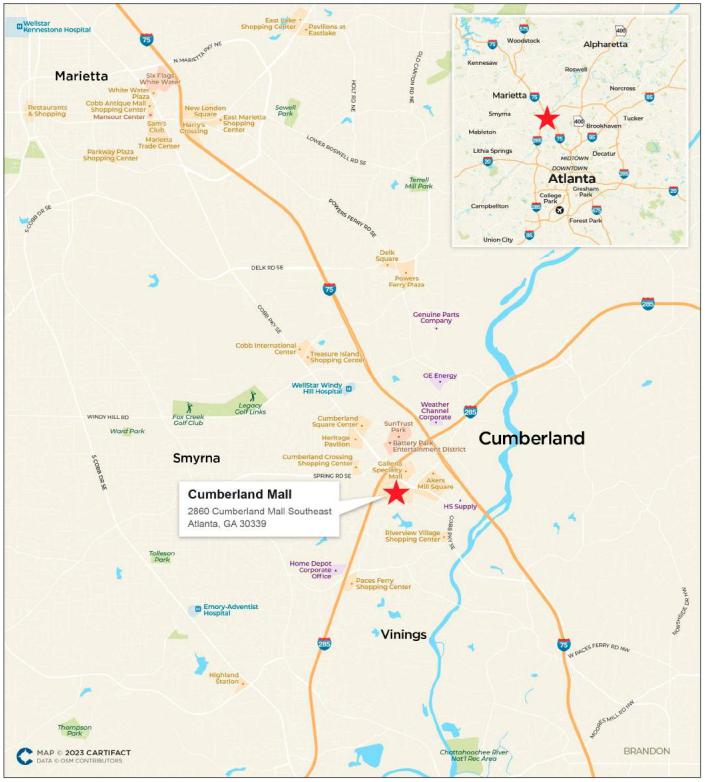
| THE INFORMATION IN THIS STRUCTURAL AND COLLATERAL TERM SHEET IS NOT COMPLETE AND MAY BE AMENDED PRIOR TO THE TIME OF SALE. THIS TERM SHEET IS NOT AN OFFER TO SELL THESE SECURITIES AND IT IS NOT A SOLICITATION OF AN OFFER TO BUY THESE SECURITIES IN ANY JURISDICTION WHERE THE OFFER OR SALE IS NOT PERMITTED. |
| | 79 | |
| Structural and Collateral Term Sheet | | BMO 2023-5C1 |
| No. 7 – Cumberland Mall |
| Mortgage Loan Information | | Property Information |
| Mortgage Loan Seller: | GACC, BMO | | Single Asset / Portfolio: | Single Asset |
| Original Principal Balance(1): | $52,000,000 | | Title: | Fee |
| Cut-off Date Principal Balance(1): | $52,000,000 | | Property Type – Subtype: | Retail – Super Regional Mall |
| % of IPB: | 6.8% | | Net Rentable Area (SF): | 709,318 |
| Loan Purpose: | Refinance | | Location: | Atlanta, Georgia |
| Borrower: | Cumberland Mall, LLC and Cumberland FS Anchor Parcel Owner LLC | | Year Built / Renovated: | 1973 / 2006-2016 |
| Borrower Sponsor(2): | BPR Nimbus LLC | | Occupancy: | 98.7% |
| Interest Rate: | 7.87000% | | Occupancy Date: | 3/31/2023 |
| Note Date: | 4/14/2023 | | 4th Most Recent NOI (As of): | $18,694,979 (12/31/2020) |
| Maturity Date: | 5/1/2028 | | 3rd Most Recent NOI (As of): | $23,224,824 (12/31/2021) |
| Interest-only Period: | 60 months | | 2nd Most Recent NOI (As of): | $24,323,229 (12/31/2022) |
| Original Term: | 60 months | | Most Recent NOI (As of): | $24,065,640 (TTM 1/31/2023) |
| Original Amortization Term: | None | | UW Economic Occupancy: | 96.5% |
| Amortization Type: | Interest Only | | UW Revenues: | $32,871,677 |
| Call Protection(3): | L(27),D(29),O(4) | | UW Expenses: | $8,090,891 |
| Lockbox / Cash Management: | Hard / Springing | | UW NOI: | $24,780,787 |
| Additional Debt(1): | Yes | | UW NCF: | $23,863,869 |
| Additional Debt Balance(1): | $128,000,000 | | Appraised Value / Per SF: | $368,000,000 / $519 |
| Additional Debt Type(1): | Pari Passu | | Appraisal Date: | 2/28/2023 |
| | | | | |
| Escrows and Reserves(4) | | Financial Information(5) |
| | Initial | Monthly | Initial Cap | | Cut-off Date Loan / SF: | $254 | |
| Taxes: | $0 | Springing | N/A | | Maturity Date Loan / SF: | $254 | |
| Insurance: | $0 | Springing | N/A | | Cut-off Date LTV: | 48.9% | |
| Replacement Reserves: | $0 | Springing | $353,853 | | Maturity Date LTV: | 48.9% | |
| TI/LC | $1,987,019 | Springing | $1,415,412 | | UW NCF DSCR: | 1.66x | |
| Gap Rent Reserve | $267,919 | $0 | N/A | | UW NOI Debt Yield: | 13.8% | |
| Anchor Tenant Reserve | $0 | Springing | N/A | | | | |
| | | | | | | |
| Sources and Uses |
| Sources | Proceeds | % of Total | | Uses | Proceeds | % of Total |
| Whole Loan(1) | $180,000,000 | 100.0% | | Existing Loan Payoff | $160,491,051 | 89.2 | % |
| | | | | Return of Equity | 15,615,412 | 8.7 | |
| | | | | Reserves | 2,254,938 | 1.3 | |
| | | | | Closing Costs | 1,638,600 | 0.9 | |
| Total Sources | $180,000,000 | 100.0% | | Total Uses | $180,000,000 | 100.0 | % |
| (1) | The Cumberland Mortgage Loan (as defined below) is part of a whole loan evidenced by 12 pari passu notes with an aggregate outstanding principal balance as of the Cut-off Date of $180 million (the "Cumberland Mall Whole Loan"). The Financial Information in the chart above reflects the Cumberland Mall Whole Loan. |
| (2) | The borrower sponsor is affiliated with the borrower sponsors of the Short Pump Town Center Mortgage Loan, the Oxmoor Center Mortgage Loan and the Heritage Plaza Mortgage Loan, which are also being contributed to the BMO 2023-5C1 transaction. |
| (3) | The lockout period will be at least 27 payment dates beginning with and including the first payment date on June 1, 2023. Defeasance of the Cumberland Mall Whole Loan in full is permitted at any time after the earlier to occur of (i) April 14, 2026 or (ii) the date that is two years from the closing date of the securitization that includes the last Cumberland Mall Whole Loan note to be securitized. The assumed lockout period of 27 payments is based on the expected BMO 2023-5C1 securitization closing date in August 2023. The actual lockout period may be longer. |
| (5) | Calculated based on the aggregate outstanding principal balance as of the Cut-Off Date of the Cumberland Mall Whole Loan (as defined below). |
The Loan. The seventh largest mortgage loan (the “Cumberland Mall Mortgage Loan”) is part of a whole loan (the “Cumberland Mall Whole Loan”) originated by Deutsche Bank AG, acting through its New York Branch (“DBNY”), Morgan Stanley Bank, N.A. (“MSBNA”) and Bank of Montreal (“BMO”) on April 14, 2023 that is evidenced by 12 pari passu notes with an aggregate outstanding principal balance as of the Cut-off Date of $180,000,000. The Cumberland Mall Whole Loan is secured by the fee simple interest in Cumberland Mall, a 709,318 SF enclosed, super-regional mall located at 2860 Cumberland Mall Southeast in Atlanta, Georgia (the “Cumberland Mall Property”). The Cumberland Mall Mortgage Loan, which is evidenced by the non-controlling notes A-3, A-4, A-5, A-9 and A-11 has an
| THE INFORMATION IN THIS STRUCTURAL AND COLLATERAL TERM SHEET IS NOT COMPLETE AND MAY BE AMENDED PRIOR TO THE TIME OF SALE. THIS TERM SHEET IS NOT AN OFFER TO SELL THESE SECURITIES AND IT IS NOT A SOLICITATION OF AN OFFER TO BUY THESE SECURITIES IN ANY JURISDICTION WHERE THE OFFER OR SALE IS NOT PERMITTED. |
| | 80 | |
| Structural and Collateral Term Sheet | | BMO 2023-5C1 |
| No. 7 – Cumberland Mall |
outstanding principal balance as of the Cut-off Date of $52,000,000 and represents approximately 6.8% of the Initial Pool Balance. GACC is contributing notes A-3, A-4, A-5, totaling $32,000,000 and BMO is contributing notes A-9 and A-11 totaling $20,000,000.
The Cumberland Mall Whole Loan proceeds were used to refinance the existing debt on the Cumberland Mall Property, fund upfront reserves, pay origination costs and return cash to the borrower. The Cumberland Mall Whole Loan accrues interest at a fixed rate of 7.87000% per annum.
The Cumberland Mall Whole Loan had an original term of 60 months and has a remaining term of 57 months as of the Cut-off Date. The scheduled maturity date of the Cumberland Mall Whole Loan is the payment date in May 2028. Voluntary prepayment of the Cumberland Mall Whole Loan in whole (but not in part) is permitted on or after the payment date occurring in February 2028 without the payment of any prepayment premium. Defeasance of the Cumberland Mall Whole Loan in whole (but not in part) is permitted after the earlier to occur of the second anniversary of the closing date of the transaction that holds the last note to be securitized and April 14, 2026.
The table below summarizes the promissory notes that comprise the Cumberland Mall Whole Loan. The relationship between the holders of the Cumberland Mall Whole Loan will be governed by a co-lender agreement as described under “Description of the Mortgage Pool—The Whole Loans—The Outside Serviced Pari Passu Whole Loans” in the Preliminary Prospectus.
| Whole Loan Summary |
| Note | Original Balance | Cut-off Date Balance | Note Holder | Controlling Piece |
| A-1 | $20,000,000 | | $20,000,000 | | Benchmark 2023-V2 | Yes |
| A-2 | $20,000,000 | | $20,000,000 | | Benchmark 2023-V2 | No |
| A-3 | $15,000,000 | | $15,000,000 | | BMO 2023-5C1 | No |
| A-4 | $10,000,000 | | $10,000,000 | | BMO 2023-5C1 | No |
| A-5 | $7,000,000 | | $7,000,000 | | BMO 2023-5C1 | No |
| A-6-1 | $30,000,000 | | $30,000,000 | | MSWF 2023-1 | No |
| A-6-2 | $10,000,000 | | $10,000,000 | | MSBNA(1) | No |
| A-7 | $23,000,000 | | $23,000,000 | | MSBNA(1) | No |
| A-8 | $15,000,000 | | $15,000,000 | | Benchmark 2023-V2 | No |
| A-9 | $12,500,000 | | $12,500,000 | | BMO 2023-5C1 | No |
| A-10 | $10,000,000 | | $10,000,000 | | Benchmark 2023-V2 | No |
| A-11 | $7,500,000 | | $7,500,000 | | BMO 2023-5C1 | No |
| Whole Loan | $180,000,000 | | $180,000,000 | | | |
| (1) | Expected to be contributed to one or more future securitization trusts. |
The Property. The Cumberland Mall Property is a 709,318 SF super regional mall located approximately 11 miles from downtown Atlanta, where more than 900,000 vehicles pass daily. The Cumberland Mall Property hosts a diverse tenant mix of over 100 shops and restaurants, meeting different customer needs. The immediate area of the Cumberland Mall Property has seen significant growth, including proximity to the Atlanta Braves stadium, which is located on the other side of the highway and holds over 41,000 people.
The Cumberland Mall Property was originally built in 1973, was expanded in 2006 and renovated in 2016. As of March 31, 2023, the Cumberland Mall Property is 98.7% leased to a diverse mix of tenants and has historically averaged 98.0% occupancy since 2016. The Cumberland Mall Property has a strong mix of national tenants and is anchored by Macy’s (non-collateral), Costco, Round 1 Bowling & Amusement, and Dick’s Sporting Goods. Costco opened in 2006 along with a 77,000 SF lifestyle center on the north side of the Cumberland Mall Property, attracting major national tenants and signature restaurants such as Cheesecake Factory, P.F. Chang’s, Buffalo Wild Wings, and Maggiano’s. In 2019, the borrower sponsor invested approximately $30.0 million on replacing the former Sears box with Dick’s Sporting Goods, Planet Fitness, and Round 1 Bowling & Amusement. Additionally, in late 2021, Brookfield Properties Retail Holding LLC (“Brookfield Properties”) received entitlements to develop 300 residential units, 60,000 SF of additional retail space, and up to 500,000 SF of office space proximate to the Cumberland Mall Property, allowing the Cumberland Mall Property to draw more people to the destination. The multifamily development is currently underway and expected to be completed in the second quarter of 2024.
The Cumberland Mall Property has shown a consistent growth in sales. Prior to the start of the COVID-19 pandemic, 2019 in-line sales PSF at the Cumberland Mall Property were $779 PSF and January 2023 TTM in-line sales PSF are $874 PSF, representing a 12.1% increase since 2019. Excluding Apple, in-line sales in 2019 were $518 PSF and January 2023 TTM in-line sales are at $610 PSF, representing a 17.7% increase since 2019. As of the January 2023 TTM, the in-line occupancy cost ratio is 8.3% including Apple and 11.9% excluding Apple. The table below provides an overview of the sales by tenancy type (partial year sales were excluded from the analysis).
| THE INFORMATION IN THIS STRUCTURAL AND COLLATERAL TERM SHEET IS NOT COMPLETE AND MAY BE AMENDED PRIOR TO THE TIME OF SALE. THIS TERM SHEET IS NOT AN OFFER TO SELL THESE SECURITIES AND IT IS NOT A SOLICITATION OF AN OFFER TO BUY THESE SECURITIES IN ANY JURISDICTION WHERE THE OFFER OR SALE IS NOT PERMITTED. |
| | 81 | |
| Structural and Collateral Term Sheet | | BMO 2023-5C1 |
| No. 7 – Cumberland Mall |
Tenancy Type | 2019 Sales(1) | 2019 PSF(1) | 2020 Sales(2) | 2020 PSF(2) | 2021 Sales | 2021 PSF | 2022 Sales | | TTM Sales(3) | |
| Anchor | $192,000,000 | $1,302 | $217,000,000 | $1,472 | $298,000,000 | $987 | $306,400,000 | $1,015 | | $306,400,000 | $1,015 | |
| Major (> 10,000 SF) | 31,977,014 | $345 | 22,889,170 | $247 | 33,119,265 | $358 | 35,424,084 | $383 | | 35,534,676 | $384 | |
| Inline (< 10,000 SF) | 163,360,834 | $779 | 130,277,728 | $602 | 188,490,676 | $863 | 197,104,268 | $863 | | 199,518,244 | $874 | |
| Inline (< 10,000 SF) excluding Apple | 105,197,133 | $518 | 99,277,330 | $473 | 135,305,482 | $639 | 135,029,048 | $609 | | 135,224,292 | $610 | |
| Total Sales | $384,992,566 | $858 | $368,079,113 | $808 | $516,265,996 | $843 | $535,342,263 | $861 | | $537,827,202 | $865 | |
| (1) | Based on the underwritten rent roll dated March 2023.. |
| (2) | 2020 Anchor sales do not include sales figures for Dick’s Sporting Goods and Round 1 Bowling & Amusement. |
| (3) | TTM is as of January 31, 2023. |
Major Tenants. The three largest tenants based on underwritten base rent are Round 1 Bowling & Amusement, H&M and Costco.
Round 1 Bowling & Amusement (“Round 1”) (83,600 square feet; 11.8% of net rentable area; 7.2% of underwritten base rent) is a multi-entertainment facility offering bowling, arcade games, billiards, karaoke, ping pong, darts, and other entertainment activities in an indoor facility complex. Round 1 opened its first U.S. location in Los Angeles in 2010 and has grown its presence in the United States to over 50 locations, with approximately 2,466 employees. At the Cumberland Mall Property, Round 1 occupies 83,600 SF through February 2031 and has two, five-year extension options.
Costco (147,409 square feet; 20.8% of net rentable area; 5.8% of underwritten base rent): is an American multinational corporation, which operates a chain of membership-only big-box retail stores. As of April 2022, Costco was the fifth largest retailer in the world. Costco is ranked #11 on the Fortune 500 rankings of the largest United States corporations by total revenue. In the United States, Costco’s main competitors operating membership warehouses are Sam’s Club and BJ’s Wholesale Club. Costco employs 304,000 employees worldwide and has an average store size of 146,000 SF. As of February 2023, Costco had nearly 123 million members. Costco has three, 10-year extension options through November 2056. Costco leases the pad from the borrowers and owns its improvements.
H&M (24,655 square feet; 3.5% of net rentable area; 4.0% of underwritten base rent) offers collections for women, men, teenagers, children and babies, with a product range that includes sportswear, underwear, cosmetics, accessories and shoes. H&M is present in 76 markets around the world. At the Cumberland Mall Property, H&M occupies 24,655 SF through January 2032 and has two, three-year extension options.
Environmental. According to a Phase I environmental report dated March 1, 2023, there are no recognized environmental conditions or recommendations for further action at the Cumberland Mall Property.
The following table presents certain information relating to the historical occupancy of the Cumberland Mall Property:
| Historical and Current Occupancy(1) |
| 2020 | 2021 | 2022 | Current(2) |
| 95.8% | 97.9% | 96.5% | 98.7% |
| (1) | Historical Occupancies are as of December 31 of each respective year, unless otherwise specified. |
| (2) | Based on the underwritten rent roll dated March 31, 2023. |
| THE INFORMATION IN THIS STRUCTURAL AND COLLATERAL TERM SHEET IS NOT COMPLETE AND MAY BE AMENDED PRIOR TO THE TIME OF SALE. THIS TERM SHEET IS NOT AN OFFER TO SELL THESE SECURITIES AND IT IS NOT A SOLICITATION OF AN OFFER TO BUY THESE SECURITIES IN ANY JURISDICTION WHERE THE OFFER OR SALE IS NOT PERMITTED. |
| | 82 | |
| Structural and Collateral Term Sheet | | BMO 2023-5C1 |
| No. 7 – Cumberland Mall |
The following table presents certain information relating to the major tenants (of which, certain tenants may have co-tenancy provisions) at the Cumberland Mall Property:
| Top Tenant Summary(1) |
| Tenant | Ratings
Moody’s/S&P/Fitch(2) | Net Rentable Area (SF) | % of
Total NRA | UW
Base Rent PSF |
UW
Base Rent | % of Total
UW Base Rent | Lease
Exp. Date |
| Round 1 Bowling & Amusement(3) | NR/NR/NR | 83,600 | | 11.8 | % | $16.75 | | $1,400,000 | 7.2 | % | 2/28/2031 |
| Costco | Aa3/A+/NR | 147,409 | | 20.8 | | $7.62 | | 1,122,880 | 5.8 | | 11/30/2026 |
| H&M(4) | NR/NR/NR | 24,655 | | 3.5 | | $31.43 | | 775,000 | 4.0 | | 1/31/2032 |
| Dick’s Sporting Goods(5) | Baa3/BBB/NR | 70,984 | | 10.0 | | $10.84 | | 769,783 | 4.0 | | 1/31/2031 |
| Foot Locker(6) | NR/NR/NR | 5,990 | | 0.8 | | $95.25 | | 570,548 | 3.0 | | 4/30/2023 |
| Champs Sports | NR/NR/NR | 7,610 | | 1.1 | | $71.64 | | 545,180 | 2.8 | | 1/31/2027 |
| Maggiano’s Little Italy | NR/NR/NR | 16,375 | | 2.3 | | $33.28 | | 544,960 | 2.8 | | 11/30/2026 |
| The Cheesecake Factory | NR/NR/NR | 11,112 | | 1.6 | | $45.00 | | 500,040 | 2.6 | | 1/31/2027 |
| DSW | NR/NR/NR | 14,664 | | 2.1 | | $30.69 | | 450,000 | 2.3 | | 1/31/2024 |
| Kids Foot Locker | NR/NR/NR | 3,955 | | 0.6 | | $98.39 | | 389,132 | 2.0 | | 7/31/2025 |
| Ten Largest Owned Tenants | | 386,354 | | 54.5 | % | $18.29 | | $7,067,524 | 36.5 | % | |
| Remaining Owned Tenants | | 314,073 | | 44.3 | | 39.08 | | 12,273,048 | 63.5 | | |
| Total Occupied | | 700,427 | | 98.7 | % | $27.61 | | $19,340,571 | 100.0 | % | |
| Vacant Spaces (Owned Space) | | 8,891 | | 1.3 | | $0.00 | | 0 | | |
| Totals / Wtd. Avg. All Owned Tenants(7) | | 709,318 | | 100.0 | % | $27.61 | | $19,340,571 | | |
| (1) | Based on the underwritten rent roll dated March 31, 2023. |
| (2) | In certain instances, ratings provided are those of the parent company of the entity shown, whether or not the parent company guarantees the lease. |
| (3) | Round 1 Bowling and Amusement may elect to terminate its lease if between March 2026 and March 2027 Round 1’s net sales fail to exceed $7,500,000. Round 1 Bowling and Amusement has 90 days following such one year period to terminate its lease by providing the landlord with 180 days’ prior notice and payment of a termination fee equal to the unamortized portion of its construction allowance and the broker fee paid by the landlord to Round 1’s broker. |
| (4) | H&M may terminate its lease if (x) its net sales fail to exceed $7,050,000 between January 1, 2027 and December 31, 2027 or (y) its net sales fail to exceed $7,755,000 between January 1, 2029 and December 31, 2029, in either case by providing 365 days’ prior written notice to the landlord within 180 days following the expiration of such 12-month period and payment of a termination fee equal to 50% of the unamortized portion of its construction allowance (amortized on a straight-line basis over 10 years commencing on the date H&M opened for business at the Cumberland Mall Property). |
| (5) | Dick’s Sporting Goods (“DSG”) may terminate its lease if Foot Locker prohibits or otherwise restricts DSG’s use of its leased premises vi’ Foot Locker's exclusivity right and such failure continues for 15 days following written notice from DSG to the landlord. |
| (6) | Foot Locker’s lease expired on April 30, 2023. Foot Locker is still open and operating in its leased space while it continues negotiations for a lease extension with the landlord. However, there is no assurance that Foot Locker will continue to operate its space or that its lease will be renewed. |
| (7) | Totals / Wtd. Avg. All Owned Tenants UW Base Rent PSF, UW Base Rent excludes vacant space. |
The following table presents certain information relating to the lease rollover schedule at the Cumberland Mall Property:
| Lease Rollover Schedule(1)(2)(3) |
| Year | Number of Leases Expiring | Net Rentable Area Expiring | % of NRA Expiring | UW Base Rent Expiring(3) | % of UW Base Rent Expiring(3) | Cumulative Net Rentable Area Expiring | Cumulative % of NRA Expiring | Cumulative UW Base Rent Expiring(3) | Cumulative % of UW Base Rent Expiring |
| Vacant | NAP | 8,891 | 1.3% | NAP | NAP | 8,891 | 1.3% | NAP | NAP | |
| 2023 | 13 | 31,286 | 4.4% | $1,648,945 | 8.5% | 40,177 | 5.7% | $1,648,945 | 8.5% | |
| 2024 | 22 | 61,639 | 8.7% | 2,705,967 | 14.0% | 101,816 | 14.4% | $4,354,912 | 22.5% | |
| 2025 | 25 | 71,897 | 10.1% | 3,388,785 | 17.5% | 173,713 | 24.5% | $7,743,696 | 40.0% | |
| 2026 | 16 | 212,606 | 30.0% | 3,745,098 | 19.4% | 386,319 | 54.5% | $11,488,795 | 59.4% | |
| 2027 | 13 | 78,272 | 11.0% | 2,523,930 | 13.0% | 464,591 | 65.5% | $14,012,725 | 72.5% | |
| 2028 | 7 | 16,070 | 2.3% | 585,446 | 3.0% | 480,661 | 67.8% | $14,598,171 | 75.5% | |
| 2029 | 2 | 1,750 | 0.2% | 222,148 | 1.1% | 482,411 | 68.0% | $14,820,319 | 76.6% | |
| 2030 | 5 | 31,797 | 4.5% | 897,754 | 4.6% | 514,208 | 72.5% | $15,718,074 | 81.3% | |
| 2031 | 3 | 154,872 | 21.8% | 2,169,783 | 11.2% | 669,080 | 94.3% | $17,887,857 | 92.5% | |
| 2032 | 5 | 27,448 | 3.9% | 1,212,381 | 6.3% | 696,528 | 98.2% | $19,100,238 | 98.8% | |
| 2033 & Beyond | 3 | 12,790 | 1.8% | 240,334 | 1.2% | 709,318 | 100.0% | $19,340,571 | 100.0% | |
| Total | 114 | 709,318 | 100.0% | $19,340,571 | 100.0% | | | | |
| (1) | Based on the underwritten rent roll dated March 31, 2023. |
| (2) | Lease Rollover Schedule is based on the lease expiration dates of all direct leases in place. |
| (3) | Certain tenants may have termination or contraction options (which may become exercisable prior to the originally stated expiration date of the tenant lease) that are not considered in the above lease rollover schedule. |
| THE INFORMATION IN THIS STRUCTURAL AND COLLATERAL TERM SHEET IS NOT COMPLETE AND MAY BE AMENDED PRIOR TO THE TIME OF SALE. THIS TERM SHEET IS NOT AN OFFER TO SELL THESE SECURITIES AND IT IS NOT A SOLICITATION OF AN OFFER TO BUY THESE SECURITIES IN ANY JURISDICTION WHERE THE OFFER OR SALE IS NOT PERMITTED. |
| | 83 | |
| Structural and Collateral Term Sheet | | BMO 2023-5C1 |
| No. 7 – Cumberland Mall |
The following table presents certain information relating to the underwritten cash flows of the Cumberland Mall Property:
| Operating History and Underwritten Net Cash Flow |
| | 2020 | 2021 | 2022 | TTM 1/31/2023 | UW Base Rent | Per Square Foot | %(1) |
| Rents in Place(2) | $15,531,763 | $17,006,998 | $18,513,247 | $18,799,674 | $19,340,571(2) | $27.27 | 71.4 | % |
| Rent Steps(3) | 0 | 0 | 0 | 0 | 321,854 | 0.45 | 1.2 | |
| Vacant Income | 0 | 0 | 0 | 0 | 669,205 | 0.94 | 2.5 | |
| Gross Potential Rent | $15,531,763 | $17,006,998 | $18,513,247 | $18,799,674 | $20,331,631 | $28.66 | 75.1 | % |
| Total Reimbursements | 5,994,957 | 5,870,712 | 6,146,884 | 6,196,689 | 6,757,614 | 9.53 | 24.9 | |
| Net Rental Income | $21,526,721 | $22,877,709 | $24,660,131 | $24,996,362 | $27,089,245 | $38.19 | 100.0 | % |
| Other Income | 4,628,949 | 7,743,164 | 7,318,910 | 7,181,902 | 6,974,670 | 9.83 | 25.7 | |
| (Vacancy/Credit Loss) | (725,673) | (301,427) | 213,345 | 162,892 | (1,192,237) | (1.68) | (4.4 | ) |
| Effective Gross Income | $25,429,997 | $30,319,446 | $32,192,386 | $32,341,156 | $32,871,677 | $46.34 | 121.3 | % |
| Total Expenses | 6,735,018 | 7,094,622 | 7,869,157 | 8,275,516 | 8,090,891 | 11.41 | 24.6 | |
| Net Operating Income | $18,694,979 | $23,224,824 | $24,323,229 | $24,065,640 | $24,780,787 | $34.94 | 75.4 | % |
| Total TI/LC, Capex/RR | 0 | 0 | 0 | 0 | 916,918 | 1.29 | 2.8 | |
| Net Cash Flow | $18,694,979 | $23,224,824 | $24,323,229 | $24,065,640 | $23,863,869 | $33.64 | 72.6 | % |
| (1) | % column represents percent of Net Rental Income for all revenue lines and represents percent of Effective Gross Income for the remainder of fields. |
| (2) | Based on the underwritten rent roll dated March 31, 2023. |
| (3) | Underwritten Rent Steps through May 1, 2024. |
The Market. The Cumberland Mall Property is located within the Atlanta-Sandy Springs-Alpharetta, Georgia Metropolitan Statistical Area (the “Atlanta MSA”) in Cobb County, Georgia. Cobb County has an estimated 2022 population of 766,149, with a population of 206,763 within a five-mile radius of the Cumberland Mall Property. The largest employers in Cobb County include the Cobb County Schools with approximately 17,750 employees, Wellstar Health System with roughly 15,000 employees, and Home Depot with about 13,000 employees. As of September 2022, Cobb County’s unemployment rate was 2.2%, 0.5% lower relative to the same period of the prior year and 1.1% below the national average. The average household income in Cobb County is $123,521.
The live, work, play environment surrounding the Cumberland Mall Property has drawn high-income renters and large corporations to the submarket in recent years. The submarket benefits from a base of large office users (approximately 31 million SF of office space) and has welcomed new expansions and relocations from major companies including new office headquarters for Thyssenkrupp and Papa John’s. Furthermore, the surrounding area features a strong mix of manufacturing companies and healthcare-related firms such as WellStar Health System and Aveanna Healthcare. Apartment rents in the immediate area surrounding the Cumberland Mall Property have increased substantially over the last few quarters (outpacing the metro average) at a trailing 12-month growth of 19.7%.
The following table presents certain information relating to comparable retail centers for the Cumberland Mall Property:
| Comparable Office Leases(1) |
| Property Name | Year Built/ Renovated | NRA (SF) | Occupancy(2) | Estimated # of Customers | Anchor / Major Tenants |
| Cumberland Mall | 1973 / 2006-2016 | 709,318(2) | 98.7%(2) | 2,348,739 | Round 1, Dick’s Sporting Goods, Costco |
| Town Center at Cobb | 1986 / 1995 | 1,281,436 | 90.0% | 1,325,138 | Belk, Macy’s, JCPenney |
| Perimeter Mall(3) | 1971 / 2017 | 1,551,000 | 85.0% | 2,558,246 | Dillard’s, Nordstrom, Von Maur, Macy‘s |
| Arbor Place | 1999 / NAP | 1,219,096 | 88.4% | 783,958 | Belk, Dillard’s, JCPenney, Macy’s (Backstage), Regal Cinemas |
| North Point Mall | 1993 / 2021 | 1,337,180 | 90.0% | 1,172,182 | Dillard’s, JCPenney, Macy’s, Von Maur, AMC Theaters |
| Wtd. Avg. Competitive Set | | | 88.2%(4) | 1,519,669(4) | |
| (1) | Source: Appraisal, unless otherwise specified. |
| (2) | Based on the underwritten rent roll as of March 31, 2023. Occupancy for the Cumberland Mall Property is as of March 31, 2023. |
| (3) | Perimeter Mall is owned by the borrower sponsor. |
| (4) | Excludes subject property. |
The Borrowers. The borrowers are Cumberland Mall, LLC and Cumberland FS Anchor Parcel Owner LLC, each a Delaware limited liability company that is owned and controlled by affiliates of Brookfield Properties and CBRE Investment Management. Each borrower is structured to be a single purpose bankruptcy-remote entity, having two independent directors in its organizational structure. Legal counsel to the borrowers delivered a non-consolidation opinion in connection with the origination of the Cumberland Mall Whole Loan.
| THE INFORMATION IN THIS STRUCTURAL AND COLLATERAL TERM SHEET IS NOT COMPLETE AND MAY BE AMENDED PRIOR TO THE TIME OF SALE. THIS TERM SHEET IS NOT AN OFFER TO SELL THESE SECURITIES AND IT IS NOT A SOLICITATION OF AN OFFER TO BUY THESE SECURITIES IN ANY JURISDICTION WHERE THE OFFER OR SALE IS NOT PERMITTED. |
| | 84 | |
| Structural and Collateral Term Sheet | | BMO 2023-5C1 |
| No. 7 – Cumberland Mall |
Cumberland FS Anchor Parcel Owner LLC owns a parcel that includes the Dick’s Sporting Goods, Round 1 and Planet Fitness stores, and Cumberland Mall, LLC owns the remainder of the Cumberland Mall Property.
The Borrower Sponsor. The borrower sponsor and non-recourse carveout guarantor is BPR Nimbus LLC, an affiliate of Brookfield Properties. Brookfield Properties develops and operates real estate investments on behalf of Brookfield Asset Management, which is one of the largest alternative asset managers in the world. Formerly known as General Growth Properties, Inc., Brookfield Properties is owned by affiliates of Brookfield Asset Management and ranks among the largest retail real estate companies in the United States. Its portfolio of retail properties spans the nation, encompassing over 200 retail centers and representing over 155 million square feet of retail space. Brookfield Properties is focused exclusively on managing, leasing and redeveloping retail properties. The borrower sponsor is affiliated with the borrower sponsors of the Short Pump Town Center Mortgage Loan, the Oxmoor Center Mortgage Loan and the Heritage Plaza Mortgage Loan, which are also being contributed to the BMO 2023-5C1 transaction.
CBRE Investment Management is a leading investment management firm that delivers sustainable investment solutions across real assets categories, geographies, risk profiles and execution formats to clients, people and communities. CBRE is responsible for more than $148.9 billion of assets under management with over 1,000 team members and 30 offices worldwide.
Property Management. The Cumberland Mall Property is managed by Brookfield Properties Retail Inc., an affiliate of the borrower sponsor.
Escrows and Reserves. At origination, the borrowers deposited approximately $1,987,019 into a TI/LC reserve and $267,919 into a gap rent reserve.
Tax Escrows – On each due date during a Cash Management Period, (as defined below) the borrowers are required to fund 1/12th of the taxes that the lender reasonably estimates will be payable over the next-ensuing 12-month period.
Insurance Escrows – On each due date during a Cash Management Period, the borrowers are required to fund 1/12th of the insurance premiums that the lender reasonably estimates will be required for the renewal of the insurance coverage. These deposits will be waived as long as an acceptable blanket policy is in effect, which was the case as of the origination date.
Replacement Reserve – During the continuance of a Cash Management Period, the borrowers are required to pay on each monthly payment date (subject to the Replacement Reserve Threshold (as defined below)) an amount equal to 1/12th of $0.25 per owned leasable square foot at the Cumberland Mall Property (which is initially estimated to be $14,744).
TI/LC Reserve – During the continuance of a Cash Management Period, the borrowers are required to pay on each monthly payment date (subject to the Rollover Reserve Threshold (as defined below)) an amount equal to 1/12th of $1.00 per owned leasable square foot at the Cumberland Mall Property (which initially will be $58,976).
The “Replacement Reserve Threshold” means 24 times the replacement reserve monthly deposit (initially $353,853).
The “Rollover Reserve Threshold” means 24 times the rollover reserve monthly deposit (initially $1,415,412).
Anchor Tenant Reserve — During the continuance of an Anchor Tenant Trigger Event (as defined below), the borrowers are required to pay on each monthly payment date an amount equal to all initial excess cash flow (subject to the individual anchor threshold amount (which is equal to the product of $50.00 and the aggregate amount of gross leasable square footage of the applicable Anchor Tenant (as defined below) space as of the origination date) for all Anchor Tenants other than Costco) for tenant improvements and leasing commissions, budgeted construction costs, required landlord work and other related costs associated with re-tenanting the applicable space or any other space at the Cumberland Mall Property.
“Anchor Tenant Trigger Event” means any Anchor Tenant (i) has “gone dark” (i.e., ceased to be in occupancy or otherwise ceased to utilize the demised premises for business purposes until such time as such Anchor Tenant operates its business at the Cumberland Mall Property for a period of no less than thirty consecutive days during normal business hours), other than (A) a temporary closure in connection with a restoration, repair or renovation, (B) any other temporary closure with a duration of less than sixty days, (C) a temporary closure in compliance with applicable law, regulations and/or governmental mandates, or (D) a temporary closure by reason of civil unrest, (ii) is the subject of a bankruptcy proceeding (until such time as such bankruptcy is dismissed or the Anchor Tenant has emerged from bankruptcy or, if the premises occupied by such Anchor Tenant are leased from the borrowers, such lease is (x) accepted and affirmed by such Anchor Tenant in the applicable bankruptcy proceeding or (y) assumed by a replacement Anchor Tenant), (iii) has vacated its premises (or has given written notice of its intention to vacate) (until such time as such Anchor Tenant has reoccupied its premises or rescinded any notice of intent to vacate, if applicable), (iv) has terminated, canceled or surrendered its Anchor Lease (or delivered written notice of its intent to do so) (until such time as such Anchor Tenant has rescinded any notice of intent to terminate, cancel or surrender such Anchor Tenant premises, if applicable), or (v) fails to renew its Anchor Lease within the applicable renewal option period (until such time as such Anchor Tenant renews and/or extend its Anchor Lease pursuant to the terms thereof) provided in such anchor lease.
An “Anchor Tenant” means Macy’s, Costco, Round 1 or Dick’s Sporting Goods.
| THE INFORMATION IN THIS STRUCTURAL AND COLLATERAL TERM SHEET IS NOT COMPLETE AND MAY BE AMENDED PRIOR TO THE TIME OF SALE. THIS TERM SHEET IS NOT AN OFFER TO SELL THESE SECURITIES AND IT IS NOT A SOLICITATION OF AN OFFER TO BUY THESE SECURITIES IN ANY JURISDICTION WHERE THE OFFER OR SALE IS NOT PERMITTED. |
| | 85 | |
| Structural and Collateral Term Sheet | | BMO 2023-5C1 |
| No. 7 – Cumberland Mall |
An “Anchor Lease” means a lease with an Anchor Tenant.
Lockbox / Cash Management. The Cumberland Mall Whole Loan is structured with a hard lockbox and springing cash management. The borrowers are required to cause all rents to be deposited directly into the lender-controlled lockbox account. The Cumberland Mall Whole Loan documents also require that all rents received by the borrowers or property manager be deposited into the lockbox account within two business days of receipt. During the continuance of a Cash Management Period, funds on deposit in the lockbox account are required to be swept on a daily basis into a lender-controlled cash management account, and applied to pay monthly debt service, required reserves and budgeted or approved property expenses. During the continuance of a Cash Sweep Period (as defined below) (but not during a Cash Management Period), an amount equal to all excess cash flow is reserved by cash management bank for the benefit of the lender, and during an Anchor Tenant Trigger Event certain excess cash flow is reserved as described above under “Escrows and Reserves—Anchor Tenant Reserve.”
A “Cash Management Period” will commence upon the occurrence of a Debt Yield Event (Cash Management Period) (as defined below) and will last until the debt yield is equal to or greater than 11.0% for two consecutive calendar quarters.
A “Cash Sweep Period” will commence upon the occurrence of an event of default or Debt Yield Event (Cash Sweep Period) (as defined below) and will last until the applicable event of default is cured and/or the debt yield is greater than 10.5% for two consecutive calendar quarters, as applicable. During a Cash Sweep Period, all excess cash flow is reserved in a lender-controlled account and the lender has certain approval rights with respect to the annual budget, material leases, and collection of lease termination payments. Solely for purposes of determining whether a Cash Sweep Period has been cured in the case of a Cash Sweep Period due to a Debt Yield Event (Cash Sweep Period), the denominator in the calculation of debt yield will equal the then aggregate outstanding principal balance of the Cumberland Mall Whole Loan as of such date, less any funds then on deposit with the lender or servicer in the excess cash flow reserve fund, provided that, following any such calculation giving credit to amounts in the excess cash flow reserve fund, such amounts will remain in the excess cash flow reserve fund and cannot be withdrawn or released for any reason until a Cash Sweep Period no longer exists without giving credit to amounts in the excess cash flow reserve fund (and all amounts in the excess cash flow reserve fund in excess of the amount so credited will be released to borrowers).
A “Debt Yield Event (Cash Management Period)” will mean the determination that the debt yield is less than 11.0% as of the end of any two consecutive calendar quarters.
A “Debt Yield Event (Cash Sweep Period)” will mean the determination that the debt yield is less than 10.5% as of the end of any two consecutive calendar quarters.
Subordinate and Mezzanine Debt. None.
Partial Release. The borrowers may obtain the release of (A) one or more vacant, non-income producing and unimproved (or improved only by landscaping, surface parking or utility facilities that are either readily re-locatable or will continue to serve the Cumberland Mall Property) parcels (including “air rights” parcels but excluding any Anchor Tenant parcel) or outlots, including, without limitation, certain pre-approved release parcels set forth in the Cumberland Mall Whole Loan documents or (B) any Expansion Parcel (as defined below), including any Anchor Tenant parcel that is an Expansion Parcel, upon satisfaction of specified conditions including, among other things, that (i) there is no event of default, (ii) the parcel subject to the release is not necessary for the remaining Cumberland Mall Property to comply with zoning or legal requirements, (iii) confirmation that the release will not result in the downgrade, withdrawal or qualification of the then current rating assigned to any class of certificates (provided that such confirmation will not be required for release of an Expansion Parcel (as defined below) or if the rating agency has waived review or failed to respond within 30 days to a request for such confirmation), (iv) the release will not result in a loan-to-value ratio that does not comply with REMIC guidelines, provided that the borrowers may prepay the Cumberland Mall Whole Loan, without any prepayment fee or yield maintenance premium, to achieve such condition, and (v) the release will not result in a material diminution in the value of the Cumberland Mall Property.
Ground Lease. None.
Acquired Expansion Parcels. The borrowers have the right, at their own expense, to acquire one or more parcels of land that constitutes an integral part of, or adjoins, the Cumberland Mall Property, including any Anchor Tenant premises, which land was not owned by the borrowers on the origination date (such acquired land, an “Expansion Parcel”), to become additional collateral for the Cumberland Mall Whole Loan, upon satisfaction of specified conditions including, among other things, that (i) there is no event of default, (ii) the borrowers acquire a fee simple or leasehold interest in the applicable Expansion Parcel, and (iii) the borrowers satisfy similar conditions as are set forth under clause (iii) under “Real Estate Substitution” with respect to the Expansion Parcel.
Real Estate Substitution. In addition, the borrowers are permitted to obtain the release of collateral parcels (an “Exchange Parcel”) from the lien of the mortgage in exchange for the substitution of new parcels in which the borrowers acquire a fee or leasehold interest (each, an “Acquired Parcel”) as collateral for the Cumberland Mall Whole Loan upon 20 days prior notice, subject to the satisfaction of certain conditions, including among other things, that: (i) the Exchange Parcel (unless it is an Expansion Parcel) is vacant, non-income producing and unimproved or improved only by landscaping, surface parking or utility facilities that are readily relocatable or that will continue to serve the Cumberland Mall Property (and the borrowers are able to make certain zoning representations as to the Acquired Parcel to the same extent as made with respect to the Exchange Parcel), (ii) the Acquired Parcel is reasonably equivalent in value to the
| THE INFORMATION IN THIS STRUCTURAL AND COLLATERAL TERM SHEET IS NOT COMPLETE AND MAY BE AMENDED PRIOR TO THE TIME OF SALE. THIS TERM SHEET IS NOT AN OFFER TO SELL THESE SECURITIES AND IT IS NOT A SOLICITATION OF AN OFFER TO BUY THESE SECURITIES IN ANY JURISDICTION WHERE THE OFFER OR SALE IS NOT PERMITTED. |
| | 86 | |
| Structural and Collateral Term Sheet | | BMO 2023-5C1 |
| No. 7 – Cumberland Mall |
Exchange Parcel, as established by a letter of value from the appraiser which appraised the Cumberland Mall Property or an appraiser of comparable experience selected by the borrowers, (iii) with respect to the Acquired Parcel, the borrowers have delivered, among other things (a) an environmental report indicating no hazardous substances except for nominal amounts (except as permitted under clause (d) below), (b) security documents creating a mortgage lien on the Acquired Parcel, and title insurance, (c) if the Acquired Parcel is improved, subject to certain exceptions, a property condition report indicating that the Acquired Parcel is in good condition and (d) if repairs are recommended by the property condition report or if the environmental report discloses the presence of hazardous materials at the Acquired Parcel, in each case in an amount equal to or greater than $10,000,000, cash or an indemnity from the guarantor, certain of its affiliates, or an entity otherwise meeting ratings or financial tests set forth in the Cumberland Mall Whole Loan documents, in an amount equal to 125% of any estimated repairs or remediation costs, as applicable, (iv) the substitution will not result in a loan-to-value ratio that does not comply with REMIC guidelines, provided that the borrowers may prepay the Cumberland Mall Whole Loan, without any prepayment fee or yield maintenance premium, to achieve such condition, (v) the borrowers acquire fee or leasehold title in the Acquired Parcel and (vi) the lender has received a rating agency confirmation from the applicable rating agencies, unless the applicable rating agency declines or fails to respond to the request for such confirmation.
| THE INFORMATION IN THIS STRUCTURAL AND COLLATERAL TERM SHEET IS NOT COMPLETE AND MAY BE AMENDED PRIOR TO THE TIME OF SALE. THIS TERM SHEET IS NOT AN OFFER TO SELL THESE SECURITIES AND IT IS NOT A SOLICITATION OF AN OFFER TO BUY THESE SECURITIES IN ANY JURISDICTION WHERE THE OFFER OR SALE IS NOT PERMITTED. |
| | 87 | |
| Structural and Collateral Term Sheet | | BMO 2023-5C1 |
| No. 8 – Gilardian NYC Portfolio II |
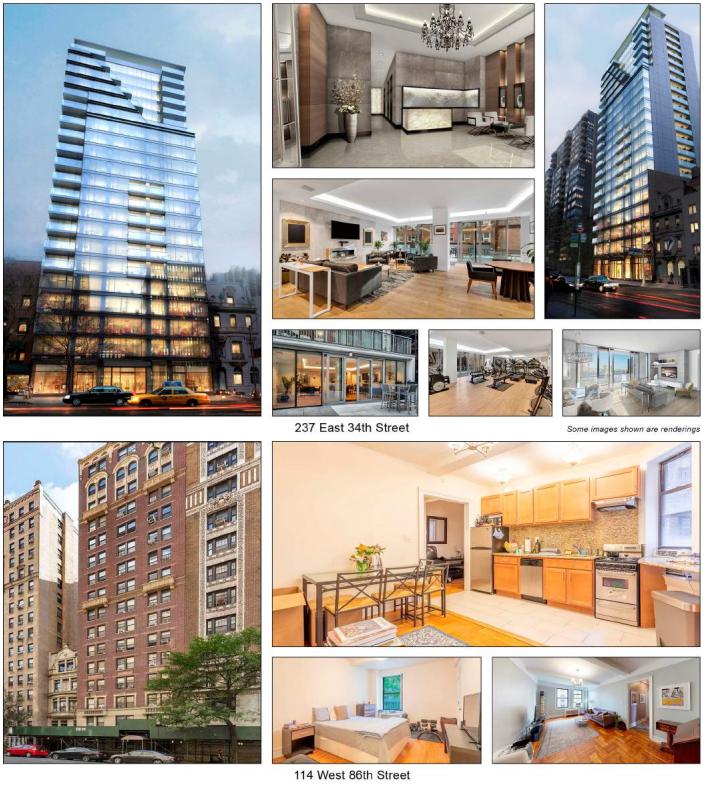
| THE INFORMATION IN THIS STRUCTURAL AND COLLATERAL TERM SHEET IS NOT COMPLETE AND MAY BE AMENDED PRIOR TO THE TIME OF SALE. THIS TERM SHEET IS NOT AN OFFER TO SELL THESE SECURITIES AND IT IS NOT A SOLICITATION OF AN OFFER TO BUY THESE SECURITIES IN ANY JURISDICTION WHERE THE OFFER OR SALE IS NOT PERMITTED. |
| | 88 | |
| Structural and Collateral Term Sheet | | BMO 2023-5C1 |
| No. 8 – Gilardian NYC Portfolio II |
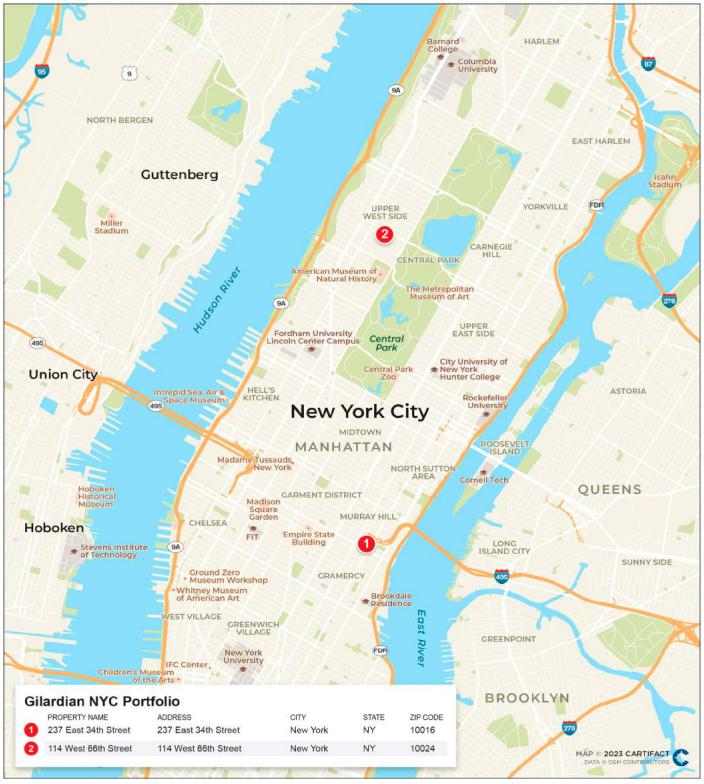
| THE INFORMATION IN THIS STRUCTURAL AND COLLATERAL TERM SHEET IS NOT COMPLETE AND MAY BE AMENDED PRIOR TO THE TIME OF SALE. THIS TERM SHEET IS NOT AN OFFER TO SELL THESE SECURITIES AND IT IS NOT A SOLICITATION OF AN OFFER TO BUY THESE SECURITIES IN ANY JURISDICTION WHERE THE OFFER OR SALE IS NOT PERMITTED. |
| | 89 | |
| Structural and Collateral Term Sheet | | BMO 2023-5C1 |
| No. 8 – Gilardian NYC Portfolio II |
| Mortgage Loan Information | | Property Information |
| Mortgage Loan Seller: | BMO | | Single Asset / Portfolio: | Portfolio |
| Original Principal Balance(1): | $41,000,000 | | Title: | Fee |
| Cut-off Date Principal Balance(1): | $41,000,000 | | Property Type – Subtype(4): | Multifamily – Various |
| % of IPB: | 5.4% | | Net Rentable Area (Units): | 201 |
| Loan Purpose: | Refinance | | Location: | New York, NY |
| Borrowers: | 107 West 68th Street Delaware, LLC, 245 West 51st Street Delaware, LLC, 324 W. 84th Delaware, LLC, 1443 York Delaware, LLC and 2410 Broadway Owner, LLC | | Year Built / Renovated: | Various / Various |
| Occupancy(4): | 96.5% |
| Occupancy Date: | 3/31/2023 |
| 4th Most Recent NOI (As of): | $3,186,055 (12/31/2020) |
| 3rd Most Recent NOI (As of): | $3,591,961 (12/31/2021) |
| 2nd Most Recent NOI (As of): | $5,112,066 (12/31/2022) |
| Borrower Sponsors: | Robert Gilardian and Albert Gilardian | | Most Recent NOI (As of): | $5,504,026 (Various) |
| Interest Rate: | 4.18762962962963% | | UW Economic Occupancy: | 97.0% |
| Note Date: | 6/1/2023 | | UW Revenues: | $10,258,769 |
| Maturity Date: | 6/6/2028 | | UW Expenses: | $3,597,703 |
| Interest-only Period: | 60 months | | UW NOI: | $6,661,066 |
| Original Term: | 60 months | | UW NCF: | $6,606,600 |
| Original Amortization Term: | None | | Appraised Value / Per Unit(5): | $137,700,000 / $685,075 |
| Amortization Type: | Interest Only | | Appraisal Date: | Various |
| Call Protection(2): | L(26),D(28),O(6) | | | |
| Lockbox / Cash Management: | Soft (Residential), Hard (Commercial) / Springing | | | |
| Additional Debt(1): | Yes | | | |
| Additional Debt Balance(1): | $13,000,000 / $41,000,000 | | | |
| Additional Debt Type(1): | Pari Passu / Mezzanine | | | |
| | | | | |
| | | | | |
| Escrows and Reserves(3) | | Financial Information(1) |
| | Initial | Monthly | Initial Cap | | | Mortgage | Total Debt |
| Taxes: | $0 | $216,566 | N/A | | Cut-off Date Loan / Unit: | $268,657 | $472,637 |
| Insurance: | $126,563 | Springing | N/A | | Maturity Date Loan / Unit: | $268,657 | $472,637 |
| Replacement Reserve(6): | $0 | $3,505 | N/A | | Cut-off Date LTV(5): | 39.2% | 69.0% |
| TI/LC: | $0 | $1,034 | N/A | | Maturity Date LTV(5): | 39.2% | 69.0% |
| Deferred Maintenance: | $112,649 | $0 | N/A | | UW NCF DSCR: | 2.88x | 1.08x |
| Debt Service: | $500,000 | $0 | N/A | | UW NOI Debt Yield: | 12.3% | 7.0% |
| | | | | | | | |
| Sources and Uses |
| Sources | Proceeds | % of Total | | Uses | Proceeds | % of Total | |
| Whole Loan | $54,000,000 | 56.8 | % | | Loan Payoff | $87,557,263 | 92.2 | % |
| Mezzanine | 41,000,000 | 43.2 | | | Closing Costs | 6,655,112 | 7.0 | |
| | | | | Reserves | 739,212 | 0.8 | |
| | | | | Return of Equity | 48,413 | 0.1 | |
| Total Sources | $95,000,000 | 100.0 | % | | Total Uses | $95,000,000 | 100.0 | % |
| (1) | The Gilardian NYC Portfolio II Whole Loan (as defined below) is part of a whole loan evidenced by two pari passu notes with an aggregate original principal balance and aggregate Cut-off Date Balance of $54,000,000. The Gilardian NYC Portfolio II Total Debt (as defined below) consists of the Gilardian NYC Portfolio II Whole Loan and a mezzanine loan with a principal balance of $41,000,000. Financial Information in the chart above reflects the Gilardian NYC Portfolio II Whole Loan and, where indicated, the Gilardian NYC Portfolio II Total Debt. For additional information, see the “Whole Loan Summary” chart herein. |
| (2) | The borrowers may defease The Gilardian NYC Portfolio II Whole Loan at any time in connection with certain permitted property leases after the earlier to occur of (x) June 1, 2027 and (y) the date that is two years after the closing date of the securitization that includes the last pari passu note to be securitized. The assumed lockout period of 26 payments is based on the expected BMO 2023-5C1 securitization closing date in August 2023. The actual lockout period may be longer. |
| (3) | For a full description of Escrows and Reserves, see “Escrows and Reserves” below. |
| (4) | The Gilardian NYC Portfolio Properties (as defined below) contain 11 commercial units totaling 12,405 square feet of commercial space, which are 100% occupied by six retail tenants and five restaurants, which represent approximately 17.5% of the net rental income from the Gilardian NYC Portfolio II Properties. The information regarding occupancy and number of units shown does not include any commercial space at the properties unless otherwise indicated herein. |
| (5) | The Cut-off Date LTV and Maturity Date LTV are based on the aggregate "as-is" appraised value of $137,700,000. |
| THE INFORMATION IN THIS STRUCTURAL AND COLLATERAL TERM SHEET IS NOT COMPLETE AND MAY BE AMENDED PRIOR TO THE TIME OF SALE. THIS TERM SHEET IS NOT AN OFFER TO SELL THESE SECURITIES AND IT IS NOT A SOLICITATION OF AN OFFER TO BUY THESE SECURITIES IN ANY JURISDICTION WHERE THE OFFER OR SALE IS NOT PERMITTED. |
| | 90 | |
| Structural and Collateral Term Sheet | | BMO 2023-5C1 |
| No. 8 – Gilardian NYC Portfolio II |
| (6) | The ongoing monthly escrow of the replacement reserve provides $3,350 for the residential portion of the Gilardian NYC Portfolio II Properties and $155 for the commercial portion of the Gilardian NYC Portfolio II Properties. |
The Loan. The eighth largest mortgage loan (the “Gilardian NYC Portfolio II Mortgage Loan”) is evidenced by the controlling Note A-1 and is part of a whole loan evidenced by two pari passu promissory notes with an aggregate original principal balance and aggregate Cut-off Date Balance of $54,000,000 (the “Gilardian NYC Portfolio II Whole Loan”). The Gilardian NYC Portfolio II Whole Loan is secured by a first lien mortgage on the borrowers’ fee interest in three high-rise and two mid-rise multifamily properties located in New York, New York (the “Gilardian NYC Portfolio II Properties”). The Gilardian NYC Portfolio II Whole Loan has a five-year term and is interest only for the full term of the mortgage loan. The Gilardian NYC Portfolio II Whole Loan will be serviced under the pooling and servicing agreement for the BMO 2023-5C1 trust. The “Gilardian NYC Portfolio II Total Debt” consists of the Gilardian NYC Portfolio II Whole Loan and a mezzanine loan having a principal amount of $41,000,000. For additional information, see “Mezzanine Debt” below.
| Whole Loan Summary |
| Note | Original Balance | Cut-off Date Balance | | Note Holder | Controlling Piece |
| A-1 | $41,000,000 | $41,000,000 | | BMO 2023-5C1 | Yes |
| A-2(1) | $13,000,000 | $13,000,000 | | BMO | No |
| Whole Loan | $54,000,000 | $54,000,000 | | | |
| (1) | Expected to be contributed to a future securitization. |
The Properties. The Gilardian NYC Portfolio II Properties are comprised of the following three high-rise and two mid-rise multifamily properties located in New York, New York that were built between 1912 and 1930: the “2410-2418 Broadway Property”, the “245 W 51st Property”, the “324-326 W 84th Property”, the “107 W 68th Property” and the “1443 York Avenue Property” respectively.
The following table presents certain information relating to the residential units at the Gilardian NYC Portfolio II Properties:
| Portfolio Summary |
| Property Name | Year Built / Renovated(1) | Units(2) | Occupancy %(2) | Allocated
Cut-off Date Whole Loan Amount (“ALA”) | % of ALA | Appraised Value(1) | % of Appraised Value | UW NOI | % of UW NOI |
| 2410-2418 Broadway | 1915 / 1989 | 46 | 93.5% | $18,440,000 | 34.1 | % | $42,600,000 | 30.9 | % | $2,325,298 | 34.9% |
| 245 W 51st | 1912 / 1998 | 65 | 96.9 | 17,230,000 | 31.9 | | 41,600,000 | 30.2 | | 1,982,521 | 29.8 |
| 324-326 W 84th | 1914 / NAP | 48 | 97.9 | 10,400,000 | 19.3 | | 28,400,000 | 20.6 | | 1,155,512 | 17.3 |
| 107 W 68th | 1930 / NAP | 30 | 100.0 | 5,920,000 | 11.0 | | 14,300,000 | 10.4 | | 710,989 | 10.7 |
| 1443 York Avenue | 1920 / NAP | 12 | 91.7 | 2,010,000 | 3.7 | | 10,800,000 | 7.8 | | 486,745 | 7.3 |
| Total/Wtd. Avg. | | 201 | 96.5% | $54,000,000 | 100.0 | % | $137,700,000 | 100.0 | % | $6,661,066 | 100.0% |
| (2) | Based on the underwritten rent roll as of March 31, 2023. The information regarding occupancy and number of units shown does not include any commercial space at the properties. |
| THE INFORMATION IN THIS STRUCTURAL AND COLLATERAL TERM SHEET IS NOT COMPLETE AND MAY BE AMENDED PRIOR TO THE TIME OF SALE. THIS TERM SHEET IS NOT AN OFFER TO SELL THESE SECURITIES AND IT IS NOT A SOLICITATION OF AN OFFER TO BUY THESE SECURITIES IN ANY JURISDICTION WHERE THE OFFER OR SALE IS NOT PERMITTED. |
| | 91 | |
| Structural and Collateral Term Sheet | | BMO 2023-5C1 |
| No. 8 – Gilardian NYC Portfolio II |
The following table presents certain information relating to the commercial tenants at the Gilardian NYC Portfolio II Properties:
| Commercial Tenant Summary(1) |
| Tenant | Property | Credit Rating (Moody’s/Fitch/S&P)(2) | Net Rentable Area (Sq. Ft.) | % of Net Rentable Area | U/W Annual Rent Per Sq. Ft.(3) | % of Total U/W Commercial income(3) | Lease Expiration |
| Japanese Restaurant | 245 W 51st | NR/NR/NR | 2,500 | 20.2 | % | $88.80 | 12.1 | % | 11/30/2031 |
| Indian Restaurant | 245 W 51st | NR/NR/NR | 2,500 | 20.2 | | $116.31 | 15.8 | | 1/31/2025 |
| West Side Judaica & Bookstore | 2410-2418 Broadway | NR/NR/NR | 1,800 | 14.5 | | $146.67 | 14.4 | | 4/30/2027 |
| Restaurant | 2410-2418 Broadway | NR/NR/NR | 1,000 | 8.1 | | $252.00 | 13.7 | | 3/31/2025 |
| Pizza Shop | 1443 York Avenue | NR/NR/NR | 800 | 6.4 | | $196.69 | 8.6 | | 12/31/2029 |
| Ice Cream Shop | 1443 York Avenue | NR/NR/NR | 800 | 6.4 | | $106.54 | 4.6 | | 7/31/2024 |
| Café | 2410-2418 Broadway | NR/NR/NR | 720 | 5.8 | | $116.67 | 4.6 | | 3/31/2025 |
| Corner Cleaners | 2410-2418 Broadway | NR/NR/NR | 665 | 5.4 | | $184.93 | 6.7 | | 4/30/2029 |
| Yorkville Convenience | 1443 York Avenue | NR/NR/NR | 600 | 4.8 | | $180.00 | 5.9 | | 9/30/2029 |
| Dunkin Donuts | 2410-2418 Broadway | NR/NR/NR | 570 | 4.6 | | $253.05 | 7.8 | | 4/30/2029 |
| Beauty Salon | 2410-2418 Broadway | NR/NR/NR | 450 | 3.6 | | $238.80 | 5.8 | | 1/31/2027 |
| Total Occupied | | | 12,405 | 100.0 | % | $148.17 | 100.0 | % | |
| Vacant | | | 0 | 0.0 | | | | |
| Total / Wtd. Avg. | | | 12,405 | 100.0 | % | | | |
| (1) | Based on the underwritten rent roll dated March 31, 2023. |
| (2) | In certain instances, ratings provided are those of the parent company of the entity shown, whether or not the parent company guarantees the lease. |
| (3) | Includes contractual rent steps through April 1, 2024. The total UW commercial income attributable to commercial tenants at the Gilardian NYC Portfolio II Properties represents approximately 17.5% of the Underwritten Net Rent Income. |
The following table presents certain information relating to the residential units at the Gilardian NYC Portfolio II Properties:
| Unit Type Summary(1) |
| Unit Type | Units | Occupancy % | Annual UW Rental Income | % of Annual Rental Income |
| Studio MR | 1 | 100.0% | $29,400 | 0.4 | % |
| 1BR MR | 49 | 100.0 | 1,987,560 | 23.7 | |
| 2BR MR | 53 | 98.1 | 2,700,060 | 32.2 | |
| 2BRPH MR | 1 | 100.0 | 75,000 | 0.9 | |
| 3BR MR | 17 | 100.0 | 1,133,520 | 13.5 | |
| 4BR MR | 10 | 100.0 | 939,060 | 11.2 | |
| Market Rent Total | 131 | 99.2% | $6,864,600 | 81.9 | % |
| Studio RC | 1 | 100.0 | 2,665 | 0.0 | |
| Studio RS | 4 | 100.0 | 100,393 | 1.2 | |
| 1BR RC | 1 | 100.0 | 13,868 | 0.2 | |
| 1BR RS | 32 | 90.6 | 651,630 | 7.8 | |
| 2BR RS | 20 | 95.0 | 418,947 | 5.0 | |
| 4BR RC | 2 | 100.0 | 19,896 | 0.2 | |
| 4BR RS | 10 | 80.0 | 312,517 | 3.7 | |
| Rent-Controlled / -Stabilized Total | 70 | 91.4% | $1,519,916 | 18.1 | % |
| Total/Wtd. Avg. | 201 | 96.5% | $8,384,516 | 100.0 | % |
| (1) | Based on the underwritten rent roll dated March 31, 2023.
|
| THE INFORMATION IN THIS STRUCTURAL AND COLLATERAL TERM SHEET IS NOT COMPLETE AND MAY BE AMENDED PRIOR TO THE TIME OF SALE. THIS TERM SHEET IS NOT AN OFFER TO SELL THESE SECURITIES AND IT IS NOT A SOLICITATION OF AN OFFER TO BUY THESE SECURITIES IN ANY JURISDICTION WHERE THE OFFER OR SALE IS NOT PERMITTED. |
| | 92 | |
| Structural and Collateral Term Sheet | | BMO 2023-5C1 |
| No. 8 – Gilardian NYC Portfolio II |
2410-2418 Broadway Property. As of March 31, 2023, the residential units at the 2410-2418 Broadway Property were 93.5% occupied. The 0.16-acre parcel is improved with a 12-story apartment building with 5,205 square feet of commercial space on the bottom floor that is 100% occupied by six tenants. Three of the commercial tenants are retail and three are restaurants, the largest being a bookstore occupying 1,800 square feet followed by a restaurant occupying 1,000 square feet. The 2410-2418 Broadway Property features 46 units in total with two-, three- and four-bedroom layouts, two of which are rent-controlled and 21 of which are rent-stabilized, ranging in size from 1,100 to 1,675 square feet. Market rents range from $5,500 to $8,400 per month, with an average market rent of approximately $6,896 and an average unit size of 1,363 square feet. Unit features include radiator, window A/C, smoke alarms, and an electric oven / range combination.
The following table presents detailed information with respect to the market rate units at the 2410-2418 Broadway Property:
| Market Rate Unit Summary |
| Unit Type | No. of Units(1) | % of Total(2) | Average Unit Size (SF)(1) | Average Monthly Rental Rate(1) | Average Monthly Rental Rate per SF(1) | Average Monthly Market Rental Rate(3) | Average Monthly Market Rental Rate per SF(3) |
| 2 BR | 11 | 47.8 | % | 1,100 | $4,730 | $4.30 | $5,500 | $5.00 |
| 3 BR | 3 | 13.0 | | 1,100 | 5,750 | 5.23 | 6,600 | 6.00 |
| 4 BR | 9 | 39.1 | | 1,675 | 8,056 | 4.81 | 8,400 | 5.01 |
| Total/Wtd. Avg. | 23 | 100.0 | % | 1,325 | $6,165 | $4.62 | $6,778 | $5.14 |
| (1) | Based on the underwritten rent roll as of March 31, 2023. |
| (2) | % of Total represents the percentage of the total market rate units at the 2410-2418 Broadway Property. |
The following table presents detailed information with respect to the rent-controlled units at the 2410-2418 Broadway Property:
| Rent-Controlled Unit Summary |
| Unit Type | No. of Units(1) | % of Total(2) | Average Unit Size (SF)(1) | Average Monthly Rental Rate(1) | Average Monthly Rental Rate per SF(1) |
| 4BR | 2 | 100.0% | 1,675 | $829 | $0.49 |
| Total/Wtd. Avg. | 2 | 100.0% | 1,675 | $829 | $0.49 |
| (1) | Based on the underwritten rent roll as of March 31, 2023. |
| (2) | % of Total represents the percentage of the total rent-controlled units at the 2410-2418 Broadway Property. |
The following table presents detailed information with respect to the rent-stabilized units at the 2410-2418 Broadway Property:
| Rent-Stabilized Unit Summary |
| Unit Type | No. of Units(1) | % of Total(2) | Average Unit Size (SF)(1) | Average Monthly Rental Rate(1)(3) | Average Monthly Rental Rate per SF(1)(3) |
| 2BR | 11 | 52.4 | % | 1,100 | $1,713 | $1.56 |
| 4BR | 10 | 47.6 | | 1,675 | 2,677 | 1.60 |
| Total/Wtd. Avg. | 21 | 100.0 | % | 1,374 | $2,142 | $1.58 |
| (1) | Based on the underwritten rent roll as of March 31, 2023. |
| (2) | % of Total represents the percentage of the total rent-stabilized units at the 2410-2418 Broadway Property. |
| (3) | Average Monthly Rental Rate and Average Monthly Rental Rate per SF excludes vacant units. |
245 W 51st Property. As of March 31, 2023, the 245 W 51st Property was 96.9% occupied. The 0.19-acre parcel is improved with a 9-story apartment building with 5,000 square feet of commercial space that is 100% occupied by two restaurant tenants, one being an Indian restaurant (Saar) and the other a Japanese restaurant. The 245 W 51st Property features 65 residential units in total, 18 of which are rent-stabilized, and one is rent-controlled, with studio, one-, two- and three-bedroom layouts ranging in size from 600 to 900 square feet. Market rents range from approximately $2,600 to $5,800 per month, with an average market rent of approximately $4,476 and an average unit size of 742 square feet. Unit features include heating, smoke alarms, and an oven/range combination.
| THE INFORMATION IN THIS STRUCTURAL AND COLLATERAL TERM SHEET IS NOT COMPLETE AND MAY BE AMENDED PRIOR TO THE TIME OF SALE. THIS TERM SHEET IS NOT AN OFFER TO SELL THESE SECURITIES AND IT IS NOT A SOLICITATION OF AN OFFER TO BUY THESE SECURITIES IN ANY JURISDICTION WHERE THE OFFER OR SALE IS NOT PERMITTED. |
| | 93 | |
| Structural and Collateral Term Sheet | | BMO 2023-5C1 |
| No. 8 – Gilardian NYC Portfolio II |
The following table presents detailed information with respect to the market rate units at 245 W 51st Property:
| Market Rate Unit Summary |
| Unit Type | No. of Units(1) | % of Total(2) | Average Unit Size (SF)(1) | Average Monthly Rental Rate(1)(3) | Average Monthly Rental Rate per SF(1)(4) | Average Monthly Market Rental Rate(4) | Average Monthly Market Rental Rate per SF(4) |
| 1BR | 13 | 28.3 | % | 637 | $3,416 | $5.37 | $4,000 | $6.28 |
| 2BR | 24 | 52.2 | | 748 | $4,240 | $5.67 | $4,750 | $6.35 |
| 3BR | 9 | 19.6 | | 900 | $5,609 | $6.23 | $5,800 | $6.44 |
| Total/Wtd. Avg. | 46 | 100.0 | % | 746 | $4,276 | $5.69 | $4,743 | $6.35 |
| (1) | Based on the underwritten rent roll as of March 31, 2023. |
| (2) | % of Total represents the percentage of the total market rate units at the 245 W 51st Property. |
| (3) | One vacant 2BR unit has been excluded from the calculation of the Average Monthly Rental Rate and Average Monthly Rental Rate per SF. |
The following table presents detailed information with respect to the rent-controlled units at the 245 W 51st Property:
| Rent-Controlled Unit Summary |
| Unit Type | No. of Units(1) | % of Total(2) | Average Unit Size (SF)(1) | Average Monthly Rental Rate(1) | Average Monthly Rental Rate per SF(1) |
| Studio | 1 | 100.0% | 600 | $222 | $0.37 |
| Total/Wtd. Avg. | 1 | 100.0% | 600 | $222 | $0.37 |
| (1) | Based on the underwritten rent roll as of March 31, 2023. |
| (2) | % of Total represents the percentage of the total rent-controlled units at the 245 W 51st Property. |
The following table presents detailed information with respect to the rent-stabilized units at the 245 W 51st Property:
| Rent-Stabilized Unit Summary |
| Unit Type | No. of Units(1) | % of Total(2) | Average Unit Size (SF)(1) | Average Monthly Rental Rate(1)(3) | Average Monthly Rental Rate per SF(1)(3) |
| Studio | 4 | 22.2 | % | 600 | $2,092 | $3.49 |
| 1BR | 9 | 50.0 | | 731 | $1,372 | $1.87 |
| 2BR | 5 | 27.8 | | 860 | $2,016 | $2.34 |
| Total/Wtd. Avg. | 18 | 100.0 | % | 738 | $1,731 | $2.39 |
| (1) | Based on the underwritten rent roll as of March 31, 2023. |
| (2) | % of Total represents the percentage of the total rent-stabilized units at the 245 W 51st Property. |
| (3) | Average Monthly Rental Rate and Average Monthly Rental Rate per SF excludes one vacant 1BR unit. |
324-326 W 84th Property. As of March 31, 2023, the 324-326 W 84th Property was 97.9% occupied. The 0.08-acre parcel is improved with a 12-story apartment building with no commercial space. The 324-326 W 84th Property features 48 units in total, 12 of which are rent-stabilized, and one is rent-controlled, with one- and two-bedroom layouts ranging in size from 650 to 725 square feet. Market rents range from approximately $4,300 to $6,995 per month, with an average market rent of approximately $4,371 and an average unit size of 653 square feet. Unit features include heating, smoke alarms, and an oven/range combination.
| THE INFORMATION IN THIS STRUCTURAL AND COLLATERAL TERM SHEET IS NOT COMPLETE AND MAY BE AMENDED PRIOR TO THE TIME OF SALE. THIS TERM SHEET IS NOT AN OFFER TO SELL THESE SECURITIES AND IT IS NOT A SOLICITATION OF AN OFFER TO BUY THESE SECURITIES IN ANY JURISDICTION WHERE THE OFFER OR SALE IS NOT PERMITTED. |
| | 94 | |
| Structural and Collateral Term Sheet | | BMO 2023-5C1 |
| No. 8 – Gilardian NYC Portfolio II |
The following table presents detailed information with respect to the market rate units at the 324-326 W 84th Property:
| Market Rate Unit Summary |
| Unit Type | No. of Units(1) | % of Total(2) | Average Unit Size (SF)(1) | Average Monthly Rental Rate(1) | Average Monthly Rental Rate per SF(1) | Average Monthly Market Rental Rate(3) | Average Monthly Market Rental Rate per SF(3) |
| 1BR | 33 | 94.3 | % | 650 | $3,328 | $5.12 | $4,300 | $6.62 |
| 2BR | 1 | 2.9 | | 725 | $3,495 | $4.82 | $5,000 | $6.90 |
| 2BRPH | 1 | 2.9 | | 725 | $6,250 | $8.62 | $6,995 | $9.65 |
| Total/Wtd. Avg. | 35 | 100.0 | % | 654 | $3,417 | $5.21 | $4,397 | $6.71 |
| (1) | Based on the underwritten rent roll as of March 31, 2023. |
| (2) | % of Total represents the percentage of the total market rate units at the 324-326 W 84th Property. |
The following table presents detailed information with respect to the rent-controlled units at the 324-326 W 84th Property:
| Rent-Controlled Unit Summary |
| Unit Type | No. of Units(1) | % of Total(2) | Average Unit Size (SF)(1) | Average Monthly Rental Rate(1) | Average Monthly Rental Rate per SF(1) |
| 1BR | 1 | 100.0% | 650 | $1,156 | $1.78 |
| Total/Wtd. Avg. | 1 | 100.0% | 650 | $1,156 | $1.78 |
| (1) | Based on the underwritten rent roll as of March 31, 2023. |
| (2) | % of Total represents the percentage of the total rent-controlled units at the 324-326 W 84th Property. |
The following table presents detailed information with respect to the rent-stabilized units at the 324-326 W 84th Property:
| Rent-Stabilized Unit Summary |
| Unit Type | No. of Units(1) | % of Total(2) | Average Unit Size (SF)(1) | Average Monthly Rental Rate(1)(3) | Average Monthly Rental Rate per SF(1)(3) |
| 1BR | 12 | 100.0% | 650 | $2,178 | $3.35 |
| Total/Wtd. Avg. | 12 | 100.0% | 650 | $2,178 | $3.35 |
| (1) | Based on the underwritten rent roll as of March 31, 2023. |
| (2) | % of Total represents the percentage of the total rent-stabilized units at the 324-326 W 84th Property. |
| (3) | Average Monthly Rental Rate and Average Monthly Rental Rate per SF excludes one vacant 1BR unit. |
107 W 68th Property. As of March 31, 2023, the 107 W 68th Property was 100.0% occupied. The 0.14-acre parcel is improved with a five-story apartment building with no commercial space. The 107 W 68th Property features 30 units in total, 13 of which are rent-stabilized, with studio, one-, two-, three- and four-bedroom layouts ranging in size from 500 to 1,200 square feet. Market rents range from approximately $2,650 to $5,750 per month, with an average market rent of $4,887 and an average unit size of 765 square feet. Unit features include heating, smoke alarms, dishwasher and an oven/range combination.
| THE INFORMATION IN THIS STRUCTURAL AND COLLATERAL TERM SHEET IS NOT COMPLETE AND MAY BE AMENDED PRIOR TO THE TIME OF SALE. THIS TERM SHEET IS NOT AN OFFER TO SELL THESE SECURITIES AND IT IS NOT A SOLICITATION OF AN OFFER TO BUY THESE SECURITIES IN ANY JURISDICTION WHERE THE OFFER OR SALE IS NOT PERMITTED. |
| | 95 | |
| Structural and Collateral Term Sheet | | BMO 2023-5C1 |
| No. 8 – Gilardian NYC Portfolio II |
The following table presents detailed information with respect to the market rate units at the 107 W 68th Property:
| Market Rate Unit Summary |
| Unit Type | No. of Units(1) | % of Total(2) | Average Unit Size (SF)(1) | Average Monthly Rental Rate(1) | Average Monthly Rental Rate per SF(1) | Average Monthly Market Rental Rate(3) | Average Monthly Market Rental Rate per SF(3) |
| Studio | 1 | 5.9 | % | 500 | $2,450 | $4.90 | $2,650 | $5.30 |
| 1BR | 2 | 11.8 | | 620 | $4,095 | $6.60 | $4,500 | $7.26 |
| 2BR | 8 | 47.1 | | 775 | $4,304 | $5.55 | $5,100 | $6.58 |
| 3BR | 5 | 29.4 | | 900 | $5,346 | $5.94 | $5,500 | $6.11 |
| 4BR | 1 | 5.9 | | 1,200 | $5,750 | $4.79 | $5,750 | $4.79 |
| Total/Wtd. Avg. | 17 | 100.0 | % | 802 | $4,562 | $5.71 | $5,041 | $6.34 |
| (1) | Based on the underwritten rent roll as of March 31, 2023. |
| (2) | % of Total represents the percentage of the total market rate units at the 107 W 68th Property. |
The following table presents detailed information with respect to the rent-stabilized units at the 107 W 68th Property:
| Rent-Stabilized Unit Summary |
| Unit Type | No. of Units(1) | % of Total(2) | Average Unit Size (SF)(1) | Average Monthly Rental Rate(1) | Average Monthly Rental Rate per SF(1) |
| 1BR | 9 | 69.2 | % | 673 | $1,178 | $1.75 |
| 2BR | 4 | 30.8 | | 810 | $1,659 | $2.05 |
| Total/Wtd. Avg. | 13 | 100.0 | % | 715 | $1,326 | $1.84 |
| (1) | Based on the underwritten rent roll as of March 31, 2023. |
| (2) | % of Total represents the percentage of the total rent-stabilized units at the 107 W 68th Property. |
1443 York Avenue Property. As of March 31, 2023, the 1443 York Avenue Property was 91.7% occupied. The 0.05-acre parcel is improved with a 5-story apartment building with 2,200 square feet of commercial space that is 100% occupied by three tenants. The three commercial tenants consist of a pizza shop, ice cream shop and convenience store. The 1443 York Avenue Property features 12 units in total, two of which are rent-stabilized, with one- and two-bedroom layouts and all being 650 square feet in size. Market rents range from approximately $2,900 to $4,250 per month, with an average market rent of $3,913. Unit features include heating, smoke alarms and an electric oven/range combination.
The following table presents detailed information with respect to the market rate units at the 1443 York Avenue Property:
| Market Rate Unit Summary |
| Unit Type | No. of Units(1) | % of Total(2) | Average Unit Size (SF)(1) | Average Monthly Rental Rate(1) | Average Monthly Rental Rate per SF(1) | Average Monthly Market Rental Rate(3) | Average Monthly Market Rental Rate per SF(3) |
| 1BR | 1 | 10.0 | % | 650 | $3,195 | $4.92 | $2,900 | $4.46 |
| 2BR | 9 | 90.0 | | 650 | $3,641 | $5.60 | $4,250 | $6.54 |
| Total/Wtd. Avg. | 10 | 100.0 | % | 650 | $3,597 | $5.53 | $4,115 | $6.33 |
| (1) | Based on the underwritten rent roll as of March 31, 2023. |
| (2) | % of Total represents the percentage of the total market rate units at the 1443 York Avenue Property. |
| THE INFORMATION IN THIS STRUCTURAL AND COLLATERAL TERM SHEET IS NOT COMPLETE AND MAY BE AMENDED PRIOR TO THE TIME OF SALE. THIS TERM SHEET IS NOT AN OFFER TO SELL THESE SECURITIES AND IT IS NOT A SOLICITATION OF AN OFFER TO BUY THESE SECURITIES IN ANY JURISDICTION WHERE THE OFFER OR SALE IS NOT PERMITTED. |
| | 96 | |
| Structural and Collateral Term Sheet | | BMO 2023-5C1 |
| No. 8 – Gilardian NYC Portfolio II |
The following table presents detailed information with respect to the rent-stabilized units at the 1443 York Avenue Property:
| Rent-stabilized Unit Summary |
| Unit Type | No. of Units(1) | % of Total(2) | Average Unit Size (SF)(1) | Average Monthly Rental Rate(1)(3) | Average Monthly Rental Rate per SF(1)(3) |
| 1BR | 2 | 100.0% | 650 | $2,049 | $3.15 |
| Total/Wtd. Avg. | 2 | 100.0% | 650 | $2,049 | $3.15 |
| (1) | Based on the underwritten rent roll as of March 31, 2023. |
| (2) | % of Total represents the percentage of the total rent-stabilized units at the 1443 York Avenue Property. |
| (3) | Average Monthly Rental Rate and Average Monthly Rental Rate per SF excludes one vacant 1BR unit. |
Environmental. According to the Phase I environmental assessments dated April 14, 2023, there was no evidence of any recognized environmental conditions at the Gilardian NYC Portfolio II Properties.
The following table presents certain information relating to the historical and current occupancy of the Gilardian NYC Portfolio II Properties:
| Historical and Current Occupancy(1) |
| Property | 2020 | 2021 | 2022 | Current(2) |
| 2410-2418 Broadway | 82.7% | 96.2% | 94.2% | 93.5% |
| 245 W 51st | 65.7% | 97.0% | 95.5% | 96.9% |
| 324-326 W 84th | 68.8% | 100.0% | 97.9% | 97.9% |
| 107 W 68th | 83.3% | 100.0% | 100.0% | 100.0% |
| 1443 York Avenue | 86.7% | 100.0% | 93.3% | 91.7% |
| (1) | Historical occupancy is as of December 31 of each respective year. |
| (2) | Current Occupancy is as of March 31, 2023. |
The following table presents certain information relating to the operating history and underwritten cash flows of the Gilardian NYC Portfolio II Properties:
| Operating History and Underwritten Net Cash Flow |
| | 2019 | 2020 | 2021 | 2022 | TTM(1) | Underwritten | Per Unit | %(2) |
| Gross Potential Rent (Residential) | $7,060,026 | $5,533,845 | $5,731,607 | $7,064,048 | $7,359,204 | $8,384,516 | $41,714 | 100.0 | % |
| Commercial Income(3) | 1,748,901 | 1,111,793 | 1,155,726 | 1,506,770 | 1,587,757 | 1,838,034 | 9,144 | 21.9 | |
| Recoveries | 210,105 | 73,451 | 75,409 | 89,376 | 85,337 | 305,299 | 1,519 | 3.6 | |
| Net Rental Income | $9,019,033 | $6,719,088 | $6,962,742 | $8,660,195 | $9,032,298 | $10,527,849 | $52,377 | 125.6 | % |
| (Vacancy/Credit Loss) | 0 | 0 | 34,638 | 0 | 0 | (313,027) | (1,557) | (3.7 | ) |
| Other Income | 26,874 | 29,372 | 29,421 | 104,983 | 104,650 | 43,947 | 219 | 0.5 | |
| Effective Gross Income | $9,045,907 | $6,748,460 | $7,026,801 | $8,765,177 | $9,136,948 | $10,258,769 | $51,039 | 122.4 | % |
| | | | | | | | | |
| Total Expenses | 3,512,056 | 3,562,405 | 3,434,840 | 3,653,111 | 3,632,923 | 3,597,703 | 17,899 | 35.1 | |
| | | | | | | | | |
| Net Operating Income | $5,533,851 | $3,186,055 | $3,591,961 | $5,112,066 | $5,504,026 | $6,661,066 | $33,140 | 64.9 | % |
| | | | | | | | | |
| Total TI/LC, Capex/RR | 0 | 0 | 0 | 0 | 0 | 54,466 | 271 | 0.5 | |
| | | | | | | | | |
| Net Cash Flow | $5,533,851 | $3,186,055 | $3,591,961 | $5,112,066 | $5,504,026 | $6,606,600 | $32,869 | 64.4 | % |
| (1) | TTM reflects the trailing 12 months ending March 31, 2023. |
| (2) | % column represents percent of Gross Potential Rent for revenue fields and represents percent of Effective Gross Income for the remainder of fields. |
| (3) | Commercial Income represents 11 commercial units totaling 12,405 square feet of commercial space, which are 100% occupied by six retail tenants and five restaurants, representing approximately 17.5% of the Underwritten Net Rental Income from the Gilardian NYC Portfolio Properties. |
| THE INFORMATION IN THIS STRUCTURAL AND COLLATERAL TERM SHEET IS NOT COMPLETE AND MAY BE AMENDED PRIOR TO THE TIME OF SALE. THIS TERM SHEET IS NOT AN OFFER TO SELL THESE SECURITIES AND IT IS NOT A SOLICITATION OF AN OFFER TO BUY THESE SECURITIES IN ANY JURISDICTION WHERE THE OFFER OR SALE IS NOT PERMITTED. |
| | 97 | |
| Structural and Collateral Term Sheet | | BMO 2023-5C1 |
| No. 8 – Gilardian NYC Portfolio II |
The Markets. According to the appraisals, the Gilardian NYC Portfolio II Properties are located in the New York Metro apartment market. According to the appraisals, as of the fourth quarter of 2022, the New York Metro apartment market average monthly asking rent per unit was $4,334 and vacancy was 3.5% with a total of 242,506 units.
According to the related appraisal, the 2022 population within a 0.25-, 0.5- and 0.75-mile radius of the 107 W 68th Property is 24,096, 69,241 and 114,334, respectively. The 2022 median household income within the same radii is $183,020, $168,663 and $171,527, respectively.
The following table presents certain market information regarding the residential units at the Gilardian NYC Portfolio II Properties and their respective submarkets:
| Market Overview(1) |
| Property | Year Built / Renovated | Fair Market Units(2) | Submarket | Property Vacancy(2) | Submarket Vacancy(3) | Appraisal Concluded Vacancy | Submarket Inventory (Units)(3) | UW Base Rent Per Unit(2) | Submarket Rent Per Unit(3) | Local Area Population(4) | Local Area Median Household Income(4) |
| 2410-2418 Broadway | 1915 / 1989 | 23 | Upper West Side | 6.5% | 3.8% | 3.5% | 17,126 | $4,232 | $5,828 | 218,146 | $151,593 |
| 245 W 51st | 1912 / 1998 | 46 | Midtown West | 3.1% | 4.9% | 3.5% | 35,410 | $3,525 | $5,603 | 52,490 | $146,867 |
| 324-326 W 84th | 1914 / NAP | 35 | Upper West Side | 2.1% | 3.8% | 3.5% | 17,126 | $3,079 | $5,828 | 218,146 | $151,593 |
| 107 W 68th | 1930 / NAP | 17 | Upper West Side | 0.0% | 3.8% | 3.5% | 17,126 | $3,160 | $5,828 | Various | Various |
| 1443 York Avenue | 1920 / NAP | 10 | Upper East Side | 8.3% | 2.7% | 3.0% | 16,800 | $3,456 | $5,099 | 98,636 | $173,359 |
| (1) | Source: Appraisal unless otherwise indicated. |
| (2) | Based on the underwritten rent roll dated March 31, 2023. |
| (3) | Submarket Vacancy, Submarket Inventory (Units) and Submarket Rent Per Unit is as of the fourth quarter of 2022. |
| (4) | Local Area Population and Local Area Median Household Income are for their respective postal codes for 2022. |
| THE INFORMATION IN THIS STRUCTURAL AND COLLATERAL TERM SHEET IS NOT COMPLETE AND MAY BE AMENDED PRIOR TO THE TIME OF SALE. THIS TERM SHEET IS NOT AN OFFER TO SELL THESE SECURITIES AND IT IS NOT A SOLICITATION OF AN OFFER TO BUY THESE SECURITIES IN ANY JURISDICTION WHERE THE OFFER OR SALE IS NOT PERMITTED. |
| | 98 | |
| Structural and Collateral Term Sheet | | BMO 2023-5C1 |
| No. 8 – Gilardian NYC Portfolio II |
The following table presents certain information relating to comparable multifamily rentals to the 2410-2418 Broadway Property:
| Competitive Rental Summary(1) |
Property Name /
Property Address | Year Built / Renovated | Occupancy(2) | # of Units(2)(3) | Unit Mix | Average SF per Unit(2) | Average Rent per SF(2)(4) | Average Rent per Unit(2)(4)(5) | Fair Market Average Rent | Fair Market Low Rent | Fair Market High Rent |
2410-2418 Broadway 2410-2418 Broadway | 1915 / 1989 | 93.5% | 46 | 2BR MR 2BR RS 3BR MR 4BR MR 4BR RC 4BR RS | 1,100 1,100 1,100 1,675 1,675 1,675 | $4.30 $1.56 $5.23 $4.81 $0.49 $1.60 | $4,730 $1,713 $5,750 $8,056 $829 $2,677 | $5,574 NAP $6,599 $8,029 NAP NAP | $5,200 NAP $5,995 $7,500 NAP NAP | $5,900 NAP $7,100 $8,950 NAP NAP |
| 451 West End Avenue | 1926 / NAP | N/A | 87 | 2BR | N/A | N/A | $5,200 | $5,574 | $5,200 | $5,900 |
| 127 West 96th Street | 1930 / NAP | N/A | 140 | 3BR | N/A | N/A | $5,995 | $6,599 | $5,995 | $7,100 |
| 209 West 97th Street | 1901 / NAP | N/A | 44 | 4BR | N/A | N/A | $7,500 | $8,029 | $7,500 | $8,950 |
| (1) | Source: Appraisal, unless otherwise indicated. |
| (2) | Based on the underwritten rent roll as of March 31, 2023. |
| (3) | # of Units is inclusive of market rate (MR), rent-stabilized (RS) and rent-controlled (RC) units. |
| (4) | Average Rent per SF and Average Rent per Unit excludes vacant units. |
| (5) | Average Rent per Unit for comparable properties are based on the actual rent for one lease at the respective property. |
The following table presents certain information relating to comparable multifamily rentals to the 245 W 51st Property:
| Competitive Rental Summary(1) |
Property Name /
Property Address | Year Built / Renovated | Occupancy(2) | # of Units(2)(3) | Unit Mix | Average SF per Unit(2) | Average Rent per SF(2)(4) | Average Rent per Unit(2)(4)(5) | Fair Market Average Rent | Fair Market Low Rent | Fair Market High Rent |
245 W 51st 245 West 51st Street | 1912 / 1998 | 96.9% | 65 | Studio RS Studio RC 1BR MR 1BR RS 2BR MR 2BR RS 3BR MR | 600 600 637 731 748 860 900 | $3.49 $0.37 $5.37 $1.87 $5.72 $2.34 $6.23 | $2,092 $222 $3,416 $1,372 $4,240 $2,016 $5,609 | NAP NAP $3,394 NAP $4,049 NAP $5,368 | NAP NAP $2,870 NAP $3,500 NAP $4,500 | NAP NAP $4,000 NAP $4,750 NAP $6,000 |
| 152 West 49th Street | 1930 / NAP | N/A | 30 | Studio | N/A | N/A | $2,750 | $2,577 | $2,195 | $2,900 |
| 211 West 53rd Street | 1925 / NAP | N/A | 28 | 1BR | N/A | N/A | $3,300 | $3,394 | $2,870 | $4,000 |
| 140 West 55th Street | 1912 / NAP | N/A | 34 | 2BR | N/A | N/A | $4,750 | $4,049 | $3,500 | $4,750 |
| 105 West 55th Street | 1917 / NAP | N/A | 52 | 3BR | N/A | N/A | $4,800 | $5,368 | $4,500 | $6,000 |
| (1) | Source: Appraisal, unless otherwise indicated. |
| (2) | Based on the underwritten rent roll as of March 31, 2023. |
| (3) | # of Units is inclusive of market rate (MR), rent-stabilized (RS) and rent-controlled (RC) units. |
| (4) | Average Rent per SF and Average Rent per Unit excludes vacant units. |
| (5) | Average Rent per Unit for comparable properties are based on the actual rent for one lease at the respective property. |
The following table presents certain information relating to comparable multifamily rentals to the 324-326 W 84th Property:
| Competitive Rental Summary(1) |
Property Name /
Property Address | Year Built / Renovated | Occupancy(2) | # of Units(2)(3) | Unit Mix | Average SF per Unit(2) | Average Rent per SF(2)(4) | Average Rent per Unit(2)(4)(5) | Fair Market Average Rent | Fair Market Low Rent | Fair Market High Rent |
324-326 W 84th 324-326 West 84th Street | 1914 / NAP | 97.9% | 48 | 1BR MR 1BR RS 1BR RC 2BR MR 2BRPH MR | 650 650 650 725 725 | $5.12 $3.35 $1.78 $4.82 $8.62 | $3,328 $2,178 $1,156 $3,495 $6,250 | $4,009 NAP NAP $4,999 $7,495 | $3,695 NAP NAP $4,800 $6,995 | $4,600 NAP NAP $5,300 $7,995 |
| 338 West 72nd Street | 1915 / NAP | N/A | 5 | 1BR | N/A | N/A | $4,600 | $4,009 | $3,695 | $4,600 |
| 175 West 90th Street | 1974 / NAP | N/A | 187 | 2BR | N/A | N/A | $4,800 | $4,999 | $4,800 | $5,300 |
| 176 West 86th Street | 1986 / NAP | N/A | 47 | 2BRPH | N/A | N/A | $6,995 | $7,495 | $6,995 | $7,995 |
| (1) | Source: Appraisal, unless otherwise indicated. |
| (2) | Based on the underwritten rent roll as of March 31, 2023. |
| (3) | # of Units is inclusive of market rate (MR), rent-stabilized (RS) and rent-controlled (RC) units. |
| (4) | Average Rent per SF and Average Rent per Unit excludes vacant units. |
| (5) | Average Rent per Unit for comparable properties are based on the actual rent for one lease at the respective property. |
| THE INFORMATION IN THIS STRUCTURAL AND COLLATERAL TERM SHEET IS NOT COMPLETE AND MAY BE AMENDED PRIOR TO THE TIME OF SALE. THIS TERM SHEET IS NOT AN OFFER TO SELL THESE SECURITIES AND IT IS NOT A SOLICITATION OF AN OFFER TO BUY THESE SECURITIES IN ANY JURISDICTION WHERE THE OFFER OR SALE IS NOT PERMITTED. |
| | 99 | |
| Structural and Collateral Term Sheet | | BMO 2023-5C1 |
| No. 8 – Gilardian NYC Portfolio II |
The following table presents certain information relating to comparable multifamily rentals to the 107 W 68th Property:
| Competitive Rental Summary(1) |
Property Name /
Property Address | Year Built / Renovated | Occupancy(2) | # of Units(2)(3) | Unit Mix | Average SF per Unit(2) | Average Rent per SF(2) | Average Rent per Unit(2)(4) | Fair Market Average Rent | Fair Market Low Rent | Fair Market High Rent |
107 W 68th 107 W 68th Street | 1930 / NAP | 100.0% | 30 | Studio MR 1BR MR 1BR RS 2BR MR 2BR RS 3BR MR 4BR MR | 500 620 673 775 810 900 1,200 | $4.90 $6.60 $1.75 $5.55 $2.05 $5.94 $4.79 | $2,450 $4,095 $1,178 $4,304 $1,659 $5,346 $5,750 | $2,550 $4,449 NAP $5,041 NAP $5,397 $5,538 | $2,450 $4,200 NAP $4,800 NAP $4,995 $4,700 | $2,750 $4,550 NAP $5,300 NAP $5,995 $6,295 |
| 148 West 68th Street | 1926 / NAP | N/A | 46 | Studio | N/A | N/A | $2,650 | $2,550 | $2,450 | $2,750 |
| 25 West 68th Street | 1925 / NAP | N/A | 75 | 1BR | N/A | N/A | $4,500 | $4,449 | $4,200 | $4,550 |
| 451 West End Avenue | 1926 / NAP | N/A | 87 | 2BR | N/A | N/A | $5,200 | $5,041 | $4,800 | $5,300 |
| 225 West End Avenue | 1910 / NAP | N/A | 43 | 3BR | N/A | N/A | $5,495 | $5,397 | $4,995 | $5,995 |
| 244 West 64th Street | 1911 / NAP | N/A | 96 | 4BR | N/A | N/A | $4,995 | $5,538 | $4,700 | $6,295 |
| (1) | Source: Appraisal, unless otherwise indicated. |
| (2) | Based on the underwritten rent roll as of March 31, 2023. |
| (3) | # of Units is inclusive of market rate (MR) and rent-stabilized (RS) units |
| (4) | Average Rent per Unit for comparable properties are based on the actual rent for one lease at the respective property. |
The following table presents certain information relating to comparable multifamily rentals to the 1443 York Avenue Property:
| Competitive Rental Summary(1) |
Property Name /
Property Address | Year Built / Renovated | Occupancy(2) | # of Units(2)(3) | Unit Mix | Average SF per Unit(2) | Average Rent per SF(2)(5) | Average Rent per Unit(2)(4)(5) | Fair Market Average Rent | Fair Market Low Rent | Fair Market High Rent |
1443 York Avenue 1443-1447 York Avenue | 1920 / NAP | 91.7% | 12 | 1BR MR 1BR RS 2BR MR | 650 650 650 | $4.92 $3.15 $5.60 | $3,195 $2,049 $3,641 | $2,798 NAP $4,032 | $2,600 NAP $3,500 | $2,995 NAP $4,500 |
| 416 East 73rd Street | 1910 / NAP | N/A | 20 | 1BR | N/A | N/A | $2,995 | $2,798 | $2,600 | $2,995 |
| 328 East 78th Street | 1910 / NAP | N/A | 28 | 2BR | N/A | N/A | $3,675 | $4,032 | $3,500 | $4,500 |
| (1) | Source: Appraisal, unless otherwise indicated. |
| (2) | Based on the underwritten rent roll as of March 31, 2023. |
| (3) | # of Units is inclusive of market rate (MR) and rent-stabilized (RS) units. |
| (4) | Average Rent per Unit for comparable properties are based on the actual rent for one lease at the respective property. |
| (5) | Average Rent per SF and Average Rent per Unit excludes one vacant 1BR unit. |
The Borrowers. The borrowers are 107 West 68th Street Delaware, LLC, 245 West 51st Street Delaware, LLC, 324 W. 84th Delaware, LLC, 1443 York Delaware, LLC and 2410 Broadway Owner, LLC, each a Delaware limited liability company and special purpose entity with one independent director for each borrower entity. Legal counsel to the borrowers provided a non-consolidation opinion in connection with the origination of the Gilardian NYC Portfolio II Whole Loan.
The Borrower Sponsors. The borrower sponsors and non-recourse carveout guarantors are Robert Gilardian and Albert Gilardian.
Property Management. The Gilardian NYC Portfolio II Properties are managed by Remington Realty, LLC, an affiliate of the borrower sponsors.
Escrows and Reserves. At origination, the borrowers were required to deposit into escrow (i) approximately $126,563 for insurance premiums, (ii) $112,649 for deferred maintenance and (iv) $500,000 for debt service reserves.
Tax Escrows – The borrowers are required to escrow 1/12th of the annual estimated tax payments on a monthly basis, which currently equates to approximately $216,566.
Insurance Escrows – Monthly payments in the insurance reserve have been waived by the lender due to the borrowers carrying a blanket policy so long as (i) no event of default has occurred or is continuing, (ii) no Trigger Event (as defined below) has occurred or is continuing and (iii) the borrowers have paid all insurance premiums directly to the appropriate insurance company within 30 days prior to the due date.
| THE INFORMATION IN THIS STRUCTURAL AND COLLATERAL TERM SHEET IS NOT COMPLETE AND MAY BE AMENDED PRIOR TO THE TIME OF SALE. THIS TERM SHEET IS NOT AN OFFER TO SELL THESE SECURITIES AND IT IS NOT A SOLICITATION OF AN OFFER TO BUY THESE SECURITIES IN ANY JURISDICTION WHERE THE OFFER OR SALE IS NOT PERMITTED. |
| | 100 | |
| Structural and Collateral Term Sheet | | BMO 2023-5C1 |
| No. 8 – Gilardian NYC Portfolio II |
Replacement Reserves – On a monthly basis, the borrowers are required to escrow $3,505 for replacement reserves, $3,350 allocated to the residential portion of the Gilardian NYC Portfolio II Properties and $155 allocated to the commercial portion of the Gilardian NYC Portfolio II Properties.
TI/LC Reserves – On a monthly basis, the borrowers are required to escrow approximately $1,034 for TI/LC reserves.
Lockbox / Cash Management. The Gilardian NYC Portfolio II Whole Loan is structured with a soft lockbox for residential tenants and hard lockbox for commercial tenants and springing cash management. The Gilardian NYC Portfolio II Whole Loan requires the borrowers or property manager to immediately deposit all revenue from residential tenants from the Gilardian NYC Portfolio II Properties received by the borrowers or property manager into the lockbox account no later than three business days after receipt. All non-residential tenants deposit all rent directly into the lockbox account. Upon the occurrence and during the continuance of a Trigger Event, all funds in the lockbox account are required to be swept on each business day to a cash management account under the control of the borrowers to be applied and disbursed in accordance with the Gilardian NYC Portfolio II Whole Loan documents, and all excess cash flow funds remaining in the cash management account after the application of such funds in accordance with the Gilardian NYC Portfolio II Whole Loan documents are required to disbursed to an excess cash reserve.
A “Trigger Event” will commence upon the earliest of the following: (i) the occurrence of an event of default under the Gilardian NYC Portfolio II Whole Loan documents, (ii) the debt service coverage ratio for the Gilardian NYC Portfolio II Total Debt is less than 1.05x for one calendar quarter, (iii) the commencement of a Lease Sweep Period (as defined below) or (iv) an event of default under the mezzanine loan.
A Trigger Event will end: (a) with regard to clause (i) of the prior sentence, upon the cure of such event of default and the lender’s acceptance of such cure in its sole and absolute discretion, (b) with regard to clause (ii) of the prior sentence, upon the debt service coverage ratio for the Gilardian NYC Portfolio II Total Debt being greater than or equal to 1.05x for two consecutive calendar quarters and for the purposes of such calculation, lender excludes out from gross income any base rent or reimbursable expenses payable under the leases that triggered such Trigger Event, (c) with regard to clause (iii) of the prior sentence, (x) the Lease Sweep Period has terminated or (y) the debt service coverage ratio is equal to or greater than 1.15x and for the purposes of such calculation, the lender will exclude from gross income any base rent or reimbursable expenses payable under any Lease Sweep Lease that triggered such Trigger Period and (d) with regard to clause (iv) of the prior sentence, a cure of such event of default under the mezzanine loan.
A ”Lease Sweep Period” will commence on the first payment date upon the earliest of the following: (a) with respect to the Lease Sweep Lease (as defined below), the earlier to occur of (i) 12 months prior to the earliest stated expiration (including the stated expiration of any renewal term) of the Lease Sweep Lease; (ii) upon the date required under the Lease Sweep Lease by which the tenant thereunder is required to give notice of its exercise of a renewal option; or (iii) the date that any tenant under a Lease Sweep Lease gives notice of its intention not to renew or extend its Lease Sweep Lease; (b) the receipt by the borrowers or property manager of notice from any tenant under a Lease Sweep Lease exercising any right to terminate its Lease Sweep Lease; (c) the date that a Lease Sweep Lease is surrendered, cancelled or terminated prior to its then current expiration date; (d) the date that any tenant under a Lease Sweep Lease discontinues its business in its Lease Sweep Space (as demised under the applicable Lease Sweep Lease) at the Gilardian NYC Portfolio II Properties or will vacate or cease occupying the Lease Sweep Space at the Gilardian NYC Portfolio II Properties; (e) upon a default under the Lease Sweep Lease by a tenant that continues beyond any applicable notice and cure period; or (f) the occurrence of an insolvency proceeding relating to any lease sweep tenant party.
The “Lease Sweep Lease” means (x) any of (i) the 2410-2418 Broadway bookstore lease, (ii) 2410-2418 Broadway restaurant lease, (iii) 245 W 51st restaurant lease, (y) any Major Lease (as defined below), and (z) upon the borrowers finding a replacement lease acceptable to the lender with respect to any portion of the Gilardian NYC Portfolio II Properties demised pursuant to a Lease Sweep Lease, such replacement lease being (i) a tenant acceptable to the lender, (ii) for a term of not less than five years, (iii) entered into in accordance with the Gilardian NYC Portfolio II Whole Loan documents, and (iv) with a net effective rental rate of not less than the net effective rental rate under the applicable Lease Sweep Lease.
A “Major Lease” means (i) any residential lease that is not an Acceptable Residential Lease (as defined below), (ii) any lease which together with all other leases to the same tenant and to all affiliates of such tenant, (A) provides for rental income representing 10% or more of the total rental income for each of the Gilardian NYC Portfolio II Properties, (B) covers more than 2,000 square feet at each of the Gilardian NYC Portfolio II Properties, in the aggregate, (C) provides for a lease term of more than 10 years including options to renew or (D) is with an affiliate of the borrower, (iii) any Lease Sweep Lease,
| THE INFORMATION IN THIS STRUCTURAL AND COLLATERAL TERM SHEET IS NOT COMPLETE AND MAY BE AMENDED PRIOR TO THE TIME OF SALE. THIS TERM SHEET IS NOT AN OFFER TO SELL THESE SECURITIES AND IT IS NOT A SOLICITATION OF AN OFFER TO BUY THESE SECURITIES IN ANY JURISDICTION WHERE THE OFFER OR SALE IS NOT PERMITTED. |
| | 101 | |
| Structural and Collateral Term Sheet | | BMO 2023-5C1 |
| No. 8 – Gilardian NYC Portfolio II |
(iv) any instrument guaranteeing or providing credit support for any lease identified in part (i) or (ii) above, and (v) contains an option or preferential right to purchase all or portion of the Gilardian NYC Portfolio II Properties.
An “Acceptable Residential Lease” means a lease of an individual residential unit located at any of the Gilardian NYC Portfolio II Properties to a tenant for residential occupancy, which lease provides for (i) a net effective rental rate, at the time such lease is executed, comparable to existing local market net effective rental rates for individual residential units that are comparable to those at the applicable individual property and (ii) an initial term (together with all renewal options) of not less than six months and not greater than two years.
Subordinate Debt. None.
Mezzanine Debt. VOYA Commercial Mortgage Originator, LLC originated a mezzanine in the amount of $41,000,000 secured by the borrowers’ ownership interest in 107 Mezz A, LLC, 245 Mezz A, LLC, 324 Mezz A, LLC, 1443 Mezz A, LLC, and 2410 Mezz A, LLC, each a Delaware limited liability company. The mezzanine loan is coterminous with the Gilardian NYC Portfolio II Whole Loan. The mezzanine loan accrues interest at a rate of 9.19800% per annum and requires interest-only payments until its maturity date.
Partial Release. At any time after the earlier to occur of (x) June 1, 2027 and (y) the date that is two years after the closing date of the securitization that includes the last pari passu note to be securitized, the Gilardian NYC Portfolio II Whole Loan documents permit the borrowers to obtain the release of any individual Gilardian NYC Portfolio II Property from the lien of the mortgage up to two times during the term of the Gilardian NYC Portfolio II Whole Loan provided, among other conditions, (i) the borrowers defease the Gilardian NYC Portfolio II Whole Loan in an amount equal to at least 110% of the allocated loan amount for the individual Gilardian NYC Portfolio II Property to be released, (ii) after giving effect to such release (a) the debt service coverage ratio for the Gilardian NYC Portfolio II Total Debt with respect to the remaining Gilardian NYC Portfolio II Properties is not less than (x) the debt service coverage ratio for the Gilardian NYC Portfolio II Total Debt immediately preceding such release or (y) 1.10x and (b) the loan-to-value ratio for the Gilardian NYC Portfolio II Total Debt with respect to the remaining Mortgaged Properties is not greater than the lesser of (x) the loan-to-value ratio for the Gilardian NYC Portfolio II Total Debt immediately preceding such release or (y) 65.0%, and (iii) REMIC release requirements are satisfied.
Ground Lease. None.
| THE INFORMATION IN THIS STRUCTURAL AND COLLATERAL TERM SHEET IS NOT COMPLETE AND MAY BE AMENDED PRIOR TO THE TIME OF SALE. THIS TERM SHEET IS NOT AN OFFER TO SELL THESE SECURITIES AND IT IS NOT A SOLICITATION OF AN OFFER TO BUY THESE SECURITIES IN ANY JURISDICTION WHERE THE OFFER OR SALE IS NOT PERMITTED. |
| | 102 | |
| Structural and Collateral Term Sheet | | BMO 2023-5C1 |
| No. 9 – Four Points Flushing |
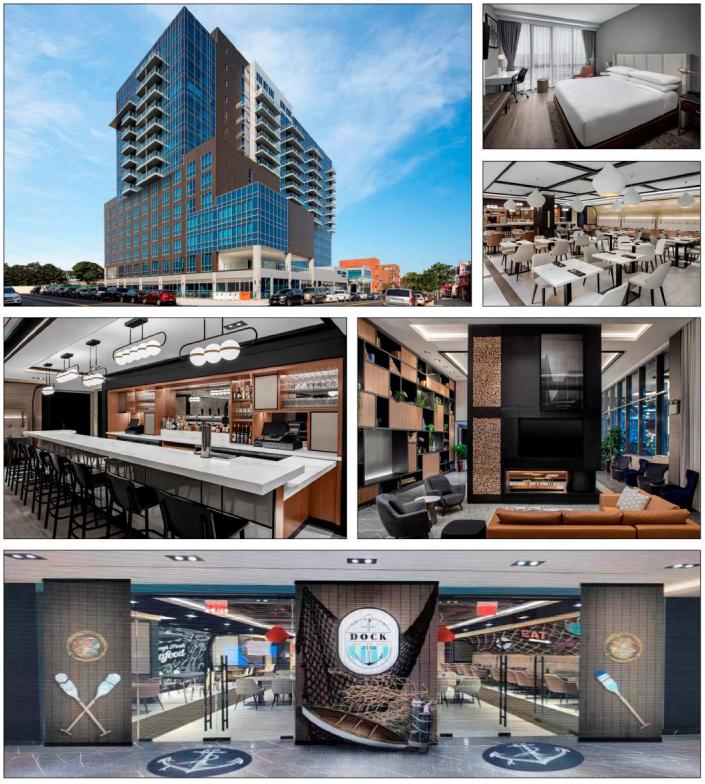
| THE INFORMATION IN THIS STRUCTURAL AND COLLATERAL TERM SHEET IS NOT COMPLETE AND MAY BE AMENDED PRIOR TO THE TIME OF SALE. THIS TERM SHEET IS NOT AN OFFER TO SELL THESE SECURITIES AND IT IS NOT A SOLICITATION OF AN OFFER TO BUY THESE SECURITIES IN ANY JURISDICTION WHERE THE OFFER OR SALE IS NOT PERMITTED. |
| | 103 | |
| Structural and Collateral Term Sheet | | BMO 2023-5C1 |
| No. 9 – Four Points Flushing |
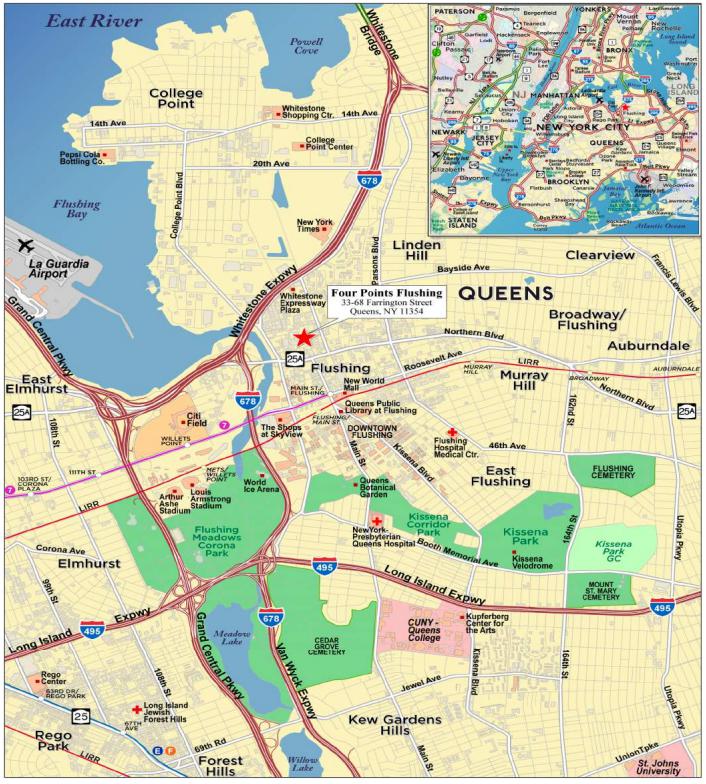
| THE INFORMATION IN THIS STRUCTURAL AND COLLATERAL TERM SHEET IS NOT COMPLETE AND MAY BE AMENDED PRIOR TO THE TIME OF SALE. THIS TERM SHEET IS NOT AN OFFER TO SELL THESE SECURITIES AND IT IS NOT A SOLICITATION OF AN OFFER TO BUY THESE SECURITIES IN ANY JURISDICTION WHERE THE OFFER OR SALE IS NOT PERMITTED. |
| | 104 | |
| Structural and Collateral Term Sheet | | BMO 2023-5C1 |
| No. 9 – Four Points Flushing |
| Mortgage Loan Information | | Property Information |
| Mortgage Loan Seller: | CREFI | | Single Asset / Portfolio: | Single Asset |
| Original Principal Balance: | $40,100,000 | | Title: | Fee |
| Cut-off Date Principal Balance: | $40,100,000 | | Property Type – Subtype(1): | Mixed Use – Hospitality / Retail |
| % of Pool by IPB: | 5.2% | | Net Rentable Area (Rooms): | 210 |
| Loan Purpose: | Refinance | | Location: | Queens, NY |
| Borrower: | New Farrington Holdings, LLC and Four Points Flushing Operations, LLC | | Year Built / Renovated: | 2021 / NAP |
| Borrower Sponsors: | George Xu | | Occupancy / ADR / RevPAR: | 80.5% / $185.01 / $148.91 |
| Interest Rate: | 7.67000% | | Occupancy / ADR / RevPAR Date: | TTM 6/30/2023 |
| Note Date: | 7/12/2023 | | 4th Most Recent NOI (As of): | NAV |
| Maturity Date: | 8/6/2028 | | 3rd Most Recent NOI (As of): | NAV |
| Interest-only Period: | 60 months | | 2nd Most Recent NOI (As of): | $4,862,461 (12/31/2022) |
| Original Term: | 60 months | | Most Recent NOI (As of): | $6,815,871 (TTM 6/30/2023) |
| Original Amortization Term: | None | | UW Occupancy / ADR / RevPAR: | 80.5% / $185.01 / $148.91 |
| Amortization Type: | Interest Only | | UW Revenues(1): | $14,283,269 |
| Call Protection: | L(24),YM1(29),O(7) | | UW Expenses(1): | $7,613,714 |
| Lockbox / Cash Management: | Springing / Springing | | UW NOI(1): | $6,669,555 |
| Additional Debt: | No | | UW NCF(1): | $6,105,844 |
| Additional Debt Balance: | N/A | | Appraised Value / Per Room: | $80,000,000 / $380,952 |
| Additional Debt Type: | N/A | | Appraisal Date: | 5/17/2023 |
| | | | | |
| Escrows and Reserves(2) | | Financial Information |
| | Initial | Monthly | Initial Cap | | Cut-off Date Loan / Room: | $190,952 |
| Taxes: | $215,674 | $107,837 | N/A | | Maturity Date Loan / Room: | $190,952 |
| Insurance: | $80,564 | $16,113 | N/A | | Cut-off Date LTV: | 50.1% |
| FF&E Reserve(3): | $0 | $19,830 | N/A | | Maturity Date LTV: | 50.1% |
| Replacement Reserve: | $0 | $3,567 | N/A | | UW NCF DSCR: | 1.96x |
| Other Reserve(4): | $69,181 | Springing | N/A | | UW NOI Debt Yield: | 16.6% |
| | | | | | | |
| Sources and Uses |
| Sources | Proceeds | % of Total | | Uses | Proceeds | % of Total |
| Mortgage Loan | $40,100,000 | 100.0% | | Loan Payoff | $34,167,935 | 85.2 | % |
| | | | | Return of Equity | 4,382,178 | 10.9 | |
| | | | | Closing Costs | 1,184,467 | 3.0 | |
| | | | | Upfront Reserves | 365,420 | 0.9 | |
| Total Sources | $40,100,000 | 100.0% | | Total Uses | $40,100,000 | 100.0 | % |
| (1) | The Four Points Flushing Property (as defined below) consists of a (i) a 210 room hotel and (ii) 31,893 square feet of commercial space consisting of retail, office, and event space. Approximately 83.3% of income comes from operations of the 210 room hotel and the remaining 16.7% of income comes from the commercial space at the Four Points Flushing Property. |
| (2) | For full description of Escrows and Reserves, see “Escrows and Reserves” below. |
| (3) | The initial Monthly FF&E Reserve amount is estimated to be $19,830, but is subject to change in accordance with the Four Points Flushing Mortgage Loan documents. For full description of Escrows and Reserves, see “Escrows and Reserves” below. |
| (4) | The Four Points Flushing Property is subject to a condominium regime. Initial Other Reserve represents two months of condominium charges associated with the Four Points Flushing Property. |
The Loan. The ninth largest mortgage loan (the “Four Points Flushing Mortgage Loan”) is secured by a first lien mortgage on the borrowers’ fee simple interest in a mixed- use property consisting of a 210-room limited-service hospitality property and 31,893 square feet of commercial space located in Queens, New York, and a 229 space multi-level below ground parking garage (the “Four Points Flushing Property”). The Four Points Flushing Mortgage Loan was originated on July 12, 2023 by Citi Real Estate Funding Inc. (“CREFI”). The Four Points Flushing Mortgage Loan has an original term of 60 months, has a remaining term of 60 months as of the Cut-off Date and is interest only for the entire term. The scheduled maturity date of the Four Points Flushing Mortgage Loan is the monthly payment date that occurs on August 6, 2028.
| THE INFORMATION IN THIS STRUCTURAL AND COLLATERAL TERM SHEET IS NOT COMPLETE AND MAY BE AMENDED PRIOR TO THE TIME OF SALE. THIS TERM SHEET IS NOT AN OFFER TO SELL THESE SECURITIES AND IT IS NOT A SOLICITATION OF AN OFFER TO BUY THESE SECURITIES IN ANY JURISDICTION WHERE THE OFFER OR SALE IS NOT PERMITTED. |
| | 105 | |
| Structural and Collateral Term Sheet | | BMO 2023-5C1 |
| No. 9 – Four Points Flushing |
Property. The Four Points Flushing Property is a 208,793 square foot mixed-use property located in Queens, New York consisting of a 210 room hotel under the Four Points by Sheraton brand, 16,916 square feet of retail space, 8,870 square feet of event space, 6,107 square feet of office space, and a 229-space multi-level below ground parking garage. Approximately 83.3% of income comes from operations of the 210 room hotel and the remaining 16.7% of income comes from the commercial space at the Four Points Flushing Property. The Four Points Flushing Property is part of a larger 15-story, mixed-use development with the first seven floors representing the Four Points Flushing Property and floors eight through 15 containing non-collateral residential condos.
The Four Points Flushing Property contains 116 king guestrooms and 94 double guestrooms. Amenities at the Four Points Flushing Property consist of a fitness center, indoor swimming pool and business center. The Four Points Flushing Property contains two food and beverage outlets, The Dock and Dekoki, which are leased to third party operators. The Dock comprises 2,903 square feet and is located on the cellar level and Dekoki comprises 2,244 square feet and features direct street access from Farrington Street. The Four Points Flushing Property contains approximately 5,150 square feet of meeting space spread across three different ballrooms with the largest ballroom comprising 4,050 square feet. The franchise agreement between the borrowers and The Sheraton, LLC, a Delaware limited liability company, expires on August 16, 2041.
One of the related borrowers and the fee owner, New Farrington Holdings, LLC, leases (i) the parking garage portion of the Four Points Flushing Property to an affiliate of the borrowers, New Farrington Garage LLC, (ii) part of the office space portion of the Four Points Flushing Property to an affiliate, Century Construction Group Corp., the third largest tenant of the commercial space, representing approximately 19.1% of the net rentable area of the commercial space, and (iii) the event space portion of Four Points Flushing Property to an affiliate, New Farrington CF LLC, each pursuant to a 10-year lease delivered in connection with the origination of the Four Points Flushing Mortgage Loan. Each affiliate lease is guaranteed by the borrower sponsor and non-recourse carveout guarantor, George Xu. One of the related borrowers, Four Points Flushing Operations, LLC, leases the hotel portion of the Mortgaged Property from the fee owner, New Farrington Holdings, LLC, pursuant to an operating lease.
The following table presents certain information relating to the 2022 demand analysis with respect to the Four Points Flushing Property based on market segmentation, as provided by a third-party market research report for the Four Points Flushing Property:
| Demand Segmentation(1) |
| Property | Rooms | Transient | Group | Contract |
| Four Points Flushing | 210 | 87.7% | 7.3% | 5.0% |
| (1) | Source: December 2022 third-party market research report. |
The following table presents certain information relating to the current and historical occupancy, ADR and RevPAR at the Four Points Flushing Property and its competitors
| Historical Occupancy, ADR, RevPAR(1) |
| | Competitive Set(2) | Four Points Flushing(3) | Penetration Factor |
| Year | Occupancy | ADR | RevPAR | Occupancy | ADR | RevPAR | Occupancy | ADR | RevPAR |
| 2021 | 72.6% | $147.52 | $107.12 | 51.2% | $164.44 | $84.23 | 70.5% | 111.5% | 78.6% |
| 2022 | 79.5% | $174.69 | $138.87 | 75.1% | $174.89 | $131.34 | 94.5% | 100.1% | 94.6% |
| TTM(4) | 82.3% | $183.02 | $150.64 | 80.4% | $177.91 | $143.00 | 97.7% | 97.2% | 94.9% |
| (1) | Variances between the underwriting, the appraisal and the above table with respect to Occupancy, ADR and RevPAR at the Four Points Flushing Property are attributable to variances in reporting methodologies and/or timing differences. |
| (2) | Occupancy, ADR and RevPAR for the Competitive Set are based on data provided by a third-party hospitality research report. The Competitive Set includes Sheraton Hotel La Guardia East, Hampton by Hilton Inn New York – La Guardia Airport, SpringHill Suites New York La Guardia Airport, Hyatt Place Flushing La Guardia Airport, and The Parc Hotel. |
| (3) | Occupancy, ADR and RevPAR for the Four Points Flushing Property are based on the underwritten cash flow. |
| (4) | TTM represents the trailing 12-month period ending May 31, 2023. |
| THE INFORMATION IN THIS STRUCTURAL AND COLLATERAL TERM SHEET IS NOT COMPLETE AND MAY BE AMENDED PRIOR TO THE TIME OF SALE. THIS TERM SHEET IS NOT AN OFFER TO SELL THESE SECURITIES AND IT IS NOT A SOLICITATION OF AN OFFER TO BUY THESE SECURITIES IN ANY JURISDICTION WHERE THE OFFER OR SALE IS NOT PERMITTED. |
| | 106 | |
| Structural and Collateral Term Sheet | | BMO 2023-5C1 |
| No. 9 – Four Points Flushing |
The following table presents certain information relating to the largest commercial tenants based on net rentable area of the Four Points Flushing Property:
| Top Tenant Summary(1) |
| Tenant | Ratings
Moody’s/S&P/Fitch(2) | Net Rentable Area (SF) | % of
Total NRA | UW Base Rent PSF(3) | UW Base Rent(3) | % of Total
UW Base Rent(3) | Lease
Exp. Date |
| Dock 3366(4) | NR/NR/NR | 11,168 | 35.0 | % | $59.14 | $660,456 | 38.0% | Various |
| New Farrington CF LLC(5) | NR/NR/NR | 8,870 | 27.8 | | $50.00 | 443,500 | 25.5% | 6/30/2033 |
| Century Development Group Corp(5) | NR/NR/NR | 6,107 | 19.1 | | $50.00 | 305,350 | 17.6% | 6/30/2033 |
| Dekoki LLC | NR/NR/NR | 2,244 | 7.0 | | $65.00 | 145,860 | 8.4% | 8/31/2031 |
| Leivine Wine & Spirits LLC | NR/NR/NR | 2,108 | 6.6 | | $60.00 | 126,480 | 7.3% | 5/31/2032 |
| One Stop Events Production LLC | NR/NR/NR | 1,396 | 4.4 | | $40.00 | 55,840 | 3.2% | 4/30/2028 |
| | | | | | | | |
| Major Tenants | 31,893 | 100.0 | % | $54.48 | $1,737,486 | 100.0% | |
| Occupied Collateral Total / Wtd. Avg. | 31,893 | 100.0 | % | | | | |
| | | | | | | | |
| Vacant Space | | 0 | 0.0 | | | | | |
| | | | | | | | |
| Collateral Total | | 31,893 | 100.0 | % | | | | |
| | | | | | | | |
| (1) | Based on underwritten rent roll dated as of July 11, 2023. |
| (2) | Ratings provided are for the parent company of the entity listed in the “Tenant” field whether or not the parent company guarantees the lease. |
| (3) | UW Base Rent, UW Base Rent PSF and % of Total UW Base Rent are comprised of underwritten base rent inclusive of contractual rent steps through February 2024. |
| (4) | Dock 3366 leases two spaces at the Four Points Flushing Property, one for 8,265 SF with a lease expiration date of January 31, 2033 and a second for 2,903 SF with a lease expiration date of June 30, 2029. |
| (5) | Leased to an affiliate of the borrowers under a lease guaranteed by the borrower. |
Environmental. According to the Phase I environmental assessment dated May 30, 2023, there was no evidence of any recognized environmental conditions at the Four Points Flushing Property.
| THE INFORMATION IN THIS STRUCTURAL AND COLLATERAL TERM SHEET IS NOT COMPLETE AND MAY BE AMENDED PRIOR TO THE TIME OF SALE. THIS TERM SHEET IS NOT AN OFFER TO SELL THESE SECURITIES AND IT IS NOT A SOLICITATION OF AN OFFER TO BUY THESE SECURITIES IN ANY JURISDICTION WHERE THE OFFER OR SALE IS NOT PERMITTED. |
| | 107 | |
| Structural and Collateral Term Sheet | | BMO 2023-5C1 |
| No. 9 – Four Points Flushing |
The following table presents certain information relating to the operating history and underwritten cash flows of the Four Points Flushing Property:
| Operating History and Underwritten Net Cash Flow |
| | 2022 | TTM(1) | Underwritten | Per Room(2) | %(3) |
| Occupancy | 75.1% | 80.5% | 80.5% | | |
| ADR | 176.30 | 185.01 | 185.01 | | |
| RevPAR | 132.40 | 148.91 | 148.91 | | |
| | | | | | |
| Room Revenue | $10,148,695 | $11,413,830 | $11,413,830 | $54,352 | 79.9 | % |
| Food & Beverage Revenue | 241,730 | 8,628 | 0 | 0 | 0.0 | |
| Other Revenue(4) | 367,560 | 484,068 | 484,068 | 2,305 | 3.4 | |
| Total Hotel Revenue | $10,757,985 | $11,906,526 | $11,897,898 | $56,657 | 83.3 | |
| Commercial Revenue(5) | 2,060,126 | 2,747,571 | 2,385,371 | 11,359 | 16.7 | |
| Total Hotel and Commercial Revenue | $12,818,111 | $14,654,097 | $14,283,269 | $68,016 | 100.0 | % |
| | | | | | |
| Room Expense | 2,415,408 | 2,407,141 | 2,407,141 | 11,463 | 16.9 | |
| Food & Beverage Expense | 247,443 | (1,696) | 0 | 0 | 0.0 | |
| Other Departmental Expenses | 87,292 | $148,006 | $148,006 | 705 | 1.0 | |
| Departmental Expenses | $2,750,143 | $2,553,451 | $2,555,147 | $12,167 | 17.9 | % |
| | | | | | |
| Departmental Profit | $8,007,842 | $9,353,075 | $9,342,751 | $44,489 | 65.4 | % |
| | | | | | |
| Management Fee | 322,740 | 357,196 | 356,937 | 1,700 | 2.5 | |
| Marketing and Franchise Fee | 1,194,262 | 1,313,376 | 1,311,739 | 6,246 | 9.2 | |
| Other Undistributed Expenses | 1,684,331 | 1,853,285 | 1,852,830 | 8,823 | 13.0 | |
| Total Undistributed Expenses | $3,201,333 | $3,523,857 | $3,521,506 | $16,769 | 24.7 | % |
| | | | | | |
| Total Commercial Expenses | 1,384,175 | 1,223,412 | 627,495 | 2,988 | 4.4 | |
| Real Estate Taxes(6) | 529,835 | 454,145 | 751,530 | 3,579 | 5.3 | |
| Property Insurance | 90,165 | 83,360 | 158,036 | 753 | 1.1 | |
| Net Operating Income | $4,862,461 | $6,815,871 | $6,669,555 | $31,760 | 46.7 | % |
| | | | | | |
| FF&E | 430,319 | 476,261 | 475,916 | 2,266 | 3.3 | |
| Replacement Reserve | 0 | 0 | 16,234 | 77 | 0.1 | |
| TI/LC | 0 | 0 | 71,561 | 341 | 0.5 | |
| | | | | | |
| Net Cash Flow | $4,432,141 | $6,339,610 | $6,105,844 | $29,075 | 42.7 | % |
| (1) | TTM represents the trailing 12-month period ending June 30, 2023. |
| (2) | Per Room values are based on 210 rooms. |
| (3) | % column represents percent of Total Revenue except for Room Expense, Food & Beverage Expense and Other Departmental Expenses which are based on their corresponding revenue line items. |
| (4) | Other Revenue consists of guest laundry, guest communications, in-room movies and the gift shop. |
| (5) | Commercial consists of adjusted base rent for the retail tenants at the Four Points Flushing Mortgage Property, tenant reimbursements, and parking revenue. |
| (6) | The Four Points Flushing Property is subject to a 15 year tax abatement via the Industrial & Commercial Abatement Program (ICAP), which runs from July 1, 2020, through June 30, 2035. The abatement amount would be 100% for the first 11 years, with the abatement percentage declining by 20% every year thereafter. Real estate taxes were underwritten based on the abated 2023/2024 estimated tax expense for the hotel component of the Four Points Flushing Property only. |
| THE INFORMATION IN THIS STRUCTURAL AND COLLATERAL TERM SHEET IS NOT COMPLETE AND MAY BE AMENDED PRIOR TO THE TIME OF SALE. THIS TERM SHEET IS NOT AN OFFER TO SELL THESE SECURITIES AND IT IS NOT A SOLICITATION OF AN OFFER TO BUY THESE SECURITIES IN ANY JURISDICTION WHERE THE OFFER OR SALE IS NOT PERMITTED. |
| | 108 | |
| Structural and Collateral Term Sheet | | BMO 2023-5C1 |
| No. 9 – Four Points Flushing |
The Market. The Four Points Flushing Property is located at the northwest corner of 35th Avenue and Farrington Street in the Flushing neighborhood of Queens, New York. Flushing is bordered by College Point and the East River to the North, Kew Garden Hills to the South, Corona to the West and Auburndale to the East.
The Four Points Flushing Property benefits from its proximity to the New York subway system via the 7-line and Long Island Railroad which both have stops on Main Street approximately 0.5 miles away. The Four Points Flushing Property also benefits from its proximity to various attractions in Queens such as CitiField, Flushing-Meadows-Corona Park, which contains the U.S. National Tennis Center (host of the annual U.S. Open tournament), the Queens Museum, Queens Zoo and Hall of Science.
According to a third-party hospitality research report, the demand segmentation of the Four Points Flushing Property was 87.7% transient, 7.3% group and 5.0% contract. The third-party market research report also identified five competitive hospitality properties, containing 830 guestrooms, which exhibited average occupancy, ADR, and RevPar of 82.3%, $183.02 and $150.64, respectively, for the trailing 12-month period ending May 31, 2023.
The following table presents certain information relating to the primary competition for the Four Points Flushing Property:
| Competitive Set(1) |
| Property | Number of Rooms | Year Opened |
| Four Points Flushing | 210 | 2021 |
| Sheraton Hotel La Guardia East | 173 | 1992 |
| Hampton by Hilton Inn New York - La Guardia Airport | 220 | 2009 |
| SpringHill Suites New York La Guardia Airport | 173 | 2012 |
| The Parc Hotel | 96 | 2014 |
| Hyatt Place Flushing La Guardia Airport | 168 | 2014 |
| (1) | Source: December 2022 third party market research report. |
The Borrowers. The borrowers are New Farrington Holdings, LLC and Four Points Flushing Operations, LLC, each a New York limited liability company and single purpose entity with one independent director in its organizational structure. Legal counsel to the borrower delivered a non-consolidation opinion in connection with the origination of the Four Points Flushing Mortgage Loan.
The Borrower Sponsor. The borrower sponsor and the non-recourse carveout guarantor is George Xu. George Xu is the founder of Century Development Group, an integrated real estate development company founded in 1998. George Xu has experience in the development of residential, commercial, mix-used and hospitality projects primarily located in the borough of Queens, New York and has worked on over a million square feet of real estate developments with the total asset value of his projects totaling over $658,000,000.
Property Management. The hospitality operations of the Four Points Flushing Property are currently managed by Real Hospitality Group, LLC, a third party property manager, and the parking facility associated with the Four Points Flushing Property is currently managed by Propark America New York, LLC.
Escrows and Reserves. At origination of the Four Points Flushing Mortgage Loan, the borrowers deposited into escrow approximately (i) $215,674 for real estate taxes, (ii) $80,564 for insurance premiums, and (iii) $69,181 for condominium charges.
Tax Escrows – The borrowers are required to deposit into a real estate tax reserve, on a monthly basis, 1/12th of the taxes that the lender reasonably estimates will be payable over the next-ensuing 12-month period (initially estimated to be approximately $107,837).
Insurance Reserve – The borrowers are required to deposit into an insurance reserve, on a monthly basis, 1/12th of the amount which would be sufficient to pay the insurance premiums due for the renewal of coverage afforded by such policies (initially estimated to be approximately $16,113).
FF&E Reserve – The borrowers are required to deposit into a furniture, fixtures and equipment (“FF&E”) reserve, on a monthly basis, an amount equal to the greater of (i) an amount equal to 1/12th of the FF&E Percentage (as defined below)
| THE INFORMATION IN THIS STRUCTURAL AND COLLATERAL TERM SHEET IS NOT COMPLETE AND MAY BE AMENDED PRIOR TO THE TIME OF SALE. THIS TERM SHEET IS NOT AN OFFER TO SELL THESE SECURITIES AND IT IS NOT A SOLICITATION OF AN OFFER TO BUY THESE SECURITIES IN ANY JURISDICTION WHERE THE OFFER OR SALE IS NOT PERMITTED. |
| | 109 | |
| Structural and Collateral Term Sheet | | BMO 2023-5C1 |
| No. 9 – Four Points Flushing |
of the greater of (1) the annual gross revenues for the hotel related operations at the Four Points Flushing Property for the preceding calendar year, as reasonably determined by lender and (2) the projected annual gross revenues for the hotel related operations at the Four Points Flushing Property for the calendar year in which such monthly payment occurs as set forth in the then-current approved annual budget and (ii) the amount of the deposit (if any) then required by the franchisor on account of FF&E under the franchise agreement.
“FF&E Percentage” means, two percent for the first twelve monthly payment dates of the Four Points Flushing Mortgage Loan, three percent for the thirteenth through twenty-fourth monthly payment dates of the Four Points Flushing Mortgage Loan, and four percent for all payments from the twenty-fifth monthly payment date until the maturity date of the Four Points Flushing Mortgage Loan.
Replacement Reserve – The borrowers are required to deposit into a replacement reserve, on a monthly basis, $3,567.
Lockbox / Cash Management. The Four Points Flushing Mortgage Loan is structured with a springing lockbox and springing cash management. The borrower is required to deliver direction letters to each of the credit card companies with which borrower has entered into a merchant’s or other credit card agreement directing them to pay to the lender-controlled lockbox account all payments which would otherwise be paid to borrower or manager under the applicable credit card processing agreement and to deliver tenant direction letters to the applicable commercial tenants. Upon the earlier to occur of (i) the debt service coverage ratio falling below 1.45x and (ii) the occurrence of a Four Points Flushing Trigger Period (as defined below), the borrower is required to (or cause the property manager to) immediately deposit all revenue generated by the Four Points Flushing Property into the lender-controlled lockbox account. All funds deposited into the lockbox are required to be transferred on each business day to or at the direction of the borrower unless a Four Points Flushing Trigger Period exists. Upon the occurrence and during the continuance of an Four Points Flushing Trigger Period, if lender elects to deliver a restricted account notice, all funds in the lockbox account are required to be swept on each business day to a cash management account under the control of the lender to be applied and disbursed in accordance with the Four Points Flushing Mortgage Loan documents, and all excess cash flow funds remaining in the cash management account after the application of such funds in accordance with the Four Points Flushing Mortgage Loan documents may be held by the lender in an excess cash flow reserve account as additional collateral for the Four Points Flushing Mortgage Loan.
An “Four Points Flushing Trigger Period” means a period (A) commencing upon the occurrence of any of the following: (i) the occurrence of an event of default, (ii) the debt service coverage ratio falling below 1.35x, (iii) a Four Points Flushing Franchise Agreement Trigger Period (as defined below), (iv) a franchise renewal trigger event, (v) the bankruptcy or insolvency of the property manager, and (vi) the bankruptcy or insolvency of the franchisor, and (B) expiring upon (a) with regard to clause (i) above, the cure (if applicable) of such event of default, (b) with regard to clause (ii) above, the debt service coverage ratio being equal to or greater than 1.35x for two consecutive calendar quarters, (c) with regard to clause (iii) above, a Four Points Flushing Franchise Agreement Trigger Period ceasing to exist, (d) with regard to clause (iv) above, the occurrence of a Four Points Flushing Franchise Renewal Event (as defined below), and (e) with regard to clause (v) above, the replacement of the property manager pursuant to the Four Points Flushing Mortgage Loan documents, and (f) with regard to clause (vi) above, the replacement of the franchisor pursuant to the Four Points Flushing Mortgage Loan documents.
“Four Points Flushing Franchise Agreement Trigger Period” means a period (A) commencing upon the first to occur of: (i) borrower being in default under the franchise agreement beyond any applicable notice and cure periods, (ii) borrower or franchisor giving notice that it is terminating the franchise agreement, (iii) any termination or cancellation of the franchise agreement (including, without limitation, rejection in any bankruptcy or similar insolvency proceeding of franchisor) and/or the franchise agreement expiring or otherwise failing to otherwise be in full force and effect, (iv) any bankruptcy or similar insolvency of franchisor and/or the manager, (v) the Four Points Flushing Property failing to be operated, “flagged” and/or branded pursuant to the franchise agreement, and (vi) any permit applicable to the franchise agreement ceasing to be in full force and effect, and (B) expiring upon lender’s receipt of evidence reasonably acceptable to lender of (1) (a) the satisfaction of the Four Points Flushing Franchise Agreement Cure Conditions (as defined below) or (b) the branding, “flagging” and operation of the Four Points Flushing Property pursuant to a replacement qualified franchise agreement entered into in accordance with the Four Points Flushing Mortgage Loan documents and (2) to the extent a PIP is required in connection with the foregoing, the deposit of the corresponding PIP deposit into the PIP reserve account.
“Four Points Flushing Franchise Renewal Event” means, in connection with any franchise renewal trigger event, an event which shall occur upon lender’s receipt of evidence reasonably acceptable to lender (which such evidence may include, without limitation, a duly executed estoppel certificate from the applicable franchisor) that (i) the related franchise
| THE INFORMATION IN THIS STRUCTURAL AND COLLATERAL TERM SHEET IS NOT COMPLETE AND MAY BE AMENDED PRIOR TO THE TIME OF SALE. THIS TERM SHEET IS NOT AN OFFER TO SELL THESE SECURITIES AND IT IS NOT A SOLICITATION OF AN OFFER TO BUY THESE SECURITIES IN ANY JURISDICTION WHERE THE OFFER OR SALE IS NOT PERMITTED. |
| | 110 | |
| Structural and Collateral Term Sheet | | BMO 2023-5C1 |
| No. 9 – Four Points Flushing |
agreement has been extended or a replacement qualified franchise agreement has been entered into, in each case, for a term expiring no earlier than five years after the maturity date of the Four Points Flushing Mortgage Loan and otherwise in accordance with the applicable terms and conditions of the Four Points Flushing Mortgage Loan documents, (ii) such franchise agreement (as so extended) or such replacement qualified franchise agreement, as applicable, is in full force and effect with no defaults thereunder and (iii) to the extent a PIP is required in connection with the foregoing, the corresponding PIP deposit has been deposited in the PIP reserve account in accordance with the Four Points Flushing Mortgage Loan documents.
"Four Points Flushing Franchise Agreement Cure Conditions” means each of the following (i) borrower has cured all defaults (if any) under the franchise agreement to the satisfaction of the applicable franchisor, (ii) borrower and the applicable franchisor have re-affirmed the franchise agreement as being in full force and effect, (iii) with respect to any applicable bankruptcy or insolvency proceedings involving the applicable franchisor and/or franchise agreement (if any), such franchisor is no longer insolvent or subject to any bankruptcy or insolvency proceedings and has affirmed such franchise agreement pursuant to a final, non-appealable order, (iv) with respect to any applicable bankruptcy or insolvency proceedings involving the applicable manager and/or management agreement (if any), such manager is no longer insolvent or subject to any bankruptcy or insolvency proceedings and has affirmed such management agreement pursuant to a final, non-appealable order, (v) the Four Points Flushing Property continues to be operated, “flagged” and branded pursuant to the franchise agreement, and (vi) all permits applicable to the related franchise agreement are in full force and effect.
Subordinate Debt. None.
Mezzanine Debt. None.
Partial Release. Not Permitted.
Ground Lease. None.
| THE INFORMATION IN THIS STRUCTURAL AND COLLATERAL TERM SHEET IS NOT COMPLETE AND MAY BE AMENDED PRIOR TO THE TIME OF SALE. THIS TERM SHEET IS NOT AN OFFER TO SELL THESE SECURITIES AND IT IS NOT A SOLICITATION OF AN OFFER TO BUY THESE SECURITIES IN ANY JURISDICTION WHERE THE OFFER OR SALE IS NOT PERMITTED. |
| | 111 | |
| Structural and Collateral Term Sheet | | BMO 2023-5C1 |
| No. 10 – Back Bay Office |

| THE INFORMATION IN THIS STRUCTURAL AND COLLATERAL TERM SHEET IS NOT COMPLETE AND MAY BE AMENDED PRIOR TO THE TIME OF SALE. THIS TERM SHEET IS NOT AN OFFER TO SELL THESE SECURITIES AND IT IS NOT A SOLICITATION OF AN OFFER TO BUY THESE SECURITIES IN ANY JURISDICTION WHERE THE OFFER OR SALE IS NOT PERMITTED. |
| | 112 | |
| Structural and Collateral Term Sheet | | BMO 2023-5C1 |
| No. 10 – Back Bay Office |
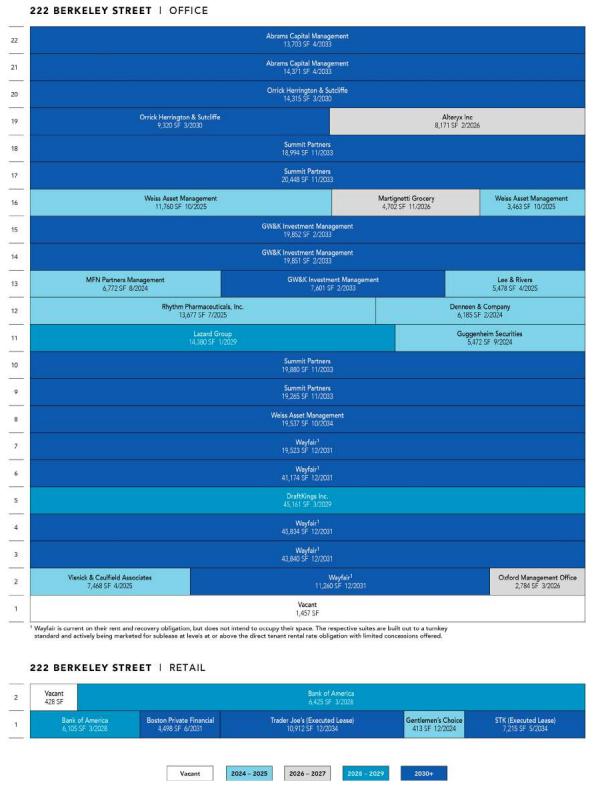
| THE INFORMATION IN THIS STRUCTURAL AND COLLATERAL TERM SHEET IS NOT COMPLETE AND MAY BE AMENDED PRIOR TO THE TIME OF SALE. THIS TERM SHEET IS NOT AN OFFER TO SELL THESE SECURITIES AND IT IS NOT A SOLICITATION OF AN OFFER TO BUY THESE SECURITIES IN ANY JURISDICTION WHERE THE OFFER OR SALE IS NOT PERMITTED. |
| | 113 | |
| Structural and Collateral Term Sheet | | BMO 2023-5C1 |
| No. 10 – Back Bay Office |
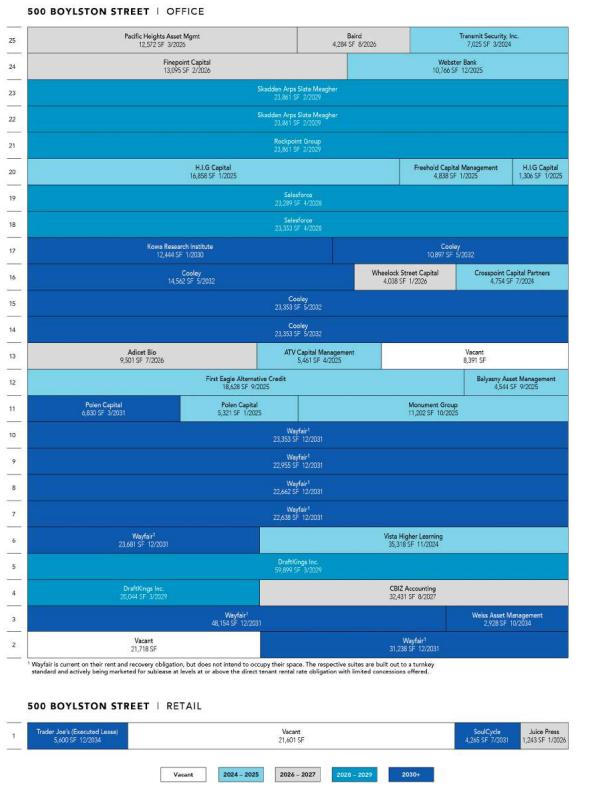
| THE INFORMATION IN THIS STRUCTURAL AND COLLATERAL TERM SHEET IS NOT COMPLETE AND MAY BE AMENDED PRIOR TO THE TIME OF SALE. THIS TERM SHEET IS NOT AN OFFER TO SELL THESE SECURITIES AND IT IS NOT A SOLICITATION OF AN OFFER TO BUY THESE SECURITIES IN ANY JURISDICTION WHERE THE OFFER OR SALE IS NOT PERMITTED. |
| | 114 | |
| Structural and Collateral Term Sheet | | BMO 2023-5C1 |
| No. 10 – Back Bay Office |

| THE INFORMATION IN THIS STRUCTURAL AND COLLATERAL TERM SHEET IS NOT COMPLETE AND MAY BE AMENDED PRIOR TO THE TIME OF SALE. THIS TERM SHEET IS NOT AN OFFER TO SELL THESE SECURITIES AND IT IS NOT A SOLICITATION OF AN OFFER TO BUY THESE SECURITIES IN ANY JURISDICTION WHERE THE OFFER OR SALE IS NOT PERMITTED. |
| | 115 | |
| Structural and Collateral Term Sheet | | BMO 2023-5C1 |
| No. 10 – Back Bay Office |
| Mortgage Loan Information | | Property Information |
| Mortgage Loan Seller: | GACC, GSMC | | Single Asset / Portfolio: | Single Asset |
| Original Principal Balance(1)(2): | $30,000,000 | | Title: | Fee |
| Cut-off Date Principal Balance(1)(2): | $30,000,000 | | Property Type – Subtype: | Office – CBD |
| % of IPB: | 3.9% | | Net Rentable Area (SF): | 1,283,670 |
| Loan Purpose: | Refinance | | Location: | Boston, MA |
| Borrower: | 500 Boylston & 222 Berkeley Owner (DE) LLC | | Year Built / Renovated: | 1987, 1991 / 2016-2022 |
| Borrower Sponsor: | JPMorgan Chase Bank, N.A., J.P. Morgan Investment Management Inc., OMERS Administration Corporation and OPG Investment Holdings (US), LLC | | Occupancy: | 95.8% |
| Interest Rate(3): | 6.29800% | | Occupancy Date: | 4/30/2023 |
| Note Date: | 6/7/2023 | | 4th Most Recent NOI (As of): | $51,254,278 |
| Maturity Date: | 7/6/2028 | | 3rd Most Recent NOI (As of): | $61,539,300 |
| Interest-only Period: | 60 months | | 2nd Most Recent NOI (As of): | $62,722,256 |
| Original Term: | 60 months | | Most Recent NOI (As of): | $63,014,340 |
| Original Amortization Term: | None | | UW Economic Occupancy: | 93.6% |
| Amortization Type: | Interest Only | | UW Revenues: | $115,015,445 |
| Call Protection: | L(25),DorYM1(28),O(7) | | UW Expenses: | $37,554,805 |
| Lockbox / Cash Management: | Hard / Springing | | UW NOI: | $77,460,640 |
| Additional Debt(2): | Yes | | UW NCF: | $77,203,906 |
| Additional Debt Balance(2): | $445,000,000 / $65,000,000 / $40,000,000 | | Appraised Value / Per SF(6): | $1,410,000,000 / $1,098 |
| Additional Debt Type(2): | Pari Passu / Subordinate/ Mezzanine | | Appraisal Date(6): | 10/19/2022 |
| | | | | |
| | | | | |
| Escrows and Reserves | | Financial Information(1) |
| | Initial | Monthly | Initial Cap | | | Senior Loan | Whole Loan | Total Debt |
| Taxes: | $0 | Springing | N/A | | Cut-off Date Loan / SF: | | $370 | | $421 | | $452 |
| Insurance: | $0 | Springing | N/A | | Maturity Date Loan / SF: | | $370 | | $421 | | $452 |
| Replacement Reserves: | $0 | Springing | N/A | | Cut-off Date LTV(2)(6): | | 33.7% | | 38.3% | | 41.1% |
| TI/LC Reserve(4): | $26,723,400 | Springing | N/A | | Maturity Date LTV(2)(6): | | 33.7% | | 38.3% | | 41.1% |
| Other(5): | $31,137,229 | $0 | N/A | | UW NCF DSCR(2): | | 2.55x | | 2.16x | | 1.94x |
| | | | | | UW NOI Debt Yield(2): | | 16.3% | | 14.3% | | 13.4% |
| | | | | | | | | |
| Sources and Uses |
| Sources | Proceeds | % of Total | | Uses | Proceeds | % of Total |
| Senior Loan(1)(2) | $475,000,000 | 76.4 | % | | Payoff Existing Debt(7) | $546,966,371 | 88.0 | % |
| Subordinate Loan(2) | 65,000,000 | 10.5 | | | Reserves | 57,860,629 | 9.3 | |
| Borrower Sponsor Equity | 41,583,604 | 6.7 | | | Closing Costs | 16,756,604 | 2.7 | |
| Mezzanine Loan(2) | 40,000,000 | 6.4 | | | | | |
| Total Sources | $621,583,604 | 100.0 | % | | Total Uses | $621,583,604 | 100.0 | % |
| (1) | The Back Bay Office Mortgage Loan (as defined below) is part of the Back Bay Office Whole Loan which has an original aggregate principal balance of $540,000,000. The Financial Information in the chart above reflects the Back Bay Office Senior Loan (as defined below) and the Back Bay Office Whole Loan. For additional information, see “The Loan” below. |
| (2) | The Back Bay Office Mortgage Loan is part of the Back Bay Office Whole Loan with an aggregate outstanding principal balance as of the Cut-off Date of $540,000,000, which is comprised of 15 senior pari passu promissory notes with an aggregate outstanding principal balance as of the Cut-off Date of $475,000,000 and two subordinate promissory notes with an aggregate outstanding principal balance as of the Cut-off Date of $65,000,000. The Cut-off Date LTV, Maturity Date LTV, UW NCF DSCR, UW NOI Debt Yield numbers presented above are based on the Back Bay Office Senior Loan. The Cut-off Date LTV, Maturity Date LTV, UW NCF DSCR and UW NOI Debt Yield based on the Back Bay Office Whole Loan are 38.3%, 38.3%, 2.16x and 14.3%, respectively. Additionally, a mezzanine loan was originated with an outstanding principal balance as of the Cut-off Date of $40,000,000 (the “Back Bay Office Mezzanine Loan,” and together with the Back Bay Office Whole Loan, the “Back Bay Office Total Debt”). The Cut-off Date LTV, Maturity Date LTV, UW NCF DSCR, and UW NOI Debt Yield based on the Back Bay Office Total Debt are 41.1%, 41.1%, 1.94x, 13.4%, respectively. |
| (3) | Represents the interest rate of the Back Bay Office Senior Loan. The interest rate of the Back Bay Office Subordinate Companion Loan (as defined below) is 8.2000% per annum. |
| THE INFORMATION IN THIS STRUCTURAL AND COLLATERAL TERM SHEET IS NOT COMPLETE AND MAY BE AMENDED PRIOR TO THE TIME OF SALE. THIS TERM SHEET IS NOT AN OFFER TO SELL THESE SECURITIES AND IT IS NOT A SOLICITATION OF AN OFFER TO BUY THESE SECURITIES IN ANY JURISDICTION WHERE THE OFFER OR SALE IS NOT PERMITTED. |
| | 116 | |
| Structural and Collateral Term Sheet | | BMO 2023-5C1 |
| No. 10 – Back Bay Office |
| (4) | The borrower is not required to make monthly deposits into the TI/LC reserve account until the first monthly payment date in which the undisbursed portion of the Upfront TI/LC Reserve of $26,723,400 is less than or equal to $15,000,000. Upon such event, the borrower will be required to deposit $213,969 on a monthly basis. See “—Escrows” below. |
| (5) | Other reserves include an upfront outstanding TI/LC reserve of approximately $21,283,070 and a free rent reserve of approximately $9,854,159. See “—Escrows” below. |
| (6) | Based on the “as is (extraordinary assumption)“ appraised value of $1,410,000,000 as of October 19, 2022, which is subject to the extraordinary assumption that approximately $67,600,000 has been reserved for leasing costs. Due to the time passed since the appraisal date, the leasing cost escrow amount under the loan agreement is $57,860,629. All outstanding leasing costs at the time of loan origination were reserved upfront. Based on the “as-is” appraised value of $1,345,000,000, the Cut-off Date LTV and Maturity Date LTV for the Back Bay Office Senior Loan), the Back Bay Office Whole Loan and the Back Bay Office Total Debt are equal to 35.3%, 40.1% and 43.1%, respectively. |
| (7) | Prior financing was originally $660,000,000 which was reduced by approximately $48.2 million of amortization prior to December 2022. In addition, in December 2022, the borrower sponsor executed an approximately $59.9 million paydown in conjunction with a short term loan extension. |
The Loan. The tenth largest mortgage loan (the “Back Bay Office Mortgage Loan”) is part of a whole loan (the “Back Bay Office Whole Loan”) that is evidenced by (i) fifteen pari passu senior promissory notes in the aggregate original principal amount of $475,000,000 (collectively, the “Back Bay Office Senior Loan”), (ii) two subordinate promissory notes in the original principal amount of $65,000,000 (the “Back Bay Office Subordinate Companion Loan”), and (iii) a mezzanine loan in the original principal amount of $40,000,000 (the “Back Bay Office Mezzanine Loan” and, together with the Back Bay Office Subordinate Companion Loan, the “Back Bay Office Subordinate Companion Loans”). The Back Bay Office Whole Loan was co-originated on June 7, 2023 by Deutsche Bank AG, New York Branch (“DBNY”), Goldman Sachs Bank USA (“GSBI”), Wells Fargo Bank, National Association (“WFBNA”), New York Life Insurance Company (“New York Life”), and Teachers Insurance and Annuity Association of America (“TIAA”). The Back Bay Office Whole Loan is secured by a first priority mortgage on the borrower’s fee simple interest in a 1,283,670 square foot office property located in Boston, Massachusetts (the “Back Bay Office Property”). The Back Bay Office Mortgage Loan is evidenced by the note A-5-1 with an outstanding principal balance of $17,500,000 contributed by GACC, and non-controlling notes A-8-2-B and A-8-3 with an aggregate outstanding principal balance as of the Cut-off Date of $12,500,000, contributed by GSMC. The remaining notes are currently held by DBRI, New York Life, Nuveen and Wells Fargo and are expected to be contributed to one or more future securitization trusts. The Back Bay Office Mortgage Loan will be serviced pursuant to the pooling and servicing agreement for the BMO 2023-C5 securitization. See “Description of the Mortgage Pool—The Whole Loans—The Serviced AB Whole Loan—The Back Bay Pari Passu-AB Whole Loan” and “Pooling and Servicing Agreement” in the Preliminary Prospectus.
The Back Bay Office Senior Loan accrues interest at a fixed rate of 6.29800% per annum and the Back Bay Office Subordinate Companion Loan accrues interest at a fixed rate of 8.20000% per annum. The Back Bay Office Whole Loan has an initial term of 60 months, a remaining term of 59 months and is interest-only for the full term. The scheduled maturity date of the Back Bay Office Whole Loan is the payment date that occurs in July 2028. The proceeds of the Back Bay Office Whole Loan were used to refinance the Back Bay Office Property, pay origination costs, and fund upfront reserves.
Defeasance or prepayment (together with, if prior to the payment date in January 2028, a prepayment fee equal to the greater of 1% of the unpaid principal balance and a yield maintenance premium) of the Back Bay Office Whole Loan in whole (but not in part) is permitted at any time after the earlier of (i) June 7, 2026 and (ii) the second anniversary of the date on which the entire Back Bay Office Whole Loan (other than note A-1, note A-2, note B-1 and note B-2) has been securitized. The assumed lockout period of 25 months is based on the expected BMO 2023-5C1 securitization cut-off date in August 2023. The actual lockout period may be longer. Voluntary prepayment of the Back Bay Office Whole Loan in whole (but not in part), without payment of any prepayment fee or yield maintenance premium is permitted on and after the payment date occurring in January 2028.
The table below summarizes the promissory notes that comprise the Back Bay Office Whole Loan. The relationship between the holders of the Back Bay Office Whole Loan is governed by a co-lender agreement as described under “Description of the Mortgage Pool—The Whole Loans—--The Back Bay Office Whole Loan” in the Preliminary Prospectus. The Back Bay Office Whole Loan will be serviced under the Benchmark 2023-B39 pooling and servicing agreement. See Description of the Mortgage Pool—The Whole Loans——The Back Bay Office Whole Loan”, and “The Pooling and Servicing Agreement—” in the Preliminary Prospectus.
| THE INFORMATION IN THIS STRUCTURAL AND COLLATERAL TERM SHEET IS NOT COMPLETE AND MAY BE AMENDED PRIOR TO THE TIME OF SALE. THIS TERM SHEET IS NOT AN OFFER TO SELL THESE SECURITIES AND IT IS NOT A SOLICITATION OF AN OFFER TO BUY THESE SECURITIES IN ANY JURISDICTION WHERE THE OFFER OR SALE IS NOT PERMITTED. |
| | 117 | |
| Structural and Collateral Term Sheet | | BMO 2023-5C1 |
| No. 10 – Back Bay Office |
| Whole Loan Summary |
| Note | Original Balance | Cut-off Date Balance | | Note Holder | Controlling Piece |
| A-1 | $137,500,000 | $137,500,000 | | New York Life | No(2) |
| A-2 | $100,000,000 | $100,000,000 | | TIAA | No(2) |
| A-3 | $22,500,000 | $22,500,000 | | Benchmark 2023-V3 | No |
| A-4-1 | $30,000,000 | $30,000,000 | | Benchmark 2023-B39 | No(2) |
| A-4-2 | $25,000,000 | $25,000,000 | | DBRI or its affiliate(1) | No |
| A-4-3 | $5,000,000 | $5,000,000 | | Benchmark 2023-V3 | No |
| A-5-1 | $17,500,000 | $17,500,000 | | BMO 2023-5C1 | No |
| A-5-2 | $12,500,000 | $12,500,000 | | DBRI or its affiliate(1) | No |
| A-6 | $50,000,000 | $50,000,000 | | BANK5 2023-5YR2 | No |
| A-7-A | $15,000,000 | $15,000,000 | | WFBNA(1) | No |
| A-7-B | $10,000,000 | $10,000,000 | | BANK5 2023-5YR2 | No |
| A-8-1 | $20,000,000 | $20,000,000 | | Benchmark 2023-B39 | No |
| A-8-2-A | $17,500,000 | $17,500,000 | | Benchmark 2023-V3 | No |
| A-8-2-B | $2,500,000 | $2,500,000 | | BMO 2023-5C1 | No |
| A-8-3 | $10,000,000 | $10,000,000 | | BMO 2023-5C1 | No |
| Total Senior Loan | $475,000,000 | $475,000,000 | | | |
| B-1 | $39,000,000 | $39,000,000 | | SM Finance (GoReLux) LLC, an entity managed by Affinius Capital Management LLC | Yes(2) |
| B-2 | $26,000,000 | $26,000,000 | | SM Finance (GoReLux) LLC, an entity managed by Affinius Capital Management LLC | No |
| Whole Loan | $540,000,000 | $540,000,000 | | | |
| (1) | Expected to be contributed to one or more future securitizations. |
| (2) | The Back Bay Office Whole Loan is a Pari Passu-AB whole loan, and the controlling note as of the date hereof is the Note B-1. Upon the occurrence of certain trigger events specified in the co-lender agreement, however, control will generally shift first, to the Note A-1, then to the Note A-2 and then to the Note A-4-1, in each case, following certain trigger events under the co-lender agreement. See “Description of the Mortgage Pool—The Whole Loans—The Back Bay Office Pari Passu-AB Whole Loan” in the Preliminary Prospectus for more information regarding the manner in which control shifts under the Back Bay Office Whole Loan. |
The Property. The Back Bay Office Property is a 1,283,670 SF Class A property located on a full square block at the intersection of Berkeley and Boylston Streets in the Back Bay neighborhood of Boston, Massachusetts. The Back Bay Office Property is made up of two interconnected buildings, developed by architects Philip Johnson and Robert A.M. Stern, with 500 Boylston Street built in 1987 and 222 Berkeley Street built in 1991. The Back Bay Office Property includes amenity-forward ground floor retail and proximity to major Boston transportation arteries. The Back Bay Office Property features flexible floor plates ranging from 14,000 to 100,000 SF, 12’-13’ slab-to-slab ceiling heights and a retail mix of restaurants and fitness tenants. Since acquiring the Back Bay Office Property in 2015, the borrower sponsor has invested approximately $192 million ($150 PSF) on leasing costs and renovation capital. Recent initiatives include renovations to the central courtyard and improvements to building common areas including a rejuvenated lobby atrium common space. The Back Bay Office Property consists of two of only 13 buildings in Boston to achieve LEED Platinum status. As of April 30, 2023, the Back Bay Office Property was 95.8% leased to 46 tenants with the largest tenant accounting for 27.8% of NRA.
The Back Bay Office Property is currently 95.8% occupied as of April 30, 2023, by a granular collection of technology, finance, and law tenants. The largest tenant is Wayfair (356,312 SF | 19.5% of underwritten base rent | lease expiration: December 31, 2031), an online platform focused exclusively on the approximately $800 billion home goods market (see further information under Major Tenants). Additional top tenants include: DraftKings Inc. (125,104 SF | 7.3% of underwritten base rent | lease expiration: March 31, 2029); Summit Partners (78,587 SF | 7.4% of underwritten base rent | lease expiration: November 30, 2033); Cooley (72,165 SF | 6.6% of underwritten base rent | lease expiration: May 31, 2032 | AM Law 2022 #16); and Skadden Arps Slate Meagher (47,722 SF | 3.8% of underwritten base rent | lease expiration: February 28, 2029 | AM Law 2022 #5). While the Property is 95.8% occupied, as of April 30, 2023, and only 26.4% of NRA is scheduled to roll during the five-year loan term, Wayfair is currently dark in its space but is currently paying full unabated rent.
Major Tenants. The three largest tenants based on underwritten base rent are Wayfair, Summit Partners and Draft Kings Inc. (“Draft Kings”.
Wayfair (356,312 square feet; 27.8% NRA; 19.5% of underwritten base rent): Wayfair is a large online platform focused exclusively on the home goods market. Wayfair provides approximately 33 million furniture, home décor, houseware, and home improvement products to customers in the United States and internationally, under various brands through its websites including Wayfair, Joss & Main, All Modern, Birch Lane, and Perigold. Headquartered in Boston, Massachusetts with operations throughout North America and Europe, Wayfair employs approximately 18,000 people. Wayfair is currently dark in its space, however as of the origination date Wayfair was paying full unabated rent. We cannot assure you whether Wayfair will continue to pay rent as expected or at all. Wayfair’s lease expires on December 31, 2031. Wayfair has subleased 19,523 SF of space on the 7th floor to Drift.com at $57.50 PSF, full-service gross, with a lease expiration of December 31, 2024. Wayfair is currently marketing 156,436 SF of its remaining space for sublease.
| THE INFORMATION IN THIS STRUCTURAL AND COLLATERAL TERM SHEET IS NOT COMPLETE AND MAY BE AMENDED PRIOR TO THE TIME OF SALE. THIS TERM SHEET IS NOT AN OFFER TO SELL THESE SECURITIES AND IT IS NOT A SOLICITATION OF AN OFFER TO BUY THESE SECURITIES IN ANY JURISDICTION WHERE THE OFFER OR SALE IS NOT PERMITTED. |
| | 118 | |
| Structural and Collateral Term Sheet | | BMO 2023-5C1 |
| No. 10 – Back Bay Office |
Summit Partners (78,587 square feet; 6.1% NRA; 7.4% of underwritten base rent): Founded in 1984, Summit Partners is a global alternative investment firm that is currently managing more than $35 billion in capital dedicated to growth equity, fixed income and public equity opportunities. Summit Partners has invested in more than 500 companies in technology, healthcare and other growth industries. Summit Partners has backed many fintech and software service companies, including Calypso Technology, Clearwater Analytics (NYSE: CWAN), EngageSmart (NYSE: ESMT), Gainsight, Jamf (NYSE: JAMF), Klaviyo, RightNow and Smartsheet (NYSE: SMAR). Summit Partners maintains offices in North America and Europe and invests in companies around the world. Summit Partners’ lease expires on November 30, 2033. Summit Partners is in a free rent period for 54,416 SF through November 2023, which was reserved in full at origination. We cannot assure you that Summit Partners will commence paying rent as expected or at all.
Draft Kings (125,104 square feet; 9.7% NRA; 7.3% of underwritten base rent): DraftKings Inc. is a digital sports entertainment and gaming company with products that range across daily fantasy, regulated gaming and digital media. Headquartered in Boston, and launched in 2012 by Jason Robins, Matt Kalish and Paul Liberman, DraftKings Inc. is a multi-channel provider of sports betting and gaming technologies, powering sports and gaming entertainment for operators in 17 countries. DraftKings Inc.’s lease at the Back Bay Office Property commenced in December 2017 and expires in March 2029 followed by two, five-year extension options. DraftKings Inc. has the right to terminate its lease as of the last day of the 7th lease year from the rent commencement date (March 10, 2026), with between 18 to 21 months’ written notice and the payment of a termination fee equal to three months of base rent for the period immediately following the termination date and the unamortized transaction costs.
Environmental. According to a Phase I environmental assessment dated November 15, 2022, there was no evidence of any recognized environmental conditions at the Back Bay Office Property.
The following table presents certain information relating to the historical occupancy of the Back Bay Office Property:
| Historical and Current Occupancy |
| 2020(1) | 2021(1) | 2022(1) | Current(2) |
| 96.0% | 97.0% | 96.8% | 95.8% |
| (1) | Historical Occupancies are as of December 31 of each respective year. |
| (2) | Current Occupancy is as of April 30, 2023. |
| THE INFORMATION IN THIS STRUCTURAL AND COLLATERAL TERM SHEET IS NOT COMPLETE AND MAY BE AMENDED PRIOR TO THE TIME OF SALE. THIS TERM SHEET IS NOT AN OFFER TO SELL THESE SECURITIES AND IT IS NOT A SOLICITATION OF AN OFFER TO BUY THESE SECURITIES IN ANY JURISDICTION WHERE THE OFFER OR SALE IS NOT PERMITTED. |
| | 119 | |
| Structural and Collateral Term Sheet | | BMO 2023-5C1 |
| No. 10 – Back Bay Office |
The following table presents certain information relating to the largest tenants based on underwritten base rent of the Back Bay Office Property:
Top Tenant Summary(1) |
| Tenant | Ratings
Moody’s/S&P/Fitch(2) | Net Rentable Area (SF) | % of
Total NRA | UW
Base Rent PSF(3) |
UW
Base Rent(3) | % of Total
UW Base Rent(3) | Lease
Exp. Date |
| Wayfair(3)(4) | NR/NR/NR | 356,312 | 27.8 | % | $38.00 | $13,539,856 | 19.5 | % | 12/31/2031 |
| Summit Partners(5) | B3/B/B- | 78,587 | 6.1 | | 65.04 | 5,111,125 | 7.4 | | 11/30/2033 |
| DraftKings Inc.(6) | NR/NR/NR | 125,104 | 9.7 | | 40.67 | 5,087,655 | 7.3 | | 3/31/2029 |
| Cooley(7) | NR/NR/NR | 72,165 | 5.6 | | 63.51 | 4,583,500 | 6.6 | | 5/31/2032 |
| Salesforce(8) | A2/A+/NR | 46,642 | 3.6 | | 83.00 | 3,871,286 | 5.6 | | 4/30/2028 |
| GW&K Investment Management | A3/BBB+/NR | 47,304 | 3.7 | | 72.00 | 3,405,888 | 4.9 | | 2/28/2033 |
| Weiss Asset Management(9)(10) | NR/NR/NR | 37,688 | 2.9 | | 71.22 | 2,684,320 | 3.9 | | Various |
| Skadden Arps Slate Meagher | NR/NR/NR | 47,722 | 3.7 | | 55.00 | 2,624,710 | 3.8 | | 2/28/2029 |
| Abrams Capital Management(11) | NR/NR/NR | 28,074 | 2.2 | | 79.00 | 2,217,846 | 3.2 | | 4/30/2033 |
| Orrick Herrington & Sutcliffe | NR/NR/NR | 23,635 | 1.8 | | 75.12 | 1,775,542 | 2.6 | | 3/31/2030 |
| Largest Tenants | | 863,233 | 67.2 | % | $52.02 | $44,901,728 | 64.7 | % | |
| Other Tenants(12) | | 366,842 | 28.6 | | 66.65 | 24,449,836 | 35.3 | | |
| Occupied Collateral Total / Wtd. Avg. | | 1,230,075 | 95.8 | % | $56.38 | $69,351,564 | 100.0 | % | |
| Vacant Space | | 53,595 | 4.2 | | | | | |
| Total / Wtd. Avg. All Owned Tenants | | 1,283,670 | 100.0 | % | | | | |
| | | | | | | | |
| (1) | Based on the underwritten rent roll dated April 30, 2023. |
(2) Credit Ratings are those of the parent company whether or not the parent guarantees the lease.
| (3) | Wayfair is currently dark in its space, but as of the origination date was paying unabated rent. We cannot assure you whether Wayfair will continue paying rent as expected or at all. |
| (4) | Wayfair has subleased 19,523 SF of space on the 7th floor to Drift.com at $57.50 PSF, full-service gross, with a lease expiration of December 31, 2024. Wayfair is currently marketing 156,436 SF of its remaining space for sublease. |
| (5) | Summit Partners is in a free rent period for 54,416 SF through November 2023, which was reserved in full at origination. We cannot assure you that Summit Partners will commence paying rent as expected or at all. |
| (6) | DraftKings Inc. has the right to terminate its lease as of the last day of the 7th lease year from the rent commencement date (March 10, 2026) with between 18 to 21 months’ written notice and the payment of a termination fee equal to three months of base rent for the period immediately following the termination date and the unamortized transaction costs. |
| (7) | Cooley has the one time right to terminate its space on the 16th floor (14,562 SF) as of May 31, 2025 with between 12 to 18 months written notice and the payment of a termination fee equal to three months of net rent and operating costs for the period immediately following the termination option, plus the unamortized pro-rata extension transaction cost. |
| (8) | Salesforce has subleased 23,353 SF of its space to Providence Equity Partners, Aeris Partners at a rate of $80.97 PSF, which sublease is co-terminous with the prime lease. |
| (9) | According to the underwritten rent roll as of April 30, 2023, two Weiss Asset Management spaces totaling 15,223 SF have an underwritten lease expiration of October 31, 2025; however, pursuant to the lease amendment dated November 15, 2022, its expected lease expiration for its other three spaces totaling 22,465 SF is October 31, 2034, which would result in a weighted average remaining term of 11.4 years for Weiss Asset Management. |
| (10) | Weiss Asset Management is currently in a free rent period for 19,537 SF until August 1, 2024, which was reserved in full at origination. We cannot assure you that Weiss Asset Management will commence paying rent as expected or at all. |
| (11) | Abrams Capital Management is currently in a free rent period until December 15, 2023, which was reserved in full at origination. We cannot assure you that Abrams Capital Management will commence paying rent as expected or at all. |
| (12) | Remaining Tenants includes two tenants (Trader Joe’s and STK), totaling 1.8% of net rentable area that have not yet taken occupancy. STK is expected to take occupancy in December 2023 and Trader Joe’s is expected to take occupancy in June 2024. We cannot assure you that either tenant will take occupancy of its respective space as expected or at all. |
| THE INFORMATION IN THIS STRUCTURAL AND COLLATERAL TERM SHEET IS NOT COMPLETE AND MAY BE AMENDED PRIOR TO THE TIME OF SALE. THIS TERM SHEET IS NOT AN OFFER TO SELL THESE SECURITIES AND IT IS NOT A SOLICITATION OF AN OFFER TO BUY THESE SECURITIES IN ANY JURISDICTION WHERE THE OFFER OR SALE IS NOT PERMITTED. |
| | 120 | |
| Structural and Collateral Term Sheet | | BMO 2023-5C1 |
| No. 10 – Back Bay Office |
The following table presents certain information relating to the tenant lease expirations of the Back Bay Office Property:
| Lease Rollover Schedule(1)(2) |
| Year | Number of Leases Expiring | Net Rentable Area Expiring | % of NRA Expiring | UW Base Rent Expiring(3) | % of UW Base Rent Expiring(3) | Cumulative Net Rentable Area Expiring | Cumulative % of NRA Expiring | Cumulative UW Base Rent Expiring(3) | Cumulative % of UW Base Rent Expiring(3) |
| Vacant | NAP | 53,595 | 4.2 | % | NAP | NAP | | 53,595 | 4.2% | NAP | NAP | |
| 2023 | 0 | 0 | 0.0 | | $0 | 0.0 | % | 53,595 | 4.2% | $0 | 0.0% | |
| 2024 | 7 | 65,939 | 5.1 | | 3,413,905 | 4.9 | | 119,534 | 9.3% | $3,413,905 | 4.9% | |
| 2025 | 12 | 120,770 | 9.4 | | 8,093,017 | 11.7 | | 240,304 | 18.7% | $11,506,922 | 16.6% | |
| 2026 | 9 | 60,390 | 4.7 | | 5,060,933 | 7.3 | | 300,694 | 23.4% | $16,567,855 | 23.9% | |
| 2027 | 1 | 32,431 | 2.5 | | 1,167,516 | 1.7 | | 333,125 | 26.0% | $17,735,371 | 25.6% | |
| 2028 | 2 | 59,172 | 4.6 | | 5,133,946 | 7.4 | | 392,297 | 30.6% | $22,869,317 | 33.0% | |
| 2029 | 4 | 211,067 | 16.4 | | 10,217,124 | 14.7 | | 603,364 | 47.0% | $33,086,441 | 47.7% | |
| 2030 | 2 | 36,079 | 2.8 | | 2,847,592 | 4.1 | | 639,443 | 49.8% | $35,934,034 | 51.8% | |
| 2031 | 4 | 371,905 | 29.0 | | 15,324,573 | 22.1 | | 1,011,348 | 78.8% | $51,258,607 | 73.9% | |
| 2032 | 1 | 72,165 | 5.6 | | 4,583,500 | 6.6 | | 1,083,513 | 84.4% | $55,842,107 | 80.5% | |
| 2033 & Thereafter(3) | 6 | 200,157 | 15.6 | | 13,509,457 | 19.5 | | 1,283,670 | 100.0% | $69,351,564 | 100.0% | |
| Total | 48 | 1,283,670 | 100.0 | % | $69,351,564 | 100.0 | % | | | | |
| (1) | Certain tenants may have termination or contraction options that may become exercisable prior to the originally stated expiration date of the tenant lease that are not considered in this lease expiration schedule. |
| (2) | Based on the underwritten rent roll dated April 30, 2023. |
| (3) | According to the underwritten rent roll as of April 30, 2023, two Weiss Asset Management spaces totaling 15,223 SF have an underwritten lease expiration of October 31, 2025; however, pursuant to the lease amendment dated November 15, 2022, their expected lease expiration is October 31, 2034, which would result in a weighted average remaining term of 11.4 years for Weiss Asset Management. |
The following table presents certain information relating to the underwritten cash flows of the Back Bay Office Property:
| Operating History and Underwritten Net Cash Flow |
| | 2020 | 2021 | 2022 | TTM(1) | Underwritten | Per Square Foot | %(2) |
| Base Rent(3) | $51,526,277 | $59,949,889 | $59,804,916 | 58,642,289 | 69,351,564 | $54.03 | | 64.2 | % |
| Step Rent(4) | 0 | 0 | 0 | 0 | 1,362,984 | 1.06 | | 1.3 | |
| Step Rent Credit(5) | 0 | 0 | 0 | 0 | 521,804 | 0.41 | | 0.5 | |
| Value of Vacant Space | 0 | 0 | 0 | 0 | 4,911,403 | 3.83 | | 4.5 | |
| Gross Potential Rent | $51,526,277 | $59,949,889 | $59,804,916 | $58,642,289 | $76,147,755 | $59.32 | | 70.4 | % |
| Total Reimbursements | 24,669,444 | 27,067,738 | 28,017,620 | 28,290,450 | 31,949,642 | 24.89 | | 29.6 | |
| Net Rental Income | $76,195,721 | $87,017,627 | $87,822,536 | $86,932,739 | $108,097,396 | $84.21 | | 100.0 | % |
| Other Income | 7,723,812 | 8,115,682 | 11,231,780 | 13,140,165 | 11,829,452 | 9.22 | | 10.9 | |
| (Vacancy/Credit Loss)(6) | (633,236) | (359,541) | (80,985) | (80,987) | (4,911,403) | (3.83) | | (4.5 | ) |
| Effective Gross Income | $83,286,297 | $94,773,768 | $98,973,331 | $99,991,917 | $115,015,445 | $89.60 | | 106.4 | % |
| Total Expenses | 32,032,019 | 33,234,468 | 36,251,075 | 36,977,577 | 37,554,805 | 29.26 | | 32.7 | |
| Net Operating Income(7)(8) | $51,254,278 | $61,539,300 | $62,722,256 | $63,014,340 | $77,460,640 | $60.34 | | 67.3 | % |
| Total TI/LC, Capex/RR | 0 | 0 | 0 | 0 | 256,734 | 0.20 | | 0.2 | |
| Net Cash Flow | $51,254,278 | $61,539,300 | $62,722,256 | $63,014,340 | $77,203,906 | $60.14 | | 67.1 | % |
| (1) | TTM reflects the trailing 12 month period ending on March 31, 2023. |
| (2) | % column represents percent of Net Rental Income for all revenue lines and represents percent of Effective Gross Income for the remainder of fields. |
| (3) | Based on the underwritten rent roll dated April 30, 2023. |
| (4) | Represents contractual rent steps through April 1, 2024. |
| (5) | Represents straight-line rent average through each tenant’s lease expiration for investment-grade tenants and tenants included in a legal industry magazine listing of the top 100 United States law firms by revenues (“Top 100 Law Firms”). |
| (6) | Vacancy also encompasses bad debt, which includes provisions made for COVID-19 abatements in 2020 and credits for unused provisions in 2021. |
| (7) | The increase in Net Operating Income from 2020 to 2021 was primarily driven by nine tenants, representing 6.6% of net rentable area with leases that began or renewed/extended in 2021, rent increases for tenants in place, and an increase in total recoveries. |
| (8) | The increase from TTM 3/31/2023 to Underwritten Net Operating Income was primarily driven by including credit for six leases which began in October 2022 or later, representing 11.6% of the net rentable area, the rent average benefit for investment-grade and Top 100 Law Firm tenants, contractual rent steps, and an increase in recoveries. |
| THE INFORMATION IN THIS STRUCTURAL AND COLLATERAL TERM SHEET IS NOT COMPLETE AND MAY BE AMENDED PRIOR TO THE TIME OF SALE. THIS TERM SHEET IS NOT AN OFFER TO SELL THESE SECURITIES AND IT IS NOT A SOLICITATION OF AN OFFER TO BUY THESE SECURITIES IN ANY JURISDICTION WHERE THE OFFER OR SALE IS NOT PERMITTED. |
| | 121 | |
| Structural and Collateral Term Sheet | | BMO 2023-5C1 |
| No. 10 – Back Bay Office |
The Market. The Back Bay Office Property is located in Boston, Suffolk County, Massachusetts, in the Back Bay office submarket. The Back Bay office submarket, one of nine distinct geographic concentrations within Boston, contains 14.3 million market rate rental SF of office space, or 10.3% of the Boston metro's total inventory of office space. In the ten-year period beginning with the third quarter of 2012, new additions to the submarket totaled 884,000 SF, while 58,000 SF were removed by developer activity. The net total gain of 826,000 SF equates to an annualized inventory growth rate of 0.6%, trailing slightly the Boston metropolitan growth rate of 1.0% over the same period. The Back Bay office submarket consists of approximately 17,357,250 SF of rentable office space as of May 6, 2023. The average market rent for the Back Bay office submarket is $59.09 per SF and the average vacancy rate is 9.4%.
| Comparable Office Leases(1) |
| Property Name/Location | Tenant | Lease Size (SF) | Rent PSF | Commencement | Lease Term (Years) | Lease Type |
Back Bay Office Boston, MA | Various | Various | $56.38(2) | Various | Various | NNN |
John Hancock Tower Boston, MA | Versanis Bio, Inc. | 5,190 | $80.00 | Jun-23 | 5.0 Yrs | NNN |
Prudential Center Boston, MA | Foley & Lardner | 99,644 | $96.90 | Mar-24 | 5.0 Yrs | Gross + TE |
Prudential Tower Boston, MA | Federal Home Loan Bank | 39,185 | $57.00 | Jan-24 | 15.0 Yrs | Gross + TE |
One Exeter Plaza Boston, MA | Cerulli Associates | 10,917 | $82.00 | Nov-22 | 10.5 Yrs | Gross + TE |
101 Huntington Boston, MA | Audax Management | 101,815 | $78.00 | Nov-22 | 14.2 Yrs | Gross + TE |
| (2) | Represents total weighted average of all tenants at the Back Bay Office Property based on the underwritten rent roll dated April 30, 2023. |
The Borrower. The borrower is 500 Boylston & 222 Berkeley Owner (DE) LLC, a Delaware limited liability company, structured to be a single purpose bankruptcy-remote entity with two independent directors. Legal counsel to the borrower delivered a non-consolidation opinion in connection with the origination of the Back Bay Office Whole Loan.
The Borrower Sponsor. The borrower sponsors are JPMorgan Chase Bank, N.A., J.P. Morgan Investment Management Inc., OMERS Administration Corporation (“OMERS”), and OPG Investment Holdings (US), LLC, and the non-recourse carveout guarantor is OPG Investment Holdings (US), LLC. The borrower is owned by a joint venture between J.P. Morgan Asset Management (“JPMAM”) and Oxford Properties (“Oxford”). JPMAM, with assets under management of $2.2 trillion as of September 30, 2022, is a global investment manager. JPMAM’s clients include institutions, retail investors and high-net worth individuals. JPMAM offers global investment management in equities, fixed income, real estate, hedge funds, private equity and liquidity.
Oxford is a global real estate investor, asset manager, and builder. It builds, buys, and grows defined real estate operating businesses. Established in 1960, Oxford and its portfolio companies reported that they manage approximately $80 billion (CAD) of assets across four continents on behalf of their investment partners. Oxford’s owned portfolio encompasses office, logistics, retail, multifamily residential, life sciences and hotels; it spans nearly 164 million SF. Oxford is owned by OMERS, the Canadian defined benefit pension plan for Ontario’s municipal employees. OPG Investment Holdings (US), LLC, the non-recourse carveout guarantor, is owned by OMERs, and does not have an ownership interest in the borrower.
Property Management. The Back Bay Office Property is managed by Oxford I Asset Management USA Inc., a Delaware corporation, an affiliate of the borrower sponsor.
Escrows and Reserves. At origination of the Back Bay Office Whole Loan, the borrower deposited (i) $26,723,400 (the “Upfront Rollover Deposit”) into a TI/LC rollover reserve, (ii) $21,283,070 into an outstanding TI/LC reserve and (iii) $9,854,159 into a free rent reserve.
Tax Reserve. On each monthly payment date during a Trigger Period (as defined below), the borrower is required to deposit into a real estate tax reserve 1/12th of the taxes that the lender estimates will be payable by the borrower over the next-ensuing 12-month period.
Insurance Reserve. On each monthly payment date during a Trigger Period, the borrower is required to deposit into an insurance reserve an amount equal to 1/12 of the insurance premiums that the lender reasonably estimates will be required for the renewal of coverage. The borrower does not need to deposit payments on each monthly payment date into the insurance reserve if an acceptable blanket policy is in effect.
Replacement Reserve. The borrower is required to deposit into a replacement reserve, on a monthly basis during the continuance of a Trigger Period, an amount equal to $21,397.
TI/LC Reserve. The borrower is required to deposit into a TI/LC reserve, on a monthly basis, an amount equal to $213,969; provided, however, such monthly deposits will not commence until the Upfront Rollover Deposit becomes equal to or less than $15,000,000.
| THE INFORMATION IN THIS STRUCTURAL AND COLLATERAL TERM SHEET IS NOT COMPLETE AND MAY BE AMENDED PRIOR TO THE TIME OF SALE. THIS TERM SHEET IS NOT AN OFFER TO SELL THESE SECURITIES AND IT IS NOT A SOLICITATION OF AN OFFER TO BUY THESE SECURITIES IN ANY JURISDICTION WHERE THE OFFER OR SALE IS NOT PERMITTED. |
| | 122 | |
| Structural and Collateral Term Sheet | | BMO 2023-5C1 |
| No. 10 – Back Bay Office |
Lockbox / Cash Management. The Back Bay Office Whole Loan is structured with a hard lockbox and springing cash management. The borrower is required to cause all rents of the Back Bay Office Property to be transmitted directly by the tenants into a lockbox account controlled by the lender. The borrower and property manager are required to deposit all revenues otherwise received relating to the Back Bay Office Property (other than tenant security deposits) into the lockbox account within two business days following receipt. All funds deposited into the lockbox are required to be transferred on a daily basis to or at the direction of the borrower unless a Trigger Period exists. Upon the occurrence and during the continuance of a Trigger Period, all funds in the lockbox account are required to be swept on a daily basis to a cash management account under the control of the lender to be applied and disbursed in accordance with the Back Bay Office Whole Loan documents, and all excess cash flow funds remaining in the cash management account after the application of such funds in accordance with the Back Bay Office Whole Loan documents are required to (i) to the extent that any Trigger Period exists other than solely as the result of a Lease Sweep Period (as defined below), be deposited into an excess cash flow reserve account as additional collateral for the Back Bay Office Whole Loan, or (ii) during a Trigger Period continuing due to a Lease Sweep Period (regardless of whether any other Trigger Period is continuing), to be deposited into the lease sweep account.
A “Trigger Period” means a period that commences (i) upon the occurrence of an event of default under the Back Bay Office Whole Loan documents until cured, (ii) upon the debt yield falling below (a) 8.50% based on the combined outstanding principal balance of the Back Bay Office Whole Loan and the Back Bay Office Mezzanine Loan or (b) 9.10% based on the outstanding principal balance of the Back Bay Office Whole Loan, as of the last day of any quarter (a “Low Debt Yield Period”) until the debt yield is equal to or greater than 8.50% for one calendar quarter for the Back Bay Office Whole Loan and Back Bay Office Mezzanine Loan or the debt yield is equal to or greater than 9.10% for one calendar quarter for the Back Bay Office Whole Loan (provided that the borrower may cure or avoid a Low Debt Yield Period by delivering to the lender cash or a letter of credit in the amount by which the outstanding principal balance of the Back Bay Office Whole Loan and/or the Back Bay Office Mezzanine Loan, as applicable, would need to be reduced for the applicable debt yield test to be satisfied), (iii) if a property manager is an affiliate of the borrower or guarantor and becomes insolvent or a debtor in any bankruptcy or insolvency proceeding, unless such property manager is replaced within 30 days until the manager is replaced with a non-affiliated manager in accordance with the terms of the Back Bay Office Whole Loan, (iv) upon the occurrence of an event of default under the Back Bay Office Mezzanine Loan documents until the mezzanine lender sends the lender a notice that such event of default has been cured or waived, or (v) upon the commencement of a Lease Sweep Period until such Lease Sweep Period ceases pursuant to the terms of the Back Bay Office Whole Loan documents.
A “Lease Sweep Period” means a period commencing on the first monthly payment date following the occurrence of any of the following: (a) with respect to each Lease Sweep Lease (as defined below), the earlier to occur of: (x) 12 months prior to the earliest stated expiration (including the stated expiration of any renewal term) of a Lease Sweep Lease; and (y) the date required under a Lease Sweep Lease by which the tenant thereunder is required to give notice of its exercise of a renewal option thereunder (and such renewal has not been so exercised); (b) the receipt by the borrower or property manager of notice from any tenant under a Lease Sweep Lease exercising its right to terminate its Lease Sweep Lease; (c) the date that a Lease Sweep Lease is surrendered, cancelled or terminated prior to its then current expiration date or the receipt by the borrower or property manager of notice from any tenant under a Lease Sweep Lease of its intent to surrender, cancel or terminate the Lease Sweep Lease prior to its then current expiration date; (d) the date that any tenant under a Lease Sweep Lease (other than Wayfair and any investment grade tenant) discontinues its business (i.e., “goes dark”) in its space at the Back Bay Office Property or gives notice that it intends to do any of the foregoing; (e) upon a default under a Lease Sweep Lease by the tenant thereunder that continues beyond any applicable notice and cure period; or (f) the occurrence of any of the following (A) any Lease Sweep Lease party is unable to pay its debts generally, or institutes any proceeding seeking to adjudicate it insolvent or seeking a liquidation or dissolution, or (B) the instituting of any proceeding against or with respect to any Lease Sweep Lease party seeking liquidation of its assets or the appointment of a receiver, liquidator, conservator, trustee or similar official in respect of it or the whole or any substantial part of its properties or assets or the taking of any corporate, partnership or limited liability company action in furtherance of any of the foregoing.
A Lease Sweep Period will end upon the following: (i) with regard to clauses (a) through (d) above, the entirety of the Lease Sweep Lease space is leased to a satisfactory replacement tenant or tenants, and in the lender’s reasonable judgment sufficient funds have been accumulated in the lease sweep account to cover all anticipated approved lease sweep space leasing expenses, free rent periods, and/or rent abatements, and any shortfalls in required payments under the loan documents or operating expenses as a result of anticipated downtime prior to the commencement of payments under the lease or leases, which funds on deposit in the lease sweep account may not exceed $125 PSF of the lease sweep space, provided that all anticipated approved lease sweep space leasing expenses will not, in lender’s reasonable judgement, exceed $125 PSF, (ii) with regard to clauses (a) through (f), funds collected in the lease sweep account are equal to $75 PSF for the applicable tenant’s space (“Lease Sweep Deposit Amount”), unless the lender determines that anticipated leasing expenses will exceed the Lease Sweep Deposit Amount, in which case the sweep will continue until the lender is satisfied that there are sufficient funds in the lease sweep account; (iii) with regard to clause (a), the tenant of the Lease Sweep Lease space has irrevocably exercised its renewal or extension option with respect to all of its space, and sufficient funds have been accumulated to cover all anticipated leasing costs; (iv) with regard to clauses (b) and (c), such termination option is not validly exercised by the tenant or is otherwise validly and irrevocably waived in writing; (v) with regard to clause (e), the date the default has been cured; or (vi) with regard to clause (f), either the Lease Sweep Lease has been affirmed or assumed in the tenant insolvency, without modification of such lease or guaranty, in a manner reasonably satisfactory to the lender, pursuant to a final, non-appealable order of the bankruptcy court, and the tenant is in full occupancy and paying full unabated rent, and adequate assurance of the future performance under the Lease Sweep Lease, as determined by the lender, has been provided, or the Lease Sweep Deposit Amount has been met.
| THE INFORMATION IN THIS STRUCTURAL AND COLLATERAL TERM SHEET IS NOT COMPLETE AND MAY BE AMENDED PRIOR TO THE TIME OF SALE. THIS TERM SHEET IS NOT AN OFFER TO SELL THESE SECURITIES AND IT IS NOT A SOLICITATION OF AN OFFER TO BUY THESE SECURITIES IN ANY JURISDICTION WHERE THE OFFER OR SALE IS NOT PERMITTED. |
| | 123 | |
| Structural and Collateral Term Sheet | | BMO 2023-5C1 |
| No. 10 – Back Bay Office |
A “Lease Sweep Lease” means (i) the Wayfair lease or (ii) any replacement lease from a different tenant that leases at least 235,000 rentable SF.
Subordinate and Mezzanine Debt. The $65,000,000 Back Bay Office Subordinate Companion Loan was funded concurrently with the origination of the Back Bay Office Senior Loan and comprises part of the Back Bay Office Whole Loan. The Back Bay Office Subordinate Companion Loan accrues interest at a rate of 8.2000% per annum. The holders of the Back Bay Office Mortgage Loan, the Back Bay Office Pari Passu Companion Loans and the Back Bay Office Subordinate Companion Loan have entered into a co-lender agreement that governs their relationship, as described under “Description of the Mortgage Pool—The Whole Loans—The Back Bay Office Whole Loan” in the Preliminary Prospectus. Additionally, the $40,000,000 Back Bay Office Mezzanine Loan was funded by RICP V Holdings, LLC concurrently with the origination of the Back Bay Office Whole Loan and is secured by the direct equity ownership in the borrower of the Back Bay Office Whole Loan. The Back Bay Office Mezzanine Loan accrues interest at a rate of 10.12500% per annum, interest only, and matures on July 6, 2028. The lenders of the Back Bay Office Whole Loan and the Back Bay Office Mezzanine Loan have entered into an intercreditor agreement that governs their relationship.
Partial Release. Not permitted.
Ground Lease. None.
| THE INFORMATION IN THIS STRUCTURAL AND COLLATERAL TERM SHEET IS NOT COMPLETE AND MAY BE AMENDED PRIOR TO THE TIME OF SALE. THIS TERM SHEET IS NOT AN OFFER TO SELL THESE SECURITIES AND IT IS NOT A SOLICITATION OF AN OFFER TO BUY THESE SECURITIES IN ANY JURISDICTION WHERE THE OFFER OR SALE IS NOT PERMITTED. |
| | 124 | |