| | | FREE WRITING PROSPECTUS |
| | | FILED PURSUANT TO RULE 433 |
| | | REGISTRATION FILE NO.: 333-255934-10 |
| | | |
| Dated January 22, 2024 | BMO 2024-5C3 |
| Structural and Collateral Term Sheet |
BMO 2024-5C3 Mortgage Trust |
$902,240,000 (Approximate Mortgage Pool Balance) |
| |
$809,593,000 (Approximate Offered Certificates) |
| |
BMO Commercial Mortgage Securities LLC Depositor |
| |
Commercial Mortgage Pass-Through Certificates, Series 2024-5C3 |
| |
|
Bank of Montreal Citi Real Estate Funding Inc. Societe Generale Financial Corporation Starwood Mortgage Capital LLC German American Capital Corporation Goldman Sachs Mortgage Company UBS AG Greystone Commercial Mortgage Capital LLC Zions Bancorporation, N.A. LMF Commercial, LLC Sponsors and Mortgage Loan Sellers |
BMO
Capital
Markets | Société
Générale | Deutsche
Bank
Securities | Goldman
Sachs &
Co. LLC | UBS
Securities
LLC | Citigroup |
| Co-Lead Managers and Joint Bookrunners |
Academy Securities
Co-Manager | Bancroft Capital, LLC
Co-Manager | Drexel Hamilton
Co-Manager |
| THE INFORMATION IN THIS STRUCTURAL AND COLLATERAL TERM SHEET IS NOT COMPLETE AND MAY BE AMENDED PRIOR TO THE TIME OF SALE. THIS TERM SHEET IS NOT AN OFFER TO SELL THESE SECURITIES AND IT IS NOT A SOLICITATION OF AN OFFER TO BUY THESE SECURITIES IN ANY JURISDICTION WHERE THE OFFER OR SALE IS NOT PERMITTED. |
| Dated January 22, 2024 | BMO 2024-5C3 |
This material is for your information, and none of BMO Capital Markets Corp., Citigroup Global Markets Inc., SG Americas Securities, LLC, Deutsche Bank Securities Inc., Goldman Sachs & Co. LLC, UBS Securities LLC, Academy Securities, Inc., Bancroft Capital, LLC and Drexel Hamilton, LLC (collectively, the “Underwriters”) are soliciting any action based upon it. This material is not to be construed as an offer to sell or the solicitation of any offer to buy any security in any jurisdiction where such an offer or solicitation would be illegal.
The depositor has filed a registration statement (including the prospectus) with the Securities and Exchange Commission (File No. 333-255934) for the offering to which this communication relates. Before you invest, you should read the prospectus in the registration statement and other documents the depositor has filed with the Securities and Exchange Commission for more complete information about the depositor, the issuing entity and this offering. You may get these documents for free by visiting EDGAR on the SEC website at www.sec.gov. Alternatively, the depositor or BMO Capital Markets Corp., any other underwriter, or any dealer participating in this offering will arrange to send you the prospectus if you request it by calling 1-866-864-7760. The Offered Certificates referred to in these materials, and the asset pool backing them, are subject to modification or revision (including the possibility that one or more Classes of Certificates may be split, combined or eliminated at any time prior to issuance or availability of a final prospectus) and are offered on a “when, as and if issued” basis. You understand that, when you are considering the purchase of these Certificates, a contract of sale will come into being no sooner than the date on which the relevant Class has been priced and we have verified the allocation of Certificates to be made to you; any “indications of interest” expressed by you, and any “soft circles” generated by us, will not create binding contractual obligations for you or us.
Neither this document nor anything contained in this document shall form the basis for any contract or commitment whatsoever. The information contained in this document is preliminary as of the date of this document, supersedes any previous such information delivered to you and will be superseded by any such information subsequently delivered prior to the time of sale. These materials are subject to change, completion or amendment from time to time. The information should be reviewed only in conjunction with the entire offering document relating to the Commercial Mortgage Pass-Through Certificates, Series 2024-5C3 (the “Offering Document”). All of the information contained herein is subject to the same limitations and qualifications contained in the Offering Document. The information contained herein does not contain all relevant information relating to the underlying mortgage loans or mortgaged properties. Such information is described elsewhere in the Offering Document. The information contained herein will be more fully described elsewhere in the Offering Document. The information contained herein should not be viewed as projections, forecasts, predictions or opinions with respect to value. Prior to making any investment decision, prospective investors are strongly urged to read the Offering Document its entirety. Neither the Securities and Exchange Commission nor any state securities commission has approved or disapproved of these securities or determined if this free writing prospectus is truthful or complete. Any representation to the contrary is a criminal offense.
This document has been prepared by the Underwriters for information purposes only and does not constitute, in whole or in part, a prospectus for the purposes of Regulation (EU) 2017/1129 (as amended or superseded) and/or Part VI of the Financial Services and Markets Act 2000 (as amended) or other offering document.
The attached information contains certain tables and other statistical analyses (the “Computational Materials”) which have been prepared in reliance upon information furnished by the Mortgage Loan Sellers. Numerous assumptions were used in preparing the Computational Materials, which may or may not be reflected herein. As such, no assurance can be given as to the Computational Materials’ accuracy, appropriateness or completeness in any particular context; or as to whether the Computational Materials and/or the assumptions upon which they are based reflect present market conditions or future market performance. The Computational Materials should not be construed as either projections or predictions or as legal, tax, financial or accounting advice. You should consult your own counsel, accountant and other advisors as to the legal, tax, business, financial and related aspects of a purchase of these Certificates. Any weighted average lives, yields and principal payment periods shown in the Computational Materials are based on prepayment and/or loss assumptions, and changes in such prepayment and/or loss assumptions may dramatically affect such weighted average lives, yields and principal payment periods. In addition, it is possible that prepayments or losses on the underlying assets will occur at rates higher or lower than the rates shown in the attached Computational Materials. The specific characteristics of the Certificates may differ from those shown in the Computational Materials due to differences between the final underlying assets and the preliminary underlying assets used in preparing the Computational Materials. The principal amount and designation of any security described in the Computational Materials are subject to change prior to issuance. None of the Underwriters or any of their respective affiliates make any representation or warranty as to the actual rate or timing of payments or losses on any of the underlying assets or the payments or yield on the Certificates. The information in this presentation is based upon management forecasts and reflects prevailing conditions and management’s views as of this date, all of which are subject to change. In preparing this presentation, we have relied upon and assumed, without independent verification, the accuracy and completeness of all information available from public sources or which was provided to us by or on behalf of the Mortgage Loan Sellers or which was otherwise reviewed by us.
This document contains forward-looking statements. If and when included in this document, the words “expects”, “intends”, “anticipates”, “estimates” and analogous expressions and all statements that are not historical facts, including statements about our beliefs or expectations, are intended to identify forward-looking statements. Any forward-looking statements are made subject to risks and uncertainties which could cause actual results to differ materially from those stated. Those risks and uncertainties include, among other things, declines in general economic and business conditions, increased competition, changes in demographics, changes in political and social conditions, regulatory initiatives and changes in consumer preferences, many of which are beyond our control and the control of any other person or entity related to this offering. The forward-looking statements made in this document are made as of the date hereof. We have no obligation to update or revise any forward-looking statement.
BMO Capital Markets is a trade name used by BMO Financial Group for the wholesale banking businesses of Bank of Montreal, BMO Harris Bank N.A. (member FDIC), Bank of Montreal Europe p.l.c, and Bank of Montreal (China) Co. Ltd, the institutional broker dealer business of BMO Capital Markets Corp. (Member FINRA and SIPC) and the agency broker dealer business of Clearpool Execution Services, LLC (Member FINRA and SIPC) in the U.S., and the institutional broker dealer businesses of BMO Nesbitt Burns Inc. (Member Investment Industry Regulatory Organization of Canada and Member Canadian Investor Protection Fund) in Canada and Asia, Bank of Montreal Europe p.l.c. (authorized and regulated by the Central Bank of Ireland) in Europe and BMO Capital Markets Limited (authorized and regulated by the Financial Conduct Authority) in the UK and Australia.
Securities and investment banking activities in the United States are performed by Deutsche Bank Securities Inc., a member of NYSE, FINRA and SIPC, and its broker-dealer affiliates. Lending and other commercial banking activities in the United States are performed by Deutsche Bank AG and its banking affiliates.
THE INFORMATION IN THIS STRUCTURAL AND COLLATERAL TERM SHEET IS NOT COMPLETE AND MAY BE AMENDED PRIOR TO THE TIME OF SALE. THIS TERM SHEET IS NOT AN OFFER TO SELL THESE SECURITIES AND IT IS NOT A SOLICITATION OF AN OFFER TO BUY THESE SECURITIES IN ANY JURISDICTION WHERE THE OFFER OR SALE IS NOT PERMITTED. |
| | 2 | |
| Dated January 22, 2024 | BMO 2024-5C3 |
IMPORTANT NOTICE RELATING TO AUTOMATICALLY-GENERATED EMAIL DISCLAIMERS
Any legends, disclaimers or other notices that may appear at the bottom of any email communication to which this document is attached relating to (1) these materials not constituting an offer (or a solicitation of an offer), (2) no representation that these materials are accurate or complete and may not be updated or (3) these materials possibly being confidential, are not applicable to these materials and should be disregarded. Such legends, disclaimers or other notices have been automatically generated as a result of these materials having been sent via Bloomberg or another system.
THE CERTIFICATES REFERRED TO IN THESE MATERIALS ARE SUBJECT TO MODIFICATION OR REVISION (INCLUDING THE POSSIBILITY THAT ONE OR MORE CLASSES OF CERTIFICATES MAY BE SPLIT, COMBINED OR ELIMINATED AT ANY TIME PRIOR TO ISSUANCE OR AVAILABILITY OF A FINAL PROSPECTUS) AND ARE OFFERED ON A “WHEN, AS AND IF ISSUED” BASIS.
THE UNDERWRITERS MAY FROM TIME TO TIME PERFORM INVESTMENT BANKING SERVICES FOR, OR SOLICIT INVESTMENT BANKING BUSINESS FROM, ANY COMPANY NAMED IN THESE MATERIALS. THE UNDERWRITERS AND/OR THEIR AFFILIATES OR RESPECTIVE EMPLOYEES MAY FROM TIME TO TIME HAVE A LONG OR SHORT POSITION IN ANY CERTIFICATE OR CONTRACT DISCUSSED IN THESE MATERIALS.
THE INFORMATION IN THIS STRUCTURAL AND COLLATERAL TERM SHEET IS NOT COMPLETE AND MAY BE AMENDED PRIOR TO THE TIME OF SALE. THIS TERM SHEET IS NOT AN OFFER TO SELL THESE SECURITIES AND IT IS NOT A SOLICITATION OF AN OFFER TO BUY THESE SECURITIES IN ANY JURISDICTION WHERE THE OFFER OR SALE IS NOT PERMITTED. |
| | 3 | |
| Structural and Collateral Term Sheet | | BMO 2024-5C3 |
| Summary of Transaction Terms |
| Offered Certificates | | | | | |
Classes of Certificates | Expected Ratings (Fitch/KBRA/Moody’s)(1) | Approximate Initial Certificate Balance or Notional Amount(2) | Approximate Initial Credit Support(3) | Initial
Pass-
Through Rate(4) | Pass-Through
Rate Description | Expected Weighted Avg. Life (yrs.)(5) | Expected Principal Window(5) |
| Class A-1 | AAAsf/AAA(sf)/Aaa(sf) | $85,000 | | 30.000% | % | (6) | 3.28 | 12/25-10/28 |
| Class A-3 | AAAsf/AAA(sf)/Aaa(sf) | $617,588,000 | | 30.000% | % | (6) | 4.86 | 10/28-02/29 |
| Class X-A | AAAsf/AAA(sf)/Aaa(sf) | $617,673,000 | (7) | N/A | % | Variable IO(8) | N/A | N/A |
| Class X-B | A-sf/AAA(sf)/NR | $191,920,000 | (7) | N/A | % | Variable IO(8) | N/A | N/A |
| Class A-S | AAAsf/AAA(sf)/Aa2(sf) | $123,535,000 | | 16.000% | % | (6) | 5.00 | 02/29-02/29 |
| Class B | AA-sf/AA-(sf)/NR | $41,913,000 | | 11.250% | % | (6) | 5.00 | 02/29-02/29 |
| Class C | A-sf/A-(sf)/NR | $26,472,000 | | 8.250% | % | (6) | 5.00 | 02/29-02/29 |
| Non-Offered Certificates(9) | | | | | |
Classes of Certificates | Expected Ratings (Fitch/KBRA/Moody’s)(1) | Approximate Initial Certificate Balance or Notional Amount(2) | Approximate Initial Credit Support(3) | Initial Pass-
Through Rate(4) | Pass-Through Rate Description | Expected Weighted Avg. Life (yrs.)(5) | Expected Principal Window(5) |
| Class X-D | BBB-sf/BBB(sf)/NR | $19,854,000 | (7) | N/A | % | Variable IO(8) | N/A | N/A |
| Class D | BBBsf/BBB+(sf)/NR | $11,030,000 | | 7.000% | % | (6) | 5.00 | 02/29-02/29 |
| Class E | BBB-sf/BBB(sf)/NR | $8,824,000 | | 6.000% | % | (6) | 5.00 | 02/29-02/29 |
| Class F-RR(10) | BB-sf/BB-(sf)/NR | $17,648,000 | | 4.000% | % | (6) | 5.00 | 02/29-02/29 |
| Class G-RR(10) | B-sf/B-(sf)/NR | $8,823,000 | | 3.000% | % | (6) | 5.00 | 02/29-02/29 |
| Class J-RR(10) | NR/NR/NR | $26,472,719 | | 0.000% | % | (6) | 5.00 | 02/29-02/29 |
| Class R(11) | N/A | N/A | | N/A | N/A | N/A | N/A | N/A |
| | | | | | | |
| | | | | | | | |
_
| Non-Offered Vertical Risk Retention Interest(9)(12) | | | | | |
Non-Offered Eligible Vertical Interest | Expected Ratings (Fitch/KBRA/Moody’s)(1) | Approximate Initial Combined VRR Interest Balance(2) | Approximate Initial Credit Support(3) | Initial Effective Interest Rate (4) | Effective Interest Rate Description | Expected Weighted Avg. Life (yrs.)(5) | Expected Principal Window(5) |
| Combined VRR Interest(12) | NR/NR/NR | $19,849,281(13) | N/A(14) | %(15) | (15) | 4.90 | 12/25-02/29 |
| (1) | It is a condition of issuance that the offered certificates and certain classes of non-offered certificates receive the ratings set forth above. The anticipated ratings shown are those of Fitch Ratings, Inc. (“Fitch”), Kroll Bond Rating Agency, LLC (“KBRA”) and Moody’s Investors Service, Inc. (“Moody’s”), as indicated. Subject to the discussion under “Ratings” in the Preliminary Prospectus, the ratings on the certificates address the likelihood of the timely receipt by holders of all payments of interest to which they are entitled on each distribution date and, except in the case of the interest only certificates, the ultimate receipt by holders of all payments of principal to which they are entitled on or before the applicable rated final distribution date. Certain nationally recognized statistical rating organizations, as defined in Section 3(a)(62) of the Securities Exchange Act of 1934, as amended, that were not hired by the depositor may use information they receive pursuant to Rule 17g-5 under the Securities Exchange Act of 1934, as amended, or otherwise to rate the offered certificates. We cannot assure you as to what ratings a non-hired nationally recognized statistical rating organization would assign. See “Risk Factors—Other Risks Relating to the Certificates—Nationally Recognized Statistical Rating Organizations May Assign Different Ratings to the Certificates; Ratings of the Certificates Reflect Only the Views of the Applicable Rating Agencies as of the Dates Such Ratings Were Issued; Ratings May Affect ERISA Eligibility; Ratings May Be Downgraded” in the Preliminary Prospectus. Fitch, KBRA and Moody’s have informed us that the “sf” designation in the ratings represents an identifier of structured finance product ratings. For additional information about this identifier, prospective investors can go to the related rating agency’s website. The depositor and the underwriters have not verified, do not adopt and do not accept responsibility for any statements made by the rating agencies on those websites. Credit ratings referenced throughout this Term Sheet are forward-looking opinions about credit risk and express a rating agency’s opinion about the willingness and ability of an issuer of securities to meet its financial obligations in full and on time. Ratings are not indications of investment merit and are not buy, sell or hold recommendations, a measure of asset value or an indication of the suitability of an investment. |
| (2) | Approximate, subject to a variance of plus or minus 5% and further subject to any additional variances described in the footnotes below. In addition, the notional amounts of the Class X-A, Class X-B and Class X-D certificates (collectively, the “Class X certificates”) may vary depending upon the final pricing of the respective classes of non-vertically retained principal balance certificates (as defined in footnote (6) below) whose certificate balances comprise such notional amounts, and, if as a result of such pricing (a) the pass-through rate of any class of Class X certificates would be equal to zero at all times, such class of certificates will not be issued on the closing date of this securitization or (b) the pass-through rate of any class of principal balance certificates whose certificate balance comprises such notional amount is at all times equal to the weighted average of the net interest rates on the mortgage loans (in each case, adjusted, if necessary, to accrue on the basis of a 360-day year consisting of twelve 30-day months) as in effect from time to time, the certificate balance of such class of principal balance certificates may not be part of, and there would be a corresponding reduction in, such notional amount of the related class of Class X certificates. |
| (3) | "Approximate Initial Credit Support" means, with respect to any class of non-vertically retained principal balance certificates, the quotient, expressed as a percentage, of (i) the aggregate of the initial certificate balances of all classes of non-vertically retained principal balance certificates, if any, junior to the subject class of non-vertically retained principal balance certificates, divided by (ii) the aggregate of the initial certificate balances of all classes of non-vertically retained principal balance certificates. The approximate initial credit support percentages set forth for the Class A-1 and Class A-3 certificates are represented in the aggregate. The approximate initial credit support percentages shown in the table above with respect to the non-vertically retained principal balance certificates do not take into account the Combined VRR Interest (as defined in footnote (12) below). |
| (4) | Approximate per annum rate as of the closing date. |
| (5) | Determined assuming no prepayments prior to the maturity date or any anticipated repayment date, as applicable, for any mortgage loan and based on the modeling assumptions described under “Yield, Prepayment and Maturity Considerations” in the Preliminary Prospectus. |
| (6) | For any distribution date, the pass-through rate for each class of the Class A-1, Class A-3, Class A-S, Class B, Class C, Class D, Class E, Class F-RR, Class G-RR and Class J-RR certificates (collectively, the “non-vertically retained principal balance certificates”, and collectively with the Class X certificates and the Class R certificates, |
THE INFORMATION IN THIS STRUCTURAL AND COLLATERAL TERM SHEET IS NOT COMPLETE AND MAY BE AMENDED PRIOR TO THE TIME OF SALE. THIS TERM SHEET IS NOT AN OFFER TO SELL THESE SECURITIES AND IT IS NOT A SOLICITATION OF AN OFFER TO BUY THESE SECURITIES IN ANY JURISDICTION WHERE THE OFFER OR SALE IS NOT PERMITTED. |
| | 4 | |
| Structural and Collateral Term Sheet | | BMO 2024-5C3 |
| Summary of Transaction Terms |
the “non-vertically retained certificates”) will generally be equal to one of (i) a fixed per annum rate, (ii) the weighted average of the net interest rates on the mortgage loans (in each case, adjusted, if necessary, to accrue on the basis of a 360-day year consisting of twelve 30-day months) as in effect from time to time, (iii) a rate equal to the lesser of a specified per annum rate and the weighted average rate described in clause (ii), or (iv) the weighted average rate described in clause (ii) less a specified percentage, but no less than 0.000%. See “Description of the Certificates—Distributions—Pass-Through Rates” in the Preliminary Prospectus.
| (7) | The Class X certificates will not have certificate balances and will not be entitled to receive distributions of principal. Interest will accrue on each class of Class X certificates at the related pass-through rate based upon the related notional amount. The notional amount of each class of the Class X certificates will be equal to the certificate balance or the aggregate of the certificate balances, as applicable, from time to time of the class or classes of the non-vertically retained principal balance certificates identified in the same row as such class of Class X certificates in the chart below (as to such class of Class X certificates, the “corresponding principal balance certificates”): |
| Class of Class X Certificates | Class(es) of Corresponding
Principal Balance Certificates |
| Class X-A | Class A-1 and Class A-3 |
| Class X-B | Class A-S, Class B and Class C |
| Class X-D | Class D and Class E |
| (8) | For any Distribution Date, the pass-through rate for each class of Class X certificates will generally be a per annum rate equal to the excess, if any, of (i) the weighted average of the net interest rates on the mortgage loans (in each case, adjusted, if necessary, to accrue on the basis of a 360-day year consisting of twelve 30-day months) as in effect from time to time, over (ii) the pass-through rate (or, if applicable, the weighted average of the pass-through rates) of the class or classes of corresponding principal balance certificates as in effect from time to time, as described in the Preliminary Prospectus. |
| (9) | The classes of certificates and uncertificated interests set forth below “Non-Offered Certificates” and “Non-Offered Vertical Risk Retention Interest” in the table are not offered hereby. |
| (10) | In partial satisfaction of Bank of Montreal’s risk retention obligations as retaining sponsor for this securitization transaction, all of the Class F-RR, Class G-RR and Class J-RR certificates (collectively, the “HRR Certificates”), with an aggregate fair value expected to represent at least 2.8433% of the fair value, as of the closing date, of all of the “ABS interests” (i.e. all of the certificates (other than the Class R certificates) and the Uncertificated VRR Interest) issued by the issuing entity, will collectively constitute an “eligible horizontal residual interest” that is to be purchased and retained by Eightfold Real Estate Capital Fund VI, L.P., a Delaware limited partnership, or its affiliate in accordance with the credit risk retention rules applicable to this securitization transaction. “Retaining sponsor,” “ABS interests” and “eligible horizontal residual interest” have the meanings given to such terms in Regulation RR. See “Credit Risk Retention” in the Preliminary Prospectus. |
| (11) | The Class R certificates will not have a certificate balance, notional amount, pass-through rate, rating or rated final distribution date. The Class R certificates will represent the residual interests in each of two separate REMICs, as further described in the Preliminary Prospectus. The Class R certificates will not be entitled to distributions of principal or interest. |
| (12) | In satisfaction of Bank of Montreal’s remaining risk retention obligations as retaining sponsor for this securitization transaction, Bank of Montreal is expected to acquire (or cause one or more other parties to acquire) from the depositor, on the closing date for this transaction, portions of an “eligible vertical interest” in the form of a “single vertical security” with an initial principal balance of approximately $19,849,281 (the “Combined VRR Interest”), which is expected to represent approximately 2.2000% of the aggregate principal balance of all the “ABS interests” (i.e., the sum of the aggregate initial certificate balance of all of the certificates (other than the Class R certificates) and the initial principal balance of the Uncertificated VRR Interest) issued by the issuing entity on the closing date for this transaction, subject to any variance in the initial principal balance of the Combined VRR Interest following calculation of the actual fair value of the HRR Certificates, all of the other classes of certificates (other than the Class R certificates) and the Uncertificated VRR Interest, as described under “Credit Risk Retention” in the Preliminary Prospectus. The Combined VRR Interest will consist of the “Uncertificated VRR Interest” and the "Class VRR certificates” (each as defined under “Credit Risk Retention” in the Preliminary Prospectus). The Combined VRR Interest will be retained by certain retaining parties in accordance with the credit risk retention rules applicable to this securitization transaction. “Eligible vertical interest” and “single vertical security” will have the meanings given to such terms in Regulation RR. See “Credit Risk Retention” in the Preliminary Prospectus. The Combined VRR Interest is not offered hereby. |
| (13) | Constitutes the Combined VRR Interest Balance, which consists of the aggregate of the certificate balance of the Class VRR certificates and the principal balance of the Uncertificated VRR Interest. |
| (14) | Although the approximate initial credit support percentages shown in the table above with respect to the non-vertically retained principal balance certificates do not take into account the Combined VRR Interest, losses incurred on the mortgage loans will be allocated between the Combined VRR Interest, on the one hand, and the non-vertically retained principal balance certificates, on the other hand, pro rata in accordance with the principal balance of the Combined VRR Interest and the aggregate outstanding certificate balance of the non-vertically retained principal balance certificates. See “Credit Risk Retention” and “Description of the Certificates” in the Preliminary Prospectus. The Class VRR certificates and the non-vertically retained principal balance certificates are collectively referred to as the “principal balance certificates”, and the Class VRR certificates and the non-vertically retained certificates are collectively referred to as the “Certificates”. |
| (15) | Although it does not have a specified pass-through rate (other than for tax reporting purposes), the effective interest rate for the Combined VRR Interest will be the weighted average of the net mortgage interest rates on the mortgage loans (in each case, adjusted, if necessary, to accrue on the basis of a 360-day year consisting of twelve 30-day months) as in effect from time to time.
|
THE INFORMATION IN THIS STRUCTURAL AND COLLATERAL TERM SHEET IS NOT COMPLETE AND MAY BE AMENDED PRIOR TO THE TIME OF SALE. THIS TERM SHEET IS NOT AN OFFER TO SELL THESE SECURITIES AND IT IS NOT A SOLICITATION OF AN OFFER TO BUY THESE SECURITIES IN ANY JURISDICTION WHERE THE OFFER OR SALE IS NOT PERMITTED. |
| | 5 | |
| Structural and Collateral Term Sheet | | BMO 2024-5C3 |
| Summary of Transaction Terms |
| Publicly Offered Certificates: | $809,593,000 monthly pay, multi-class, commercial mortgage REMIC Pass-Through Certificates. |
| Co-Lead Managers and Joint Bookrunners: | BMO Capital Markets Corp., Citigroup Global Markets Inc., SG Americas Securities, LLC, Deutsche Bank Securities Inc., Goldman Sachs & Co. LLC and UBS Securities LLC |
| Co-Managers: | Academy Securities, Inc., Bancroft Capital, LLC and Drexel Hamilton, LLC |
| Mortgage Loan Sellers: | Bank of Montreal (“BMO”) (15.6%); Citi Real Estate Funding Inc. (“CREFI”) (29.3%); Societe Generale Financial Corporation (“SGFC”) (16.1%); Starwood Mortgage Capital LLC (“SMC”) (11.3%); German American Capital Corporation (“GACC”) (9.6%); Goldman Sachs Mortgage Company (“GSMC”) (5.6%); UBS AG (“UBS”) (4.7%); Greystone Commercial Mortgage Capital LLC (“GCMC”) (3.5%); Zions Bancorporation, N.A. (“ZBNA”) (2.4%); and LMF Commercial, LLC (“LMF”) (1.9%). |
| Master Servicer: | Wells Fargo Bank, National Association |
| Special Servicer: | Greystone Servicing Company LLC |
| Directing Holder/Controlling Class Representative: | Eightfold Real Estate Capital Fund VI, L.P. |
| Trustee: | Computershare Trust Company, National Association |
| Certificate Administrator: | Computershare Trust Company, National Association |
| Operating Advisor: | Park Bridge Lender Services LLC |
| Asset Representations Reviewer: | Park Bridge Lender Services LLC |
| Rating Agencies: | Fitch Ratings, Inc. (“Fitch”), Kroll Bond Rating Agency, LLC (“KBRA”) and Moody’s Investors Service, Inc. (“Moody’s”). |
| U.S. Credit Risk Retention: | For a discussion on the manner in which BMO, as retaining sponsor, intends to satisfy the U.S. credit risk retention requirements, see “Credit Risk Retention” in the Preliminary Prospectus. |
| EU Credit Risk Retention: | The transaction is not structured to satisfy the EU risk retention and due diligence requirements. |
| Closing Date: | On or about February 14, 2024. |
| Cut-off Date: | With respect to each mortgage loan, the related due date in February 2024, or in the case of any mortgage loan that has its first due date after February 2024, the date that would have been its due date in February 2024 under the terms of that mortgage loan if a monthly debt service payment were scheduled to be due in that month. |
| Distribution Date: | The 4th business day after the Determination Date in each month, commencing in March 2024. |
| Determination Date: | 11th day of each month, or if the 11th day is not a business day, the next succeeding business day, commencing in March 2024. |
| Assumed Final Distribution Date: | The Distribution Date in February 2029 which is the latest anticipated repayment date of the Certificates. |
| Rated Final Distribution Date: | The Distribution Date in February 2057. |
| Tax Treatment: | The Publicly Offered Certificates are expected to be treated as REMIC “regular interests” for U.S. federal income tax purposes. |
| Form of Offering: | The Class A-1, Class A-3, Class X-A, Class X-B, Class A-S, Class B and Class C Certificates (the “Publicly Offered Certificates”) will be offered publicly. The Class X-D, Class D, Class E, Class F-RR, Class G-RR, Class J-RR and Class R Certificates (the “Privately Offered Certificates”) will be offered domestically to Qualified Institutional Buyers and to Institutional Accredited Investors (other than the Class R Certificates) and to institutions that are not U.S. Persons pursuant to Regulation S (other than the Class R Certificates). |
| SMMEA Status: | The Certificates will not constitute “mortgage related securities” for purposes of SMMEA. |
| ERISA: | The Publicly Offered Certificates are expected to be ERISA eligible. |
| Optional Termination: | On any Distribution Date on which the aggregate principal balance of the pool of mortgage loans is less than 1% of the aggregate principal balance of the mortgage loans as of the cut-off date, certain entities specified in the Preliminary Prospectus will have the option to purchase all of the remaining mortgage loans (and all property acquired through exercise of remedies in respect of any mortgage loan) at the price specified in the Preliminary Prospectus. Refer to “Pooling and Servicing Agreement—Termination; Retirement of Certificates” in the Preliminary Prospectus. |
| Minimum Denominations: | The Publicly Offered Certificates (other than the Class X-A and Class X-B Certificates) will be issued in minimum denominations of $10,000 and integral multiples of $1 in excess of $10,000. The Class X-A and Class X-B will be issued in minimum denominations of $1,000,000 and in integral multiples of $1 in excess of $1,000,000. |
| Settlement Terms: | DTC, Euroclear and Clearstream Banking. |
| Analytics: | The transaction is expected to be modeled by Bloomberg, L.P., Trepp, LLC, Intex Solutions, Inc., BlackRock Financial Management, Inc., CMBS.com, Inc., Moody’s Analytics, Markit Group Limited, RealINSIGHT, Thompson Reuters Corporation, Intercontinental Exchange | ICE Data Services, KBRA Analytics, LLC and DealView Technologies Ltd. |
THE INFORMATION IN THIS STRUCTURAL AND COLLATERAL TERM SHEET IS NOT COMPLETE AND MAY BE AMENDED PRIOR TO THE TIME OF SALE. THIS TERM SHEET IS NOT AN OFFER TO SELL THESE SECURITIES AND IT IS NOT A SOLICITATION OF AN OFFER TO BUY THESE SECURITIES IN ANY JURISDICTION WHERE THE OFFER OR SALE IS NOT PERMITTED. |
| | 6 | |
| Structural and Collateral Term Sheet | | BMO 2024-5C3 |
| Summary of Transaction Terms |
| Risk Factors: | THE CERTIFICATES INVOLVE CERTAIN RISKS AND MAY NOT BE SUITABLE FOR ALL INVESTORS. REFER TO THE “SUMMARY OF RISK FACTORS” AND “RISK FACTORS” SECTIONS OF THE PRELIMINARY PROSPECTUS. |
THE INFORMATION IN THIS STRUCTURAL AND COLLATERAL TERM SHEET IS NOT COMPLETE AND MAY BE AMENDED PRIOR TO THE TIME OF SALE. THIS TERM SHEET IS NOT AN OFFER TO SELL THESE SECURITIES AND IT IS NOT A SOLICITATION OF AN OFFER TO BUY THESE SECURITIES IN ANY JURISDICTION WHERE THE OFFER OR SALE IS NOT PERMITTED. |
| | 7 | |
| Structural and Collateral Term Sheet | | BMO 2024-5C3 |
| Collateral Characteristics |
Mortgage Loan Seller | Number of Mortgage Loans | Number of Mortgaged Properties | Aggregate
Cut-off Date Balance | | Roll-up Aggregate Cut-off Date Balance | Roll-up Aggregate % of Cut-off Date Balance |
| CREFI | 7 | 20 | $260,500,000 | 28.9% | $264,250,000 | 29.3% |
| SGFC | 3 | 3 | $105,600,000 | 11.7% | $145,600,000 | 16.1% |
| BMO | 5 | 7 | $78,950,000 | 8.8% | $140,410,000 | 15.6% |
| SMC | 5 | 5 | $71,950,000 | 8.0% | $102,200,000 | 11.3% |
| GACC | 2 | 3 | $47,750,000 | 5.3% | $86,500,000 | 9.6% |
| GSMC | - | - | - | - | $50,250,000 | 5.6% |
| UBS AG | 3 | 5 | $42,080,000 | 4.7% | $42,080,000 | 4.7% |
| GCMC | 2 | 2 | $31,850,000 | 3.5% | $31,850,000 | 3.5% |
| ZBNA | 2 | 2 | $21,600,000 | 2.4% | $21,600,000 | 2.4% |
| LMF | 3 | 3 | $17,500,000 | 1.9% | $17,500,000 | 1.9% |
| GACC, BMO, GSMC | 1 | 1 | $73,960,000 | 8.2% | - | - |
| SMC, GSMC | 1 | 1 | $60,500,000 | 6.7% | - | - |
| SGFC, GACC | 1 | 1 | $50,000,000 | 5.5% | - | - |
| GSMC, GACC | 1 | 1 | $25,000,000 | 2.8% | - | - |
| BMO, CREFI, GACC | 1 | 1 | $15,000,000 | 1.7% | - | - |
| Total: | 37 | 55 | $902,240,000 | 100.0% | $902,240,000 | 100.0% |
| Loan Pool | |
| | Initial Pool Balance (“IPB”): | $902,240,000 |
| | Number of Mortgage Loans: | 37 |
| | Number of Mortgaged Properties: | 55 |
| | Average Cut-off Date Balance per Mortgage Loan: | $24,384,865 |
| | Weighted Average Current Mortgage Rate: | 6.88006% |
| | 10 Largest Mortgage Loans as % of IPB: | 54.1% |
| | Weighted Average Remaining Term to Maturity: | 59 months |
| | Weighted Average Seasoning: | 1 month |
| | | |
| Credit Statistics | |
| | Weighted Average UW NCF DSCR(1)(2): | 1.92x |
| | Weighted Average UW NOI Debt Yield(1): | 13.9% |
| | Weighted Average Cut-off Date Loan-to-Value Ratio (“LTV”)(1)(3): | 51.5% |
| | Weighted Average Maturity Date/ARD LTV(1)(3): | 51.4% |
| | | |
| Other Statistics | |
| | % of Mortgage Loans with Additional Debt: | 6.3% |
| | % of Mortgage Loans with Single Tenants(4): | 10.5% |
| % of Mortgage Loans secured by Multiple Properties: | 20.1% |
| | |
| Amortization | |
| | Weighted Average Original Amortization Term(5): | 360 months |
| | Weighted Average Remaining Amortization Term(5): | 360 months |
| | % of Mortgage Loans with Interest-Only: | 99.5% |
| % of Mortgage Loans with Partial Interest-Only followed by Amortizing Balloon: | 0.5% |
| | | |
| Lockboxes(6) | |
| | % of Mortgage Loans with Hard Lockboxes: | 60.9% |
| | % of Mortgage Loans with Springing Lockboxes: | 20.8% |
| | % of Mortgage Loans with Soft Lockboxes: | 13.3% |
| | % of Mortgage Loans with Soft (Residential); Hard (Commercial) Lockboxes: | 5.0% |
| | | |
| Reserves | |
| | % of Mortgage Loans Requiring Monthly Tax Reserves: | 77.4% |
| | % of Mortgage Loans Requiring Monthly Insurance Reserves: | 37.0% |
| | % of Mortgage Loans Requiring Monthly CapEx Reserves: | 65.2% |
| | % of Mortgage Loans Requiring Monthly TI/LC Reserves(7): | 22.2% |
(See footnotes on following page)
THE INFORMATION IN THIS STRUCTURAL AND COLLATERAL TERM SHEET IS NOT COMPLETE AND MAY BE AMENDED PRIOR TO THE TIME OF SALE. THIS TERM SHEET IS NOT AN OFFER TO SELL THESE SECURITIES AND IT IS NOT A SOLICITATION OF AN OFFER TO BUY THESE SECURITIES IN ANY JURISDICTION WHERE THE OFFER OR SALE IS NOT PERMITTED. |
| | 8 | |
| Structural and Collateral Term Sheet | | BMO 2024-5C3 |
| Collateral Characteristics |
| (1) | In the case of Loan Nos. 1, 2, 4, 5, 6, 10, 11, 12, 15, 18, 24 and 27, the UW NCF DSCR, UW NOI Debt Yield, Cut-off Date Loan-to-Value Ratio and Maturity Date/ARD Loan-to-Value Ratio calculations include the related Pari Passu Companion Loan(s). In the case of Loan Nos. 6 and 27, the UW NCF DSCR, UW NOI Debt Yield, Cut-off Date Loan-to-Value Ratio and Maturity Date/ARD Loan-to-Value Ratio calculations exclude the related mezzanine loans. |
| (2) | For the mortgage loans that are interest-only for the entire term and accrue interest on an Actual/360 basis, the Monthly Debt Service Amount ($) was calculated as 1/12th of the product of (i) the Original Balance ($), (ii) the Interest Rate % and (iii) 365/360. |
| (3) | In the case of Loan No. 11, the Cut-off Date LTV and Maturity/ARD LTV are calculated by using an appraised value based on an “hypothetical as is” assumption. In the case of Loan No. 32, the Cut-off Date LTV and Maturity/ARD LTV are calculated by using an appraised value based on a “as complete” assumption. Refer to the definition of “Appraised Value” under “Description of the Mortgage Pool—Certain Calculations and Definitions” in the Preliminary Prospectus for additional details. |
| (4) | Excludes mortgage loans that are secured by multiple properties with multiple tenants. |
| (5) | Excludes 36 mortgage loans that are interest-only for the entire term or until the anticipated repayment date. |
| (6) | For a more detailed description of lockboxes, refer to “Description of the Mortgage Pool—Certain Calculations and Definitions” and “—Certain Terms of the Mortgage Loans—Mortgaged Property Accounts” in the Preliminary Prospectus. |
| (7) | Calculated only with respect to the Cut-off Date Balance of mortgage loans secured or partially secured by office, industrial, retail, multifamily (with commercial tenants) and mixed use properties. |
THE INFORMATION IN THIS STRUCTURAL AND COLLATERAL TERM SHEET IS NOT COMPLETE AND MAY BE AMENDED PRIOR TO THE TIME OF SALE. THIS TERM SHEET IS NOT AN OFFER TO SELL THESE SECURITIES AND IT IS NOT A SOLICITATION OF AN OFFER TO BUY THESE SECURITIES IN ANY JURISDICTION WHERE THE OFFER OR SALE IS NOT PERMITTED. |
| | 9 | |
| Structural and Collateral Term Sheet | | BMO 2024-5C3 |
| Collateral Characteristics |
| Ten Largest Mortgage Loans |
| No. | Loan Name | City, State | Mortgage Loan Seller | No.
of Prop. | Cut-off Date Balance | % of IPB | Square Feet / Rooms / Units | Property Type | UW
NCF DSCR(1)(2) | UW NOI Debt Yield(1) | Cut-off Date LTV(1)(3) | Maturity Date/ARD LTV(1)(3) |
| 1 | Tysons Corner Center | McLean, VA | GACC, BMO, GSMC | 1 | $73,960,000 | 8.2% | 1,793,638 | Retail | 2.00x | 13.7% | 39.4% | 39.4% |
| 2 | Elmwood Shopping Center | Elmwood, LA | CREFI | 1 | $70,000,000 | 7.8% | 804,807 | Retail | 2.46x | 16.7% | 40.8% | 40.8% |
| 3 | Margaritaville Lake of the Ozarks | Osage Beach, MO | SMC, GSMC | 1 | $60,500,000 | 6.7% | 520 | Hospitality | 1.94x | 17.1% | 56.0% | 56.0% |
| 4 | Galleria at Tyler | Riverside, CA | SGFC, GACC | 1 | $50,000,000 | 5.5% | 565,913 | Retail | 1.96x | 16.7% | 50.0% | 50.0% |
| 5 | 33 West State Street and 50 East State Street | Trenton, NJ | CREFI | 2 | $50,000,000 | 5.5% | 473,622 | Office | 1.50x | 11.3% | 65.1% | 65.1% |
| 6 | Piazza Alta | Philadelphia, PA | SGFC | 1 | $45,000,000 | 5.0% | 695 | Multifamily | 2.46x | 11.8% | 39.5% | 39.5% |
| 7 | ExchangeRight Net Leased Portfolio #66 | Various, Various | CREFI | 11 | $43,250,000 | 4.8% | 507,017 | Various | 2.07x | 13.1% | 45.4% | 45.4% |
| 8 | 61 S Paramus Road | Paramus, NJ | SGFC | 1 | $33,600,000 | 3.7% | 279,699 | Office | 1.95x | 15.2% | 59.3% | 59.3% |
| 9 | 111 West 19th Street | New York, NY | CREFI | 1 | $33,000,000 | 3.7% | 189,731 | Office | 3.03x | 22.6% | 27.3% | 27.3% |
| 10 | 333 South Spruce Street | Manteno, IL | CREFI | 1 | $28,750,000 | 3.2% | 1,546,575 | Industrial | 1.65x | 11.3% | 56.0% | 56.0% |
| | | | | | | | | | | | | |
| | Top 3 Total/Weighted Average | 3 | $204,460,000 | 22.7% | | | 2.14x | 15.7% | 44.8% | 44.8% |
| | Top 5 Total/Weighted Average | 6 | $304,460,000 | 33.7% | | | 2.01x | 15.2% | 49.0% | 49.0% |
| | Top 10 Total/Weighted Average | 21 | $488,060,000 | 54.1% | | | 2.10x | 14.9% | 47.4% | 47.4% |
| | Non-Top 10 Total/Weighted Average(2) | 34 | $414,180,000 | 45.9% | | | 1.71x | 12.7% | 56.2% | 56.2% |
| (1) | In the case of Loan Nos. 1, 2, 4, 5, 6, 10, 11, 12, 15, 18, 24 and 27, the UW NCF DSCR, UW NOI Debt Yield, Cut-off Date LTV and Maturity Date/ARD LTV calculations include the related Pari Passu Companion Loan(s). In the case of Loan Nos. 6 and 27, the UW NCF DSCR, UW NOI Debt Yield, Cut-off Date LTV and Maturity Date/ARD LTV calculations exclude the related mezzanine loans. |
| (2) | For the mortgage loans that are interest-only for the entire term and accrue interest on an Actual/360 basis, the Monthly Debt Service Amount ($) was calculated as 1/12th of the product of (i) the Original Balance ($), (ii) the Interest Rate % and (iii) 365/360. |
| (3) | In the case of Loan No. 11, the Cut-off Date LTV and Maturity/ARD LTV are calculated by using an appraised value based on an “hypothetical as is” assumption. In the case of Loan No. 32, the Cut-off Date LTV and Maturity/ARD LTV are calculated by using an appraised value based on a “as complete” assumption. Refer to the definition of “Appraised Value” under “Description of the Mortgage Pool—Certain Calculations and Definitions” in the Preliminary Prospectus for additional details. |
THE INFORMATION IN THIS STRUCTURAL AND COLLATERAL TERM SHEET IS NOT COMPLETE AND MAY BE AMENDED PRIOR TO THE TIME OF SALE. THIS TERM SHEET IS NOT AN OFFER TO SELL THESE SECURITIES AND IT IS NOT A SOLICITATION OF AN OFFER TO BUY THESE SECURITIES IN ANY JURISDICTION WHERE THE OFFER OR SALE IS NOT PERMITTED. |
| | 10 | |
| Structural and Collateral Term Sheet | | BMO 2024-5C3 |
| Collateral Characteristics |
| Pari Passu Companion Loan Summary |
No. | Loan Name | | Trust Cut-off Date Balance | Aggregate Pari Passu Loan Cut-off Date Balance(1) | Controlling Pooling/Trust & Servicing Agreement | Master Servicer | Special Servicer | Related Pari Passu Loan(s) Securitizations | Related Pari Passu Loan(s) Original Balance(1) |
| 1 | Tysons Corner Center | GACC, BMO, GSMC | $73,960,000 | $636,040,000 | TYSN 2023-CRNR | Berkadia | Situs | TYSN 2023-CRNR
Benchmark 2024-V5(2)
Future Securitization(s) | $440,200,000
$73,960,000
$121,880,000 |
| 2 | Elmwood Shopping Center | CREFI | $70,000,000 | $15,000,000 | BMO 2024-5C3 | Wells Fargo | Greystone | Future Securitization(s) | $15,000,000 |
| 4 | Galleria at Tyler | SGFC, GACC | $50,000,000 | $100,000,000 | Benchmark 2024-V5(2)(3) | Midland(3) | Rialto(3) | Benchmark 2024-V5(2)
Future Securitization(s) | $35,000,000
$65,000,000 |
| 5 | 33 West State Street and 50 East State Street | CREFI | $50,000,000 | $40,000,000 | BMO 2024-5C3 | Wells Fargo | Greystone | Future Securitization(s) | $40,000,000 |
| 6 | Piazza Alta | SGFC | $45,000,000 | $140,900,000 | BMO 2023-5C2 | KeyBank | Greystone | BMO 2023-5C2
BBCMS 2023-5C23 | $75,000,000
$65,900,000 |
| 10 | 333 South Spruce Street | CREFI | $28,750,000 | $50,000,000 | Benchmark 2024-V5(2) | Midland | Rialto | Benchmark 2024-V5(2) | $50,000,000 |
| 11 | Crescent Center | GCMC | $28,750,000 | $23,250,000 | BMO 2024-5C3 | Wells Fargo | Greystone | Future Securitization(s) | $23,250,000 |
| 12 | Staten Island Mall | GACC | $28,500,000 | $171,500,000 | BMO 2024-5C3(4) | Wells Fargo(4) | Greystone(4) | Future Securitization(s) | $171,500,000 |
| 15 | Garden State Plaza | GSMC, GACC | $25,000,000 | $500,000,000 | NJ Trust 2023-GSP | Berkadia | Argentic | NJ Trust 2023-GSP
Benchmark 2024-V5(2)
Future Securitization(s) | $425,000,000
$45,000,000
$30,000,000 |
| 18 | OPI Portfolio | UBS AG | $23,000,000 | $31,300,000 | BMO 2024-5C3 | Wells Fargo | Greystone | BMO 2023-C7 Future Securitization(s) | $25,000,000 $6,300,000 |
| 24 | DoubleTree by Hilton Hotel Orlando at SeaWorld | BMO, CREFI, GACC | $15,000,000 | $70,000,000 | Benchmark 2024-V5(2) | Midland | Rialto | Benchmark 2024-V5(2) Future Securitization(s) | $60,000,000 $10,000,000 |
| 27 | Bala Plaza Portfolio | CREFI | $11,500,000 | $88,000,000 | Benchmark 2023-B40 | Midland | LNR Partners | BMO 2023-C7 Benchmark 2023-B40 | $40,000,000 $48,000,000 |
| (1) | In the case of Loan Nos. 6 and 27, the Aggregate Pari Passu Loan Cut-off Date Balance and Related Pari Passu Loan(s) Original Balance exclude the related mezzanine loan(s). |
| (2) | Based on a publicly available preliminary prospectus. The Benchmark 2024-V5 transaction is expected to close prior to the closing of this securitization transaction. |
| (3) | In the case of Loan No. 4, until the securitization of the related controlling pari passu companion loan, the related whole loan will be serviced and administered pursuant to the pooling and servicing agreement for the Benchmark 2024-V5 securitization transaction by the parties thereto. Upon the securitization of the related controlling pari-passu companion loan, servicing of the related whole loan will shift to the servicers under the servicing agreement with respect to such future securitization transaction, which servicing agreement will become the Controlling Pooling/Trust & Servicing Agreement. |
| (4) | In the case of Loan No. 12, until the securitization of the related controlling pari passu companion loan, the related whole loan will be serviced and administered pursuant to the pooling and servicing agreement for the BMO 2024-5C3 securitization transaction by the parties thereto. Upon the securitization of the related controlling pari-passu companion loan, servicing of the related whole loan will shift to the servicers under the servicing agreement with respect to such future securitization transaction, which servicing agreement will become the Controlling Pooling/Trust & Servicing Agreement (referred to in this Term Sheet as the “Controlling PSA”). |
THE INFORMATION IN THIS STRUCTURAL AND COLLATERAL TERM SHEET IS NOT COMPLETE AND MAY BE AMENDED PRIOR TO THE TIME OF SALE. THIS TERM SHEET IS NOT AN OFFER TO SELL THESE SECURITIES AND IT IS NOT A SOLICITATION OF AN OFFER TO BUY THESE SECURITIES IN ANY JURISDICTION WHERE THE OFFER OR SALE IS NOT PERMITTED. |
| | 11 | |
| Structural and Collateral Term Sheet | | BMO 2024-5C3 |
| Collateral Characteristics |
No. | Loan Name | Trust
Cut-off Date Balance | Pari Passu Loan(s) Cut-off Date Balance | Mezzanine Debt Cut-off Date Balance(1) | Total Debt Cut-off Date Balance | Mortgage Loan UW NCF DSCR(2) | Total Debt UW NCF DSCR | Mortgage Loan
Cut-off Date LTV(2) | Total Debt Cut-off Date LTV | Mortgage Loan UW NOI Debt Yield(2) | Total Debt UW NOI Debt Yield |
| 6 | Piazza Alta | $45,000,000 | $140,900,000 | $126,100,000 | $312,000,000 | 2.46x | 1.10x | 39.5% | 66.3% | 11.8% | 7.0% |
| 27 | Bala Plaza Portfolio | $11,500,000 | $88,000,000 | $30,000,000 | $129,500,000 | 1.68x | 1.43x | 47.4% | 61.6% | 16.2% | 12.5% |
| (1) | In the case of Loan Nos. 6 and 27, subordinate debt represents one subordinate mezzanine loan. |
| (2) | Mortgage Loan UW NCF DSCR, Mortgage Loan Cut-off Date LTV and Mortgage Loan UW NOI Debt Yield calculations include any related Pari Passu Companion Loans (if applicable), but exclude the related one or more mezzanine loans. |
THE INFORMATION IN THIS STRUCTURAL AND COLLATERAL TERM SHEET IS NOT COMPLETE AND MAY BE AMENDED PRIOR TO THE TIME OF SALE. THIS TERM SHEET IS NOT AN OFFER TO SELL THESE SECURITIES AND IT IS NOT A SOLICITATION OF AN OFFER TO BUY THESE SECURITIES IN ANY JURISDICTION WHERE THE OFFER OR SALE IS NOT PERMITTED. |
| | 12 | |
| Structural and Collateral Term Sheet | | BMO 2024-5C3 |
| Collateral Characteristics |
| Mortgaged Properties by Type(1) |
| | | | | | Weighted Average |
| Property Type | Property Subtype | Number of Properties | Cut-off Date Principal Balance | % of IPB | UW
NCF DSCR(2)(3) | UW
NOI DY(2) | Cut-off Date LTV(2)(4) | Maturity Date/ARD LTV(2)(4) |
| Retail | Super Regional Mall | 4 | $177,460,000 | 19.7% | 2.14x | 15.9% | 41.5% | 41.5% |
| | Anchored | 3 | 121,000,000 | 13.4 | 2.11x | 14.9% | 50.7% | 50.7% |
| | Single Tenant | 10 | 19,260,000 | 2.1 | 2.07x | 13.1% | 45.4% | 45.4% |
| | Shadow Anchored | 2 | 11,550,000 | 1.3 | 1.58x | 12.4% | 60.8% | 60.8% |
| | Subtotal: | 19 | $329,270,000 | 36.5% | 2.11x | 15.3% | 45.8% | 45.8% |
| Multifamily | Garden | 6 | $71,300,000 | 7.9% | 1.46x | 10.2% | 59.6% | 59.5% |
| | Mid Rise | 6 | 56,000,000 | 6.2 | 1.36x | 9.6% | 65.0% | 65.0% |
| | Luxury High Rise | 1 | 45,000,000 | 5.0 | 2.46x | 11.8% | 39.5% | 39.5% |
| | Student Housing | 2 | 19,250,000 | 2.1 | 2.04x | 11.3% | 51.9% | 51.9% |
| | Low Rise | 1 | 2,600,000 | 0.3 | 1.30x | 8.5% | 67.2% | 67.2% |
| | Subtotal: | 16 | $194,150,000 | 21.5% | 1.72x | 10.5% | 55.8% | 55.8% |
| Office | CBD | 4 | $89,573,002 | 9.9% | 2.08x | 15.6% | 49.9% | 49.9% |
| | Suburban | 5 | 88,055,968 | 9.8 | 1.76x | 14.3% | 57.6% | 57.6% |
| | Subtotal: | 9 | $177,628,970 | 19.7% | 1.92x | 15.0% | 53.7% | 53.7% |
| Hospitality | Full Service | 2 | $75,500,000 | 8.4% | 1.92x | 17.1% | 56.7% | 56.7% |
| | Select Service | 1 | 6,300,000 | 0.7 | 1.64x | 15.7% | 52.5% | 52.5% |
| | Subtotal: | 3 | $81,800,000 | 9.1% | 1.90x | 17.0% | 56.4% | 56.4% |
| Industrial | Warehouse/Distribution | 3 | $65,890,000 | 7.3% | 1.77x | 11.9% | 52.5% | 52.5% |
| | Subtotal: | 3 | $65,890,000 | 7.3% | 1.77x | 11.9% | 52.5% | 52.5% |
| Mixed Use | Office/Retail | 2 | $25,671,030 | 2.8% | 2.14x | 15.1% | 47.3% | 47.3% |
| | Multifamily/Retail | 2 | 24,200,000 | 2.7 | 1.29x | 9.1% | 60.6% | 60.6% |
| | Subtotal: | 4 | $49,871,030 | 5.5% | 1.72x | 12.2% | 53.8% | 53.8% |
| Self Storage | Self Storage | 1 | $3,630,000 | 0.4% | 1.47x | 10.9% | 60.4% | 60.4% |
| Total / Weighted Average: | 55 | $902,240,000 | 100.0% | 1.92x | 13.9% | 51.5% | 51.4% |
| (1) | Because this table presents information relating to the mortgaged properties and not mortgage loans, the information for mortgage loans secured by more than one mortgaged property is based on allocated loan amounts, individual appraised values, net cash flow or net operating income with respect to such individual mortgaged properties, as applicable. |
| (2) | In the case of Loan Nos. 1, 2, 4, 5, 6, 10, 11, 12, 15, 18, 24 and 27, the UW NCF DSCR, UW NOI DY, Cut-off Date LTV and Maturity Date/ARD LTV calculations include the related Pari Passu Companion Loan(s). In the case of Loan Nos. 6 and 27, the UW NCF DSCR, UW NOI DY, Cut-off Date LTV and Maturity Date/ARD LTV calculations exclude the related mezzanine loans. |
| (3) | For the mortgage loans that are interest-only for the entire term or until the anticipated repayment date and accrue interest on an Actual/360 basis, the Monthly Debt Service Amount ($) was calculated as 1/12th of the product of (i) the Original Balance ($), (ii) the Interest Rate % and (iii) 365/360. |
| (4) | In the case of Loan No. 11, the Cut-off Date LTV and Maturity/ARD LTV are calculated by using an appraised value based on an “hypothetical as is” assumption. In the case of Loan No. 32, the Cut-off Date LTV and Maturity/ARD LTV are calculated by using an appraised value based on a “as complete” assumption. Refer to the definition of “Appraised Value” under “Description of the Mortgage Pool—Certain Calculations and Definitions” in the Preliminary Prospectus for additional details. |
THE INFORMATION IN THIS STRUCTURAL AND COLLATERAL TERM SHEET IS NOT COMPLETE AND MAY BE AMENDED PRIOR TO THE TIME OF SALE. THIS TERM SHEET IS NOT AN OFFER TO SELL THESE SECURITIES AND IT IS NOT A SOLICITATION OF AN OFFER TO BUY THESE SECURITIES IN ANY JURISDICTION WHERE THE OFFER OR SALE IS NOT PERMITTED. |
| | 13 | |
| Structural and Collateral Term Sheet | | BMO 2024-5C3 |
| Collateral Characteristics |
| Mortgaged Properties by Location(1) |
| | | | | Weighted Average |
State (or Province) | Number of Properties | Cut-off Date
Principal Balance | % of IPB | UW
NCF DSCR(2)(3) | UW
NOI Debt Yield(2) | Cut-off Date LTV(2)(4) | Maturity Date/ARD LTV(2)(4) |
| New York | 10 | $142,950,000 | 15.8% | 1.86x | 13.8% | 49.6% | 49.6% |
| New Jersey | 4 | 108,600,000 | 12.0 | 1.98x | 14.6% | 55.0% | 55.0% |
| Pennsylvania | 6 | 93,140,000 | 10.3 | 2.12x | 12.5% | 45.2% | 45.2% |
| Virginia | 1 | 73,960,000 | 8.2 | 2.00x | 13.7% | 39.4% | 39.4% |
| Louisiana | 2 | 73,630,000 | 8.2 | 2.41x | 16.4% | 41.8% | 41.8% |
| Missouri | 2 | 68,200,000 | 7.6 | 1.95x | 16.6% | 54.8% | 54.8% |
| California | 1 | 50,000,000 | 5.5 | 1.96x | 16.7% | 50.0% | 50.0% |
| Florida | 2 | 38,450,000 | 4.3 | 2.05x | 15.8% | 52.0% | 52.0% |
| Illinois | 3 | 36,050,000 | 4.0 | 1.63x | 11.5% | 56.6% | 56.4% |
| Tennessee | 1 | 28,750,000 | 3.2 | 1.56x | 13.0% | 64.1% | 64.1% |
| Texas | 6 | 27,633,002 | 3.1 | 1.97x | 12.0% | 50.6% | 50.6% |
| Mississippi | 1 | 27,100,000 | 3.0 | 1.54x | 9.2% | 64.2% | 64.2% |
| Kansas | 1 | 27,000,000 | 3.0 | 1.92x | 14.1% | 64.4% | 64.4% |
| Michigan | 3 | 25,100,000 | 2.8 | 1.35x | 10.7% | 63.6% | 63.6% |
| Georgia | 1 | 16,426,998 | 1.8 | 1.75x | 13.8% | 48.4% | 48.4% |
| Maryland | 2 | 15,400,000 | 1.7 | 1.47x | 12.3% | 62.9% | 62.9% |
| Delaware | 1 | 13,150,000 | 1.5 | 1.49x | 10.8% | 57.7% | 57.7% |
| Nevada | 1 | 13,000,000 | 1.4 | 1.61x | 11.9% | 53.3% | 53.3% |
| North Carolina | 1 | 8,450,000 | 0.9 | 1.45x | 12.1% | 65.0% | 65.0% |
| Massachusetts | 1 | 5,030,000 | 0.6 | 2.07x | 13.1% | 45.4% | 45.4% |
| New Hampshire | 1 | 4,500,000 | 0.5 | 1.41x | 10.8% | 62.9% | 62.9% |
| Idaho | 1 | 2,480,000 | 0.3 | 2.07x | 13.1% | 45.4% | 45.4% |
| Connecticut | 1 | 2,100,000 | 0.2 | 1.41x | 10.8% | 62.9% | 62.9% |
| Ohio | 1 | 580,000 | 0.1 | 2.07x | 13.1% | 45.4% | 45.4% |
| Indiana | 1 | 560,000 | 0.1 | 2.07x | 13.1% | 45.4% | 45.4% |
| Total / Weighted Average: | 55 | $902,240,000 | 100.0% | 1.92x | 13.9% | 51.5% | 51.4% |
| (1) | Because this table presents information relating to the mortgaged properties and not mortgage loans, the information for mortgage loans secured by more than one mortgaged property is based on allocated loan amounts, individual appraised values, net cash flow or net operating income with respect to such individual mortgaged properties, as applicable. |
| (2) | In the case of Loan Nos. 1, 2, 4, 5, 6, 10, 11, 12, 15, 18, 24 and 27, the UW NCF DSCR, UW NOI Debt Yield, Cut-off Date LTV and Maturity Date/ARD LTV calculations include the related Pari Passu Companion Loan(s). In the case of Loan Nos. 6 and 27, the UW NCF DSCR, UW NOI Debt Yield, Cut-off Date LTV and Maturity Date/ARD LTV calculations exclude the related mezzanine loans. |
| (3) | For the mortgage loans that are interest-only for the entire term or until the anticipated repayment date and accrue interest on an Actual/360 basis, the Monthly Debt Service Amount ($) was calculated as 1/12th of the product of (i) the Original Balance ($), (ii) the Interest Rate % and (iii) 365/360. |
| (4) | In the case of Loan No. 11, the Cut-off Date LTV and Maturity/ARD LTV are calculated by using an appraised value based on an “hypothetical as is” assumption. In the case of Loan No. 32, the Cut-off Date LTV and Maturity/ARD LTV are calculated by using an appraised value based on a “as complete” assumption. Refer to the definition of “Appraised Value” under “Description of the Mortgage Pool—Certain Calculations and Definitions” in the Preliminary Prospectus for additional details. |
THE INFORMATION IN THIS STRUCTURAL AND COLLATERAL TERM SHEET IS NOT COMPLETE AND MAY BE AMENDED PRIOR TO THE TIME OF SALE. THIS TERM SHEET IS NOT AN OFFER TO SELL THESE SECURITIES AND IT IS NOT A SOLICITATION OF AN OFFER TO BUY THESE SECURITIES IN ANY JURISDICTION WHERE THE OFFER OR SALE IS NOT PERMITTED. |
| | 14 | |
| Structural and Collateral Term Sheet | | BMO 2024-5C3 |
| Collateral Characteristics |
| Cut-off Date Principal Balance |
| | | | | Weighted Average |
| Range of Cut-off Date Principal Balances | Number of Loans | Cut-off Date Principal Balance | % of IPB | Mortgage Rate | Remaining Loan Term | UW
NCF DSCR(1)(2) | UW
NOI
DY(1) | Cut-off
Date LTV(1)(3) | Maturity Date/ARD LTV(1)(3) |
| $3,100,000 | - | $4,999,999 | 4 | | $15,130,000 | 1.7 | % | 7.32865% | 58 | 1.49x | 11.4% | 60.2% | 59.8% |
| $5,000,000 | - | $9,999,999 | 6 | | 45,250,000 | 5.0 | | 7.28581% | 59 | 1.42x | 10.9% | 63.2% | 63.2% |
| $10,000,000 | - | $19,999,999 | 7 | | 106,600,000 | 11.8 | | 6.95145% | 59 | 1.63x | 12.2% | 57.6% | 57.6% |
| $20,000,000 | - | $29,999,999 | 11 | | 275,950,000 | 30.6 | | 6.96026% | 58 | 1.79x | 13.1% | 54.2% | 54.2% |
| $30,000,000 | - | $39,999,999 | 2 | | 66,600,000 | 7.4 | | 7.01609% | 59 | 2.49x | 18.9% | 43.4% | 43.4% |
| $40,000,000 | - | $73,960,000 | 7 | | 392,710,000 | 43.5 | | 6.71721% | 59 | 2.06x | 14.6% | 47.5% | 47.5% |
| Total / Weighted Average: | 37 | | $902,240,000 | 100.0 | % | 6.88006% | 59 | 1.92x | 13.9% | 51.5% | 51.4% |
| | | | | Weighted Average |
Range of
Mortgage Interest Rates | Number of Loans | Cut-off Date Principal Balance | % of IPB | Mortgage Rate | Remaining Loan Term | UW
NCF DSCR(1)(2) | UW
NOI
DY(1) | Cut-off
Date LTV(1)(3) | Maturity Date/ARD LTV(1)(3) |
| 4.67614% | - | 5.99999% | 3 | $91,350,000 | 10.1 | % | 5.07901% | 58 | 2.10x | 10.9% | 49.4% | 49.4% |
| 6.00000% | - | 6.49999% | 3 | 61,800,000 | 6.8 | | 6.19902% | 60 | 1.87x | 12.0% | 51.1% | 51.1% |
| 6.50000% | - | 6.99999% | 11 | 328,710,000 | 36.4 | | 6.67919% | 59 | 2.15x | 15.0% | 44.8% | 44.8% |
| 7.00000% | - | 7.49999% | 10 | 220,680,000 | 24.5 | | 7.27694% | 59 | 1.66x | 13.3% | 59.9% | 59.9% |
| 7.50000% | - | 7.99999% | 6 | 169,250,000 | 18.8 | | 7.70547% | 58 | 1.78x | 14.8% | 53.8% | 53.8% |
| 8.00000% | - | 8.49999% | 3 | 18,950,000 | 2.1 | | 8.16298% | 59 | 1.47x | 13.2% | 61.0% | 60.7% |
| 8.50000% | - | 8.71000% | 1 | 11,500,000 | 1.3 | | 8.71000% | 57 | 1.68x | 16.2% | 47.4% | 47.4% |
| Total / Weighted Average: | 37 | $902,240,000 | 100.0 | % | 6.88006% | 59 | 1.92x | 13.9% | 51.5% | 51.4% |
| Original Term to Maturity in Months |
| | | | | Weighted Average |
Original Term to
Maturity in Months | Number of Loans | Cut-off Date Principal Balance | % of IPB | Mortgage Rate | Remaining Loan Term | UW
NCF DSCR(1)(2) | UW
NOI
DY(1) | Cut-off
Date LTV(1)(3) | Maturity Date/ARD LTV(1)(3) |
| 60 | 37 | $902,240,000 | 100.0% | | 6.88006% | 59 | 1.92x | 13.9% | 51.5% | 51.4% |
| Total / Weighted Average: | 37 | $902,240,000 | 100.0% | | 6.88006% | 59 | 1.92x | 13.9% | 51.5% | 51.4% |
| Remaining Term to Maturity in Months |
| | | | | Weighted Average |
| Range of Remaining Term to Maturity in Months | Number of Loans | Cut-off Date Principal Balance | % of IPB | Mortgage Rate | Remaining Loan Term | UW
NCF DSCR(1)(2) | UW
NOI
DY(1) | Cut-off
Date LTV(1)(3) | Maturity Date/ARD LTV(1)(3) |
| 56 | - | 60 | 37 | $902,240,000 | 100.0% | | 6.88006% | 59 | 1.92x | 13.9% | 51.5% | 51.4% |
| Total / Weighted Average: | 37 | $902,240,000 | 100.0% | | 6.88006% | 59 | 1.92x | 13.9% | 51.5% | 51.4% |
| (1) | In the case of Loan Nos. 1, 2, 4, 5, 6, 10, 11, 12, 15, 18, 24 and 27, the UW NCF DSCR, UW NOI DY, Cut-off Date LTV and Maturity Date/ARD LTV calculations include the related Pari Passu Companion Loan(s). In the case of Loan Nos. 6 and 27, the UW NCF DSCR, UW NOI DY, Cut-off Date LTV and Maturity Date/ARD LTV calculations exclude the related mezzanine loans. |
| (2) | For the mortgage loans that are interest-only for the entire term or until the anticipated repayment date and accrue interest on an Actual/360 basis, the Monthly Debt Service Amount ($) was calculated as 1/12th of the product of (i) the Original Balance ($), (ii) the Interest Rate % and (iii) 365/360. |
| (3) | In the case of Loan No. 11, the Cut-off Date LTV and Maturity/ARD LTV are calculated by using an appraised value based on an “hypothetical as is” assumption. In the case of Loan No. 32, the Cut-off Date LTV and Maturity/ARD LTV are calculated by using an appraised value based on a “as complete” assumption. Refer to “Description of the Mortgage Pool—Certain Calculations and Definitions—Appraised Value” in the Preliminary Prospectus for additional details. |
THE INFORMATION IN THIS STRUCTURAL AND COLLATERAL TERM SHEET IS NOT COMPLETE AND MAY BE AMENDED PRIOR TO THE TIME OF SALE. THIS TERM SHEET IS NOT AN OFFER TO SELL THESE SECURITIES AND IT IS NOT A SOLICITATION OF AN OFFER TO BUY THESE SECURITIES IN ANY JURISDICTION WHERE THE OFFER OR SALE IS NOT PERMITTED. |
| | 15 | |
| Structural and Collateral Term Sheet | | BMO 2024-5C3 |
| Collateral Characteristics |
Original Amortization Term in Months |
| | | | | Weighted Average |
Original
Amortization
Term in Months | Number of Loans | Cut-off Date Principal Balance | % of IPB | Mortgage Rate | Remaining Loan Term | UW
NCF DSCR(1)(2) | UW
NOI
DY(1) | Cut-off
Date LTV(1)(3) | Maturity Date/ARD LTV(1)(3) |
| Interest Only | 36 | $898,040,000 | 99.5 | % | 6.87327% | 59 | 1.92x | 13.9% | 51.4% | 51.4% |
| 360 | 1 | 4,200,000 | 0.5 | | 8.33000% | 57 | 1.27x | 11.8% | 65.6% | 64.2% |
| Total / Weighted Average: | 37 | $902,240,000 | 100.0 | % | 6.88006% | 59 | 1.92x | 13.9% | 51.5% | 51.4% |
| Remaining Amortization Term in Months |
| | | | | Weighted Average |
| Range of Remaining Amortization Term in Months | Number of Loans | Cut-off Date Principal Balance | % of IPB | Mortgage Rate | Remaining Loan Term | UW
NCF DSCR(1)(2) | UW
NOI
DY(1) | Cut-off
Date LTV(1)(3) | Maturity Date/ARD LTV(1)(3) |
| Interest Only | 36 | $898,040,000 | 99.5 | % | 6.87327% | 59 | 1.92x | 13.9% | 51.4% | 51.4% |
| 360 | 1 | 4,200,000 | 0.5 | | 8.33000% | 57 | 1.27x | 11.8% | 65.6% | 64.2% |
| Total / Weighted Average: | 37 | $902,240,000 | 100.0 | % | 6.88006% | 59 | 1.92x | 13.9% | 51.5% | 51.4% |
| | | | | Weighted Average |
| Amortization Types | Number of Loans | Cut-off Date Principal Balance | % of IPB | Mortgage Rate | Remaining Loan Term | UW
NCF DSCR(1)(2) | UW
NOI
DY(1) | Cut-off
Date LTV(1)(3) | Maturity Date/ARD LTV(1)(3) |
| Interest Only | 36 | $898,040,000 | 99.5 | % | 6.87327% | 59 | 1.92x | 13.9% | 51.4% | 51.4% |
| Interest Only, Amortizing Balloon | 1 | 4,200,000 | 0.5 | | 8.33000% | 57 | 1.27x | 11.8% | 65.6% | 64.2% |
| Total / Weighted Average: | 37 | $902,240,000 | 100.0 | % | 6.88006% | 59 | 1.92x | 13.9% | 51.5% | 51.4% |
| Underwritten Net Cash Flow Debt Service Coverage Ratios(1)(2) |
| | | | | Weighted Average |
| Range of Underwritten Net Cash Flow Debt Service Coverage Ratios | Number of Loans | Cut-off Date Principal Balance | % of IPB | Mortgage Rate | Remaining Loan Term | UW
NCF DSCR(1)(2) | UW
NOI
DY(1) | Cut-off
Date LTV(1)(3) | Maturity Date/ARD LTV(1)(3) |
| 1.22x | - | 1.49x | 13 | $156,230,000 | 17.3 | % | 7.17719% | 59 | 1.34x | 10.0% | 62.3% | 62.3% |
| 1.50x | - | 1.59x | 4 | 112,850,000 | 12.5 | | 6.95299% | 59 | 1.53x | 11.2% | 64.4% | 64.4% |
| 1.60x | - | 1.69x | 4 | 59,550,000 | 6.6 | | 7.29343% | 59 | 1.65x | 12.8% | 53.4% | 53.4% |
| 1.70x | - | 1.79x | 1 | 23,000,000 | 2.5 | | 7.67100% | 56 | 1.75x | 13.8% | 48.4% | 48.4% |
| 1.80x | - | 1.89x | 1 | 15,000,000 | 1.7 | | 7.75000% | 58 | 1.85x | 17.1% | 59.4% | 59.4% |
| 1.90x | - | 1.99x | 5 | 174,200,000 | 19.3 | | 7.37377% | 59 | 1.94x | 16.1% | 56.1% | 56.1% |
| 2.00x | - | 2.99x | 8 | 328,410,000 | 36.4 | | 6.27464% | 59 | 2.27x | 14.7% | 41.3% | 41.3% |
| 3.00x | - | 3.03x | 1 | 33,000,000 | 3.7 | | 6.95000% | 59 | 3.03x | 22.6% | 27.3% | 27.3% |
| Total / Weighted Average: | 37 | $902,240,000 | 100.0 | % | 6.88006% | 59 | 1.92x | 13.9% | 51.5% | 51.4% |
| (1) | In the case of Loan Nos. 1, 2, 4, 5, 6, 10, 11, 12, 15, 18, 24 and 27, the UW NCF DSCR, UW NOI DY, Cut-off Date LTV and Maturity Date/ARD LTV calculations include the related Pari Passu Companion Loan(s). In the case of Loan Nos. 6 and 27, the UW NCF DSCR, UW NOI DY, Cut-off Date LTV and Maturity Date/ARD LTV calculations exclude the related mezzanine loans. |
| (2) | For the mortgage loans that are interest-only for the entire term or until the anticipated repayment date and accrue interest on an Actual/360 basis, the Monthly Debt Service Amount ($) was calculated as 1/12th of the product of (i) the Original Balance ($), (ii) the Interest Rate % and (iii) 365/360. |
| (3) | In the case of Loan No. 11, the Cut-off Date LTV and Maturity/ARD LTV are calculated by using an appraised value based on an “hypothetical as is” assumption. In the case of Loan No. 32, the Cut-off Date LTV and Maturity/ARD LTV are calculated by using an appraised value based on a “as complete” assumption. Refer to “Description of the Mortgage Pool—Certain Calculations and Definitions—Appraised Value” in the Preliminary Prospectus for additional details. |
THE INFORMATION IN THIS STRUCTURAL AND COLLATERAL TERM SHEET IS NOT COMPLETE AND MAY BE AMENDED PRIOR TO THE TIME OF SALE. THIS TERM SHEET IS NOT AN OFFER TO SELL THESE SECURITIES AND IT IS NOT A SOLICITATION OF AN OFFER TO BUY THESE SECURITIES IN ANY JURISDICTION WHERE THE OFFER OR SALE IS NOT PERMITTED. |
| | 16 | |
| Structural and Collateral Term Sheet | | BMO 2024-5C3 |
| Collateral Characteristics |
| LTV Ratios as of the Cut-off Date(1)(3) |
| | | | | Weighted Average |
Range of
Cut-off Date LTVs | Number of Loans | Cut-off Date Principal Balance | % of IPB | Mortgage Rate | Remaining Loan Term | UW
NCF DSCR(1)(2) | UW
NOI
DY(1) | Cut-off
Date LTV(1)(3) | Maturity Date/ARD LTV(1)(3) |
| 27.3% | - | 49.9% | 11 | $379,760,000 | 42.1 | % | 6.54101% | 58 | 2.29x | 15.5% | 40.2% | 40.2% |
| 50.0% | - | 59.9% | 10 | 259,950,000 | 28.8 | | 7.21224% | 59 | 1.82x | 14.5% | 55.0% | 55.0% |
| 60.0% | - | 64.9% | 11 | 175,330,000 | 19.4 | | 6.93562% | 59 | 1.50x | 11.0% | 63.3% | 63.3% |
| 65.0% | - | 70.1% | 5 | 87,200,000 | 9.7 | | 7.25461% | 60 | 1.43x | 10.8% | 66.0% | 65.9% |
| Total / Weighted Average: | 37 | $902,240,000 | 100.0 | % | 6.88006% | 59 | 1.92x | 13.9% | 51.5% | 51.4% |
| LTV Ratios as of the Maturity Date(1)(3) |
| | | | | Weighted Average |
Range of
Maturity Date LTVs | Number of Loans | Cut-off Date Principal Balance | % of IPB | Mortgage Rate | Remaining Loan Term | UW
NCF DSCR(1)(2) | UW
NOI
DY(1) | Cut-off
Date LTV(1)(3) | Maturity Date/ARD LTV(1)(3) |
| 27.3% | - | 49.9% | 11 | $379,760,000 | 42.1 | % | 6.54101% | 58 | 2.29x | 15.5% | 40.2% | 40.2% |
| 50.0% | - | 59.9% | 10 | 259,950,000 | 28.8 | | 7.21224% | 59 | 1.82x | 14.5% | 55.0% | 55.0% |
| 60.0% | - | 64.9% | 12 | 179,530,000 | 19.9 | | 6.96824% | 59 | 1.49x | 11.0% | 63.4% | 63.4% |
| 65.0% | - | 70.1% | 4 | 83,000,000 | 9.2 | | 7.20019% | 60 | 1.44x | 10.7% | 66.0% | 66.0% |
| Total / Weighted Average: | 37 | $902,240,000 | 100.0 | % | 6.88006% | 59 | 1.92x | 13.9% | 51.5% | 51.4% |
| | | | | Weighted Average |
| Prepayment Protection | Number of Loans | Cut-off Date Principal Balance | % of IPB | Mortgage Rate | Remaining Loan Term | UW
NCF DSCR(1)(2) | UW
NOI
DY(1) | Cut-off
Date LTV(1)(3) | Maturity Date/ARD LTV(1)(3) |
| Defeasance | 24 | $523,030,000 | 58.0 | % | 6.77768% | 59 | 1.85x | 13.1% | 53.7% | 53.7% |
| Yield Maintenance | 9 | 204,750,000 | 22.7 | | 7.05479% | 58 | 1.93x | 14.1% | 50.9% | 50.9% |
| Yield Maintenance or Defeasance | 4 | 174,460,000 | 19.3 | | 6.98189% | 59 | 2.11x | 16.1% | 45.4% | 45.4% |
| Total / Weighted Average: | 37 | $902,240,000 | 100.0 | % | 6.88006% | 59 | 1.92x | 13.9% | 51.5% | 51.4% |
| | | | | Weighted Average |
| Loan Purpose | Number of Loans | Cut-off Date Principal Balance | % of IPB | Mortgage Rate | Remaining Loan Term | UW
NCF DSCR(1)(2) | UW
NOI
DY(1) | Cut-off
Date LTV(1)(3) | Maturity Date/ARD LTV(1)(3) |
| Refinance | 26 | $683,760,000 | 75.8 | % | 6.84196% | 59 | 1.97x | 14.2% | 50.4% | 50.4% |
| Acquisition | 8 | 162,480,000 | 18.0 | | 6.90677% | 59 | 1.86x | 13.6% | 55.1% | 55.1% |
| Recapitalization | 3 | 56,000,000 | 6.2 | | 7.26773% | 58 | 1.55x | 11.6% | 53.8% | 53.8% |
| Total / Weighted Average: | 37 | $902,240,000 | 100.0 | % | 6.88006% | 59 | 1.92x | 13.9% | 51.5% | 51.4% |
| (1) | In the case of Loan Nos. 1, 2, 4, 5, 6, 10, 11, 12, 15, 18, 24 and 27, the UW NCF DSCR, UW NOI DY, Cut-off Date LTV and Maturity Date/ARD LTV calculations include the related Pari Passu Companion Loan(s). In the case of Loan Nos. 6 and 27, the UW NCF DSCR, UW NOI DY, Cut-off Date LTV and Maturity Date/ARD LTV calculations exclude the related mezzanine loans. |
| (2) | For the mortgage loans that are interest-only for the entire term or until the anticipated repayment date and accrue interest on an Actual/360 basis, the Monthly Debt Service Amount ($) was calculated as 1/12th of the product of (i) the Original Balance ($), (ii) the Interest Rate % and (iii) 365/360. |
| (3) | In the case of Loan No. 11, the Cut-off Date LTV and Maturity/ARD LTV are calculated by using an appraised value based on an “hypothetical as is” assumption. In the case of Loan No. 32, the Cut-off Date LTV and Maturity/ARD LTV are calculated by using an appraised value based on a “as complete” assumption. Refer to “Description of the Mortgage Pool—Certain Calculations and Definitions—Appraised Value” in the Preliminary Prospectus for additional details. |
THE INFORMATION IN THIS STRUCTURAL AND COLLATERAL TERM SHEET IS NOT COMPLETE AND MAY BE AMENDED PRIOR TO THE TIME OF SALE. THIS TERM SHEET IS NOT AN OFFER TO SELL THESE SECURITIES AND IT IS NOT A SOLICITATION OF AN OFFER TO BUY THESE SECURITIES IN ANY JURISDICTION WHERE THE OFFER OR SALE IS NOT PERMITTED. |
| | 17 | |
| Structural and Collateral Term Sheet | | BMO 2024-5C3 |
| Collateral Characteristics |
| Previous Securitization History(1) |
| No. | Mortgage Loan Seller | Loan/Property Name | Location | Property Type | Cut-off Date Principal Balance | % of IPB | Previous Securitization |
| 3 | SMC, GSMC | Margaritaville Lake of the Ozarks | Osage Beach, MO | Hospitality | $60,500,000 | 6.7% | GSMS 2017-GS7 |
| 5.01 | CREFI | 50 East State Street | Trenton, NJ | Office | $30,000,000 | 3.3% | UBSBB 2012-C2 |
| 5.02 | CREFI | 33 West State Street | Trenton, NJ | Office | $20,000,000 | 2.2% | UBSBB 2012-C2 |
| 10 | CREFI | 333 South Spruce Street | Manteno, IL | Industrial | $28,750,000 | 3.2% | FIVE 2023-V1 |
| 13 | SMC | Highland Hills Apartments | Jackson, MS | Multifamily | $27,100,000 | 3.0% | ARCLO 2021-FL4 |
| 15 | GSMC, GACC | Garden State Plaza | Paramus, NJ | Retail | $25,000,000 | 2.8% | RBSCF 2013-GSP, WFRBS 2013-C18 |
| 16 | CREFI | Whole Foods at Gateway Center | West Bloomfield, MI | Retail | $24,000,000 | 2.7% | AREIT 2018-CRE1 |
| 17 | SMC | University Shoppes | Miami, FL | Mixed Use | $23,450,000 | 2.6% | JPMBB 2014-C18 |
| 22.02 | BMO | Claremont Manor Apartments | Claremont, NH | Multifamily | $4,500,000 | 0.5% | FREMF 2022-KF139 |
| 37 | GCMC | Orchard Grove Shopping Center | Aurora, IL | Retail | $3,100,000 | 0.3% | GSMS 2014-GC18 |
| (1) | The table above represents the properties for which the previously existing debt was most recently securitized, based on information provided by the related borrower or obtained through searches of a third-party database. |
THE INFORMATION IN THIS STRUCTURAL AND COLLATERAL TERM SHEET IS NOT COMPLETE AND MAY BE AMENDED PRIOR TO THE TIME OF SALE. THIS TERM SHEET IS NOT AN OFFER TO SELL THESE SECURITIES AND IT IS NOT A SOLICITATION OF AN OFFER TO BUY THESE SECURITIES IN ANY JURISDICTION WHERE THE OFFER OR SALE IS NOT PERMITTED. |
| | 18 | |
| Structural and Collateral Term Sheet | | BMO 2024-5C3 |
| Structural Overview |
| ■ Certificates: | | The “Certificates” will consist of the Class A-1, Class A-3, Class X-A, Class X-B, Class X-D, Class A-S, Class B, Class C, Class D, Class E, Class F-RR, Class G-RR, Class J-RR, Class VRR and Class R certificates. The Certificates (exclusive of the Class VRR certificates) are referred to as the “Non-Vertically Retained Certificates”. The Non-Vertically Retained Certificates other than the Class R Certificates are referred to as the “Non-Vertically Retained Regular Certificates”. The Non-Vertically Retained Regular Certificates and the Class VRR certificates are collectively referred to as “Regular Certificates”. The Class A-1, Class A-3, Class A-S, Class B, Class C, Class D, Class E, Class F-RR, Class G-RR and Class J-RR certificates are collectively referred to as the “Non-Vertically Retained Principal Balance Certificates”. The Non-Vertically Retained Principal Balance Certificates and the Class VRR certificates are collectively referred to as “Principal Balance Certificates”. The Class X-A, Class X-B and Class X-D certificates are collectively referred to as the “Class X Certificates”. |
| ■ Accrual: | | Each Class of Certificates (other than the Class R Certificates) will accrue interest on a 30/360 basis. The Class R Certificates will not accrue interest. |
■ Allocation Between Combined
VRR Interest and Non-Vertically
Retained Certificates: | | The aggregate amount available for distribution to holders of the Non-Vertically Retained Certificates and the Combined VRR Interest on each distribution date will be: (i) the gross amount of interest, principal, yield maintenance charges and prepayment premiums collected with respect to the mortgage loans in the applicable one-month collection period, net of specified expenses of the issuing entity, including fees payable therefrom to, and losses, liabilities, advances (with interest thereon), costs and expenses reimbursable or indemnifiable therefrom to, the master servicer, the special servicer, the certificate administrator, the trustee, the operating advisor, the asset representations reviewer and CREFC®; and (ii) allocated to amounts available for distribution to the holders of the Combined VRR Interest, on the one hand, and amounts available for distribution to the holders of the Non-Vertically Retained Certificates (exclusive of the Class R certificates), on the other hand. On each distribution date, the portion of such aggregate available funds allocable to: (a) the Combined VRR Interest will be the product of such aggregate available funds multiplied by the Vertically Retained Percentage; and (b) the Non-Vertically Retained Certificates (exclusive of the Class R certificates) will at all times be the product of such aggregate available funds multiplied by the Non-Vertically Retained Percentage. See “Credit Risk Retention” and “Description of the Certificates” in the Preliminary Prospectus. The “Vertically Retained Percentage” is a fraction, expressed as a percentage, the numerator of which is the initial principal balance of the Combined VRR Interest, and the denominator of which is the sum of (x) the aggregate initial certificate balance of all classes of Non-Vertically Retained Principal Balance Certificates and (y) the initial principal balance of the Combined VRR Interest. The “Non-Vertically Retained Percentage” is the difference between 100% and the Vertically Retained Percentage. |
| ■ Distributions: | | On each Distribution Date, funds available for distribution to holders of the Non-Vertically Retained Certificates (exclusive of any portion thereof that represents the Non-Vertically Retained Percentage of (i) any yield maintenance charges and prepayment premiums collected on the mortgage loans and/or (ii) any excess interest accrued after the related anticipated repayment date on any mortgage loan with an anticipated repayment date) (“Non-Vertically Retained Available Funds”) will be distributed in the following amounts and order of priority (in each case to the extent of remaining available funds): 1. Class A-1, Class A-3, Class X-A, Class X-B and Class X-D certificates: to interest on the Class A-1, Class A-3, Class X-A, Class X-B and Class X-D certificates, up to, and pro rata in accordance with, their respective interest entitlements. 2. Class A-1 and Class A-3 certificates: to the extent of Non-Vertically Retained Available Funds allocable to principal received or advanced on the mortgage loans, (i) first to principal on the Class A-1 certificates until their certificate balance is reduced to zero, and then (ii) to principal on the Class A-3 certificates until their certificate balance is reduced to zero, all funds available for distribution of principal remaining after the distributions to the Class A-1 certificates in clause (i) above. However, if the certificate balances of each and every class of the Class A-S, Class B, Class C, Class D, Class E, Class F-RR, Class G-RR and Class J-RR certificates have been reduced to zero as a result of the allocation of mortgage loan losses and other unanticipated expenses to those certificates, then Non-Vertically Retained Available Funds allocable to principal will be distributed to the Class A-1 and Class A-3 certificates, pro rata, based on their respective certificate balances. 3. Class A-1 and Class A-3 certificates: to reimburse the Class A-1 and Class A-3 certificates, pro rata, for any unreimbursed losses on the mortgage loans that were previously allocated to reduce |
THE INFORMATION IN THIS STRUCTURAL AND COLLATERAL TERM SHEET IS NOT COMPLETE AND MAY BE AMENDED PRIOR TO THE TIME OF SALE. THIS TERM SHEET IS NOT AN OFFER TO SELL THESE SECURITIES AND IT IS NOT A SOLICITATION OF AN OFFER TO BUY THESE SECURITIES IN ANY JURISDICTION WHERE THE OFFER OR SALE IS NOT PERMITTED. |
| | 19 | |
| Structural and Collateral Term Sheet | | BMO 2024-5C3 |
| Structural Overview |
| | the certificate balances of those classes, together with interest at their respective pass-through rates. 4. Class A-S certificates: (i) first, to interest on the Class A-S certificates in the amount of their interest entitlement; (ii) next, to the extent of Non-Vertically Retained Available Funds allocable to principal remaining after distributions in respect of principal to each class of Non-Vertically Retained Principal Balance Certificates with a higher principal payment priority (in this case, the Class A-1 and Class A-3 certificates), to principal on the Class A-S certificates until their certificate balance is reduced to zero; and (iii) next, to reimburse the Class A-S certificates for any unreimbursed losses on the mortgage loans that were previously allocated to reduce the certificate balance of that class, together with interest at its pass-through rate. 5. Class B certificates: (i) first, to interest on the Class B certificates in the amount of their interest entitlement; (ii) next, to the extent of Non-Vertically Retained Available Funds allocable to principal remaining after distributions in respect of principal to each class of Non-Vertically Retained Principal Balance Certificates with a higher principal payment priority (in this case, the Class A-1, Class A-3 and Class A-S certificates), to principal on the Class B certificates until their certificate balance is reduced to zero; and (iii) next, to reimburse Class B certificates for any unreimbursed losses on the mortgage loans that were previously allocated to reduce the certificate balance of that class, together with interest at its pass-through rate. 6. Class C certificates: (i) first, to interest on the Class C certificates in the amount of their interest entitlement; (ii) next, to the extent of Non-Vertically Retained Available Funds allocable to principal remaining after distributions in respect of principal to each class of Non-Vertically Retained Principal Balance Certificates with a higher principal payment priority (in this case, the Class A-1, Class A-3, Class A-S and Class B certificates), to principal on the Class C certificates until their certificate balance is reduced to zero; and (iii) next, to reimburse the Class C certificates for any unreimbursed losses on the mortgage loans that were previously allocated to reduce the certificate balance of that class, together with interest at its pass-through rate. 7. After the Class A-1, Class A-3, Class X-A, Class X-B, Class X-D, Class A-S, Class B and Class C certificates are paid all amounts to which they are entitled on such Distribution Date, the remaining Non-Vertically Retained Available Funds will be used to pay interest to the Class D, Class E, Class F-RR, Class G-RR and Class J-RR certificates, and to pay principal to, and to reimburse (with interest) any unreimbursed losses to, the Class D, Class E, Class F-RR, Class G-RR and Class J-RR certificates, sequentially in order, and with respect to each such class of Non-Vertically Retained Principal Balance Certificates, in a manner analogous to the Class C certificates pursuant to clause 6 above. |
■ Realized Losses: | | The certificate balances of the Non-Vertically Retained Principal Balance Certificates will each be reduced without distribution on any Distribution Date as a write-off to the extent of any loss realized on the mortgage loans allocated to the related class on such Distribution Date. On each Distribution Date, the Non-Vertically Retained Percentage of any such losses will be applied to the respective classes of Non-Vertically Retained Principal Balance Certificates in the following order, in each case until the related certificate balance is reduced to zero: first to the Class J-RR certificates; second, to the Class G-RR certificates; third, to the Class F-RR certificates; fourth, to the Class E certificates; fifth, to the Class D certificates; sixth, to the Class C certificates; seventh, to the Class B certificates; eighth, to the Class A-S certificates; and, finally pro rata, to the Class A-1 and Class A-3 certificates, based on their then current respective certificate balances. The notional amount of each class of Class X Certificates will be reduced to reflect reductions in the certificate balance(s) of the class (or classes, as applicable) of Corresponding Principal Balance Certificates as a result of allocations of losses realized on the mortgage loans to such class(es) of Non-Vertically Retained Principal Balance Certificates. |
| | | |
THE INFORMATION IN THIS STRUCTURAL AND COLLATERAL TERM SHEET IS NOT COMPLETE AND MAY BE AMENDED PRIOR TO THE TIME OF SALE. THIS TERM SHEET IS NOT AN OFFER TO SELL THESE SECURITIES AND IT IS NOT A SOLICITATION OF AN OFFER TO BUY THESE SECURITIES IN ANY JURISDICTION WHERE THE OFFER OR SALE IS NOT PERMITTED. |
| | 20 | |
| Structural and Collateral Term Sheet | | BMO 2024-5C3 |
| Structural Overview |
| ■ Prepayment Premiums and Yield Maintenance Charges: | | On each Distribution Date, until the notional amounts of the Class X-A, Class X-B and Class X-D certificates and the certificate balances of the Class A-1, Class A-3, Class A-S, Class B, Class C, Class D and Class E certificates have been reduced to zero, the Non-Vertically Retained Percentage of each yield maintenance charge collected on the mortgage loans during the related one-month collection period (or, in the case of an outside serviced mortgage loan, that accompanied a principal prepayment included in the aggregate available funds for such Distribution Date) is required to be distributed to holders of the Non-Vertically Retained Regular Certificates (excluding holders of the Class F-RR, Class G-RR and Class J-RR certificates) as follows: (a) first the Non-Vertically Retained Percentage of such yield maintenance charge will be allocated among (i) the group (the “YM Group A”) of the Class A-1, Class A-3 and Class X-A certificates, (ii) the group (the “YM Group A-S/B/C”) comprised of the Class A-S, Class B, Class C and Class X-B certificates, and (iii) the group (the “YM Group D/E”, and the YM Group A, the YM Group A-S/B/C and the YM Group D/E, collectively, the “YM Groups”) comprised of the Class D, Class E and Class X-D certificates, pro rata, based upon the aggregate amount of principal distributed to the class or classes of Non-Vertically Retained Principal Balance Certificates in each YM Group on such Distribution Date, and (b) then the portion of such yield maintenance charge allocated to each YM Group will be further allocated as among the classes of Non-Vertically Retained Regular Certificates in such YM Group, in the following manner: (i) each class of Non-Vertically Retained Principal Balance Certificates in such YM Group will entitle the applicable certificateholders to receive on the applicable Distribution Date that portion of such yield maintenance charge equal to the product of (X) a fraction whose numerator is the amount of principal distributed to such class of Non-Vertically Retained Principal Balance Certificates on such Distribution Date and whose denominator is the total amount of principal distributed to all of the Non-Vertically Retained Principal Balance Certificates in that YM Group on such Distribution Date, (Y) except in the case of any YM Group comprised solely of one or more classes of Non-Vertically Retained Principal Balance Certificates, the Base Interest Fraction (as defined in the Preliminary Prospectus) for the related principal prepayment and such class of Non-Vertically Retained Principal Balance Certificates, and (Z) the portion of such yield maintenance charge allocated to such YM Group, and (ii) the portion of such yield maintenance charge allocated to such YM Group and remaining after such distributions with respect to the Non-Vertically Retained Principal Balance Certificates in such YM Group will be distributed to the class of Class X Certificates (if any) in such YM Group. If there is more than one class of Non-Vertically Retained Principal Balance Certificates in any YM Group entitled to distributions of principal on any particular Distribution Date on which yield maintenance charges are distributable to such classes, the aggregate portion of such yield maintenance charges allocated to such YM Group will be allocated among all such classes of Non-Vertically Retained Principal Balance Certificates up to, and on a pro rata basis in accordance with, their respective entitlements to those yield maintenance charges in accordance with the prior sentence of this paragraph. If a prepayment premium (calculated as a percentage of the amount prepaid) is imposed in connection with a prepayment rather than a yield maintenance charge, then the prepayment premium so collected will be allocated as described above. For this purpose, the discount rate used to calculate the Base Interest Fraction will be the discount rate used to determine the yield maintenance charge for mortgage loans that require payment at the greater of a yield maintenance charge or a minimum amount equal to a fixed percentage of the principal balance of the mortgage loan or, for mortgage loans that only have a prepayment premium based on a fixed percentage of the principal balance of the mortgage loan, such other discount rate as may be specified in the related loan documents. After the notional amounts of the Class X-A, Class X-B and Class X-D certificates and the certificate balances of the Class A-1, Class A-3, Class A-S, Class B, Class C, Class D and Class E certificates have been reduced to zero, the Non-Vertically Retained Percentage of all prepayment premiums and yield maintenance charges with respect to the mortgage loans will be allocated among the holders of the Class F-RR, Class G-RR and Class J-RR certificates as provided in the BMO 2023-5C3 pooling and servicing agreement. No yield maintenance charges or prepayment premiums will be distributed to the holders of the Class R certificates. For a description of prepayment premiums and yield maintenance charges required on the mortgage loans, see Annex A to the Preliminary Prospectus. See also “Certain Legal Aspects of the Mortgage Loans—Default Interest and Limitations on Prepayments” in the Preliminary Prospectus. |
| ■ Advances: | | The master servicer and, if it fails to do so, the trustee, will be obligated to make P&I advances with respect to each mortgage loan in the issuing entity and, with respect to all of the mortgage loans serviced under the BMO 2024-5C3 pooling and servicing agreement, servicing advances, including paying delinquent property taxes, condominium assessments, insurance premiums and ground lease rents, but only to the extent that those advances are not deemed non-recoverable from collections on the related mortgage loan and, in the case of servicing advances, any related companion loans as described below. P&I advances are subject to reduction in connection with any appraisal reductions that may occur. The special servicer will have no obligation to make any advances, provided that, in an urgent or emergency situation requiring the making of a property protection advance, the special servicer may, in its sole discretion, make a property protection advance and will be entitled to |
THE INFORMATION IN THIS STRUCTURAL AND COLLATERAL TERM SHEET IS NOT COMPLETE AND MAY BE AMENDED PRIOR TO THE TIME OF SALE. THIS TERM SHEET IS NOT AN OFFER TO SELL THESE SECURITIES AND IT IS NOT A SOLICITATION OF AN OFFER TO BUY THESE SECURITIES IN ANY JURISDICTION WHERE THE OFFER OR SALE IS NOT PERMITTED. |
| | 21 | |
| Structural and Collateral Term Sheet | | BMO 2024-5C3 |
| Structural Overview |
| | reimbursement from the master servicer for such advance. The master servicer, the special servicer and the trustee will each be entitled to receive interest on advances they make at the prime rate (and, solely in the case of the master servicer, subject to a floor of 2.0% per annum), compounded annually. |
■ Serviced Mortgage Loans/Outside Serviced Mortgage Loans: | | One or more whole loans may each constitute an “outside serviced whole loan”, in which case (as identified under “Collateral Characteristics—Pari Passu Companion Loan Summary” above), the BMO 2024-5C3 pooling and servicing agreement is not the Controlling PSA, and each related mortgage loan constitutes an “outside serviced mortgage loan,” each related companion loan constitutes an “outside serviced companion loan,” and each related Controlling PSA constitutes an “outside servicing agreement.” One or more whole loans may be identified in the Preliminary Prospectus as a “servicing shift whole loan”, in which case the related mortgage loan constitutes a “servicing shift mortgage loan” and each related companion loan constitutes a “servicing shift companion loan”. Any servicing shift whole loan will initially be serviced pursuant to the BMO 2024-5C3 pooling and servicing agreement during which time such mortgage loan, such whole loan and each related companion loan will be a serviced mortgage loan, a serviced whole loan and a serviced companion loan (each as defined below), respectively. However, upon the inclusion of the related controlling pari passu companion loan in a future securitization transaction, the servicing of such mortgage loan will shift to the servicing agreement governing such securitization transaction, and such mortgage loan, such whole loan and each related companion loan will be an outside serviced mortgage loan, an outside serviced whole loan and an outside serviced companion loan, respectively. All of the mortgage loans transferred to the issuing entity (other than any outside serviced mortgage loan) are sometimes referred to in this Term Sheet as the “serviced mortgage loans” and, together with any related companion loans, as the “serviced loans” (which signifies that they are being serviced by the master servicer and the special servicer under the BMO 2024-5C3 pooling and servicing agreement); each related whole loan constitutes a “serviced whole loan”; and each related companion loan constitutes a “serviced companion loan.” See “Description of the Mortgage Pool—The Whole Loans” in the Preliminary Prospectus. |
| ■ Appraisal Reduction Amounts: | | An Appraisal Reduction Amount generally will be created with respect to a required appraisal loan (which is a serviced loan as to which certain defaults, modifications or insolvency events have occurred (as further described in the Preliminary Prospectus)) in the amount, if any, by which the principal balance of such required appraisal loan, plus other amounts overdue or advanced in connection with such required appraisal loan, exceeds 90% of the appraised value of the related mortgaged property (subject to certain downward adjustments permitted under the BMO 2024-5C3 pooling and servicing agreement) plus certain escrows and reserves (including letters of credit) held with respect to such required appraisal loan; provided that, if so provided in the related co-lender agreement, the holder of a subordinate companion loan may be permitted to post cash or a letter of credit to offset some or all of an Appraisal Reduction Amount. In the case of an outside serviced mortgage loan, any Appraisal Reduction Amounts will be calculated pursuant to, and by a party to, the related outside servicing agreement. In general, any Appraisal Reduction Amount calculated with respect to a whole loan will be allocated first, to any related subordinate companion loan(s) (up to the outstanding principal balance(s) thereof), and then, to the related mortgage loan and any related pari passu companion loan(s) on a pro rata basis in accordance with their respective outstanding principal balances. As a result of an Appraisal Reduction Amount being calculated for and/or allocated to a given mortgage loan, the interest portion of any P&I advance for such mortgage loan will be reduced, which (to the extent of the Non-Vertically Retained Percentage of the reduction in such P&I advance) will have the effect of reducing the amount of interest available to the most subordinate class(es) of Certificates then outstanding (i.e., first, to the Class J-RR certificates, then, to the Class G-RR certificates, then, to the Class F-RR certificates, then, to the Class E certificates, then, to the Class D certificates, then, to the Class C certificates, then, to the Class B certificates, then, to the Class A-S certificates, and then, pro rata based on interest entitlements, to the Class A-1, Class A-3, Class X-A, Class X-B and Class X-D certificates). In general, a serviced loan will cease to be a required appraisal loan, and no longer be subject to an Appraisal Reduction Amount, when the same has ceased to be a specially serviced loan (if applicable), has been brought current for at least three consecutive months and no other circumstances exist that would cause such serviced loan to be a required appraisal loan. For various purposes under the BMO 2024-5C3 pooling and servicing agreement (including, with respect to the Non-Vertically Retained Principal Balance Certificates, for purposes of determining the Non-Reduced Certificates and the Controlling Class, as well as the occurrence of a Control Termination Event and an Operating Advisor Consultation Trigger Event), the Vertically Retained Percentage of any Appraisal Reduction Amounts in respect of or allocated to the mortgage loans will be allocated to notionally reduce the certificate balance of the Combined VRR Interest, and the Non-Vertically Retained Percentage of any Appraisal Reduction Amounts in respect of or allocated to the mortgage loans will be allocated to notionally reduce the certificate balances of the Non-Vertically Retained Principal Balance Certificates as follows: first, to the Class J-RR, Class G-RR, Class F-RR, |
THE INFORMATION IN THIS STRUCTURAL AND COLLATERAL TERM SHEET IS NOT COMPLETE AND MAY BE AMENDED PRIOR TO THE TIME OF SALE. THIS TERM SHEET IS NOT AN OFFER TO SELL THESE SECURITIES AND IT IS NOT A SOLICITATION OF AN OFFER TO BUY THESE SECURITIES IN ANY JURISDICTION WHERE THE OFFER OR SALE IS NOT PERMITTED. |
| | 22 | |
| Structural and Collateral Term Sheet | | BMO 2024-5C3 |
| Structural Overview |
| | Class E, Class D, Class C, Class B and Class A-S certificates, in that order, in each case until the related certificate balance is notionally reduced to zero; and then to the Class A-1 and Class A-3 certificates, pro rata based on certificate balance. |
■ Cumulative Appraisal Reduction Amounts: | | A “Cumulative Appraisal Reduction Amount”, as of any date of determination, is equal to the sum of (i) all Appraisal Reduction Amounts then in effect, and (ii) with respect to any AB Modified Loans, any Collateral Deficiency Amount then in effect. “Collateral Deficiency Amount” means, with respect to any AB Modified Loan as of any date of determination, the excess of (i) the stated principal balance of such AB Modified Loan (taking into account the related junior note(s) included therein), over (ii) the sum of (in the case of a whole loan, solely to the extent allocable to the subject mortgage loan) (x) the most recent appraised value for the related mortgaged property or mortgaged properties, plus (y) solely to the extent not reflected or taken into account in such appraised value and to the extent on deposit with, or otherwise under the control of, the lender as of the date of such determination, any capital or additional collateral contributed by the related borrower at the time the mortgage loan became (and as part of the modification related to) such AB Modified Loan for the benefit of the related mortgaged property or mortgaged properties (provided, that in the case of an outside serviced mortgage loan, the amounts set forth in this clause (y) will be taken into account solely to the extent relevant information is received), plus (z) any other escrows or reserves (in addition to any amounts set forth in the immediately preceding clause (y)) held by the lender in respect of such AB Modified Loan as of the date of such determination. For purposes of determining the identity of the Controlling Class and the existence of a Control Termination Event and an Operating Advisor Consultation Trigger Event, the Non-Vertically Retained Percentage of Collateral Deficiency Amounts will be allocable to the respective classes of Control Eligible Certificates (as defined below), in reverse alphabetical order of class designation, in a manner similar to the allocation of Appraisal Reduction Amounts to such classes. “AB Modified Loan” means any corrected mortgage loan (1) that became a corrected mortgage loan (which includes for purposes of this definition any outside serviced mortgage loan that became a “corrected” mortgage loan (or any term substantially similar thereto) pursuant to the related outside servicing agreement) due to a modification thereto that resulted in the creation of an A/B note structure (or similar structure) and as to which the new junior note(s) did not previously exist or the principal amount of the new junior note(s) was previously part of either an A note held by the trust or the original unmodified mortgage loan and (2) as to which an Appraisal Reduction Amount is not in effect. |
| ■ Age of Appraisals: | | Appraisals (which can be an update of a prior appraisal) with respect to a serviced loan are required to be no older than 9 months for purposes of determining appraisal reductions (other than the annual re-appraisal), market value, and other calculations as described in the Preliminary Prospectus. |
| ■ Sale of Defaulted Loans: | | There will be no “Fair Market Value Purchase Option”. Instead, defaulted mortgage loans will be sold in a process similar to the sale process for REO property. With respect to an outside serviced whole loan, the party acting as special servicer with respect to such outside serviced whole loan pursuant to the related outside servicing agreement (the “outside special servicer”) may offer to sell to any person (or may offer to purchase) for cash such outside serviced whole loan in accordance with the terms of the related outside servicing agreement during such time as such outside serviced whole loan constitutes a defaulted mortgage loan qualifying for sale thereunder and, in connection with any such sale, the related outside special servicer is required to sell both the applicable outside serviced mortgage loan and the related outside serviced pari passu companion loan(s) and, if so provided in the related co-lender agreement or the Controlling PSA, any related subordinate companion loan(s), together as one defaulted loan. |
| ■ Directing Holder: | | The “Directing Holder” with respect to any mortgage loan or whole loan serviced under the BMO 2024-5C3 pooling and servicing agreement will be: ● except (i) with respect to an excluded mortgage loan, (ii) with respect to a serviced whole loan as to which the Controlling Note is held outside the issuing entity (sometimes referred to in this Term Sheet as a “serviced outside controlled whole loan”), and (iii) during any period that a Control Termination Event has occurred and is continuing, the Controlling Class Representative; and ● with respect to any serviced outside controlled whole loan (which may include a servicing shift whole loan or any other serviced whole loan with a controlling companion loan held outside the issuing entity), if and for so long as such holder is entitled under the related co-lender agreement to exercise consent rights similar to those entitled to be exercised by the Controlling Class Representative, the holder of the related Controlling Note (during any such period, the “outside controlling note holder”). |
THE INFORMATION IN THIS STRUCTURAL AND COLLATERAL TERM SHEET IS NOT COMPLETE AND MAY BE AMENDED PRIOR TO THE TIME OF SALE. THIS TERM SHEET IS NOT AN OFFER TO SELL THESE SECURITIES AND IT IS NOT A SOLICITATION OF AN OFFER TO BUY THESE SECURITIES IN ANY JURISDICTION WHERE THE OFFER OR SALE IS NOT PERMITTED. |
| | 23 | |
| Structural and Collateral Term Sheet | | BMO 2024-5C3 |
| Structural Overview |
| | The applicable directing holder (or equivalent party) with respect to any outside serviced mortgage loan will be, in general, (i) in the event the related Controlling Note is included in the subject outside securitization transaction, the controlling class representative (or equivalent entity) under the related outside servicing agreement, and (ii) in all other cases, the third party holder of the related Controlling Note or its representative (which may be a controlling class representative (or equivalent entity) under a separate securitization transaction to which such note has been transferred (if any)), as provided in the related co-lender agreement. An “excluded mortgage loan” is, if the Controlling Class Representative is the Directing Holder with respect to the subject mortgage loan, a mortgage loan or related whole loan with respect to which the Controlling Class Representative or the holder(s) of more than 50% of the Controlling Class (by certificate balance) is (or are) a Borrower Party (as defined in the Preliminary Prospectus). |
| ■ Controlling Class Representative: | | The “Controlling Class Representative” will be the controlling class certificateholder or other representative designated by at least a majority of the controlling class certificateholders by certificate balance. The “Controlling Class” is, as of any time of determination, the most subordinate class of the Control Eligible Certificates that has an outstanding certificate balance as notionally reduced by any Cumulative Appraisal Reduction Amount allocable to such class, at least equal to 25% of the initial certificate balance of that class of certificates; provided that (except under the circumstances set forth in the next proviso) if no such class meets the preceding requirement, then the Class F-RR certificates will be the controlling class; provided, further, however, that if, at any time, the aggregate outstanding certificate balance of the classes of Non-Vertically Retained Principal Balance Certificates senior to the Control Eligible Certificates has been reduced to zero (without regard to the allocation of any Cumulative Appraisal Reduction Amounts), then the “Controlling Class” will be the most subordinate class of Control Eligible Certificates with an outstanding certificate balance greater than zero (without regard to the allocation of any Cumulative Appraisal Reduction Amounts). The “Control Eligible Certificates” consist of the Class F-RR, Class G-RR and Class J-RR certificates. See “The Pooling and Servicing Agreement—Directing Holder” in the Preliminary Prospectus. No other class of certificates will be eligible to act as the controlling class or appoint a Controlling Class Representative. No person may exercise any of the rights and powers of the Controlling Class Representative with respect to an excluded mortgage loan. On the Closing Date, Eightfold Real Estate Capital Fund VI, L.P., is expected to (i) purchase the HRR Certificates and (ii) appoint itself (or an affiliate) as the initial Controlling Class Representative. Eightfold Real Estate Capital Fund VI, L.P. or an affiliate may acquire additional Certificates |
■ Control Termination Event: | | A “Control Termination Event” will: with respect to any mortgage loan either (a) occur when none of the classes of the Control Eligible Certificates has an outstanding certificate balance (as notionally reduced by any Cumulative Appraisal Reduction Amount then allocable to such class) that is at least equal to 25% of the initial certificate balance of that class of certificates or (b) be deemed to occur as described below; provided, however, that a Control Termination Event will in no event exist at any time that the certificate balance of each class of the Non-Vertically Retained Principal Balance Certificates senior to the Control Eligible Certificates (without regard to the allocation of Cumulative Appraisal Reduction Amounts) has been reduced to zero. With respect to excluded mortgage loans as to which the Controlling Class Representative would otherwise be the Directing Holder, a Control Termination Event will be deemed to exist. The holders of Certificates representing the majority of the certificate balance of the most senior class of Control Eligible Certificates whose certificate balance is notionally reduced to less than 25% of the initial certificate balance of that class as a result of an allocation of an Appraisal Reduction Amount or a Collateral Deficiency Amount, as applicable, to such class will have the right to challenge the Special Servicer’s Appraisal Reduction Amount determination or a Collateral Deficiency Amount determination, as applicable, and, at their sole expense, obtain a second appraisal for any serviced loan for which an Appraisal Reduction Event has occurred or as to which there exists a Collateral Deficiency Amount, under the circumstances described in the Preliminary Prospectus. |
■ Consultation Termination Event: | | A “Consultation Termination Event” with respect to any mortgage loan, (a) when none of the classes of Control Eligible Certificates has an outstanding certificate balance, without regard to the allocation of any Cumulative Appraisal Reduction Amount, that is equal to or greater than 25% of the initial certificate balance of that class of certificates or (b) be deemed to occur as described below; provided, however, that a Consultation Termination Event will in no event exist at any time that the certificate balance of each class of the Non-Vertically Retained Principal Balance Certificates senior to the Control Eligible Certificates (without regard to the allocation of Cumulative Appraisal Reduction Amounts) has been reduced to zero. With respect to excluded mortgage loans as to which the Controlling Class Representative would otherwise be a Consulting Party, a Consultation Termination Event will be deemed to exist. |
THE INFORMATION IN THIS STRUCTURAL AND COLLATERAL TERM SHEET IS NOT COMPLETE AND MAY BE AMENDED PRIOR TO THE TIME OF SALE. THIS TERM SHEET IS NOT AN OFFER TO SELL THESE SECURITIES AND IT IS NOT A SOLICITATION OF AN OFFER TO BUY THESE SECURITIES IN ANY JURISDICTION WHERE THE OFFER OR SALE IS NOT PERMITTED. |
| | 24 | |
| Structural and Collateral Term Sheet | | BMO 2024-5C3 |
| Structural Overview |
■ Control/Consultation Rights: | | With respect to any Serviced Loan, the applicable Directing Holder will be entitled to have consent and/or consultation rights under the BMO 2024-5C3 pooling and servicing agreement with respect to certain major decisions (including with respect to assumptions, waivers, certain loan modifications and workouts) and other matters with respect to each serviced loan. After the occurrence and during the continuance of a Control Termination Event, the consent rights of the Controlling Class Representative will terminate, and the Controlling Class Representative will retain non-binding consultation rights under the BMO 2024-5C3 pooling and servicing agreement with respect to certain major decisions and other matters with respect to the serviced mortgage loans, other than (i) any excluded mortgage loan and (ii) any serviced outside controlled whole loan. After the occurrence and during the continuance of a Consultation Termination Event, all of these rights of the Controlling Class Representative with respect to the applicable serviced loans will terminate. With respect to any serviced outside controlled whole loan (including any servicing shift whole loan for so long as it is serviced under the BMO 2024-5C3 pooling and servicing agreement), the holder of the related Controlling Note or its representative (which holder or representative will not be the Controlling Class Representative) will instead be entitled to exercise the above-described consent and consultation rights, to the extent provided under the related co-lender agreement. With respect to each outside serviced whole loan, the applicable outside controlling class representative or other related controlling noteholder pursuant to, and subject to the limitations set forth in, the related outside servicing agreement and the related co-lender agreement will have consent, consultation, approval and direction rights with respect to certain major decisions (including with respect to assumptions, waivers, loan modifications and workouts) regarding such outside serviced whole loan, as provided for in the related co-lender agreement and in the related outside servicing agreement. To the extent permitted under the related co-lender agreement, the Controlling Class Representative (so long as a Consultation Termination Event does not exist) may have certain consultation rights with respect to each outside serviced whole loan. See “Description of the Mortgage Pool—The Whole Loans” in the Preliminary Prospectus. |
| ■ Risk Retention Consultation Party: | | The “risk retention consultation parties”, with respect to any serviced mortgage loan or, if applicable, serviced whole loan will be the party selected by Bank of Montreal and the party selected by Citi Real Estate Funding Inc. Each risk retention consultation party will have certain non-binding consultation rights in certain circumstances, (i) for so long as no Consultation Termination Event is continuing, with respect to any specially serviced loan (other than any outside serviced mortgage loan), and (ii) during the continuance of a Consultation Termination Event, with respect to any mortgage loan (other than any outside serviced mortgage loan), as further described in the Preliminary Prospectus. Notwithstanding the foregoing, a risk retention consultation party will not have any consultation rights with respect to any mortgage loan that is an excluded RRCP mortgage loan with respect to such party. Bank of Montreal and Citi Real Estate Funding Inc. are expected to be appointed as the initial risk retention consultation parties. With respect to any risk retention consultation party, an “excluded RRCP mortgage loan” is a mortgage loan or whole loan with respect to which such risk retention consultation party, or the person(s) entitled to appoint such risk retention consultation party, is a Borrower Party. |
THE INFORMATION IN THIS STRUCTURAL AND COLLATERAL TERM SHEET IS NOT COMPLETE AND MAY BE AMENDED PRIOR TO THE TIME OF SALE. THIS TERM SHEET IS NOT AN OFFER TO SELL THESE SECURITIES AND IT IS NOT A SOLICITATION OF AN OFFER TO BUY THESE SECURITIES IN ANY JURISDICTION WHERE THE OFFER OR SALE IS NOT PERMITTED. |
| | 25 | |
| Structural and Collateral Term Sheet | | BMO 2024-5C3 |
| Structural Overview |
| ■ Termination of Special Servicer: | | At any time, the special servicer (but not any outside special servicer for any outside serviced whole loan) may be removed and replaced by the applicable Directing Holder, if any, with or without cause upon satisfaction of certain conditions specified in the BMO 2024-5C3 pooling and servicing agreement. After the occurrence and during the continuance of a Control Termination Event, the holders of at least 25% of the voting rights of the Certificates (without regard to the application of any Appraisal Reduction Amounts) may request a vote to replace the special servicer (with respect to all of the serviced loans other than any serviced outside controlled whole loan). The subsequent vote may result in the termination and replacement of the special servicer if, within 180 days of the initial request for that vote, the holders of (a) at least 66-2/3% of the voting rights allocable to the Certificates of those holders that voted on the matter (provided that holders representing the applicable Certificateholder Quorum voted on the matter), or (b) more than 50% of the voting rights of each class of Certificates that are Non-Reduced Certificates vote affirmatively to so replace. “Non-Reduced Certificates” means each class of Principal Balance Certificates that has an outstanding certificate balance as may be notionally reduced by any Appraisal Reduction Amounts allocated to that class, equal to or greater than 25% of an amount equal to the initial certificate balance of that class of certificates minus all principal payments made on such class of certificates. Notwithstanding the foregoing, but subject to the discussion in the next paragraph, solely with respect to a serviced outside controlled whole loan (including any servicing shift whole loan, for so long as it is serviced pursuant to the BMO 2024-5C3 pooling and servicing agreement), only the holder of the related Controlling Note or its representative may terminate the special servicer without cause (solely with respect to the related whole loan) and appoint a replacement special servicer for that whole loan. If the operating advisor determines, in its sole discretion exercised in good faith, that (1) the special servicer has failed to comply with the servicing standard and (2) a replacement of the special servicer would be in the best interest of the certificateholders and the Uncertificated VRR Interest owner (as a collective whole), the operating advisor will have the right to recommend the replacement of the special servicer with respect to the serviced loans, resulting in a solicitation of a certificateholder vote. The subsequent vote may result in the termination and replacement of the special servicer if, within 180 days of the initial request for that vote, the holders of at least a majority of the aggregate outstanding principal balance of the Certificates of those holders that voted on the matter (provided that holders representing the applicable Certificateholder Quorum vote on the matter) vote affirmatively to so replace. “Certificateholder Quorum” means a quorum that: (a) for purposes of a vote to terminate and replace the special servicer or the asset representations reviewer at the request of the holders of Certificates evidencing not less than 25% of the voting rights (without regard to the application of any Appraisal Reduction Amounts), consists of the holders of Certificates evidencing at least 50% of the voting rights (taking into account the allocation of any Appraisal Reduction Amounts to notionally reduce the certificate balances of the respective classes of Non-Vertically Retained Principal Balance Certificates) of all of the Certificates, on an aggregate basis; and (b) for purposes of a vote to terminate and replace the special servicer based on a recommendation of the operating advisor, consists of the holders of Certificates evidencing at least 20% of the aggregate of the outstanding principal balances of all Certificates, with such quorum including at least (3) holders and/or beneficial owners of Certificates that are not “affiliated” (as defined in Regulation RR) with each other. The related outside special servicer under each outside servicing agreement generally may be (or, if the applicable outside servicing agreement has not yet been executed, it is anticipated that such outside special servicer may be) replaced by the related outside controlling class representative (or an equivalent party), or the vote of the requisite holders of certificates issued, under the applicable outside servicing agreement (depending on whether or not the equivalent of a control termination event or a consultation termination event exists under that outside servicing agreement) or by any applicable other controlling noteholder under the related co-lender agreement in a manner generally similar to the manner in which the special servicer may be replaced under the BMO 2024-5C3 pooling and servicing agreement as described above in this “Termination of Special Servicer” section (although there will be differences, in particular as regards certificateholder votes and the timing of when an outside special servicer may be terminated based on the recommendation of an operating advisor). If the special servicer, to its knowledge, becomes a Borrower Party with respect to a mortgage loan, the special servicer will not be permitted to act as special servicer with respect to that mortgage loan. Subject to certain limitations described in the Preliminary Prospectus, any applicable Directing Holder will be entitled to appoint a replacement special servicer for that mortgage loan. If there is no applicable Directing Holder or if the applicable Directing Holder does not take action to appoint a |
THE INFORMATION IN THIS STRUCTURAL AND COLLATERAL TERM SHEET IS NOT COMPLETE AND MAY BE AMENDED PRIOR TO THE TIME OF SALE. THIS TERM SHEET IS NOT AN OFFER TO SELL THESE SECURITIES AND IT IS NOT A SOLICITATION OF AN OFFER TO BUY THESE SECURITIES IN ANY JURISDICTION WHERE THE OFFER OR SALE IS NOT PERMITTED. |
| | 26 | |
| Structural and Collateral Term Sheet | | BMO 2024-5C3 |
| Structural Overview |
| | replacement special servicer within the requisite time period, a replacement special servicer will be appointed in the manner specified in the BMO 2024-5C3 pooling and servicing agreement. |
| ■ Voting Rights: | | At all times during the term of the BMO 2024-5C3 pooling and servicing agreement, the voting rights for the Certificates (the “voting rights”) will be allocated among the respective classes of certificateholders in the following percentages: (1) 1% in the aggregate in the case of the respective classes of the Class X Certificates, allocated pro rata based upon their respective notional amounts as of the date of determination (for so long as the notional amount of at least one class of the Class X Certificates is greater than zero), and (2) in the case of any class of Non-Vertically Retained Principal Balance Certificates, a percentage equal to the product of 99% (or, if the notional amounts of all classes of the Class X Certificates have been reduced to zero, 100%) and a fraction, the numerator of which is equal to the certificate balance of such class of Non-Vertically Retained Principal Balance Certificates as of the date of determination, and the denominator of which is equal to the aggregate of the certificate balances of all classes of the Non-Vertically Retained Principal Balance Certificates, in each case, as of the date of determination, provided, that in certain circumstances described under “The Pooling and Servicing Agreement” in the Preliminary Prospectus, voting rights will only be exercisable by holders of Certificates that are Non-Reduced Certificates and/or may otherwise be exercisable or allocated in a manner that takes into account the allocation of Appraisal Reduction Amounts. The voting rights of any class of certificates are required to be allocated among certificateholders of such class in proportion to their respective percentage interests. The Class R certificates and the Uncertificated VRR Interest will not be entitled to any voting rights. |
| ■ Servicing Compensation: | | Modification Fees: Certain fees resulting from modifications, amendments, waivers or other changes to the terms of the loan documents, as more fully described in the Preliminary Prospectus, will be used to offset expenses on the related serviced mortgage loan (i.e. reimburse the trust for certain expenses, including unreimbursed advances and interest on unreimbursed advances previously incurred (other than special servicing fees, workout fees and liquidation fees) on the related serviced mortgage loan but not yet reimbursed to the trust or servicers or to pay expenses (other than special servicing fees, workout fees and liquidation fees) that are still outstanding in each case unless as part of the written modification the related borrower is required to pay these amounts on a going forward basis or in the future). Any excess modification fees not so applied to offset expenses will be available as compensation to the master servicer and/or special servicer. Within any prior 12-month period, all such excess modification fees earned by the master servicer or by the special servicer (after taking into account the offset described below applied during such 12-month period) with respect to any serviced mortgage loan will be subject to a cap equal to the greater of (i) 1% of the outstanding principal balance of such mortgage loan after giving effect to such transaction and (ii) $25,000. All excess modification fees earned by the special servicer will be required to offset any future workout fees or liquidation fees payable with respect to the related serviced mortgage loan or related REO property; provided, that if the serviced mortgage loan ceases being a corrected loan, and is subject to a subsequent modification, any excess modification fees earned by the special servicer prior to such serviced mortgage loan ceasing to be a corrected loan will no longer be offset against future liquidation fees and workout fees unless such serviced mortgage loan ceased to be a corrected loan within 18 months of it becoming a modified mortgage loan. Penalty Fees: All late fees and default interest will first be used to reimburse certain expenses previously incurred with respect to the related mortgage loan (including special servicing fees, workout fees and liquidation fees) but not yet reimbursed to the trust, the master servicer or the special servicer or to pay certain expenses (including special servicing fees, workout fees and liquidation fees) that are still outstanding on the related mortgage loan, and any excess received with respect to a serviced loan will be paid to the master servicer (for penalty fees accrued while a non-specially serviced loan) and the special servicer (for penalty fees accrued while a specially serviced loan). To the extent any amounts reimbursed out of penalty charges are subsequently recovered on a related serviced loan, they will be paid to the master servicer or special servicer who would have been entitled to the related penalty charges that were previously used to reimburse such expense. Liquidation / Workout Fees: Liquidation fees will be calculated at the lesser of (a) 1.0% or (b) with respect to any serviced mortgage loan (or related serviced whole loan, if applicable) or related REO Property, such lesser rate as would result in a liquidation fee of $1,000,000, for each serviced loan that is a specially serviced loan and any REO property, subject in any case to a minimum liquidation |
THE INFORMATION IN THIS STRUCTURAL AND COLLATERAL TERM SHEET IS NOT COMPLETE AND MAY BE AMENDED PRIOR TO THE TIME OF SALE. THIS TERM SHEET IS NOT AN OFFER TO SELL THESE SECURITIES AND IT IS NOT A SOLICITATION OF AN OFFER TO BUY THESE SECURITIES IN ANY JURISDICTION WHERE THE OFFER OR SALE IS NOT PERMITTED. |
| | 27 | |
| Structural and Collateral Term Sheet | | BMO 2024-5C3 |
| Structural Overview |
| | fee of $25,000. For any serviced loan that is a corrected loan, workout fees will be calculated at the lesser of (a) 1.0% and (b) such lower rate as would result in a workout fee of $1,000,000 when applied to each expected payment of principal and interest (other than (i) default interest and (ii) any “excess interest” accrued after the related anticipated repayment date on any mortgage loan with an anticipated repayment date) on the related serviced loan (or related serviced whole loan, if applicable) from the date such serviced loan becomes a corrected loan through and including the then related maturity date, subject in any case to a minimum workout fee of $25,000. Notwithstanding the foregoing, in connection with a maturity default, no liquidation or workout fee will be payable in connection with a payoff or refinancing of the related serviced loan within 90 days of the maturity default, but the special servicer may collect and retain appropriate fees from the related borrower in connection with the subject liquidation or workout. In the case of an outside serviced whole loan, calculation of the foregoing amounts payable to the related outside servicer or outside special servicer may be different than as described above. For example, the extent to which modification fees and penalty fees are applied to offset expenses may be different and liquidation fees and workout fees may be subject to different caps or no caps. |
| ■ Operating Advisor: | | The operating advisor will, in general and under certain circumstances described in the Preliminary Prospectus, have the following rights and responsibilities with respect to the serviced mortgage loans: ● are viewing the actions of the special servicer with respect to specially serviced loans and with respect to certain major decisions regarding non-specially serviced loans as to which the operating advisor has consultation rights; ● reviewing reports provided by the special servicer to the extent set forth in the BMO 2024-5C3 pooling and servicing agreement; ● reviewing for accuracy certain calculations made by the special servicer; ● issuing an annual report generally setting forth, among other things, its assessment of whether the special servicer is performing its duties in compliance with the servicing standard and the BMO 2024-5C3 pooling and servicing agreement and identifying any material deviations therefrom; ● recommending the replacement of the special servicer if the operating advisor determines, in its sole discretion exercised in good faith, that (1) the special servicer has failed to comply with the servicing standard and (2) a replacement of the special servicer would be in the best interest of the certificateholders and the owners of the Uncertificated VRR Interest (as a collective whole); and ● after the occurrence and during the continuance of an Operating Advisor Consultation Trigger Event, consulting on a non-binding basis with the special servicer with respect to certain major decisions (and such other matters as are set forth in the BMO 2024-5C3 pooling and servicing agreement) in respect of the applicable serviced mortgage loan(s) and/or related companion loan(s). An “Operating Advisor Consultation Trigger Event” will occur when the aggregate outstanding certificate balance of the HRR Certificates (as notionally reduced by any Cumulative Appraisal Reduction Amounts then allocable to the HRR Certificates) is 25% or less of the initial aggregate certificate balance of the HRR Certificates. With respect to excluded mortgage loans, an Operating Advisor Consultation Trigger Event will be deemed to exist. Notwithstanding the foregoing, the operating advisor will generally have no obligations or consultation rights as operating advisor under the BMO 2024-5C3 pooling and servicing agreement with respect to any outside serviced mortgage loan or any related REO property. The operating advisor will be subject to termination and replacement if the holders of at least 15% of the voting rights of Non-Reduced Certificates vote to terminate and replace the operating advisor and such termination and replacement is affirmatively voted for by the holders of more than 50% of the voting rights allocable to the Non-Reduced Certificates of those holders that exercise their right to vote (provided that holders entitled to exercise at least 50% of the voting rights allocable to the Non-Reduced Certificates exercise their right to vote within 180 days of the initial request for a vote). The holders initiating such vote will be responsible for the fees and expenses in connection with the vote and replacement. See “The Pooling and Servicing Agreement—Operating Advisor” in the Preliminary Prospectus. |
THE INFORMATION IN THIS STRUCTURAL AND COLLATERAL TERM SHEET IS NOT COMPLETE AND MAY BE AMENDED PRIOR TO THE TIME OF SALE. THIS TERM SHEET IS NOT AN OFFER TO SELL THESE SECURITIES AND IT IS NOT A SOLICITATION OF AN OFFER TO BUY THESE SECURITIES IN ANY JURISDICTION WHERE THE OFFER OR SALE IS NOT PERMITTED. |
| | 28 | |
| Structural and Collateral Term Sheet | | BMO 2024-5C3 |
| Structural Overview |
| ■ Asset Representations Reviewer: | | The asset representations reviewer will be required to review certain delinquent mortgage loans after a specified delinquency threshold has been exceeded and the required percentage of certificateholders vote to direct a review of such delinquent mortgage loans. An asset review will occur when either (1) mortgage loans with an aggregate outstanding principal balance of 25% or more of the aggregate outstanding principal balance of all of the mortgage loans (including any REO mortgage loans) held by the issuing entity as of the end of the applicable collection period are at least 60 days delinquent in respect of their related monthly payments or balloon payment, if any (for purposes of this paragraph, “delinquent loans”) or (2) at least 15 mortgage loans are delinquent loans as of the end of the applicable collection period and the aggregate outstanding principal balance of such delinquent loans constitutes at least 20% of the aggregate outstanding principal balance of all of the mortgage loans (including any REO mortgage loans) held by the issuing entity as of the end of the applicable collection period. The asset representations reviewer may be terminated and replaced without cause. Upon (i) the written direction of certificateholders evidencing not less than 25% of the voting rights requesting a vote to terminate and replace the asset representations reviewer with a proposed successor asset representations reviewer that is an eligible asset representations reviewer, and (ii) payment by such holders to the certificate administrator of the reasonable fees and expenses to be incurred by the certificate administrator in connection with administering such vote, the certificate administrator will promptly provide notice of such request to all certificateholders and the asset representations reviewer by posting such notice on its internet website, and by mailing such notice to all certificateholders and the asset representations reviewer. Upon the affirmative vote of certificateholders evidencing at least 75% of the voting rights allocable to those holders that exercise their right to vote (provided that holders representing the applicable Certificateholder Quorum exercise their right to vote within 180 days of the initial request for a vote), the trustee will be required to terminate all of the rights and obligations of the asset representations reviewer under the BMO 2024-5C3 pooling and servicing agreement by written notice to the asset representations reviewer, and the proposed successor asset representations reviewer will be appointed. See “The Pooling and Servicing Agreement—The Asset Representations Reviewer” in the Preliminary Prospectus. |
| ■ Dispute Resolution Provisions: | | The mortgage loan sellers will be subject to the dispute resolution provisions set forth in the BMO 2024-5C3 pooling and servicing agreement to the extent those provisions are triggered with respect to any mortgage loan sold to the depositor by a mortgage loan seller and such mortgage loan seller will be obligated under the related mortgage loan purchase agreement to comply with all applicable provisions and to take part in any mediation or arbitration proceedings that may result. Generally, in the event that a Repurchase Request (as defined in the Preliminary Prospectus) with respect to a mortgage loan is not “Resolved” (as defined below) within 180 days after the related mortgage loan seller receives such Repurchase Request, then the enforcing servicer will be required to send a notice to the “Initial Requesting Certificateholder” (if any) indicating the enforcing servicer’s intended course of action with respect to the Repurchase Request. If (a) the enforcing servicer’s intended course of action with respect to the Repurchase Request does not involve pursuing further action to exercise rights against the applicable mortgage loan seller with respect to the Repurchase Request and the Initial Requesting Certificateholder, if any, or any other certificateholder or certificate owner of Certificates (other than the holder of Class VRR certificates) wishes to exercise its right to refer the matter to mediation (including nonbinding arbitration) or arbitration, or (b) the enforcing servicer’s intended course of action is to pursue further action to exercise rights against the related mortgage loan seller with respect to the Repurchase Request but the Initial Requesting Certificateholder, if any, or any other certificateholder or certificate owner of Certificates (other than the holder of Class VRR certificates) does not agree with the dispute resolution method selected by the enforcing servicer, then the Initial Requesting Certificateholder, if any, or such other certificateholder or certificate owner may deliver a written notice to the enforcing servicer indicating its intent to exercise its right to refer the matter to either mediation or arbitration. In addition, any other certificateholder or certificate owner of Certificates may deliver, within the time frame provided in the BMO 2024-5C3 pooling and servicing agreement, a written notice requesting the right to participate in any dispute resolution consultation that is conducted by the enforcing servicer following the enforcing servicer’s receipt of the notice described in the preceding sentence. “Resolved” means, with respect to a Repurchase Request, (i) that any material breach of representations and warranties or a material document defect has been cured, (ii) the related mortgage loan has been repurchased in accordance with the related mortgage loan purchase agreement, (iii) a mortgage loan has been substituted for the related mortgage loan in accordance with the related mortgage loan purchase agreement, (iv) the applicable mortgage loan seller has made a “loss of value payment”, (v) a contractually binding agreement has been entered into between the enforcing servicer, on behalf of the issuing entity, and the related mortgage loan seller that settles the related mortgage loan seller’s obligations under the related mortgage loan purchase agreement, or (vi) the related mortgage loan is no longer property of the issuing entity as a result of a sale or other disposition in accordance with the BMO 2024-5C3 pooling and servicing agreement. In the event a |
THE INFORMATION IN THIS STRUCTURAL AND COLLATERAL TERM SHEET IS NOT COMPLETE AND MAY BE AMENDED PRIOR TO THE TIME OF SALE. THIS TERM SHEET IS NOT AN OFFER TO SELL THESE SECURITIES AND IT IS NOT A SOLICITATION OF AN OFFER TO BUY THESE SECURITIES IN ANY JURISDICTION WHERE THE OFFER OR SALE IS NOT PERMITTED. |
| | 29 | |
| Structural and Collateral Term Sheet | | BMO 2024-5C3 |
| Structural Overview |
| | Repurchase Request is Resolved in a manner contemplated by clause (v) described above, in the event the enforcing servicer determines in its reasonable judgment that such a contractually binding agreement to be entered into between the enforcing servicer, on behalf of the issuing entity, and the related mortgage loan seller could reasonably be expected to result in losses or other shortfalls on or in respect of the related mortgage loan directly attributable to the contractually binding agreement, then the enforcing Servicer will be required to obtain the consent of the applicable Directing Holder before entering into such contractually binding agreement. See “The Pooling and Servicing Agreement—Dispute Resolution Provisions” in the Preliminary Prospectus. |
| ■ Liquidated Loan Waterfall: | | Upon liquidation of any mortgage loan, all net liquidation proceeds related to the mortgage loan (but not any related companion loan) will be applied (after allocation to offset certain advances and expenses) so that amounts allocated as a recovery of accrued and unpaid interest will not, in the first instance, include any delinquent interest that was not advanced as a result of Appraisal Reduction Amounts or interest that accrued on any junior note(s) if such mortgage loan is an AB Modified Loan. After the adjusted interest amount is so allocated, any remaining liquidation proceeds will be allocated to pay principal on the mortgage loan until the unpaid principal amount of the mortgage loan has been reduced to zero. Any remaining liquidation proceeds will then be allocated to pay delinquent interest that was not advanced as a result of Appraisal Reduction Amounts and any interest that accrued on any junior note(s) if such mortgage loan is an AB Modified Loan. |
| ■ Credit Risk Retention: | | This securitization transaction will be subject to the credit risk retention rules of Section 15G of the Securities Exchange Act of 1934, as amended. An economic interest in the credit risk of the mortgage loans in this transaction is expected to be retained pursuant to risk retention regulations (as codified at 12 CFR Part 244) promulgated under Section 15G (“Regulation RR”), as a combination of (A) an “eligible vertical interest” in the form of the Combined VRR Interest and (B) an “eligible horizontal residual interest” in the form of the HRR Certificates. Bank of Montreal will act as retaining sponsor under Regulation RR for this securitization transaction and is expected, on the Closing Date, to partially satisfy its risk retention obligation through (i) the purchase by a third party purchaser of the HRR Certificates and (ii) the acquisition by Citi Real Estate Funding Inc. (as an originator) of a portion of the Combined VRR Interest. For a further discussion of the manner in which the credit risk retention requirements are expected to be satisfied by Bank of Montreal, as retaining sponsor for this securitization transaction, see “Credit Risk Retention” in the Preliminary Prospectus. |
| ■ The Combined VRR Interest Prepayment Premiums and Yield Maintenance Charges: | | On each Distribution Date, the Vertically Retained Percentage of each yield maintenance charge and prepayment premium collected on the mortgage loans during the related collection period (or, in the case of an outside serviced mortgage loan, that accompanied a principal prepayment included in the aggregate available funds for such Distribution Date) will be required to be distributed to the holders of the Combined VRR Interest. |
| ■ Appraisal Reduction Amounts: | | On each Distribution Date, the Vertically Retained Percentage of any Appraisal Reduction Amounts will be allocated to the Combined VRR Interest to notionally reduce (to not less than zero) the principal balance thereof. |
| ■ Investor Communications: | | The certificate administrator is required to include on any Form 10–D any request received from a certificateholder to communicate with other certificateholders related to certificateholders exercising their rights under the terms of the BMO 2024-5C3 pooling and servicing agreement. Any certificateholder wishing to communicate with other certificateholders regarding the exercise of its rights under the terms of the BMO 2024-5C3 pooling and servicing agreement will be able to deliver a written request signed by an authorized representative of the requesting investor to the certificate administrator. |
| ■ Deal Website: | | The certificate administrator will maintain a deal website including, but not limited to: ● all special notices delivered. ● summaries of final asset status reports. ● all appraisals in connection with an appraisal reduction plus any subsequent appraisal updates. ● an “Investor Q&A Forum” and a voluntary investor registry. |
| ■ Cleanup Call: | | On any Distribution Date on which the aggregate unpaid principal balance of the mortgage loans (including mortgage loans as to which the related mortgaged properties have become REO properties) remaining in the issuing entity is less than 1% of the aggregate principal balance of the pool of mortgage loans as of the Cut-off Date (excluding for the purposes of this calculation, the unpaid principal balance of any mortgage loan with an anticipated repayment date, but in such case only if the option described above is exercised after the Distribution Date related to the collection period in which the corresponding anticipated repayment date occurs), certain specified persons will have the option to purchase all of the remaining mortgage loans (and all property acquired through exercise of remedies in respect of any mortgage loan) at the price specified in the Preliminary Prospectus. |
THE INFORMATION IN THIS STRUCTURAL AND COLLATERAL TERM SHEET IS NOT COMPLETE AND MAY BE AMENDED PRIOR TO THE TIME OF SALE. THIS TERM SHEET IS NOT AN OFFER TO SELL THESE SECURITIES AND IT IS NOT A SOLICITATION OF AN OFFER TO BUY THESE SECURITIES IN ANY JURISDICTION WHERE THE OFFER OR SALE IS NOT PERMITTED. |
| | 30 | |
| Structural and Collateral Term Sheet | | BMO 2024-5C3 |
| Structural Overview |
| | Exercise of the option will terminate the issuing entity and retire the then outstanding certificates and the Uncertificated VRR Interest. If the aggregate certificate balances of the Class A-1, Class A-3, Class A-S, Class B, Class C, Class D and Class E certificates and the notional amounts of the Class X-A, Class X-B and Class X-D certificates have been reduced to zero and if the master servicer has received from the remaining certificateholders the payment specified in the BMO 2024-5C3 pooling and servicing agreement, the issuing entity could also be terminated in connection with an exchange of all the then-outstanding certificates (excluding the Class R certificates) and the Uncertificated VRR Interest for the mortgage loans remaining in the issuing entity, as further described under “The Pooling and Servicing Agreement—Optional Termination; Optional Mortgage Loan Purchase” in the Preliminary Prospectus. |
The Offered Certificates involve certain risks and may not be suitable for all investors. For information regarding certain risks associated with an investment in the Offered Certificates, see “Summary of Risk Factors” and “Risk Factors” in the Preliminary Prospectus. Capitalized terms used but not otherwise defined in this Term Sheet have the respective meanings assigned to those terms in the Preliminary Prospectus.
THE INFORMATION IN THIS STRUCTURAL AND COLLATERAL TERM SHEET IS NOT COMPLETE AND MAY BE AMENDED PRIOR TO THE TIME OF SALE. THIS TERM SHEET IS NOT AN OFFER TO SELL THESE SECURITIES AND IT IS NOT A SOLICITATION OF AN OFFER TO BUY THESE SECURITIES IN ANY JURISDICTION WHERE THE OFFER OR SALE IS NOT PERMITTED. |
| | 31 | |
| Structural and Collateral Term Sheet | | BMO 2024-5C3 |
| No. 1 – Tysons Corner Center |
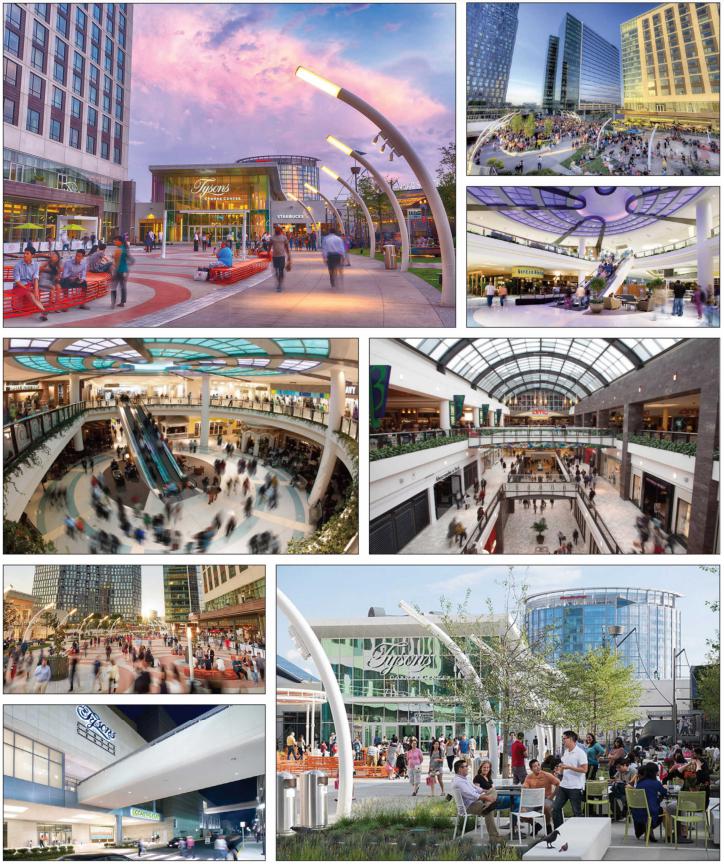
THE INFORMATION IN THIS STRUCTURAL AND COLLATERAL TERM SHEET IS NOT COMPLETE AND MAY BE AMENDED PRIOR TO THE TIME OF SALE. THIS TERM SHEET IS NOT AN OFFER TO SELL THESE SECURITIES AND IT IS NOT A SOLICITATION OF AN OFFER TO BUY THESE SECURITIES IN ANY JURISDICTION WHERE THE OFFER OR SALE IS NOT PERMITTED. |
| | 32 | |
| Structural and Collateral Term Sheet | | BMO 2024-5C3 |
| No. 1 – Tysons Corner Center |

THE INFORMATION IN THIS STRUCTURAL AND COLLATERAL TERM SHEET IS NOT COMPLETE AND MAY BE AMENDED PRIOR TO THE TIME OF SALE. THIS TERM SHEET IS NOT AN OFFER TO SELL THESE SECURITIES AND IT IS NOT A SOLICITATION OF AN OFFER TO BUY THESE SECURITIES IN ANY JURISDICTION WHERE THE OFFER OR SALE IS NOT PERMITTED. |
| | 33 | |
| Structural and Collateral Term Sheet | | BMO 2024-5C3 |
| No. 1 – Tysons Corner Center |
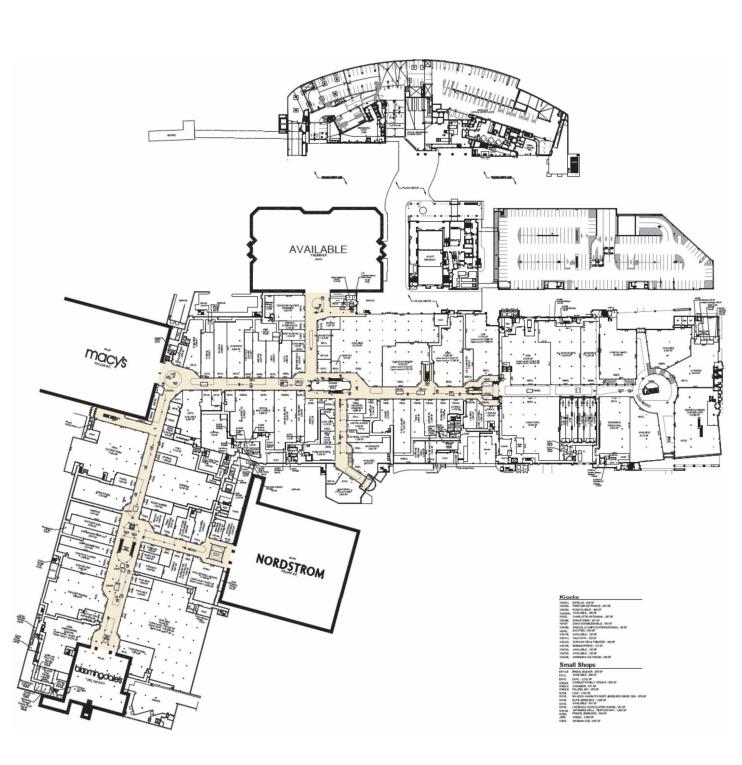
THE INFORMATION IN THIS STRUCTURAL AND COLLATERAL TERM SHEET IS NOT COMPLETE AND MAY BE AMENDED PRIOR TO THE TIME OF SALE. THIS TERM SHEET IS NOT AN OFFER TO SELL THESE SECURITIES AND IT IS NOT A SOLICITATION OF AN OFFER TO BUY THESE SECURITIES IN ANY JURISDICTION WHERE THE OFFER OR SALE IS NOT PERMITTED. |
| | 34 | |
| Structural and Collateral Term Sheet | | BMO 2024-5C3 |
| No. 1 – Tysons Corner Center |

THE INFORMATION IN THIS STRUCTURAL AND COLLATERAL TERM SHEET IS NOT COMPLETE AND MAY BE AMENDED PRIOR TO THE TIME OF SALE. THIS TERM SHEET IS NOT AN OFFER TO SELL THESE SECURITIES AND IT IS NOT A SOLICITATION OF AN OFFER TO BUY THESE SECURITIES IN ANY JURISDICTION WHERE THE OFFER OR SALE IS NOT PERMITTED. |
| | 35 | |
| Structural and Collateral Term Sheet | | BMO 2024-5C3 |
| No. 1 – Tysons Corner Center |
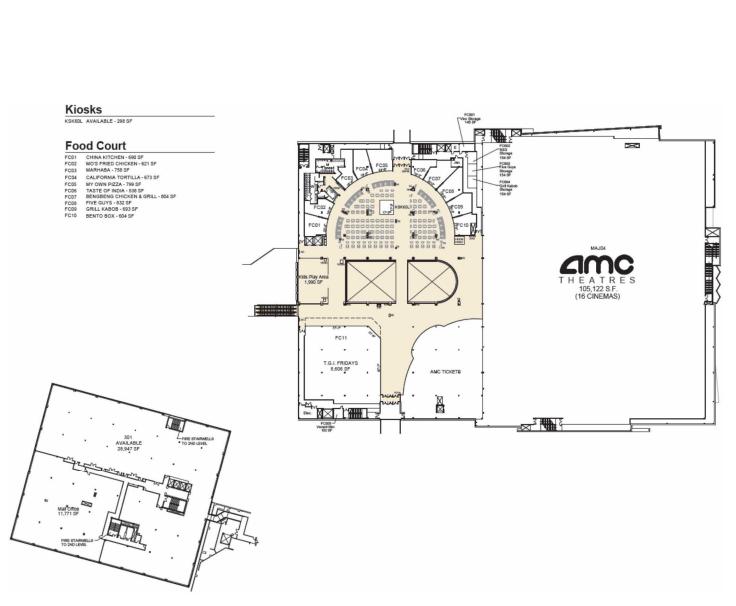
THE INFORMATION IN THIS STRUCTURAL AND COLLATERAL TERM SHEET IS NOT COMPLETE AND MAY BE AMENDED PRIOR TO THE TIME OF SALE. THIS TERM SHEET IS NOT AN OFFER TO SELL THESE SECURITIES AND IT IS NOT A SOLICITATION OF AN OFFER TO BUY THESE SECURITIES IN ANY JURISDICTION WHERE THE OFFER OR SALE IS NOT PERMITTED. |
| | 36 | |
| Structural and Collateral Term Sheet | | BMO 2024-5C3 |
| No. 1 – Tysons Corner Center |
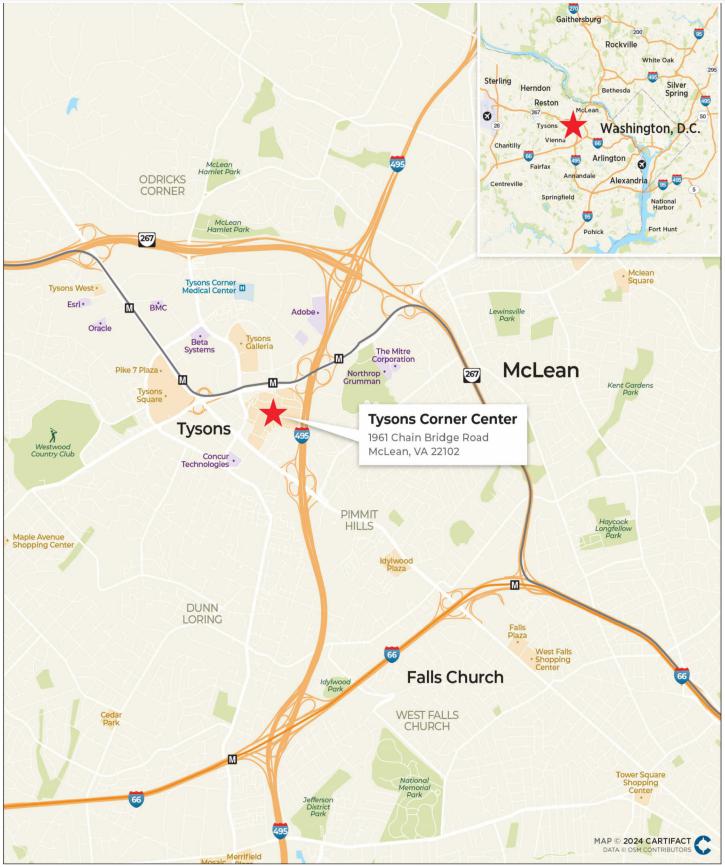
THE INFORMATION IN THIS STRUCTURAL AND COLLATERAL TERM SHEET IS NOT COMPLETE AND MAY BE AMENDED PRIOR TO THE TIME OF SALE. THIS TERM SHEET IS NOT AN OFFER TO SELL THESE SECURITIES AND IT IS NOT A SOLICITATION OF AN OFFER TO BUY THESE SECURITIES IN ANY JURISDICTION WHERE THE OFFER OR SALE IS NOT PERMITTED. |
| | 37 | |
| Structural and Collateral Term Sheet | | BMO 2024-5C3 |
| No. 1 – Tysons Corner Center |
| Mortgage Loan Information | | Property Information |
| Mortgage Loan Seller: | GACC, BMO, GSMC | | Single Asset / Portfolio: | Single Asset |
| Original Principal Balance(1): | $73,960,000 | | Title: | Fee/Leasehold |
| Cut-off Date Principal Balance(1): | $73,960,000 | | Property Type – Subtype: | Retail – Super Regional Mall |
| % of IPB: | 8.2% | | Net Rentable Area (SF): | 1,793,638 |
| Loan Purpose: | Refinance | | Location: | McLean, VA |
| Borrower: | Tysons Corner Property Holdings LLC and Tysons Corner Holdings LLC | | Year Built / Renovated: | 1968 / 1989, 2005 |
| Borrower Sponsors: | The Macerich Partnership, L.P. and Alaska Permanent Fund Corporation | | Occupancy: | 95.4% |
| Interest Rate: | 6.60060% | | Occupancy Date: | 11/1/2023 |
| Note Date: | 12/4/2023 | | 4th Most Recent NOI (As of): | $86,076,177 (12/31/2020) |
| Maturity Date: | 12/6/2028 | | 3rd Most Recent NOI (As of): | $83,536,276 (12/31/2021) |
| Interest-only Period: | 60 months | | 2nd Most Recent NOI (As of): | $84,604,983 (12/31/2022) |
| Original Term: | 60 months | | Most Recent NOI (As of)(5): | $85,531,322 (TTM 9/30/2023) |
| Original Amortization Term: | None | | UW Economic Occupancy: | 92.2% |
| Amortization Type: | Interest Only | | UW Revenues: | $140,618,916 |
| Call Protection(2): | L(26),DorYM1(27),O(7) | | UW Expenses: | $43,516,369 |
| Lockbox / Cash Management: | Hard / Springing | | UW NOI(5): | $97,102,547 |
| Additional Debt(1): | Yes | | UW NCF: | $94,950,181 |
| Additional Debt Balance(1): | $636,040,000 | | Appraised Value / Per SF: | $1,800,000,000 / $1,004 |
| Additional Debt Type(1): | Pari Passu | | Appraisal Date: | 10/5/2023 |
| | | | | |
| Escrows and Reserves(3) | | Financial Information(1) |
| | Initial | Monthly | Initial Cap | | Cut-off Date Loan / SF: | $396 | |
| Taxes: | $0 | Springing | N/A | | Maturity Date Loan / SF: | $396 | |
| Insurance: | $0 | Springing | N/A | | Cut-off Date LTV: | 39.4% | |
| Replacement Reserves: | $0 | Springing | $896,819 | | Maturity Date LTV: | 39.4% | |
| TI/LC | $0 | Springing | $3,587,276 | | UW NCF DSCR: | 2.00x | |
| Other(4) | $39,775,125 | $0 | N/A | | UW NOI Debt Yield: | 13.7% | |
| | | | | | | | |
| | | | | | | |
| Sources and Uses |
| Sources | Proceeds | % of Total | | Uses | Proceeds | % of Total |
| Whole Loan(1) | $710,000,000 | 100.0% | | Loan Payoff | $666,692,845 | 93.9 | % |
| | | | | Reserves | 39,775,125 | 5.6 | % |
| | | | | Closing Costs | 3,532,030 | 0.5 | % |
| Total Sources | $710,000,000 | 100.0% | | Total Uses | $710,000,000 | 100.0 | % |
| (1) | The Tysons Corner Center Mortgage Loan (as defined below) is part of the Tysons Corner Center Whole Loan (as defined below) which is comprised of eighteen pari passu notes with an aggregate original principal balance and Cut-off Date Balance of $710,000,000. The Tysons Corner Center Whole Loan was co-originated by Deutsche Bank AG, New York Branch (“DBNY”), JPMorgan Chase Bank, National Association (“JPMCB”), Bank of Montreal (“BMO”), and Goldman Sachs Bank USA (“GSBI”). The Financial Information in the chart above is based on the aggregate outstanding principal balance as of the Cut-off Date of the Tysons Corner Center Whole Loan. |
| (2) | The lockout period will be at least 26 payment dates beginning with and including the first payment date on January 6, 2024. Defeasance or voluntary prepayment with yield maintenance of the Tysons Corner Center Whole Loan in full (but not in part) is permitted at any time following the earlier to occur of (i) December 6, 2026 or (ii) the date that is two years from the closing date of the securitization that includes the last pari passu note to be securitized. The assumed lockout period of 26 payments is based on the expected BMO 2024-5C3 securitization trust closing date in February 2024. The actual lockout period may be longer. |
| (3) | See “Escrows and Reserves” below for further discussion of reserve information. |
| (4) | Other Reserves consists of an Outstanding TI/LC Reserve (Upfront: $30,769,199) and a Gap Rent Reserve (Upfront: $9,005,926). See “Escrows and Reserves” below. |
| (5) | The main driver in the increase from Most Recent NOI to UW NOI is recent lease up. |
The Loan. The largest mortgage loan (the “Tysons Corner Center Mortgage Loan”) is part of a whole loan (the “Tysons Corner Center Whole Loan”) that is evidenced by eighteen pari passu promissory notes in the aggregate original principal amount of $710,000,000 and secured by the borrowers’ respective fee and leasehold interests in a 1,793,638 SF super regional mall located at 1961 Chain Bridge Road in McLean, Virginia (the “Tysons Corner Center Property”). The Tysons
THE INFORMATION IN THIS STRUCTURAL AND COLLATERAL TERM SHEET IS NOT COMPLETE AND MAY BE AMENDED PRIOR TO THE TIME OF SALE. THIS TERM SHEET IS NOT AN OFFER TO SELL THESE SECURITIES AND IT IS NOT A SOLICITATION OF AN OFFER TO BUY THESE SECURITIES IN ANY JURISDICTION WHERE THE OFFER OR SALE IS NOT PERMITTED. |
| | 38 | |
| Structural and Collateral Term Sheet | | BMO 2024-5C3 |
| No. 1 – Tysons Corner Center |
Corner Center Whole Loan was co-originated on December 4, 2023 by DBNY, JPMCB, BMO and GSBI and accrues interest at a fixed rate of 6.60060% per annum. The Tysons Corner Center Mortgage Loan is evidenced by the non-controlling Notes A-1-5, A-2-3-1, A-4-2, and A-4-3 with an aggregate original principal balance of $73,960,000. GACC is selling Note A-1-5 with an original principal balance of $10,000,000, GSMC is selling Note A-2-3-1 with an original principal balance of $10,000,000 and BMO is selling Notes A-4-2 and A-4-3 with an aggregate original principal balance of $53,960,000. The relationship between the holders of the Tysons Corner Center Whole Loan is governed by a co-lender agreement as described under “Description of the Mortgage Pool—The Whole Loans—The Outside Serviced Pari Passu Whole Loans” in the Preliminary Prospectus. The Tysons Corner Center Whole Loan is being serviced pursuant to the trust and servicing agreement for the TYSN 2023-CRNR securitization trust. See “The Pooling and Servicing Agreement—Servicing of the Outside Serviced Mortgage Loans” in the Preliminary Prospectus.
The table below summarizes the promissory notes that comprise the Tysons Corner Center Whole Loan.
| Whole Loan Summary |
| Note | Original Balance | Cut-off Date Balance | Note Holder | Controlling Piece |
| A-1-1 | $176,080,000 | $176,080,000 | TYSN 2023-CRNR | Yes |
| A-1-2 | $30,000,000 | $30,000,000 | Benchmark 2024-V5 | No |
| A-1-3(1) | $20,000,000 | $20,000,000 | DBNY(1) | No |
| A-1-4 | $10,000,000 | $10,000,000 | Benchmark 2024-V5 | No |
| A-1-5 | $10,000,000 | $10,000,000 | BMO 2024-5C3 | No |
| A-1-6(1) | $37,920,000 | $37,920,000 | DBNY(1) | No |
| A-2-1 | $88,040,000 | $88,040,000 | TYSN 2023-CRNR | No |
| A-2-2 | $20,000,000 | $20,000,000 | Benchmark 2024-V5 | No |
| A-2-3-1 | $10,000,000 | $10,000,000 | BMO 2024-5C3 | No |
| A-2-3-2 | $10,000,000 | $10,000,000 | GSBI(1) | No |
| A-2-4 | $13,960,000 | $13,960,000 | Benchmark 2024-V5 | No |
| A-3-1 | $88,040,000 | $88,040,000 | TYSN 2023-CRNR | No |
| A-3-2(1) | $20,000,000 | $20,000,000 | JPMCB(1) | No |
| A-3-3(1) | $10,000,000 | $10,000,000 | JPMCB(1) | No |
| A-3-4(1) | $23,960,000 | $23,960,000 | JPMCB(1) | No |
| A-4-1 | $88,040,000 | $88,040,000 | TYSN 2023-CRNR | No |
| A-4-2 | $30,000,000 | $30,000,000 | BMO 2024-5C3 | No |
| A-4-3 | $23,960,000 | $23,960,000 | BMO 2024-5C3 | No |
| Whole Loan | $710,000,000 | $710,000,000 | | |
| (1) | Expected to be contributed to one or more future securitization transactions. |
The Property. The Tysons Corner Center Property is a 1,793,638 SF, super regional mall located 12.5 miles outside Washington D.C. The Tysons Corner Center Property consists of one contiguous building and 10,059 parking spaces (for a parking ratio of 5.61 spaces per 1000 SF) situated on a 76.56 acre site in McLean, Virginia, and has 238 tenants. The Tysons Corner Center Property is anchored by Bloomingdale’s, Macy’s, and Nordstrom which collectively generated approximately $239.9 million of sales in the September 2023 TTM while also increasing foot traffic at the Tysons Corner Center Property. The diversified in-line tenant base features large-format retailers and operators including Zara, Apple, Uniqlo, Victoria’s Secret, lululemon athletica, H&M, and Sephora contributing to total Tysons Corner Center Property sales in the September 2023 TTM of approximately $891.2 million. In-line stores smaller than 10,000 SF (excluding arcade and non-retail stores) generated approximately $495.4 million of sales in the September 2023 TTM, driving sales volume of $1,202 PSF at an occupancy cost of 16.1%.
The Tysons Corner Center Property was originally developed in 1968 and was subsequently expanded in 1989 and 2005. Since 2005, the borrower sponsors have invested approximately $352 million (with over $100 million invested in the last six years) in capital improvements, leasing capital, and operational upgrades to preserve the asset’s competitive positioning. Major capital initiatives include Apple’s relocation/renewal costing approximately $22.1 million, the repositioning of L.L. Bean’s former space, costing approximately $19.6 million through 2023, and ongoing operating capital improvements to the parking deck, HVAC, roof, vertical transportation, security equipment, and common areas. The borrower sponsors have also invested approximately $525 million to create a (non-collateral) 24/7 live-work-play-stay, mixed-use destination adjacent to the Tysons Corner Center Property. This non-collateral development project opened between 2014 and 2016 and includes a 22-story Class-A office tower, a 429-unit luxury apartment building, and a 300-key Hyatt.
THE INFORMATION IN THIS STRUCTURAL AND COLLATERAL TERM SHEET IS NOT COMPLETE AND MAY BE AMENDED PRIOR TO THE TIME OF SALE. THIS TERM SHEET IS NOT AN OFFER TO SELL THESE SECURITIES AND IT IS NOT A SOLICITATION OF AN OFFER TO BUY THESE SECURITIES IN ANY JURISDICTION WHERE THE OFFER OR SALE IS NOT PERMITTED. |
| | 39 | |
| Structural and Collateral Term Sheet | | BMO 2024-5C3 |
| No. 1 – Tysons Corner Center |
The following table contains sales history for the Tysons Corner Center Property:
| Sales History(1) |
| | 2019 | 2021 | 2022 | TTM September 2023 |
| Sales PSF (Inline < 10,000 SF) | $461,073,000 | $413,432,000 | $475,055,000 | $495,396,000 |
| Sales PSF (Inline < 10,000 SF, Excluding Apple) | $373,499,000 | $338,185,000 | $389,701,000 | $423,169,000 |
| Over 10,000 SF | $182,117,000 | $181,694,000 | $141,709,000 | $141,471,000 |
| Theaters & Arcades | $19,341,000 | $8,707,000 | $12,229,000 | $14,406,000 |
| Department Stores | $215,350,000 | $211,721,000 | $238,646,000 | $239,897,000 |
| Occupancy Cost (Inline < 10,000 SF)(2) | 17.0% | N/A | 15.9% | 16.1% |
| (1) | Information is as of September 30, 2023, as provided by the borrower sponsors, and only includes tenants reporting sales. |
| (2) | Occupancy Cost (Inline < 10,000 SF) was not calculated during periods affected by COVID due to incomplete sales reporting by tenants. |
Major Tenants. The three anchor tenants are Bloomingdale’s, Macy’s and Nordstrom.
Bloomingdale’s (252,754 square feet; 14.1% of net rentable area; 1.0% of underwritten gross rent). Bloomingdale’s is a high-end department store chain founded in 1860 that currently offers clothes, accessories, shoes, and furniture for men, women and children. Bloomingdale’s was acquired by Federated Department Stores in 1930, which acquired the Macy’s department store chain in 1994. Ultimately, Federated Department Stores was renamed Macy’s, Inc. (NYSE: M) in 2007. The chain has a total of 37 department stores and 23 outlet stores with the Bloomingdale's nameplate in operation. Its headquarters and flagship store are located in New York City. The Bloomingdale’s lease expires July 22, 2028, and the tenant has one seven-year renewal option upon no less than 270 days’ prior written notice. Bloomingdale’s has no termination options.
Nordstrom (201,000 square feet; 11.2% of net rentable area; 0.2% of underwritten gross rent). Nordstrom (NYSE: JWN) is a fashion retailer offering clothing shoes and accessories for men, women and children. Founded in 1901 and headquartered in Seattle, Nordstrom has 370 stores across 40 states and Canada, which includes 122 full-line stores, 236 Nordstrom Rack locations, 7 Trunk Club clubhouses, two clearance stores and a Nordstrom local service concept. In fiscal year 2022, Nordstrom reported net sales of nearly $15.1 billion, an increase of 6.6% from fiscal year 2021. The Nordstrom at the Tysons Corner Center Property is reportedly in the top 15% of all Nordstrom locations, with the men’s department ranking as the highest performing across Nordstrom’s entire national fleet. Nordstrom’s lease expires in March 2025 and the tenant has 11, five-year renewal options exercisable upon no less than 9 months’ and no earlier than 24 months prior written notice. Nordstrom has no termination options.
Macy’s (237,076 square feet; 13.2% of net rentable area; 0.1% of underwritten gross rent). Macy’s, Inc. (NYSE: M) is an American department store chain founded in 1858 that currently offers clothes, accessories, shoes, and furniture for men, women and children. It operates more than 700 department stores under the nameplates Macy’s and Bloomingdale’s and over 160 specialty stores that include Bloomingdale’s The Outlet, Bluemercury and Macy’s Backstage. Macy’s Inc. operates stores in 43 states, the District of Columbia, Guam and Puerto Rico, as well as macys.com, bloomingdales.com and bluemercury.com. Macy’s Inc. has corporate offices in Cincinnati, Ohio and New York, New York. The Macy’s lease expires July 24, 2028, and the tenant has six, five-year renewal options remaining upon no less than 270 days’ prior written notice. Macy’s has no termination options.
Appraisal. According to the appraisal, the Tysons Corner Center Property had an “as-is” appraised value of $1,800,000,000 as of October 5, 2023.
Appraisal Approach | Appraised Value | Capitalization Rate |
| Income Capitalization Approach | $1,800,000,000 | 5.25% |
Environmental. According to the Phase I environmental report, dated August 2, 2023, there was no evidence of any recognized environmental conditions at the Tysons Corner Center Property.
THE INFORMATION IN THIS STRUCTURAL AND COLLATERAL TERM SHEET IS NOT COMPLETE AND MAY BE AMENDED PRIOR TO THE TIME OF SALE. THIS TERM SHEET IS NOT AN OFFER TO SELL THESE SECURITIES AND IT IS NOT A SOLICITATION OF AN OFFER TO BUY THESE SECURITIES IN ANY JURISDICTION WHERE THE OFFER OR SALE IS NOT PERMITTED. |
| | 40 | |
| Structural and Collateral Term Sheet | | BMO 2024-5C3 |
| No. 1 – Tysons Corner Center |
The following table presents certain information relating to the historical occupancy of the Tysons Corner Center Property:
| Historical and Current Occupancy(1) |
| 2020 | 2021 | 2022 | Current(2) |
| 90.6% | 88.6% | 88.9% | 95.4% |
| (1) | Historical Occupancies are as of December 31 of each respective year, unless otherwise specified. |
| (2) | Based on the underwritten rent roll dated November 1, 2023. |
The following table presents certain information relating to the major tenants (of which, certain tenants may have co-tenancy provisions) at the Tysons Corner Center Property:
| Tenant Summary(1) |
Tenant | Credit Rating (Moody’s/
S&P/Fitch)(2) | Net Rentable Area (SF) | % of Net Rentable Area |
UW
Gross Rent(3) | UW
Gross Rent PSF(3) | % of Total
UW Gross Rent(3) | Lease Expiration |
| Anchors | | | | | | | |
| Bloomingdale’s(4) | Ba1/BB+/NR | 252,754 | 14.1% | $1,218,492 | $4.82 | 1.0 | % | 7/22/2028 |
| Nordstrom(5) | NR/BB+/BBB- | 200,000 | 11.2% | 282,999 | $1.41 | 0.2 | | 3/31/2025 |
| Macy’s(6) | Ba1/BB+/NR | 237,076 | 13.2% | 94,786 | $0.40 | 0.1 | | 7/24/2028 |
| Major Tenants | | | | | | | |
| AMC Theatres(7) | Caa1/CCC+/NR | 105,122 | 5.9% | 4,589,627 | $43.66 | 3.6 | | 9/30/2025 |
| Primark(8) | NR/NR/NR | 50,186 | 2.8% | 2,922,512 | $58.23 | 2.3 | | 5/31/2034 |
| | | | | | | | |
| In-line >10,000 SF | | 306,089 | 17.1% | 32,775,526 | $107.08 | 26.0 | | |
| In-line <10,000 SF | | 490,510 | 27.3% | 83,994,405 | $171.24 | 66.5 | | |
| Specialty Leasing | | 65,118 | 3.6% | 0 | 0.00 | 0.0 | | |
| Office/Other | | 4,661 | 0.3% | 357,065 | $76.61 | 0.3 | | |
| Total Occupied | | 1,711,516 | 95.4% | $126,235,411 | $73.76 | 100.0 | % | |
| Vacant | | 82,122 | 4.6% | | | | |
| Total | | 1,793,638 | 100.0% | | | | |
| (1) | Based on the underwritten rent roll dated November 1, 2023. |
| (2) | Certain ratings are those of the parent company whether or not the parent guarantees the lease. |
| (3) | UW Gross Rent, UW Gross Rent PSF and % of Total UW Gross Rent includes Base Rent, recoveries (fixed CAM, tax reimbursements and utility reimbursements) and percentage rent contribution. |
| (4) | Bloomingdale’s has one, seven-year renewal option upon no less than 270 days’ prior written notice. |
| (5) | Nordstrom has eleven, five-year renewal options exercisable upon no less than 9 months’ and no earlier than 24 months prior written notice. This includes Nordstrom’s anchor space of 200,000 SF. There is an additional 1,000 SF that is included in the In-line <10,000 SF numbers above. |
| (6) | Macy’s has six, five-year renewal options exercisable upon no less than 270 days’ prior written notice. |
| (7) | AMC Theatres has four, five-year renewal options exercisable upon at least 12 months’ prior written notice. |
| (8) | Primark (signed but not in occupancy) is expected to commence its ten-year lease on April 22, 2024. Primark has three, five-year renewal options exercisable upon at least 12 months’ notice. Primark has various options to terminate its lease (i) if it has not opened by a date determined by a formula specified in the lease, (ii) if the delivery date has not occurred in accordance with a formula specified in the lease or (iii) if the floor area is more than 3% less than specified in the lease. In addition, Primark has the right to terminate its lease effective as of the end of its fifth lease year if the tenant’s gross sales during its fourth lease year do not equal to exceed $23,000,000. Such termination right must be exercised by notice given at any time during the 90-day period following the end of the fourth lease year. At origination $9,005,926 was deposited into a gap rent reserve for various tenants, including $1,170,894 for Primark. We cannot assure you that Primark will take occupancy or commence paying rent as expected, or at all. |
THE INFORMATION IN THIS STRUCTURAL AND COLLATERAL TERM SHEET IS NOT COMPLETE AND MAY BE AMENDED PRIOR TO THE TIME OF SALE. THIS TERM SHEET IS NOT AN OFFER TO SELL THESE SECURITIES AND IT IS NOT A SOLICITATION OF AN OFFER TO BUY THESE SECURITIES IN ANY JURISDICTION WHERE THE OFFER OR SALE IS NOT PERMITTED. |
| | 41 | |
| Structural and Collateral Term Sheet | | BMO 2024-5C3 |
| No. 1 – Tysons Corner Center |
The following table presents certain information relating to the lease rollover schedule at the Tysons Corner Center Property:
| Lease Rollover Schedule(1)(2) |
| Year | Number of Leases Expiring | Net Rentable Area Expiring | % of NRA Expiring | UW Base Rent Expiring | % of UW Base Rent Expiring | Cumulative Net Rentable Area Expiring | Cumulative % of NRA Expiring | Cumulative UW Base Rent Expiring | Cumulative % of UW Base Rent Expiring |
| Vacant | 0 | 82,122 | 4.6% | $0 | 0.0% | 82,122 | 4.6% | $0 | 0.0% |
| MTM | 6 | 12,809 | 0.7 | 857,511 | 1.1% | 94,931 | 5.3% | $857,511 | 1.1% |
| 2024 | 40 | 139,997 | 7.8 | 10,907,326 | 14.5% | 234,928 | 13.1% | $11,764,837 | 15.7% |
| 2025 | 33 | 417,137 | 23.3 | 13,290,259 | 17.7% | 652,065 | 36.4% | $25,055,096 | 33.4% |
| 2026 | 23 | 104,482 | 5.8 | 10,419,016 | 13.9% | 756,547 | 42.2% | $35,474,112 | 47.3% |
| 2027 | 20 | 53,367 | 3.0 | 6,063,018 | 8.1% | 809,914 | 45.2% | $41,537,130 | 55.3% |
| 2028 | 26 | 572,395 | 31.9 | 8,931,129 | 11.9% | 1,382,309 | ��77.1% | $50,468,259 | 67.2% |
| 2029 | 7 | 18,224 | 1.0 | 1,559,846 | 2.1% | 1,400,533 | 78.1% | $52,028,105 | 69.3% |
| 2030 | 13 | 25,339 | 1.4 | 2,855,202 | 3.8% | 1,425,872 | 79.5% | $54,883,308 | 73.1% |
| 2031 | 8 | 32,012 | 1.8 | 2,202,582 | 2.9% | 1,457,884 | 81.3% | $57,085,890 | 76.1% |
| 2032 | 10 | 28,649 | 1.6 | 2,715,169 | 3.6% | 1,486,533 | 82.9% | $59,801,059 | 79.7% |
| 2033 | 11 | 67,584 | 3.8 | 5,552,422 | 7.4% | 1,554,117 | 86.6% | $65,353,481 | 87.1% |
| 2034 | 10 | 166,699 | 9.3 | 8,362,650 | 11.1% | 1,720,816 | 95.9% | $73,716,131 | 98.2% |
| 2035 & Beyond | 1 | 7,704 | 0.4 | 1,329,864 | 1.8% | 1,728,520 | 96.4% | $75,045,995 | 100.0% |
| Specialty Leasing | 30 | 65,118 | 3.6 | 0 | 0.0% | 1,793,638 | 100.0% | $75,045,995 | 100.0% |
| Total | 238 | 1,793,638 | 100.0% | $75,045,995 | 100.0% | | | | |
| (1) | Based on the underwritten rent roll as of November 1, 2023. |
| (2) | Certain tenants may have lease termination options that are not reflected in the Lease Rollover Schedule. |
The following table presents certain information relating to the operating history and underwritten cash flows of the Tysons Corner Center Property:
| Operating History and Underwritten Net Cash Flow(1) |
| | 2020 | 2021 | 2022 | TTM September 2023 | Underwritten | Per Square Foot | %(2) |
| Rents in Place | $74,476,740 | $67,924,167 | $65,811,352 | $67,573,137 | $75,045,995 | $41.84 | 55.6% |
| Rent Steps | 0 | 0 | 0 | 0 | 1,503,149 | 0.84 | 1.1 |
| Vacant Income | 0 | 0 | 0 | 0 | 11,821,381 | 6.59 | 8.8 |
| Gross Potential Rent | $74,476,740 | $67,924,167 | $65,811,352 | $67,573,137 | 88,370,525 | $49.27 | 65.5% |
| Total Reimbursements | 49,321,594 | 42,341,921 | 42,773,913 | 43,726,608 | 46,509,747 | 25.93 | 34.5 |
| Net Rental Income | $123,798,334 | $110,266,088 | $108,585,265 | $111,299,745 | $134,880,271 | $75.20 | 100.0% |
| Other Income | 17,429,202 | 19,929,530 | 19,463,316 | 19,285,025 | 17,560,026 | 9.79 | 13.0 |
| (Vacancy/Credit Loss) | (11,043,533) | (3,517,708) | (600,363) | (966,945) | (11,821,381) | (6.59) | (8.8) |
| Effective Gross Income | $130,184,003 | $126,677,910 | $127,448,218 | $129,617,825 | $140,618,916 | $78.40 | 104.3% |
| Total Expenses(3) | $44,107,826 | $43,141,634 | $42,843,235 | $44,086,503 | $43,516,369 | $24.26 | 30.9% |
| Net Operating Income(4) | $86,076,177 | $83,536,276 | $84,604,983 | $85,531,322 | $97,102,547 | $54.14 | 69.1% |
| Total TI/LC, Capex/RR | 0 | 0 | 0 | 0 | (2,152,366) | (1.20) | (1.5) |
| Net Cash Flow | $86,076,177 | $83,536,276 | $84,604,983 | $85,531,322 | $94,950,181 | $52.94 | 67.5% |
| (1) | Based on the underwritten rent roll as of November 1, 2023. |
| (2) | % column represents percent of Net Rental Income for all revenue lines and represents percent of Effective Gross Income for the remainder of fields. |
| (3) | Underwritten Total Expenses includes Real Estate Taxes of approximately $24,033,263 and Insurance expense of approximately $802,641. Other expenses include general and administrative, repairs and maintenance, security, utility, marketing, other expenses and ground rent. |
| (4) | The main driver in the increase from TTM 9/30/2023 Net Operating Income to UW Net Operating Income is recent lease up. |
THE INFORMATION IN THIS STRUCTURAL AND COLLATERAL TERM SHEET IS NOT COMPLETE AND MAY BE AMENDED PRIOR TO THE TIME OF SALE. THIS TERM SHEET IS NOT AN OFFER TO SELL THESE SECURITIES AND IT IS NOT A SOLICITATION OF AN OFFER TO BUY THESE SECURITIES IN ANY JURISDICTION WHERE THE OFFER OR SALE IS NOT PERMITTED. |
| | 42 | |
| Structural and Collateral Term Sheet | | BMO 2024-5C3 |
| No. 1 – Tysons Corner Center |
The Market. The Tysons Corner Center Property is located in at the intersection of Chain Bridge Route 123 and the Capital Beltway/I-495 where 172,000 vehicles pass daily, with direct access to DC’s Metro Silver Line and positioned between Dulles International and Reagan International airports. The Tysons Corner Center Property’s total trade area is comprised of approximately 3.2 million people in 1.2 million households with an average household income exceeding $165,000 and an average net worth over $1.8 million. As the primary shopping destination of Fairfax County, the trade area in which the Tysons Corner Center Property is located has an affluent, dense and educated population, and is ranked as having the 5th highest median household income in the United States. Loudon County and Falls Church City also fall within the Tysons Corner Center Property’s trade area and along with Fairfax County, represent three of the wealthiest counties in the United States.
Within the Fairfax County retail submarket, malls are the largest subtype, accounting for nearly 2.9 million square feet. Rents are approximately $39.00/SF, which is a 3.7% increase from 2022. Vacancy in the retail submarket is 3.2%, which is near the same level it was a year ago. Vacancy has only fallen 0.1% during this time. During this period, 5,700 square feet has been absorbed, and none has been delivered. In the past three years, rents have increased a cumulative 7.4%.
As of year-end 2022, the population within a 10-mile radius of the Tysons Corner Center Property had an aggregate retail sales level of $41.32 million, with average retail sales per household of $74,026. By comparison, the Washington D.C. metropolitan area had average sales per household of $71,488, while the Virginia and United States averages were $65,311 and $63,688, respectively.
The following table presents certain information relating to the demographics of the Tysons Corner Center Property:
| Demographics Summary(1)(2) |
| Property Name | City, State | Whole Loan Cut-off Date Balance | 5-mile Population | 10-mile Population | 15-mile Population | 5-mile Avg Household Income | 10-mile Avg Household Income | 15-mile Avg Household Income |
| Tysons Corner Center | McLean, VA | $710,000,000 | 261,017 | 1,355,610 | 2,998,684 | $195,243 | $176,653 | $157,344 |
| (2) | Values are as of 2022. |
The Borrowers. The borrowers are Tysons Corner Property Holdings LLC and Tysons Corner Holdings LLC, each a Delaware limited liability company and single purpose entity with two independent directors. Legal counsel to the borrowers delivered a non-consolidation opinion in connection with the origination of the Tysons Corner Center Whole Loan.
The Borrower Sponsors. The borrowers are a 50/50 joint venture between the borrower sponsors, which are the Macerich Partnership, L.P., a subsidiary of The Macerich Company (“Macerich”) and the Alaska Permanent Fund Corporation The non-recourse carveout guarantor is The Macerich Partnership, L.P.
Macerich is a fully integrated, self-managed and self-administered real estate investment trust. As a leading owner, operator and developer of retail real estate in densely populated U.S. markets, Macerich’s portfolio is concentrated in California, the Pacific Northwest, Phoenix/Scottsdale, and the metropolitan New York to Washington, D.C. corridor. Developing and managing properties that serve as community cornerstones, Macerich currently owns 47 million square feet of real estate consisting primarily of interests in 44 regional town centers.
The Alaska Permanent Fund, a sovereign wealth fund, was established in 1976 by Alaskans to preserve and convert the State’s non-renewable oil and mineral wealth into a renewable financial resource for all generations of Alaskans. The Alaska Permanent Fund is managed by the Alaska Permanent Fund Corporation, which was created by the Alaska State Legislature in 1980 as an independent state entity tasked with the mission to manage and invest the assets of the Alaska Permanent Fund and other funds designated by law. As of November 30, 2023, the Alaska Permanent Fund Corporation managed assets worth $75.5 billion.
Property Management. The Tysons Corner Center Property is managed by MACW Property Management, LLC, an affiliate of the non-recourse carveout guarantor.
Escrows and Reserves. At origination, the borrowers deposited approximately $30,769,199 into an Outstanding TI/LC Reserve and $9,005,926 into a gap rent reserve.
THE INFORMATION IN THIS STRUCTURAL AND COLLATERAL TERM SHEET IS NOT COMPLETE AND MAY BE AMENDED PRIOR TO THE TIME OF SALE. THIS TERM SHEET IS NOT AN OFFER TO SELL THESE SECURITIES AND IT IS NOT A SOLICITATION OF AN OFFER TO BUY THESE SECURITIES IN ANY JURISDICTION WHERE THE OFFER OR SALE IS NOT PERMITTED. |
| | 43 | |
| Structural and Collateral Term Sheet | | BMO 2024-5C3 |
| No. 1 – Tysons Corner Center |
Tax Escrows – During the continuance of a Trigger Period (as defined below), the borrowers are required to escrow 1/12th of the annual estimated tax payments payable during the next ensuing 12 months on a monthly basis.
Insurance Escrows – During the continuance of a Trigger Period, the borrowers are required to escrow 1/12th of the annual estimated insurance payments on a monthly basis, unless no event of default is continuing as to which the lender has initiated an enforcement action and the Tysons Corner Center Property is insured under a blanket policy meeting the requirements set forth in the related loan agreement (in which case, no insurance escrows will be required, notwithstanding the continuance of a Trigger Period).
Replacement Reserve – During the continuance of a Trigger Period, the borrowers are required to deposit monthly, with or on behalf of the lender, an amount equal to the gross leasable area of the Tysons Corner Center Property (excluding the non-collateral square footage and the premises leased or previously leased to (i) Nordstrom, (ii) Lord & Taylor, and (iii) any other tenant that is required to pay for all repairs and maintenance costs for its entire leased premises, roof and structural components) multiplied by $0.25 and divided by 12 (initially, $37,367) into a replacement reserve account subject to a cap of 24 times the required monthly deposit (initially, $896,819).
TI/LC Escrows – During the continuance of a Trigger Period, the borrowers are required to deposit monthly, with or on behalf of the lender, an amount equal to the gross leasable area of the Tysons Corner Center Property (excluding the non-collateral square footage and the premises leased or previously leased to (i) Nordstrom, (ii) Macy’s, (iii) Bloomingdales and (iv) Lord & Taylor) multiplied by $1.00 and divided by 12 (initially $149,740) into a leasing reserve account subject to a cap of 24 times the required monthly deposit (initially, $3,587,276).
All deposits to all reserve funds listed above may be in the form of Credit Support. “Credit Support” means any one or more of (A) cash, (B) United States obligations (C) other securities having a rating reasonably acceptable to the lender and for which a rating agency confirmation has been received, and/or (D) a letter of credit satisfying certain conditions. In addition, the TI/LC reserve may be replaced by a guaranty of limited payment provided by the non-recourse carveout guarantor, which will be reduced on a dollar-to-dollar basis by equity capital spent by the borrower on approved leasing expenses not duplicative of costs paid with funds in such reserve.
Lockbox / Cash Management. The Tysons Corner Center Whole Loan is structured with a hard lockbox and springing cash management. All rents from the Tysons Corner Center Property are required to be deposited directly into a lockbox account controlled by the lender (the “Lockbox Account”), and any rents otherwise received by borrowers or the property manager are required to be deposited into the Lockbox Account within three business days after receipt. Prior to a Trigger Period, the borrowers may utilize the Lockbox Account as the borrowers’ operating account. During the continuance of a Trigger Period, the borrowers will no longer have access to the Lockbox Account, and all funds deposited into the Lockbox Account are required to be swept on a weekly basis and on the second business day prior to each monthly payment date into a deposit account controlled by the lender (the “Cash Management Account”), to be applied and disbursed in accordance with the Tysons Corner Center Whole Loan documents, provided no Cut-off Event (as defined below) is continuing, to pay debt service, the reserves and escrows described above, budgeted operating expenses, lender-approved extraordinary expenses, and capital projects undertaken in accordance with the loan documents. During the continuance of a Trigger Period, any excess cash is required to be deposited into an eligible account (the “Excess Cash Flow Reserve Account”) and held by the lender as additional security for the Tysons Corner Center Whole Loan; provided, that, funds on deposit in the Excess Cash Flow Reserve Account will be made available to the borrowers for the payment of certain property-level expenses and other uses as set forth in the Tysons Corner Center Whole Loan documents, including required REIT distributions in an amount up to $500,000. All sums remaining on deposit in the Excess Cash Flow Reserve Account will be disbursed to the borrowers on the earlier to occur of (i) payment in full of the debt or (ii) discontinuation of a Trigger Period. A “Cut-off Event” means the occurrence of an event of default and the earlier of (i) an enforcement action (which has not been cured) or (ii) the tendering of a deed in lieu of foreclosure.
A “Trigger Period” means a period commencing upon (i) an event of default under the Tysons Corner Center Whole Loan documents or (ii) the interest only debt service coverage ratio falling below 1.50x for two consecutive calculation dates (a “Low DSCR Period”). A “calculation date” means the 60th day following the end of each calendar quarter. A Trigger Period resulting from an event of default will end if the lender has waived or the borrowers have cured such event of default. A Trigger Period resulting from a Low DSCR Period will end if the borrowers have maintained an interest-only debt service coverage ratio of at least 1.50x for two consecutive calculation dates. Upon the end of a Trigger Period, all remaining funds
THE INFORMATION IN THIS STRUCTURAL AND COLLATERAL TERM SHEET IS NOT COMPLETE AND MAY BE AMENDED PRIOR TO THE TIME OF SALE. THIS TERM SHEET IS NOT AN OFFER TO SELL THESE SECURITIES AND IT IS NOT A SOLICITATION OF AN OFFER TO BUY THESE SECURITIES IN ANY JURISDICTION WHERE THE OFFER OR SALE IS NOT PERMITTED. |
| | 44 | |
| Structural and Collateral Term Sheet | | BMO 2024-5C3 |
| No. 1 – Tysons Corner Center |
in the Cash Management Account will be disbursed to the borrowers except for funds that are required to be deposited into an account whether or not a Trigger Period is continuing. The borrowers may also cure a Trigger Period arising from a Low DSCR Period by (i) following the expiration of the lockout period, prepaying the Tysons Corner Center Whole Loan (together with payment of the prepayment fee) in an amount that would result in an interest-only debt service coverage ratio of 1.50x or (ii) providing to the lender Credit Support, in an amount which, if added to the underwritten net operating income of the Tysons Corner Center Property would cause the interest only debt service coverage ratio to equal 1.50x.
Subordinate Debt. None.
Mezzanine Debt. None.
Partial Release. The borrowers are permitted to obtain the free release of (i) non-income producing and unimproved real property, (ii) non-income producing real property that is improved by structures that have been vacant and non-income producing continuously since the origination date and for at least three years prior to the date of release, (iii) future development parcels identified in the loan agreement (and which may be increased in size by not more than 15%), and (iv) a parcel identified in the loan agreement as the “L&T Parcel,” which was formerly occupied by a Lord & Taylor store (and which may be increased in size by not more than 15%). Such release is subject to various conditions, including, among others, (i) satisfaction of REMIC related conditions, (ii) except in the case of a release of the L&T Parcel, certification by the borrowers that the release will not materially and adversely affect the use, operations, economic value of, or revenue produced by (exclusive of the economic value or revenue lost attributable to the release parcel) of the remaining improvements on the Tysons Corner Center Property, and (iii) the release parcel has been legally subdivided and constitutes a separate tax lot (or if not a separate tax lot, the release parcel owner is contractually obligated to pay its share of all taxes and other charges). Such release may be done by means of a lot line adjustment, plat, legal subdivision, vertical subdivision, condominium or any other means legally permitted. It is anticipated that such release parcels may be redeveloped, which redevelopment could have an impact on the Tysons Corner Center Property.
Ground Lease. The borrower Tysons Corner Property Holdings LLC owns the fee interest in the Tysons Corner Center Property and ground leases it to the borrower Tysons Corner Holdings LLC, and the Tysons Corner Center Whole Loan is secured by both borrowers’ interests.
Terrorism Insurance. The borrowers are required to obtain and maintain property insurance and business interruption insurance for 24 months plus a twelve month extended period of indemnity. Such insurance is required to cover acts of terror or similar acts of sabotage; provided that if the Terrorism Risk Insurance Program Reauthorization Act of 2019 (as further modified, amended or extended) is no longer in effect, the borrowers will only be required to pay for terrorism insurance up to a maximum of 200% of the then annual insurance premiums payable for the Tysons Corner Center Property at the time with respect to stand-alone property and business income or rental income insurance interruption policies. See “Risk Factors—Risks Relating to the Mortgage Loans—Terrorism Insurance May Not Be Available for All Mortgaged Properties” in the Preliminary Prospectus.
THE INFORMATION IN THIS STRUCTURAL AND COLLATERAL TERM SHEET IS NOT COMPLETE AND MAY BE AMENDED PRIOR TO THE TIME OF SALE. THIS TERM SHEET IS NOT AN OFFER TO SELL THESE SECURITIES AND IT IS NOT A SOLICITATION OF AN OFFER TO BUY THESE SECURITIES IN ANY JURISDICTION WHERE THE OFFER OR SALE IS NOT PERMITTED. |
| | 45 | |
| Structural and Collateral Term Sheet | | BMO 2024-5C3 |
| No. 2 – Elmwood Shopping Center |
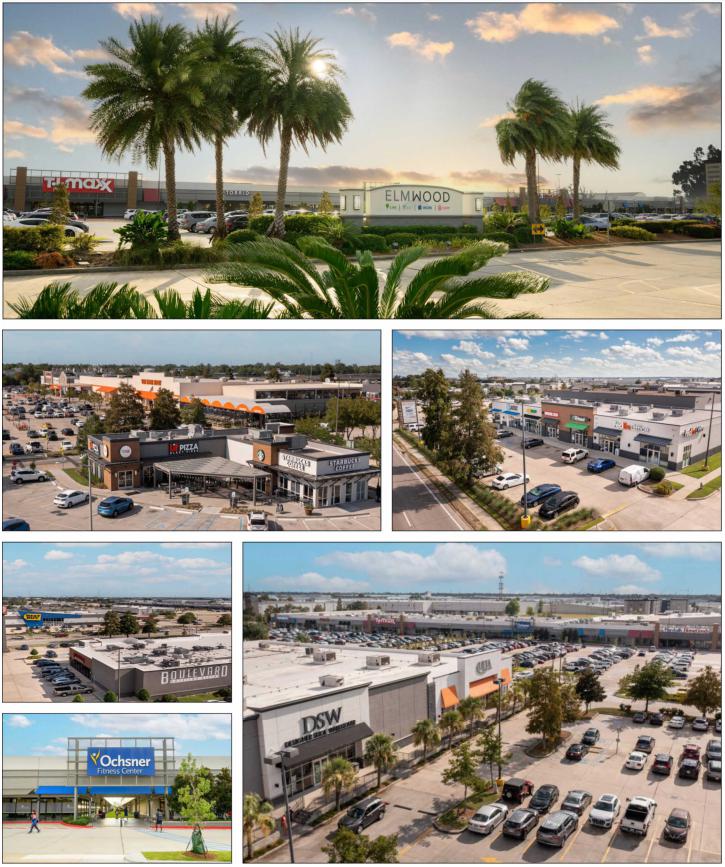
THE INFORMATION IN THIS STRUCTURAL AND COLLATERAL TERM SHEET IS NOT COMPLETE AND MAY BE AMENDED PRIOR TO THE TIME OF SALE. THIS TERM SHEET IS NOT AN OFFER TO SELL THESE SECURITIES AND IT IS NOT A SOLICITATION OF AN OFFER TO BUY THESE SECURITIES IN ANY JURISDICTION WHERE THE OFFER OR SALE IS NOT PERMITTED. |
| | 46 | |
| Structural and Collateral Term Sheet | | BMO 2024-5C3 |
| No. 2 – Elmwood Shopping Center |
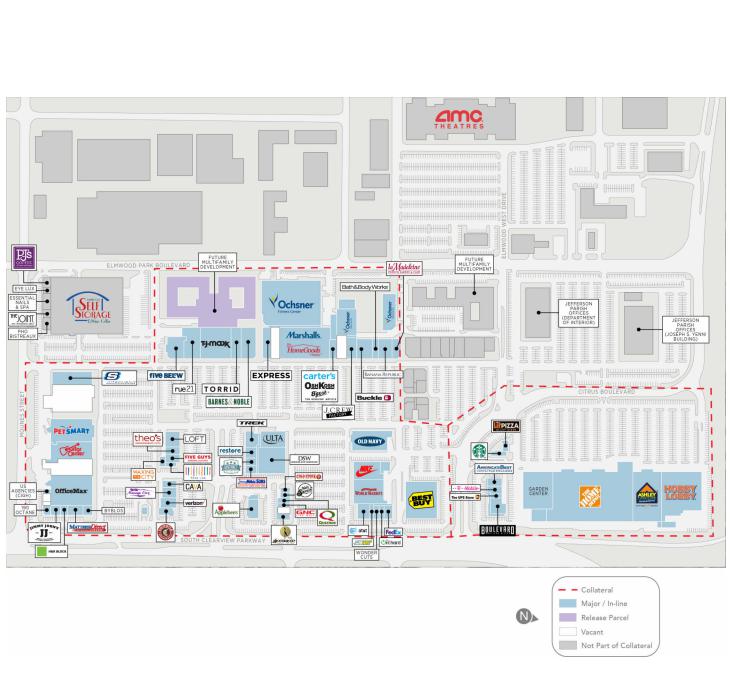
THE INFORMATION IN THIS STRUCTURAL AND COLLATERAL TERM SHEET IS NOT COMPLETE AND MAY BE AMENDED PRIOR TO THE TIME OF SALE. THIS TERM SHEET IS NOT AN OFFER TO SELL THESE SECURITIES AND IT IS NOT A SOLICITATION OF AN OFFER TO BUY THESE SECURITIES IN ANY JURISDICTION WHERE THE OFFER OR SALE IS NOT PERMITTED. |
| | 47 | |
| Structural and Collateral Term Sheet | | BMO 2024-5C3 |
| No. 2 – Elmwood Shopping Center |
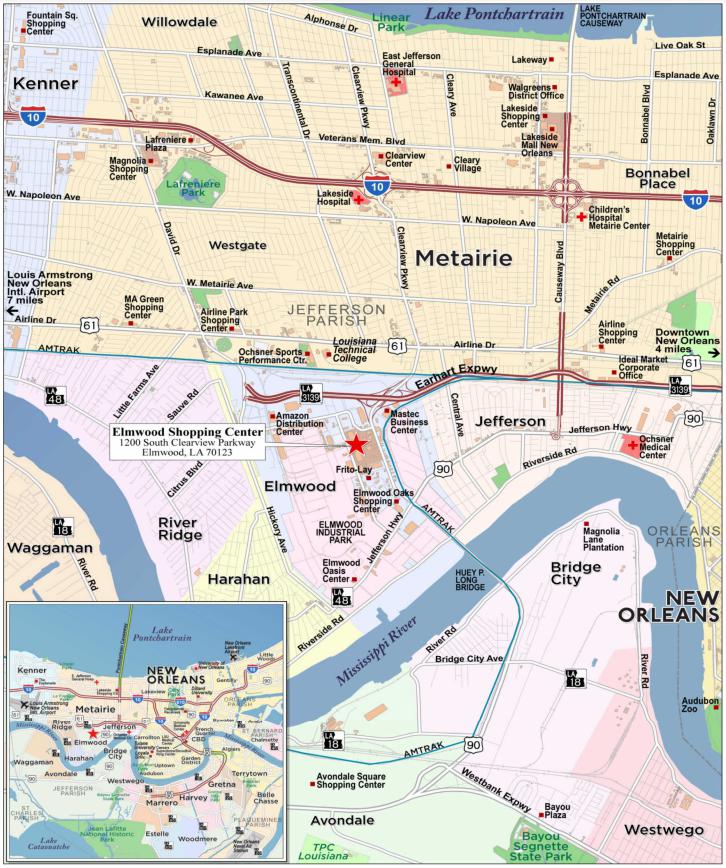
THE INFORMATION IN THIS STRUCTURAL AND COLLATERAL TERM SHEET IS NOT COMPLETE AND MAY BE AMENDED PRIOR TO THE TIME OF SALE. THIS TERM SHEET IS NOT AN OFFER TO SELL THESE SECURITIES AND IT IS NOT A SOLICITATION OF AN OFFER TO BUY THESE SECURITIES IN ANY JURISDICTION WHERE THE OFFER OR SALE IS NOT PERMITTED. |
| | 48 | |
| Structural and Collateral Term Sheet | | BMO 2024-5C3 |
| No. 2 – Elmwood Shopping Center |
| Mortgage Loan Information | | Property Information |
| Mortgage Loan Seller: | CREFI | | Single Asset / Portfolio: | Single Asset |
| Original Principal Balance(1): | $70,000,000 | | Title: | Fee |
| Cut-off Date Principal Balance(1): | $70,000,000 | | Property Type – Subtype: | Retail – Anchored |
| % of IPB: | 7.8% | | Net Rentable Area (SF): | 804,807 |
| Loan Purpose: | Refinance | | Location: | Elmwood, LA |
| Borrower: | Elmwood Retail Properties, L.L.C. | | Year Built / Renovated: | 1977 / 2020 |
| Borrower Sponsor: | Lauricella Land Company, LLC | | Occupancy: | 92.0% |
| Interest Rate: | 6.60000% | | Occupancy Date: | 11/21/2023 |
| Note Date: | 12/20/2023 | | 4th Most Recent NOI (As of): | $9,604,985 (12/31/2020) |
| Maturity Date: | 1/6/2029 | | 3rd Most Recent NOI (As of): | $12,244,786 (12/31/2021) |
| Interest-only Period: | 60 months | | 2nd Most Recent NOI (As of): | $11,875,003 (12/31/2022) |
| Original Term: | 60 months | | Most Recent NOI (As of): | $12,730,117 (TTM 10/31/2023) |
| Original Amortization Term: | None | | UW Economic Occupancy: | 90.8% |
| Amortization Type: | Interest Only | | UW Revenues: | $20,116,855 |
| Call Protection(2): | YM1(53),O(7) | | UW Expenses: | $5,957,736 |
| Lockbox / Cash Management: | Hard / Springing | | UW NOI: | $14,159,119 |
| Additional Debt(1): | Yes | | UW NCF: | $13,990,109 |
| Additional Debt Balance(1): | $15,000,000 | | Appraised Value / Per SF(4): | $208,100,000 / $259 |
| Additional Debt Type(1): | Pari Passu | | Appraisal Date: | 11/10/2023 |
| | | | | |
| Escrows and Reserves(3) | | Financial Information(1) |
| | Initial | Monthly | Initial Cap | | | Whole Loan | |
| Taxes: | $164,331 | $164,331 | N/A | | Cut-off Date Loan / SF: | $106 | |
| Insurance: | $0 | Springing | N/A | | Maturity Date Loan / SF: | $106 | |
| Replacement Reserves: | $0 | $14,084 | N/A | | Cut-off Date LTV(4): | 40.8% | |
| TI/LC: | $5,800,000 | Springing | $2,500,000 | | Maturity Date LTV(4): | 40.8% | |
| Deferred Maintenance: | $2,000,549 | $0 | N/A | | UW NCF DSCR: | 2.46x | |
| Unfunded Obligations: | $2,262,243 | $0 | N/A | | UW NOI Debt Yield: | 16.7% | |
| | | | | | | | | |
| Sources and Uses |
| Sources | Proceeds | % of Total | | | Uses | Proceeds | % of Total |
Whole Loan(1) | $85,000,000 | 100.0% | | | Loan Payoff | $63,534,534 | 74.7 | % |
| | | | | Upfront Reserves | 10,227,123 | 12.0 | |
| | | | | Return of Equity | 9,585,241 | 11.3 | |
| | | | | Closing Costs | 1,653,102 | 1.9 | |
| Total Sources | $85,000,000 | 100.0% | | | Total Uses | $85,000,000 | 100.0 | % |
| (1) | The Elmwood Shopping Center Mortgage Loan (as defined below) is part of the Elmwood Shopping Center Whole Loan (as defined below) which is comprised of two pari passu promissory notes with an aggregate original principal balance of $85,000,000. The Elmwood Shopping Center Whole Loan was originated by Citi Real Estate Funding Inc. (“CREFI”). The Financial Information in the chart above is based on the aggregate outstanding principal balance as of the Cut-off Date of the Elmwood Shopping Center Whole Loan. |
| (2) | The borrower has the option to prepay the Elmwood Shopping Center Whole Loan in whole but not in part (i) on or after the payment date occurring in July 2028 without the payment of any prepayment premium or (ii) at any time prior with the payment of a yield maintenance premium. |
| (3) | For a full description of Escrows and Reserves, please refer to “Escrows and Reserves” below. |
| (4) | Appraised Value includes two release parcels valued at $63,800 and $678,704, respectively. The Appraised Value excluding these release parcels would be $207,357,496 resulting in a Cut-off Date LTV and Maturity Date LTV of 41.0%. |
THE INFORMATION IN THIS STRUCTURAL AND COLLATERAL TERM SHEET IS NOT COMPLETE AND MAY BE AMENDED PRIOR TO THE TIME OF SALE. THIS TERM SHEET IS NOT AN OFFER TO SELL THESE SECURITIES AND IT IS NOT A SOLICITATION OF AN OFFER TO BUY THESE SECURITIES IN ANY JURISDICTION WHERE THE OFFER OR SALE IS NOT PERMITTED. |
| | 49 | |
| Structural and Collateral Term Sheet | | BMO 2024-5C3 |
| No. 2 – Elmwood Shopping Center |
The Loan. The second largest mortgage loan (the “Elmwood Shopping Center Mortgage Loan”) is part of a whole loan (the “Elmwood Shopping Center Whole Loan”) secured by the borrower’s fee interest in an anchored retail property totaling 804,807 square feet located in Elmwood, Louisiana (the “Elmwood Shopping Center Property”). The Elmwood Shopping Center Whole Loan is comprised of two pari passu notes, with an aggregate outstanding principal balance as of the Cut-off Date of $85,000,000. The Elmwood Shopping Center Whole Loan was originated on December 20, 2023 by CREFI and accrues interest at a fixed rate of 6.60000% per annum. The Elmwood Shopping Center Whole Loan has an initial term of five years and is interest-only for the full term. The scheduled maturity date of the Elmwood Shopping Center Whole Loan is the payment date that occurs on January 6, 2029. The Elmwood Shopping Center Mortgage Loan is evidenced by the controlling Note A-1 with an outstanding principal balance as of the Cut-off Date of $70,000,000. The remaining note is currently held by CREFI and is expected to be contributed to one or more future securitization trust(s).
The table below identifies the promissory notes that comprise the Elmwood Shopping Center Whole Loan. The relationship between the holders of the Elmwood Shopping Center Whole Loan is governed by a co-lender agreement as described under “Description of the Mortgage Pool—The Whole Loans—The Serviced Pari Passu Whole Loans” in the Preliminary Prospectus. The Elmwood Shopping Center Whole Loan will be serviced pursuant to the pooling and servicing agreement for the BMO 2024-5C3 securitization trust. See “The Pooling and Servicing Agreement” in the Preliminary Prospectus.
| Whole Loan Summary |
| Note | Original Balance | Cut-off Date Balance | Note Holder | Controlling Piece |
| A-1 | $70,000,000 | $70,000,000 | BMO 2024-5C3 | Yes |
| A-2(1) | $15,000,000 | $15,000,000 | CREFI | No |
| Whole Loan | $85,000,000 | $85,000,000 | | |
| (1) | Expected to be contributed to one or more securitization trust(s). |
The Property. The Elmwood Shopping Center Property is comprised of an 804,807 square foot open-air anchored retail center located in Elmwood, Louisiana. The Elmwood Shopping Center Property is located on an approximately 69.5-acre site and was built in 1977 then subsequently renovated in 2020. According to a third-party market report the Elmwood Shopping Center Property was the most visited shopping center in Louisiana and the 131st most visited in the United States by total number of annual customer visits. As of November 21, 2023, the Elmwood Shopping Center Property was 92.0% occupied by 67 unique tenants.
Major Tenants. The three largest tenants based on underwritten base rent are Home Depot, Ochsner Fitness and Best Buy.
Home Depot (101,860 square feet; 12.7% of NRA; 9.1 % of underwritten base rent): Founded in 1978, Home Depot is a home improvement retailer that sells a wide assortment of building materials, home improvement, and lawn and garden products. Home Depot has approximately 475,000 employees across more than 2,300 stores in the U.S., Canada and Mexico. Home Depot has been a tenant at the Elmwood Shopping Center Property since April 1997 and has a current lease term through January 2028 with no termination options and four, five-year renewal options.
Ochsner Fitness (98,832 square feet; 12.3% of NRA; 7.5% of underwritten base rent): Ochsner Fitness is a subsidiary of Ochsner Health System, a not-for-profit health system based in New Orleans, Louisiana. Ochsner Fitness operates as a fitness center at the Elmwood Shopping Center with a full weight room, cardio studio, six pools for lap and recreational swimming, three racquetball courts and three pickleball courts. The Ochsner Fitness space also features Elevate by Ochsner Health, which offers massage, cryotherapy, esthetic treatments, and acupuncture as well as nutrition services offered by registered dieticians. Ochsner Fitness has been a tenant at the Elmwood Shopping Center Property since May 1991 and has a current lease term through March 2033 with no termination options and two, five-year renewal options.
Best Buy (30,038 square feet; 3.7% of NRA; 5.0% of underwritten base rent): Founded in 1966, Best Buy is a consumer electronics retailer headquartered in Richfield, Minnesota. Best Buy operates 963 stores in the United States and 160 stores in Canada. Best Buy has been a tenant at the Elmwood Shopping Center Property since November 2007 and has a current lease term through January 2028 with no termination options and two, five-year renewal options.
THE INFORMATION IN THIS STRUCTURAL AND COLLATERAL TERM SHEET IS NOT COMPLETE AND MAY BE AMENDED PRIOR TO THE TIME OF SALE. THIS TERM SHEET IS NOT AN OFFER TO SELL THESE SECURITIES AND IT IS NOT A SOLICITATION OF AN OFFER TO BUY THESE SECURITIES IN ANY JURISDICTION WHERE THE OFFER OR SALE IS NOT PERMITTED. |
| | 50 | |
| Structural and Collateral Term Sheet | | BMO 2024-5C3 |
| No. 2 – Elmwood Shopping Center |
Appraisal. According to the appraisal, the Elmwood Shopping Center Whole Loan had an “as-is” appraised value of $208,100,000 as of November 10, 2023. The table below shows the appraiser’s “as-is” conclusions.
| Elmwood Shopping Center(1) |
| Property | Value(2) | Capitalization Rate(2) |
| Elmwood Shopping Center | $208,100,000 | 7.50% |
| (2) | The appraiser used a discounted cash flow analysis utilizing an 8.50% discount rate and 8.0% terminal capitalization rate to arrive at its value. The capitalization rates shown above represent the direct capitalization rate. |
Environmental. According to the Phase I environmental assessments dated November 29, 2023, there was no evidence of any recognized environmental conditions at the Elmwood Shopping Center Property.
The following table presents certain information relating to the historical and current occupancy of the Elmwood Shopping Center Property:
| Historical and Current Occupancy(1) |
| 2019 | 2020 | 2021 | 2022 | Current(2) |
| 93.5% | 91.4% | 92.9% | 94.0% | 92.0% |
| (1) | Historical Occupancies are the annual average physical occupancy of each respective year. |
| (2) | Based on the underwritten rent rolls dated November 21, 2023. |
THE INFORMATION IN THIS STRUCTURAL AND COLLATERAL TERM SHEET IS NOT COMPLETE AND MAY BE AMENDED PRIOR TO THE TIME OF SALE. THIS TERM SHEET IS NOT AN OFFER TO SELL THESE SECURITIES AND IT IS NOT A SOLICITATION OF AN OFFER TO BUY THESE SECURITIES IN ANY JURISDICTION WHERE THE OFFER OR SALE IS NOT PERMITTED. |
| | 51 | |
| Structural and Collateral Term Sheet | | BMO 2024-5C3 |
| No. 2 – Elmwood Shopping Center |
The following table presents certain information relating to the largest tenants based on underwritten base rent at the Elmwood Shopping Center Property:
| Top Tenant Summary(1) |
| Tenant | Ratings Moody’s/S&P/Fitch(2) | Net Rentable Area (SF) | % of Total NRA | UW Base Rent PSF(3) | UW Base Rent(3) | % of Total UW Base Rent(3) | 2022 Sales(1) | Lease Expiration Date |
| Home Depot | A2/A/A | 101,860 | 12.7% | $13.86 | $1,411,780 | 9.1 | % | NAV | 1/31/2028 |
| Ochsner Fitness | NR/NR/NR | 98,832 | 12.3 | $11.76 | 1,162,526 | 7.5 | | NAV | 3/31/2033 |
| Best Buy | A3/BBB+/NR | 30,038 | 3.7 | $26.00 | 780,988 | 5.0 | | NAV | 1/31/2028 |
| Hobby Lobby | NR/NR/NR | 43,222 | 5.4 | $16.75 | 723,969 | 4.7 | | NAV | 7/31/2029 |
| Office Max | NR/NR/NR | 31,913 | 4.0 | $18.25 | 582,412 | 3.7 | | NAV | 12/31/2027 |
| Marshall's | NR/NR/NR | 36,380 | 4.5 | $15.75 | 572,985 | 3.7 | | $13,261,000 | 10/31/2027 |
| Old Navy | Ba3/BB/NR | 17,250 | 2.1 | $32.50 | 560,625 | 3.6 | | $6,831,000 | 5/31/2033 |
| Ashley Furniture | NR/NR/NR | 36,000 | 4.5 | $13.50 | 486,000 | 3.1 | | $12,071,000 | 6/30/2025 |
| Petsmart | B1/B+/NR | 23,058 | 2.9 | $19.50 | 449,631 | 2.9 | | $9,661,000 | 8/31/2025 |
| DSW | NR/NR/NR | 18,009 | 2.2 | $23.60 | 425,012 | 2.7 | | $6,262,000 | 1/31/2029 |
| Largest Tenants | | 436,562 | 54.2% | $16.39 | $7,155,929 | 46.1 | % | | |
| Remaining Tenants | 303,525 | 37.7 | $27.60 | $8,377,713 | 53.9 | | | |
| Total Occupied | 740,087 | 92.0% | $20.99 | $15,533,642 | 100.0 | % | | |
| Vacant Space | | 64,720 | 8.0 | | | | | |
| Total / Wtd. Avg. | 804,807 | 100.0% | | | | | |
| (1) | Based on the underwritten rent rolls dated November 21, 2023. |
| (2) | In certain instances, ratings provided are those of the parent company of the entity shown, whether or not the parent company guarantees the lease. |
| (3) | UW Base Rent PSF, UW Base Rent and % of Total UW Base Rent include average rent steps of $476,800 for Ochsner Fitness, Starbucks and FedEx and contractual rent steps of $208,942 through August 1, 2024. |
THE INFORMATION IN THIS STRUCTURAL AND COLLATERAL TERM SHEET IS NOT COMPLETE AND MAY BE AMENDED PRIOR TO THE TIME OF SALE. THIS TERM SHEET IS NOT AN OFFER TO SELL THESE SECURITIES AND IT IS NOT A SOLICITATION OF AN OFFER TO BUY THESE SECURITIES IN ANY JURISDICTION WHERE THE OFFER OR SALE IS NOT PERMITTED. |
| | 52 | |
| Structural and Collateral Term Sheet | | BMO 2024-5C3 |
| No. 2 – Elmwood Shopping Center |
The following table presents certain information relating to tenant lease expirations at the Elmwood Shopping Center Property:
| Lease Rollover Schedule(1)(2) |
| Year | | Number of Leases Expiring | | | Net Rentable Area Expiring | | | % of NRA Expiring | | | UW Base Rent Expiring(3) | | | % of UW Base Rent Expiring(3) | | | Cumulative Net Rentable Area Expiring | | | Cumulative % of NRA Expiring | | | Cumulative UW Base Rent Expiring(3) | | | Cumulative % of UW Base Rent Expiring(3) | |
| Vacant | | NAP | | | 64,720 | | | 8.0% | | | NAP | | | NAP | | | 64,720 | | | 8.0% | | | NAP | | | NAP | |
| 2024 & MTM(4) | | 5 | | | 12,234 | | | 1.5 | | | $373,014 | | | 2.4% | | | 76,954 | | | 9.6% | | | $373,014 | | | 2.4% | |
| 2025 | | 9 | | | 96,153 | | | 11.9 | | | 1,839,616 | | | 11.8 | | | 173,107 | | | 21.5% | | | $2,212,630 | | | 14.2% | |
| 2026 | | 9 | | | 28,800 | | | 3.6 | | | 910,149 | | | 5.9 | | | 201,907 | | | 25.1% | | | $3,122,779 | | | 20.1% | |
| 2027 | | 13 | | | 98,396 | | | 12.2 | | | 2,530,027 | | | 16.3 | | | 300,303 | | | 37.3% | | | $5,652,807 | | | 36.4% | |
| 2028 | | 14 | | | 218,204 | | | 27.1 | | | 4,323,202 | | | 27.8 | | | 518,507 | | | 64.4% | | | $9,976,009 | | | 64.2% | |
| 2029 | | 6 | | | 107,356 | | | 13.3 | | | 2,065,848 | | | 13.3 | | | 625,863 | | | 77.8% | | | $12,041,857 | | | 77.5% | |
| 2030 | | 1 | | | 2,021 | | | 0.3 | | | 141,874 | | | 0.9 | | | 627,884 | | | 78.0% | | | $12,183,732 | | | 78.4% | |
| 2031 | | 1 | | | 4,500 | | | 0.6 | | | 171,000 | | | 1.1 | | | 632,384 | | | 78.6% | | | $12,354,732 | | | 79.5% | |
| 2032 | | 5 | | | 31,874 | | | 4.0 | | | 812,230 | | | 5.2 | | | 664,258 | | | 82.5% | | | $13,166,962 | | | 84.8% | |
| 2033 | | 4 | | | 130,766 | | | 16.2 | | | 2,165,048 | | | 13.9 | | | 795,024 | | | 98.8% | | | $15,332,010 | | | 98.7% | |
| 2034 | | 1 | | | 6,301 | | | 0.8 | | | 201,632 | | | 1.3 | | | 801,325 | | | 99.6% | | | $15,533,642 | | | 100.0% | |
| 2035 & Beyond(5) | | 0 | | | 3,482 | | | 0.4 | | | 0 | | | 0.0 | | | 804,807 | | | 100.0% | | | $15,533,642 | | | 100.0% | |
| Total | | 68 | | | 804,807 | | | 100.0% | | | $15,533,642 | | | 100.0% | | | | | |
| (1) | Based on the underwritten rent rolls dated November 21, 2023. |
| (2) | Certain tenants have more than one lease. Certain tenants may have lease termination or contraction options that are exercisable prior to the originally stated expiration date of the subject lease and that are not considered in the lease rollover schedule. |
| (3) | UW Base Rent Expiring, % of UW Base Rent Expiring, Cumulative UW Base Rent Expiring and Cumulative % of UW Base Rent Expiring include average rent steps of $476,800 for Ochsner Fitness, Starbucks and FedEx and contractual rent steps of $208,942 through August 1, 2024. |
| (4) | Includes two tenants that are on MTM leases. |
| (5) | 2035 & Beyond is inclusive of 3,482 square feet of storage space to which no lease or rent is attributable. |
THE INFORMATION IN THIS STRUCTURAL AND COLLATERAL TERM SHEET IS NOT COMPLETE AND MAY BE AMENDED PRIOR TO THE TIME OF SALE. THIS TERM SHEET IS NOT AN OFFER TO SELL THESE SECURITIES AND IT IS NOT A SOLICITATION OF AN OFFER TO BUY THESE SECURITIES IN ANY JURISDICTION WHERE THE OFFER OR SALE IS NOT PERMITTED. |
| | 53 | |
| Structural and Collateral Term Sheet | | BMO 2024-5C3 |
| No. 2 – Elmwood Shopping Center |
The following table presents certain information relating to the operating history and underwritten cash flows at the Elmwood Shopping Center Property:
| Operating History and Underwritten Net Cash Flow |
| | 2019 | 2020 | 2021 | 2022 | T12 October 2023 | Underwritten | Per Square Foot | %(1) |
| In Place Rent | $13,441,496 | $11,870,164 | $13,891,541 | $13,757,145 | $14,288,701 | $14,847,900 | $18.45 | 69.0% |
| Commercial Rent Steps(2) | 0 | 0 | 0 | 0 | 0 | 685,742 | 0.85 | 3.2 |
| Potential Income from Vacant Space | 0 | 0 | 0 | 0 | 0 | 1,984,447 | 2.47 | 9.2 |
| Gross Potential Rent | $13,441,496 | $11,870,164 | $13,891,541 | $13,757,145 | $14,288,701 | $17,518,089 | $21.77 | 81.4% |
| Total Reimbursements | 2,140,027 | 1,607,212 | 2,064,009 | 2,623,320 | 3,459,680 | 4,014,330 | 4.99 | 18.6 |
| Total Gross Income | $15,581,523 | $13,477,376 | $15,955,550 | $16,380,465 | $17,748,381 | $21,532,419 | $26.75 | 100.0% |
| Other Income(3) | 65,591 | 120,936 | 425,248 | 447,681 | 568,883 | 568,883 | 0.71 | 2.6 |
| (Vacancy/Credit Loss) | 0 | 0 | 0 | 0 | 0 | (1,984,447) | (2.47) | (9.2) |
| Effective Gross Income | $15,647,114 | $13,598,312 | $16,380,798 | $16,828,146 | $18,317,264 | 20,116,855 | $25.00 | 93.4% |
| Management Fee | 578,815 | 523,918 | 466,154 | 573,926 | 565,774 | 603,506 | 0.75 | 3.0 |
| Real Estate Taxes | 1,567,866 | 1,580,706 | 1,660,274 | 1,765,934 | 1,922,854 | 1,878,070 | 2.33 | 9.3 |
| Insurance | 732,379 | 760,155 | 871,794 | 1,032,600 | 1,584,963 | 1,962,605 | 2.44 | 9.8 |
| Other Expenses(4) | 1,069,158 | 1,128,548 | 1,137,790 | 1,580,683 | 1,513,556 | 1,513,556 | 1.88 | 7.5 |
| Total Expenses | $3,948,218 | $3,993,327 | $4,136,012 | $4,953,143 | $5,587,147 | $5,957,736 | $7.40 | 29.6% |
| Net Operating Income(5) | $11,698,896 | $9,604,985 | $12,244,786 | $11,875,003 | $12,730,117 | $14,159,119 | $17.59 | 70.4% |
| Capital Expenditures | 0 | 0 | 0 | 0 | 0 | 169,009 | 0.21 | 0.8 |
| TI/LC | 0 | 0 | 0 | 0 | 0 | 0 | 0.00 | 0.0 |
| Net Cash Flow | $11,698,896 | $9,604,985 | $12,244,786 | $11,875,003 | $12,730,117 | $13,990,109 | $17.38 | 69.5% |
| (1) | % column represents percent of Total Gross Income for all revenue lines and represents percent of Effective Gross Income for the remainder of fields. |
| (2) | Underwritten Contractual Rent Steps include average rent steps of $476,800 for Ochsner Fitness, Starbucks and FedEx and contractual rent steps of $208,942 through August 1, 2024. |
| (3) | Other Income includes temporary tenant income related to seasonal tenants and percentage rent. |
| (4) | Other Expenses consist of general operating, CAM, repairs and maintenance, utilities, general and administrative and non-reimbursable expenses. |
| (5) | The increase from T-12 October 2023 Net Operating Income to Underwritten Net Operating Income is primarily driven by increased reimbursements and the borrower sponsor executing lease renewals at higher rents. |
THE INFORMATION IN THIS STRUCTURAL AND COLLATERAL TERM SHEET IS NOT COMPLETE AND MAY BE AMENDED PRIOR TO THE TIME OF SALE. THIS TERM SHEET IS NOT AN OFFER TO SELL THESE SECURITIES AND IT IS NOT A SOLICITATION OF AN OFFER TO BUY THESE SECURITIES IN ANY JURISDICTION WHERE THE OFFER OR SALE IS NOT PERMITTED. |
| | 54 | |
| Structural and Collateral Term Sheet | | BMO 2024-5C3 |
| No. 2 – Elmwood Shopping Center |
The Market. The Elmwood Shopping Center Property is located at 1200 South Clearview Parkway within Elmwood, Louisiana and is part of the New Orleans-Metairie metropolitan statistical area (“New Orleans MSA”). The Elmwood Shopping Center Property is located at the intersection of Clearview Parkway and Jefferson Highway with nearby access to Interstate 10.
According to the appraisal, the Elmwood Shopping Center Property is located in the Elmwood/Harahan submarket of the New Orleans MSA. As of the third quarter of 2023, the Elmwood/Harahan submarket had a total office inventory of 2,205,281 square feet, a vacancy rate of 0.7%, average asking rent of $22.09 per square foot and positive net absorption of 45,285 square feet in the trailing calendar year.
According to the appraisal, the 2023 total population within a one-, three- and five-mile radius is 6,699, 105,156 and 271,290, respectively. Furthermore, the 2023 average household income within a one-, three- and five-mile radius is $84,761, $87,515 and $96,185, respectively.
The Borrower. The borrower is Elmwood Retail Properties, L.L.C., a Louisiana limited liability company and single-purpose entity having at least one independent director in its organizational structure. Legal counsel to the borrower delivered a non-consolidation opinion in connection with the origination of the Elmwood Shopping Center Whole Loan.
The Borrower Sponsor. The borrower sponsor and non-recourse carveout guarantor is Lauricella Land Company, L.L.C. (“Lauricella”). Lauricella is a family-owned commercial real estate development and management company that was founded in the 1940s and has developed shopping centers, hotels, self-storage facilities, apartments, single-family neighborhoods, and theaters throughout the greater New Orleans area.
Property Management. The Elmwood Shopping Center Property is managed by Lauricella, which is a borrower-affiliated management company.
Escrows and Reserves. At origination of the Elmwood Shopping Center Whole Loan, the borrower deposited approximately (i) $164,331 into a reserve account for real estate taxes, (ii) $2,000,549 into a reserve account for immediate repairs, (iii) $5,800,000, into a reserve account for tenant improvements and leasing commissions and (iv) $2,262,243 into a reserve account for unfunded obligations.
Tax Reserve – The borrower is required to deposit into a real estate tax reserve, on a monthly basis, 1/12 of the taxes that the lender estimates will be payable over the next-ensuing 12-month period (initially estimated to be approximately $164,331).
Insurance Reserve – The borrower is required to deposit into an insurance reserve, on a monthly basis, 1/12 of the amount which will be sufficient to pay the insurance premiums due for the renewal of coverage afforded by such policies; provided, however, such insurance reserve has been conditionally waived so long as the borrower maintains a blanket policy meeting the requirements of the Elmwood Shopping Center Whole Loan documents.
Replacement Reserve – The borrower is required to deposit into a replacement reserve, on a monthly basis, approximately $14,084.
Leasing Reserve – On each payment date during a Leasing Reserve Deposit Period (as defined below), the borrower is required to deposit into the leasing reserve an amount equal to approximately $67,067.
“Leasing Reserve Deposit Period” means each period commencing on any date on which the amount of leasing reserve funds on deposit in the leasing reserve account is less than $1,000,000, and ending on the next subsequent date on which the amount of leasing reserve funds on deposit in the leasing reserve account equals or exceeds $2,500,000.
Lockbox / Cash Management. The Elmwood Shopping Center Whole Loan is structured with a hard lockbox and springing cash management. The borrower is required to, and is required to cause the property manager to, immediately deposit all revenue directly into a lender approved lockbox account. The borrower was required to, within ten business days of origination of the Elmwood Shopping Center Whole Loan, deliver a notice to each tenant directing them to remit all rent and other sums due under the applicable lease directly to the lender-controlled lockbox account. All funds deposited into the lockbox are required to be transferred on each business day to or at the direction of the borrower unless a Trigger Period
THE INFORMATION IN THIS STRUCTURAL AND COLLATERAL TERM SHEET IS NOT COMPLETE AND MAY BE AMENDED PRIOR TO THE TIME OF SALE. THIS TERM SHEET IS NOT AN OFFER TO SELL THESE SECURITIES AND IT IS NOT A SOLICITATION OF AN OFFER TO BUY THESE SECURITIES IN ANY JURISDICTION WHERE THE OFFER OR SALE IS NOT PERMITTED. |
| | 55 | |
| Structural and Collateral Term Sheet | | BMO 2024-5C3 |
| No. 2 – Elmwood Shopping Center |
(as defined below) exists and the lender elects (in its sole and absolute discretion) to deliver a restricted account notice. Upon the occurrence and during the continuance of a Trigger Period, if lender elects to deliver a restricted account notice, all funds in the lockbox account are required to be swept on each business day to a lender-controlled cash management account to be applied and disbursed in accordance with the Elmwood Shopping Center Whole Loan documents, and all excess cash flow funds remaining in the cash management account after the application of such funds in accordance with the Elmwood Shopping Center Whole Loan documents are required to be held by the lender in an excess cash flow reserve account as additional collateral for the Elmwood Shopping Center Whole Loan. Upon the cure of the applicable Trigger Period, so long as no other Trigger Period exists, the lender is required to return any amounts remaining on deposit in the excess cash flow reserve account to the borrower. Upon an event of default under the Elmwood Shopping Center Mortgage Loan documents, the lender may apply funds to the debt in such priority as it may determine.
A “Trigger Period” means a period (A) commencing upon the earliest of (i) the occurrence and continuance of an event of default and (ii) the debt service coverage ratio being less than 1.25x, and (B) expiring upon (x) with regard to clause (i) above, the cure (if applicable) of such event of default, and (y) with regard to clause (ii) above, the date that the debt service coverage ratio is equal to or greater than 1.25x for two consecutive calendar quarters.
Subordinate Debt. None.
Mezzanine Debt. None.
Partial Release. At any time, the borrower may obtain a release of the lien of the related security instrument with respect to a certain portion of the Elmwood Shopping Center Property (the “Release Parcel”) without payment of a release price provided that, among other things, (i) no event of default has occurred and is continuing; (ii) the Release Parcel and the portion of the Elmwood Shopping Center Property remaining after giving effect to such release (the “Remaining Property”) constitutes one or more separate legal lots and tax parcels, and such Remaining Property complies with applicable zoning laws, ordinances, land use and other governmental rules and regulations and other applicable legal requirements; (iii) the borrower delivers a rating agency confirmation, if required by the lender; and (iv) if at the time of the release, the Elmwood Shopping Center Whole Loan is included in a REMIC trust and the loan-to-value ratio of the Remaining Property would exceed 125% immediately after the release, the borrower pays down the principal balance of the Elmwood Shopping Center Whole Loan by a qualified amount, unless the lender receives an opinion that, if the foregoing payment requirement is not followed, the applicable REMIC trust will not fail to maintain its status as a REMIC trust as a result of such release.
Ground Lease. None.
THE INFORMATION IN THIS STRUCTURAL AND COLLATERAL TERM SHEET IS NOT COMPLETE AND MAY BE AMENDED PRIOR TO THE TIME OF SALE. THIS TERM SHEET IS NOT AN OFFER TO SELL THESE SECURITIES AND IT IS NOT A SOLICITATION OF AN OFFER TO BUY THESE SECURITIES IN ANY JURISDICTION WHERE THE OFFER OR SALE IS NOT PERMITTED. |
| | 56 | |
| Structural and Collateral Term Sheet | | BMO 2024-5C3 |
| No. 3 – Margaritaville Lake of the Ozarks |

THE INFORMATION IN THIS STRUCTURAL AND COLLATERAL TERM SHEET IS NOT COMPLETE AND MAY BE AMENDED PRIOR TO THE TIME OF SALE. THIS TERM SHEET IS NOT AN OFFER TO SELL THESE SECURITIES AND IT IS NOT A SOLICITATION OF AN OFFER TO BUY THESE SECURITIES IN ANY JURISDICTION WHERE THE OFFER OR SALE IS NOT PERMITTED. |
| | 57 | |
| Structural and Collateral Term Sheet | | BMO 2024-5C3 |
| No. 3 – Margaritaville Lake of the Ozarks |
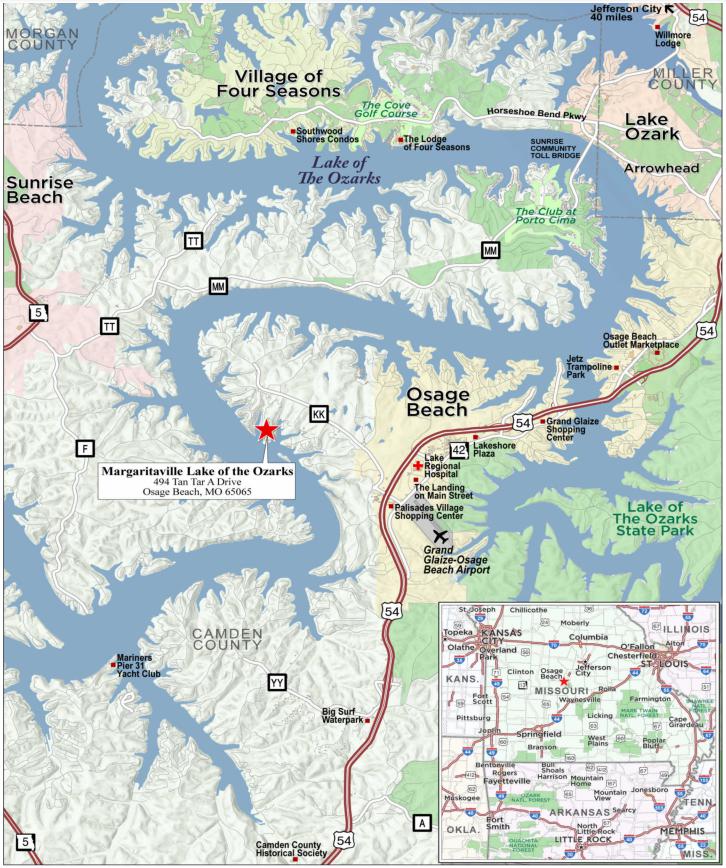
THE INFORMATION IN THIS STRUCTURAL AND COLLATERAL TERM SHEET IS NOT COMPLETE AND MAY BE AMENDED PRIOR TO THE TIME OF SALE. THIS TERM SHEET IS NOT AN OFFER TO SELL THESE SECURITIES AND IT IS NOT A SOLICITATION OF AN OFFER TO BUY THESE SECURITIES IN ANY JURISDICTION WHERE THE OFFER OR SALE IS NOT PERMITTED. |
| | 58 | |
| Structural and Collateral Term Sheet | | BMO 2024-5C3 |
| No. 3 – Margaritaville Lake of the Ozarks |
| Mortgage Loan Information | | Property Information |
| Mortgage Loan Sellers: | SMC, GSMC | | Single Asset / Portfolio: | Single Asset |
| Original Principal Balance: | $60,500,000 | | Title(2): | Fee/Leasehold |
| Cut-off Date Principal Balance: | $60,500,000 | | Property Type - Subtype: | Hospitality – Full Service |
| % of Pool by IPB: | 6.7% | | Net Rentable Area (Rooms): | 520 |
| Loan Purpose: | Refinance | | Location: | Osage Beach, MO |
| Borrower: | Tan Tar A State Road, LLC | | Year Built / Renovated: | 1960 / 2023 |
| Borrower Sponsors: | Carlos J. Rodriguez, Sr. and Carlos J. Rodriguez, Jr. | | Occupancy / ADR / RevPAR: | 54.5% / $165.86 / $90.44 |
| Interest Rate: | 7.41000% | | Occupancy / ADR / RevPAR Date: | 10/31/2023 |
| Note Date: | 1/10/2024 | | 4th Most Recent NOI (As of)(3): | $3,466,476 (12/31/2020) |
| Maturity Date: | 2/6/2029 | | 3rd Most Recent NOI (As of)(3): | $7,322,604 (12/31/2021) |
| Interest-only Period: | 60 months | | 2nd Most Recent NOI (As of): | $9,895,372 (12/31/2022) |
| Original Term: | 60 months | | Most Recent NOI (As of)(4): | $10,421,934 (TTM 10/31/2023) |
| Original Amortization: | None | | UW Occupancy / ADR / RevPAR: | 52.8% / $165.96 / $87.56 |
| Amortization Type: | Interest Only | | UW Revenues: | $38,108,811 |
| Call Protection: | L(24),DorYM1(29),O(7) | | UW Expenses: | $27,746,341 |
| Lockbox / Cash Management: | Soft / Springing | | UW NOI(4): | $10,362,469 |
| Additional Debt: | No | | UW NCF: | $8,838,117 |
| Additional Debt Balance: | N/A | | Appraised Value / Per Room: | $108,000,000 / $207,692 |
| Additional Debt Type: | N/A | | Appraisal Date: | 11/29/2023 |
| | | | | |
| Escrows and Reserves(1) | | Financial Information |
| | Initial | Monthly | Initial Cap | | Cut-off Date Loan / Room: | $116,346 |
| Taxes: | $83,872 | $27,957 | N/A | | Maturity Date Loan / Room: | $116,346 |
| Insurance: | $0 | Springing | N/A | | Cut-off Date LTV: | 56.0% |
| FF&E Reserves: | $0 | $127,029 | N/A | | Maturity Date LTV: | 56.0% |
| Seasonality Reserve: | $0 | Springing | $3,000,000 | | UW NCF DSCR: | 1.94x |
| | | | | | UW NOI Debt Yield: | 17.1% |
| | | | | | | |
| Sources and Uses |
| Sources | Proceeds | % of Total | | Uses | Proceeds | % of Total | |
| Mortgage Loan | $60,500,000 | 100.0% | | Return of Equity | $34,678,136 | 57.3 | % |
| | | | | Loan Payoff | 24,860,492 | 41.1 | |
| | | | | Closing Costs | 877,500 | 1.5 | |
| | | | | Upfront Reserves | 83,872 | 0.1 | |
| Total Sources | $60,500,000 | 100.0% | | Total Uses | $60,500,000 | 100.0 | % |
| (1) | For a full description of Escrows and Reserves, please refer to “Escrows and Reserves” below. |
| (2) | Collateral for the Margaritaville Lake of the Ozarks Mortgage Loan (as defined below) includes (i) the fee simple interest in approximately 176 acres (which includes the guest rooms and most amenities) and (ii) the leasehold interest in approximately 0.68 acres which comprises a maintenance building. The leasehold interest is subject to a ground lease with a 99-year term anticipated to expire in August 2076 with total annual rent payments equal to $1.00. |
| (3) | Historical NOI reflects operations impacted by the COVID-19 pandemic. |
| (4) | The borrower sponsors purchased the Margaritaville Lake of the Ozarks Property (as defined below) in June 2017 for $30.0 million and have completed approximately $26.5 million in PIP work and capital expenditure projects as part of the hotel's conversion to a branded Margaritaville resort. Projects included an expansion with 26 additional hotel rooms (opened in July and August 2023), room renovations (which included new case goods, flooring, beds, lighting and art work) and construction of the Landshark Bar & Grill, which is a lakeside pool and bar. The increase in NOI between the Most Recent NOI and the UW NOI is primarily driven by 26 additional rooms coming online in July and August 2023. |
The Loan. The third largest mortgage loan (the “Margaritaville Lake of the Ozarks Mortgage Loan”) has an outstanding principal balance as of the Cut-off Date of $60,500,000 and is secured by the borrower’s fee and ground leasehold interest in a 520-room, full service hotel located in Osage Beach, Missouri (the “Margaritaville Lake of the Ozarks Property”). The Margaritaville Lake of the Ozarks Mortgage Loan was co-originated on January 10, 2024 by Starwood Mortgage Capital LLC (“SMC”) and Goldman Sachs Bank USA (“GS”).
THE INFORMATION IN THIS STRUCTURAL AND COLLATERAL TERM SHEET IS NOT COMPLETE AND MAY BE AMENDED PRIOR TO THE TIME OF SALE. THIS TERM SHEET IS NOT AN OFFER TO SELL THESE SECURITIES AND IT IS NOT A SOLICITATION OF AN OFFER TO BUY THESE SECURITIES IN ANY JURISDICTION WHERE THE OFFER OR SALE IS NOT PERMITTED. |
| | 59 | |
| Structural and Collateral Term Sheet | | BMO 2024-5C3 |
| No. 3 – Margaritaville Lake of the Ozarks |
The Margaritaville Lake of the Ozarks Mortgage Loan has a five-year term, is interest-only for the entire loan term and accrues interest on an Actual/360 basis. The scheduled maturity date of the Margaritaville Lake of the Ozarks Mortgage Loan is the monthly payment date that occurs in February 2029.
| Whole Loan Summary |
| Note | Original Balance | Cut-off Date Balance | Note Holder | Controlling Piece |
| A-1 | $30,250,000 | $30,250,000 | BMO 2024-5C3 | Yes |
| A-2 | $30,250,000 | $30,250,000 | BMO 2024-5C3 | No |
| Whole Loan | $60,500,000 | $60,500,000 | | |
The Property. The Margaritaville Lake of the Ozarks Property is a 520-room full service hotel located along the shoreline of Osage Beach, Missouri. The Margaritaville Lake of the Ozarks Property, which was previously known as Tan-Tar-A Resort, opened in 1960. The Margaritaville Lake of the Ozarks Property is a destination resort that is located on the shores of the 54,000-acre Lake of the Ozarks. Amenities at the Margaritaville Lake of the Ozarks Property include 76,748 square feet of meeting space, a 126-boat slip marina offering boat and water sport rentals, a 20,000 square foot indoor waterpark, 18-holes of golf and nine food and beverage outlets (including three full-service restaurants and a poolside bar).
The Margaritaville Lake of the Ozarks Property offers guests a wide array of accommodations including single rooms, one-bedroom suites, two-bedroom suites and parlor suites. Standard guestroom amenities include personal refrigerators, flat-screen televisions, free high-speed internet access and a work area. The Margaritaville Lake of the Ozarks Property’s suites, including one-bedroom suites, two-bedroom suites, and parlor suites, offer a kitchenette with a half-size refrigerator and freezer, oven, stove, sink, toaster and microwave. Furthermore, the Margaritaville Lake of the Ozarks Property’s one-bedroom and two-bedroom suites offer living quarters that are large enough to sleep up to five and eight guests, respectively.
The borrower sponsors began managing the Margaritaville Lake of the Ozarks Property through their management company in 2012 when the prior loan on the Margaritaville Lake of the Ozarks Property transferred to special servicing. The borrower sponsors acquired the Margaritaville Lake of the Ozarks Property in 2017 for $30.0 million from an REO sale. At the time, the Margaritaville Lake of the Ozarks Property was unflagged and in a state of disrepair after the prior owner lost the Margaritaville Lake of the Ozarks Property in a foreclosure. Following its acquisition, the borrower sponsors converted the Margaritaville Lake of the Ozarks Property to a Margaritaville-branded resort. As part of the conversion, the Margaritaville Lake of the Ozarks Property underwent substantial improvements, including full guest room renovations, the addition of two restaurants and bars, as well as exterior and pool renovations. In total, the borrower sponsors have invested approximately $26,530,000 ($51,000/room) to flag the hotel as a Margaritaville resort. In connection with the borrower sponsor’s acquisition, the borrower entered into a new 20-year franchise agreement following the flag conversion in 2019. The franchise agreement’s initial term expires in 2039 with two, five-year extension options.
Appraisal. According to the appraisal, the Margaritaville Lake of the Ozarks Property had an “as-is” appraised value of $108,000,000 as of November 29, 2023. The table below shows the appraisal’s “as-is” conclusions.
| Appraisal Valuation Summary(1) |
| Appraisal Approach | Appraised Value | Capitalization Rate(2) |
| Income Capitalization Approach | $108,000,000 | 8.00% |
| (2) | The appraisal used an income capitalization approach to arrive at the appraised value. The capitalization rates shown above represent the reversionary capitalization rate. |
Environmental. According to the Phase I environmental assessment dated December 7, 2023, there is a recognized environmental condition at the Margaritaville Lake of the Ozarks Property relating to four underground storage tanks that were installed in the early 1970s and removed in 1986; however, there are no closure reports or removal documentation. As such, the Phase I environmental assessment recommended the performance of a subsurface investigation of the site of the former underground storage tanks which was estimated to cost from $15,000 to $435,000. At origination of the Margaritaville Lake of the Ozarks Mortgage Loan, a $1,000,000 environmental insurance policy for the benefit of the lender was obtained.
THE INFORMATION IN THIS STRUCTURAL AND COLLATERAL TERM SHEET IS NOT COMPLETE AND MAY BE AMENDED PRIOR TO THE TIME OF SALE. THIS TERM SHEET IS NOT AN OFFER TO SELL THESE SECURITIES AND IT IS NOT A SOLICITATION OF AN OFFER TO BUY THESE SECURITIES IN ANY JURISDICTION WHERE THE OFFER OR SALE IS NOT PERMITTED. |
| | 60 | |
| Structural and Collateral Term Sheet | | BMO 2024-5C3 |
| No. 3 – Margaritaville Lake of the Ozarks |
The Market. The Lake of the Ozarks is home to one of the Midwest’s most popular lake destinations, with more than 1,150 miles of shoreline. The Lake of the Ozarks offers access to public beaches, fishing, watersports, golfing, and state parks, bringing more than five million visitors annually due to its central location to several major cities in the Midwest. According to the appraisal, the Margaritaville Lake of the Ozarks Property’s demand concentration is 70% meeting and group business and 30% transient business.
The following table presents certain information relating to the current and historical occupancy, ADR and RevPAR at the Margaritaville Lake of the Ozarks Property and its competitors:
| Historical Occupancy, ADR, RevPAR(1)(2) |
| | Competitive Set(3) | Margaritaville Lake of the Ozarks(4) | Penetration Factor |
| Year | Occupancy | ADR | RevPAR | Occupancy | ADR | RevPAR | Occupancy | ADR | RevPAR |
| 2020 | 33.6% | $130.03 | $43.67 | 29.2% | $159.04 | $46.49 | 87.0% | 122.3% | 106.4% |
| 2021 | 41.2% | $157.26 | $64.82 | 42.8% | $162.32 | $69.48 | 103.8% | 103.2% | 107.2% |
| 2022 | 45.5% | $154.85 | $70.46 | 54.0% | $162.79 | $87.86 | 118.6% | 105.1% | 124.7% |
| TTM(5) | 50.3% | $152.61 | $76.70 | 54.5% | $165.86 | $90.44 | 108.5% | 108.7% | 117.9% |
| (1) | Data provided by a third party market research report. |
| (2) | The variances between the underwriting, appraisal and third party market research provider data with respect to Occupancy, ADR and RevPAR at the Margaritaville Lake of the Ozarks Property are attributable to differing reporting methodologies and/or timing differences. |
| (3) | The competitive set includes Capitol Plaza Hotel, Chateau On The Lake Resort, Holiday Inn Executive Center Columbia Mall, Camden On The Lake and Hilton Branson Convention Center. |
| (4) | Data based on the underwritten Occupancy, ADR and RevPAR. |
| (5) | TTM represents the trailing 12-month period ending October 31, 2023. |
The following table presents certain information relating to the operating history and underwritten cash flows of the Margaritaville Lake of the Ozarks Property:
Operating History and Underwritten Net Cash Flow |
| | 2020 | 2021 | 2022(1) | TTM(1)(2) | Underwritten(1) | Per Room(3) | %(4) | |
| Occupancy | 29.2% | 42.8% | 54.0% | 54.5% | 52.8% | | |
| ADR | $159.04 | $162.32 | $162.79 | $165.86 | $165.96 | | |
| RevPAR | $46.49 | $69.48 | $87.86 | $90.44 | $87.56 | | |
| | | | | | | | | |
| Room Revenue | $8,404,934 | $12,527,704 | $15,841,945 | $16,591,657 | $16,619,607 | $31,961 | 43.6 | % |
| Food & Beverage Revenue | 6,766,438 | 10,884,840 | 13,991,862 | 14,731,291 | 14,746,901 | 28,359 | 38.7 | |
| Other Departmental Revenue | 4,940,664 | 6,148,260 | 6,747,708 | 6,735,166 | 6,742,303 | 12,966 | 17.7 | |
| Total Revenue | $20,112,036 | $29,560,804 | $36,581,515 | $38,058,114 | $38,108,811 | $73,286 | 100.0 | % |
| | | | | | | | | |
| Room Expense | 2,642,436 | 3,739,549 | 4,575,627 | 4,872,127 | 4,880,334 | 9,385 | 29.4 | |
| | | | | | | | | |
| Food & Beverage Expenses | 4,333,653 | 6,458,340 | 8,344,974 | 8,899,819 | 8,909,249 | 17,133 | 60.4 | |
| | | | | | | | | |
| Other Departmental Expenses | 2,549,395 | 2,988,033 | 3,267,551 | 3,051,684 | 3,054,918 | 5,875 | 45.3 | |
| Departmental Expenses | $9,525,484 | $13,185,922 | $16,188,152 | $16,823,629 | $16,844,501 | $32,393 | 44.2 | % |
| | | | | | | | | |
| Gross Operating Income | $10,586,551 | $16,374,882 | $20,393,363 | $21,234,484 | $21,264,309 | $40,893 | 55.8 | % |
| | | | | | | | | |
| Operating Expenses | $5,727,939 | $7,633,625 | $8,911,808 | $9,086,694 | $9,098,943 | $17,498 | 23.9 | % |
| | | | | | | | | |
| Gross Operating Profit | $4,858,612 | $8,741,257 | $11,481,555 | $12,147,790 | $12,165,366 | $23,395 | 31.9 | % |
| | | | | | | | | |
| Fixed Expenses | $1,392,136 | $1,418,652 | $1,586,183 | $1,725,856 | $1,802,897 | $3,467 | 4.7 | % |
| | | | | | | | | |
| Net Operating Income | $3,466,476 | $7,322,604 | $9,895,372 | $10,421,934 | $10,362,469 | $19,928 | 27.2 | % |
| FF&E | 804,481 | 1,182,432 | 1,463,261 | 1,522,325 | 1,524,352 | 2,931 | 4.0 | |
| Net Cash Flow | $2,661,995 | $6,140,172 | $8,432,111 | $8,899,610 | $8,838,117 | $16,996 | 23.2 | % |
| (1) | The increase in NOI between 2022 and the UW NOI is primarily driven by 26 additional rooms coming online in July and August 2023. |
| (2) | TTM column reflects the trailing 12 months ending October 31, 2023. |
| (3) | Per Room values are based on 520 rooms. |
| (4) | % column represents percent of Total Revenue except for Room Expense, Food & Beverage Expenses and Other Departmental Expenses which are based on their corresponding revenue line items. |
THE INFORMATION IN THIS STRUCTURAL AND COLLATERAL TERM SHEET IS NOT COMPLETE AND MAY BE AMENDED PRIOR TO THE TIME OF SALE. THIS TERM SHEET IS NOT AN OFFER TO SELL THESE SECURITIES AND IT IS NOT A SOLICITATION OF AN OFFER TO BUY THESE SECURITIES IN ANY JURISDICTION WHERE THE OFFER OR SALE IS NOT PERMITTED. |
| | 61 | |
| Structural and Collateral Term Sheet | | BMO 2024-5C3 |
| No. 3 – Margaritaville Lake of the Ozarks |
The Borrower. The borrower is Tan Tar A State Road, LLC, a Delaware limited liability company and special purpose entity with two independent directors. Legal counsel to the borrower provided a non-consolidation opinion in connection with the origination of the Margaritaville Lake of the Ozarks Mortgage Loan.
The Borrower Sponsors. The borrower sponsors and guarantors are Carlos J. Rodriguez, Sr. and Carlos J. Rodriguez, Jr. The borrower sponsors are principals of Driftwood Hospitality (“Driftwood”). Driftwood is a commercial real estate investment, development, and lending platform specializing in the hospitality sector. The principals of Driftwood Hospitality have over 30 years of experience. Driftwood currently operates 86 hotels with more than 16,500 rooms throughout the United States, the Bahamas and Costa Rica. Driftwood’s portfolio includes several brands that range from full-service hotels and resorts to midsize select-service, extended stay, and independent boutiques. Driftwood’s hotels include Marriott, Hilton, Hyatt, IHG and Wyndham flagged properties.
Property Management. The Margaritaville Lake of the Ozarks Property is managed by Driftwood Hospitality Management II, LLC, an affiliate of the borrower.
Escrows and Reserves. At origination, the borrower deposited into escrow approximately $83,872 for real estate taxes.
Tax Escrows – On a monthly basis, the borrower is required to escrow 1/12th of the annual estimated tax payments, which currently equates to $27,957.
Insurance Escrows – On a monthly basis, the borrower is required to escrow 1/12th of the annual estimated insurance payments; however, such monthly insurance escrow is suspended so long as the borrower maintains a blanket policy acceptable to the lender and no event of default is ongoing, among other conditions. The monthly insurance escrow is currently suspended.
Replacement Reserves – On a monthly basis, the borrower is required to escrow an amount equal to 1/12th of 4% of annual gross revenues, which currently equates to $127,029.
Seasonality Reserve – On a monthly basis in July, August, September and October of each year, the borrower is required to deposit $750,000 subject to a cap of $3,000,000. The lender is required to disburse $600,000 from the seasonality reserve to the borrower on each monthly payment date in November, December, January, February and March.
Lockbox / Cash Management. The Margaritaville Lake of the Ozarks Mortgage Loan is structured with a soft lockbox and springing cash management. The borrower or property manager, as applicable, must cause all credit card receipts to be deposited into the lockbox account. On each business day, all funds in the lockbox account will be swept to an account designated by the borrower. Upon the occurrence and during the continuance of a Margaritaville Lake of the Ozarks Sweep Event Period (as defined below), all funds in the lockbox account are required to be swept daily to a cash management account under the control of the lender to be applied and disbursed in accordance with the Margaritaville Lake of the Ozarks Mortgage Loan documents, and all excess cash flow funds remaining in the cash management account after the application of such funds in accordance with the Margaritaville Lake of the Ozarks Mortgage Loan documents are required to be held by the lender in an excess cash flow reserve account as additional collateral for the Margaritaville Lake of the Ozarks Mortgage Loan. To the extent that no Margaritaville Lake of the Ozarks Sweep Event Period is continuing, all excess cash flow funds are required to be disbursed to the borrower.
A “Margaritaville Lake of the Ozarks Sweep Event Period” will commence upon the earliest of the following: (i) the occurrence of an event of default under the Margaritaville Lake of the Ozarks Mortgage Loan documents; (ii) the date on which the debt service coverage ratio (based on a 30-year amortization schedule) is less than 1.25x based on the trailing 12 months; (iii) the expiration of the franchise agreement; (iv) a default under the franchise agreement; (v) the borrower or franchisor delivers notice of its intent to termination the franchise agreement; or (vi) the termination of the franchise agreement.
A Margaritaville Lake of the Ozarks Sweep Event Period will end: (a) with regard to clause (i), upon the cure of such event of default and the lender’s acceptance of such cure in its sole and absolute discretion; (b) with regard to clause (ii), upon the debt service coverage ratio (based on a 30-year amortization schedule) based on the trailing 12-month period being at least 1.30x for two consecutive calendar quarters; (c) with regard to clauses (iii), (iv), (v), and (vi), upon the borrower (x) entering into a qualified franchise agreement, (y) the term of the related franchise agreement commencing and (z) the
THE INFORMATION IN THIS STRUCTURAL AND COLLATERAL TERM SHEET IS NOT COMPLETE AND MAY BE AMENDED PRIOR TO THE TIME OF SALE. THIS TERM SHEET IS NOT AN OFFER TO SELL THESE SECURITIES AND IT IS NOT A SOLICITATION OF AN OFFER TO BUY THESE SECURITIES IN ANY JURISDICTION WHERE THE OFFER OR SALE IS NOT PERMITTED. |
| | 62 | |
| Structural and Collateral Term Sheet | | BMO 2024-5C3 |
| No. 3 – Margaritaville Lake of the Ozarks |
borrower delivers to the lender a comfort letter from the franchisor; (d) with regard to clause (iv), upon the cure of such default; and (e) with regard to clause (v), upon the borrower or franchisor withdrawing its notice to terminate the franchise agreement.
Subordinate Debt. None.
Mezzanine Debt. From and after January 10, 2026, the borrower is permitted to obtain mezzanine debt from an acceptable mezzanine lender under the following conditions, among others: (a) minimum combined debt service coverage ratio of 1.40x, (b) aggregate maximum loan-to-value ratio of 75.0%, (c) the Margaritaville Lake of the Ozarks Property will have satisfied a minimum debt yield of 15.00% for at least two consecutive non-overlapping trailing 12 month calendar periods, (d) delivery of an intercreditor agreement satisfactory to the mortgage lender and (e) rating agency confirmation.
Partial Release. The borrower may obtain a release of the portion of the Margaritaville Lake of the Ozarks Property subject to the ground lease described immediately below for no value. Such ground leased parcel contains a maintenance building and certain ancillary storage buildings – none of which were given any value in the appraisal. Such partial release is conditioned on, amongst other things, any support facilities located on the release property and reasonably necessary for the operation of the remaining Margaritaville Lake of the Ozarks Property being satisfactorily relocated on the remaining Margaritaville Lake of the Ozarks Property and the partial release having no adverse REMIC impact.
Ground Lease. The Margaritaville Lake of the Ozarks Mortgage Loan is secured in part by the borrower’s leasehold interest in a 0.68-acre parcel under a ground lease for a maintenance shed with the neighboring homeowner’s association. The ground lease is currently scheduled to expire on August 11, 2076 and requires ground rent payments equal to $1.00 per annum. The ground lease has two 99-year renewal options with no rental increases. The borrower and the borrower sponsors are liable for losses resulting from any failure to pay ground rent as required under the ground lease or if the ground lease terminates or expires for any reason during the term of the Margaritaville Lake of the Ozarks Mortgage Loan.
THE INFORMATION IN THIS STRUCTURAL AND COLLATERAL TERM SHEET IS NOT COMPLETE AND MAY BE AMENDED PRIOR TO THE TIME OF SALE. THIS TERM SHEET IS NOT AN OFFER TO SELL THESE SECURITIES AND IT IS NOT A SOLICITATION OF AN OFFER TO BUY THESE SECURITIES IN ANY JURISDICTION WHERE THE OFFER OR SALE IS NOT PERMITTED. |
| | 63 | |
| Structural and Collateral Term Sheet | | BMO 2024-5C3 |
| No. 4 – Galleria at Tyler |
THE INFORMATION IN THIS STRUCTURAL AND COLLATERAL TERM SHEET IS NOT COMPLETE AND MAY BE AMENDED PRIOR TO THE TIME OF SALE. THIS TERM SHEET IS NOT AN OFFER TO SELL THESE SECURITIES AND IT IS NOT A SOLICITATION OF AN OFFER TO BUY THESE SECURITIES IN ANY JURISDICTION WHERE THE OFFER OR SALE IS NOT PERMITTED. |
| | 64 | |
| Structural and Collateral Term Sheet | | BMO 2024-5C3 |
| No. 4 – Galleria at Tyler |
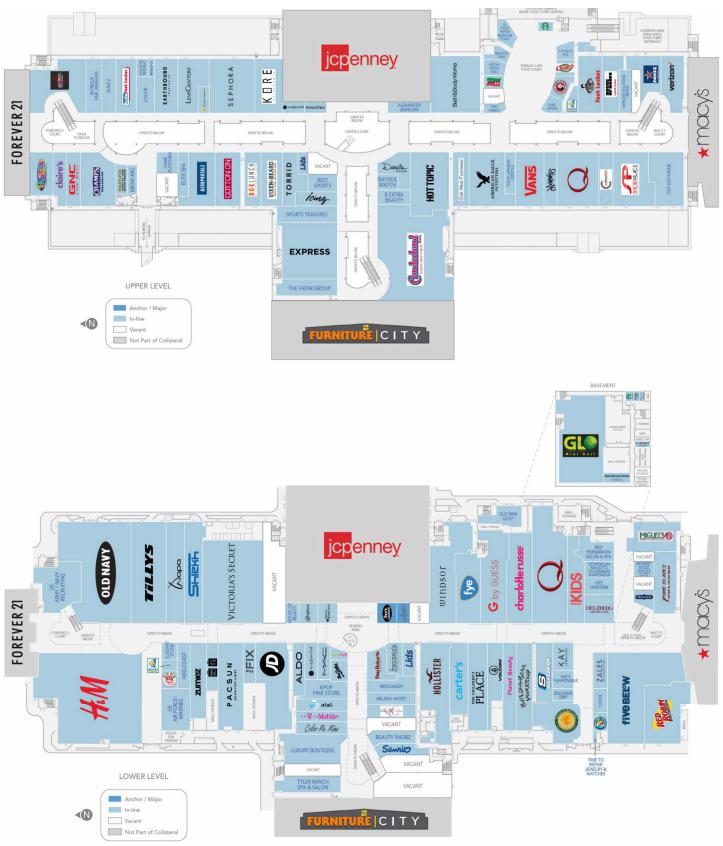
THE INFORMATION IN THIS STRUCTURAL AND COLLATERAL TERM SHEET IS NOT COMPLETE AND MAY BE AMENDED PRIOR TO THE TIME OF SALE. THIS TERM SHEET IS NOT AN OFFER TO SELL THESE SECURITIES AND IT IS NOT A SOLICITATION OF AN OFFER TO BUY THESE SECURITIES IN ANY JURISDICTION WHERE THE OFFER OR SALE IS NOT PERMITTED. |
| | 65 | |
| Structural and Collateral Term Sheet | | BMO 2024-5C3 |
| No. 4 – Galleria at Tyler |
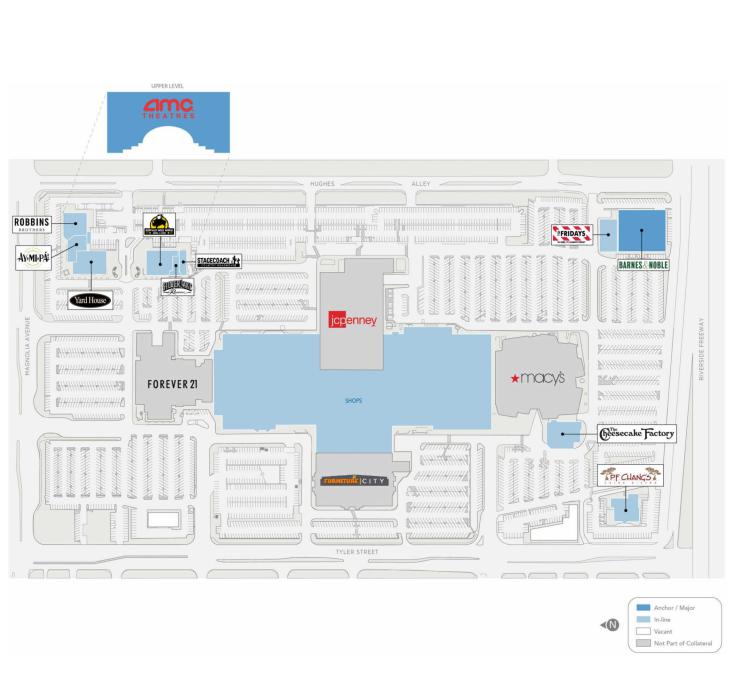
THE INFORMATION IN THIS STRUCTURAL AND COLLATERAL TERM SHEET IS NOT COMPLETE AND MAY BE AMENDED PRIOR TO THE TIME OF SALE. THIS TERM SHEET IS NOT AN OFFER TO SELL THESE SECURITIES AND IT IS NOT A SOLICITATION OF AN OFFER TO BUY THESE SECURITIES IN ANY JURISDICTION WHERE THE OFFER OR SALE IS NOT PERMITTED. |
| | 66 | |
| Structural and Collateral Term Sheet | | BMO 2024-5C3 |
| No. 4 – Galleria at Tyler |
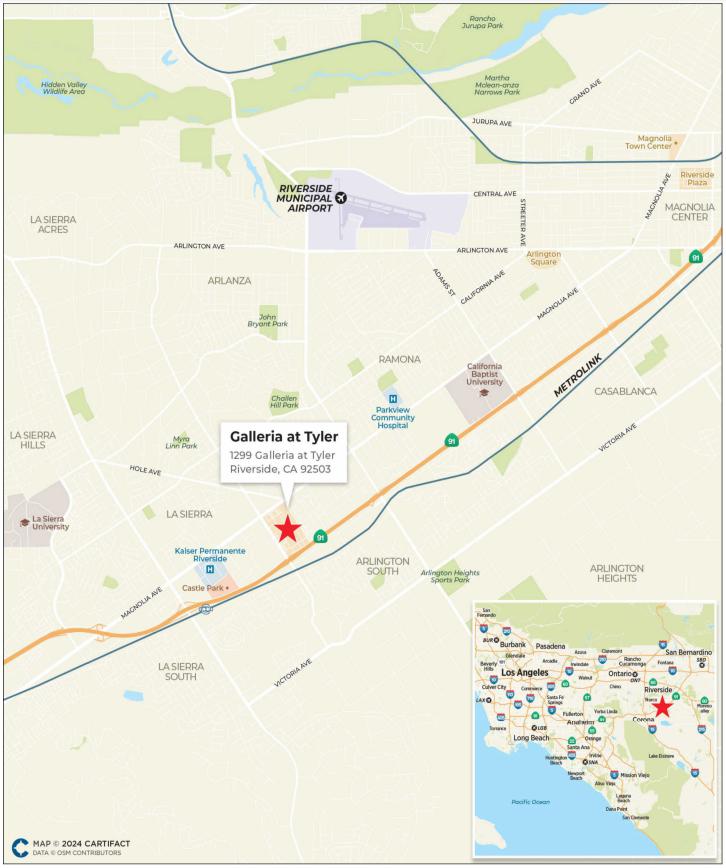
THE INFORMATION IN THIS STRUCTURAL AND COLLATERAL TERM SHEET IS NOT COMPLETE AND MAY BE AMENDED PRIOR TO THE TIME OF SALE. THIS TERM SHEET IS NOT AN OFFER TO SELL THESE SECURITIES AND IT IS NOT A SOLICITATION OF AN OFFER TO BUY THESE SECURITIES IN ANY JURISDICTION WHERE THE OFFER OR SALE IS NOT PERMITTED. |
| | 67 | |
| Structural and Collateral Term Sheet | | BMO 2024-5C3 |
| No. 4 – Galleria at Tyler |
| Mortgage Loan Information | | Property Information |
| Mortgage Loan Sellers: | SGFC, GACC | | Single Asset / Portfolio: | Single Asset |
| Original Principal Balance(1): | $50,000,000 | | Title: | Fee |
| Cut-off Date Principal Balance(1): | $50,000,000 | | Property Type – Subtype: | Retail – Super Regional Mall |
| % of IPB: | 5.5% | | Net Rentable Area (SF)(5): | 565,913 |
| Loan Purpose: | Refinance | | Location: | Riverside, CA |
| Borrower: | Tyler Mall Limited Partnership | | Year Built / Renovated: | 1970 / 1991, 2007 |
| Borrower Sponsors: | Brookfield Properties Retail Holding LLC and Teachers’ Retirement System of the State of Illinois | | Occupancy: | 90.3% |
| Interest Rate: | 7.91900% | | Occupancy Date: | 12/18/2023 |
| Note Date: | 12/13/2023 | | 4th Most Recent NOI (As of): | $20,929,304 (12/31/2020) |
| Maturity Date: | 1/1/2029 | | 3rd Most Recent NOI (As of): | $19,509,271 (12/31/2021) |
| Interest-only Period: | 60 months | | 2nd Most Recent NOI (As of): | $24,423,689 (12/31/2022) |
| Original Term: | 60 months | | Most Recent NOI (As of): | $23,997,964 (TTM 11/30/2023) |
| Original Amortization Term: | None | | UW Economic Occupancy: | 87.9% |
| Amortization Type: | Interest Only | | UW Revenues: | $36,420,340 |
| Call Protection(2): | L(25),D(28),O(7) | | UW Expenses: | $11,434,747 |
| Lockbox / Cash Management: | Hard / Springing | | UW NOI: | $24,985,593 |
| Additional Debt(1): | Yes | | UW NCF: | $23,644,379 |
| Additional Debt Balance(1): | $100,000,000 | | Appraised Value / Per SF: | $300,000,000 / $530 |
| Additional Debt Type(1): | Pari Passu | | Appraisal Date: | 10/12/2023 |
| | | | | |
| Escrows and Reserves(3) | | Financial Information(1) |
| | Initial | Monthly | Initial Cap | | Cut-off Date Loan / SF: | $265 |
| Taxes: | $0 | Springing | N/A | | Maturity Date Loan / SF: | $265 |
| Insurance: | $0 | Springing | N/A | | Cut-off Date LTV: | 50.0% |
| Replacement Reserves: | $0 | Springing | N/A | | Maturity Date LTV: | 50.0% |
| TI/LC: | $0 | Springing | N/A | | UW NCF DSCR: | 1.96x |
| Other Reserves(4): | $9,924,378 | $0 | N/A | | UW NOI Debt Yield: | 16.7% |
| | | | | | | |
| | | | | | | |
| Sources and Uses |
| Sources | Proceeds | % of Total | | | Uses | Proceeds | % of Total | |
| Whole Loan(1) | $150,000,000 | 91.8 | % | | Loan Payoff | $152,794,561 | 93.5 | % |
| Borrower Sponsor Equity | 13,330,744 | 8.2 | | | Upfront Reserves | 9,924,378 | 6.1 | |
| | | | | Closing Costs | 611,806 | 0.4 | |
| | | | | | | |
| Total Sources | $163,330,744 | 100.0 | % | | Total Uses | $163,330,744 | 100.0 | % |
| (1) | The Galleria at Tyler Mortgage Loan (as defined below) is part of the Galleria at Tyler Whole Loan (as defined below), which is comprised of nine pari passu notes with an aggregate original principal balance and Cut-off Date Balance of $150,000,000. The Galleria at Tyler Whole Loan was co-originated by Deutsche Bank AG, New York Branch (“DBNY”), Bank of America, N.A. (“BANA”) and Société Générale Financial Corporation (“SGFC”). The Financial Information in the chart above is based on the aggregate outstanding principal balance as of the Cut-off Date of the Galleria at Tyler Whole Loan. |
| (2) | The lockout period will be at least 25 payment dates beginning with and including the first payment date on February 1, 2024. Defeasance of the Galleria at Tyler Whole Loan is permitted at any time after the earlier to occur of (a) the end of the two-year period commencing on the closing date of the securitization of the last promissory note representing a portion of the Galleria at Tyler Whole Loan to be securitized and (b) December 13, 2026. The assumed defeasance lockout period of 25 payments is based on the expected BMO 2024-5C3 securitization closing date in February 2024. The actual lockout period may be longer. |
| (3) | See “Escrows and Reserves” below for further discussion of reserve information. |
| (4) | Other Reserves consists of a general reserve ($5,000,000), outstanding landlord obligations reserve ($4,687,691), and a gap rent reserve ($236,687). |
| (5) | The Galleria at Tyler Property (as defined below) is the collateral portion of a larger mall containing 1,187,621 square feet. |
THE INFORMATION IN THIS STRUCTURAL AND COLLATERAL TERM SHEET IS NOT COMPLETE AND MAY BE AMENDED PRIOR TO THE TIME OF SALE. THIS TERM SHEET IS NOT AN OFFER TO SELL THESE SECURITIES AND IT IS NOT A SOLICITATION OF AN OFFER TO BUY THESE SECURITIES IN ANY JURISDICTION WHERE THE OFFER OR SALE IS NOT PERMITTED. |
| | 68 | |
| Structural and Collateral Term Sheet | | BMO 2024-5C3 |
| No. 4 – Galleria at Tyler |
The Loan. The fourth largest mortgage loan (the “Galleria at Tyler Mortgage Loan”) is part of a whole loan (the “Galleria at Tyler Whole Loan”) that is evidenced by nine pari passu promissory notes in the aggregate original principal amount of $150,000,000 and secured by the borrower’s fee interest in a 565,913 square foot super regional mall located in Riverside, California (the “Galleria at Tyler Property”). The Galleria at Tyler Whole Loan was co-originated on December 13, 2023 by DBNY, BANA and SGFC and accrues interest at the rate of 7.91900% per annum. The Galleria at Tyler Mortgage Loan is evidenced by the non-controlling Note A-2-3, non-controlling Note A-3-1 and non-controlling Note A-3-2 with an aggregate original principal balance of $50,000,000. GACC is selling Note A-2-3 with an original principal balance of $10,000,000 and SGFC is selling Notes A-3-1 and A-3-2 with an aggregate original principal balance of $40,000,000. The remaining promissory notes comprising the Galleria at Tyler Whole Loan are summarized in the below table. The relationship between the holders of the Galleria at Tyler Whole Loan is governed by a co-lender agreement as described under “Description of the Mortgage Pool—The Whole Loans—The Outside Serviced Pari Passu Whole Loans” in the Preliminary Prospectus. The Galleria at Tyler Whole Loan will initially be serviced pursuant to the pooling and servicing agreement for the Benchmark 2024-V5 transaction; however, following the securitization of the controlling Note A-1-1, the Galleria at Tyler Whole Loan will be serviced pursuant to the pooling and servicing agreement for the transaction that includes the controlling Note A-1-1. See “Pooling and Servicing Agreement—Servicing of the Outside Serviced Mortgage Loans” in the Preliminary Prospectus.
The table below identifies the promissory notes that comprise the Galleria at Tyler Whole Loan.
| Whole Loan Summary |
| Note | Original Balance | Cut-off Date Balance | Note Holder | Controlling Piece |
| A-1-1(1) | $30,000,000 | $30,000,000 | BANA | Yes |
| A-1-2(1) | $20,000,000 | $20,000,000 | BANA | No |
| A-1-3(1) | $10,000,000 | $10,000,000 | BANA | No |
| A-2-1 | $20,000,000 | $20,000,000 | Benchmark 2024-V5 | No |
| A-2-2 | $15,000,000 | $15,000,000 | Benchmark 2024-V5 | No |
| A-2-3 | $10,000,000 | $10,000,000 | BMO 2024-5C3 | No |
| A-3-1 | $20,000,000 | $20,000,000 | BMO 2024-5C3 | No |
| A-3-2 | $20,000,000 | $20,000,000 | BMO 2024-5C3 | No |
| A-3-3(1) | $5,000,000 | $5,000,000 | SGFC | No |
| Whole Loan | $150,000,000 | $150,000,000 | | |
| (1) | Expected to be contributed to one or more securitization trust(s). |
The Property. The Galleria at Tyler Property is a 565,913 square foot portion of an 1,187,621 square foot super regional mall (the “Galleria at Tyler Mall”) located in Riverside, California. The Galleria at Tyler Mall is comprised of eight buildings located on 29.58 acres, has over 120 tenants and has 5,679 parking spaces in total for a ratio of 4.8 spaces per 1,000 square feet. The Galleria at Tyler Property opened in 1970 and was most recently renovated in 2007. The Galleria at Tyler Property is anchored by non-collateral tenants JCPenney, Macy’s, Forever 21 and Furniture City and by the collateral tenant AMC, and includes as major tenants Barnes & Noble, Old Navy, Victoria’s Secret and H&M.
The top 10 collateral tenants by underwritten base rent at the Galleria at Tyler Property represent 30.9% of total square feet and generate 29.8% of underwritten rent. The Galleria at Tyler Property also features a strong restaurant lineup including Ay Mi Pa, Yard House, TGI Friday’s, Buffalo Wild Wings, and The Cheesecake Factory. Over the trailing-12 months ended October 31, 2023, the Galleria at Tyler Property generated total sales of approximately $217 million (excluding non-collateral tenants, JCPenney, and Macy’s). Over the same time period, inline tenants (less than 10,000 square feet) generated sales of approximately $561 per square foot, with an occupancy cost of 14.6%. The Galleria at Tyler Property had a five- year average occupancy between 2018-2022 of 95.3%, including temporary tenants, and 88.2% without temporary tenants.
The Galleria at Tyler Property was originally developed in 1970 and was most recently renovated in 2007. Since 2019, the borrower sponsors have invested approximately $16.2 million. This investment has helped maintain the occupancy and attract new tenants including Furniture City and several well performing restaurants. Several tenants have recently invested capital to their units. Existing tenant House of Hoops by Foot Locker is currently in negotiations to expand into 9,985 square feet from its 5,598 square foot unit. Victoria’s Secret and H&M, two top ten tenants at the Galleria at Tyler Property, recently renovated their units investing approximately $5 million ($420 per square foot) and $2 million ($95 per square foot), respectively. The borrower sponsors currently plan to invest an additional approximately $2.5 million through 2025.
THE INFORMATION IN THIS STRUCTURAL AND COLLATERAL TERM SHEET IS NOT COMPLETE AND MAY BE AMENDED PRIOR TO THE TIME OF SALE. THIS TERM SHEET IS NOT AN OFFER TO SELL THESE SECURITIES AND IT IS NOT A SOLICITATION OF AN OFFER TO BUY THESE SECURITIES IN ANY JURISDICTION WHERE THE OFFER OR SALE IS NOT PERMITTED. |
| | 69 | |
| Structural and Collateral Term Sheet | | BMO 2024-5C3 |
| No. 4 – Galleria at Tyler |
However, such investment is not required or reserved for under the Galleria at Tyler Whole Loan documents. Additionally, new tenant JDSports opened in early December 2023 in an 8,621 square foot unit and invested approximately $1.6 million ($185 per square foot) in its space.
Major Tenants. The three largest tenants based on underwritten base rent are AMC, H&M and Victoria’s Secret.
AMC (70,000 square feet; 12.4% of net rentable area (“NRA”); 9.6% of underwritten base rent). AMC (Fitch/Moody’s/S&P: NR/Caa1/CCC+) is an American movie theater chain that was founded in 1920 in Kansas City, Missouri, now headquartered in Leawood, Kansas. It has 2,826 screens in 354 European theaters and 7,648 screens in 586 American theaters. In 2006, AMC merged with Loews Cineplex Entertainment to form AMC Entertainment, and in 2017 after acquiring Odeon, UCI and Carmike Cinemas, AMC became one of the largest movie theater chains in the world. The AMC at the Galleria at Tyler Property is the number one location within the region and generates approximately $750,000 in sales per screen as of September 2023. The AMC lease expires December 31, 2028, has two, five-year renewal options, one four-year renewal option, a six-month renewal option and has no termination options.
H&M (20,799 square feet; 3.7% of NRA; 3.0% of underwritten base rent). H&M (Fitch/Moody’s/S&P: NR/NR/BBB) is a global fashion and design company, with over 4,000 stores in more than 70 markets and online sales in 60 markets. The brands of H&M are available through physical stores and digital channels in markets globally. H&M employs approximately 150,000 people. H&M’s lease expires in January 2032, has two, three-year renewal options exercisable upon no less than 180 days’ prior written notice and has no termination options.
Victoria’s Secret (12,000 square feet; 2.1% of NRA; 3.0% of underwritten base rent). Victoria’s Secret (Fitch/Moody’s/S&P: NR/Ba3/BB-) is a specialty retailer of modern, fashion-inspired collections including signature bras, panties, lingerie, casual sleepwear, athleisure and swim as well as fragrances and body care. Victoria’s Secret was founded in 1977 and comprises two brands, Victoria’s Secret and PINK. Victoria’s Secret employs 30,000 associates across a global footprint of approximately 1,360 retail stores in approximately 70 countries. The Victoria’s Secret lease expires in January 2033 and has no renewal or termination options.
Appraisal. According to the appraisal, the Galleria at Tyler Property had an “as-is” appraised value of $300,000,000 as of October 12, 2023. The table below shows the appraiser’s “as-is” conclusions.
| Appraisal Valuation Summary(1) |
| Appraisal Approach | Appraised Value | Capitalization Rate(2) |
| Income Capitalization Approach | $300,000,000 | 7.50% |
| (2) | The appraiser used a discounted cash flow approach to arrive at the appraised value. The capitalization rate shown above represents the overall capitalization rate. |
Environmental. According to the Phase I environmental assessment dated October 12, 2023, there was no evidence of any recognized environmental conditions at the Galleria at Tyler Property.
The following table presents certain information relating to the historical occupancy of the Galleria at Tyler Property:
| Historical and Current Occupancy(1) |
| 2016 | 2017 | 2018 | 2019 | 2020 | 2021 | 2022 | Current(2) |
| 93.3% | 96.6% | 93.6% | 93.7% | 87.9% | 82.3% | 83.7% | 90.3% |
| (1) | Historical Occupancies are as of December 31 of each respective year. |
| (2) | Current Occupancy is as of December 18, 2023. |
THE INFORMATION IN THIS STRUCTURAL AND COLLATERAL TERM SHEET IS NOT COMPLETE AND MAY BE AMENDED PRIOR TO THE TIME OF SALE. THIS TERM SHEET IS NOT AN OFFER TO SELL THESE SECURITIES AND IT IS NOT A SOLICITATION OF AN OFFER TO BUY THESE SECURITIES IN ANY JURISDICTION WHERE THE OFFER OR SALE IS NOT PERMITTED. |
| | 70 | |
| Structural and Collateral Term Sheet | | BMO 2024-5C3 |
| No. 4 – Galleria at Tyler |
The following table presents certain information relating to the largest tenants (of which certain tenants may have co-tenancy provisions) based on underwritten base rent at the Galleria at Tyler Property:
Top Tenant Summary(1) |
| Tenant Name | Credit Rating (Fitch/Moody's/S&P)(2) | Net Rentable Area (SF) | % of Total NRA | UW Base Rent PSF(3) | UW Base Rent(3) | % of Total UW Base Rent(3) | Lease Exp. Date |
| Non-Collateral Anchors | | | | | | |
| JCPenney | NR/NR/NR | 165,566 | 26.6% | NAP | NAP | NAP | 1/31/2068 |
| Macy's | BBB-/Ba1/BB+ | 157,384 | 25.3 | NAP | NAP | NAP | 1/31/2068 |
| Forever 21 | NR/NR/NR | 153,500 | 24.7 | NAP | NAP | NAP | 1/31/2068 |
| Furniture City | NR/NR/NR | 145,258 | 23.4 | NAP | NAP | NAP | 1/31/2068 |
| Non-Collateral Anchors Subtotal/Wtd. Avg. | 621,708 | 100.0% | NAP | NAP | NAP | |
| | | | | | | | |
| Major Tenants | | | | | | | |
| AMC(4) | NR/Caa1/CCC+ | 70,000 | 12.4% | $29.97 | $2,098,250 | 9.6% | 12/31/2028 |
| H&M(5) | NR/NR/BBB | 20,799 | 3.7 | 31.88 | 663,000 | 3.0 | 1/31/2032 |
| Victoria's Secret | NR/Ba3/BB- | 12,000 | 2.1 | 53.74 | 644,880 | 3.0 | 1/31/2033 |
| Barnes & Noble | NR/NR/NR | 25,000 | 4.4 | 25.00 | 625,000 | 2.9 | 1/31/2029 |
| The Cheesecake Factory(6) | NR/NR/NR | 10,047 | 1.8 | 45.00 | 452,115 | 2.1 | 1/31/2027 |
| House of Hoops by Foot Locker | NR/Ba2/BB | 5,598 | 1.0 | 78.29 | 438,267 | 2.0 | 1/31/2024 |
| Lenscrafters | NR/A2/A | 3,234 | 0.6 | 131.04 | 423,783 | 1.9 | 8/31/2032 |
| Old Navy | NR/Ba3/BB | 14,504 | 2.6 | 26.66 | 386,725 | 1.8 | 6/30/2029 |
| Vans | NR/Baa3/BBB | 3,503 | 0.6 | 107.46 | 376,449 | 1.7 | 4/30/2028 |
| Yard House(7) | NR/NR/NR | 10,001 | 1.8 | 37.26 | 372,680 | 1.7 | 12/31/2029 |
| Largest Tenants | | 174,686 | 30.9% | $37.10 | $6,481,149 | 29.8% | |
| Remaining Tenants | | 336,356 | 59.4 | 45.48 | 15,295,863 | 70.2 | |
| Total Occupied | | 511,042 | 90.3% | $42.61 | $21,777,012 | 100.0% | |
| Vacant Space(4) | | 54,871 | 9.7 | | | | |
| Totals/ Wtd. Avg. | 565,913 | 100.0% | | | | |
| (1) | Based on the underwritten rent roll dated December 18, 2023 with rent steps though December 1, 2024. |
| (2) | Certain ratings are those of the parent company whether or not the parent guarantees the lease. |
| (3) | UW Base Rent, UW Base Rent PSF and % of Total UW Base Rent are inclusive of rent steps. |
| (4) | AMC has two, five-year renewal options, as well as one successive separate renewal option for 4 years and 6 months, all of which are exercisable upon no less than six months’ prior written notice. |
| (5) | H&M has two, three-year renewal options exercisable upon no less than 180 days’ prior written notice. |
| (6) | The Cheesecake Factory has one, five-year renewal option exercisable upon no less than 180 days’ prior written notice. |
| (7) | Yard House has one, five-year renewal option exercisable upon no less than 365 days’ prior written notice. |
THE INFORMATION IN THIS STRUCTURAL AND COLLATERAL TERM SHEET IS NOT COMPLETE AND MAY BE AMENDED PRIOR TO THE TIME OF SALE. THIS TERM SHEET IS NOT AN OFFER TO SELL THESE SECURITIES AND IT IS NOT A SOLICITATION OF AN OFFER TO BUY THESE SECURITIES IN ANY JURISDICTION WHERE THE OFFER OR SALE IS NOT PERMITTED. |
| | 71 | |
| Structural and Collateral Term Sheet | | BMO 2024-5C3 |
| No. 4 – Galleria at Tyler |
The following table presents tenant sales history for the Galleria at Tyler Property:
| Sales History(1) |
| Tenancy Type | 2020(2) | 2021 | 2022 | TTM October 2023 |
| Gross Mall Sales(3) | $129,668,503 | $223,554,180 | $222,098,118 | $216,594,512 |
| Estimated Macy’s Sales(4) | $23,500,000 | $39,900,000 | $46,500,000 | $46,500,000 |
| Estimated JCPenney Sales(4) | $9,800,000 | $15,900,000 | $14,700,000 | $14,700,000 |
| AMC (Sales Per Screen)(5) | $122,879 | $407,093 | $645,462 | $748,645 |
| Sales PSF (Inline < 10,000 SF) | $315 | $631 | $602 | $561 |
| Occupancy Cost (Inline < 10,000 SF) | 23.8% | 10.7% | 13.3% | 14.6% |
| (1) | Information is as of December of 2020, 2021, 2022 and the trailing 12 month period ending October 31, 2023 unless otherwise noted, as provided by the borrower sponsor, and only includes tenants reporting sales. |
| (2) | The Galleria at Tyler Property closed due to the COVID-19 pandemic from March 16, 2020 through May 26, 2020. |
| (3) | Excludes estimated sales for the non-collateral tenants, Forever 21, Furniture City, JCPenney and Macy’s. |
| (4) | Represents estimated sales as per the appraisal. TTM October 2023 sales are shown as of year-end 2022. |
| (5) | AMC Sales Per Screen are as of September 2023 and are based on 16 screens. |
The following table presents certain information relating to the lease rollover schedule at the Galleria at Tyler Property:
| Lease Rollover Schedule(1)(2) |
| Year | Number of Leases Expiring | Net Rentable Area Expiring | % of NRA Expiring | UW Base Rent Expiring | % of UW Base Rent Expiring | Cumulative Net Rentable Area Expiring | Cumulative % of NRA Expiring | Cumulative UW Base Rent Expiring | Cumulative % of UW Base Rent Expiring |
| Vacant | NAP | 54,871 | 9.7 | % | NAP | NA | P | 54,871 | | 9.7% | | NAP | NAP | |
| MTM | 6 | 13,055 | 2.3 | | $378,984 | 1.7 | % | 67,926 | | 12.0% | | $378,984 | 1.7% | |
| 2024 | 28 | 74,917 | 13.2 | | 3,269,725 | 15.0 | | 142,843 | | 25.2% | | $3,648,709 | 16.8% | |
| 2025 | 16 | 37,350 | 6.6 | | 2,141,618 | 9.8 | | 180,193 | | 31.8% | | $5,790,326 | 26.6% | |
| 2026 | 18 | 41,185 | 7.3 | | 1,967,484 | 9.0 | | 221,378 | | 39.1% | | $7,757,811 | 35.6% | |
| 2027 | 13 | 46,819 | 8.3 | | 2,298,810 | 10.6 | | 268,197 | | 47.4% | | $10,056,621 | 46.2% | |
| 2028 | 14 | 113,861 | 20.1 | | 4,197,159 | 19.3 | | 382,058 | | 67.5% | | $14,253,780 | 65.5% | |
| 2029 | 5 | 56,031 | 9.9 | | 1,708,785 | 7.8 | | 438,089 | | 77.4% | | $15,962,566 | 73.3% | |
| 2030 | 7 | 35,988 | 6.4 | | 1,399,744 | 6.4 | | 474,077 | | 83.8% | | $17,362,310 | 79.7% | |
| 2031 | 1 | 1,663 | 0.3 | | 125,333 | 0.6 | | 475,740 | | 84.1% | | $17,487,643 | 80.3% | |
| 2032 | 5 | 37,540 | 6.6 | | 1,555,323 | 7.1 | | 513,280 | | 90.7% | | $19,042,966 | 87.4% | |
| 2033 | 6 | 20,884 | 3.7 | | 1,333,208 | 6.1 | | 534,164 | | 94.4% | | $20,376,174 | 93.6% | |
| 2034 | 6 | 27,581 | 4.9 | | 1,227,829 | 5.6 | | 561,745 | | 99.3% | | $21,604,003 | 99.2% | |
| 2035 & Beyond | 1 | 4,168 | 0.7 | | 173,010 | 0.8 | | 565,913 | | 100.0% | | $21,777,012 | 100.0% | |
| Total | 126 | 565,913 | 100.0 | % | $21,777,012 | 100.0 | % | | | | |
| (1) | Based on the underwritten rent roll dated December 18, 2023. |
| (2) | Certain leases may have termination options that are exercisable prior to the originally stated expiration date of the lease and that are not considered in this Lease Rollover Schedule. |
THE INFORMATION IN THIS STRUCTURAL AND COLLATERAL TERM SHEET IS NOT COMPLETE AND MAY BE AMENDED PRIOR TO THE TIME OF SALE. THIS TERM SHEET IS NOT AN OFFER TO SELL THESE SECURITIES AND IT IS NOT A SOLICITATION OF AN OFFER TO BUY THESE SECURITIES IN ANY JURISDICTION WHERE THE OFFER OR SALE IS NOT PERMITTED. |
| | 72 | |
| Structural and Collateral Term Sheet | | BMO 2024-5C3 |
| No. 4 – Galleria at Tyler |
The following table presents certain information relating to the operating history and underwritten cash flows of the Galleria at Tyler Property:
Operating History and Underwritten Net Cash Flow |
| | 2019 | 2020 | 2021 | 2022 | T12 Nov 2023 | Underwritten(1) | Per Square Foot | %(2) | |
| Base Rent | $21,286,629 | $19,588,464 | $16,032,131 | $18,149,491 | $20,074,413 | $21,777,012 | $38.48 | 59.7 | % |
| Gross Up Vacancy | 0 | 0 | 0 | 0 | 0 | 4,369,816 | 7.72 | 12.0 | |
| Overage Rent | 677,626 | 191,399 | 1,929,273 | 3,020,101 | 2,148,900 | 1,576,946 | 2.79 | 4.3 | |
| Percentage Rent in Lieu | 51,704 | 270,840 | 786,315 | 230,683 | 83,273 | 0 | 0.00 | 0.0 | |
| Gross Potential Rent | $22,015,959 | $20,050,703 | $18,747,719 | $21,400,275 | $22,306,586 | $27,723,775 | $48.99 | 76.0 | % |
| Total Reimbursements | 11,622,000 | 11,301,120 | 7,997,303 | 8,797,039 | 8,326,854 | 8,750,398 | 15.46 | 24.0 | |
| Total Gross Income | $33,637,959 | $31,351,823 | $26,745,022 | $30,197,314 | $30,633,440 | $36,474,173 | $64.45 | 100.0 | % |
| Other Income | 709,847 | 221,383 | 237,625 | 378,850 | 468,399 | 241,610 | 0.43 | 0.7 | |
| Specialty Leasing | 3,548,392 | 2,384,991 | 4,059,320 | 4,086,308 | 4,057,312 | 4,135,711 | 7.31 | 11.3 | |
| (Vacancy / Credit Loss) | (76,984) | (3,118,798) | (837,226) | 797,111 | 114,734 | (4,431,154) | (7.83) | (12.1 | ) |
| Effective Gross Income | $37,819,214 | $30,839,398 | $30,204,741 | $35,459,583 | $35,273,885 | $36,420,340 | $64.36 | 99.9 | % |
| Management Fee | 1,000,000 | 1,000,000 | 1,000,000 | 1,000,000 | 1,000,000 | 1,000,000 | 1.77 | 2.7 | |
| Real Estate Taxes(3) | 3,464,886 | 3,457,597 | 3,528,748 | 3,565,886 | 3,771,601 | 3,703,438 | 6.54 | 10.2 | |
| Insurance | 231,728 | 283,173 | 473,191 | 605,908 | 594,172 | 652,715 | 1.15 | 1.8 | |
| Other Expenses(4) | 5,957,543 | 5,169,325 | 5,693,531 | 5,864,099 | 5,910,148 | 6,078,594 | 10.74 | 16.7 | |
| Total Expenses | $10,654,157 | $9,910,094 | $10,695,470 | $11,035,894 | $11,275,921 | $11,434,747 | $20.21 | 31.4 | % |
| Net Operating Income | $27,165,057 | $20,929,304 | $19,509,271 | $24,423,689 | $23,997,964 | $24,985,593 | $44.15 | 68.6 | % |
| Capital Expenditures | 0 | 0 | 0 | 0 | 0 | 209,388 | 0.37 | 0.6 | |
| TI/LC | 0 | 0 | 0 | 0 | 0 | 1,131,826 | 2.00 | 3.1 | |
| Net Cash Flow | $27,165,057 | $20,929,304 | $19,509,271 | $24,423,689 | $23,997,964 | $23,644,379 | $41.78 | 64.9 | % |
| (1) | Based on the underwritten rent roll dated December 18, 2023. Underwritten base rent includes rent steps though December 1, 2024. |
| (2) | % column represents percent of Gross Income for all revenue lines and represents percent of Effective Gross Income for the remainder of fields. |
| (3) | With regards to the underwritten real estate taxes, the real estate tax obligations for the Galleria at Tyler Property include assessments to pay debt service on revenue bonds with an original principal amount of $15,980,000 that relate to construction of parking improvements at the Galleria at Tyler Property. See “Description of the Mortgage Pool—Real Estate and Other Tax Considerations” in the Preliminary Prospectus. |
| (4) | Other Expenses include janitorial and cleaning, common area maintenance, utilities, marketing and advertising, landscaping, general and administrative, and security expenses. |
The Market. The Galleria at Tyler Property is located in the Riverside, California submarket, approximately 55 miles east of Los Angeles International Airport, adjacent to Riverside Freeway and six miles east of I-15. Riverside is the largest city in the Inland Empire market, the metropolitan region inland of and adjacent to coastal Southern California, bordering Los Angeles County to the west. The Galleria at Tyler Property’s trade area consists of a population of approximately 1.4 million residents with an average household income over $98,640 as of 2022. Local industry drivers with the largest labor forces include local county and school officials, County of Riverside, March Air Force, and University of California, totaling approximately 43,000 employees. The Galleria at Tyler Property benefits from proximity to multiple colleges and universities within a fifteen-minute drive, including the University of California, Riverside, with a total student population of approximately 27,000. The Galleria at Tyler Property is the only shopping center in Riverside and is situated in between I-15 and I-215. The Galleria at Tyler Property is located approximately 17 miles from its closest competitor. The nearest Francesca’s, Yard House, The Cheesecake Factory, P.F. Chang’s, Aldo, Pandora, and AMC are located over 20 miles away, and the next closest Journeys, Miniso, Shoe Palace, Foot Locker, H&M are over 15 miles away.
The Galleria at Tyler Property is located within the Riverside retail submarket. The Riverside retail submarket is comprised of approximately 17.7 million square feet of retail space, accounting for 8.80% of the 201.6 million square feet of the Inland Empire market inventory. Over the 12 months ending December 2023, the Riverside market has delivered approximately 68,600 square feet of retail space and had annual rent growth of 3.0%.
THE INFORMATION IN THIS STRUCTURAL AND COLLATERAL TERM SHEET IS NOT COMPLETE AND MAY BE AMENDED PRIOR TO THE TIME OF SALE. THIS TERM SHEET IS NOT AN OFFER TO SELL THESE SECURITIES AND IT IS NOT A SOLICITATION OF AN OFFER TO BUY THESE SECURITIES IN ANY JURISDICTION WHERE THE OFFER OR SALE IS NOT PERMITTED. |
| | 73 | |
| Structural and Collateral Term Sheet | | BMO 2024-5C3 |
| No. 4 – Galleria at Tyler |
The following table presents certain information relating to the demographics of the Galleria at Tyler Property:
| Demographics Summary(1)(2) |
| Property Name | City, State | Whole Loan Cut-off Date Balance | 1-mile Population | 3-mile Population | 5-mile Population | 1-mile Avg Household Income | 3-mile Avg Household Income | 5-mile Avg Household Income |
| Galleria at Tyler | Riverside, CA | $150,000,000 | 18,955 | 137,599 | 251,187 | $80,749 | $97,717 | $104,065 |
| (2) | Values estimated are as of December 2022. |
The Borrower. The borrower for the Galleria at Tyler Whole Loan is Tyler Mall Limited Partnership, a Delaware limited partnership single purpose entity with two independent directors. Legal counsel to the Galleria at Tyler borrower delivered a non-consolidation opinion in connection with the origination of the Galleria at Tyler Whole Loan.
The Borrower Sponsors. The borrower sponsors are Brookfield Properties Retail Holding LLC (“Brookfield Retail”) and the Teachers’ Retirement System of the State of Illinois (“TRSIL”), each of which indirectly owns a 50% interest in the borrower. The non-recourse carveout guarantor is GGP-TRS L.L.C., an affiliate of Brookfield Retail and the 100% owner of the borrower. Brookfield Retail is a fully integrated, diversified global real estate services company that has portfolio management and development capabilities across the real estate investment strategies of Brookfield Corporation. Brookfield Property Partners owns, operates and develops a large portfolio of office, retail, multifamily, industrial, hospitality, triple net lease, student housing and manufactured housing assets. Brookfield Retail owns over 160 retail properties totaling over 130 million square feet throughout the United States.
TRSIL is an Illinois state government agency dealing with pensions and other financial benefits for teachers and other workers in education in Illinois. The Illinois General Assembly created TRSIL of Illinois in 1939 for the purpose of providing retirement annuities, and disability and survivor benefits for educators employed in public schools outside the city of Chicago. As of September 30, 2023, TRSIL had nearly $66.0 billion of assets under management.
Property Management. The Galleria at Tyler Property is managed by Brookfield Properties Retail Inc., an affiliate of Brookfield Retail.
Escrows and Reserves. At origination, the borrower was required to deposit into escrow approximately $4,687,691 for an outstanding landlord obligations reserve, $5,000,000 for general reserves (to be used for capital expenditures and leasing expenses) and $236,687 for a gap rent reserve.
Tax Escrows – During the continuance of a Cash Management Period (as defined below) or from and after the date on which the borrower first requests a disbursement from the general reserve (a “General Reserve Disbursement Date”), the borrower is required to escrow 1/12th of the annual estimated tax payments payable during the next ensuing 12 months on a monthly basis.
Insurance Escrows– During the continuance of a Cash Management Period, or from and after a General Reserve Disbursement Date, the borrower is required to escrow 1/12th of the annual estimated insurance payments on a monthly basis, unless the Galleria at Tyler Property is insured under a blanket policy meeting the requirements of the Galleria at Tyler Whole Loan documents (in which case no insurance escrows will be required).
Replacement Reserves– During the continuance of a Cash Management Period or from and after a General Reserve Disbursement Date, the borrower is required to deposit monthly into a replacement reserve an amount equal to $17,448.83 for repairs and replacements required to be made to the Galleria at Tyler Property during the calendar year.
TI/LC Reserve – During the continuance of a Cash Management Period or from and after a General Reserve Disbursement Date, the borrower is required to deposit monthly into a rollover reserve an amount equal to $94,318 for tenant improvement, landlord work, tenant improvement allowance, leasing commission obligations, reasonable legal fees and related tenant capital costs incurred following the origination date.
Lockbox / Cash Management. The Galleria at Tyler Whole Loan is structured with a hard lockbox and springing cash management. The borrower is required to cause all tenants at the Galleria at Tyler Property (other than tenants under Seasonal Leases (as defined below)) to pay rents (other than Non-Core Income (as defined below)) directly into a lockbox account controlled by the lender (the “Lockbox Account”), and to deposit any rents otherwise received by the borrower or
THE INFORMATION IN THIS STRUCTURAL AND COLLATERAL TERM SHEET IS NOT COMPLETE AND MAY BE AMENDED PRIOR TO THE TIME OF SALE. THIS TERM SHEET IS NOT AN OFFER TO SELL THESE SECURITIES AND IT IS NOT A SOLICITATION OF AN OFFER TO BUY THESE SECURITIES IN ANY JURISDICTION WHERE THE OFFER OR SALE IS NOT PERMITTED. |
| | 74 | |
| Structural and Collateral Term Sheet | | BMO 2024-5C3 |
| No. 4 – Galleria at Tyler |
the property manager (other than Non-Core Income) into the Lockbox Account within two business days after receipt. Prior to a Cash Management Period, all funds in the Lockbox Account will be disbursed to the borrower’s operating account. During the continuance of a Cash Management Period, all funds deposited into the Lockbox Account are required to be swept each business day into a deposit account controlled by the lender (the “Cash Management Account”), to be applied and disbursed in accordance with the Galleria at Tyler Whole Loan documents to pay, including but not limited to, (i) the tax and insurance escrow deposits, if any, described above, (ii) provided that no default exists as to which the lender has initiated an enforcement action, to pay budgeted operating expenses (or actual operating expenses to the extent not more than 115% of budgeted operating expenses), budgeted capital expenses (or actual capital expenses to the extent not more than 110% of budgeted capital expenses), lender-approved extraordinary expenses, and (iii) the replacement and rollover reserve deposits, if any, described above. During the continuance of a Cash Management Period, any excess cash is required to be deposited into an excess cash reserve account to be held by the lender as additional security for the Galleria at Tyler Whole Loan; provided, that, funds on deposit in such account will be made available to the borrower for the payment of certain property-level expenses and other uses, including REIT distributions up to $200,000.
“Non-Core Income” means (i) certain de minimis amounts of rents from miscellaneous revenue items such as holiday photos and change retrieved from fountains (but will not include rent from Seasonal Leases) and (ii) certain rents generated pursuant to multi-property sponsorship and advertising programs which are directly attributable to the Galleria at Tyler Property.
“Seasonal Leases” means leases or license agreements having a maximum term of one year or less.
A “Cash Management Period” means a period commencing upon (i) an event of default under the Galleria at Tyler Whole Loan, (ii) the debt yield is less than 14% as of the end of any two consecutive calendar quarters (a “Low Debt Yield Period”), or (iii) any Anchor (as defined below) (A) has “gone dark” (i.e., ceased to utilize its space for business purposes), other than a temporary closure in connection (x) with a restoration, repair or renovation, (y) compliance with applicable law, regulations and/or governmental mandates or (z) an event of force majeure, (B) has vacated its space; or (C) is the subject of certain bankruptcy or insolvency events (an “Anchor Trigger Event”). A Cash Management Period resulting from an event of default will end if the lender has waived or the borrower has cured such event of default. A Cash Management Period resulting from a Low Debt Yield Period will end if the borrower has maintained a debt yield equal to or in excess of 14% for two consecutive calendar quarters or has either (i) prepaid the Galleria at Tyler Whole Loan (with payment of yield maintenance if partial prepayment occurs prior to July 1, 2028), (ii) delivered cash to the lender, or (iii) delivered a letter of credit to the lender, in each case in an amount which if subtracted from the outstanding principal balance of the Galleria at Tyler Whole Loan would cause the debt yield to equal or exceed 14%. A Cash Management Period resulting from an Anchor Trigger Event will end if (i) for any Anchor Trigger Event described in clause (A) or (B) of the definition of Anchor Trigger Event, such Anchor operates the demised premises (to the extent not subject to any permitted subletting) for a period of no less than 30 consecutive operating days; (ii) for any Anchor Trigger Event described in clause (C) of the definition of Anchor Trigger Event, (x) if such premises occupied by the Anchor are owned by the Anchor, the bankruptcy or insolvency is dismissed or the Anchor has emerged from such bankruptcy or insolvency action and is continuing to occupy its premises or a substantial portion thereof, and (y) if such premises occupied by the Anchor are leased by the borrower to the Anchor, such lease is accepted and affirmed by the Anchor in the bankruptcy or insolvency action; or (iii) for any Anchor Trigger Event, the Anchor space or a substantial portion thereof becomes owned or leased by one or more replacement occupants reasonably approved by the lender. Upon the end of a Cash Management Period, all remaining funds in the Cash Management Account will be disbursed to the borrower.
“Anchor” means any of (i) JCPenney, Macy’s, Forever 21, Furniture City and AMC, (ii) any tenant who occupies all or substantially all of the space currently occupied by the foregoing after an acquisition of such space by the borrower or one of its affiliates, and (iii) any replacement of either of the foregoing.
Subordinate Debt. None.
Mezzanine Debt. None.
Partial Release. The borrower may obtain the release of (A) one or more vacant, non-income producing and unimproved (or improved only by landscaping, surface parking or utility facilities that are either readily re-locatable or will continue to serve the Galleria at Tyler Property) parcels (including “air rights” parcels) or outlots (provided, however, that this condition will not apply to any Galleria at Tyler Expansion Parcels (as defined below), or (B) any Galleria at Tyler Acquired Parcels (as defined below), including, if applicable, any Anchor parcel, upon satisfaction of specified conditions including, among
THE INFORMATION IN THIS STRUCTURAL AND COLLATERAL TERM SHEET IS NOT COMPLETE AND MAY BE AMENDED PRIOR TO THE TIME OF SALE. THIS TERM SHEET IS NOT AN OFFER TO SELL THESE SECURITIES AND IT IS NOT A SOLICITATION OF AN OFFER TO BUY THESE SECURITIES IN ANY JURISDICTION WHERE THE OFFER OR SALE IS NOT PERMITTED. |
| | 75 | |
| Structural and Collateral Term Sheet | | BMO 2024-5C3 |
| No. 4 – Galleria at Tyler |
other things, that (i) there is no event of default, (ii) the borrower delivers evidence that the parcel subject to release is not necessary for the borrower’s operation or use of the remaining Galleria at Tyler Property and may be readily separated from the Galleria at Tyler Property without a material diminution in value, (iii) the parcel subject to release has been legally subdivided and after giving effect to such transfer, the release parcel and the remaining Galleria at Tyler Property conform to legal requirements and constitute separate tax lots (or all action has been taken to effectuate the same), (iv) the parcel subject to the release is not necessary for the remaining portion of the Galleria at Tyler Property to comply with zoning or legal requirements, (v) receipt of a rating agency confirmation from the applicable rating agencies (provided that such confirmation will not be required for release of a Galleria at Tyler Expansion Parcel or if the rating agency has waived review or failed to respond within 30 days to a request for such confirmation), and (vi) the release will not result in a loan-to-value ratio that does not comply with REMIC guidelines provided that the borrower may prepay the Galleria at Tyler Whole Loan to meet such condition, with payment of a yield maintenance premium calculated based upon the amount prepaid, unless the borrower receives an opinion of counsel that the issuing entity will not fail to maintain its status as a REMIC trust as a result of the release of the release parcel.
In addition, the borrower has the right, at its own expense, to acquire one or more parcels of land that constitutes an integral part of, or adjoins or is proximately located near, the shopping center of which the Galleria at Tyler Property is a part, which land was not owned by the borrower on the origination date (such acquired land, a “Galleria at Tyler Expansion Parcel”), to become additional collateral for the Galleria at Tyler Whole Loan, upon satisfaction of specified conditions including, among other things, that (i) there is no event of default, (ii) the borrower acquires a fee simple or leasehold interest in the applicable Galleria at Tyler Expansion Parcel, and (iii) the borrower delivers, among other things (a) unless the Galleria at Tyler Expansion Parcel is already covered by the environmental report delivered at origination, an environmental report indicating no hazardous substances except for nominal amounts (except as permitted under clause (d) below), (b) security documents creating a mortgage lien on the Galleria at Tyler Expansion Parcel, and title insurance, (c) if the Galleria at Tyler Expansion Parcel is improved, subject to certain exceptions, a property condition report indicating that the Galleria at Tyler Expansion Parcel is in good condition and (d) if repairs are recommended by the property condition report or if the environmental report discloses the presence of hazardous materials at the Galleria at Tyler Expansion Parcel, and the cost of such repairs or remediation is reasonably likely to exceed 10% of the original principal balance of the Galleria at Tyler Whole Loan, cash or an indemnity from the guarantor, certain of its affiliates, or an entity otherwise meeting ratings or financial tests set forth in the loan documents, in an amount equal to 125% of any estimated repairs or remediation costs, as applicable.
The borrower is also permitted to obtain the release of collateral parcels (each, a “Galleria at Tyler Exchange Parcel”) from the lien of the mortgage in exchange for the substitution of new parcels in which the borrower acquires a fee or leasehold interest (each, a “Galleria at Tyler Acquired Parcel”) as collateral for the Galleria at Tyler Whole Loan upon 20 days’ prior notice, subject to the satisfaction of certain conditions, including among other things, that: (i) the Galleria at Tyler Exchange Parcel (unless it is a Galleria at Tyler Expansion Parcel) is vacant, non-income producing and unimproved or improved only by landscaping, surface parking or utility facilities that are readily re-locatable or that will continue to serve the Galleria at Tyler Property (and the borrower is able to make certain zoning representations as to the Galleria at Tyler Acquired Parcel to the same extent as made with respect to the Galleria at Tyler Exchange Parcel), (ii) the Galleria at Tyler Acquired Parcel is reasonably equivalent in value to the Galleria at Tyler Exchange Parcel, as established by a letter of value from the appraiser which appraised the Galleria at Tyler Galleria at Tyler Property or an appraiser of comparable experience selected by the borrower, (iii) with respect to the Galleria at Tyler Acquired Parcel, the borrower has delivered, among other things (a) unless the Galleria at Tyler Acquired Parcel is already covered by the environmental report delivered at origination, an environmental report indicating no hazardous substances except for nominal amounts (except as permitted under clause (d) below), (b) security documents creating a mortgage lien on the Galleria at Tyler Acquired Parcel, and title insurance, (c) if the Galleria at Tyler Acquired Parcel is improved, subject to certain exceptions, a property condition report indicating that the Galleria at Tyler Acquired Parcel is in good condition, and (d) if repairs are recommended by the property condition report or if the environmental report discloses the presence of hazardous materials at the Galleria at Tyler Acquired Parcel, and the cost of such repairs or remediation is likely to exceed 10% of the original principal balance of the Galleria at Tyler Whole Loan, cash or an indemnity from the guarantor, certain of its affiliates, or an entity otherwise meeting ratings or financial tests set forth in the Galleria at Tyler Whole Loan documents, in an amount equal to 125% of any estimated repairs or remediation costs, as applicable, (e) the loan-to-value ratio (after giving effect to such substitution) is equal to or less than 125% (in compliance with REMIC guidelines), provided that the borrower may prepay the Galleria at Tyler Whole Loan in order to meet such condition, with payment of a yield maintenance premium calculated based upon the amount prepaid, unless the borrower receives an opinion of counsel that the issuing entity will not fail to maintain its status as a REMIC trust as a result of the substitution and (f) the lender has received a rating agency confirmation from the applicable rating agencies, unless the applicable rating agency declines or fails to respond to the request for such confirmation.
THE INFORMATION IN THIS STRUCTURAL AND COLLATERAL TERM SHEET IS NOT COMPLETE AND MAY BE AMENDED PRIOR TO THE TIME OF SALE. THIS TERM SHEET IS NOT AN OFFER TO SELL THESE SECURITIES AND IT IS NOT A SOLICITATION OF AN OFFER TO BUY THESE SECURITIES IN ANY JURISDICTION WHERE THE OFFER OR SALE IS NOT PERMITTED. |
| | 76 | |
| Structural and Collateral Term Sheet | | BMO 2024-5C3 |
| No. 4 – Galleria at Tyler |
Ground Lease. None.
Terrorism Insurance. The borrower is required to obtain and maintain property insurance in an amount equal to 100% of full replacement cost and business interruption insurance for 24 months. Such insurance is required to cover acts of terrorism; provided that (a) the borrower is permitted to maintain terrorism coverage with a licensed captive insurance company that is affiliated with the borrower sponsor if certain conditions set forth in the related Galleria at Tyler Whole Loan documents are satisfied, and (b) the borrower will only be required to pay for terrorism insurance a maximum of two times the annual insurance premiums payable for the Galleria at Tyler Property at the time with respect to the property and business income or rental income insurance interruption policies (excluding the terrorism and earthquake components of such premiums). See “Risk Factors—Risks Relating to the Mortgage Loans—Terrorism Insurance May Not Be Available for All Mortgaged Properties” in the Preliminary Prospectus.
THE INFORMATION IN THIS STRUCTURAL AND COLLATERAL TERM SHEET IS NOT COMPLETE AND MAY BE AMENDED PRIOR TO THE TIME OF SALE. THIS TERM SHEET IS NOT AN OFFER TO SELL THESE SECURITIES AND IT IS NOT A SOLICITATION OF AN OFFER TO BUY THESE SECURITIES IN ANY JURISDICTION WHERE THE OFFER OR SALE IS NOT PERMITTED. |
| | 77 | |
| Structural and Collateral Term Sheet | | BMO 2024-5C3 |
| No. 5 – 33 West State Street and 50 East State Street |
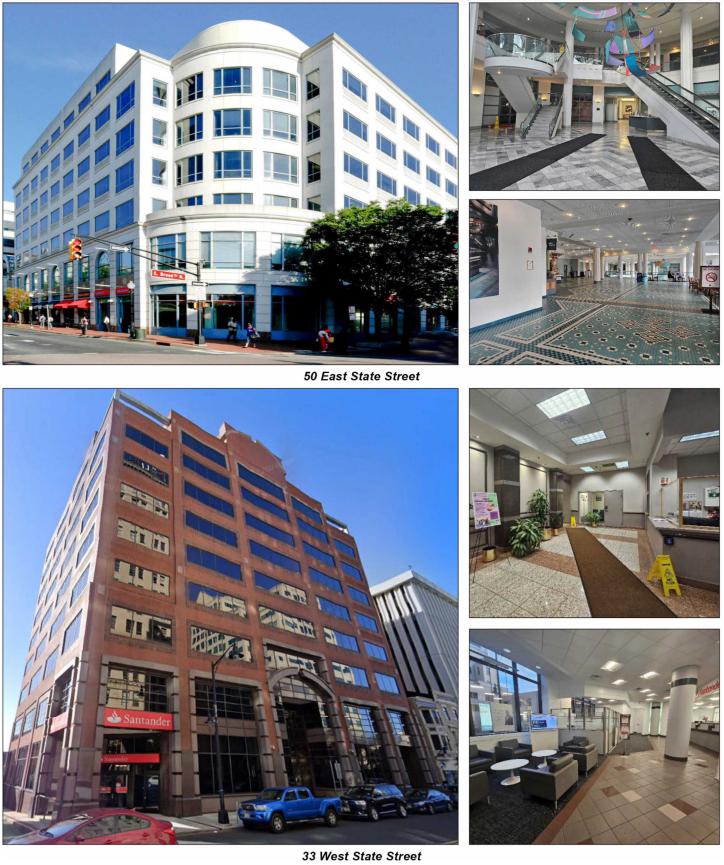
THE INFORMATION IN THIS STRUCTURAL AND COLLATERAL TERM SHEET IS NOT COMPLETE AND MAY BE AMENDED PRIOR TO THE TIME OF SALE. THIS TERM SHEET IS NOT AN OFFER TO SELL THESE SECURITIES AND IT IS NOT A SOLICITATION OF AN OFFER TO BUY THESE SECURITIES IN ANY JURISDICTION WHERE THE OFFER OR SALE IS NOT PERMITTED. |
| | 78 | |
| Structural and Collateral Term Sheet | | BMO 2024-5C3 |
| No. 5 – 33 West State Street and 50 East State Street |
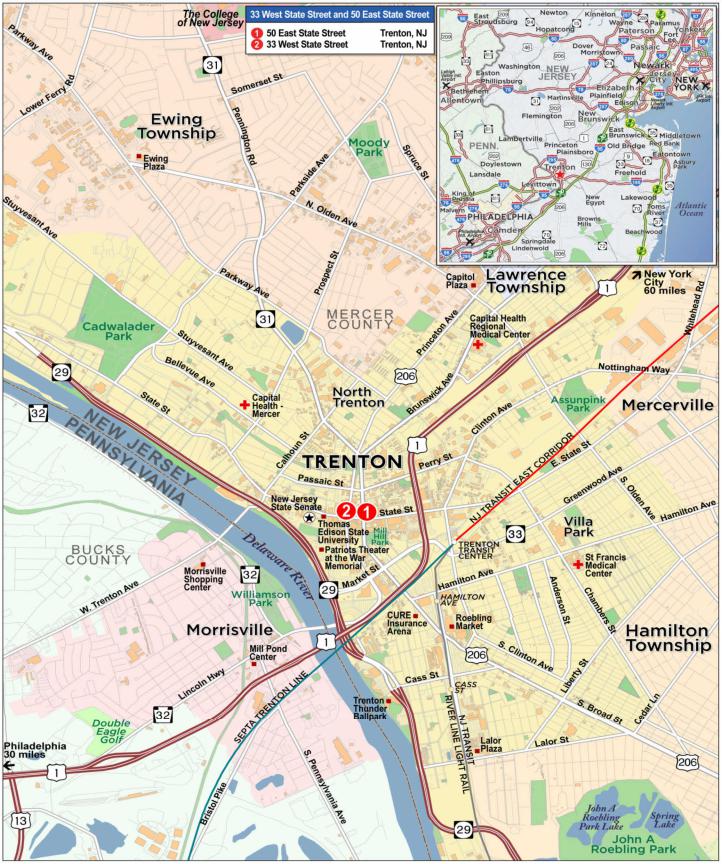
THE INFORMATION IN THIS STRUCTURAL AND COLLATERAL TERM SHEET IS NOT COMPLETE AND MAY BE AMENDED PRIOR TO THE TIME OF SALE. THIS TERM SHEET IS NOT AN OFFER TO SELL THESE SECURITIES AND IT IS NOT A SOLICITATION OF AN OFFER TO BUY THESE SECURITIES IN ANY JURISDICTION WHERE THE OFFER OR SALE IS NOT PERMITTED. |
| | 79 | |
| Structural and Collateral Term Sheet | | BMO 2024-5C3 |
| No. 5 – 33 West State Street and 50 East State Street |
| Mortgage Loan Information | | Property Information |
| Mortgage Loan Seller: | CREFI | | Single Asset / Portfolio: | Portfolio |
| Original Principal Balance(1): | $50,000,000 | | Title: | Fee |
| Cut-off Date Principal Balance(1): | $50,000,000 | | Property Type – Subtype: | Office - CBD |
| % of IPB: | 5.5% | | Net Rentable Area (SF): | 473,622 |
| Loan Purpose: | Refinance | | Location: | Trenton, NJ |
| Borrower: | 33-50 State Street LLC | | Year Built / Renovated(5): | Various / NAP |
| Borrower Sponsor: | Muddy Puddles LLC | | Occupancy: | 93.7% |
| Interest Rate: | 7.35000% | | Occupancy Date: | 12/12/2023 |
| Note Date: | 1/17/2024 | | 4th Most Recent NOI (As of): | $9,077,625 (12/31/2020) |
| Maturity Date: | 2/6/2029 | | 3rd Most Recent NOI (As of): | $8,995,912 (12/31/2021) |
| Interest-only Period: | 60 months | | 2nd Most Recent NOI (As of)(6): | $9,129,723 (12/31/2022) |
| Original Term: | 60 months | | Most Recent NOI (As of)(6): | $13,276,204 (TTM 10/31/2023) |
| Original Amortization Term: | None | | UW Economic Occupancy: | 94.1% |
| Amortization Type: | Interest Only | | UW Revenues: | $17,450,074 |
| Call Protection(2): | L(24),D(29),O(7) | | UW Expenses: | $7,276,016 |
| Lockbox / Cash Management: | Hard / In Place | | UW NOI(6): | $10,174,057 |
| Additional Debt(1): | Yes | | UW NCF: | $10,029,003 |
| Additional Debt Balance(1): | $40,000,000 | | Appraised Value / Per SF: | $138,300,000 / $292 |
| Additional Debt Type(1): | Pari Passu | | Appraisal Date: | 11/28/2023 |
| | | | | |
| Escrows and Reserves(3) | | Financial Information(1) |
| | Initial | Monthly | Initial Cap | | | Whole Loan |
| Taxes: | $267,288 | $267,288 | N/A | | Cut-off Date Loan / SF: | $190 | |
| Insurance: | $78,813 | $15,763 | N/A | | Maturity Date Loan / SF: | $190 | |
| Replacement Reserves: | $0 | $7,894 | N/A | | Cut-off Date LTV: | 65.1% | |
| TI/LC(4): | $20,000,000 | $0 | N/A | | Maturity Date LTV: | 65.1% | |
| | | | | | UW NCF DSCR: | 1.50x | |
| | | | | | UW NOI Debt Yield: | 11.3% | |
| | | | | | | |
| Sources and Uses |
| Sources | Proceeds | % of Total | | Uses | Proceeds | % of Total |
Whole Loan(1) | $90,000,000 | 100.0% | | Loan Payoff(7) | $59,062,024 | 65.6 | % |
| | | | | Upfront Reserves | 20,346,101 | 22.6 | |
| | | | | Sponsor Equity | 9,027,121 | 10.0 | |
| | | | | Closing Costs | 1,564,754 | 1.7 | |
| Total Sources | $90,000,000 | 100.0% | | Total Uses | $90,000,000 | 100.0 | % |
| (1) | The 33 West State Street and 50 East State Street Mortgage Loan (as defined below) is part of the 33 West State Street and 50 East State Street Whole Loan (as defined below), which is comprised of two pari passu promissory notes with an aggregate original principal balance of $90,000,000. The 33 West State Street and 50 East State Street Whole Loan was co-originated by Citi Real Estate Funding Inc. (“CREFI”) and Morgan Stanley Bank, N.A. (“MSBNA”). The Financial Information in the chart above is based on the aggregate outstanding principal balance as of the Cut-off Date of the 33 West State Street and 50 East State Street Whole Loan. |
| (2) | The lockout period will be at least 24 payment dates beginning with and including the first payment date on March 6, 2024. Defeasance of the 33 West State Street and 50 East State Street Whole Loan is permitted at any time after the earlier to occur of (a) the end of the two-year period commencing on the closing date of the securitization of the last promissory note representing a portion of the 33 West State Street and 50 East State Street Whole Loan to be securitized and (b) January 17, 2028. The assumed defeasance lockout period of 24 payments is based on the expected BMO 2024-5C3 securitization closing date in February 2024. The actual lockout period may be longer. |
| (3) | For a full description of Escrows and Reserves, please refer to “Escrows and Reserves” below. |
| (4) | The State of New Jersey’s leases at each of the 50 East State Street Property (as defined below) and the 33 West State Street Property (as defined below) require the related borrower to perform certain improvement work and to spend in connection with such work an aggregate tenant improvement allowance of $20,000,000. Should the sum of the borrower’s expenditures for or in connection with such improvements in the aggregate equal less than $20,000,000, then the State of New Jersey will either receive a rent credit equaling the difference between such expenditures and $20,000,000, or, at the State of New Jersey’s sole discretion, apply the rent credit towards additional refurbishment work by the borrower at the 50 East State Street Property and/or the 33 West State Street Property. At origination of the 33 West State Street and 50 East State Street Mortgage Loan, $20,000,000 was reserved for the cost of performing such improvement work. |
| (5) | See the “Portfolio Summary” chart below. |
| (6) | The increase from 2nd Most Recent NOI (as of) to Most Recent NOI (as of) and subsequent decrease to UW NOI is primarily attributable to one-time holdover rent associated with the State of New Jersey’s leases. |
| (7) | Loan Payoff represents the full loan payoff of the prior CMBS debt securitized in UBSBB 2012-C2, which was paid off by the borrower via cash and an intercompany loan prior to the origination of the 33 West State Street and 50 East State Street Whole Loan. |
THE INFORMATION IN THIS STRUCTURAL AND COLLATERAL TERM SHEET IS NOT COMPLETE AND MAY BE AMENDED PRIOR TO THE TIME OF SALE. THIS TERM SHEET IS NOT AN OFFER TO SELL THESE SECURITIES AND IT IS NOT A SOLICITATION OF AN OFFER TO BUY THESE SECURITIES IN ANY JURISDICTION WHERE THE OFFER OR SALE IS NOT PERMITTED. |
| | 80 | |
| Structural and Collateral Term Sheet | | BMO 2024-5C3 |
| No. 5 – 33 West State Street and 50 East State Street |
The Loan. The fifth largest mortgage loan (the “33 West State Street and 50 East State Street Mortgage Loan”) is part of a whole loan (the “33 West State Street and 50 East State Street Whole Loan”) secured by the borrower’s fee interests in two office properties totaling 473,622 square feet located in Trenton, New Jersey (the “33 West State Street and 50 East State Street Properties”). The 33 West State Street and 50 East State Street Whole Loan is comprised of two pari passu notes, with an aggregate outstanding principal balance as of the Cut-off Date of $90,000,000. The 33 West State Street and 50 East State Street Whole Loan was co-originated on January 17, 2024 by CREFI and MSBNA and accrues interest at a fixed rate of 7.35000% per annum. The 33 West State Street and 50 East State Street Whole Loan has an initial term of five years and is interest-only for the full term. The scheduled maturity date of the 33 West State Street and 50 East State Street Whole Loan is the payment date that occurs on February 6, 2029. The 33 West State Street and 50 East State Street Mortgage Loan is evidenced by the controlling Note A-1 with an outstanding principal balance as of the Cut-off Date of $50,000,000. The remaining Note A-2 is currently held by MSBNA and is expected to be contributed to one or more future securitization trust(s). The relationship between the holders of the 33 West State Street and 50 East State Street Whole Loan is governed by a co-lender agreement as described under “Description of the Mortgage Pool—The Whole Loans—The Serviced Pari Passu Whole Loans” in the Preliminary Prospectus. The 33 West State Street and 50 East State Street Whole Loan will be serviced pursuant to the pooling and servicing agreement for the BMO 2024-5C3 securitization trust. See “The Pooling and Servicing Agreement” in the Preliminary Prospectus.
| Whole Loan Summary |
| Note | Original Balance | Cut-off Date Balance | Note Holder | Controlling Piece |
| A-1 | $50,000,000 | $50,000,000 | BMO 2024-5C3 | Yes |
| A-2(1) | $40,000,000 | $40,000,000 | MSBNA | No |
| Whole Loan | $90,000,000 | $90,000,000 | | |
| (1) | Expected to be contributed to one or more securitization trust(s). |
The Properties. The 33 West State Street and 50 East State Street Properties consist of two properties located at 50 East State Street and 33 West State Street within two blocks of each other, in Trenton, New Jersey, which total 473,622 square feet.
50 East State Street Property
The 50 East State Street property is comprised of a seven-story office building totaling 305,885 square feet located at 50 East State Street, Trenton, New Jersey (the “50 East State Street Property”). The 50 East State Street Property was built in 1989 and is situated on an approximately 1.90-acre site. The 50 East State Street Property features six elevators, 14’ ceiling heights and 14 surface parking spaces, resulting in a parking ratio of approximately 0.05 spaces per 1,000 square feet. The State of New Jersey occupies 246,138 square feet of space at the 50 East State Street Property and has access to 304 of the 310 parking spaces at the 33 West State Street Property described below. As of December 12, 2023, the 50 East State Street Property was 90.5% occupied by 14 unique tenants.
33 West State Street Property
The 33 West State Street property is comprised of a nine-story office building totaling 167,737 square feet located at 33 West State Street, Trenton, New Jersey (the “33 West State Street Property”). The 33 West State Street Property was built in 1986 and is situated on an approximately 0.77-acre site. The 33 West State Street Property features six elevators, 14’ ceiling heights and a 310-space parking garage, resulting in a parking ratio of approximately 1.85 spaces per 1,000 square feet. As of December 12, 2023, the 33 West State Street Property was 99.6% occupied by the State of New Jersey and Santander Sovereign Bank (“Santander”). The State of New Jersey occupies the entirety of the 163,480 square foot office component at the 33 West State Street Property with Santander occupying 3,583 square feet of ground floor retail space.
THE INFORMATION IN THIS STRUCTURAL AND COLLATERAL TERM SHEET IS NOT COMPLETE AND MAY BE AMENDED PRIOR TO THE TIME OF SALE. THIS TERM SHEET IS NOT AN OFFER TO SELL THESE SECURITIES AND IT IS NOT A SOLICITATION OF AN OFFER TO BUY THESE SECURITIES IN ANY JURISDICTION WHERE THE OFFER OR SALE IS NOT PERMITTED. |
| | 81 | |
| Structural and Collateral Term Sheet | | BMO 2024-5C3 |
| No. 5 – 33 West State Street and 50 East State Street |
The following table presents certain information relating to the 33 West State Street and 50 East State Street Properties:
| Portfolio Summary |
| Property Name | City, State | Year Built / Renovated(1) | Sq. Ft.(2) | Occupancy(2) | Allocated Whole Loan Cut-off Date Balance | % of Allocated Whole Loan Cut-off Date Balance | Appraised Value(1) | U/W NOI(2) | % of U/W NOI |
| 50 East State Street | Trenton, NJ | 1989 / NAP | 305,885 | 90.5% | $54,000,000 | 60.0 | % | $82,800,000 | $5,785,098 | 56.9 | % |
| 33 West State Street | Trenton, NJ | 1986 / NAP | 167,737 | 99.6% | 36,000,000 | 40.0 | | 55,500,000 | 4,388,959 | 43.1 | |
| Total | | | 473,622 | 93.7% | $90,000,000 | 100.0 | % | $138,300,000 | $10,174,057 | 100.0 | % |
| (2) | Based on the underwritten rent rolls dated December 12, 2023. |
Major Tenants. The three largest tenants at the 33 West State Street and 50 East State Street Properties based on underwritten base rent are the State of New Jersey, TD Bank and Kicks USA.
State of New Jersey (409,618 square feet; 86.5% of NRA; 92.0% of underwritten base rent): The State of New Jersey leases 246,138 square feet of space at the 50 East State Street Property and 163,480 square feet of space at the 33 West State Street Property. The space leased to the State of New Jersey at the 50 East State Street Property is occupied by various divisions of the Department of Children and Families on the second through seventh floors. The space leased to the State of New Jersey at the 33 West State Street Property is occupied by the Department of Property Management and Construction on the 8th and 9th floors, the Office of Management and Budget on the 6th, 7th, and 2nd floors, the Department of Revenue on the 3rd and 5th floors, the Secretary of State (Staff) Elections on the 4th floor, and the State of New Jersey Economic office on the first floor. The State of New Jersey has been in occupancy at the 33 West State Street and 50 East State Street Properties since they were built in 1986 and 1989 and has a current lease term through October 2038 with no renewal options. The State of New Jersey may terminate its lease at either or both of the 50 East State Street Property and the 33 West State Street Property at any time if either (x) appropriations have not been made by the state legislature for payment of its rent pursuant to its respective lease or (y) the State of New Jersey Leasing and Space Utilization Committee rejects the State of New Jersey’s respective lease.
TD Bank (6,218 square feet; 1.3% of NRA; 1.4% of underwritten base rent): TD Bank (NYSE: TD) is one of the ten largest banks in the U.S., providing over ten million customers with a full range of retail, small business and commercial banking products and services at more than 1,100 locations throughout the Northeast, MidAtlantic, Metro D.C., the Carolinas and Florida. TD Bank has been a tenant at the 50 East State Street Property since November 2002 and has a current lease term through June 2028 with one, five-year renewal option and no termination options.
Kicks USA (6,161 square feet; 1.3% of NRA; 1.2% of underwritten base rent): Founded in 2002, Kicks USA is a sportswear and sneaker retailer operating in New Jersey, New York, Pennsylvania and Maryland. Kicks USA has been a tenant at the 50 East State Street Property since October 2015 and has a current lease term through December 2025 with two, five-year renewal options and no termination options.
Appraisals. According to the appraisals, the 33 West State Street and 50 East State Street Whole Loan had an aggregate “as is” appraised value of $138,300,000 as of November 28, 2023. The table below shows the appraiser’s “as-is” conclusions.
| 33 West State Street and 50 East State Street(1) |
| Property | Value(2) | Capitalization Rate(2) |
| 50 East State Street | $82,800,000 | 7.00% |
| 33 West State Street | $55,500,000 | 7.00% |
| Total / Wtd. Avg | $138,300,000 | 7.00% |
| (2) | The appraiser used a discounted cash flow analysis utilizing an 8.75% internal rate of return and 7.5% terminal capitalization rate to arrive at its value. The capitalization rates shown above represent the direct capitalization rate. |
Environmental. According to the Phase I environmental assessments dated December 5, 2023, there was no evidence of any recognized environmental conditions at the 33 West State Street and 50 East State Street Properties.
THE INFORMATION IN THIS STRUCTURAL AND COLLATERAL TERM SHEET IS NOT COMPLETE AND MAY BE AMENDED PRIOR TO THE TIME OF SALE. THIS TERM SHEET IS NOT AN OFFER TO SELL THESE SECURITIES AND IT IS NOT A SOLICITATION OF AN OFFER TO BUY THESE SECURITIES IN ANY JURISDICTION WHERE THE OFFER OR SALE IS NOT PERMITTED. |
| | 82 | |
| Structural and Collateral Term Sheet | | BMO 2024-5C3 |
| No. 5 – 33 West State Street and 50 East State Street |
The following table presents certain information relating to the historical and current occupancy of the 33 West State Street and 50 East State Street Properties:
| Historical and Current Occupancy(1) |
| 2019 | 2020 | 2021 | 2022 | Current(2) |
| 96.2% | 96.0% | 96.8% | 96.1% | 93.7% |
| (1) | Historical Occupancies are the annual average physical occupancy of each respective year. |
| (2) | Based on the underwritten rent rolls dated December 12, 2023. |
The following table presents certain information relating to the largest tenants based on underwritten base rent at the 33 West State Street and 50 East State Street Properties:
| Top Tenant Summary(1) |
| Tenant | Property | Ratings Moody’s/S&P/Fitch(2) | Net Rentable Area (SF) | % of Total NRA | UW Base Rent PSF(3) | UW Base Rent(3) | % of Total UW Base Rent(3) | Lease Expiration Date |
| State of New Jersey(4) | Various | A1/A/A+ | 409,618 | 86.5 | % | $23.40 | $9,585,038 | 92.0 | % | 10/31/2038 |
| TD Bank | 50 East State Street | Aa2/AA-/AA- | 6,218 | 1.3 | | $24.20 | 150,476 | 1.4 | | 6/30/2028 |
| Kicks USA | 50 East State Street | NR/NR/NR | 6,161 | 1.3 | | $20.00 | 123,220 | 1.2 | | 12/31/2025 |
| Santander Sovereign Bank | 33 West State Street | Baa2/BBB+/NR | 3,583 | 0.8 | | $27.02 | 96,812 | 0.9 | | 6/30/2029 |
| Metro PCS of Pennsylvania, LLC | 50 East State Street | NR/NR/NR | 3,110 | 0.7 | | $31.00 | 96,410 | 0.9 | | 7/31/2026 |
| USA Vein Clinics of New Jersey LLC(5) | 50 East State Street | NR/NR/NR | 4,087 | 0.9 | | $20.50 | 83,784 | 0.8 | | 1/31/2033 |
| Express Management Holdings LLC | 50 East State Street | NR/NR/NR | 2,538 | 0.5 | | $23.82 | 60,444 | 0.6 | | 4/30/2027 |
| Walgreens Eastern Co., Inc. | 50 East State Street | NR/NR/NR | 2,190 | 0.5 | | $18.70 | 40,953 | 0.4 | | 12/31/2027 |
Bosphorus Enterprises, Inc.
(Cricket Wireless) | 50 East State Street | NR/NR/NR | 2,195 | 0.5 | | $18.45 | 40,498 | 0.4 | | 12/31/2028 |
| Jersey Health Examiners, P.A | 50 East State Street | NR/NR/NR | 1,250 | 0.3 | | $25.50 | 31,875 | 0.3 | | 10/31/2024 |
| Largest Tenants | | | 440,950 | 93.1 | % | $23.38 | $10,309,509 | 98.9 | % | |
| Remaining Tenants | | | 3,003 | 0.6 | | $37.03 | $111,188 | 1.1 | | |
| Total Occupied | | | 443,953 | 93.7 | % | $23.47 | $10,420,696 | 100.0 | % | |
| Vacant Space | | | 29,669 | 6.3 | | | | | |
| Total / Wtd. Avg. | | | 473,622 | 100.0 | % | | | | |
| (1) | Based on the underwritten rent rolls dated December 12, 2023. |
| (2) | In certain instances, ratings provided are those of the parent company of the entity shown, whether or not the parent company guarantees the lease. |
| (3) | UW Base Rent PSF, UW Base Rent and % of Total UW Base Rent include straight-line rent steps of $163,847 for the State of New Jersey and contractual rent steps through December 12, 2024 totaling $6,967. |
| (4) | The State of New Jersey leases 246,138 square feet of space at the 50 East State Street Property and 163,480 square feet of space at the 33 West State Street Property. Pursuant to its leases, the State of New Jersey pays approximately $5,661,174 in annual average rent for its space at the 50 East State Street Property and $3,760,017 in annual average rent for its space at the 33 West State Street Property. The State of New Jersey may terminate its lease at either or both of the 50 East State Street Property and the 33 West State Street Property at any time if either (x) appropriations have not been made by the state legislature for payment of its rent pursuant to its respective lease or (y) the State of New Jersey Leasing and Space Utilization Committee rejects the State of New Jersey’s respective lease. |
| (5) | USA Vein Clinics of New Jersey LLC may terminate its lease in August 2027, August 2029 or August 2031 by providing at least 180 days’ prior notice and payment of an early termination fee equal to any pre-paid leasing commission(s) and reimbursement to the landlord for any unamortized portion of construction costs paid for by the landlord (50% if terminated in August 2027, 30% if terminated in August 2029, and 10% if terminated in August 2031). |
THE INFORMATION IN THIS STRUCTURAL AND COLLATERAL TERM SHEET IS NOT COMPLETE AND MAY BE AMENDED PRIOR TO THE TIME OF SALE. THIS TERM SHEET IS NOT AN OFFER TO SELL THESE SECURITIES AND IT IS NOT A SOLICITATION OF AN OFFER TO BUY THESE SECURITIES IN ANY JURISDICTION WHERE THE OFFER OR SALE IS NOT PERMITTED. |
| | 83 | |
| Structural and Collateral Term Sheet | | BMO 2024-5C3 |
| No. 5 – 33 West State Street and 50 East State Street |
The following table presents certain information relating to tenant lease expirations at the 33 West State Street and 50 East State Street Properties:
| Lease Rollover Schedule(1)(2) |
| Year | Number of Leases Expiring | Net Rentable Area Expiring | % of NRA Expiring | UW Base Rent Expiring(3) | % of UW Base Rent Expiring | Cumulative Net Rentable Area Expiring | Cumulative % of NRA Expiring | Cumulative UW Base Rent Expiring | Cumulative % of UW Base Rent Expiring |
| Vacant | 0 | 29,669 | 6.3% | NAP | NAP | 29,669 | 6.3% | NAP | NAP |
| 2024 & MTM(4) | 4 | 3,890 | 0.8 | $103,505 | 1.0% | 33,559 | 7.1% | $103,505 | 1.0% |
| 2025 | 1 | 6,161 | 1.3 | 123,220 | 1.2 | 39,720 | 8.4% | $226,725 | 2.2% |
| 2026 | 2 | 3,472 | 0.7 | 104,210 | 1.0 | 43,192 | 9.1% | $330,935 | 3.2% |
| 2027 | 2 | 4,728 | 1.0 | 101,397 | 1.0 | 47,920 | 10.1% | $432,332 | 4.1% |
| 2028 | 3 | 8,414 | 1.8 | 222,731 | 2.1 | 56,334 | 11.9% | $655,063 | 6.3% |
| 2029 | 1 | 3,583 | 0.8 | 96,812 | 0.9 | 59,917 | 12.7% | $751,875 | 7.2% |
| 2030 | 0 | 0 | 0.0 | 0 | 0.0 | 59,917 | 12.7% | $751,875 | 7.2% |
| 2031 | 0 | 0 | 0.0 | 0 | 0.0 | 59,917 | 12.7% | $751,875 | 7.2% |
| 2032 | 0 | 0 | 0.0 | 0 | 0.0 | 59,917 | 12.7% | $751,875 | 7.2% |
| 2033 | 1 | 4,087 | 0.9 | 83,784 | 0.8 | 64,004 | 13.5% | $835,659 | 8.0% |
| 2034 | 0 | 0 | 0.0 | 0 | 0.0 | 64,004 | 13.5% | $835,659 | 8.0% |
| 2035 & Beyond | 2 | 409,618 | 86.5 | 9,585,038 | 92.0 | 473,622 | 100.0% | $10,420,696 | 100.0% |
| Total | 16 | 473,622 | 100.0% | $10,420,696 | 100.0% | | | | |
| (1) | Based on the underwritten rent rolls dated December 12, 2023. |
| (2) | Certain tenants have more than one lease. Certain tenants may have lease termination or contraction options that are exercisable prior to the originally stated expiration date of the subject lease and that are not considered in the lease rollover schedule. |
| (3) | UW Base Rent Expiring, % of UW Base Rent Expiring, Cumulative UW Base Rent Expiring and Cumulative % of UW Base Rent Expiring include straight-line rent steps of $163,847 for the State of New Jersey and contractual rent steps through December 12, 2024, totaling $6,967. |
| (4) | Includes two MTM tenants. |
THE INFORMATION IN THIS STRUCTURAL AND COLLATERAL TERM SHEET IS NOT COMPLETE AND MAY BE AMENDED PRIOR TO THE TIME OF SALE. THIS TERM SHEET IS NOT AN OFFER TO SELL THESE SECURITIES AND IT IS NOT A SOLICITATION OF AN OFFER TO BUY THESE SECURITIES IN ANY JURISDICTION WHERE THE OFFER OR SALE IS NOT PERMITTED. |
| | 84 | |
| Structural and Collateral Term Sheet | | BMO 2024-5C3 |
| No. 5 – 33 West State Street and 50 East State Street |
The following table presents certain information relating to operating history and underwritten cash flows at the 33 West State Street and 50 East State Street Properties:
| Operating History and Underwritten Net Cash Flow(1) |
| | 2019 | 2020 | 2021 | 2022(2) | TTM October 2023(2)(3) | Underwritten(2) | Per Square Foot | %(4) |
| Rents in Place | $9,134,507 | $9,324,936 | $9,202,916 | $9,447,806 | $13,155,241 | $10,249,882 | $21.64 | 57.0% |
| Contractual Rent Steps(5) | 0 | 0 | 0 | 0 | 0 | 170,814 | 0.36 | 1.0 |
| Vacant Income | 0 | 0 | 0 | 0 | 0 | 1,055,046 | 2.23 | 5.9 |
| Gross Potential Rent | $9,134,507 | $9,324,936 | $9,202,916 | $9,447,806 | $13,155,241 | $11,475,742 | $24.23 | 63.8% |
| Total Reimbursements | 6,022,191 | 5,869,897 | 6,033,941 | 6,289,863 | 6,612,451 | 6,500,018 | 13.72 | 36.2 |
| Net Rental Income | $15,156,697 | $15,194,833 | $15,236,857 | $15,737,669 | $19,767,692 | $17,975,760 | $37.95 | 100.0% |
| Other Income(6) | 567,626 | 559,629 | 561,522 | 566,195 | 559,425 | 530,865 | 1.12 | 3.0 |
| (Vacancy/Credit Loss) | 0 | 0 | 0 | 0 | 0 | (1,056,551) | (2.23) | (5.9) |
| Effective Gross Income | $15,724,324 | $15,754,462 | $15,798,379 | $16,303,864 | $20,327,117 | $17,450,074 | $36.84 | 97.1% |
| Real Estate Taxes | 2,866,638 | 2,914,906 | 2,927,366 | 2,879,833 | 2,890,513 | 2,932,671 | 6.19 | 16.8 |
| Insurance | 117,896 | 120,955 | 131,134 | 145,851 | 153,634 | 180,143 | 0.38 | 1.0 |
| Management Fee | 396,444 | 402,444 | 388,762 | 407,967 | 507,854 | 523,502 | 1.11 | 3.0 |
| Other Expenses(7) | 3,532,783 | 3,238,533 | 3,355,205 | 3,740,490 | 3,498,912 | 3,639,700 | 7.68 | 20.9 |
| Total Expenses | $6,913,761 | $6,676,838 | $6,802,467 | $7,174,141 | $7,050,913 | $7,276,016 | $15.36 | 41.7% |
| Net Operating Income | $8,810,562 | $9,077,625 | $8,995,912 | $9,129,723 | $13,276,204 | $10,174,057 | $21.48 | 58.3% |
| Replacement Reserves | 0 | 0 | 0 | 0 | 0 | 94,724 | 0.20 | 0.5 |
| TI/LC | 0 | 0 | 0 | 0 | 0 | 50,330 | 0.11 | 0.3 |
| Net Cash Flow | $8,810,562 | $9,077,625 | $8,995,912 | $9,129,723 | $13,276,204 | $10,029,003 | $21.18 | 57.5% |
| (1) | Based on the underwritten rent rolls dated December 12, 2023. |
| (2) | The increase in Net Operating Income from 2022 to TTM October 2023 and subsequent decrease in Net Operating Income from TTM October 2023 to Underwritten is primarily attributable to one-time holdover rent associated with the State of New Jersey’s leases. |
| (3) | TTM reflects the trailing 12-month period ending October 31, 2023. |
| (4) | % column represents percent of Net Rental Income for all revenue lines and represents percent of Effective Gross Income for the remainder of fields. |
| (5) | Underwritten Contractual Rent Steps include straight-line rent steps of $163,847 for the State of New Jersey and contractual rent steps through December 12, 2024, totaling $6,967. |
| (6) | Other Income includes $507,552 in parking income and the remainder from miscellaneous income. |
| (7) | Other Expenses consist of payroll and benefits, contract services, repairs and maintenance, utilities, general and administrative payroll and benefits, cleaning, repairs and maintenance, utilities, general and administrative and parking expenses. |
The Market. The 33 West State Street and 50 East State Street Properties are located within two blocks of each other at 50 East State Street and 33 West State Street in Trenton, New Jersey and are part of the Trenton-Princeton, New Jersey Metropolitan Statistical Area (“Trenton MSA”). The 33 West State Street and 50 East State Street Properties are located approximately 33.0 miles northeast of Philadelphia and 60.3 miles southwest of New York City. The 33 West State Street and 50 East State Street Properties have nearby access to U.S. Routes 1 and 206, which provide immediate access to main highways connecting Trenton to area suburbs including Interstates 95, 195 and 295 and U.S. Route 1.
According to the appraisals, the 33 West State Street and 50 East State Street Properties are located in the Trenton Office submarket of the Trenton MSA. As of the third quarter of 2023, the Trenton Office submarket had a total office inventory of 29,814,783 square feet, a vacancy rate of 10.2%, and average asking rent of $23.28 per square foot with no new deliveries within the past year.
THE INFORMATION IN THIS STRUCTURAL AND COLLATERAL TERM SHEET IS NOT COMPLETE AND MAY BE AMENDED PRIOR TO THE TIME OF SALE. THIS TERM SHEET IS NOT AN OFFER TO SELL THESE SECURITIES AND IT IS NOT A SOLICITATION OF AN OFFER TO BUY THESE SECURITIES IN ANY JURISDICTION WHERE THE OFFER OR SALE IS NOT PERMITTED. |
| | 85 | |
| Structural and Collateral Term Sheet | | BMO 2024-5C3 |
| No. 5 – 33 West State Street and 50 East State Street |
The following table presents certain information relating to comparable office leases at 33 West State Street and 50 East State Street Properties:
| Comparable Office Rental Summary(1) |
| Property Name | Tenant | Suite Size (SF) | Commencement | Lease Term (Yrs) | Rent (PSF) |
| 33 West State Street and 50 East State Street | Various | Various | Various | Various | $23.47(2) |
| Tower Center 1 | HCL | 40,732 SF | August 2023 | 15.0 yrs | $31.50 |
| Tower Center 1 | Confidential | 26,770 SF | May 2021 | 10.0 yrs | $29.50 |
| Van Nest Office Park | Caplin Steriles USA | 1,492 SF | October 2023 | 5.3 yrs | $17.00 |
| 200 Princeton South Corporate Center | Berkley Insurance | 15,561 SF | October 2022 | 10.5 yrs | $30.50 |
| Princeton Forrestal Center | MRM | 16,306 SF | August 2022 | 10.0 yrs | $32.00 |
| The Commons | Bristol-Myers Squibb | 118,110 SF | March 2021 | 10.0 yrs | $35.00 |
| (2) | Based on the underwritten rent rolls dated December 12, 2023. |
The Borrower. The borrower is 33-50 State Street LLC, a Delaware limited liability company and single-purpose entity having at least one independent director in its organizational structure. Legal counsel to the borrower delivered a non-consolidation opinion in connection with the origination of the 33 West State Street and 50 East State Street Whole Loan.
The Borrower Sponsor. The borrower sponsor is Muddy Puddles LLC and the non-recourse carveout guarantors are Simon Glick, Seymour Pluchenik and Menashe Frankel. Simon Glick oversees Glick Family Investments, which is a family office, based in New York that specializes in real estate and private equity investments.
Property Management. The 33 West State Street and 50 East State Street Properties are managed by Ten to Five Management LLC, a borrower-affiliated management company.
Escrows and Reserves. At origination of the 33 West State Street and 50 East State Street Whole Loan, the borrower deposited approximately (i) $267,288 into a reserve account for real estate taxes, (ii) $78,813 into a reserve account for insurance premiums, and (iii) $20,000,000 into a reserve account for tenant improvements and leasing commissions.
Tax Reserve – The borrower is required to deposit into a real estate tax reserve, on a monthly basis, 1/12 of the taxes that the lender reasonably estimates will be payable over the next-ensuing 12-month period (initially estimated to be approximately $267,288).
Insurance Reserve – The borrower is required to deposit into an insurance reserve, on a monthly basis, 1/12 of the amount, which will be sufficient to pay the insurance premiums due for the renewal of coverage afforded by such policies (initially estimated to be approximately $15,763).
Replacement Reserve – The borrower is required to deposit into a replacement reserve, on a monthly basis, approximately $7,894.
TI / LC Reserve – If at any time any Specified Tenant (as defined below) requires that the borrower provide a refurbishment allowance and/or rent credit, the borrower is required to deposit the full amount of such refurbishment allowance and/or rent credit into the reserve account for tenant improvements and leasing commissions.
THE INFORMATION IN THIS STRUCTURAL AND COLLATERAL TERM SHEET IS NOT COMPLETE AND MAY BE AMENDED PRIOR TO THE TIME OF SALE. THIS TERM SHEET IS NOT AN OFFER TO SELL THESE SECURITIES AND IT IS NOT A SOLICITATION OF AN OFFER TO BUY THESE SECURITIES IN ANY JURISDICTION WHERE THE OFFER OR SALE IS NOT PERMITTED. |
| | 86 | |
| Structural and Collateral Term Sheet | | BMO 2024-5C3 |
| No. 5 – 33 West State Street and 50 East State Street |
Lockbox / Cash Management. The 33 West State Street and 50 East State Street Whole Loan is structured with a hard lockbox and in place cash management. The borrower is required to, and is required to cause the property manager to, immediately deposit all revenue directly into a lender approved lockbox account. Within five business days of the execution of the lockbox account agreement, the borrower is required to deliver a notice to all tenants at the 33 West State Street and 50 East State Street Properties directing them to remit all payments due under the applicable lease directly to the lender-controlled lockbox. All funds deposited into the lockbox are required to be transferred on each business day to the cash management account, to be applied and disbursed in accordance with the 33 West State Street and 50 East State Street Whole Loan documents, and all excess cash flow funds remaining in the cash management account after the application of such funds will (i) to the extent that a Trigger Period (as defined below) has occurred and is continuing, be deposited in the excess cash flow account, and (ii) to the extent no Trigger Period exists, be disbursed to the borrower. Upon an event of default under the 33 West Street and 50 East State Street Mortgage Loan documents, the lender may apply funds to the debt in such priority as it may determine.
A “Specified Tenant” means, as applicable, the State of New Jersey, together with any successor and/or assigns thereof, (i) any other lessee(s) of the Specified Tenant space (or any portion thereof) and (ii) any guarantor(s) of the applicable related Specified Tenant lease(s).
A “Trigger Period” means a period (A) commencing upon the earliest of (i) the occurrence and continuance of an event of default, (ii) the debt service coverage ratio being less than 1.25x, and (iii) the occurrence of a Specified Tenant Trigger Period (as defined below), and (B) expiring upon (x) with regard to any Trigger Period commenced pursuant to clause (i) above, the cure (if applicable) of such event of default, and (y) with regard to any Trigger Period commenced pursuant to clause (ii) above, the date that the debt service coverage ratio is equal to or greater than 1.25x for two consecutive calendar quarters, and (z) with regard to any Trigger Period commenced pursuant to clause (iii) above, a Specified Tenant Trigger Period ceasing to exist.
A “Specified Tenant Trigger Period” means a period (A) commencing upon the first to occur of (i) Specified Tenant being in monetary or material non-monetary default under the applicable Specified Tenant lease beyond any applicable notice and cure periods, (ii) Specified Tenant failing to be in actual, physical possession of the Specified Tenant space (or applicable portion thereof), (iii) other than in connection with a permitted dark event, Specified Tenant failing to be open for business during customary hours and/or “going dark” in the Specified Tenant space (or applicable portion thereof), (iv) Specified Tenant giving notice that it is terminating its lease for all or any portion of the Specified Tenant space (or applicable portion thereof), (v) any termination or cancellation of any Specified Tenant lease (including, without limitation, rejection in any bankruptcy or similar insolvency proceeding) and/or any Specified Tenant lease failing to otherwise be in full force and effect, (vi) any bankruptcy or similar insolvency of Specified Tenant, and (vii) Specified Tenant failing to extend or renew the applicable Specified Tenant lease for a minimum renewal term of five years on or prior to the earlier to occur of (1) twelve months prior to the expiration of the then applicable term of the applicable Specified Tenant lease and (2) the date required under a Specified Tenant lease by which the tenant thereunder is required to give notice of its exercise of a renewal option thereunder, in each case, in accordance with the applicable terms and conditions thereof and the 33 West State Street and 50 East State Street Whole Loan documents; and (B) expiring upon the first to occur of the lender’s receipt of evidence reasonably acceptable to the lender of (1) the satisfaction of the applicable Specified Tenant Cure Conditions (as defined below), or (2) the borrower leasing the entire Specified Tenant space (or applicable portion thereof) pursuant to one or more leases in accordance with the applicable terms and conditions of the 33 West State Street and 50 East State Street Whole Loan documents, the applicable tenant(s) under such lease(s) being in actual, physical occupancy of the space demised under its lease, all contingencies to effectiveness of such lease have expired or been satisfied, each such lease has commenced and a rent commencement date has been established.
“Specified Tenant Cure Conditions” means each of the following, as applicable (i) the applicable Specified Tenant has cured all defaults under the applicable Specified Tenant lease, (ii) the applicable Specified Tenant is in actual, physical possession of the Specified Tenant space (or applicable portion thereof) and open for business during customary hours and not “dark” in the Specified Tenant space (or applicable portion thereof) (unless the sole reason the applicable Specified Tenant is not open for business or “dark” is an ongoing permitted dark event with respect to said applicable Specified Tenant), (iii) the applicable Specified Tenant has revoked or rescinded all termination or cancellation notices with respect to the applicable Specified Tenant lease and has re-affirmed the applicable Specified Tenant lease as being in full force and effect, (iv) in the event the Specified Tenant Trigger Period is due to the applicable Specified Tenant’s failure to extend or renew the applicable Specified Tenant lease in accordance with clause (vii) of the definition of “Specified Tenant Trigger
THE INFORMATION IN THIS STRUCTURAL AND COLLATERAL TERM SHEET IS NOT COMPLETE AND MAY BE AMENDED PRIOR TO THE TIME OF SALE. THIS TERM SHEET IS NOT AN OFFER TO SELL THESE SECURITIES AND IT IS NOT A SOLICITATION OF AN OFFER TO BUY THESE SECURITIES IN ANY JURISDICTION WHERE THE OFFER OR SALE IS NOT PERMITTED. |
| | 87 | |
| Structural and Collateral Term Sheet | | BMO 2024-5C3 |
| No. 5 – 33 West State Street and 50 East State Street |
Period”, the applicable Specified Tenant has renewed or extended the applicable Specified Tenant lease in accordance with the terms thereof and the 33 West State Street and 50 East State Street Whole Loan documents for a minimum renewal term of five years, (v) with respect to any applicable bankruptcy or insolvency proceedings involving the applicable Specified Tenant and/or the applicable Specified Tenant lease, the applicable Specified Tenant has affirmed the applicable Specified Tenant lease pursuant to final, non-appealable order of a court of competent jurisdiction, and (vi) the applicable Specified Tenant is paying full, unabated rent under the applicable Specified Tenant lease (unless (x) such non-payment of rent is solely the result of an abatement thereunder and (y) in connection with the foregoing abatement, the borrower has deposited cash into a reserve account with lender an amount equal to the total unabated rent that would otherwise be due and payable during all remaining unexpired abatement periods if no such abatement were in place).
Subordinate Debt. None.
Mezzanine Debt. None.
Partial Release. None.
Ground Lease. None.
THE INFORMATION IN THIS STRUCTURAL AND COLLATERAL TERM SHEET IS NOT COMPLETE AND MAY BE AMENDED PRIOR TO THE TIME OF SALE. THIS TERM SHEET IS NOT AN OFFER TO SELL THESE SECURITIES AND IT IS NOT A SOLICITATION OF AN OFFER TO BUY THESE SECURITIES IN ANY JURISDICTION WHERE THE OFFER OR SALE IS NOT PERMITTED. |
| | 88 | |
| Structural and Collateral Term Sheet | | BMO 2024-5C3 |
| No. 6 – Piazza Alta |

THE INFORMATION IN THIS STRUCTURAL AND COLLATERAL TERM SHEET IS NOT COMPLETE AND MAY BE AMENDED PRIOR TO THE TIME OF SALE. THIS TERM SHEET IS NOT AN OFFER TO SELL THESE SECURITIES AND IT IS NOT A SOLICITATION OF AN OFFER TO BUY THESE SECURITIES IN ANY JURISDICTION WHERE THE OFFER OR SALE IS NOT PERMITTED. |
| | 89 | |
| Structural and Collateral Term Sheet | | BMO 2024-5C3 |
| No. 6 – Piazza Alta |

THE INFORMATION IN THIS STRUCTURAL AND COLLATERAL TERM SHEET IS NOT COMPLETE AND MAY BE AMENDED PRIOR TO THE TIME OF SALE. THIS TERM SHEET IS NOT AN OFFER TO SELL THESE SECURITIES AND IT IS NOT A SOLICITATION OF AN OFFER TO BUY THESE SECURITIES IN ANY JURISDICTION WHERE THE OFFER OR SALE IS NOT PERMITTED. |
| | 90 | |
| Structural and Collateral Term Sheet | | BMO 2024-5C3 |
| No. 6 – Piazza Alta |
| Mortgage Loan Information | | Property Information |
| Mortgage Loan Seller: | SGFC | | Single Asset / Portfolio: | Single Asset |
| Original Principal Balance(1): | $45,000,000 | | Title: | Fee |
| Cut-off Date Principal Balance(1): | $45,000,000 | | Property Type – Subtype: | Multifamily – Luxury High Rise |
| % of IPB: | 5.0% | | Net Rentable Area (Units)(4): | 695 |
| Loan Purpose: | Refinance | | Location: | Philadelphia, PA |
| Borrower: | Terminal Property Owner LLC | | Year Built / Renovated: | 2022-2023 / NAP |
Borrower Sponsors: | Matthew Pestronk and Michael Pestronk | | Occupancy(5): | 91.9% |
| Interest Rate: | 4.67614% | | Occupancy Date: | 8/3/2023 |
| Note Date: | 9/21/2023 | | 4th Most Recent NOI (As of)(6): | NAV |
| Maturity Date: | 10/8/2028 | | 3rd Most Recent NOI (As of)(6): | NAV |
| Interest-Only Period: | 60 months | | 2nd Most Recent NOI (As of)(6): | NAV |
| Original Term: | 60 months | | Most Recent NOI (As of)(6): | NAV |
| Original Amortization Term: | None | | UW Economic Occupancy: | 95.0% |
| Amortization Type: | Interest Only | | UW Revenues: | $25,836,537 |
| Call Protection: | L(28),D(28),O(4) | | UW Expenses: | $3,971,583 |
| Lockbox / Cash Management | Soft (Residential); Hard (Commercial) / In Place | | UW NOI: | $21,864,954 |
| Additional Debt(1): | Yes | | UW NCF: | $21,649,143 |
| Additional Debt Balance(1): | $140,900,000 / $126,100,000 | | Appraised Value / Per Unit: | $470,600,000 / $677,122 |
| Additional Debt Type(1)(2): | Pari Passu / Mezzanine | | Appraisal Date: | 6/27/2023 |
| Escrows and Reserves(3) | | Financial Information(1) |
| | Initial | Monthly | Initial Cap | | | Whole Loan | Total Debt |
| Taxes: | $260,924 | $19,042 | N/A | | Cut-off Date Loan / Unit: | $267,482 | $448,921 |
| Insurance: | $144,517 | Springing | N/A | | Maturity Date Loan / Unit: | $267,482 | $448,921 |
| Replacement Reserves: | $0 | Springing | N/A | | Cut-off Date LTV: | 39.5% | 66.3% |
| TI/LC Reserve: | $11,304,598 | Springing | N/A | | Maturity Date LTV: | 39.5% | 66.3% |
| Other Reserves: | $1,911,036 | $3,250 | N/A | | UW NCF DSCR: | 2.46x | 1.10x |
| | | | | | UW NOI Debt Yield: | 11.8% | 7.0% |
| | | | | | | | |
| Sources and Uses |
| Sources | Proceeds | % of Total | | Uses | Proceeds | % of Total |
| Whole Loan(1) | $185,900,000 | 56.0 | % | | Loan Payoff | $294,834,291 | 88.8 | % |
| Mezzanine Loan(2) | 126,100,000 | 38.0 | | | Closing Costs(7) | 23,748,203 | 7.1 | |
| Sponsor Equity | 20,203,569 | 6.0 | | | Reserves | 13,621,075 | 4.1 | |
| Total Sources | $332,203,569 | 100.0 | % | | Total Uses | $332,203,569 | 100.0 | % |
| (1) | The Piazza Alta Mortgage Loan (as defined below) is part of a whole loan evidenced by five pari passu promissory notes with an aggregate original principal balance as of the Cut-off Date of $185,900,000 (the “Piazza Alta Whole Loan”). The financial information presented in the chart above reflects the Cut-off Date Balance of the Piazza Alta Whole Loan and the Piazza Alta Total Debt (as defined below) inclusive of a $126,100,000 mezzanine loan. |
| (2) | For a full description of the mezzanine loan, see “Subordinate and Mezzanine Debt” below. |
| (3) | For a full description of Escrows and Reserves, see “Escrows and Reserves” below. |
| (4) | The Piazza Alta Property (as defined below) consists of a 695-unit multifamily complex with 35,111 square feet of ground floor retail space and a six-story parking garage. |
| (5) | Occupancy is calculated excluding management units. |
| (6) | Historical NOIs are not available as the Piazza Alta Property was built in several stages from 2022 to 2023. |
| (7) | Closing Costs includes an interest rate buy-down fee of approximately $18,252,000. |
THE INFORMATION IN THIS STRUCTURAL AND COLLATERAL TERM SHEET IS NOT COMPLETE AND MAY BE AMENDED PRIOR TO THE TIME OF SALE. THIS TERM SHEET IS NOT AN OFFER TO SELL THESE SECURITIES AND IT IS NOT A SOLICITATION OF AN OFFER TO BUY THESE SECURITIES IN ANY JURISDICTION WHERE THE OFFER OR SALE IS NOT PERMITTED. |
| | 91 | |
| Structural and Collateral Term Sheet | | BMO 2024-5C3 |
| No. 6 – Piazza Alta |
The Loan. The sixth largest mortgage loan (the “Piazza Alta Mortgage Loan”) is part of a fixed rate whole loan secured by the borrower’s fee simple interest in a 695-unit, Class A luxury high rise multifamily property located in Philadelphia, Pennsylvania (the “Piazza Alta Property”). The Piazza Alta Whole Loan consists of five pari passu notes and accrues interest at 4.67614% per annum. The Piazza Alta Whole Loan has a five-year term, is interest only for the term of the loan and accrues interest on an Actual/360 basis. The Piazza Alta Whole Loan was originated by Societe Generale Financial Corporation. The Piazza Alta Whole Loan is serviced pursuant to the pooling and servicing agreement for the BMO 2023-5C2 securitization trust. See “Description of the Mortgage Pool—The Whole Loans—The Outside Serviced Pari Passu Whole Loans” and “Pooling and Servicing Agreement—Servicing of the Outside Serviced Mortgage Loans” in the Preliminary Prospectus.
The table below identifies the promissory notes that comprise the Piazza Alta Whole Loan:
| Whole Loan Summary |
| Note | Original Balance | Cut-off Date Balance | Note Holder | Controlling Piece |
| A-1 | $75,000,000 | $75,000,000 | BMO 2023-5C2 | Yes |
| A-2 | $50,000,000 | $50,000,000 | BBCMS 2023-5C23 | No |
| A-3 | $45,000,000 | $45,000,000 | BMO 2024-5C3 | No |
| A-4 | $10,000,000 | $10,000,000 | BBCMS 2023-5C23 | No |
| A-5 | $5,900,000 | $5,900,000 | BBCMS 2023-5C23 | No |
| Whole Loan | $185,900,000 | $185,900,000 | | |
The Property. The Piazza Alta Property is a newly developed, Class A, 695-unit luxury high rise multifamily complex with 35,111 square feet of ground floor retail space and a six-story parking garage situated on approximately 4.3 acres located in Philadelphia, Pennsylvania. Phase I of the Piazza Alta Property development was built in several stages between 2022 and 2023, and includes two connected buildings, identified as buildings A – F, that consist of 321 studio units, 132 one-bedroom “junior” units, 150 one-bedroom units, 66 two-bedroom units, 19 three-bedroom units, seven four-bedroom units, 35,111 square feet of ground floor retail space and a six-story parking garage. The Piazza Alta Property represents the borrower sponsors’ most recently delivered and largest ground-up development. The Piazza Alta Property is currently in Phase I of a two-phase development plan. Phase II is expected to include a 434-unit multifamily component to be constructed on an adjacent parcel that is not part of the collateral but is currently part of the same tax parcel. The six-story parking garage has 445 spaces, resulting in a parking ratio of approximately 0.6 spaces per unit. The Piazza Alta Property is subject to a two-unit condominium regime comprised of the collateral Phase I property (“Unit 1”) and the non-collateral Phase II property (“Unit 2”) as described under “Description of the Mortgage Pool—Statistical Characteristics of the Mortgage Loans—Condominium Interests and Other Shared Interests” in the Preliminary Prospectus.
The unit living areas feature either a traditional, sleek or Scandinavian style. The traditional style units feature shaker white cabinetry, stainless steel appliances, travertine porcelain bathroom tile, champagne bronze bathroom features and solid marble patterned backsplashes. The sleek style units feature a darker, modern scheme with charcoal cabinets, black stainless steel appliances, dark stone backsplashes, grey marble patterned porcelain bathroom tile and matte black fixtures throughout. The Scandinavian style unit offers a minimalist look featuring slim-profile cabinetry with stainless steel appliances, solid white marble patterned backsplash and brushed nickel metal accents on fixtures. Each unit at the Piazza Alta Property is equipped with a washer and dryer and the bathrooms feature rainfall shower heads with high-pressure body jets, and some units feature soaking tubs. The common area amenities feature a state-of-the-art fitness center featuring Peloton bikes, life-size ski-machine simulators, a Zen yoga studio and a spin studio. Additionally, the Piazza Alta Property offers a spa featuring saunas, steam rooms, hydromassage beds and treatment rooms that are available for massages and facials. The rooftop terrace features a connected lap and lounge pool, hot tub and kids splash pad, built-in fire pits and dedicated kitchen and dining areas. The Piazza Alta Property also offers a co-working space and lounge area on the second floor. The lounge area is furnished with various seating options and includes an entertaining kitchen with an island for serving and gathering. The co-working space has a separated workstation, balancing the benefits of communal workspace with privacy and social distancing. Residents at the Piazza Alta Property also have access to a professional-grade golf simulator on an amenity floor.
The City of Philadelphia maintains a tax abatement program to promote development of new housing. Under this program, the real estate taxes attributable to newly constructed or rehabilitated improvements are abated for a period of ten years. The tax abatement applicable to the improvements at the Piazza Alta Property will terminate in December 2033. As such,
THE INFORMATION IN THIS STRUCTURAL AND COLLATERAL TERM SHEET IS NOT COMPLETE AND MAY BE AMENDED PRIOR TO THE TIME OF SALE. THIS TERM SHEET IS NOT AN OFFER TO SELL THESE SECURITIES AND IT IS NOT A SOLICITATION OF AN OFFER TO BUY THESE SECURITIES IN ANY JURISDICTION WHERE THE OFFER OR SALE IS NOT PERMITTED. |
| | 92 | |
| Structural and Collateral Term Sheet | | BMO 2024-5C3 |
| No. 6 – Piazza Alta |
2034 will be the first year that the full, unabated real estate taxes will be due at the Piazza Alta Property. According to the Piazza Alta Property’s real estate tax schedule, the unabated taxes would be approximately $1,499,586 for 2024 compared to the abated taxes of $239,766. Additionally, the Piazza Alta Property is subject to the Northern Liberties business improvement district taxes of $22,659. Based on the lender’s underwriting, real estate taxes were underwritten to $262,425. See “Description of the Mortgage Pool—Real Estate and Other Tax Considerations” in the Preliminary Prospectus.
The following table presents detailed information with respect to the unit mix of the Piazza Alta Property:
| Multifamily Unit Mix(1) |
| Unit Type | # of Units | % of Units | Occupied Units | % Occupied | Average SF | Avg. Monthly Rent Per Unit(2) |
| Studio | 321 | (3) | 46.2 | % | 285 | | 88.8% | | 477 | | $1,908 |
| One Bedroom | 150 | (4) | 21.6 | | 144 | | 96.0% | | 637 | | $2,581 |
| One Bedroom Junior | 132 | | 19.0 | | 132 | | 100.0% | | 853 | | $2,963 |
| Two Bedroom | 66 | | 9.5 | | 61 | | 92.4% | | 1,270 | | $4,722 |
| Three Bedroom | 19 | | 2.7 | | 17 | | 89.5% | | 1,494 | | $5,600 |
| Four Bedroom | 7 | | 1.0 | | 0 | | 0.0% | | 2,046 | | $0 |
| Total/Wtd. Avg. | 695 | | 100.0 | % | 639 | | 91.9% | | 702 | | $2,644 |
| (1) | Based on the rent roll dated August 3, 2023. |
| (2) | Avg. Monthly Rent Per Unit is calculated using the in-place rent of the Occupied Units. |
| (3) | The Studio units include four management units. |
| (4) | The One Bedroom units include one management unit. |
Appraisal. According to the appraisal, the Piazza Alta Property had an “as-is” appraised value of $470,600,000 as of June 27, 2023. The table below shows the appraiser’s “as-is” conclusions.
| Appraisal Valuation Summary(1) |
| Appraisal Approach | Appraised Value | Capitalization Rate(2) |
| Income Capitalization Approach | $470,600,000 | 4.75% |
| (2) | The appraiser used a discounted cash flow approach to arrive at the appraised value. The capitalization rate shown above represents the overall capitalization rate. |
Environmental. According to the Phase I environmental assessment dated June 21, 2023, there is no evidence of any recognized environmental conditions at the Piazza Alta Property. However, the Phase I environmental assessment did identify a controlled recognized environmental condition and historical recognized environmental condition relating to past uses at the Piazza Alta Property as described under “Description of the Mortgage Pool—Environmental Considerations” in the Preliminary Prospectus.
The following table presents certain information relating to the historical and current occupancy of the Piazza Alta Property:
| Historical and Current Occupancy(1) |
| 2020 | 2021 | 2022 | Current(2) |
| NAV | NAV | NAV | 91.9% |
| (1) | Historical Occupancy is not available as the Piazza Alta Property was built in several stages from 2022 to 2023. |
| (2) | Current Occupancy is as of August 3, 2023 and excludes management units. |
THE INFORMATION IN THIS STRUCTURAL AND COLLATERAL TERM SHEET IS NOT COMPLETE AND MAY BE AMENDED PRIOR TO THE TIME OF SALE. THIS TERM SHEET IS NOT AN OFFER TO SELL THESE SECURITIES AND IT IS NOT A SOLICITATION OF AN OFFER TO BUY THESE SECURITIES IN ANY JURISDICTION WHERE THE OFFER OR SALE IS NOT PERMITTED. |
| | 93 | |
| Structural and Collateral Term Sheet | | BMO 2024-5C3 |
| No. 6 – Piazza Alta |
The following table presents certain information relating to the underwritten cash flows of the Piazza Alta Property:
| Underwritten Net Cash Flow(1) |
| | Underwritten | Per Unit | %(2) | |
| Gross Rental Income | $22,495,357 | $32,367 | 81.5 | % |
| Commercial Revenue | 2,457,770 | 3,536 | 8.9 | |
| Parking Income | 1,804,800 | 2,597 | 6.5 | |
| Gross Potential Rent | $26,757,927 | $38,501 | 97.0 | % |
| RUBS Income | 429,510 | 618 | 1.6 | |
| Other Income(3) | 412,000 | 593 | 1.5 | |
| Total Gross Potential Income | $27,599,437 | $39,711 | 100.0 | % |
| (Vacancy/Credit Loss)(4) | (1,740,640) | (2,505) | (6.3 | ) |
| Concessions | (22,260) | (32) | (0.1 | ) |
| Effective Gross Income | $25,836,537 | $37,175 | 93.6 | % |
| | | | |
| Total Expenses | $3,971,583 | $5,715 | 15.4 | % |
| Net Operating Income | $21,864,954 | $31,460 | 84.6 | % |
| Capital Expenditures | 180,700 | 260 | 0.7 | |
| TI/LC | 35,111 | 51 | 0.1 | |
| Net Cash Flow | $21,649,143 | $31,150 | 83.8 | % |
| (1) | Based on the underwritten net cash flow and rent roll dated August 3, 2023. |
| (2) | % column represents percent of Total Gross Potential Income for all revenue lines and represents percent of Effective Gross Income for the remainder of fields. |
| (3) | Other Income is based on the appraisal and includes month-to-month fees, late fees, application fees, damages and cleaning fees, lease cancellation fees, administrative fees, pet premiums, amenities fees, commercial tenant reimbursements, and any other miscellaneous income items. |
| (4) | Underwritten Vacancy/Credit Loss represents the underwritten economic vacancy of 5.0% for the residential portion of the Piazza Alta Property. |
The Market. The Piazza Alta Property is located within the Northern Liberties neighborhood of Philadelphia’s Center City district which spans from the Art Museum steps to the riverfront to the east and South Street to the south. The Northern Liberties neighborhood is a revitalized area with art galleries, boutiques and several restaurants. Philadelphia’s squares and newest civic spaces are minutes away from the Piazza Alta Property and offer outdoor living spaces for its residents. Located southwest of the Piazza Alta Property are the Rittenhouse Square neighborhood and Washington Square West neighborhoods. Rittenhouse Row is a shopping destination featuring locally owned boutiques, high-end stores, small galleries, specialty shops, spas and salons, and restaurants and cafes. Other uses adjacent to the Piazza Alta Property include the Academy of Music and Kimmel Center to the south, The Franklin Institute to the west and Rivers Casino to the east.
The city of Philadelphia is an economic center in Pennsylvania and home to thirteen Fortune 500 companies. Philadelphia's economy is driven by life sciences, financial services, technology and advanced manufacturing. Major employers include: University of Pennsylvania, Virtua Health, Comcast, Aramark, Johnson & Johnson, Dupont Merck, Rite Aid and AmerisourceBergen. Comcast Center is located less than three miles from the Piazza Alta Property. Comcast Center features a three-building urban campus, a Four Seasons Hotel and the 58-story Comcast Technology Center. The Comcast Center is the Comcast Corporation’s headquarters and is home to 8,000 employees. The city is one of the largest health, education and research centers in the United States, featuring a number of higher-level educational facilities, including Temple University, Drexel University, West Chester University, University of Pennsylvania and Villanova University.
Public transportation is available near the Piazza Alta Property with the immediate area being served by the Southeastern Pennsylvania Transportation Authority with bus stops on North 2nd Street and West Girard Avenue. Subway service is provided at the Girard Station (Market-Frankford Line). Major traffic arteries located within five miles of the Piazza Alta Property include Interstate 76, Interstate 676, Interstate 95, US Route 13 and US Route 30.
THE INFORMATION IN THIS STRUCTURAL AND COLLATERAL TERM SHEET IS NOT COMPLETE AND MAY BE AMENDED PRIOR TO THE TIME OF SALE. THIS TERM SHEET IS NOT AN OFFER TO SELL THESE SECURITIES AND IT IS NOT A SOLICITATION OF AN OFFER TO BUY THESE SECURITIES IN ANY JURISDICTION WHERE THE OFFER OR SALE IS NOT PERMITTED. |
| | 94 | |
| Structural and Collateral Term Sheet | | BMO 2024-5C3 |
| No. 6 – Piazza Alta |
Per the appraisal, as of the first quarter of 2023, the Center City Philadelphia submarket reported total inventory of 44,177 units and a vacancy rate of 5.7%.
| Submarket Multifamily Statistics(1) |
| |
| Date | Inventory | Rent Per Unit | Occupancy |
| 2018 | 38,181 | $2,183 | 94.2% |
| 2019 | 39,498 | $2,351 | 95.2% |
| 2020 | 40,234 | $2,126 | 92.5% |
| 2021 | 41,529 | $2,352 | 95.8% |
| 2022 | 43,862 | $2,457 | 94.2% |
| 1st Qtr. 2023 | 44,177 | $2,433 | 94.3% |
The appraisal identified six comparable rental properties for the Piazza Alta Property. The comparable leases indicate a rent range of $1,655 per month to $8,250 per month, averaging $3,093 per month. The comparable properties were built between 2007 and 2022 and range from 183 to 316 units. The occupancy of the comparables range from 90.0% to 99.0%. The average unit size of the comparable range from 701 square feet to 1,319 square feet with an average of 941 square feet.
| Multifamily Rent Comparables(1) |
| |
| Property | Distance from Subject (miles) | Year Built/Year Renovated | Occupancy | No. Units | Avg. Unit Size (SF) | Avg. Rent Per Unit | Amenities |
Piazza Alta 1099 Germantown
Avenue Philadelphia, PA | - | 2022-2023/NAP | 91.9%(2) | 695(2) | 702(2) | $2,644(2) | Fitness Center, Sauna, Steam Room, Swimming Pools, Fit-Pit Area, Co-working Spaces, Indoor/Outdoor Lounge Areas, Concierge Services, Parking Garage |
The Alexander 300 Alexander Court Philadelphia, PA | 1.6 | 2018/NAP | 95.0% | 277 | 701 | $2,589 | Elevators, Fitness Center, Swimming Pool |
Dwell 1321 N American Street Philadelphia, PA | 0.3 | 2020/NAP | 90.0% | 198 | 827 | $2,470 | Business Center, Dog Park, Fitness Center, Swimming Pool |
St. James 200 West Washington
Square Philadelphia, PA | 1.6 | 2022/NAP | 96.0% | 304 | 1,319 | $3,677 | Business Center, Concierge/Doorman, Elevators, Exterior Lighting, Fitness Center, Game Room, Guest Parking, On-Site Manager, Pet Policy |
The Harper 112 South 19th Street Philadelphia, PA | 2.1 | 2019/NAP | 99.0% | 183 | 1,049 | $4,646 | Business Center, Fitness Center, Game Room, Sport Court, Swimming Pool |
The Piazza 1001 N 2nd Street Philadelphia, PA | 0.1 | 2007/NAP | 94.7% | 316 | 902 | $2,751 | Fitness Center, Swimming Pool |
The Poplar 901 North 9th Street Philadelphia, PA | 0.7 | 2021/NAP | 96.4% | 285 | 850 | $2,426 | Business Center, Concierge/Doorman, Elevators, Fitness Center, Spa/Sauna, Swimming Pool |
| Average(3) | | | 95.2% | 261 | 941 | $3,093 | |
| (2) | Based on the underwritten rent roll dated August 3, 2023. |
| (3) | Calculated excluding the Piazza Alta Property. |
The Borrower. The borrowing entity for the Piazza Alta Whole Loan is Terminal Property Owner LLC, a Delaware limited liability company and single purpose entity with two independent directors. Legal counsel to the borrower delivered a non-consolidation opinion in connection with the origination of the Piazza Alta Whole Loan.
The Borrower Sponsors. The borrower sponsors and nonrecourse carve-out guarantors of the Piazza Alta Whole Loan are Michael Pestronk and Matthew Pestronk, the founders of Post Brothers LLC (“Post Brothers”). Post Brothers is a developer, owner and manager generally focused on the development and creation of Class A apartment buildings in the
THE INFORMATION IN THIS STRUCTURAL AND COLLATERAL TERM SHEET IS NOT COMPLETE AND MAY BE AMENDED PRIOR TO THE TIME OF SALE. THIS TERM SHEET IS NOT AN OFFER TO SELL THESE SECURITIES AND IT IS NOT A SOLICITATION OF AN OFFER TO BUY THESE SECURITIES IN ANY JURISDICTION WHERE THE OFFER OR SALE IS NOT PERMITTED. |
| | 95 | |
| Structural and Collateral Term Sheet | | BMO 2024-5C3 |
| No. 6 – Piazza Alta |
greater Philadelphia metropolitan area. Post Brothers is a vertically-integrated company, with over 200 employees, providing in-house expertise in design, construction, leasing and management. Since the company’s founding in 2006, Post Brothers has developed or acquired more than 30 properties totaling approximately 8,000 apartments and 700,000 square feet of complimentary office and retail space, with a focus in the greater Philadelphia area and New Jersey.
Property Management. The Piazza Alta Property is managed by Post Commercial Real Estate, LLC, an affiliate of the borrower sponsors. Post Commercial Real Estate, LLC is a full-service multifamily property manager and developer with a current portfolio under management of 8,000 units across 30 residential properties.
Escrows and Reserves. At origination, the borrower deposited in escrow: (i) $260,924 for real estate taxes; (ii) $144,517 for insurance reserves; (iii) $11,304,598 for tenant improvement allowance and leasing commission reserves; (iv) $889,351 for residential concession reserves; and (v) $1,021,685 for free rent reserves.
Tax Escrows – On a monthly basis, the borrower is required to escrow 1/12th of the taxes that the lender estimates will be payable during the next 12 months in order to accumulate sufficient funds to pay all such taxes including, until the occurrence of a Tax Parcel Event (as defined below), taxes attributable to the non-collateral Unit 2 described under “The Property,” above, that is part of a shared tax lot with the Piazza Alta Property at least 30 days prior to their respective due dates. Currently, the borrower is required to pay approximately $19,042 for taxes attributed to Unit 1 of the condominium regime. As of the date of origination, the borrower has represented to the lender that it has taken the necessary steps (including filing the paperwork and the payment of all fees) with the appropriate governmental authorities for the Tax Parcel Event. The borrower is required to (i) periodically update the lender with respect to any progress made towards achieving the Tax Parcel Event, (ii) promptly provide the lender with any correspondence relating to the Tax Parcel Event and (iii) immediately notify the lender upon the occurrence of the Tax Parcel Event and deliver to the lender evidence in form and substance satisfactory to the lender of the occurrence of the Tax Parcel Event. A “Tax Parcel Event” will occur upon (i) Unit 2 being a separate tax lot and not a part of any tax lot of the Piazza Alta Property and not included in the tax bills for the Piazza Alta Property and (ii) the Piazza Alta Property being comprised of one or more parcels with separate tax lots and not being comprised of a portion of any other tax lot that is not a part of the Piazza Alta Property.
Insurance Escrows – On a monthly basis, the borrower is required to escrow 1/12th of the insurance premiums that the lender estimates will be payable for the renewal of coverage afforded by the polices upon the expiration in order to accumulate with the lender sufficient funds to pay all such insurance premiums at least 30 days prior to the expiration. The borrower will not be required to make monthly insurance deposits so long as (i) no event of default has occurred and is continuing, (ii) the borrower provides the lender evidence of renewal of the policies, (iii) the borrower provides the lender with paid receipts evidencing payment of the insurance premiums by no later than 10 business days prior to the expiration dates of the policies, and (iv) there is on deposit in the tax and insurance subaccount with respect to insurance premiums an amount equal to not less than the Static Insurance Reserve Amount (as defined below) (the foregoing clauses (i) through (iv) are collectively referred to as the “Insurance Premium Waiver Conditions”). In the event the Insurance Premium Waiver Conditions are no longer satisfied, the borrower will commence making all monthly insurance deposits as required pursuant to the Piazza Alta Whole Loan documents. Additionally, so long as the Piazza Alta Property is insured under a blanket insurance policy the borrower will not be required to make monthly insurance deposits into the insurance subaccount. As of the date of origination, the Piazza Alta Property is insured under a blanket insurance policy. Notwithstanding the above, in the event that such blanket insurance policy is no longer in effect, the borrower will be required to escrow $144,517 (the “Static Insurance Reserve Amount”), which was reserved at origination. In accordance with the Piazza Alta Whole Loan documents, the lender may from time to time, upon written notice to the borrower, increase the Static Insurance Reserve Amount required to reflect any increases in the insurance premiums for the coverages afforded by the policies on a stand-alone basis, such that the Static Insurance Reserve Amount is not less than three months of the insurance premiums that the lender reasonably estimates will be payable for the renewal of coverage afforded by the policies on a stand-alone basis.
Replacement Reserves – Commencing on the payment date occurring in November 2025 and continuing for each payment date thereafter, the borrower is required to escrow $15,058 for replacement reserves.
TI/LC Reserves – Commencing on the payment date occurring in November 2025 and continuing on each payment date thereafter, the borrower is required to escrow $2,926 for tenant improvement and leasing costs. Additionally, the borrower is required to pay any lease termination payments received from non-residential tenants to the lender for transfer into the tenant improvement and leasing subaccount.
THE INFORMATION IN THIS STRUCTURAL AND COLLATERAL TERM SHEET IS NOT COMPLETE AND MAY BE AMENDED PRIOR TO THE TIME OF SALE. THIS TERM SHEET IS NOT AN OFFER TO SELL THESE SECURITIES AND IT IS NOT A SOLICITATION OF AN OFFER TO BUY THESE SECURITIES IN ANY JURISDICTION WHERE THE OFFER OR SALE IS NOT PERMITTED. |
| | 96 | |
| Structural and Collateral Term Sheet | | BMO 2024-5C3 |
| No. 6 – Piazza Alta |
Common Charges Reserves – On each monthly payment date, the borrower is required to deposit an amount equal to the monthly amount (currently estimated at $39,000 per year or $3,250 per month) as set forth in the approved operating budget for common charges payable on such payment date (plus any other amounts that may be due for common charges which are not included in the approved operating budget) in order to accumulate with the lender sufficient funds to pay all common charges during the next three months prior to their respective due dates.
Lockbox / Cash Management. The Piazza Alta Whole Loan is structured with a soft (for residential tenants) and hard (for commercial tenants) lockbox and in-place cash management. At origination, the Piazza Alta borrower was required to notify each non-residential tenant of the Piazza Alta Property to remit all amounts due with respect to the Piazza Alta Property directly to the lockbox account. Following the addition of any Additional Real Estate (as defined below) to the condominium in accordance with the Piazza Alta Whole Loan documents, the borrower will deliver any rents received by the condominium association, including rents from the garage unit into the lockbox account. All rents received by the borrower or property manager (including, rents received from residential tenants, non-residential tenants, payments received from residential tenants in connection with the early termination or cancellation of residential leases and any rents pertaining to the garage unit) are required to be deposited within two business days of receipt into the lockbox account. All funds in the lockbox account are required to be swept each business day into the lender-controlled cash management account and applied and disbursed in accordance with the Piazza Alta Whole Loan documents. During the continuance of a Cash Trap Period (as defined below), any excess cash flow will be deposited into the cash collateral reserve subaccount. As long as no Cash Trap Period is in effect, any excess cash flow is required to transferred to the borrower.
A “Cash Trap Period” will commence upon: (i) the occurrence of an event of default; (ii) as of the origination date and any other payment date, the failure to maintain a debt service coverage ratio of at least 1.10x (it being acknowledged that a Cash Trap Period commenced as of the origination date as a result of this clause); or (iii) the occurrence of any mezzanine loan default; and will end, as applicable when (1) the Piazza Alta Whole Loan and all other obligations under the Piazza Alta Whole Loan documents have been repaid in full, (2) with respect to clause (i) above only, such event of default has been cured and no other event of default has occurred and is continuing, (3) with respect to clause (ii) above only, for two consecutive calendar quarters since the commencement of the existing Cash Trap Period (A) no monetary default, material non-monetary default or event of default has occurred and is continuing, (B) no event that could trigger another Cash Trap Period has occurred, (C) the debt service coverage ratio is at least equal to 1.10x as of the applicable payment dates following the end of each of two consecutive calendar quarters, and (D) the receipt of notice to the lender from the mezzanine lender that all monthly current mezzanine debt service payments (accrual component) (including, without limitation, any outstanding aggregate accrual component) under the Piazza Alta Mezzanine Loan (as defined below) has been paid current (and no other Cash Trap Period is then continuing), or (4) with respect to clause (iii) above only, receipt by the lender of a notice from the mezzanine lender, that all mezzanine loan defaults under the Piazza Alta Mezzanine Loan have either been cured or waived (and no other Cash Trap Period is then continuing).
Acquisition of Additional Real Estate. Pursuant to the Piazza Alta Whole Loan documents, the borrower has the right to acquire the Additional Real Estate as a general common element (each, an “Acquisition”), subject to the condominium declaration and subject to certain conditions set forth in the Piazza Alta Whole Loan documents, including that: (i) no acceleration of the Piazza Alta Whole Loan and no event of default has occurred; (ii) the proposed Acquisition will not be permitted within 30 days prior to or following a securitization; and (iii) receipt of rating agency confirmations. The “Additional Real Estate” consists of two parcels: (i) a vacant strip of land which was formerly known as Germantown Avenue and (ii) a parking garage located at 145 W. Wildey Street (which exists beneath the roof amenity unit/pool which is already a general common element of the Piazza Alta condominium).
Subordinate and Mezzanine Debt. Concurrently with the origination of the Piazza Alta Whole Loan, a $126,100,000 mezzanine loan was funded (the “Piazza Alta Mezzanine Loan” and together with the Piazza Alta Whole Loan, the “Piazza Alta Total Debt”), which is secured by the mezzanine borrower’s direct equity interests in the borrower. The Piazza Alta Mezzanine Loan accrues interest at a rate of 10.50000% per annum and is coterminous with the Piazza Alta Whole Loan.
With respect to the Piazza Alta Mezzanine Loan, interest on the outstanding principal balance of the Piazza Alta Mezzanine Loan will accrue at a rate of 10.50000% per annum (the “Piazza Alta Mezzanine Loan Interest Rate”), comprised of a current pay interest rate of 8.50000% per annum (the “Current Pay Rate”) and an accrual component interest rate of 2.00000% per annum (the “Accrual Pay Rate”). On each payment date, (i) the mezzanine borrower is required to pay a monthly debt service on the Piazza Alta Mezzanine Loan in an amount equal to the Current Pay Rate (the “Mezzanine Monthly Debt Service (Current Pay)”) and (ii) if any additional amount derived from the Piazza Alta Property is then
THE INFORMATION IN THIS STRUCTURAL AND COLLATERAL TERM SHEET IS NOT COMPLETE AND MAY BE AMENDED PRIOR TO THE TIME OF SALE. THIS TERM SHEET IS NOT AN OFFER TO SELL THESE SECURITIES AND IT IS NOT A SOLICITATION OF AN OFFER TO BUY THESE SECURITIES IN ANY JURISDICTION WHERE THE OFFER OR SALE IS NOT PERMITTED. |
| | 97 | |
| Structural and Collateral Term Sheet | | BMO 2024-5C3 |
| No. 6 – Piazza Alta |
available pursuant to the Mortgage Loan documents, then such amount is required to be applied to that portion of the “Mezzanine Monthly Debt Service Payment Amount” (as defined below) accruing interest at the Accrual Pay Rate (the “Mezzanine Monthly Debt Service (Accrual Component)”). To the extent such additional amount derived from the Piazza Alta Property is insufficient to pay any portion of the Mezzanine Monthly Debt Service (Accrual Component), such unpaid portion will be added to the aggregate accrual component (any Mezzanine Monthly Debt Service (Accrual Component) that has not been paid due to insufficient cash flow will comprise the aggregate accrual component) and accrue interest at the Piazza Alta Mezzanine Loan Interest Rate. Alternatively, to the extent such additional amount derived from the Piazza Alta Property exceeds the Mezzanine Monthly Debt Service (Accrual Component), then such excess will be applied to the aggregate accrual component then outstanding, to reduce the balance of the aggregate accrual component. To the extent the aggregate accrual component is remaining unpaid at the maturity date of the Piazza Alta Whole Loan, the aggregate accrual component will be due and payable in full at the maturity date. The “Mezzanine Monthly Debt Service Payment Amount” means the unpaid principal accrued and accruing through the last day of the applicable interest period (whether the same is actually due and payable or has been deferred pursuant to the terms of the mezzanine loan documents, it being understood that the Mezzanine Monthly Debt Service (Current Pay) may not be deferred at any time). Based on Piazza Alta Total Debt, the Cut-off Date LTV, UW NCF DSCR and UW NOI Debt Yield are 66.3%, 1.10x and 7.0%, respectively.
Permitted Future Mezzanine Debt. Not permitted.
Partial Release. Not permitted.
Ground Lease. None.
THE INFORMATION IN THIS STRUCTURAL AND COLLATERAL TERM SHEET IS NOT COMPLETE AND MAY BE AMENDED PRIOR TO THE TIME OF SALE. THIS TERM SHEET IS NOT AN OFFER TO SELL THESE SECURITIES AND IT IS NOT A SOLICITATION OF AN OFFER TO BUY THESE SECURITIES IN ANY JURISDICTION WHERE THE OFFER OR SALE IS NOT PERMITTED. |
| | 98 | |
| Structural and Collateral Term Sheet | | BMO 2024-5C3 |
| No. 7 – ExchangeRight Net Leased Portfolio #66 |

THE INFORMATION IN THIS STRUCTURAL AND COLLATERAL TERM SHEET IS NOT COMPLETE AND MAY BE AMENDED PRIOR TO THE TIME OF SALE. THIS TERM SHEET IS NOT AN OFFER TO SELL THESE SECURITIES AND IT IS NOT A SOLICITATION OF AN OFFER TO BUY THESE SECURITIES IN ANY JURISDICTION WHERE THE OFFER OR SALE IS NOT PERMITTED. |
| | 99 | |
| Structural and Collateral Term Sheet | | BMO 2024-5C3 |
| No. 7 – ExchangeRight Net Leased Portfolio #66 |

THE INFORMATION IN THIS STRUCTURAL AND COLLATERAL TERM SHEET IS NOT COMPLETE AND MAY BE AMENDED PRIOR TO THE TIME OF SALE. THIS TERM SHEET IS NOT AN OFFER TO SELL THESE SECURITIES AND IT IS NOT A SOLICITATION OF AN OFFER TO BUY THESE SECURITIES IN ANY JURISDICTION WHERE THE OFFER OR SALE IS NOT PERMITTED. |
| | 100 | |
| Structural and Collateral Term Sheet | | BMO 2024-5C3 |
| No. 7 – ExchangeRight Net Leased Portfolio #66 |
| Mortgage Loan Information | | Property Information |
| Mortgage Loan Seller: | CREFI | | Single Asset / Portfolio: | Portfolio |
| Original Principal Balance: | $43,250,000 | | Title: | Fee |
| Cut-off Date Principal Balance: | $43,250,000 | | Property Type – Subtype(2): | Various – Various |
| % of IPB: | 4.8% | | Net Rentable Area (SF): | 507,017 |
| Loan Purpose: | Acquisition | | Location(2): | Various |
Borrower: | ExchangeRight Net-Leased Portfolio 66 DST | | Year Built / Renovated(2): | Various |
| Borrower Sponsor: | ExchangeRight Real Estate, LLC | | Occupancy: | 100.0% |
| Interest Rate: | 6.140000% | | Occupancy Date: | 2/1/2024 |
| Note Date: | 1/17/2024 | | 4th Most Recent NOI (As of)(3): | NAV |
| Maturity Date: | 2/1/2029 | | 3rd Most Recent NOI (As of)(3): | NAV |
| Interest-only Period: | 60 months | | 2nd Most Recent NOI (As of)(3): | NAV |
| Original Term: | 60 months | | Most Recent NOI (As of)(3): | NAV |
| Original Amortization Term: | None | | UW Economic Occupancy: | 95.0% |
| Amortization Type: | Interest Only | | UW Revenues: | $5,645,822 |
| Call Protection: | L(24),D(29),O(7) | | UW Expenses: | $0 |
| Lockbox / Cash Management: | Hard / Springing | | UW NOI: | $5,645,822 |
| Additional Debt: | No | | UW NCF: | $5,574,175 |
| Additional Debt Balance: | N/A | | Appraised Value / Per SF: | $95,175,000 / $188 |
| Additional Debt Type: | N/A | | Appraisal Date(4): | Various |
| | | | | |
| Escrows and Reserves(1) | | Financial Information |
| | Initial | Monthly | Initial Cap | | Cut-off Date Loan / SF: | $85 |
| Taxes: | $24,124 | $12,062 | N/A | | Maturity Date Loan / SF: | $85 |
| Insurance: | $0 | Springing | N/A | | Cut-off Date LTV: | 45.4% |
| Replacement Reserves: | $0 | Springing | N/A | | Maturity Date LTV: | 45.4% |
| TI/LC: | $500,000 | Springing | N/A | | UW NCF DSCR: | 2.07x |
| Deferred Maintenance: | $32,775 | $0 | N/A | | UW NOI Debt Yield: | 13.1% |
| Unfunded Obligations: | $118,750 | $0 | N/A | | | |
| | | | | | | |
| Sources and Uses |
| Sources | Proceeds | % of Total | | Uses | Proceeds | % of Total |
| Mortgage Loan | $43,250,000 | 44.8 | % | | Purchase Price(5) | $93,630,943 | 97.0 | % |
| Borrower Sponsor Equity | 53,273,825 | 55.2 | | | Closing Costs(6) | 2,217,233 | 2.3 | |
| | | | | Upfront Reserves | 675,649 | 0.7 | |
| Total Sources | $96,523,825 | 100.0 | % | | Total Uses | $96,523,825 | 100.0 | % |
| (1) | See “Escrows and Reserves” below for further discussion of reserve information. |
| (2) | See “The Properties” below for more information. |
| (3) | Historical financial information is not available because the ExchangeRight Net Leased Portfolio #66 Properties (as defined below) were acquired by the borrower between December 22, 2023 and January 17, 2024. |
| (4) | The individual appraisal valuation dates are between November 3, 2023 and November 28, 2023. |
| (5) | Purchase Price reflects the combined purchase price of the ExchangeRight Net Leased Portfolio #66 Properties which were acquired between December 2023 and January 2024. |
| (6) | Closing Costs includes an interest rate buydown fee of $1,353,725. |
The Loan. The seventh largest mortgage loan (the “ExchangeRight Net Leased Portfolio #66 Mortgage Loan”) is evidenced by a single promissory note in the original principal amount of $43,250,000 and secured by the borrower’s fee interests in ten single-tenant retail properties and one industrial property leased to FedEx Ground (the “ExchangeRight Net Leased Portfolio #66 Properties”). The ExchangeRight Net Leased Portfolio #66 Mortgage Loan was originated on January 17, 2024 by Citi Real Estate Funding Inc. and accrues interest at a fixed rate of 6.14000% per annum. The ExchangeRight Net Leased Portfolio #66 Mortgage Loan had an original term of 60 months and is interest only for the entire term. The scheduled maturity date of the ExchangeRight Net Leased Portfolio #66 Mortgage Loan is the payment date in February 2029. The ExchangeRight Net Leased Portfolio #66 Mortgage Loan proceeds, along with approximately $53.3
THE INFORMATION IN THIS STRUCTURAL AND COLLATERAL TERM SHEET IS NOT COMPLETE AND MAY BE AMENDED PRIOR TO THE TIME OF SALE. THIS TERM SHEET IS NOT AN OFFER TO SELL THESE SECURITIES AND IT IS NOT A SOLICITATION OF AN OFFER TO BUY THESE SECURITIES IN ANY JURISDICTION WHERE THE OFFER OR SALE IS NOT PERMITTED. |
| | 101 | |
| Structural and Collateral Term Sheet | | BMO 2024-5C3 |
| No. 7 – ExchangeRight Net Leased Portfolio #66 |
million of equity contributed by the borrower sponsor, were used to acquire the ExchangeRight Net Leased Portfolio #66 Properties, fund upfront reserves and pay origination costs.
The Properties. The ExchangeRight Net Leased Portfolio #66 Properties are comprised of 10 single-tenant retail properties and one single-tenant warehouse/distribution industrial property totaling 507,017 square feet and located across eight states. The ExchangeRight Net Leased Portfolio #66 Properties are located in the following states: Pennsylvania (one property, 49.5% of net rentable area and 44.4% of underwritten rent), Missouri (one property, 17.5% of net rentable area and 20.7% of underwritten rent), Massachusetts (one property, 14.0% of net rentable area and 13.8% of underwritten rent), Idaho (one property, 4.3% of net rentable area and 8.0% of underwritten rent), Texas (three properties, 5.8% of net rentable area and 5.8% of underwritten rent), Michigan (two properties, 4.3% of net rentable area and 3.6% of underwritten rent), Ohio (one property, 2.5% of net rentable area and 1.9% of underwritten rent) and Indiana (one property, 2.2% of net rentable area and 1.8% of underwritten rent). Built between 1958 and 2023, the ExchangeRight Net Leased Portfolio #66 Properties range in size from 9,229 square feet to 251,028 square feet.
The ExchangeRight Net Leased Portfolio #66 Properties are leased to the following seven nationally recognized tenants: FedEx Ground, Hy-Vee, Stop & Shop, Dollar General, Tractor Supply, Dollar Tree and Family Dollar. Each lease at the ExchangeRight Net Leased Portfolio #66 Properties expires after the maturity date of the ExchangeRight Net Leased Portfolio #66 Mortgage Loan.
The following table presents certain information relating to the ExchangeRight Net Leased Portfolio #66 Properties, which are presented in descending order of their allocated loan amounts:
| ExchangeRight Net Leased Portfolio #66 Properties Summary(1) |
Tenant Name
City, State | Year Built | Tenant NRSF(2) | % of Portfolio NRSF | Lease Expiration Date(2)) | Allocated Loan Amount | Appraised Value | % of Portfolio Appraised Value | Annual U/W Base Rent(2)2) | Annual U/W Base Rent PSF | % of Annual U/W Base Rent | Renewal Options2) |
| FedEx Ground | 2023 | 251,028 | 49.5% | 1/31/2033 | $23,990,000 | $44,000,000 | 46.2% | $2,638,973 | $10.51 | 44.4% | 2 x 5 years |
| Reading, PA |
| Hy-Vee | 2010 | 88,588 | 17.5% | 7/18/2031 | $7,700,000 | $19,000,000 | 20.0% | $1,228,740 | $13.87 | 20.7% | 6 x 5 years |
| Kansas City, MO |
| Stop & Shop | 1997 | 70,950 | 14.0% | 12/31/2038 | $5,030,000 | $13,150,000 | 13.8% | $821,842 | $11.58 | 13.8% | 6 x 5 years |
| Fall River, MA |
| Tractor Supply | 2023 | 21,910 | 4.3% | 9/30/2044 | $2,480,000 | $7,560,000 | 7.9% | $475,000 | $21.68 | 8.0% | 4 x 5 years |
| Athol, ID |
| Dollar Tree | 2023 | 10,052 | 2.0% | 11/30/2033 | $710,000 | $1,975,000 | 2.1% | $134,985 | $13.43 | 2.3% | 5 x 5 years |
| Amarillo, TX |
| Dollar Tree | 2023 | 10,136 | 2.0% | 11/30/2033 | $680,000 | $1,900,000 | 2.0% | $130,500 | $12.87 | 2.2% | 6 x 5 years |
| Abilene, TX |
| Dollar General | 2023 | 10,697 | 2.1% | 9/30/2038 | $600,000 | $1,700,000 | 1.8% | $115,000 | $10.75 | 1.9% | 5 x 5 years |
| Flint, MI |
| Family Dollar/Dollar Tree | 1958 | 12,615 | 2.5% | 5/31/2033 | $580,000 | $1,650,000 | 1.7% | $111,839 | $8.87 | 1.9% | 3 x 5 years |
| Dayton, OH |
| Dollar General | 2023 | 10,925 | 2.2% | 9/30/2038 | $560,000 | $1,600,000 | 1.7% | $107,998 | $9.89 | 1.8% | 5 x 5 years |
| Goshen, IN |
| Dollar General | 2022 | 10,887 | 2.1% | 9/30/2037 | $500,000 | $1,425,000 | 1.5% | $95,994 | $8.82 | 1.6% | 5 x 5 years |
| Saginaw, MI |
| Dollar General | 2019 | 9,229 | 1.8% | 2/28/2034 | $420,000 | $1,215,000 | 1.3% | $82,100 | $8.90 | 1.4% | 3 x 5 years |
| Del Rio, TX |
| Total/Weighted Average | | 507,017 | 100.0% | | $43,250,000 | $95,175,000 | 100.0% | $5,942,971 | $11.72 | 100.0% | |
| (1) | Information obtained from the appraisals, unless otherwise indicated. |
| (2) | Based on underwritten rent rolls dated February 1, 2024. |
Appraisals. According to the appraisals, the ExchangeRight Net Leased Portfolio #66 Properties had an aggregate “as-is” value of $95,175,000 as of various dates in November 2023. Based on the aggregate “as-is” appraised value of
THE INFORMATION IN THIS STRUCTURAL AND COLLATERAL TERM SHEET IS NOT COMPLETE AND MAY BE AMENDED PRIOR TO THE TIME OF SALE. THIS TERM SHEET IS NOT AN OFFER TO SELL THESE SECURITIES AND IT IS NOT A SOLICITATION OF AN OFFER TO BUY THESE SECURITIES IN ANY JURISDICTION WHERE THE OFFER OR SALE IS NOT PERMITTED. |
| | 102 | |
| Structural and Collateral Term Sheet | | BMO 2024-5C3 |
| No. 7 – ExchangeRight Net Leased Portfolio #66 |
$95,175,000, the Cut-off Date LTV and Maturity Date LTV for the ExchangeRight Net Leased Portfolio #66 Mortgage Loan is 45.4%.
| ExchangeRight Net Leased Portfolio #66 Appraised Value(1) |
| Properties | Value | Capitalization Rate |
| FedEx Ground- Reading (Aviation), PA | $44,000,000 | 6.00% |
| Hy-Vee - Kansas City (64th), MO | $19,000,000 | 6.50% |
| Stop & Shop - Fall River (Rodman), MA | $13,150,000 | 6.25% |
| Tractor Supply - Athol (Athol Crossings), ID | $7,560,000 | 6.25% |
| Dollar Tree - Amarillo (Arden), TX | $1,975,000 | 6.75% |
| Dollar Tree - Abilene (Industrial), TX | $1,900,000 | 6.75% |
| Dollar General - Flint (Linden Creek), MI | $1,700,000 | 6.75% |
| Family Dollar /Dollar Tree Combo - Dayton (Troy), OH | $1,650,000 | 6.75% |
| Dollar General - Goshen (Kercher), IN | $1,600,000 | 6.75% |
| Dollar General - Saginaw (East), MI | $1,425,000 | 6.75% |
| Dollar General - Del Rio (Cienegas), TX | $1,215,000 | 6.75% |
| Total / Wtd. Avg.(2) | $95,175,000 | 6.24% |
| (2) | Total / Wtd. Avg. is based on the appraised value of each ExchangeRight Net Leased Portfolio #66 Property. |
Environmental. The Phase I environmental site assessments for the ExchangeRight Net Leased Portfolio #66 Properties identified a recognized environmental condition for the Stop & Shop - Fall River (Rodman), MA property based on its historic use as a dry cleaning facility, as a machine shop and automotive parts businesses, as a cotton mill, and as a furniture manufacturer. In lieu of conducting the recommended limited subsurface investigations and to mitigate the potential of environmental liability associated with the RECs identified at the Stop & Shop - Fall River (Rodman), MA property in connection with its historic use as a dry cleaning facility, as a machine shop and automotive parts business, as a cotton mill and as a furniture manufacturer, a “site lender environmental asset protection” insurance policy issued by Beazley was purchased at origination of the ExchangeRight Net Leased Portfolio #66 Mortgage Loan. See “Description of the Mortgage Pool—Environmental Considerations” in the Preliminary Prospectus.
The following table presents certain information relating to the historical occupancy of the ExchangeRight Net Leased Portfolio #66 Properties:
| Current Occupancy(1)(2) |
| 100.0% |
| (1) | Historical Occupancies are not available because the ExchangeRight Net Leased Portfolio #66 Properties were recently acquired between December 22, 2023 and January 17, 2024. |
| (2) | Based on the underwritten rent rolls dated February 1, 2024. |
THE INFORMATION IN THIS STRUCTURAL AND COLLATERAL TERM SHEET IS NOT COMPLETE AND MAY BE AMENDED PRIOR TO THE TIME OF SALE. THIS TERM SHEET IS NOT AN OFFER TO SELL THESE SECURITIES AND IT IS NOT A SOLICITATION OF AN OFFER TO BUY THESE SECURITIES IN ANY JURISDICTION WHERE THE OFFER OR SALE IS NOT PERMITTED. |
| | 103 | |
| Structural and Collateral Term Sheet | | BMO 2024-5C3 |
| No. 7 – ExchangeRight Net Leased Portfolio #66 |
The following table presents certain information relating to the tenants at the ExchangeRight Net Leased Portfolio #66 Properties:
| Top Tenant Summary(1) |
| Tenant | Ratings
Moody’s/S&P/Fitch(2) | Net Rentable Area (SF) | % of
Total NRA | UW
Base Rent PSF |
UW
Base Rent | % of Total
UW Base Rent | Lease
Exp. Date |
| FedEx Ground | Baa2/BBB/NR | 251,028 | 49.5 | % | $10.51 | $2,638,973 | 44.4 | % | 1/31/2033 |
| Hy-Vee | NR/NR/NR | 88,588 | 17.5 | | $13.87 | $1,228,740 | 20.7 | | 7/18/2031 |
| Stop & Shop | Baa1/BBB+/NR | 70,950 | 14.0 | | $11.58 | $821,842 | 13.8 | | 12/31/2038 |
| Tractor Supply | Baa1/BBB/NR | 21,910 | 4.3 | | $21.68 | $475,000 | 8.0 | | 9/30/2044 |
| Dollar General(3) | Baa2/BBB/NR | 41,738 | 8.2 | | $9.61 | $401,092 | 6.7 | | Various |
| Dollar Tree(4) | Baa2/BBB/NR | 20,188 | 4.0 | | $13.15 | $265,485 | 4.5 | | 11/30/2033 |
| Family Dollar / Dollar Tree | Baa2/NR/NR | 12,615 | 2.5 | | $8.87 | $111,839 | 1.9 | | 5/31/2033 |
| Total Occupied | | 507,017 | 100.0 | % | $11.72 | $5,942,971 | 100.0 | % | |
| Vacant Space | | 0 | 0.0 | | | | | |
| Totals/ Wtd. Avg. | | 507,017 | 100.0 | % | | | | |
| (1) | Based on the underwritten rent rolls dated February 1, 2024. |
| (2) | Certain ratings are those of the parent company whether or not the parent guarantees the lease. |
| (3) | Dollar General leases 41,738 square feet of space across four properties: (i) Dollar General – Flint (Linden Creek), MI, 10,697 square feet of space with an initial lease expiration of September 30, 2038; (ii) Dollar General – Goshen (Kercher), IN, 10,925 square feet of space with an initial lease expiration of September 30, 2038; (iii) Dollar General – Saginaw (East), MI, 10,887 square feet of space with an initial lease expiration of September 30, 2037 and (iv) Dollar General – Del Rio (Cienegas), TX, 9,229 square feet of space with an initial lease expiration of February 28, 2034. |
| (4) | Dollar Tree leases 20,188 square feet of space across two properties: (i) Dollar Tree – Amarillo (Arden), TX, 10,052 square feet of space with an initial lease expiration of November 30, 2033 and (ii) Dollar Tree – Abilene (Industrial), TX 10,136 square feet of space with an initial lease expiration of November 30, 2033. |
The following table presents certain information relating to the lease rollover schedule at the ExchangeRight Net Leased Portfolio #66 Properties:
| Lease Rollover Schedule(1)(2) |
| Year | Number of Leases Expiring | Net Rentable Area Expiring | % of NRA Expiring | UW Base Rent Expiring | % of UW Base Rent Expiring | Cumulative Net Rentable Area Expiring | Cumulative % of NRA Expiring | Cumulative UW Base Rent Expiring | Cumulative % of UW Base Rent Expiring |
| Vacant | NAP | 0 | 0.0 | % | NAP | NAP | | 0 | 0.0% | NAP | NAP |
| 2024 & MTM | 0 | 0 | 0.0 | | $0 | 0.0 | % | 0 | 0.0% | $0 | 0.0% |
| 2025 | 0 | 0 | 0.0 | | 0 | 0.0 | | 0 | 0.0% | $0 | 0.0% |
| 2026 | 0 | 0 | 0.0 | | 0 | 0.0 | | 0 | 0.0% | $0 | 0.0% |
| 2027 | 0 | 0 | 0.0 | | 0 | 0.0 | | 0 | 0.0% | $0 | 0.0% |
| 2028 | 0 | 0 | 0.0 | | 0 | 0.0 | | 0 | 0.0% | $0 | 0.0% |
| 2029 | 0 | 0 | 0.0 | | 0 | 0.0 | | 0 | 0.0% | $0 | 0.0% |
| 2030 | 0 | 0 | 0.0 | | 0 | 0.0 | | 0 | 0.0% | $0 | 0.0% |
| 2031 | 1 | 88,588 | 17.5 | | 1,228,740 | 20.7 | | 88,588 | 17.5% | $1,228,740 | 20.7% |
| 2032 | 0 | 0 | 0.0 | | 0 | 0.0 | | 88,588 | 17.5% | $1,228,740 | 20.7% |
| 2033 | 4 | 283,831 | 56.0 | | 3,016,297 | 50.8 | | 372,419 | 73.5% | $4,245,037 | 71.4% |
| 2034 | 1 | 9,229 | 1.8 | | 82,100 | 1.4 | | 381,648 | 75.3% | $4,327,137 | 72.8% |
| 2035 & Beyond | 5 | 125,369 | 24.7 | | 1,615,834 | 27.2 | | 507,017 | 100.0% | $5,942,971 | 100.0% |
| Total | 11 | 507,017 | 100.0 | % | $5,942,971 | 100.0 | % | | | | |
| (1) | Based on the underwritten rent rolls dated February 1, 2024. |
| (2) | Certain tenants may have lease termination options that are exercisable prior to the originally stated expiration date of the related lease and are not considered in this Lease Rollover Schedule. |
THE INFORMATION IN THIS STRUCTURAL AND COLLATERAL TERM SHEET IS NOT COMPLETE AND MAY BE AMENDED PRIOR TO THE TIME OF SALE. THIS TERM SHEET IS NOT AN OFFER TO SELL THESE SECURITIES AND IT IS NOT A SOLICITATION OF AN OFFER TO BUY THESE SECURITIES IN ANY JURISDICTION WHERE THE OFFER OR SALE IS NOT PERMITTED. |
| | 104 | |
| Structural and Collateral Term Sheet | | BMO 2024-5C3 |
| No. 7 – ExchangeRight Net Leased Portfolio #66 |
The following table presents certain information relating to the underwritten cash flows of the ExchangeRight Net Leased Portfolio #66 Properties:
| Underwritten Net Cash Flow(1)(2) |
| | | Underwritten | Per Square Foot | % | (3) |
| Gross Potential Rent | | $5,942,971 | $11.72 | 100.0 | % |
| Total Reimbursements | | 0 | 0.00 | 0.0 | |
| Net Rental Income | | $5,942,971 | $11.72 | 100.0 | % |
| Other Income | | 0 | 0.00 | 0.0 | |
| (Vacancy/Credit Loss) | | (297,149) | (0.59) | (5.0 | ) |
| Effective Gross Income | | $5,645,822 | $11.14 | 95.0 | % |
| Total Expenses(4) | | $0 | $0.00 | 0.0 | % |
| Net Operating Income | | $5,645,822 | $11.14 | 100.0 | % |
| Replacement Reserves | | 71,647 | 0.14 | 1.3 | |
| Net Cash Flow | | $5,574,175 | $10.99 | 98.7 | % |
| (1) | Based on the underwritten rent rolls dated February 1, 2024. |
| (2) | Historical financial information is not available because the ExchangeRight Net Leased Portfolio #66 Properties were recently acquired between December 22, 2023 and January 17, 2024. |
| (3) | Revenue-related figures are calculated as a % of Net Rental Income. Net Operating Income, Replacement Reserves and Net Cash Flow are calculated as a % of Effective Gross Income. |
| (4) | Total Expenses are underwritten based on the ExchangeRight Net Leased Portfolio #66 Properties absolute triple-net leases. As a result there are no underwritten real estate taxes or insurance costs. |
THE INFORMATION IN THIS STRUCTURAL AND COLLATERAL TERM SHEET IS NOT COMPLETE AND MAY BE AMENDED PRIOR TO THE TIME OF SALE. THIS TERM SHEET IS NOT AN OFFER TO SELL THESE SECURITIES AND IT IS NOT A SOLICITATION OF AN OFFER TO BUY THESE SECURITIES IN ANY JURISDICTION WHERE THE OFFER OR SALE IS NOT PERMITTED. |
| | 105 | |
| Structural and Collateral Term Sheet | | BMO 2024-5C3 |
| No. 7 – ExchangeRight Net Leased Portfolio #66 |
The Market. The following table presents certain market information relating to the ExchangeRight Net Leased Portfolio #66 Properties:
| Market Area Summary(1)(2) |
Tenant Name
City, State | Market | Submarket | Submarket Inventory (SF) | Submarket Vacancy | Submarket NNN Rent PSF |
| FedEx Ground | Berks County | PA I-81/I-78 Corridor | 393,861,328 | 5.6% | $8.35 |
| Reading, PA |
| Hy-Vee | Kansas City, MO-KS | Platte/Clay County | 5,031,000 | 10.8% | $15.72 |
| Kansas City, MO |
| Stop & Shop | Providence-Warwick, RI-MA | Southwest/Bristol | 6,356,000 | 6.6% | $22.79 |
| Fall River, MA |
| Tractor Supply | Coeur d’Alene CBSA | Coeur d’Alene | 11,661,332 | 1.3% | $19.38 |
| Athol, ID |
| Dollar Tree | Amarillo, TX CBSA | Amarillo | 16,846,493 | 6.9% | $15.01 |
| Amarillo, TX |
| Dollar Tree | Abilene, TX CBSA | Abilene | 10,220,671 | 3.1% | $15.29 |
| Abilene, TX |
| Dollar General | Flint CBSA | Genesee County | 28,300,000 | 6.3% | $11.79 |
| Flint, MI |
| Family Dollar / Dollar Tree | Dayton CBSA | Central | 3,815,000 | 21.4% | $9.86 |
| Dayton, OH |
| Dollar General | Elkhart CBSA | Elkhart County | 14,400,000 | 1.7% | $10.60 |
| Goshen, IN |
| Dollar General | Saginaw CBSA | Saginaw County | 13,800,000 | 2.6% | $11.43 |
| Saginaw, MI |
| Dollar General | Del Rio CBSA | Del Rio | 2,200,000 | 4.1% | $15.42 |
| Del Rio, TX |
| (1) | Information obtained from the appraisals, unless otherwise indicated. |
| (2) | Certain submarket information is not available because there are no delineated submarkets in the area. In these instances market data is shown instead. |
THE INFORMATION IN THIS STRUCTURAL AND COLLATERAL TERM SHEET IS NOT COMPLETE AND MAY BE AMENDED PRIOR TO THE TIME OF SALE. THIS TERM SHEET IS NOT AN OFFER TO SELL THESE SECURITIES AND IT IS NOT A SOLICITATION OF AN OFFER TO BUY THESE SECURITIES IN ANY JURISDICTION WHERE THE OFFER OR SALE IS NOT PERMITTED. |
| | 106 | |
| Structural and Collateral Term Sheet | | BMO 2024-5C3 |
| No. 7 – ExchangeRight Net Leased Portfolio #66 |
The Borrower. The borrower for the ExchangeRight Net Leased Portfolio #66 Mortgage Loan is ExchangeRight Net-Leased Portfolio 66 DST, a Delaware statutory trust with one independent trustee. Legal counsel to the borrower delivered a non-consolidation opinion in connection with the origination of the ExchangeRight Net Leased Portfolio #66 Mortgage Loan.
The Borrower Sponsors. The borrower sponsor is ExchangeRight Real Estate, LLC. ExchangeRight Real Estate, LLC has more than 23 million square feet of commercial properties under management and owns more than 1,200 investment-grade and multifamily properties located across 47 states. ExchangeRight Real Estate, LLC and its three owners, David Fisher, Warren Thomas and Joshua Ungerecht (collectively, the “Individual Guarantors”), are the guarantors of certain nonrecourse carveout liabilities under the ExchangeRight Net Leased Portfolio #66 Mortgage Loan.
The borrower has master leased the ExchangeRight Net Leased Portfolio #66 Properties to ExchangeRight NLP 66 Master Lessee, LLC (the “ExchangeRight Net Leased Portfolio #66 Master Tenant”), which is owned by ExchangeRight Real Estate, LLC, which is in turn owned by the Individual Guarantors. The ExchangeRight Net Leased Portfolio #66 Master Tenant is a Delaware limited liability company structured to be bankruptcy-remote, with one independent director. The master lease generally imposes responsibility on the ExchangeRight Net Leased Portfolio #66 Master Tenant for the operation, maintenance and management of the ExchangeRight Net Leased Portfolio #66 Properties and payment of all expenses incurred in the maintenance and repair of the ExchangeRight Net Leased Portfolio #66 Properties, other than capital expenses. The ExchangeRight Net Leased Portfolio #66 Master Tenant’s interest in all tenant rents was assigned to the borrower, which in turn collaterally assigned its interest to the lender. The master lease is subordinate to the ExchangeRight Net Leased Portfolio #66 Mortgage Loan and, upon an event of default under the ExchangeRight Net Leased Portfolio #66 Mortgage Loan, the lender has the right to cause the borrower to terminate the master lease. A default under the master lease is an event of default under the ExchangeRight Net Leased Portfolio #66 Mortgage Loan and gives rise to recourse liability to the non-recourse carveout guarantors for losses, unless such default arises solely in connection with the failure of the ExchangeRight Net Leased Portfolio #66 Master Tenant to pay rent as a result of the ExchangeRight Net Leased Portfolio #66 Properties not generating sufficient cash flow for the payment of such rent.
The lender has the right to require the borrower to convert from a Delaware statutory trust to a limited liability company upon (i) an event of default or the lender’s good faith determination of imminent default under the ExchangeRight Net Leased Portfolio #66 Mortgage Loan, (ii) the lender’s good faith determination that the borrower will be unable to make a material decision or take a material action required in connection with the operation and maintenance of the ExchangeRight Net Leased Portfolio #66 Properties, and (iii) 90 days prior to the maturity date of the ExchangeRight Net Leased Portfolio #66 Mortgage Loan, if an executed commitment from an institutional lender to refinance the ExchangeRight Net Leased Portfolio #66 Mortgage Loan is not delivered to the lender.
Property Management. The ExchangeRight Net Leased Portfolio #66 Properties are managed by NLP Management, LLC, an affiliate of the borrower sponsor.
Escrows and Reserves. At origination of the ExchangeRight Net Leased Portfolio #66 Mortgage Loan, the borrower deposited approximately (i) $24,124 into a real estate tax reserve account, (ii) $32,775 into a required repairs reserve account, (iii) $500,000 into a TI/LC reserve account, and (iv) $118,750 into an unfunded obligations reserve account.
Tax Reserve – The borrower is required to deposit into a real estate tax reserve, on a monthly basis, 1/12 of the taxes that the lender estimates will be payable over the next-ensuing 12-month period (initially estimated to be approximately $12,062).
Insurance Reserve – The borrower is required to deposit into an insurance reserve, on a monthly basis, 1/12 of the amount which will be sufficient to pay the insurance premiums due for the renewal of coverage afforded by such policies; provided, however, such insurance reserve has been conditionally waived so long as the borrower maintains a blanket policy meeting the requirements of the ExchangeRight Net Leased Portfolio #66 Mortgage Loan documents.
Replacement Reserve – The borrower is required to deposit, on a monthly basis during a Cash Management Period (as defined below), an amount equal to 1/12 of the sum of the products obtained by multiplying (i) $0.15 by the aggregate number of rentable square feet of retail space at the ExchangeRight Net Leased Portfolio #66 Properties, and (ii) $0.10 by the aggregate number of rentable square feet of industrial space at the ExchangeRight Net Leased Portfolio #66 Properties into a capital expense replacement account (initially, $5,971), provided, however, no deposit will be required to be made with respect to the aggregate number of rentable square feet at the ExchangeRight Net Leased Portfolio #66 Properties for which tenants are obligated under their applicable leases to pay capital expenses for their respective premises; in each
THE INFORMATION IN THIS STRUCTURAL AND COLLATERAL TERM SHEET IS NOT COMPLETE AND MAY BE AMENDED PRIOR TO THE TIME OF SALE. THIS TERM SHEET IS NOT AN OFFER TO SELL THESE SECURITIES AND IT IS NOT A SOLICITATION OF AN OFFER TO BUY THESE SECURITIES IN ANY JURISDICTION WHERE THE OFFER OR SALE IS NOT PERMITTED. |
| | 107 | |
| Structural and Collateral Term Sheet | | BMO 2024-5C3 |
| No. 7 – ExchangeRight Net Leased Portfolio #66 |
case, to the extent the following conditions are satisfied: (i) no event of default has occurred and is continuing, (ii) the borrower provides proof of payment by the applicable tenant of all capital expenses promptly following request by the lender, (iii) the leases with the applicable tenants are in full force and effect and not subject to any default beyond any applicable grace or notice and cure period by either the borrower or such tenant, and (iv) no material adverse change should (in the lender’s reasonable determination) have occurred with respect to the applicable tenant such that its ability to timely pay the capital expenses has been materially jeopardized. The ExchangeRight Net Leased Portfolio #66 Mortgage Loan documents provide that the initial such tenants are (i) Dollar General at Dollar General - Del Rio (Cienegas), TX, (ii) Dollar General at Dollar General - Goshen (Kercher), IN, (iii) Dollar General at Dollar General - Saginaw (East), MI, (iv) Dollar General at Dollar General - Flint (Linden Creek), MI, (v) Hy-Vee at Hy-Vee - Kansas City (64th), MO, and (vi) Stop & Shop at Stop & Shop - Fall River (Rodman), MA.
TI / LC Reserve – On each payment date during a Cash Management Period, the borrower will be required to deposit an amount equal to 1/12th of the product obtained by multiplying $0.75 by the aggregate number of rentable square feet of space at the ExchangeRight Net Leased Portfolio #66 Properties (initially, $31,689) into a tenant improvements and leasing commissions reserve subaccount.
Lockbox / Cash Management The ExchangeRight Net Leased Portfolio #66 Mortgage Loan is structured with a hard lockbox and springing cash management. The borrower, property manager and master lessee are required to cause all rents to be deposited directly into a lender approved lockbox account. All funds received by the borrower, property manager, or master lessee are required to be deposited in a lockbox account within two business days following receipt. During the continuance of a Cash Management Period, all funds on deposit in the lockbox account are required to be swept at the end of each business day into a lender-controlled cash management account and applied on each payment date and disbursed in accordance with the ExchangeRight Net Leased Portfolio #66 Mortgage Loan documents. Provided no Cash Management Period is continuing, funds on deposit in the lockbox accounts will be disbursed to the borrower’s operating account.
A “Cash Management Period” means a period (A) commencing on lender giving notice to the lockbox bank of the occurrence of any of the following (i) a default or an event of default, (ii) the debt service coverage ratio being less than 1.20x, or (iii) the monthly payment date that occurs in November, 2028, to the extent a Qualified Transfer (as defined below) has not occurred as of such date, and (B) ending upon lender giving notice to the lockbox bank that the sweeping of the funds into the lockbox account may cease and (a) with respect to clause (i) above, such default has been cured (or in the case of an event of default, waived in writing by lender) and no other default or event of default has occurred and is continuing, (b) with respect to clause (ii) above, the debt service coverage ratio being at least 1.25x for two consecutive calendar quarters, or (c) with respect to clause (iii) above, a Qualified Transfer has occurred.
A “Qualified Transfer” means any time following January 17, 2025, the borrower sponsor has the right to effect a one-time transfer of all (but not less than all) of the outstanding ownership interests in the borrower and the ExchangeRight Net Leased Portfolio #66 Master Tenant to an Approved Transferee (as defined below) and to replace the guarantors with such Approved Transferee (or other acceptable replacement guarantor satisfactory to lender in its sole discretion); provided that certain conditions are satisfied, including among others: (i) no event of default has occurred and is continuing and no default or event of default will otherwise occur as a result of such transfer, (ii) the ExchangeRight Net Leased Portfolio #66 Properties will continue to be managed by a qualified manager, (iii) prior to any release of the guarantor, the Approved Transferee (or other acceptable replacement guarantor) executes a full payment guarantee and indemnity pursuant to which it agrees to be liable (from and after the transfer) for repayment in full of the ExchangeRight Net Leased Portfolio #66 Mortgage Loan and for all of the indemnity obligations (including environmental liabilities and obligations) for which the existing guarantors are liable under the guaranty, (iv) the Approved Transferee owns, directly or indirectly, 100% of the legal and beneficial ownership interests in, and controls, the borrower and ExchangeRight Net Leased Portfolio #66 Master Tenant, (v) the delivery of opinions regarding existence, authority, enforceability and non-consolidation satisfactory to the lender, and (vi) if required by the lender, rating agency confirmation from each applicable rating agency.
"Approved Transferee" means either (i) an eligible institution that is, or is wholly-owned and controlled by, a bank, savings and loan association, investment bank, insurance company, trust company, real estate investment trust, commercial credit corporation, pension plan, pension fund or pension advisory firm, mutual fund, government entity or plan or institution similar to any of the foregoing or (i) any person that (a) meets the requirements of a Qualified Transferee (as defined below), (b) is regularly engaged in the business of owning or operating commercial properties, or interests therein, which are similar to
THE INFORMATION IN THIS STRUCTURAL AND COLLATERAL TERM SHEET IS NOT COMPLETE AND MAY BE AMENDED PRIOR TO THE TIME OF SALE. THIS TERM SHEET IS NOT AN OFFER TO SELL THESE SECURITIES AND IT IS NOT A SOLICITATION OF AN OFFER TO BUY THESE SECURITIES IN ANY JURISDICTION WHERE THE OFFER OR SALE IS NOT PERMITTED. |
| | 108 | |
| Structural and Collateral Term Sheet | | BMO 2024-5C3 |
| No. 7 – ExchangeRight Net Leased Portfolio #66 |
the ExchangeRight Net Leased Portfolio #66 Properties, (c) owns interests in, or operates, at least five retail properties with a minimum of 750,000 square feet in the aggregate, (d) immediately upon consummation of the applicable permitted transfer, has, and at all time maintains, either (i) a minimum net worth of at least $200,000,000 and total assets of at least $400,000,000 (excluding the ExchangeRight Net Leased Portfolio #66 Properties) or (ii) an investment-grade rating of not less than BBB- by S&P or Baa3 by Moody’s, (e) at all times owns no less than 100% of the legal and beneficial ownership of the borrower, (f) is not a Delaware statutory trust, and (g) causes the borrower to convert into a Delaware limited liability company, provided, however, such conversion will not be required if, prior to or otherwise in connection with any such transfer (A) the borrower is solely owned by a person under the management or control of David Fisher, Joshua Ungerecht and Warren Thomas, and (B) the borrower is no longer treated as an investment trust pursuant to the Internal Revenue Code of 1986.
A “Qualified Transferee” means a transferee that (i) has never been indicted or convicted of, or pled guilty or no contest to a felony, (ii) has never been indicted or convicted of, or pled guilty or no contest to a Patriot Act offense and is not a sanctioned person and is not on any government watch list, (iii) has never been the subject of a voluntary or involuntary (to the extent the same has not been discharged) bankruptcy proceeding, (iv) has no material outstanding judgments, litigations or regulatory actions against it or its interests and (v) is not a crowdfunded entity or controlled by a crowdfunded entity.
In addition, at any time following January 17, 2025, the borrower sponsors have the right to effect a one-time transfer of all (but not less than all) of the outstanding ownership interests in the borrower and the ExchangeRight Net Leased Portfolio #66 Master Tenant to an Approved REIT (as defined below) or a subsidiary thereof (including ExchangeRight Income Fund Operating Partnership, LP, a Delaware limited partnership (“ExchangeRight Operating Partnership”) that is management controlled by such Approved REIT and that meets the requirements of a Qualified Transferee and to replace the guarantors with such Approved REIT subject to satisfaction of the requirements of the ExchangeRight Net Leased Portfolio #66 Mortgage Loan documents.
"Approved REIT" means a real estate investment trust that (i) meets the requirements of a Qualified Transferee and for whom the lender has received a credit check and bankruptcy, litigation judgment lien and other comparable searches, all of which are reasonably acceptable to the lender, (ii) is at all times (A) owned, directly or indirectly, by David Fisher, Joshua Ungerecht and Warren Thomas in an amount that is equal to either (1) 0.50% of all equity interests or (2) equity interests valued at not less than $15,000,000, and (B) under the management control of an approved REIT manager, and (iii) is otherwise reasonably acceptable to the lender in all respects. Subject to the satisfaction of clauses (i) and (ii) above, each of (x) ExchangeRight Income Fund (doing business as the ExchangeRight Essential Income Strategy), a Maryland statutory trust, (y) ExchangeRight Operating Partnership, and (z) any real estate investment trust or the operating partnership that is under the management control of such real estate investment trust will be deemed to have satisfied clause (iii) above provided such entity has total assets of at least $400,000,000 (excluding the ExchangeRight Net Leased Portfolio #66 Properties) and at least $200,000,000 in shares of beneficial interest owned by investors.
Current Mezzanine or Secured Subordinate Indebtedness. None.
Permitted Future Mezzanine or Secured Subordinate Indebtedness. Not permitted.
Release of Collateral. The borrower is permitted to release one or more of the ExchangeRight Net Leased Portfolio #66 Properties from the lien of the ExchangeRight Net Leased Portfolio #66 Mortgage Loan documents at any time after the date that is the earlier to occur of (a) the third anniversary of the origination date of the ExchangeRight Net Leased Portfolio #66 Mortgage Loan, and (b) the date that is two years after the closing date of this securitization, subject to satisfaction of the applicable conditions set forth therein, including, without limitation, that: (i) the sale of such ExchangeRight Net Leased Portfolio #66 Property is pursuant to an arm’s-length agreement with a third party not affiliated with the borrower or guarantor; (ii) no default or event of default has occurred and is continuing; (iii) the borrower has delivered a rating agency comfort letter (if required pursuant to a pooling and servicing agreement); (iv) the ExchangeRight Net Leased Portfolio #66 Mortgage Loan is defeased (to the extent that a partial defeasance is then permitted under the ExchangeRight Net Leased Portfolio #66 Mortgage Loan documents), in an amount equal to the greater of (a) 115% of the allocated loan amount of such ExchangeRight Net Leased Portfolio #66 Properties and (b) 90% of the net sales proceeds applicable to such ExchangeRight Net Leased Portfolio #66 Properties; (v) the debt service coverage ratio for the ExchangeRight Net Leased Portfolio #66 Mortgage Loan after giving effect to any such release is no less than the greater of (i) 2.10x and (ii) the debt service coverage ratio immediately prior to such release; and (vi) the debt yield for the ExchangeRight Net Leased Portfolio
THE INFORMATION IN THIS STRUCTURAL AND COLLATERAL TERM SHEET IS NOT COMPLETE AND MAY BE AMENDED PRIOR TO THE TIME OF SALE. THIS TERM SHEET IS NOT AN OFFER TO SELL THESE SECURITIES AND IT IS NOT A SOLICITATION OF AN OFFER TO BUY THESE SECURITIES IN ANY JURISDICTION WHERE THE OFFER OR SALE IS NOT PERMITTED. |
| | 109 | |
| Structural and Collateral Term Sheet | | BMO 2024-5C3 |
| No. 7 – ExchangeRight Net Leased Portfolio #66 |
#66 Mortgage Loan after giving effect to any such release is no less than the greater of (i) 12.89% and (ii) the debt yield immediately prior to such release.
Ground Lease. None.
THE INFORMATION IN THIS STRUCTURAL AND COLLATERAL TERM SHEET IS NOT COMPLETE AND MAY BE AMENDED PRIOR TO THE TIME OF SALE. THIS TERM SHEET IS NOT AN OFFER TO SELL THESE SECURITIES AND IT IS NOT A SOLICITATION OF AN OFFER TO BUY THESE SECURITIES IN ANY JURISDICTION WHERE THE OFFER OR SALE IS NOT PERMITTED. |
| | 110 | |
| Structural and Collateral Term Sheet | | BMO 2024-5C3 |
| No. 8 – 61 S Paramus Road |
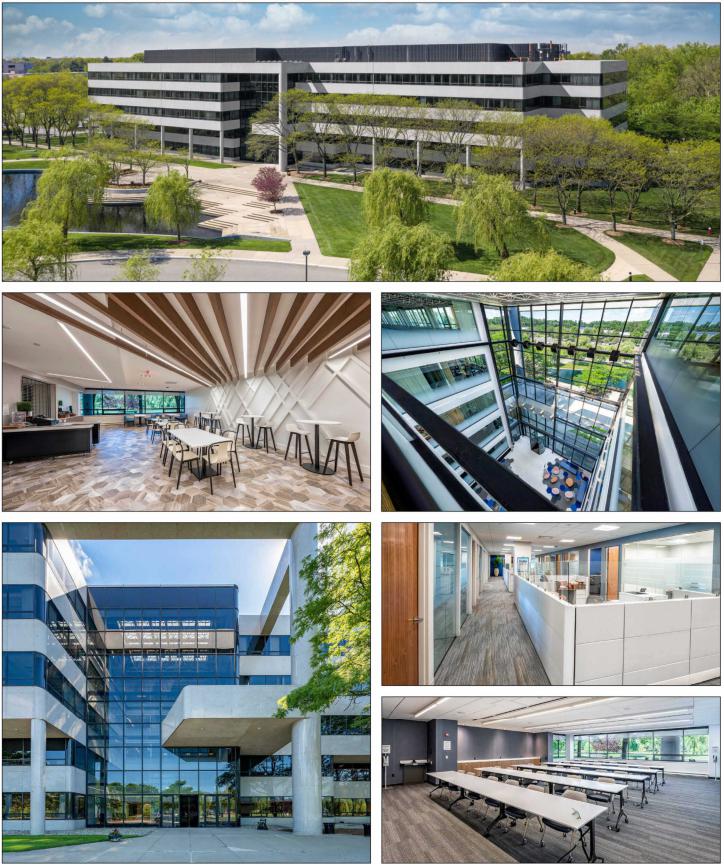
THE INFORMATION IN THIS STRUCTURAL AND COLLATERAL TERM SHEET IS NOT COMPLETE AND MAY BE AMENDED PRIOR TO THE TIME OF SALE. THIS TERM SHEET IS NOT AN OFFER TO SELL THESE SECURITIES AND IT IS NOT A SOLICITATION OF AN OFFER TO BUY THESE SECURITIES IN ANY JURISDICTION WHERE THE OFFER OR SALE IS NOT PERMITTED. |
| | 111 | |
| Structural and Collateral Term Sheet | | BMO 2024-5C3 |
| No. 8 – 61 S Paramus Road |
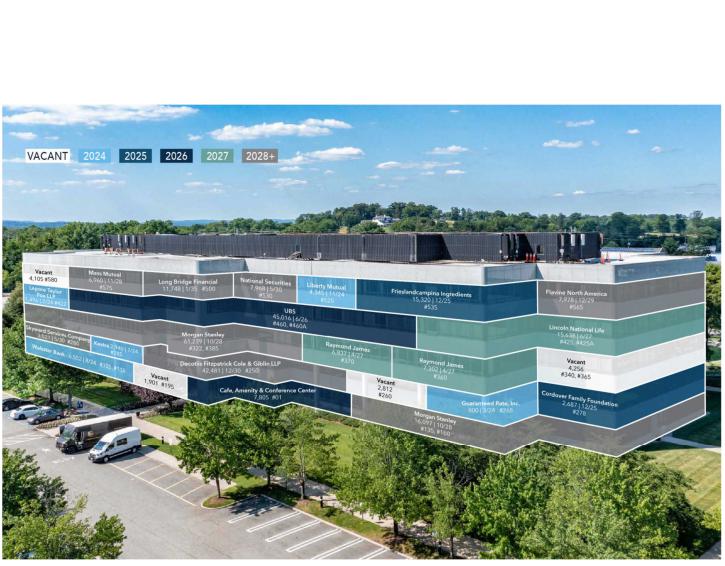
THE INFORMATION IN THIS STRUCTURAL AND COLLATERAL TERM SHEET IS NOT COMPLETE AND MAY BE AMENDED PRIOR TO THE TIME OF SALE. THIS TERM SHEET IS NOT AN OFFER TO SELL THESE SECURITIES AND IT IS NOT A SOLICITATION OF AN OFFER TO BUY THESE SECURITIES IN ANY JURISDICTION WHERE THE OFFER OR SALE IS NOT PERMITTED. |
| | 112 | |
| Structural and Collateral Term Sheet | | BMO 2024-5C3 |
| No. 8 – 61 S Paramus Road |
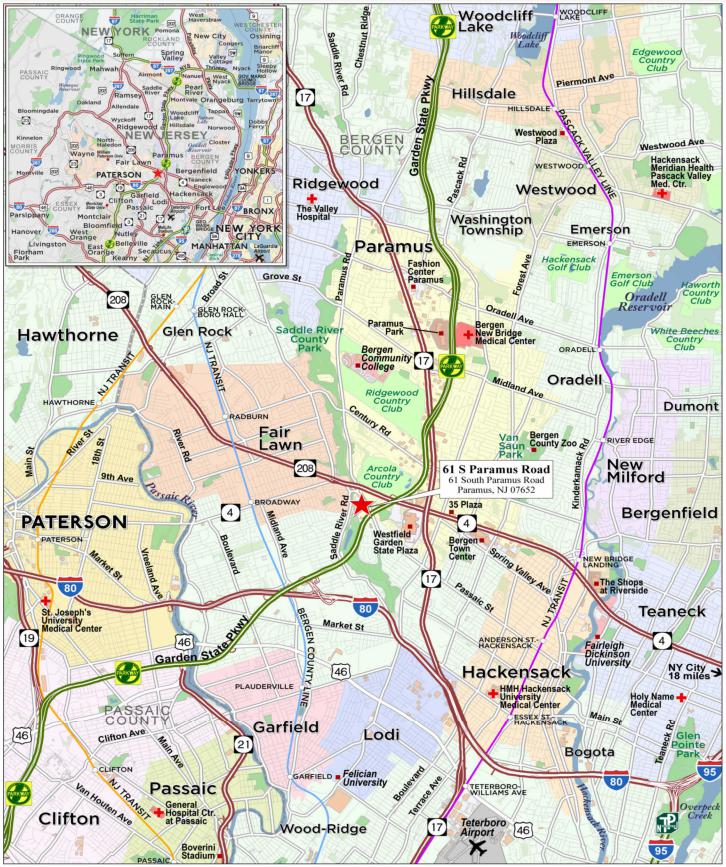
THE INFORMATION IN THIS STRUCTURAL AND COLLATERAL TERM SHEET IS NOT COMPLETE AND MAY BE AMENDED PRIOR TO THE TIME OF SALE. THIS TERM SHEET IS NOT AN OFFER TO SELL THESE SECURITIES AND IT IS NOT A SOLICITATION OF AN OFFER TO BUY THESE SECURITIES IN ANY JURISDICTION WHERE THE OFFER OR SALE IS NOT PERMITTED. |
| | 113 | |
| Structural and Collateral Term Sheet | | BMO 2024-5C3 |
| No. 8 – 61 S Paramus Road |
| Mortgage Loan Information | | Property Information |
| Mortgage Loan Seller: | SGFC | | Single Asset / Portfolio: | Single Asset |
| Original Principal Balance: | $33,600,000 | | Title: | Leasehold |
| Cut-off Date Principal Balance: | $33,600,000 | | Property Type – Subtype: | Office – Suburban |
| % of IPB: | 3.7% | | Net Rentable Area (SF): | 279,699 |
| Loan Purpose: | Acquisition | | Location: | Paramus, NJ |
| Borrower: | FM Sixty One Paramus LLC | | Year Built / Renovated: | 1985 / 2019 |
| Borrower Sponsors: | Crown Acquisitions, Inc., First Mile | | Occupancy: | 95.3% |
| | Capital, LLC and Richard Chera | | Occupancy Date: | 12/1/2023 |
| Interest Rate: | 7.08100% | | 4th Most Recent NOI (As of)(2): | NAV |
| Note Date: | 12/28/2023 | | 3rd Most Recent NOI (As of): | $4,717,150 (12/31/2021) |
| Maturity Date: | 1/1/2029 | | 2nd Most Recent NOI (As of): | $5,401,175 (12/31/2022) |
| Interest-only Period: | 60 months | | Most Recent NOI (As of): | $5,241,255 (TTM 9/30/2023) |
| Original Term: | 60 months | | UW Economic Occupancy: | 91.0% |
| Original Amortization Term: | None | | UW Revenues: | $9,061,075 |
| Amortization Type: | Interest Only | | UW Expenses: | $3,947,255 |
| Call Protection: | L(36),YM1(17),O(7) | | UW NOI: | $5,113,820 |
| Lockbox / Cash Management: | Springing / Springing | | UW NCF: | $4,694,272 |
| Additional Debt: | No | | Appraised Value / Per SF: | $56,700,000 / $203 |
| Additional Debt Balance: | N/A | | Appraisal Date: | 11/8/2023 |
| Additional Debt Type: | N/A | | | |
| | | | | |
| Escrows and Reserves(1) | | Financial Information |
| | Initial | Monthly | Initial Cap | | Cut-off Date Loan / SF: | $120 |
| Taxes: | $187,501 | $62,500 | N/A | | Maturity Date Loan / SF: | $120 |
| Insurance: | $0 | Springing | N/A | | Cut-off Date LTV: | 59.3% |
| CapEx Reserves: | $540,000 | $5,827 | N/A | | Maturity Date LTV: | 59.3% |
| Engineering Reserves: | $27,500 | $0 | N/A | | UW NCF DSCR: | 1.95x |
| TI/LC: | $5,000,000 | Springing | $5,000,000 | | UW NOI Debt Yield: | 15.2% |
| Other Reserves: | $1,313,963 | $0 | N/A | | | |
| | | | | | | |
| Sources and Uses |
| Sources | Proceeds | % of Total | | | Uses | Proceeds | % of Total | |
| Mortgage Loan | $33,600,000 | 53.6 | % | | Purchase Price | $54,712,893 | 87.3 | % |
| Sponsor Equity | 29,074,664 | 46.4 | | | Upfront Reserves | 7,068,964 | 11.3 | |
| | | | | Closing Costs | 892,806 | 1.4 | |
| Total Sources | $62,674,664 | 100.0 | % | | Total Uses | $62,674,664 | 100.0 | % |
| (1) | For a full description of Escrows and Reserves, please refer to “Escrows and Reserves” below. |
| (2) | 4th Most Recent NOI is unavailable as the 61 S Paramus Road Property (as defined below) was acquired by the borrower at the origination of the 61 S Paramus Road Mortgage Loan (as defined below), and the prior owner did not provide such information. |
The Loan. The eighth largest mortgage loan (the “61 S Paramus Road Mortgage Loan”) is secured by a first lien mortgage on the borrower’s leasehold interest in a 279,699 square foot office property located in Paramus, New Jersey (the “61 S Paramus Road Property”). The 61 S Paramus Road Mortgage Loan was originated by Societe Generale Financial Corporation (“SGFC”) and has an outstanding principal balance as of the Cut-off Date of $33,600,000. The 61 S Paramus Mortgage Loan is evidenced by two promissory notes, Note A-1 and Note A-2, with an aggregate original principal balance of $33,600,000. The 61 S Paramus Road Mortgage Loan accrues interest at a fixed rate of 7.08100% per annum. The 61 S Paramus Road Mortgage Loan has a 5-year term and is interest-only for the full term.
The Property. The 61 S Paramus Road Property is a Class A office center comprised of one, five-story building, totaling 279,699 square feet on an approximately 25.9-acre site in Paramus, New Jersey. Built in 1985 and renovated in 2019, the 61 S Paramus Road Property has a total of 1,116 surface parking spaces, resulting in a parking ratio of 4.0 spaces per 1,000 square feet of net rentable area. As of December 1, 2023, the 61 S Paramus Road Property was 95.3% occupied by 17 tenants.
THE INFORMATION IN THIS STRUCTURAL AND COLLATERAL TERM SHEET IS NOT COMPLETE AND MAY BE AMENDED PRIOR TO THE TIME OF SALE. THIS TERM SHEET IS NOT AN OFFER TO SELL THESE SECURITIES AND IT IS NOT A SOLICITATION OF AN OFFER TO BUY THESE SECURITIES IN ANY JURISDICTION WHERE THE OFFER OR SALE IS NOT PERMITTED. |
| | 114 | |
| Structural and Collateral Term Sheet | | BMO 2024-5C3 |
| No. 8 – 61 S Paramus Road |
Major Tenants. The three largest tenants based on net rentable area are Morgan Stanley, UBS and Decotiis Fitzpatrick Cole & Giblin LLP. The weighted average lease term at the 61 S Paramus Road Property is 19.4 years, with Morgan Stanley and UBS each having been at the 61 S Paramus Road Property for over 30 years.
Morgan Stanley (77,336 square feet; 27.6% of NRA, 27.5% of underwritten base rent, Moody’s/S&P/Fitch: A1/A-/NR): Morgan Stanley is an American investment bank, wealth management and financial services company headquartered in New York, New York. Morgan Stanley has been a tenant at the 61 S Paramus Road Property since 1985 under a lease expiring in October 2028 and has expanded its presence at the 61 S Paramus Road Property in 2016 and 2018 due to mergers among other regional offices. Morgan Stanley has two, five-year renewal options on all occupied units at fair market value and a one-time termination option on the 16,097 square foot expansion space in July 2025.
UBS (45,016 square feet; 16.1% of NRA, 14.9% of underwritten base rent, Moody’s/S&P/Fitch: Aa2/A+/NR): UBS is a global wealth management firm that provides financial services to institutional and corporate clients worldwide, as well as private clients in Switzerland. Headquartered in Zürich, Switzerland, UBS maintains a presence in all major financial centers with a network of offices in 50 countries. UBS has been a tenant at the 61 S Paramus Road Property since 1993 under a lease expiring in June 2026. UBS has two, five-year renewal options on all occupied units at fair market value and no termination options.
Decotiis Fitzpatrick Cole & Giblin LLP (42,481 square feet; 15.2% of NRA, 16.3% of underwritten base rent, Moody’s/S&P/Fitch: NR/NR/NR): Decotiis Fitzpatrick Cole & Giblin LLP, is a regional full-service law firm with three offices in the tri-state area. The firm has over 75 attorneys and a wide array of specialties. These include real estate, labor law, public procurement, litigation, environmental law, public finance, tax, municipal law, government and regulatory affairs, among others. Decotiis Fitzpatrick Cole & Giblin LLP has been a tenant at the 61 S Paramus Road Property since 2019 under a lease expiring in December 2030. Decotiis Fitzpatrick Cole & Giblin LLP has one, five-year renewal option at fair market value and no termination options.
Appraisal. According to the appraisal, the 61 S Paramus Road Property had an “as-is” appraised value of $56,700,000 as of November 8, 2023. The table below shows the appraiser’s “as-is” conclusions.
| Appraisal Valuation Summary(1) |
| Appraisal Approach | Appraised Value | Capitalization Rate(2) |
| Income Capitalization Approach | $56,700,000 | 7.75% |
| (2) | The appraiser used a discounted cash flow approach to arrive at the appraised value. The capitalization rate shown above represents the overall capitalization rate. |
Environmental. According to the Phase I environmental assessment dated November 21, 2023, there was no evidence of any recognized environmental condition at the 61 S Paramus Road Property.
The following table presents certain information relating to the historical occupancy of the 61 S Paramus Road Property:
| Historical and Current Occupancy |
| 2021(1) | 2022(1) | Current(2) |
| 91.0% | 94.0% | 95.3% |
| (1) | Historical Occupancies are as of December 31 of each respective year. |
| (2) | Based on the underwritten rent roll dated December 1, 2023. |
THE INFORMATION IN THIS STRUCTURAL AND COLLATERAL TERM SHEET IS NOT COMPLETE AND MAY BE AMENDED PRIOR TO THE TIME OF SALE. THIS TERM SHEET IS NOT AN OFFER TO SELL THESE SECURITIES AND IT IS NOT A SOLICITATION OF AN OFFER TO BUY THESE SECURITIES IN ANY JURISDICTION WHERE THE OFFER OR SALE IS NOT PERMITTED. |
| | 115 | |
| Structural and Collateral Term Sheet | | BMO 2024-5C3 |
| No. 8 – 61 S Paramus Road |
The following table presents certain information relating to the largest tenants based on net rentable area of the 61 S Paramus Road Property:
| Top Tenant Summary(1) |
| Tenant | Ratings
Moody’s/S&P/Fitch(2) | Net Rentable Area (SF) | % of
Total NRA | UW Base Rent PSF | UW Base Rent | % of Total
UW Base Rent | Lease
Exp. Date |
| Morgan Stanley | A1/A-/NR | 77,336 | 27.6 | % | $31.09 | $2,404,422 | 27.5 | % | 10/31/2028 |
| UBS | Aa2/A+/NR | 45,016 | 16.1 | | $29.00 | 1,305,464 | 14.9 | | 6/30/2026 |
| Decotiis Fitzpatrick Cole & Giblin LLP | NR/NR/NR | 42,481 | 15.2 | | $33.50 | 1,423,113 | 16.3 | | 12/31/2030 |
| Lincoln National | Baa2/BBB+/NR | 15,638 | 5.6 | | $36.39 | 569,029 | 6.5 | | 6/30/2027 |
| Frieslandcampina Ingredients | NR/NR/NR | 15,320 | 5.5 | | $30.75 | 471,090 | 5.4 | | 12/31/2025 |
| Raymond James | A3/A-/NR | 14,139 | 5.1 | | $37.49 | 530,088 | 6.1 | | 4/30/2027 |
| Major Tenants | | 209,930 | 75.1 | % | $31.93 | $6,703,206 | 76.6 | % | |
| Other Tenants | | 56,695 | 20.3 | | $36.18 | 2,051,391 | 23.4 | | |
| Occupied Collateral Total / Wtd. Avg. | | 266,625 | 95.3 | % | $32.83 | $8,754,597 | 100.0 | % | |
| | | | | | | | |
| Vacant Space | | 13,074 | 4.7 | | | | | |
| | | | | | | | |
| Collateral Total | | 279,699 | 100.0 | % | | | | |
| | | | | | | | |
| (1) | Based on the underwritten rent roll dated December 1, 2023. |
| (2) | Certain ratings are those of the parent company whether or not the parent guarantees the lease. |
The following table presents certain information relating to the tenant lease expirations at the 61 S Paramus Road Property:
| Lease Rollover Schedule(1)(2) |
| Year | Number of Leases Expiring | Net Rentable Area Expiring | % of NRA Expiring | UW Base Rent Expiring | % of UW Base Rent Expiring | Cumulative Net Rentable Area Expiring | Cumulative % of NRA Expiring | Cumulative UW Base Rent Expiring | Cumulative % of UW Base Rent Expiring |
| Vacant | NAP | 13,074 | 4.7 | % | NAP | NA | P | 13,074 | | 4.7% | | NAP | NAP | |
| MTM | 0 | 0 | 0.0 | | $0 | 0.0 | % | 13,074 | | 4.7% | | $0 | 0.0% | |
| 2024 | 5 | 16,133 | 5.8 | | 579,896 | 6.6 | | 29,207 | | 10.4% | | $579,896 | 6.6% | |
| 2025 | 2 | 18,007 | 6.4 | | 570,509 | 6.5 | | 47,214 | | 16.9% | | $1,150,405 | 13.1% | |
| 2026 | 1 | 45,016 | 16.1 | | 1,305,464 | 14.9 | | 92,230 | | 33.0% | | $2,455,869 | 28.1% | |
| 2027 | 2 | 29,777 | 10.6 | | 1,099,118 | 12.6 | | 122,007 | | 43.6% | | $3,554,987 | 40.6% | |
| 2028 | 2 | 84,296 | 30.1 | | 2,668,730 | 30.5 | | 206,303 | | 73.8% | | $6,223,716 | 71.1% | |
| 2029 | 1 | 7,978 | 2.9 | | 292,384 | 3.3 | | 214,281 | | 76.6% | | $6,516,100 | 74.4% | |
| 2030 | 3 | 53,470 | 19.1 | | 1,824,917 | 20.8 | | 267,751 | | 95.7% | | $8,341,017 | 95.3% | |
| 2031 | 0 | 0 | 0.0 | | 0 | 0.0 | | 267,751 | | 95.7% | | $8,341,017 | 95.3% | |
| 2032 | 0 | 0 | 0.0 | | 0 | 0.0 | | 267,751 | | 95.7% | | $8,341,017 | 95.3% | |
| 2033 | 0 | 0 | 0.0 | | 0 | 0.0 | | 267,751 | | 95.7% | | $8,341,017 | 95.3% | |
| 2034 | 0 | 0 | 0.0 | | 0 | 0.0 | | 267,751 | | 95.7% | | $8,341,017 | 95.3% | |
| 2035 & Beyond | 1 | 11,948 | 4.3 | | 413,580 | 4.7 | | 279,699 | | 100.0% | | $8,754,597 | 100.0% | |
| Total | 17 | 279,699 | 100.0 | % | $8,754,597 | 100.0 | % | | | | |
| (1) | Based on the underwritten rent roll dated December 1, 2023. |
| (2) | Certain leases may have termination options that are exercisable prior to the originally stated expiration date of the lease and that are not considered in this Lease Rollover Schedule. |
THE INFORMATION IN THIS STRUCTURAL AND COLLATERAL TERM SHEET IS NOT COMPLETE AND MAY BE AMENDED PRIOR TO THE TIME OF SALE. THIS TERM SHEET IS NOT AN OFFER TO SELL THESE SECURITIES AND IT IS NOT A SOLICITATION OF AN OFFER TO BUY THESE SECURITIES IN ANY JURISDICTION WHERE THE OFFER OR SALE IS NOT PERMITTED. |
| | 116 | |
| Structural and Collateral Term Sheet | | BMO 2024-5C3 |
| No. 8 – 61 S Paramus Road |
The following table presents certain information relating to the operating history and underwritten cash flows of the 61 S Paramus Road Property:
| Operating History and Underwritten Net Cash Flow |
| | 2021 | 2022 | TTM(1) | Underwritten | Per Square Foot | %(2) |
| Rents in Place | $7,831,656 | $7,933,703 | $8,097,261 | $9,205,650 | $32.91 | 92.5 | % |
| Vacant Income | 0 | 0 | 0 | 0 | 0.00 | 0.0 | |
| Gross Potential Rent | $7,831,656 | $7,933,703 | $8,097,261 | $9,205,650 | $32.91 | 92.5 | % |
| Total Reimbursements | 685,766 | 1,011,203 | 773,900 | 564,003 | 2.02 | 5.7 | |
| Other Income | 32,916 | 85,509 | 251,883 | 187,572 | 0.67 | 1.9 | |
| Net Rental Income | $8,550,338 | $9,030,415 | $9,123,044 | $9,957,225 | $35.60 | 100.0 | % |
| (Vacancy/Credit Loss)(3) | 0 | 0 | 0 | (896,150) | (3.20) | (9.0 | ) |
| Effective Gross Income | $8,550,338 | $9,030,415 | $9,123,044 | $9,061,075 | $32.40 | 91.0 | % |
| Total Expenses | 3,833,188 | 3,629,240 | 3,881,788 | 3,947,255 | 14.11 | 43.6 | |
| Net Operating Income | $4,717,150 | $5,401,175 | $5,241,255 | $5,113,820 | $18.28 | 56.4 | % |
| Capital Expenditures | 0 | 0 | 0 | 69,925 | 0.25 | 0.8 | |
| TI/LC | 0 | 0 | 0 | 349,624 | 1.25 | 3.9 | |
| Net Cash Flow | $4,717,150 | $5,401,175 | $5,241,255 | $4,694,272 | $16.78 | 51.8 | % |
| (1) | TTM reflects the trailing 12 months ending September 30, 2023. |
| (2) | % column represents percent of Net Rental Income for all revenue lines and represents percentage of Effective Gross Income for the remaining fields. |
| (3) | The underwritten economic vacancy is 9.0%. The 61 S Paramus Road Property was 95.3% physically occupied based on the December 1, 2023 rent roll. |
The Market. The 61 S Paramus Road Property is located within Paramus and Bergen County, New Jersey and forms part of the New York-Newark-Jersey City metropolitan statistical area (“New York MSA”). The industry employment totals for the New York MSA indicate somewhat higher proportions within the services, transportation/utilities, public administration, information, finance/insurance/real estate, and agriculture/mining sectors. According to the Bureau of Labor Statistics, the most recent reported unemployment rate for the New York MSA is 4.4% (March 2023). Major employers in the New York MSA include Montefiore Health System (32,232 employees), Mount Sinai Health System (32,074 employees), JPMorgan Chase & Co. (29,000 employees), Bank of America (27,000 employees) and New York-Presbyterian Healthcare System (23,709 employees).
The 61 S Paramus Road Property is located in the Borough of Paramus in Bergen County. The borough has a total of 121.92 miles of roadways, of which 90.93 miles are maintained by the municipality, 18.86 miles by Bergen County, 7.72 miles by the New Jersey Department of Transportation, and 4.41 miles by the New Jersey Turnpike Authority. Highways in Paramus include Route 17, Route 4 and the Garden State Parkway, all in close proximity to the 61 S Paramus Road Property, with the Garden State Parkway entry ramp located adjacent to the 61 S Paramus Road Property. According to the appraisal, the estimated 2023 population within a one-, three- and five-mile radius of the 61 S Paramus Road Property was 12,858, 168,380 and 643,088, respectively. Additionally, for the same period, the average household income within the same radii was $160,745, $139,863 and $124,595, respectively.
According to the appraisal, the 61 S Paramus Road Property is located within the Route 4/17 submarket of the Northern New Jersey office market. As of the third quarter 2023, the Route 4/17 office submarket contained approximately 2.4 million square feet of office space with a vacancy rate of 12.1% and an average asking rental rate of $28.96 per square foot. The submarket reported 11,551 square feet of positive net absorption over the past four quarters.
According to a third-party market data provider, as of the first quarter of 2024, the Route 4/17 office submarket contained approximately 2.2 million square feet of 4 & 5 Star office space with a vacancy rate of 10.3% and an average asking rental rate of $33.95 per square foot. The growth of Valley Health System, Summit Health, and Hackensack Meridian Health has been a driver to net absorption of over 339,000 square feet of 4 & 5 Star office space within the submarket since 2019. Over that same time-period, the vacancy rate declined to 10.3% from 19.7%. This in turn has led to a lack of 4 & 5 Star quality space in the submarket. This is further illustrated by examples such as Valley Health System who, in addition to their expansion via acquisitions in the submarket, is currently constructing a new $738 million hospital in the submarket (adjacent to the Paramus Park Mall, less than five miles north of the 61 S Paramus Road Property). This growth in medical uses has been largely responsible for increasing office occupancy and 4 & 5 Star rents in the Paramus market.
THE INFORMATION IN THIS STRUCTURAL AND COLLATERAL TERM SHEET IS NOT COMPLETE AND MAY BE AMENDED PRIOR TO THE TIME OF SALE. THIS TERM SHEET IS NOT AN OFFER TO SELL THESE SECURITIES AND IT IS NOT A SOLICITATION OF AN OFFER TO BUY THESE SECURITIES IN ANY JURISDICTION WHERE THE OFFER OR SALE IS NOT PERMITTED. |
| | 117 | |
| Structural and Collateral Term Sheet | | BMO 2024-5C3 |
| No. 8 – 61 S Paramus Road |
The following table presents certain information relating to comparable office leases for the 61 S Paramus Road Property:
| Comparable Office Leases(1) |
| Property / Location | Year Built / Renovated | Tenant Name | Lease Start Date | Term (yrs.) | Lease Type | Tenant SF | Rent PSF |
61 S Paramus Road
Paramus, NJ | 1985 / 2019 | Various | Various | Various | Various | 279,699(2) | $32.83(2) |
500 Frank W. Burr
Boulevard Teaneck, NJ | 1985 / 2009 | Q Cells Enable, LLC | Oct-23 | 10.3 | Modified Gross | 15,131 | $34.00 |
300 Frank W. Burr
Boulevard Teaneck, NJ | 1983 / 2009 | The Trustees of Columbia University | Sep-23 | 10.3 | Gross + TE | 4,283 | $34.50 |
500 Frank W. Burr
Boulevard Teaneck, NJ | 1985 / 2009 | RCCA MSO LLC | Oct-22 | 7.3 | Modified Gross | 5,499 | $33.00 |
401 Hackensack Ave
Hackensack, NJ | 1968 / 2016 | Greystone Funding | Sep-22 | 5.3 | Gross + TE | 3,558 | $31.50 |
301 Route 17 North
Rutherford, NJ | 1981 / 2014 | Kumon | Feb-22 | 7.5 | Gross + TE | 21,651 | $28.50 |
| (2) | Based on the underwritten rent roll dated December 1, 2023. |
The Borrower. The borrowing entity for the 61 S Paramus Road Mortgage Loan is FM Sixty One Paramus LLC, a single purpose entity limited liability company with one independent director. Legal counsel to the borrower delivered a non-consolidation opinion in connection with the origination of the 61 S Paramus Road Mortgage Loan.
The Borrower Sponsors. The borrower sponsors are Crown Acquisitions, Inc., First Mile Capital, LLC and Richard Chera. Crown Acquisitions, Inc. is a New York-based full-service real estate firm. Richard Chera is the non-recourse guarantor. Richard Chera is a co-founder and serves as senior managing director of Crown Acquisitions Inc. and First Mile Capital, LLC.
Property Management. The 61 S Paramus Road Property is managed by Paramount Newco Realty, LLC, a third party property management company.
Escrows and Reserves. At origination of the 61 S Paramus Road Mortgage Loan, the borrower deposited approximately (i) $187,501 into a reserve account for real estate taxes, (ii) $5,000,000 into a reserve account for tenant improvements and leasing commissions, (iii) $27,500 into a reserve account for deferred maintenance, (iv) $1,282,713 into a reserve account for unfunded obligations, (v) $540,000 into a reserve account for capital expenses and (vi) $31,250 into a reserve account for ground rent.
Tax Escrows – The borrower is required to deposit into a real estate tax reserve, on a monthly basis, 1/12th of the taxes that the lender estimates will be payable over the next-ensuing 12-month period (initially estimated to be approximately $62,500).
Insurance Escrows – The borrower is required to deposit into an insurance reserve, on a monthly basis, 1/12th of the reasonably estimated insurance premiums unless the borrower maintains a blanket policy in accordance with the 61 S Paramus Road Mortgage Loan documents and no event of default is continuing.
TI/LC Reserves –The borrower is required to deposit into a tenant improvement and leasing commission reserve on a monthly basis, an amount equal to $1.25 per square foot (approximately $29,135) if the balance of the TI/LC reserve account is less than $3,000,000, until the amounts on deposit in the TI/LC reserve account are equal to $5,000,000.
CapEx Reserves – The borrower is required to deposit into a capital expense reserve account, on a monthly basis, approximately $5,827.
THE INFORMATION IN THIS STRUCTURAL AND COLLATERAL TERM SHEET IS NOT COMPLETE AND MAY BE AMENDED PRIOR TO THE TIME OF SALE. THIS TERM SHEET IS NOT AN OFFER TO SELL THESE SECURITIES AND IT IS NOT A SOLICITATION OF AN OFFER TO BUY THESE SECURITIES IN ANY JURISDICTION WHERE THE OFFER OR SALE IS NOT PERMITTED. |
| | 118 | |
| Structural and Collateral Term Sheet | | BMO 2024-5C3 |
| No. 8 – 61 S Paramus Road |
Lockbox / Cash Management. The 61 S Paramus Road Mortgage Loan is structured with a springing lockbox and springing cash management. Upon the occurrence of the initial Cash Management Period (as defined below), the borrower is required to cause all rents from all tenants of the 61 S Paramus Road Property to be transmitted directly by such tenants into the clearing account. Without in any way limiting the foregoing, from and after the commencement of the initial Cash Management Period, if borrower or the property manager receive any rents, the borrower is required to deposit such amounts into the clearing account within three business days of receipt. Funds deposited into the clearing account are required to be swept by the clearing bank on a daily basis (i) during the continuance of a Cash Management Period, into an eligible account at the cash management bank controlled by the lender (the "Cash Management Account") and (ii) absent the existence of a Cash Management Period, into the borrower’s operating account.
A "Cash Management Period" will commence upon the lender giving notice to the clearing bank of the occurrence of any of the following: (i) the stated maturity date, (ii) an event of default, (iii) if, as of any calculation date, the debt service coverage ratio is less than 1.20:1 (a "DSCR Cash Management Period") or (iv) the commencement of a Lease Sweep Period (as defined below); and will end upon the lender giving notice to the clearing bank that the sweeping of funds into the Cash Management Account may cease, which notice the lender will only be required to give if (1) the 61 S Paramus Road Mortgage Loan and all other obligations under the 61 S Paramus Road Mortgage Loan documents have been repaid in full or (2) the stated maturity date has not occurred and (A) with respect to the matters described in clause (ii) above, such event of default has been cured and no other event of default has occurred and is continuing or (B) with respect to the matter described in clause (iii) above, the 61 S Paramus Road Property has achieved a debt service coverage ratio of at least 1.20:1 for two consecutive calendar quarters or (C) with respect to the matter described in clause (iv) above, such Lease Sweep Period has ended.
The borrower may suspend its obligation to cause all rents to be deposited into the clearing account during a DSCR Cash Management Period (provided no other Cash Management Period is continuing) if and for so long as the following conditions are satisfied: (i) borrower has deposited (and maintains on deposit) with the lender cash in the amount of the difference between (A) the annual net operating income that would be required to achieve a debt service coverage ratio of 1.20x, minus (B) the then-existing annual net operating income, as reasonably determined by the lender (the “NOI Shortfall”), which cash amount will be transferred to the cash collateral subaccount; or (ii) the borrower has deposited (and maintains on deposit) with the lender a letter of credit in the amount of the NOI Shortfall. The cash deposit or letter of credit is required to remain on deposit with lender until the termination of the DSCR Cash Management Period, at which time the remaining cash deposit or letter of credit will be returned to the borrower. In the event the NOI Shortfall exceeds the amount of cash or the letter of credit on deposit with the lender at the end of any calendar quarter during the continuance of a DSCR Cash Management Period, and the borrower wishes to maintain the suspension of the deposit requirements set forth above, the borrower is required to promptly make additional deposits of cash, or modifications or supplements to the letter of credit, in amounts sufficient to cover the full amount of the then-existing NOI Shortfall. Borrower’s compliance with the foregoing is required to be tested quarterly. During an event of default, the lender will have the right to apply any cash deposit, or draw on any one or more letters of credit delivered according to this section, and apply such amount or the proceeds thereof to the debt in such order as the lender may determine in its sole discretion.
A “Lease Sweep Period” will commence on the first payment date following the occurrence of any of the following: (i) the date that is 12 months prior to the expiration of the then current term of a Major Lease (as defined below) if the applicable Major Tenant (as defined below) thereunder has not renewed or extended the lease term pursuant to such Major Lease for a minimum term of three (3) years; or (ii) the date that is 12 months prior to the effective date of any proposed termination, cancellation or surrender of a Major Lease (or a Substantial Portion (as defined below) thereof) as set forth in any notice from a major tenant exercising such right to terminate, cancel or surrender its Major Lease; (iii) the date that any Major Lease (or a Substantial Portion thereof) is actually surrendered, cancelled or terminated prior to its then current expiration date (if such sweep has not already commenced under clause (ii) above); or (iv) any Major Tenant discontinues its business at the entirety of its premises (i.e., "goes dark") or give notice that it intends to discontinue its business at the entirety of its premises; or (v) the occurrence and continuance (beyond any applicable notice and cure periods) of a material monetary default or material nonmonetary default under any Major Lease by the applicable Major Tenant thereunder; or (vi) the occurrence of an insolvency proceeding involving a Major Tenant.
A "Major Lease" means each of the Decotiis Fitzpatrick Cole & Giblin LLP lease, the Morgan Stanley lease, the UBS lease, and any other lease which covers 43,000 or more rentable square feet of the 61 S Paramus Road Property.
THE INFORMATION IN THIS STRUCTURAL AND COLLATERAL TERM SHEET IS NOT COMPLETE AND MAY BE AMENDED PRIOR TO THE TIME OF SALE. THIS TERM SHEET IS NOT AN OFFER TO SELL THESE SECURITIES AND IT IS NOT A SOLICITATION OF AN OFFER TO BUY THESE SECURITIES IN ANY JURISDICTION WHERE THE OFFER OR SALE IS NOT PERMITTED. |
| | 119 | |
| Structural and Collateral Term Sheet | | BMO 2024-5C3 |
| No. 8 – 61 S Paramus Road |
A "Major Tenant" means any tenant under either a Major Lease, or under one or more leases (leased by such tenant and/or its affiliates), which when taken together cover in the aggregate 43,000 or more rentable square feet of the 61 S Paramus Road Property.
A "Substantial Portion" means, with respect to the applicable portion of any Major Lease that is the subject of termination, cancellation, surrender or non-renewal, 15% or more of the rentable square feet demised pursuant to such Major Lease, provided, however, with respect to the termination option affecting 16,097 square feet of expansion space under the Morgan Stanley lease, in the event the resulting debt yield (taking into account the exercise of such termination option) is equal to or greater than 14%, then the exercise of such termination option of the Morgan Stanley lease solely with respect to suite 385 (and any notice related thereto) will be deemed to not affect a Substantial Portion of the Morgan Stanley lease.
Subordinate Debt. None.
Mezzanine Debt. None.
Partial Release. The 61 S Paramus Mortgage Loan documents permit the release of the Release Parcel (as defined below) from the lien of the mortgage in connection with the sale or transfer of the Release Parcel (a “Partial Release Event”) upon borrower's satisfaction of each of the following conditions, including but not limited to: (a) both immediately before such Partial Release Event and immediately thereafter, no event of default is continuing; (b) the borrower provides not less than 30 days’ prior written notice to the lender specifying that the Partial Release Event will occur; (c) in conjunction with the Partial Release Event which is undertaken after a securitization of the loan, the borrower is required, if requested by lender, to deliver an opinion of counsel for the borrower opining, among other things if reasonably required by the lender, that any REMIC trust formed pursuant to a securitization will not fail to maintain its status as a "real estate mortgage investment conduit" within the meaning of Section 860D of the Internal Revenue Code as a result of such Partial Release Event and (d) the Partial Release Event may not occur 60 days prior to or 60 days after the date a securitization has occurred.
“Release Parcel” means all or a portion of the land comprised of approximately 3.29 acres of the existing parking lot.
Ground Lease. The 61 S Paramus Road Property is encumbered by a ground lease that expires in 2116 and is held by the ground lessor, Paramus Road IV, L.L.C. The ground rent on the 61 S Paramus Road Property is $375,000 annually through November 30, 2027. On December 1, 2027, annual base rent will be adjusted to 112.5% of the current annual base rent, and such adjusted annual base rent will be the annual base rent to be paid in monthly installments each year for a term of 10 years. On the commencement of the 11th year after the first adjustment, the annual base rent will again increase by a factor of 112.5%. The annual base rent is subject to the same such adjustment on the commencement of every 11th year for the remainder of the term of the lease.
Terrorism Insurance. The 61 S Paramus Road Mortgage Loan documents require that the “all risk” insurance policy required to be maintained by the borrower provides coverage for terrorism in an amount equal to the full replacement cost of the 61 S Paramus Road Property as well as business interruption insurance covering no less than the 18-month period following the occurrence of a casualty event, together with a six-month extended period of indemnity. See “Risk Factors—Risks Relating to the Mortgage Loans—Terrorism Insurance May Not Be Available for All Mortgaged Properties” in the prospectus.
THE INFORMATION IN THIS STRUCTURAL AND COLLATERAL TERM SHEET IS NOT COMPLETE AND MAY BE AMENDED PRIOR TO THE TIME OF SALE. THIS TERM SHEET IS NOT AN OFFER TO SELL THESE SECURITIES AND IT IS NOT A SOLICITATION OF AN OFFER TO BUY THESE SECURITIES IN ANY JURISDICTION WHERE THE OFFER OR SALE IS NOT PERMITTED. |
| | 120 | |
| Structural and Collateral Term Sheet | | BMO 2024-5C3 |
| No. 9 – 111 West 19th Street |

THE INFORMATION IN THIS STRUCTURAL AND COLLATERAL TERM SHEET IS NOT COMPLETE AND MAY BE AMENDED PRIOR TO THE TIME OF SALE. THIS TERM SHEET IS NOT AN OFFER TO SELL THESE SECURITIES AND IT IS NOT A SOLICITATION OF AN OFFER TO BUY THESE SECURITIES IN ANY JURISDICTION WHERE THE OFFER OR SALE IS NOT PERMITTED. |
| | 121 | |
| Structural and Collateral Term Sheet | | BMO 2024-5C3 |
| No. 9 – 111 West 19th Street |

THE INFORMATION IN THIS STRUCTURAL AND COLLATERAL TERM SHEET IS NOT COMPLETE AND MAY BE AMENDED PRIOR TO THE TIME OF SALE. THIS TERM SHEET IS NOT AN OFFER TO SELL THESE SECURITIES AND IT IS NOT A SOLICITATION OF AN OFFER TO BUY THESE SECURITIES IN ANY JURISDICTION WHERE THE OFFER OR SALE IS NOT PERMITTED. |
| | 122 | |
| Structural and Collateral Term Sheet | | BMO 2024-5C3 |
| No. 9 – 111 West 19th Street |
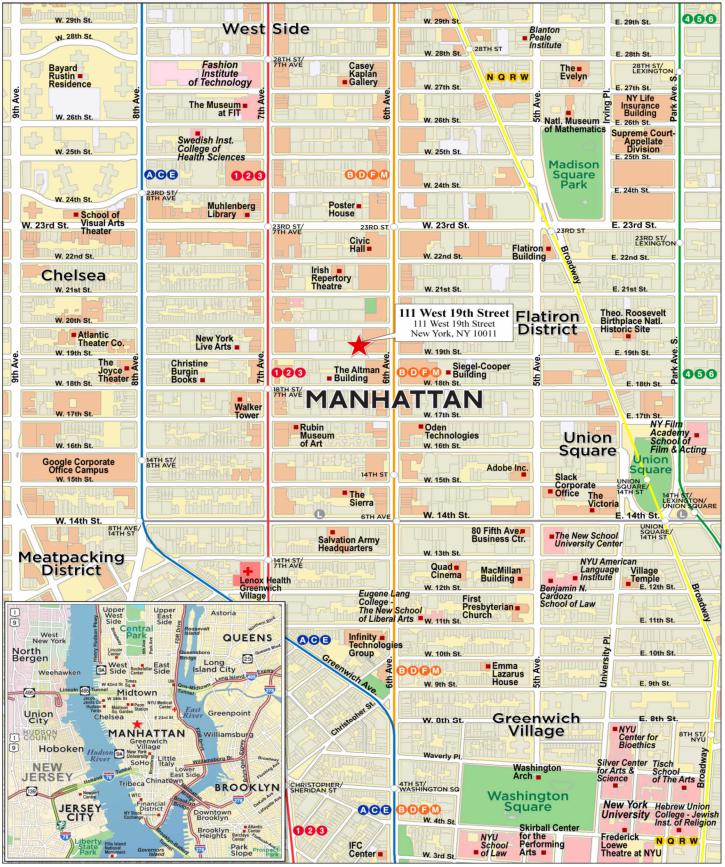
THE INFORMATION IN THIS STRUCTURAL AND COLLATERAL TERM SHEET IS NOT COMPLETE AND MAY BE AMENDED PRIOR TO THE TIME OF SALE. THIS TERM SHEET IS NOT AN OFFER TO SELL THESE SECURITIES AND IT IS NOT A SOLICITATION OF AN OFFER TO BUY THESE SECURITIES IN ANY JURISDICTION WHERE THE OFFER OR SALE IS NOT PERMITTED. |
| | 123 | |
| Structural and Collateral Term Sheet | | BMO 2024-5C3 |
| No. 9 – 111 West 19th Street |
| Mortgage Loan Information | | Property Information |
| Mortgage Loan Seller: | CREFI | | Single Asset / Portfolio: | Single Asset |
| Original Principal Balance: | $33,000,000 | | Title: | Fee |
| Cut-off Date Principal Balance: | $33,000,000 | | Property Type – Subtype: | Office – CBD |
| % of IPB: | 3.7% | | Net Rentable Area (SF): | 189,731 |
| Loan Purpose: | Refinance | | Location: | New York, NY |
| Borrower: | 19th Street Owner LLC | | Year Built / Renovated: | 1901 / 2015 |
| Borrower Sponsor: | Steven Kaufman | | Occupancy: | 87.9% |
| Interest Rate: | 6.95000% | | Occupancy Date: | 10/1/2023 |
| Note Date: | 12/21/2023 | | 4th Most Recent NOI (As of): | $8,820,715 (12/31/2020) |
| Maturity Date: | 1/6/2029 | | 3rd Most Recent NOI (As of): | $6,934,144 (12/31/2021) |
| Interest-only Period: | 60 months | | 2nd Most Recent NOI (As of): | $7,593,191 (12/31/2022) |
| Original Term: | 60 months | | Most Recent NOI (As of): | $7,699,506 (TTM 9/30/2023) |
| Original Amortization Term: | None | | UW Economic Occupancy: | 87.5% |
| Amortization Type: | Interest Only | | UW Revenues: | $11,268,117 |
| Call Protection: | L(25),D(32),O(3) | | UW Expenses: | $3,822,862 |
| Lockbox / Cash Management: | Hard / Springing | | UW NOI: | $7,445,254 |
| Additional Debt: | No | | UW NCF: | $7,048,400 |
| Additional Debt Balance: | N/A | | Appraised Value / Per SF: | $121,000,000 / $638 |
| Additional Debt Type: | N/A | | Appraisal Date: | 11/15/2023 |
| | | | | |
| Escrows and Reserves(1) | | Financial Information |
| | Initial | Monthly | Initial Cap | | Cut-off Date Loan / SF: | $174 |
| Taxes: | $360,289 | $180,144 | N/A | | Maturity Date Loan / SF: | $174 |
| Insurance: | $0 | Springing | N/A | | Cut-off Date LTV: | 27.3% |
| Deferred Maintenance: | $22,500 | $0 | N/A | | Maturity Date LTV: | 27.3% |
| Replacement Reserves: | $0 | $3,162 | N/A | | UW NCF DSCR: | 3.03x |
| TI/LC: | $3,000,000 | Springing | $3,000,000 | | UW NOI Debt Yield: | 22.6% |
| Other Reserves(2) | $3,384,905 | $0 | N/A | | | |
| | | | | | | |
| Sources and Uses |
| Sources | Proceeds | % of Total | | Uses | Proceeds | % of Total |
| Loan Amount | $33,000,000 | 99.8 | % | | Loan Payoff | $25,108,653 | 75.9 | % |
| Equity Contribution | 75,000 | 0.2 | | | Reserves | 6,767,693 | 20.5 | |
| | | | | Closing Costs | 1,198,653 | 3.6 | |
| Total Sources | $33,075,000 | 100.0 | % | | Total Uses | $33,075,000 | 100.0 | % |
| (1) | See “Escrows and Reserves” below for further discussion of reserve information. |
| (2) | Other Reserves consists of approximately $3,384,905 of building improvements reserves. |
The Loan. The ninth largest mortgage loan (the “111 West 19th Street Mortgage Loan”) is secured by the borrower’s fee interest in an eight-story office building located in New York, New York featuring 189,731 square feet, including 31,231 square feet of retail space (the “111 West 19th Street Property”). The 111 West 19th Street Mortgage Loan has an original and outstanding principal balance as of the Cut-off Date of $33,000,000 and represents approximately 3.7% of the Initial Pool Balance.
The 111 West 19th Street Mortgage Loan was originated on December 21, 2023 by Citi Real Estate Funding Inc. The 111 West 19th Street Mortgage Loan proceeds were used to refinance the 111 West 19th Street Property, fund upfront reserves and pay origination costs. The 111 West 19th Street Mortgage Loan accrues interest at a fixed rate of 6.95000% per annum.
The 111 West 19th Street Mortgage Loan had an original term of 60 months and has a remaining term of 59 months as of the Cut-off Date. The 111 West 19th Street Mortgage Loan requires interest-only payments during the full term. The scheduled maturity date of the 111 West 19th Street Mortgage Loan is the payment date in January 2029.
THE INFORMATION IN THIS STRUCTURAL AND COLLATERAL TERM SHEET IS NOT COMPLETE AND MAY BE AMENDED PRIOR TO THE TIME OF SALE. THIS TERM SHEET IS NOT AN OFFER TO SELL THESE SECURITIES AND IT IS NOT A SOLICITATION OF AN OFFER TO BUY THESE SECURITIES IN ANY JURISDICTION WHERE THE OFFER OR SALE IS NOT PERMITTED. |
| | 124 | |
| Structural and Collateral Term Sheet | | BMO 2024-5C3 |
| No. 9 – 111 West 19th Street |
The Property. The 111 West 19th Street Property is an eight-story 189,731 square foot multitenant office property located along the north side of West 19th Street and south side of West 20th Street between Sixth and Seventh Avenues in the Chelsea office submarket of New York, New York. The 111 West 19th Street Property is situated on a 0.42-acre site and was built in 1901 and was most recently renovated in 2015. The 111 West 19th Street Property is comprised of 158,500 square feet of office space and 31,231 square feet of multi-level retail space, inclusive of 16,000 square feet of ground level space, 14,000 square feet of lower level space and 1,321 square feet of mezzanine level space. As of October 1, 2023 the 111 West 19th Street Property was 87.9% occupied by five office tenants and one retail tenant. The retail space is 100% occupied by Kleinfeld Bridal Corp. which has been at the 111 West 19th Street Property since October 2004. Additionally, the borrower sponsor executed a letter of intent with Ripple Labs, Inc. (“Ripple”) for the remaining 23,000 square feet at the 111 West 19th Street Property. There can be no assurance that Ripple will take possession of the applicable premises and begin paying rent as expected or at all.
Major Tenants. The three largest tenants based on underwritten base rent are RELX Inc., DineInFresh, Inc. and Fortress Equity Partners LP.
RELX Inc. (46,000 square feet; 24.2% of net rentable area; 32.7% of underwritten base rent) is a global provider of information-based analytics and decision tools for professional and business customers under the parent company RELX PLC. The company serves customers in over 180 countries and has more than 35,000 employees in its 40+ offices with its headquarters in London, UK. RELX Inc. has been at the 111 West 19th Street Property since November 2015 and has a current lease term through October 2025 with one five-year renewal option and no termination options. RELX Inc. subleases 23,000 square feet of space on the fourth floor of the 111 West 19th Street Property to Bond Veterinary, Inc.
DineInFresh, Inc. (23,000 square feet; 12.1% of net rentable area; 17.3% of underwritten base rent) is a meal-kit delivery service that offers chef-designed recipes and ingredients. The company was founded in 2012 and is operated and based in New York with the name Plated which is a subsidiary of Albertsons. DineInFresh, Inc. has been at the 111 West 19th Street Property since June 2017 and has a current lease term through October 2027 with no renewal or termination options. DineInFresh, Inc. subleases its entire 23,000 square feet of space at the 111 West 19th Street Property to Outbrain, Inc.
Fortress Equity Partners LP (20,500 square feet; 10.8% of net rentable area; 15.8% of underwritten base rent) is a private equity fund and an affiliate of Fortress Investment Group, LLC (Nasdaq: FIG), owned by Wesley Edens. As of September 30, 2023, Fortress Investment Group, LLC had $46.2 billion of assets under management on behalf of over 1,900 institutional clients and private investors across a range of credit and real estate, private equity and permanent capital investment strategies. Fortress Equity Partners LP has been at the 111 West 19th Street Property since March 2017 and has a current lease term through March 2028 with one, five-year renewal option and no termination options.
Appraisal. According to the appraisal, the 111 West 19th Street Property had an “as-is” appraised value of $121,000,000 as of November 15, 2023.
| 111 West 19th Street Appraised Value(1) |
| Property Name | Appraised Value | Capitalization Rate |
| 111 West 19th Street | $121,000,000 | 5.54%(1) |
| | (1) | The appraiser used a discounted cash flow analysis utilizing an 7.25% discount rate and 6.25% terminal capitalization rate to arrive at its value. The capitalization rate shown above represents the implied capitalization rate. |
THE INFORMATION IN THIS STRUCTURAL AND COLLATERAL TERM SHEET IS NOT COMPLETE AND MAY BE AMENDED PRIOR TO THE TIME OF SALE. THIS TERM SHEET IS NOT AN OFFER TO SELL THESE SECURITIES AND IT IS NOT A SOLICITATION OF AN OFFER TO BUY THESE SECURITIES IN ANY JURISDICTION WHERE THE OFFER OR SALE IS NOT PERMITTED. |
| | 125 | |
| Structural and Collateral Term Sheet | | BMO 2024-5C3 |
| No. 9 – 111 West 19th Street |
Environmental. The Phase I environmental assessment of the 111 West 19th Street Property dated November 21, 2023 identified no recognized environmental conditions, controlled environmental conditions or significant data gaps with the property. See “Description of the Mortgage Pool—Environmental Considerations” in the Preliminary Prospectus.
The following table presents certain information relating to the historical occupancy of the 111 West 19th Street Property:
| Historical and Current Occupancy(1) |
| 2021 | 2022 | Current(2) |
| 88.0% | 88.0% | 87.9% |
| (1) | Historical Occupancies are as of December 31 of each respective year, unless otherwise specified. |
| (2) | Based on the underwritten rent roll dated October 1, 2023. |
The following table presents certain information relating to the major tenants at the 111 West 19th Street Property:
| Top Tenant Summary(1) |
| Tenant | Ratings
Moody’s/S&P/Fitch(2) | Net Rentable Area (SF) | % of
Total NRA | UW
Base Rent PSF |
UW
Base Rent | % of Total
UW Base Rent | Lease
Exp. Date |
| RELX Inc.(3) | A3/BBB+/BBB+ | 46,000 | | 24.2 | % | $72.58 | $3,338,497 | 32.7 | % | 10/31/2025 |
| DineInFresh, Inc.(4) | NR/NR/NR | 23,000 | | 12.1 | | $76.75 | 1,765,353 | 17.3 | | 10/31/2027 |
| Fortress Equity Partners LP | NR/NR/NR | 20,500 | | 10.8 | | $78.83 | 1,616,043 | 15.8 | | 3/31/2028 |
| The Barbarian Group, LLC | NR/NR/NR | 23,000 | | 12.1 | | $64.51 | 1,483,632 | 14.5 | | 6/30/2024 |
| NFE Management LLC | NR/NR/NR | 23,000 | | 12.1 | | $55.00 | 1,265,000 | 12.4 | | 10/31/2024 |
| Kleinfeld Bridal Corp.(5) | NR/NR/NR | 31,231 | | 16.5 | | $23.41 | 730,998 | 7.2 | | 9/30/2037 |
| Total Occupied | | 166,731 | | 87.9 | % | $61.17 | $10,199,523 | 100.0 | % | |
| Vacant Space | | 23,000 | | 12.1 | | | | | |
| Totals/ Wtd. Avg. | | 189,731 | | 100.0 | % | | | | |
| (1) | Based on the underwritten rent roll dated October 1, 2023, inclusive of rent steps through November 2024. |
| (2) | Certain ratings are those of the parent company whether or not the parent guarantees the lease. |
| (3) | RELX Inc. subleases 23,000 square feet of space on the fourth floor of the 111 West 19th Street Property to Bond Veterinary, Inc. |
| (4) | DineInFresh, Inc. subleases its entire 23,000 square feet of space at the 111 West 19th Street Property to Outbrain, Inc. |
| (5) | Kleinfeld Bridal Corp. subleases 1,231 square feet of mezzanine space at the 111 West 19th Street Property to Occasion Brands, LLC. |
THE INFORMATION IN THIS STRUCTURAL AND COLLATERAL TERM SHEET IS NOT COMPLETE AND MAY BE AMENDED PRIOR TO THE TIME OF SALE. THIS TERM SHEET IS NOT AN OFFER TO SELL THESE SECURITIES AND IT IS NOT A SOLICITATION OF AN OFFER TO BUY THESE SECURITIES IN ANY JURISDICTION WHERE THE OFFER OR SALE IS NOT PERMITTED. |
| | 126 | |
| Structural and Collateral Term Sheet | | BMO 2024-5C3 |
| No. 9 – 111 West 19th Street |
The following table presents certain information relating to the lease rollover schedule at the 111 West 19th Street Property:
| Lease Rollover Schedule(1)(2) |
| Year | Number of Leases Expiring | Net Rentable Area Expiring | % of NRA Expiring | UW Base Rent Expiring | % of UW Base Rent Expiring | Cumulative Net Rentable Area Expiring | Cumulative % of NRA Expiring | Cumulative UW Base Rent Expiring | Cumulative % of UW Base Rent Expiring |
| Vacant | NAP | 23,000 | 12.1 | % | NAP | NA | P | 23,000 | 12.1% | | NAP | NAP |
| 2024 | 2 | 46,000 | 24.2 | | $2,748,632 | 26.9 | % | 69,000 | 36.4% | | $2,748,632 | 26.9% |
| 2025 | 1 | 46,000 | 24.2 | | 3,338,497 | 32.7 | | 115,000 | 60.6% | | $6,087,129 | 59.7% |
| 2026 | 0 | 0 | 0.0 | | 0 | 0.0 | | 115,000 | 60.6% | | $6,087,129 | 59.7% |
| 2027 | 1 | 23,000 | 12.1 | | 1,765,353 | 17.3 | | 138,000 | 72.7% | | $7,852,482 | 77.0% |
| 2028 | 1 | 20,500 | 10.8 | | 1,616,043 | 15.8 | | 158,500 | 83.5% | | $9,468,525 | 92.8% |
| 2029 | 0 | 0 | 0.0 | | 0 | 0.0 | | 158,500 | 83.5% | | $9,468,525 | 92.8% |
| 2030 | 0 | 0 | 0.0 | | 0 | 0.0 | | 158,500 | 83.5% | | $9,468,525 | 92.8% |
| 2031 | 0 | 0 | 0.0 | | 0 | 0.0 | | 158,500 | 83.5% | | $9,468,525 | 92.8% |
| 2032 | 0 | 0 | 0.0 | | 0 | 0.0 | | 158,500 | 83.5% | | $9,468,525 | 92.8% |
| 2033 | 0 | 0 | 0.0 | | 0 | 0.0 | | 158,500 | 83.5% | | $9,468,525 | 92.8% |
| 2034 | 0 | 0 | 0.0 | | 0 | 0.0 | | 158,500 | 83.5% | | $9,468,525 | 92.8% |
| 2035 & Beyond | 1 | 31,231 | 16.5 | | 730,998 | 7.2 | | 189,731 | 100.0% | | $10,199,523 | 100.0% |
| Total | 6 | 189,731 | 100.0 | % | $10,199,523 | 100.0 | % | | | | |
| (1) | Based on the underwritten rent roll dated October 1, 2023, inclusive of rent steps through November 2024. |
| (2) | Certain tenants may have lease termination options that are exercisable prior to the originally stated expiration date of the related lease and are not considered in the rollover schedule. |
The following table presents certain information relating to the operating history and underwritten cash flows of the 111 West 19th Street Property:
| Operating History and Underwritten Net Cash Flow |
| | | 2019 | 2020 | 2021 | 2022 | TTM September 2023 | Underwritten | Per Square Foot | %(1) |
| Rents in Place(2) | | $10,404,908 | $10,986,704 | $9,230,708 | $9,796,877 | $10,060,694 | $10,199,523 | $53.76 | 79.8 | % |
| Vacant Income | | 0 | 0 | 0 | 0 | 0 | 1,495,000 | 7.88 | 11.7 | |
| Gross Potential Rent | | $10,404,908 | $10,986,704 | $9,230,708 | $9,796,877 | $10,060,694 | $11,694,523 | $61.64 | 91.5 | % |
| Total Reimbursements | | 509,854 | 731,721 | 688,110 | 956,413 | 1,037,235 | 1,091,896 | 5.75 | 8.5 | |
| Net Rental Income | | $10,914,762 | $11,718,425 | $9,918,818 | $10,753,290 | $11,097,929 | $12,786,419 | $67.39 | 100.0 | % |
| Other Income(3) | | 26,582 | 92,100 | 84,151 | 75,576 | 77,011 | 80,000 | 0.42 | 0.6 | |
| (Vacancy/Credit Loss) | | 0 | 0 | 0 | 0 | 0 | (1,598,302) | (8.42) | (12.5 | ) |
| Effective Gross Income | | $10,941,344 | $11,810,525 | $10,002,969 | $10,828,866 | $11,174,940 | $11,268,117 | $59.39 | 88.1 | % |
| Management Fee | | 359,766 | 330,204 | 309,335 | 318,786 | 351,509 | 338,043 | 1.78 | 3.0 | |
| Real Estate Taxes | | 1,343,484 | 1,522,719 | 1,629,467 | 1,793,562 | 1,971,444 | 2,079,892 | 10.96 | 18.5 | |
| Insurance | | 66,156 | 82,921 | 93,478 | 89,148 | 99,233 | 117,581 | 0.62 | 1.0 | |
| Other Expenses(4) | | 1,063,012 | 1,053,966 | 1,036,545 | 1,034,179 | 1,053,248 | 1,287,346 | 6.79 | 11.4 | |
| Total Expenses | | $2,832,418 | $2,989,810 | $3,068,825 | $3,235,675 | $3,475,434 | $3,822,862 | $20.15 | 33.9 | % |
| Net Operating Income | | $8,108,926 | $8,820,715 | $6,934,144 | $7,593,191 | $7,699,506 | $7,445,254 | $39.24 | 66.1 | % |
| Total TI/LC, Capex/RR | | 0 | 0 | 0 | 0 | 0 | 396,854 | 2.09 | 3.5 | |
| Net Cash Flow | | $8,108,926 | $8,820,715 | $6,934,144 | $7,593,191 | $7,699,506 | $7,048,400 | $37.15 | 62.6 | % |
| (1) | Revenue-related figures are calculated as a % of Net Rental Income. Total Expenses, Net Operating Income, Total TI/LC, Capex/RR and Net Cash Flow are calculated as a % of Effective Gross Income. |
| (2) | Underwritten Rents in Place is based on the underwritten rent roll dated October 1, 2023, inclusive of rent steps through November 2024. |
| (3) | Underwritten Other Income includes sprinkler income, water income, air conditioning income and miscellaneous income. |
| (4) | Other Expenses include payroll and benefits, repairs and maintenance, utilities, contract services, legal and professional, and general and administrative expenses. |
THE INFORMATION IN THIS STRUCTURAL AND COLLATERAL TERM SHEET IS NOT COMPLETE AND MAY BE AMENDED PRIOR TO THE TIME OF SALE. THIS TERM SHEET IS NOT AN OFFER TO SELL THESE SECURITIES AND IT IS NOT A SOLICITATION OF AN OFFER TO BUY THESE SECURITIES IN ANY JURISDICTION WHERE THE OFFER OR SALE IS NOT PERMITTED. |
| | 127 | |
| Structural and Collateral Term Sheet | | BMO 2024-5C3 |
| No. 9 – 111 West 19th Street |
The Market. The 111 West 19th Street Property is located in New York, New York, in the Midtown South office market and the Chelsea office submarket of Manhattan. According to the appraisal, New York City has a population of approximately 8.8 million people and a median annual household income of $70,044. Since the second quarter of 2020, 165,100 jobs have been introduced to Manhattan offices leading to a total of 1.5 million office jobs in the overall market, which surpasses the previous peak in February 2020.
The Midtown South office market is the smallest market within the greater Manhattan office market with approximately 69.1 million square feet in inventory. Fashion art, advertising, and technology industries have migrated to Midtown South in recent years as the workplace environment includes loft spaces and large floor plans which is more desired by companies in creative industries rather than tall glass towers in other Manhattan markets.
According to the appraisal, as of the third quarter of 2023, the Chelsea office submarket had a total inventory of approximately 17.2 million square feet, an overall vacancy rate of 23.0% and an overall asking rent of $74.02 per square foot.
The Borrower. The borrower is 19th Street Owner LLC, a Delaware limited liability company with one independent director. Legal counsel to the borrower delivered a non-consolidation opinion in connection with the origination of the 111 West 19th Street Mortgage Loan.
The Borrower Sponsor. The borrower sponsor and non-recourse carveout guarantor is Steven Kaufman. The Kaufman Organization, led by Steven Kaufman, is a three-generation, family-owned and operated New York-based real estate firm with approximately 48 properties in the New York metro area.
Property Management. The 111 West 19th Street Property is managed by Kaufman Management Company, L.L.C., an affiliate of the borrower sponsor.
Escrows and Reserves. At origination of the 111 West 19th Street Mortgage Loan, the borrower deposited approximately: (i) $360,289 into a tax reserve, (ii) $3,000,000 into a tenant improvement and leasing commission reserve, (iii) $22,500 into an immediate repairs reserve, and (iv) $3,384,905 into a building improvements reserve.
Tax Reserve – The borrower is required to deposit into a real estate tax reserve, on a monthly basis, 1/12 of the taxes that the lender estimates will be payable over the next-ensuing 12-month period (initially estimated to be approximately $180,144).
Insurance Reserve – The borrower is required to deposit into an insurance reserve, on a monthly basis, 1/12 of the amount which will be sufficient to pay the insurance premiums due for the renewal of coverage afforded by such policies; provided, however, such insurance reserve has been conditionally waived so long as the borrower maintains a blanket policy meeting the requirements of the 111 West 19th Street Mortgage Loan documents.
Replacement Reserve – The borrower is required to deposit into a replacement reserve, on a monthly basis, $3,162.
TI / LC Reserve – Following a Leasing Reserve Replenishment Trigger (as defined below), the borrower is required to deposit into a tenant improvement and leasing commission reserve, on a monthly basis, an amount equal to $31,622 (provided that no such monthly deposits are required to the extent that the same would cause the balance to exceed $3,000,000).
Building Improvements Reserve – The lender will disburse the building improvement reserve funds for replacements (including “make ready” or “spec space” buildout) in the same manner as disbursements are made from the replacement reserve account. Provided no Trigger Period (as defined below) has occurred and is continuing, in the event the borrower enters into a lease with Ripple prior to April 1, 2024 in accordance with the 111 West 19th Street Mortgage Loan documents, lender will (i) transfer a portion of the building improvements reserve account to the tenant improvement and leasing commission reserve account so that the balance of the tenant improvement and leasing commission reserve account equals $4,000,000, (ii) retain in the building improvements reserve account an amount equal to $966,000 representing the free rent credit anticipated to be owed by borrower to Ripple pursuant to its lease, which amount will be disbursed monthly in February, March, April, May, June, July, August and September 2024, in each case, in the amount of $120,750, and (iii) disburse the remaining portion of the building improvement reserve funds to the borrower.
THE INFORMATION IN THIS STRUCTURAL AND COLLATERAL TERM SHEET IS NOT COMPLETE AND MAY BE AMENDED PRIOR TO THE TIME OF SALE. THIS TERM SHEET IS NOT AN OFFER TO SELL THESE SECURITIES AND IT IS NOT A SOLICITATION OF AN OFFER TO BUY THESE SECURITIES IN ANY JURISDICTION WHERE THE OFFER OR SALE IS NOT PERMITTED. |
| | 128 | |
| Structural and Collateral Term Sheet | | BMO 2024-5C3 |
| No. 9 – 111 West 19th Street |
Lockbox / Cash Management The 111 West 19th Street Mortgage Loan is structured with a hard lockbox and springing cash management. The borrower is required to, and is required to cause the property manager to, immediately deposit all revenue directly into a lender approved lockbox account. Within three business days of receipt of a notice from Capital One, National Association, stating that the post office box referenced in the lockbox account agreement is available to receive physical checks, the borrower was required to deliver a notice to the tenants at the 111 West 19th Street Property directing them to remit all payments due under the applicable lease directly to the lender-controlled lockbox. All funds deposited into the lockbox are required to be transferred on each business day to or at the direction of the borrower unless a Trigger Period exists. Upon the occurrence and during the continuance of a Trigger Period, and provided that lender elects (in its sole and absolute discretion) to deliver a restricted account notice, all funds in the lockbox account are required to be swept on each business day to a cash management account under the control of the lender to be applied and disbursed in accordance with the 111 West 19th Street Mortgage Loan documents, and all excess cash flow funds remaining in the cash management account after the application of such funds in accordance with the 111 West 19th Street Mortgage Loan documents are required to be held by the lender in an excess cash flow reserve account as additional collateral for the 111 West 19th Street Mortgage Loan. Upon the cure of the applicable Trigger Period, so long as no other Trigger Period exists, the lender is required to return any amounts remaining on deposit in the excess cash flow reserve account to the borrower. Upon an event of default under the 111 West 19th Street Mortgage Loan documents, the lender may apply funds to the debt in such priority as it may determine.
“Leasing Reserve Replenishment Trigger” means the balance of the leasing reserve funds on deposit in the leasing reserve account is less than $2,000,000.
A “Trigger Period” means a period (A) commencing upon the earliest of (i) the occurrence and continuance of an event of default and/or (ii) the debt service coverage ratio being less than 1.45x, and (B) expiring upon (x) with regard to any Trigger Period commenced in connection with clause (i) above, the cure (if applicable) of such event of default, and (y) with regard to any Trigger Period commenced in connection with clause (ii) above, the date that the debt service coverage ratio is equal to or greater than 1.45x for two consecutive calendar quarters.
Subordinate Debt. None.
Mezzanine Debt. None.
Partial Release. Not Permitted.
Ground Lease. None.
THE INFORMATION IN THIS STRUCTURAL AND COLLATERAL TERM SHEET IS NOT COMPLETE AND MAY BE AMENDED PRIOR TO THE TIME OF SALE. THIS TERM SHEET IS NOT AN OFFER TO SELL THESE SECURITIES AND IT IS NOT A SOLICITATION OF AN OFFER TO BUY THESE SECURITIES IN ANY JURISDICTION WHERE THE OFFER OR SALE IS NOT PERMITTED. |
| | 129 | |
| Structural and Collateral Term Sheet | | BMO 2024-5C3 |
| No. 10 – 333 South Spruce Street |
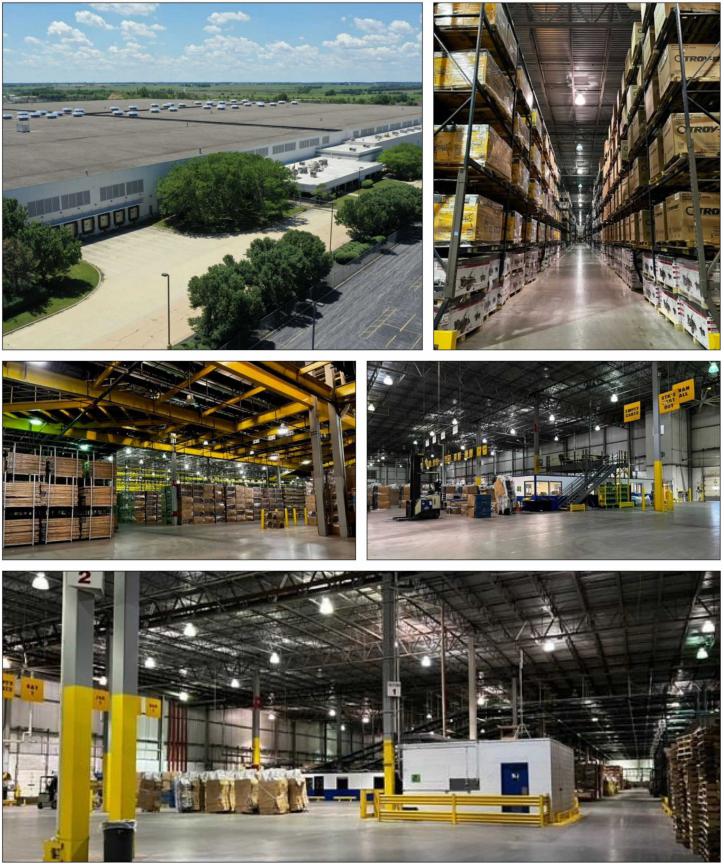
THE INFORMATION IN THIS STRUCTURAL AND COLLATERAL TERM SHEET IS NOT COMPLETE AND MAY BE AMENDED PRIOR TO THE TIME OF SALE. THIS TERM SHEET IS NOT AN OFFER TO SELL THESE SECURITIES AND IT IS NOT A SOLICITATION OF AN OFFER TO BUY THESE SECURITIES IN ANY JURISDICTION WHERE THE OFFER OR SALE IS NOT PERMITTED. |
| | 130 | |
| Structural and Collateral Term Sheet | | BMO 2024-5C3 |
| No. 10 – 333 South Spruce Street |
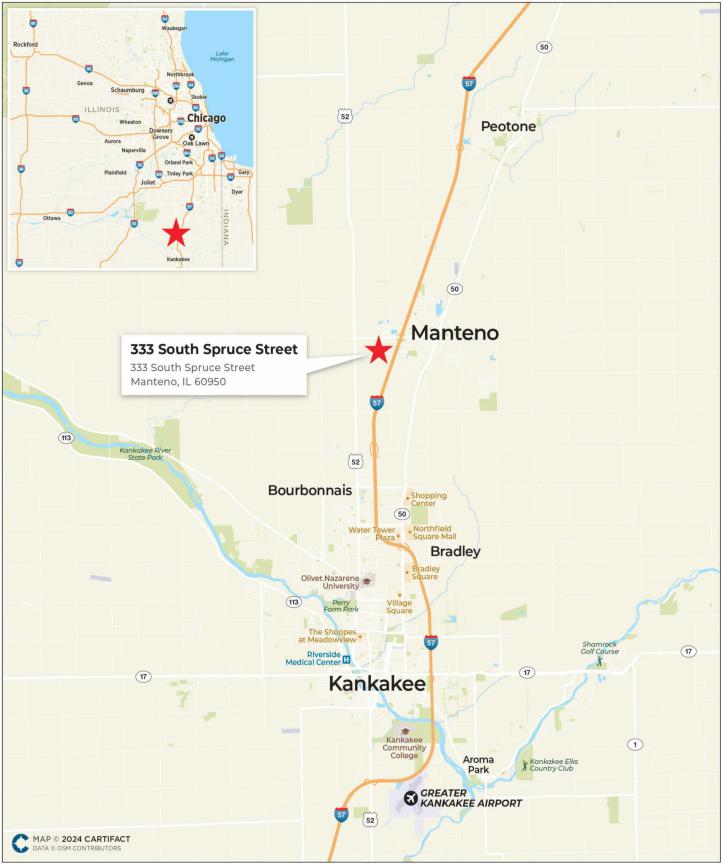
THE INFORMATION IN THIS STRUCTURAL AND COLLATERAL TERM SHEET IS NOT COMPLETE AND MAY BE AMENDED PRIOR TO THE TIME OF SALE. THIS TERM SHEET IS NOT AN OFFER TO SELL THESE SECURITIES AND IT IS NOT A SOLICITATION OF AN OFFER TO BUY THESE SECURITIES IN ANY JURISDICTION WHERE THE OFFER OR SALE IS NOT PERMITTED. |
| | 131 | |
| Structural and Collateral Term Sheet | | BMO 2024-5C3 |
| No. 10 – 333 South Spruce Street |
| Mortgage Loan Information | | Property Information |
| Mortgage Loan Seller: | CREFI | | Single Asset / Portfolio: | Single Asset |
| Original Principal Balance(1): | $28,750,000 | | Title: | Fee |
| Cut-off Date Principal Balance(1): | $28,750,000 | | Property Type – Subtype: | Industrial – Warehouse/Distribution |
| % of IPB: | 3.2% | | Net Rentable Area (SF): | 1,546,575 |
| Loan Purpose: | Acquisition | | Location: | Manteno, IL |
| Borrower: | 333 South Spruce LLC | | Year Built / Renovated: | 1991 / NAP |
| Borrower Sponsor: | Gotion, Inc. | | Occupancy: | 100.0% |
| Interest Rate: | 6.60000% | | Occupancy Date: | 2/6/2024 |
| Note Date: | 12/15/2023 | | 4th Most Recent NOI (As of)(4): | NAV |
| Maturity Date: | 1/6/2029 | | 3rd Most Recent NOI (As of)(4): | NAV |
| Interest-only Period: | 60 months | | 2nd Most Recent NOI (As of)(4): | NAV |
| Original Term: | 60 months | | Most Recent NOI (As of)(4): | NAV |
| Original Amortization Term: | None | | UW Economic Occupancy: | 95.0% |
| Amortization Type: | Interest Only | | UW Revenues: | $9,149,706 |
| Call Protection: | L(4),YM1(49),O(7) | | UW Expenses: | $274,491 |
| Lockbox / Cash Management: | Hard / Springing | | UW NOI: | $8,875,215 |
| Additional Debt(1): | Yes | | UW NCF: | $8,720,558 |
| Additional Debt Balance(1): | $50,000,000 | | Appraised Value / Per SF: | $140,700,000 / $91 |
| Additional Debt Type(1): | Pari Passu | | Appraisal Date: | 10/20/2023 |
| | | | | |
| Escrows and Reserves(2) | | Financial Information(1) |
| | Initial | Monthly | Initial Cap | | | Whole Loan |
| Taxes: | $425,726 | $85,145 | N/A | | Cut-off Date Loan / SF: | $51 | |
| Insurance: | $217,592 | $217,592 | N/A | | Maturity Date Loan / SF: | $51 | |
| Replacement Reserves: | $950,000 | $12,888 | N/A | | Cut-off Date LTV: | 56.0% | |
| TI/LC: | $0 | Springing | N/A | | Maturity Date LTV: | 56.0% | |
| Deferred Maintenance: | $40,625 | $0 | N/A | | UW NCF DSCR: | 1.65x | |
| Other(3): | $9,356,000 | $0 | N/A | | UW NOI Debt Yield: | 11.3% | |
| | | | | | | |
| Sources and Uses |
| Sources | Proceeds | % of Total | | Uses | Proceeds | % of Total |
| Whole Loan(1) | $78,750,000 | 47.6 | % | | Purchase Price | $139,500,000 | 84.4 | % |
| Sponsor Equity | 77,225,947 | 46.7 | | | Closing Costs(5) | 14,842,004 | 9.0 | |
| Other Sources(3) | 9,356,000 | 5.7 | | | Upfront Reserves(3) | 10,989,943 | 6.6 | |
| | | | | | | |
| Total Sources | $165,331,947 | 100.0 | % | | Total Uses | $165,331,947 | 100.0 | % |
| (1) | The 333 South Spruce Street Mortgage Loan (as defined below) is part of the 333 South Spruce Street Whole Loan (as defined below) which is comprised of two pari passu promissory notes with an aggregate original principal balance and Cut-off Date Balance of $78,750,000. The 333 South Spruce Street Whole Loan was originated by Citi Real Estate Funding Inc. (“CREFI”). The Financial Information in the chart above is based on the aggregate outstanding principal balance of the 333 South Spruce Street Whole Loan. |
| (2) | For a full description of Escrows and Reserves, see "Escrows and Reserves" below. |
| (3) | Initial Other reserves and Other Sources represent a $9,356,000 security deposit reserve in the form of a letter of credit which accounts for approximately one-year’s rent from the sole tenant at the 333 South Spruce Street Property (as defined below). |
| (4) | Historical financials are not available because the 333 South Spruce Street Property (as defined below) was recently acquired and subsequently leased to an affiliate of the borrower in December 2023. |
| (5) | Closing Costs includes an interest rate buydown fee of $3,937,500. |
THE INFORMATION IN THIS STRUCTURAL AND COLLATERAL TERM SHEET IS NOT COMPLETE AND MAY BE AMENDED PRIOR TO THE TIME OF SALE. THIS TERM SHEET IS NOT AN OFFER TO SELL THESE SECURITIES AND IT IS NOT A SOLICITATION OF AN OFFER TO BUY THESE SECURITIES IN ANY JURISDICTION WHERE THE OFFER OR SALE IS NOT PERMITTED. |
| | 132 | |
| Structural and Collateral Term Sheet | | BMO 2024-5C3 |
| No. 10 – 333 South Spruce Street |
The Loan. The tenth largest mortgage loan (the “333 South Spruce Street Mortgage Loan”) is part of a whole loan (the “333 South Spruce Street Whole Loan”) secured by the borrower’s fee interest in an industrial warehouse and distribution center totaling 1,546,575 square feet located in Manteno, Illinois (the “333 South Spruce Street Property”). The 333 South Spruce Street Whole Loan is comprised of two pari passu notes, with an aggregate outstanding principal balance as of the Cut-off Date of $78,750,000. The 333 South Spruce Street Whole Loan was originated on December 15, 2023 by CREFI and accrues interest at a fixed rate of 6.60000% per annum. The 333 South Spruce Street Whole Loan has an initial term of five-years and is interest-only for the full term. The scheduled maturity date of the 333 South Spruce Street Whole Loan is the payment date that occurs on January 6, 2029. The 333 South Spruce Street Mortgage Loan is evidenced by the non-controlling Note A-2 with an outstanding principal balance as of the Cut-off Date of $28,750,000.
The table below identifies the promissory notes that comprise the 333 South Spruce Street Whole Loan. The relationship between the holders of the 333 South Spruce Street Whole Loan will be governed by a co-lender agreement as described under “Description of the Mortgage Pool—The Whole Loans—The Outside Serviced Pari Passu Whole Loans” in the Preliminary Prospectus. The 333 South Spruce Street Whole Loan is expected to be serviced pursuant to the pooling and servicing agreement for the Benchmark 2024-V5 securitization trust. See “The Pooling and Servicing Agreement—Servicing of the Outside Serviced Mortgage Loans” in the Preliminary Prospectus.
| Whole Loan Summary |
| Note | Original Balance | Cut-off Date Balance | Note Holder | Controlling Piece |
| A-1 | | $50,000,000 | | | $50,000,000 | | Benchmark 2024-V5 | Yes |
| A-2 | | $28,750,000 | | | $28,750,000 | | BMO 2024-5C3 | No |
| Whole Loan | | $78,750,000 | | | $78,750,000 | | | |
The Property. The 333 South Spruce Street Property is a 1,546,575 square foot Class A industrial warehouse and distribution facility located at 333 South Spruce Street in Manteno, Illinois. The 333 South Spruce Street Property is located off Interstate 57, approximately 50 miles south of Chicago, Illinois. As of February 6, 2024, the 333 South Spruce Street Property was 100.0% leased to Gotion Illinois New Energy, Inc. (“Gotion”), which commenced a 15-year triple-net lease in December 2023 with a scheduled expiration date of November 30, 2038 and no termination options. The nonrecourse carveout guarantor, Gotion, Inc., a California corporation, an affiliate of the borrower, delivered a guaranty of such lease. The 333 South Spruce Street Property was constructed in 1991 and is situated on an approximately 153.0-acre site. The 333 South Spruce Street Property consists of a single-story facility that features 35’ clear heights, 88 exterior docks, three drive-in doors and 981 concrete paved truck trailer stalls. The 333 South Spruce Street Property also contains office space which comprises approximately 1.0% of net rentable area and a 250 square foot guard house. The 333 South Spruce Street Property also contains 586 parking spaces resulting in a parking ratio of 0.38 spaces per 1,000 square feet.
Sole Tenant. The 333 South Spruce Street Property is 100.0% occupied to a single tenant, Gotion, an affiliate of the borrower, that is pursuant to a triple-net lease with a commencement date of December 1, 2023, and a scheduled expiration date of November 30, 2038. The Gotion lease has one, five-year renewal option and no termination options. Gotion specializes in the design and manufacturing of lithium-ion powered batteries and clean energy storage applications. Gotion is expected specifically to focus on lithium-ion battery cells for electric vehicles at the 333 South Spruce Street Property.
Appraisal. According to the appraisal, the 333 South Spruce Street Property had an “as-is” appraised value of $140,700,000 as of October 20, 2023 and a hypothetical market value “as dark” of $112,200,000 as of October 20, 2023. The table below shows the appraiser’s “as-is” conclusions. Based on the “as dark” value of $112,200,000, the Cut-off Date LTV and Maturity Date LTV for the 333 South Spruce Street Whole Loan are 70.2%.
| 333 South Spruce Street Appraised Value(1) |
| Property | Value | Capitalization Rate |
| 333 South Spruce Street | $140,700,000 | 6.50% |
Environmental. According to the Phase I environmental report, dated August 8, 2023, there was no evidence of any recognized environmental conditions at the 333 South Spruce Street Property.
THE INFORMATION IN THIS STRUCTURAL AND COLLATERAL TERM SHEET IS NOT COMPLETE AND MAY BE AMENDED PRIOR TO THE TIME OF SALE. THIS TERM SHEET IS NOT AN OFFER TO SELL THESE SECURITIES AND IT IS NOT A SOLICITATION OF AN OFFER TO BUY THESE SECURITIES IN ANY JURISDICTION WHERE THE OFFER OR SALE IS NOT PERMITTED. |
| | 133 | |
| Structural and Collateral Term Sheet | | BMO 2024-5C3 |
| No. 10 – 333 South Spruce Street |
The following table presents certain information relating to the historical and current occupancy of the 333 South Spruce Street Property:
| Current Occupancy(1)(2) |
| 100.0% |
| (1) | Based on the underwritten rent roll dated February 6, 2024. |
| (2) | Historical occupancy is not available because the borrower sponsor acquired and subsequently leased the 333 South Spruce Street Property to an affiliate of the borrower in December 2023. |
The following table presents certain information relating to the sole tenant at the 333 South Spruce Street Property:
| Tenant Summary(1) |
Tenant | Credit Rating (Moody’s/
S&P/Fitch) | Net Rentable Area (SF) | % of Net Rentable Area | UW
Base Rent | UW Base Rent
Per SF | % of Total UW Base Rent | Lease Expiration | Termination Option (Y/N) | Renewal Option |
| Gotion | NR/NR/NR | 1,546,575 | 100.0 | % | $9,356,779 | $6.05 | 100.0% | 11/30/2038 | N | 1 x 5 Yr |
| Total Occupied | | 1,546,575 | 100.0 | % | $9,356,779 | $6.05 | 100.0% | | | |
| Vacant | | 0 | 0.0 | | | | | | | |
| Total | | 1,546,575 | 100.0 | % | | | | | | |
| (1) | Based on the underwritten rent roll dated February 6, 2024. |
The following table presents certain information relating to tenant lease expirations at the 333 South Spruce Street Property:
| Lease Rollover Schedule(1) |
| Year | Number of Leases Expiring | Net Rentable Area Expiring | % of NRA Expiring | UW Base Rent Expiring | % of UW Base Rent Expiring | Cumulative Net Rentable Area Expiring | Cumulative % of NRA Expiring | Cumulative UW Base Rent Expiring | Cumulative % of UW Base Rent Expiring |
| Vacant | 0 | 0 | 0.0% | NAP | NAP | 0 | 0.0% | NAP | NAP |
| 2024 & MTM | 0 | 0 | 0.0% | $0 | 0.0% | 0 | 0.0% | $0 | 0.0% |
| 2025 | 0 | 0 | 0.0% | 0 | 0.0% | 0 | 0.0% | $0 | 0.0% |
| 2026 | 0 | 0 | 0.0% | 0 | 0.0% | 0 | 0.0% | $0 | 0.0% |
| 2027 | 0 | 0 | 0.0% | 0 | 0.0% | 0 | 0.0% | $0 | 0.0% |
| 2028 | 0 | 0 | 0.0% | 0 | 0.0% | 0 | 0.0% | $0 | 0.0% |
| 2029 | 0 | 0 | 0.0% | 0 | 0.0% | 0 | 0.0% | $0 | 0.0% |
| 2030 | 0 | 0 | 0.0% | 0 | 0.0% | 0 | 0.0% | $0 | 0.0% |
| 2031 | 0 | 0 | 0.0% | 0 | 0.0% | 0 | 0.0% | $0 | 0.0% |
| 2032 | 0 | 0 | 0.0% | 0 | 0.0% | 0 | 0.0% | $0 | 0.0% |
| 2033 | 0 | 0 | 0.0% | 0 | 0.0% | 0 | 0.0% | $0 | 0.0% |
| 2034 | 0 | 0 | 0.0% | 0 | 0.0% | 0 | 0.0% | $0 | 0.0% |
| 2035 & Beyond | 1 | 1,546,575 | 100.0% | 9,356,779 | 100.0% | 1,546,575 | 100.0% | 9,356,779 | 100.0% |
| Total | 1 | 1,546,575 | 100.0% | $9,356,779 | 100.0% | | | | |
| (1) | Based on the underwritten rent roll dated February 6, 2024. |
THE INFORMATION IN THIS STRUCTURAL AND COLLATERAL TERM SHEET IS NOT COMPLETE AND MAY BE AMENDED PRIOR TO THE TIME OF SALE. THIS TERM SHEET IS NOT AN OFFER TO SELL THESE SECURITIES AND IT IS NOT A SOLICITATION OF AN OFFER TO BUY THESE SECURITIES IN ANY JURISDICTION WHERE THE OFFER OR SALE IS NOT PERMITTED. |
| | 134 | |
| Structural and Collateral Term Sheet | | BMO 2024-5C3 |
| No. 10 – 333 South Spruce Street |
The following table presents certain information relating to the underwritten cash flows at the 333 South Spruce Street Property:
| Underwritten Net Cash Flow(1)(2) |
| | Underwritten | Per Square Foot | %(3) |
| Base Rent | $9,356,779 | | $6.05 | | 97.2% |
| Gross Potential Rent | $9,356,779 | | $6.05 | | 97.2% |
| Total Reimbursements | 274,491 | | 0.18 | | 2.8 |
| Total Gross Income | $9,631,270 | | $6.23 | | 100.0% |
| Vacancy / Credit Loss | (481,563) | | (0.31) | | (5.0) |
| Effective Gross Income | $9,149,706 | | $5.92 | | 100.0% |
| Management Fee | 274,491 | | 0.18 | | 3.0 |
| Real Estate Taxes | 0 | | 0.00 | | 0.0 |
| Insurance | 0 | | 0.00 | | 0.0 |
| Total Expenses(4) | $274,491 | | $0.18 | | 3.0% |
| Net Operating Income | $8,875,215 | | $5.74 | | 97.0% |
| Capital Expenditures | 154,658 | | 0.10 | | 1.7 |
| TI/LC | 0 | | 0.00 | | 0.0 |
| Net Cash Flow | $8,720,558 | | $5.64 | | 95.3% |
| (1) | Based on the underwritten rent roll dated as of February 6, 2024. |
| (2) | Historical financial information is not available because the borrower sponsor acquired and subsequently leased the 333 South Spruce Street Property to an affiliate of the borrower in December 2023. |
| (3) | % column represents percent of Total Gross Income for all revenue lines and Vacancy / Credit Loss and represents percent of Effective Gross Income for the remainder of fields. |
| (4) | Total Expenses are underwritten based on Gotion’s absolute triple-net lease. As a result there are no underwritten real estate taxes or insurance. |
The Market. The 333 South Spruce Street Property is located in Manteno, Illinois within Kankakee County. Kankakee County is approximately 50 miles south of Chicago, Illinois. The 333 South Spruce Street Property is located in the Manteno City submarket within the Kankakee Metropolitan Statistical Area (“MSA”). Primary access to the 333 South Spruce Street Property is provided by Route 17 and Route 50, which are both primary commercial roads. Route 17 and Route 50 intersect Interstate 57 which serves as a major north/south route from Chicago, Illinois. The Interstate 57 corridor includes warehouse and distribution facilities for Amazon, Clorox and J.M. Smucker Company.
According to a third-party market research report, the 333 South Spruce Street Property is located within the Kankakee Industrial Market which reported a total inventory of approximately 13.5 million square feet of industrial space, a vacancy rate of 2.9% and average year to date rental rates as of September 2023 of $5.58 per square foot. There have been 100,000 square feet of net deliveries within the Kankakee Industrial Market over the past three years and there are no projects currently underway.
The Kankakee MSA’s major industries include manufacturing, food processing and pharmaceutical production. The three largest employers in the MSA are Riverside HealthCare, CSL Behring and Shapiro Development Center. According to the appraisal, the 2023 total population within a one-, three- and five-mile radius is 2,152, 10,086 and 19,862, respectively. Furthermore, the 2023 average household income within a one-, three- and five-mile radius is $124,383, $98,658 and $103,416, respectively.
THE INFORMATION IN THIS STRUCTURAL AND COLLATERAL TERM SHEET IS NOT COMPLETE AND MAY BE AMENDED PRIOR TO THE TIME OF SALE. THIS TERM SHEET IS NOT AN OFFER TO SELL THESE SECURITIES AND IT IS NOT A SOLICITATION OF AN OFFER TO BUY THESE SECURITIES IN ANY JURISDICTION WHERE THE OFFER OR SALE IS NOT PERMITTED. |
| | 135 | |
| Structural and Collateral Term Sheet | | BMO 2024-5C3 |
| No. 10 – 333 South Spruce Street |
The following table presents certain market information with respect to the 333 South Spruce Street Property:
| Summary of Comparable Sales(1) |
| Address | Sale Date | Sale Price | Square Feet | Price per SF |
333 South Spruce Street Manteno, Illinois | Dec – 2023 | $139,500,000 | 1,546,575 SF(2) | $90.20 |
3835 Youngs Road Channahon, Illinois | Jan – 2022 | $96,750,000 | 906,517 SF | $106.73 |
25101 South Ridgeland Avenue Monee, Illinois | Apr – 2022 | $85,924,058 | 879,090 SF | $97.74 |
1669 Elijah Creek Road Hebron, Kentucky | Sep – 2022 | $63,005,250 | 600,050 SF | $105.00 |
81 & 89 Forest Road Franklin, Indiana | May – 2022 | $78,250,000 | 948,000 SF | $82.54 |
6531 Cochran Road Solon, Ohio | Jan – 2021 | $26,000,000 | 302,022 SF | $86.09 |
| (2) | Based on the underwritten rent roll dated February 6, 2024. |
The Borrower. The borrower is 333 South Spruce LLC, a Delaware limited liability company and single purpose entity having at least one independent director in its organizational structure. Legal counsel to the borrower delivered a non-consolidation opinion in connection with the origination of the 333 South Spruce Street Whole Loan.
The Borrower Sponsor. The borrower sponsor and non-recourse carveout guarantor is Gotion. See “Sole Tenant” for more information.
Property Management. The 333 South Spruce Street Property is self-managed.
Escrows and Reserves. At origination of the 333 South Spruce Street Whole Loan, the borrower deposited: (i) approximately $425,726 into a tax reserve, (ii) approximately $217,592 into an insurance reserve, (iii) $950,000 into a replacement reserve, and (iv) $40,625 into an immediate repairs reserve. In addition, at origination of the 333 South Spruce Street Whole Loan, the borrower was required to deliver to lender (to be deposited into a security deposit reserve) all security deposits (and any interest theretofore earned thereon) under all leases at the 333 South Spruce Street Property, and, if requested by the lender, all letters of credit delivered in lieu of a cash security deposit assigned with full power of attorney and executed sight drafts. At origination the letter of credit totaled $9,356,000.
Tax Reserve – The borrower is required to deposit into a real estate tax reserve, on a monthly basis, 1/12 of the taxes that the lender estimates will be payable over the next-ensuing 12-month period (initially estimated to be approximately $85,145).
Insurance Reserve – The borrower is required to deposit into an insurance reserve, on a monthly basis, 1/12 of the amount which will be sufficient to pay the insurance premiums due for the renewal of coverage afforded by such policies (initially estimated to be approximately $217,592).
Replacement Reserve – The borrower is required to deposit into a replacement reserve, on a monthly basis, approximately $12,888.
TI / LC Reserve – During a Trigger Period (as defined below), the borrower is required to deposit into a TI/LC reserve, on a monthly basis, an amount equal to approximately $32,220.
Security Deposit Reserve – The borrower is required to deposit into the security deposit reserve all amounts drawn under any letter of credit held by the borrower in lieu of cash security deposits.
Lockbox / Cash Management The 333 South Spruce Street Whole Loan is structured with a hard lockbox and springing cash management. The borrower is required to, and is required to cause the property manager to, promptly deposit all rents
THE INFORMATION IN THIS STRUCTURAL AND COLLATERAL TERM SHEET IS NOT COMPLETE AND MAY BE AMENDED PRIOR TO THE TIME OF SALE. THIS TERM SHEET IS NOT AN OFFER TO SELL THESE SECURITIES AND IT IS NOT A SOLICITATION OF AN OFFER TO BUY THESE SECURITIES IN ANY JURISDICTION WHERE THE OFFER OR SALE IS NOT PERMITTED. |
| | 136 | |
| Structural and Collateral Term Sheet | | BMO 2024-5C3 |
| No. 10 – 333 South Spruce Street |
directly into a lender approved lockbox account. Within two business days of origination of the 333 South Spruce Street Whole Loan, the borrower was required to deliver a notice to the sole tenant at the 333 South Spruce Street Property directing the sole tenant to remit all payments under the applicable lease directly to the lender-controlled lockbox. All funds deposited into the lockbox are required to be transferred on each business day to or at the direction of the borrower unless a Trigger Period exists. Upon the occurrence and during the continuance of a Trigger Period, all funds in the lockbox account are required to be swept on each business day to a cash management account under the control of the lender to be applied and disbursed in accordance with the 333 South Spruce Street Whole Loan documents, and all excess cash flow funds remaining in the cash management account after the application of such funds in accordance with the 333 South Spruce Street Whole Loan documents are required to be held by the lender in an excess cash flow reserve account as additional collateral for the 333 South Spruce Street Whole Loan. Upon the cure of the applicable Trigger Period, so long as no other Trigger Period exists, the lender is required to return any amounts remaining on deposit in the excess cash flow reserve account to the borrower. Upon an event of default under the 333 South Spruce Street Whole Loan documents, the lender may apply funds to the debt in such priority as it may determine.
A “Trigger Period” means a period (A) commencing upon the earliest of (i) the occurrence and continuance of an event of default, (ii) the debt service coverage ratio falling below 1.20x (on an interest only basis), (iii) the occurrence of Specified Tenant Trigger Period (as defined below), (iv) the occurrence of a Performance Trigger (as defined below) and/or (v) any cancellation and/or termination of Tax Incentive Program (as defined below), any violation or breach of the terms and conditions of the 333 South Spruce Street Whole Loan documents concerning such Tax Incentive Program, and/or any event which would, directly or indirectly, cause a termination right, cause any termination fees to be due, or would cause a material adverse effect to occur under any Tax Incentive Program, and (B) expiring upon (a) with regard to any Trigger Period commenced in connection with clause (i) above, the cure (if applicable) of such event of default, (b) with regard to any Trigger Period commenced in connection with clause (ii) above, the date that the debt service coverage ratio is equal to or greater than 1.20x (on an interest only basis) for two consecutive calendar quarters, (c) with regard to any Trigger Period commenced in connection with clause (iii) above, a Specified Tenant Trigger Period ceasing to exist, (d) with regard to any Trigger Period commenced in connection with clause (iv) above, a Performance Trigger ceasing to exist for two consecutive calendar quarters, and (e) with regard to any Trigger Period commenced in connection with clause (v) above, the reinstatement of the applicable Tax Incentive Program, cure of the applicable violation or breach, and/or cure of any such event.
A “Specified Tenant” means (i) Gotion, together with any successor, (ii) any replacement tenant of Gotion approved in accordance with the 333 South Spruce Street Whole Loan documents and (iii) any parent or affiliate thereof providing credit support or a guaranty under the applicable related Specified Tenant lease.
A “Specified Tenant Trigger Period” means a period (A) commencing upon the earliest of (i) Specified Tenant being in monetary default or material non-monetary default under the applicable Specified Tenant lease beyond applicable notice and cure periods, (ii) Specified Tenant failing to be in actual, physical possession of the Specified Tenant space (or applicable portion thereof), or Specified Tenant failing to be open for business during customary hours and/or “going dark” in the Specified Tenant space (or applicable portion thereof), (iii) Specified Tenant subleasing any portion of the Specified Tenant space, (iv) Specified Tenant giving notice that it is terminating its lease for all or any portion of the Specified Tenant space (or applicable portion thereof), (v) any termination or cancellation of any Specified Tenant lease (including, without limitation, rejection in any bankruptcy or similar insolvency proceeding) and/or any Specified Tenant lease failing to otherwise be in full force and effect, and (vi) any bankruptcy or similar insolvency of Specified Tenant, and (B) expiring upon the first to occur of the lender’s receipt of evidence reasonably acceptable to the lender of (1) the satisfaction of the applicable Specified Tenant Cure Conditions (as defined below); or (2) the borrower leasing the entire Specified Tenant space (or applicable portion thereof) pursuant to one or more leases in accordance with the applicable terms and conditions of the 333 South Spruce Street Whole Loan documents, the applicable tenant(s) under such lease(s) being in actual, physical occupancy of the space demised, and, in the lender’s judgment, the applicable Specified Tenant Excess Cash Flow Condition (as defined below) is satisfied in connection therewith.
“Specified Tenant Cure Conditions” means (i) the lender’s receipt of reasonably satisfactory evidence that the Specified Tenant has cured all defaults under the applicable Specified Tenant lease and no other default under such Specified Tenant lease occurs for a period of three consecutive months following such cure, (ii) the applicable Specified Tenant is in actual, physical possession of the Specified Tenant space (or applicable portion thereof) and open for business during customary hours and not “dark” in the Specified Tenant space (or applicable portion thereof), (iii) the applicable Specified Tenant has revoked or rescinded all termination or cancellation notices with respect to the applicable Specified Tenant lease and has
THE INFORMATION IN THIS STRUCTURAL AND COLLATERAL TERM SHEET IS NOT COMPLETE AND MAY BE AMENDED PRIOR TO THE TIME OF SALE. THIS TERM SHEET IS NOT AN OFFER TO SELL THESE SECURITIES AND IT IS NOT A SOLICITATION OF AN OFFER TO BUY THESE SECURITIES IN ANY JURISDICTION WHERE THE OFFER OR SALE IS NOT PERMITTED. |
| | 137 | |
| Structural and Collateral Term Sheet | | BMO 2024-5C3 |
| No. 10 – 333 South Spruce Street |
re-affirmed the applicable Specified Tenant lease as being in full force and effect, (iv) if applicable, the Specified Tenant is no longer insolvent or subject to any bankruptcy or insolvency proceedings and has affirmed the applicable Specified Tenant lease pursuant to final, non-appealable order of a court of competent jurisdiction, and (v) the applicable Specified Tenant is paying full, unabated rent under the applicable Specified Tenant lease.
“Specified Tenant Excess Cash Flow Condition” means, with respect to curing any Specified Tenant Trigger Period by re-tenanting the applicable Specified Tenant space or renewal/extension of any Specified Tenant lease, sufficient funds have been accumulated in the excess cash flow account and the leasing reserve account (during the continuance of the subject Specified Tenant Trigger Period) to cover all anticipated leasing commissions, tenant improvement costs, tenant allowances, free rent periods, and/or rent abatement periods to be incurred in connection with any such re-tenanting or renewal/extension.
“Performance Trigger” means a period (A) commencing upon, as of any calendar month, the failure of Gotion to maintain trailing twelve-month revenues of at least $300,000,000, and (B) expiring upon Gotion maintaining trailing twelve-month revenues of at least $300,000,000 for two consecutive calendar quarters.
“Tax Incentive Program” means that certain Intergovernmental Agreement, dated August 31, 2023 and effective on or about the date of origination of the 333 South Spruce Street Mortgage Loan, by the governmental agencies party thereto, pursuant to which real estate taxes for the 333 South Spruce Street Property in excess of $2,000,000 in each tax year commencing with the 2024 tax year and ending with the 2053 tax year will be abated.
Subordinate Debt. None.
Mezzanine Debt. None.
Partial Release. Not Permitted.
Ground Lease. None.
THE INFORMATION IN THIS STRUCTURAL AND COLLATERAL TERM SHEET IS NOT COMPLETE AND MAY BE AMENDED PRIOR TO THE TIME OF SALE. THIS TERM SHEET IS NOT AN OFFER TO SELL THESE SECURITIES AND IT IS NOT A SOLICITATION OF AN OFFER TO BUY THESE SECURITIES IN ANY JURISDICTION WHERE THE OFFER OR SALE IS NOT PERMITTED. |
| | 138 | |
| Structural and Collateral Term Sheet | | BMO 2024-5C3 |
| No. 11 – Crescent Center |
| Mortgage Loan Information | | Property Information |
| Mortgage Loan Seller: | GCMC | | Single Asset / Portfolio: | Single Asset |
| Original Principal Balance(1): | $28,750,000 | | Title: | Fee |
| Cut-off Date Principal Balance(1): | $28,750,000 | | Property Type – Subtype: | Office – Suburban |
| % of IPB: | 3.2% | | Net Rentable Area (SF): | 356,188 |
| Loan Purpose: | Refinance | | Location: | Memphis, TN |
| Borrower: | Crescent Center Memphis, LLC | | Year Built / Renovated: | 1986 / 2001, 2020 |
| Borrower Sponsors: | David Long and Peggy Long | | Occupancy: | 87.6% |
| Interest Rate: | 7.51300% | | Occupancy Date: | 11/13/2023 |
| Note Date: | 9/22/2023 | | 4th Most Recent NOI (As of): | $3,755,295 (12/31/2020) |
| Maturity Date: | 10/6/2028 | | 3rd Most Recent NOI (As of): | $3,684,484 (12/31/2021) |
| Interest-only Period: | 60 months | | 2nd Most Recent NOI (As of): | $4,418,358 (12/31/2022) |
| Original Term: | 60 months | | Most Recent NOI (As of): | $5,070,098 (TTM 8/31/2023) |
| Original Amortization Term: | None | | UW Economic Occupancy: | 88.3% |
| Amortization Type: | Interest Only | | UW Revenues: | $10,935,948 |
| Call Protection: | L(28),D(25),O(7) | | UW Expenses: | $4,160,455 |
| Lockbox / Cash Management: | Hard / Springing | | UW NOI: | $6,775,493 |
| Additional Debt(1): | Yes | | UW NCF: | $6,163,117 |
| Additional Debt Balance(1): | $23,250,000 | | Appraised Value / Per SF: | $81,100,000 / $228 |
| Additional Debt Type(1): | Pari Passu | | Appraisal Date: | 8/3/2023 |
| | | | | |
| Escrows and Reserves | | Financial Information(1) |
| | Initial | Monthly | Initial Cap | | Cut-off Date Loan / SF: | $146 |
| Taxes: | $530,919 | $132,730 | N/A | | Maturity Date Loan / SF: | $146 |
| Insurance: | $92,115 | $9,211 | N/A | | Cut-off Date LTV: | 64.1% |
| Replacement Reserves: | $0 | $5,936 | N/A | | Maturity Date LTV: | 64.1% |
| TI/LC Reserve: | $500,000 | $53,428 | N/A | | UW NCF DSCR: | 1.56x |
| Other Reserves(2): | $1,308,459 | Springing(2) | N/A | | UW NOI Debt Yield: | 13.0% |
| | | | | | | |
| Sources and Uses |
| Sources | Proceeds | % of Total | | Uses | Proceeds | % of Total |
| Whole Loan(1) | $52,000,000 | 95.1 | % | | Loan Payoff | $49,625,707 | 90.8 | % |
| Borrower Sponsor Equity | 2,672,977 | 4.9 | | | Closing Costs(3) | 2,615,777 | 4.8 | |
| | | | | Reserves | 2,431,492 | 4.4 | |
| Total Sources | $54,672,977 | 100.0 | % | | Total Uses | $54,672,977 | 100.0 | % |
| (1) | The Crescent Center Mortgage Loan (as defined below) is part of a whole loan evidenced by six pari passu promissory notes with an aggregate original principal balance of $52,000,000 (the “Crescent Center Whole Loan”). The Financial Information in the chart above is based on the aggregate outstanding principal balance of the Crescent Center Whole Loan. |
| (2) | Other Reserves include (i) $1,079,540 for outstanding free rent relating to the Simmons Bank and Benefit Recovery Group, LLC leases and (ii) $228,919 for outstanding tenant improvements and leasing commissions. If the balance in the Simmons Bank free rent reserve is less than $475,750 on October 1, 2025, the borrower is required to deposit the amount necessary to cause the balance of funds in the reserve account to equal $475,750. |
| (3) | Closing Costs include an approximately $1.61 million interest rate buydown. |
The Loan. The eleventh largest mortgage loan (the “Crescent Center Mortgage Loan”) is part of a whole loan originated by GCMC on September 22, 2023 secured by the borrower’s fee interest in a 356,188 square foot office property located in Memphis, Tennessee (the “Crescent Center Property”). The Crescent Center Whole Loan consists of six pari passu notes and accrues interest at a rate of 7.51300% per annum. The Crescent Center Whole Loan has a five-year term and is interest-only for the term of the loan. The Crescent Center Mortgage Loan is evidenced by the controlling Note A-1 and the non-controlling Notes A-3 and A-4-1, which have an aggregate original and outstanding principal balance as of the Cut-off Date of $28,750,000. The remaining notes are currently held by GCMC and are expected to be contributed to one or more securitization trust(s). The relationship between the holders of the Crescent Center Whole Loan is governed by a co-lender agreement described under “Description of the Mortgage Pool – The Whole Loans – The Serviced Pari Passu Whole Loans” in the Preliminary Prospectus.
THE INFORMATION IN THIS STRUCTURAL AND COLLATERAL TERM SHEET IS NOT COMPLETE AND MAY BE AMENDED PRIOR TO THE TIME OF SALE. THIS TERM SHEET IS NOT AN OFFER TO SELL THESE SECURITIES AND IT IS NOT A SOLICITATION OF AN OFFER TO BUY THESE SECURITIES IN ANY JURISDICTION WHERE THE OFFER OR SALE IS NOT PERMITTED. |
| | 139 | |
| Structural and Collateral Term Sheet | | BMO 2024-5C3 |
| No. 11 – Crescent Center |
The table below identifies the promissory notes that comprise the Crescent Center Whole Loan:
| Whole Loan Summary |
| | Note | | Original Balance | Cut-off Date Balance | Note Holder | Controlling Piece |
| | A-1 | | | $15,000,000 | | | $15,000,000 | | BMO 2024-5C3 | Yes |
| | A-2(1) | | | $12,000,000 | | | $12,000,000 | | GCMC | No |
| | A-3 | | | $10,000,000 | | | $10,000,000 | | BMO 2024-5C3 | No |
| | A-4-1 | | | $3,750,000 | | | $3,750,000 | | BMO 2024-5C3 | No |
| | A-4-2(1) | | | $6,250,000 | | | $6,250,000 | | GCMC | No |
| | A-5(1) | | | $5,000,000 | | | $5,000,000 | | GCMC | No |
| | Whole Loan | | | $52,000,000 | | | $52,000,000 | | | |
| (1) | Expected to be contributed to one or more future securitization trust(s). |
The Property. The Crescent Center Property consists of a nine-story, Class A office building, two outparcel retail buildings and a parking garage located in Memphis, Tennessee totaling 356,188 square feet. The Crescent Center Property was constructed in 1986 and was acquired by the borrower sponsors in September 2021 for $67.5 million, after which they completed an approximately $2.7 million capital improvement project, which included a lobby upgrade, restroom renovations, and corridor work. Since acquisition, the borrower sponsors have executed new leases with five tenants, totaling 66,113 square feet, and 14 renewal and expansion leases, accounting for 60,854 square feet.
The Crescent Center Property consists of 331,406 square feet (93.0% of NRA) of office space, 18,177 square feet of outparcel retail space, 6,605 square feet of fitness center and storage space, and a four-story parking structure. The Crescent Center Property contains 1,014 garage parking spaces and 63 surface spaces. The Crescent Center Property is managed and leased by CBRE, Inc., the largest commercial property management company in the United States. The Crescent Center Property is 87.6% leased as of November 13, 2023 to a roster of 39 tenants. The three largest tenants at the Crescent Center Property are Butler Snow LLP (15.6% of NRA), Simmons Bank (12.4% of NRA) and Benefit Recovery Group, LLC (5.6% of NRA), with no additional tenant accounting for more than 4.9% of NRA. The outparcel retail spaces consist of GMRI, Inc. dba Seasons 52 (“Seasons 52”) and Capital Grille Holdings, Inc. (“Capital Grille”), two national chain restaurants that are part of Darden Restaurants, Inc. (rated Baa2/BBB/BBB by Moody’s/S&P/Fitch). Seasons 52 and Capital Grille each executed 10-year extensions in 2023, with expiration dates in 2034. The Crescent Center Property has maintained average occupancy of 89.8% since 2011.
Major Tenants.
Butler Snow LLP (55,581 square feet; 15.6% of NRA; 17.1% of underwritten base rent). Butler Snow LLP (“Butler Snow”) is an international law firm, and the largest law firm in Memphis, focused on business law and litigation, with clients ranging from emerging technology startups to Fortune 100 companies. Founded in 1954, and consisting of over 400 professionals in 28 locations, the firm practices include public finance, mass tort litigation / class action, real estate law and tax law.
Butler Snow currently occupies 55,581 square feet, including the entire fifth floor (40,237 square feet) and 14,949 square feet on the fourth floor of the Crescent Center Property. Butler Snow has been a tenant at the Crescent Center Property since 2002 and most recently executed a 128-month renewal in June 2020. The tenant has two, five-year renewal options remaining. Effective between September 1, 2027 and September 1, 2028, Butler Snow shall have the one-time right to reduce its space by up to 14,949 square feet located on the fourth floor of the Crescent Center Property, with 365 days’ notice and a fee equal to three months’ rent and unamortized leasing commissions, costs of landlord’s work and tenant improvement costs.
Simmons Bank (44,081 square feet; 12.4% of NRA; 14.2% of underwritten base rent). Simmons Bank (Moody’s/KBRA: Baa2/BBB+) Simmons Bank is a regional bank founded in 1903 and headquartered in Pine Bluff, Arkansas, with $27.6 billion in assets and over 200 locations in Arkansas, Kansas, Missouri, Oklahoma, Tennessee and Texas employing over 3,200 associates. In 2021, Simmons Bank acquired naming rights to Simmons Bank Liberty Stadium, current home to the University of Memphis Tigers football team and the Liberty Bowl.
THE INFORMATION IN THIS STRUCTURAL AND COLLATERAL TERM SHEET IS NOT COMPLETE AND MAY BE AMENDED PRIOR TO THE TIME OF SALE. THIS TERM SHEET IS NOT AN OFFER TO SELL THESE SECURITIES AND IT IS NOT A SOLICITATION OF AN OFFER TO BUY THESE SECURITIES IN ANY JURISDICTION WHERE THE OFFER OR SALE IS NOT PERMITTED. |
| | 140 | |
| Structural and Collateral Term Sheet | | BMO 2024-5C3 |
| No. 11 – Crescent Center |
Simmons Bank currently occupies 44,081 square feet of office space, including a 5,531 square foot first floor space operating as a retail bank branch, and an outparcel drive-through. Simmons Bank has been a tenant at the Crescent Center Property since 2022, when it entered into a new lease for 24,221 square feet on the ninth floor, and assumed and extended an existing lease to a prior tenant on the 5,531 square foot first floor space. Subsequently, Simmons Bank executed an expansion lease for an additional 14,329 square feet in March 2023, to occupy the entirety of the ninth floor and extend the term of its lease. Simmons Bank has one, five-year renewal option for its ninth floor space, and a termination option with respect to the 5,531 square foot first floor space effective August 31, 2028 with nine months’ prior notice and payment of a termination fee equal to three months’ rent and unamortized leasing commissions, any abated and/or free rent and tenant improvement costs, which was a legacy provision of the lease assumed by the prior tenant. The Simmons Bank lease also includes signage rights on the Crescent Center Property.
Benefit Recovery Group, LLC (19,864 square feet; 5.6% of NRA; 6.3% of underwritten base rent). Benefit Recovery Group, LLC (“Benefit Recovery Group”) is a health insurance subrogation company offering compensation recovery services across a number of industries. Headquartered at the Crescent Center Property, Benefit Recovery Group has over 20 years of experience in subrogation, utilizing a technology-optimized process to maximize recoveries for their clients.
Benefit Recovery Group executed its initial lease for 15,000 square feet at the Crescent Center Property in August 2023, and expanded by an additional 4,864 square feet in October 2023. Benefit Recovery Group has one, five-year renewal option and a one-time right to terminate its lease effective January 31, 2031 with nine months’ prior notice and payment of a termination fee equal to unamortized leasing commissions and tenant improvement costs.
Environmental. The Phase I environmental assessment dated August 17, 2023, recommended the development and implementation of an asbestos-containing materials Operation and Maintenance Plan, which is currently in place.
The following table presents certain information relating to the historical and current occupancy of the Crescent Center Property:
| Historical and Current Occupancy(1) |
| 2011 | 2012 | 2013 | 2014 | 2015 | 2016 | 2017 | 2018 | 2019 | 2020 | 2021 | 2022 | Current(2) |
| 89.0% | 88.0% | 90.0% | 94.0% | 99.0% | 96.0% | 96.0% | 97.0% | 92.7% | 80.8% | 71.5% | 86.0% | 87.6% |
| (1) | Historical occupancies are as of December 1 of each respective year for 2020-2022, and average occupancy for 2011-2019. |
| (2) | Current occupancy is based on the underwritten rent roll dated November 13, 2023. |
The following table presents certain information relating to the largest tenants at the Crescent Center Property:
| Tenant Summary(1) |
| Tenant | Ratings
Moody’s/S&P/Fitch(2) | Net Rentable Area (SF) | % of
Total NRA | UW Base Rent PSF | UW Base Rent | % of Total
UW Base Rent | Lease
Expiration Date(3) |
| Butler Snow LLP | NR/NR/NR | 55,581 | 15.6 | % | $32.35 | $1,798,209 | 17.1 | % | 6/30/2035 |
| Simmons Bank | Baa2/NR/NR | 44,081 | 12.4 | | $33.95 | 1,496,422 | 14.2 | | 1/31/2038 |
| Benefit Recovery Group, LLC | NR/NR/NR | 19,864 | 5.6 | | $33.23 | 660,081 | 6.3 | | 1/31/2034 |
| Diversified Trust Company | NR/NR/NR | 17,579 | 4.9 | | $34.87 | 612,942 | 5.8 | | 4/30/2033 |
| Wells Fargo Clearing Services | A1/BBB+/A+ | 15,637 | 4.4 | | $33.92 | 530,407 | 5.0 | | 4/30/2028 |
| Major Tenants | | 152,742 | 42.9 | % | $33.38 | $5,098,061 | 48.4 | % | |
| Other Tenants | | 159,357 | 44.7 | % | $34.05 | $5,426,573 | 51.6 | % | |
| Occupied Collateral Total / Wtd. Avg. | | 312,099 | 87.6 | % | $33.72 | $10,524,634 | 100.0 | % | |
| Vacant Space | | 44,089 | 12.4 | % | | | | |
| Collateral Total | | 356,188 | 100.0 | % | | | | |
| | | | | | | | |
| (1) | Information is based on the underwritten rent roll dated November 13, 2023, inclusive of rent steps through November 2024 and straight-line rent for Simmons Bank. |
| (2) | In certain instances, ratings provided are those of the parent company of the entity shown, whether or not the parent company guarantees the lease. |
| (3) | Certain tenants may have lease termination options that are exercisable prior to the originally stated expiration date of the subject lease. |
THE INFORMATION IN THIS STRUCTURAL AND COLLATERAL TERM SHEET IS NOT COMPLETE AND MAY BE AMENDED PRIOR TO THE TIME OF SALE. THIS TERM SHEET IS NOT AN OFFER TO SELL THESE SECURITIES AND IT IS NOT A SOLICITATION OF AN OFFER TO BUY THESE SECURITIES IN ANY JURISDICTION WHERE THE OFFER OR SALE IS NOT PERMITTED. |
| | 141 | |
| Structural and Collateral Term Sheet | | BMO 2024-5C3 |
| No. 11 – Crescent Center |
The following table presents certain information relating to the tenant lease expirations of the Crescent Center Property:
| Lease Rollover Schedule(1)(2) |
| Year | Number of Leases Expiring | Net Rentable Area Expiring | % of NRA Expiring | UW Base Rent Expiring | % of UW Base Rent Expiring | Cumulative Net Rentable Area Expiring | Cumulative % of NRA Expiring | Cumulative UW Base Rent Expiring | Cumulative % of UW Base Rent Expiring |
| Vacant | NAP | 44,089 | 12.4 | % | NAP | NA | P | 44,089 | 12.4% | | NAP | NAP | |
| 2023 & MTM | 1 | 1,024 | 0.3 | | $34,959 | 0.3 | % | 45,113 | 12.7% | | $34,959 | 0.3% | |
| 2024 | 3 | 14,535 | 4.1 | | 388,014 | 3.7 | | 59,648 | 16.7% | | $422,974 | 4.0% | |
| 2025 | 5 | 13,414 | 3.8 | | 479,507 | 4.6 | | 73,062 | 20.5% | | $902,481 | 8.6% | |
| 2026 | 10 | 37,312 | 10.5 | | 1,257,581 | 11.9 | | 110,374 | 31.0% | | $2,160,061 | 20.5% | |
| 2027 | 4 | 15,846 | 4.4 | | 549,916 | 5.2 | | 126,220 | 35.4% | | $2,709,977 | 25.7% | |
| 2028 | 3 | 20,122 | 5.6 | | 675,512 | 6.4 | | 146,342 | 41.1% | | $3,385,489 | 32.2% | |
| 2029 | 5 | 17,130 | 4.8 | | 570,003 | 5.4 | | 163,472 | 45.9% | | $3,955,493 | 37.6% | |
| 2030 | 1 | 3,952 | 1.1 | | 131,651 | 1.3 | | 167,424 | 47.0% | | $4,087,144 | 38.8% | |
| 2031 | 4 | 14,795 | 4.2 | | 452,374 | 4.3 | | 182,219 | 51.2% | | $4,539,518 | 43.1% | |
| 2032 | 1 | 7,311 | 2.1 | | 248,428 | 2.4 | | 189,530 | 53.2% | | $4,787,946 | 45.5% | |
| 2033 | 4 | 17,579 | 4.9 | | 612,942 | 5.8 | | 207,109 | 58.1% | | $5,400,888 | 51.3% | |
| 2034 | 4 | 38,041 | 10.7 | | 1,389,887 | 13.2 | | 245,150 | 68.8% | | $6,790,775 | 64.5% | |
| 2035 & Beyond | 11 | 111,038 | 31.2 | | 3,733,859 | 35.5 | | 356,188 | 100.0% | | $10,524,634 | 100.0% | |
| Total | 56 | 356,188 | 100.0 | % | $10,524,634 | 100.0 | % | | | | |
| (1) | Based on the underwritten rent roll dated November 13, 2023, inclusive of rent steps through November 2024 and straight-line rent for Simmons Bank. |
| (2) | Certain tenants may have lease termination options that are exercisable prior to the originally stated expiration date of the subject lease and that are not considered in the lease rollover schedule. |
The following table presents certain information relating to the operating history and underwritten cash flows of the Crescent Center Property:
| Operating History and Underwriting Net Cash Flow |
| | 2020 | 2021 | 2022 | TTM(1) | Underwritten | Per Square Foot | %(2) |
| In Place Rent(3) | $7,135,410 | $7,010,582 | $8,117,707 | $8,686,875 | $10,478,451(3) | $29.42 | 85.6 | % |
| Vacancy Gross Up | 0 | 0 | 0 | 0 | 1,432,893 | 4.02 | 11.7 | |
| Straight-Line Rent(4) | 0 | 0 | 0 | 0 | 46,182(4) | 0.13 | 0.4 | |
| Gross Potential Rent | $7,135,410 | $7,010,582 | $8,117,707 | $8,686,875 | $11,957,526 | $33.57 | 97.7 | % |
| Total Reimbursements | 127,965 | 62,112 | 25,870 | 186,521 | 283,246 | 0.80 | 2.3 | |
| Total Gross Income | $7,263,375 | $7,072,694 | $8,143,577 | $8,873,396 | $12,240,773 | $34.37 | 100.0 | % |
| Other Income(5) | 23,390 | 31,354 | (60,122) | 97,678 | 128,068(5) | 0.36 | 1.0 | |
| (Vacancy/Credit Loss) | 0 | 0 | 0 | 0 | (1,432,893) | (4.02) | (11.7 | ) |
| Effective Gross Income | $7,286,765 | $7,104,048 | $8,083,455 | $8,971,074 | $10,935,948 | $30.70 | 100.0 | % |
| Total Expenses | $3,531,470 | $3,419,564 | $3,665,097 | $3,900,976 | $4,160,455 | $11.68 | 38.0 | % |
| Net Operating Income(6) | $3,755,295 | $3,684,484 | $4,418,358 | $5,070,098(6) | $6,775,493(6) | $19.02 | 62.0 | % |
| Capital Expenditures | 0 | 0 | 0 | 0 | 71,238 | 0.20 | 0.7 | |
| TI/LC | 0 | 0 | 0 | 0 | 541,138 | 1.52 | 4.9 | |
| Net Cash Flow | $3,755,295 | $3,684,484 | $4,418,358 | $5,070,098 | $6,163,117 | $17.30 | 56.4 | % |
| (1) | TTM reflects the trailing 12 months ending August 31, 2023. |
| (2) | % column represents percent of Total Gross Income for all revenue lines and represents percent of Effective Gross Income for the remainder of fields. |
| (3) | Underwritten In Place Rent includes rent steps through November 2024. |
| (4) | Includes straight-line rent for investment-grade tenants or their affiliates averaged to earlier of lease expiration or loan maturity. |
| (5) | Other Income consists primarily of Simmons Bank signage and contractual parking income. |
| (6) | The increase from TTM Net Operating Income to Underwritten Net Operating Income is primarily driven by six new leases commencing in 2023 and 2024, totaling 28,615 square feet (8.0% of NRA). |
THE INFORMATION IN THIS STRUCTURAL AND COLLATERAL TERM SHEET IS NOT COMPLETE AND MAY BE AMENDED PRIOR TO THE TIME OF SALE. THIS TERM SHEET IS NOT AN OFFER TO SELL THESE SECURITIES AND IT IS NOT A SOLICITATION OF AN OFFER TO BUY THESE SECURITIES IN ANY JURISDICTION WHERE THE OFFER OR SALE IS NOT PERMITTED. |
| | 142 | |
| Structural and Collateral Term Sheet | | BMO 2024-5C3 |
| No. 11 – Crescent Center |
The Market. The Crescent Center Property is located at a signalized intersection on Poplar Avenue in Memphis, Tennessee. Memphis is home to several Fortune 500 company headquarters, including FedEx, AutoZone, and International Paper. FedEx Corporation is the largest employer in Memphis, with 30,000 employees and six million daily shipments out of Memphis International Airport.
The Crescent Center Property is proximate to Interstate 240, which provides direct access to Memphis International Airport, located approximately 11 miles away. Poplar Avenue also provides direct access to Downtown, Memphis, approximately 12 miles west of the Crescent Center Property. The Crescent Center Property is adjacent to a Target anchored retail center.
The Crescent Center Property is located within the East Memphis office submarket. As of the fourth quarter of 2023, the East Memphis office submarket had an inventory of approximately 15.17 million square feet, making it the largest submarket in Memphis, accounting for 25.7% of total office inventory. The East Memphis office submarket had a vacancy rate of 11.8% and an asking rental rate of $24.70 per square foot, the highest of all Memphis submarkets. According to the appraisal, the East Memphis submarket demonstrates sound fundamentals, and a competitive set of approximately 1.52 million square feet exhibited a vacancy rate of 7.8%.
According the appraisal, as of 2022, the population and average household income within a 5-mile radius of the Crescent Center Property were 224,399 and $90,046, respectively.
The following table presents certain information relating to comparable office properties to the Crescent Center Property:
| Competitive Building Summary(1) |
Property Name | Year Built | Rentable Area (SF) | Occupancy | Parking Spaces | Asking Rent PSF | Rate Type |
| Crescent Center | 1986 | 356,188(2) | 87.6%(2) | 1,077(3) | $33.72(2)(4) | Various |
| Colonnade | 1998 | 89,000 | 100.0% | 267 | $25.00 | FSG |
| 999 S Shady Grove Rd. | 2008 | 150,571 | 81.0% | 454 | $30.25 | FSG |
| Ridgeway Center | 1995 | 158,733 | 93.4% | 457 | 29.75 | FSG |
| TraVure | 2018 | 169,769 | 96.9% | NAV | $33.00 | FSG |
| Triad Centre III | 2009 | 148,810 | 77.2% | 840 | $30.50 | FSG |
| Renaissance Center | 2000 | 191,000 | 78.9% | 661 | $29.50 | FSG |
| (2) | Information is based on the underwritten rent roll dated November 13, 2023. |
| (3) | Information based on the zoning report dated September 18, 2023. |
| (4) | Asking Rent PSF based on the underwritten base rent per square foot for the Crescent Center Property. |
The following table presents certain information relating to the appraisal’s market rent conclusion for the Crescent Center Property:
| Market Rent Summary(1) |
| Type | Market Rent PSF | Lease Term (Years) | Rent Increase Projection | Lease Type |
| Office | $32.50 | 7.0 | 2.5% annual | Full Service |
| Storage | $12.50 | 5.0 | 2.5% annual | None |
| Amenity | $4.00 | 15.0 | None | Full Service |
| Outparcel | $42.00 | 10.0 | 10.0% every 5 years | Triple Net |
THE INFORMATION IN THIS STRUCTURAL AND COLLATERAL TERM SHEET IS NOT COMPLETE AND MAY BE AMENDED PRIOR TO THE TIME OF SALE. THIS TERM SHEET IS NOT AN OFFER TO SELL THESE SECURITIES AND IT IS NOT A SOLICITATION OF AN OFFER TO BUY THESE SECURITIES IN ANY JURISDICTION WHERE THE OFFER OR SALE IS NOT PERMITTED. |
| | 143 | |
| Structural and Collateral Term Sheet | | BMO 2024-5C3 |
| No. 11 – Crescent Center |
The following table presents certain information relating to comparable sales to the Crescent Center Property:
| Comparable Sales(1) |
| Name / Property Location | Sale Date | Total NRA (SF) | Total Occupancy | Sale Price | Sale Price PSF | Adjusted Sales Price PSF |
Crescent Center Memphis, TN | NAP | 356,188(2) | 87.6% | (2) | NAP | NAP | NAP |
The Forum Metro Center Nashville, TN | Aug-2022 | 158,193 | 94.0% | | $32,250,000 | $204 | $212 |
Bemiston Tower Clayton, MO | Feb-2023 | 174,241 | 95.0% | | $32,725,000 | $188 | $194 |
Vanderbilt Office Plaza Nashville, TN | May-2023 | 130,913 | 93.0% | | $37,000,000 | $283 | $289 |
Parkside Plaza I Knoxville, TN | Aug-2022 | 100,340 | 100.0% | | $24,500,000 | $244 | $254 |
Ridgeway Center Memphis, TN | Jun-2021 | 168,000 | 100.0% | | $27,700,000 | $165 | $175 |
Colonnade Memphis, TN | Jul-2020 | 89,000 | 89.3% | | $13,000,000 | $146 | $158 |
| (2) | Based on the underwritten rent roll dated November 13, 2023. |
THE INFORMATION IN THIS STRUCTURAL AND COLLATERAL TERM SHEET IS NOT COMPLETE AND MAY BE AMENDED PRIOR TO THE TIME OF SALE. THIS TERM SHEET IS NOT AN OFFER TO SELL THESE SECURITIES AND IT IS NOT A SOLICITATION OF AN OFFER TO BUY THESE SECURITIES IN ANY JURISDICTION WHERE THE OFFER OR SALE IS NOT PERMITTED. |
| | 144 | |
| Structural and Collateral Term Sheet | | BMO 2024-5C3 |
| No. 12 – Staten Island Mall |
| Mortgage Loan Information | | Property Information |
| Mortgage Loan Seller: | GACC | | Single Asset / Portfolio: | Single Asset |
| Original Principal Balance(1): | $28,500,000 | | Title: | Fee |
| Cut-off Date Principal Balance(1): | $28,500,000 | | Property Type – Subtype: | Retail – Super Regional Mall |
| % of IPB: | 3.2% | | Net Rentable Area (SF)(5): | 995,900 |
| Loan Purpose: | Refinance | | Location: | Staten Island, NY |
| Borrowers: | GGP Staten Island Mall, LLC and Staten Island FS Anchor Parcel LLC, | | Year Built / Renovated: | 1972 / 1993, 2018 |
| Borrower Sponsor(2): | BPR Nimbus LLC | | Occupancy: | 87.3% |
| Interest Rate: | 7.53400% | | Occupancy Date: | 11/30/2023 |
| Note Date: | 1/18/2024 | | 4th Most Recent NOI (As of): | $30,602,548 (12/31/2020) |
| Maturity Date: | 2/1/2029 | | 3rd Most Recent NOI (As of): | $23,965,918 (12/31/2021) |
| Interest-only Period: | 60 months | | 2nd Most Recent NOI (As of): | $33,279,822 (12/31/2022) |
| Original Term: | 60 months | | Most Recent NOI (As of): | $36,582,216 (T-12 10/31/2023) |
| Original Amortization Term: | None | | UW Economic Occupancy: | 87.5% |
| Amortization Type: | Interest Only | | UW Revenues: | $63,861,272 |
| Call Protection(3): | L(24),D(29),O(7) | | UW Expenses: | $30,795,311 |
| Lockbox / Cash Management: | Hard / Springing | | UW NOI: | $33,065,961 |
| Additional Debt(1): | Yes | | UW NCF: | $31,870,881 |
| Additional Debt Balance(1): | $171,500,000 | | Appraised Value / Per SF: | $467,000,000 / $469 |
| Additional Debt Type(1): | Pari Passu | | Appraisal Date: | 8/22/2023 |
| | | | | |
| Escrows and Reserves | | Financial Information(1) |
| | Initial | Monthly | Initial Cap | | Cut-off Date Loan / Unit: | $201 |
| Taxes: | $0 | Springing | N/A | | Maturity Date Loan / Unit: | $201 |
| Insurance: | $0 | Springing | N/A | | Cut-off Date LTV: | 42.8% |
| Replacement Reserves: | $0 | Springing | $497,950 | | Maturity Date LTV: | 42.8% |
| TI/LC: | $4,580,787 | Springing | $1,991,800 | | UW NCF DSCR: | 2.09x |
| Gap Rent: | $403,197 | Springing | N/A | | UW NOI Debt Yield: | 16.5% |
| Other Reserves(4): | $0 | Springing | N/A | | | |
| | | | | | | |
| Sources and Uses |
| Sources | Proceeds | % of Total | | Uses | Proceeds | % of Total |
| Whole Loan | $200,000,000 | 94.7% | | Loan Payoff | $204,429,707 | 96.8 | % |
| Equity Contribution | 11,179,744 | 5.3% | | Upfront Reserves | 4,983,984 | 2.4 | |
| | | | | Closing Costs | 1,766,053 | 0.8 | |
| | | | | | | |
| Total Sources | $211,179,744 | 100.0% | | Total Uses | $211,179,744 | 100.0 | % |
| (1) | The Staten Island Mall Mortgage Loan (as defined below) is part of the Staten Island Mall Whole Loan (as defined below) which is comprised of twelve pari passu notes with an aggregate original principal balance and Cut-off Date Balance of $200,000,000. The Staten Island Mall Whole Loan was co-originated by Deutsche Bank AG, New York (“DBNY”), Wells Fargo Bank, National Association (“WFBNA”) and Barclays Capital Real Estate Inc. (“Barclays”)). The Financial Information in the chart above is based on the aggregate outstanding principal balance as of the Cut-off Date of the Staten Island Mall Whole Loan. |
| (2) | BPR Nimbus LLC is also the non-recourse carveout guarantor. The non-recourse carveout guarantor’s recourse obligations with respect to bankruptcy or insolvency related events is capped at 20% of the outstanding principal balance of the Staten Island Mall Whole Loan, plus third party costs actually incurred by the lender (including reasonable attorneys’ fees and costs) in connection with collection of amounts due under the non-recourse carveout guaranty. |
| (3) | The lockout period will be at least 24 payment dates beginning with and including the first payment date on March 1, 2024. Defeasance of the Staten Island Mall Whole Loan in full (but not in part) is permitted at any time following the earlier to occur of (i) January 18, 2027 or (ii) the date that is two years from the closing date of the securitization that includes the last pari passu note to be securitized. The assumed lockout period of 24 payments is based on the expected BMO 2024-5C3 securitization trust closing date in February 2024. The actual lockout period may be longer. The Staten Island Mall Whole Loan may be partially prepaid at any time to cure a cash management trigger period, provided that any prepayment prior to the payment date occurring in August 2028 will be subject to payment of the yield maintenance premium. |
| (4) | During the continuance of an anchor tenant trigger event as defined in the Staten Island Mall loan agreement, the borrower will be required to make monthly deposits equal to the anchor tenant reserve monthly deposit as defined in the Staten Island Mall loan agreement for tenant improvements and leasing commissions, budgeted construction costs, required landlord work and other related costs associated with re-tenanting the applicable space or any other space at the Staten Island Mall Property. |
| (5) | The Staten Island Mall Property (as defined below) is the collateral portion of a larger mall containing 1,462,822 SF. |
THE INFORMATION IN THIS STRUCTURAL AND COLLATERAL TERM SHEET IS NOT COMPLETE AND MAY BE AMENDED PRIOR TO THE TIME OF SALE. THIS TERM SHEET IS NOT AN OFFER TO SELL THESE SECURITIES AND IT IS NOT A SOLICITATION OF AN OFFER TO BUY THESE SECURITIES IN ANY JURISDICTION WHERE THE OFFER OR SALE IS NOT PERMITTED. |
| | 145 | |
| Structural and Collateral Term Sheet | | BMO 2024-5C3 |
| No. 12 – Staten Island Mall |
The Loan. The twelfth largest mortgage loan (the “Staten Island Mall Mortgage Loan”) is part of a whole loan (the “Staten Island Mall Whole Loan”) originated by DBNY, WFBNA and Barclays on January 18, 2024 that is evidenced by 12 pari passu notes with an aggregate outstanding principal balance as of the Cut-off Date of $200,000,000, and accrues interest at a fixed rate of 7.53400% per annum. The Staten Island Mall Whole Loan is secured by the fee simple interest in a 995,500 SF portion (the “Staten Island Mall Property”) of the Staten Island Mall, an enclosed, 1,462,822 SF super-regional mall located at 2655 Richmond Avenue in Staten Island, New York (the “Staten Island Mall”). The Staten Island Mall Mortgage Loan, which is evidenced by the non-controlling note A-1 has an outstanding principal balance as of the Cut-off Date of $28,500,000 and represents approximately 3.2% of the Initial Pool Balance.
The relationship between the holders of the Staten Island Mall Whole Loan will be governed by a co-lender agreement as described under “Description of the Mortgage Pool—The Whole Loans—The Serviced Pari Passu Whole Loans” and “The Outside Serviced Pari Passu Whole Loans” in the Preliminary Prospectus. The Staten Island Mall Whole Loan will initially be serviced under the pooling and servicing agreement for the BMO 2024-5C3 transaction until the controlling Note A-2 is contributed to a securitization, at which point the Staten Island Mall Whole Loan will be serviced under the pooling and servicing agreement for the securitization transaction to which Note A-2 is contributed. See “The Pooling and Servicing Agreement – Servicing of the Mortgage Loans” and “—Servicing of the Outside Serviced Mortgage Loans” in the Preliminary Prospectus.
The table below identifies the promissory notes that comprise the Staten Island Mall Whole Loan.
| Whole Loan Summary |
| Note | Original Balance | Cut-off Date Balance | Note Holder | Controlling Piece |
| A-1 | | $28,500,000 | | | $28,500,000 | | BMO 2024-5C3 | No |
| A-2 | | $25,000,000 | | | $25,000,000 | | DBNY(1) | Yes |
| A-3 | | $15,000,000 | | | $15,000,000 | | DBNY(1) | No |
| A-4 | | $11,500,000 | | | $11,500,000 | | DBNY(1) | No |
| A-5 | | $30,000,000 | | | $30,000,000 | | Barclays(1) | No |
| A-6 | | $15,000,000 | | | $15,000,000 | | Barclays(1) | No |
| A-7 | | $10,000,000 | | | $10,000,000 | | Barclays(1) | No |
| A-8 | | $5,000,000 | | | $5,000,000 | | Barclays(1) | No |
| A-9 | | $25,000,000 | | | $25,000,000 | | WFBNA(1) | No |
| A-10 | | $20,000,000 | | | $20,000,000 | | WFBNA(1) | No |
| A-11 | | $10,000,000 | | | $10,000,000 | | WFBNA(1) | No |
| A-12 | | $5,000,000 | | | $5,000,000 | | WFBNA(1) | No |
| Whole Loan | | $200,000,000 | | | $200,000,000 | | | |
| (1) | Expected to be contributed to one or more future securitization trusts. |
The Property. The Staten Island Mall Property is a 995,500 square foot collateral portion of the Staten Island Mall, a 1,462,822 square foot super regional mall located in Staten Island, New York. Staten Island Mall was built in 1972 and is anchored by Macy’s and JCPenney (non-collateral), along with a line-up of junior anchors including Dave & Buster’s, AMC Theatre, Primark, LIDL, and Hobby Lobby. Macy’s (289,512 SF) and JC Penney (177,410 SF) both own their respective boxes and are not included as part of the Staten Island Mall Property. The Staten Island Mall is comprised of five buildings located on 78.54 acres, has 167 tenants and has 6,900 parking spaces in total for a ratio of 4.72 spaces per 1,000 SF. In 2018, the Staten Island Mall underwent a $231 million redevelopment and expansion, which added a lifestyle component to the mall. The expansion included a new food court, new plaza area, and additional decked parking.
The Staten Island Mall benefits from being the only regional mall on Staten Island. The Staten Island Mall sees more than 12 million shoppers every year due in part a road network that places it within an approximately 15-mile radius of every resident on the island. The Staten Island Mall Property caters to a trade area of over 485,000 people with an average household income of over $110,000. Staten Island is accessed by the nearby metropolitan areas through the Staten Island Ferry, which serves over 22 million people annually, combined with accessibility through motor traffic from New Jersey and Brooklyn.
As part of the redevelopment and expansion, the borrower sponsor executed leases with retailers such as AMC Theatre, Barnes & Noble, Dave & Busters, Chipotle, Shake Shack, Ulta Beauty, and Zara, which have helped diversify the tenant mix and product offerings at the Staten Island Mall Property. Most recently, the borrower signed a new 10-year lease with
THE INFORMATION IN THIS STRUCTURAL AND COLLATERAL TERM SHEET IS NOT COMPLETE AND MAY BE AMENDED PRIOR TO THE TIME OF SALE. THIS TERM SHEET IS NOT AN OFFER TO SELL THESE SECURITIES AND IT IS NOT A SOLICITATION OF AN OFFER TO BUY THESE SECURITIES IN ANY JURISDICTION WHERE THE OFFER OR SALE IS NOT PERMITTED. |
| | 146 | |
| Structural and Collateral Term Sheet | | BMO 2024-5C3 |
| No. 12 – Staten Island Mall |
Hobby Lobby, an arts and crafts retailer, which took occupancy of 42,768 SF in June 2023. Earlier in 2023, The Mighty Crab, a Cajun seafood restaurant, opened a 5,536 SF restaurant, adding another food offering at the Staten Island Mall Property. In addition to these newly signed leases, the borrower has signed a 10-year lease with Uniqlo to occupy 10,929 SF.
As of October 31, 2023 TTM, sales for the in-line (<10,000 SF) tenant category are $765 PSF, with an occupancy cost ratio of 13.9%. Excluding Apple, the in-line (<10,000 SF) tenant sales are $628 PSF, with an occupancy cost ratio of 17.0%. The major tenants (>10,000 SF) have experienced growth since the COVID-19 pandemic, reaching October 31, 2023 TTM sales of $38.0 million ($236 PSF), a 5.2% increase from 2019 sales of $36.1 million ($225 PSF).
The following table presents tenant sales history for the Staten Island Mall Property:
Tenancy Type | 2019 Sales | 2019 PSF(1) | 2020 Sales | 2020 PSF(1) | 2021 Sales | 2021 PSF(1) | 2022 Sales | | TTM Sales(2) | |
| Anchor | $19,348,080 | $203 | $11,665,021 | $122 | $4,812,283 | $51 | $14,946,714 | $157 | $18,112,475 | $190 |
| Major (> 10,000 SF) | 36,053,132 | $225 | 28,514,242 | $178 | 27,589,556 | $172 | 39,111,833 | $244 | 37,935,043 | $236 |
| Inline (< 10,000 SF) | 198,823,588 | $816 | 109,228,240 | $435 | 197,610,950 | $775 | 198,565,374 | $762 | 197,182,104 | $765 |
| Inline (< 10,000 SF) excluding Apple | 156,300,975 | $654 | 86,304,641 | $350 | 159,814,024 | $638 | 160,124,694 | $625 | 158,932,145 | $628 |
| Total Sales | $254,224,800 | $509 | $149,407,502 | $295 | $230,012,789 | $450 | $252,623,922 | $489 | $253,229,623 | $493 |
| (1) | Based on the underwritten rent roll dated November 30, 2023. |
| (2) | TTM is as of October 31, 2023. |
Major Tenants. The three largest tenants based on underwritten base rent are AMC Theatres, Zara and Primark.
AMC Theatres (54,000 square feet; 5.4% of net rentable area; 6.8% of underwritten base rent) is a large movie exhibition company in the United States and worldwide. The company operates over 2,800 screens in over 350 European theatres along with over 7,500 screens in 586 American theatres. At the Staten Island Mall Property, AMC Theatres features 11 screens, has a lease expiration in February 2034, and produced October 31, 2023 TTM sales of $10,181,272 ($925,570 per screen) versus the 2019 sales of $9,464,419 ($860,402 per screen). There are no termination or extension options.
Zara (29,141 square feet; 2.9% of net rentable area; 5.1% of underwritten base rent): is a Spanish multi-national clothing chain with operations in over 90 countries that was founded in 1974. Headquartered in Artexio, Spain the company acts as the flagship brand of the Inditex Group with over 547 stores in Spain, 229 stores in China, 145 stores in France and 98 stores in the United States. In May 2021, Zara expanded its product offerings with its first beauty line, ZARA Beauty. Zara has a lease expiration in April 2028. The tenant had sales of $419 PSF as of October 31, 2023 TTM. Zara has the right to terminate its lease if its net sales from the leased premises fail to exceed $12,000,000 during the measuring period beginning on the first day of the 49th full calendar month following the date the tenant opened for business, (the “Open Date”) and ending on the last day of the 60th full calendar month following the Open Date, upon written notice delivered on or before the 120th day following the end of the measuring period. If such notice is given, the lease will terminate 365 days after such notice is received by the landlord. There are no extension options.
Primark (73,647 square feet; 7.4% of net rentable area; 4.9% of underwritten base rent) is an international clothing retailer headquartered in Dublin Ireland with outlets across Europe and the United States. The company was established in 1969 and in 2006 began expanding into the rest of Europe by opening stores in Spain, The Netherlands, Portugal, Germany, Belgium, and other countries. In 2015, the company opened its first store in the United States in Boston. The company operates with 72,000 team members in 15 countries. At the Staten Island Mall Property, Primark has occupied its 73,647 square foot location since 2017, has a lease expiration in June 2027. The Primark does not report sales. The tenant has a one-time right to terminate at any time after the fifth lease year upon delivery of written notice to the landlord no later than 6 months prior to the end of the fifth lease year. There are no extension options.
THE INFORMATION IN THIS STRUCTURAL AND COLLATERAL TERM SHEET IS NOT COMPLETE AND MAY BE AMENDED PRIOR TO THE TIME OF SALE. THIS TERM SHEET IS NOT AN OFFER TO SELL THESE SECURITIES AND IT IS NOT A SOLICITATION OF AN OFFER TO BUY THESE SECURITIES IN ANY JURISDICTION WHERE THE OFFER OR SALE IS NOT PERMITTED. |
| | 147 | |
| Structural and Collateral Term Sheet | | BMO 2024-5C3 |
| No. 12 – Staten Island Mall |
The following table presents certain information relating to the historical occupancy of the Staten Island Mall Property:
| Historical and Current Occupancy(1) |
| 2020 | 2021 | 2022 | Current(2) |
| 83.1% | 83.8% | 84.0% | 87.3% |
| (1) | Historical Occupancies are as of December 31 of each respective year, unless otherwise specified. |
| (2) | Based on the underwritten rent roll dated November 30, 2023. |
The following table presents certain information relating to the major tenants (of which, certain tenants may have
co-tenancy provisions) at the Staten Island Mall Property:
| Top Tenant Summary(1) |
| Tenant | Ratings
Moody’s/S&P/Fitch(2) | Net Rentable Area (SF) | % of
Total NRA | UW
Base Rent PSF |
UW
Base Rent | % of Total
UW Base Rent | Lease
Exp. Date |
| AMC Theatres | Caa2/Caa+/NR | 54,000 | 5.4 | % | $41.78 | $2,256,000 | 6.8 | % | 2/28/2034 |
| Zara(3) | NR/NR/NR | 29,141 | 2.9 | | $57.96 | 1,689,120 | 5.1 | % | 4/30/2028 |
| Primark(4) | NR/NR/NR | 73,647 | 7.4 | | $22.00 | 1,620,234 | 4.9 | % | 6/30/2027 |
| Lidl | NR/A/NR | 37,403 | 3.8 | | $42.35 | 1,584,017 | 4.8 | % | 1/31/2039 |
| Dave & Buster’s | NR/NR/NR | 41,241 | 4.1 | | $38.00 | 1,567,158 | 4.7 | % | 1/31/2033 |
| The Container Store | NR/B/NR | 24,075 | 2.4 | | $41.80 | 1,006,335 | 3.0 | % | 2/28/2033 |
| H&M(5) | NR/BBB/NR | 25,471 | 2.6 | | $37.12 | 945,420 | 2.9 | % | 1/31/2030 |
| Barnes & Noble Bookseller | NR/NR/NR | 20,084 | 2.0 | | $42.50 | 853,570 | 2.6 | % | 1/31/2029 |
| Hobby Lobby | NR/B/NR | 42,768 | 4.3 | | $17.00 | 727,056 | 2.2 | % | 5/31/2033 |
| Express | NR/NR/NR | 12,928 | 1.3 | | $51.25 | 662,560 | 2.0 | % | 1/31/2025 |
| Ten Largest Owned Tenants | | 360,758 | 36.2 | % | $35.79 | $12,911,470 | 39.1 | % | |
| Remaining Owned Tenants | | 508,219 | 51.0 | | 39.57 | 20,108,716 | 60.9 | | |
| Total Occupied | | 868,977 | 87.3 | % | $38.00 | $33,020,186 | 100.0 | % | |
| Vacant Spaces (Owned Space) | | 126,923 | 12.7 | | 0.00 | 0 | | |
| Totals / Wtd. Avg. All Owned Tenants | | 995,900 | 100.0 | % | $38.00 | $33,020,186 | | |
| (1) | Based on the underwritten rent roll dated November 30, 2023. |
| (2) | In certain instances, ratings provided are those of the parent company of the entity shown, whether or not the parent company guarantees the lease. |
| (3) | Zara has the right to terminate its lease if its net sales from the leased premises fail to exceed $12,000,000 during the measuring period beginning on the first day of the 49th full calendar month following the date the tenant opened for business, (the “Open Date”) and ending on the last day of the 60th full calendar month following the Open Date, upon written notice delivered on or before the 120th day following the end of the measuring period. If such notice is given, the lease will terminate 365 days after such notice is received by the landlord. |
| (4) | Primark has a one-time right to terminate at any time after the fifth lease year upon delivery of written notice to the landlord no later than 6 months prior to the end of the fifth lease year. |
| (5) | H&M has the right to terminate its lease if (i) its net sales from the leased premises fail to exceed $6,874,269 in the fourth full lease year after the rental commencement date or (ii) its net sales from the leased premises fail to exceed $7,151,989.47 in the sixth full lease year after the rental commencement date, in each case upon not less than 365 days’ notice given within 180 days following the end of the applicable measuring period. |
THE INFORMATION IN THIS STRUCTURAL AND COLLATERAL TERM SHEET IS NOT COMPLETE AND MAY BE AMENDED PRIOR TO THE TIME OF SALE. THIS TERM SHEET IS NOT AN OFFER TO SELL THESE SECURITIES AND IT IS NOT A SOLICITATION OF AN OFFER TO BUY THESE SECURITIES IN ANY JURISDICTION WHERE THE OFFER OR SALE IS NOT PERMITTED. |
| | 148 | |
| Structural and Collateral Term Sheet | | BMO 2024-5C3 |
| No. 12 – Staten Island Mall |
The following table presents certain information relating to the lease rollover schedule at the Staten Island Mall Property:
| Lease Rollover Schedule(1)(2) |
| Year | Number of Leases Expiring | Net Rentable Area Expiring | % of NRA Expiring | UW Base Rent Expiring | % of UW Base Rent Expiring | Cumulative Net Rentable Area Expiring | Cumulative % of NRA Expiring | Cumulative UW Base Rent Expiring | Cumulative % of UW Base Rent Expiring |
| Vacant | NAP | 126,923 | 12.7 | % | NAP | NAP | 126,923 | 12.7 | % | NAP | NAP | |
| MTM | 2 | 5,803 | 0.6 | | $0 | 0.0% | 132,726 | 13.3 | % | $0 | 0.0% | |
| 2024 | 37 | 121,817 | 12.2 | | 2,313,310 | 7.0% | 254,543 | 25.6 | % | $2,313,310 | 7.0% | |
| 2025 | 38 | 107,281 | 10.8 | | 5,059,889 | 15.3% | 361,824 | 36.3 | % | $7,373,199 | 22.3% | |
| 2026 | 17 | 60,152 | 6.0 | | 2,401,754 | 7.3% | 421,976 | 42.4 | % | $9,774,953 | 29.6% | |
| 2027 | 19 | 142,425 | 14.3 | | 4,218,491 | 12.8% | 564,401 | 56.7 | % | $13,993,444 | 42.4% | |
| 2028 | 25 | 82,873 | 8.3 | | 4,852,666 | 14.7% | 647,274 | 65.0 | % | $18,846,111 | 57.1% | |
| 2029 | 10 | 54,184 | 5.4 | | 3,371,346 | 10.2% | 701,458 | 70.4 | % | $22,217,457 | 67.3% | |
| 2030 | 5 | 41,232 | 4.1 | | 1,406,524 | 4.3% | 742,690 | 74.6 | % | $23,623,981 | 71.5% | |
| 2031 | 2 | 1,030 | 0.1 | | 85,602 | 0.3% | 743,720 | 74.7 | % | $23,709,583 | 71.8% | |
| 2032 | 6 | 16,981 | 1.7 | | 735,198 | 2.2% | 760,701 | 76.4 | % | $24,444,781 | 74.0% | |
| 2033 & Beyond | 13 | 235,199 | 23.6 | | 8,575,405 | 26.0% | 995,900 | 100.0 | % | $33,020,186 | 100.0% | |
| Total | 174 | 995,900 | 100.0 | % | $33,020,186 | 100.0% | | | | |
| (1) | Based on the underwritten rent roll dated November 30, 2023. |
| (2) | Certain tenants may have termination options that are not considered in the above lease |
The following table presents certain information relating to the operating history and underwritten cash flows of the Staten Island Mall Property:
| Operating History and Underwritten Net Cash Flow |
| | 2019 | 2020 | 2021 | 2022 | TTM 10/31/2023 | Underwritten | Per Square Foot | %(1) |
| Rents in Place(2) | $38,297,987 | $35,160,641 | $31,511,074 | $33,302,007 | $33,191,879 | | $33,020,186 | | $33.16 | | 51.5 | % |
| Rent Steps(3) | 0 | 0 | 0 | 0 | 0 | | 647,911 | | 0.65 | | 1.0 | |
| Vacant Income | 0 | 0 | 0 | 0 | 0 | | 9,103,273 | | 9.14 | | 14.2 | |
| Gross Potential Rent | $38,297,987 | $35,160,641 | $31,511,074 | $33,302,007 | $33,191,879 | | $42,771,370 | | $42.95 | | 66.7 | % |
| Total Reimbursements | 28,837,736 | 26,841,040 | 18,268,336 | 19,230,163 | 21,224,797 | | 21,343,090 | | 21.43 | | 33.3 | |
| Net Rental Income | $67,135,723 | $62,001,681 | $49,779,410 | $52,532,170 | $54,416,676 | | $64,114,460 | | $64.38 | | 100.0 | % |
| Other Income | 9,849,626 | 5,151,946 | 8,136,933 | 9,628,520 | 9,322,478 | | 8,850,085 | | 8.89 | | 13.8 | |
| (Vacancy/Credit Loss) | (448,500) | (4,564,271) | (1,862,967) | 2,597,330 | (1,037,038) | | (9,103,273) | | (9.14) | | (14.2 | ) |
| Effective Gross Income | $76,536,848 | $62,589,356 | $56,053,376 | $64,758,020 | $62,702,116 | | $63,861,272 | | $64.12 | | 99.6 | % |
| Total Expenses(4) | 35,170,586 | 31,986,808 | 32,087,459 | 31,478,198 | 26,119,900 | | 30,795,311 | | 30.92 | | 48.2 | |
| Net Operating Income | $41,366,262 | $30,602,548 | $23,965,918 | $33,279,822 | $36,582,216 | | $33,065,961 | | $33.20 | | 51.8 | % |
| Total TI/LC, Capex/RR | 0 | 0 | 0 | 0 | 0 | | 1,195,080 | | 1.20 | | 1.9 | |
| Net Cash Flow | $41,366,262 | $30,602,548 | $23,965,918 | $33,279,822 | $36,582,216 | | $31,870,881 | | $32.00 | | 49.9 | % |
| (1) | % column represents percent of Net Rental Income for all revenue lines and represents percent of Effective Gross Income for the remainder of fields. |
| (2) | Based on the underwritten rent roll dated November 30, 2023. |
| (3) | Includes underwritten rent steps through January 1, 2025. |
| (4) | Expenses include real estate taxes. Portions of the Staten Island Mall Property benefit from a New York City Industrial and Commercial Incentive Program (“ICIP”) exemption or a New York City Industrial & Commercial Abatement Program (“ICAP”) abatement. Real estate taxes were underwritten based on the appraisal real estate taxes for the 2023/2024 tax year, less the ICIP/ICAP abatement amounts shown in the appraisal for such tax year. There is one parcel (Block 2400 Lot 77) for which real estate taxes were not underwritten as the tenant is directly responsible for taxes. |
The Market. The Staten Island Mall Property is located in the heart of Staten Island, the southernmost of New York City’s five boroughs. The Staten Mall Property is located along Richmond Avenue between Platinum Road and Richmond Hill Road in the New Springville neighborhood of Staten Island. New Springville is located within the central portion of Staten Island, which is a primary residential neighborhood with excellent access to Richmond Avenue, the prime retail / commercial area in Staten Island.
THE INFORMATION IN THIS STRUCTURAL AND COLLATERAL TERM SHEET IS NOT COMPLETE AND MAY BE AMENDED PRIOR TO THE TIME OF SALE. THIS TERM SHEET IS NOT AN OFFER TO SELL THESE SECURITIES AND IT IS NOT A SOLICITATION OF AN OFFER TO BUY THESE SECURITIES IN ANY JURISDICTION WHERE THE OFFER OR SALE IS NOT PERMITTED. |
| | 149 | |
| Structural and Collateral Term Sheet | | BMO 2024-5C3 |
| No. 12 – Staten Island Mall |
Being located in the New York City market, the Staten Island Mall Property benefits from a large local consumer base. There are a variety of large industries in Staten Island, with the top employers including Global Container Terminal, Amazon Fulfillment Center, Matrix Global Logistics Park, Pratt Mill Paper Industry, and the Corporate Park of Staten Island. Collectively, these companies employ over 25,000 people. As of 2022, within a 10 and 20 minute drive of the Staten Island Mall Property, the population was 53,743 and 390,102, respectively with a median household income of $127,282 and $121,680, respectively.
The Staten Island Mall Property is located within the New York City retail market and the Staten Island retail submarket. According to a third party report, as of December 2023, the vacancy rate in the submarket was 5.1%. The total submarket is comprised of 20,474,522 SF with only 3,015 SF currently under construction. Average rents as of December 2023 were $37.08/SF, which is a 2.7% increase from where they were a year ago. In the past three years, rents have increased a cumulative 8.3%.
The following table presents certain information relating to competitive retail centers for the Staten Island Mall Property:
| Competitive Retail Centers(1) |
| Property Name | Year Built/ Renovated | GLA (SF) | Occupancy | Estimated # of Customers | Anchor / Major Tenants |
| Staten Island Mall | 1972 / 1993, 2018 | 1,462,422(2) | 87.3%(2) | 11,800,000 | AMC, Zara, Primark |
| Woodbridge Center | 1971 / 2003 | 1,661,324 | 67.0% | 6,400,000 | Boscov’s, JC Penney, Macy’s |
| Menlo Park Mall | 1960 / 2015 | 1,323,156 | 90.0% | 10,400,000 | Macy’s, Nordstrom, AMC |
| The Mills at Jersey Gardens | 1999 / NAP | 1,301,776 | 100.0% | 10,100,000 | Bed, Bath & Beyond, Burlington, Cohoes, Forever XXI,
Lowes Cineplex, Marshalls, Neiman Marcus, Portabella,
Saks Off Fifth Avenue |
| Newport Centre | 1987 / 2002 | 1,149,147 | 92.0% | 5,900,000 | JCPenney, Sears, Macy’s, Kohl’s, AMC |
| Kings Plaza | 1970 / 2018 | 1,146,000 | 99.0% | 7,600,000 | Lowe’s, Macy’s, Primark, Target |
| Wtd. Avg. Competitive Set | | | 88.1%(3) | 40,400,000(3) | |
| (1) | Source: Appraisal, unless otherwise specified. |
| (2) | Based on the underwritten rent roll as of November 30, 2023. Occupancy for the Staten Island Mall Property is as of November 30, 2023. |
| (3) | Excludes subject property. |
THE INFORMATION IN THIS STRUCTURAL AND COLLATERAL TERM SHEET IS NOT COMPLETE AND MAY BE AMENDED PRIOR TO THE TIME OF SALE. THIS TERM SHEET IS NOT AN OFFER TO SELL THESE SECURITIES AND IT IS NOT A SOLICITATION OF AN OFFER TO BUY THESE SECURITIES IN ANY JURISDICTION WHERE THE OFFER OR SALE IS NOT PERMITTED. |
| | 150 | |
| Structural and Collateral Term Sheet | | BMO 2024-5C3 |
| No. 13 – Highland Hills Apartments |
| Mortgage Loan Information | | Property Information |
| Mortgage Loan Seller: | SMC | | Single Asset / Portfolio: | Single Asset |
| Original Principal Balance: | $27,100,000 | | Title: | Fee |
| Cut-off Date Principal Balance: | $27,100,000 | | Property Type – Subtype: | Multifamily – Garden |
| % of IPB: | 3.0% | | Net Rentable Area (Units): | 454 |
| Loan Purpose: | Refinance | | Location: | Jackson, MS |
| Borrowers(1): | Various | | Year Built / Renovated: | 1967 / 2020-2023 |
| Borrower Sponsors: | Pinchos D. Shemano and Heyme Bleier | | Occupancy: | 94.7% |
| Interest Rate: | 5.59100% | | Occupancy Date: | 11/20/2023 |
| Note Date: | 12/22/2023 | | 4th Most Recent NOI (As of): | $2,006,013 (12/31/2020) |
| Maturity Date: | 1/6/2029 | | 3rd Most Recent NOI (As of): | $2,028,939 (12/31/2021) |
| Interest-only Period: | 60 months | | 2nd Most Recent NOI (As of): | $2,166,448 (12/31/2022) |
| Original Term: | 60 months | | Most Recent NOI (As of): | $2,309,289 (TTM 10/31/2023) |
| Original Amortization Term: | None | | UW Economic Occupancy: | 80.1% |
| Amortization Type: | Interest Only | | UW Revenues: | $4,309,406 |
| Call Protection: | L(25),D(31),O(4) | | UW Expenses: | $1,814,909 |
| Lockbox / Cash Management: | Soft / Springing | | UW NOI: | $2,494,497 |
| Additional Debt: | No | | UW NCF: | $2,358,297 |
| Additional Debt Balance: | N/A | | Appraised Value / Per Unit: | $42,200,000 / $92,952 |
| Additional Debt Type: | N/A | | Appraisal Date: | 11/29/2023 |
| | | | | |
| | | | | |
| Escrows and Reserves | | Financial Information |
| | Initial | Monthly | Initial Cap | | Cut-off Date Loan / Unit: | $59,692 | |
| Taxes: | $0 | $15,324 | N/A | | Maturity Date Loan / Unit: | $59,692 | |
| Insurance: | $183,020 | $31,242 | N/A | | Cut-off Date LTV: | 64.2% | |
| Replacement Reserve: | $0 | $11,350 | N/A | | Maturity Date LTV: | 64.2% | |
| Deferred Maintenance: | $100,000 | $0 | N/A | | UW NCF DSCR: | 1.54x | |
| | | | | | UW NOI Debt Yield: | 9.2% | |
| | | | | | | |
| Sources and Uses |
| Sources | Proceeds | % of Total | | Uses | Proceeds | % of Total | |
| Mortgage Loan | $27,100,000 | 100.0% | | Loan Payoff | $23,127,069 | 85.3 | % |
| | | | | Closing Costs(2) | 2,994,017 | 11.0 | |
| | | | | Return of Equity | 695,894 | 2.6 | |
| | | | | Upfront Reserves | 283,020 | 1.0 | |
| Total Sources | $27,100,000 | 100.0% | | Total Uses | $27,100,000 | 100.0 | % |
| (1) | The borrowers under the Highland Hills Apartments Mortgage Loan (as defined below) are HB Highland Hills LLC, Highland Hills 2019 LLC, CS Highland Hills LLC and Highland Hills 5779 LLC. |
| (2) | Closing Costs includes a $2,495,000 interest rate buydown. |
The Loan. The thirteenth largest mortgage loan (the “Highland Hills Apartments Mortgage Loan”) has an outstanding principal balance as of the Cut-off Date of $27,100,000 and is secured by the borrower’s fee interest in a 454-unit multifamily property located in Jackson, Mississippi (the “Highland Hills Apartments Property”). The Highland Hills Apartments Mortgage Loan was originated by Starwood Mortgage Capital and accrues interest at a rate of 5.59100% per annum. The Highland Hills Apartments Mortgage Loan has a five-year term, is interest-only for the entire term and accrues interest on an Actual/360 basis.
THE INFORMATION IN THIS STRUCTURAL AND COLLATERAL TERM SHEET IS NOT COMPLETE AND MAY BE AMENDED PRIOR TO THE TIME OF SALE. THIS TERM SHEET IS NOT AN OFFER TO SELL THESE SECURITIES AND IT IS NOT A SOLICITATION OF AN OFFER TO BUY THESE SECURITIES IN ANY JURISDICTION WHERE THE OFFER OR SALE IS NOT PERMITTED. |
| | 151 | |
| Structural and Collateral Term Sheet | | BMO 2024-5C3 |
| No. 13 – Highland Hills Apartments |
The Property. The Highland Hills Apartments Property is a 454-unit garden-style multifamily property built in 1967 and recently renovated between 2020 and 2023. As of November 20, 2023, the Highland Hills Apartments Property was 94.7% occupied. The Highland Hills Apartments Property is located at 20 North Hill Parkway, approximately five miles north of downtown Jackson. The Highland Hills Apartments Property consists of 40 buildings and two swimming pools.
In addition to the two swimming pools, amenities at the Highland Hills Apartments Property include a recently renovated clubhouse with Wi-Fi, a fitness center, secure access, on-site laundry facilities, and on-site management and maintenance teams. The unit mix includes 20 studio units, 171 one-bedroom units, 218 two-bedroom units and 45 three-bedroom units. Each unit offers spacious living areas, kitchens with brushed nickel finishes, storage space, private patios or balconies, and washer/dryer connections. Select units also include fireplaces, ceramic tile showers, bookshelves and/or a wet bar. The Highland Hills Apartments Property has been undergoing renovations since 2020, whereby the borrower sponsors take units offline as leases roll to complete upgrades. Renovations include new flooring, new kitchen appliances and counters, and new tiled showers, among other improvements. The borrower sponsors’ current cost basis is in excess of $30.0 million. The cost basis reflects the $23.3 million purchase of the property in 2019 and $3.5 million recently invested in the Highland Hills Apartments Property (used primarily to renovate 235 units), amongst other things.
| Highland Hills Apartments Unit Mix |
| Unit Type | Collateral Units(1) | % of Collateral Units(1) | Occupied Collateral Units(1) | % of Units Occupied(1) | Total Collateral SF(1) | Average Collateral SF(1) | Market Rent Per Unit(2) | Market Rent PSF(2) | Average Rent Per Unit(1) | Average Rent PSF(1) |
| Studio | 20 | 4.4% | 20 | 100.0% | 10,532 | 527 | $720 | $1.37 | $676 | $1.28 |
| 1 Bedroom | 171 | 37.7% | 168 | 98.2% | 131,905 | 771 | $789 | $1.02 | $772 | $1.00 |
| 2 Bedroom | 218 | 48.0% | 197 | 90.4% | 247,001 | 1,133 | $953 | $0.84 | $891 | $0.79 |
| 3 Bedroom | 45 | 9.9% | 45 | 100.0% | 64,661 | 1,437 | $1,114 | $0.78 | $1,078 | $0.75 |
| Collateral Total/Wtd. Avg. | 454 | 100.0% | 430 | 94.7% | 454,099 | 1,000 | $897 | $0.90 | $854 | $0.86 |
| (1) | Based on the borrower rent roll dated as of November 20, 2023. |
The Market. According to the appraisal, the Highland Hills Apartments Property is located in the Jackson multifamily market. As of the third quarter of 2023, the Jackson multifamily market average monthly asking rent was $1,095 and vacancy was approximately 12.8%. According to the appraisal, the Highland Hills Apartments Property is located in the North multifamily submarket. As of the third quarter of 2023, the North multifamily submarket average monthly asking rent was $1,047 and vacancy was approximately 18.1%.
According to the appraisal, the estimated 2023 population within a one-, three- and five-mile radius of the Highland Hills Apartments Property is 10,278, 50,852 and 98,270, respectively. The estimated 2023 average household income within the same radii is $80,995, $75,693 and $67,381, respectively.
THE INFORMATION IN THIS STRUCTURAL AND COLLATERAL TERM SHEET IS NOT COMPLETE AND MAY BE AMENDED PRIOR TO THE TIME OF SALE. THIS TERM SHEET IS NOT AN OFFER TO SELL THESE SECURITIES AND IT IS NOT A SOLICITATION OF AN OFFER TO BUY THESE SECURITIES IN ANY JURISDICTION WHERE THE OFFER OR SALE IS NOT PERMITTED. |
| | 152 | |
| Structural and Collateral Term Sheet | | BMO 2024-5C3 |
| No. 13 – Highland Hills Apartments |
The following table presents certain information relating to comparable multifamily rental properties to the Highland Hills Apartments Property:
| Comparable Rental Summary(1) |
| Property Address | Year Built / Renovated | Occupancy | # Units | Unit Mix | Average SF per Unit | Average Rent per SF | Average Rent per Unit |
Highland Hills Apartments(2) 20 North Hill Parkway Jackson, MS | 1967 / 2020-2023 | 94.7% | 454 | Studio 1 Bedroom 2 Bedroom 3 Bedroom | 527 771 1,133 1,437 | $1.28 $1.00 $0.79 $0.75 | $676 $772 $891 $1,078 |
The Pointe at East River Place 881 East River Place Jackson, MS | 1986 / NAP | 90.0% | 112 | Studio 1 Bedroom 2 Bedroom | 555 630 910 | $1.44 $1.55 $1.30 | $798 $975 $1,179 |
Park at Marsala 1805 Hospital Drive Jackson, MS | 1980 / 2018 | 97.0% | 199 | Studio 1 Bedroom 2 Bedroom 3 Bedroom | 434 622 1,033 1,335 | $1.38 $1.08 $0.86 $0.75 | $599 $669 $892 $999 |
The Park at Newhaven 220 Edgewood Terrace Drive Jackson, MS | 1971 / 2022 | 88.0% | 176 | 1 Bedroom 2 Bedroom 3 Bedroom | 800 1,330 1,750 | $0.97 $0.76 $0.69 | $775 $1,008 $1,200 |
Castlegate Apartments 5600 Keele Street Jackson, MS | 1975 / 2019 | 93.0% | 217 | 1 Bedroom 2 Bedroom 3 Bedroom | 800 1,050 1,250 | $1.16 $0.99 $0.96 | $930 $1,040 $1,195 |
The Park at Inverness 5880 Ridgewood Road Jackson, MS | 1976 / 2009 | 80.0% | 432 | 1 Bedroom 2 Bedroom 3 Bedroom | 800 1,000 1,200 | $1.00 $0.90 $0.88 | $800 $900 $1,050 |
Jackson Heights 365 West Northside Drive Jackson, MS | 1974 / 2016 | 76.0% | 145 | Studio 1 Bedroom 2 Bedroom | 450 550 1,050 | $1.44 $1.27 $0.81 | $649 $699 $849 |
White Oak Estates 759 Glencross Drive Jackson, MS | 1996 / NAP | 38.0% | 416 | 1 Bedroom 2 Bedroom 3 Bedroom | 929 1,145 1,338 | $1.17 $1.12 $1.07 | $1,083 $1,283 $1,433 |
| (1) | Source: Appraisal, unless otherwise indicated. |
| (2) | Based on the borrower rent roll dated as of November 20, 2023. |
Environmental. According to the Phase I environmental assessment dated November 29, 2023, there was no evidence of any recognized environmental conditions at the Highland Hills Apartments Property.
The following table presents certain information relating to the historical and current occupancy of the Highland Hills Apartment Property:
| Historical and Current Occupancy(1) |
| 2020 | 2021 | 2022 | Current(2) |
| 92.5% | 89.4% | 91.7% | 94.7% |
| (1) | Historical occupancy is as of December 31 of each respective year. |
| (2) | Current Occupancy is as of November 20, 2023. |
THE INFORMATION IN THIS STRUCTURAL AND COLLATERAL TERM SHEET IS NOT COMPLETE AND MAY BE AMENDED PRIOR TO THE TIME OF SALE. THIS TERM SHEET IS NOT AN OFFER TO SELL THESE SECURITIES AND IT IS NOT A SOLICITATION OF AN OFFER TO BUY THESE SECURITIES IN ANY JURISDICTION WHERE THE OFFER OR SALE IS NOT PERMITTED. |
| | 153 | |
| Structural and Collateral Term Sheet | | BMO 2024-5C3 |
| No. 13 – Highland Hills Apartments |
The following table presents certain information relating to operating history and underwritten cash flows at the Highland Hills Apartment Property:
| Operating History and Underwritten Net Cash Flow |
| | 2020 | 2021 | 2022 | TTM(1) | Underwritten | Per Unit | %(2) |
| Gross Potential Rent | $3,937,142 | $4,045,737 | $3,964,310 | $4,311,613 | $4,680,180 | $10,309 | 100.0 | % |
| Net Rental Income | $3,937,142 | $4,045,737 | $3,964,310 | $4,311,613 | $4,680,180 | $10,309 | 100.0 | % |
| (Vacancy/Credit Loss) | (752,934) | (859,450) | (705,056) | (817,358) | (932,702) | (2,054) | (19.9 | ) |
| Other Income | 420,897 | 469,609 | 556,601 | 561,928 | 561,928 | 1,238 | 12.0 | |
| Effective Gross Income | $3,605,105 | $3,655,896 | $3,815,855 | $4,056,183 | $4,309,406 | $9,492 | 92.1 | % |
| | | | | | | | |
| Total Expenses | $1,599,092 | $1,626,958 | $1,649,407 | $1,746,895 | $1,814,909 | $3,998 | 42.1 | % |
| | | | | | | | |
| Net Operating Income | $2,006,013 | $2,028,939 | $2,166,448 | $2,309,289 | $2,494,497 | $5,494 | 57.9 | % |
| | | | | | | | |
| Total TI/LC, Capex/RR | 0 | 0 | 0 | 0 | 136,200 | 300 | 3.2 | |
| | | | | | | | |
| Net Cash Flow | $2,006,013 | $2,028,939 | $2,166,448 | $2,309,289 | $2,358,297 | $5,194 | 54.7 | % |
| (1) | TTM reflects the trailing 12 months ending October 31, 2023. |
| (2) | % column represents percent of Net Rental Income for revenue fields and represents percent of Effective Gross Income for the remainder of fields. |
THE INFORMATION IN THIS STRUCTURAL AND COLLATERAL TERM SHEET IS NOT COMPLETE AND MAY BE AMENDED PRIOR TO THE TIME OF SALE. THIS TERM SHEET IS NOT AN OFFER TO SELL THESE SECURITIES AND IT IS NOT A SOLICITATION OF AN OFFER TO BUY THESE SECURITIES IN ANY JURISDICTION WHERE THE OFFER OR SALE IS NOT PERMITTED. |
| | 154 | |
| Structural and Collateral Term Sheet | | BMO 2024-5C3 |
| No. 14 – Oak Park Commons |
| Mortgage Loan Information | | Property Information |
| Mortgage Loan Seller: | SGFC | | Single Asset / Portfolio: | Single Asset |
| Original Principal Balance: | $27,000,000 | | Title: | Fee/Leasehold |
| Cut-off Date Principal Balance: | $27,000,000 | | Property Type – Subtype: | Retail – Anchored |
| % of IPB: | 3.0% | | Net Rentable Area (SF): | 342,137 |
| Loan Purpose: | Acquisition | | Location: | Lenexa, KS |
| Borrowers(1): | Various | | Year Built / Renovated: | 1986-1992, 2012, 2022 / NAP |
| Borrower Sponsors: | Francis Greenburger, Chris Brochert and Daniel Stern | | Occupancy: | 87.4% |
| Interest Rate: | 6.77400% | | Occupancy Date: | 12/5/2023 |
| Note Date: | 12/27/2023 | | 4th Most Recent NOI (As of): | NAV |
| Maturity Date: | 1/1/2029 | | 3rd Most Recent NOI (As of): | $3,515,266 (12/31/2021) |
| Interest-only Period: | 60 months | | 2nd Most Recent NOI (As of): | $3,608,536 (12/31/2022) |
| Original Term: | 60 months | | Most Recent NOI (As of): | $3,855,735 (TTM 9/30/2023) |
| Original Amortization Term: | None | | UW Economic Occupancy: | 84.8% |
| Amortization Type: | Interest Only | | UW Revenues: | $5,972,303 |
| Call Protection: | L(25),D(28),O(7) | | UW Expenses: | $2,178,174 |
| Lockbox / Cash Management: | Springing / Springing | | UW NOI: | $3,794,129 |
| Additional Debt: | No | | UW NCF: | $3,554,633 |
| Additional Debt Balance: | N/A | | Appraised Value / Per SF: | $41,900,000 / $122 |
| Additional Debt Type: | N/A | | Appraisal Date: | 11/10/2023 |
| | | | | |
| Escrows and Reserves | | Financial Information |
| | Initial | Monthly | Initial Cap | | Cut-off Date Loan / SF: | $79 |
| Taxes(2): | $336,853 | $88,159 | N/A | | Maturity Date Loan / SF: | $79 |
| Insurance: | $0 | Springing | N/A | | Cut-off Date LTV: | 64.4% |
| CapEx Reserve: | $1,282,469 | $5,702 | N/A | | Maturity Date LTV: | 64.4% |
| Engineering Reserve: | $92,531 | $0 | N/A | | UW NCF DSCR: | 1.92x |
| TI/LC: | $1,282,898 | $9,672 | $400,000 | | UW NOI Debt Yield: | 14.1% |
| Environmental Reserve: | $125,000 | $0 | N/A | | | |
| Debt Service Reserve: | $0 | Springing | $513,206 | | | |
| Other Reserves(3): | $511,344 | $25,000 | $600,000 | | | |
| | | | | | | |
| Sources and Uses |
| Sources | Proceeds | % of Total | | | Uses | Proceeds | % of Total | |
| Mortgage Loan | $27,000,000 | 59.7 | % | | Purchase Price | $40,000,000 | 88.4 | % |
| Sponsor Equity | 16,362,395 | 36.2 | | | Upfront Reserves | 3,631,095 | 8.0 | |
| Seller’s Credit | 1,900,000 | 4.2 | | | Closing Costs | 1,631,300 | 3.6 | |
| Total Sources | $45,262,395 | 100.0 | % | | Total Uses | $45,262,395 | 100.0 | % |
| (1) | The borrowers of the Oak Park Commons Mortgage Loan (as defined below) are Oak Park Commons Cayuga Equities LLC, Oak Park Commons Wall Equities LLC, Oak Park Commons Merrill Equities LLC, Oak Park Commons Holdings LLC, Oak Park Commons Equities LLC, Oak Park Commons CH Equities LLC, Oak Park Commons Bordentown Equities LLC, Oak Park Commons CCBP Equities LLC and Oak Park Commons Lenexa, LLC, collectively, as tenants in common with respect to the Oak Park Commons Property (as defined below). |
| (2) | Initial tax reserves include approximately $264,477 for real estate taxes and approximately $72,376 for the annual taxes due on the Petco tax lot land. |
| (3) | Other reserves include an anchor tenant rollover reserve of approximately $250,000 (approximately $25,000 per month, capped at $600,000) and a free rent reserve of approximately $261,344. |
The Loan. The fourteenth largest mortgage loan, (the “Oak Park Commons Mortgage Loan”) is secured by a first lien mortgage on the borrower’s fee and leasehold interest in a 342,137 square foot retail property located in Lenexa, Kansas (the “Oak Park Commons Property”). The Oak Park Commons Mortgage Loan was originated by Societe Generale Financial Corporation (“SGFC”). The Oak Park Commons Mortgage Loan accrues at an interest rate of 6.77400% per annum. The Oak Park Commons Mortgage Loan has a 5-year term and is interest-only for the full term of the loan.
The Property. The Oak Park Commons Property is an anchored shopping center property comprised of 12, one-story retail buildings, totaling 342,137 square feet on an approximately 37.93-acre site in Lenexa, Kansas. The majority of the Oak
THE INFORMATION IN THIS STRUCTURAL AND COLLATERAL TERM SHEET IS NOT COMPLETE AND MAY BE AMENDED PRIOR TO THE TIME OF SALE. THIS TERM SHEET IS NOT AN OFFER TO SELL THESE SECURITIES AND IT IS NOT A SOLICITATION OF AN OFFER TO BUY THESE SECURITIES IN ANY JURISDICTION WHERE THE OFFER OR SALE IS NOT PERMITTED. |
| | 155 | |
| Structural and Collateral Term Sheet | | BMO 2024-5C3 |
| No. 14 – Oak Park Commons |
Park Commons Property was built between 1986 and 1992, with portions completed in 2012 and 2022. The Oak Park Commons Property has 1,785 parking spaces, resulting in a parking ratio of 5.2 spaces per 1,000 square feet of net rentable area. As of December 5, 2023, the Oak Park Commons Property was 87.4% occupied.
Major Tenants. The three largest tenants at the Oak Park Commons Property based on net rentable area are Hobby Lobby, Ross Dress for Less and Petco.
Hobby Lobby (63,000 square feet; 18.4% of NRA, 10.6% of underwritten base rent, Moody’s/S&P/Fitch: NR/NR/NR): Hobby Lobby is the largest privately owned arts and craft retailer in the world, operating more than 900 stores that offer more than 70,000 crafting and home décor products. Hobby Lobby has over 43,000 employees. Hobby Lobby stores sell arts and crafts supplies, baskets, beads, candles, frames, home decorating accessories, and silk flowers. Hobby Lobby has been a tenant at the Oak Park Commons Property since 2015 under a lease that expires in July 2025, has three, five-year extension options and no termination option.
Ross Dress for Less (25,000 square feet; 7.3% of NRA, 8.7% of underwritten base rent, Moody’s/S&P/Fitch: A2/BBB+/NR): Ross Dress for Less is the largest off-price apparel and home fashion chain in the United States, with 1,765 locations in 43 states, the District of Columbia, and Guam. Ross Dress for Less has been a tenant at the Oak Park Commons Property since 2014 and recently gave notice in August 2023 of its option to renew at the Oak Park Commons Property through January 2030. The lease has three additional five-year extension options and no termination option.
Petco (22,000 square feet; 6.4% of NRA, 8.2% of underwritten base rent, Moody’s/S&P/Fitch: B2/B+/NR): Petco, founded in 1965, operates as a health and wellness company, focused on enhancing the lives of pets, pet parents, and its Petco partners in the United States, Mexico, and Puerto Rico. Petco has been a tenant at the Oak Park Commons Property since 2005 under a lease that expires in March 2024, has three five-year extension options and no termination option. Petco is in the process of finalizing an extension of the lease through March 31, 2027, but such lease amendment has not been executed as of the date hereof. The building that Petco occupies is encumbered by a ground lease with annual payments of $1 per year with no rent escalations that is set to expire on December 31, 2103. The ground lease has no renewal options and the borrower has the right to terminate the ground lease at any time by giving 30 days’ prior notice.
Environmental. According to the Phase I environmental assessment dated October 25, 2023, there was evidence of certain recognized environmental conditions at the Oak Park Commons Property. The current and historical use of the Oak Park Commons Property as a dry cleaning facility since at least the late 1990s and the identified tetrachloroethylene (“PCE”) and trichloroethylene (“TCE”) contaminants in the groundwater at the Oak Park Commons Property is considered a recognized environmental condition to the Oak Park Commons Property. Additionally, the identified PCE and TCE contaminants represent a vapor encroachment condition to the Oak Park Commons Property and a recognized environmental condition relative to vapor migration. The installation of a sub-slab depressurization system was recommended to mitigate this recognized environmental condition. At the origination of the Oak Park Commons Mortgage Loan, the borrower deposited approximately $125,000 into an environmental remediation reserve account in connection with the environmental remediation work. See “Description of the Mortgage Pool—Environmental Considerations” in the Preliminary Prospectus.
The following table presents certain information relating to the historical occupancy of the Oak Park Commons Property:
| Historical and Current Occupancy |
| 2021(1) | 2022(1) | Current(2) |
| 84.6% | 88.1% | 87.4% |
| (1) | Historical Occupancies are as of December 31 of each respective year. |
| (2) | Current Occupancy is as of December 5, 2023. |
THE INFORMATION IN THIS STRUCTURAL AND COLLATERAL TERM SHEET IS NOT COMPLETE AND MAY BE AMENDED PRIOR TO THE TIME OF SALE. THIS TERM SHEET IS NOT AN OFFER TO SELL THESE SECURITIES AND IT IS NOT A SOLICITATION OF AN OFFER TO BUY THESE SECURITIES IN ANY JURISDICTION WHERE THE OFFER OR SALE IS NOT PERMITTED. |
| | 156 | |
| Structural and Collateral Term Sheet | | BMO 2024-5C3 |
| No. 14 – Oak Park Commons |
The following table presents certain information relating to the largest tenants based on the net rentable area of the Oak Park Commons Property:
| Top Tenant Summary(1) |
| Tenant | Ratings
Moody’s/S&P/ Fitch(2) | Net Rentable Area (SF) | % of
Total NRA | UW Base Rent PSF(3) | UW Base Rent(3) | % of Total
UW Base Rent(3) | Sales PSF | Occ. Costs | Lease
Exp. Date |
| Hobby Lobby | NR/NR/NR | 63,000 | 18.4 | % | $7.70 | $485,100 | | 10.6 | % | NAP | NAP | 7/31/2025 |
| Ross Dress for Less | A2/BBB+/NR | 25,000 | 7.3 | | $15.90 | 397,500 | | 8.7 | | NAP | NAP | 1/31/2030 |
| Petco | B2/B+/NR | 22,000 | 6.4 | | $17.00 | 374,000 | | 8.2 | | NAP | NAP | 3/31/2024 |
| K&G Men’s Company, Inc | NR/NR/NR | 20,010 | 5.8 | | $7.50 | 150,075 | | 3.3 | | NAP | NAP | 2/29/2028 |
| Northern Tool & Equipment | NR/NR/NR | 17,018 | 5.0 | | $11.50 | 195,707 | | 4.3 | | NAP | NAP | 8/31/2025 |
| Kids Empire | NR/NR/NR | 15,383 | 4.5 | | $14.00 | 215,362 | | 4.7 | | NAP | NAP | 6/30/2034 |
| Major Tenants | | 162,411 | 47.5 | % | $11.19 | $1,817,744 | | 39.9 | % | | | |
| Other Tenants | | 136,603 | 39.9 | | 20.08 | 2,742,359 | | 60.1 | | | | |
| Occupied Collateral Total / Wtd. Avg. | | 299,014 | 87.4 | % | $15.25 | $4,560,103 | | 100.0 | % | | | |
| | | | | | | | | | |
| Vacant Space | | 43,123 | 12.6 | | | | | | | |
| | | | | | | | | | |
| Collateral Total | | 342,137 | 100.0 | % | | | | | | |
| | | | | | | | | | |
| (1) | Based on the underwritten rent roll dated December 5, 2023. |
| (2) | In certain instances, ratings provided are those of the parent company of the entity shown, whether or not the parent company guarantees the lease. |
| (3) | UW Base Rent PSF, UW Base Rent and % of Total UW Base Rent are inclusive of straight-line rent for Ross Dress for Less. |
THE INFORMATION IN THIS STRUCTURAL AND COLLATERAL TERM SHEET IS NOT COMPLETE AND MAY BE AMENDED PRIOR TO THE TIME OF SALE. THIS TERM SHEET IS NOT AN OFFER TO SELL THESE SECURITIES AND IT IS NOT A SOLICITATION OF AN OFFER TO BUY THESE SECURITIES IN ANY JURISDICTION WHERE THE OFFER OR SALE IS NOT PERMITTED. |
| | 157 | |
| Structural and Collateral Term Sheet | | BMO 2024-5C3 |
| No. 14 – Oak Park Commons |
The following table presents certain information relating to the tenant lease expirations at the Oak Park Commons Property:
| Lease Rollover Schedule(1)(2) |
| Year | Number of Leases Expiring | Net Rentable Area Expiring | % of NRA Expiring | UW Base Rent Expiring(3) | % of UW Base Rent Expiring(3) | Cumulative Net Rentable Area Expiring | Cumulative % of NRA Expiring | Cumulative UW Base Rent Expiring(3) | Cumulative % of UW Base Rent Expiring(3) |
| Vacant | NAP | 43,123 | | 12.6 | % | NAP | NA | P | 43,123 | | 12.6% | | NAP | NAP | |
| MTM | 2 | 2,610 | | 0.8 | | $18,896 | 0.4 | % | 45,733 | | 13.4% | | $18,896 | 0.4% | |
| 2024 | 6 | 39,810 | | 11.6 | | 735,505 | 16.1 | | 85,543 | | 25.0% | | $754,401 | 16.5% | |
| 2025 | 9 | 92,692 | | 27.1 | | 916,163 | 20.1 | | 178,235 | | 52.1% | | $1,670,564 | 36.6% | |
| 2026 | 4 | 13,661 | | 4.0 | | 222,752 | 4.9 | | 191,896 | | 56.1% | | $1,893,316 | 41.5% | |
| 2027 | 6 | 45,198 | | 13.2 | | 812,126 | 17.8 | | 237,094 | | 69.3% | | $2,705,442 | 59.3% | |
| 2028 | 6 | 34,618 | | 10.1 | | 478,137 | 10.5 | | 271,712 | | 79.4% | | $3,183,579 | 69.8% | |
| 2029 | 2 | 3,393 | | 1.0 | | 98,211 | 2.2 | | 275,105 | | 80.4% | | $3,281,790 | 72.0% | |
| 2030 | 2 | 31,314 | | 9.2 | | 481,539 | 10.6 | | 306,419 | | 89.6% | | $3,763,329 | 82.5% | |
| 2031 | 1 | 1,775 | | 0.5 | | 30,175 | 0.7 | | 308,194 | | 90.1% | | $3,793,504 | 83.2% | |
| 2032 | 3 | 7,399 | | 2.2 | | 253,482 | 5.6 | | 315,593 | | 92.2% | | $4,046,986 | 88.7% | |
| 2033 & Beyond | 4 | 26,544 | | 7.8 | | 513,117 | 11.3 | | 342,137 | | 100.0% | | $4,560,103 | 100.0% | |
| Total | 45 | 342,137 | | 100.0 | % | $4,560,103 | 100.0 | % | | | | |
| (1) | Based on the underwritten rent roll dated December 5, 2023. |
| (2) | Certain leases may have termination options that are exercisable prior to the originally stated expiration date of the lease and that are not considered in this Lease Rollover Schedule. |
| (3) | UW Base Rent Expiring, % of UW Base Rent Expiring, Cumulative UW Base Rent Expiring and Cumulative % of UW Base Rent Expiring are inclusive of straight-line rent for Ross Dress for Less. |
The following table presents certain information relating to the operating history and underwritten cash flows of the Oak Park Commons Property:
| Operating History and Underwriting Net Cash Flow |
| | 2021 | 2022 | TTM(1) | Underwritten | Per Square Foot | %(2) |
| Rents in Place | $4,464,451 | $4,510,948 | $4,608,826 | $5,552,684 | | $16.23 | | 78.9 | % |
| Vacant Income | 0 | 0 | 0 | 0 | | 0.00 | | 0.0 | |
| Gross Potential Rent | $4,464,451 | $4,510,948 | $4,608,826 | $5,552,684 | | $16.23 | | 78.9 | % |
| Total Reimbursements | 1,365,041 | 1,185,472 | 1,362,812 | 1,489,200 | | 4.35 | | 21.1 | |
| Other Income | 30,234 | 211,591 | 42,340 | 0 | | 0.00 | | 0.0 | |
| Net Rental Income | $5,859,726 | $5,908,011 | $6,013,978 | $7,041,884 | | $20.58 | | 100.0 | % |
| (Vacancy/Credit Loss)(3) | 65,455 | (20,841) | (9,577) | (1,069,581) | | (3.13) | | (15.2 | ) |
| Effective Gross Income | $5,925,181 | $5,887,170 | $6,004,401 | $5,972,303 | | $17.46 | | 100.0 | % |
| Total Expenses | 2,409,915 | 2,278,634 | 2,148,666 | 2,178,174 | | 6.37 | | 36.5 | |
| Net Operating Income | $3,515,266 | $3,608,536 | $3,855,735 | $3,794,129 | | $11.09 | | 63.5 | % |
| Capital Expenditures | 0 | 0 | 0 | 68,427 | | 0.20 | | 1.1 | |
| TI/LC | 0 | 0 | 0 | 171,069 | | 0.50 | | 2.9 | |
| Net Cash Flow | $3,515,266 | $3,608,536 | $3,855,735 | $3,554,633 | | $10.39 | | 59.5 | % |
| (1) | TTM reflects the trailing 12-month period ending September 30, 2023. |
| (2) | % column represents percent of Net Rental Income for all revenue and vacancy/credit loss lines and represents percent of Effective Gross Income for the remainder of fields. |
| (3) | The underwritten economic vacancy is 15.2%. The Oak Park Commons Property was 87.4% physically occupied as of December 5, 2023. |
THE INFORMATION IN THIS STRUCTURAL AND COLLATERAL TERM SHEET IS NOT COMPLETE AND MAY BE AMENDED PRIOR TO THE TIME OF SALE. THIS TERM SHEET IS NOT AN OFFER TO SELL THESE SECURITIES AND IT IS NOT A SOLICITATION OF AN OFFER TO BUY THESE SECURITIES IN ANY JURISDICTION WHERE THE OFFER OR SALE IS NOT PERMITTED. |
| | 158 | |
| Structural and Collateral Term Sheet | | BMO 2024-5C3 |
| No. 14 – Oak Park Commons |
The Market. The Oak Park Commons Property is located in Lenexa, Kansas, within the Kansas City, MO-KS core-based statistical area in Johnson County, Kansas. According to the appraisal, unemployment for the region as of July 2023 was at 3.4%, below the national average of 3.5%. The workforce grew by 0.9% and 5,232 jobs were added, compared to 12 months prior. The education and health services sector, accounting for the highest share of regional employment, increased 5.1% year-over-year and the second largest sector, trade, transportation, and utilities, grew 0.7%.
The Oak Park Commons Property fronts two major arterial streets with relatively high traffic volumes, Quivira Road and 95th Street. According to the appraisal, average traffic counts along Quivira Road range from 18,000 to 23,000 vehicles per day and along 95th Street, the range is 21,200 to 25,200 vehicles per day. The local area benefits from excellent freeway access. Interstate 435 is a circumferential highway that extends from east to west through the southeastern portion of the neighborhood before curving northward. It provides access to suburban areas to the north and east of the local area and also provides the most convenient route to the Kansas City International Airport. According to the appraisal, the estimated 2022 population within a one-, three- and five-mile radius of the Oak Park Commons Property was 10,419, 98,393 and 240,307, respectively. Additionally, for the same period, the average household income within the same radii was $91,429, $98,473 and $109,101, respectively.
According to the appraisal, the Oak Park Commons Property is located within the Kansas City retail market and the Johnson County retail submarket. As of the third quarter 2023, the Kansas City retail market contained approximately 26.6 million square feet of retail space inventory with a vacancy rate of 11.2% and an average asking rental rate of $14.87 per square foot. As of the third quarter 2023, the Kansas City retail market reported no completions and negative absorption of 20,000 square feet. The Johnson County retail submarket contained approximately 13.2 million square feet of retail space with a vacancy rate of 10.4% and an average asking rental rate of $16.01 per square foot as of third quarter 2023. The Johnson County retail submarket reported no completions and negative absorption of 32,000 square feet.
THE INFORMATION IN THIS STRUCTURAL AND COLLATERAL TERM SHEET IS NOT COMPLETE AND MAY BE AMENDED PRIOR TO THE TIME OF SALE. THIS TERM SHEET IS NOT AN OFFER TO SELL THESE SECURITIES AND IT IS NOT A SOLICITATION OF AN OFFER TO BUY THESE SECURITIES IN ANY JURISDICTION WHERE THE OFFER OR SALE IS NOT PERMITTED. |
| | 159 | |
| Structural and Collateral Term Sheet | | BMO 2024-5C3 |
| No. 15 – Garden State Plaza |
| Mortgage Loan Information | | Property Information |
| Mortgage Loan Seller: | GSMC, GACC | | Single Asset / Portfolio: | Single Asset |
| Original Principal Balance(1): | $25,000,000 | | Title: | Fee |
| Cut-off Date Principal Balance(1): | $25,000,000 | | Property Type – Subtype: | Retail – Super Regional Mall |
| % of IPB: | 2.8% | | Net Rentable Area (SF)(6)(7): | 2,057,906 |
| Loan Purpose: | Refinance | | Location: | Paramus, NJ |
Borrower (2):
| Westland Garden State Plaza Limited Partnership | | Year Built / Renovated: | 1957 / 1981, 1986, 1993, 1994, 2014, 2017, 2021 |
Borrower Sponsors:
| Unibail-Rodamco-Westfield and affiliates of The Prudential Assurance Company Limited | | Occupancy(7): | 94.9% |
| Interest Rate(3): | 6.61300% | | Occupancy Date: | 9/13/2023 |
| Note Date: | 12/11/2023 | | 4th Most Recent NOI (As of): | $83,636,399 (12/31/2020) |
| Maturity Date: | 1/6/2029 | | 3rd Most Recent NOI (As of): | $99,169,720 (12/31/2021) |
| Interest-only Period: | 60 months | | 2nd Most Recent NOI (As of): | $96,638,742 (12/31/2022) |
| Original Term: | 60 months | | Most Recent NOI (As of): | $97,794,310 (TTM 9/30/2023) |
| Original Amortization Term: | None | | UW Economic Occupancy: | 92.1% |
| Amortization Type: | Interest Only | | UW Revenues: | $144,104,515 |
| Call Protection(4): | L(25),DorYM1(28),O(7) | | UW Expenses: | $38,201,821 |
| Lockbox / Cash Management: | Hard / Springing | | UW NOI: | $105,902,693 |
| Additional Debt(1): | Yes | | UW NCF: | $104,725,782 |
| Additional Debt Balance(1): | $500,000,000 | | Appraised Value / Per SF: | $1,814,000,000 / $881 |
| Additional Debt Type(1): | Pari Passu | | Appraisal Date: | 10/23/2023 |
| | | | | |
| | | | | |
| Escrows and Reserves | | Financial Information(1) |
| | Initial | Monthly | Initial Cap | | Cut-off Date Loan / SF: | $255 | |
| Taxes: | $0 | Springing | N/A | | Maturity Date Loan / SF: | $255 | |
| Insurance: | $0 | Springing | N/A | | Cut-off Date LTV: | 28.9% | |
| Replacement Reserves: | $0 | Springing | $367,747 | | Maturity Date LTV: | 28.9% | |
| TI/LC Reserve: | $0 | Springing | $1,838,735 | | UW NCF DSCR: | 2.98x | |
| Other(5): | $0 | $0 | N/A | | UW NOI Debt Yield: | 20.2% | |
| | | | | | | | |
| | | | | | | |
| Sources and Uses |
| Sources | Proceeds | % of Total | | Uses | Proceeds | % of Total | |
| Whole Loan(1) | $525,000,000 | 98.4 | % | | Loan Payoff | $526,745,637 | 98.7 | % |
| Equity Contribution | 8,659,157 | 1.6 | | | Closing Costs(8) | 6,913,520 | 1.3 | |
| | | | | | | |
| Total Sources | $533,659,157 | 100.0 | % | | Total Uses | $533,659,157 | 100.0 | % |
| (1) | The Garden State Plaza Mortgage Loan (as defined below) is part of the Garden State Plaza Whole Loan (as defined below), which is evidenced by ten pari passu promissory notes with an aggregate principal balance as of the Cut-off Date of $525,000,000. The Financial Information in the chart above is based on the aggregate principal balance of the promissory notes comprising the Garden State Plaza Whole Loan. |
| (2) | There is no non-recourse carveout guarantor with respect to the Garden State Plaza Whole Loan. |
| (3) | For purposes of calculating interest and other amounts payable on the Garden State Plaza Whole Loan, each note was divided into multiple components with varying interest rates. The interest rate of the Garden State Plaza Whole Loan represents the approximate weighted average interest rate of two components. Prepayments of the Garden State Plaza Whole Loan will be applied to the components in sequential order. As a result of the components having different interest rates and the allocation of prepayments to sequentially reduce the components, the per annum weighted average interest rate of the components (and, therefore, the interest rate of the Garden State Plaza Whole Loan) may increase over time. |
| (4) | Voluntary prepayment with yield maintenance or defeasance of the Garden State Plaza Whole Loan is permitted at any time after the date that is the earliest to occur of (i) two years after the closing date of the securitization that includes the last Garden State Plaza Whole Loan note to be securitized and (ii) December 11, 2026 (or in the case of prepayments to cure a cash sweep, at any time after the origination date). The assumed lockout period of 25 payments is based on the anticipated closing date of the BMO 2024-5C3 securitization trust in February 2024. The actual lockout period may be longer. |
| (5) | Other Reserves were not funded at origination; a reserve guaranty in the amount of $28,079,978.61 was provided in lieu, consisting of (a) $27,864,885.70 to be used for tenant improvements, tenant improvement allowances and leasing commissions that were outstanding under any executed leases in effect as of the origination date, and (b) $215,092.91 to be used to make deposits into the deposit account in lieu of any base rent payments abated or not yet begun pursuant to any free rent periods or gap rent periods that were still outstanding under any executed leases in effect as of the origination date. |
| (6) | Size includes the Lord & Taylor box, specialty tenants and excludes two free-standing units (Best Buy & Bank of America) that are set to be demolished (such free-standing units were not included in the underwritten rent roll). 832,083 SF of the Size is related to tenants on ground leases, including Macy’s, Neiman Marcus, Nordstrom, and Chilis/On The Border. |
THE INFORMATION IN THIS STRUCTURAL AND COLLATERAL TERM SHEET IS NOT COMPLETE AND MAY BE AMENDED PRIOR TO THE TIME OF SALE. THIS TERM SHEET IS NOT AN OFFER TO SELL THESE SECURITIES AND IT IS NOT A SOLICITATION OF AN OFFER TO BUY THESE SECURITIES IN ANY JURISDICTION WHERE THE OFFER OR SALE IS NOT PERMITTED. |
| | 160 | |
| Structural and Collateral Term Sheet | | BMO 2024-5C3 |
| No. 15 – Garden State Plaza |
| (7) | Included in the occupancy figures is Papaya (8,531 SF / 0.4% of Size). Papaya executed their lease in January 2022 but never took occupancy at the Garden State Plaza Property (as defined below). There is no UW total rent attributed to the failed Papaya occupancy. Occupancy is 91.0% when excluding ground lease tenants and Lord & Taylor and 81.3% while excluding ground lease tenants and including the Lord & Taylor box and treating the box as vacant. Occupancy is 88.9% when including ground lease tenants and Lord & Taylor box and treating the box as vacant. |
| (8) | There was no rate buydown or origination fee paid by the borrower. |
The Loan. The fifteenth largest mortgage loan (the “Garden State Plaza Mortgage Loan”) is part of a whole loan (the “Garden State Plaza Whole Loan”) evidenced by ten pari passu notes that are secured by the borrower’s fee simple interest in an 2,057,906 square foot retail property located in Paramus, New Jersey (the “Garden State Plaza Property”). The Garden State Plaza Mortgage Loan, which is evidenced by the non-controlling notes A-1-C3 and A-2-C2, has an aggregate outstanding principal balance as of the Cut-off Date of $25,000,000. The Garden State Plaza Whole Loan was co-originated by Goldman Sachs Bank USA (“GSBI”), German American Capital Corporation (“GACC”) and Natixis Real Estate Capital LLC (“NREC”) and has an aggregate outstanding principal balance as of the Cut-off Date of $525,000,000. The Garden State Plaza Whole Loan has a five-year interest-only term and accrues interest at a fixed rate of 6.61300% per annum. The Garden State Plaza Whole Loan has an initial term of 60 months and has a remaining term of 59 months as of the Cut-off Date. The scheduled maturity date of the Garden State Plaza Whole Loan is the payment date that occurs on January 6, 2029. GSMC is selling Note A-1-C3 with an aggregate outstanding principal balance of $10,000,000 as of the Cut-off Date and GACC is selling Note A-2-C2 in the outstanding principal balance of $15,000,000 as of the Cut-off Date, to the BMO 2024-5C3 securitization transaction. The remaining notes are currently held by NREC and other securitization trusts and are expected to be contributed to one or more future securitization trust(s).
The table below identifies the promissory notes that comprise the Garden State Plaza Whole Loan. The relationship between the holders of the Garden State Plaza Whole Loan will be governed by a co-lender agreement as described under “Description of the Mortgage Pool – The Whole Loans – The Outside Serviced Pari Passu Mortgage Loans” in the Preliminary Prospectus.
| Whole Loan Summary |
| Note | Original Balance | Cut-off Date Balance | Note Holder | Controlling Piece |
| A-1-S1 | $170,000,000 | $170,000,000 | NJ Trust 2023-GSP | Yes |
| A-2-S1 | $127,500,000 | $127,500,000 | NJ Trust 2023-GSP | No |
| A-3-S1 | $127,500,000 | $127,500,000 | NJ Trust 2023-GSP | No |
| A-1-C1 | $20,000,000 | $20,000,000 | Benchmark 2024-V5 | No |
| A-1-C2 | $10,000,000 | $10,000,000 | Benchmark 2024-V5 | No |
| A-1-C3 | $10,000,000 | $10,000,000 | BMO 2024-5C3 | No |
| A-2-C1 | $15,000,000 | $15,000,000 | Benchmark 2024-V5 | No |
| A-2-C2 | $15,000,000 | $15,000,000 | BMO 2024-5C3 | No |
| A-3-C1 | $15,000,000 | $15,000,000 | NREC(1) | No |
| A-3-C2 | $15,000,000 | $15,000,000 | NREC(1) | No |
| Whole Loan | $525,000,000 | $525,000,000 | | |
| (1) | Expected to be contributed to one or more future securitization trust(s). |
The Property. The Garden State Plaza Property is a 2,057,906 SF super regional mall featuring a mix of retail and entertainment tenants. The Garden State Plaza Property is located at the cross section of Route 4, Route 17, and the Garden State Parkway, which, combined, see over approximately 105,000 vehicles per day, providing both nearby residents and visitors accessibility to the Garden State Plaza Property’s roster of over 300 tenants, which includes four leased fee department stores (Macy’s / Neiman Marcus / Nordstrom / Chilis/On The Border).
As of October 2023 TTM, the Garden State Plaza Property achieved approximately $893 million in total sales with in-line <10,000 SF comparable sales of $1,034 PSF during the same period despite most tenants being closed on Sundays due to the “blue laws” in Bergen County, New Jersey, which prohibit the sale of most consumer discretionary goods on Sundays. In-line <10,000 SF comparable sales increased 50.7% from 2020 sales of $686 PSF. According to a third-party data analytics firm which tracks foot traffic, the Garden State Plaza Property is home to the 11th ranked AMC in the United States, generating nearly $15.9 million in sales over October 2023 TTM (approximately $996,000 per screen), as well as the 5th ranked Macy’s, 9th ranked Nordstrom and 12th ranked Neiman Marcus.
THE INFORMATION IN THIS STRUCTURAL AND COLLATERAL TERM SHEET IS NOT COMPLETE AND MAY BE AMENDED PRIOR TO THE TIME OF SALE. THIS TERM SHEET IS NOT AN OFFER TO SELL THESE SECURITIES AND IT IS NOT A SOLICITATION OF AN OFFER TO BUY THESE SECURITIES IN ANY JURISDICTION WHERE THE OFFER OR SALE IS NOT PERMITTED. |
| | 161 | |
| Structural and Collateral Term Sheet | | BMO 2024-5C3 |
| No. 15 – Garden State Plaza |
The borrower sponsors have contributed significant capital to the Garden State Plaza Property in recent years, including approximately $250 million in capital expenditures since 2017. The borrower recently signed leases with entertainment and food and beverage tenants, including Pinstripes, Nerf Action Experience, Planet Playskool, and Fogo de Chao. Nerf Action Experience has not yet taken occupancy, and we cannot assure you that the tenant will do so as expected or at all.
Major Tenants.
Macy’s (439,632 SF; 22.0% of Net Rentable Area (“NRA”); 10.6% of underwritten base rent): Macy’s is an American department store chain featuring the Macy’s Bloomingdale’s and Bluemercury nameplates. Founded in 1858 as a dry goods store in New York City, Macy’s has 784 boxes at 723 locations as of October 28, 2023. Macy’s has been a tenant at the Garden State Plaza Property since 1957. NRA
includes four ground lease tenants and the Lord & Taylor box (130,000 SF) that is expected to be redeveloped and excludes specialty
tenants (including temporary tenants, RMUs / Carts, Specialty Tenants, ATMs, Trash and Non-Leasable Space).
AMC (95,818 SF; 4.8% of NRA; 4.1% of underwritten base rent): AMC is the largest movie exhibition company in the world. Founded in 1920, AMC owned or operated approximately 900 theaters and 10,000 screens across the globe as of June 30, 2023. AMC has been a tenant at the Garden State Plaza Property since 2005.
Zara (23,573 SF; 1.2% of NRA; 4.0% of underwritten base rent): Zara is a Spanish multinational retail clothing chain. Founded in 1975, Zara had 2,237 locations as of October 31, 2023. Zara has been a tenant at the Garden State Plaza Property since 2016.
The following table presents certain information relating to the historical and current occupancy of the Garden State Plaza Property:
| Historical and Current Occupancy(1) |
| 2020 | 2021 | 2022 | Current |
| 95.0% | 94.2% | 94.6% | N/A |
| (1) | 2020-2022 historical occupancy is based on total mall physical occupancy, excluding Lord & Taylor. U/W occupancy is 94.9% based on the September 13, 2023 rent roll (including signed not occupied tenants and adjusted for recent leasing updates and excluding Lord & Taylor box). UW Economic Occupancy is 92.1% |
THE INFORMATION IN THIS STRUCTURAL AND COLLATERAL TERM SHEET IS NOT COMPLETE AND MAY BE AMENDED PRIOR TO THE TIME OF SALE. THIS TERM SHEET IS NOT AN OFFER TO SELL THESE SECURITIES AND IT IS NOT A SOLICITATION OF AN OFFER TO BUY THESE SECURITIES IN ANY JURISDICTION WHERE THE OFFER OR SALE IS NOT PERMITTED. |
| | 162 | |
| Structural and Collateral Term Sheet | | BMO 2024-5C3 |
| No. 15 – Garden State Plaza |
The following table presents certain information relating to the largest tenants at the Garden State Plaza Property:
| Tenant Summary(1)(2) |
| Tenant | Ratings Moody’s/S&P/Fitch(3) | Net Rentable Area (SF) | % of Total NRA | UW Base Rent PSF | UW Base Rent | % of Total UW Base Rent | Lease Expiration Date |
| Macy's | Ba2/BB+/BBB- | 439,632 | 22.0 | % | $18.76 | $8,245,410 | 10.6 | % | 7/31/2026 |
| AMC | Caa2/CCC+/NR | 95,818 | 4.8 | | 33.50 | 3,209,903 | 4.1 | | 5/31/2027 |
| Zara | NR/NR/NR | 23,573 | 1.2 | | 132.07 | 3,113,286 | 4.0 | | 10/31/2026 |
| Nordstrom | Ba1/BB+/BB+ | 245,348 | 12.3 | | 10.44 | 2,562,525 | 3.3 | | 7/31/2026 |
| H&M | NR/BBB/NR | 23,851 | 1.2 | | 89.65 | 2,138,242 | 2.8 | | 1/31/2026 |
| Victoria's Secret | B1/BB-/NR | 13,927 | 0.7 | | 109.95 | 1,531,274 | 2.0 | | 1/31/2026 |
| Gap | B1/BB/NR | 11,744 | 0.6 | | 117.17 | 1,376,044 | 1.8 | | 6/30/2026 |
| Express/Express Men | NR/NR/NR | 9,999 | 0.5 | | 129.84 | 1,298,270 | 1.7 | | 1/31/2027 |
| Hollister | NR/BB-/NR | 9,329 | 0.5 | | 126.81 | 1,182,973 | 1.5 | | 1/31/2024 |
| Gucci | NR/A/NR | 6,231 | 0.3 | | 106.09 | 661,047 | 0.9 | | 1/31/2033 |
| Major Tenants | | 879,452 | 44.1 | % | $28.79 | $25,318,974 | 32.6 | % | |
| Other Tenants | | 886,981 | 44.4 | | 59.03 | 52,358,944 | 67.4 | | |
| Total Occupied | | 1,766,433 | 88.5 | % | $43.97 | $77,677,918 | 100.0 | % | |
| Vacant Space | | 229,113 | 11.5 | | | | | |
| Total / Wtd. Avg. | | 1,995,546 | 100.0 | % | | | | |
| (1) | Based on the underwritten rent roll dated September 13, 2023, inclusive of contractual rent steps through December 31, 2024. |
| (2) | Includes four ground lease tenants and the Lord & Taylor box (130,000 SF) that is expected to be redeveloped. Excludes Specialty Tenants (including temporary tenants, RMUs / Carts, Specialty Tenants, ATMs, Trash and Non-Leasable Space). |
| (3) | Certain ratings are those of the parent company whether or not the parent guarantees the lease. |
The following table presents certain information relating to the tenant lease expiration dates at the Garden State Plaza Property:
Lease Rollover
Schedule(1)(2)(3)(4) |
Year | Number of Leases Expiring | Net Rentable Area Expiring | % of Net Rental Area Expiring | UW Base Rent Expiring | % of UW Base Rent Expiring | Cumulative Net Rentable Area Expiring | Cumulative % of NRA Expiring | Cumulative UW Base Rent Expiring | Cumulative % of UW Base Rent Expiring |
| Vacant | NAP | 229,113 | 11.5 | % | NAP | NAP | | 229,113 | | 11.5% | | NAP | NAP | |
| MTM | 9 | 15,015 | 0.8 | | $1,524,784 | 2.0 | % | 244,128 | | 12.2% | | $1,524,784 | 2.0% | |
| 2023 | 3 | 5,742 | 0.3 | | 411,442 | 0.5 | | 249,870 | | 12.5% | | $1,936,226 | 2.5% | |
| 2024 | 41 | 146,113 | 7.3 | | 10,891,053 | 14.0 | | 395,983 | | 19.8% | | $12,827,278 | 16.5% | |
| 2025 | 34 | 114,472 | 5.7 | | 8,013,601 | 10.3 | | 510,455 | | 25.6% | | $20,840,879 | 26.8% | |
| 2026 | 41 | 842,236 | 42.2 | | 24,775,533 | 31.9 | | 1,352,691 | | 67.8% | | $45,616,413 | 58.7% | |
| 2027 | 18 | 137,733 | 6.9 | | 7,712,433 | 9.9 | | 1,490,424 | | 74.7% | | $53,328,846 | 68.7% | |
| 2028 | 26 | 94,184 | 4.7 | | 6,379,937 | 8.2 | | 1,584,608 | | 79.4% | | $59,708,782 | 76.9% | |
| 2029 | 13 | 30,826 | 1.5 | | 2,415,433 | 3.1 | | 1,615,434 | | 81.0% | | $62,124,215 | 80.0% | |
| 2030 | 8 | 18,855 | 0.9 | | 1,520,902 | 2.0 | | 1,634,289 | | 81.9% | | $63,645,117 | 81.9% | |
| 2031 | 10 | 28,244 | 1.4 | | 1,582,656 | 2.0 | | 1,662,533 | | 83.3% | | $65,227,772 | 84.0% | |
| 2032 | 14 | 60,822 | 3.0 | | 4,832,928 | 6.2 | | 1,723,355 | | 86.4% | | $70,060,700 | 90.2% | |
| 2033 | 9 | 35,832 | 1.8 | | 2,649,518 | 3.4 | | 1,759,187 | | 88.2% | | $72,710,218 | 93.6% | |
| 2034 | 7 | 14,723 | 0.7 | | 1,333,891 | 1.7 | | 1,773,910 | | 88.9% | | $74,044,109 | 95.3% | |
| 2035 & Beyond | 4 | 221,636 | 11.1 | | 3,633,809 | 4.7 | | 1,995,546 | | 100.0% | | $77,677,918 | 100.0% | |
| Total | 237 | 1,995,546 | 100.0 | % | $77,677,918 | 100.0 | % | | | | |
| (1) | Based on the underwritten rent roll dated September 13, 2023, inclusive of contractual rent steps through December 31, 2024. |
| (2) | Lease Rollover Schedule is based on the lease expiration dates of all direct leases in place. Certain tenants have more than one lease. |
| (3) | Certain tenants may have lease termination options that are exercisable prior to the originally stated expiration date of the related lease and are not considered in the lease rollover schedule. |
| (4) | Includes four ground lease tenants and the Lord & Taylor box (130,000 SF) that is expected to be redeveloped. Excludes Specialty Tenants (including temporary tenants, RMUs / Carts, Specialty Tenants, ATMs, Trash and Non-Leasable Space). |
THE INFORMATION IN THIS STRUCTURAL AND COLLATERAL TERM SHEET IS NOT COMPLETE AND MAY BE AMENDED PRIOR TO THE TIME OF SALE. THIS TERM SHEET IS NOT AN OFFER TO SELL THESE SECURITIES AND IT IS NOT A SOLICITATION OF AN OFFER TO BUY THESE SECURITIES IN ANY JURISDICTION WHERE THE OFFER OR SALE IS NOT PERMITTED. |
| | 163 | |
| Structural and Collateral Term Sheet | | BMO 2024-5C3 |
| No. 15 – Garden State Plaza |
The following table presents certain information relating to the operating history and underwritten cash flows of the Garden State Plaza Property:
| Operating History and Underwritten Net Cash Flow |
| | 2020 | 2021 | 2022 | T12 September 2023 | Underwritten | Per Square Foot(1) | % | (2) |
| Base Rent(3) | $70,561,683 | $62,653,106 | $72,900,770 | $74,113,270 | | $77,677,918 | | $37.75 | | 49.6 | % |
| Credit Tenant Rent Steps | 0 | 0 | 0 | 0 | | 479,516 | | 0.23 | | 0.3 | |
| Gross Up Vacancy | 0 | 0 | 0 | 0 | | 12,415,019 | | 6.03 | | 7.9 | |
| Gross Potential Rent | $70,561,683 | $62,653,106 | $72,900,770 | $74,113,270 | | $90,572,453 | | $44.01 | | 57.9 | % |
| Total Reimbursements | 41,338,653 | 41,537,014 | 43,871,404 | 45,341,052 | | 45,761,082 | | 22.24 | | 29.2 | |
| Other Income(4) | 18,699,061 | 25,100,491 | 19,573,269 | 20,512,274 | | 20,185,999 | | 9.81 | | 12.9 | |
| Net Rental Income | $130,599,397 | $129,290,611 | $136,345,443 | $139,966,597 | | $156,519,534 | | $76.06 | | 100.0 | % |
| (Vacancy/Credit Loss) | (10,396,417) | 6,311,699 | (1,395,330) | (2,667,966) | | (12,415,019) | | (6.03) | | (7.9 | ) |
| Effective Gross Income | $120,202,980 | $135,602,310 | $134,950,113 | $137,298,631 | | $144,104,515 | | $70.02 | | 92.1 | % |
| Management Fee | 1,000,000 | 1,000,000 | 1,000,000 | 1,000,000 | | 1,000,000 | | 0.49 | | 0.7 | |
| Real Estate Taxes | 17,474,349 | 17,095,850 | 17,793,973 | 18,650,118 | | 17,347,618 | | 8.43 | | 12.0 | |
| Insurance | 1,136,549 | 1,343,689 | 790,774 | 1,213,905 | | 1,213,905 | | 0.59 | | 0.8 | |
| Other Expenses(5) | 16,955,684 | 16,993,051 | 18,726,625 | 18,640,298 | | 18,640,298 | | 9.06 | | 12.9 | |
| Total Expenses | $36,566,582 | $36,432,590 | $38,311,371 | $39,504,321 | | $38,201,821 | | $18.56 | | 26.5 | % |
| Net Operating Income | $83,636,399 | $99,169,720 | $96,638,742 | $97,794,310 | | $105,902,693 | | $51.46 | | 73.5 | % |
| Capital Expenditures | 0 | 0 | 0 | 0 | | 245,165 | | 0.12 | | 0.2 | |
| TI/LC | 0 | 0 | 0 | 0 | | 931,746 | | 0.45 | | 0.6 | |
| Net Cash Flow | $83,636,399 | $99,169,720 | $96,638,742 | $97,794,310 | | $104,725,782 | | $50.89 | | 72.7 | % |
| (1) | Based on total property square footage of 2,057,906. |
| (2) | % column represents percent of Net Rental Income for all revenue lines and represents percent of Effective Gross Income for the remainder of fields. |
| (3) | Based on the underwritten rent roll dated September 13, 2023, inclusive of contractual rent steps through December 31, 2024. |
| (4) | Other Income consists of overage rent, specialty revenue, storage income and parking income. |
| (5) | Other Expenses consists of utilities, repairs and maintenance, janitorial, payroll and specialty leasing expenses. |
The Market. Located in Paramus, New Jersey, the Garden State Plaza Property’s trade area lies primarily within a 10-mile radius that serves a population of over 2.35 million people and over 871,000 households. The Garden State Plaza Property is located in the Route 4 / 17 submarket of the Northern New Jersey market, which is considered an upper tier submarket compared to other submarkets in the Northern New Jersey market and is considered the prime retail corridor in the area according to the appraisal. Both the Route 4 / 17 submarket and the Northern New Jersey market feature vacancy rates of 2.8% and 4.0%, respectively, as of the third quarter of 2023. These vacancy rates have continued to fall post-COVID. Route 4 / 17 submarket vacancy decreased to 2.8% from 5.0% in the third quarter of 2021 while the Northern New Jersey market vacancy rates decreased to 4.0% from 4.3% in the same time period.
THE INFORMATION IN THIS STRUCTURAL AND COLLATERAL TERM SHEET IS NOT COMPLETE AND MAY BE AMENDED PRIOR TO THE TIME OF SALE. THIS TERM SHEET IS NOT AN OFFER TO SELL THESE SECURITIES AND IT IS NOT A SOLICITATION OF AN OFFER TO BUY THESE SECURITIES IN ANY JURISDICTION WHERE THE OFFER OR SALE IS NOT PERMITTED. |
| | 164 | |
| Structural and Collateral Term Sheet | BMO 2024-5C3 |
| Contacts |
| BMO Capital Markets CMBS Capital Markets & Banking |
| Contact | E-mail | Phone Number |
| Paul Vanderslice | paul.vanderslice@bmo.com | (917) 996-4514 |
| Managing Director | | |
| | | |
| David Schell | david.schell@bmo.com | (347) 996-0721 |
| Managing Director | | |
| | | |
| Ravish Kamath | ravish.kamath@bmo.com | (347) 668-1507 |
| Director | | |
| | | |
| BMO Capital Markets CMBS Trading & Structuring |
| Contact | E-Mail | Phone Number |
| Andrew Noonan | andrew.noonan@bmo.com | (347) 466-3147 |
| Managing Director | | |
| | | |
| Mary Kunka | mary.kunka@bmo.com | (347) 956-1226 |
| Managing Director | | |
| | | |
| Kiran Manda | kiran.manda@bmo.com | (347) 831-4776 |
| Managing Director | | |
| | | |
| Michael Chen | lei4.chen@bmo.com | (646) 265-0023 |
| Director | | |
| | | |
| BMO Capital Markets Securitized Products Syndicate |
| Contact | E-Mail | Phone Number |
| Alex Smith-Constantine | alex.smithconstantine@bmo.com | (212) 702-1866 |
| Managing Director | | |
| | | |
| Trinian Donohoe | trinian.donohoe@bmo.com | (212) 702-1866 |
| Vice President | | |
| | | |
| Citigroup CMBS Capital Markets and Securitization | |
| Contact | Contact | Contact |
| Rick Simpson | richard.simpson@citi.com | (212) 816-5343 |
| Managing Director | | |
| | | |
| Jason Mercandetti | jason.mercandetti@citi.com | (212) 816-6384 |
| Director | | |
| | | |
| Citigroup Structuring, Trading & Syndicate | |
| Contact | E-Mail | Phone Number |
| Raul Orozco | raul.d.orozco@citi.com | (212) 723-1295 |
| Managing Director | | |
| | | |
| Matt Perry | mattison.perry@citi.com | (212) 723-1295 |
| Director | | |
| | | |
| Societe Generale Banking & Capital Markets |
| Contact | E-Mail | Phone Number |
| Jim Barnard | jim.barnard@sgcib.com | (212) 278-6263 |
| Director | | |
| | | |
| Justin Cappuccino | justin.cappuccino@sgcib.com | (212) 278-6393 |
| Director | | |
| | | |
| Russell Yu | russell.yu@sgcib.com | (212) 278-5467 |
| Vice President | | |
| | | |
THE INFORMATION IN THIS STRUCTURAL AND COLLATERAL TERM SHEET IS NOT COMPLETE AND MAY BE AMENDED PRIOR TO THE TIME OF SALE. THIS TERM SHEET IS NOT AN OFFER TO SELL THESE SECURITIES AND IT IS NOT A SOLICITATION OF AN OFFER TO BUY THESE SECURITIES IN ANY JURISDICTION WHERE THE OFFER OR SALE IS NOT PERMITTED. |
| | 165 | |
| Structural and Collateral Term Sheet | BMO 2024-5C3 |
| Contacts |
| Societe Generale Syndicate & Trading |
| Contact | E-Mail | Phone Number |
| Mark Lacerenza | mark.lacerenza@sgcib.com | (212) 278-5243 |
| Managing Director | | |
| | | |
| Claire Weiss | claire.weiss@sgcib.com | (212) 278-6570 |
| Director | | |
| | | |
| John D'Elisa | john.d'elisa@sgcib.com | (212) 278-4608 |
| Director | | |
| | | |
| Philip Yenikomshian | philip.yenikomshian@sgcib.com | (212) 278-5155 |
| Director | | |
| | | |
| Kevin Lu | kevin.lu@sgcib.com | (212) 278-5692 |
| Vice President | | |
| | | |
| Deutsche Bank Securities Banking | |
| Contact | Contact | Contact |
| Lainie Kaye | lainie.kaye@db.com | (212) 250-5270 |
| Managing Director | | |
| | | |
| Michael Miller | michael.miller@db.com | (212) 250-0099 |
| Vice President | | |
| | | |
| Sam Lockwood | sam.lockwood@db.com | (212) 250-4569 |
| Vice President | | |
| |
| Deutsche Bank Securities Trading & Structuring | |
| Contact | Contact | Contact |
| Shaishav Agarwal | shaishav.agarwal@db.com | (212) 250-6290 |
| Managing Director | | |
| | | |
| Dan Penn | daniel.penn@db.com | (212) 250-5149 |
| Managing Director | | |
| | | |
| Matt Smith | matt-t.smith@db.com | (212) 250-6155 |
| Director | | |
| | | |
| Ryan Horvath | ryan.horvath@db.com | (212) 250-5149 |
| Director | | |
| | | |
| Goldman Sachs Real Estate Financing Group - Securitization |
| Contact | E-Mail | Phone Number |
| Scott Epperson | scott.epperson@gs.com | (212) 934-2882 |
| Managing Director | | |
| | | |
| Justin Peterson | justin.peterson@gs.com | (212) 902-4283 |
| Vice President | | |
| | | |
| Raymond Todd | raymond.todd@gs.com | (972) 501-3979 |
| Vice President | | |
| | | |
| Goldman Sachs Real Estate Financing Group - Capital Markets |
| Contact | E-Mail | Phone Number |
| Nitin Jagga | nitin.jagga@gs.com | (212) 855-9035 |
| Vice President | | |
| | | |
| Rebecca Bayard | rebecca.bayard@gs.com | (212) 934-0848 |
| Vice President | | |
| | | |
| | | |
THE INFORMATION IN THIS STRUCTURAL AND COLLATERAL TERM SHEET IS NOT COMPLETE AND MAY BE AMENDED PRIOR TO THE TIME OF SALE. THIS TERM SHEET IS NOT AN OFFER TO SELL THESE SECURITIES AND IT IS NOT A SOLICITATION OF AN OFFER TO BUY THESE SECURITIES IN ANY JURISDICTION WHERE THE OFFER OR SALE IS NOT PERMITTED. |
| | 166 | |
| Structural and Collateral Term Sheet | BMO 2024-5C3 |
| Contacts |
| Goldman Sachs Syndicate & Structuring |
| Contact | E-Mail | Phone Number |
| Scott Walter | scott.walter@gs.com | (212) 357-8910 |
| Managing Director | | |
| | | |
| Lisa Schexnayder | lisa.schexnayder@gs.com | (212) 902-2330 |
| Vice President | | |
| | | |
| Wenfei Liu | wenfei.liu@gs.com | (212) 357-0433 |
| Vice President | | |
| | | |
| UBS CMBS Capital Markets and Banking | | |
| Contact | E-Mail | Phone Number |
| Nicholas Galeone | nicholas.galeone@ubs.com | (212) 713-8832 |
| Managing Director | | |
| | | |
| Siho Ham | siho.ham@ubs.com | (212) 713-1278 |
| Managing Director | | |
| | | |
| Michael Barbieri | michael.barbieri@ubs.com | (212) 713-1181 |
| Executive Director | | |
| | | |
| UBS CMBS Trading and Syndicate | | |
| Contact | E-Mail | Phone Number |
| Jared Randall | jared.randall@ubs.com | (212) 713-8568 |
| Executive Director | | |
| | | |
| | | |
| | | |
| | | |
THE INFORMATION IN THIS STRUCTURAL AND COLLATERAL TERM SHEET IS NOT COMPLETE AND MAY BE AMENDED PRIOR TO THE TIME OF SALE. THIS TERM SHEET IS NOT AN OFFER TO SELL THESE SECURITIES AND IT IS NOT A SOLICITATION OF AN OFFER TO BUY THESE SECURITIES IN ANY JURISDICTION WHERE THE OFFER OR SALE IS NOT PERMITTED. |
| | 167 | |