| | | FREE WRITING PROSPECTUS |
| | | FILED PURSUANT TO RULE 433 |
| | | REGISTRATION FILE NO.: 333-255934-11 |
| | | |
| Dated March 11, 2024 | BMO 2024-C8 |
| |
| Structural and Collateral Term Sheet |
| |
BMO 2024-C8 Mortgage Trust |
$683,436,933 (Approximate Mortgage Pool Balance) |
| |
$616,323,000 (Approximate Offered Certificates) |
| |
BMO Commercial Mortgage Securities LLC Depositor |
COMMERCIAL MORTGAGE PASS-THROUGH CERTIFICATES, SERIES 2024-C8 |
Bank of Montreal Citi Real Estate Funding Inc. German American Capital Corporation Starwood Mortgage Capital LLC National Cooperative Bank, N.A. Goldman Sachs Mortgage Company Ladder Capital Finance LLC Morgan Stanley Mortgage Capital Holdings LLC Zions Bancorporation, N.A. LMF Commercial, LLC UBS AG BSPRT CMBS Finance, LLC Sponsors and Mortgage Loan Sellers |
BMO Capital
Markets | Deutsche Bank
Securities | Morgan
Stanley | Goldman Sachs
& Co. LLC | UBS Securities
LLC | Citigroup |
| Co-Lead Managers and Joint Bookrunners |
| | | |
Academy Securities
Co-Manager | Bancroft Capital, LLC Co-Manager | Drexel Hamilton
Co-Manager |
THE INFORMATION IN THIS STRUCTURAL AND COLLATERAL TERM SHEET IS NOT COMPLETE AND MAY BE AMENDED PRIOR TO THE TIME OF SALE. THIS TERM SHEET IS NOT AN OFFER TO SELL THESE SECURITIES AND IT IS NOT A SOLICITATION OF AN OFFER TO BUY THESE SECURITIES IN ANY JURISDICTION WHERE THE OFFER OR SALE IS NOT PERMITTED. |
| | | |
| Dated March 11, 2024 | BMO 2024-C8 |
This material is for your information, and none of BMO Capital Markets Corp., Citigroup Global Markets Inc., Deutsche Bank Securities Inc., Morgan Stanley & Co. LLC, Goldman Sachs & Co. LLC, UBS Securities LLC, Academy Securities, Inc., Bancroft Capital, LLC and Drexel Hamilton, LLC (collectively, the “Underwriters”) are soliciting any action based upon it. This material is not to be construed as an offer to sell or the solicitation of any offer to buy any security in any jurisdiction where such an offer or solicitation would be illegal.
The depositor has filed a registration statement (including the prospectus) with the Securities and Exchange Commission (File No. 333-255934) for the offering to which this communication relates. Before you invest, you should read the prospectus in the registration statement and other documents the depositor has filed with the Securities and Exchange Commission for more complete information about the depositor, the issuing entity and this offering. You may get these documents for free by visiting EDGAR on the SEC website at www.sec.gov. Alternatively, the depositor or BMO Capital Markets Corp., any other underwriter, or any dealer participating in this offering will arrange to send you the prospectus if you request it by calling 1-866-864-7760. The Offered Certificates referred to in these materials, and the asset pool backing them, are subject to modification or revision (including the possibility that one or more Classes of Certificates may be split, combined or eliminated at any time prior to issuance or availability of a final prospectus) and are offered on a “when, as and if issued” basis. You understand that, when you are considering the purchase of these Certificates, a contract of sale will come into being no sooner than the date on which the relevant Class has been priced and we have verified the allocation of Certificates to be made to you; any “indications of interest” expressed by you, and any “soft circles” generated by us, will not create binding contractual obligations for you or us.
Neither this document nor anything contained in this document shall form the basis for any contract or commitment whatsoever. The information contained in this document is preliminary as of the date of this document, supersedes any previous such information delivered to you and will be superseded by any such information subsequently delivered prior to the time of sale. These materials are subject to change, completion or amendment from time to time. The information should be reviewed only in conjunction with the entire offering document relating to the Commercial Mortgage Pass-Through Certificates, Series 2024-C8 (the “Offering Document”). All of the information contained herein is subject to the same limitations and qualifications contained in the Offering Document. The information contained herein does not contain all relevant information relating to the underlying mortgage loans or mortgaged properties. Such information is described elsewhere in the Offering Document. The information contained herein will be more fully described elsewhere in the Offering Document. The information contained herein should not be viewed as projections, forecasts, predictions or opinions with respect to value. Prior to making any investment decision, prospective investors are strongly urged to read the Offering Document its entirety. Neither the Securities and Exchange Commission nor any state securities commission has approved or disapproved of these securities or determined if this free writing prospectus is truthful or complete. Any representation to the contrary is a criminal offense.
This document has been prepared by the Underwriters for information purposes only and does not constitute, in whole or in part, a prospectus for the purposes of Regulation (EU) 2017/1129 (as amended or superseded) and/or Part VI of the Financial Services and Markets Act 2000 (as amended) or other offering document.
The attached information contains certain tables and other statistical analyses (the “Computational Materials”) which have been prepared in reliance upon information furnished by the Mortgage Loan Sellers. Numerous assumptions were used in preparing the Computational Materials, which may or may not be reflected herein. As such, no assurance can be given as to the Computational Materials’ accuracy, appropriateness or completeness in any particular context; or as to whether the Computational Materials and/or the assumptions upon which they are based reflect present market conditions or future market performance. The Computational Materials should not be construed as either projections or predictions or as legal, tax, financial or accounting advice. You should consult your own counsel, accountant and other advisors as to the legal, tax, business, financial and related aspects of a purchase of these Certificates. Any weighted average lives, yields and principal payment periods shown in the Computational Materials are based on prepayment and/or loss assumptions, and changes in such prepayment and/or loss assumptions may dramatically affect such weighted average lives, yields and principal payment periods. In addition, it is possible that prepayments or losses on the underlying assets will occur at rates higher or lower than the rates shown in the attached Computational Materials. The specific characteristics of the Certificates may differ from those shown in the Computational Materials due to differences between the final underlying assets and the preliminary underlying assets used in preparing the Computational Materials. The principal amount and designation of any security described in the Computational Materials are subject to change prior to issuance. None of the Underwriters or any of their respective affiliates make any representation or warranty as to the actual rate or timing of payments or losses on any of the underlying assets or the payments or yield on the Certificates. The information in this presentation is based upon management forecasts and reflects prevailing conditions and management’s views as of this date, all of which are subject to change. In preparing this presentation, we have relied upon and assumed, without independent verification, the accuracy and completeness of all information available from public sources or which was provided to us by or on behalf of the Mortgage Loan Sellers or which was otherwise reviewed by us.
This document contains forward-looking statements. If and when included in this document, the words “expects”, “intends”, “anticipates”, “estimates” and analogous expressions and all statements that are not historical facts, including statements about our beliefs or expectations, are intended to identify forward-looking statements. Any forward-looking statements are made subject to risks and uncertainties which could cause actual results to differ materially from those stated. Those risks and uncertainties include, among other things, declines in general economic and business conditions, increased competition, changes in demographics, changes in political and social conditions, regulatory initiatives and changes in consumer preferences, many of which are beyond our control and the control of any other person or entity related to this offering. The forward-looking statements made in this document are made as of the date hereof. We have no obligation to update or revise any forward-looking statement.
BMO Capital Markets is a trade name used by BMO Financial Group for the wholesale banking businesses of Bank of Montreal, BMO Harris Bank N.A. (member FDIC), Bank of Montreal Europe p.l.c, and Bank of Montreal (China) Co. Ltd, the institutional broker dealer business of BMO Capital Markets Corp. (Member FINRA and SIPC) and the agency broker dealer business of Clearpool Execution Services, LLC (Member FINRA and SIPC) in the U.S., and the institutional broker dealer businesses of BMO Nesbitt Burns Inc. (Member Investment Industry Regulatory Organization of Canada and Member Canadian Investor Protection Fund) in Canada and Asia, Bank of Montreal Europe p.l.c. (authorized and regulated by the Central Bank of Ireland) in Europe and BMO Capital Markets Limited (authorized and regulated by the Financial Conduct Authority) in the UK and Australia.
Securities and investment banking activities in the United States are performed by Deutsche Bank Securities Inc., a member of NYSE, FINRA and SIPC, and its broker-dealer affiliates. Lending and other commercial banking activities in the United States are performed by Deutsche Bank AG and its banking affiliates.
THE INFORMATION IN THIS STRUCTURAL AND COLLATERAL TERM SHEET IS NOT COMPLETE AND MAY BE AMENDED PRIOR TO THE TIME OF SALE. THIS TERM SHEET IS NOT AN OFFER TO SELL THESE SECURITIES AND IT IS NOT A SOLICITATION OF AN OFFER TO BUY THESE SECURITIES IN ANY JURISDICTION WHERE THE OFFER OR SALE IS NOT PERMITTED. |
| | 2 | |
| Dated March 11, 2024 | BMO 2024-C8 |
IMPORTANT NOTICE RELATING TO AUTOMATICALLY-GENERATED EMAIL DISCLAIMERS
Any legends, disclaimers or other notices that may appear at the bottom of any email communication to which this document is attached relating to (1) these materials not constituting an offer (or a solicitation of an offer), (2) no representation that these materials are accurate or complete and may not be updated or (3) these materials possibly being confidential, are not applicable to these materials and should be disregarded. Such legends, disclaimers or other notices have been automatically generated as a result of these materials having been sent via Bloomberg or another system.
THE CERTIFICATES REFERRED TO IN THESE MATERIALS ARE SUBJECT TO MODIFICATION OR REVISION (INCLUDING THE POSSIBILITY THAT ONE OR MORE CLASSES OF CERTIFICATES MAY BE SPLIT, COMBINED OR ELIMINATED AT ANY TIME PRIOR TO ISSUANCE OR AVAILABILITY OF A FINAL PROSPECTUS) AND ARE OFFERED ON A “WHEN, AS AND IF ISSUED” BASIS.
THE UNDERWRITERS MAY FROM TIME TO TIME PERFORM INVESTMENT BANKING SERVICES FOR, OR SOLICIT INVESTMENT BANKING BUSINESS FROM, ANY COMPANY NAMED IN THESE MATERIALS. THE UNDERWRITERS AND/OR THEIR AFFILIATES OR RESPECTIVE EMPLOYEES MAY FROM TIME TO TIME HAVE A LONG OR SHORT POSITION IN ANY CERTIFICATE OR CONTRACT DISCUSSED IN THESE MATERIALS.
THE INFORMATION IN THIS STRUCTURAL AND COLLATERAL TERM SHEET IS NOT COMPLETE AND MAY BE AMENDED PRIOR TO THE TIME OF SALE. THIS TERM SHEET IS NOT AN OFFER TO SELL THESE SECURITIES AND IT IS NOT A SOLICITATION OF AN OFFER TO BUY THESE SECURITIES IN ANY JURISDICTION WHERE THE OFFER OR SALE IS NOT PERMITTED. |
| | 3 | |
| Structural and Collateral Term Sheet | | BMO 2024-C8 |
| Indicative Capital Structure |
| Offered Certificates | | | | | | |
Classes of Certificates | Expected Ratings (Fitch/KBRA/S&P)(1) | Approximate Initial Certificate Balance or Notional Amount(2) | Approximate Initial Credit Support(3) | Initial
Pass-
Through Rate(4) | Pass-Through
Rate Description | Expected Weighted Avg. Life (yrs.)(5) | Expected Principal Window(5) |
| Class A-1 | AAAsf/AAA(sf)/AAA(sf) | $3,431,000 | 30.000% | % | (6) | 2.49 | 04/24-10/28 |
| Class A-2 | AAAsf/AAA(sf)/AAA(sf) | $23,712,000 | 30.000% | % | (6) | 4.83 | 10/28-03/29 |
| Class A-4 | AAAsf/AAA(sf)/AAA(sf) | (7) | 30.000% | % | (6) | (7) | (7) |
| Class A-5 | AAAsf/AAA(sf)/AAA(sf) | (7) | 30.000% | % | (6) | (7) | (7) |
| Class A-SB | AAAsf/AAA(sf)/AAA(sf) | $6,921,000 | 30.000% | % | (6) | 7.27 | 03/29-05/33 |
| Class X-A | AAAsf/AAA(sf)/AAA(sf) | $478,405,000(8) | N/A | % | Variable IO(9) | N/A | N/A |
| Class X-B | NR/AAA(sf)/A-(sf) | $137,918,000(8) | N/A | % | Variable IO(9) | N/A | N/A |
| Class A-S | AAAsf/AAA(sf)/AA+(sf) | $83,721,000 | 17.750% | % | (6) | 9.96 | 03/34-03/34 |
| Class B | AA-sf/AA-(sf)/AA-(sf) | $28,192,000 | 13.625% | % | (6) | 9.96 | 03/34-03/34 |
| Class C | NR/A-(sf)/A-(sf) | $26,005,000 | 9.820% | % | (6) | 9.96 | 03/34-03/34 |
| Non-Offered Certificates(10) | | | | | |
Classes of Certificates | Expected Ratings (Fitch/KBRA/S&P)(1) | Approximate Initial Certificate Balance or Notional Amount(2) | Approximate Initial Credit Support(3) | Initial Pass-
Through Rate(4) | Pass-Through Rate Description | Expected Weighted Avg. Life (yrs.)(5) | Expected Principal Window(5) |
| Class D-RR(11) | NR/BBB(sf)/BBB(sf) | $16,710,000 | 7.375% | % | (6) | 9.96 | 03/34-03/34 |
| Class XDRR(11) | NR/BBB(sf)/BBB(sf) | $16,710,000(8) | N/A | % | Variable IO(9) | N/A | N/A |
| Class E-RR(11) | NR/BBB-(sf)/BBB-(sf) | $7,689,000 | 6.250% | % | (6) | 9.96 | 03/34-03/34 |
| Class XERR(11) | NR/BBB-(sf)/BBB-(sf) | $7,689,000(8) | N/A | % | Variable IO(9) | N/A | N/A |
| Class F-RR(11) | NR/BB-(sf)/BB(sf) | $13,668,000 | 4.250% | % | (6) | 9.96 | 03/34-03/34 |
| Class XFRR(11) | NR/BB-(sf)/BB(sf) | $13,668,000(8) | N/A | % | Variable IO(9) | N/A | N/A |
| Class G-RR(11) | NR/B-(sf)/BB-(sf) | $6,835,000 | 3.250% | % | (6) | 9.96 | 03/34-03/34 |
| Class XGRR(11) | NR/B-(sf)/BB-(sf) | $6,835,000(8) | N/A | % | Variable IO(9) | N/A | N/A |
| Class J-RR(11) | NR/NR/NR | $22,211,933 | 0.000% | % | (6) | 9.96 | 03/34-03/34 |
| Class XJRR(11) | NR/NR/NR | $22,211,933(8) | N/A | % | Variable IO(9) | N/A | N/A |
| Class S(12) | N/A | N/A | N/A | N/A | N/A | N/A | N/A |
| Class R(12) | N/A | N/A | N/A | N/A | N/A | N/A | N/A |
| | | | | | | |
| | | | | | | | |
| (1) | It is a condition of issuance that the offered certificates and certain classes of non-offered certificates receive the ratings set forth above. The anticipated ratings shown are those of Fitch Ratings, Inc. (“Fitch”), Kroll Bond Rating Agency, LLC (“KBRA”) and S&P Global Ratings (“S&P”), as indicated. Subject to the discussion under “Ratings” in the Preliminary Prospectus, the ratings on the certificates address the likelihood of the timely receipt by holders of all payments of interest to which they are entitled on each distribution date and, except in the case of the interest only certificates, the ultimate receipt by holders of all payments of principal to which they are entitled on or before the applicable rated final distribution date. Certain nationally recognized statistical rating organizations, as defined in Section 3(a)(62) of the Securities Exchange Act of 1934, as amended, that were not hired by the depositor may use information they receive pursuant to Rule 17g-5 under the Securities Exchange Act of 1934, as amended, or otherwise to rate the offered certificates. We cannot assure you as to what ratings a non-hired nationally recognized statistical rating organization would assign. See “Risk Factors—Other Risks Relating to the Certificates—Nationally Recognized Statistical Rating Organizations May Assign Different Ratings to the Certificates; Ratings of the Certificates Reflect Only the Views of the Applicable Rating Agencies as of the Dates Such Ratings Were Issued; Ratings May Affect ERISA Eligibility; Ratings May Be Downgraded” in the Preliminary Prospectus. Fitch, KBRA and S&P have informed us that the “sf” designation in the ratings represents an identifier of structured finance product ratings. For additional information about this identifier, prospective investors can go to the related rating agency’s website. The depositor and the underwriters have not verified, do not adopt and do not accept responsibility for any statements made by the rating agencies on those websites. Credit ratings referenced throughout this Term Sheet are forward-looking opinions about credit risk and express a rating agency’s opinion about the willingness and ability of an issuer of securities to meet its financial obligations in full and on time. Ratings are not indications of investment merit and are not buy, sell or hold recommendations, a measure of asset value or an indication of the suitability of an investment. |
| (2) | Approximate, subject to a variance of plus or minus 5% and further subject to any additional variances described in the footnotes below. In addition, the notional amounts of the Class X-A, Class X-B, Class XDRR, Class XERR, Class XFRR, Class XGRR and Class XJRR certificates (collectively, the “Class X certificates”) may vary depending upon the final pricing of the respective classes of principal balance certificates (as defined in footnote (6) below) whose certificate balances comprise such notional amounts, and, if as a result of such pricing (a) the pass-through rate of any class of Class X certificates would be equal to zero at all times, such class of Class X certificates will not be issued on the closing date of this securitization or (b) the pass-through rate of any class of principal balance certificates whose certificate balance comprises such notional amount is at all times equal to the weighted average of the net interest rates on the mortgage loans (in each case, adjusted, if necessary, to accrue on the basis of a 360-day year consisting of twelve 30-day months) as in effect from time to time, the certificate balance of such class of principal balance certificates may not be part of, and there may be a corresponding reduction in, such notional amount of the related class of Class X certificates. |
| (3) | "Approximate Initial Credit Support" means, with respect to any class of principal balance certificates, the quotient, expressed as a percentage, of (i) the aggregate of the initial certificate balances of all classes of principal balance certificates, if any, junior to the subject class of principal balance certificates, divided by (ii) the aggregate of the initial certificate balances of all classes of principal balance certificates. The approximate initial credit support percentages set forth for the Class A-1, Class A-2, Class A-4, Class A-5 and Class A-SB certificates are represented in the aggregate. |
| (4) | Approximate per annum rate as of the closing date. |
| (5) | Determined assuming no prepayments prior to the maturity date or any anticipated repayment date, as applicable, for any mortgage loan and based on the modeling assumptions described under “Yield, Prepayment and Maturity Considerations” in the Preliminary Prospectus. |
| (6) | For any distribution date, the pass-through rate for each class of the Class A-1, Class A-2, Class A-4, Class A-5, Class A-SB, Class A-S, Class B, Class C, Class D-RR, Class E-RR, Class F-RR, Class G-RR and Class J-RR certificates (collectively, the “principal balance certificates”, and collectively with the Class X certificates, the Class S certificates and the Class R certificates, the “certificates”) will generally be equal to one of (i) a fixed per annum rate, (ii) the weighted average of the net interest rates on the mortgage loans (in each case, adjusted, if necessary, to accrue on the basis of a 360-day year consisting of twelve 30-day months) as in effect from time to time, (iii) a rate equal to the lesser of a specified per annum rate and the weighted average rate described in clause (ii), or (iv) the weighted average rate described in clause (ii) less a specified percentage, but no less than 0.000%. See “Description of the Certificates—Distributions—Pass-Through Rates” in the Preliminary Prospectus. |
| (7) | The exact initial certificate balances of the Class A-4 and Class A-5 certificates are unknown and will be determined based on the final pricing of those classes of certificates. However, the respective initial certificate balances, weighted average lives and principal windows of the Class A-4 and Class A-5 certificates are expected |
THE INFORMATION IN THIS STRUCTURAL AND COLLATERAL TERM SHEET IS NOT COMPLETE AND MAY BE AMENDED PRIOR TO THE TIME OF SALE. THIS TERM SHEET IS NOT AN OFFER TO SELL THESE SECURITIES AND IT IS NOT A SOLICITATION OF AN OFFER TO BUY THESE SECURITIES IN ANY JURISDICTION WHERE THE OFFER OR SALE IS NOT PERMITTED. |
| | 4 | |
| Structural and Collateral Term Sheet | | BMO 2024-C8 |
| Indicative Capital Structure |
to be within the applicable ranges reflected in the following chart. The aggregate initial certificate balance of the Class A-4 and Class A-5 certificates is expected to be approximately $444,341,000 subject to a variance of plus or minus 5%.
Class of Certificates | Expected Range of Initial Certificate Balances | Expected Range of Weighted Avg. Lives (Yrs) | Expected Range of Principal Windows |
| Class A-4 | $0 - $200,000,000 | N/A – 9.63 | N/A – 05/33-12/33 |
| Class A-5 | $244,341,000 - $444,341,000 | 9.87 – 9.76 | 12/33-03/34 – 05/33-03/34 |
| (8) | The Class X certificates will not have certificate balances and will not be entitled to receive distributions of principal. Interest will accrue on each class of Class X certificates at the related pass-through rate based upon the related notional amount. The notional amount of each class of the Class X certificates will be equal to the certificate balance or the aggregate of the certificate balances, as applicable, from time to time of the class or classes of the principal balance certificates identified in the same row as such class of Class X certificates in the chart below (as to such class of Class X certificates, the “corresponding principal balance certificates”): |
| Class of Class X Certificates | Class(es) of Corresponding
Principal Balance Certificates |
| Class X-A | Class A-1, Class A-2, Class A-4, Class A-5 and Class A-SB |
| Class X-B | Class A-S, Class B and Class C |
| Class XDRR | Class D-RR |
| Class XERR | Class E-RR |
| Class XFRR | Class F-RR |
| Class XGRR | Class G-RR |
| Class XJRR | Class J-RR |
| (9) | The pass-through rate for each class of Class X certificates will generally be a per annum rate equal to the excess, if any, of (i) the weighted average of the net interest rates on the mortgage loans (in each case, adjusted, if necessary, to accrue on the basis of a 360-day year consisting of twelve 30-day months) as in effect from time to time, over (ii) the pass-through rate (or, if applicable, the weighted average of the pass-through rates) of the class or classes of corresponding principal balance certificates as in effect from time to time, as described in the Preliminary Prospectus. |
| (10) | The classes of certificates set forth below “Non-Offered Certificates” in the table are not offered hereby. |
| (11) | In satisfaction of Bank of Montreal’s risk retention obligations as retaining sponsor for this securitization transaction, all of the Class D-RR, Class XDRR, Class E-RR, Class XERR, Class F-RR, Class XFRR, Class G-RR, Class XGRR, Class J-RR and Class XJRR certificates (collectively, the “HRR Certificates”), with an aggregate fair value expected to represent at least 5.0% of the fair value, as of the closing date of this transaction, of all of the “ABS interests” (i.e., all of the certificates (other than the Class R certificates)) issued by the issuing entity, will collectively constitute an “eligible horizontal residual interest” that is to be purchased and retained by RREF V - D AIV RR H, LLC, a Delaware limited liability company, or its affiliate, in accordance with the credit risk retention rules applicable to this securitization transaction. The certificate balances of the Class C and Class D-RR certificates may be reallocated between those classes based on the determination of the aggregate fair value, as of the closing date for this transaction, of all of the certificates (other than the Class R certificates), in order to satisfy the credit risk retention rule. Any such reallocation would have a corresponding effect on the notional amounts of the Class X-B and Class XDRR certificates. However, the “Approximate Initial Credit Support” for the Class C certificates will have a minimum value of 9.750%. “Retaining sponsor,” “ABS interests” and “eligible horizontal residual interest” have the meanings given to such terms in Regulation RR. See “Credit Risk Retention” in the Preliminary Prospectus. |
| (12) | Neither the Class S certificates nor the Class R certificates will have a certificate balance, notional amount, pass-through rate, rating or rated final distribution date. Excess interest accruing after the related anticipated repayment date on any mortgage loan with an anticipated repayment date will, to the extent collected, be allocated to the Class S certificates as set forth in “Description of the Certificates—Distributions—Excess Interest”. The Class R certificates will represent the residual interests in each of two separate REMICs, as further described in the Preliminary Prospectus. The Class R certificates will not be entitled to distributions of principal or interest. |
THE INFORMATION IN THIS STRUCTURAL AND COLLATERAL TERM SHEET IS NOT COMPLETE AND MAY BE AMENDED PRIOR TO THE TIME OF SALE. THIS TERM SHEET IS NOT AN OFFER TO SELL THESE SECURITIES AND IT IS NOT A SOLICITATION OF AN OFFER TO BUY THESE SECURITIES IN ANY JURISDICTION WHERE THE OFFER OR SALE IS NOT PERMITTED. |
| | 5 | |
| Structural and Collateral Term Sheet | | BMO 2024-C8 |
| Summary of Transaction Terms |
| Publicly Offered Certificates: | $616,323,000 monthly pay, multi-class, commercial mortgage REMIC Pass-Through Certificates. |
| Co-Lead Managers and Joint Bookrunners: | BMO Capital Markets Corp., Citigroup Global Markets Inc., Deutsche Bank Securities Inc., Morgan Stanley & Co. LLC, Goldman Sachs & Co. LLC and UBS Securities LLC |
| Co-Managers: | Academy Securities, Inc., Bancroft Capital, LLC and Drexel Hamilton, LLC |
| Mortgage Loan Sellers: | Bank of Montreal (“BMO”) (14.5%); Citi Real Estate Funding Inc. (“CREFI”) (17.3%); German American Capital Corporation (“GACC”) (17.3%); Starwood Mortgage Capital LLC (“SMC”) (9.5%); National Cooperative Bank, N.A. (“NCB”) (8.6%); Goldman Sachs Mortgage Company (“GSMC”) (6.8%); Ladder Capital Finance LLC (“LCF”) (5.9%); Morgan Stanley Mortgage Capital Holdings LLC (“MSMCH”) (5.9%); Zions Bancorporation, N.A. (“ZBNA”) (5.6%); LMF Commercial, LLC (“LMF”) (4.0%); UBS AG (“UBS”) (2.9%); and BSPRT CMBS Finance, LLC (“BSPRT”) (1.6%). |
| Master Servicer: | Wells Fargo Bank, National Association, with respect to all mortgage loans other than the mortgage loans being contributed to the issuing entity by National Cooperative Bank, N.A. (the “NCB Mortgage Loans”), and National Cooperative Bank, N.A., with respect to the NCB Mortgage Loans. |
| Special Servicer: | Rialto Capital Advisors, LLC, with respect to all mortgage loans other than the NCB Mortgage Loans, and National Cooperative Bank, N.A., with respect to the NCB Mortgage Loans. |
| Directing Holder/Controlling Class Representative: | RREF V - D AIV RR H, LLC |
| Trustee: | Wilmington Savings Fund Society, FSB |
| Certificate Administrator: | Citibank, N.A. |
| Operating Advisor: | BellOak, LLC |
| Asset Representations Reviewer: | BellOak, LLC |
| Rating Agencies: | Fitch Ratings, Inc. (“Fitch”), Kroll Bond Rating Agency, LLC (“KBRA”) and Standard and Poor’s (“S&P”). |
| U.S. Credit Risk Retention: | For a discussion on the manner in which BMO, as retaining sponsor, intends to satisfy the U.S. credit risk retention requirements, see “Credit Risk Retention” in the Preliminary Prospectus. |
| EU Credit Risk Retention: | The transaction is not structured to satisfy the EU risk retention and due diligence requirements. |
| Closing Date: | On or about March 28, 2024. |
| Cut-off Date: | With respect to each mortgage loan, the related due date in March 2024, or in the case of any mortgage loan that has its first due date after March 2024, the date that would have been its due date in March 2024 under the terms of that mortgage loan if a monthly debt service payment were scheduled to be due in that month. |
| Distribution Date: | The 4th business day after the Determination Date in each month, commencing in April 2024. |
| Determination Date: | 11th day of each month, or if the 11th day is not a business day, the next succeeding business day, commencing in April 2024. |
| Assumed Final Distribution Date: | The Distribution Date in March 2034 which is the latest anticipated repayment date of the Certificates. |
| Rated Final Distribution Date: | The Distribution Date in March 2057. |
| Tax Treatment: | The Publicly Offered Certificates are expected to be treated as REMIC “regular interests” for U.S. federal income tax purposes. |
| Form of Offering: | The Class A-1, Class A-2, Class A-4, Class A-5, Class A-SB, Class X-A, Class X-B, Class A-S, Class B and Class C Certificates (the “Publicly Offered Certificates”) will be offered publicly. The Class D-RR, Class XDRR, Class E-RR, Class XERR, Class F-RR, Class XFRR, Class G-RR, Class XGRR, Class J-RR, Class XJRR and Class R Certificates (the “Privately Offered Certificates”) will be offered domestically to Qualified Institutional Buyers and to Institutional Accredited Investors (other than the Class R Certificates) and to institutions that are not U.S. Persons pursuant to Regulation S (other than the Class R Certificates). |
| SMMEA Status: | The Certificates will not constitute “mortgage related securities” for purposes of SMMEA. |
| ERISA: | The Publicly Offered Certificates are expected to be ERISA eligible. |
| Optional Termination: | On any Distribution Date on which the aggregate principal balance of the pool of mortgage loans is less than 1% of the aggregate principal balance of the mortgage loans as of the cut-off date, certain entities specified in the Preliminary Prospectus will have the option to purchase all of the remaining mortgage loans (and all property acquired through exercise of remedies in respect of any mortgage loan) at the price specified in the Preliminary Prospectus. Refer to “Pooling and Servicing Agreement—Termination; Retirement of Certificates” in the Preliminary Prospectus. |
| Minimum Denominations: | The Publicly Offered Certificates (other than the Class X-A and Class X-B Certificates) will be issued in minimum denominations of $10,000 and integral multiples of $1 in excess of $10,000. The Class X-A and Class X-B will be issued in minimum denominations of $1,000,000 and in integral multiples of $1 in excess of $1,000,000. |
| Settlement Terms: | DTC, Euroclear and Clearstream Banking. |
| Analytics: | The transaction is expected to be modeled by Bloomberg, L.P., Trepp, LLC, Intex Solutions, Inc., BlackRock Financial Management, Inc., CMBS.com, Inc., Moody’s Analytics, Markit Group Limited, |
THE INFORMATION IN THIS STRUCTURAL AND COLLATERAL TERM SHEET IS NOT COMPLETE AND MAY BE AMENDED PRIOR TO THE TIME OF SALE. THIS TERM SHEET IS NOT AN OFFER TO SELL THESE SECURITIES AND IT IS NOT A SOLICITATION OF AN OFFER TO BUY THESE SECURITIES IN ANY JURISDICTION WHERE THE OFFER OR SALE IS NOT PERMITTED. |
| | 6 | |
| Structural and Collateral Term Sheet | | BMO 2024-C8 |
| Summary of Transaction Terms |
| RealINSIGHT, Thompson Reuters Corporation, Intercontinental Exchange | ICE Data Services, KBRA Analytics, LLC, DealView Technologies Ltd. and Recursion Co. |
| Risk Factors: | THE CERTIFICATES INVOLVE CERTAIN RISKS AND MAY NOT BE SUITABLE FOR ALL INVESTORS. REFER TO THE “SUMMARY OF RISK FACTORS” AND “RISK FACTORS” SECTIONS OF THE PRELIMINARY PROSPECTUS. |
THE INFORMATION IN THIS STRUCTURAL AND COLLATERAL TERM SHEET IS NOT COMPLETE AND MAY BE AMENDED PRIOR TO THE TIME OF SALE. THIS TERM SHEET IS NOT AN OFFER TO SELL THESE SECURITIES AND IT IS NOT A SOLICITATION OF AN OFFER TO BUY THESE SECURITIES IN ANY JURISDICTION WHERE THE OFFER OR SALE IS NOT PERMITTED. |
| | 7 | |
| Structural and Collateral Term Sheet | | BMO 2024-C8 |
| Collateral Characteristics |
Mortgage Loan Seller | Number of Mortgage Loans | Number of Mortgaged Properties | Aggregate
Cut-off Date Balance | | Roll-up Aggregate Cut-off Date Balance | Roll-up Aggregate % of Cut-off Date Balance |
| CREFI | 3 | 4 | $118,462,500 | 17.3% | $118,462,500 | 17.3% |
| GACC | 3 | 10 | $118,410,000 | 17.3% | $118,410,000 | 17.3% |
| BMO | 5 | 9 | $52,850,000 | 7.7% | $99,100,000 | 14.5% |
| SMC | 1 | 1 | $65,000,000 | 9.5% | $65,000,000 | 9.5% |
| NCB | 24 | 24 | $58,450,003 | 8.6% | $58,450,003 | 8.6% |
| GSMC | - | - | - | - | $46,750,000 | 6.8% |
| LCF | 5 | 5 | $40,400,000 | 5.9% | $40,400,000 | 5.9% |
| MSMCH | - | - | - | - | $40,000,000 | 5.9% |
| ZBNA | 2 | 2 | $38,496,280 | 5.6% | $38,496,280 | 5.6% |
| LMF | 2 | 2 | $27,425,000 | 4.0% | $27,425,000 | 4.0% |
| UBS AG | 3 | 4 | $20,043,150 | 2.9% | $20,043,150 | 2.9% |
| BSPRT | 2 | 2 | $10,900,000 | 1.6% | $10,900,000 | 1.6% |
| GSMC, BMO | 1 | 1 | $68,000,000 | 9.9% | - | - |
| MSMCH, BMO | 1 | 1 | $65,000,000 | 9.5% | - | - |
| Total: | 52 | 65 | $683,436,933 | 100.0% | $683,436,933 | 100.0% |
| Loan Pool | |
| | Initial Pool Balance (“IPB”): | $683,436,933 |
| | Number of Mortgage Loans: | 52 |
| | Number of Mortgaged Properties: | 65 |
| | Average Cut-off Date Balance per Mortgage Loan: | $13,143,018 |
| | Weighted Average Current Mortgage Rate: | 6.83843% |
| | 10 Largest Mortgage Loans as % of IPB: | 68.7% |
| | Weighted Average Remaining Term to Maturity: | 116 months |
| | Weighted Average Seasoning: | 2 months |
| | | |
| Credit Statistics | |
| | Weighted Average UW NCF DSCR(1)(2): | 2.46x |
| | Weighted Average UW NOI Debt Yield(1): | 18.1% |
| | Weighted Average Cut-off Date Loan-to-Value Ratio (“LTV”)(1)(3): | 47.6% |
| | Weighted Average Maturity Date/ARD LTV(1)(3)(4): | 47.3% |
| | | |
| Other Statistics | |
| | % of Mortgage Loans with Additional Debt(5): | 8.7% |
| | % of Mortgage Loans with Single Tenants(6): | 24.4% |
| | % of Mortgage Loans secured by Multiple Properties: | 16.6% |
| | |
| Amortization | |
| | Weighted Average Original Amortization Term(7): | 369 months |
| | Weighted Average Remaining Amortization Term(7): | 368 months |
| | % of Mortgage Loans with Interest-Only: | 72.6% |
| | % of Mortgage Loans with Amortizing Balloon: | 11.7% |
| | % of Mortgage Loans with Partial Interest-Only followed by Amortizing Balloon: | 9.6% |
| | % of Mortgage Loans with Interest-Only with Anticipated Repayment Date: | 5.9% |
| | % of Mortgage Loans with Fully Amortizing: | 0.2% |
| | | |
| Lockboxes(8) | |
| | % of Mortgage Loans with Hard Lockboxes: | 56.7% |
| | % of Mortgage Loans with Springing Lockboxes: | 23.4% |
| | % of Mortgage Loans with Soft Lockboxes: | 11.3% |
| | % of Mortgage Loans with No Lockbox: | 8.6% |
| | | |
| Reserves | |
| | % of Mortgage Loans Requiring Monthly Tax Reserves: | 54.5% |
| | % of Mortgage Loans Requiring Monthly Insurance Reserves: | 25.1% |
| | % of Mortgage Loans Requiring Monthly CapEx Reserves: | 27.4% |
| | % of Mortgage Loans Requiring Monthly TI/LC Reserves(9): | 21.0% |
(See footnotes on following page)
THE INFORMATION IN THIS STRUCTURAL AND COLLATERAL TERM SHEET IS NOT COMPLETE AND MAY BE AMENDED PRIOR TO THE TIME OF SALE. THIS TERM SHEET IS NOT AN OFFER TO SELL THESE SECURITIES AND IT IS NOT A SOLICITATION OF AN OFFER TO BUY THESE SECURITIES IN ANY JURISDICTION WHERE THE OFFER OR SALE IS NOT PERMITTED. |
| | 8 | |
| Structural and Collateral Term Sheet | | BMO 2024-C8 |
| Collateral Characteristics |
| (1) | In the case of Loan Nos. 1, 2, 3, 5, 7, 11, 12 and 21, the UW NCF DSCR, UW NOI Debt Yield, Cut-off Date LTV and Maturity Date/ARD LTV calculations include the related Pari Passu Companion Loan(s). In the case of Loan No. 11, the UW NCF DSCR, UW NOI Debt Yield, Cut-off Date LTV and Maturity Date/ARD LTV calculations exclude the related Subordinate Companion Loans and/or mezzanine loans. For mortgaged properties securing residential cooperative mortgage loans, UW NCF DSCR and UW NOI Debt Yield calculations for each such mortgaged property is calculated using underwritten net operating income or underwritten net cash flow, as applicable, for the related residential cooperative property which is the projected net operating income or net cash flow, as applicable, reflected in the most recent appraisal obtained by or otherwise in the possession of the related mortgage loan seller as of the Cut-off Date. The Cut-off Date LTV and Maturity Date/ARD LTV calculations are based upon the appraised value of the residential cooperative property determined as if such residential cooperative property is operated as a residential cooperative, inclusive of the amount of the underlying debt encumbering such residential cooperative property. The UW NCF DSCR, UW NOI Debt Yield, Cut-off Date LTV and Maturity Date/ARD LTV information do not take into account any subordinate debt (whether or not secured by the related mortgaged property), that currently exists or is allowed under the terms of any mortgage loan. See “Certain Characteristics of Mortgage Loans Secured by Residential Cooperatives” in the Preliminary Prospectus. |
| (2) | For the mortgage loans that are interest-only for the entire term and accrue interest on an Actual/360 basis, the Monthly Debt Service Amount ($) was calculated as 1/12th of the product of (i) the Original Balance ($), (ii) the Interest Rate % and (iii) 365/360. |
| (3) | In the case of Loan No. 4, the Cut-off Date LTV and Maturity/ARD LTV are calculated by using an appraised value based on an “as portfolio” assumption. In the case of Loan No. 5, the Cut-off Date LTV and Maturity/ARD LTV are calculated by using an appraised value based on a “prospective as complete - proposed” assumption. In the case of Loan No. 15, the Cut-off Date LTV and Maturity/ARD LTV are calculated by using an appraised value based on a “as complete” assumption. Refer to the definition of “Appraised Value” under “Description of the Mortgage Pool—Certain Calculations and Definitions” in the Preliminary Prospectus for additional details. |
| (4) | In the case of Loan Nos. 13, 14, 26, 27 and 32, the mortgage loans are with anticipated repayment dates and presented as if they were to mature on the related anticipated repayment date. |
| (5) | Seventeen (17) of the mortgage loans, each of which is secured by a residential cooperative property, currently have subordinate secured lines of credit to the related mortgage borrowers that permit future advances (such loans, collectively, the “Subordinate Coop LOCs”). The percentage figure expressed as % of Mortgage Loans with Additional Debt” is determined as a percentage of the initial pool balance and does not take into account any Subordinate Coop LOCs and future subordinate debt (whether or not secured by the mortgaged property), if any, that may be permitted under the terms of any mortgage loan or the pooling and servicing agreement. See “Existing Additional Secured Debt—Additional Debt Financing For Mortgage Loans Secured by Residential Cooperatives Sold to the Depositor by National Cooperative Bank, N.A.” in the Preliminary Prospectus. |
| (6) | Excludes mortgage loans that are secured by multiple properties with multiple tenants. |
| (7) | Excludes 26 mortgage loans that are interest-only for the entire term or until the anticipated repayment date. |
| (8) | For a more detailed description of lockboxes, refer to “Description of the Mortgage Pool—Certain Calculations and Definitions” and “—Certain Terms of the Mortgage Loans—Mortgaged Property Accounts” in the Preliminary Prospectus. |
| (9) | Calculated only with respect to the Cut-off Date Balance of mortgage loans secured or partially secured by office, industrial, retail, hospitality (with commercial tenants), data center and mixed use properties. |
THE INFORMATION IN THIS STRUCTURAL AND COLLATERAL TERM SHEET IS NOT COMPLETE AND MAY BE AMENDED PRIOR TO THE TIME OF SALE. THIS TERM SHEET IS NOT AN OFFER TO SELL THESE SECURITIES AND IT IS NOT A SOLICITATION OF AN OFFER TO BUY THESE SECURITIES IN ANY JURISDICTION WHERE THE OFFER OR SALE IS NOT PERMITTED. |
| | 9 | |
| Structural and Collateral Term Sheet | | BMO 2024-C8 |
| Collateral Characteristics |
| Ten Largest Mortgage Loans |
| |
| No. | Loan Name | City, State | Mortgage Loan Seller | No.
of Prop. | Cut-off Date Balance | % of IPB | Square Feet / Rooms / Units | Property Type | UW
NCF DSCR(1)(2) | UW NOI Debt Yield(1) | Cut-off Date LTV(1)(3) | Maturity Date/ARD LTV(1)(3)(4) |
| 1 | Danbury Fair Mall | Danbury, CT | GSMC, BMO | 1 | $68,000,000 | 9.9% | 923,598 | Retail | 2.52x | 19.4% | 41.8% | 40.9% |
| 2 | 60 Hudson | New York, NY | MSMCH, BMO | 1 | $65,000,000 | 9.5% | 1,149,619 | Other | 3.92x | 24.2% | 17.5% | 17.5% |
| 3 | Fayette Pavilion | Fayetteville, GA | SMC | 1 | $65,000,000 | 9.5% | 1,063,840 | Retail | 1.60x | 11.3% | 64.4% | 64.4% |
| 4 | Tekni-Plex Industrial Portfolio | Various, Various | GACC | 8 | $58,410,000 | 8.5% | 1,138,969 | Industrial | 2.07x | 14.4% | 55.6% | 55.6% |
| 5 | Axis Apartments | Chicago, IL | CREFI | 1 | $58,000,000 | 8.5% | 716 | Multifamily | 1.37x | 9.8% | 53.0% | 53.0% |
| 6 | AHF Crossville Portfolio | Crossville, TN | CREFI | 2 | $37,300,000 | 5.5% | 949,281 | Industrial | 1.67x | 12.7% | 60.2% | 60.2% |
| 7 | Arundel Mills and Marketplace | Hanover, MD | GACC | 1 | $35,000,000 | 5.1% | 1,938,983 | Retail | 1.98x | 16.1% | 41.4% | 41.4% |
| 8 | Monroe Street Retail | Toledo, OH | ZBNA | 1 | $34,500,000 | 5.0% | 543,378 | Retail | 1.72x | 13.1% | 63.0% | 63.0% |
| 9 | Residence Inn Del Mar | San Diego, CA | GACC | 1 | $25,000,000 | 3.7% | 118 | Hospitality | 1.78x | 14.2% | 50.0% | 50.0% |
| 10 | Lincoln City Outlet Center | Lincoln City, OR | CREFI | 1 | $23,162,500 | 3.4% | 255,608 | Retail | 2.01x | 16.2% | 64.0% | 64.0% |
| | | | | | | | | | | | | |
| | Top 3 Total/Weighted Average | 3 | $198,000,000 | 29.0% | | | 2.68x | 18.3% | 41.2% | 40.9% |
| | Top 5 Total/Weighted Average | 12 | $314,410,000 | 46.0% | | | 2.32x | 16.0% | 46.1% | 45.9% |
| | Top 10 Total/Weighted Average | 18 | $469,372,500 | 68.7% | | | 2.16x | 15.5% | 49.2% | 49.1% |
| | Non-Top 10 Total/Weighted Average(1)(3)(5) | 47 | $214,064,433 | 31.3% | | | 3.12x | 23.9% | 44.2% | 43.4% |
| (1) | In the case of Loan Nos. 1, 2, 3, 5, 7, 11, 12 and 21, the UW NCF DSCR, UW NOI Debt Yield, Cut-off Date LTV and Maturity Date/ARD LTV calculations include the related Pari Passu Companion Loan(s). In the case of Loan No. 11, the UW NCF DSCR, UW NOI Debt Yield, Cut-off Date LTV and Maturity Date/ARD LTV calculations exclude the related Subordinate Companion Loans. |
| (2) | For the mortgage loans that are interest-only for the entire term and accrue interest on an Actual/360 basis, the Monthly Debt Service Amount ($) was calculated as 1/12th of the product of (i) the Original Balance ($), (ii) the Interest Rate % and (iii) 365/360. |
| (3) | In the case of Loan No. 4, the Cut-off Date LTV and Maturity/ARD LTV are calculated by using an appraised value based on an “as portfolio” assumption. In the case of Loan No. 5, the Cut-off Date LTV and Maturity/ARD LTV are calculated by using an appraised value based on a “prospective as complete - proposed” assumption. In the case of Loan No. 15, the Cut-off Date LTV and Maturity/ARD LTV are calculated by using an appraised value based on a “as complete” assumption. Refer to the definition of “Appraised Value” under “Description of the Mortgage Pool—Certain Calculations and Definitions” in the Preliminary Prospectus for additional details. |
| (4) | In the case of Loan Nos. 13, 14, 26, 27 and 32, the mortgage loans are with anticipated repayment dates and presented as if they were to mature on the related anticipated repayment date. |
| (5) | For mortgaged properties securing residential cooperative mortgage loans, UW NCF DSCR and UW NOI Debt Yield calculations for each such mortgaged property is calculated using underwritten net operating income or underwritten net cash flow, as applicable, for the related residential cooperative property which is the projected net operating income or net cash flow, as applicable, reflected in the most recent appraisal obtained by or otherwise in the possession of the related mortgage loan seller as of the Cut-off Date. The Cut-off Date LTV and Maturity Date/ARD LTV calculations are based upon the appraised value of the residential cooperative property determined as if such residential cooperative property is operated as a residential cooperative, inclusive of the amount of the underlying debt encumbering such residential cooperative property. The UW NCF DSCR, UW NOI Debt Yield, Cut-off Date LTV and Maturity Date/ARD LTV information do not take into account any subordinate debt (whether or not secured by the related mortgaged property), that currently exists or is allowed under the terms of any mortgage loan. See “Certain Characteristics of Mortgage Loans Secured by Residential Cooperatives” in the Preliminary Prospectus. |
THE INFORMATION IN THIS STRUCTURAL AND COLLATERAL TERM SHEET IS NOT COMPLETE AND MAY BE AMENDED PRIOR TO THE TIME OF SALE. THIS TERM SHEET IS NOT AN OFFER TO SELL THESE SECURITIES AND IT IS NOT A SOLICITATION OF AN OFFER TO BUY THESE SECURITIES IN ANY JURISDICTION WHERE THE OFFER OR SALE IS NOT PERMITTED. |
| | 10 | |
| Structural and Collateral Term Sheet | | BMO 2024-C8 |
| Collateral Characteristics |
| Pari Passu Companion Loan Summary |
No. | Loan Name | Mortgage Loan Seller | Trust Cut-off Date Balance | Aggregate Pari Passu Loan Cut-off Date Balance(1) | Controlling Pooling/Trust & Servicing Agreement | Master Servicer | Special Servicer | Related Pari Passu Loan(s) Securitizations | Related Pari Passu Loan(s) Original Balance(1) |
| 1 | Danbury Fair Mall | GSMC, BMO | $68,000,000 | $87,000,000 | BMO 2024-C8 | Wells Fargo | Rialto | Future Securitization(s) | $87,000,000 |
| 2 | 60 Hudson | MSMCH, BMO | $65,000,000 | $215,000,000 | MSWF 2023-2 | Wells Fargo | Argentic | MSWF 2023-2
BBCMS 2023-C22
BMO 2023-C7
Future Securitization(s) | $90,000,000
$40,000,000
$20,000,000
$65,000,000 |
| 3 | Fayette Pavilion | SMC | $65,000,000 | $29,125,000 | BMO 2024-C8 | Wells Fargo | Rialto | Future Securitization(s) | $29,125,000 |
| 5 | Axis Apartments | CREFI | $58,000,000 | $78,000,000 | Benchmark 2023-B40 | Midland | LNR Partners | Benchmark 2023-B40
BBCMS 2024-C24 | $48,000,000
$30,000,000 |
| 7 | Arundel Mills and Marketplace | GACC | $35,000,000 | $325,000,000 | MSWF 2023-2 | Wells Fargo | Argentic | MSWF 2023-2
BMO 2023-C7
Benchmark 2023-B40
BBCMS 2024-C24
Future Securitization(s) | $90,000,000
$60,000,000
$25,000,000
$60,000,000
$90,000,000 |
| 11 | Woodfield Mall | BMO | $20,000,000 | $244,000,000 | BMO 2023-C7 | Midland | KeyBank | BMO 2023-C7
BBCMS 2024-C24
Future Securitization(s) | $68,000,000
$67,500,000
$108,500,000 |
| 12 | Medlock Crossing | LMF | $19,850,000 | $7,000,000 | BMO 2024-C8 | Wells Fargo | Rialto | Future Securitization(s) | $7,000,000 |
| 21 | OPI Portfolio | UBS AG | $6,300,000 | $48,000,000 | BMO 2024-5C3 | Wells Fargo | Greystone | BMO 2023-C7
BMO 2024-5C3 | $25,000,000
$23,000,000 |
| (1) | In the case of Loan No. 11, the Aggregate Pari Passu Loan Cut-off Date Balance and Related Pari Passu Loan(s) Original Balance exclude the related Subordinate Companion Loan(s). |
THE INFORMATION IN THIS STRUCTURAL AND COLLATERAL TERM SHEET IS NOT COMPLETE AND MAY BE AMENDED PRIOR TO THE TIME OF SALE. THIS TERM SHEET IS NOT AN OFFER TO SELL THESE SECURITIES AND IT IS NOT A SOLICITATION OF AN OFFER TO BUY THESE SECURITIES IN ANY JURISDICTION WHERE THE OFFER OR SALE IS NOT PERMITTED. |
| | 11 | |
| Structural and Collateral Term Sheet | | BMO 2024-C8 |
| Collateral Characteristics |
| Additional Debt Summary(1) |
No. | Loan Name | Trust
Cut-off Date Balance | Pari Passu Loan(s) Cut-off Date Balance | Subordinate Debt Cut-off Date Balance(2) | Total Debt Cut-off Date Balance | Mortgage Loan UW NCF DSCR(3) | Total Debt UW NCF DSCR | Mortgage Loan
Cut-off Date LTV(3) | Total Debt Cut-off Date LTV | Mortgage Loan UW NOI Debt Yield(3) | Total Debt UW NOI Debt Yield |
| 11 | Woodfield Mall | $20,000,000 | $244,000,000 | $30,000,000 | $294,000,000 | 2.42x | 2.05x | 38.0% | 42.4% | 16.0% | 14.3% |
| (1) | Seventeen (17) of the mortgage loans, each of which is secured by a residential cooperative property, currently have in place Subordinate Coop LOCs that permit future advances. See “Existing Additional Secured Debt—Additional Debt Financing For Mortgage Loans Secured by Residential Cooperatives Sold to the Depositor by National Cooperative Bank, N.A.” in the Preliminary Prospectus. |
| (2) | In the case of Loan No. 11, subordinate debt represents one or more Subordinate Companion Loans. |
| (3) | Mortgage Loan UW NCF DSCR, Mortgage Loan Cut-off Date LTV and Mortgage Loan UW NOI Debt Yield calculations include any related Pari Passu Companion Loans (if applicable), but exclude the related Subordinate Companion Loans. |
THE INFORMATION IN THIS STRUCTURAL AND COLLATERAL TERM SHEET IS NOT COMPLETE AND MAY BE AMENDED PRIOR TO THE TIME OF SALE. THIS TERM SHEET IS NOT AN OFFER TO SELL THESE SECURITIES AND IT IS NOT A SOLICITATION OF AN OFFER TO BUY THESE SECURITIES IN ANY JURISDICTION WHERE THE OFFER OR SALE IS NOT PERMITTED. |
| | 12 | |
| Structural and Collateral Term Sheet | | BMO 2024-C8 |
| Collateral Characteristics |
| Mortgaged Properties by Type(1) |
| | | | | | Weighted Average |
| Property Type | Property Subtype | Number of Properties | Cut-off Date Principal Balance | % of IPB | UW
NCF DSCR(2)(3)(4) | UW
NOI DY(2)(4) | Cut-off Date LTV(2)(4)(5) | Maturity Date/ARD LTV (2)(4)(5)(6) |
| Retail | Anchored | 6 | $140,168,150 | 20.5% | 1.64x | 12.4% | 62.0% | 61.9% |
| | Super Regional Mall | 3 | 123,000,000 | 18.0 | 2.35x | 17.9% | 41.1% | 40.6% |
| | Single Tenant | 6 | 45,300,000 | 6.6 | 1.58x | 11.4% | 59.7% | 59.7% |
| | Outlet Center | 1 | 23,162,500 | 3.4 | 2.01x | 16.2% | 64.0% | 64.0% |
| | Subtotal: | 16 | $331,630,650 | 48.5% | 1.92x | 14.6% | 54.1% | 53.8% |
| Multifamily | Cooperative | 24 | $58,450,003 | 8.6% | 6.73x | 51.6% | 11.9% | 10.9% |
| | High Rise | 1 | 58,000,000 | 8.5 | 1.37x | 9.8% | 53.0% | 53.0% |
| | Subtotal: | 25 | $116,450,003 | 17.0% | 4.06x | 30.8% | 32.4% | 31.9% |
| Industrial | Manufacturing | 6 | $46,060,000 | 6.7% | 1.91x | 14.0% | 58.2% | 56.8% |
| | Manufacturing/Warehouse | 2 | 37,300,000 | 5.5 | 1.67x | 12.7% | 60.2% | 60.2% |
| | Warehouse/Manufacturing | 2 | 15,446,000 | 2.3 | 2.07x | 14.4% | 55.6% | 55.6% |
| | Warehouse/Distribution | 1 | 8,904,000 | 1.3 | 2.07x | 14.4% | 55.6% | 55.6% |
| | Subtotal: | 11 | $107,710,000 | 15.8% | 1.86x | 13.7% | 58.3% | 57.7% |
| Other | Data Center | 1 | $65,000,000 | 9.5% | 3.92x | 24.2% | 17.5% | 17.5% |
| Hospitality | Extended Stay | 1 | $25,000,000 | 3.7% | 1.78x | 14.2% | 50.0% | 50.0% |
| | Limited Service | 2 | 10,496,280 | 1.5 | 2.14x | 20.8% | 55.6% | 51.8% |
| | Subtotal: | 3 | $35,496,280 | 5.2% | 1.89x | 16.2% | 51.7% | 50.5% |
| Office | Medical | 4 | $7,500,000 | 1.1% | 1.89x | 13.1% | 55.1% | 55.1% |
| | Suburban | 1 | 4,499,569 | 0.7 | 1.75x | 13.8% | 48.4% | 48.4% |
| | CBD | 1 | 1,800,431 | 0.3 | 1.75x | 13.8% | 48.4% | 48.4% |
| | Subtotal: | 6 | $13,800,000 | 2.0% | 1.83x | 13.4% | 52.0% | 52.0% |
| Self Storage | Self Storage | 1 | $9,500,000 | 1.4% | 1.73x | 11.4% | 66.9% | 66.9% |
| Manufactured Housing | RV Park | 2 | $3,850,000 | 0.6% | 1.65x | 14.5% | 65.0% | 65.0% |
| Total / Weighted Average: | 65 | $683,436,933 | 100.0% | 2.46x | 18.1% | 47.6% | 47.3% |
| (1) | Because this table presents information relating to the mortgaged properties and not mortgage loans, the information for mortgage loans secured by more than one mortgaged property is based on allocated loan amounts, individual appraised values, net cash flow or net operating income with respect to such individual mortgaged properties, as applicable. |
| (2) | In the case of Loan Nos. 1, 2, 3, 5, 7, 11, 12 and 21, the UW NCF DSCR, UW NOI Debt Yield, Cut-off Date LTV and Maturity Date/ARD LTV calculations include the related Pari Passu Companion Loan(s). In the case of Loan No. 11, the UW NCF DSCR, UW NOI Debt Yield, Cut-off Date LTV and Maturity Date/ARD LTV calculations exclude the related Subordinate Companion Loans. |
| (3) | For the mortgage loans that are interest-only for the entire term or until the anticipated repayment date and accrue interest on an Actual/360 basis, the Monthly Debt Service Amount ($) was calculated as 1/12th of the product of (i) the Original Balance ($), (ii) the Interest Rate % and (iii) 365/360. |
| (4) | For mortgaged properties securing residential cooperative mortgage loans, the UW NCF DSCR and UW NOI Debt Yield for each such mortgaged property is calculated using underwritten net operating income or underwritten net cash flow, as applicable, for the related residential cooperative property which is the projected net operating income or net cash flow, as applicable, reflected in the most recent appraisal obtained by or otherwise in the possession of the related mortgage loan seller as of the Cut-off Date. The Cut-off Date LTV and Maturity Date/ARD LTV calculations are based upon the appraised value of the residential cooperative property determined as if such residential cooperative property is operated as a residential cooperative, inclusive of the amount of the underlying debt encumbering such residential cooperative property. The UW NCF DSCR, UW NOI Debt Yield, Cut-off Date LTV and Maturity Date/ARD LTV calculations do not take into account any subordinate debt (whether or not secured by the related mortgaged property) that currently exists or is allowed under the terms of any mortgage loan. |
| (5) | In the case of Loan No. 4, the Cut-off Date LTV and Maturity/ARD LTV are calculated by using an appraised value based on an “as portfolio” assumption. In the case of Loan No. 5, the Cut-off Date LTV and Maturity/ARD LTV are calculated by using an appraised value based on a “prospective as complete - proposed” assumption. In the case of Loan No. 15, the Cut-off Date LTV and Maturity/ARD LTV are calculated by using an appraised value based on a “as complete” assumption. Refer to the definition of “Appraised Value” under “Description of the Mortgage Pool—Certain Calculations and Definitions” in the Preliminary Prospectus for additional details. |
| (6) | In the case of Loan Nos. 13, 14, 26, 27 and 32, the mortgage loans are with anticipated repayment dates and presented as if they were to mature on the related anticipated repayment date. |
THE INFORMATION IN THIS STRUCTURAL AND COLLATERAL TERM SHEET IS NOT COMPLETE AND MAY BE AMENDED PRIOR TO THE TIME OF SALE. THIS TERM SHEET IS NOT AN OFFER TO SELL THESE SECURITIES AND IT IS NOT A SOLICITATION OF AN OFFER TO BUY THESE SECURITIES IN ANY JURISDICTION WHERE THE OFFER OR SALE IS NOT PERMITTED. |
| | 13 | |
| Structural and Collateral Term Sheet | | BMO 2024-C8 |
| Collateral Characteristics |
| Mortgaged Properties by Location(1) |
| | | | | Weighted Average |
State | Number of Properties | Cut-off Date Principal Balance | % of IPB | UW
NCF DSCR(2)(3)(4) | UW
NOI DY(2)(4) | Cut-off Date LTV(2)(4)(5) | Maturity Date/ARD LTV (2)(4)(5)(6) |
| New York | 27 | $156,744,092 | 22.9% | 4.49x | 31.7% | 24.7% | 24.3% |
| Georgia | 3 | 89,349,569 | 13.1 | 1.56x | 11.3% | 63.5% | 63.5% |
| Illinois | 4 | 87,173,150 | 12.8 | 1.64x | 11.9% | 50.3% | 50.1% |
| Connecticut | 1 | 68,000,000 | 9.9 | 2.52x | 19.4% | 41.8% | 40.9% |
| Ohio | 3 | 50,645,000 | 7.4 | 1.83x | 13.5% | 60.6% | 60.6% |
| Tennessee | 4 | 41,150,000 | 6.0 | 1.67x | 12.9% | 60.6% | 60.6% |
| Maryland | 2 | 41,000,000 | 6.0 | 2.04x | 16.4% | 41.1% | 41.1% |
| California | 2 | 34,500,000 | 5.0 | 1.77x | 13.4% | 54.7% | 54.7% |
| Oregon | 1 | 23,162,500 | 3.4 | 2.01x | 16.2% | 64.0% | 64.0% |
| Texas | 4 | 22,379,431 | 3.3 | 1.83x | 13.6% | 52.9% | 52.9% |
| North Carolina | 2 | 18,059,000 | 2.6 | 1.75x | 12.4% | 59.9% | 59.9% |
| Indiana | 5 | 14,312,000 | 2.1 | 1.98x | 13.7% | 55.3% | 55.3% |
| South Carolina | 1 | 12,000,000 | 1.8 | 1.47x | 13.0% | 65.4% | 60.3% |
| Colorado | 1 | 6,500,000 | 1.0 | 2.12x | 21.0% | 54.2% | 52.0% |
| Michigan | 1 | 4,900,000 | 0.7 | 1.43x | 10.9% | 54.1% | 54.1% |
| Alabama | 1 | 4,200,000 | 0.6 | 1.49x | 10.7% | 60.9% | 60.9% |
| Pennsylvania | 1 | 3,996,280 | 0.6 | 2.18x | 20.6% | 57.9% | 51.4% |
| Arkansas | 1 | 3,100,000 | 0.5 | 1.50x | 10.7% | 58.5% | 58.5% |
| New Jersey | 1 | 2,265,911 | 0.3 | 5.13x | 39.7% | 15.2% | 13.1% |
| Total / Weighted Average: | 65 | $683,436,933 | 100.0% | 2.46x | 18.1% | 47.6% | 47.3% |
| (1) | Because this table presents information relating to the mortgaged properties and not mortgage loans, the information for mortgage loans secured by more than one mortgaged property is based on allocated loan amounts, individual appraised values, net cash flow or net operating income with respect to such individual mortgaged properties, as applicable. |
| (2) | In the case of Loan Nos. 1, 2, 3, 5, 7, 11, 12 and 21, the UW NCF DSCR, UW NOI Debt Yield, Cut-off Date LTV and Maturity Date/ARD LTV calculations include the related Pari Passu Companion Loan(s). In the case of Loan No. 11, the UW NCF DSCR, UW NOI Debt Yield, Cut-off Date LTV and Maturity Date/ARD LTV calculations exclude the related Subordinate Companion Loans. |
| (3) | For the mortgage loans that are interest-only for the entire term or until the anticipated repayment date and accrue interest on an Actual/360 basis, the Monthly Debt Service Amount ($) was calculated as 1/12th of the product of (i) the Original Balance ($), (ii) the Interest Rate % and (iii) 365/360. |
| (4) | For mortgaged properties securing residential cooperative mortgage loans, the UW NCF DSCR and UW NOI Debt Yield for each such mortgaged property is calculated using underwritten net operating income or underwritten net cash flow, as applicable, for the related residential cooperative property which is the projected net operating income or net cash flow, as applicable, reflected in the most recent appraisal obtained by or otherwise in the possession of the related mortgage loan seller as of the Cut-off Date. The Cut-off Date LTV and Maturity Date/ARD LTV calculations are based upon the appraised value of the residential cooperative property determined as if such residential cooperative property is operated as a residential cooperative, inclusive of the amount of the underlying debt encumbering such residential cooperative property. The UW NCF DSCR, UW NOI Debt Yield, Cut-off Date LTV and Maturity Date/ARD LTV calculations do not take into account any subordinate debt (whether or not secured by the related mortgaged property) that currently exists or is allowed under the terms of any mortgage loan. |
| (5) | In the case of Loan No. 4, the Cut-off Date LTV and Maturity/ARD LTV are calculated by using an appraised value based on an “as portfolio” assumption. In the case of Loan No. 5, the Cut-off Date LTV and Maturity/ARD LTV are calculated by using an appraised value based on a “prospective as complete - proposed” assumption. In the case of Loan No. 15, the Cut-off Date LTV and Maturity/ARD LTV are calculated by using an appraised value based on a “as complete” assumption. Refer to the definition of “Appraised Value” under “Description of the Mortgage Pool—Certain Calculations and Definitions” in the Preliminary Prospectus for additional details. |
| (6) | In the case of Loan Nos. 13, 14, 26, 27 and 32, the mortgage loans are with anticipated repayment dates and presented as if they were to mature on the related anticipated repayment date. |
THE INFORMATION IN THIS STRUCTURAL AND COLLATERAL TERM SHEET IS NOT COMPLETE AND MAY BE AMENDED PRIOR TO THE TIME OF SALE. THIS TERM SHEET IS NOT AN OFFER TO SELL THESE SECURITIES AND IT IS NOT A SOLICITATION OF AN OFFER TO BUY THESE SECURITIES IN ANY JURISDICTION WHERE THE OFFER OR SALE IS NOT PERMITTED. |
| | 14 | |
| Structural and Collateral Term Sheet | | BMO 2024-C8 |
| Collateral Characteristics |
| Cut-off Date Principal Balance |
| | | | | Weighted Average |
| Range of Cut-off Date Principal Balances | Number of Loans | Cut-off Date Principal Balance | % of IPB | Mortgage Rate | Remaining Loan Term | UW
NCF DSCR(1)(2)(3) | UW
NOI
DY(1)(3) | Cut-off
Date LTV(1)(3)(4) | Maturity Date/ARD LTV(1)(3)(4)(5) |
| $1,198,204 | - | $4,999,999 | 28 | $72,160,518 | 10.6 | % | 6.93173% | 114 | 5.62x | 43.3% | 26.5% | 25.6% |
| $5,000,000 | - | $9,999,999 | 9 | 61,053,915 | 8.9 | | 7.23985% | 99 | 1.97x | 15.9% | 48.4% | 47.6% |
| $10,000,000 | - | $19,999,999 | 4 | 60,850,000 | 8.9 | | 7.12862% | 120 | 1.52x | 11.6% | 63.0% | 62.0% |
| $20,000,000 | - | $29,999,999 | 3 | 68,162,500 | 10.0 | | 6.85707% | 119 | 2.05x | 15.4% | 51.2% | 51.2% |
| $30,000,000 | - | $39,999,999 | 3 | 106,800,000 | 15.6 | | 7.19123% | 118 | 1.79x | 13.9% | 54.9% | 54.9% |
| $40,000,000 | - | $68,000,000 | 5 | 314,410,000 | 46.0 | | 6.55902% | 118 | 2.32x | 16.0% | 46.1% | 45.9% |
| Total / Weighted Average: | 52 | $683,436,933 | 100.0 | % | 6.83843% | 116 | 2.46x | 18.1% | 47.6% | 47.3% |
| | | | | Weighted Average |
Range of
Mortgage Interest Rates | Number of Loans | Cut-off Date Principal Balance | % of IPB | Mortgage Rate | Remaining Loan Term | UW
NCF DSCR(1)(2)(3) | UW
NOI
DY(1)(3) | Cut-off
Date LTV(1)(3)(4) | Maturity Date/ARD LTV(1)(3)(4)(5) |
| 5.88500% | - | 5.99999% | 2 | $67,650,000 | 9.9 | % | 5.88755% | 115 | 4.39x | 27.8% | 17.0% | 17.0% |
| 6.00000% | - | 6.49999% | 11 | 113,359,358 | 16.6 | | 6.38007% | 118 | 3.26x | 24.3% | 38.6% | 37.9% |
| 6.50000% | - | 6.99999% | 13 | 247,562,407 | 36.2 | | 6.84004% | 119 | 2.15x | 15.5% | 54.1% | 54.1% |
| 7.00000% | - | 7.49999% | 18 | 183,080,782 | 26.8 | | 7.10391% | 120 | 1.85x | 14.4% | 55.7% | 55.3% |
| 7.50000% | - | 7.99999% | 6 | 61,434,386 | 9.0 | | 7.67484% | 104 | 1.97x | 17.5% | 45.8% | 45.0% |
| 8.00000% | - | 8.49999% | 1 | 6,500,000 | 1.0 | | 8.23200% | 60 | 2.12x | 21.0% | 54.2% | 52.0% |
| 8.50000% | - | 8.61500% | 1 | 3,850,000 | 0.6 | | 8.61500% | 60 | 1.65x | 14.5% | 65.0% | 65.0% |
| Total / Weighted Average: | 52 | $683,436,933 | 100.0 | % | 6.83843% | 116 | 2.46x | 18.1% | 47.6% | 47.3% |
| Original Term to Maturity in Months |
| | | | | Weighted Average |
Original Term to
Maturity in Months | Number of Loans | Cut-off Date Principal Balance | % of IPB | Mortgage Rate | Remaining Loan Term | UW
NCF DSCR(1)(2)(3) | UW
NOI
DY(1)(3) | Cut-off
Date LTV(1)(3)(4) | Maturity Date/ARD LTV(1)(3)(4)(5) |
| 60 | 4 | $23,893,150 | 3.5 | % | 7.93814% | 58 | 1.77x | 16.6% | 56.6% | 55.1% |
| 84 | 1 | 2,247,523 | 0.3 | | 6.39000% | 83 | 5.65x | 43.2% | 6.6% | 6.0% |
| 120 | 47 | 657,296,260 | 96.2 | | 6.79998% | 118 | 2.47x | 18.1% | 47.4% | 47.1% |
| Total / Weighted Average: | 52 | $683,436,933 | 100.0 | % | 6.83843% | 116 | 2.46x | 18.1% | 47.6% | 47.3% |
| Remaining Term to Maturity in Months |
| | | | | Weighted Average |
| Range of Remaining Term to Maturity in Months | Number of Loans | Cut-off Date Principal Balance | % of IPB | Mortgage Rate | Remaining Loan Term | UW
NCF DSCR(1)(2)(3) | UW
NOI
DY(1)(3) | Cut-off
Date LTV(1)(3)(4) | Maturity Date/ARD LTV(1)(3)(4)(5) |
| 55 | - | 60 | 4 | $23,893,150 | 3.5 | % | 7.93814% | 58 | 1.77x | 16.6% | 56.6% | 55.1% |
| 83 | - | 83 | 1 | 2,247,523 | 0.3 | | 6.39000% | 83 | 5.65x | 43.2% | 6.6% | 6.0% |
| 111 | - | 120 | 47 | 657,296,260 | 96.2 | | 6.79998% | 118 | 2.47x | 18.1% | 47.4% | 47.1% |
| Total / Weighted Average: | 52 | $683,436,933 | 100.0 | % | 6.83843% | 116 | 2.46x | 18.1% | 47.6% | 47.3% |
| (1) | In the case of Loan Nos. 1, 2, 3, 5, 7, 11, 12 and 21, the UW NCF DSCR, UW NOI Debt Yield, Cut-off Date LTV and Maturity Date/ARD LTV calculations include the related Pari Passu Companion Loan(s). In the case of Loan No. 11, the UW NCF DSCR, UW NOI Debt Yield, Cut-off Date LTV and Maturity Date/ARD LTV calculations exclude the related Subordinate Companion Loans. |
| (2) | For the mortgage loans that are interest-only for the entire term or until the anticipated repayment date and accrue interest on an Actual/360 basis, the Monthly Debt Service Amount ($) was calculated as 1/12th of the product of (i) the Original Balance ($), (ii) the Interest Rate % and (iii) 365/360. |
| (3) | For mortgaged properties securing residential cooperative mortgage loans, the UW NCF DSCR and UW NOI Debt Yield for each such mortgaged property is calculated using underwritten net operating income or underwritten net cash flow, as applicable, for the related residential cooperative property which is the projected net operating income or net cash flow, as applicable, reflected in the most recent appraisal obtained by or otherwise in the possession of the related mortgage loan seller as of the Cut-off Date. The Cut-off Date LTV and Maturity Date/ARD LTV calculations are based upon the appraised value of the residential cooperative property determined as if such residential cooperative property is operated as a residential cooperative, inclusive of the amount of the underlying debt encumbering such residential cooperative property. The UW NCF DSCR, UW NOI Debt Yield, Cut-off Date LTV and Maturity Date/ARD LTV calculations do not take into account any subordinate debt (whether or not secured by the related mortgaged property) that currently exists or is allowed under the terms of any mortgage loan. |
| (4) | In the case of Loan No. 4, the Cut-off Date LTV and Maturity/ARD LTV are calculated by using an appraised value based on an “as portfolio” assumption. In the case of Loan No. 5, the Cut-off Date LTV and Maturity/ARD LTV are calculated by using an appraised value based on a “prospective as complete - proposed” assumption. In the case of Loan No. 15, the Cut-off Date LTV and Maturity/ARD LTV are calculated by using an appraised value based on a “as complete” assumption. Refer to the definition of “Appraised Value” under “Description of the Mortgage Pool—Certain Calculations and Definitions” in the Preliminary Prospectus for additional details. |
| (5) | In the case of Loan Nos. 13, 14, 26, 27 and 32, the mortgage loans are with anticipated repayment dates and presented as if they were to mature on the related anticipated repayment date. |
THE INFORMATION IN THIS STRUCTURAL AND COLLATERAL TERM SHEET IS NOT COMPLETE AND MAY BE AMENDED PRIOR TO THE TIME OF SALE. THIS TERM SHEET IS NOT AN OFFER TO SELL THESE SECURITIES AND IT IS NOT A SOLICITATION OF AN OFFER TO BUY THESE SECURITIES IN ANY JURISDICTION WHERE THE OFFER OR SALE IS NOT PERMITTED. |
| | 15 | |
| Structural and Collateral Term Sheet | | BMO 2024-C8 |
| Collateral Characteristics |
| Original Amortization Term in Months |
| | | | | Weighted Average |
Original
Amortization
Term in Months | Number of Loans | Cut-off Date Principal Balance | % of IPB | Mortgage Rate | Remaining Loan Term | UW
NCF DSCR(1)(2)(3) | UW
NOI
DY(1)(3) | Cut-off
Date LTV(1)(3)(4) | Maturity Date/ARD LTV(1)(3)(4)(5) |
| Interest Only | 26 | $536,797,500 | 78.5 | % | 6.86668% | 117 | 2.08x | 14.7% | 51.0% | 51.0% |
| 120 | 1 | 1,319,956 | 0.2 | | 7.68000% | 116 | 5.98x | 89.5% | 3.7% | 0.0% |
| 360 | 21 | 132,180,743 | 19.3 | | 6.71545% | 112 | 3.72x | 29.4% | 38.1% | 36.3% |
| 480 | 4 | 13,138,734 | 1.9 | | 6.83675% | 118 | 4.68x | 35.2% | 12.2% | 11.6% |
| Total / Weighted Average: | 52 | $683,436,933 | 100.0 | % | 6.83843% | 116 | 2.46x | 18.1% | 47.6% | 47.3% |
| Remaining Amortization Term in Months |
| | | | | Weighted Average |
| Range of Remaining Amortization Term in Months | Number of Loans | Cut-off Date Principal Balance | % of IPB | Mortgage Rate | Remaining Loan Term | UW
NCF DSCR(1)(2)(3) | UW
NOI
DY(1)(3) | Cut-off
Date LTV(1)(3)(4) | Maturity Date/ARD LTV(1)(3)(4)(5) |
| Interest Only | 26 | $536,797,500 | 78.5 | % | 6.86668% | 117 | 2.08x | 14.7% | 51.0% | 51.0% |
| 116 | - | 116 | 1 | 1,319,956 | 0.2 | | 7.68000% | 116 | 5.98x | 89.5% | 3.7% | 0.0% |
| 351 | - | 360 | 21 | 132,180,743 | 19.3 | | 6.71545% | 112 | 3.72x | 29.4% | 38.1% | 36.3% |
| 476 | - | 479 | 4 | 13,138,734 | 1.9 | | 6.83675% | 118 | 4.68x | 35.2% | 12.2% | 11.6% |
| Total / Weighted Average: | 52 | $683,436,933 | 100.0 | % | 6.83843% | 116 | 2.46x | 18.1% | 47.6% | 47.3% |
| | | | | Weighted Average |
| Amortization Types | Number of Loans | Cut-off Date Principal Balance | % of IPB | Mortgage Rate | Remaining Loan Term | UW
NCF DSCR(1)(2)(3) | UW
NOI
DY(1)(3) | Cut-off
Date LTV(1)(3)(4) | Maturity Date/ARD LTV(1)(3)(4)(5) |
| Interest Only | 21 | $496,397,500 | 72.6 | % | 6.85339% | 117 | 2.12x | 15.0% | 50.2% | 50.2% |
| Interest Only, Amortizing Balloon | 2 | 80,000,000 | 11.7 | | 6.49310% | 119 | 2.36x | 18.4% | 45.3% | 43.8% |
| Amortizing Balloon | 23 | 65,319,477 | 9.6 | | 7.01218% | 104 | 5.59x | 43.9% | 24.0% | 22.2% |
| Interest Only - ARD | 5 | 40,400,000 | 5.9 | | 7.03000% | 120 | 1.59x | 11.4% | 60.4% | 60.4% |
| Fully Amortizing | 1 | 1,319,956 | 0.2 | | 7.68000% | 116 | 5.98x | 89.5% | 3.7% | 0.0% |
| Total / Weighted Average: | 52 | $683,436,933 | 100.0 | % | 6.83843% | 116 | 2.46x | 18.1% | 47.6% | 47.3% |
| Underwritten Net Cash Flow Debt Service Coverage Ratios(1)(2) |
| | | | | Weighted Average |
| Range of Underwritten Net Cash Flow Debt Service Coverage Ratios | Number of Loans | Cut-off Date Principal Balance | % of IPB | Mortgage Rate | Remaining Loan Term | UW
NCF DSCR(1)(2)(3) | UW
NOI
DY(1)(3) | Cut-off
Date LTV(1)(3)(4) | Maturity Date/ARD LTV(1)(3)(4)(5) |
| 1.37x | - | 1.49x | 6 | $103,050,000 | 15.1 | % | 7.02259% | 118 | 1.40x | 10.5% | 57.0% | 56.4% |
| 1.50x | - | 1.59x | 2 | 10,343,150 | 1.5 | | 7.39205% | 77 | 1.52x | 14.6% | 60.5% | 58.5% |
| 1.60x | - | 1.69x | 6 | 140,289,033 | 20.5 | | 7.04342% | 118 | 1.63x | 11.9% | 61.2% | 61.1% |
| 1.70x | - | 1.79x | 5 | 82,875,000 | 12.1 | | 7.00034% | 114 | 1.74x | 13.4% | 57.3% | 57.3% |
| 1.80x | - | 1.89x | 1 | 7,500,000 | 1.1 | | 6.84100% | 120 | 1.89x | 13.1% | 55.1% | 55.1% |
| 1.90x | - | 1.99x | 1 | 35,000,000 | 5.1 | | 7.70100% | 116 | 1.98x | 16.1% | 41.4% | 41.4% |
| 2.00x | - | 2.99x | 8 | 187,563,399 | 27.4 | | 6.70829% | 117 | 2.28x | 17.2% | 48.9% | 48.4% |
| 3.00x | - | 15.90x | 23 | 116,816,351 | 17.1 | | 6.21624% | 115 | 5.44x | 38.4% | 14.5% | 14.1% |
| Total / Weighted Average: | 52 | $683,436,933 | 100.0 | % | 6.83843% | 116 | 2.46x | 18.1% | 47.6% | 47.3% |
| (1) | In the case of Loan Nos. 1, 2, 3, 5, 7, 11, 12 and 21, the UW NCF DSCR, UW NOI Debt Yield, Cut-off Date LTV and Maturity Date/ARD LTV calculations include the related Pari Passu Companion Loan(s). In the case of Loan No. 11, the UW NCF DSCR, UW NOI Debt Yield, Cut-off Date LTV and Maturity Date/ARD LTV calculations exclude the related Subordinate Companion Loans. |
| (2) | For the mortgage loans that are interest-only for the entire term or until the anticipated repayment date and accrue interest on an Actual/360 basis, the Monthly Debt Service Amount ($) was calculated as 1/12th of the product of (i) the Original Balance ($), (ii) the Interest Rate % and (iii) 365/360. |
| (3) | For mortgaged properties securing residential cooperative mortgage loans, the UW NCF DSCR and UW NOI Debt Yield for each such mortgaged property is calculated using underwritten net operating income or underwritten net cash flow, as applicable, for the related residential cooperative property which is the projected net operating income or net cash flow, as applicable, reflected in the most recent appraisal obtained by or otherwise in the possession of the related mortgage loan seller as of the Cut-off Date. The Cut-off Date LTV and Maturity Date/ARD LTV calculations are based upon the appraised value of the residential cooperative property determined as if such residential cooperative property is operated as a residential cooperative, inclusive of the amount of the underlying debt encumbering such residential cooperative property. The UW NCF DSCR, UW NOI Debt Yield, Cut-off Date LTV and Maturity Date/ARD LTV calculations do not take into account any subordinate debt (whether or not secured by the related mortgaged property) that currently exists or is allowed under the terms of any mortgage loan. |
| (4) | In the case of Loan No. 4, the Cut-off Date LTV and Maturity/ARD LTV are calculated by using an appraised value based on an “as portfolio” assumption. In the case of Loan No. 5, the Cut-off Date LTV and Maturity/ARD LTV are calculated by using an appraised value based on a “prospective as complete - proposed” assumption. In the case of Loan No. 15, the Cut-off Date LTV and Maturity/ARD LTV are calculated by using an appraised value based on a “as complete” assumption. Refer to the definition of “Appraised Value” under “Description of the Mortgage Pool—Certain Calculations and Definitions” in the Preliminary Prospectus for additional details. |
| (5) | In the case of Loan Nos. 13, 14, 26, 27 and 32, the mortgage loans are with anticipated repayment dates and presented as if they were to mature on the related anticipated repayment date. |
THE INFORMATION IN THIS STRUCTURAL AND COLLATERAL TERM SHEET IS NOT COMPLETE AND MAY BE AMENDED PRIOR TO THE TIME OF SALE. THIS TERM SHEET IS NOT AN OFFER TO SELL THESE SECURITIES AND IT IS NOT A SOLICITATION OF AN OFFER TO BUY THESE SECURITIES IN ANY JURISDICTION WHERE THE OFFER OR SALE IS NOT PERMITTED. |
| | 16 | |
| Structural and Collateral Term Sheet | | BMO 2024-C8 |
| Collateral Characteristics |
| LTV Ratios as of the Cut-off Date(1)(3) |
| | | | | Weighted Average |
Range of
Cut-off Date LTVs | Number of Loans | Cut-off Date Principal Balance | % of IPB | Mortgage Rate | Remaining Loan Term | UW
NCF DSCR(1)(2)(3) | UW
NOI
DY(1)(3) | Cut-off
Date LTV(1)(3)(4) | Maturity Date/ARD LTV(1)(3)(4)(5) |
| 3.3% | - | 49.9% | 30 | $258,750,003 | 37.9 | % | 6.55330% | 115 | 3.72x | 27.0% | 28.7% | 28.2% |
| 50.0% | - | 59.9% | 10 | 179,081,280 | 26.2 | | 6.97467% | 117 | 1.75x | 13.0% | 53.7% | 53.5% |
| 60.0% | - | 64.9% | 9 | 220,255,650 | 32.2 | | 7.03277% | 118 | 1.65x | 12.5% | 62.8% | 62.7% |
| 65.0% | - | 66.9% | 3 | 25,350,000 | 3.7 | | 7.09774% | 111 | 1.59x | 12.6% | 65.9% | 63.5% |
| Total / Weighted Average: | 52 | $683,436,933 | 100.0 | % | 6.83843% | 116 | 2.46x | 18.1% | 47.6% | 47.3% |
| LTV Ratios as of the Maturity Date(1)(3) |
| | | | | Weighted Average |
Range of
Maturity Date LTVs | Number of Loans | Cut-off Date Principal Balance | % of IPB | Mortgage Rate | Remaining Loan Term | UW
NCF DSCR(1)(2)(3) | UW
NOI
DY(1)(3) | Cut-off
Date LTV(1)(3)(4) | Maturity Date/ARD LTV(1)(3)(4)(5) |
| 0.0% | - | 49.9% | 30 | $258,750,003 | 37.9 | % | 6.55330% | 115 | 3.72x | 27.0% | 28.7% | 28.2% |
| 50.0% | - | 59.9% | 11 | 186,324,430 | 27.3 | | 6.99691% | 114 | 1.74x | 13.1% | 54.0% | 53.7% |
| 60.0% | - | 64.9% | 9 | 225,012,500 | 32.9 | | 7.01980% | 120 | 1.65x | 12.4% | 63.0% | 62.7% |
| 65.0% | - | 66.9% | 2 | 13,350,000 | 2.0 | | 7.09571% | 103 | 1.71x | 12.3% | 66.4% | 66.4% |
| Total / Weighted Average: | 52 | $683,436,933 | 100.0 | % | 6.83843% | 116 | 2.46x | 18.1% | 47.6% | 47.3% |
| | | | | Weighted Average |
| Prepayment Protection | Number of Loans | Cut-off Date Principal Balance | % of IPB | Mortgage Rate | Remaining Loan Term | UW
NCF DSCR(1)(2)(3) | UW
NOI
DY(1)(3) | Cut-off
Date LTV(1)(3)(4) | Maturity Date/ARD LTV(1)(3)(4)(5) |
| Defeasance | 15 | $319,726,930 | 46.8 | % | 6.88978% | 115 | 2.25x | 16.2% | 48.1% | 47.7% |
| Yield Maintenance | 28 | 210,600,003 | 30.8 | | 6.73393% | 116 | 3.24x | 24.7% | 38.9% | 38.3% |
| Defeasance or Yield Maintenance | 9 | 153,110,000 | 22.4 | | 6.87493% | 120 | 1.82x | 12.9% | 58.7% | 58.7% |
| Total / Weighted Average: | 52 | $683,436,933 | 100.0 | % | 6.83843% | 116 | 2.46x | 18.1% | 47.6% | 47.3% |
| | | | | Weighted Average |
| Loan Purpose | Number of Loans | Cut-off Date Principal Balance | % of IPB | Mortgage Rate | Remaining Loan Term | UW
NCF DSCR(1)(2)(3) | UW
NOI
DY(1)(3) | Cut-off
Date LTV(1)(3)(4) | Maturity Date/ARD LTV(1)(3)(4)(5) |
| Refinance | 43 | $442,526,664 | 64.8 | % | 6.77491% | 116 | 2.82x | 20.7% | 40.8% | 40.3% |
| Acquisition | 7 | 233,115,650 | 34.1 | | 6.93424% | 118 | 1.79x | 13.3% | 60.9% | 60.8% |
| Recapitalization | 2 | 7,794,619 | 1.1 | | 7.57877% | 67 | 1.92x | 15.4% | 42.0% | 41.6% |
| Total / Weighted Average: | 52 | $683,436,933 | 100.0 | % | 6.83843% | 116 | 2.46x | 18.1% | 47.6% | 47.3% |
| (1) | In the case of Loan Nos. 1, 2, 3, 5, 7, 11, 12 and 21, the UW NCF DSCR, UW NOI Debt Yield, Cut-off Date LTV and Maturity Date/ARD LTV calculations include the related Pari Passu Companion Loan(s). In the case of Loan No. 11, the UW NCF DSCR, UW NOI Debt Yield, Cut-off Date LTV and Maturity Date/ARD LTV calculations exclude the related Subordinate Companion Loans. |
| (2) | For the mortgage loans that are interest-only for the entire term or until the anticipated repayment date and accrue interest on an Actual/360 basis, the Monthly Debt Service Amount ($) was calculated as 1/12th of the product of (i) the Original Balance ($), (ii) the Interest Rate % and (iii) 365/360. |
| (3) | For mortgaged properties securing residential cooperative mortgage loans, the UW NCF DSCR and UW NOI Debt Yield for each such mortgaged property is calculated using underwritten net operating income or underwritten net cash flow, as applicable, for the related residential cooperative property which is the projected net operating income or net cash flow, as applicable, reflected in the most recent appraisal obtained by or otherwise in the possession of the related mortgage loan seller as of the Cut-off Date. The Cut-off Date LTV and Maturity Date/ARD LTV calculations are based upon the appraised value of the residential cooperative property determined as if such residential cooperative property is operated as a residential cooperative, inclusive of the amount of the underlying debt encumbering such residential cooperative property. The UW NCF DSCR, UW NOI Debt Yield, Cut-off Date LTV and Maturity Date/ARD LTV calculations do not take into account any subordinate debt (whether or not secured by the related mortgaged property) that currently exists or is allowed under the terms of any mortgage loan. |
| (4) | In the case of Loan No. 4, the Cut-off Date LTV and Maturity/ARD LTV are calculated by using an appraised value based on an “as portfolio” assumption. In the case of Loan No. 5, the Cut-off Date LTV and Maturity/ARD LTV are calculated by using an appraised value based on a “prospective as complete - proposed” assumption. In the case of Loan No. 15, the Cut-off Date LTV and Maturity/ARD LTV are calculated by using an appraised value based on a “as complete” assumption. Refer to the definition of “Appraised Value” under “Description of the Mortgage Pool—Certain Calculations and Definitions” in the Preliminary Prospectus for additional details. |
| (5) | In the case of Loan Nos. 13, 14, 26, 27 and 32, the mortgage loans are with anticipated repayment dates and presented as if they were to mature on the related anticipated repayment date. |
THE INFORMATION IN THIS STRUCTURAL AND COLLATERAL TERM SHEET IS NOT COMPLETE AND MAY BE AMENDED PRIOR TO THE TIME OF SALE. THIS TERM SHEET IS NOT AN OFFER TO SELL THESE SECURITIES AND IT IS NOT A SOLICITATION OF AN OFFER TO BUY THESE SECURITIES IN ANY JURISDICTION WHERE THE OFFER OR SALE IS NOT PERMITTED. |
| | 17 | |
| Structural and Collateral Term Sheet | | BMO 2024-C8 |
| Collateral Characteristics |
| Previous Securitization History(1) |
| No. | Mortgage Loan Seller | Loan/Property Name | Location | Property Type | Cut-off Date Principal Balance | % of IPB | Previous Securitization |
| 7 | GACC | Arundel Mills and Marketplace | Hanover, MD | Retail | $35,000,000 | 5.1% | MSBAM 2014-C15, MSBAM 2014-C16, JPMBB 2017-C19 |
| 8 | ZBNA | Monroe Street Retail | Toledo, OH | Retail | $34,500,000 | 5.0% | GSMS 2014-GC18 |
| 9 | GACC | Residence Inn Del Mar | San Diego, CA | Hospitality | $25,000,000 | 3.7% | MSBAM 2014-C17 |
| 10 | CREFI | Lincoln City Outlet Center | Lincoln City, OR | Retail | $23,162,500 | 3.4% | GSMS 2015-GC28 |
| 12 | LMF | Medlock Crossing | Duluth, GA | Retail | $19,850,000 | 2.9% | LBUBS 2005-C3 |
| 22 | BSPRT | Sunrise Shopping Center | Oxon Hill, MD | Retail | $6,000,000 | 0.9% | CGCMT 2014-GC19 |
| 23 | NCB | NB Owners Corp. | Flushing, NY | Multifamily | $5,296,732 | 0.8% | WFRBS 2014-C19 |
| 25 | BSPRT | Polly's Country Market | Chelsea, MI | Retail | $4,900,000 | 0.7% | COMM 2014-UBS3 |
| 35 | NCB | 325 East 72nd Street, Inc. | New York, NY | Multifamily | $2,844,906 | 0.4% | WFRBS 2014-C19 |
| 38 | NCB | Centrentset Corp. | New York, NY | Multifamily | $2,650,000 | 0.4% | WFRBS 2014-C20 |
| 42 | NCB | 70 N. Grove Owners Corp. a/k/a 70 North Grove St. Corp. | Freeport, NY | Multifamily | $2,000,000 | 0.3% | WFRBS 2014-C20 |
| (1) | The table above represents the properties for which the previously existing debt was previously securitized, based on information provided by the related borrower or obtained through searches of a third-party database. |
THE INFORMATION IN THIS STRUCTURAL AND COLLATERAL TERM SHEET IS NOT COMPLETE AND MAY BE AMENDED PRIOR TO THE TIME OF SALE. THIS TERM SHEET IS NOT AN OFFER TO SELL THESE SECURITIES AND IT IS NOT A SOLICITATION OF AN OFFER TO BUY THESE SECURITIES IN ANY JURISDICTION WHERE THE OFFER OR SALE IS NOT PERMITTED. |
| | 18 | |
| Structural and Collateral Term Sheet | | BMO 2024-C8 |
| Class A-2(1) |
Class A-2
No. | Loan Name | Location | Cut-off Date Balance | % of IPB | Maturity Date Balance | % of Certificate Class(2) | Original Loan Term | Remaining Loan Term | UW NCF DSCR(3)(4) | UW NOI Debt Yield(3) | Cut-off Date LTV(3) | Maturity Date/ARD LTV(3) |
| 19 | Nameoki Commons | Granite City, IL | $7,243,150 | 1.1% | $6,910,707 | 29.1% | 60 | 59 | 1.53x | 16.3% | 61.3% | 58.5% |
| 20 | Good Hotels Denver | Denver, CO | $6,500,000 | 1.0% | $6,239,878 | 26.3% | 60 | 60 | 2.12x | 21.0% | 54.2% | 52.0% |
| 21 | OPI Portfolio | Various, Various | $6,300,000 | 0.9% | $6,300,000 | 26.6% | 60 | 55 | 1.75x | 13.8% | 48.4% | 48.4% |
| 29 | Tennessee RV Park | Brownsville, TN | $3,850,000 | 0.6% | $3,850,000 | 16.2% | 60 | 60 | 1.65x | 14.5% | 65.0% | 65.0% |
| Total / Weighted Average: | | $23,893,150 | 3.5% | $23,300,586 | 98.3% | 60 | 58 | 1.77x | 16.6% | 56.6% | 55.1% |
| (1) | The table above presents the mortgage loans whose balloon payments would be applied to pay down the certificate balances of the Class A-2 Certificates, assuming a 0% CPR and applying the “Modeling Assumptions” described in the Preliminary Prospectus, including the assumptions that (i) none of the mortgage loans in the pool experience prepayments, defaults or losses; (ii) there are no extensions of maturity dates of any mortgage loans in the pool; and (iii) each mortgage loan in the pool is paid in full on its stated maturity date or anticipated repayment date. Each Class of Certificates, including the Class A-2 Certificates, evidences undivided ownership interests in the entire pool of mortgage loans. Debt service coverage ratio, debt yield and loan-to-value ratio information does not take into account subordinate debt (whether or not secured by the mortgaged property), if any, that is allowed under the terms of any mortgage loans. See Annex A to the Preliminary Prospectus. |
| (2) | Reflects the percentage equal to the Percentage of the Maturity Date Balance divided by the initial Class A-2 Certificate Balance. |
| (3) | In the case of Loan No. 21, the UW NCF DSCR, UW NOI Debt Yield, Cut-off Date LTV and Maturity Date/ARD LTV calculations include the related Pari Passu Companion Loan(s). |
| (4) | For the mortgage loans that are interest-only for the entire term or until the anticipated repayment date and accrue interest on an Actual/360 basis, the Monthly Debt Service Amount ($) was calculated as 1/12th of the product of (i) the Original Balance ($), (ii) the Interest Rate % and (iii) 365/360. |
THE INFORMATION IN THIS STRUCTURAL AND COLLATERAL TERM SHEET IS NOT COMPLETE AND MAY BE AMENDED PRIOR TO THE TIME OF SALE. THIS TERM SHEET IS NOT AN OFFER TO SELL THESE SECURITIES AND IT IS NOT A SOLICITATION OF AN OFFER TO BUY THESE SECURITIES IN ANY JURISDICTION WHERE THE OFFER OR SALE IS NOT PERMITTED. |
| | 19 | |
| Structural and Collateral Term Sheet | | BMO 2024-C8 |
| Structural Overview |
| ■ Certificates: | | The “Certificates” will consist of the Class A-1, Class A-2, Class A-4, Class A-5, Class A-SB, Class X-A, Class X-B, Class A-S, Class B, Class C, Class D-RR, Class XDRR, Class E-RR, Class XERR, Class F-RR, Class XFRR, Class G-RR, Class XGRR, Class J-RR, Class XJRR, Class S and Class R certificates. The Class A-1, Class A-2, Class A-4, Class A-5, Class A-SB, Class A-S, Class B, Class C, Class D-RR, Class E-RR, Class F-RR, Class G-RR and Class J-RR certificates are collectively referred to as the “Principal Balance Certificates”. The Class X-A, Class X-B, Class XDRR, Class XERR, Class XFRR, Class XGRR and Class XJRR certificates are collectively referred to as the “Class X Certificates”. |
| ■ Accrual: | | Each Class of Certificates (other than the Class S and Class R Certificates) will accrue interest on a 30/360 basis. The Class S and Class R Certificates will not accrue interest. |
| ■ Distributions: | | The aggregate amount available for distribution to holders of the Certificates on each distribution date will be: (i) the gross amount of interest, principal, yield maintenance charges and prepayment premiums collected with respect to the mortgage loans in the applicable one-month collection period, net of specified expenses of the issuing entity, including fees payable therefrom to, and losses, liabilities, advances (with interest thereon), costs and expenses reimbursable or indemnifiable therefrom to, the master servicer, the special servicer, the certificate administrator, the trustee, the operating advisor, the asset representations reviewer and CREFC®. On each Distribution Date, funds available for distribution to holders of the Certificates (exclusive of any portion thereof that represents (i) any yield maintenance charges and prepayment premiums collected on the mortgage loans and/or (ii) any excess interest accrued after the related anticipated repayment date on any mortgage loan with an anticipated repayment date) (“Available Funds”) will be distributed in the following amounts and order of priority (in each case to the extent of remaining available funds): 1. Class A-1, Class A-2, Class A-4, Class A-5, Class A-SB, Class X-A and Class X-B certificates: to interest on the Class A-1, Class A-2, Class A-4, Class A-5, Class A-SB, Class X-A and Class X-B certificates, up to, and pro rata in accordance with, their respective interest entitlements. 2. Class A-1, Class A-2, Class A-4, Class A-5 and Class A-SB certificates: to the extent of Available Funds allocable to principal received or advanced on the mortgage loans, (i) to principal on the Class A-SB certificates until their certificate balance is reduced to the Class A-SB scheduled principal balance set forth in Annex F to the Preliminary Prospectus for the relevant Distribution Date, then (ii) to principal on the Class A-1 certificates until their certificate balance is reduced to zero, all funds available for distribution of principal remaining after the distributions to the Class A-SB certificates in clause (i) above, then (iii) to principal on the Class A-2 certificates until their certificate balance is reduced to zero, all funds available for distribution of principal remaining after the distributions to the Class A-1 certificates in clause (ii) above, then (iv) to principal on the Class A-4 certificates until their certificate balance is reduced to zero, all funds available for distribution of principal remaining after the distributions to the Class A-2 certificates in clause (iii) above, then (v) to principal on the Class A-5 certificates until their certificate balance is reduced to zero, all funds available for distribution of principal remaining after the distributions to the Class A-4 certificates in clause (iv) above and then (vi) to principal on the Class A-SB certificates until their certificate balance is reduced to zero, all funds available for distribution of principal remaining after the distributions to the Class A-5 certificates in clause (v) above. However, if the certificate balances of each and every class of the Class A-S, Class B, Class C, Class D-RR, Class E-RR, Class F-RR, Class G-RR and Class J-RR certificates have been reduced to zero as a result of the allocation of mortgage loan losses and other unanticipated expenses to those certificates, then Available Funds allocable to principal will be distributed to the Class A-1, Class A-2, Class A-4, Class A-5 and Class A-SB certificates, pro rata, based on their respective certificate balances (and the schedule for the Class A-SB principal distributions will be disregarded). 3. Class A-1, Class A-2, Class A-4, Class A-5 and Class A-SB certificates: to reimburse the Class A-1, Class A-2, Class A-4, Class A-5 and Class A-SB certificates, pro rata, for any unreimbursed losses on the mortgage loans that were previously allocated to reduce the certificate balances of those classes, together with interest at their respective pass-through rates. 4. Class A-S certificates: (i) first, to interest on the Class A-S certificates in the amount of their interest entitlement; (ii) next, to the extent of Available Funds allocable to principal remaining after distributions in respect of principal to each class of Principal Balance Certificates with a higher principal payment priority (in this case, the Class A-1, Class A-2, Class A-4, Class A-5 and Class A-SB certificates), to principal on the Class A-S certificates until their certificate balance is reduced to zero; and (iii) next, to reimburse the Class A-S certificates for any unreimbursed losses on the mortgage loans that were previously allocated to reduce the certificate balance of that class, together with interest at its pass-through rate. |
THE INFORMATION IN THIS STRUCTURAL AND COLLATERAL TERM SHEET IS NOT COMPLETE AND MAY BE AMENDED PRIOR TO THE TIME OF SALE. THIS TERM SHEET IS NOT AN OFFER TO SELL THESE SECURITIES AND IT IS NOT A SOLICITATION OF AN OFFER TO BUY THESE SECURITIES IN ANY JURISDICTION WHERE THE OFFER OR SALE IS NOT PERMITTED. |
| | 20 | |
| Structural and Collateral Term Sheet | | BMO 2024-C8 |
| Structural Overview |
| | 5. Class B certificates: (i) first, to interest on the Class B certificates in the amount of their interest entitlement; (ii) next, to the extent of Available Funds allocable to principal remaining after distributions in respect of principal to each class of Principal Balance Certificates with a higher principal payment priority (in this case, the Class A-1, Class A-2, Class A-4, Class A-5, Class A-SB and Class A-S certificates), to principal on the Class B certificates until their certificate balance is reduced to zero; and (iii) next, to reimburse Class B certificates for any unreimbursed losses on the mortgage loans that were previously allocated to reduce the certificate balance of that class, together with interest at its pass-through rate. 6. Class C certificates: (i) first, to interest on the Class C certificates in the amount of their interest entitlement; (ii) next, to the extent of Available Funds allocable to principal remaining after distributions in respect of principal to each class of Principal Balance Certificates with a higher principal payment priority (in this case, the Class A-1, Class A-2, Class A-4, Class A-5, Class A-SB, Class A-S and Class B certificates), to principal on the Class C certificates until their certificate balance is reduced to zero; and (iii) next, to reimburse the Class C certificates for any unreimbursed losses on the mortgage loans that were previously allocated to reduce the certificate balance of that class, together with interest at its pass-through rate. 7. After the Class A-1, Class A-2, Class A-4, Class A-5, Class A-SB, Class X-A, Class X-B, Class A-S, Class B and Class C certificates are paid all amounts to which they are entitled on such Distribution Date, the remaining Available Funds will be used to pay interest to the Class D-RR and Class XDRR (pro rata based on interest entitlements), Class E-RR and Class XERR (pro rata based on interest entitlements), Class F-RR and Class XFRR (pro rata based on interest entitlements), Class G-RR and Class XGRR (pro rata based on interest entitlements) and Class J-RR and Class XJRR (pro rata based on interest entitlements) certificates, and to pay principal to, and to reimburse (with interest) any unreimbursed losses to, the Class D-RR, Class E-RR, Class F-RR, Class G-RR and Class J-RR certificates, sequentially in order, and with respect to each such class of Principal Balance Certificates, in a manner analogous to the Class C certificates pursuant to clause 6 above. |
■ Realized Losses: | | The certificate balances of the Principal Balance Certificates will each be reduced without distribution on any Distribution Date as a write-off to the extent of any loss realized on the mortgage loans allocated to the related class on such Distribution Date. On each Distribution Date, any such losses will be applied to the respective classes of Principal Balance Certificates in the following order, in each case until the related certificate balance is reduced to zero: first, to the Class J-RR certificates; second, to the Class G-RR certificates; third, to the Class F-RR certificates; fourth, to the Class E-RR certificates; fifth, to the Class D-RR certificates; sixth, to the Class C certificates; seventh, to the Class B certificates; eighth, to the Class A-S certificates; and, finally pro rata, to the Class A-1, Class A-2, Class A-4, Class A-5 and Class A-SB certificates, based on their then current respective certificate balances. The notional amount of each class of Class X Certificates will be reduced to reflect reductions in the certificate balance(s) of the class (or classes, as applicable) of Corresponding Principal Balance Certificates as a result of allocations of losses realized on the mortgage loans to such class(es) of Principal Balance Certificates. |
| | | |
THE INFORMATION IN THIS STRUCTURAL AND COLLATERAL TERM SHEET IS NOT COMPLETE AND MAY BE AMENDED PRIOR TO THE TIME OF SALE. THIS TERM SHEET IS NOT AN OFFER TO SELL THESE SECURITIES AND IT IS NOT A SOLICITATION OF AN OFFER TO BUY THESE SECURITIES IN ANY JURISDICTION WHERE THE OFFER OR SALE IS NOT PERMITTED. |
| | 21 | |
| Structural and Collateral Term Sheet | | BMO 2024-C8 |
| Structural Overview |
| ■ Prepayment Premiums and Yield Maintenance Charges: | | On each Distribution Date, until the notional amounts of the Class X-A, Class X-B, Class XDRR and Class XERR certificates and the certificate balances of the Class A-1, Class A-2, Class A-4, Class A-5, Class A-SB, Class A-S, Class B, Class C, Class D-RR and Class E-RR certificates have been reduced to zero, each yield maintenance charge collected on the mortgage loans during the related one-month collection period (or, in the case of an outside serviced mortgage loan, that accompanied a principal prepayment included in the Available Funds for such Distribution Date) is required to be distributed to holders of the Regular Certificates (excluding holders of the Class F-RR, Class XFRR, Class G-RR, Class XGRR, Class J-RR and Class XJRR certificates) as follows: (a) first such yield maintenance charge will be allocated between (i) the group (the “YM Group A”) comprised of the Class A-1, Class A-2, Class A-4, Class A-5, Class A-SB and Class X-A certificates, (ii) the group (the “YM Group A-S/B/C”) comprised of the Class A-S, Class B, Class C and Class X-B certificates, (iii) the group (the “YM Group D”) comprised of the Class D-RR and Class XDRR certificates, and (iv) the group (the “YM Group E”, and the YM Group A, the YM Group A-S/B/C, the YM Group D and the YM Group E, together, the “YM Groups”) comprised of the Class E-RR and Class XERR certificates, pro rata, based upon the aggregate amount of principal distributed to the class or classes of Principal Balance Certificates in each YM Group on such Distribution Date, and (b) then the portion of such yield maintenance charge allocated to each YM Group will be further allocated as among the classes of Regular Certificates in such YM Group, in the following manner: (i) each class of Principal Balance Certificates in such YM Group will entitle the applicable certificateholders to receive on the applicable Distribution Date that portion of such yield maintenance charge equal to the product of (X) a fraction whose numerator is the amount of principal distributed to such class of Principal Balance Certificates on such Distribution Date and whose denominator is the total amount of principal distributed to all of the Principal Balance Certificates in that YM Group on such Distribution Date, (Y) except in the case of any YM Group comprised solely of a class or classes of Principal Balance Certificates (for each of which classes the value of this clause (Y) is one (1)), the Base Interest Fraction (as defined in the Preliminary Prospectus) for the related principal prepayment and such class of Principal Balance Certificates, and (Z) the portion of such yield maintenance charge allocated to such YM Group, and (ii) the portion of such yield maintenance charge allocated to such YM Group and remaining after such distributions with respect to the Principal Balance Certificates in such YM Group will be distributed to the class of Class X Certificates (if any) in such YM Group. If there is more than one class of Principal Balance Certificates in any YM Group entitled to distributions of principal on any particular Distribution Date on which yield maintenance charges are distributable to such classes, the aggregate portion of such yield maintenance charges allocated to such YM Group will be allocated among all such classes of Principal Balance Certificates up to, and on a pro rata basis in accordance with, their respective entitlements in those yield maintenance charges in accordance with the prior sentence of this paragraph. If a prepayment premium (calculated as a percentage of the amount prepaid) is imposed in connection with a prepayment rather than a yield maintenance charge, then the prepayment premium so collected will be allocated as described above. For this purpose, the discount rate used to calculate the Base Interest Fraction will be the discount rate used to determine the yield maintenance charge for mortgage loans that require payment at the greater of a yield maintenance charge or a minimum amount equal to a fixed percentage of the principal balance of the mortgage loan. If a discount rate was not used in the calculation of the applicable yield maintenance charge or prepayment premium pursuant to the terms of the mortgage loan, the discount rate used to calculate the Base Interest Fraction will be the yield calculated by the linear interpolation of the yields, as reported in Federal Reserve Statistical Release H.15 (519)—Selected Interest Rates under the heading “U.S. government securities/Treasury constant maturities” for the week ending prior to the date of the relevant prepayment (or deemed prepayment), of U.S. Treasury constant maturities with a maturity date, one longer and one shorter, most nearly approximating the maturity date or Anticipated Repayment Date, as applicable, of that mortgage loan or REO loan, such interpolated treasury yield converted to a monthly equivalent yield. After the notional amounts of the Class X-A, Class X-B, Class XDRR and Class XERR certificates and the certificate balances of the Class A-1, Class A-2, Class A-4, Class A-5, Class A-SB, Class A-S, Class B, Class C, Class D-RR and Class E-RR certificates have been reduced to zero, all prepayment premiums and yield maintenance charges with respect to the mortgage loans will be allocated among the holders of the Class F-RR, Class G-RR and Class J-RR certificates as provided in the BMO 2024-C8 pooling and servicing agreement. No yield maintenance charges or prepayment premiums will be distributed to the holders of the Class XFRR, Class XGRR, Class XJRR, Class S and Class R certificates. For a description of prepayment premiums and yield maintenance charges required on the mortgage loans, see Annex A to the Preliminary Prospectus. See also “Certain Legal Aspects of the Mortgage Loans—Default Interest and Limitations on Prepayments” in the Preliminary Prospectus. |
| ■ Advances: | | The master servicer and, if it fails to do so, the trustee, will be obligated to make P&I advances with respect to each mortgage loan in the issuing entity and, with respect to all of the mortgage loans serviced under the BMO 2024-C8 pooling and servicing agreement, servicing advances, including |
THE INFORMATION IN THIS STRUCTURAL AND COLLATERAL TERM SHEET IS NOT COMPLETE AND MAY BE AMENDED PRIOR TO THE TIME OF SALE. THIS TERM SHEET IS NOT AN OFFER TO SELL THESE SECURITIES AND IT IS NOT A SOLICITATION OF AN OFFER TO BUY THESE SECURITIES IN ANY JURISDICTION WHERE THE OFFER OR SALE IS NOT PERMITTED. |
| | 22 | |
| Structural and Collateral Term Sheet | | BMO 2024-C8 |
| Structural Overview |
| | paying delinquent property taxes, condominium assessments, insurance premiums and ground lease rents, but only to the extent that those advances are not deemed non-recoverable from collections on the related mortgage loan and, in the case of servicing advances, any related companion loans as described below. P&I advances are subject to reduction in connection with any appraisal reductions that may occur. The special servicer will have no obligation to make any advances, provided that, in an urgent or emergency situation requiring the making of a property protection advance, the special servicer may, in its sole discretion, make a property protection advance and will be entitled to reimbursement from the master servicer for such advance. The master servicer, the special servicer and the trustee will each be entitled to receive interest on advances they make at the prime rate (and, solely in the case of the master servicer, subject to a floor of 2.0% per annum), compounded annually. |
■ Serviced Mortgage Loans/Outside Serviced Mortgage Loans: | | One or more whole loans may each constitute an “outside serviced whole loan”, in which case (as identified under “Collateral Characteristics—Pari Passu Companion Loan Summary” above), the BMO 2024-C8 pooling and servicing agreement is not the Controlling PSA, and each related mortgage loan constitutes an “outside serviced mortgage loan,” each related companion loan constitutes an “outside serviced companion loan,” and each related Controlling PSA constitutes an “outside servicing agreement.” One or more whole loans may be identified in the Preliminary Prospectus as a “servicing shift whole loan”, in which case the related mortgage loan constitutes a “servicing shift mortgage loan” and each related companion loan constitutes a “servicing shift companion loan”. Any servicing shift whole loan will initially be serviced pursuant to the BMO 2024-C8 pooling and servicing agreement during which time such mortgage loan, such whole loan and each related companion loan will be a serviced mortgage loan, a serviced whole loan and a serviced companion loan (each as defined below), respectively. However, upon the inclusion of the related controlling pari passu companion loan in a future securitization transaction, the servicing of such mortgage loan will shift to the servicing agreement governing such securitization transaction, and such mortgage loan, such whole loan and each related companion loan will be an outside serviced mortgage loan, an outside serviced whole loan and an outside serviced companion loan, respectively. All of the mortgage loans transferred to the issuing entity (other than any outside serviced mortgage loan) are sometimes referred to in this Term Sheet as the “serviced mortgage loans” and, together with any related companion loans, as the “serviced loans” (which signifies that they are being serviced by the master servicer and the special servicer under the BMO 2024-C8 pooling and servicing agreement); each related whole loan constitutes a “serviced whole loan”; and each related companion loan constitutes a “serviced companion loan.” See “Description of the Mortgage Pool—The Whole Loans” in the Preliminary Prospectus. |
| ■ Appraisal Reduction Amounts: | | An Appraisal Reduction Amount generally will be created with respect to a required appraisal loan (which is a serviced loan as to which certain defaults, modifications or insolvency events have occurred (as further described in the Preliminary Prospectus)) in the amount, if any, by which the principal balance of such required appraisal loan, plus other amounts overdue or advanced in connection with such required appraisal loan, exceeds 90% of the appraised value of the related mortgaged property (subject to certain downward adjustments permitted under the BMO 2024-C8 pooling and servicing agreement) plus certain escrows and reserves (including letters of credit) held with respect to such required appraisal loan; provided that, in the case of a residential cooperative property, such appraised value will be determined (I) except as provided in clause (II) below, assuming that the subject mortgaged property is operated as a residential cooperative with such value, in general, to equal the sum of (x) the gross share value of all cooperative units in such residential cooperative property (generally applying a discount for sponsor or investor held units that are rent regulated, rent stabilized or rent controlled units, and in certain instances, for market rate units as and if deemed appropriate by the appraiser), based in part on various comparable sales of cooperative apartment units in the market, plus, in most cases, (y) the amount of the underlying debt encumbering such residential cooperative property, and (II) if the special servicer determines, in accordance with the servicing standard, that there is no reasonable expectation that the subject mortgaged property will be operated as a residential cooperative following any work-out or liquidation of the related mortgage loan, assuming such mortgaged property is operated as a multifamily rental property); and provided further that, if so provided in the related co-lender agreement, the holder of a subordinate companion loan may be permitted to post cash or a letter of credit to offset some or all of an Appraisal Reduction Amount. In the case of an outside serviced mortgage loan, any Appraisal Reduction Amounts will be calculated pursuant to, and by a party to, the related outside servicing agreement. In general, any Appraisal Reduction Amount calculated with respect to a whole loan will be allocated first, to any related subordinate companion loan(s) (up to the outstanding principal balance(s) thereof), and then, to the related mortgage loan and any related pari passu companion loan(s) on a pro rata basis in accordance with their respective outstanding principal balances. As a result of an Appraisal Reduction Amount being calculated for and/or allocated to a given mortgage loan, the interest portion of any P&I advance for such mortgage loan will be reduced, which will have the effect of reducing the amount of interest available to the most subordinate class(es) of Certificates then outstanding (i.e., |
THE INFORMATION IN THIS STRUCTURAL AND COLLATERAL TERM SHEET IS NOT COMPLETE AND MAY BE AMENDED PRIOR TO THE TIME OF SALE. THIS TERM SHEET IS NOT AN OFFER TO SELL THESE SECURITIES AND IT IS NOT A SOLICITATION OF AN OFFER TO BUY THESE SECURITIES IN ANY JURISDICTION WHERE THE OFFER OR SALE IS NOT PERMITTED. |
| | 23 | |
| Structural and Collateral Term Sheet | | BMO 2024-C8 |
| Structural Overview |
| | first, pro rata based on interest entitlements, to the Class J-RR and Class XJRR certificates, then, pro rata based on interest entitlements, to the Class G-RR and Class XGRR certificates, then, pro rata based on interest entitlements, to the Class F-RR and Class XFRR certificates, then, pro rata based on interest entitlements, to the Class E-RR and Class XERR certificates, then, pro rata based on interest entitlements, to the Class D-RR and Class XDRR certificates, then, to the Class C certificates, then, to the Class B certificates, then to the Class A-S certificates, and then, pro rata based on interest entitlements, to the Class A-1, Class A-2, Class A-4, Class A-5, Class A-SB, Class X-A and Class X-B certificates). In general, a serviced loan will cease to be a required appraisal loan, and no longer be subject to an Appraisal Reduction Amount, when the same has ceased to be a specially serviced loan (if applicable), has been brought current for at least three consecutive months and no other circumstances exist that would cause such serviced loan to be a required appraisal loan. For various purposes under the BMO 2024-C8 pooling and servicing agreement (including, with respect to the Principal Balance Certificates, for purposes of determining the Non-Reduced Certificates and the Controlling Class, as well as the occurrence of a Control Termination Event and an Operating Advisor Consultation Trigger Event), any Appraisal Reduction Amounts in respect of or allocated to the mortgage loans will be allocated to notionally reduce the certificate balances of the Principal Balance Certificates as follows: first, to the Class J-RR, Class G-RR, Class F-RR, Class E-RR, Class D-RR, Class C, Class B and Class A-S certificates, in that order, in each case until the related certificate balance is notionally reduced to zero; and then to the Class A-1, Class A-2, Class A-4, Class A-5 and Class A-SB certificates, pro rata based on certificate balance. |
■ Cumulative Appraisal Reduction Amounts: | | A “Cumulative Appraisal Reduction Amount”, as of any date of determination, is equal to the sum of (i) all Appraisal Reduction Amounts then in effect, and (ii) with respect to any AB Modified Loans, any Collateral Deficiency Amount then in effect. “Collateral Deficiency Amount” means, with respect to any AB Modified Loan as of any date of determination, the excess of (i) the stated principal balance of such AB Modified Loan (taking into account the related junior note(s) included therein), over (ii) the sum of (in the case of a whole loan, solely to the extent allocable to the subject mortgage loan) (x) the most recent appraised value for the related mortgaged property or mortgaged properties, plus (y) solely to the extent not reflected or taken into account in such appraised value and to the extent on deposit with, or otherwise under the control of, the lender as of the date of such determination, any capital or additional collateral contributed by the related borrower at the time the mortgage loan became (and as part of the modification related to) such AB Modified Loan for the benefit of the related mortgaged property or mortgaged properties (provided, that in the case of an outside serviced mortgage loan, the amounts set forth in this clause (y) will be taken into account solely to the extent relevant information is received), plus (z) any other escrows or reserves (in addition to any amounts set forth in the immediately preceding clause (y)) held by the lender in respect of such AB Modified Loan as of the date of such determination. For purposes of determining the identity of the Controlling Class and the existence of a Control Termination Event and an Operating Advisor Consultation Trigger Event, Collateral Deficiency Amounts will be allocable to the respective classes of Control Eligible Certificates (as defined below), in reverse alphabetical order of class designation, in a manner similar to the allocation of Appraisal Reduction Amounts to such classes. “AB Modified Loan” means any corrected mortgage loan (1) that became a corrected mortgage loan (which includes for purposes of this definition any outside serviced mortgage loan that became a “corrected” mortgage loan (or any term substantially similar thereto) pursuant to the related outside servicing agreement) due to a modification thereto that resulted in the creation of an A/B note structure (or similar structure) and as to which the new junior note(s) did not previously exist or the principal amount of the new junior note(s) was previously part of either an A note held by the trust or the original unmodified mortgage loan and (2) as to which an Appraisal Reduction Amount is not in effect. |
| ■ Age of Appraisals: | | Appraisals (which can be an update of a prior appraisal) with respect to a serviced loan are required to be no older than 9 months for purposes of determining appraisal reductions (other than the annual re-appraisal), market value, and other calculations as described in the Preliminary Prospectus. |
| ■ Sale of Defaulted Loans: | | There will be no “Fair Market Value Purchase Option”. Instead, defaulted mortgage loans will be sold in a process similar to the sale process for REO property. With respect to an outside serviced whole loan, the party acting as special servicer with respect to such outside serviced whole loan pursuant to the related outside servicing agreement (the “outside special servicer”) may offer to sell to any person (or may offer to purchase) for cash such outside serviced whole loan in accordance with the terms of the related outside servicing agreement during such time as such outside serviced whole loan constitutes a defaulted mortgage loan qualifying for sale thereunder and, in connection with any such sale, the related outside special servicer is required to sell both the applicable outside serviced mortgage loan and the related outside serviced pari passu companion loan(s) and, if so provided in the related co-lender agreement or the Controlling PSA, any related subordinate companion loan(s), together as one defaulted loan. |
THE INFORMATION IN THIS STRUCTURAL AND COLLATERAL TERM SHEET IS NOT COMPLETE AND MAY BE AMENDED PRIOR TO THE TIME OF SALE. THIS TERM SHEET IS NOT AN OFFER TO SELL THESE SECURITIES AND IT IS NOT A SOLICITATION OF AN OFFER TO BUY THESE SECURITIES IN ANY JURISDICTION WHERE THE OFFER OR SALE IS NOT PERMITTED. |
| | 24 | |
| Structural and Collateral Term Sheet | | BMO 2024-C8 |
| Structural Overview |
| ■ Directing Holder: | | The “Directing Holder” with respect to any mortgage loan or whole loan serviced under the BMO 2024-C8 pooling and servicing agreement will be: ● except (i) with respect to an excluded mortgage loan, (ii) with respect to a serviced whole loan as to which the Controlling Note is held outside the issuing entity (sometimes referred to in this Term Sheet as a “serviced outside controlled whole loan”), and (iii) during any period that a Control Termination Event has occurred and is continuing, the Controlling Class Representative; and ● with respect to any serviced outside controlled whole loan (which may include a servicing shift whole loan or any other serviced whole loan with a controlling companion loan held outside the issuing entity), if and for so long as such holder is entitled under the related co-lender agreement to exercise consent rights similar to those entitled to be exercised by the Controlling Class Representative, the holder of the related Controlling Note (during any such period, the “outside controlling note holder”). The applicable directing holder (or equivalent party) with respect to any outside serviced mortgage loan will be, in general, (i) in the event the related Controlling Note is included in the subject outside securitization transaction, the controlling class representative (or equivalent entity) under the related outside servicing agreement, and (ii) in all other cases, the third party holder of the related Controlling Note or its representative (which may be a controlling class representative (or equivalent entity) under a separate securitization transaction to which such note has been transferred (if any)), as provided in the related co-lender agreement. An “excluded mortgage loan” is, if the Controlling Class Representative is the Directing Holder with respect to the subject mortgage loan, a mortgage loan or related whole loan with respect to which the Controlling Class Representative or the holder(s) of more than 50% of the Controlling Class (by certificate balance) is (or are) a Borrower Party (as defined in the Preliminary Prospectus). |
| ■ Controlling Class Representative: | | The “Controlling Class Representative” will be the controlling class certificateholder or other representative designated by at least a majority of the controlling class certificateholders by certificate balance. The “Controlling Class” is, as of any time of determination, the most subordinate class of the Control Eligible Certificates that has an outstanding certificate balance as notionally reduced by any Cumulative Appraisal Reduction Amount allocable to such class, at least equal to 25% of the initial certificate balance of that class of certificates; provided that (except under the circumstances set forth in the next proviso) if no such class meets the preceding requirement, then the Class G-RR certificates will be the controlling class; provided, further, however, that if, at any time, the aggregate outstanding certificate balance of the classes of Principal Balance Certificates senior to the Control Eligible Certificates has been reduced to zero (without regard to the allocation of any Cumulative Appraisal Reduction Amounts), then the “Controlling Class” will be the most subordinate class of Control Eligible Certificates with an outstanding certificate balance greater than zero (without regard to the allocation of any Cumulative Appraisal Reduction Amounts). The “Control Eligible Certificates” consist of the Class G-RR and Class J-RR certificates. See “The Pooling and Servicing Agreement—Directing Holder” in the Preliminary Prospectus. No other class of certificates will be eligible to act as the controlling class or appoint a Controlling Class Representative. No person may exercise any of the rights and powers of the Controlling Class Representative with respect to an excluded mortgage loan. On the Closing Date, RREF V - D AIV RR H, LLC, or its affiliate, is expected to (i) purchase the HRR certificates and also receive the Class S Certificates, and (ii) to appoint itself as the initial Controlling Class Representative. |
■ Control Termination Event: | | A “Control Termination Event” will: with respect to any mortgage loan either (a) occur when none of the classes of the Control Eligible Certificates has an outstanding certificate balance (as notionally reduced by any Cumulative Appraisal Reduction Amount then allocable to such class) that is at least equal to 25% of the initial certificate balance of that class of certificates or (b) be deemed to occur as described below; provided, however, that a Control Termination Event will in no event exist at any time that the certificate balance of each class of the Principal Balance Certificates senior to the Control Eligible Certificates (without regard to the allocation of Cumulative Appraisal Reduction Amounts) has been reduced to zero. With respect to excluded mortgage loans as to which the Controlling Class Representative would otherwise be the Directing Holder, a Control Termination Event will be deemed to exist. The holders of Certificates representing the majority of the certificate balance of the most senior class of Control Eligible Certificates whose certificate balance is notionally reduced to less than 25% of the initial certificate balance of that class as a result of an allocation of an Appraisal Reduction Amount or a Collateral Deficiency Amount, as applicable, to such class will have the right to challenge the Special Servicer’s Appraisal Reduction Amount determination or a Collateral Deficiency Amount determination, as applicable, and, at their sole expense, obtain a second |
THE INFORMATION IN THIS STRUCTURAL AND COLLATERAL TERM SHEET IS NOT COMPLETE AND MAY BE AMENDED PRIOR TO THE TIME OF SALE. THIS TERM SHEET IS NOT AN OFFER TO SELL THESE SECURITIES AND IT IS NOT A SOLICITATION OF AN OFFER TO BUY THESE SECURITIES IN ANY JURISDICTION WHERE THE OFFER OR SALE IS NOT PERMITTED. |
| | 25 | |
| Structural and Collateral Term Sheet | | BMO 2024-C8 |
| Structural Overview |
| | appraisal for any serviced loan for which an Appraisal Reduction Event has occurred or as to which there exists a Collateral Deficiency Amount, under the circumstances described in the Preliminary Prospectus. |
■ Consultation Termination Event: | | A “Consultation Termination Event” with respect to any mortgage loan, (a) when none of the classes of Control Eligible Certificates has an outstanding certificate balance, without regard to the allocation of any Cumulative Appraisal Reduction Amount, that is equal to or greater than 25% of the initial certificate balance of that class of certificates or (b) be deemed to occur as described below; provided, however, that a Consultation Termination Event will in no event exist at any time that the certificate balance of each class of the Principal Balance Certificates senior to the Control Eligible Certificates (without regard to the allocation of Cumulative Appraisal Reduction Amounts) has been reduced to zero. With respect to excluded mortgage loans as to which the Controlling Class Representative would otherwise be a Consulting Party, a Consultation Termination Event will be deemed to exist. |
■ Control/Consultation Rights: | | With respect to any Serviced Loan, the applicable Directing Holder will be entitled to have consent and/or consultation rights under the BMO 2024-C8 pooling and servicing agreement with respect to certain major decisions (including with respect to assumptions, waivers, certain loan modifications and workouts) and other matters with respect to each serviced loan. After the occurrence and during the continuance of a Control Termination Event, the consent rights of the Controlling Class Representative will terminate, and the Controlling Class Representative will retain non-binding consultation rights under the BMO 2024-C8 pooling and servicing agreement with respect to certain major decisions and other matters with respect to the serviced mortgage loans, other than (i) any excluded mortgage loan and (ii) any serviced outside controlled whole loan. After the occurrence and during the continuance of a Consultation Termination Event, all of these rights of the Controlling Class Representative with respect to the applicable serviced loans will terminate. With respect to any serviced outside controlled whole loan (including any servicing shift whole loan for so long as it is serviced under the BMO 2024-C8 pooling and servicing agreement), the holder of the related Controlling Note or its representative (which holder or representative will not be the Controlling Class Representative) will instead be entitled to exercise the above-described consent and consultation rights, to the extent provided under the related co-lender agreement. With respect to each outside serviced whole loan, the applicable outside controlling class representative or other related controlling noteholder pursuant to, and subject to the limitations set forth in, the related outside servicing agreement and the related co-lender agreement will have consent, consultation, approval and direction rights with respect to certain major decisions (including with respect to assumptions, waivers, loan modifications and workouts) regarding such outside serviced whole loan, as provided for in the related co-lender agreement and in the related outside servicing agreement. To the extent permitted under the related co-lender agreement, the Controlling Class Representative (so long as a Consultation Termination Event does not exist) may have certain consultation rights with respect to each outside serviced whole loan. See “Description of the Mortgage Pool—The Whole Loans” in the Preliminary Prospectus. |
THE INFORMATION IN THIS STRUCTURAL AND COLLATERAL TERM SHEET IS NOT COMPLETE AND MAY BE AMENDED PRIOR TO THE TIME OF SALE. THIS TERM SHEET IS NOT AN OFFER TO SELL THESE SECURITIES AND IT IS NOT A SOLICITATION OF AN OFFER TO BUY THESE SECURITIES IN ANY JURISDICTION WHERE THE OFFER OR SALE IS NOT PERMITTED. |
| | 26 | |
| Structural and Collateral Term Sheet | | BMO 2024-C8 |
| Structural Overview |
| ■ Termination of Special Servicer: | | At any time, the special servicer (but not any outside special servicer for any outside serviced whole loan) may be removed and replaced by the applicable Directing Holder, if any, with or without cause upon satisfaction of certain conditions specified in the BMO 2024-C8 pooling and servicing agreement. Except in the case of a serviced outside controlled whole loan, and solely after the occurrence and during the continuance of a Control Termination Event, the holders of at least 25% of the voting rights of the Certificates (other than the Class S certificates) (without regard to the application of any Appraisal Reduction Amounts) may request a vote to replace the special servicer (with respect to all of the serviced loans other than any serviced outside controlled whole loan). The subsequent vote may result in the termination and replacement of the special servicer if, within 180 days of the initial request for that vote, the holders of (a) at least 66-2/3% of the voting rights allocable to the Certificates of those holders that voted on the matter (provided that holders representing the applicable Certificateholder Quorum voted on the matter), or (b) more than 50% of the voting rights of each class of Certificates that are Non-Reduced Certificates vote affirmatively to so replace. “Non-Reduced Certificates” means each class of Principal Balance Certificates that has an outstanding certificate balance as may be notionally reduced by any Appraisal Reduction Amounts allocated to that class, equal to or greater than 25% of an amount equal to the initial certificate balance of that class of certificates minus all principal payments made on such class of certificates. Notwithstanding the foregoing, but subject to the discussion in the next paragraph, solely with respect to a serviced outside controlled whole loan (including any servicing shift whole loan, for so long as it is serviced pursuant to the BMO 2024-C8 pooling and servicing agreement), only the holder of the related Controlling Note or its representative may terminate the special servicer without cause (solely with respect to the related whole loan) and appoint a replacement special servicer for that whole loan. If the operating advisor determines, in its sole discretion exercised in good faith, that (1) the special servicer has failed to comply with the servicing standard and (2) a replacement of the special servicer would be in the best interest of the certificateholders (as a collective whole), the operating advisor will have the right to recommend the replacement of the special servicer with respect to the serviced loans, resulting in a solicitation of a certificateholder vote. The subsequent vote may result in the termination and replacement of the special servicer if, within 180 days of the initial request for that vote, the holders of at least a majority of the aggregate outstanding principal balance of the Certificates of those holders that voted on the matter (provided that holders representing the applicable Certificateholder Quorum vote on the matter) vote affirmatively to so replace. “Certificateholder Quorum” means a quorum that: (a) for purposes of a vote to terminate and replace the special servicer or the asset representations reviewer at the request of the holders of Certificates evidencing not less than 25% of the voting rights (without regard to the application of any Appraisal Reduction Amounts), consists of the holders of Certificates evidencing at least 50% of the voting rights (taking into account the allocation of any Appraisal Reduction Amounts to notionally reduce the certificate balances of the respective classes of Principal Balance Certificates) of all of the Certificates (other than the Class S certificates), on an aggregate basis; and (b) for purposes of a vote to terminate and replace the special servicer based on a recommendation of the operating advisor, consists of the holders of Certificates evidencing at least 20% of the aggregate of the outstanding principal balances of all Certificates, with such quorum including at least (3) holders and/or beneficial owners of Certificates that are not “affiliated” (as defined in Regulation RR) with each other. The related outside special servicer under each outside servicing agreement generally may be (or, if the applicable outside servicing agreement has not yet been executed, it is anticipated that such outside special servicer may be) replaced by the related outside controlling class representative (or an equivalent party), or the vote of the requisite holders of certificates issued, under the applicable outside servicing agreement (depending on whether or not the equivalent of a control termination event or a consultation termination event exists under that outside servicing agreement) or by any applicable other controlling noteholder under the related co-lender agreement in a manner generally similar to the manner in which the special servicer may be replaced under the BMO 2024-C8 pooling and servicing agreement as described above in this “Termination of Special Servicer” section (although there will be differences, in particular as regards certificateholder votes and the timing of when an outside special servicer may be terminated based on the recommendation of an operating advisor). If the special servicer, to its knowledge, becomes a Borrower Party with respect to a mortgage loan, the special servicer will not be permitted to act as special servicer with respect to that mortgage loan. Subject to certain limitations described in the Preliminary Prospectus, any applicable Directing Holder will be entitled to appoint a replacement special servicer for that mortgage loan. If there is no applicable Directing Holder or if the applicable Directing Holder does not take action to appoint a |
THE INFORMATION IN THIS STRUCTURAL AND COLLATERAL TERM SHEET IS NOT COMPLETE AND MAY BE AMENDED PRIOR TO THE TIME OF SALE. THIS TERM SHEET IS NOT AN OFFER TO SELL THESE SECURITIES AND IT IS NOT A SOLICITATION OF AN OFFER TO BUY THESE SECURITIES IN ANY JURISDICTION WHERE THE OFFER OR SALE IS NOT PERMITTED. |
| | 27 | |
| Structural and Collateral Term Sheet | | BMO 2024-C8 |
| Structural Overview |
| | | replacement special servicer within the requisite time period, a replacement special servicer will be appointed in the manner specified in the BMO 2024-C8 pooling and servicing agreement. |
| ■ Voting Rights: | | At all times during the term of the BMO 2024-C8 pooling and servicing agreement, the voting rights for the Certificates (the “voting rights”) will be allocated among the respective classes of certificateholders in the following percentages: (1) 1% in the aggregate in the case of the respective classes of the Class X Certificates, allocated pro rata based upon their respective notional amounts as of the date of determination (for so long as the notional amount of at least one class of the Class X Certificates is greater than zero), and (2) in the case of any class of Principal Balance Certificates, a percentage equal to the product of 99% (or, if the notional amounts of all classes of the Class X Certificates have been reduced to zero, 100%) and a fraction, the numerator of which is equal to the certificate balance of such class of Principal Balance Certificates as of the date of determination, and the denominator of which is equal to the aggregate of the certificate balances of all classes of the Principal Balance Certificates, in each case, as of the date of determination, provided, that in certain circumstances described under “The Pooling and Servicing Agreement” in the Preliminary Prospectus, voting rights will only be exercisable by holders of Certificates that are Non-Reduced Certificates and/or may otherwise be exercisable or allocated in a manner that takes into account the allocation of Appraisal Reduction Amounts. The voting rights of any class of certificates are required to be allocated among certificateholders of such class in proportion to their respective percentage interests. The Class S and Class R certificates will not be entitled to any voting rights. |
| ■ Servicing Compensation: | | Modification Fees: Certain fees resulting from modifications, amendments, waivers or other changes to the terms of the loan documents, as more fully described in the Preliminary Prospectus, will be used to offset expenses on the related serviced mortgage loan (i.e. reimburse the trust for certain expenses, including unreimbursed advances and interest on unreimbursed advances previously incurred (other than special servicing fees, workout fees and liquidation fees) on the related serviced mortgage loan but not yet reimbursed to the trust or servicers or to pay expenses (other than special servicing fees, workout fees and liquidation fees) that are still outstanding in each case unless as part of the written modification the related borrower is required to pay these amounts on a going forward basis or in the future). Any excess modification fees not so applied to offset expenses will be available as compensation to the master servicer and/or special servicer. Within any prior 12-month period, all such excess modification fees earned by the master servicer or by the special servicer (after taking into account the offset described below applied during such 12-month period) with respect to any serviced mortgage loan will be subject to a cap equal to the greater of (i) 1% of the outstanding principal balance of such mortgage loan after giving effect to such transaction and (ii) $25,000. All excess modification fees earned by the special servicer will be required to offset any future workout fees or liquidation fees payable with respect to the related serviced mortgage loan or related REO property; provided, that if the serviced mortgage loan ceases being a corrected loan, and is subject to a subsequent modification, any excess modification fees earned by the special servicer prior to such serviced mortgage loan ceasing to be a corrected loan will no longer be offset against future liquidation fees and workout fees unless such serviced mortgage loan ceased to be a corrected loan within 18 months of it becoming a modified mortgage loan. Penalty Fees: All late fees and default interest will first be used to reimburse certain expenses previously incurred with respect to the related mortgage loan (including special servicing fees, workout fees and liquidation fees) but not yet reimbursed to the trust, the master servicer or the special servicer or to pay certain expenses (including special servicing fees, workout fees and liquidation fees) that are still outstanding on the related mortgage loan, and any excess received with respect to a serviced loan will be paid to the master servicer (for penalty fees accrued while a non-specially serviced loan) and the special servicer (for penalty fees accrued while a specially serviced loan). To the extent any amounts reimbursed out of penalty charges are subsequently recovered on a related serviced loan, they will be paid to the master servicer or special servicer who would have been entitled to the related penalty charges that were previously used to reimburse such expense. Liquidation / Workout Fees: Liquidation fees will be calculated at the lesser of (a) 1.0% or (b) with respect to any serviced mortgage loan (or related serviced whole loan, if applicable) or related REO Property, such lesser rate as would result in a liquidation fee of $1,000,000, for each serviced loan that is a specially serviced loan and any REO property, subject in any case to a minimum liquidation fee of $25,000. For any serviced loan that is a corrected loan, workout fees will be calculated at the |
THE INFORMATION IN THIS STRUCTURAL AND COLLATERAL TERM SHEET IS NOT COMPLETE AND MAY BE AMENDED PRIOR TO THE TIME OF SALE. THIS TERM SHEET IS NOT AN OFFER TO SELL THESE SECURITIES AND IT IS NOT A SOLICITATION OF AN OFFER TO BUY THESE SECURITIES IN ANY JURISDICTION WHERE THE OFFER OR SALE IS NOT PERMITTED. |
| | 28 | |
| Structural and Collateral Term Sheet | | BMO 2024-C8 |
| Structural Overview |
| | | lesser of (a) 1.0% and (b) such lower rate as would result in a workout fee of $1,000,000 when applied to each expected payment of principal and interest (other than (i) default interest and (ii) any “excess interest” accrued after the related anticipated repayment date on any mortgage loan with an anticipated repayment date) on the related serviced loan (or related serviced whole loan, if applicable) from the date such serviced loan becomes a corrected loan through and including the then related maturity date, subject in any case to a minimum workout fee of $25,000. Notwithstanding the foregoing, in connection with a maturity default, no liquidation or workout fee will be payable in connection with a payoff or refinancing of the related serviced loan within 90 days of the maturity default, but the special servicer may collect and retain appropriate fees from the related borrower in connection with the subject liquidation or workout. In the case of an outside serviced whole loan, calculation of the foregoing amounts payable to the related outside servicer or outside special servicer may be different than as described above. For example, the extent to which modification fees and penalty fees are applied to offset expenses may be different and liquidation fees and workout fees may be subject to different caps or no caps. |
| ■ Operating Advisor: | | The operating advisor will, in general and under certain circumstances described in the Preliminary Prospectus, have the following rights and responsibilities with respect to the serviced mortgage loans: ● reviewing the actions of the special servicer with respect to specially serviced loans and with respect to certain major decisions regarding non-specially serviced loans as to which the operating advisor has consultation rights; ● reviewing reports provided by the special servicer to the extent set forth in the BMO 2024-C8 pooling and servicing agreement; ● reviewing for accuracy certain calculations made by the special servicer; ● issuing an annual report generally setting forth, among other things, its assessment of whether the special servicer is performing its duties in compliance with the servicing standard and the BMO 2024-C8 pooling and servicing agreement and identifying any material deviations therefrom; ● recommending the replacement of the special servicer if the operating advisor determines, in its sole discretion exercised in good faith, that (1) the special servicer has failed to comply with the servicing standard and (2) a replacement of the special servicer would be in the best interest of the certificateholders (as a collective whole); and ● after the occurrence and during the continuance of an Operating Advisor Consultation Trigger Event, consulting on a non-binding basis with the special servicer with respect to certain major decisions (and such other matters as are set forth in the BMO 2024-C8 pooling and servicing agreement) in respect of the applicable serviced mortgage loan(s) and/or related companion loan(s). An “Operating Advisor Consultation Trigger Event” will occur when the aggregate outstanding certificate balance of the HRR Certificates (as notionally reduced by any Cumulative Appraisal Reduction Amounts then allocable to the HRR Certificates) is 25% or less of the initial aggregate certificate balance of the HRR Certificates. With respect to excluded mortgage loans, an Operating Advisor Consultation Trigger Event will be deemed to exist. Notwithstanding the foregoing, the operating advisor will generally have no obligations or consultation rights as operating advisor under the BMO 2024-C8 pooling and servicing agreement with respect to any outside serviced mortgage loan or any related REO property. The operating advisor will be subject to termination and replacement if the holders of at least 15% of the voting rights of Non-Reduced Certificates vote to terminate and replace the operating advisor and such termination and replacement is affirmatively voted for by the holders of more than 50% of the voting rights allocable to the Non-Reduced Certificates of those holders that exercise their right to vote (provided that holders entitled to exercise at least 50% of the voting rights allocable to the Non-Reduced Certificates exercise their right to vote within 180 days of the initial request for a vote). The holders initiating such vote will be responsible for the fees and expenses in connection with the vote and replacement. See “The Pooling and Servicing Agreement—Operating Advisor” in the Preliminary Prospectus. |
| ■ Asset Representations Reviewer: | | The asset representations reviewer will be required to review certain delinquent mortgage loans after a specified delinquency threshold has been exceeded and the required percentage of certificateholders vote to direct a review of such delinquent mortgage loans. An asset review will |
THE INFORMATION IN THIS STRUCTURAL AND COLLATERAL TERM SHEET IS NOT COMPLETE AND MAY BE AMENDED PRIOR TO THE TIME OF SALE. THIS TERM SHEET IS NOT AN OFFER TO SELL THESE SECURITIES AND IT IS NOT A SOLICITATION OF AN OFFER TO BUY THESE SECURITIES IN ANY JURISDICTION WHERE THE OFFER OR SALE IS NOT PERMITTED. |
| | 29 | |
| Structural and Collateral Term Sheet | | BMO 2024-C8 |
| Structural Overview |
| | occur when either (1) mortgage loans with an aggregate outstanding principal balance of 30.0% or more of the aggregate outstanding principal balance of all of the mortgage loans (including any REO mortgage loans) held by the issuing entity as of the end of the applicable collection period are at least 60 days delinquent in respect of their related monthly payments or balloon payment, if any (for purposes of this paragraph, “delinquent loans”) or (2) at least 15 mortgage loans are delinquent loans as of the end of the applicable collection period and the aggregate outstanding principal balance of such delinquent loans constitutes at least 20% of the aggregate outstanding principal balance of all of the mortgage loans (including any REO mortgage loans) held by the issuing entity as of the end of the applicable collection period. The asset representations reviewer may be terminated and replaced without cause. Upon (i) the written direction of certificateholders evidencing not less than 25% of the voting rights requesting a vote to terminate and replace the asset representations reviewer with a proposed successor asset representations reviewer that is an eligible asset representations reviewer, and (ii) payment by such holders to the certificate administrator of the reasonable fees and expenses to be incurred by the certificate administrator in connection with administering such vote, the certificate administrator will promptly provide notice of such request to all certificateholders and the asset representations reviewer by posting such notice on its internet website, and by mailing such notice to all certificateholders and the asset representations reviewer. Upon the affirmative vote of certificateholders evidencing at least 75% of the voting rights allocable to those holders that exercise their right to vote (provided that holders representing the applicable Certificateholder Quorum exercise their right to vote within 180 days of the initial request for a vote), the trustee will be required to terminate all of the rights and obligations of the asset representations reviewer under the BMO 2024-C8 pooling and servicing agreement by written notice to the asset representations reviewer, and the proposed successor asset representations reviewer will be appointed. See “The Pooling and Servicing Agreement—The Asset Representations Reviewer” in the Preliminary Prospectus. |
| ■ Dispute Resolution Provisions: | | The mortgage loan sellers will be subject to the dispute resolution provisions set forth in the BMO 2024-C8 pooling and servicing agreement to the extent those provisions are triggered with respect to any mortgage loan sold to the depositor by a mortgage loan seller and such mortgage loan seller will be obligated under the related mortgage loan purchase agreement to comply with all applicable provisions and to take part in any mediation or arbitration proceedings that may result. Generally, in the event that a Repurchase Request (as defined in the Preliminary Prospectus) with respect to a mortgage loan is not “Resolved” (as defined below) within 180 days after the related mortgage loan seller receives such Repurchase Request, then the enforcing servicer will be required to send a notice to the “Initial Requesting Certificateholder” (if any) indicating the enforcing servicer’s intended course of action with respect to the Repurchase Request. If (a) the enforcing servicer’s intended course of action with respect to the Repurchase Request does not involve pursuing further action to exercise rights against the applicable mortgage loan seller with respect to the Repurchase Request and the Initial Requesting Certificateholder, if any, or any other certificateholder or certificate owner of Certificates wishes to exercise its right to refer the matter to mediation (including nonbinding arbitration) or arbitration, or (b) the enforcing servicer’s intended course of action is to pursue further action to exercise rights against the related mortgage loan seller with respect to the Repurchase Request but the Initial Requesting Certificateholder, if any, or any other certificateholder or certificate owner of Certificates does not agree with the dispute resolution method selected by the enforcing servicer, then the Initial Requesting Certificateholder, if any, or such other certificateholder or certificate owner may deliver a written notice to the enforcing servicer indicating its intent to exercise its right to refer the matter to either mediation or arbitration. In addition, any other certificateholder or certificate owner of Certificates may deliver, within the time frame provided in the BMO 2024-C8 pooling and servicing agreement, a written notice requesting the right to participate in any dispute resolution consultation that is conducted by the enforcing servicer following the enforcing servicer’s receipt of the notice described in the preceding sentence. “Resolved” means, with respect to a Repurchase Request, (i) that any material breach of representations and warranties or a material document defect has been cured, (ii) the related mortgage loan has been repurchased in accordance with the related mortgage loan purchase agreement, (iii) a mortgage loan has been substituted for the related mortgage loan in accordance with the related mortgage loan purchase agreement, (iv) the applicable mortgage loan seller has made a “loss of value payment”, (v) a contractually binding agreement has been entered into between the enforcing servicer, on behalf of the issuing entity, and the related mortgage loan seller that settles the related mortgage loan seller’s obligations under the related mortgage loan purchase agreement, or (vi) the related mortgage loan is no longer property of the issuing entity as a result of a sale or other disposition in accordance with the BMO 2024-C8 pooling and servicing agreement. See “The Pooling and Servicing Agreement—Dispute Resolution Provisions” in the Preliminary Prospectus. |
| ■ Liquidated Loan Waterfall: | | Upon liquidation of any mortgage loan, all net liquidation proceeds related to the mortgage loan (but not any related companion loan) will be applied (after allocation to offset certain advances and |
THE INFORMATION IN THIS STRUCTURAL AND COLLATERAL TERM SHEET IS NOT COMPLETE AND MAY BE AMENDED PRIOR TO THE TIME OF SALE. THIS TERM SHEET IS NOT AN OFFER TO SELL THESE SECURITIES AND IT IS NOT A SOLICITATION OF AN OFFER TO BUY THESE SECURITIES IN ANY JURISDICTION WHERE THE OFFER OR SALE IS NOT PERMITTED. |
| | 30 | |
| Structural and Collateral Term Sheet | | BMO 2024-C8 |
| Structural Overview |
| | expenses) so that amounts allocated as a recovery of accrued and unpaid interest will not, in the first instance, include any delinquent interest that was not advanced as a result of Appraisal Reduction Amounts or interest that accrued on any junior note(s) if such mortgage loan is an AB Modified Loan. After the adjusted interest amount is so allocated, any remaining liquidation proceeds will be allocated to pay principal on the mortgage loan until the unpaid principal amount of the mortgage loan has been reduced to zero. Any remaining liquidation proceeds will then be allocated to pay delinquent interest that was not advanced as a result of Appraisal Reduction Amounts and any interest that accrued on any junior note(s) if such mortgage loan is an AB Modified Loan. |
| ■ Credit Risk Retention: | | This securitization transaction will be subject to the credit risk retention rules of Section 15G of the Securities Exchange Act of 1934, as amended. An economic interest in the credit risk of the mortgage loans in this transaction is expected to be retained pursuant to risk retention regulations (as codified at 12 CFR Part 244) promulgated under Section 15G (“Regulation RR”), as an “eligible horizontal residual interest” in the form of the HRR Certificates. Bank of Montreal will act as retaining sponsor under Regulation RR for this securitization transaction and is expected, on the Closing Date, to satisfy its risk retention obligation through the purchase by a third party purchaser of the HRR Certificates. For a further discussion of the manner in which the credit risk retention requirements are expected to be satisfied by Bank of Montreal, as retaining sponsor for this securitization transaction, see “Credit Risk Retention” in the Preliminary Prospectus. |
| ■ Investor Communications: | | The certificate administrator is required to include on any Form 10–D any request received from a certificateholder to communicate with other certificateholders related to certificateholders exercising their rights under the terms of the BMO 2024-C8 pooling and servicing agreement. Any certificateholder wishing to communicate with other certificateholders regarding the exercise of its rights under the terms of the BMO 2024-C8 pooling and servicing agreement will be able to deliver a written request signed by an authorized representative of the requesting investor to the certificate administrator. |
| ■ Deal Website: | | The certificate administrator will maintain a deal website including, but not limited to: ● all special notices delivered. ● summaries of final asset status reports. ● all appraisals in connection with an appraisal reduction plus any subsequent appraisal updates. ● an “Investor Q&A Forum” and a voluntary investor registry. |
| ■ Cleanup Call: | | On any Distribution Date on which the aggregate unpaid principal balance of the mortgage loans (including mortgage loans as to which the related mortgaged properties have become REO properties) remaining in the issuing entity is less than 1% of the aggregate principal balance of the pool of mortgage loans as of the Cut-off Date (excluding for the purposes of this calculation, the unpaid principal balance of any mortgage loan that is an ARD Loan, but in such case only if the option described above is exercised after the Distribution Date related to the collection period in which the corresponding anticipated repayment date occurs), certain specified persons will have the option to purchase all of the remaining mortgage loans (and all property acquired through exercise of remedies in respect of any mortgage loan) at the price specified in the Preliminary Prospectus. Exercise of the option will terminate the issuing entity and retire the then outstanding certificates. If the aggregate certificate balances of the Class A-1, Class A-2, Class A-4, Class A-5, Class A-SB, Class A-S, Class B, Class C, Class D-RR and Class E-RR certificates and the notional amounts of the Class X-A, Class X-B, Class XDRR and Class XERR certificates have been reduced to zero and if the master servicer has received from the remaining certificateholders the payment specified in the BMO 2024-C8 pooling and servicing agreement, the issuing entity could also be terminated in connection with an exchange of all the then-outstanding certificates (excluding the Class S and Class R certificates) for the mortgage loans remaining in the issuing entity, as further described under “The Pooling and Servicing Agreement—Optional Termination; Optional Mortgage Loan Purchase” in the Preliminary Prospectus. |
The Offered Certificates involve certain risks and may not be suitable for all investors. For information regarding certain risks associated with an investment in the Offered Certificates, see “Summary of Risk Factors” and “Risk Factors” in the Preliminary Prospectus. Capitalized terms used but not otherwise defined in this Term Sheet have the respective meanings assigned to those terms in the Preliminary Prospectus.
THE INFORMATION IN THIS STRUCTURAL AND COLLATERAL TERM SHEET IS NOT COMPLETE AND MAY BE AMENDED PRIOR TO THE TIME OF SALE. THIS TERM SHEET IS NOT AN OFFER TO SELL THESE SECURITIES AND IT IS NOT A SOLICITATION OF AN OFFER TO BUY THESE SECURITIES IN ANY JURISDICTION WHERE THE OFFER OR SALE IS NOT PERMITTED. |
| | 31 | |
| Structural and Collateral Term Sheet | | BMO 2024-C8 |
| No. 1 – Danbury Fair Mall |

THE INFORMATION IN THIS STRUCTURAL AND COLLATERAL TERM SHEET IS NOT COMPLETE AND MAY BE AMENDED PRIOR TO THE TIME OF SALE. THIS TERM SHEET IS NOT AN OFFER TO SELL THESE SECURITIES AND IT IS NOT A SOLICITATION OF AN OFFER TO BUY THESE SECURITIES IN ANY JURISDICTION WHERE THE OFFER OR SALE IS NOT PERMITTED. |
| | 32 | |
| Structural and Collateral Term Sheet | | BMO 2024-C8 |
| No. 1 – Danbury Fair Mall |
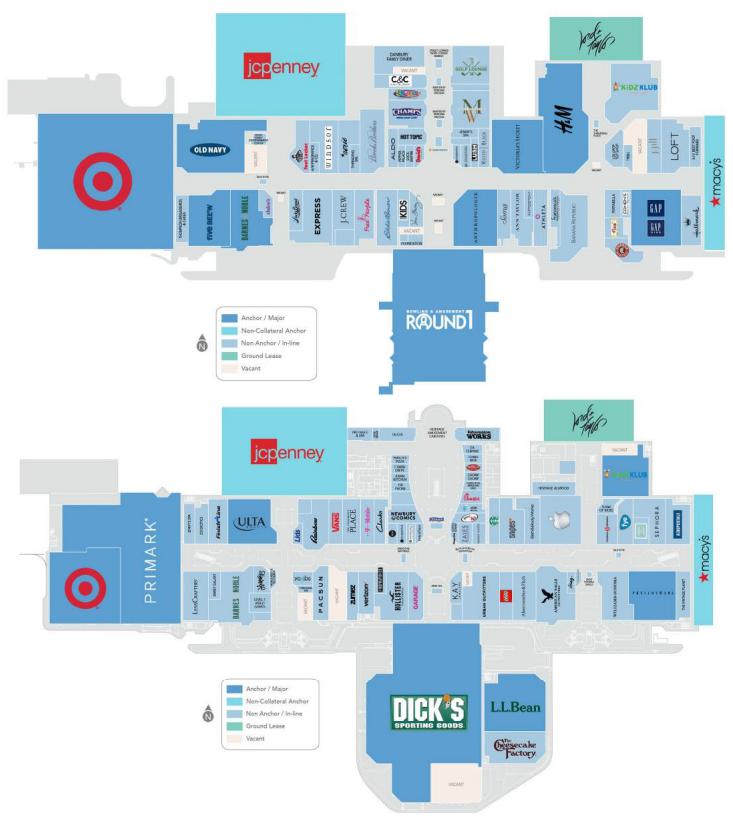
THE INFORMATION IN THIS STRUCTURAL AND COLLATERAL TERM SHEET IS NOT COMPLETE AND MAY BE AMENDED PRIOR TO THE TIME OF SALE. THIS TERM SHEET IS NOT AN OFFER TO SELL THESE SECURITIES AND IT IS NOT A SOLICITATION OF AN OFFER TO BUY THESE SECURITIES IN ANY JURISDICTION WHERE THE OFFER OR SALE IS NOT PERMITTED. |
| | 33 | |
| Structural and Collateral Term Sheet | | BMO 2024-C8 |
| No. 1 – Danbury Fair Mall |

THE INFORMATION IN THIS STRUCTURAL AND COLLATERAL TERM SHEET IS NOT COMPLETE AND MAY BE AMENDED PRIOR TO THE TIME OF SALE. THIS TERM SHEET IS NOT AN OFFER TO SELL THESE SECURITIES AND IT IS NOT A SOLICITATION OF AN OFFER TO BUY THESE SECURITIES IN ANY JURISDICTION WHERE THE OFFER OR SALE IS NOT PERMITTED. |
| | 34 | |
| Structural and Collateral Term Sheet | | BMO 2024-C8 |
| No. 1 – Danbury Fair Mall |
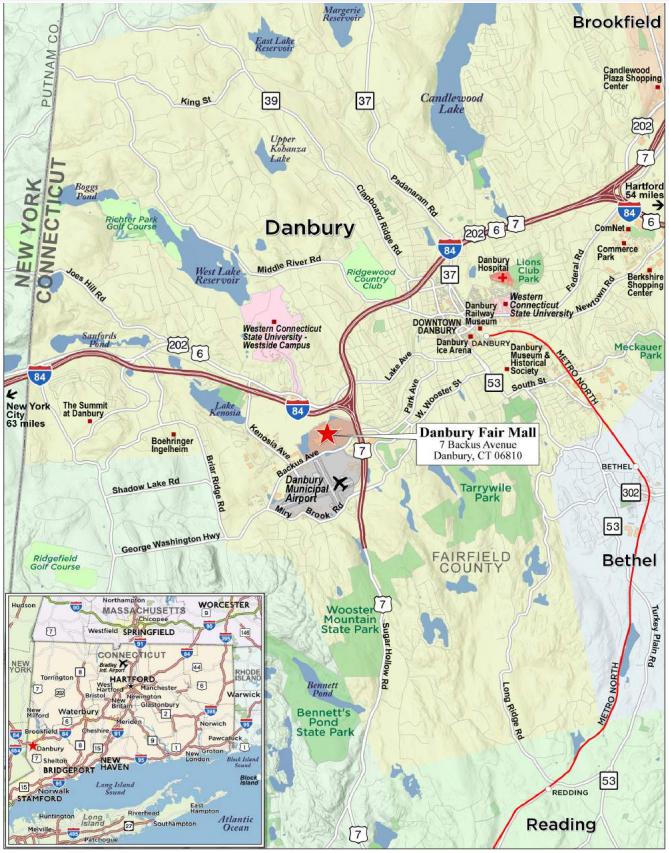
THE INFORMATION IN THIS STRUCTURAL AND COLLATERAL TERM SHEET IS NOT COMPLETE AND MAY BE AMENDED PRIOR TO THE TIME OF SALE. THIS TERM SHEET IS NOT AN OFFER TO SELL THESE SECURITIES AND IT IS NOT A SOLICITATION OF AN OFFER TO BUY THESE SECURITIES IN ANY JURISDICTION WHERE THE OFFER OR SALE IS NOT PERMITTED. |
| | 35 | |
| Structural and Collateral Term Sheet | | BMO 2024-C8 |
| No. 1 – Danbury Fair Mall |
| Mortgage Loan Information | | Property Information |
| Mortgage Loan Sellers: | GSMC, BMO | | Single Asset / Portfolio: | Single Asset |
| Original Principal Balance(1): | $68,000,000 | | Title: | Fee |
| Cut-off Date Principal Balance(1): | $68,000,000 | | Property Type – Subtype: | Retail – Super Regional Mall |
| % of IPB: | 9.9% | | Net Rentable Area (SF): | 923,598 |
| Loan Purpose: | Refinance | | Location: | Danbury, CT |
| Borrowers: | Danbury Mall, LLC and MS Danbury LLC | | Year Built / Renovated: | 1986 / 2007, 2017 |
| Borrower Sponsor: | The Macerich Partnership, L.P. | | Occupancy(3): | 97.1% |
| Interest Rate: | 6.38600% | | Occupancy Date: | 1/4/2024 |
| Note Date: | 1/25/2024 | | 4th Most Recent NOI (As of): | $24,148,737 (12/31/2020) |
| Maturity Date: | 2/6/2034 | | 3rd Most Recent NOI (As of): | $22,240,718 (12/31/2021) |
| Interest-only Period: | 96 months | | 2nd Most Recent NOI (As of): | $26,390,480 (12/31/2022) |
| Original Term: | 120 months | | Most Recent NOI (As of): | $30,411,426 (TTM 9/30/2023) |
| Original Amortization Term: | 360 months | | UW Economic Occupancy: | 94.5% |
| Amortization Type: | Interest Only, Amortizing Balloon | | UW Revenues: | $43,953,322 |
| Call Protection(2): | L(25),YM1(88),O(7) | | UW Expenses: | $13,946,497 |
| Lockbox / Cash Management: | Soft / Springing | | UW NOI: | $30,006,825 |
| Additional Debt(1): | Yes | | UW NCF: | $29,271,323 |
| Additional Debt Balance(1): | $87,000,000 | | Appraised Value / Per SF: | $371,000,000 / $402 |
| Additional Debt Type(1): | Pari Passu | | Appraisal Date: | 12/18/2023 |
| | | | | |
| Escrows and Reserves(4) | | Financial Information(1) |
| | Initial | Monthly | Initial Cap | | Cut-off Date Loan / SF: | $168 | |
| Taxes: | $0 | Springing | N/A | | Maturity Date Loan / SF: | $164 | |
| Insurance: | $0 | Springing | N/A | | Cut-off Date LTV: | 41.8% | |
| Replacement Reserves: | $0 | Springing | N/A | | Maturity Date LTV: | 40.9% | |
| TI / LC: | $0 | Springing | N/A | | UW NCF DSCR: | 2.52x | |
| Other(5): | $4,103,258 | $0 | N/A | | UW NOI Debt Yield: | 19.4% | |
| | | | | | | | |
| | | | | | | |
| Sources and Uses |
| Sources | Proceeds | % of Total | | Uses | Proceeds | % of Total |
| Whole Loan(1) | $155,000,000 | 100.0% | | Loan Payoff | $116,946,803 | 75.4 | % |
| | | | | Equity Distribution | 30,706,123 | 19.8 | |
| | | | | Reserves | 4,103,258 | 2.6 | |
| | | | | Closing Costs(6) | 3,243,816 | 2.1 | |
| Total Sources | $155,000,000 | 100.0% | | Total Uses | $155,000,000 | 100.0 | % |
| (1) | The Danbury Fair Mall Mortgage Loan (as defined below) is part of the Danbury Fair Mall Whole Loan (as defined below), which is evidenced by six pari passu promissory notes with an aggregate principal balance of $155,000,000. The Financial Information presented above is based on the aggregate principal balance of the promissory notes comprising the Danbury Fair Mall Whole Loan. |
| (2) | The Danbury Fair Mall Whole Loan may be voluntarily prepaid in whole (but not in part, other than in connection with the release of the L&T Parcel (as defined below) pursuant to the Mortgage Loan documents) at any time from and after the earlier to occur of (i) February 6, 2027 and (ii) the date that is two years from the closing date of the securitization that includes the last pari passu note of the Danbury Fair Mall Whole Loan to be securitized, with the payment of a yield maintenance premium if such prepayment is made prior to August 6, 2033. From and after August 6, 2033, the Danbury Fair Mall Whole Loan may be voluntarily prepaid in whole without the payment of a yield maintenance premium. The assumed lockout period of 25 payments is based on the expected BMO 2024-C8 securitization closing date in March 2024. The actual lockout period may be longer. |
| (3) | Occupancy includes all tenants in place, specialty leasing tenants of greater than six months, and tenants with signed leases as of the reporting period. Occupancy excludes gross leasable area for anchor tenants. |
| (4) | See “Escrows and Reserves” below for further discussion of reserve information. |
| (5) | Other Reserves include an outstanding TI/LC reserve of $3,460,293 and a gap and rent reserve of $642,965.09 which represents the sum of (i) the pro-rated rent for tenants with lease commencement dates after the note date, and (ii) the differential in current and contractual rent for tenants whose co-tenancy clauses will be cured by incoming leases with Target who is expected to open and commence paying rent on April 14, 2024 and Round 1 Entertainment who opened and commenced paying rent on March 9, 2024. |
| (6) | Closing Costs includes an interest rate buy-down fee of approximately $1,550,000. |
THE INFORMATION IN THIS STRUCTURAL AND COLLATERAL TERM SHEET IS NOT COMPLETE AND MAY BE AMENDED PRIOR TO THE TIME OF SALE. THIS TERM SHEET IS NOT AN OFFER TO SELL THESE SECURITIES AND IT IS NOT A SOLICITATION OF AN OFFER TO BUY THESE SECURITIES IN ANY JURISDICTION WHERE THE OFFER OR SALE IS NOT PERMITTED. |
| | 36 | |
| Structural and Collateral Term Sheet | | BMO 2024-C8 |
| No. 1 – Danbury Fair Mall |
The Loan. The largest mortgage loan (the “Danbury Fair Mall Mortgage Loan”) is part of a whole loan (the “Danbury Fair Mall Whole Loan”) evidenced by six pari passu promissory notes issued by Danbury Mall, LLC and MS Danbury LLC in the aggregate original principal amount of $155,000,000. The Danbury Fair Mall Mortgage Loan is evidenced by the controlling Note A-1 and non-controlling note A-2, which have an aggregate outstanding principal balance as of the Cut-off Date of $68,000,000. The Danbury Fair Mall Mortgage Loan will be included in the BMO 2024-C8 securitization trust and represents approximately 9.9% of the Initial Pool Balance. The Danbury Fair Mall Whole Loan was co-originated on January 25, 2024 by Goldman Sachs Bank USA (“GSBI”), Morgan Stanley Bank, N.A. (“MSBNA”) and Bank of Montreal (“BMO”). The Danbury Fair Mall Whole Loan is secured by the borrowers’ fee simple interest in an approximately 1.27 million square foot enclosed super regional mall located in Danbury, Connecticut, of which 923,598 square feet serves as collateral (the “Danbury Fair Mall Property”) for the Danbury Fair Mall Whole Loan and does not include any portion of the regional mall that is occupied by Macy’s and JCPenney (which own their own parcels). The Danbury Fair Mall Whole Loan has a 10-year term, with an interest-only period accruing interest at a rate of 6.38600% per annum on an Actual/360 basis, followed by amortization on a 30-year basis.
The table below identifies the promissory notes that comprise the Danbury Fair Mall Whole Loan. The Danbury Fair Mall Whole Loan will be serviced pursuant to the pooling and servicing agreement for the BMO 2024-C8 trust securitization. The relationship between the holders of the Danbury Fair Mall Whole Loan is governed by a co-lender agreement as described under “Description of the Mortgage Pool—The Whole Loans—The Serviced Pari Passu Whole Loans” and “The Pooling and Servicing Agreement” in the Preliminary Prospectus.
| Whole Loan Summary |
| Note | Original Balance | Cut-off Date Balance | Note Holder | Controlling Piece |
| A-1 | $46,750,000 | $46,750,000 | BMO 2024-C8 | Yes |
| A-2 | $21,250,000 | $21,250,000 | BMO 2024-C8 | No |
| A-3 | $31,000,000 | $31,000,000 | MSBNA(1) | No |
| A-4 | $38,500,000 | $38,500,000 | GSMC(1) | No |
| A-5 | $9,250,000 | $9,250,000 | BMO(1) | No |
| A-6 | $8,250,000 | $8,250,000 | BMO(1) | No |
| Whole Loan | $155,000,000 | $155,000,000 | | |
| (1) | Expected to be contributed to one or more future securitization trusts. |
The Property. The Danbury Fair Mall Property is part of a two-story, Class B+ super regional mall located in Danbury, Connecticut. The Danbury Fair Mall Property consists of 923,598 owned square feet within a super regional mall of 1,274,784 square feet, which is anchored by a 218,213 square foot Macy’s (non-collateral), a 132,973 square foot JCPenney (non-collateral), a 73,080 square foot DICK’S Sporting Goods and a 51,489 square foot Primark. The Borrower Sponsor (as defined below) recently executed leases with Round 1 Entertainment and Target to occupy anchor/major space at the Danbury Fair Mall Property beginning in March 2024 and April 2024, respectively. The Danbury Fair Mall Property is a shopping and dining destination located off the intersection of Interstate 84 and Route 7 in Danbury, Connecticut. The Danbury Fair Mall Property was originally constructed in 1986 and expanded in 1991 with the addition of the Lord & Taylor box (improvements owned by the tenant). The Danbury Fair Mall Property was acquired by the Borrower Sponsor in 2005. Following the Borrower Sponsor’s acquisition, the Danbury Fair Mall Property underwent a $24.8 million renovation in 2007. The Borrower Sponsor completed a second large scale renovation in 2011 following its acquisition of the former Filene’s parcel in 2010. The $38.0 million redevelopment included a reconfiguration of the 170,000 square feet Filene’s box into a DICK’S Sporting Goods on the main level, Forever 21 on the lower level, plus the addition of L.L. Bean, Cheesecake Factory and the former Brio Tuscan Grille. Today, the Danbury Fair Mall Property leases to a mix of retailers and offers a multitude of dining options. The Danbury Fair Mall Property’s granular rent roll includes over 150 tenants with no non-anchor/major tenants accounting for more than 1.05% of collateral SF and 2.78% of Total Underwritten Rent. The Danbury Fair Mall Property is 97.1% leased as of January 4, 2024, which represents an improvement since the pandemic-driven occupancy trough of 90.1% in 2021. Comparable in-line tenant sales at the Danbury Fair Mall Property were $747 PSF in Q3 2023, up 13.6% over pre-COVID 2019 sales of $658 PSF, equating to an occupancy cost of 11.7%. Comparable ex-Apple in-line sales over the same period were $564 PSF, up 11.0% over pre-COVID 2019 sales of $508 PSF, equating to an occupancy cost of 14.7%.
THE INFORMATION IN THIS STRUCTURAL AND COLLATERAL TERM SHEET IS NOT COMPLETE AND MAY BE AMENDED PRIOR TO THE TIME OF SALE. THIS TERM SHEET IS NOT AN OFFER TO SELL THESE SECURITIES AND IT IS NOT A SOLICITATION OF AN OFFER TO BUY THESE SECURITIES IN ANY JURISDICTION WHERE THE OFFER OR SALE IS NOT PERMITTED. |
| | 37 | |
| Structural and Collateral Term Sheet | | BMO 2024-C8 |
| No. 1 – Danbury Fair Mall |
The Danbury Fair Mall Property contains a dark 79,872 square foot anchor box (the “L&T Parcel”) that is owned by Hudson Bay Company and subleased to Lord & Taylor. Lord & Taylor and was operational before its parent company closed all locations. The tenant has kept current on its rent obligations. In August 2022, the Borrower Sponsor was able to secure a lease with National Resources who plans to invest over $25.0 million into the L&T Parcel to redevelop the existing two-level location into a multi family project featuring micro-housing and medical office uses. The borrowers have successfully rezoned the Danbury Fair Mall Property to allow for multi family development and have obtained the necessary entitlements for this conversion from the City of Danbury. The borrowers expect the project to generate approximately $400,000 in incremental rent revenue annually over Lord & Taylor’s current lease, subject to recapturing the space from Lord & Taylor. The L&T Parcel can be released at any time with the prepayment of the Danbury Fair Mall Whole Loan in the amount equal to the greater of (x) $2,000,000 and (y) 45% of the proceeds of the sale of the L&T Parcel, subject to satisfaction of certain conditions set forth in the Danbury Fair Mall Mortgage Loan documents.
Major Tenants. The three largest tenants based on underwritten base rent are DICK’S Sporting Goods, Target and Round 1 Entertainment.
DICK’S Sporting Goods (73,080 square feet, 7.9% of net rentable area (“NRA”), 6.6% of underwritten base rent): DICK’S Sporting Goods is a sports apparel and equipment retailer with 728 locations as of January 28, 2023 that was founded in 1948 in Binghamton, New York. DICK’S Sporting Goods occupies 73,080 square feet on a lease that expires January 31, 2031 with three, five-year renewal options and no termination options. DICK’S Sporting Goods currently pays $25.00 per SF with a scheduled rent increase in lease year 6.
Target (126,615 square feet, 13.7% of NRA, 4.9% of underwritten base rent): Founded in 1962, Target is a general merchandise retailer with stores in all 50 states and the District of Columbia, totaling 1,956 domestic locations, as of February 2024. In 2022, Target generated approximately $109 billion in total revenue. Target will occupy 126,615 SF and is expected to open and commence paying rent on April 14, 2024 on a lease that expires January 31, 2034 with eight, five-year renewal options and no termination options. Target is expected to pay $10.67 per SF with a scheduled rent increase on May 1, 2029.
Round 1 Entertainment (60,848 square feet, 6.6% of NRA, 4.5% of underwritten base rent): Round 1 Entertainment is a multi-entertainment facility that includes bowling, arcade games, karaoke, billiards, darts and ping pong, and operates under the Round 1 Entertainment Inc. parent entity, which was established in 2009 and currently has more than 50 locations that are open or plan to open across the United States as of February 2024. Round 1 Entertainment occupies 60,848 square feet on a lease that commenced on March 9, 2024 and expires February 28, 2034 with two, five-year renewal options and no termination options. Round 1 Entertainment currently pays $20.75 per SF with a scheduled rent increase in lease year 6.
Appraisal. According to the appraisal, the Danbury Fair Mall Property had an “as-is” appraised value of $371,000,000 as of December 18, 2023. The table below shows the appraisal’s “as-is” conclusions.
| Appraisal Valuation Summary(1) |
| Appraisal Approach | Appraised Value | Capitalization Rate |
| Income Capitalization Approach | $371,000,000 | 7.75% |
Environmental. The Phase I environmental assessment of the Danbury Fair Mall Property dated December 21, 2023 identified no recognized environmental conditions, controlled environmental conditions or significant data gaps. See “Description of the Mortgage Pool—Environmental Considerations” in the Prospectus.
THE INFORMATION IN THIS STRUCTURAL AND COLLATERAL TERM SHEET IS NOT COMPLETE AND MAY BE AMENDED PRIOR TO THE TIME OF SALE. THIS TERM SHEET IS NOT AN OFFER TO SELL THESE SECURITIES AND IT IS NOT A SOLICITATION OF AN OFFER TO BUY THESE SECURITIES IN ANY JURISDICTION WHERE THE OFFER OR SALE IS NOT PERMITTED. |
| | 38 | |
| Structural and Collateral Term Sheet | | BMO 2024-C8 |
| No. 1 – Danbury Fair Mall |
The following table presents certain information relating to the historical occupancy of the Danbury Fair Mall Property:
| Historical and Current Occupancy(1) |
| 2021 | 2022 | 9/30/2023 | Current(2)(3) |
| 90.1% | 98.1% | 99.3% | 97.1% |
| (1) | Historical Occupancies are as of December 31 of each respective year, unless otherwise specified. |
| (2) | Based on the underwritten rent roll dated January 4, 2024. |
| (3) | Occupancy includes all tenants in place, specialty leasing tenants of greater than six months, and tenants with signed leases as of the reporting period. Occupancy excludes gross leasable area for anchor tenants |
The following table presents certain information relating to the major tenants (of which, certain tenants have co-tenancy provisions) at the Danbury Fair Mall Property:
| Top Tenant Summary(1) |
| Tenant Name | Credit Rating (Moody's/ S&P/Fitch)(2) | Net Rentable Area (SF) | % of Total NRA | UW Base Rent PSF(3) | UW Base Rent (3) | % of Total UW Base Rent | Lease Exp. Date |
| DICK'S Sporting Goods | Baa3/BBB/NR | 73,080 | 7.9 | % | $25.00 | $1,827,000 | 6.6 | % | 1/31/2031 |
| Target(4) | A2/A/A | 126,615 | 13.7 | | $10.67 | 1,350,417 | 4.9 | | 1/31/2034 |
| Round 1 Entertainment(5) | NR/NR/NR | 60,848 | 6.6 | | $20.75 | 1,262,529 | 4.5 | | 2/28/2034 |
| Primark | NR/NR/NR | 51,489 | 5.6 | | $21.77 | 1,120,676 | 4.0 | | 8/31/2026 |
| Apple Store | Aaa/AA+/NR | 9,675 | 1.0 | | $79.64 | 770,536 | 2.8 | | 7/31/2027 |
| Victoria's Secret(6) | B1/BB-/NR | 12,133 | 1.3 | | $62.43 | 757,471 | 2.7 | | 3/31/2024 |
| Banana Republic | B1/BB/NR | 8,427 | 0.9 | | $75.35 | 634,998 | 2.3 | | 3/31/2025 |
| Old Navy | B1/BB/NR | 16,640 | 1.8 | | $34.00 | 565,760 | 2.0 | | 3/31/2027 |
| H&M | NR/BBB/NR | 21,563 | 2.3 | | $26.24 | 565,757 | 2.0 | | 1/31/2028 |
| Barnes & Noble | NR/NR/NR | 19,092 | 2.1 | | $28.00 | 534,576 | 1.9 | | 1/31/2034 |
| Ten Largest Owned Tenants | | 399,562 | 43.3 | % | $23.50 | $9,389,721 | 33.8 | % | |
| Remaining Owned Tenants(7)(8) | | 497,550 | 53.9 | | $36.91 | 18,365,234 | 66.2 | | |
| Occupied Total Collateral | | 897,112 | 97.1 | % | $30.94 | $27,754,954 | 100.0 | % | |
| Vacant Space (Owned) | | 26,486 | 2.9 | | | | | |
| Totals/ Wtd. Avg. All Owned Tenants | | 923,598 | 100.0 | % | | | | |
| (1) | Based on the underwritten rent roll dated January 4, 2024. |
| (2) | Certain ratings are those of the parent company whether or not the parent guarantees the lease. |
| (3) | UW Base Rent PSF and UW Base Rent includes percentage in-lieu of rents totaling $653,695. |
| (4) | Target is expected to open and commence paying rent on April 14, 2024 and is obligated to begin paying rent once the tenant opens for business. We cannot assure you that the tenant will take occupancy, or begin paying rent, on the lease commencement date or at all. |
| (5) | Round 1 Entertainment opened and commenced paying rent on March 9, 2024. |
| (6) | Victoria’s Secret is currently in negotiation with the Borrower Sponsor to renew its lease. We cannot assure you that the tenant will renew its lease. |
| (7) | Remaining Owned Tenants includes various tenants with lease start dates after the loan origination date, that total 17,007 SF and $721,949 of UW Base Rent. |
| (8) | Remaining Owned Tenants includes $359,999 of UW Base Rent from the L&T Parcel. |
THE INFORMATION IN THIS STRUCTURAL AND COLLATERAL TERM SHEET IS NOT COMPLETE AND MAY BE AMENDED PRIOR TO THE TIME OF SALE. THIS TERM SHEET IS NOT AN OFFER TO SELL THESE SECURITIES AND IT IS NOT A SOLICITATION OF AN OFFER TO BUY THESE SECURITIES IN ANY JURISDICTION WHERE THE OFFER OR SALE IS NOT PERMITTED. |
| | 39 | |
| Structural and Collateral Term Sheet | | BMO 2024-C8 |
| No. 1 – Danbury Fair Mall |
The following table presents certain information relating to the lease rollover schedule at the Danbury Fair Mall Property:
| Lease Rollover Schedule(1)(2) |
| Year | Number of Leases Expiring | Net Rentable Area Expiring | % of NRA Expiring | UW Base Rent Expiring(3) | % of UW Base Rent Expiring(3) | Cumulative Net Rentable Area Expiring | Cumulative % of NRA Expiring | Cumulative UW Base Rent Expiring(3) | Cumulative % of UW Base Rent Expiring(3) |
| Vacant | NAP | 26,486 | 2.9 | % | NAP | NA | P | 26,486 | 2.9% | NAP | NAP |
| 2024 & MTM | 89 | 120,663 | 13.1 | | $3,885,175 | 14.0 | % | 147,149 | 16.0% | $3,885,175 | 14.0% |
| 2025 | 26 | 92,003 | 10.0 | | 4,068,700 | 14.7 | | 239,152 | 25.9% | $7,953,874 | 28.7% |
| 2026 | 18 | 87,861 | 9.5 | | 3,188,885 | 11.5 | | 327,013 | 35.4% | $11,142,759 | 40.1% |
| 2027 | 25 | 85,272 | 9.2 | | 4,517,226 | 16.3 | | 412,285 | 44.6% | $15,659,985 | 56.4% |
| 2028 | 9 | 52,097 | 5.6 | | 2,102,536 | 7.6 | | 464,382 | 50.3% | $17,762,521 | 64.0% |
| 2029 | 8 | 22,480 | 2.4 | | 1,310,678 | 4.7 | | 486,862 | 52.7% | $19,073,199 | 68.7% |
| 2030 | 7 | 26,886 | 2.9 | | 1,377,160 | 5.0 | | 513,748 | 55.6% | $20,450,359 | 73.7% |
| 2031 | 4 | 82,944 | 9.0 | | 2,251,483 | 8.1 | | 596,692 | 64.6% | $22,701,841 | 81.8% |
| 2032 | 3 | 13,029 | 1.4 | | 497,926 | 1.8 | | 609,721 | 66.0% | $23,199,767 | 83.6% |
| 2033 | 5 | 23,268 | 2.5 | | 708,784 | 2.6 | | 632,989 | 68.5% | $23,908,551 | 86.1% |
| 2034 | 4 | 207,376 | 22.5 | | 3,240,541 | 11.7 | | 840,365 | 91.0% | $27,149,092 | 97.8% |
| 2035 & Beyond | 2 | 83,233 | 9.0 | | 605,863 | 2.2 | | 923,598 | 100.0% | $27,754,954 | 100.0% |
| Total | 200 | 923,598 | 100.0 | % | $27,754,954 | 100.0 | % | | | | |
| (1) | Information is based on the underwritten rent roll dated January 4, 2024. |
| (2) | Certain tenants may have lease termination options that are exercisable prior to the stated expiration date of the subject lease or leases which are not considered in the Lease Rollover Schedule. |
| (3) | UW Base Rent Expiring, % of UW Base Rent Expiring, Cumulative UW Base Rent Expiring and Cumulative % of UW Base Rent Expiring includes percentage in-lieu of rents totaling $653,695. |
The following table presents certain information relating to the underwritten cash flows of the Danbury Fair Mall Property:
| Operating History and Underwritten Net Cash Flow |
| | 2020 | 2021 | 2022 | TTM September 2023 | Underwritten | Per Square Foot(1) | % | |
| Base Rent(2)(3) | $25,189,660 | $22,919,907 | $22,862,520 | $23,737,683 | $27,101,259 | $29.34 | 58.3 | % |
| Gross Up Vacancy | 0 | 0 | 0 | 0 | 1,764,389 | 1.91 | 3.8 | |
| Other Commercial Rental Revenue(4) | 2,505,763 | 4,662,477 | 5,242,739 | 5,354,726 | 5,111,552 | 5.53 | 11.0 | |
| Commercial Reimbursement Revenue | 14,157,025 | 11,138,371 | 9,961,216 | 11,696,366 | 11,898,954 | 12.88 | 25.6 | |
| Credit Tenant Rent Steps | 0 | 0 | 0 | 0 | 79,821 | 0.09 | 0.2 | |
| Miscellaneous Revenue | 633,477 | 305,542 | 659,728 | 638,512 | 549,969 | 0.60 | 1.2 | |
| Gross Potential Rent | $42,485,925 | $39,026,297 | $38,726,203 | $41,427,286 | $46,505,943 | $50.35 | 100.0 | % |
| Commercial Credit Loss | (3,590,947) | (865,112) | (54,641) | (61,365) | (2,552,621) | (2.76) | (5.5 | ) |
| Effective Gross Income | $38,894,978 | $38,161,185 | $38,671,562 | $41,365,921 | $43,953,322 | $47.59 | 94.5 | % |
| Real Estate Taxes | 8,160,081 | 8,178,060 | 3,560,760 | 2,338,238 | 5,313,240 | 5.75 | 12.1 | |
| Insurance | 290,848 | 342,559 | 377,870 | 397,892 | 500,460 | 0.54 | 1.1 | |
| Other Expenses | 6,295,312 | 7,399,848 | 8,342,452 | 8,218,365 | 8,132,797 | 8.81 | 18.5 | |
| Net Operating Income | $24,148,737 | $22,240,718 | $26,390,480 | $30,411,426 | $30,006,825 | $32.49 | 68.3 | % |
| Total TI/LC, Capex/RR | 0 | 0 | 0 | 0 | 735,502 | 0.80 | 1.7 | |
| Net Cash Flow | $24,148,737 | $22,240,718 | $26,390,480 | $30,411,426 | $29,271,323 | $31.69 | 66.6 | % |
| (1) | Per Square Foot is based on the total collateral square feet of 923,598. |
| (2) | Base Rent reflects annualized in-place base rent for in-place tenants and recently executed leases as of January 2024, with contractual rent steps through March 2025. Rental revenues have been adjusted to be exclusive of deferred straight-line minimum rent and termination income. |
| (3) | The difference between Underwritten Base Rent and previous historical Base Rent figures is primarily attributable to $2,612,946 of rent from both Target and Round 1 Entertainment, who are expected to take occupancy after the origination date. |
| (4) | Other Commercial Rental Revenue includes Overage / Percentage Rent, PIL Rent, Kiosks, Temporary, Specialty tenants and Business Development Income. |
THE INFORMATION IN THIS STRUCTURAL AND COLLATERAL TERM SHEET IS NOT COMPLETE AND MAY BE AMENDED PRIOR TO THE TIME OF SALE. THIS TERM SHEET IS NOT AN OFFER TO SELL THESE SECURITIES AND IT IS NOT A SOLICITATION OF AN OFFER TO BUY THESE SECURITIES IN ANY JURISDICTION WHERE THE OFFER OR SALE IS NOT PERMITTED. |
| | 40 | |
| Structural and Collateral Term Sheet | | BMO 2024-C8 |
| No. 1 – Danbury Fair Mall |
The Market. The Danbury Fair Mall Property is located within the Danbury area of the Bridgeport-Stamford-Norwalk MSA. The Danbury Fair Mall Property’s surrounding area is categorized as suburban consisting primarily of single-family homes and retail centers, and the Danbury Fair Mall Property is considered the largest demand generator within the City of Danbury. The Danbury Fair Mall Property benefits from proximity to Manhattan which is located approximately 60 miles away and access to the Westchester County Airport, situated approximately 35 miles from the mall. In 2022, the Bridgeport-Stamford-Norwalk MSA gross metro product was $70.6 billion, a 3.3% increase from 2021. Within the immediate trade area comprised of the 1.0-mile region surrounding the Danbury Fair Mall Property, the 2023 average annual household income is approximately $132,337, relative to the 2023 statewide household income of approximately $129,040.
The following table presents retail market statistics for the surrounding area of the Danbury Fair Mall Property:
| Retail Market Statistics (TTM Q4 2023)(1) |
| Market/Submarket | Inventory (SF) | Completions (SF) | Vacancy | Net Absorption (SF) | NNN Rent Overall / SF |
| Stamford Retail | 53,184,660 | 171,383 | 4.00% | -245,986 | $32.75 |
| Danbury Retail | 6,955,057 | 45,000 | 4.00% | -106,171 | $22.32 |
| 1-Mile Radius Retail | 2,134,351 | 0 | 7.70% | -122,019 | $28.90 |
The Borrowers and Borrower Sponsor. The borrowers are Danbury Mall, LLC and MS Danbury LLC, each a single purpose entity with two independent directors. Legal counsel to the borrowers delivered a non-consolidation opinion in connection with the origination of the Danbury Fair Mall Whole Loan. The borrower sponsor (the “Borrower Sponsor”) and non-recourse carveout guarantor is The Macerich Partnership, L.P., a Delaware limited partnership headquartered in Santa Monica, California and a provider of real estate investment services. The Macerich Partnership, L.P. acquires, leases, manages, develops, and redevelops malls and community centers.
Property Management. The Danbury Fair Mall Property is managed by MACW Property Management, LLC, an affiliate of the Borrower Sponsor.
Escrows and Reserves. At origination, the borrowers were required to deposit into escrow (i) approximately $642,965 for a gap rent reserve and (ii) $3,460,293 for a TI/LC reserve (comprised of unpaid tenant allowances ($2,748,013), unpaid leasing commissions ($562,280) and landlord work ($150,000)).
Tax Escrows - During the continuance of a Trigger Period (as defined below), the borrowers are required to escrow 1/12th of the annual estimated tax payments on a monthly basis.
Insurance Escrows – During the continuance of a Trigger Period, the borrowers are required to escrow 1/12th of the annual estimated insurance payments on a monthly basis, except if the Danbury Fair Mall Property is insured under a blanket policy meeting the requirements set forth in the related loan agreement (in which case, no insurance escrows will be required, notwithstanding the occurrence of a Trigger Period).
Capital Expenditure Reserve - During the continuance of a Trigger Period, the borrowers are required to escrow an amount equal to the gross leasable area (excluding the Non-Collateral Square Footage (as defined below)) of any tenant that is required to pay for all repairs and maintenance costs for its entire leased premises, roof and structural components, and the following tenants: (i) Lord & Taylor, (ii) Shake Shack and (iii) Longhorn Steakhouse), multiplied by $0.25 and divided by 12 months. The monthly replacement reserve amount is estimated to be approximately $17,390. The borrowers are permitted to cease monthly deposits when the replacement reserve balance is equal to the sum of 24 monthly deposits, currently estimated to be $417,353. The tenants listed in clause (i) through (iii) above collectively represent 9.6% of the NRA and 2.6% of UW Base Rent.
Rollover Reserve – During the continuance of a Trigger Period, the borrowers are required to escrow an amount equal to the gross leasable area (excluding the Non-Collateral Square Footage and, to the extent not causing or contributing to the cause of the applicable Trigger Period, Lord & Taylor (and/or Live Uno), Target, Round 1 Entertainment, DICK’S Sporting Goods, Shake Shack and Longhorn Steakhouse) multiplied by $1.00 and divided by 12 months. The monthly rollover reserve amount is estimated to be approximately $47,847. The borrowers are not required to make any monthly deposits when the rollover reserve balance is equal to the sum of 24 monthly deposits, currently estimated to be $1,148,324. The borrowers’ upfront deposit of $642,965.09 with respect to gap rent is not included in the calculation of the rollover reserve balance for purposes of calculating the rollover reserve cap.
THE INFORMATION IN THIS STRUCTURAL AND COLLATERAL TERM SHEET IS NOT COMPLETE AND MAY BE AMENDED PRIOR TO THE TIME OF SALE. THIS TERM SHEET IS NOT AN OFFER TO SELL THESE SECURITIES AND IT IS NOT A SOLICITATION OF AN OFFER TO BUY THESE SECURITIES IN ANY JURISDICTION WHERE THE OFFER OR SALE IS NOT PERMITTED. |
| | 41 | |
| Structural and Collateral Term Sheet | | BMO 2024-C8 |
| No. 1 – Danbury Fair Mall |
“Non-Collateral Square Footage” means the square footage occupied by Macy’s and JCPenney.
Lockbox / Cash Management. The Danbury Fair Mall Whole Loan is structured with a soft lockbox and springing cash management. The borrowers and property manager are required to direct the tenants to pay rent directly into the lockbox account, and to deposit any rents otherwise received in such account within three business days after receipt. So long as no Trigger Period is continuing, borrowers will have access to the funds deposited into the lockbox account, and may utilize the lockbox account as its operating account. During the continuance of a Trigger Period, all funds in the lockbox account are required to be swept on a weekly basis and on the second business day before each payment date to a lender-controlled cash management account. Funds in the cash management account are required to be applied to debt service and the reserves and escrows described above, with any excess funds (i) to be deposited into the TI/LC Reserve, if the Trigger Period is caused by a Tenant Trigger Event, or into an excess cash flow reserve account held by the lender as cash collateral for the Danbury Fair Mall Whole Loan, or if (ii) no Trigger Period is continuing, disbursed to the borrowers.
A “Trigger Period” means the period commencing upon the occurrence of (i) an event of default or (ii) a Low Debt Yield Period (as defined below). A Trigger Period will end (a) with respect to the matters described in clause (i) above, if the event of default has been waived by the lender and no other event of default is then continuing or (b) with respect to the matters described in clause (ii) above, if a cure of the Low Debt Yield Period occurs.
A “Low Debt Yield Period” will commence if, as of any calculation date, the Danbury Fair Mall Whole Loan debt yield is less than (x) 12.5% for the period commencing on the origination date to and excluding the eighth anniversary of the origination date, and end if the Danbury Fair Mall Whole Loan has achieved a debt yield of at least 12.5% for two consecutive calculation dates (45th day following the end of each calendar quarter during the term), and (y) 15.0% for the period commencing on the eighth anniversary of the origination date until the maturity date, and end if the Danbury Fair Mall Whole Loan has achieved a debt yield of at least 15.0% for two consecutive calculation dates.
Subordinate Debt. None. However, the borrowers are permitted to obtain property assessed clean energy (PACE) or similar loans in an aggregate amount up to $7.5 million without the consent of the lender.
Mezzanine Debt. None.
Partial Release. The borrowers may obtain the release of one or more non-income producing parcels without the payment of a release price (except with respect to the L&T Parcel), subject to satisfaction of certain conditions including, but not limited to, (i) no event of default has occurred and is continuing, (ii) regardless of whether such release is successfully consummated, the borrowers pay to the lender a processing fee in the amount of $15,000, (iii) the remaining property constitutes a separate tax lot (or the borrowers have filed an application for a separate tax lot and the Borrower Sponsor guarantees the payment of taxes on such release parcel pending the final issuance of such separate tax lot), (iv) the borrowers certify to the lender that the remaining property with all easements appurtenant and other permitted encumbrances thereto will not, strictly as a result of such transfer, be in violation of any reciprocal easement agreements or major leases, or any then applicable law, statute, rule or regulation and (v) satisfaction of any REMIC release conditions. The borrowers may obtain release of the L&T Parcel with the payment of a release price equal to the greater of $2,000,000 and 45% of the proceeds of the sale of the L&T Parcel (after deduction for reasonable and customary out-of-pocket costs of sale) and a yield maintenance premium if released prior to the open period.
Ground Lease. None.
THE INFORMATION IN THIS STRUCTURAL AND COLLATERAL TERM SHEET IS NOT COMPLETE AND MAY BE AMENDED PRIOR TO THE TIME OF SALE. THIS TERM SHEET IS NOT AN OFFER TO SELL THESE SECURITIES AND IT IS NOT A SOLICITATION OF AN OFFER TO BUY THESE SECURITIES IN ANY JURISDICTION WHERE THE OFFER OR SALE IS NOT PERMITTED. |
| | 42 | |
| Structural and Collateral Term Sheet | | BMO 2024-C8 |
| No. 2 – 60 Hudson |
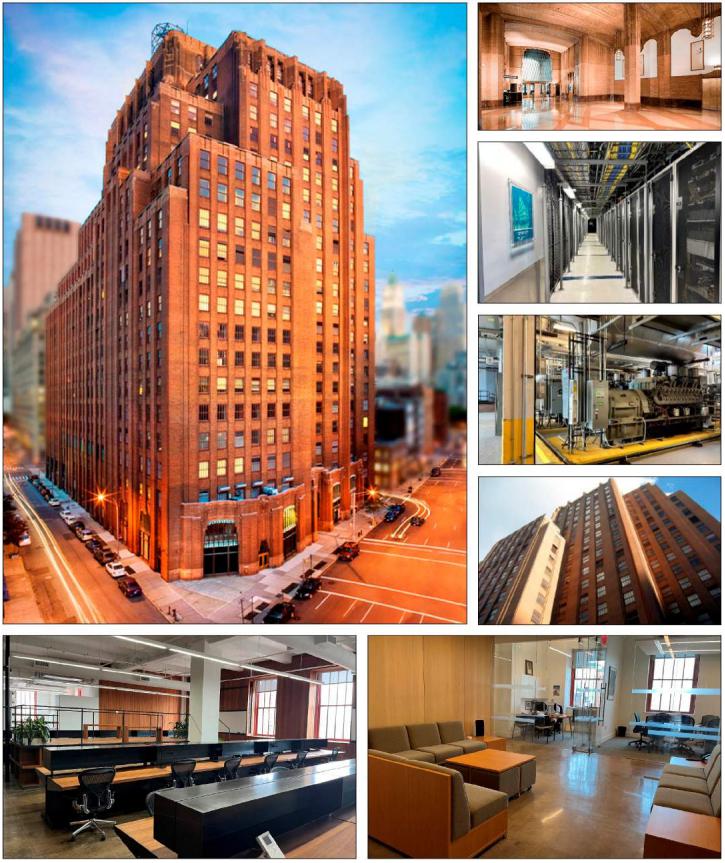
THE INFORMATION IN THIS STRUCTURAL AND COLLATERAL TERM SHEET IS NOT COMPLETE AND MAY BE AMENDED PRIOR TO THE TIME OF SALE. THIS TERM SHEET IS NOT AN OFFER TO SELL THESE SECURITIES AND IT IS NOT A SOLICITATION OF AN OFFER TO BUY THESE SECURITIES IN ANY JURISDICTION WHERE THE OFFER OR SALE IS NOT PERMITTED. |
| | 43 | |
| Structural and Collateral Term Sheet | | BMO 2024-C8 |
| No. 2 – 60 Hudson |
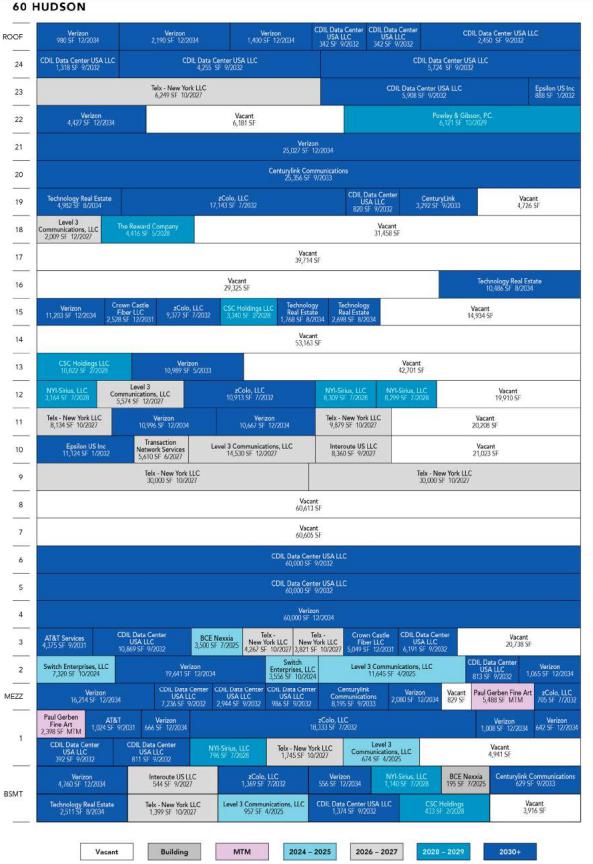
THE INFORMATION IN THIS STRUCTURAL AND COLLATERAL TERM SHEET IS NOT COMPLETE AND MAY BE AMENDED PRIOR TO THE TIME OF SALE. THIS TERM SHEET IS NOT AN OFFER TO SELL THESE SECURITIES AND IT IS NOT A SOLICITATION OF AN OFFER TO BUY THESE SECURITIES IN ANY JURISDICTION WHERE THE OFFER OR SALE IS NOT PERMITTED. |
| | 44 | |
| Structural and Collateral Term Sheet | | BMO 2024-C8 |
| No. 2 – 60 Hudson |

THE INFORMATION IN THIS STRUCTURAL AND COLLATERAL TERM SHEET IS NOT COMPLETE AND MAY BE AMENDED PRIOR TO THE TIME OF SALE. THIS TERM SHEET IS NOT AN OFFER TO SELL THESE SECURITIES AND IT IS NOT A SOLICITATION OF AN OFFER TO BUY THESE SECURITIES IN ANY JURISDICTION WHERE THE OFFER OR SALE IS NOT PERMITTED. |
| | 45 | |
| Structural and Collateral Term Sheet | | BMO 2024-C8 |
| No. 2 – 60 Hudson |
| Mortgage Loan Information | | Property Information |
| Mortgage Loan Seller: | MSMCH, BMO | | Single Asset / Portfolio: | Single Asset |
| Original Principal Balance(1): | $65,000,000 | | Title: | Fee |
| Cut-off Date Principal Balance(1): | $65,000,000 | | Property Type - Subtype: | Other – Data Center |
| % of IPB: | 9.5% | | Net Rentable Area (SF): | 1,149,619 |
| Loan Purpose: | Refinance | | Location: | New York, NY |
| Borrower: | 60 Hudson Owner, LLC | | Year Built / Renovated: | 1930 / 2013 |
| Borrower Sponsor: | The Stahl Organization(2) | | Occupancy: | 62.2% |
| Interest Rate: | 5.88500% | | Occupancy Date: | 6/5/2023 |
| Note Date: | 9/6/2023 | | 4th Most Recent NOI (As of): | $67,543,911 (12/31/2020) |
| Maturity Date: | 10/1/2033 | | 3rd Most Recent NOI (As of): | $77,460,400 (12/31/2021) |
| Interest-only Period: | 120 months | | 2nd Most Recent NOI (As of): | $65,561,820 (12/31/2022) |
| Original Term: | 120 months | | Most Recent NOI (As of): | $73,525,984 (TTM 6/30/2023) |
| Original Amortization Term: | None | | UW Economic Occupancy: | 65.2% |
| Amortization Type: | Interest Only | | UW Revenues: | $120,518,204 |
| Call Protection(3): | L(29),D(86),O(5) | | UW Expenses: | $52,684,531 |
| Lockbox / Cash Management: | Hard / In Place | | UW NOI: | $67,833,673 |
| Additional Debt(1): | Yes | | UW NCF: | $65,493,494 |
| Additional Debt Balance(1): | $215,000,000 | | Appraised Value / Per SF: | $1,596,000,000 / $1,388 |
| Additional Debt Type(1): | Pari Passu | | Appraisal Date: | 5/8/2023 |
| | | | | |
| Escrows and Reserves(4) | | Financial Information(1) |
| | Initial | Monthly | Initial Cap | | Cut-off Date Loan / SF: | $244 |
| Taxes: | $7,089,987 | $1,772,497 | N/A | | Maturity Date Loan / SF: | $244 |
| Insurance: | $0 | Springing | N/A | | Cut-off Date LTV: | 17.5% |
| Replacement Reserves: | $0 | Springing | N/A | | Maturity Date LTV: | 17.5% |
| TI / LC: | $0 | Springing | N/A | | UW NCF DSCR: | 3.92x |
| | | | | | UW NOI Debt Yield: | 24.2% |
| | | | | | | |
| Sources and Uses |
| Sources | Proceeds | % of Total | | Uses | Proceeds | % of Total | |
| Whole Loan | $280,000,000 | 98.7 | % | | Loan Payoff | $274,771,150 | 96.9 | % |
| Borrower Sponsor Equity | 3,678,608 | 1.3 | | | Reserves | 7,089,987 | 2.5 | |
| | | | | Closing Costs | 1,817,471 | 0.6 | |
| Total Sources | $283,678,608 | 100.0 | % | | Total Uses | $283,678,608 | 100.0 | % |
| (1) | The 60 Hudson Mortgage Loan (as defined below) is part of the 60 Hudson Whole Loan (as defined below), which is comprised of 11 pari passu promissory notes with an aggregate original principal balance of $280,000,000. The Financial Information in the chart above reflects the 60 Hudson Whole Loan. |
| (2) | There is no non-recourse carveout guarantor or separate environmental indemnitor with respect to the 60 Hudson Whole Loan. |
| (3) | Defeasance of the 60 Hudson Whole Loan is permitted at any time after the earlier of (i) April 1, 2027 or (ii) the date that is two years from the closing date of the securitization that includes the last pari passu note of the 60 Hudson Whole Loan to be securitized. The assumed lockout period of 29 payments is based on the expected BMO 2024-C8 securitization closing date in March 2024. The actual lockout period may be longer. |
| (4) | For a full description of Escrows and Reserves, see “Escrows and Reserves” below. |
The Loan. The second largest mortgage loan (the “60 Hudson Mortgage Loan”), is part of the 60 Hudson whole loan (the “60 Hudson Whole Loan”) with an original principal balance of $280,000,000. The 60 Hudson Whole Loan is secured by the borrower’s fee interest in a data center located in New York, New York totaling 1,149,619 square feet (the “60 Hudson Property”). The 60 Hudson Whole Loan consists of 11 pari passu notes and accrues interest at a rate of 5.88500% per annum. The 60 Hudson Whole Loan has a 10-year term, is interest-only for the full term of the loan and accrues interest on an Actual/360 basis. The 60 Hudson Whole Loan was originated by Morgan Stanley Bank, N.A. (“MSBNA”). Bank of Montreal purchased the non-controlling Note A-6 in the original principal amount of $20,000,000 and the non-controlling Note A-7-2 in the original principal amount of $5,000,000 from Morgan Stanley Mortgage Capital Holdings LLC (“MSMCH”), an affiliate of MSBNA, on [March 8, 2024], and both notes will be contributed to the BMO 2024-C8 securitization trust, along with the non-controlling Note A-3 in the original principal balance of $40,000,000, and represent approximately 9.5% of the Initial Pool Balance. The 60 Hudson Whole Loan is serviced pursuant to the pooling and servicing agreement for the MSWF 2023-2
THE INFORMATION IN THIS STRUCTURAL AND COLLATERAL TERM SHEET IS NOT COMPLETE AND MAY BE AMENDED PRIOR TO THE TIME OF SALE. THIS TERM SHEET IS NOT AN OFFER TO SELL THESE SECURITIES AND IT IS NOT A SOLICITATION OF AN OFFER TO BUY THESE SECURITIES IN ANY JURISDICTION WHERE THE OFFER OR SALE IS NOT PERMITTED. |
| | 46 | |
| Structural and Collateral Term Sheet | | BMO 2024-C8 |
| No. 2 – 60 Hudson |
securitization trust. See “Description of the Mortgage Pool— The Whole Loans—The Outside Serviced Pari Passu Whole Loans” in the Preliminary Prospectus and “The Pooling and Servicing Agreement—Servicing of the Outside Serviced Mortgage Loans” in the Preliminary Prospectus.
The table below identifies the promissory notes that comprise the 60 Hudson Whole Loan:
| Whole Loan Summary |
| Notes | Original Balance | Cut-off Date Balance | Note Holder | Controlling Piece |
| A-1 | $60,000,000 | $60,000,000 | MSWF 2023-2 | Yes |
| A-2(1) | $50,000,000 | $50,000,000 | MSBNA | No |
| A-3 | $40,000,000 | $40,000,000 | BMO 2024-C8 | No |
| A-4 | $30,000,000 | $30,000,000 | MSWF 2023-2 | No |
| A-5 | $30,000,000 | $30,000,000 | BBCMS 2023-C22 | No |
| A-6 | $20,000,000 | $20,000,000 | BMO 2024-C8 | No |
| A-7-1(1) | $15,000,000 | $15,000,000 | MSBNA | No |
| A-7-2 | $5,000,000 | $5,000,000 | BMO 2024-C8 | No |
| A-8 | $10,000,000 | $10,000,000 | BBCMS 2023-C22 | No |
| A-9 | $10,000,000 | $10,000,000 | BMO 2023-C7 | No |
| A-10 | $10,000,000 | $10,000,000 | BMO 2023-C7 | No |
| Whole Loan | $280,000,000 | $280,000,000 | | |
| (1) | Expected to be contributed to one or more future securitizations. |
The Property. The 60 Hudson Property is a 24-story, plus basement, 1,149,619 square foot data center/carrier hotel building situated on an approximately 1.2-acre site located in New York, New York. The building spans an entire block between Hudson Street, West Broadway, Worth Street and Thomas Street. The 60 Hudson Property is one of the primary telecom and internet centers in New York City. Built in 1930 for the Western Union telegraph company, the building was initially known as the “Telegraph Capital of America”. After Western Union departed in 1973, the 60 Hudson Property was converted into a colocation center. Hundreds of telecommunication companies interconnect their respective internet networks, where telecommunications companies route internet traffic and exchange information in a “meet-me room” located at the 60 Hudson Property through fiber-optic lines. The 60 Hudson Property is widely considered a primary telecommunications hub of the Northeast region of the United States. The building provides an interconnection via under-sea cable to the United Kingdom, and to the cables from Manasquan, New Jersey, and Truckerton, New York, to the European Union.
The borrower sponsor most recently renovated the 60 Hudson Property in 2013. As of June 5, 2023, the 60 Hudson Property was 62.2% leased and anchored by major telecommunications and data center tenants, including Verizon, Hudson Interxchange (as defined below), Telx - New York LLC (Digital Realty), and zColo, LLC (DataBank). Approximately 9.5% of NRA consists of traditional office space. The 60 Hudson Property building was designated a historical landmark in 1992 by the New York City Landmarks Preservation Commission.
Major Tenants.
Verizon (184,420 square feet; 16.0% of NRA; 28.3% of underwritten base rent). Verizon (NYSE: VZ) is a leading provider of technology and communications services. Headquartered in New York City, and formed on June 30, 2000, the company offers voice, data and video services and solutions on its networks and platforms. Verizon has nearly 1,500 retail locations throughout over 150 countries and reported 2022 revenues of $136.8 billion. Verizon operates at the 60 Hudson Property under four separate affiliated entities; MCI Communication Services (157,952 square feet), Metropolitan Fibers Systems of NY (14,904 square feet), XO Communications Services (10,898 square feet) and Verizon New York Inc. (666 square feet). Verizon and these affiliated entities have been a tenant at the 60 Hudson Property since July 1984, September 1990, December 1997, and December 1986, respectively. With the exception of the XO Communications Services lease (10,898 square feet), Verizon and these affiliated leases recently executed extension notices for their leases, which will extend for 10 years through December 2034, with one, 10-year renewal option remaining with the exception of Verizon New York Inc. The XO Communications Services lease has an expiration date of May 31, 2033, with no renewal options remaining. Verizon has no termination options at the 60 Hudson Property.
THE INFORMATION IN THIS STRUCTURAL AND COLLATERAL TERM SHEET IS NOT COMPLETE AND MAY BE AMENDED PRIOR TO THE TIME OF SALE. THIS TERM SHEET IS NOT AN OFFER TO SELL THESE SECURITIES AND IT IS NOT A SOLICITATION OF AN OFFER TO BUY THESE SECURITIES IN ANY JURISDICTION WHERE THE OFFER OR SALE IS NOT PERMITTED. |
| | 47 | |
| Structural and Collateral Term Sheet | | BMO 2024-C8 |
| No. 2 – 60 Hudson |
CDIL Data Centre USA LLC (“Hudson Interxchange”) (172,775 square feet; 15.0% of NRA; 22.1% of underwritten base rent). Hudson Interxchange (previously known as Datagryd) is a wholesale data center provider meeting the demands of high-power cloud computing and data storage clients by offering colocation space, power and cooling infrastructure for data network, telecommunications, cloud and large enterprises. Datagryd was acquired by Cordiant Digital Infrastructure in 2022 for $74.0 million and was rebranded to Hudson Interxchange. Hudson Interxchange has occupied the 60 Hudson Property since September 2011, has a lease expiration date of September 30, 2032 and has three, five-year renewal options remaining. Hudson Interxchange has no termination options at the 60 Hudson Property.
Telx – New York LLC (Digital Realty) (“Telx”) (95,494 square feet; 8.3% of NRA; 12.9% of underwritten base rent). Telx is a provider of data center colocation, interconnection, and cloud enablement solutions. Telx was acquired by Digital Realty Trust, Inc. in 2015 for $1.9 billion. Digital Realty Trust, Inc. operates as a real estate investment trust and is a large global provider of cloud- and carrier-neutral data center, colocation, and interconnection solutions. As of December 31, 2022, Digital Realty Trust Inc.’s portfolio consisted of 316 specialty industrial properties located in North America, Europe, South America, Africa, Australia and Asia. Telx has been a tenant at the 60 Hudson Property since June 1997, has a lease expiration date of October 31, 2027 and has one, five-year renewal option remaining. Telx has no termination options at the 60 Hudson Property.
zColo, LLC (DataBank) (“DataBank”) (57,840 square feet; 5.0% of NRA; 10.6% of underwritten base rent). DataBank acquired the data center assets of Zayo Group (zColo LLC) in December 2020 for approximately $1.4 billion, expanding DataBank’s footprint to over 65 data centers in over 29 markets and creating one of the largest privately held data center operators in North America. DataBank’s data centers are located in markets across the United States, and include major carrier interconnects in markets such as New York, Los Angeles, Seattle, Denver, Chicago, Minneapolis, Boston, Philadelphia, and Miami. DataBank has been a tenant at the 60 Hudson Property since April 1995, has a lease expiration date of July 31, 2032 and has one, 10-year renewal option remaining. Databank has no termination options at the 60 Hudson Property.
Appraisal. According to the appraisal, the 60 Hudson Property had an “as-is” appraised value of $1,596,000,000 as of May 8, 2023. The table below shows the appraiser’s “as-is” conclusions.
| Appraisal Valuation Summary(1) |
| Appraisal Approach | Appraised Value | Capitalization Rate(2) |
| Income Capitalization Approach | $1,596,000,000 | 4.50% |
| (2) | The appraiser used a discounted cash flow approach to arrive at the appraised value. The capitalization rate shown above represents the overall capitalization rate. |
Environmental. According to the Phase I environmental report dated May 11, 2023, there are no recognized environmental conditions at the 60 Hudson Property.
The following table presents certain information relating to the historical occupancy of the 60 Hudson Property:
| Historical and Current Occupancy(1) |
| 2020 | 2021 | 2022 | Current(2) |
| 72.6% | 64.1% | 63.2% | 62.2% |
| (1) | Historical Occupancies are as of December 31 of each respective year. |
| (2) | Current Occupancy is as of June 5, 2023. |
THE INFORMATION IN THIS STRUCTURAL AND COLLATERAL TERM SHEET IS NOT COMPLETE AND MAY BE AMENDED PRIOR TO THE TIME OF SALE. THIS TERM SHEET IS NOT AN OFFER TO SELL THESE SECURITIES AND IT IS NOT A SOLICITATION OF AN OFFER TO BUY THESE SECURITIES IN ANY JURISDICTION WHERE THE OFFER OR SALE IS NOT PERMITTED. |
| | 48 | |
| Structural and Collateral Term Sheet | | BMO 2024-C8 |
| No. 2 – 60 Hudson |
| Top Tenant Summary(1) |
| Tenant | Ratings
Moody’s/S&P/ Fitch(2) | Net Rentable Area (SF) | % of
Total NRA | UW Base Rent PSF(3)(4) | UW Base Rent(3)(4) | % of Total
UW Base Rent(3)(4) | Lease
Exp. Date | Renewal Options |
| Verizon(3) | Baa1/BBB+/A- | 184,420 | 16.0 | % | $125.96 | $23,229,241 | 28.3 | % | Various(3) | Various(3) |
| Hudson Interxchange | NR/NR/NR | 172,775 | 15.0 | | $104.95 | 18,132,737 | 22.1 | | 9/30/2032 | 3, 5-year |
| Telx | Baa2/BBB/BBB | 95,494 | 8.3 | | $111.26 | 10,624,472 | 12.9 | | 10/31/2027 | 1, 5-year |
| DataBank | NR/NR/NR | 57,840 | 5.0 | | $150.18 | 8,686,211 | 10.6 | | 7/31/2032 | 1, 10-year |
| Centurylink Communications | Caa3/CCC+/CCC+ | 37,472 | 3.3 | | $101.29 | 3,795,715 | 4.6 | | 9/30/2033 | 1, 10-year |
| Level 3 Communications, LLC | NR/NR/NR | 35,389 | 3.1 | | $119.59 | 4,232,080 | 5.2 | | Various(5) | 1, 10-year |
| NYI-Sirius, LLC | NR/NR/NR | 21,708 | 1.9 | | $115.42 | 2,505,625 | 3.0 | | 7/31/2028(6) | 1, 10-year |
| Major Tenants | | 605,098 | 52.6 | % | $117.68 | $71,206,081 | 86.7 | % | | |
| | | | | | | | | |
| Other Tenants | | 109,536 | 9.5 | | $99.99 | 10,952,927 | 13.3 | | | |
| | | | | | | | | |
| Occupied Collateral Total | 714,634 | 62.2 | % | $114.97 | $82,159,008 | 100.0 | % | | |
| | | | | | | | | |
| Vacant Space(7) | | 434,985 | 37.8 | | | | | | |
| | | | | | | | | |
| Collateral Total | | 1,149,619 | 100.0 | % | | | | | |
| | | | | | | |
| (1) | Based on underwritten rent roll dated June 5, 2023. |
| (2) | Ratings provided are for the parent company of the entity listed in the “Tenant” field whether or not the parent company guarantees the lease. |
| (3) | Includes Verizon affiliated leases under MCI Communication Services (157,952 square feet), Metropolitan Fiber Systems of NY (14,904 square feet), XO Communications Services (10,898 square feet) and Verizon New York Inc. (666 square feet). With the exception of the XO Communications Services lease, Verizon and its affiliated leases recently executed extension notices for their leases, which extends the leases through December 31, 2034. The XO Communications Services lease has a lease expiration date of May 31, 2033. With the exception of the Verizon New York Inc. and XO Communications Services leases, Verizon’s affiliated leases have one, 10-year renewal option remaining. |
| (4) | UW Base Rent, UW Base Rent PSF and % of Total UW Base Rent includes rent steps totaling $3,076,879 through September 2024. |
| (5) | Level 3 Communications, LLC has 22,113 square feet with an expiration date of December 31, 2027 and 13,276 square feet with an expiration date of April 30, 2025. Additionally, the landlord and tenant each had the right and option to terminate the lease with respect to the 12th floor premises as of December 31, 2024 upon delivery of written notice to the other no less than 12 months, and no more than 15 months, prior to December 31, 2024. |
| (6) | NYI-Sirius, LLC has the option to terminate its lease with respect to the Suite 1213 premises (8,309 square feet) upon 12 months’ prior written notice to the landlord, together with the payment of $100,000. |
| (7) | Vacant Space includes one in-place tenant, Stadium Goods (13,828 square feet) which was underwritten as vacant due to its lease expiring in October 2023. |
THE INFORMATION IN THIS STRUCTURAL AND COLLATERAL TERM SHEET IS NOT COMPLETE AND MAY BE AMENDED PRIOR TO THE TIME OF SALE. THIS TERM SHEET IS NOT AN OFFER TO SELL THESE SECURITIES AND IT IS NOT A SOLICITATION OF AN OFFER TO BUY THESE SECURITIES IN ANY JURISDICTION WHERE THE OFFER OR SALE IS NOT PERMITTED. |
| | 49 | |
| Structural and Collateral Term Sheet | | BMO 2024-C8 |
| No. 2 – 60 Hudson |
The following table presents certain information relating to tenant lease expirations at the 60 Hudson Property:
| Lease Rollover Schedule(1)(2) |
| Year | Number of Leases Expiring | Net Rentable Area Expiring | % of NRA Expiring | UW Base Rent Expiring(3) | % of UW Base Rent Expiring(3) | Cumulative Net Rentable Area Expiring | Cumulative % of NRA Expiring | Cumulative UW Base Rent Expiring(3) | Cumulative % of UW Base Rent Expiring(3) |
| Vacant(4) | NAP | 434,985 | 37.8 | % | NAP | NA | P | 434,985 | 37.8% | NAP | NAP |
| MTM | 1 | 7,886 | 0.7 | | $0 | 0.0 | % | 442,871 | 38.5% | $0 | 0.0% |
| 2024 | 1 | 10,876 | 0.9 | | 1,090,229 | 1.3 | | 453,747 | 39.5% | $1,090,229 | 1.3% |
| 2025 | 2 | 16,971 | 1.5 | | 1,938,982 | 2.4 | | 470,718 | 40.9% | $3,029,211 | 3.7% |
| 2026 | 0 | 0 | 0.0 | | 0 | 0.0 | | 470,718 | 40.9% | $3,029,211 | 3.7% |
| 2027 | 4 | 132,121 | 11.5 | | 14,937,189 | 18.2 | | 602,839 | 52.4% | $17,966,400 | 21.9% |
| 2028 | 3 | 40,719 | 3.5 | | 4,776,223 | 5.8 | | 643,558 | 56.0% | $22,742,623 | 27.7% |
| 2029 | 1 | 6,121 | 0.5 | | 529,996 | 0.6 | | 649,679 | 56.5% | $23,272,619 | 28.3% |
| 2030 | 0 | 0 | 0.0 | | 0 | 0.0 | | 649,679 | 56.5% | $23,272,619 | 28.3% |
| 2031 | 2 | 12,976 | 1.1 | | 1,581,019 | 1.9 | | 662,655 | 57.6% | $24,853,638 | 30.3% |
| 2032 | 3 | 242,627 | 21.1 | | 28,097,299 | 34.2 | | 905,282 | 78.7% | $52,950,938 | 64.4% |
| 2033 | 2 | 48,370 | 4.2 | | 5,014,225 | 6.1 | | 953,652 | 83.0% | $57,965,162 | 70.6% |
| 2034 & Beyond | 2 | 195,967 | 17.0 | | 24,193,846 | 29.4 | | 1,149,619 | 100.0% | $82,159,008 | 100.0% |
| Total | 21 | 1,149,619 | 100.0 | % | $82,159,008 | 100.0 | % | | | | |
| (1) | Based on the underwritten rent roll dated June 5, 2023. |
| (2) | Certain tenants may have lease termination options that are exercisable prior to the stated expiration date of the subject lease or leases which are not considered in the lease rollover schedule. |
| (3) | UW Base Rent Expiring, % of UW Base Rent Expiring, Cumulative UW Base Rent Expiring and Cumulative % of UW Base Rent Expiring includes rent steps totaling $3,076,879 through September 2024. |
| (4) | Vacant Space includes one in-place tenant, Stadium Goods (13,828 square feet) which was underwritten as vacant due to its lease expiring in October 2023. |
THE INFORMATION IN THIS STRUCTURAL AND COLLATERAL TERM SHEET IS NOT COMPLETE AND MAY BE AMENDED PRIOR TO THE TIME OF SALE. THIS TERM SHEET IS NOT AN OFFER TO SELL THESE SECURITIES AND IT IS NOT A SOLICITATION OF AN OFFER TO BUY THESE SECURITIES IN ANY JURISDICTION WHERE THE OFFER OR SALE IS NOT PERMITTED. |
| | 50 | |
| Structural and Collateral Term Sheet | | BMO 2024-C8 |
| No. 2 – 60 Hudson |
The following table presents certain information relating to the operating history and underwritten cash flows of the 60 Hudson Property:
| Operating History and Underwritten Net Cash Flow |
| | 2020 | 2021 | 2022 | TTM(1) | Underwritten | Per Square Foot | %(2) | |
| Rents in Place | $80,020,378 | 81,473,151 | $79,777,070 | $80,757,027 | $122,965,524 | $106.96 | 74.8 | % |
| Contractual Rent Steps(3) | 0 | 0 | 0 | 0 | 3,076,879 | 2.68 | 1.9 | |
| Gross Potential Rent | $80,020,378 | $81,473,151 | $79,777,070 | $80,757,027 | $126,042,403 | $109.64 | 76.7 | % |
| Other Income(4) | 22,431,718 | 29,768,129 | 26,396,142 | 35,751,074 | 31,900,000 | 27.75 | 19.4 | |
| Total Reimbursements | 8,899,659 | 7,503,651 | 6,767,304 | 7,800,073 | 6,459,196 | 5.62 | 3.9 | |
| Net Rental Income | $111,351,756 | $118,744,930 | $112,940,517 | $124,308,174 | $164,401,599 | $143.01 | 100.0 | % |
| (Vacancy/Credit Loss) | 0 | 0 | 0 | 0 | (43,883,395) | (38.17) | (26.7 | ) |
| Effective Gross Income | $111,351,756 | $118,744,930 | $112,940,517 | $124,308,174 | $120,518,204 | $104.83 | 73.3 | % |
| | | | | | | | |
| Taxes | 20,888,707 | 16,556,736 | 20,495,261 | 20,777,690 | 21,269,961 | 18.50 | 17.6 | |
| Insurance | 707,269 | 703,478 | 681,814 | 758,606 | 745,821 | 0.65 | 0.6 | |
| Utilities | 12,286,565 | 14,381,855 | 16,217,542 | 19,529,586 | 20,454,246 | 17.79 | 17.0 | |
| Repairs & Maintenance | 6,440,232 | 6,119,787 | 6,156,168 | 5,921,862 | 6,782,245 | 5.90 | 5.6 | |
| Other Expenses | 3,485,072 | 3,522,673 | 3,827,913 | 3,794,446 | 3,432,258 | 2.99 | 2.8 | |
| Total Expenses | $43,807,845 | $41,284,530 | $47,378,697 | $50,782,190 | $52,684,531 | $45.83 | 43.7 | % |
| | | | | | | | |
| Net Operating Income | $67,543,911 | $77,460,400 | $65,561,820 | $73,525,984 | $67,833,673 | $59.01 | 56.3 | % |
| | | | | | | | |
| Capital Expenditures | 0 | 0 | 0 | 0 | 229,924 | 0.20 | 0.2 | |
| TI/LC | 0 | 0 | 0 | 0 | 2,110,256 | 1.84 | 1.8 | |
| | | | | | | | |
| Net Cash Flow | $67,543,911 | $77,460,400 | $65,561,820 | $73,525,984 | $65,493,494 | $56.97 | 54.3 | % |
| (1) | TTM represents the trailing 12-month period ending June 30, 2023. |
| (2) | % column represents percent of Net Rental Income for all revenue lines and represents percent of Effective Gross Income for the remainder of fields. |
| (3) | Contractual Rent Steps include rent steps through September 2024. |
| (4) | Other Income includes metered electric charges, conduit income, point of entry income, condenser water income, emergency generator access charges, fuel riser income and other miscellaneous fees. |
THE INFORMATION IN THIS STRUCTURAL AND COLLATERAL TERM SHEET IS NOT COMPLETE AND MAY BE AMENDED PRIOR TO THE TIME OF SALE. THIS TERM SHEET IS NOT AN OFFER TO SELL THESE SECURITIES AND IT IS NOT A SOLICITATION OF AN OFFER TO BUY THESE SECURITIES IN ANY JURISDICTION WHERE THE OFFER OR SALE IS NOT PERMITTED. |
| | 51 | |
| Structural and Collateral Term Sheet | | BMO 2024-C8 |
| No. 2 – 60 Hudson |
The Market. The 60 Hudson Property is located in the Financial District neighborhood of Lower Manhattan, which borders the neighborhoods of Downtown West, Downtown East, Battery Park, Tribeca/City Hall, Chinatown, and the Lower East Side. The 60 Hudson Property is located five blocks north of the Wall Street subway station, which provides access to the 2 and 3 lines, while also being located a short walk from the PATH, 4, 5, A, C, E, J, M, Z, W, R, 1, 2, and 3 subway lines, with the new Fulton Street Transit Center providing access to New Jersey, Brooklyn, and the residential neighborhoods in Lower Manhattan.
The 60 Hudson Property is located within the New York metro data center market, which includes clusters of properties in Northern New Jersey, Southeastern New York, and Southwestern Connecticut. The New York metro represents the second-largest data center market in the United States, behind Northern Virginia, and accounts for the highest colocation revenues with proximity to Wall Street and subsea connectivity. Manhattan represents a major confluence of fiber networks and enterprise information technology footprints, with developed carrier hotels including the 60 Hudson Property, 32 Avenue of the Americas, and 111 8th Avenue expected to remain central hubs for networking and connectivity. As of 2023, according to a third party market research report, the New York metro is estimated to operate with nearly 800 megawatts of multi-tenant information technology capacity. The New York market is estimated to have surpassed 6.0 million square feet of multi-tenant operational space as of 2022.
Data center customers within this region primarily include the financial sector, but also include healthcare, media, and others which have specific user requirements and compliance needs. New York’s financial industry is responsible for approximately 40% of its total economic output. Transferring data is vital for the financial services industry, and this communication must move quickly with its information stored securely. Increased volume of data in trading is raising demand for cybersecurity software with monitors for fraud or noncompliance. Proximity hosting allows traders to be physically close to information technology systems allowing the advantage of multiple data flows. According to the appraisal, data center operators in this region are reporting occupancy rates from 75% to 93%.
According to the appraisal, the estimated 2022 population within a half-, one- and two-mile radius was approximately 19,702, 213,569, and 677,036, respectively, and the average household income within the same radii was $206,211, $207,361, and $217,611, respectively.
The following table presents certain information relating to comparable data center sales for the 60 Hudson Property:
| Comparable Sales Summary(1) |
| Subject/Location | Year Built/ Renovated | Rentable Area (SF) | Occupancy | Sale Date | Sale Price | Sale Price PSF |
60 Hudson Property (subject)(2) New York, NY | 1930 / 2013 | 1,149,619 | 62.2% | NAV | $1,596,000,000(3) | $1,388.29(3) |
1500 Champa Street Denver, CO | 1985 / 2014 | 140,323 | 100.0% | Dec. 2021 | $92,000,000 | $655.63 |
Confidential Major Market | 1925 / 2010 | 66,000 | Value Add | Oct. 2021 | $31,895,000 | $483.26 |
325 Hudson New York, NY | 1967 / 2007 | 217,600 | Value Add | May 2021 | $134,140,000 | $616.45 |
Confidential Secondary Market | 1914 / 2001 | 300,000 | Value Add | Jan. 2021 | $360,000,000 | $1,200.00 |
Confidential Major Market | 1942 / 2000 | 175,000 | 75.0% | Dec. 2020 | $165,468,922 | $945.54 |
Confidential Major Market | 1923 / Various | 110,000 | 94.0% | Apr. 2020 | $100,000,000 | $909.09 |
Confidential Major Market | 1981 / 2013 | 400,000 | 90.0% | Jan. 2020 | $750,000,000 | $1,875.00 |
1950 North Stemmons Freeway Dallas, TX | 1985 / Various | 1,600,000 | 90.0% | Feb. 2018 | $800,000,000 | $500.00 |
| (1) | Source: Appraisal unless otherwise noted. |
| (2) | Information obtained from the underwritten rent roll dated June 5, 2023 other than Year Built/Renovated and Sale Price for the 60 Hudson Property. |
| (3) | Sale Price represents appraised value. |
THE INFORMATION IN THIS STRUCTURAL AND COLLATERAL TERM SHEET IS NOT COMPLETE AND MAY BE AMENDED PRIOR TO THE TIME OF SALE. THIS TERM SHEET IS NOT AN OFFER TO SELL THESE SECURITIES AND IT IS NOT A SOLICITATION OF AN OFFER TO BUY THESE SECURITIES IN ANY JURISDICTION WHERE THE OFFER OR SALE IS NOT PERMITTED. |
| | 52 | |
| Structural and Collateral Term Sheet | | BMO 2024-C8 |
| No. 2 – 60 Hudson |
The following table presents information relating to the appraisal’s market rent conclusion for the 60 Hudson Property:
| Market Rent Summary(1) |
| Category | Market Rent (PSF) | Lease Type (Reimbursements)(2) | Rent Increase Projection | Lease Term | Tenant Improvements (New/Renewal) | Leasing Commissions (New/Renewal) |
| Office (Floors 1-13) | $54.00 | MG+E (Taxes Only) | 2.5% per year | 10 years | $125.00 / $90.00 | 4.0% / 2.0% |
| Office (Floors 14-24) | $60.00 | MG+E (Taxes Only) | 2.5% per year | 10 years | $125.00 / $90.00 | 4.0% / 2.0% |
| Office (Floor 14; 1st Turn) | $60.00 | MG+E (Taxes Only) | 2.5% per year | 10 years | $150.00 / $90.00 | 4.0% / 2.0% |
| Data Center ($100 PSF) | $100.00 | MG+E (Taxes Only) | 2.5% per year | 10 years | $20.00 / $5.00 | 4.0% / 2.0% |
| Data Center ($125 PSF) | $125.00 | MG+E (Taxes Only) | 2.5% per year | 10 years | $20.00 / $5.00 | 4.0% / 2.0% |
| Data Center ($175 PSF) | $175.00 | MG+E (Taxes Only) | 2.5% per year | 10 years | $20.00 / $5.00 | 4.0% / 2.0% |
| (1) | Source: Appraisal unless otherwise noted. |
| (2) | MG+E (Taxes Only) represents modified gross basis with tenants paying their pro rata share of expense reimbursements (taxes only) over a base year. |
The Borrower. The borrower of the 60 Hudson Whole Loan is 60 Hudson Owner, LLC, a single purpose Delaware limited liability company with two independent directors in its organizational structure. Legal counsel to the borrower delivered a non-consolidation opinion in connection with the origination of the 60 Hudson Whole Loan.
The Borrower Sponsor. The borrower sponsor is The Stahl Organization. The Stahl Organization is a privately held, New York based real estate company founded by Stanley Stahl in 1949. The Stahl Organization’s current real estate portfolio comprises over five million square feet of office space, including 277 Park Avenue and 122 East 42nd Street, and 10 retail/commercial properties in Manhattan. The Stahl Organization is also a significant residential landlord with over 3,500 apartments in various residential assets located throughout New York City. There is no non-recourse carveout guarantor or separate environmental indemnitor with respect to the 60 Hudson Whole Loan.
In addition to its real estate portfolio, The Stahl Organization owns 100% of Apple Bank for Savings, which has 84 branches. The Stahl Organization also owns Cauldwell Wingate Company, a construction company based in New York City and founded in 1910.
The Stahl Organization’s executives have been associated with the company for many years as employees and third-party professional consultants. Richard Czaja, the Co-President and General Counsel, has been with The Stahl Organization for over 35 years and has represented the company in legal matters during the prior eight years. Gregg Wolpert, Co-President, has been with the company for over 33 years and managed several Stahl real estate investments during the prior eight years. Marianne Dziuba, Executive Vice President, has been with the organization for over 40 years. Robert Getreu, a key principal, is an Executive Vice President of Colliers Tri-State Management, (the property manager), and handled the redevelopment and expansion of the 60 Hudson Property in 2013. Robert Getreu has been with Colliers Tri-State Management for over 31 years. Richard Czaja and Robert Getreu are the non-member managers of two entities which own an approximately 67.5% indirect equity interest in the borrower. Richard Czaja and Gregg Wolpert are trustees of a trust which is the general partner of a third entity which owns the remaining 32.5% indirect equity interest in the borrower.
Property Management. The 60 Hudson Property is managed by Colliers Tri-State Management LLC, an affiliated property manager.
Escrows and Reserves. At origination of the 60 Hudson Whole Loan, the borrower deposited $7,089,987 for real estate taxes.
Real Estate Tax Reserves - On each monthly payment date, the borrower is required to deposit into a reserve for real estate taxes an amount equal to 1/12th of the real estate taxes that the lender estimates will be payable during the next 12 months for the 60 Hudson Property (currently approximately $1,772,497 per month).
Insurance Reserves – On each monthly payment date, the borrower is required to deposit into a reserve for insurance premiums an amount equal to 1/12th of the insurance premiums that the lender estimates will be payable for the renewal of coverage upon the expiration of the insurance policies. Notwithstanding the foregoing, the borrower is not required to reserve for insurance premiums, provided that (i) no event of default is continuing under the 60 Hudson Whole Loan documents, (ii) the liability and casualty insurance coverage for the 60 Hudson Property is included in blanket policies approved by the lender in its reasonable discretion, and (iii) the borrower provides the lender with evidence of renewal of
THE INFORMATION IN THIS STRUCTURAL AND COLLATERAL TERM SHEET IS NOT COMPLETE AND MAY BE AMENDED PRIOR TO THE TIME OF SALE. THIS TERM SHEET IS NOT AN OFFER TO SELL THESE SECURITIES AND IT IS NOT A SOLICITATION OF AN OFFER TO BUY THESE SECURITIES IN ANY JURISDICTION WHERE THE OFFER OR SALE IS NOT PERMITTED. |
| | 53 | |
| Structural and Collateral Term Sheet | | BMO 2024-C8 |
| No. 2 – 60 Hudson |
the policies and paid receipts for the payment of the insurance premiums by no later than 10 days prior to the expiration date of the policies.
Replacement Reserves – On each monthly payment date during the continuance of a Reserves Trigger Period (as defined below), the borrower is required to deposit approximately $19,160 into a reserve for capital expenditures.
TI/LC Reserves – On each monthly payment date during the continuance of a Reserves Trigger Period, the borrower is required to deposit approximately $287,405 into a reserve for tenant improvements and leasing commissions.
Lockbox / Cash Management. The 60 Hudson Whole Loan is structured with a hard lockbox maintained with Apple Bank for Savings, an affiliate of the borrower, and in place cash management. All rents are required to be deposited into the lender-controlled lockbox account. The 60 Hudson Whole Loan requires that the borrower deliver tenant direction letters to the tenants directing them to pay all rents into the lockbox account, and if the borrower or property manager receives rents from the 60 Hudson Property despite such direction, to deposit such rents into the lockbox account within one business day of receipt. All funds in the lockbox account are required to be swept on each business day into a lender-controlled cash management account, to be applied, provided no event of default is continuing under the 60 Hudson Whole Loan documents, (i) to make the monthly deposits, if any, into the tax and insurance reserve funds, as described above under “Escrows and Reserves”, (ii) to pay debt service on the 60 Hudson Whole Loan, (iii) to make monthly deposits, if any, into the Replacement Reserve and the TI/LC Reserve, as described above under “Escrows and Reserves”, (iv) if a Cash Sweep Event Period (as defined below) is continuing, to pay monthly operating expenses in the amount set forth in the lender-approved annual budget and lender approved extraordinary expenses, and (v) to apply any funds remaining in the cash management account after the application described above (x) if a Cash Sweep Event Period exists, to be deposited into an excess cash flow reserve to be held as additional collateral for the 60 Hudson Whole Loan during the continuance of such Cash Sweep Event Period and (y) otherwise, to be disbursed to the borrower.
“Reserves Trigger Period” means the continuance of any Cash Sweep Event Period, provided that if such Cash Sweep Event Period is not caused by an event of default under the 60 Hudson Whole Loan documents, the Reserves Trigger Period will not be deemed to have occurred if (i) the borrower demonstrates to the reasonable satisfaction of the lender that the borrower has Sufficient Liquid Resources (as defined below) or (ii) the borrower delivers to the lender the Additional Collateral (as defined below) as and when permitted by the 60 Hudson Whole Loan documents.
In the event a Reserves Trigger Period has been avoided by the borrower demonstrating it has Sufficient Liquid Resources, all funds in the lockbox account will still be required to be swept into a lender controlled cash management account and all remaining funds after the application described in the “Lockbox / Cash Management” section will be deposited into an excess cash flow reserve to be held as additional collateral for the 60 Hudson Whole Loan during the continuance of a “Cash Sweep Event Period”.
“Sufficient Liquid Resources” means that the borrower has cash, cash equivalents and/or other liquid assets equal to not less than 50% or more of the capital expenditures and tenant improvements and leasing commissions payable as of an applicable determination date.
“Additional Collateral” means either cash or a letter of credit in the amount of $17,500,000.
“Cash Sweep Event Period” means a period (A) commencing upon the earliest of (i) the occurrence of an event of default under the 60 Hudson Whole Loan documents, or (ii) the interest only debt service coverage ratio of the 60 Hudson Whole Loan being less than 1.60x at the end of any calendar quarter; and (B) expiring upon (y) with regard to any Cash Sweep Event Period commenced in connection with clause (i) above, the cure (if applicable) of such event of default, and (z) with regard to any Cash Sweep Event Period commenced in connection with clause (ii) above, the date that either (A) the interest only debt service coverage ratio is equal to or greater than 1.60x for the immediately preceding calendar quarter (without assuming that the Additional Collateral has been applied as a partial repayment of the 60 Hudson Whole Loan) or (B) assuming that no event of default is continuing, the date that the borrower delivers Additional Collateral to the lender; provided, however, that if, 12 months following the commencement of the Cash Sweep Event Period that resulted in delivery of Additional Collateral, the interest only debt service coverage ratio is less than 1.60x at the end of any calendar quarter (without giving effect to application of the Additional Collateral to the outstanding principal balance of the 60 Hudson Whole Loan), a Cash Sweep Event Period will be deemed to have occurred and will continue until the date that the interest only debt service coverage ratio is equal to or greater than 1.60x for the immediately preceding calendar quarter. In no event will
THE INFORMATION IN THIS STRUCTURAL AND COLLATERAL TERM SHEET IS NOT COMPLETE AND MAY BE AMENDED PRIOR TO THE TIME OF SALE. THIS TERM SHEET IS NOT AN OFFER TO SELL THESE SECURITIES AND IT IS NOT A SOLICITATION OF AN OFFER TO BUY THESE SECURITIES IN ANY JURISDICTION WHERE THE OFFER OR SALE IS NOT PERMITTED. |
| | 54 | |
| Structural and Collateral Term Sheet | | BMO 2024-C8 |
| No. 2 – 60 Hudson |
the borrower have the right to cure a Cash Sweep Event Period by delivering Additional Collateral on more than three occasions.
Subordinate and Mezzanine Debt. None.
Permitted Future Mezzanine Debt. Not permitted.
Partial Release. Not permitted.
Ground Lease. None.
THE INFORMATION IN THIS STRUCTURAL AND COLLATERAL TERM SHEET IS NOT COMPLETE AND MAY BE AMENDED PRIOR TO THE TIME OF SALE. THIS TERM SHEET IS NOT AN OFFER TO SELL THESE SECURITIES AND IT IS NOT A SOLICITATION OF AN OFFER TO BUY THESE SECURITIES IN ANY JURISDICTION WHERE THE OFFER OR SALE IS NOT PERMITTED. |
| | 55 | |
| Structural and Collateral Term Sheet | | BMO 2024-C8 |
| No. 3 – Fayette Pavilion |
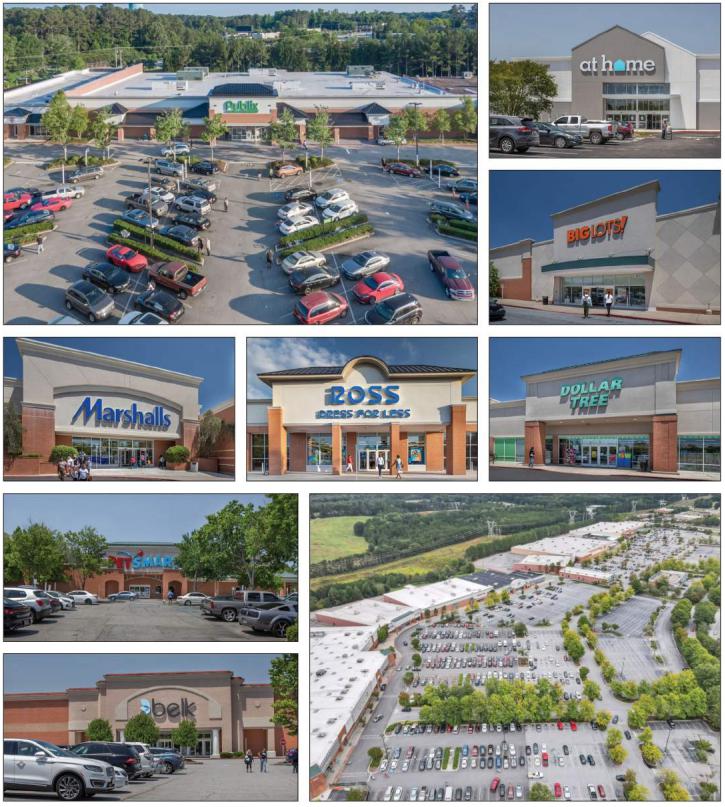
THE INFORMATION IN THIS STRUCTURAL AND COLLATERAL TERM SHEET IS NOT COMPLETE AND MAY BE AMENDED PRIOR TO THE TIME OF SALE. THIS TERM SHEET IS NOT AN OFFER TO SELL THESE SECURITIES AND IT IS NOT A SOLICITATION OF AN OFFER TO BUY THESE SECURITIES IN ANY JURISDICTION WHERE THE OFFER OR SALE IS NOT PERMITTED. |
| | 56 | |
| Structural and Collateral Term Sheet | | BMO 2024-C8 |
| No. 3 – Fayette Pavilion |
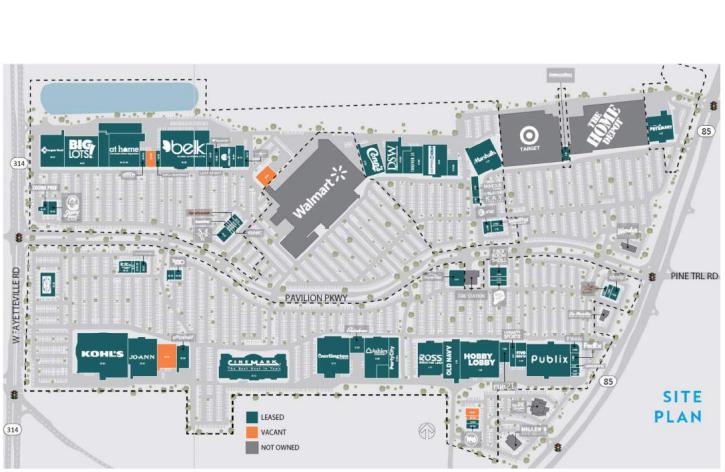
THE INFORMATION IN THIS STRUCTURAL AND COLLATERAL TERM SHEET IS NOT COMPLETE AND MAY BE AMENDED PRIOR TO THE TIME OF SALE. THIS TERM SHEET IS NOT AN OFFER TO SELL THESE SECURITIES AND IT IS NOT A SOLICITATION OF AN OFFER TO BUY THESE SECURITIES IN ANY JURISDICTION WHERE THE OFFER OR SALE IS NOT PERMITTED. |
| | 57 | |
| Structural and Collateral Term Sheet | | BMO 2024-C8 |
| No. 3 – Fayette Pavilion |

THE INFORMATION IN THIS STRUCTURAL AND COLLATERAL TERM SHEET IS NOT COMPLETE AND MAY BE AMENDED PRIOR TO THE TIME OF SALE. THIS TERM SHEET IS NOT AN OFFER TO SELL THESE SECURITIES AND IT IS NOT A SOLICITATION OF AN OFFER TO BUY THESE SECURITIES IN ANY JURISDICTION WHERE THE OFFER OR SALE IS NOT PERMITTED. |
| | 58 | |
| Structural and Collateral Term Sheet | | BMO 2024-C8 |
| No. 3 – Fayette Pavilion |
| Mortgage Loan Information | | Property Information |
| Mortgage Loan Seller: | SMC | | Single Asset / Portfolio: | Single Asset |
| Original Principal Balance(1): | $65,000,000 | | Title: | Fee |
| Cut-off Date Principal Balance(1): | $65,000,000 | | Property Type - Subtype: | Retail – Anchored |
| % of Pool by IPB: | 9.5% | | Net Rentable Area (SF): | 1,063,840 |
| Loan Purpose: | Acquisition | | Location: | Fayetteville, GA |
| Borrowers: | Fayette Pavilion LLC and Miles Fayette LLC | | Year Built / Renovated: | 1995, 2023 / NAP |
| Borrower Sponsor: | Dr. Hardam S. Azad | | Occupancy: | 96.0% |
| Interest Rate: | 6.95600% | | Occupancy Date: | 2/6/2024 |
| Note Date: | 2/8/2024 | | 4th Most Recent NOI (As of): | $9,374,773 (12/31/2021) |
| Maturity Date: | 3/6/2034 | | 3rd Most Recent NOI (As of): | $9,383,798 (12/31/2022) |
| Interest-only Period: | 120 months | | 2nd Most Recent NOI (As of): | $10,006,469 (12/31/2023) |
| Original Term: | 120 months | | Most Recent NOI (As of): | $10,115,913 (TTM 1/31/2024) |
| Original Amortization: | None | | UW Economic Occupancy: | 95.8% |
| Amortization Type: | Interest Only | | UW Revenues: | $14,064,058 |
| Call Protection(2): | L(24),D(90),O(6) | | UW Expenses: | $3,471,570 |
| Lockbox / Cash Management: | Hard / Springing | | UW NOI: | $10,592,488 |
| Additional Debt(1): | Yes | | UW NCF: | $10,592,488 |
| Additional Debt Balance(1): | $29,125,000 | | Appraised Value / Per SF: | $146,050,000 / $137 |
| Additional Debt Type(1): | Pari Passu | | Appraisal Date: | 12/12/2023 |
| | | | | |
| Escrows and Reserves(3) | | Financial Information(1) |
| | Initial | Monthly | Initial Cap | | Cut-off Date Loan / SF: | $88 |
| Taxes: | $371,270 | $74,254 | N/A | | Maturity Date Loan / SF: | $88 |
| Insurance: | $90,435 | $30,145 | N/A | | Cut-off Date LTV: | 64.4% |
| General Reserve: | $6,770,048 | Springing | $250,000 | | Maturity Date LTV: | 64.4% |
| TI/LC: | $5,000,000 | Springing | $2,000,000 | | UW NCF DSCR: | 1.60x |
| Outstanding TI/LC Reserve: | $40,000 | $0 | N/A | | UW NOI Debt Yield: | 11.3% |
| | | | | | | |
| Sources and Uses |
| Sources | Proceeds | % of Total | | Uses | Proceeds | % of Total |
| Whole Loan(1) | $94,125,000 | 73.0 | % | | Purchase Price(4) | $115,403,062 | 89.5 | % |
| Sponsor Equity | 34,802,040 | 27.0 | | | Upfront Reserves | 12,271,753 | 9.5 | |
| | | | | Closing Costs | 1,252,225 | 1.0 | |
| Total Sources | $128,927,040 | 100.0 | % | | Total Uses | $128,927,040 | 100.0 | % |
| (1) | The Fayette Pavilion Mortgage Loan (as defined below) is part of a whole loan evidenced by five pari passu promissory notes with an aggregate original principal balance of $94,125,000 (the “Fayette Pavilion Whole Loan”). The financial information in the chart above is based on the aggregate outstanding principal balance of the Fayette Pavilion Whole Loan. |
| (2) | The lockout period will be at least 24 payments beginning with and including the first payment date of April 6, 2024. Defeasance of the Fayette Pavilion Whole Loan is permitted after the date that is the earlier to occur of (i) two years from the closing date of the securitization that includes the last note to be securitized and (ii) February 8, 2027. The assumed lockout of 24 payments is based on the expected BMO 2024-C8 securitization closing date in March 2024. The actual lockout period may be longer. |
| (3) | For a full description of Escrows and Reserves, see “Escrows and Reserves” below. |
| (4) | The contract purchase price is $134.0 million. The purchase price presented in the Sources and Uses is net of various seller credits. |
The Loan. The third largest mortgage loan (the “Fayette Pavilion Mortgage Loan”) is part of a whole loan originated by SMC on February 8, 2024 secured by the borrowers’ fee interest in a 1,063,840 square foot anchored retail property located in Fayetteville, Georgia (the “Fayette Pavilion Property”). The Fayette Pavilion Whole Loan consists of five pari passu notes and accrues interest at a rate of 6.95600% per annum on an Actual/360 basis. The Fayette Pavilion Whole Loan has a 10-year interest-only term. The Fayette Pavilion Mortgage Loan is evidenced by the controlling Note A-1 and the non-controlling Note A-4, which have an aggregate original and outstanding principal balance as of the Cut-off Date of $65,000,000. The remaining notes are currently held by Starwood Mortgage Funding III LLC and are expected to be contributed to one or more future securitization trust(s).
THE INFORMATION IN THIS STRUCTURAL AND COLLATERAL TERM SHEET IS NOT COMPLETE AND MAY BE AMENDED PRIOR TO THE TIME OF SALE. THIS TERM SHEET IS NOT AN OFFER TO SELL THESE SECURITIES AND IT IS NOT A SOLICITATION OF AN OFFER TO BUY THESE SECURITIES IN ANY JURISDICTION WHERE THE OFFER OR SALE IS NOT PERMITTED. |
| | 59 | |
| Structural and Collateral Term Sheet | | BMO 2024-C8 |
| No. 3 – Fayette Pavilion |
The relationship between the holders of the Fayette Pavilion Whole Loan is governed by a co-lender agreement described under “Description of the Mortgage Pool – The Whole Loans – The Serviced Pari Passu Whole Loans” in the Preliminary Prospectus.
The table below identifies the promissory notes that comprise the Fayette Pavilion Whole Loan:
| Whole Loan Summary |
| Note | Original Balance | Cut-off Date Balance | Note Holder | Controlling Piece |
| A-1 | $60,000,000 | $60,000,000 | BMO 2024-C8 | Yes |
| A-2(1) | $14,125,000 | $14,125,000 | Starwood Mortgage Funding III LLC | No |
| A-3(1) | $10,000,000 | $10,000,000 | Starwood Mortgage Funding III LLC | No |
| A-4(1) | $5,000,000 | $5,000,000 | BMO 2024-C8 | No |
| A-5(1) | $5,000,000 | $5,000,000 | Starwood Mortgage Funding III LLC | No |
| Whole Loan | $94,125,000 | $94,125,000 | | |
| (1) | Expected to be contributed to one or more future securitization trust(s). |
The Property. The Fayette Pavilion Property is a 1,063,840 square foot anchored retail center located in Fayetteville, Georgia. The Fayette Pavilion Property was originally constructed in 1995 and 2023 and is anchored by Publix, Kohl’s, Hobby Lobby, Ross Dress for Less and other major tenants. In addition to the collateral tenants, the Fayette Pavilion Property is shadow anchored by non-collateral anchors Walmart, Target and Home Depot, each of which contribute CAM income for the Fayette Pavilion Property. According to property management, Target is in the final stages of completing a comprehensive store renovation at a cost of approximately $6 million, demonstrating a strong commitment to its location at Fayette Pavilion. Similarly, according to property management, Walmart recently expanded its store to include a Walmart Health Center. Notably, the Walmart parcel was recently sold in September 2022 for a purchase price of $24.5 million.
The Fayette Pavilion Property’s grocery-anchor tenant, Publix (5.3% NRA), has over 35 years of tenure at the Fayette Pavilion Property and is an original tenant. Publix signed a 10-year lease extension in December 2021 bringing the tenant’s lease expiration out to December 2031. Publix’s contractual renewal options are for five-year terms, however, Publix opted to renew two of its options simultaneously as part of its recent renewal. In the summer of 2023, according to property management, Publix completed a store refresh at a cost of over $1 million which included upgrades to the refrigeration, the addition of new self-checkout lanes, and improvements to décor and fixtures. Publix’s 2022 sales were $38.9 million or $694 PSF which demonstrates an occupancy cost of 1.7%.
As of February 6, 2024, the Fayette Pavilion Property was 96.0% leased to 67 tenants, 68.2% of which have been at the Fayette Pavilion Property for over five years with 57.1% having been at the Fayette Pavilion Property for over ten years. The Fayette Pavilion Property is the largest and most visited open-air shopping center in Georgia. Consisting of over 106.4 acres, the Fayette Pavilion Property offers various retail tenants that attract over 8.3 million annual visits from a trade area that encompasses a large portion of the southern half of the Atlanta MSA. Developed in phases in 1995 and 2023, the Fayette Pavilion Property is a super-regional, tandem grocery-anchored shopping destination that includes tenant categories that include grocery, service, specialty, discounter, food and beverage, among others.
Major Tenants. The largest tenants based on underwritten base rent are Cinemark Theaters (“Cinemark”), Burlington Coat Factory and At Home.
Cinemark (60,560 square feet; 5.7% of NRA; 8.2% of underwritten base rent). Cinemark is an American movie theater chain with more than 300 theaters in 42 states. Cinemark has operated at the Fayette Pavilion Property since 1998, most recently renewed its lease in October 2018 through December 2025 and has four five-year lease renewal options remaining. Cinemark has no termination options. Cinemark operates 17 screens and its sales per screen as of its fiscal year 2022 were equal to $399,004.
Burlington Coat Factory (49,000 square feet; 4.6% of NRA; 5.2% of underwritten base rent). Burlington Coat Factory is an American department store chain with nearly 1,000 stores across 46 states and Puerto Rico. Burlington Coat Factory has been at the Fayette Pavilion Property since 2019, has a current lease expiration date in February 2030 and has four five-year renewal options remaining. Burlington Coat Factory has no termination options.
At Home (78,284 square feet; 7.4% of NRA; 5.1% of underwritten base rent). At Home is an American big-box chain of home furnishing stores. At Home operates over 250 stores in 40 states across the U.S. At Home has been at the Fayette
THE INFORMATION IN THIS STRUCTURAL AND COLLATERAL TERM SHEET IS NOT COMPLETE AND MAY BE AMENDED PRIOR TO THE TIME OF SALE. THIS TERM SHEET IS NOT AN OFFER TO SELL THESE SECURITIES AND IT IS NOT A SOLICITATION OF AN OFFER TO BUY THESE SECURITIES IN ANY JURISDICTION WHERE THE OFFER OR SALE IS NOT PERMITTED. |
| | 60 | |
| Structural and Collateral Term Sheet | | BMO 2024-C8 |
| No. 3 – Fayette Pavilion |
Pavilion Property since 2022, has a current lease expiration date in February 2033 and has two five-year lease renewal options remaining. At Home has no termination options.
Appraisal. According to the appraisal, the Fayette Pavilion Property had an “as-is” appraised value of $146,050,000 as of December 12, 2023. The table below shows the appraisal’s “as-is” conclusions.
| Appraisal Valuation Summary(1) |
| Appraisal Approach | Appraised Value | Capitalization Rate(2) |
| Income Capitalization Approach | $146,050,000 | 7.25% |
| (2) | The appraisal used a discounted cash flow approach to arrive at the appraised value. The capitalization rates shown above represent the overall capitalization rate. |
Environmental. According to the Phase I environmental assessment dated December 22, 2023, there was no evidence of any recognized environmental conditions at the Fayette Pavilion Property.
The following table presents certain information relating to the historical and current occupancy at the Fayette Pavilion Property:
| Historical and Current Occupancy(1) |
| 2020 | 2021 | 2022 | Current(2) |
| 88.8% | 92.5% | 95.9% | 96.0% |
| (1) | Historical occupancy is as of December 1 of each respective year. |
| (2) | Current Occupancy is based on the underwritten rent roll dated February 6, 2024. |
THE INFORMATION IN THIS STRUCTURAL AND COLLATERAL TERM SHEET IS NOT COMPLETE AND MAY BE AMENDED PRIOR TO THE TIME OF SALE. THIS TERM SHEET IS NOT AN OFFER TO SELL THESE SECURITIES AND IT IS NOT A SOLICITATION OF AN OFFER TO BUY THESE SECURITIES IN ANY JURISDICTION WHERE THE OFFER OR SALE IS NOT PERMITTED. |
| | 61 | |
| Structural and Collateral Term Sheet | | BMO 2024-C8 |
| No. 3 – Fayette Pavilion |
The following table presents certain information relating to the major tenants (of which, certain tenants may have co-tenancy provisions) at the Fayette Pavilion Property:
| Top Ten Tenant Summary(1) |
| Tenant | Ratings
Moody’s/S&P/Fitch(2) | Net Rentable Area (SF) | % of
Total NRA | UW Base Rent PSF | UW Base Rent | % of Total
UW Base Rent | Sales PSF | Occ. Costs | Lease
Exp. Date |
| Cinemark(3)(4) | NR / BB- / NR | 60,560 | 5.7 | % | $15.25 | $923,540 | 8.2 | % | $112 | 15.5% | 12/31/2025 |
| Burlington Coat Factory(5)(6) | NR / BB+ / NR | 49,000 | 4.6 | | $12.00 | 588,000 | 5.2 | | $138 | 9.8% | 2/28/2030 |
| At Home(7) | C / CCC / NR | 78,284 | 7.4 | | $7.41 | 580,000 | 5.1 | | NAV | NAV | 2/28/2033 |
| Publix(8)(9) | NR / NR / NR | 56,146 | 5.3 | | $8.65 | 485,663 | 4.3 | | $694 | 1.7% | 12/1/2031 |
| Belk(10)(11) | NR / CCC- / NR | 65,927 | 6.2 | | $7.30 | 481,267 | 4.3 | | $86 | 11.1% | 2/15/2025 |
| Kohl’s(12)(13) | Ba3 / BB / BBB- | 86,584 | 8.1 | | $5.47 | 473,614 | 4.2 | | NAV | NAV | 1/31/2027 |
| Hobby Lobby(14)(15) | NR / NR / NR | 57,000 | 5.4 | | $7.50 | 427,500 | 3.8 | | $117 | 7.6% | 2/28/2026 |
| Ross Dress for Less(16) | A2 / BBB+ / NR | 32,587 | 3.1 | | $12.00 | 391,044 | 3.5 | | NAV | NAV | 1/31/2027 |
| Petsmart(17)(18) | B3 / B+ / NR | 25,416 | 2.4 | | $13.66 | 347,183 | 3.1 | | $324 | 4.8% | 1/31/2026 |
| Marshalls(19)(20) | A2 / A / NR | 30,090 | 2.8 | | $11.25 | 338,513 | 3.0 | | $342 | 4.2% | 1/31/2029 |
| Top Ten Tenants | 541,594 | 50.9 | % | $9.30 | $5,036,324 | 44.6 | % | | | |
| | | | | | | | | | |
| Non Top Ten Tenants | 480,021 | 45.1 | | $13.01 | 6,247,450 | 55.4 | | | | |
| | | | | | | | | | |
| Occupied Collateral Total / Wtd. Avg. | 1,021,615 | 96.0 | % | $11.05 | $11,283,773 | 100.0 | % | | | |
| | | | | | | | | | |
| Vacant Space | 42,225 | 4.0 | | | | | | | |
| | | | | | | | | | |
| Collateral Total | 1,063,840 | 100.0 | % | | | | | | |
| | | | | | | | | |
| (1) | Based on the underwritten rent roll dated February 6, 2024 with rent steps totaling $93,676 through November 2024 and rent averaging for investment grade tenants totaling $18,165. |
| (2) | Ratings provided are for the parent company of the entity listed in the “Tenant” field whether or not the parent company guarantees the lease. |
| (3) | Cinemark has four five-year lease renewal options remaining. |
| (4) | Cinemark Sales PSF and Occ. Costs represent FY 2022. Sales per screen is equal to $399,004. |
| (5) | Burlington Coat Factory has four five-year lease renewal options remaining. |
| (6) | Burlington Coat Factory Sales PSF and Occ. Costs represent FY 2022. |
| (7) | At Home has two five-year lease renewal options remaining. |
| (8) | Publix has three five-year lease renewal options remaining. |
| (9) | Publix Sales PSF and Occ. Costs represent FY 2022. |
| (10) | Belk has two five-year lease renewal options remaining. |
| (11) | Belk Sales PSF and Occ. Costs represent the trailing 12 months ending January 2023. |
| (12) | Kohl’s operates under a ground lease. |
| (13) | Kohl’s has seven five-year lease renewal options remaining. |
| (14) | Hobby Lobby has two five-year lease renewal options remaining. |
| (15) | Hobby Lobby Sales PSF and Occ. Costs represent the trailing 12 months ending February 2023. |
| (16) | Ross Dress for Less has one five-year lease renewal option remaining. |
| (17) | Petsmart has three five-year lease renewal options remaining. |
| (18) | Petsmart Sales PSF and Occ. Costs represent the trailing 12 months ending January 2023. |
| (19) | Marshalls has two five-year lease renewal options remaining. |
| (20) | Marshalls Sales PSF and Occ. Costs represent FY 2022. |
THE INFORMATION IN THIS STRUCTURAL AND COLLATERAL TERM SHEET IS NOT COMPLETE AND MAY BE AMENDED PRIOR TO THE TIME OF SALE. THIS TERM SHEET IS NOT AN OFFER TO SELL THESE SECURITIES AND IT IS NOT A SOLICITATION OF AN OFFER TO BUY THESE SECURITIES IN ANY JURISDICTION WHERE THE OFFER OR SALE IS NOT PERMITTED. |
| | 62 | |
| Structural and Collateral Term Sheet | | BMO 2024-C8 |
| No. 3 – Fayette Pavilion |
The following table presents certain information relating to the lease rollover schedule at the Fayette Pavilion Property:
| Lease Rollover Schedule(1)(2) |
| Year | Number of Leases Expiring | Net Rentable Area Expiring | % of NRA Expiring | UW Base Rent Expiring | % of UW Base Rent Expiring | Cumulative Net Rentable Area Expiring | Cumulative % of NRA Expiring | Cumulative UW Base Rent Expiring | Cumulative % of UW Base Rent Expiring |
| Vacant | NAP | 42,225 | 4.0 | % | NAP | NA | P | 42,225 | 4.0% | NAP | NAP |
| 2024 & MTM | 5 | 15,460 | 1.5 | | $326,000 | 2.9 | % | 57,685 | 5.4% | $326,000 | 2.9% |
| 2025 | 7 | 159,462 | 15.0 | | 2,012,796 | 17.8 | | 217,147 | 20.4% | $2,338,795 | 20.7% |
| 2026 | 6 | 107,877 | 10.1 | | 1,246,215 | 11.0 | | 325,024 | 30.6% | $3,585,010 | 31.8% |
| 2027 | 15 | 212,293 | 20.0 | | 2,074,094 | 18.4 | | 537,317 | 50.5% | $5,659,104 | 50.2% |
| 2028 | 9 | 129,407 | 12.2 | | 1,194,993 | 10.6 | | 666,724 | 62.7% | $6,854,097 | 60.7% |
| 2029 | 5 | 72,790 | 6.8 | | 857,487 | 7.6 | | 739,514 | 69.5% | $7,711,583 | 68.3% |
| 2030 | 2 | 61,000 | 5.7 | | 719,700 | 6.4 | | 800,514 | 75.2% | $8,431,283 | 74.7% |
| 2031 | 5 | 115,236 | 10.8 | | 1,129,647 | 10.0 | | 915,750 | 86.1% | $9,560,930 | 84.7% |
| 2032 | 8 | 27,952 | 2.6 | | 564,557 | 5.0 | | 943,702 | 88.7% | $10,125,487 | 89.7% |
| 2033 | 5 | 120,138 | 11.3 | | 1,158,286 | 10.3 | | 1,063,840 | 100.0% | $11,283,773 | 100.0% |
| 2034 | 0 | 0 | 0.0 | | 0 | 0.0 | | 1,063,840 | 100.0% | $11,283,773 | 100.0% |
| 2035 & Beyond | 0 | 0 | 0.0 | | 0 | 0.0 | | 1,063,840 | 100.0% | $11,283,773 | 100.0% |
| Total | 67 | 1,063,840 | 100.0 | % | $11,283,773 | 100.0 | % | | | | |
| (1) | Based on the underwritten rent roll dated February 6, 2024 with rent steps totaling $93,676 through November 2024 and rent averaging for investment-grade tenants totaling $18,165. |
| (2) | Certain tenants may have lease termination options that are exercisable prior to the originally stated expiration date of the subject lease and that are not considered in the Lease Rollover Schedule. |
The Market. The Fayette Pavilion Property is located in Fayetteville, Georgia. The Fayette Pavilion Property is situated approximately 22 miles south of the Atlanta central business district and approximately 11 miles south of Hartsfield-Jackson International Airport. According to the appraisal, the Fayette Pavilion Property is located in the Fayette/Peachtree retail submarket within the Atlanta retail market. According to the appraisal, the Atlanta retail market has a vacancy rate of approximately 3.5% and quoted rental rates of $21.70 per square foot as of the third quarter of 2023. Additionally, according to the appraisal, the Fayette/Peachtree retail submarket has a vacancy rate of approximately 3.2% and average asking rents of $20.11 per square foot as of the third quarter of 2023. Within a one-, three- and five-mile radius of the Fayette Pavilion Property, the estimated 2023 population is 1,384, 31,016 and 102,940, respectively. Within the same radii, the estimated 2023 average annual household income is $95,402, $87,598 and $90,846, respectively.
THE INFORMATION IN THIS STRUCTURAL AND COLLATERAL TERM SHEET IS NOT COMPLETE AND MAY BE AMENDED PRIOR TO THE TIME OF SALE. THIS TERM SHEET IS NOT AN OFFER TO SELL THESE SECURITIES AND IT IS NOT A SOLICITATION OF AN OFFER TO BUY THESE SECURITIES IN ANY JURISDICTION WHERE THE OFFER OR SALE IS NOT PERMITTED. |
| | 63 | |
| Structural and Collateral Term Sheet | | BMO 2024-C8 |
| No. 3 – Fayette Pavilion |
The following table presents certain information relating to comparable shop space leases for the Fayette Pavilion Property:
| Comparable Leases Summary |
| Property Name/Location | Year Built | Occ. % | Total NRA (SF) | Distance from Subject | Tenant Name | Lease Date/Term (Mos.) | Lease Area (SF) | Annual Base Rent PSF | Lease Type |
Fayette Pavilion 72 Pavilion Parkway Fayetteville, GA | 1995, 2023 | 96.0% | 1,063,840 | - | - | - | - | $17.89 | NNN |
Banks Crossing 100 Banks Road Fayetteville, GA | 1988 | 95% | 256,701 | 1.2 miles | Asking | Dec. 2023 / 60 | 4,000 | $23.00 | NNN |
Lake Ridge Village 1270 Highway 138 Southwest Riverdale, GA | 2005 | 100% | 7,500 | 6.3 miles | Asking | Dec. 2023 / 60 | 5,000 | $19.50 | NNN |
Single Tenant Retail Building 1297 Mount Zion Road Morrow, GA | 1978 | 50% | 5,720 | 12.4 miles | For Eyes | Dec. 2022 / 36 | 3,750 | $16.50 | NNN |
Locust Grove Village 4914-4960 Bill Gardner Parkway Locust Grove, GA | 2002 | 100% | 15,600 | 27.6 miles | Indigo Soul Yoga Studio | Oct. 2022 / 61 | 1,400 | $15.85 | NNN |
Marketplace at Locust Grove II 4955 Bill Gardner Parkway Locust Grove, GA | 2021 | 100% | 12,647 | 27.6 miles | Planet Smoothie | May 2022 / 60 | 1,260 | $22.00 | NNN |
Togwotee Village 1240 Highway 54 West Peachtree City, GA | 2008 | 82% | 108,735 | 12.4 miles | Asking PT Solutions Erika Ward Interiors | Dec. 2023 / 60 Feb. 2020 / 36 Jan. 2020 / 36 | 3,728 2,213 1,509 | $21.00 $18.00 $20.50 | NNN NNN NNN |
Source: Appraisal, except for the Fayette Pavilion Property, which is based on the underwritten rent roll dated February 6, 2024.
The following table presents certain information relating to comparable anchor and junior anchor leases for the Fayette Pavilion Property:
| Comparable Leases Summary |
| Property Name/Location | Year Built | Occ. % | Total NRA (SF) | Distance from Subject | Tenant Name | Lease Date/Term (Mos.) | Lease Area (SF) | Annual Base Rent PSF | Lease Type |
Fayette Pavilion 72 Pavilion Parkway Fayetteville, GA | 1995, 2023 | 96.0% | 1,063,840 | - | - | - | - | $8.94 | NNN |
Pacifica Doraville Asian Square 5150 Buford Highway Doraville, GA | 1992 | 85% | 37,252 | 39.7 miles | KOI KEE LLC (dba Loi Kee) | Apr. 2024 / 120 | 12,752 | $10.00 | NNN |
LA Fitness – McDonough, GA 95 Foster Drive McDonough, GA | 2007 | 100% | 45,000 | 16.4 miles | LA Fitness | Aug. 2023 / 120 | 45,000 | $17.78 | Absolute Net |
Summerlin Corners 1757 Newnan Crossings Boulevard Newnan, GA | 2022 | 100% | 16,000 | 22.7 miles | Dollar Tree | Oct. 2022 / 120 | 10,000 | $14.00 | NNN |
6000 Medlock Bridge Parkway 6000 Medlock Bridge Parkway Johns Creek, GA | 1993 | 100% | 113,112 | 47.1 miles | No Longer Bound | Sep. 2022 / 120 | 17,648 | $13.00 | NNN |
Proposed Publix Anchored Shopping Center 10227 Alcovy Crossing Drive Covington, GA | 2022 | 98% | 62,787 | 46.6 miles | Publix | Aug. 2022 / 240 | 48,387 | $14.00 | NNN |
Piedmont Village 2800 Canton Road Marietta, GA | 1989 | 100% | 116,428 | 42.6 miles | Sports Collectibles | Jan. 2022 / 60 | 10,000 | $10.00 | NNN |
Source: Appraisal, except for the Fayette Pavilion Property which is based on the underwritten rent roll dated February 6, 2024.
THE INFORMATION IN THIS STRUCTURAL AND COLLATERAL TERM SHEET IS NOT COMPLETE AND MAY BE AMENDED PRIOR TO THE TIME OF SALE. THIS TERM SHEET IS NOT AN OFFER TO SELL THESE SECURITIES AND IT IS NOT A SOLICITATION OF AN OFFER TO BUY THESE SECURITIES IN ANY JURISDICTION WHERE THE OFFER OR SALE IS NOT PERMITTED. |
| | 64 | |
| Structural and Collateral Term Sheet | | BMO 2024-C8 |
| No. 3 – Fayette Pavilion |
The following table presents certain information relating to the operating history and underwritten cash flows at the Fayette Pavilion Property:
| Operating History and Underwritten Net Cash Flow |
| | 2021 | 2022 | 2023 | TTM(1) | Underwritten | Per SF | %(2) | |
| Rents In Place | $10,554,246 | $10,594,506 | $10,996,716 | $11,075,742 | $11,171,933 | $10.50 | 77.0 | % |
| Rent Steps(3) | 0 | 0 | 0 | 0 | 111,840 | 0.11 | 0.8 | |
| Vacant Income | 0 | 0 | 0 | 0 | 607,785 | 0.57 | 4.2 | |
| Reimbursements | 1,975,284 | 1,872,124 | 2,268,319 | 2,238,588 | 2,608,207 | 2.45 | 18.0 | |
| Net Rental Income | $12,529,531 | $12,466,631 | $13,265,036 | $13,314,330 | $14,499,765 | $13.63 | 100.0 | % |
| (Vacancy/Credit Loss) | 0 | 0 | 0 | 0 | (607,785) | (0.57) | (4.2 | ) |
| Other Income(4) | 226,137 | 261,067 | 170,078 | 172,078 | 172,078 | 0.16 | 1.2 | |
| Effective Gross Income | $12,755,668 | $12,727,697 | $13,435,114 | $13,486,408 | $14,064,058 | $13.22 | 97.0 | % |
| | | | | | | | |
| Total Expenses | $3,380,894 | $3,343,899 | $3,428,645 | $3,370,495 | $3,471,570 | $3.26 | 24.7 | % |
| | | | | | | | |
| Net Operating Income | $9,374,773 | $9,383,798 | $10,006,469 | $10,115,913 | $10,592,488 | $9.96 | 75.3 | % |
| | | | | | | | |
| Total TI/LC, Capex/RR | 0 | 0 | 0 | 0 | 0 | 0.00 | 0.0 | |
| | | | | | | | |
| Net Cash Flow | $9,374,773 | $9,383,798 | $10,006,469 | $10,115,913 | $10,592,488 | $9.96 | 75.3 | % |
| (1) | TTM represents the trailing 12-month period ending January 31, 2024. |
| (2) | % column represents percentage of Net Rental Income for all revenue lines and represents percentage of Effective Gross Income for the remaining fields. |
| (3) | Underwritten Rent Steps totaling $93,676 through November 2024 and rent averaging for investment grade tenants totaling $18,165. |
| (4) | Other Income includes percentage rent, signage rent, late fees and storage income. |
The Borrowers. The borrowers are Fayette Pavilion LLC and Miles Fayette LLC, as tenants-in-common with respect to the Fayette Pavilion Whole Loan. Each borrower is a Delaware limited liability company and special purpose entity with two independent directors. Legal counsel to the borrowers delivered a non-consolidation opinion in connection with the origination of the Fayette Pavilion Whole Loan.
The Borrower Sponsor. The borrower sponsor and guarantor is Dr. Hardam S. Azad, while Kathleen D. Miles is an additional non-recourse carveout guarantor whose liability is limited to the Miles Fayette LLC borrowing entity and affiliates. Dr. Azad has extensive real estate experience and is the founder and president of 5 Rivers CRE, LLC, which currently owns and operates 23 retail properties containing over four million square feet of retail space. 5 Rivers CRE, LLC manages properties in Louisiana, Mississippi, Tennessee, Alabama, Georgia, North Carolina and Oklahoma.
Property Management. The Fayette Pavilion Property is managed by 5 Rivers CRE, LLC, an affiliate of the borrowers.
Escrows and Reserves. At origination, the borrowers deposited into escrow approximately $371,270 for real estate taxes, approximately $90,435 for insurance premiums, $6,770,048 for general use including tenant improvements, leasing commissions and capital expenditures, $5,000,000 for general tenant improvements and leasing commissions and $40,000 for an outstanding TI/LC reserve related to Majestic Nails.
Tax Escrows – On a monthly basis, the borrowers are required to escrow 1/12th of the annual estimated tax payments, which currently equates to $74,254.
Insurance Escrows – On a monthly basis, the borrowers are required to escrow 1/12th of the annual estimated insurance payments, which currently equates to approximately $30,145.
General Reserve – On a monthly basis, the borrowers are required to escrow $17,731 for replacement reserves or approved leasing costs, subject to a cap of $250,000. The ongoing general reserve is currently suspended and is required to be replenished when the reserve account falls below the cap.
TI/LC Reserves – On a monthly basis, the borrowers are required to escrow $53,192 for tenant improvement and leasing commission reserves subject to a cap of $2,000,000. The ongoing TI/LC reserve is currently suspended and is required to be replenished when the reserve account falls below the cap.
THE INFORMATION IN THIS STRUCTURAL AND COLLATERAL TERM SHEET IS NOT COMPLETE AND MAY BE AMENDED PRIOR TO THE TIME OF SALE. THIS TERM SHEET IS NOT AN OFFER TO SELL THESE SECURITIES AND IT IS NOT A SOLICITATION OF AN OFFER TO BUY THESE SECURITIES IN ANY JURISDICTION WHERE THE OFFER OR SALE IS NOT PERMITTED. |
| | 65 | |
| Structural and Collateral Term Sheet | | BMO 2024-C8 |
| No. 3 – Fayette Pavilion |
Lockbox / Cash Management. The Fayette Pavilion Whole Loan is structured with a hard lockbox and springing cash management. The borrowers are required to cause all rents to be deposited by tenants (pursuant to tenant direction letters) and credit card companies with which the borrowers and/or property manager have agreements (pursuant to credit card direction letters) directly into the lockbox account. Upon the occurrence and during the continuance of a Sweep Event Period (as defined below), all funds in the lockbox account are required to be swept daily to a cash management account under the control of the lender to be applied and disbursed in accordance with Fayette Pavilion Whole Loan documents and all excess cash flow funds remaining in the cash management account after the application of such funds in accordance with the Fayette Pavilion Whole Loan documents are required to be held by the lender in an excess cash flow reserve account as additional collateral for Fayette Pavilion Whole Loan. To the extent that no Sweep Event Period is continuing, all excess cash flow funds are required to be disbursed to the borrower.
A “Sweep Event Period” will commence upon the earliest of the following: (i) the occurrence of an event of default under the Fayette Pavilion Whole Loan documents; (ii) the date on which the debt service coverage ratio (based on (x) the then current rent roll (annualized) and (y) the trailing 12-month expense reimbursements and operating expenses based on the trailing 12 calendar months) is less than 1.15x; or (iii) the occurrence of a Major Tenant Trigger Event Period (as defined below).
A Sweep Event Period will end: (a) with regard to clause (i), upon the cure of such event of default and the lender’s acceptance of such cure in its sole and absolute discretion; (b) with regard to clause (ii), upon the debt service coverage ratio (based on (x) the then current rent roll (annualized) and (y) the trailing 12-month expense reimbursements and operating expenses based on the trailing 12 calendar months) being at least 1.20x for at least two consecutive calendar quarters; and (c) with regard to clause (iii), the Major Tenant Trigger Event Period is cured in accordance with the Fayette Pavilion Whole Loan documents.
A “Major Tenant Trigger Event Period” will commence upon the date on which any of the following applies to two or more Major Tenants and/or Major Shadow Anchor (both as defined below): (i) a Major Tenant fails to renew or extend the term of its lease, on terms and conditions reasonably acceptable to the lender and in accordance with the terms of the Fayette Pavilion Whole Loan documents including, without limitation, for a term of no less than five years (or as otherwise approved by the lender), on or prior to the date that is six months prior to lease expiration, (ii) a default by such Major Tenant occurs (beyond any applicable notice and cure period) under its lease, (iii) a Major Tenant and/or Major Shadow Anchor goes dark, vacates or otherwise fails to occupy or otherwise ceases operations at its space, or fails to be open for business at the Fayette Pavilion Property during customary hours, or gives notice of its intent to commence any of the foregoing, including without limitation any announcement of a store closure with respect to its premises, (iv) a Major Tenant and/or Major Shadow Anchor files, as a debtor, a bankruptcy or similar insolvency proceeding, or otherwise becomes involved, as a debtor, in a bankruptcy or any similar insolvency proceeding, (v) a Major Tenant sublets any portion of its leased space or (vi) a Major Tenant terminates its lease or gives notice of its intent to terminate its lease.
A Major Tenant Trigger Event Period will terminate: (a) with regard to clause (i), if the related Major Tenant has extended its lease for at least five years and on terms acceptable to the lender, and the lender has received an estoppel certificate confirming that all tenant improvements and leasing commissions have been paid ; (b) with regard to clause (ii), upon the related Major Tenant curing such default; (c) with regard to clause (iii), upon the related Major Tenant and/or Major Shadow Anchor rescinding such notice and/or resuming its customary business operations at its leased space for at least four consecutive calendar months; (d) with regard to clause (iv), when the lease for the related Major Tenant is assumed or affirmed in such proceeding and the related Major Tenant and/or Major Shadow Anchor, among other things, is discharged from bankruptcy such that no proceedings are ongoing; and (e) with regard to clause (v), the related Major Tenant is no longer subletting its space. A Major Tenant Trigger Event Period will also terminate in the event that a Major Tenant Re-Tenanting Event (as defined below) or a Major Shadow Anchor Re-Tenanting Event, as applicable, has occurred.
A "Major Tenant Re-Tenanting Event" means that: (i) the related Major Tenant space is leased pursuant to a replacement lease (or leases) for a term of at least five years and on terms acceptable to the lender for the related space; (ii) that each such Major Tenant is in occupancy of its premises, open for business and is paying full unabated rent; and (iii) that all tenant improvement costs and leasing commissions provided in each such replacement lease have been paid, and the lender has received a reasonably satisfactory estoppel certificate from each such replacement tenant affirming the foregoing and that such replacement tenant is not a debtor in any bankruptcy or other insolvency proceeding.
THE INFORMATION IN THIS STRUCTURAL AND COLLATERAL TERM SHEET IS NOT COMPLETE AND MAY BE AMENDED PRIOR TO THE TIME OF SALE. THIS TERM SHEET IS NOT AN OFFER TO SELL THESE SECURITIES AND IT IS NOT A SOLICITATION OF AN OFFER TO BUY THESE SECURITIES IN ANY JURISDICTION WHERE THE OFFER OR SALE IS NOT PERMITTED. |
| | 66 | |
| Structural and Collateral Term Sheet | | BMO 2024-C8 |
| No. 3 – Fayette Pavilion |
A “Major Tenant” means individually and collectively as the context may require, Kohl’s, Publix, Marshalls, their respective successors and assigns, and any replacement tenant or occupant for any portion of space at the Fayette Pavilion Property currently leased to the foregoing tenants.
A "Major Shadow Anchor Re-Tenanting Event" means that: that the lender has received satisfactory evidence that that the replacement occupant of the Major Shadow Anchor space satisfies all co-tenancy requirements of any lease relating to such Major Shadow Anchor, such evidence to include, without limitation, estoppel certificates or other written evidence, reasonably satisfactory to the lender, from such tenants with co-tenancy requirements at the Fayette Pavilion Property.
A “Major Shadow Anchor” means Walmart, its successors and assigns, and any replacement tenant that enters into a lease for the related Major Shadow Anchor space.
Subordinate and Mezzanine Debt. Not permitted.
Partial Release. Not permitted.
Ground Lease. None.
THE INFORMATION IN THIS STRUCTURAL AND COLLATERAL TERM SHEET IS NOT COMPLETE AND MAY BE AMENDED PRIOR TO THE TIME OF SALE. THIS TERM SHEET IS NOT AN OFFER TO SELL THESE SECURITIES AND IT IS NOT A SOLICITATION OF AN OFFER TO BUY THESE SECURITIES IN ANY JURISDICTION WHERE THE OFFER OR SALE IS NOT PERMITTED. |
| | 67 | |
| Structural and Collateral Term Sheet | | BMO 2024-C8 |
| No. 4 – Tekni-Plex Industrial Portfolio |
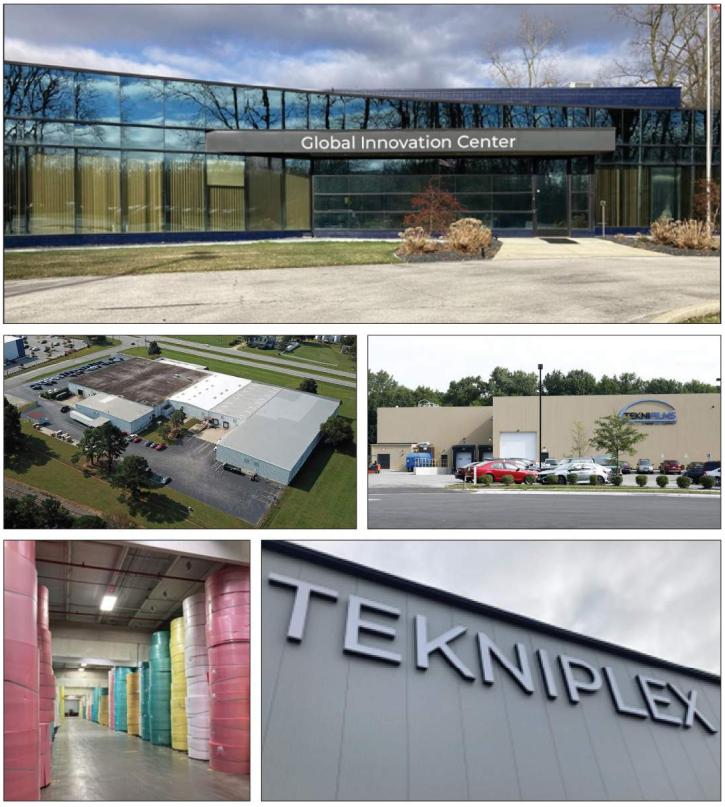
THE INFORMATION IN THIS STRUCTURAL AND COLLATERAL TERM SHEET IS NOT COMPLETE AND MAY BE AMENDED PRIOR TO THE TIME OF SALE. THIS TERM SHEET IS NOT AN OFFER TO SELL THESE SECURITIES AND IT IS NOT A SOLICITATION OF AN OFFER TO BUY THESE SECURITIES IN ANY JURISDICTION WHERE THE OFFER OR SALE IS NOT PERMITTED. |
| | 68 | |
| Structural and Collateral Term Sheet | | BMO 2024-C8 |
| No. 4 – Tekni-Plex Industrial Portfolio |
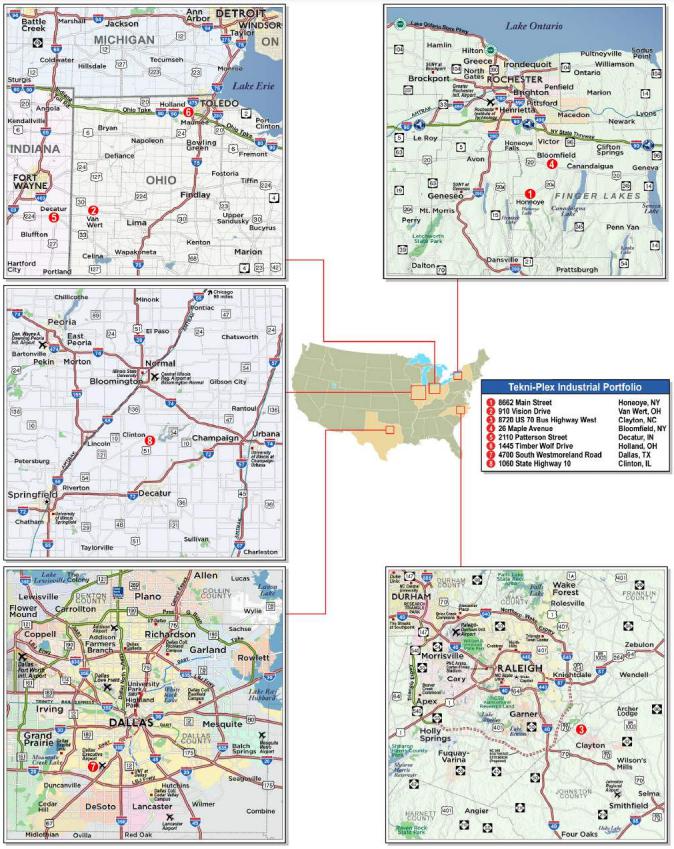
THE INFORMATION IN THIS STRUCTURAL AND COLLATERAL TERM SHEET IS NOT COMPLETE AND MAY BE AMENDED PRIOR TO THE TIME OF SALE. THIS TERM SHEET IS NOT AN OFFER TO SELL THESE SECURITIES AND IT IS NOT A SOLICITATION OF AN OFFER TO BUY THESE SECURITIES IN ANY JURISDICTION WHERE THE OFFER OR SALE IS NOT PERMITTED. |
| | 69 | |
| Structural and Collateral Term Sheet | | BMO 2024-C8 |
| No. 4 – Tekni-Plex Industrial Portfolio |
| Mortgage Loan Information | | Property Information |
| Mortgage Loan Seller: | GACC | | Single Asset / Portfolio: | Portfolio |
| Original Principal Balance: | $58,410,000 | | Title: | Fee |
| Cut-off Date Principal Balance: | $58,410,000 | | Property Type – Subtype(4): | Industrial – Various |
| % of IPB: | 8.5% | | Net Rentable Area (SF): | 1,138,969 |
| Loan Purpose(1): | Acquisition | | Location(4): | Various |
| Borrower: | Eggpack Property LLC | | Year Built / Renovated(4): | Various |
| Borrower Sponsor: | U.S. Realty Advisors, LLC | | Occupancy: | 100.0% |
| Interest Rate: | 6.75000% | | Occupancy Date: | 1/24/2024 |
| Note Date: | 1/24/2024 | | 4th Most Recent NOI (As of)(5): | NAV |
| Maturity Date: | 2/6/2034 | | 3rd Most Recent NOI (As of)(5): | NAV |
| Interest-only Period: | 120 months | | 2nd Most Recent NOI (As of)(5): | NAV |
| Original Term: | 120 months | | Most Recent NOI (As of)(5): | NAV |
| Original Amortization Term: | None | | UW Economic Occupancy: | 95.0% |
| Amortization Type: | Interest Only | | UW Revenues: | $8,692,458 |
| Call Protection: | L(11),YM1(14),DorYM1(88),O(7) | | UW Expenses: | $260,774 |
| Lockbox / Cash Management: | Hard / Springing | | UW NOI: | $8,431,684 |
| Additional Debt: | No | | UW NCF: | $8,260,839 |
| Additional Debt Balance: | N/A | | Appraised Value / Per SF(6): | $105,000,000 / $92 |
| Additional Debt Type: | N/A | | Appraisal Date(6): | 12/22/2023 |
| | | | | |
| Escrows and Reserves(2) | | Financial Information |
| | Initial | Monthly | Initial Cap | | Cut-off Date Loan / SF: | $51 | |
| Taxes: | $0 | Springing | N/A | | Maturity Date Loan / SF: | $51 | |
| Insurance: | $0 | Springing | N/A | | Cut-off Date LTV(6): | 55.6% | |
| Replacement Reserves: | $0 | Springing | $512,536 | | Maturity Date LTV(6): | 55.6% | |
| TI/LC: | $0 | Springing | $3,416,907 | | UW NCF DSCR: | 2.07x | |
| Other(3): | $3,750,784 | $0 | N/A | | UW NOI Debt Yield: | 14.4% | |
| | | | | | | |
| Sources and Uses |
| Sources | Proceeds | % of Total | | Uses | Proceeds | % of Total |
| Mortgage Loan Amount | $58,410,000 | 68.9 | % | | Purchase Price(7) | $79,486,404 | 93.7 | % |
| Borrower Sponsor Equity | 26,395,701 | 31.1 | | | Reserves | 3,750,784 | 4.4 | |
| | | | | Closing Costs | 1,568,513 | 1.9 | |
| Total Sources | $84,805,701 | 100.0 | % | | Total Uses | $84,805,701 | 100.0 | % |
| | (1) | The borrower executed a sale leaseback transaction on the origination date to acquire the Tekni-Plex Industrial Portfolio Properties (as defined below). The loan proceeds were used to acquire the Tekni-Plex Industrial Portfolio Properties, other than the 910 Vision Drive mortgaged property, which was acquired in April 2023. |
| (2) | See “Escrows and Reserves” below for further discussion of reserve information. |
| (3) | Other reserves consist of an upfront reserve that was deposited by the borrower into escrow with an escrow agent for the completion of the improvements at the 910 Vision Drive mortgaged property, to be disbursed pursuant to the terms and conditions of an escrow agreement among Tekni-Plex, Inc., the borrower, the lender and the escrow agent, as described below. The improvements are still under construction and, as of the general contractor’s report dated January 11, 2024, the building shell for the 910 Vision Drive mortgaged property was generally complete. Remaining work included installation of equipment and completing interior finishes. |
| (4) | See “The Properties” below for more information. |
| (5) | Historical financial information is not available because the Tekni-Plex Industrial Portfolio Properties were acquired by the borrower in a sale leaseback transaction on the origination date, except for the 910 Vision Drive mortgaged property, which was acquired in April 2023. |
| (6) | The appraised value represents the “As Portfolio” appraised value, which assumes a 1.25% portfolio premium is applied to the aggregate sum of the individual appraised values. The individual appraisal valuation dates are between December 18, 2023, and December 22, 2023. The aggregate of the “as is” appraised values of the Tekni-Plex Industrial Portfolio Properties is $103,700,000 which results in a Cut-off Date LTV and Maturity Date LTV of 56.3% |
| (7) | Purchase Price reflects the combined purchase price of all of the Tekni-Plex Industrial Portfolio Properties, including the 910 Vision Drive mortgaged property. The Tekni-Plex Industrial Portfolio Properties were acquired on the origination date, other than the 910 Vision Drive mortgaged property, which was acquired in April 2023. |
The Loan. The fourth largest mortgage loan (the “Tekni-Plex Industrial Portfolio Mortgage Loan”) is evidenced by a single promissory note in the original principal amount of $58,410,000 and secured by the borrower’s fee interests in eight industrial, manufacturing, and warehouse properties leased to Tekni-Plex, Inc. (the “Tekni-Plex Industrial Portfolio Properties”). The Tekni-Plex Industrial Portfolio Mortgage Loan was originated on January 24, 2024, by DBR Investments Co. Limited and accrues interest at a fixed rate of 6.75000% per annum. The Tekni-Plex Industrial Portfolio Mortgage Loan had an original term of 120 months and is interest only for the entire term. The scheduled maturity date of the Tekni-Plex Industrial Portfolio Mortgage Loan is the payment date in February 2034. The Tekni-Plex Industrial Portfolio Mortgage Loan
THE INFORMATION IN THIS STRUCTURAL AND COLLATERAL TERM SHEET IS NOT COMPLETE AND MAY BE AMENDED PRIOR TO THE TIME OF SALE. THIS TERM SHEET IS NOT AN OFFER TO SELL THESE SECURITIES AND IT IS NOT A SOLICITATION OF AN OFFER TO BUY THESE SECURITIES IN ANY JURISDICTION WHERE THE OFFER OR SALE IS NOT PERMITTED. |
| | 70 | |
| Structural and Collateral Term Sheet | | BMO 2024-C8 |
| No. 4 – Tekni-Plex Industrial Portfolio |
proceeds, along with approximately $26.4 million of equity contributed by the borrower sponsor, were used to acquire the Tekni-Plex Industrial Portfolio Properties and pay origination costs.
The Properties. The Tekni-Plex Industrial Portfolio Properties are comprised of eight industrial properties totaling 1,138,969 square feet and located across six states. The Tekni-Plex Industrial Portfolio Properties are located in the following states: New York (two properties, 34.1% of net rentable area and 36.0% of underwritten rent), Ohio (two properties, 23.6% of net rentable area and 28.5% of underwritten rent), Indiana (one property, 16.0% of net rentable area and 12.2% of underwritten rent), Texas (one property, 12.0% of net rentable area and 11.7% of underwritten rent), Illinois (one property, 5.5% of net rentable area and 3.4% of underwritten rent), and North Carolina (one property, 8.8% of net rentable area and 8.2% of underwritten rent). Built between 1969 and 2024, the Tekni-Plex Industrial Portfolio Properties range in size from 62,829 square feet to 262,324 square feet.
The Tekni-Plex Industrial Portfolio Properties were acquired by the borrower in a sale-leaseback transaction with Tekni-Plex, Inc. and are leased to Tekni-Plex, Inc. under a master lease representing 100.0% of net rentable area and 100.0% of the underwritten base rent expiring January 31, 2044 (the “Tekni-Plex Master Lease”).
With respect to the 910 Vision Drive mortgaged property, the improvements are still under construction. As of the general contractor’s report dated January 11, 2024, the work at the 910 Vision Drive mortgaged property was estimated to be approximately 89% complete and ongoing work included completing interior finishes, electric installation, and structural steel installation at the southeast corner of the warehouse area. Future work is also expected to include installation of equipment. At origination, $3,750,784.30 was deposited by the borrower into an escrow with a third-party escrow agent for the completion of the improvements at the 910 Vision Drive mortgaged property pursuant to the terms and conditions of an escrow agreement among Tekni-Plex, the borrower, the lender and the escrow agent. Tekni-Plex is entitled to receive disbursements from such escrow upon (i) satisfaction of conditions set forth in a development agreement between Tekni-Plex and the borrower and (ii) consent of the lender (which must be promptly granted if Tekni-Plex has complied with the terms of the development agreement in connection with the draw request). In the event that either (i) the conditions to release of the final disbursement from the escrow have not been satisfied as evidenced by the borrower and lender’s confirmation thereof within 60 days after May 1, 2024 (as such date may be extended for certain unavoidable delays or landlord delays as set forth in the related development agreement), or (ii) the escrow agent is notified of a continuing event of default under the Tekni-Plex Industrial Portfolio Mortgage Loan, the escrow agent is required to release the remaining funds held in such escrow to the lender, to be held and disbursed as set forth in the Tekni-Plex Industrial Portfolio Mortgage Loan documents.
The sole tenant has requested an amendment to the development agreement relating to the 910 Vision Drive mortgaged property to, among other provisions, extend the required time of completion of the related improvements from May 1, 2024 to a later date (currently expected to be July 1, 2024; however it is possible the tenant may seek a longer extension) and to release a portion of the retainage owing to the general contractor. It is anticipated that the lender will consent to such amendment.
THE INFORMATION IN THIS STRUCTURAL AND COLLATERAL TERM SHEET IS NOT COMPLETE AND MAY BE AMENDED PRIOR TO THE TIME OF SALE. THIS TERM SHEET IS NOT AN OFFER TO SELL THESE SECURITIES AND IT IS NOT A SOLICITATION OF AN OFFER TO BUY THESE SECURITIES IN ANY JURISDICTION WHERE THE OFFER OR SALE IS NOT PERMITTED. |
| | 71 | |
| Structural and Collateral Term Sheet | | BMO 2024-C8 |
| No. 4 – Tekni-Plex Industrial Portfolio |
The following table presents certain information relating to the Tekni-Plex Industrial Portfolio Properties, which are presented in descending order of their allocated loan amounts:
| Tekni-Plex Industrial Portfolio Summary |
| Property Name | City, State(2) | Property Type – Subtype(2) | Year Built / Renovated (2) | SF(1) | Occupancy(1) | Allocated Mortgage Loan Cut-off Date Balance | % of Allocated Mortgage Loan Cut-off Date Balance | Appraised Value(2)(3) | % of UW Base Rent |
| 8662 Main Street | Honeoye, NY | Industrial – Warehouse / Manufacturing | 1980 / 2016 | 262,324 | 100.0% | $13,516,000 | 23.1% | $25,200,000 | 24.3% |
| 910 Vision Drive | Van Wert, OH | Industrial – Manufacturing | 2024 / NAP | 205,000 | 100.0% | 13,463,000 | 23.0 | 19,900,000 | 23.9 |
4700 South Westmoreland Road | Dallas, TX | Industrial – Warehouse / Distribution | 1986 / NAP | 136,209 | 100.0% | 8,904,000 | 15.2 | 16,600,000 | 11.7 |
| 2110 Patterson Street | Decatur, IN | Industrial – Manufacturing | 1971 / 2003 | 182,407 | 100.0% | 6,812,000 | 11.7 | 12,700,000 | 12.2 |
| 26 Maple Avenue | Bloomfield, NY | Industrial – Manufacturing | 1991 / 2010 | 126,126 | 100.0% | 6,544,000 | 11.2 | 12,200,000 | 11.7 |
8720 US 70 Business Highway West | Clayton, NC | Industrial – Manufacturing | 1976 / NAP | 100,486 | 100.0% | 4,559,000 | 7.8 | 8,500,000 | 8.2 |
| 1445 Timber Wolf Drive | Holland, OH | Industrial – Manufacturing | 1994 / 2015 | 63,588 | 100.0% | 2,682,000 | 4.6 | 5,000,000 | 4.6 |
| 1060 State Highway 10 | Clinton, IL | Industrial – Warehouse / Manufacturing | 1969 / 1993 | 62,829 | 100.0% | 1,930,000 | 3.3 | 3,600,000 | 3.4 |
| Total/Weighted Average | | | | 1,138,969 | 100.0% | $58,410,000 | 100.0% | $105,000,000(3) | 100.0% |
| (1) | Based on the underwritten rent rolls dated January 24, 2024. |
| (2) | Information obtained from the appraisals. |
| (3) | The appraised value represents the “As Portfolio” appraised value, which assumes a 1.25% portfolio premium is applied to the aggregate sum of the individual appraised values. The individual appraisal valuation dates are between December 18, 2023, and December 22, 2023. The aggregate of the “as is” appraised values of the Tekni-Plex Industrial Portfolio Properties is $103,700,000 which results in a Cut-off Date LTV and Maturity Date LTV of 56.3% |
Appraisals. According to the appraisals, the Tekni-Plex Industrial Portfolio Properties had an aggregate “as-is” value of $103,700,000 as of various dates in December 2023 and an “As Portfolio” appraised value of $105,000,000, which assumed a portfolio premium of approximately 1.25% on the aggregate value of the individual property values. Based on the aggregate of the “as-is” appraised values of $103,700,000, the Cut-off Date LTV and Maturity Date LTV for the Tekni-Plex Industrial Portfolio Mortgage Loan is 56.3%.
| Tekni-Plex Industrial Portfolio Appraised Value(1) |
| Properties | Value | Capitalization Rate |
| 8662 Main Street | $25,200,000 | 8.25% |
| 910 Vision Drive | 19,900,000 | 8.25% |
| 4700 South Westmoreland Road | 16,600,000 | 6.00% |
| 2110 Patterson Street | 12,700,000 | 8.25% |
| 26 Maple Avenue | 12,200,000 | 8.25% |
| 8720 US 70 Business Highway West | 8,500,000 | 8.25% |
| 1445 Timber Wolf Drive | 5,000,000 | 8.25% |
| 1060 State Highway 10 | 3,600,000 | 8.25% |
| Total / Wtd. Avg. | $105,000,000(2) | 7.89%(3) |
| (2) | The appraised value represents the “As Portfolio” appraised value, which assumes a 1.25% portfolio premium is applied to the aggregate sum of the individual appraised values. The individual appraisal valuation dates are between December 18, 2023, and December 22, 2023. The aggregate of the “as is” appraised values of the Tekni-Plex Industrial Portfolio Properties is $103,700,000 which results in a Cut-off Date LTV and Maturity Date LTV of 56.3%. |
| (3) | Total / Wtd. Avg. is based on the appraised value of each Tekni-Plex Industrial Portfolio Property. |
Environmental. According to the Phase I environmental assessments dated various dates in October 2023, there were recognized environmental conditions at the 26 Maple Avenue mortgaged property and the 2110 Patterson Street mortgaged property, and a controlled recognized environmental condition at the 8662 Main Street mortgaged property. At origination, a pollution liability policy was obtained. See “Description of the Mortgage Pool—Environmental Considerations” in the Preliminary Prospectus.
THE INFORMATION IN THIS STRUCTURAL AND COLLATERAL TERM SHEET IS NOT COMPLETE AND MAY BE AMENDED PRIOR TO THE TIME OF SALE. THIS TERM SHEET IS NOT AN OFFER TO SELL THESE SECURITIES AND IT IS NOT A SOLICITATION OF AN OFFER TO BUY THESE SECURITIES IN ANY JURISDICTION WHERE THE OFFER OR SALE IS NOT PERMITTED. |
| | 72 | |
| Structural and Collateral Term Sheet | | BMO 2024-C8 |
| No. 4 – Tekni-Plex Industrial Portfolio |
The following table presents certain information relating to the occupancy of the Tekni-Plex Industrial Portfolio Properties:
| Current Occupancy(1)(2) |
| 100.0% |
| (1) | Historical financial information is not available because the Tekni-Plex Industrial Portfolio Properties were acquired by the borrower on the origination date, except for the 910 Vision Drive mortgaged property, which was acquired in April 2023, in a sale leaseback transaction. |
| (2) | Based on the underwritten rent rolls dated January 24, 2024. |
The Sole Tenant. The sole tenant for the Tekni-Plex Industrial Portfolio Properties is Tekni-Plex, Inc. (“Tekni-Plex”), rated NR/B-/NR by Moody’s, S&P and Fitch, a company that manufactures packaging and container products, including packaging materials for the food industry, medical compounds and medical tubing solutions. Headquartered in Wayne, Pennsylvania, Tekni-Plex employs 7,000 people throughout its operations in Belgium, Brazil, Canada, China, Colombia, Costa Rica, Germany, India, Italy, Mexico, Northern Ireland, and the United States. In 2022, Tekni-Plex reorganized its lines of business into two distinct segments: Tekni-Plex Consumer Products and Tekni-Plex Healthcare in order to organize and incorporate recently acquired businesses into complementary verticals.
Tekni-Plex was purchased in 2017 by funds managed by Genstar Capital, a middle-market private equity firm. Since being acquired by Genstar Capital in 2017, Tekni-Plex has operated with high financial leverage and a focus on growth through acquisitions.
The following table presents certain information relating to the sole tenant at the Tekni-Plex Industrial Portfolio Properties:
| Top Tenant Summary(1) |
| Tenant | Ratings
Moody’s/S&P/Fitch(2) | Net Rentable Area (SF) | % of
Total NRA | UW
Base Rent PSF |
UW
Base Rent | % of Total
UW Base Rent | Lease
Exp. Date | Renewal Options |
| Tekni-Plex, Inc. | NR/B-/NR | 1,138,969 | 100.0% | $7.61 | $8,672,372 | 100.0% | 1/31/2044 | 2 x 10 years |
| Total Occupied | | 1,138,969 | 100.0% | $7.61 | $8,672,372 | 100.0% | | |
| Vacant Space | | 0 | 0.0 | | | | | |
| Totals/ Wtd. Avg. | | 1,138,969 | 100.0% | | | | | |
| (1) | Based on the underwritten rent rolls dated January 24, 2024. |
| (2) | Certain ratings are those of the parent company whether or not the parent guarantees the lease. |
The Tekni-Plex Master Lease is guaranteed by Trident TPI Holdings, Inc. The Tekni-Plex Master Lease permits the following transfers with respect to the tenant, the lease guarantor, and the Tekni-Plex Master Lease without the landlord’s consent: (i) an assignment of the Tekni-Plex Master Lease and the leased premises as a whole to an affiliate of the tenant or lease guarantor; (ii) the acquisition of more than 10% of the direct or indirect equity interests in the tenant or lease guarantor by any person or entity; (iii) any change of control, including the acquisition of any controlling ownership or voting interest in the tenant or the lease guarantor (including but not limited to any merger, consolidation, sale of equity or other change of control transaction involving any direct or indirect parent of the tenant or the guarantor); (iv) a merger or consolidation of Tekni-Plex or the lease guarantor with any person, and (v) an asset transfer (the sale of all or substantially all of tenant’s assets) to any person (including an affiliate of Tekni-Plex or the lease guarantor), provided that (i) there is no event of default under the Tekni-Plex Master Lease, (ii) the surviving entity or assignee is organized in the United States (unless otherwise agreed by the landlord), and can make the representations and warranties of the tenant set forth in the Tekni-Plex Master Lease, (iii) the landlord has received reasonably acceptable searches, (iv) the transfer does not violate a representation that the tenant and its affiliates are not a specially designated national or blocked person (as defined in the Tekni-Plex Master Lease), (v) such transaction is bona fide, and (vi) a replacement lease guarantor delivers a replacement guaranty from a guarantor that is audited, is a parent entity in the ownership structure of the tenant with consolidated financial statements with such tenant, and, in certain cases, engages in a synergistic business with the tenant (if such an entity is available).
THE INFORMATION IN THIS STRUCTURAL AND COLLATERAL TERM SHEET IS NOT COMPLETE AND MAY BE AMENDED PRIOR TO THE TIME OF SALE. THIS TERM SHEET IS NOT AN OFFER TO SELL THESE SECURITIES AND IT IS NOT A SOLICITATION OF AN OFFER TO BUY THESE SECURITIES IN ANY JURISDICTION WHERE THE OFFER OR SALE IS NOT PERMITTED. |
| | 73 | |
| Structural and Collateral Term Sheet | | BMO 2024-C8 |
| No. 4 – Tekni-Plex Industrial Portfolio |
Tekni-Plex is permitted to mortgage its leasehold interest in the Tekni-Plex Master Lease, or any portion thereof, provided that the mortgagee is a Qualified Institution and all rights under such leasehold mortgages will be subject to the Tekni-Plex Master Lease and subordinate to any mortgage on the fee interests in the Tekni-Plex Industrial Portfolio Properties. A “Qualified Institution” means various types of banking institutions, or an insurance company, trust company, real estate investment trust or pension fund, which in each case has gross assets in excess of $5 billion dollars.
Tekni-Plex has a right of first offer to purchase the Tekni-Plex Industrial Portfolio Properties under the Tekni-Plex Master Lease. In addition, the Tekni-Plex Master Lease contains restrictions on transfer of the Tekni-Plex Industrial Portfolio Properties to certain identified competitors of Tekni-Plex.
The following table presents certain information relating to the lease rollover schedule at the Tekni-Plex Industrial Portfolio Properties:
| Lease Rollover Schedule(1) |
| Year | Number of Leases Expiring | Net Rentable Area Expiring | % of NRA Expiring | UW Base Rent Expiring | % of UW Base Rent Expiring | Cumulative Net Rentable Area Expiring | Cumulative % of NRA Expiring | Cumulative UW Base Rent Expiring | Cumulative % of UW Base Rent Expiring |
| Vacant | NAP | 0 | 0.0% | NAP | NAP | 0 | 0.0% | NAP | NAP |
| 2024 & MTM | 0 | 0 | 0.0 | $0 | 0.0% | 0 | 0.0% | $0 | 0.0% |
| 2025 | 0 | 0 | 0.0 | 0 | 0.0 | 0 | 0.0% | $0 | 0.0% |
| 2026 | 0 | 0 | 0.0 | 0 | 0.0 | 0 | 0.0% | $0 | 0.0% |
| 2027 | 0 | 0 | 0.0 | 0 | 0.0 | 0 | 0.0% | $0 | 0.0% |
| 2028 | 0 | 0 | 0.0 | 0 | 0.0 | 0 | 0.0% | $0 | 0.0% |
| 2029 | 0 | 0 | 0.0 | 0 | 0.0 | 0 | 0.0% | $0 | 0.0% |
| 2030 | 0 | 0 | 0.0 | 0 | 0.0 | 0 | 0.0% | $0 | 0.0% |
| 2031 | 0 | 0 | 0.0 | 0 | 0.0 | 0 | 0.0% | $0 | 0.0% |
| 2032 | 0 | 0 | 0.0 | 0 | 0.0 | 0 | 0.0% | $0 | 0.0% |
| 2033 | 0 | 0 | 0.0 | 0 | 0.0 | 0 | 0.0% | $0 | 0.0% |
| 2034 | 0 | 0 | 0.0 | 0 | 0.0 | 0 | 0.0% | $0 | 0.0% |
| 2035 & Beyond | 1 | 1,138,969 | 100.0% | $8,672,372 | 100.0% | 1,138,969 | 100.0% | $8,672,372 | 100.0% |
| Total | 1 | 1,138,969 | 100.0% | $8,672,372 | 100.0% | | | | |
| (1) | Based on the underwritten rent rolls dated January 24, 2024. |
THE INFORMATION IN THIS STRUCTURAL AND COLLATERAL TERM SHEET IS NOT COMPLETE AND MAY BE AMENDED PRIOR TO THE TIME OF SALE. THIS TERM SHEET IS NOT AN OFFER TO SELL THESE SECURITIES AND IT IS NOT A SOLICITATION OF AN OFFER TO BUY THESE SECURITIES IN ANY JURISDICTION WHERE THE OFFER OR SALE IS NOT PERMITTED. |
| | 74 | |
| Structural and Collateral Term Sheet | | BMO 2024-C8 |
| No. 4 – Tekni-Plex Industrial Portfolio |
The following table presents certain information relating to the underwritten cash flow of the Tekni-Plex Industrial Portfolio Properties:
| Underwritten Net Cash Flow(1)(2) |
| | Underwritten | Per Square Foot | %(3) |
| Base Rent | $8,672,372 | $7.61 | 94.8% |
| Rent Step | 216,809 | 0.19 | 2.4% |
| CAM + Other Reimbursement | 260,774 | 0.23 | 2.9% |
| Total Gross Income | $9,149,955 | $8.03 | 100.0% |
| (Vacancy/Credit Loss) | (457,498) | (0.40) | (5.0) |
| Effective Gross Income | $8,692,458 | $7.63 | 95.0% |
| Total Expenses(4) | $260,774 | $0.23 | 3.0% |
| Net Operating Income | $8,431,684 | $7.40 | 97.0% |
| Replacement Reserves | 170,845 | 0.15 | 2.0 |
| Net Cash Flow | $8,260,839 | $7.25 | 95.0% |
| (1) | Based on the underwritten rent rolls dated January 24, 2024. |
| (2) | Historical financial information is not available because the Tekni-Plex Industrial Portfolio Properties were acquired by the borrower on the origination date, except for the 910 Vision Drive mortgaged property, which was acquired in April 2023, in a sale leaseback transaction. |
| (3) | Revenue-related figures are calculated as a % of Total Gross Income. Net Operating Income, Total Expenses, Replacement Reserves and Net Cash Flow are calculated as a % of Effective Gross Income. |
| (4) | Total Expenses are underwritten based on the Tekni-Plex Master Lease. As a result, there are no underwritten real estate taxes or insurance costs. The 910 Vision Drive mortgaged property has obtained a tax abatement pursuant to an enterprise zone agreement. See “Description of the Mortgage Pool—Real Estate and Other Tax Considerations” in the Preliminary Prospectus. |
The Market. The following table presents certain market information relating to the Tekni-Plex Industrial Portfolio Properties:
| Market Area Summary(1) |
| Property | Market | Submarket | Submarket Inventory (SF)(2) | Submarket Vacancy(2) | Submarket NNN Rent PSF(2) |
| 910 Vision Drive | Fort Wayne, OH | Van Wert County | 2,997,752 | 3.30% | $6.50 |
| 8662 Main Street | Rochester, NY | Outlying Ontario County | 9,578,949 | 2.30% | $4.51 |
| 4700 South Westmoreland Road | Dallas/Fort Worth, TX | Redbird Airport | 22,109,767 | 9.50% | $6.72 |
| 1445 Timber Wolf Drive | Toledo, OH | South/Southwest | 19,213,502 | 0.60% | $7.79 |
| 2110 Patterson Street | Fort Wayne MSA | Adams County | 1,739,490 | 1.70% | $7.99 |
| 26 Maple Avenue | Rochester, NY | Outlying Ontario County | 9,578,949 | 2.30% | $4.51 |
| 8720 US 70 Business Highway West | Raleigh/Durham, NC | Johnston County | 16,080,419 | 1.20% | $5.19 |
| 1060 State Highway 10 | Illinois | Decatur | 12,096,155 | 9.30% | $4.85 |
| (1) | Information obtained from the appraisals, unless otherwise indicated. |
| (2) | Submarket Inventory, Submarket Vacancy, and Submarket NNN Rent PSF are TTM as of the third quarter of 2023. |
The Borrower. The borrower for the Tekni-Plex Industrial Portfolio Mortgage Loan is Eggpack Property LLC, a Delaware
limited liability company with one independent director. Legal counsel to the borrower delivered a non-consolidation opinion in connection with the origination of the Tekni-Plex Industrial Portfolio Mortgage Loan.
The Borrower Sponsor. The borrower sponsor is U.S. Realty Advisors, LLC, a real estate investment firm with over 35 years of commercial real estate experience and more than 15 million square feet of commercial properties under management. The borrower sponsor specializes in allocating capital through customized sale-leaseback and build-to-suit structures into real estate assets occupied by corporations across the credit spectrum. USRA Net Lease IV Capital Corp., a Delaware corporation, is the guarantor of certain nonrecourse carveout liabilities under the Tekni-Plex Industrial Portfolio Mortgage Loan. Only the single purpose entity borrower, and not the guarantor, is liable under the environmental indemnity for the Tekni-Plex Industrial Portfolio Mortgage Loan.
THE INFORMATION IN THIS STRUCTURAL AND COLLATERAL TERM SHEET IS NOT COMPLETE AND MAY BE AMENDED PRIOR TO THE TIME OF SALE. THIS TERM SHEET IS NOT AN OFFER TO SELL THESE SECURITIES AND IT IS NOT A SOLICITATION OF AN OFFER TO BUY THESE SECURITIES IN ANY JURISDICTION WHERE THE OFFER OR SALE IS NOT PERMITTED. |
| | 75 | |
| Structural and Collateral Term Sheet | | BMO 2024-C8 |
| No. 4 – Tekni-Plex Industrial Portfolio |
Property Management. The Tekni-Plex Industrial Portfolio Properties are self-managed by the borrower.
Escrows and Reserves. At origination of the Tekni-Plex Industrial Portfolio Loan, the borrower deposited approximately $3,750,784 into a reserve with a third-party escrow agent for the completion of the improvements at the 910 Vision Drive mortgaged property, to be disbursed as described above under “The Properties.”
Tax Reserve – During the continuance of a Trigger Period (as defined below), the borrower is required to deposit into a real estate tax reserve, on a monthly basis, 1/12 of the taxes that the lender estimates will be payable over the next-ensuing 12-month period.
Insurance Reserve – During the continuance of a Trigger Period, the borrower is required to deposit into an insurance reserve, on a monthly basis, 1/12 of the amount which will be sufficient to pay the insurance premiums due for the renewal of coverage afforded by the insurance policies.
Replacement Reserve – During the continuance of a Trigger Period, the borrower is required to deposit into an account for repairs and replacements (the “Replacement Reserve”), on a monthly basis, an amount equal to the lesser of (x) $14,237.11 and (y) the difference between the amount then on deposit in such Replacement Reserve and $512,536.05.
TI / LC Reserve – During a Trigger Period, the borrower is required to deposit into a reserve for tenant improvements and leasing commissions (the “Rollover Reserve”), on a monthly basis, an amount equal to the lesser of (x) $94,914.08 and (y) the difference between the amount then on deposit in such Rollover Reserve and $3,416,907.
Lockbox / Cash Management. The Tekni-Plex Industrial Portfolio Mortgage Loan is structured with a hard lockbox and springing cash management. The borrower and the property manager are required to cause all rents to be deposited directly into a lender-controlled lockbox account. All revenues received by the borrower or property manager are required to be deposited in the lockbox account within one business day of receipt. During the continuance of a Trigger Period, all funds on deposit in the lockbox account are required to be swept at the end of each business day into a lender-controlled cash management account and applied on each payment date and disbursed in accordance with the Tekni-Plex Industrial Portfolio Mortgage Loan documents to pay (i) required deposits (if any) into the tax and insurance reserves, (ii) debt service on the Tekni-Plex Industrial Portfolio Mortgage Loan, (iii) required deposits (if any) into the Replacement Reserve and Rollover Reserve, (iv) solely if the Tekni-Plex Industrial Portfolio Properties are no longer leased under a triple net lease as to which the tenant is not in monetary default, budgeted operating expenses, and approved extraordinary expenses, and (v) any remainder (A) if a Lease Sweep Period exists, to a lease sweep reserve (the “Lease Sweep Account”) or (B) if no Lease Sweep Period exists, to a cash collateral account to be held as additional collateral during the continuance of such Trigger Period. Provided no Trigger Period is continuing, funds on deposit in the lockbox account will be disbursed to the borrower’s operating account.
A “Trigger Period” means a period (A) commencing on the occurrence of any of the following (i) an event of default, (ii) the debt service coverage ratio being less than 1.40x as of the end of any calendar quarter (a “DSCR Event”), or (iii) the occurrence of a Lease Sweep Period (as defined below), and (B) ending upon (a) with respect to clause (i) above, the event of default has been cured or has been waived by the lender, (b) with respect to a DSCR Event, the earlier to occur of either (x) the debt service coverage ratio being at least 1.40x for two consecutive calendar quarters or (y) the borrower has delivered to the lender cash or a letter of credit (“DSCR Maintenance Collateral”) in the amount which, if applied to repay the outstanding principal balance of the Tekni-Plex Industrial Portfolio Mortgage Loan, would cause the debt service coverage ratio to be 1.40x, or (c) with respect to clause (iii) above, a Lease Sweep Period has been cured.
At the end of each calendar quarter, if a DSCR Event would occur even after giving effect to any DCSR Maintenance Collateral, the borrower will have the right to increase the DSCR Maintenance Collateral so as to prevent such DSCR Event. In addition, DSCR Maintenance Collateral may be decreased if the amount of DSCR Maintenance Collateral is in excess of that needed to avoid a DSCR Event, and will be released to the borrower if a DSCR Event no longer exists (without giving effect to such DSCR Maintenance Collateral).
A “Sweep Lease” means (i) the Tekni-Plex Master Lease and (ii) any replacement lease that, either individually, or when taken together with any other lease with the same tenant or its affiliates, covers 10% or more of the rentable square footage of the Tekni-Plex Industrial Portfolio Properties. This does not include any sublease of a Sweep Lease.
THE INFORMATION IN THIS STRUCTURAL AND COLLATERAL TERM SHEET IS NOT COMPLETE AND MAY BE AMENDED PRIOR TO THE TIME OF SALE. THIS TERM SHEET IS NOT AN OFFER TO SELL THESE SECURITIES AND IT IS NOT A SOLICITATION OF AN OFFER TO BUY THESE SECURITIES IN ANY JURISDICTION WHERE THE OFFER OR SALE IS NOT PERMITTED. |
| | 76 | |
| Structural and Collateral Term Sheet | | BMO 2024-C8 |
| No. 4 – Tekni-Plex Industrial Portfolio |
A "Lease Sweep Period” will commence (a) upon the earlier of (i) the date that is 12 months prior to the expiration of a Sweep Lease or (ii) upon the date required under the Sweep Lease by which the tenant is required to give notice of its exercise of a renewal option thereunder (and such renewal has not been so exercised); (b) upon the early surrender, early termination, or early cancellation of a Sweep Lease or upon the borrower’s receipt of notice by the tenant of its intent to effect an early surrender, early termination, or early cancellation of its Sweep Lease; (c) if a tenant under a Sweep Lease has ceased operating its business for a period of more than 90 days in more than 20% of its space at the Tekni-Plex Industrial Portfolio Properties (i.e., “goes dark”) (other than in connection with certain permitted closures for alterations, repairs, equipment installation or retooling, restoration following a casualty or condemnation, or governmental restrictions related to a state of emergency or pandemic or epidemic, provided, that, in each case, the Sweep Lease remains in full force and effect in accordance with its then current terms); (d) upon any monetary default by the tenant under the Sweep Lease beyond any applicable notice and cure period, or (e) upon a bankruptcy or insolvency proceeding of the tenant under a Sweep Lease (or its direct or indirect parent company (if any) and/or any lease guarantor).
A Lease Sweep Period will end in the case of all clauses above, when the entirety of the Sweep Lease space (or applicable portion thereof) is leased pursuant to one or more Qualified Leases (as defined below) and sufficient funds have been swept into the Lease Sweep Account (during the continuance of the subject Lease Sweep Period) to cover all anticipated approved leasing expenses, free rent periods, and/or rent abatement periods set forth in all such Qualified Leases and any shortfalls in required payments under the Tekni-Plex Industrial Portfolio Mortgage Loan documents (including taxes and insurance to the extent funds in such account are insufficient to pay same) or operating expenses as a result of any anticipated down time prior to the commencement of payments under such Qualified Leases. In addition a Lease Sweep Period will end (A) in the case of clause (a) above, on the date on which the tenant under the Sweep Lease irrevocably exercises its renewal or extension option with respect to all of its space, and sufficient funds have been accumulated in the Lease Sweep Account to cover all anticipated approved leasing expenses, free rent periods, and/or rent abatement periods in connection with such renewal or extension, (B) in the case of clause (b) above, if the termination option is not validly exercised or is otherwise validly and irrevocably waived in writing by the tenant, (C) in the case of clause(c) above, such discontinuance ceases (i.e. operations by the tenant resume under the Sweep Lease), (D) in the case of clause (d) above, the date on which the subject default has been cured, (E) in the case of clause (e) above, either (1) the applicable bankruptcy or insolvency proceeding has terminated and the Sweep Lease (and any guaranty thereof) has been affirmed or assumed, without modification that would adversely impact the lender, by the tenant, and if applicable, lease guarantor or (2) the applicable Sweep Lease has been assumed by the tenant and assigned to a third party in compliance with the requirements of the Sweep Lease, without modification that would adversely impact the lender, and in the case of either clause (1) or clause (2)), all defaults under the Sweep Lease are cured and the tenant is in occupancy of its premises and paying full, unabated rent.
A “Qualified Lease” means either: (A) the original Sweep Lease, as extended in accordance with (i) the express renewal option set forth therein or (ii) a modification approved by the lender, or (B) a replacement lease (i) with a term that extends at least five years beyond the maturity date of the Tekni-Plex Industrial Portfolio Mortgage Loan; (ii) entered into in accordance with the Tekni-Plex Industrial Portfolio Mortgage Loan documents and (iii) on market terms with respect to, among other things, base rent, additional rent and recoveries and tenant improvement allowances.
Current Mezzanine or Secured Subordinate Indebtedness. None.
Permitted Future Mezzanine or Secured Subordinate Indebtedness. Not permitted.
Release of Collateral. Not Permitted.
Ground Lease. None.
THE INFORMATION IN THIS STRUCTURAL AND COLLATERAL TERM SHEET IS NOT COMPLETE AND MAY BE AMENDED PRIOR TO THE TIME OF SALE. THIS TERM SHEET IS NOT AN OFFER TO SELL THESE SECURITIES AND IT IS NOT A SOLICITATION OF AN OFFER TO BUY THESE SECURITIES IN ANY JURISDICTION WHERE THE OFFER OR SALE IS NOT PERMITTED. |
| | 77 | |
| Structural and Collateral Term Sheet | | BMO 2024-C8 |
| No. 5 – Axis Apartments |
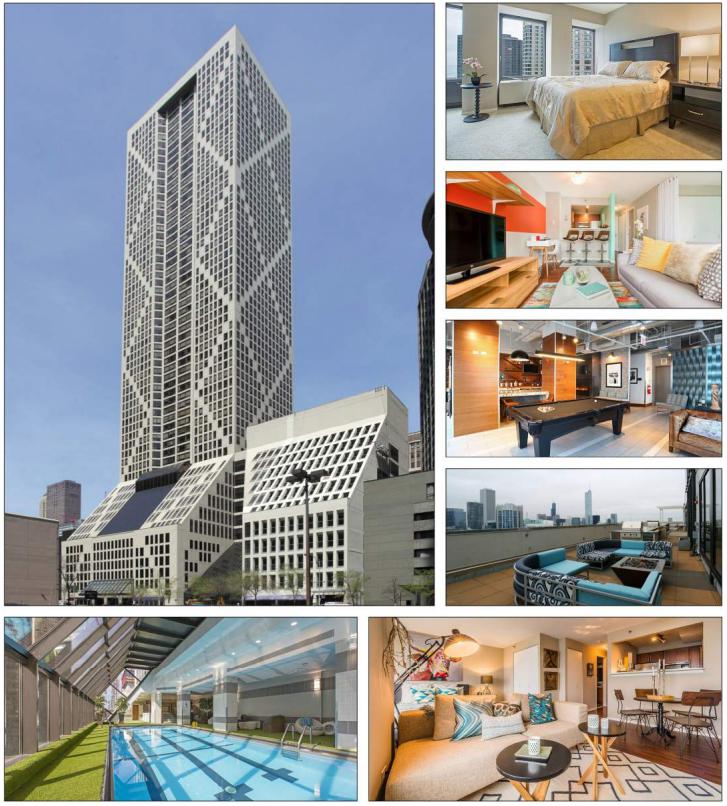
THE INFORMATION IN THIS STRUCTURAL AND COLLATERAL TERM SHEET IS NOT COMPLETE AND MAY BE AMENDED PRIOR TO THE TIME OF SALE. THIS TERM SHEET IS NOT AN OFFER TO SELL THESE SECURITIES AND IT IS NOT A SOLICITATION OF AN OFFER TO BUY THESE SECURITIES IN ANY JURISDICTION WHERE THE OFFER OR SALE IS NOT PERMITTED. |
| | 78 | |
| Structural and Collateral Term Sheet | | BMO 2024-C8 |
| No. 5 – Axis Apartments |
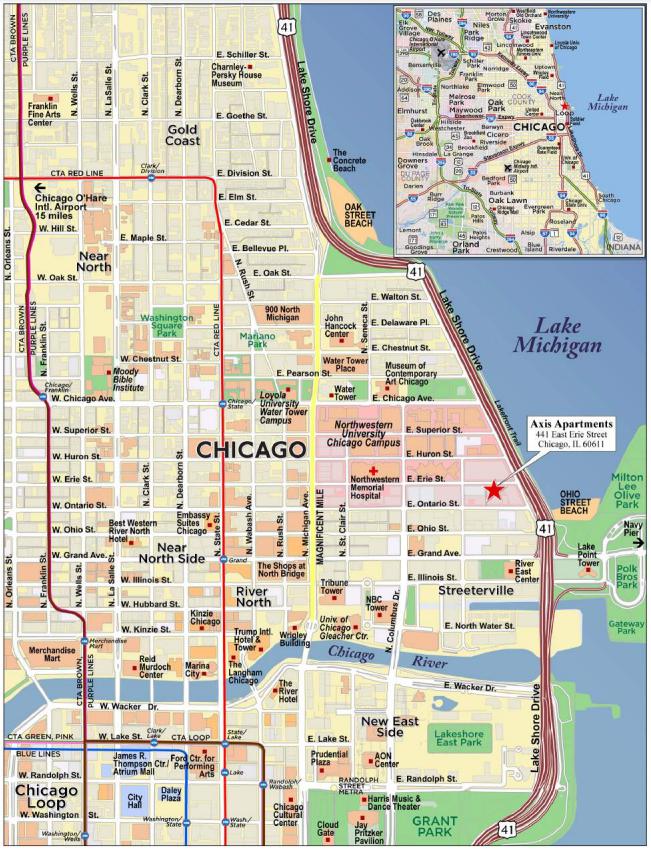
THE INFORMATION IN THIS STRUCTURAL AND COLLATERAL TERM SHEET IS NOT COMPLETE AND MAY BE AMENDED PRIOR TO THE TIME OF SALE. THIS TERM SHEET IS NOT AN OFFER TO SELL THESE SECURITIES AND IT IS NOT A SOLICITATION OF AN OFFER TO BUY THESE SECURITIES IN ANY JURISDICTION WHERE THE OFFER OR SALE IS NOT PERMITTED. |
| | 79 | |
| Structural and Collateral Term Sheet | | BMO 2024-C8 |
| No. 5 – Axis Apartments |
| Mortgage Loan Information | | Property Information |
| Mortgage Loan Seller: | CREFI | | Single Asset / Portfolio: | Single Asset |
| Original Principal Balance(1): | $58,000,000 | | Title: | Fee |
| Cut-off Date Principal Balance(1): | $58,000,000 | | Property Type – Subtype: | Multifamily – High Rise |
| % of Pool by IPB: | 8.5% | | Net Rentable Area (Units): | 716 |
| Loan Purpose: | Refinance | | Location: | Chicago, IL |
| Borrower: | AH Axis Erie, LLC | | Year Built / Renovated: | 1986 / 2015 |
| Borrower Sponsors: | William O’Kane and Karen O’Kane | | Occupancy(4): | 92.5% |
| Interest Rate: | 6.88000% | | Occupancy Date: | 10/20/2023 |
| Note Date: | 11/27/2023 | | 4th Most Recent NOI (As of): | NAV |
| Maturity Date: | 12/6/2033 | | 3rd Most Recent NOI (As of): | $8,815,970 (12/31/2021) |
| Interest-only Period: | 120 months | | 2nd Most Recent NOI (As of): | $9,284,565 (12/31/2022) |
| Original Term: | 120 months | | Most Recent NOI (As of)(5): | $10,170,700 (TTM 7/31/2023) |
| Original Amortization: | None | | UW Economic Occupancy: | 91.7% |
| Amortization Type: | Interest Only | | UW Revenues: | $21,736,552 |
| Call Protection: | L(27),YM1(86),O(7) | | UW Expenses: | $8,473,297 |
| Lockbox / Cash Management: | Springing / Springing | | UW NOI(5): | $13,263,255 |
| Additional Debt(1): | Yes | | UW NCF: | $13,036,413 |
| Additional Debt Balance(1): | $78,000,000 | | Appraised Value / Per Unit(6): | $256,800,000 / $358,659 |
| Additional Debt Type(1): | Pari Passu | | Appraisal Date(6): | 5/31/2024 |
| | | | | |
| Escrows and Reserves(2) | | Financial Information |
| | Initial | Monthly | Initial Cap | | Cut-off Date Loan / Unit: | $189,944 |
| Taxes: | $1,318,059 | $329,515 | N/A | | Maturity Date Loan / Unit: | $189,944 |
| Insurance: | $216,815 | $30,974 | N/A | | Cut-off Date LTV(6): | 53.0% |
| Replacement Reserves: | $0 | $15,203 | N/A | | Maturity Date LTV(6): | 53.0% |
| TI / LC: | $0 | Springing | N/A | | UW NCF DSCR: | 1.37x |
| Deferred Maintenance: | $106,250 | $0 | N/A | | UW NOI Debt Yield: | 9.8% |
| Other(3): | $6,644,232 | $0 | N/A | | | |
| | | | | | | |
| Sources and Uses |
| Sources | Proceeds | % of Total | | Uses | Proceeds | % of Total |
| Whole Loan(1) | $136,000,000 | 82.5 | % | | Loan Payoff | $153,800,522 | 93.3 | % |
| Borrower Sponsor Equity | 22,164,897 | 13.4 | | | Upfront Reserves | 8,285,356 | 5.0 | |
| Letter of Credit(3) | 6,644,232 | 4.0 | | | Closing Costs | 2,723,251 | 1.7 | |
| Total Sources | $164,809,129 | 100.0 | % | | Total Uses | $164,809,129 | 100.0 | % |
| (1) | The Axis Apartments Mortgage Loan (as defined below) is part of a whole loan evidenced by five pari passu notes with an aggregate outstanding principal balance as of the Cut-off Date of $136.0 million (the “Axis Apartments Whole Loan”). The Financial Information in the chart above reflects the Axis Apartments Whole Loan. |
| (2) | For a full description of Escrows and Reserves, see “Escrows and Reserves”. |
| (3) | Other reserves include (i) an initial base rent reserve for Sonder Hospitality USA Inc. (“Sonder”) of $3,624,131, which accounts for approximately one year of Sonder’s rent, (ii) an initial Sonder gap rent reserve of $1,812,061 and (iii) a Sonder free rent reserve of $1,208,040, all in the form of a letter of credit. See “Escrows and Reserves” below. |
| (4) | Occupancy includes 101 units that are currently being converted from office space to residential units and are leased by Sonder on a six-year term with two, three-year renewal options. The other 615 units not subject to the Sonder Lease (as defined below) are 91.2% leased. |
| (5) | The increase from Most Recent NOI to UW NOI is due to the borrower sponsors converting former vacant commercial space into 101 multifamily units on floors six through 10 of the Axis Apartments Property (as defined below). Sonder is not yet in occupancy of its leased premises nor has it commenced paying rent under its lease. See “The Property” below. |
| (6) | The Appraised Value, Appraised Value / Per Unit, Cut-off Date LTV and Maturity Date LTV are based on the appraiser’s “prospective as complete – proposed” value of $256,800,000 as of May 31, 2024, which assumes completion of the currently ongoing and planned renovation work for 101 units that are being converted from office space to residential units (see “The Property” below). The appraiser concluded to an “as-is” appraised value of $229,400,000 as of September 29, 2023, which would result in a Cut-off Date LTV Ratio and Maturity Date LTV Ratio of 59.3% and 59.3%, respectively. |
THE INFORMATION IN THIS STRUCTURAL AND COLLATERAL TERM SHEET IS NOT COMPLETE AND MAY BE AMENDED PRIOR TO THE TIME OF SALE. THIS TERM SHEET IS NOT AN OFFER TO SELL THESE SECURITIES AND IT IS NOT A SOLICITATION OF AN OFFER TO BUY THESE SECURITIES IN ANY JURISDICTION WHERE THE OFFER OR SALE IS NOT PERMITTED. |
| | 80 | |
| Structural and Collateral Term Sheet | | BMO 2024-C8 |
| No. 5 – Axis Apartments |
The Loan. The fifth largest mortgage loan (the “Axis Apartments Mortgage Loan”) is part of the Axis Apartments Whole Loan secured by the borrower’s fee interest in a Class A, 716 unit, 60-story high rise multifamily property with 17,195 square feet of ground floor retail space located in downtown Chicago, Illinois (the “Axis Apartments Property”). The Axis Apartments Whole Loan is comprised of five pari passu notes, with an aggregate outstanding principal balance as of the Cut-off Date of $136,000,000. The Axis Apartments Whole Loan was originated on November 27, 2023 by Citi Real Estate Funding Inc. (“CREFI”) and accrues interest at a fixed rate of 6.88000% per annum. The Axis Apartments Whole Loan has an initial term of 10 years, is interest-only for the full term and accrues interest on an Actual/360 basis. The scheduled maturity date of the Axis Apartments Whole Loan is December 6, 2033. The Axis Apartments Mortgage Loan is evidenced by the non-controlling Note A-2 and Note A-4 with an aggregate outstanding principal balance as of the Cut-off Date of $58,000,000. The table below summarizes the promissory notes that comprise the Axis Apartments Whole Loan. The relationship between the holders of the Axis Apartments Whole Loan will be governed by a co-lender agreement as described under “Description of the Mortgage Pool—The Whole Loans—The Outside Serviced Pari Passu Whole Loans” in the Preliminary Prospectus. The Axis Apartments Whole Loan is being serviced pursuant to the pooling and servicing agreement for the Benchmark 2023-B40 securitization trust. See “The Pooling and Servicing Agreement—Servicing of the Outside Serviced Mortgage Loans” in the Preliminary Prospectus.
| Whole Loan Summary |
| Note | Original Balance | Cut-off Date Balance | Note Holder | Controlling Piece |
| A-1 | $48,000,000 | $48,000,000 | Benchmark 2023-B40 | Yes |
| A-2 | $30,000,000 | $30,000,000 | BMO 2024-C8 | No |
| A-3-1 | $18,000,000 | $18,000,000 | BBCMS 2024-C24 | No |
| A-3-2 | $12,000,000 | $12,000,000 | BBCMS 2024-C24 | No |
| A-4 | $28,000,000 | $28,000,000 | BMO 2024-C8 | No |
| Whole Loan | $136,000,000 | $136,000,000 | | |
The Property. The Axis Apartments Property is a Class A, 716 unit, 60-story high rise multifamily property with 17,195 square feet of ground floor retail space located in downtown Chicago, Illinois. The Axis Apartments Property was originally constructed in 1986 and renovated in 2009 and 2015. 101 of the units located on the 6th through 10th floors at the Axis Apartments Property are in the process of being converted from office space to residential units (the “Sonder Units”) which conversion has been divided into two phases. All 101 units have been leased by Sonder on a six-year term with two, three- year renewal options remaining. Launched in 2014 and headquartered in San Francisco, Sonder provides a variety of accommodation options from spacious rooms to fully-equipped suites and apartments and can be found in over 40 markets spanning 10 countries and three continents. The Sonder Lease accounts for 101 units and 19.0% of underwritten base rent. The Axis Apartments Property also features four retail units which are comprised of 17,195 square feet and account for 3.5% of underwritten base rent. As of October 20, 2023, the retail units were 88.7% occupied by SMI Imaging, LLC and Children’s Creative Learning Center, Inc.
Sonder is not yet in occupancy of its leased premises nor has such tenant commenced paying rent under its lease. Sonder’s lease is expected to commence following completion of the conversion work, as required by that certain lease agreement dated as of March 31, 2021, between the borrower, as landlord, and Sonder, as tenant (the “Sonder Lease”). The budget for the conversion of this space is $28,636,849 with the first phase scheduled to be completed on or before June 30, 2024 and the second phase scheduled to be completed on or before August 14, 2024. The borrower delivered a completion guaranty in connection with such obligations, which requires the guarantors to maintain a minimum net worth of $136.0 million and liquid assets of $13.6 million. There can be no assurance that the conversion of this space will be completed in the expected timeframe or at all, and Sonder has the right to terminate the lease if not delivered within the specified timeframe. The Sonder Lease includes four months of free rent, which amount was reserved at origination of the Axis Apartments Whole Loan. The Axis Apartment Whole Loan is structured with a Sonder base rent reserve of $3,624,131, which accounts for approximately one year of Sonder’s rent, a Sonder gap rent reserve of $1,812,061 and a Sonder free rent reserve of $1,208,040, all in the form of a letter of credit.
THE INFORMATION IN THIS STRUCTURAL AND COLLATERAL TERM SHEET IS NOT COMPLETE AND MAY BE AMENDED PRIOR TO THE TIME OF SALE. THIS TERM SHEET IS NOT AN OFFER TO SELL THESE SECURITIES AND IT IS NOT A SOLICITATION OF AN OFFER TO BUY THESE SECURITIES IN ANY JURISDICTION WHERE THE OFFER OR SALE IS NOT PERMITTED. |
| | 81 | |
| Structural and Collateral Term Sheet | | BMO 2024-C8 |
| No. 5 – Axis Apartments |
The unit mix at the Axis Apartments Property consists of 136 convertible units, 170 studio units, 191 one-bedroom units, 47 one-bedroom plus den units, 69 two-bedroom units, two three-bedroom units and the 101 Sonder Units that are comprised of 51 studio units, 21 one-bedroom units, 28 two-bedroom units and one three-bedroom unit. Amenities at the Axis Apartments Property include a 360-degree rooftop sky park, fitness center, sauna, steam room, indoor parking garage, business center, rentable storage lockers, community grilling stations, indoor pool, bike racks, 24-hour lobby attendant and laundry facilities.
| Unit Mix(1) |
Unit Type | # of Units | % of Total | Occupied Units | Occupancy | Average Unit Size (SF) | Average Monthly Rental Rate | Average Monthly Market Rent Per Unit (2) |
| Convertible | 136 | 19.0% | 133 | 97.8% | 546 | $1,915 | $1,930 |
| Studio | 170 | 23.7 | 167 | 98.2% | 471 | $1,700 | $1,725 |
| 1BR/1BA | 173 | 24.2 | 139 | 80.3% | 920 | $2,381 | $2,441 |
| 1 BR/1BA-Loft | 1 | 0.1 | 0 | 0.0% | 780 | NAP | $2,600 |
| 1 BR/1.5BA-Loft | 17 | 2.4 | 15 | 88.2% | 1,149 | $2,874 | $2,900 |
| 1BR/1.5BA+Den | 47 | 6.6 | 44 | 93.6% | 926 | $2,756 | $2,765 |
| 2BR/1.5BA | 44 | 6.1 | 42 | 95.5% | 930 | $2,772 | $2,800 |
| 2BR/2BA | 13 | 1.8 | 13 | 100.0% | 1,391 | $3,721 | $3,725 |
| 2BR/2BA-Loft | 12 | 1.7 | 8 | 66.7% | 1,657 | $3,874 | $3,950 |
| 3BR/2BA-Loft | 2 | 0.3 | 0 | 0.0% | 1,980 | NAP | $4,550 |
| Sonder Studio1/2/3 BR(3) | 101 | 14.1 | 101 | 100.0% | 753 | $2,990 | NAP |
| Total/Wtd. Avg. | 716 | 100.0% | 662 | 92.5% | 749 | $2,192(4) | $2,257(4) |
| (1) | Based on the underwritten rent roll dated October 20, 2023. |
| (3) | The Sonder Units are comprised of 51 studio units, 21 one-bedroom units, 28 two-bedroom units and one three-bedroom unit. |
| (4) | Does not include the 101 Sonder Units, as each unit pays a monthly base rent of $2,990 regardless of the type of unit. |
Appraisal. According to the appraisal, the Axis Apartments Property had an “as-is” appraised value of $229,400,000 as of September 29, 2023 and a “prospective as complete – proposed” value of $256,800,000, which takes into account the executed Sonder Lease. The table below shows the appraiser’s “as-is” conclusions. Based on the “as-is” value of $229,400,000, the Cut-off Date LTV and Maturity Date LTV for the Axis Apartments Whole Loan are 59.3%.
| Axis Apartments Appraised Value |
| Property | Value(1) | Capitalization Rate |
| Axis Apartments | $229,400,000 | 5.25% |
Environmental. According to the Phase I environmental site assessment dated October 6, 2023, there was no evidence of any recognized environmental conditions at the Axis Apartments Property.
| Historical and Current Occupancy |
| 2020 | 2021(1) | 2022(1) | Current(2) |
| Axis Apartments | NAV | 83.3% | 96.6% | 92.5% |
| (1) | Historical occupancies represent the average annual occupancy as of December 31 for each respective year unless otherwise indicated. |
| (2) | Current occupancy is as of October 20, 2023. Occupancy includes 101 units that are currently being converted from office space to residential units and are leased by Sonder on a six-year term with two, three-year renewal options. The other 615 units not subject to the Sonder Lease are 91.2% leased. |
THE INFORMATION IN THIS STRUCTURAL AND COLLATERAL TERM SHEET IS NOT COMPLETE AND MAY BE AMENDED PRIOR TO THE TIME OF SALE. THIS TERM SHEET IS NOT AN OFFER TO SELL THESE SECURITIES AND IT IS NOT A SOLICITATION OF AN OFFER TO BUY THESE SECURITIES IN ANY JURISDICTION WHERE THE OFFER OR SALE IS NOT PERMITTED. |
| | 82 | |
| Structural and Collateral Term Sheet | | BMO 2024-C8 |
| No. 5 – Axis Apartments |
Operating History and Underwritten Net Cash Flow |
| | 2021 | 2022 | TTM(1)(2) | Underwritten(1) | Per Unit | %(3) | |
| Residential Rents In-Place | $15,244,057 | $15,292,584 | $15,538,339 | $18,381,399 | $25,672 | 78.2 | % |
| Commercial Rents In-Place | 3,464,089 | 3,425,895 | 3,445,151 | 657,439 | 918 | 2.8 | |
| Vacant Rent | 0 | 0 | 0 | 1,755,531 | 2,452 | 7.5 | |
| Gross Potential Rent | $18,708,146 | $18,718,479 | $18,983,490 | $20,794,369 | $29,042 | 88.5 | % |
| Other Income(4) | 2,156,196 | 2,408,174 | 2,437,123 | 2,697,714 | 3,768 | 11.5 | |
| Net Rental Income | $20,864,342 | $21,126,653 | $21,420,613 | $23,492,083 | $32,810 | 100.0 | % |
| (Vacancy/Concessions/Credit Loss) | (3,995,972) | (3,115,816) | (2,884,302) | (1,755,531) | (2,452) | (7.5 | ) |
| Effective Gross Income | $16,868,370 | $18,010,837 | $18,536,311 | $21,736,552 | $30,358 | 92.5 | % |
| Total Expenses(5) | $8,052,400 | $8,726,272 | $8,365,611 | $8,473,297 | $11,834 | 39.0 | % |
| Net Operating Income | $8,815,970 | $9,284,565 | $10,170,700 | $13,263,255 | $18,524 | 61.0 | % |
| Total TI/LC, Capex/RR | 0 | 0 | 0 | 226,842 | 317 | 1.0 | |
| Net Cash Flow | $8,815,970 | $9,284,565 | $10,170,700 | $13,036,413 | $18,207 | 60.0 | % |
| (1) | The increase from TTM Net Operating Income to Underwritten Net Operating Income and TTM Residential Rents In-Place to Underwritten Residential Rents In-Place along with the accompanying decrease from TTM Commercial Rents In-Place to Underwritten Commercial Rents In-Place is primarily attributable to the borrower sponsors converting former vacant commercial space into 101 multifamily units on floors six through 10 of the Axis Apartments Property. |
| (2) | The TTM column represents the trailing twelve-month period ending July 31, 2023. |
| (3) | The % column represents percentage of Net Rental Income for all revenue lines and represents percentage of Effective Gross Income for the remainder of the fields. |
| (4) | Other Income consists of parking income, water/sewer usage fees, commission laundry income, trash removal usage fees and other miscellaneous income for the apartments and tenant’s pro-rata obligation for real estate tax expense and CAM expenses for the commercial component. |
| (5) | Total Expenses consist of repairs and maintenance, utilities, advertising and marketing, general and administrative and non-revenue units. |
The Market. The Axis Apartments Property is located at 441 East Erie Street in the Near North neighborhood of Chicago, Illinois, just north of Chicago’s CBD. Primary access to the neighborhood is provided by Chicago Avenue, North Avenue and La Salle Street.
According to the appraisal, the Axis Apartments Property is located in the Streeterville/River North apartment submarket of the Chicago MSA. As of the second quarter of 2023, the Streeterville/River North apartment submarket had a total inventory of 52,058 units, a vacancy rate of 4.9% and effective rent of $2,784 per unit.
According to the appraisal, the 2023 population within a one-, three- and five-mile radius of the Axis Apartments Property was 82,421, 328,425 and 728,820, respectively. The 2023 average household income within the same radii was $185,238, $177,282 and $155,758, respectively.
THE INFORMATION IN THIS STRUCTURAL AND COLLATERAL TERM SHEET IS NOT COMPLETE AND MAY BE AMENDED PRIOR TO THE TIME OF SALE. THIS TERM SHEET IS NOT AN OFFER TO SELL THESE SECURITIES AND IT IS NOT A SOLICITATION OF AN OFFER TO BUY THESE SECURITIES IN ANY JURISDICTION WHERE THE OFFER OR SALE IS NOT PERMITTED. |
| | 83 | |
| Structural and Collateral Term Sheet | | BMO 2024-C8 |
| No. 5 – Axis Apartments |
The following table presents certain information relating to comparable multifamily properties to the Axis Apartments Property:
| Multifamily Rent Comparables(1) |
Property Name | Distance from Subject | Year Built / Renovated | Occupancy | Number of Units | Average Unit Size | Average Rent Per Unit |
| Axis Apartments | – | 1986 / 2015 | 92.5%(2)(3) | 716(2) | 749 SF(2) | $2,192(2)(4) |
| The Bernardin | 0.5 Miles | 2005 / 2023 | 90.0% | 171 | 1,050 SF | $3,283 |
| One East Delaware | 0.7 Miles | 1989 / 2019 | 98.0% | 304 | 768 SF | $2,582 |
| Gold Cost City Club Apartments | 0.4 Miles | 1962 / 2016 | 95.0% | 145 | 812 SF | $2,253 |
1111 N. Dearborn Street | 0.9 Miles | 1981 / 2020 | 95.0% | 286 | 744 SF | $2,309 |
| 1000 N LaSalle | 1.0 Miles | 1980 / NAP | 96.0% | 148 | 793 SF | $2,213 |
| 65 East Scott | 0.9 Miles | 1975 / NAP | 100.0% | 230 | 697 SF | $2,056 |
| The Chicagoan | 0.5 Miles | 1990 / 2014 | 95.0% | 221 | 925 SF | $2,749 |
| Arrive Streeterville | 0.1 Miles | 1972 / 2019 | 97.0% | 1,061 | 739 SF | $2,232 |
| (2) | Based on the underwritten rent roll dated October 20, 2023. |
| (3) | Occupancy includes 101 units that are currently being converted from office space to residential units and are leased by Sonder on a six-year term. The other 615 units are 91.2% leased. |
| (4) | Does not include the 101 Sonder Units as each unit pays a monthly base rent of $2,990 regardless of the type of unit. |
The Borrower. The borrower is AH Axis Erie, LLC, a Delaware limited liability company and single purpose entity having at least one independent director in its organizational structure. Legal counsel to the borrower delivered a non-consolidation opinion in connection with the origination of the Axis Apartments Whole Loan.
The Borrower Sponsors. The borrower sponsors and non-recourse carveout guarantors are William O'Kane and Karen O'Kane. William O’Kane is the founder and head of Group Fox, Inc., a family owned real estate investment firm founded in 1978 that owns and operates over 4,000 apartments in 15 unique neighborhoods in Chicago, Illinois.
Property Management. The Axis Apartments Property is managed by Group Fox, Inc., a borrower affiliated management company.
Escrows and Reserves. At origination of the Axis Apartments Whole Loan, the borrower deposited approximately (i) $1,318,059 into a reserve account for real estate taxes, (ii) $216,815 into a reserve account for insurance premiums, (iii) $106,250 into a reserve account for immediate repairs, (iv) $1,812,061 in the form of a letter of credit into a reserve account for gap rent under the Sonder Lease, (v) $3,624,131 in the form of a letter of credit into a reserve account for one year of base rent under the Sonder Lease and (vi) $1,208,040 in the form of a letter of credit into a reserve account for free rent under the Sonder Lease.
Tax Escrows – On a monthly basis, the borrower is required to deposit into a real estate tax reserve 1/12th of the property taxes that the lender estimates will be payable over the next-ensuing 12-month period (initially estimated to be approximately $329,515).
Insurance Escrows – The borrower is required to deposit into an insurance reserve, on a monthly basis, 1/12th of the amount which will be sufficient to pay the insurance premiums due for the renewal of coverage afforded by such policies (initially estimated to be approximately $30,974).
Replacement Reserves – On a monthly basis, the borrower is required to deposit approximately $15,203 into a replacement reserve (approximately $250 per unit annually).
THE INFORMATION IN THIS STRUCTURAL AND COLLATERAL TERM SHEET IS NOT COMPLETE AND MAY BE AMENDED PRIOR TO THE TIME OF SALE. THIS TERM SHEET IS NOT AN OFFER TO SELL THESE SECURITIES AND IT IS NOT A SOLICITATION OF AN OFFER TO BUY THESE SECURITIES IN ANY JURISDICTION WHERE THE OFFER OR SALE IS NOT PERMITTED. |
| | 84 | |
| Structural and Collateral Term Sheet | | BMO 2024-C8 |
| No. 5 – Axis Apartments |
TI / LC Reserve – During the continuance of a Trigger Period (as defined below), the borrower is required to deposit into a tenant improvements and leasing commissions reserve account, on a monthly basis, approximately $1,433, for tenant improvements and leasing commissions incurred with respect to non-residential leases other than the Sonder Lease.
Lockbox / Cash Management. The Axis Apartments Whole Loan is structured with a springing lockbox and springing cash management. On the first occurrence of a Trigger Period, the borrower is required to establish a lender-controlled lockbox account, and is thereafter required to deposit, or cause the property manager to immediately deposit, all revenue received by the borrower or the property manager into such lockbox. Within five days after the first occurrence of a Trigger Period, the borrower is required to deliver a notice to all tenants under non-residential leases at the Axis Apartments Property directing them to remit rent and all other sums due under the applicable lease directly to the lender-controlled lockbox account. All funds deposited into the lockbox are required to be transferred on each business day to, or at the direction of, the borrower, unless a Trigger Period exists and the lender elects (in its sole and absolute discretion) to deliver a restricted account notice to the institution maintaining the lockbox account, in which case all funds in the lockbox account are required to be swept on each business day to a lender-controlled cash management account to be applied and disbursed in accordance with the Axis Apartments Whole Loan documents, and all excess cash flow funds remaining in the cash management account after the application of such funds in accordance with the Axis Apartments Whole Loan documents are required to be held by the lender in an excess cash flow reserve account as additional collateral for the Axis Apartments Whole Loan.
“Trigger Period” means a period (A) commencing upon the earliest of (i) the occurrence and continuance of an event of default under the Axis Apartments Whole Loan documents, (ii) the debt service coverage ratio being less than 1.05x (provided, however, that no Trigger Period will exist pursuant to this clause (ii) during any period that the DSCR Collateral Cure Conditions (as defined below) are satisfied), and (iii) the occurrence of a Specified Tenant Trigger Period (as defined below) (provided, however, that no Trigger Period will exist pursuant to this clause (iii) during any period that the Collateral Cure Conditions (as defined below) are satisfied); and (B) expiring upon (x) with regard to clause (i) above, the cure (if applicable) of such event of default under the Axis Apartments Whole Loan documents, (y) with regard to clause (ii) above, the date that the debt service coverage ratio is equal to or greater than 1.10x for two consecutive calendar quarters, and (z) with regard to clause (iii) above, a Specified Tenant Trigger Period ceasing to exist.
“Collateral Cure Conditions” will be deemed to exist if, within 10 days following the occurrence of the relevant Trigger Period, the borrower deposits into an account with the lender an amount equal to $3,624,120 (in the form of cash or a letter of credit) as additional collateral for the Axis Apartments Whole Loan, and which will only be returned to the borrower upon either (i) satisfaction of the Collateral Cure Release Conditions (as defined below) or (ii) full repayment of the Axis Apartments Whole Loan.
“Collateral Cure Release Conditions” will be deemed satisfied if either: (a) all applicable Trigger Periods for which the Collateral Cure Conditions have been satisfied in order to cause the cessation of such Trigger Period(s) cease to exist pursuant to the other terms and conditions of the definition of Trigger Period (and/or the definition of Specified Tenant Trigger Period, as applicable) without regard to the fact that any collateral has been posted hereunder to satisfy the Collateral Cure Conditions (e.g., (1) in the case of a Specified Tenant (as defined below) being in default under the applicable Specified Tenant lease, the conditions set forth in clause (i) of the definition of Specified Tenant Cure Conditions (as defined below) have been satisfied, or (2) in the case of a Trigger Period due to a low debt service coverage ratio, the conditions set forth in clause (B)(y) of the definition of Trigger Period have been satisfied); or (b)(i) no Trigger Period then exists (or would exist if the collateral posted to satisfy the Collateral Cure Conditions is released to the borrower), (ii) the debt yield equals or exceeds 9.25% and (iii) the Sonder Lease is no longer in place at the Axis Apartments Property and at least 90 of the individual dwelling units intended to be covered by the Sonder Lease as of origination of the Axis Apartments Whole Loan have been leased to other tenants by the borrower pursuant to residential leases.
THE INFORMATION IN THIS STRUCTURAL AND COLLATERAL TERM SHEET IS NOT COMPLETE AND MAY BE AMENDED PRIOR TO THE TIME OF SALE. THIS TERM SHEET IS NOT AN OFFER TO SELL THESE SECURITIES AND IT IS NOT A SOLICITATION OF AN OFFER TO BUY THESE SECURITIES IN ANY JURISDICTION WHERE THE OFFER OR SALE IS NOT PERMITTED. |
| | 85 | |
| Structural and Collateral Term Sheet | | BMO 2024-C8 |
| No. 5 – Axis Apartments |
“DSCR Collateral Cure Conditions” will be deemed to exist if (i) the Collateral Cure Conditions are satisfied and (ii) the debt service coverage ratio would, but for the exclusion of rental income from the Sonder Lease, equal or exceed 1.05x.
“Specified Tenant Trigger Period” means a period: (A) commencing upon the first to occur of (i) a Specified Tenant being in default under the applicable Specified Tenant lease, (ii) a Specified Tenant failing to be in actual, physical possession of its Specified Tenant space (or applicable portion thereof), (iii) a Specified Tenant failing to be open for business during customary hours and/or “going dark” in its Specified Tenant space (or applicable portion thereof), (iv) a Specified Tenant giving notice that it is terminating its lease for all or any portion of its Specified Tenant space (or applicable portion thereof), (v) any termination or cancellation of any Specified Tenant lease (including, without limitation, rejection in any bankruptcy or similar insolvency proceeding) and/or any Specified Tenant lease failing to otherwise be in full force and effect and (vi) any bankruptcy or similar insolvency of a Specified Tenant; and (B) expiring upon the lender’s receipt of evidence reasonably acceptable to the lender of the first to occur of (1) the satisfaction of the applicable Specified Tenant Cure Conditions or (2) the borrower leasing the entire Specified Tenant space (or applicable portion thereof) pursuant to one or more leases in accordance with the applicable terms and conditions of the Axis Apartments Whole Loan documents, the applicable tenant(s) under such lease(s) being in actual, physical occupancy of the space demised under its lease, all contingencies to effectiveness of such lease having expired or been satisfied, each such lease having commenced and the Specified Tenant having commenced paying full unabated rent.
“Specified Tenant Cure Conditions” means each of the following, as applicable: (i) the Specified Tenant has cured all defaults under the applicable Specified Tenant lease; (ii) the applicable Specified Tenant is in actual, physical possession of the Specified Tenant space (or applicable portion thereof), open to the public for business during customary hours and not “dark” in the Specified Tenant space (or applicable portion thereof); (iii) the applicable Specified Tenant has revoked or rescinded all termination or cancellation notices with respect to the applicable Specified Tenant lease and has re-affirmed the applicable Specified Tenant lease as being in full force and effect; (iv) with respect to any applicable bankruptcy or insolvency proceedings involving the applicable Specified Tenant and/or the applicable Specified Tenant lease, the applicable Specified Tenant is no longer insolvent or subject to any bankruptcy or insolvency proceedings and has affirmed the applicable Specified Tenant lease pursuant to a final, non-appealable order of a court of competent jurisdiction; and (v) the applicable Specified Tenant is paying full, unabated rent under the applicable Specified Tenant lease.
“Specified Tenant” means, as applicable, (i) Sonder, together with any replacement, successor and/or assigns thereof in accordance with the terms of the Axis Apartments Whole Loan documents and (ii) any guarantor of any Specified Tenant lease (including without limitation, Sonder).
Subordinate and Mezzanine Debt. None.
Permitted Future Mezzanine Debt. Not permitted.
Partial Release. Not permitted.
Ground Lease. None.
THE INFORMATION IN THIS STRUCTURAL AND COLLATERAL TERM SHEET IS NOT COMPLETE AND MAY BE AMENDED PRIOR TO THE TIME OF SALE. THIS TERM SHEET IS NOT AN OFFER TO SELL THESE SECURITIES AND IT IS NOT A SOLICITATION OF AN OFFER TO BUY THESE SECURITIES IN ANY JURISDICTION WHERE THE OFFER OR SALE IS NOT PERMITTED. |
| | 86 | |
| Structural and Collateral Term Sheet | | BMO 2024-C8 |
| No. 6 – AHF Crossville Portfolio |
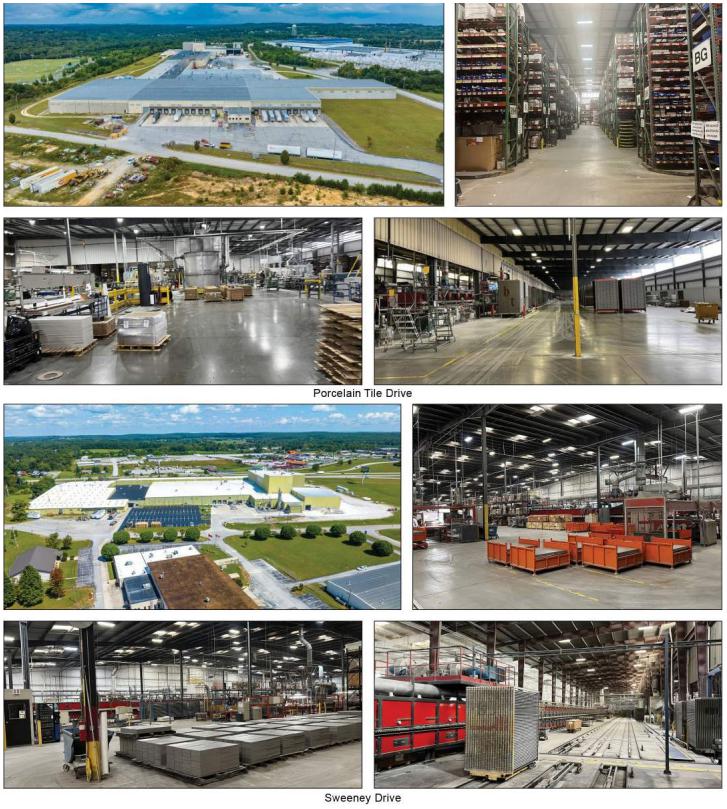
THE INFORMATION IN THIS STRUCTURAL AND COLLATERAL TERM SHEET IS NOT COMPLETE AND MAY BE AMENDED PRIOR TO THE TIME OF SALE. THIS TERM SHEET IS NOT AN OFFER TO SELL THESE SECURITIES AND IT IS NOT A SOLICITATION OF AN OFFER TO BUY THESE SECURITIES IN ANY JURISDICTION WHERE THE OFFER OR SALE IS NOT PERMITTED. |
| | 87 | |
| Structural and Collateral Term Sheet | | BMO 2024-C8 |
| No. 6 – AHF Crossville Portfolio |
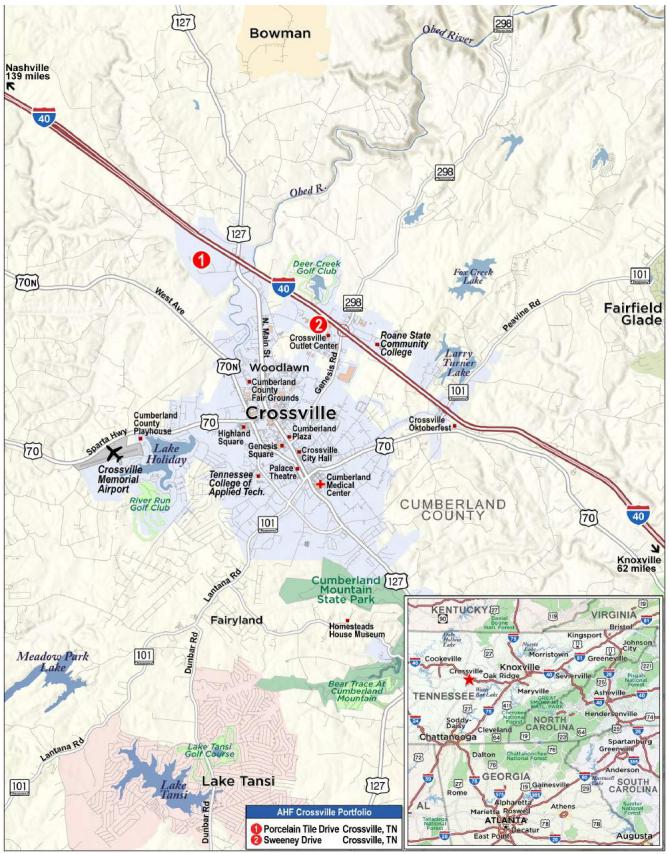
THE INFORMATION IN THIS STRUCTURAL AND COLLATERAL TERM SHEET IS NOT COMPLETE AND MAY BE AMENDED PRIOR TO THE TIME OF SALE. THIS TERM SHEET IS NOT AN OFFER TO SELL THESE SECURITIES AND IT IS NOT A SOLICITATION OF AN OFFER TO BUY THESE SECURITIES IN ANY JURISDICTION WHERE THE OFFER OR SALE IS NOT PERMITTED. |
| | 88 | |
| Structural and Collateral Term Sheet | | BMO 2024-C8 |
| No. 6 – AHF Crossville Portfolio |
| Mortgage Loan Information | | Property Information |
| Mortgage Loan Seller: | CREFI | | Single Asset / Portfolio: | Portfolio |
| Original Principal Balance: | $37,300,000 | | Title: | Fee |
| Cut-off Date Principal Balance: | $37,300,000 | | Property Type – Subtype: | Industrial – Manufacturing/ Warehouse |
| % of IPB: | 5.5% | | Net Rentable Area (SF): | 949,281 |
| Loan Purpose: | Acquisition | | Location: | Crossville, TN |
| Borrower: | AGNL Tile, L.L.C. | | Year Built / Renovated(3): | Various / Various |
| Borrower Sponsors: | Angelo, Gordon & Co., L.P. and TPG, Inc. | | Occupancy: | 100.0% |
| Interest Rate: | 7.01000% | | Occupancy Date: | 2/16/2024 |
| Note Date: | 2/16/2024 | | 4th Most Recent NOI (As of)(4): | NAV |
| Maturity Date: | 3/6/2034 | | 3rd Most Recent NOI (As of)(4): | NAV |
| Interest-only Period: | 120 months | | 2nd Most Recent NOI (As of)(4): | NAV |
| Original Term: | 120 months | | Most Recent NOI (As of)(4): | NAV |
| Original Amortization Term: | None | | UW Economic Occupancy: | 95.0% |
| Amortization Type: | Interest Only | | UW Revenues: | $5,629,091 |
| Call Protection: | YM1(24),DorYM1(89),O(7) | | UW Expenses: | $879,548 |
| Lockbox / Cash Management: | Hard / Springing | | UW NOI: | $4,749,543 |
| Additional Debt(1): | No | | UW NCF: | $4,437,144 |
| Additional Debt Balance(1): | N/A | | Appraised Value / Per SF: | $62,000,000 / $65 |
| Additional Debt Type(1): | N/A | | Appraisal Date: | 1/5/2024 |
| | | | | |
| Escrows and Reserves(2) | | Financial Information |
| | Initial | Monthly | Initial Cap | | Cut-off Date Loan / SF: | $39 | |
| Taxes: | $0 | Springing | N/A | | Maturity Date Loan / SF: | $39 | |
| Insurance: | $0 | Springing | N/A | | Cut-off Date LTV: | 60.2% | |
| Replacement Reserves: | $0 | Springing | N/A | | Maturity Date LTV: | 60.2% | |
| TI / LC: | $0 | $0 | N/A | | UW NCF DSCR: | 1.67x | |
| | | | | | UW NOI Debt Yield: | 12.7% | |
| | | | | | | | |
| Sources and Uses |
| Sources | Proceeds | % of To | tal | | Uses | Proceeds | % of T | otal |
| Mortgage Loan | $37,300,000 | 59.3 | % | | Purchase Price | 61,425,000 | 97.7 | % |
| Sponsor Equity | 24,744,287 | 39.3 | | | Closing Costs | 1,474,913 | 2.3 | |
| Other Sources | 855,627 | 1.4 | | | | | |
| Total Sources | $62,899,913 | 100.0 | % | | Total Uses | $62,899,913 | 100.0 | % |
| (1) | In connection with the origination of the AHF Crossville Portfolio Mortgage Loan (as defined below), the related borrower, AGNL Tile, L.L.C., entered into an intercompany loan with its sole member, AGNL Tile Holdco, L.L.C. See “Description of the Mortgage Pool—Additional Indebtedness—Permitted Unsecured Debt and Other Debt” in the Preliminary Prospectus. |
| (2) | For a full description of Escrows and Reserves, see “Escrows and Reserves” below. |
| (3) | See “Portfolio Summary” below. |
| (4) | Historical financial information is not available because the AHF Crossville Portfolio Properties (as defined below) were acquired in a sale-leaseback transaction at the origination of the AHF Crossville Portfolio Mortgage Loan (as defined below). |
The Loan. The sixth largest mortgage loan (the “AHF Crossville Portfolio Mortgage Loan”) is secured by the borrower’s fee interest in two industrial manufacturing and warehouse properties totaling 949,281 square feet located in Crossville, Tennessee (the “AHF Crossville Portfolio Properties”). The AHF Crossville Portfolio Mortgage Loan has an outstanding principal balance as of the Cut-off Date of $37,300,000. The AHF Crossville Portfolio Mortgage Loan was originated on February 16, 2024 by CREFI and accrues interest at a fixed rate of 7.01000% per annum. The AHF Crossville Portfolio Mortgage Loan has an initial term of ten years and is interest-only for the full term. The scheduled maturity date of the AHF Crossville Portfolio Mortgage Loan is the payment date that occurs on March 6, 2034.
The Properties. The AHF Crossville Portfolio Properties are comprised of a 586,477 square foot industrial manufacturing and warehouse property located at 301 Porcelain Tile Drive in Crossville, Tennessee (the “Porcelain Tile Drive Property”)
THE INFORMATION IN THIS STRUCTURAL AND COLLATERAL TERM SHEET IS NOT COMPLETE AND MAY BE AMENDED PRIOR TO THE TIME OF SALE. THIS TERM SHEET IS NOT AN OFFER TO SELL THESE SECURITIES AND IT IS NOT A SOLICITATION OF AN OFFER TO BUY THESE SECURITIES IN ANY JURISDICTION WHERE THE OFFER OR SALE IS NOT PERMITTED. |
| | 89 | |
| Structural and Collateral Term Sheet | | BMO 2024-C8 |
| No. 6 – AHF Crossville Portfolio |
and a 362,804 square foot industrial manufacturing and warehouse property located at 297-349 Sweeney Drive in Crossville, Tennessee (the “Sweeney Drive Property”).
The following table presents certain information relating to the AHF Crossville Portfolio Properties:
| Portfolio Summary |
| Property Name | Year Built / Renovated(1) | Sq. Ft.(2) | Occupancy(2) | Allocated Mortgage Loan Cut-off Date Balance | % of Allocated Mortgage Loan Cut-off Date Balance | Appraised Value(1) | U/W NOI | % of U/W NOI |
| Porcelain Tile Drive | 2000 / 2019 | 586,477 | 100.0% | $23,499,000 | 63.0% | $38,300,000 | $2,933,340 | 61.8% |
| Sweeney Drive | 1980, 1985, 1995, 2005 / NAP | 362,804 | 100.0% | 13,801,000 | 37.0% | 23,700,000 | 1,816,203 | 38.2% |
| Total / Wtd. Avg. | | 949,281 | 100.0% | $37,300,000 | 100.0% | $62,000,000 | $4,749,543 | 100.0% |
| (2) | Based on the underwritten rent rolls dated February 16, 2024. |
Porcelain Tile Drive
The Porcelain Tile Drive Property is comprised of an industrial manufacturing and warehouse building totaling 586,477 square feet located at 301 Porcelain Tile Drive in Crossville, Tennessee. The Porcelain Tile Drive Property was originally constructed in 2000, with several additions between 2007 and 2019. The Porcelain Tile Drive Property is comprised of one building situated on an approximately 43.2-acre site and contains 22 to 38-foot clear heights, 26 dock-high loading doors and 17 drive-in doors.
Sweeney Drive
The Sweeney Drive Property is comprised of a four-building industrial manufacturing and warehouse facility totaling 362,804 square feet located at 297-349 Sweeney Drive in Crossville, Tennessee. The Sweeney Drive Property was originally constructed in 1980, with additions in 1985, 1995 and 2005. The Sweeney Drive Property is comprised of four buildings situated on a 29.44-acre site and contains 18 to 70-foot clear heights, nine dock-high loading doors and 17 drive-in doors.
Sole Tenant. The AHF Crossville Portfolio Properties are 100.0% leased to a single tenant, AHF, LLC (“AHF Products”), a leader in hardwood and vinyl flooring with a family of brands serving the residential and commercial markets. AHF Products employs over 2,400 employees. AHF Products recently acquired Crossville, Inc. in October 2023. Crossville, Inc. is a porcelain tile manufacturer for both commercial and residential applications. The AHF Crossville Portfolio consists of 100% of Crossville, Inc.’s footprint and revenue. AHF Products has a current lease term at the AHF Crossville Portfolio Properties through March 2049 with two, ten-year renewal options and no termination options.
Appraisals. According to the appraisals, as of January 5, 2024, the AHF Crossville Portfolio Properties had an aggregate “as-is” appraised value of $62,000,000 as of January 5, 2024 and an aggregate hypothetical market value “as dark” of $44,600,000 as of January 5, 2024. The table below shows the appraiser’s “as-is” conclusions. Based on the “as dark” value of $44,600,000, the Cut-off Date LTV and Maturity Date LTV for the AHF Crossville Portfolio Mortgage Loan are each 83.6%.
| AHF Crossville Portfolio(1) |
| Property | Value | Capitalization Rate |
| Porcelain Tile Drive | $38,300,000 | 8.00% |
| Sweeney Drive | $23,700,000 | 8.00% |
| Total / Wtd. Avg(2) | $62,000,000 | 8.00% |
| (2) | Total / Wtd. Avg is based on the appraised value of each AHF Crossville Portfolio Property. |
Environmental. According to the Phase I environmental reports dated January 19, 2024, there was no evidence of any recognized environmental conditions at the AHF Crossville Portfolio Properties.
THE INFORMATION IN THIS STRUCTURAL AND COLLATERAL TERM SHEET IS NOT COMPLETE AND MAY BE AMENDED PRIOR TO THE TIME OF SALE. THIS TERM SHEET IS NOT AN OFFER TO SELL THESE SECURITIES AND IT IS NOT A SOLICITATION OF AN OFFER TO BUY THESE SECURITIES IN ANY JURISDICTION WHERE THE OFFER OR SALE IS NOT PERMITTED. |
| | 90 | |
| Structural and Collateral Term Sheet | | BMO 2024-C8 |
| No. 6 – AHF Crossville Portfolio |
The following table presents certain information relating to the historical and current occupancy of the AHF Crossville Portfolio Properties:
| Historical and Current Occupancy(1)(2) |
| 2021 | 2022 | 2023 | Current |
| NAV | NAV | NAV | 100.0% |
| (1) | Based on the underwritten rent rolls dated February 16, 2024. |
| (2) | Historical Occupancy is not available because the borrower sponsor acquired the AHF Crossville Portfolio Properties via a sale leaseback transaction at origination of the AHF Crossville Portfolio Mortgage Loan. |
The following table presents certain information relating to the sole tenant at the AHF Crossville Portfolio Properties:
| Tenant Summary(1) |
Tenant | Credit Rating (Moody’s/
S&P/Fitch) | Net Rentable Area (SF) | % of Net Rentable Area | UW
Base Rent(2) | UW Base Rent
Per SF(2) | % of Total UW Base Rent(2) | Lease Expiration | Termination Option (Y/N) | Renewal Option |
| AHF, LLC | NR/NR/NR | 949,281 | 100.0 | % | $5,045,811 | $5.32 | 100.0% | 3/31/2049 | N | 2 x 10 Yr |
| Total Occupied | | 949,281 | 100.0 | % | $5,045,811 | $5.32 | 100.0% | | | |
| Vacant | | 0 | 0.0 | | | | | | | |
| Total | | 949,281 | 100.0 | % | | | | | | |
| (1) | Based on the underwritten rent rolls dated February 16, 2024. |
| (2) | UW Base Rent, UW Base Rent PSF and % of Total UW Base Rent include rent steps totaling $146,965 through January 1, 2025. |
The following table presents certain information relating to tenant lease expiration at the AHF Crossville Portfolio Properties:
| Lease Rollover Schedule(1) |
| Year | Number of Leases Expiring | Net Rentable Area Expiring | % of NRA Expiring | UW Base Rent Expiring(2) | % of UW Base Rent Expiring(2) | Cumulative Net Rentable Area Expiring | Cumulative % of NRA Expiring | Cumulative UW Base Rent Expiring(2) | Cumulative % of UW Base Rent Expiring(2) |
| Vacant | NAP | 0 | 0.0% | NAP | NAP | 0 | 0.0% | NAP | NAP |
| 2024 & MTM | 0 | 0 | 0.0 | $0 | 0.0% | 0 | 0.0% | $0 | 0.0% |
| 2025 | 0 | 0 | 0.0 | 0 | 0.0 | 0 | 0.0% | $0 | 0.0% |
| 2026 | 0 | 0 | 0.0 | 0 | 0.0 | 0 | 0.0% | $0 | 0.0% |
| 2027 | 0 | 0 | 0.0 | 0 | 0.0 | 0 | 0.0% | $0 | 0.0% |
| 2028 | 0 | 0 | 0.0 | 0 | 0.0 | 0 | 0.0% | $0 | 0.0% |
| 2029 | 0 | 0 | 0.0 | 0 | 0.0 | 0 | 0.0% | $0 | 0.0% |
| 2030 | 0 | 0 | 0.0 | 0 | 0.0 | 0 | 0.0% | $0 | 0.0% |
| 2031 | 0 | 0 | 0.0 | 0 | 0.0 | 0 | 0.0% | $0 | 0.0% |
| 2032 | 0 | 0 | 0.0 | 0 | 0.0 | 0 | 0.0% | $0 | 0.0% |
| 2033 | 0 | 0 | 0.0 | 0 | 0.0 | 0 | 0.0% | $0 | 0.0% |
| 2034 | 0 | 0 | 0.0 | 0 | 0.0 | 0 | 0.0% | $0 | 0.0% |
| 2035 & Beyond | 1 | 949,281 | 100.0 | 5,045,811 | 100.0 | 949,281 | 100.0% | $5,045,811 | 100.0% |
| Total | 1 | 949,281 | 100.0% | $5,045,811 | 100.0% | | | | |
| (1) | Based on the underwritten rent rolls dated February 16, 2024. |
| (2) | UW Base Rent Expiring, % of UW Base Rent Expiring, Cumulative UW Base Rent Expiring and Cumulative % of UW Base Rent Expiring include rent steps totaling $146,965 through January 1, 2025. |
THE INFORMATION IN THIS STRUCTURAL AND COLLATERAL TERM SHEET IS NOT COMPLETE AND MAY BE AMENDED PRIOR TO THE TIME OF SALE. THIS TERM SHEET IS NOT AN OFFER TO SELL THESE SECURITIES AND IT IS NOT A SOLICITATION OF AN OFFER TO BUY THESE SECURITIES IN ANY JURISDICTION WHERE THE OFFER OR SALE IS NOT PERMITTED. |
| | 91 | |
| Structural and Collateral Term Sheet | | BMO 2024-C8 |
| No. 6 – AHF Crossville Portfolio |
The following table presents certain information relating to the underwritten cash flows at the AHF Crossville Portfolio Properties:
| Operating History and Underwriting Net Cash Flow(1)(2) |
| | Underwritten | Per Square Foot | %(3) |
| Base Rent | $4,898,846 | $5.16 | 82.7% |
| Contractual Rent Steps | 146,965 | 0.15 | 2.5 |
| Gross Potential Rent | $5,045,811 | $5.32 | 85.2% |
| Total Reimbursements | 879,548 | 0.93 | 14.8 |
| Total Gross Income | $5,925,359 | $6.24 | 100.0% |
| (Vacancy / Credit Loss) | (296,268) | (0.31) | (5.0) |
| Effective Gross Income | $5,629,091 | $5.93 | 95.0% |
| Management Fee | 168,873 | 0.18 | 3.0 |
| Real Estate Taxes | 122,120 | 0.13 | 2.2 |
| Insurance | 132,900 | 0.14 | 2.4 |
| Other Expenses | 455,655 | 0.48 | 8.1 |
| Total Expenses | $879,548 | $0.93 | 15.6% |
| Net Operating Income | $4,749,543 | $5.00 | 84.4% |
| Capital Expenditures | 142,392 | 0.15 | 2.5 |
| TI/LC | 170,007 | 0.18 | 3.0 |
| Net Cash Flow | $4,437,144 | $4.67 | 78.8% |
| (1) | Based on the underwritten rent rolls dated as of February 16, 2024. |
| (2) | Historical Financials are not available because the borrower sponsor acquired the AHF Crossville Portfolio Properties via a sale leaseback transaction at origination of the AHF Crossville Portfolio Mortgage Loan. |
| (3) | % column represents percent of Total Gross Income for all revenue lines and represents percent of Effective Gross Income for the remainder of fields. |
The Market. The AHF Crossville Portfolio Properties are located in Crossville, Tennessee within Cumberland County. As of 2023, Cumberland County had a population of 63,387 and is situated along I-40, approximately 70 miles west of Knoxville and 113 miles east of Nashville. Tenants at industrial properties in Crossville and nearby towns include, but are not limited to, Perdue Farms, Academy Sports + Outdoors, Stonepeak Ceramics, CoLinx, Mizkan Americas, TTi Floor Care, and Atmus, among others.
The AHF Crossville Portfolio Properties are located in the Tennessee East Area submarket of the Knoxville metropolitan statistical area (“MSA”). The Knoxville MSA’s major industries include services, manufacturing and retail trade. The three largest employers in the MSA are Y-12 National Security Complex, Covenant Health and the University of Tennessee. According to the appraisal, as of the trailing four quarters ending in the third quarter of 2023, the Tennessee East Area submarket reported a total inventory of approximately 59.6 million square feet of industrial space, a vacancy rate of 3.2% and an average rental rate of $5.19 per square foot.
According to the appraisal, the 2023 total population within a one-, three- and five-mile radius of the AHF Crossville Portfolio Properties is 762, 10,036 and 21,929, respectively. Furthermore, the 2023 average household income within the same radii is $80,938, $59,407 and $65,405, respectively.
THE INFORMATION IN THIS STRUCTURAL AND COLLATERAL TERM SHEET IS NOT COMPLETE AND MAY BE AMENDED PRIOR TO THE TIME OF SALE. THIS TERM SHEET IS NOT AN OFFER TO SELL THESE SECURITIES AND IT IS NOT A SOLICITATION OF AN OFFER TO BUY THESE SECURITIES IN ANY JURISDICTION WHERE THE OFFER OR SALE IS NOT PERMITTED. |
| | 92 | |
| Structural and Collateral Term Sheet | | BMO 2024-C8 |
| No. 6 – AHF Crossville Portfolio |
The following table presents certain market information with respect to the AHF Crossville Portfolio Properties:
| Summary of Comparable Sales(1) |
| Property Name | Tenant | Suite Size (SF) | Commencement | Lease Term (Mos.) | Base Rent PSF |
| AHF Crossville Portfolio(2) | AHF, LLC | 949,281 SF | Feb - 2024 | 300 Mos. | $5.16 |
| Phoenix Stamping Building | Phoenix Stamping | 215,000 SF | Sept – 2023 | 120 Mos. | $5.06 |
| Phoenix - Huntsville II | American Hyperion Solar | 1,361,882 SF | August – 2023 | 87 Mos. | $6.07 |
| 607 Meacham Rd | Dura Supreme Cabinetry | 309,620 SF | April – 2023 | 144 Mos. | $4.35 |
| Shop HQ (iMedia Brands) | Shop HQ (iMedia Brands) | 608,624 SF | April – 2023 | 300 Mos. | $5.27 |
| 10625963 - Blythewood | Intertape Polymer Corp | 350,563 SF | September – 2022 | 240 Mos. | $5.65 |
| 2700 West Front Street | Kewaunee Scientific | 413,000 SF | March – 2022 | 240 Mos. | $4.59 |
| (2) | Based on the underwritten rent rolls dated February 16, 2024. |
The Borrower. The borrower is AGNL Tile, L.L.C., a Delaware limited liability company and single purpose entity having at least one independent director in its organizational structure. Legal counsel to the borrower delivered a non-consolidation opinion in connection with the origination of the AHF Crossville Portfolio Mortgage Loan.
The Borrower Sponsors. The borrower sponsors are Angelo, Gordon & Co., L.P. and TPG, Inc. and the non-recourse carveout guarantors are AG Net Lease IV Corp., AG Net Lease IV (Q) Corp. and AG Net Lease Realty Fund IV Investments (H-1), L.P., severally (but not jointly), each of which is a subsidiary of Angelo Gordon’s Net Lease Realty Fund IV. Angelo Gordon is a privately-held registered investment advisor dedicated to alternative investing. The firm was founded in 1988 and currently manages approximately $78 billion. Angelo Gordon has experience in a broad range of absolute return strategies for both institutional and high net worth investors. Angelo Gordon began investing in commercial real estate in 1993 and currently manages a portfolio of over $45 billion in real estate assets across the globe.
Property Management. The AHF Crossville Portfolio Properties are currently self-managed.
Escrows and Reserves. At origination of the AHF Crossville Portfolio Mortgage Loan, the borrower was not required to fund any initial reserves pursuant to the loan agreement.
Immediate Repairs – The borrower is not obligated to fund an immediate repairs reserve provided that the repairs are the responsibility of the Specified Tenant (as defined below) and are being completed by Specified Tenant. However, pursuant to the lease with AHF Products and an escrow agreement among AHF Products, the borrower and Fidelity National Title Insurance Company (“FNTIC”), as escrow agent, $500,000 was reserved by the borrower, in its capacity as landlord, to cover the cost of immediate repairs that AHF Products is required to either complete or arrange for the completion of pursuant to its lease. After completion of any immediate repairs, AHF Products will provide the borrower (as landlord) with a signed certificate stating that the repair has been fully completed and complies with the applicable requirements of its lease. Within 5 business days of the borrower’s determination that all draw conditions have been met, the borrower will instruct FNTIC to disburse the amount requested by AHF Products. Notably, AHF Products must request at least $100,000 in each disbursement request, and thus can only make up to 5 disbursement requests.
Tax Escrows – On a monthly basis during a Tax Trigger Period (as defined below), the borrower is required to deposit 1/12th of the property taxes that the lender estimates will be payable over the next-ensuing 12-month period.
Insurance Escrows – On a monthly basis during an Insurance Trigger Period (as defined below), the borrower is required to deposit 1/12th of the amount which will be sufficient to pay the insurance premiums due for the renewal of coverage afforded by such policies.
Replacement Reserves – On a monthly basis during a Replacement Reserve Trigger Period (as defined below), the borrower is required to escrow $11,866 for replacement reserves.
THE INFORMATION IN THIS STRUCTURAL AND COLLATERAL TERM SHEET IS NOT COMPLETE AND MAY BE AMENDED PRIOR TO THE TIME OF SALE. THIS TERM SHEET IS NOT AN OFFER TO SELL THESE SECURITIES AND IT IS NOT A SOLICITATION OF AN OFFER TO BUY THESE SECURITIES IN ANY JURISDICTION WHERE THE OFFER OR SALE IS NOT PERMITTED. |
| | 93 | |
| Structural and Collateral Term Sheet | | BMO 2024-C8 |
| No. 6 – AHF Crossville Portfolio |
“Tax Trigger Period” means each monthly payment date during any period when (i) a Trigger Period (as defined below) is then continuing and (ii) neither the borrower nor the Specified Tenant has (A) timely paid the taxes directly to the appropriate taxing authority and (B) provided evidence of such payment to the lender.
“Insurance Trigger Period” means any period when (i) a Trigger Period is then continuing and (ii) neither the borrower nor the Specified Tenant has (A) timely paid the insurance premiums due on the insurance policies required under the AHF Crossville Portfolio Mortgage Loan documents to the issuer of such insurance policies and (B) provided evidence of such payment to the lender.
“Replacement Reserve Trigger Period” means each monthly payment date during any period when: (i) a Trigger Period is then continuing and (ii) neither the borrower nor the Specified Tenant has diligently made the replacements and/or alterations to either the Porcelain Tile Drive Property or the Sweeney Drive Property.
Lockbox / Cash Management. The AHF Crossville Portfolio Mortgage Loan is structured with a hard lockbox and springing cash management. The borrower is required to deliver a notice to the tenant directing it to remit all payments under the lease directly to the lender-controlled lockbox. The borrower is required to cause revenue received by the borrower (and if the AHF Crossville Portfolio Properties are managed by a third party, the property manager) from the AHF Crossville Portfolio Properties to be immediately deposited into such lockbox. All funds deposited into the lockbox are required to be transferred on each business day to or at the direction of the borrower unless a Trigger Period exists. Upon the occurrence and during the continuance of a Trigger Period, all funds in the lockbox account are required to be swept on each business day to a cash management account under the control of the lender to be applied and disbursed in accordance with the AHF Crossville Portfolio Mortgage Loan documents, and all excess cash flow funds remaining in the cash management account after the application of such funds in accordance with the AHF Crossville Portfolio Mortgage Loan documents are required to be held by the lender in an excess cash flow reserve account and as additional collateral for the AHF Crossville Portfolio Mortgage Loan, subject to the Excess Cash Flow Cap (as defined below), as and when applicable, as described below. Upon the cure of the applicable Trigger Period, so long as no other Trigger Period exists, the lender is required to return any amounts remaining on deposit in the excess cash flow reserve account to the borrower. Upon an event of default under the AHF Crossville Portfolio Mortgage Loan documents, the lender may apply funds to the AHF Crossville Portfolio Mortgage Loan in such order, priority and proportions as the lender deems proper.
“Trigger Period” means a period (A) commencing upon the earliest of (i) the occurrence and continuance of an event of default under the AHF Crossville Portfolio Mortgage Loan documents, (ii) the occurrence of a DSCR Event (as defined below) or (iii) the occurrence of a Specified Tenant Trigger Period (as defined below), and (B) expiring upon (x) with regard to clause (i) above, the cure (if applicable) of such event of default under the AHF Crossville Portfolio Mortgage Loan documents, (y) with regard to clause (ii) above, the date that the debt service coverage ratio is equal to or greater than 1.20x for two consecutive calendar quarters; provided that if the DSCR Event occurs solely because of the events described in clause (A)(i) or (A)(iii) of the definition of Specified Tenant Trigger Period below and the borrower cures the same by depositing additional cash collateral or a letter of credit into the excess cash flow account, any such amounts will be included in calculating whether a DSCR Event occurred, and (z) with regard to clause (iii) above, the satisfaction of the Specified Tenant Cure Conditions (as defined below).
“Specified Tenant Trigger Period” means a period (A) commencing upon the first to occur of (i) an event of default by the Specified Tenant under the Specified Tenant lease arising directly as result of the Specified Tenant’s failure to be in actual, physical possession of, or abandoning, the Specified Tenant space (or applicable portion thereof), (ii) any termination or cancellation of the Specified Tenant lease (including, without limitation, rejection in any bankruptcy or similar insolvency proceeding) or (iii) any bankruptcy or similar insolvency of the Specified Tenant, and (B) expiring upon the lender’s receipt of evidence reasonably acceptable to the lender (which such evidence includes, without limitation, a duly executed estoppel certificate from the Specified Tenant in form and substance acceptable to the lender) of the satisfaction of the applicable Specified Tenant Cure Conditions.
“Specified Tenant Cure Conditions” mean (A) with respect to clause (A)(i) of the definition of Specified Tenant Trigger Period, the lender’s receipt of satisfactory evidence that any event of default by the Specified Tenant under the Specified Tenant lease arising directly as a result of the Specified Tenant’s failure to be in actual, physical possession of, or abandoning the Specified Tenant space (or applicable portion thereof) has been cured, or, in the event that the Excess Cash Flow Cap Conditions (as defined below) are satisfied in full, the earlier date that the amount on deposit in the excess cash flow account is equal to the Excess Cash Flow Cap, (B) with respect to clause (A)(ii) of the definition of Specified
THE INFORMATION IN THIS STRUCTURAL AND COLLATERAL TERM SHEET IS NOT COMPLETE AND MAY BE AMENDED PRIOR TO THE TIME OF SALE. THIS TERM SHEET IS NOT AN OFFER TO SELL THESE SECURITIES AND IT IS NOT A SOLICITATION OF AN OFFER TO BUY THESE SECURITIES IN ANY JURISDICTION WHERE THE OFFER OR SALE IS NOT PERMITTED. |
| | 94 | |
| Structural and Collateral Term Sheet | | BMO 2024-C8 |
| No. 6 – AHF Crossville Portfolio |
Tenant Trigger Period, the date the Specified Tenant space has been re-leased pursuant to one or more replacement leases approved by the lender in accordance with the AHF Crossville Portfolio Mortgage Loan documents and the tenant(s) thereunder are in actual physical occupancy of the Specified Tenant space and paying full unabated rent, and (C) with respect to clause (A)(iii) of the definition of Specified Tenant Trigger Period, the earliest to occur of: (i) the date that the Specified Tenant is no longer insolvent or subject to any bankruptcy or insolvency proceedings and has affirmed the Specified Tenant lease pursuant to a final, non-appealable order of a court of competent jurisdiction, (ii) if the Specified Tenant lease is assumed or assigned to a new entity in connection with such proceedings, the date the bankruptcy court has issued a final order approving the Specified Tenant’s reorganization plan, (iii) if the Specified Tenant lease is rejected or otherwise terminated due to any bankruptcy or insolvency proceedings, the date the Specified Tenant space has been re-leased pursuant to one or more replacement leases approved by the lender in accordance with the AHF Crossville Portfolio Mortgage Loan documents and the tenants thereunder are in actual physical occupancy of the Specified Tenant space and paying full unabated rent, or (iv) if the Excess Cash Flow Cap Conditions are satisfied in full, the date that the amount in the excess cash flow account is equal to the Excess Cash Flow Cap.
“Excess Cash Flow Cap” means an amount equal to 18 months of base rent payable under the Specified Tenant lease.
“Excess Cash Flow Cap Conditions” means (a) a Trigger Period exists solely as a result of a Specified Tenant Trigger Period, (b) no other Trigger Period has occurred and is continuing, and (c) as of the applicable date of determination, the maturity date of the AHF Crossville Portfolio Mortgage Loan is scheduled to occur in no earlier than two years.
“DSCR Event” means that the debt service coverage ratio is less than 1.20x for two consecutive calendar quarters.
“Specified Tenant” means, as applicable, (a) AHF, as tenant under the Specified Tenant lease, together with its successors and permitted assigns, (b) AHF Parent Holding, Inc., as guarantor under the Specified Tenant lease, together with its successors and permitted assigns, or (c) any replacement of the foregoing in accordance with the AHF Crossville Portfolio Mortgage Loan documents.
Subordinate and Mezzanine Debt. None.
Permitted Future Mezzanine Debt. Provided that no event of default is continuing under the AHF Crossville Portfolio Mortgage Loan documents, the borrower is permitted to incur a future mezzanine loan at any time from and after the date that is two years after the closing date of the BMO 2024-C8 securitization, subject to the satisfaction of the requirements set forth in the AHF Crossville Portfolio Mortgage Loan documents, which include, but are not limited to: (i) the aggregate loan-to-value ratio based on the AHF Crossville Portfolio Mortgage Loan and the mezzanine loan is no greater than 60.2%; (ii) the actual combined debt service coverage ratio based on the AHF Crossville Portfolio Mortgage Loan and the mezzanine loan is no less than 1.62x; (iii) the actual combined net cash flow debt yield based on the AHF Crossville Portfolio Mortgage Loan and the mezzanine loan is no less than 11.9%; (iv) the execution of an intercreditor agreement acceptable to the lender and satisfactory to the rating agencies; (v) if required by the lender, receipt of a rating agency confirmation; and (vi) the maturity of the mezzanine loan is coterminous with, or longer than, the maturity date of the AHF Crossville Portfolio Mortgage Loan.
Partial Release. Not permitted.
Ground Lease. None.
THE INFORMATION IN THIS STRUCTURAL AND COLLATERAL TERM SHEET IS NOT COMPLETE AND MAY BE AMENDED PRIOR TO THE TIME OF SALE. THIS TERM SHEET IS NOT AN OFFER TO SELL THESE SECURITIES AND IT IS NOT A SOLICITATION OF AN OFFER TO BUY THESE SECURITIES IN ANY JURISDICTION WHERE THE OFFER OR SALE IS NOT PERMITTED. |
| | 95 | |
| Structural and Collateral Term Sheet | | BMO 2024-C8 |
| No. 7 – Arundel Mills and Marketplace |

THE INFORMATION IN THIS STRUCTURAL AND COLLATERAL TERM SHEET IS NOT COMPLETE AND MAY BE AMENDED PRIOR TO THE TIME OF SALE. THIS TERM SHEET IS NOT AN OFFER TO SELL THESE SECURITIES AND IT IS NOT A SOLICITATION OF AN OFFER TO BUY THESE SECURITIES IN ANY JURISDICTION WHERE THE OFFER OR SALE IS NOT PERMITTED. |
| | 96 | |
| Structural and Collateral Term Sheet | | BMO 2024-C8 |
| No. 7 – Arundel Mills and Marketplace |
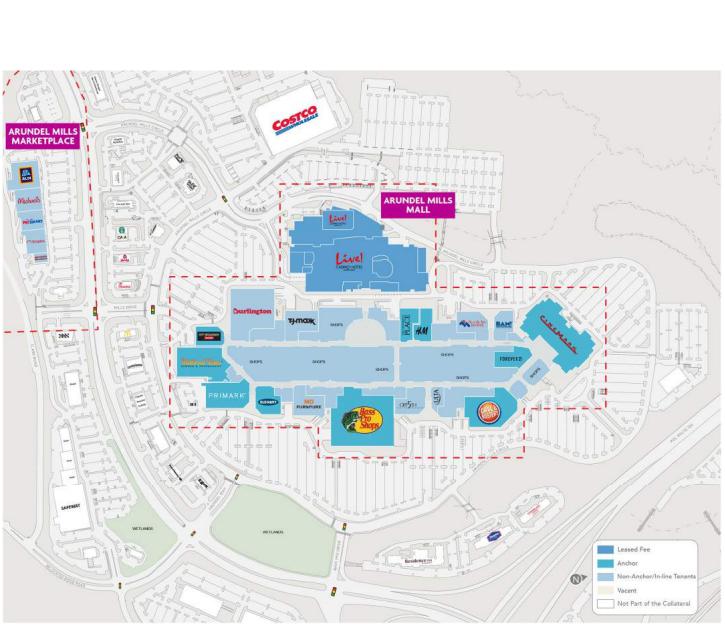
THE INFORMATION IN THIS STRUCTURAL AND COLLATERAL TERM SHEET IS NOT COMPLETE AND MAY BE AMENDED PRIOR TO THE TIME OF SALE. THIS TERM SHEET IS NOT AN OFFER TO SELL THESE SECURITIES AND IT IS NOT A SOLICITATION OF AN OFFER TO BUY THESE SECURITIES IN ANY JURISDICTION WHERE THE OFFER OR SALE IS NOT PERMITTED. |
| | 97 | |
| Structural and Collateral Term Sheet | | BMO 2024-C8 |
| No. 7 – Arundel Mills and Marketplace |
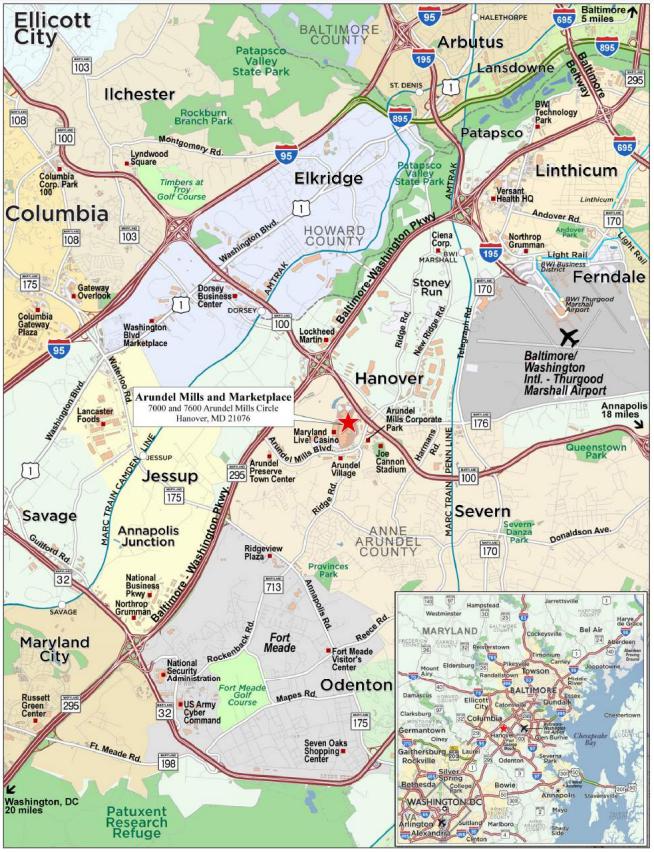
THE INFORMATION IN THIS STRUCTURAL AND COLLATERAL TERM SHEET IS NOT COMPLETE AND MAY BE AMENDED PRIOR TO THE TIME OF SALE. THIS TERM SHEET IS NOT AN OFFER TO SELL THESE SECURITIES AND IT IS NOT A SOLICITATION OF AN OFFER TO BUY THESE SECURITIES IN ANY JURISDICTION WHERE THE OFFER OR SALE IS NOT PERMITTED. |
| | 98 | |
| Structural and Collateral Term Sheet | | BMO 2024-C8 |
| No. 7 – Arundel Mills and Marketplace |
| Mortgage Loan Information | | Property Information |
| Loan Seller: | GACC | | Single Asset / Portfolio: | Single Asset |
| Original Principal Balance(1): | $35,000,000 | | Title: | Fee |
| Cut-off Date Principal Balance(1): | $35,000,000 | | Property Type – Subtype: | Retail – Super Regional Mall |
| % of IPB: | 5.1% | | Net Rentable Area (SF)(8): | 1,938,983 |
| Loan Purpose: | Refinance | | Location: | Hanover, MD |
| Borrowers: | Arundel Mills Limited Partnership and Arundel Mills Marketplace Limited Partnership | | Year Built / Renovated: | 2000, 2002, 2012 / NAP |
| Borrower Sponsor(2): | Simon Property Group, L.P. | | Occupancy(9): | 98.3% |
| Interest Rate: | 7.70100% | | Occupancy Date: | 6/15/2023 |
| Note Date: | 10/5/2023 | | 4th Most Recent NOI (As of)(10): | $42,286,167 (12/31/2020) |
| Maturity Date: | 11/1/2033 | | 3rd Most Recent NOI (As of)(10): | $52,018,087 (12/31/2021) |
| Interest-only Period: | 120 months | | 2nd Most Recent NOI (As of): | $52,750,256 (12/31/2022) |
| Original Term: | 120 months | | Most Recent NOI (As of)(11): | $51,525,734 (TTM 8/31/2023) |
| Original Amortization Term: | None | | UW Economic Occupancy: | 98.1% |
| Amortization Type: | Interest Only | | UW Revenues: | $74,354,670 |
| Call Protection(3): | L(28),D(86),O(6) | | UW Expenses: | $16,415,944 |
| Lockbox / Cash Management: | Hard / Springing | | UW NOI(11): | $57,938,726 |
| Additional Debt(1)(4)(5): | Yes | | UW NCF: | $55,557,554 |
| Additional Debt Balance(1)(4)(5): | $325,000,000 | | Appraised Value / Per SF(8): | $870,600,000 / $449 |
| Additional Debt Type(1)(4)(5): | Pari Passu | | Appraisal Date: | 9/1/2023 |
| | | | | |
| Escrows and Reserves(6) | | Financial Information(1) |
| | Initial | Monthly | Initial Cap | | | Whole Loan |
| Taxes: | $0 | Springing | N/A | | Cut-off Date Loan / SF(8): | $186 |
| Insurance: | $0 | Springing | N/A | | Maturity Date Loan / SF(8): | $186 |
| Replacement Reserves: | $0 | Springing | N/A | | Cut-off Date LTV: | 41.4% |
| TI/LC: | $0 | $231,942 | $5,566,608 | | Maturity Date LTV: | 41.4% |
| Deferred Maintenance: | $0 | $0 | N/A | | UW NCF DSCR: | 1.98x |
| Other(7): | $4,384,369 | $0 | N/A | | UW NOI Debt Yield: | 16.1% |
| | | | | | | |
| Sources and Uses |
| Sources | Proceeds | % of Total | | Uses | Proceeds | % of Total |
| Whole Loan(1) | $360,000,000 | 91.8 | % | | Loan Payoff | $384,870,923 | 98.1 | % |
| Sponsor Equity | 32,236,503 | 8.2 | | | Upfront Reserves | 4,384,369 | 1.1 | |
| | | | | Closing Costs | 2,981,210 | 0.8 | |
| Total Sources | $392,236,503 | 100.0 | % | | Total Uses | $392,236,503 | 100.0 | % |
| (1) | The Arundel Mills and Marketplace Mortgage Loan (as defined below) is part of a whole loan evidenced by 16 pari passu promissory notes with an aggregate original principal balance of $360,000,000 (the “Arundel Mills and Marketplace Whole Loan”). The financial information presented in the chart above shows the Cut-off Date Loan / SF, Maturity Date Loan / SF, Cut-off Date LTV, Maturity Date LTV, UW NCF DSCR and UW NOI Debt Yield based on the Arundel Mills and Marketplace Whole Loan. |
| (2) | The borrower sponsor is also a borrower sponsor for the Woodfield Mall mortgage loan. |
| (3) | Defeasance of the Arundel Mills and Marketplace Whole Loan is permitted at any time after the earlier to occur of (a) the end of the two-year period commencing on the closing date of the securitization of the last promissory note representing a portion of the Arundel Mills and Marketplace Whole Loan to be securitized and (b) December 1, 2026. The assumed defeasance lockout period of 28 payments is based on the closing date of the BMO 2024-C8 transaction in March 2024. The actual defeasance lockout period may be longer. After December 1, 2026, if any pari passu note has not been contributed to a securitization with a REMIC startup date at least two years prior to December 1, 2026, in connection with the defeasance of all other notes, the borrowers may prepay any note that has not been securitized for two years upon payment of a prepayment fee equal to the greater of (i) 1% of the prepaid amount or (ii) the yield maintenance basis. In addition, the Arundel Mills and Marketplace Whole Loan may be prepaid or defeased in connection with a partial release, as described under “Partial Release” below. |
| (4) | See “The Loan” section below for further discussion of additional mortgage debt. |
| (5) | The Arundel Mills and Marketplace Property (as defined below) is subject to an existing property assessed clean energy ("PACE”) loan in an original principal amount of $2,037,877.38 from Petros PACE Finance, LLC, a Texas limited liability company to the borrowers. The PACE loan has a term of approximately 17 years with final payment occurring in November 2035. The annual debt service is $195,956.85 and the remaining balance, as of October 2023, including all interest and administrative expenses was $1,633,579.73. Payments and any accrued interest are collected on the tax bill for the Arundel Mills and Marketplace Property and constitute a first lien on the Arundel Mills and Marketplace Property that has a priority over any mortgage loan. In addition, the Arundel Mills and Marketplace Whole Loan documents permit the borrowers to enter into an additional PACE loan for an amount not to exceed $5,000,000. |
| (6) | See “Escrows and Reserves” below for further discussion of reserve requirements. |
| (7) | Other Initial Escrows and Reserves consist of (i) $3,796,478 for an outstanding tenant improvements and leasing commissions reserve, and (ii) $587,891 for an upfront gap rent reserve. |
| (8) | The Arundel Mills and Marketplace Property includes a larger mall and lifestyle center, which consists of 1,391,652 square feet of owned improvements and 547,331 |
THE INFORMATION IN THIS STRUCTURAL AND COLLATERAL TERM SHEET IS NOT COMPLETE AND MAY BE AMENDED PRIOR TO THE TIME OF SALE. THIS TERM SHEET IS NOT AN OFFER TO SELL THESE SECURITIES AND IT IS NOT A SOLICITATION OF AN OFFER TO BUY THESE SECURITIES IN ANY JURISDICTION WHERE THE OFFER OR SALE IS NOT PERMITTED. |
| | 99 | |
| Structural and Collateral Term Sheet | | BMO 2024-C8 |
| No. 7 – Arundel Mills and Marketplace |
square feet of leased fee improvements. The Cut-off Date Loan / SF, Maturity Date Loan / SF, and Appraised Value / SF are based on the total square feet of 1,938,983. The Cut-off Date Loan / SF, Maturity Date Loan / SF, and Appraised Value / Per SF based on the Owned SF (as defined below) of 1,391,652 is $258.69, $258.69, and $625.59, respectively.
| (9) | Occupancy represents the occupancy excluding square footage from the leased fee tenant, Live Casino Hotel (as defined below), and temporary tenants and is based on the Owned SF totaling 1,391,652. Occupancy including Live Casino Hotel is 98.8%. |
| (10) | The increase from 4th Most Recent NOI to 3rd Most Recent NOI was primarily driven by an increase in bad debt/collection loss in 2020 due to the effect of the novel coronavirus pandemic. |
| (11) | The increase from the Most Recent NOI to UW NOI is driven by 18 new and renewal leases commencing in 2023 and 2024 totaling 113,039 square feet (5.8% of square feet and 8.3% of underwritten rent) and rent steps of $604,665. |
The Loan. The seventh largest mortgage loan (the “Arundel Mills and Marketplace Mortgage Loan”) is part of a fixed rate whole loan evidenced by 16 pari passu notes with an aggregate outstanding principal balance as of the Cut-off Date of $360,000,000. The Arundel Mills and Marketplace Whole Loan is secured by the borrowers’ fee interest in a 1,837,764 square foot super regional mall (“Arundel Mills”) and a 101,219 square foot lifestyle center (“Arundel Marketplace”) totaling 1,938,983 square feet located in Hanover, Maryland (the “Arundel Mills and Marketplace Property”). The Arundel Mills and Marketplace Mortgage Loan is evidenced by the non-controlling Note A-3-1 and Note A-3-5 with an aggregate outstanding principal balance as of the Cut-off Date of $35,000,000. The Arundel Mills and Marketplace Whole Loan was co-originated by Wells Fargo Bank, National Association (“WFB”), Societe Generale Financial Corporation (“SGFC”), DBR Investments Co. Limited (“DBRI”) and Citi Real Estate Funding Inc. (“CREFI”) on October 5, 2023. The Arundel Mills and Marketplace Whole Loan is being serviced pursuant to the pooling and servicing agreement for the MSWF 2023-2 securitization trust. The relationship between the holders of the Arundel Mills and Marketplace Whole Loan is governed by a co-lender agreement as described under “Description of the Mortgage Pool—The Whole Loans—The Non-Serviced Pari Passu Whole Loans” and “Pooling and Servicing Agreement—Servicing of the Non-Serviced Mortgage Loans” in the Preliminary Prospectus.
| | | Whole Loan Summary | | |
| Note | Original Balance | Cut-off Date Balance | Note Holder | Controlling Piece |
| A-1-1 | $50,000,000 | $50,000,000 | MSWF 2023-2 | Yes |
| A-1-2 | $30,000,000 | $30,000,000 | MSWF 2023-2 | No |
| A-1-3(1) | $15,000,000 | $15,000,000 | WFB | No |
| A-1-4 | $10,000,000 | $10,000,000 | MSWF 2023-2 | No |
| A-2-1(1) | $40,000,000 | $40,000,000 | SGFC | No |
| A-2-2 | $30,000,000 | $30,000,000 | BBCMS 2024-C24 | No |
| A-2-3(1) | $10,000,000 | $10,000,000 | SGFC | No |
| A-2-4(1) | $5,000,000 | $5,000,000 | SGFC | No |
| A-3-1 | $25,000,000 | $25,000,000 | BMO 2024-C8 | No |
| A-3-2(1) | $20,000,000 | $20,000,000 | DBRI | No |
| A-3-3 | $15,000,000 | $15,000,000 | BBCMS 2024-C24 | No |
| A-3-4 | $15,000,000 | $15,000,000 | BBCMS 2024-C24 | No |
| A-3-5 | $10,000,000 | $10,000,000 | BMO 2024-C8 | No |
| A-4-1 | $40,000,000 | $40,000,000 | BMO 2023-C7 | No |
| A-4-2 | $25,000,000 | $25,000,000 | Benchmark 2023-B40 | No |
| A-4-3 | $20,000,000 | $20,000,000 | BMO 2023-C7 | No |
| Whole Loan | $360,000,000 | $360,000,000 | | |
| (1) | Expected to be contributed to one or more future securitization(s). |
The Property. The Arundel Mills and Marketplace Property comprises Arundel Mills, a 1,837,764 square foot super regional mall, which includes 1,290,433 of owned square feet and 547,331 of leased fee square feet, and Arundel Marketplace, a 101,219 owned square foot lifestyle center, together totaling 1,938,983 square feet located in Hanover, Maryland. In total, the Owned SF comprises 1,391,652 square feet (the “Owned SF”). Arundel Mills is anchored by Live Casino Hotel Maryland (“Live Casino Hotel”), which owns its improvements and ground leases the underlying land from the borrowers, Bass Pro Shops Outdoor (“Bass Pro”), Burlington, Dave & Buster’s, Medieval Times and Cinemark Theatres (“Cinemark”). Arundel Mills is an enclosed mall with multiple wings and entrances, containing a food court and anchor tenants. Arundel Marketplace is leased to major tenants including Aldi, Michael’s, Staples and PetSmart. Built between 2000, 2002 and 2012 the Arundel Mills and Marketplace Property is situated on a 208.08-acre parcel and contains 6,207 parking spaces (4.5/1,000 Owned SF), which excludes the spaces within the casino parking structure. The collateral tenancy, outside of the anchors, is granular with no other tenant making up more than 3.3% of the Owned SF. Notable tenants include T.J. Maxx, Saks Fifth Avenue Off 5th, Old Navy, Polo Ralph Lauren, Ulta Beauty, Nike Factory Store, The North Face, and
THE INFORMATION IN THIS STRUCTURAL AND COLLATERAL TERM SHEET IS NOT COMPLETE AND MAY BE AMENDED PRIOR TO THE TIME OF SALE. THIS TERM SHEET IS NOT AN OFFER TO SELL THESE SECURITIES AND IT IS NOT A SOLICITATION OF AN OFFER TO BUY THESE SECURITIES IN ANY JURISDICTION WHERE THE OFFER OR SALE IS NOT PERMITTED. |
| | 100 | |
| Structural and Collateral Term Sheet | | BMO 2024-C8 |
| No. 7 – Arundel Mills and Marketplace |
Victoria’s Secret. As of June 15, 2023, the Arundel Mills and Marketplace Property was 98.3% leased based on Owned SF and 98.8% leased based on total square feet by 177 tenants.
The trailing 12-month in-line sales per square foot as of July 31, 2023 are $559 per square foot, representing a 10.0% increase over 2019. As of the trailing 12-month period as of July 31, 2023, the in-line occupancy cost ratio is 13.0%. The table below provides an overview of sales by inline tenants with less than 10,000 square feet.
| Sales for Inline Tenants(1) |
| | 2019 Sales PSF | 2020 Sales PSF | 2021 Sales PSF | 2022 Sales PSF | TTM 7/31/2023
Sales PSF |
| Inline Sales (< 10,000 SF) | | $508 | | | $394 | | | $568 | | | $562 | | | $559 | |
| Occupancy Cost | | 13.8% | | | 17.6% | | | 12.9% | | | 12.7% | | | 13.0% | |
| (1) | Information obtained from the borrowers. |
Major Tenants. The three largest tenants based on underwritten base rent are Cinemark, Live Casino Hotel and Dave & Buster’s.
Cinemark (107,190 square feet; 5.5% of net rentable area (“NRA”); 9.1% of underwritten base rent). Founded in 1984 and headquartered in Plano, Texas, Cinemark is the third-largest movie theater chain in the United States, operating 5,812 screens across 514 theaters in the US and Latin America as of June 30, 2023. Cinemark operates 24 screens at the Arundel Mills and Marketplace Property and, according to the appraisal, this is the strongest performing theater in a 15-mile radius with 1.2 million visitors during the trailing 12-month period ending in August 2023. Cinemark has been a tenant at the Arundel Mills and Marketplace Property since 2000 and has a lease expiration of December 2025. The tenant has three, five-year extension options and no termination options.
Live Casino Hotel (547,331 square feet; 28.2% of NRA; 5.5% of underwritten base rent). Live Casino Hotel is owned by The Cordish Companies, which started in 1910 and is a real estate developer and owner operator of multiple businesses in the entertainment industry. Live Casino Hotel offers a wide range of gaming and entertainment options with approximately 206 tables, 310 hotel rooms, a spa, and 75,000 square feet of event space. Live Casino Hotel attracts more than 10 million visitors annually and features the largest gambling floor of any casino in the country. Live Casino Hotel has been a tenant at the Arundel Mills and Marketplace Property since June 2012. Live Casino Hotel owns its improvements and leases the underlying land from the borrowers pursuant to a ground lease expiring in July 2115. Live Casino Hotel may terminate its lease on June 30, 2027, which is the expiration of the first 15-year period from the rent commencement date, or at the end of any 10-year period thereafter with 365 days’ notice. In addition to base rent, Live Casino Hotel pays percentage rent equal to 1.0% of retail and gaming gross revenues, less a percentage rent allowance of $1,500,000. The underwritten Live Casino Hotel percentage rent is $6,324,300, which is based on TTM 7/31/2023 sales.
Dave & Buster’s (63,631 square feet; 3.3% of NRA; 4.5% of underwritten base rent). Founded in 1982 in Dallas, Texas, Dave & Buster’s is an entertainment venue including an arcade, sports bar and restaurant. Today, there are over 150 locations across North America with a total of over 20 million visitors annually. Dave & Buster’s has been a tenant at the Arundel Mills and Marketplace Property since 2000 and has a lease expiration in May 2026. The tenant has two, five-year extension options and no termination options.
The following table presents certain information relating to the historical occupancy of the Arundel Mills and Marketplace Property:
Historical and Current
Occupancy(1)(2)(3) |
| 2019 | 2020 | 2021 | 2022 | Current(4) |
| 98.2% | 94.2% | 93.2% | 97.2% | 98.3% |
| (1) | Historical Information obtained from the Arundel Mills and Marketplace borrowers. |
| (2) | Occupancy represents the occupancy excluding the square footage from the leased fee tenant, Live Casino Hotel, and is based on the Owned SF. Occupancy as of June 15, 2023 based on the total square feet is 98.8%. |
| (3) | Historical and Current Occupancy figures exclude temporary tenants at the Arundel Mills and Marketplace Property. |
| (4) | Current Occupancy is based on the underwritten rent roll dated as of June 15, 2023.
|
THE INFORMATION IN THIS STRUCTURAL AND COLLATERAL TERM SHEET IS NOT COMPLETE AND MAY BE AMENDED PRIOR TO THE TIME OF SALE. THIS TERM SHEET IS NOT AN OFFER TO SELL THESE SECURITIES AND IT IS NOT A SOLICITATION OF AN OFFER TO BUY THESE SECURITIES IN ANY JURISDICTION WHERE THE OFFER OR SALE IS NOT PERMITTED. |
| | 101 | |
| Structural and Collateral Term Sheet | | BMO 2024-C8 |
| No. 7 – Arundel Mills and Marketplace |
The following table presents certain information relating to the major tenants (of which, certain tenants may have co-tenancy provisions) at the Arundel Mills and Marketplace Property:
| Tenant Summary(1) |
| Tenant | Credit Rating (Fitch/Moody's/S&P)(2) | Net Rentable Area (SF) | % of Total NRA | UW Base Rent PSF(3)(4) | U/W Base Rent(3)(4) | % of Total UW Base Rent | Lease Expiration Date |
| Anchor Tenant (leased fee)(5) | | | | | | | |
| Live Casino Hotel(6)(7) | NR/NR/NR | 547,331 | 28.2 | % | $4.08 | $2,231,337 | | 5.5 | % | 7/13/2115 |
| Total/Wtd. Avg. | | 547,331 | 28.2 | % | $4.08 | $2,231,337 | | 5.5 | % | |
| | | | | | | | |
| Major Tenants | | | | | | | |
| Cinemark | B+/NR/B+ | 107,190 | 5.5 | % | $34.00 | $3,644,460 | | 9.1 | % | 12/31/2025 |
| Dave & Buster's | NR/NR/NR | 63,631 | 3.3 | | $28.60 | 1,819,847 | | 4.5 | | 5/31/2026 |
| Primark | NR/NR/A | 46,143 | 2.4 | | $25.16 | 1,161,117 | | 2.9 | | 8/31/2033 |
| Forever 21 | NR/NR/NR | 25,211 | 1.3 | | $41.72 | 1,051,790 | (8) | 2.6 | | 1/31/2026 |
| Bass Pro | NR/NR/NR | 127,672 | 6.6 | | $7.01 | 895,134 | (8) | 2.2 | | 10/3/2026 |
| The Children’s Place | NR/NR/NR | 20,816 | 1.1 | | $36.02 | 749,792 | | 1.9 | | 4/30/2025 |
| Old Navy | NR/Ba3/BB | 26,044 | 1.3 | | $28.64 | 745,958 | | 1.9 | | 1/31/2027 |
| Michael Kors | BBB-/NR/BBB- | 6,861 | 0.4 | | $95.52 | 655,363 | | 1.6 | | 4/30/2028 |
| H&M | NR/NR/BBB | 20,296 | 1.0 | | $27.71 | 562,336 | (8) | 1.4 | | 1/31/2028 |
| Off Broadway Shoes | NR/NR/NR | 21,526 | 1.1 | | $23.91 | 514,691 | | 1.3 | | 1/31/2026 |
| Medieval Times | NR/NR/NR | 66,244 | 3.4 | | $7.50 | 496,680 | | 1.2 | | 8/31/2033 |
| Total/Wtd. Avg. | | 531,634 | 27.4 | % | $23.13 | $12,297,168 | | 30.6 | % | |
| | | | | | | | |
| Non-Major Tenants(9) | | 835,783 | 43.1 | % | $30.73 | $25,684,060 | | 63.9 | % | |
| | | | | | | | |
| Occupied Collateral Total | | 1,914,748 | 98.8 | % | $27.78(10) | $40,212,565 | | 100.0 | % | |
| Vacant Space | | 24,235 | 1.2 | % | | | | |
| Total/Wtd. Avg. | | 1,938,983 | 100.0 | % | | | | |
| (1) | Based on the underwritten rent roll dated as of June 15, 2023. |
| (2) | Certain ratings are those of the parent company whether or not the parent guarantees the lease. |
| (3) | UW Base Rent PSF and U/W Base Rent includes percentage in-lieu of rents totaling $3,023,713. |
| (4) | U/W Base Rent and UW Base Rent PSF includes $604,665 of rent steps through September 2024. |
| (5) | Live Casino Hotel owns its own improvements and ground leases the land from the borrowers. |
| (6) | Live Casino Hotel may terminate its lease on June 30, 2027, which is the expiration of the first 15-year period from the rent commencement date, or at the end of any 10-year period thereafter. |
| (7) | Live Casino Hotel also pays percentage rent, which equates to 1.0% of retail and gaming gross revenues, less a percentage rent allowance of $1,500,000. The underwritten Live Casino Hotel percentage rent is $6,324,300, which is based on TTM 7/31/2023 sales and not included in the UW Base Rent. |
| (8) | Forever 21, Bass Pro and H&M UW Base Rent PSF and UW Base Rent represent percentage in-lieu of rent based on the tenants’ TTM 7/31/2023 sales. |
| (9) | Non-Major Tenants includes three tenants, The North Face, Brooks Brothers, and True Religion, totaling 15,717 square feet (1.1% of Owned SF), with lease start dates in June 2024, May 2024, and February 2024, respectively. |
| (10) | Occupied Collateral Total UW Base Rent PSF are based on the Owned SF and excludes Net Rentable Area (SF) and U/W Base Rent from the leased fee tenant, Live Casino Hotel. |
The following table presents a summary of sales for certain tenants at the Arundel Mills and Marketplace Property:
| Sales Summary(1) |
| | 2019 Sales (PSF) | 2020 Sales (PSF) | 2021 Sales (PSF) | 2022 Sales (PSF) | TTM 7/31/2023 Sales (PSF) |
| Live Casino Hotel(2) | $643,538,000 | $463,348,000 | $723,949,000 | $785,282,000 | $782,430,000 |
| Cinemark(3) | $756,958 | $146,750 | $382,500 | $588,875 | $690,661 |
| Dave & Buster’s | $233.44 | $108.61 | $223.33 | $251.94 | $258.58 |
| Primark | NAV | NAV | NAV | NAV | NAV |
| Forever 21 | $189.96 | $116.30 | $243.82 | $209.63 | $185.42 |
| Bass Pro | $280.45 | $322.68 | $347.17 | $346.38 | $350.56 |
| The Children’s Place | $201.58 | $99.44 | $209.50 | $180.49 | $175.94 |
| Old Navy | $281.56 | $157.54 | $286.94 | $257.30 | $257.59 |
| Michael Kors | $974.64 | $569.01 | $787.20 | $895.93 | $816.75 |
| H&M | $279.71 | $185.50 | $315.68 | $309.37 | $291.65 |
| Off Broadway Shoes | $216.62 | $124.50 | $222.15 | $229.26 | $212.70 |
| Medieval Times | $159.17 | $29.30 | $73.71 | $154.85 | $177.06 |
| (1) | Information obtained from the borrowers. |
| (2) | Live Casino Hotel is the ground lessee and owns its improvements. Historical sales are shown on an annual basis above. Sales at Live Casino Hotel only represent retail and gaming sales. |
| (3) | Calculated based on a sales per screen (with 24 screens). |
THE INFORMATION IN THIS STRUCTURAL AND COLLATERAL TERM SHEET IS NOT COMPLETE AND MAY BE AMENDED PRIOR TO THE TIME OF SALE. THIS TERM SHEET IS NOT AN OFFER TO SELL THESE SECURITIES AND IT IS NOT A SOLICITATION OF AN OFFER TO BUY THESE SECURITIES IN ANY JURISDICTION WHERE THE OFFER OR SALE IS NOT PERMITTED. |
| | 102 | |
| Structural and Collateral Term Sheet | | BMO 2024-C8 |
| No. 7 – Arundel Mills and Marketplace |
The following table presents certain information relating to the lease rollover schedule at the Arundel Mills and Marketplace Property:
| Lease Rollover Schedule(1)(2) |
| Year | Number of Leases Expiring | Net Rentable Area Expiring | % of NRA Expiring | UW Base Rent Expiring(3) | % of UW Base Rent Expiring(3) | Cumulative Net Rentable Area Expiring | Cumulative % of NRA Expiring | Cumulative UW Base Rent Expiring(3) | Cumulative % of UW Base Rent Expiring(3) |
| Vacant | NAP | 24,235 | | 1.2 | % | NAP | NAP | | 24,235 | 1.2% | NAP | NAP |
| 2024 & MTM | 53 | 171,618 | | 8.9 | | $6,763,143 | 16.8 | % | 195,853 | 10.1% | $6,763,143 | 16.8% |
| 2025 | 26 | 249,150 | | 12.8 | | 7,710,372 | 19.2 | | 445,003 | 23.0% | $14,473,515 | 36.0% |
| 2026 | 23 | 418,423 | | 21.6 | | 7,077,611 | 17.6 | | 863,426 | 44.5% | $21,551,126 | 53.6% |
| 2027 | 24 | 103,687 | | 5.3 | | 4,697,690 | 11.7 | | 967,113 | 49.9% | $26,248,816 | 65.3% |
| 2028 | 16 | 113,056 | | 5.8 | | 3,708,472 | 9.2 | | 1,080,169 | 55.7% | $29,957,288 | 74.5% |
| 2029 | 14 | 56,297 | | 2.9 | | 2,542,768 | 6.3 | | 1,136,466 | 58.6% | $32,500,056 | 80.8% |
| 2030 | 6 | 21,905 | | 1.1 | | 931,272 | 2.3 | | 1,158,371 | 59.7% | $33,431,328 | 83.1% |
| 2031 | 2 | 6,199 | | 0.3 | | 265,149 | 0.7 | | 1,164,570 | 60.1% | $33,696,477 | 83.8% |
| 2032 | 1 | 30,641 | | 1.6 | | 300,000 | 0.7 | | 1,195,211 | 61.6% | $33,996,477 | 84.5% |
| 2033 | 9 | 182,701 | | 9.4 | | 3,399,377 | 8.5 | | 1,377,912 | 71.1% | $37,395,854 | 93.0% |
| 2034 | 2 | 13,740 | | 0.7 | | 585,374 | 1.5 | | 1,391,652 | 71.8% | $37,981,228 | 94.5% |
| 2035 & Beyond | 1 | 547,331 | | 28.2 | | 2,231,337 | 5.5 | | 1,938,983 | 100.0% | $40,212,565 | 100.0% |
| Total | 177 | 1,938,983 | | 100.0 | % | $40,212,565 | 100.0 | % | | | | |
| (1) | Based on the underwritten rent roll dated June 15, 2023. |
| (2) | Certain tenants may have termination options that are exercisable prior to the originally stated expiration date of the subject lease and that are not considered in the Lease Rollover Schedule. |
| (3) | UW Base Rent Expiring, % of UW Base Rent Expiring, Cumulative UW Base Rent Expiring and Cumulative % of UW Base Rent Expiring include percentage in-lieu of rent totaling $3,023,713 and rent steps totaling $604,665 through September 2024. |
THE INFORMATION IN THIS STRUCTURAL AND COLLATERAL TERM SHEET IS NOT COMPLETE AND MAY BE AMENDED PRIOR TO THE TIME OF SALE. THIS TERM SHEET IS NOT AN OFFER TO SELL THESE SECURITIES AND IT IS NOT A SOLICITATION OF AN OFFER TO BUY THESE SECURITIES IN ANY JURISDICTION WHERE THE OFFER OR SALE IS NOT PERMITTED. |
| | 103 | |
| Structural and Collateral Term Sheet | | BMO 2024-C8 |
| No. 7 – Arundel Mills and Marketplace |
The following table presents certain information relating to the operating history and underwritten net cash flow of the Arundel Mills and Marketplace Property:
| Operating History and Underwritten Net Cash Flow |
| | 2019 | 2020 | 2021 | 2022 | TTM August 2023(1) | Underwritten | Per Square Foot | %(2) |
| In Place Rent | $36,140,448 | $33,938,041 | $33,271,004 | $32,940,359 | $34,871,979 | $36,584,187 | $18.87 | 48.5% |
| Contractual Rent Steps(3) | 0 | 0 | 0 | 0 | 0 | 604,665 | 0.31 | 0.8 |
| Potential Income from Vacant Space | 0 | 0 | 0 | 0 | 0 | 1,028,517 | 0.53 | 1.4 |
| Percentage in Lieu(4) | 2,164,224 | 2,365,569 | 4,167,022 | 3,784,601 | 2,469,932 | 3,023,713 | 1.56 | 4.0 |
| Gross Potential Rent | $38,304,672 | $36,303,610 | $37,438,026 | $36,724,960 | $37,341,911 | $41,241,082 | $21.27 | 54.7% |
| Percentage Rent(5) | 5,808,460 | 3,354,054 | 7,437,689 | 8,482,789 | 8,559,268 | 8,491,820 | 4.38 | 11.3 |
| Temp Tenant Income | 3,342,965 | 2,264,738 | 3,091,587 | 3,631,703 | 3,339,445 | 3,339,445 | 1.72 | 4.4 |
| Reimbursement Revenue | 22,032,762 | 21,644,732 | 21,147,941 | 20,262,474 | 20,258,479 | 21,856,710 | 11.27 | 29.0 |
| Other Revenue(6) | 582,524 | 112,149 | 367,765 | 406,519 | 454,130 | 454,130 | 0.23 | 0.6 |
| Net Rental Income | $70,071,383 | $63,679,283 | $69,483,008 | $69,508,445 | $69,953,233 | $75,383,187 | $38.88 | 100.0% |
| Less Free Rent & Credit Loss | (226,840) | (6,402,854) | (81,074) | 475,767 | (228,717) | 0 | 0.00 | 0.0 |
| Less Vacancy | 0 | 0 | 0 | 0 | 0 | (1,028,517) | (0.53) | (2.5)(7) |
| Effective Gross Income | $69,844,543 | $57,276,429 | $69,401,934 | $69,984,212 | $69,724,516 | $74,354,670 | $38.35 | 98.6% |
| | | | | | | | | |
| Real Estate Taxes | 5,088,710 | 5,406,023 | 5,550,627 | 3,310,098 | 5,186,899 | 5,186,899 | 2.68 | 7.0 |
| Insurance | 506,729 | 593,510 | 625,192 | 703,339 | 759,782 | 759,782 | 0.39 | 1.0 |
| Management Fee(8) | 2,849,028 | 2,385,373 | 2,769,663 | 2,901,210 | 2,782,838 | 1,000,000 | 0.52 | 1.3 |
| Other Expenses | 9,351,475 | 6,605,356 | 8,438,365 | 10,319,309 | 9,469,263 | 9,469,263 | 4.88 | 12.7 |
| Total Expenses | 17,795,942 | $14,990,262 | $17,383,847 | $17,233,956 | $18,198,782 | $16,415,944 | $8.47 | 22.1% |
| | | | | | | | | |
| Net Operating Income | $52,048,601 | $42,286,167(9) | $52,018,087(9) | $52,750,256 | $51,525,734(10) | $57,938,726(10) | $29.88 | 77.9% |
| TI/LC | 0 | 0 | 0 | 0 | 0 | 2,102,842 | 1.08 | 2.8 |
| Capital Expenditures | 0 | 0 | 0 | 0 | 0 | 278,330 | 0.14 | 0.4 |
| Net Cash Flow | $52,048,601 | $42,286,167 | $52,018,087 | $52,750,256 | $51,525,734 | $55,557,554 | $28.65 | 74.7% |
| | | | | | | | | |
| (1) | TTM August 2023 reflects the trailing 12-month period ending August 31, 2023. |
| (2) | Represents (i) percent of Net Rental Income for all revenue fields, (ii) percent of Gross Potential Rent for Vacancy and Free Rent & Credit Loss and (iii) percent of Effective Gross Income for all other fields. |
| (3) | Represents rent steps through September 2024. |
| (4) | Percentage in Lieu rents are underwritten based on the tenants’ TTM 7/31/2023 sales. |
| (5) | Primarily comprised of percentage rent paid by Live Casino Hotel, which equates to 1.0% of retail and gaming gross revenues, less a percentage rent allowance of $1,500,000. The underwritten Live Casino Hotel percentage rent is $6,324,300, which is based on TTM 7/31/2023 sales. |
| (6) | Other Revenue includes revenue from tenant services, media and telecom. |
| (7) | Represents the underwritten economic vacancy %. The Arundel Mills and Marketplace Property was 98.3% occupied based on the Owned SF as of June 15, 2023. |
| (8) | Management Fee is capped at $1,000,000. The property is managed by Simon Management Associates II, LLC, an affiliate of the borrowers. |
| (9) | The increase in 2020 Net Operating Income to 2021 Net Operating Income was primarily driven by an increase in bad debt/collection loss in 2020 due to the effect of the novel coronavirus pandemic. |
| (10) | The increase from the TTM August 2023 Net Operating Income to the Underwritten Net Operating Income is driven by 18 new and renewal leases commencing in 2023 and 2024 totaling 113,039 square feet (5.8% of Owned SF and 8.3% of underwritten rent) and underwritten rent steps of $604,665. |
Environmental. According to the Phase I environmental site assessments dated September 25, 2023 and September 29, 2023, there was no evidence of any recognized environmental conditions at the Arundel Mills and Marketplace Property.
The Market. The Arundel Mills and Marketplace Property is located in Hanover, Maryland, approximately 13.0 miles southwest of Baltimore and 28.9 miles northeast of Washington, D.C. According to the appraisal, the neighborhood is primarily comprised of retail and residential uses with the Arundel Mills and Marketplace Property anchoring a dominant commercial corridor. Primary access to the area is provided by State Highway 100, which is adjacent to the Arundel Mills and Marketplace Property and had a traffic count of approximately 74,222 vehicles per day, and Interstate 295, which is
THE INFORMATION IN THIS STRUCTURAL AND COLLATERAL TERM SHEET IS NOT COMPLETE AND MAY BE AMENDED PRIOR TO THE TIME OF SALE. THIS TERM SHEET IS NOT AN OFFER TO SELL THESE SECURITIES AND IT IS NOT A SOLICITATION OF AN OFFER TO BUY THESE SECURITIES IN ANY JURISDICTION WHERE THE OFFER OR SALE IS NOT PERMITTED. |
| | 104 | |
| Structural and Collateral Term Sheet | | BMO 2024-C8 |
| No. 7 – Arundel Mills and Marketplace |
approximately two miles from the Arundel Mills and Marketplace Property. According to the appraisal, the top five employers in the surrounding area are Fort Meade, Johns Hopkins University, Johns Hopkins Hospital, University of Maryland Medical Systems and University System of Maryland.
Within a one-, three- and five-mile radius of the Arundel Mills and Marketplace Property, the 2022 average household income was approximately $148,021, $145,352 and $145,096, respectively; and within the same radii, the 2022 estimated population was 9,168, 53,846 and 155,847, respectively.
According to a third-party market research report, the Arundel Mills and Marketplace Property is situated within the BWI/Anne Arundel retail submarket of the Baltimore retail market. As of November 2023, the submarket reported total inventory of approximately 4.4 million square feet with a 1.1% vacancy rate and average rents of $27.55 per square foot.
The following table presents certain information relating to the appraiser’s market rent conclusions for the Arundel Mills and Marketplace Property:
| Market Rent Summary(1) |
| | Market Rent (PSF) | Lease Term (Yrs.) | Rent Increase Projections | New Tenant Improvements |
| Less Than <1,000 SF | $85.00 | 7 | 3.0% annually | $65.00 |
| 1,000-2,499 SF | $44.00 | 7 | 3.0% annually | $65.00 |
| 2,500-4,999 SF | $32.50 | 7 | 3.0% annually | $65.00 |
| 5,000-9,999 SF | $37.50 | 7 | 3.0% annually | $65.00 |
| Over 10,000 SF | $36.50 | 7 | 3.0% annually | $65.00 |
| Jewelry | $91.00 | 7 | 3.0% annually | $65.00 |
| Food Court | $202.50 | 7 | 3.0% annually | $65.00 |
| Restaurant | $39.00 | 7 | 3.0% annually | $150.00 |
| Kiosk | $385.00 | 7 | 3.0% annually | $0.00 |
| Jr. Anchor | $21.50 | 10 | 10.0% Mid-Term | $100.00 |
| Major | $22.50 | 10 | 10.0% Mid-Term | $100.00 |
| Anchor | $7.25 | 10 | 10.0% Mid-Term | $0.00 |
| Movie Theater | $31.00 | 10 | 10.0% Mid-Term | $65.00 |
| Grocery Anchor(2) | $15.00 | 20 | 10.0% every 5 years | $15.00 |
| Junior Anchor(2) | $17.00 | 10 | 10.0% Mid-Term | $15.00 |
| Large Inline(2) | $40.00 | 5 | 3.0% annually | $20.00 |
| (2) | Market rent conclusions for Arundel Marketplace. |
THE INFORMATION IN THIS STRUCTURAL AND COLLATERAL TERM SHEET IS NOT COMPLETE AND MAY BE AMENDED PRIOR TO THE TIME OF SALE. THIS TERM SHEET IS NOT AN OFFER TO SELL THESE SECURITIES AND IT IS NOT A SOLICITATION OF AN OFFER TO BUY THESE SECURITIES IN ANY JURISDICTION WHERE THE OFFER OR SALE IS NOT PERMITTED. |
| | 105 | |
| Structural and Collateral Term Sheet | | BMO 2024-C8 |
| No. 7 – Arundel Mills and Marketplace |
The table below presents certain information relating to comparable retail centers pertaining to the Arundel Mills and Marketplace Property identified by the appraiser:
| Competitive Set(1) |
| Property Name | Year Built/Renovated | Total NRA | Total Occupancy | Anchor / Major Tenants | Distance to Arundel Mills and Marketplace Property |
| Arundel Mills and Marketplace | 2000, 2002, 2012/NAP | 1,938,983 | 98.3 | %(2) | Live Casino Hotel, Bass Pro, Burlington, Dave & Buster’s, Medieval Times and Cinemark | NAP |
| Marley Station | 1987/2006 | 1,086,384 | 55.7 | % | Macy’s, JCPenney | 9.0 miles |
| Waugh Chapel Towne Centre | 2012/NAP | 662,717 | 97.1 | % | Wegmans, Target, Dick’s Sporting Goods, Regal Waugh Chapel | 13.0 miles |
| The Mall in Columbia | 1971/2018 | 1,439,872 | 91.7 | % | Macy’s, JCPenney, Nordstrom, AMC Columbia 14, Lidl | 13.2 miles |
| Security Square Mall | 1900/1998 | 1,345,170 | 97.8 | % | Macy’s, Burlington, AMC Security Square 8 | 16.2 miles |
| The Gallery at Harborplace | 1980/2019 | 327,774 | 50.4 | % | NAV | 12.5 miles |
| Westfield Wheaton | 1958/2016 | 1,522,828 | 97.2 | % | Macy’s, Target, Costco Wholesale, JCPenney | 27.6 miles |
| Weighted Average | | | 89.3 | % | | |
| (1) | Information obtained from the appraisal, unless otherwise specified. |
| (2) | Based on the Owned SF of the underwritten rent roll as of June 15, 2023. Total Occupancy based on total square feet is 98.8% |
The Borrowers. The borrowers are Arundel Mills Limited Partnership and Arundel Mills Marketplace Limited Partnership, each a Delaware limited partnership with two independent directors. The borrowers are each joint ventures between Simon Property Group, L.P. (59.3%) and Kan Am Group (40.7%). Legal counsel to the borrowers delivered a non-consolidation opinion in connection with the origination of the Arundel Mills and Marketplace Whole Loan.
The Borrower Sponsor. The borrower sponsor and non-recourse carveout guarantor of the Arundel Mills and Marketplace Whole Loan is Simon Property Group, L.P. (“Simon”). Simon Property Group, Inc. (NYSE: SPG) is a real estate investment trust engaged in the ownership of shopping, dining, entertainment and mixed-use destinations. Simon has approximately 400 retail centers across 24 countries. Simon Property Group, Inc. owned an approximately 87.0% ownership interest in Simon as of September 30, 2023, and has exclusive control of Simon’s day-to-day management. Pursuant to the Arundel Mills and Marketplace Whole Loan documents, so long as one or more of Simon Property Group, Inc. or Simon (collectively, “Simon Key Principal”) or an affiliate of Simon Key Principal is the non-recourse carveout guarantor, the non-recourse carveout guarantor’s liability under the guaranty is limited to 20.0% of the original principal balance of the Arundel Mills and Marketplace Whole Loan (i.e., $72,000,000) in the aggregate, plus all of the reasonable out-of-pocket costs and expenses (including court costs and reasonable attorneys’ fees) incurred by the lender in the enforcement of the related guaranty or the preservation of the lender’s rights under such guaranty. In addition, there is no separate environmental indemnity with respect to the Arundel Mills and Marketplace Whole Loan. The non-recourse carveout guaranty covers breaches of representations, warranties and indemnification provisions in the loan agreement concerning environmental laws and hazardous materials; however, such coverage is subject to the cap described above.
Property Management. The Arundel Mills and Marketplace Property is managed by Simon Management Associates II, LLC, an affiliate of the borrowers.
Escrows and Reserves. At origination of the Arundel Mills and Marketplace Whole Loan, the borrowers deposited approximately (i) $587,891 into a reserve account for gap rent and (ii) $3,796,478 into a reserve account for outstanding TI/LC.
Tax Reserve – After the occurrence of a Control Event (as defined below) or during a Lockbox Event Period (as defined below), or at any time (x) any property taxes are not paid by the borrowers prior to the assessment of a penalty, or (y) upon request of the lender, the borrowers fail to promptly provide evidence that property taxes have been paid prior to the assessment of a penalty, the Arundel Mills and Marketplace Whole Loan documents require the borrowers to make monthly
THE INFORMATION IN THIS STRUCTURAL AND COLLATERAL TERM SHEET IS NOT COMPLETE AND MAY BE AMENDED PRIOR TO THE TIME OF SALE. THIS TERM SHEET IS NOT AN OFFER TO SELL THESE SECURITIES AND IT IS NOT A SOLICITATION OF AN OFFER TO BUY THESE SECURITIES IN ANY JURISDICTION WHERE THE OFFER OR SALE IS NOT PERMITTED. |
| | 106 | |
| Structural and Collateral Term Sheet | | BMO 2024-C8 |
| No. 7 – Arundel Mills and Marketplace |
payments into the real estate tax reserve in an amount equal to 1/12th of the property taxes that the lender reasonably estimates will be payable during the ensuing 12 months.
Insurance Reserve – After the occurrence of a Control Event or during a Lockbox Event Period, if the borrowers have not provided satisfactory evidence to the lender that the Arundel Mills and Marketplace Property is covered by policies that are being maintained as part of a reasonably acceptable blanket insurance policy, the Arundel Mills and Marketplace Whole Loan documents require the borrowers to make ongoing monthly deposits in an amount equal to 1/12th of the insurance premiums that the lender reasonably estimates will be payable for the renewal of the coverage afforded by the policies in order to accumulate sufficient funds to pay the premiums at least 30 days prior to expiration.
Replacement Reserve – After the occurrence of a Control Event or during the Lockbox Event Period, the Arundel Mills and Marketplace Whole Loan documents require springing ongoing monthly deposits of $39,430 for replacement reserves.
TI / LC Reserve – The Arundel Mills and Marketplace Whole Loan documents require ongoing monthly deposits of $231,942 for tenant improvements and leasing commissions reserves, subject to a cap of $5,566,608, provided that no such cap will apply during a Lockbox Event Period.
Gap Rent Reserve – The Arundel Mills and Marketplace Whole Loan documents require an upfront deposit of $587,891 for gap and free rent related to Kids Empire, Brooks Brothers, and Komma Tea.
Outstanding TI/LC Reserve – The Arundel Mills and Marketplace Whole Loan documents require an upfront deposit of $3,796,478 for outstanding tenant improvements and leasing commissions related to Primark, Under Armour, Kids Empire, Adidas, The North Face, Brooks Brothers, Vera Bradley, Spencer’s, and Movado Company Store.
A “Control Event” will occur upon Simon Key Principal not owning at least 50% of the direct or indirect interests in the borrowers or not controlling the borrowers.
Lockbox / Cash Management. The Arundel Mills and Marketplace Whole Loan is structured with a hard lockbox and springing cash management. The borrowers are required to deposit all rents into a lender-controlled lockbox account within two business days of receipt, and to direct all tenants to make direct rent deposits into the lockbox account. As long as a Lockbox Event Period is not in effect, all funds in the lockbox account are required to be distributed to the borrowers weekly. During the continuance of a Lockbox Event Period, all funds in the lockbox will be transferred weekly to a lender-controlled cash management account to be disbursed in accordance with the Arundel Mills and Marketplace Whole Loan documents, with any excess funds required to be held as additional security in an excess cash flow subaccount controlled by the lender for so long as the Lockbox Event Period continues.
A “Lockbox Event Period” will commence upon the earlier of the following (each of the items in clauses (i) through (v), a “Lockbox Event”):
| | (i) | the occurrence of an event of default; |
| | (ii) | any bankruptcy action of the borrowers; |
| (iii) | a bankruptcy action of the manager if the manager is an affiliate of the borrowers, and provided the manager is not replaced within 60 days with a qualified manager; |
| (iv) | the net operating income debt yield (“NOI DY”), based on the trailing four calendar quarter period, is below 10.5%, for two consecutive calendar quarters; or |
| | (v) | the occurrence of a Major Tenant Trigger Event (as defined below). |
A Lockbox Event Period will end upon the occurrence of the following:
| | ● | with regard to clause (i), the cure of such event of default; |
| ● | with regard to clause (iii), the borrowers replace the manager with a qualified manager under a replacement management agreement within 60 days, or the bankruptcy action is discharged or dismissed within 90 days without any adverse consequences to the property or loan; |
| ● | with regard to clause (iv), the NOI DY being 10.5% or greater for two consecutive calendar quarters; or |
| ● | with regard to clause (v), so long as only one Major Tenant Trigger Event exists, the earlier to occur of (x) the date on which the applicable Major Tenant Threshold Amount (as defined below) has been deposited in the excess cash reserve account or (y) a Major Tenant Trigger Event Cure (as defined below) has occurred; provided, however, |
THE INFORMATION IN THIS STRUCTURAL AND COLLATERAL TERM SHEET IS NOT COMPLETE AND MAY BE AMENDED PRIOR TO THE TIME OF SALE. THIS TERM SHEET IS NOT AN OFFER TO SELL THESE SECURITIES AND IT IS NOT A SOLICITATION OF AN OFFER TO BUY THESE SECURITIES IN ANY JURISDICTION WHERE THE OFFER OR SALE IS NOT PERMITTED. |
| | 107 | |
| Structural and Collateral Term Sheet | | BMO 2024-C8 |
| No. 7 – Arundel Mills and Marketplace |
that, the expiration or termination of the Lockbox Event Period is subject to the following conditions, among others set forth in the Arundel Mills and Marketplace Whole Loan documents: (i) no other Lockbox Event has occurred and is continuing, (ii) no other event of default has occurred and is continuing and (iii) the borrowers may not cure a Lockbox Event (x) more than a total of five times in the aggregate during the term of the Loan or (y) triggered by a bankruptcy action of the borrowers.
A “Major Tenant Trigger Event” will commence upon the occurrence of any of the following: (i) a bankruptcy action of Bass Pro Shops, Cinemark, Live Casino Hotel or any replacement tenant occupying at least 50% of the space (each, a “Major Tenant”); (ii) a Major Tenant going dark or vacating, on a permanent basis (other than temporary closures due to renovation, closures less than 90 days or closures mandated by law or related to COVID stay-at-home orders); or (iii) a Major Tenant failing to give notice to renew its lease by the earlier of (a) the date required under the lease or (b) the date that is 6 months prior to the lease expiration date.
A “Major Tenant Threshold Amount” means, with respect to (i) the space occupied by Bass Pro, the amount of $6,383,600, (ii) with respect to the space occupied by Cinemark, the amount of $5,359,500 and (iii) with respect to the space occupied by Live Casino Hotel, the amount of $13,037,450.
An “Major Tenant Trigger Event Cure” will commence upon the occurrence of any of the following: (A) with regard to clause (i) of the definition of Major Tenant Trigger Event, (a) the applicable Major Tenant has assumed and any applicable bankruptcy court has affirmed such assumption of the Major Tenant lease, and the applicable Major Tenant is in occupancy of its full space or (b) at the borrowers’ election, the guarantor has delivered to the lender a guaranty in the applicable Major Tenant Threshold Amount, (B) with regard to clause (ii) of the definition of Major Tenant Trigger Event, (a) the applicable Major Tenant continuously operates its business for at least 30 consecutive days during normal business hours and is paying full rent as is required under the lease or (b) at the borrowers’ election, the guarantor has delivered to the lender a guaranty in the applicable Major Tenant Threshold Amount and (C) with regard to clause (iii) of the definition of Major Tenant Trigger Event, (a) the date on which Major Tenant renews and/or extends its lease, (b) at least 50% of the applicable Major Tenant space has been leased to one or more new tenants, (c) the applicable Major Tenant Threshold Amount has been deposited in the excess cash reserve account or (d) at the borrowers’ election, the guarantor has delivered to the lender a guaranty in the applicable Major Tenant Threshold Amount.
Subordinate and Mezzanine Debt. None.
Permitted Future Mezzanine Debt. Not permitted.
Partial Release. Provided that no event of default exists and a Control Event has not occurred, (I) with respect to a partial prepayment, at any time prior to the date that is two years after the closing date of the securitization that includes the last note to be securitized (the “REMIC Prohibition Period”), and (II) with respect to a partial defeasance, at any time after the earlier to occur of (a) December 1, 2026, and (b) the expiration of the REMIC Prohibition Period, the Arundel Mills and Marketplace Whole Loan documents permit the release of Arundel Marketplace, which has an allocated loan amount of $11,000,000, upon defeasance or prepayment (together with, if prior to the open period, payment of a prepayment fee equal to the greater of 1.00% of the amount prepaid and a yield maintenance premium), as applicable, of 100% of such allocated loan amount of $11,000,000, provided the following conditions, among others, are satisfied: (i) (a) the lender’s determination that the post-release debt yield for Arundel Mills is equal to or greater than the pre-release debt yield for the mortgaged property or (b) the borrowers’ partial defeasance or partial prepayment of the Arundel Mills and Marketplace Mortgage Whole Loan in an amount that would result in the post-release debt yield for Arundel Mills being equal to or greater than the pre-release debt yield for the mortgaged property; (ii) an opinion of counsel that the partial release satisfies REMIC related requirements; and (iii) if Arundel Marketplace is conveyed to an affiliate, (a) receipt of an officer’s certificate confirming that the intended primary use of Arundel Marketplace will not be exclusively for retail, (b) any tenants being relocated to Arundel Marketplace from Arundel Mills have been replaced with comparable tenants on comparable rental terms, (c) the release will not have a material adverse effect on Arundel Mills and (d) a rent roll and leasing plan for the Arundel Mills and Arundel Marketplace.
Additionally, the borrowers own a non-income producing 24.21-acre parcel of vacant forestry land at the Arundel Mills and Marketplace Property (“Forestry Parcel”), adjacent to which is a single-family home. The home was purchased in 2002 and was surrounded by a fence. Approximately 43,493 square feet of the Forestry Parcel (“Contested Portion”) is located within that fence. The owner of the single-family home has filed an adverse possession suit claiming ownership of the Contested Portion. The value of the Forestry Parcel was not deducted from the appraised value of the Arundel Mills and
THE INFORMATION IN THIS STRUCTURAL AND COLLATERAL TERM SHEET IS NOT COMPLETE AND MAY BE AMENDED PRIOR TO THE TIME OF SALE. THIS TERM SHEET IS NOT AN OFFER TO SELL THESE SECURITIES AND IT IS NOT A SOLICITATION OF AN OFFER TO BUY THESE SECURITIES IN ANY JURISDICTION WHERE THE OFFER OR SALE IS NOT PERMITTED. |
| | 108 | |
| Structural and Collateral Term Sheet | | BMO 2024-C8 |
| No. 7 – Arundel Mills and Marketplace |
Marketplace Property in the appraisal, nor was the Forestry Parcel separately valued in the appraisal. Under the Arundel Mills and Marketplace Whole Loan documents, the borrowers may obtain a release from the lien of the mortgage of, for no additional consideration, the Contested Portion, or such substantially similar tract of land the borrowers are required to convey in connection with the adverse possession suit (or reasonably agrees to convey in order to settle the suit).
Ground Lease. None.
THE INFORMATION IN THIS STRUCTURAL AND COLLATERAL TERM SHEET IS NOT COMPLETE AND MAY BE AMENDED PRIOR TO THE TIME OF SALE. THIS TERM SHEET IS NOT AN OFFER TO SELL THESE SECURITIES AND IT IS NOT A SOLICITATION OF AN OFFER TO BUY THESE SECURITIES IN ANY JURISDICTION WHERE THE OFFER OR SALE IS NOT PERMITTED. |
| | 109 | |
| Structural and Collateral Term Sheet | | BMO 2024-C8 |
| No. 8 – Monroe Street Retail |

THE INFORMATION IN THIS STRUCTURAL AND COLLATERAL TERM SHEET IS NOT COMPLETE AND MAY BE AMENDED PRIOR TO THE TIME OF SALE. THIS TERM SHEET IS NOT AN OFFER TO SELL THESE SECURITIES AND IT IS NOT A SOLICITATION OF AN OFFER TO BUY THESE SECURITIES IN ANY JURISDICTION WHERE THE OFFER OR SALE IS NOT PERMITTED. |
| | 110 | |
| Structural and Collateral Term Sheet | | BMO 2024-C8 |
| No. 8 – Monroe Street Retail |
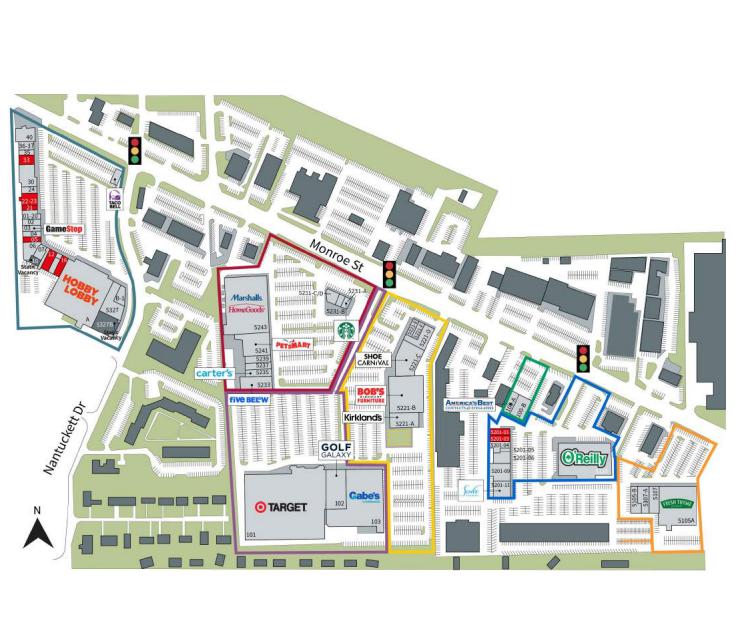
THE INFORMATION IN THIS STRUCTURAL AND COLLATERAL TERM SHEET IS NOT COMPLETE AND MAY BE AMENDED PRIOR TO THE TIME OF SALE. THIS TERM SHEET IS NOT AN OFFER TO SELL THESE SECURITIES AND IT IS NOT A SOLICITATION OF AN OFFER TO BUY THESE SECURITIES IN ANY JURISDICTION WHERE THE OFFER OR SALE IS NOT PERMITTED. |
| | 111 | |
| Structural and Collateral Term Sheet | | BMO 2024-C8 |
| No. 8 – Monroe Street Retail |

THE INFORMATION IN THIS STRUCTURAL AND COLLATERAL TERM SHEET IS NOT COMPLETE AND MAY BE AMENDED PRIOR TO THE TIME OF SALE. THIS TERM SHEET IS NOT AN OFFER TO SELL THESE SECURITIES AND IT IS NOT A SOLICITATION OF AN OFFER TO BUY THESE SECURITIES IN ANY JURISDICTION WHERE THE OFFER OR SALE IS NOT PERMITTED. |
| | 112 | |
| Structural and Collateral Term Sheet | | BMO 2024-C8 |
| No. 8 – Monroe Street Retail |
| Mortgage Loan Information | | Property Information |
| Mortgage Loan Seller: | ZBNA | | Single Asset / Portfolio: | Single Asset |
| Original Principal Balance: | $34,500,000 | | Title: | Fee |
| Cut-off Date Principal Balance: | $34,500,000 | | Property Type – Subtype: | Retail – Anchored |
| % of IPB: | 5.0% | | Net Rentable Area (SF): | 543,378 |
| Loan Purpose: | Acquisition | | Location: | Toledo, OH |
| Borrower: | Triple Bar Toledo LLC | | Year Built / Renovated: | 1970-1972, 1974, 1990-1991, 2005, 2014-2015, 2017 / 2016, 2023 |
| Borrower Sponsors: | Robert V. Gothier, Jr. and Mark X. DiSanto | | Occupancy: | 94.4% |
| Interest Rate: | 6.87000% | | Occupancy Date: | 12/20/2023 |
| Note Date: | 12/21/2023 | | 4th Most Recent NOI (As of): | $4,517,789 (12/31/2020) |
| Maturity Date: | 1/6/2034 | | 3rd Most Recent NOI (As of): | $4,677,799 (12/31/2021) |
| Interest-only Period: | 120 months | | 2nd Most Recent NOI (As of): | $4,666,712 (12/31/2022) |
| Original Term: | 120 months | | Most Recent NOI (As of): | $4,303,618 (TTM 10/31/2023) |
| Original Amortization Term: | None | | UW Economic Occupancy: | 92.0% |
| Amortization Type: | Interest Only | | UW Revenues: | $7,345,436 |
| Call Protection: | L(26),D(89),O(5) | | UW Expenses: | $2,835,920 |
| Lockbox / Cash Management: | Springing | | UW NOI: | $4,509,516 |
| Additional Debt: | No | | UW NCF: | $4,142,072 |
| Additional Debt Balance: | N/A | | Appraised Value / Per SF(1): | $54,800,000 / $101 |
| Additional Debt Type: | N/A | | Appraisal Date: | 12/1/2024 |
| | | | | |
| Escrows and Reserves(2) | | Financial Information |
| | Initial | Monthly | Initial Cap | | Cut-off Date Loan / SF: | $63 |
| Taxes: | $177,479 | $118,319 | N/A | | Maturity Date Loan / SF: | $63 |
| Insurance: | $0 | Springing | N/A | | Cut-off Date LTV: | 63.0% |
| Replacement Reserves: | $500,000 | $6,792 | N/A | | Maturity Date LTV: | 63.0% |
| TI / LC: | $1,000,000 | Springing | $1,000,000 | | UW NCF DSCR: | 1.72x |
| Rent Concession Reserve: | $533,333 | $0 | N/A | | UW NOI Debt Yield: | 13.1% |
| Existing TI / LC Reserve: | $713,619 | $0 | N/A | | | |
| | | | | | | |
| Sources and Uses |
| Sources | Proceeds | % of Total | | | Uses | Proceeds | % of Total | |
| Mortgage Loan | $34,500,000 | 61.3 | % | | Purchase Price(3) | $51,500,000 | 91.5 | % |
| Borrower Sponsor Equity | 19,044,737 | 33.8 | | | Upfront Reserves | 3,881,430 | 6.9 | |
| Seller Credits | 2,746,952 | 4.9 | | | Closing Costs(4) | 910,260 | 1.6 | |
| Total Sources | $56,291,689 | 100.0 | % | | Total Uses | $56,291,689 | 100.0 | % |
| (1) | The Appraised Value / Per SF is a “Prospective Market Value Upon Start of O'Reilly Auto Parts Lease” of $54,800,000, which assumes that as of December 1, 2024, O’Reilly Auto Parts has taken possession of its leased space and commenced rent payments. Gap rent through December 2024 and all applicable tenant improvements and leasing commissions were reserved with the lender for such tenant at the time of origination of the Monroe Street Retail Mortgage Loan (as defined below). The “as-is” appraised value of the Monroe Street Retail Property (as defined below) as of November 21, 2023 was $52,100,000. |
| (2) | For a full description of Escrows and Reserves, please refer to “Escrows and Reserves” below. |
| (3) | A mortgage loan securing a portion of the Monroe Street Retail Property was previously securitized in the GSMS 2014-GC18 securitization trust. |
| (4) | Closing Costs includes an interest rate buydown fee of $345,000. |
The Loan. The eighth largest mortgage loan (the “Monroe Street Retail Mortgage Loan”) is evidenced by a single promissory note in the original principal amount of $34,500,000, secured by the borrower’s fee interest in an anchored retail shopping center located in Toledo, Ohio (the “Monroe Street Retail Property”). The Monroe Street Retail Mortgage Loan was originated on December 21, 2023 by Zions Bancorporation, N.A. (“ZBNA”) and proceeds, along with approximately $19.0 million of equity contributed by the borrower sponsor and $2.7 million in seller credits, were used to acquire the Monroe Street Retail Property, fund upfront reserves and pay closing costs. The Monroe Street Retail Mortgage Loan accrues interest at a fixed rate of 6.87000% per annum, has a 10-year original term and is interest-only for the full term.
THE INFORMATION IN THIS STRUCTURAL AND COLLATERAL TERM SHEET IS NOT COMPLETE AND MAY BE AMENDED PRIOR TO THE TIME OF SALE. THIS TERM SHEET IS NOT AN OFFER TO SELL THESE SECURITIES AND IT IS NOT A SOLICITATION OF AN OFFER TO BUY THESE SECURITIES IN ANY JURISDICTION WHERE THE OFFER OR SALE IS NOT PERMITTED. |
| | 113 | |
| Structural and Collateral Term Sheet | | BMO 2024-C8 |
| No. 8 – Monroe Street Retail |
The Property. The Monroe Street Retail Property is a 10-building anchored retail shopping center totaling 543,378 square feet, situated along the Ohio State Route 51 (Monroe Street) retail corridor in Toledo, Ohio. Combined traffic counts total approximately 23,374 vehicles per day at the Monroe Street Retail Property. The buildings were constructed between 1970 and 2017 and certain buildings were renovated in 2016 and 2023. The Monroe Street Retail Property consists of seven non-contiguous parcels with a combined size of 46.5-acres and is anchored by national tenants including Target, Marshalls-HomeGoods, Hobby Lobby, Fresh Thyme Farmers Market and junior anchor Golf Galaxy. Additional notable anchor, junior anchor and in-line tenants include Gabe’s, O’Reilly Auto Parts, Bob’s Discount Furniture, Shoe Carnival, PetSmart, Kirkland’s, Five Below, KidStrong and GameStop, plus several dining options including Starbucks Coffee, Dave’s Hot Chicken, Tropical Smoothie Café and Taco Bell. Six tenants, collectively comprising 37.0% of net rentable area and 26.3% of underwritten base rent, are investment-grade rated by Moody’s and S&P (see the “Tenant Summary” table below). The top ten tenants, collectively comprising 70.0% of net rentable area and 59.9% of underwritten base rent, have been in occupancy at the Monroe Street Retail Property for a weighted average of 15.8 years. The seller completed approximately $909,565 in capital expenditures from 2020-2023, including ADA improvements, LED lighting upgrades, landscape upgrades, concrete repairs and building caulk and exterior painting at the Monroe Street Retail Property.
As of December 20, 2023, the Monroe Street Retail Property was 94.4% occupied by 46 tenants and has averaged 94.8% occupancy from 2014 through December 20, 2023. No single tenant represents more than 9.3% of underwritten base rent and only Target, which occupies its space pursuant to a ground lease, represents more than 10.1% of the net rentable area. The Monroe Street Retail Property contains 2,432 surface parking spaces, resulting in a parking ratio of approximately 4.5 spaces per 1,000 square feet of rentable area.
Major Tenants. The three largest tenants based on underwritten base rent are Fresh Thyme Farmers Market, Marshalls-HomeGoods and Gabe’s.
Fresh Thyme Farmers Market (30,000 square feet; 5.5% of NRA, 9.3% of underwritten base rent): Founded in 2012 and operating out of Downers Grove, Illinois, Fresh Thyme Farmers Market (“Fresh Thyme”) employs approximately 12,000 people across 70 stores primarily in the Midwestern United States and Pennsylvania. Fresh Thyme is a privately held company and is partially owned by Meijer. Fresh Thyme has been a tenant at the Monroe Street Retail Property since January 2016, with its current lease expiration date in July 2031 and has four remaining 5-year extension options, with no unilateral termination options. Fresh Thyme reports sales at the Monroe Street Retail Property of approximately $351 per square foot as of December 31, 2022.
Marshalls-HomeGoods (45,518 square feet; 8.4% of NRA, 8.9% of underwritten base rent, Moody’s/S&P/Fitch: A2/A/NR): Marshalls and HomeGoods are operated under the TJX Companies umbrella (NYSE: TJX), having the same parent company as TJ Maxx. Per the appraisal, the TJX Companies have over 329,000 employees, annual revenue of over $49.9 billion dollars and operate in all 50 states. Marshalls-HomeGoods has been a tenant since 2014, when its building was fully constructed at the Monroe Street Retail Property. Its current lease expiration date is in October 2029 and the tenant has three, 5-year extension options remaining, with no unilateral termination options.
Gabe’s (50,514 square feet; 9.3% of NRA, 8.0% of underwritten base rent): Founded in 1961 in Morgantown, West Virginia, Gabe’s is an off-price clothing, footwear and home goods retailer. After its acquisition of Old Time Pottery, a Tennessee-based home merchandise store in 2023, Gabe’s has more than 167 store locations in 20 states, along with six distribution centers servicing the Mid-Atlantic, Midwest and Southeastern United States. Gabe’s has been a tenant at the Monroe Street Retail Property since August 2013, with its current lease expiration date in February 2029 and has one, 5-year extension option remaining, with no unilateral termination options. Gabe’s reports sales at the Monroe Street Retail Property of approximately $125 per square foot as of December 31, 2022.
The following table presents certain information relating to the historical occupancy of the Monroe Street Retail Property:
| Historical and Current Occupancy |
| 2020(1) | 2021(1) | 2022(1) | Current(2) |
| 93.7% | 94.5% | 90.1% | 94.4% |
| (1) | Historical Occupancies are as of December 31 of each respective year. |
| (2) | Based on the underwritten rent roll dated December 20, 2023. |
THE INFORMATION IN THIS STRUCTURAL AND COLLATERAL TERM SHEET IS NOT COMPLETE AND MAY BE AMENDED PRIOR TO THE TIME OF SALE. THIS TERM SHEET IS NOT AN OFFER TO SELL THESE SECURITIES AND IT IS NOT A SOLICITATION OF AN OFFER TO BUY THESE SECURITIES IN ANY JURISDICTION WHERE THE OFFER OR SALE IS NOT PERMITTED. |
| | 114 | |
| Structural and Collateral Term Sheet | | BMO 2024-C8 |
| No. 8 – Monroe Street Retail |
Appraisal. According to the appraisal, the Appraised Value is a “Prospective Market Value Upon Start of O'Reilly Auto Parts Lease” is $54,800,000, which assumes that as of December 1, 2024, O’Reilly Auto Parts has taken possession of its leased space and commenced rent payments. Gap rent through December 2024 and all applicable tenant improvements and leasing commissions were reserved with the lender for such tenant at the time of origination of the Monroe Street Retail Mortgage Loan. The “as-is” appraised value of the Monroe Street Retail Property as of November 21, 2023 was $52,100,000.
Appraisal Valuation Summary(1) |
Property | Appraised Value | Capitalization Rate |
| Monroe Street Retail | $54,800,000 | 9.25% |
Environmental. The Phase I environmental assessment at the Monroe Street Retail Property dated December 20, 2023 did not identify any recognized environmental conditions.
The following table presents certain information relating to the largest tenants based on underwritten base rent at the Monroe Street Retail Property:
| Tenant Summary(1) |
| Tenant | Ratings
Moody’s/S&P/Fitch(2) | Net Rentable Area (SF) | % of
Total NRA | UW Base Rent PSF(3) | UW Base Rent(3) | % of Total
UW Base Rent(3) | Sales PSF/Year(4) | UW Occ. Costs(5) | Lease
Exp. Date |
| Fresh Thyme Farmers Market | NR/NR/NR | 30,000 | 5.5 | % | $17.00 | | $510,000 | 9.3 | % | $351 | 6.2% | 7/31/2031 | |
| Marshalls-HomeGoods | A2/A/NR | 45,518 | 8.4 | | $10.75 | | 489,319 | 8.9 | | NAV | NAV | 10/31/2029 | |
| Gabe’s | NR/NR/NR | 50,514 | 9.3 | | $8.68 | | 438,536 | 8.0 | | $125 | 10.7% | 2/28/2029 | |
| Hobby Lobby | NR/NR/NR | 55,000 | 10.1 | | $6.00 | | 330,000 | 6.0 | | NAV | NAV | 5/31/2029 | |
| O’Reilly Auto Parts(6) | Baa1/BBB/NR | 32,154 | 5.9 | | $10.25 | | 329,579 | 6.0 | | NAV | NAV | 12/31/2039 | |
| Bob’s Discount Furniture | NR/NR/NR | 23,200 | 4.3 | | $14.00 | | 324,800 | 5.9 | | NAV | NAV | 6/30/2033 | |
| Target(7) | A2/A/A | 101,909 | 18.8 | | $2.50 | | 255,000 | 4.7 | | NAV | NAV | 1/31/2026 | |
| Golf Galaxy | Baa3/BBB/NR | 15,920 | 2.9 | | $14.17 | | 225,586 | 4.1 | | NAV | NAV | 1/31/2029 | |
| Shoe Carnival | NR/NR/NR | 13,867 | 2.6 | | $14.64 | | 203,013 | 3.7 | | $300 | 6.4% | 5/31/2026 | |
| PetSmart | B3/B+/NR | 12,348 | 2.3 | | $14.50 | | 179,046 | 3.3 | | NAV | NAV | 4/30/2025 | |
| Top 10 Tenants | | 380,430 | 70.0 | % | $8.63 | | $3,284,879 | 59.9 | % | | | |
| Other Tenants | | 132,595 | 24.4 | % | $16.55 | | $2,195,016 | 40.1 | % | | | |
| Occupied Collateral Total / Wtd. Avg. | | 513,025 | 94.4 | % | $10.68 | | $5,479,895 | 100.0 | % | | | |
| | | | | | | | | | |
| Vacant Space | | 30,353 | 5.6 | % | | | | | | |
| | | | | | | | | | |
| Collateral Total | | 543,378 | 100.0 | % | | | | | | |
| | | | | | | | | | |
| (1) | Based on the underwritten rent roll dated December 20, 2023. |
| (2) | In certain instances, ratings provided are those of the parent company of the entity shown, whether or not the parent company guarantees the lease. |
| (3) | UW Base Rent, % of Total UW Base Rent and UW Base Rent PSF include contractual rent steps through January 2025 for 15 tenants totaling $66,739 but does not include straight-line rent averaging for the investment-grade tenant O’Reilly Auto Parts. |
| (4) | Sales PSF/Year are as of the trailing 12-month period ending December 31, 2022, as provided by the tenants to the borrower. |
| (5) | UW Occ. Costs are based on underwritten base rent and reimbursements and most recently reported sales. |
| (6) | O’Reilly Auto Parts is expected to commence rent payments upon the date the tenant opens for business, which is estimated to be December 1, 2024. All applicable tenant improvements, leasing commissions and gap rent through and including December 2024 were escrowed upfront in connection with the origination of the Monroe Street Retail Mortgage Loan. |
| (7) | Target occupies its space on a ground lease. |
THE INFORMATION IN THIS STRUCTURAL AND COLLATERAL TERM SHEET IS NOT COMPLETE AND MAY BE AMENDED PRIOR TO THE TIME OF SALE. THIS TERM SHEET IS NOT AN OFFER TO SELL THESE SECURITIES AND IT IS NOT A SOLICITATION OF AN OFFER TO BUY THESE SECURITIES IN ANY JURISDICTION WHERE THE OFFER OR SALE IS NOT PERMITTED. |
| | 115 | |
| Structural and Collateral Term Sheet | | BMO 2024-C8 |
| No. 8 – Monroe Street Retail |
The following table presents certain information relating to the tenant lease expirations at the Monroe Street Retail Property:
| Lease Rollover Schedule(1)(2) |
| Year | Number of Leases Expiring | Net Rentable Area Expiring | % of NRA Expiring | UW Base Rent Expiring(3) | % of UW Base Rent Expiring(3) | Cumulative Net Rentable Area Expiring | Cumulative % of NRA Expiring | Cumulative UW Base Rent Expiring(3) | Cumulative % of UW Base Rent Expiring(3) |
| Vacant | NAP | 30,353 | 5.6 | % | NAP | NA | P | 30,353 | | 5.6% | | NAP | NAP | |
| 2024 & MTM | 4 | 9,884 | 1.8 | | $184,098 | 3.4 | % | 40,237 | | 7.4% | | $184,098 | 3.4% | |
| 2025 | 12 | 49,596 | 9.1 | | 717,884 | 13.1 | | 89,833 | | 16.5% | | $901,982 | 16.5% | |
| 2026 | 7 | 129,998 | 23.9 | | 714,792 | 13.0 | | 219,831 | | 40.5% | | $1,616,774 | 29.5% | |
| 2027 | 1 | 2,160 | 0.4 | | 39,699 | 0.7 | | 221,991 | | 40.9% | | $1,656,472 | 30.2% | |
| 2028 | 4 | 15,712 | 2.9 | | 306,828 | 5.6 | | 237,703 | | 43.7% | | $1,963,300 | 35.8% | |
| 2029 | 7 | 185,112 | 34.1 | | 1,714,109 | 31.3 | | 422,815 | | 77.8% | | $3,677,409 | 67.1% | |
| 2030 | 0 | 0 | 0.0 | | 0 | 0.0 | | 422,815 | | 77.8% | | $3,677,409 | 67.1% | |
| 2031 | 2 | 35,912 | 6.6 | | 566,164 | 10.3 | | 458,727 | | 84.4% | | $4,243,573 | 77.4% | |
| 2032 | 3 | 11,192 | 2.1 | | 183,268 | 3.3 | | 469,919 | | 86.5% | | $4,426,841 | 80.8% | |
| 2033 | 2 | 29,200 | 5.4 | | 438,800 | 8.0 | | 499,119 | | 91.9% | | $4,865,641 | 88.8% | |
| 2034 | 2 | 9,878 | 1.8 | | 205,379 | 3.7 | | 508,997 | | 93.7% | | $5,071,020 | 92.5% | |
| 2035 & Beyond | 2 | 34,381 | 6.3 | | 408,875 | 7.5 | | 543,378 | | 100.0% | | $5,479,895 | 100.0% | |
| Total | 46 | 543,378 | 100.0 | % | $5,479,895 | 100.0 | % | | | | |
| (1) | Based on the underwritten rent roll dated December 20, 2023. |
| (2) | Certain tenants may have lease termination options that are exercisable prior to the originally stated expiration date of the subject lease and that are not considered in the lease rollover schedule. |
| (3) | UW Base Rent Expiring, % of UW Base Rent Expiring, Cumulative UW Base Rent Expiring and Cumulative % of UW Base Rent Expiring include contractual rent steps through January 2025 for 15 tenants totaling $66,739 but does not include straight-line rent averaging for the investment-grade tenant O’Reilly Auto Parts. |
The following table presents certain information relating to the operating history and underwritten cash flows of the Monroe Street Retail Property:
| Operating History and Underwritten Net Cash Flow |
| | 2020 | 2021 | 2022 | 10/31/2023 TTM | Underwritten | Per Square Foot | %(1) |
| Base Rent(2) | $5,244,109 | $5,277,237 | $5,431,435 | $5,269,297 | | $5,493,077 | $10.11 | 68.8 | % |
| Grossed Up Vacant Space | 0 | 0 | 0 | 0 | | 416,719 | 0.77 | 5.2 | |
| Gross Potential Rent | $5,244,109 | $5,277,237 | $5,431,435 | $5,269,297 | | $5,909,796 | $10.88 | 74.0 | % |
| Other Income(3) | 67,721 | 85,534 | 31,974 | 31,785 | | 35,463 | 0.07 | 0.4 | |
| Percentage Rent(4) | 14,600 | 0 | 0 | 0 | | 0 | 0.00 | 0.0 | |
| Total Reimbursements | 1,523,803 | 1,527,032 | 1,391,424 | 1,348,689 | | 2,035,826 | 3.75 | 25.5 | |
| Net Rental Income | $6,850,232 | $6,889,802 | $6,854,833 | $6,649,770 | | $7,981,086 | $14.69 | 100.0 | % |
| (Vacancy & Credit Loss)(5) | (200,429) | 22,906 | (24,665) | (266,512) | | (635,650) | (1.17) | (8.0 | ) |
| Effective Gross Income | $6,649,802 | $6,912,708 | $6,830,168 | $6,383,258 | | $7,345,436 | $13.52 | 92.0 | % |
| Total Expenses(6) | $2,132,014 | $2,234,909 | $2,163,456 | $2,079,640 | | $2,835,920 | $5.22 | 38.6 | % |
| Net Operating Income | $4,517,789 | $4,677,799 | $4,666,712 | $4,303,618 | | $4,509,516 | $8.30 | 61.4 | % |
| Capital Expenditures | 0 | 0 | 0 | 0 | | 81,507 | 0.15 | 1.1 | |
| TI / LC | 0 | 0 | 0 | 0 | | 285,937 | 0.53 | 3.9 | |
| Net Cash Flow | $4,517,789 | $4,677,799 | $4,666,712 | $4,303,618 | | $4,142,072 | $7.62 | 56.4 | % |
| (1) | % column represents percent of Net Rental Income for all revenue lines and represents percent of Effective Gross Income for the remainder of fields. |
| (2) | Underwritten Base Rent includes $13,183 of straight-line rent averaging credit for investment-grade tenant O’Reilly Auto Parts. |
| (3) | Other Income reflects the contractual amounts paid by the two automated teller machines on site at the Monroe Street Retail Property. |
| (4) | The 2020 Percentage Rent was paid by a prior tenant at the Monroe Street Retail Property. |
| (5) | Historically, the Vacancy & Credit Loss consists of bad debt. The underwritten economic occupancy is 92.0%. The Monroe Street Retail Property was 94.4% physically occupied based on the December 20, 2023 rent roll. |
| (6) | The management fee is underwritten to reflect 4.0% of Effective Gross Income and is subordinate to the Monroe Street Retail Mortgage Loan. The Monroe Street Retail Property is managed by a borrower sponsor affiliate. |
THE INFORMATION IN THIS STRUCTURAL AND COLLATERAL TERM SHEET IS NOT COMPLETE AND MAY BE AMENDED PRIOR TO THE TIME OF SALE. THIS TERM SHEET IS NOT AN OFFER TO SELL THESE SECURITIES AND IT IS NOT A SOLICITATION OF AN OFFER TO BUY THESE SECURITIES IN ANY JURISDICTION WHERE THE OFFER OR SALE IS NOT PERMITTED. |
| | 116 | |
| Structural and Collateral Term Sheet | | BMO 2024-C8 |
| No. 8 – Monroe Street Retail |
The Market. The Monroe Street Retail Property is located along Ohio State Route 51 (Monroe Street), approximately 7.3 miles northwest of the Toledo, Ohio central business district (“CBD”). Per the appraisal, combined traffic counts total approximately 23,374 vehicles per day at the Monroe Street Retail Property. Primary access to the area is provided by Interstates 75 and 475 and U.S. Highway 20 and 23 and West Sylvania Avenue, with approximate driving times to the Toledo CBD, Eugene F. Kranz Toledo Express Airport, Ann Arbor, Michigan and Detroit Metropolitan Wayne County Airport of 14, 24, 51 and 49 minutes, respectively.
According to the appraisal, the immediate area surrounding the Monroe Street Retail Property was developed with a mix of residential and commercial uses. Demand generators include manufacturing and labor for the automotive factories in the region, including the Chrysler Toledo Assembly Plant and the Jeep Plant situated approximately 9.8 and 8.3 miles east of the Monroe Street Retail Property, respectively. ProMedica Health Systems, one of the largest area employers per the appraisal, has its Toledo hospital campus approximately 4.1 miles southeast of the Monroe Street Retail Property. Additionally, The University of Toledo, with a student enrollment of over 15,000, has its campus situated approximately 4.5 miles southeast of the Monroe Street Retail Property.
According to the appraisal, within a one-, three- and five-mile radius of the Monroe Street Retail Property, the 2023 average household income was approximately $102,908, $97,717 and $87,559, respectively; and within the same radii, the 2023 estimated population was 8,361, 79,162 and 193,527, respectively. The United States Census Bureau noted the 2018-2022 State of Ohio’s median household income as being $66,990. According to a third-party market research report, the Monroe Street Retail Property is situated within the West/Sylvania retail submarket of the Toledo – OH retail market. As of February 7, 2024, the submarket reported total retail inventory of approximately 15.6 million square feet with a 3.5% vacancy rate and average asking rents of $13.96 per square foot.
The following table presents certain information relating to the comparable Anchor/Jr. Anchor retail leases for the Monroe Street Retail Property:
| Comparable Anchor/Jr. Anchor Retail Rental Summary(1) |
| Property Name/Location | Year Built/Renovated | Size (SF) | Distance from Subject (Miles) | Tenant | Suite Size (SF) | Rent PSF | Lease Start Date | Lease Term (Years) |
Monroe Street Retail 5115, 5157, 5203, 5221, 5225, 5235 and 5329 Monroe Street Toledo, OH | 1970-1972, 1974, 1990-1991, 2005, 2014-2015, 2017 / 2016, 2023 | 543,378(2) | -- | Various(2) | 15,920 – 55,000(2)(3) | $6.00 – 17.00(2)(3) | Various(2) | Various(2) |
Lafayette Pavillions 100-200 S Creasy Ln Lafayette, IN | 2006/NAV | 423,740 | 188.3 | TJ Maxx | 30,000 | $10.50 | Feb-2022 | 5.0 |
The Shops at River Crossing 8605-8709 River Crossing Blvd Indianapolis, IN | 1995/2015 | 105,291 | 178.0 | DSW | 18,596 | $18.50 | Oct-2023 | 10.0 |
Cross Pointe Shopping Center 127-191 E Alex Bell Rd Centerville, OH | 1987/NAV | 145,633 | 144.4 | Dots Market | 27,261 | $14.00 | Jul-2022 | 10.0 |
Northpointe Center 3909 Gorsky Dr Zanesville, OH | 2006/NAV | 75,745 | 145.0 | Academy Sports & Outdoor | 55,521 | $10.00 | Sep-2023 | 15.0 |
Mall Woods Shopping Center 131-161 Mall Woods Dr Dayton, OH | 1994/NAV | 78,793 | 145.4 | Best Buy | 45,483 | $9.50 | Sep-2023 | 5.0 |
Hartland Plaza 10490 Highland Rd Hartland, MI | 1980/NAV | 56,187 | 64.6 | Planet Fitness | 23,800 | $7.50 | Jan-2024 | 10.0 |
| (2) | Based on the underwritten rent roll dated December 20, 2023. |
| (3) | Excludes Target as the tenant occupies its space pursuant to a ground lease. |
THE INFORMATION IN THIS STRUCTURAL AND COLLATERAL TERM SHEET IS NOT COMPLETE AND MAY BE AMENDED PRIOR TO THE TIME OF SALE. THIS TERM SHEET IS NOT AN OFFER TO SELL THESE SECURITIES AND IT IS NOT A SOLICITATION OF AN OFFER TO BUY THESE SECURITIES IN ANY JURISDICTION WHERE THE OFFER OR SALE IS NOT PERMITTED. |
| | 117 | |
| Structural and Collateral Term Sheet | | BMO 2024-C8 |
| No. 8 – Monroe Street Retail |
The following table presents certain information relating to the comparable large in-line retail leases for the Monroe Street Retail Property:
| Comparable Large In-Line Retail Rental Summary(1) |
| Property Name/Location | Year Built/Renovated | Size (SF) | Distance from Subject (Miles) | Tenant | Suite Size (SF) | Rent PSF | Lease Start Date | Lease Term (Years) |
Monroe Street Retail 5115, 5157, 5203, 5221, 5225, 5235 and 5329 Monroe Street Toledo, OH | 1970-1972, 1974, 1990-1991, 2005, 2014-2015, 2017 / 2016, 2023 | 543,378(2) | -- | Various(2) | 6,450 – 12,348(2) | $14.50 –$18.00(2) | Various(2) | Various(2) |
French Quarter Square Fremont Pike, OH | 2022/NAV | 27,068 | 10.8 | Jekyll and Hyde Gym | 12,000 | $20.00 | Nov-2023 | 5.0 |
Foundation Park Shopping Center 1515 S Byrne Rd Toledo, OH | 1988/NAV | 39,462 | 6.2 | My Achievement Center | 6,405 | $11.25 | Mar-2023 | 5.0 |
Oregon Plaza Shopping Center 3205 Navarre Ave Oregon, OH | 1983/NAV | 49,240 | 10.3 | Five Below | 9,578 | $12.50 | Oct-2023 | 10.0 |
Spring Meadows 1455 S Mccord Rd Holland, OH | 1987/NAV | 186,190 | 6.4 | Skechers | 9,519 | $15.00 | Feb-2023 | 10.0 |
| (2) | Based on the underwritten rent roll dated December 20, 2023. |
The following table presents certain information relating to the comparable small in-line retail leases for the Monroe Street Retail Property:
| Comparable Small In-Line Retail Rental Summary(1) |
| Property Name/Location | Year Built/Renovated | Size (SF) | Distance from Subject (Miles) | Tenant | Suite Size (SF) | Rent PSF | Lease Start Date | Lease Term (Years) |
Monroe Street Retail 5115, 5157, 5203, 5221, 5225, 5235 and 5329 Monroe Street Toledo, OH | 1970-1972, 1974, 1990-1991, 2005, 2014-2015, 2017 / 2016, 2023 | 543,378(2) | -- | Various(2) | 630 – 8,809(2) | $7.38 – $37.00(2) | Various(2) | Various(2) |
Saxon Square 6600 Sylvania Ave Sylvania, OH | 1973/NAV | 42,655 | 2.6 | American Cancer Society All Star Driving | 1,311 1,200 | $13.75 $12.00 | Mar-2023 Nov-2023 | 5.0 5.0 |
Talmadge Town Center North 4038 Talmadge Rd Toledo, OH | 2006/NAV | 18,780 | 0.7 | SVS Vision V/O Med Spa | 2,500 2,620 | $22.00 $19.00 | Jan-2022 Jan-2022 | 5.0 5.0 |
Promenade Shops 5577 Monroe St Sylvania, OH | 1984/NAV | 36,000 | 1.0 | Fitness Tenant | 2,250 | $14.75 | Oct-2023 | 10.0 |
| (2) | Based on the underwritten rent roll dated December 20, 2023. |
The following table presents certain information relating to the appraisal’s market rent conclusion for the Monroe Street Retail Property:
| Market Rent Summary(1) |
| | Target Ground Lease | Anchor | Jr. Anchor | Investment Grade Jr. Anchor | In-Line | Investment Grade In-Line | Large In-Line | Pad |
| Market Rent (PSF) | $2.50 | $10.00 | $14.00 | $11.00 | $22.00-$25.00 | $16.00 | $16.00-$17.00 | $35.50 |
| Lease Term (Years) | 15 | 10 | 7 | 7 | 3 | 3 | 5 | 10 |
| Lease Type (Reimbursements) | NNN | NNN | NNN | NNN | NNN | NNN | NNN | NNN |
| Tenant Improvements (New) | None | $40.00 per SF | $30.00 per SF | $30.00 per SF | $10.00 per SF | $10.00 per SF | $15.00 per SF | None |
| Tenant Improvements (Renewal) | None | $10.00 per SF | $5.00 per SF | $5.00 per SF | $2.00 per SF | $2.00 per SF | $2.00 per SF | None |
| Free Rent | 0 months | 0 months | 0 months | 0 months | 0 months | 0 months | 0 months | 0 months |
THE INFORMATION IN THIS STRUCTURAL AND COLLATERAL TERM SHEET IS NOT COMPLETE AND MAY BE AMENDED PRIOR TO THE TIME OF SALE. THIS TERM SHEET IS NOT AN OFFER TO SELL THESE SECURITIES AND IT IS NOT A SOLICITATION OF AN OFFER TO BUY THESE SECURITIES IN ANY JURISDICTION WHERE THE OFFER OR SALE IS NOT PERMITTED. |
| | 118 | |
| Structural and Collateral Term Sheet | | BMO 2024-C8 |
| No. 8 – Monroe Street Retail |
The table below presents certain information relating to comparable sales pertaining to the Monroe Street Retail Property identified by the appraiser:
| Comparable Sales(1) |
| |
| Property Name | Location | Rentable Area (SF) | Sale Date | Sale Price (PSF) |
| Pavilion Shopping Center | Beachwood, OH | 206,840 | Nov-2023 | $152 |
| Maple Hill Pavillion | Kalamazoo, MI | 276,396 | May-2023 | $121 |
| Springfield Commons | Toledo, OH | 271,690 | Mar-2023 | $83 |
| 13 & Little Mack Shopping Center | Roseville, MI | 60,430 | Jun-2022 | $66 |
| 43259 Crescent Blvd | Novi, MI | 63,504 | May-2022 | $137 |
| The Oaks – Saline | Saline, MI | 53,071 | Mar-2022 | $81 |
The Borrower. The borrower for the Monroe Street Retail Mortgage Loan is Triple Bar Toledo LLC, a Delaware limited liability company and a bankruptcy remote single purpose entity with one independent director. Legal counsel to the borrower delivered a non-consolidation opinion in connection with the origination of the Monroe Street Retail Mortgage Loan.
The Borrower Sponsors. The non-recourse carveout guarantors and borrower sponsors are Robert V. Gothier, Jr. and Mark X. DiSanto. Mr. Gothier is the founder of J.C. Bar Properties, Inc. (“J.C. Bar”), a full-service commercial real estate company which acquires, manages, and leases grocery-anchored shopping centers in the Mid-Atlantic United States. Founded in 2006, J.C. Bar has completed over $1 billion in mixed-use and retail projects and currently manages over 3 million square feet across over 40 shopping centers.
Mr. DiSanto is the Chief Executive Officer of Triple Crown Corporation, which provides real estate acquisition, construction and property management services. Since 1977, Triple Crown Corporation has constructed and developed approximately 2,675 single family homes and over 6.3 million square feet of commercial space.
Robert V. Gothier, Jr. was involved as a non-controlling partner in a prior loan foreclosure in 2020, unrelated to the Monroe Street Retail Property. See “Description of the Mortgage Pool—Default History, Bankruptcy Issues and Other Proceedings” in the Preliminary Prospectus.
Property Management. The Monroe Street Retail Property is managed by J.C. Bar Properties, Inc., an affiliate of one of the borrower sponsors, Robert V. Gothier, Jr. (see “The Borrower Sponsors” above).
Escrows and Reserves. As of the date of origination of the Monroe Street Retail Mortgage Loan, the borrower was required to deposit (i) approximately $177,479 in a real estate tax reserve account, (ii) $500,000 in a replacement reserve account, (iii) $1,000,000 in a general leasing reserve, (iv) approximately $533,333 in a rent concession reserve for tenants O’Reilly Auto Parts, Dave’s Hot Chicken and Kidstrong and (v) approximately $713,619 in an existing TI/LC reserve for tenants O’Reilly Auto Parts, Dave’s Hot Chicken, Kidstrong, Bob’s Discount Furniture and Leroy and Margaret’s. Note that certain reserves may have been drawn upon between the time of origination and the cut-off date.
Tax Escrows – The borrower is required to deposit into a real estate tax reserve, on a monthly basis in an amount equal to 1/12th of the real estate taxes that the lender estimates will be payable during the next 12 months (initially approximately $118,319).
Insurance Escrows – The Monroe Street Retail Mortgage Loan documents do not require ongoing monthly insurance reserve deposits as long as (i) no event of default is continuing; (ii) the Monroe Street Retail Property is covered under a blanket or umbrella policy acceptable to the lender; (iii) the borrower provides the lender with evidence of renewal of such policies; and (iv) the borrower provides the lender with paid receipts for payment of the insurance premiums by no later than ten business days prior to the policy expiration dates.
Replacement Reserves – The Monroe Street Retail Mortgage Loan documents require ongoing monthly replacement reserve deposits of approximately $6,792, which the lender may require the borrower to increase (not more than once per year) upon 30 days’ notice to the borrower if the lender reasonably determines such increase is necessary to maintain the proper operation of the Monroe Street Retail Property.
THE INFORMATION IN THIS STRUCTURAL AND COLLATERAL TERM SHEET IS NOT COMPLETE AND MAY BE AMENDED PRIOR TO THE TIME OF SALE. THIS TERM SHEET IS NOT AN OFFER TO SELL THESE SECURITIES AND IT IS NOT A SOLICITATION OF AN OFFER TO BUY THESE SECURITIES IN ANY JURISDICTION WHERE THE OFFER OR SALE IS NOT PERMITTED. |
| | 119 | |
| Structural and Collateral Term Sheet | | BMO 2024-C8 |
| No. 8 – Monroe Street Retail |
Leasing Reserves – The Monroe Street Retail Mortgage Loan documents require ongoing monthly general tenant improvements and leasing commissions reserves of approximately $29,433. Deposits into the leasing reserve (exclusive of any pending disbursements therefrom) will be capped at $1,000,000 as long as no Cash Trap Event Period (as defined below) is continuing.
Lockbox / Cash Management. The Monroe Street Retail Mortgage Loan is structured with a springing lockbox and springing cash management. Within 30 days from receipt of written notice from the lender that a Cash Trap Event Period has commenced, the borrower is required to (i) execute a deposit account control agreement to establish a deposit account with a clearing bank and (ii) send executed letters directing all tenants to deposit all sums due under their respective leases directly into said deposit account. During the continuance of a Cash Trap Event Period, all funds in the deposit account are required to be swept periodically to a lender-controlled cash management account. If the borrower or property manager receive any rents or income directly, each is required to deposit such amounts into the deposit account within one business day of receipt. So long as a Cash Trap Event Period is in effect, all excess funds will be swept to an excess cash flow subaccount controlled by the lender and held for so long as such Cash Trap Event Period is continuing, provided, however, that during a Cash Trap Event Period caused solely by a Major Tenant Event Period (as defined below, and provided that no other Cash Trap Event Period subsequently commences or is continuing) such sweep will be subject to a cap of $1,900,000, with all excess over $1,900,000 being disbursed back to the borrower. For the avoidance of doubt, the Major Tenant Event Period cap is independent and in addition to any cap contemplated for the leasing reserve discussed in the “Escrows and Reserves” section above.
A “Cash Trap Event Period” will commence upon the earlier of the following:
| (i) | the occurrence of an event of default; |
| (ii) | the net cash flow debt service coverage ratio, assuming an amortization period of 30 years (“Amortizing NCF DSCR”) falling below 1.15x (tested quarterly) (a “Low DSCR Event”), provided, however, if within five business days of written notice from the lender, the borrower has delivered cash and cash equivalents or a letter of credit in an amount equal to six months of excess cash flow, as determined by the lender in its reasonable discretion (with such deposit being required every subsequent six month period in which a Low DSCR Event is continuing) (the “DSCR Cash Trap Avoidance Collateral”), no Low DSCR Event will be deemed to have occurred; or |
| (iii) | a Major Tenant Event Period, provided, however, if within five business days of written notice from the lender, the borrower delivers cash and cash equivalents or a letter of credit in an amount equal to $1,900,000, no Major Tenant Event Period will be deemed to have occurred. |
A Cash Trap Event Period will end upon the occurrence of the following:
| ● | with regard to clause (i), the cure of such event of default and the lender’s acceptance of such cure; |
| ● | with regard to clause (ii), the Amortizing NCF DSCR being equal to or greater than 1.20x for two consecutive calendar quarters; or |
| ● | with regard to clause (iii), a Major Tenant Event Period Cure (as defined below). |
A “Major Tenant Event Period” will commence upon the earliest to occur of the following with respect to Target, as well as its successors and assigns, and any replacement tenant for all or a portion of such tenant’s space (individually or collectively, as applicable, “Major Tenant”):
| (i) | a Major Tenant, or its parent or guarantor filing, or otherwise becoming involved as debtor in, a bankruptcy or similar insolvency proceeding; |
| (ii) | a Major Tenant “going dark”, vacating or otherwise failing to continually occupy its space (or any material portion thereof), or giving notice of its intent to commence any of the foregoing; |
| (iii) | a Major Tenant surrendering, terminating or canceling its lease (or any material portion thereof), or otherwise failing or ceasing to be in full force and effect, or a Major Tenant giving notice of, or commencing a legal proceeding asserting any of the foregoing; |
| (iv) | a default occurring (beyond any applicable notice and cure period) under a Major Tenant lease; or |
| (v) | a Major Tenant failing to renew or extend the term of its lease on or prior to the date that is the earlier of (x) six months prior to the date of scheduled expiration, (y) the deadline to renew such lease as set forth therein, to the extent that such lease expressly provides for such deadline and (z) the date the Major Tenant provides actual notice of its intent not to renew such lease. |
THE INFORMATION IN THIS STRUCTURAL AND COLLATERAL TERM SHEET IS NOT COMPLETE AND MAY BE AMENDED PRIOR TO THE TIME OF SALE. THIS TERM SHEET IS NOT AN OFFER TO SELL THESE SECURITIES AND IT IS NOT A SOLICITATION OF AN OFFER TO BUY THESE SECURITIES IN ANY JURISDICTION WHERE THE OFFER OR SALE IS NOT PERMITTED. |
| | 120 | |
| Structural and Collateral Term Sheet | | BMO 2024-C8 |
| No. 8 – Monroe Street Retail |
A “Major Tenant Event Period Cure” will occur upon:
| | ● | solely with regards to clause (i) above, (x) a Major Tenant Re-Tenanting Event (as defined below) having occurred or (y) two consecutive calendar quarters after the bankruptcy or insolvency proceeding having terminated in a manner satisfactory to the lender, such Major Tenant’s lease having been affirmed and the terms of such lease, as affirmed, being satisfactory to the lender; |
| | ● | solely with regards to clause (ii) above, (x) a Major Tenant Re-Tenanting Event having occurred or (y) the applicable Major Tenant having resumed its normal business operations in its entire space for a period of two consecutive calendar quarters; |
| | ● | solely with regards to clause (iii) above, (x) a Major Tenant Re-Tenanting Event having occurred or (y) such Major Tenant having (A) revoked any notification of any such termination, cancellation, or surrender of such lease and (B) delivered to the lender a tenant estoppel certificate reasonably acceptable to the lender; |
| | ● | solely with regards to clause (iv) above, (x) a Major Tenant Re-Tenanting Event having occurred or (y) the subject default having been cured and no other default under the related lease having occurred (beyond any notice and cure period) for a period of two consecutive calendar quarters; or |
| | ● | solely with regards to clause (v) above, (x) a Major Tenant Re-Tenanting Event having occurred or (y) the lender having received evidence that the Major Tenant extended the term of its lease pursuant to the terms thereof (or on terms and conditions otherwise acceptable to the lender) for a period of no less than five years, such evidence to include, without limitation, a tenant estoppel certificate from the applicable Major Tenant acceptable to the lender, confirming that all obligations of the borrower to such Major Tenant with respect to tenant improvements and leasing commissions having been satisfied in full and that such Major Tenant is then paying full, unabated rent pursuant to the terms thereof. |
A “Major Tenant Re-Tenanting Event” will occur upon the lender receiving satisfactory evidence (including, without limitation, a satisfactory estoppel) that (i) all of the applicable Major Tenant space at the Monroe Street Retail Property has been leased to one or more satisfactory replacement tenants, each pursuant to a satisfactory replacement lease; (ii) each such tenant is in occupancy of its premises, is open for normal business and is paying full, unabated rent pursuant to the terms of its lease (or such abatement having been reserved); and (iii) all tenant improvement costs and leasing commissions provided in each such replacement lease having been paid (or sufficient funds having been deposited into the leasing reserve subaccount for payment of such amounts).
Subordinate and Mezzanine Debt. None.
Permitted Future Mezzanine Debt. Not permitted.
Partial Release. Not permitted.
Ground Lease. None.
THE INFORMATION IN THIS STRUCTURAL AND COLLATERAL TERM SHEET IS NOT COMPLETE AND MAY BE AMENDED PRIOR TO THE TIME OF SALE. THIS TERM SHEET IS NOT AN OFFER TO SELL THESE SECURITIES AND IT IS NOT A SOLICITATION OF AN OFFER TO BUY THESE SECURITIES IN ANY JURISDICTION WHERE THE OFFER OR SALE IS NOT PERMITTED. |
| | 121 | |
| Structural and Collateral Term Sheet | | BMO 2024-C8 |
| No. 9 – Residence Inn Del Mar |
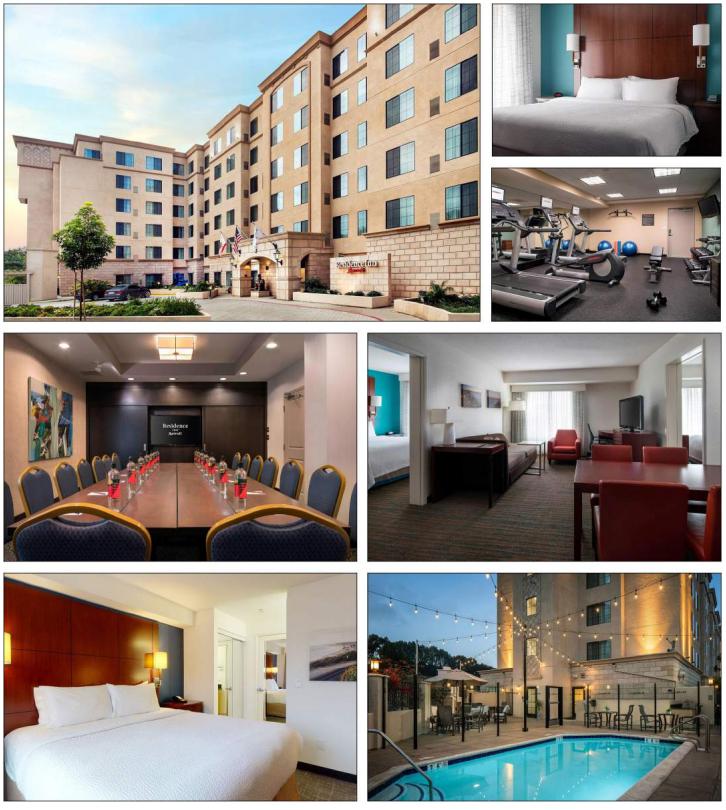
THE INFORMATION IN THIS STRUCTURAL AND COLLATERAL TERM SHEET IS NOT COMPLETE AND MAY BE AMENDED PRIOR TO THE TIME OF SALE. THIS TERM SHEET IS NOT AN OFFER TO SELL THESE SECURITIES AND IT IS NOT A SOLICITATION OF AN OFFER TO BUY THESE SECURITIES IN ANY JURISDICTION WHERE THE OFFER OR SALE IS NOT PERMITTED. |
| | 122 | |
| Structural and Collateral Term Sheet | | BMO 2024-C8 |
| No. 9 – Residence Inn Del Mar |
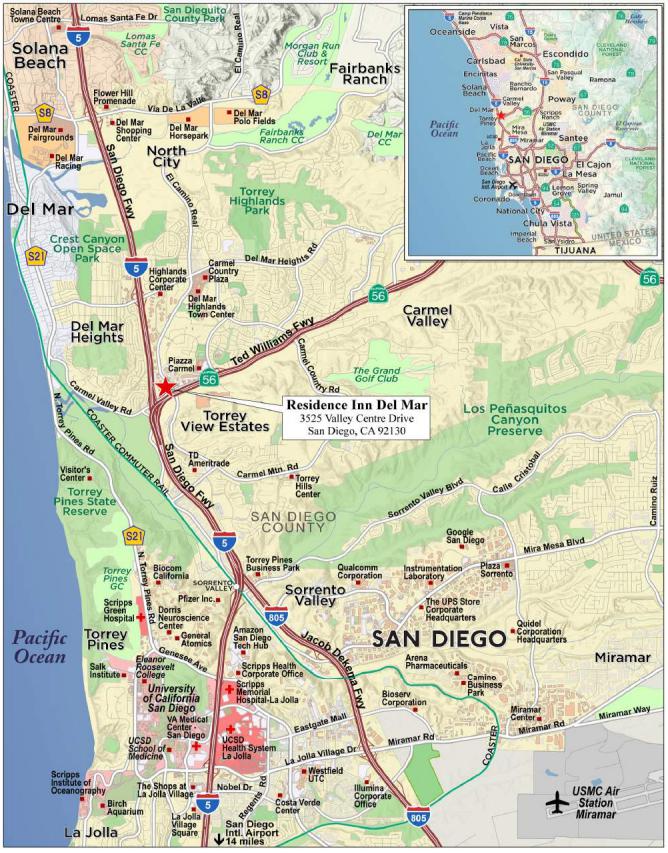
THE INFORMATION IN THIS STRUCTURAL AND COLLATERAL TERM SHEET IS NOT COMPLETE AND MAY BE AMENDED PRIOR TO THE TIME OF SALE. THIS TERM SHEET IS NOT AN OFFER TO SELL THESE SECURITIES AND IT IS NOT A SOLICITATION OF AN OFFER TO BUY THESE SECURITIES IN ANY JURISDICTION WHERE THE OFFER OR SALE IS NOT PERMITTED. |
| | 123 | |
| Structural and Collateral Term Sheet | | BMO 2024-C8 |
| No. 9 – Residence Inn Del Mar |
| Mortgage Loan Information | | Property Information |
| Mortgage Loan Seller: | GACC | | Single Asset / Portfolio: | Single Asset |
| Original Principal Balance: | $25,000,000 | | Title: | Fee |
| Cut-off Date Principal Balance: | $25,000,000 | | Property Type - Subtype: | Hospitality – Extended Stay |
| % of Pool by IPB: | 3.7% | | Net Rentable Area (Rooms): | 118 |
| Loan Purpose: | Refinance | | Location: | San Diego, CA |
| Borrower: | CV Residence Hotel, LLC | | Year Built / Renovated: | 2013 / 2020 |
| Borrower Sponsor: | Joseph F. Oliver III | | Occupancy / ADR / RevPAR: | 84.7% / $195.04 / $165.15 |
| Interest Rate: | 7.00300% | | Occupancy / ADR / RevPAR Date: | 12/31/2023 |
| Note Date: | 2/26/2024 | | 4th Most Recent NOI (As of)(3): | $737,490 (12/31/2020) |
| Maturity Date: | 3/6/2034 | | 3rd Most Recent NOI (As of)(3): | $2,264,098 (12/31/2021) |
| Interest-only Period: | 120 months | | 2nd Most Recent NOI (As of): | $3,296,589 (12/31/2022) |
| Original Term: | 120 months | | Most Recent NOI (As of): | $3,575,905 (12/31/2023) |
| Original Amortization: | None | | UW Occupancy / ADR / RevPAR: | 84.7% / $195.04 / $165.15 |
| Amortization Type: | Interest Only | | UW Revenues: | $7,785,816 |
| Call Protection: | L(24), D(89),O(7) | | UW Expenses: | $4,235,764 |
| Lockbox / Cash Management(1): | Springing | | UW NOI: | $3,550,052 |
| Additional Debt: | No | | UW NCF: | $3,160,761 |
| Additional Debt Balance: | N/A | | Appraised Value / Per Room: | $50,000,000 / $423,729 |
| Additional Debt Type: | N/A | | Appraisal Date: | 1/9/2024 |
| | | | | |
| Escrows and Reserves(2) | | Financial Information |
| | Initial | Monthly | Initial Cap | | Cut-off Date Loan / Room: | $211,864 |
| Taxes: | $0 | Springing | N/A | | Maturity Date Loan / Room: | $211,864 |
| Insurance: | $0 | Springing | N/A | | Cut-off Date LTV: | 50.0% |
| FF&E: | $0 | Springing | N/A | | Maturity Date LTV: | 50.0% |
| PIP Reserve: | $0 | Springing | N/A | | UW NCF DSCR: | 1.78x |
| Custodial Funds and Hotel Tax Reserve: | $0 | Springing | N/A | | UW NOI Debt Yield: | 14.2% |
| Refundable Advance Payment Reserve: | $0 | Springing | N/A | | | |
| | | | | | | |
| Sources and Uses |
| Sources | Proceeds | % of Total | | Uses | Proceeds | % of Total | |
| Mortgage Loan | $25,000,000 | 100.0% | | Loan Payoff | $18,573,424 | 74.3 | % |
| | | | | Principal Equity | 6,253,883 | 25.0 | |
| | | | | Closing Costs | 172,693 | 0.7 | |
| Total Sources | $25,000,000 | 100.0% | | Total Uses | $25,000,000 | 100.0 | % |
| (1) | The borrower is required to deliver a springing lockbox agreement within 45 days after the loan origination date (subject to extension for another 45 days if the borrower is diligently pursuing the same). |
| (2) | See “Escrows and Reserves” below for further discussion of reserve requirements. |
| (3) | 4th Most Recent NOI and 3rd Most Recent NOI reflect operations impacted by the COVID-19 pandemic. |
The Loan. The ninth largest mortgage loan (the “Residence Inn Del Mar Mortgage Loan”) is evidenced by a single promissory note in the original principal amount of $25,000,000 and is secured by a first lien mortgage on the borrower’s fee simple interest in a 118 room, six-story, extended stay hotel in San Diego, California (the “Residence Inn Del Mar Property”). The Residence Inn Del Mar Mortgage Loan was originated on February 26, 2024 by DBRI. The Residence Inn Del Mar Mortgage Loan has a 10-year term, is interest-only for the entire loan term and accrues interest at a fixed rate of 7.00300% per annum on an Actual/360 basis. The scheduled maturity date of the Residence Inn Del Mar Mortgage Loan is the monthly payment date that occurs in March 2034.
THE INFORMATION IN THIS STRUCTURAL AND COLLATERAL TERM SHEET IS NOT COMPLETE AND MAY BE AMENDED PRIOR TO THE TIME OF SALE. THIS TERM SHEET IS NOT AN OFFER TO SELL THESE SECURITIES AND IT IS NOT A SOLICITATION OF AN OFFER TO BUY THESE SECURITIES IN ANY JURISDICTION WHERE THE OFFER OR SALE IS NOT PERMITTED. |
| | 124 | |
| Structural and Collateral Term Sheet | | BMO 2024-C8 |
| No. 9 – Residence Inn Del Mar |
The Property. The Residence Inn Del Mar Property is a 118 room, six-story, extended stay hotel in San Diego, California. It was built in 2013 and is located 17 miles northwest of the San Diego Central Business District (CBD). The guestroom configuration consists of 94 king studio suites, 18 king 1-bedroom suites, and six 2-bedroom suites. All of the units have separate kitchens and living areas. Hotel amenities include a 24-hour fitness center, an outdoor pool, whirlpool, business center, market pantry, and guest coin laundry facility. A complimentary daily hot breakfast is served in the buffet area (located just off the lobby area). The Residence Inn Del Mar Property also has parking for 118 vehicles in the parking garage. The hotel charges $25 a day for parking on-site and a discounted rate for long term parking. There are also three event and meeting spaces, the largest being The Grand Prix, with a maximum capacity of 25 people.
The Residence Inn Del Mar Property has access to Interstate 5, allowing for access to cities such as La Jolla to the south and Encinitas to the north. The hotel is located adjacent to the intersection of the North/South 5 Freeway and the East/West 56 Hwy, enabling guests ease of access throughout the greater San Diego region.
The Residence Inn Del Mar Property was built in 2013. The borrower renovated the Residence Inn Del Mar Property in 2019-2020, including remodeling all guest rooms, at a total cost of approximately $1.4 million ($12,000 / room). An additional $187,000 has been spent on capital expenditures in the last three years.
Since opening, the Residence Inn Del Mar Property has been operating under a direct management agreement with Residence Inn by Marriott, LLC (the “Residence Inn Del Mar Hotel Management Agreement”), which commenced in December 2008, and expires on June 1, 2043, with two successive 10-year renewal periods. The hotel manager has a right of first negotiation to purchase the Residence Inn Del Mar Property. See “Description of the Mortgage Pool—Purchase Options and Rights of First Refusal” in the Preliminary Prospectus.
As of December 2023, the top ten corporate accounts by number of room nights totaled approximately $1.15 million in total revenue (16.2% of room revenues). The hotel has shown improvement in RevPAR from $62.30 in 2020 to $165.15 by 2023 year-end.
Appraisal. According to the appraisal, the Residence Inn Del Mar Property had an “as-is” appraised value of $50,000,000 as of January 9, 2024. The table below shows the appraisal’s “as-is” conclusions.
| Appraisal Valuation Summary(1) |
| Appraisal Approach | Appraised Value | Capitalization Rate(2) |
| Income Capitalization Approach | $50,000,000 | 6.20% |
| (2) | The appraisal used an income capitalization approach to arrive at the appraised value. The capitalization rates shown above represent the reversionary capitalization rate. |
Environmental. According to the Phase I environmental assessment dated January 18, 2024, there are no recognized environmental conditions at the Residence Inn Del Mar Property.
The Market. The Residence Inn Del Mar Property is located along Valley Centre Drive in Del Mar, within San Diego, California, within the Carmel Valley master-planned community located next to the Interstate 5 corridor. There are several office developments located along Valley Centre Drive within walking distance of the hotel, including the Kilroy Centre Del Mar, a collection of five class A office/life science buildings totaling over 500,000 square feet. The Residence Inn Del Mar Property is also located 5 miles from University of California, San Diego (“UCSD”) and the Scripps Research Institute. UCSD has a total enrollment of approximately 42,000 students. The Residence Inn Del Mar Property is in direct proximity to leisure demand drivers including the San Diego Fairgrounds, the San Diego Polo Fields, and the Torrey Pines Golf Course, which hosts professional golf tournaments annually.
The San Diego, California lodging market comprises approximately 66,470 hotel rooms located primarily in San Diego County. The primary municipal market is San Diego, which has a population of approximately 3.0 million with an income per capita of $72,000 as of January 2023. The San Diego/La Jolla submarket contains approximately 7,000 hotel rooms and houses 51 of the San Diego market’s 517 hotel properties. A 127 room Tempo by Hilton is being constructed adjacent to the Residence Inn Del Mar Property and is expected to open in July 2023 and to be 100% competitive with respect to the Residence Inn Del Mar Property. In addition, a Springhill Suites by Marriott has been proposed to be constructed a block from the Residence Inn Del Mar Property; however, the project was put on indefinite hold during the pandemic. Prior to this
THE INFORMATION IN THIS STRUCTURAL AND COLLATERAL TERM SHEET IS NOT COMPLETE AND MAY BE AMENDED PRIOR TO THE TIME OF SALE. THIS TERM SHEET IS NOT AN OFFER TO SELL THESE SECURITIES AND IT IS NOT A SOLICITATION OF AN OFFER TO BUY THESE SECURITIES IN ANY JURISDICTION WHERE THE OFFER OR SALE IS NOT PERMITTED. |
| | 125 | |
| Structural and Collateral Term Sheet | | BMO 2024-C8 |
| No. 9 – Residence Inn Del Mar |
development, the last hotel constructed in the submarket was in 2013. The submarket has barriers to entry due to increased building costs, environmental controls, and local opposition.
The following table presents certain information relating to the current and historical occupancy, ADR and RevPAR at the Residence Inn Del Mar and its competitors:
| Historical Occupancy, ADR, RevPAR(1)(2) |
| | Competitive Set(3) | Residence Inn Del Mar(4) | Penetration Factor |
| Year | Occupancy | ADR | RevPAR | Occupancy | ADR | RevPAR | Occupancy | ADR | RevPAR |
| 2020 | 52.8% | $118.94 | $62.80 | 47.9% | $130.10 | $62.30 | 90.7% | 109.4% | 99.2% |
| 2021 | 69.3% | $131.29 | $91.03 | 79.5% | $141.27 | $112.35 | 114.7% | 107.6% | 123.4% |
| 2022 | 80.3% | $169.88 | $136.49 | 84.8% | $190.40 | $161.53 | 105.5% | 112.1% | 118.3% |
| 2023 | 77.0% | $178.92 | $137.83 | 84.7% | $195.04 | $165.15 | 109.9% | 109% | 119.8% |
| (1) | Data provided by a third-party market research report. |
| (2) | The variances between the underwriting, appraisal and third-party market research provider data with respect to Occupancy, ADR and RevPAR at the Residence Inn Del Mar Property are attributable to differing reporting methodologies and/or timing differences. |
| (3) | The competitive set includes Holiday Inn Express & Suites San Diego Sorrento Valley, Sonesta ES Suites San Diego Sorrento Mesa, Homewood Suites by Hilton San Diego-Del Mar, and Hilton Garden Inn San Diego Del Mar. |
| (4) | Occupancy, ADR and RevPAR for the Residence Inn Del Mar Property are based on the underwritten cash flow. |
The following table presents certain information with respect to the historical and underwritten cash flows of the Residence Inn Del Mar Property:
Operating History and Underwritten Net Cash Flow |
| | 2020(1) | | 2021(1) | | 2022(1) | | 2023 | | Underwritten | Per Room(2) | %(3) | |
| Occupancy | 47.9 | % | 79.5% | 84.8% | 84.7% | 84.7% | | |
| ADR | $130.10 | | $141.27 | $190.40 | $195.04 | $195.04 | | |
| RevPAR | $62.30 | | $112.35 | $161.53 | $165.15 | $165.15 | | |
| Room Revenue | $2,690,439 | | $4,838,893 | $6,957,064 | $7,113,043 | $7,113,043 | $195.04 | 91.4 | % |
| Food & Beverage Revenue | 4,871 | | 2,152 | 2,314 | 6,500 | 6,500 | 0.18 | 0.1 | |
| Other Departmental Revenue | 221,343 | | 402,017 | 546,510 | 666,273 | 666,273 | 18.27 | 8.6 | |
| Total Revenue | $2,916,652 | | $5,243,062 | $7,505,887 | $7,785,816 | $7,785,816 | $213.49 | 100.0 | % |
| Room Expense | 733,731 | | 979,979 | 1,543,131 | 1,471,098 | 1,471,098 | 40.34 | 20.7 | |
| Food & Beverage Expenses | 4,805 | | 1,288 | 5,414 | 3,256 | 3,256 | 0.09 | 50.1 | |
| Other Departmental Expenses | 13,288 | | 23,375 | 29,840 | 28,383 | 28,383 | 0.78 | 4.3 | |
| Departmental Expenses | $751,824 | | $1,004,643 | $1,578,384 | $1,502,737 | $1,502,737 | $41.20 | 19.3 | % |
| Departmental Income | $2,164,828 | | $4,238,419 | $5,927,503 | $6,283,079 | $6,283,079 | $172.28 | 80.7 | % |
| Total Other Expenses | $1,427,338 | | $1,974,321 | $2,630,913 | $2,707,174 | $2,733,027 | $63.46 | 35.1 | % |
| Net Operating Income | $737,490 | | $2,264,098 | $3,296,589 | $3,575,905 | $3,550,052 | $82.43 | 45.6 | % |
| FF&E | 145,833 | | 262,153 | 375,294 | 389,512 | 389,291 | 9.04 | 5.0 | |
| Net Cash Flow | $591,658 | | $2,001,945 | $2,921,295 | $3,186,393 | $3,160,761 | $73.39 | 40.6 | % |
| (1) | Historical financials are impacted by COVID protocols resulting in disruptions of operations at the Residence Inn Del Mar Property. |
| (2) | Per Room values are based on 118 rooms. |
| (3) | % column represents percent of Total Revenue except for Room Expense, Food & Beverage Expenses and Other Departmental Expenses which are based on their corresponding revenue line items. |
The Borrower. The borrower is CV Residence Hotel, LLC a single purpose Delaware limited liability company with one independent director. Legal counsel to the borrower delivered a non-consolidation opinion in connection with the origination of the Residence Inn Del Mar Mortgage Loan.
The Borrower Sponsor. The borrower sponsor and non-recourse carve-out guarantor is Joseph F. Oliver III, owner, and founder of Oliver Holdings. Joseph F. Oliver III is an experienced owner and operator and has been an investor in commercial real estate for nearly 50 years. He formed Asset Property Management Inc. in 1974, where he now serves as
THE INFORMATION IN THIS STRUCTURAL AND COLLATERAL TERM SHEET IS NOT COMPLETE AND MAY BE AMENDED PRIOR TO THE TIME OF SALE. THIS TERM SHEET IS NOT AN OFFER TO SELL THESE SECURITIES AND IT IS NOT A SOLICITATION OF AN OFFER TO BUY THESE SECURITIES IN ANY JURISDICTION WHERE THE OFFER OR SALE IS NOT PERMITTED. |
| | 126 | |
| Structural and Collateral Term Sheet | | BMO 2024-C8 |
| No. 9 – Residence Inn Del Mar |
the president. Asset Property Management Inc. is involved in property management and development business primarily in San Diego County, with a current focus on hospitality and multi-family opportunities.
Property Management. The Residence Inn Del Mar Property is managed by Residence Inn by Marriott, LLC, a Delaware limited liability company, pursuant to the Residence Inn Del Mar Hotel Management Agreement.
Escrows and Reserves.
Tax Reserve – On a monthly basis, solely if the Reserve Waiver Conditions (as defined below) fail to be satisfied with respect to the tax reserve, the borrower is required to deposit into a real estate tax reserve held with the lender an amount equal to 1/12th of the real estate taxes that the lender estimates will be payable during the next 12 months.
Insurance Reserve – On a monthly basis, solely if the Reserve Waiver Conditions fail to be satisfied with respect to the insurance reserve, the borrower is required to deposit into an insurance premium reserve held by the lender an amount equal to 1/12th of the insurance premiums that the lender estimates will be payable for the renewal of the coverage afforded by the insurance policies upon the expiration thereof. However, so long as the borrower maintains a blanket policy approved by the lender and provides evidence of payment of insurance premiums for such policy, deposit into the insurance account with respect to insurance premiums related to such policy will be suspended (even if the Reserve Waiver Conditions are not satisfied).
FF&E Reserve – On a monthly basis, solely if the Reserve Waiver Conditions fail to be satisfied with respect to the FF&E reserve, the borrower is required to deposit into an FF&E reserve held by the lender an amount equal to the greater of (i) 5% of the projected gross revenue for the Residence Inn Del Mar Property for the prior month as set forth in the approved annual budget, and (ii) the then current amount required by the Franchise Agreement (as defined below).
PIP Reserve – During the continuance of a PIP Sweep Period (as defined below) , the borrower is required to pay to the lender all excess cash flow after application of revenues as described below under “Lockbox and Cash Management,” for deposit into a PIP reserve until such time as the PIP Sweep Period has ended.
A “PIP Sweep Period” means a period that will (A) commence upon the occurrence of any of the following: (i) such time as the borrower receives notice that any Franchisor (as defined below) requires a property improvement plan (“PIP”) to be implemented at the Residence Inn Del Mar Property, or (ii) the termination, surrender, cancellation or expiration of the Franchise Agreement (or management agreement that constitutes a “brand management” agreement) and (B) end upon: (a) in the case of clause (A)(i) above, such time as an amount equal to 120% of the estimated cost of the PIP has accumulated in the PIP reserve, and (b) in the case of clause (A) (ii) above, (x) a replacement Franchise Agreement has been entered into in accordance with the terms and conditions of the loan agreement and (y) the lender has confirmed that either the new Franchisor is not requiring the implementation of a PIP or 120% of the estimated amount of any PIP has accumulated in the PIP reserve.
Custodial Funds and Hotel Tax Reserve — On a monthly basis, solely if the Reserve Waiver Conditions fail to be satisfied with respect to such reserve, the borrower is required to deposit monthly, into a custodial funds and hotel tax reserve, an amount reasonably budgeted by the borrower and approved by the lender in its reasonable discretion (or determined by the lender if borrower fails to establish a budgeted amount), to provide for custodial funds (tips, gratuities or service charges paid via credit card and owed to personnel at the Residence Inn Del Mar Property), and sales and occupancy taxes that are anticipated to be payable during such month.
Refundable Advance Payment Reserve – Solely if the Reserve Waiver Conditions fail to be satisfied with respect to such reserve, the borrower must deposit into a refundable advance payment reserve as and when received an amount equal to the refundable advance payments and deposits that have been received, including for group business, banquets and other events that are in excess of $50,000. Provided that no event of default exists, the lender must disburse funds in the refundable advance payments reserve once per calendar month within ten days following the borrower’s written request accompanied by reasonable documentation, to be applied as follows: (i) to the borrower, for payment of refunds due from the advance payments and deposits or (ii) where such advance payments and deposits have been forfeited or where the applicable event has occurred and the charges have been incurred by the hotel customer, either to the borrower (if no Trigger Period (as defined below) is continuing) or (if a Trigger Period is continuing) to the cash management account to be applied on the next monthly payment date.
THE INFORMATION IN THIS STRUCTURAL AND COLLATERAL TERM SHEET IS NOT COMPLETE AND MAY BE AMENDED PRIOR TO THE TIME OF SALE. THIS TERM SHEET IS NOT AN OFFER TO SELL THESE SECURITIES AND IT IS NOT A SOLICITATION OF AN OFFER TO BUY THESE SECURITIES IN ANY JURISDICTION WHERE THE OFFER OR SALE IS NOT PERMITTED. |
| | 127 | |
| Structural and Collateral Term Sheet | | BMO 2024-C8 |
| No. 9 – Residence Inn Del Mar |
“Reserve Waiver Conditions” means that (i) no event of default has occurred and is continuing under the Residence Inn Del Mar Mortgage Loan; (ii) there is no monetary or material non-monetary default by the hotel manager (or successor manager or franchisor) (collectively, the “Franchisor”) under the Residence Inn Del Mar Hotel Management Agreement (or any replacement hotel management or franchise agreement) (collectively, the “Franchise Agreement”) which default and failure to timely cure result in either party having the right to terminate the Franchise Agreement; (iii) the Franchisor continues to collect the amounts, and to make the payments and perform the obligations required under the Franchise Agreement, in each case relating to the obligations and liabilities for which the applicable reserve account was established, (iv) with respect to the FF&E reserve account only, lender has a perfected security interest in the FF&E reserve account maintained by the Franchisor; (v) with respect to any payment of taxes, either borrower or Franchisor delivers evidence of the payment of the same by no later than 30 days prior to delinquency; (vi) with respect to any payment of insurance premiums, borrower or Franchisor delivers evidence of the payment of the same by no later than the dates required in the loan agreement, (vii) with respect to any application of funds held by the Franchisor for any purpose other than taxes and/or insurance premiums, evidence (in a form reasonably acceptable to the lender) that the applicable funds are being applied as contemplated pursuant to this clause (vii) shall be promptly provided upon the lender’s request; and (viii) the Franchisor CM Conditions (as defined below) are satisfied.
As of the origination date, the franchisor reserve account control agreement with respect to the FF&E reserve account maintained by the Franchisor had not yet been executed and delivered, and therefore the lender does not have a perfected security interest in such reserve account. The borrower is required to enter into the franchisor reserve account control agreement within 45 days of loan origination (subject to an additional 45 days so long as the borrower is diligently pursuing the same).
“Franchisor CM Conditions” means each of the following conditions: (i) the Franchisor (1) is not subject to a bankruptcy or insolvency proceeding, (2) is not in material default of the Franchise Agreement which would give rise to a termination right of the borrower, and (3) has not failed to apply revenue as provided in the Franchise Agreement, (ii) either (x) the Franchise Agreement in place as of the origination date is in full force and effect and the Franchisor continues to be owned and controlled by Marriott International, Inc., or (y) a replacement Franchise Agreement is in full force and effect in the form of a “brand management” agreement, and (iii) the Franchise Agreement or such replacement Franchise Agreement has a Franchise Cash Flow Provision reasonably acceptable to the lender and all revenue from the Residence Inn Del Mar Property is being collected by the Franchisor and applied in accordance with said Franchise Cash Flow Provision.
“Franchise Cash Flow Provision” means provision(s) providing that the Franchisor: (i) will collect all revenue from the Residence Inn Del Mar Property and hold it in eligible accounts with an eligible institution in the name of borrower which have been pledged to secure the Residence Inn Del Mar Mortgage Loan, (ii) will apply said revenue solely to the payment of property operating expenses and brand management fees, (iii) will maintain and hold reserves for furniture, fixtures and equipment (“FF&E”) in eligible accounts with an eligible institution in the name of the borrower which have been pledged to secure the Residence Inn Del Mar Mortgage Loan, and (iv) that any excess revenue after the payment of costs under clause (ii) (the “Net Remittance”) will (x) following the first occurrence of a Trigger Period, be deposited into the lockbox account or (y) to the extent no Trigger Period exists, be disbursed to the borrower.
Lockbox / Cash Management. The Residence Inn Del Mar Mortgage Loan is structured with a springing lockbox and springing cash management. The borrower is required to deliver a springing lockbox agreement within 45 days after the loan origination date (subject to extension for another 45 days if the borrower is diligently pursuing the same). Upon the first occurrence of a Trigger Period, the borrower is required to establish a lender-controlled lockbox account pursuant to the springing lockbox agreement. Upon the first occurrence of a Trigger Period and at all times thereafter, the borrower is required to cause all gross revenue (i) to be transmitted directly by non-residential tenants of the Residence Inn Del Mar Property (if any) and (ii) in the nature of sums payable by issuers of credit cards accepted at the Residence Inn Del Mar Property, to be transmitted directly by such issuer into the lockbox account; provided that for so long as the Franchisor CM Conditions remain satisfied, the Franchisor may collect the revenues from the Residence Inn Del Mar Property and apply them in accordance with the Franchise Cash Flow Provision. During any Trigger Period, funds deposited into the lockbox account are required to be swept daily into a lender controlled cash management account and applied (i) to make required deposits (if any) into the tax reserve, the insurance reserve, the custodial funds reserve, and the refundable advance payments reserve, (ii) to pay debt service on the Residence Inn Del Mar Mortgage Loan, (iii) to make the required deposit, if any, into the FF&E reserve, (iv) to the extent gross revenues (and not the Net Remittance) are deposited into the lockbox account, to pay budgeted operating expenses, (v) to pay approved extraordinary expenses and (vi) (A) during a Trigger Period, other than a PIP Sweep Period, to a cash collateral account to be held as additional collateral during the continuance
THE INFORMATION IN THIS STRUCTURAL AND COLLATERAL TERM SHEET IS NOT COMPLETE AND MAY BE AMENDED PRIOR TO THE TIME OF SALE. THIS TERM SHEET IS NOT AN OFFER TO SELL THESE SECURITIES AND IT IS NOT A SOLICITATION OF AN OFFER TO BUY THESE SECURITIES IN ANY JURISDICTION WHERE THE OFFER OR SALE IS NOT PERMITTED. |
| | 128 | |
| Structural and Collateral Term Sheet | | BMO 2024-C8 |
| No. 9 – Residence Inn Del Mar |
of such Trigger Period and (B) if the only Trigger Period is a PIP Sweep Period, to the PIP reserve. To the extent that no Trigger Period is continuing, all excess cash flow funds are required to be disbursed to the borrower.
A “Trigger Period” will commence upon the earliest of the following: (i) the occurrence of an event of default under the Residence Inn Del Mar Mortgage Loan documents; (ii) the date on which the debt service coverage ratio is less than 1.25x based on the trailing 12 months (a “Low DSCR Period”); (iii) if the hotel manager is an affiliate of the borrower or non-recourse carveout guarantor and such hotel manager becomes insolvent or a debtor in any bankruptcy or insolvency proceeding, or (iv) the commencement of a PIP Sweep Period.
A Trigger Period will end: (a) with regard to clause (i), upon the cure of such event of default and the lender’s acceptance of such cure; (b) with regard to a Low DSCR Period, upon the debt service coverage ratio being at least 1.25x for two consecutive calendar quarters, (c) with regard to clause (iii), if the hotel manager is replaced with an unaffiliated qualified manager or another non-affiliated manager approved by the lender, and (iv) with respect to a PIP Sweep Period, such PIP Sweep Period has ended as provided in the definition of such term.
In addition, in order to avoid or terminate a Low DSCR Period, the borrower may deposit with the lender cash or a letter of credit in the amount of $443,766.49, which deposit will be required to be made annually to the extent needed to avoid or terminate a Low DSCR Period until such time as the Residence Inn Del Mar Property has achieved a debt service coverage ratio of at least 1.25x, for two consecutive calendar quarters.
Subordinate and Mezzanine Debt. None.
Partial Release. Not Permitted.
Ground Lease. None.
THE INFORMATION IN THIS STRUCTURAL AND COLLATERAL TERM SHEET IS NOT COMPLETE AND MAY BE AMENDED PRIOR TO THE TIME OF SALE. THIS TERM SHEET IS NOT AN OFFER TO SELL THESE SECURITIES AND IT IS NOT A SOLICITATION OF AN OFFER TO BUY THESE SECURITIES IN ANY JURISDICTION WHERE THE OFFER OR SALE IS NOT PERMITTED. |
| | 129 | |
| Structural and Collateral Term Sheet | | BMO 2024-C8 |
| No. 10 – Lincoln City Outlet Center |
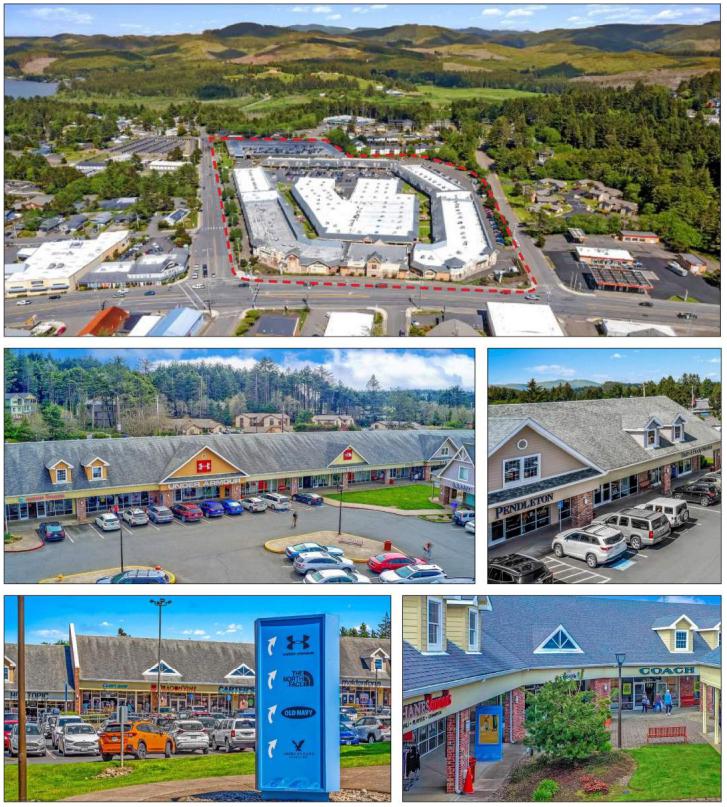
THE INFORMATION IN THIS STRUCTURAL AND COLLATERAL TERM SHEET IS NOT COMPLETE AND MAY BE AMENDED PRIOR TO THE TIME OF SALE. THIS TERM SHEET IS NOT AN OFFER TO SELL THESE SECURITIES AND IT IS NOT A SOLICITATION OF AN OFFER TO BUY THESE SECURITIES IN ANY JURISDICTION WHERE THE OFFER OR SALE IS NOT PERMITTED. |
| | 130 | |
| Structural and Collateral Term Sheet | | BMO 2024-C8 |
| No. 10 – Lincoln City Outlet Center |

THE INFORMATION IN THIS STRUCTURAL AND COLLATERAL TERM SHEET IS NOT COMPLETE AND MAY BE AMENDED PRIOR TO THE TIME OF SALE. THIS TERM SHEET IS NOT AN OFFER TO SELL THESE SECURITIES AND IT IS NOT A SOLICITATION OF AN OFFER TO BUY THESE SECURITIES IN ANY JURISDICTION WHERE THE OFFER OR SALE IS NOT PERMITTED. |
| | 131 | |
| Structural and Collateral Term Sheet | | BMO 2024-C8 |
| No. 10 – Lincoln City Outlet Center |

THE INFORMATION IN THIS STRUCTURAL AND COLLATERAL TERM SHEET IS NOT COMPLETE AND MAY BE AMENDED PRIOR TO THE TIME OF SALE. THIS TERM SHEET IS NOT AN OFFER TO SELL THESE SECURITIES AND IT IS NOT A SOLICITATION OF AN OFFER TO BUY THESE SECURITIES IN ANY JURISDICTION WHERE THE OFFER OR SALE IS NOT PERMITTED. |
| | 132 | |
| Structural and Collateral Term Sheet | | BMO 2024-C8 |
| No. 10 – Lincoln City Outlet Center |
| Mortgage Loan Information | | Property Information |
| Mortgage Loan Seller: | CREFI | | Single Asset / Portfolio: | Single Asset |
| Original Principal Balance: | $23,162,500 | | Title: | Fee |
| Cut-off Date Principal Balance: | $23,162,500 | | Property Type – Subtype: | Retail – Outlet Center |
| % of IPB: | 3.4% | | Net Rentable Area (SF): | 255,608 |
| Loan Purpose: | Acquisition | | Location: | Lincoln City, OR |
| Borrower: | LC Outlets CMBS, LLC | | Year Built / Renovated: | 1989 / 1996 |
| Borrower Sponsor: | Horizon Group Properties, Inc. | | Occupancy: | 95.1% |
| Interest Rate: | 7.15000% | | Occupancy Date: | 2/1/2024 |
| Note Date: | 2/13/2024 | | 4th Most Recent NOI (As of): | $2,937,804 (12/31/2020) |
| Maturity Date: | 3/6/2034 | | 3rd Most Recent NOI (As of): | $2,885,434 (12/31/2021) |
| Interest-only Period: | 120 months | | 2nd Most Recent NOI (As of): | $3,309,041 (12/31/2022) |
| Original Term: | 120 months | | Most Recent NOI (As of)(2): | $3,409,789 (TTM 11/30/2023) |
| Original Amortization Term: | None | | UW Economic Occupancy: | 95.2% |
| Amortization Type: | Interest Only | | UW Revenues: | $6,236,074 |
| Call Protection: | L(24),D(89),O(7) | | UW Expenses: | $2,484,097 |
| Lockbox / Cash Management: | Hard / Springing | | UW NOI(2): | $3,751,977 |
| Additional Debt: | No | | UW NCF: | $3,379,306 |
| Additional Debt Balance: | N/A | | Appraised Value / Per SF: | $36,200,000 / $142 |
| Additional Debt Type: | N/A | | Appraisal Date: | 12/31/2023 |
| | | | | |
| Escrows and Reserves(1) | | Financial Information |
| | Initial | Monthly | Initial Cap | | Cut-off Date Loan / SF: | $91 |
| Taxes: | $0 | $58,172 | N/A | | Maturity Date Loan / SF: | $91 |
| Insurance: | $24,585 | Springing | N/A | | Cut-off Date LTV: | 64.0% |
| Replacement Reserves: | $0 | $4,473 | N/A | | Maturity Date LTV: | 64.0% |
| TI / LC: | $250,000 | $42,601 | $1,500,000 | | UW NCF DSCR: | 2.01x |
| Unfunded Obligations: | $544,562 | $0 | N/A | | UW NOI Debt Yield: | 16.2% |
| | | | | | | |
| Sources and Uses |
| Sources | Proceeds | % of Total | | Uses | Proceeds | % of Total |
| Mortgage Loan | $23,162,500 | 62.5 | % | | Purchase Price | $35,250,000 | 95.1 | % |
| Sponsor Equity | 13,291,819 | 35.9 | | | Closing Costs | 1,000,529 | 2.7 | |
| Other Sources | 615,357 | 1.7 | | | Upfront Reserves | 819,147 | 2.2 | |
| Total Sources | $37,069,676 | 100.0 | % | | Total Uses | $37,069,676 | 100.0 | % |
| (1) | For a full description of Escrows and Reserves, see “Escrows and Reserves” below. |
| (2) | The increase from Most Recent NOI to UW NOI is primarily driven by recently executed leases with Adidas America, Inc. and Gilgamesh Brewing in August 2023, which collectively account for $255,440 in annual base rent. |
The Loan. The tenth largest mortgage loan (the “Lincoln City Outlet Center Mortgage Loan”) is secured by the borrower’s fee interest in a retail outlet center totaling 255,608 square feet located in Lincoln City, Oregon (the “Lincoln City Outlet Center Property”). The Lincoln City Outlet Center Mortgage Loan is evidenced by a single promissory note in the original principal amount of $23,162,500. The Lincoln City Outlet Center Mortgage Loan was originated on February 13, 2024 by CREFI and accrues interest at a fixed rate of 7.15000% per annum. The Lincoln City Outlet Center Mortgage Loan has an initial term of ten years and is interest-only for the full term. The scheduled maturity date of the Lincoln City Outlet Center Mortgage Loan is the payment date that occurs on March 6, 2034.
THE INFORMATION IN THIS STRUCTURAL AND COLLATERAL TERM SHEET IS NOT COMPLETE AND MAY BE AMENDED PRIOR TO THE TIME OF SALE. THIS TERM SHEET IS NOT AN OFFER TO SELL THESE SECURITIES AND IT IS NOT A SOLICITATION OF AN OFFER TO BUY THESE SECURITIES IN ANY JURISDICTION WHERE THE OFFER OR SALE IS NOT PERMITTED. |
| | 133 | |
| Structural and Collateral Term Sheet | | BMO 2024-C8 |
| No. 10 – Lincoln City Outlet Center |
The Property. The Lincoln City Outlet Center Property is comprised of a 255,608 square foot retail outlet center located off of Highway 101 in Lincoln City, Oregon. The Lincoln City Outlet Center Property is located on an approximately 17.5-acre site and was built in 1989 then subsequently renovated in 1996. The Lincoln City Outlet Center Property features a two-story parking garage and surface parking that provides a total of 1,332 parking spaces resulting in a total parking ratio of 5.21 spaces per 1,000 square feet. As of February 1, 2024, the Lincoln City Outlet Center Property was 95.1% occupied by 52 unique tenants at an average rate of $18.34 per square foot.
Major Tenants. The three largest tenants based on underwritten base rent are Columbia Sportswear, Eddie Bauer and North Face.
Columbia Sportswear (13,806 square feet; 5.4% of NRA; 7.9% of underwritten base rent): Founded in 1938, Columbia Sportswear is an outdoor apparel and footwear retailer with outdoor gear suited for all seasons, activities and locations. Columbia Sportswear has been a tenant at the Lincoln City Outlet Center Property since July 2007 and leases two spaces at the Lincoln City Outlet Center Property totaling 13,806 square feet. Columbia Sportswear leases 8,694 square feet of space, accounting for 7.0% of underwritten base rent pursuant to a lease expiring in September 2027. Columbia Sportswear may terminate its lease for 8,694 square feet upon 60 days’ written notice to the landlord if gross sales during any lease year are less than $100 per square foot, equal to $869,400; provided the termination notice is given to the landlord within 120 days of the borrower’s receipt of Columbia Sportswear’s annual statement of gross sales. Columbia Sportswear also leases 5,112 square feet of space, accounting for 0.9% of underwritten base rent pursuant to a lease expiring December 31, 2024 via Columbia Brands USA, LLC, which is an affiliate entity of Columbia Sportswear.
Eddie Bauer (10,785 square feet; 4.2% of NRA; 6.4% of underwritten base rent): Founded in 1920, Eddie Bauer is an outdoor brand offering performance outerwear, apparel, footwear, accessories, and gear to consumers. Eddie Bauer has been a tenant at the Lincoln City Outlet Center Property since February 2002 and is currently on a month-to-month lease.
North Face (7,360 square feet; 2.9% of NRA; 4.9% of underwritten base rent): Founded in 1966, North Face is a subsidiary of VF Corporation that specializes in high-performance outdoor apparel, footwear, equipment and accessories company. North Face has been a tenant at the Lincoln City Outlet Center Property since September 2013 and has a current lease term through January 2029 with no renewal or termination options.
Appraisal. According to the appraisal, the Lincoln City Outlet Center Mortgage Loan had an “as-is” appraised value of $36,200,000 as of December 31, 2023. The table below shows the appraiser’s “as-is” conclusions.
| Lincoln City Outlet Center(1) |
| Property | Value | Capitalization Rate |
| Lincoln City Outlet Center | $36,200,000 | 10.05% |
Environmental. The Phase I environmental assessment dated January 10, 2024 identified one controlled recognized environmental condition at the Lincoln City Outlet Center Property stemming from impacts to site soils and groundwater caused by historic releases from diesel and gasoline underground storage tanks (each individually a “UST”) at the Oregon Department of Transportation (“ODOT”) facility formerly located on the northeastern portion of the Lincoln City Outlet Center Property. These impacts were identified during UST decommissioning activities in 1991 and 1992. Soil remediation activities and groundwater monitoring, which also identified groundwater impacts to the northern adjacent site, were conducted and on March 22, 2007, the Oregon Department of Environmental Quality issued a letter stating that No Further Action (“NFA”) in relation to the identified impacts at the Lincoln City Outlet Center Property was required. The NFA letter allowed certain residual soil and groundwater impacts to remain in place; however, in relation to these residual impacts, the NFA prohibits groundwater use at the Lincoln City Outlet Center Property and at the northern adjacent site, and requires that engineering controls, such as a vapor barrier or adequate ventilation, be instituted in the event of construction along Southeast East Devils Lake Road in the vicinity of where the UST soils excavation took place. Additionally, the NFA letter requires a health and safety plan protective of workers in the event of excavation in the roadway between the Lincoln City Outlet Center Property and the northern adjacent site. Given the documented regulatory closure of this matter, the Phase I ESA consultant did not recommend any additional investigation, but did recommend continued compliance with the groundwater use prohibition and engineering control requirements outlined in the NFA letter.
THE INFORMATION IN THIS STRUCTURAL AND COLLATERAL TERM SHEET IS NOT COMPLETE AND MAY BE AMENDED PRIOR TO THE TIME OF SALE. THIS TERM SHEET IS NOT AN OFFER TO SELL THESE SECURITIES AND IT IS NOT A SOLICITATION OF AN OFFER TO BUY THESE SECURITIES IN ANY JURISDICTION WHERE THE OFFER OR SALE IS NOT PERMITTED. |
| | 134 | |
| Structural and Collateral Term Sheet | | BMO 2024-C8 |
| No. 10 – Lincoln City Outlet Center |
The following table presents certain information relating to the historical and current occupancy of the Lincoln City Outlet Center Property:
| Historical and Current Occupancy(1) |
| 2020 | 2021 | 2022 | Current(2) |
| 85.4% | 86.4% | 93.5% | 95.1% |
| (1) | Historical Occupancies are the annual average physical occupancy of each respective year. |
| (2) | Based on the underwritten rent roll dated February 1, 2024. |
The following table presents certain information relating to the largest tenants based on underwritten base rent at the Lincoln City Outlet Center Property:
| Top Tenant Summary(1) |
| Tenant | Ratings Moody’s/S&P/Fitch(2) | Net Rentable Area (SF) | % of Total NRA | UW Base Rent PSF(3) | UW Base Rent(3) | % of Total UW Base Rent(3) | Lease Expiration Date | Tenant Sales per SF(4) | Occupancy Cost |
| Columbia Sportswear(5)(6) | NR/NR/NR | 8,694 | 3.4% | $35.67 | $310,083 | 7.0 | % | 9/30/2027 | $621.74 | 8.9% |
| Eddie Bauer | NR/NR/NR | 10,785 | 4.2 | $26.43 | 285,000 | 6.4 | | MTM | $211.59 | 15.3% |
| North Face | Baa3/BBB-/NR | 7,360 | 2.9 | $29.40 | 216,357 | 4.9 | | 1/31/2029 | $623.24 | 7.2% |
| Nike Factory Store | NR/NR/NR | 13,462 | 5.3 | $15.00 | 201,930 | 4.5 | | 3/31/2028 | $658.50 | 3.5% |
| Coach | Baa2/BBB/NR | 3,510 | 1.4 | $51.06 | 179,221 | 4.0 | | 1/31/2028 | $1,021.20 | 5.1% |
| Rack Room | NR/NR/NR | 7,560 | 3.0 | $22.00 | 166,320 | 3.7 | | 3/31/2029 | $312.91 | 14.3% |
| Old Navy Outlet | B1/BB/NR | 16,464 | 6.4 | $9.03 | 148,726 | 3.3 | | 12/31/2024 | $225.84 | 4.3% |
| Gilgamesh Brewing(7) | NR/NR/NR | 6,543 | 2.6 | $20.70 | 135,440 | 3.0 | | 8/31/2030 | NAV | NAV |
| Under Armour | Ba3/BB/NR | 6,030 | 2.4 | $21.29 | 128,387 | 2.9 | | 3/31/2024 | $532.28 | 4.2% |
| Levi's Only | Ba2/BB+/BB+ | 3,908 | 1.5 | $32.15 | 125,651 | 2.8 | | 1/31/2026 | $492.76 | 9.4% |
| Largest Tenants | | 84,316 | 33.0% | $22.50 | $1,897,116 | 42.6 | % | | | |
| Remaining Tenants | 158,742 | 62.1 | $16.14 | 2,561,309 | 57.4 | | | | |
| Total Occupied | 243,058 | 95.1% | $18.34 | $4,458,424 | 100.0 | % | | | |
| Vacant Space | | 12,550 | 4.9 | | | | | | |
| Total / Wtd. Avg. | 255,608 | 100.0% | | | | | | |
| (1) | Based on the underwritten rent roll dated February 1, 2024. |
| (2) | In certain instances, ratings provided are those of the parent company of the entity shown, whether or not the parent company guarantees the lease. |
| (3) | UW Base Rent PSF, UW Base Rent and % of Total UW Base Rent include average rent steps of $18,533 for North Face and contractual rent steps of $53,956 through February 1, 2025. |
| (4) | Tenant Sales per SF are based on the TTM period ending November 2023 provided by the borrower. |
| (5) | Columbia Sportswear has the option to terminate its lease upon 60 days’ notice, if total gross sales during any lease year are less than $100 per square foot, equal to $869,400. |
| (6) | Columbia Sportswear also leases 5,112 square feet of space at the Lincoln City Outlet Center Property with UW Base Rent of $42,000 expiring December 31, 2024 via Columbia Brands USA, LLC which is an affiliate entity of Columbia Sportswear. |
| (7) | Gilgamesh Brewing has the option to terminate its lease upon 90 days’ notice, during the fifth full lease year (9/1/2027 to 8/31/2028), if total gross sales are less than $1,200,000 ($183 per square foot). |
THE INFORMATION IN THIS STRUCTURAL AND COLLATERAL TERM SHEET IS NOT COMPLETE AND MAY BE AMENDED PRIOR TO THE TIME OF SALE. THIS TERM SHEET IS NOT AN OFFER TO SELL THESE SECURITIES AND IT IS NOT A SOLICITATION OF AN OFFER TO BUY THESE SECURITIES IN ANY JURISDICTION WHERE THE OFFER OR SALE IS NOT PERMITTED. |
| | 135 | |
| Structural and Collateral Term Sheet | | BMO 2024-C8 |
| No. 10 – Lincoln City Outlet Center |
The following table presents certain information relating to tenant lease expirations at the Lincoln City Outlet Center Property:
| Lease Rollover Schedule(1)(2) |
| Year | Number of Leases Expiring | Net Rentable Area Expiring | % of NRA Expiring | UW Base Rent Expiring(3) | % of UW Base Rent Expiring(3) | Cumulative Net Rentable Area Expiring | Cumulative % of NRA Expiring | Cumulative UW Base Rent Expiring(3) | Cumulative % of UW Base Rent Expiring(3) |
| Vacant | NAP | 12,550 | 4.9% | NAP | NAP | 12,550 | 4.9% | NAP | NAP |
| 2024 | 15 | 77,484 | 30.3 | 1,172,654 | 26.3% | 90,034 | 35.2% | $1,172,654 | 26.3% |
| 2025 | 11 | 40,490 | 15.8 | 623,677 | 14.0 | 130,524 | 51.1% | $1,796,331 | 40.3% |
| 2026(4) | 7 | 29,941 | 11.7 | 388,659 | 8.7 | 160,465 | 62.8% | $2,184,991 | 49.0% |
| 2027 | 5 | 22,726 | 8.9 | 651,389 | 14.6 | 183,191 | 71.7% | $2,836,379 | 63.6% |
| 2028 | 8 | 35,281 | 13.8 | 752,103 | 16.9 | 218,472 | 85.5% | $3,588,482 | 80.5% |
| 2029 | 4 | 23,075 | 9.0 | 567,799 | 12.7 | 241,547 | 94.5% | $4,156,281 | 93.2% |
| 2030 | 1 | 6,543 | 2.6 | 135,440 | 3.0 | 248,090 | 97.1% | $4,291,721 | 96.3% |
| 2031 | 1 | 1,980 | 0.8 | 44,867 | 1.0 | 250,070 | 97.8% | $4,336,588 | 97.3% |
| 2032 | 0 | 0 | 0.0 | 0 | 0.0 | 250,070 | 97.8% | $4,336,588 | 97.3% |
| 2033 | 1 | 5,538 | 2.2 | 121,836 | 2.7 | 255,608 | 100.0% | $4,458,424 | 100.0% |
| 2034 | 0 | 0 | 0.0 | 0 | 0.0 | 255,608 | 100.0% | $4,458,424 | 100.0% |
| 2035 & Beyond | 0 | 0 | 0.0 | 0 | 0.0 | 255,608 | 100.0% | $4,458,424 | 100.0% |
| Total | 53 | 255,608 | 100.0% | $4,458,424 | 100.0% | | | | |
| (1) | Based on the underwritten rent roll dated February 1, 2024. |
| (2) | Certain tenants have more than one lease. Certain tenants may have lease termination or contraction options that are exercisable prior to the originally stated expiration date of the subject lease and that are not considered in the lease rollover schedule. |
| (3) | UW Base Rent Expiring, % of UW Base Rent Expiring, Cumulative UW Base Rent Expiring and Cumulative % of UW Base Rent Expiring include average rent steps of $18,533 for North Face and contractual rent steps of $53,956 through February 1, 2025. |
| (4) | 2026 includes a lease to Rivian Adventure Network Charging for six parking spaces at the Lincoln City Outlet Center Property to which no NRA is attributable. The Rivian Adventure Network Charging lease accounts for $18,000 of UW Base Rent and expires November 30, 2026. |
THE INFORMATION IN THIS STRUCTURAL AND COLLATERAL TERM SHEET IS NOT COMPLETE AND MAY BE AMENDED PRIOR TO THE TIME OF SALE. THIS TERM SHEET IS NOT AN OFFER TO SELL THESE SECURITIES AND IT IS NOT A SOLICITATION OF AN OFFER TO BUY THESE SECURITIES IN ANY JURISDICTION WHERE THE OFFER OR SALE IS NOT PERMITTED. |
| | 136 | |
| Structural and Collateral Term Sheet | | BMO 2024-C8 |
| No. 10 – Lincoln City Outlet Center |
The following table presents certain information relating to operating history and underwritten cash flows at the Lincoln City Outlet Center Property:
| Operating History and Underwriting Net Cash Flow |
| | 2020 | 2021 | 2022 | TTM November 2023(1) | Underwritten(1) | Per Square Foot | %(2) |
| In Place Rent | $3,786,766 | $3,506,779 | $3,825,509 | $4,097,137 | $4,385,936 | $17.16 | 70.2% |
| Contractual Rent Steps(3) | 0 | 0 | 0 | 0 | 72,488 | $0.28 | 1.2 |
| Potential Income from Vacant Space | 0 | 0 | 0 | 0 | 269,558 | $1.05 | 4.3 |
| Gross Potential Rent | $3,786,766 | $3,506,779 | $3,825,509 | $4,097,137 | $4,727,982 | $18.50 | 75.6% |
| Total Reimbursements | 1,635,731 | 1,489,717 | 1,554,247 | 1,510,471 | 1,523,344 | $5.96 | 24.4 |
| Total Gross Income | $5,422,497 | $4,996,496 | $5,379,756 | $5,607,608 | $6,251,326 | $24.46 | 100.0% |
| Other Income(4) | 68,901 | 315,201 | 409,657 | 410,378 | 287,199 | $1.12 | 4.6 |
| (Vacancy/Credit Loss) | (258,390) | (74,969) | (33,231) | (95,163) | (302,451) | ($1.18) | (4.8) |
| Effective Gross Income | $5,233,008 | $5,236,728 | $5,756,182 | $5,922,823 | $6,236,074 | $24.40 | 99.8% |
| Management Fee | 209,320 | 209,469 | 230,247 | 236,913 | 249,443 | $0.98 | 4.0 |
| Real Estate Taxes | 619,281 | 635,345 | 673,589 | 697,130 | 698,069 | $2.73 | 11.2 |
| Insurance | 138,982 | 91,320 | 102,171 | 118,027 | 93,656 | $0.37 | 1.5 |
| Other Expenses(5) | 1,327,621 | 1,415,160 | 1,441,134 | 1,460,964 | 1,442,929 | $5.65 | 23.1 |
| Total Expenses | $2,295,204 | $2,351,294 | $2,447,141 | $2,513,034 | $2,484,097 | $9.72 | 39.8% |
| Net Operating Income | $2,937,804 | $2,885,434 | $3,309,041 | $3,409,789 | $3,751,977 | $14.68 | 60.2% |
| Capital Expenditures | 0 | 0 | 0 | 0 | 53,678 | 0.21 | 0.9 |
| TI/LC | 0 | 0 | 0 | 0 | 318,993 | 1.25 | 5.1 |
| Net Cash Flow | $2,937,804 | $2,885,434 | $3,309,041 | $3,409,789 | $3,379,306 | $13.22 | 54.2% |
| (1) | The increase from TTM November 2023 Net Operating Income to Underwritten Net Operating Income is primarily driven by recently executed leases with Adidas America, Inc. and Gilgamesh Brewing in August 2023 for $255,440 in annual base rent. |
| (2) | % column represents percent of Total Gross Income for all revenue lines and represents percent of Effective Gross Income for the remainder of fields. |
| (3) | Underwritten Contractual Rent Steps include average rent steps of $18,533 for North Face and contractual rent steps of $53,956 through February 1, 2025. |
| (4) | Other Income includes percentage rent, revenue generated from a variety of tenant-related services, as well as vending income. |
| (5) | Other Expenses consist of general operating, CAM, repairs and maintenance, utilities, general and administrative and water/sewer/septic expenses. |
The Market. The Lincoln City Outlet Center Property is located at 1500 and 1710 Southeast East Devils Lake Road, and 1041 and 1121 East Oar Avenue in Lincoln City, Oregon. The Lincoln City Outlet Center Property is located off the east side of Highway 101 which is the primary north-south highway along the Oregon Coast and crosses three states with an over 1,500-mile route that connects Olympia, Washington to Los Angeles, California. The Lincoln City Outlet Center Property benefits from limited competition from other outlet centers in its primary trade area. The nearest outlet centers to the Lincoln City Outlet Center Property are the Woodburn Premium Outlets, 75 miles to the east, and the Seaside Outlets, 92 miles to the north on Highway 101 in Seaside, Oregon.
According to a third-party market research report, the Lincoln City Outlet Center Property is located in the Newport retail submarket. As of December 31, 2023, the Newport retail submarket had a total inventory of 2,743,730 square feet, a vacancy rate of 2.9% and an average asking rent of $20.18 per square foot.
According to the appraisal, the 2022 total population within a 0.5-, 1.0- and 1.5-mile radius is 2,017, 2,696 and 4,545, respectively. Furthermore, the 2022 average household income within the same radius is $60,146, $61,539 and $64,159, respectively.
The Borrower. The borrower is LC Outlets CMBS, LLC, a Delaware limited liability company and single purpose entity having at least one independent director in its organizational structure. Legal counsel to the borrower delivered a non-consolidation opinion in connection with the origination of the Lincoln City Outlet Center Mortgage Loan.
THE INFORMATION IN THIS STRUCTURAL AND COLLATERAL TERM SHEET IS NOT COMPLETE AND MAY BE AMENDED PRIOR TO THE TIME OF SALE. THIS TERM SHEET IS NOT AN OFFER TO SELL THESE SECURITIES AND IT IS NOT A SOLICITATION OF AN OFFER TO BUY THESE SECURITIES IN ANY JURISDICTION WHERE THE OFFER OR SALE IS NOT PERMITTED. |
| | 137 | |
| Structural and Collateral Term Sheet | | BMO 2024-C8 |
| No. 10 – Lincoln City Outlet Center |
The Borrower Sponsor. The borrower sponsor and non-recourse carveout guarantor is Horizon Group Properties, Inc. Horizon Group Properties, Inc. is an owner and developer of outlet shopping centers in seven states and is a developer of a master planned community in suburban Chicago.
Property Management. The Lincoln City Outlet Center Property is managed by Horizon Group Properties, L.P., a borrower affiliated management company.
Escrows and Reserves. At origination of the Lincoln City Outlet Center Mortgage Loan, the borrower deposited approximately (i) $250,000 into a leasing reserve account, (ii) $24,584.82 into an insurance account and (iii) $544,561.90 into an unfunded obligations reserve.
Tax Escrows – On a monthly basis, the borrower is required to deposit into a real estate tax reserve, 1/12th of the property taxes that the lender estimates will be payable over the next-ensuing 12-month period (initially estimated to be approximately $58,172).
Insurance Escrows – On a monthly basis, the borrower is required to deposit into an insurance reserve, 1/12th of the amount which will be sufficient to pay the insurance premiums due for the renewal of coverage afforded by such policies (initially estimated to be approximately $8,195). Additionally, for so long as the borrower pays insurance premiums on a monthly basis, the borrower is required to make monthly payments in an amount such that the balance of the insurance reserve is equal to or exceeds the aggregate amount of the estimated cost of the next three months’ worth of insurance premiums as determined by the lender. However, deposits into the insurance reserve will be conditionally waived so long as the balance of the insurance reserve is equal to or exceeds the aggregate amount of the estimated cost of the next three months’ worth of insurance premiums as determined by the lender.
Replacement Reserves – On a monthly basis, the borrower is required to deposit approximately $4,473 for replacement reserves; provided, however, that the lender may increase the amount of future monthly deposits (subject to a cap of one increase per year) if the lender determines in its reasonable discretion, based upon an updated property condition report or annual site inspection, that such increase is necessary to maintain the proper operation of the Lincoln City Outlet Center Property.
Leasing Reserve – On a monthly basis, the borrower is required to deposit the Leasing Reserve Monthly Deposit (as defined below) for landlord construction obligations under any lease, tenant improvements and leasing commissions; provided, however, that the borrower is not required to make such monthly deposit if the leasing reserve funds are equal to or exceed $1,500,000 (the “Leasing Reserve Cap”).
“Leasing Reserve Monthly Deposit” means (a) on each monthly payment date from and after February 13, 2024 through the monthly payment date occurring in March 2025, $42,601.33, (b) beginning on the monthly payment date occurring in April 2025 and on each subsequent monthly payment date through the monthly payment date occurring in March 2026, $31,951.00 and (c) beginning on the monthly payment date occurring in April 2026 and on each subsequent monthly payment date through March 6, 2034, $25,560.83; provided, however, that after the leasing reserve fund equals or exceeds the Leasing Reserve Cap and then falls below the Leasing Reserve Cap, the required monthly deposit thereafter will be $26,625.83.
Lockbox / Cash Management. The Lincoln City Outlet Center Mortgage Loan is structured with a hard lockbox and springing cash management. The Lincoln City Outlet Center Mortgage Loan documents required the borrower to send or cause the property manager to send a notice to all tenants at the Lincoln City Outlet Center Property directing them to remit all payments under their respective leases directly to the lender-controlled lockbox. The borrower is required to cause all revenue received by the borrower or the property manager from the Lincoln City Outlet Center Property to be deposited into such lockbox no later than two business days after receipt. All funds deposited into the lockbox are required to be transferred on each business day to or at the direction of the borrower unless a Trigger Period (as defined below) exists. Upon the occurrence and during the continuance of a Trigger Period, all funds in the lockbox account are required to be swept on each business day to a cash management account under the control of the lender to be applied and disbursed in accordance with the Lincoln City Outlet Center Mortgage Loan documents. All excess cash flow funds remaining in the cash management account after the application of such funds in accordance with the Lincoln City Outlet Center Mortgage Loan documents are required to be held by the lender in an excess cash flow reserve account as additional collateral for the Lincoln City Outlet Center Mortgage Loan. Upon the cure of the applicable Trigger Period, so long as no other Trigger
THE INFORMATION IN THIS STRUCTURAL AND COLLATERAL TERM SHEET IS NOT COMPLETE AND MAY BE AMENDED PRIOR TO THE TIME OF SALE. THIS TERM SHEET IS NOT AN OFFER TO SELL THESE SECURITIES AND IT IS NOT A SOLICITATION OF AN OFFER TO BUY THESE SECURITIES IN ANY JURISDICTION WHERE THE OFFER OR SALE IS NOT PERMITTED. |
| | 138 | |
| Structural and Collateral Term Sheet | | BMO 2024-C8 |
| No. 10 – Lincoln City Outlet Center |
Period exists, the lender is required to return any amounts remaining on deposit in the excess cash flow reserve account to the borrower. Upon an event of default under the Lincoln City Outlet Center Mortgage Loan documents, any amounts recovered from the Lincoln City Outlet Center Property or any other collateral for the Lincoln City Outlet Center Mortgage Loan and/or paid to or received by the lender may be applied by the lender in its sole discretion in such order of priority as the lender may determine.
“Trigger Period” means a period (A) commencing upon the earliest of (i) the occurrence and continuance of an event of default under the Lincoln City Outlet Center Mortgage Loan documents and (ii) the debt service coverage ratio being less than 1.35x, and (B) expiring upon (y) with regard to clause (i) above, the cure (if applicable) of such event of default under the Lincoln City Outlet Center Mortgage Loan documents and (z) with regard to clause (ii) above, the date that the debt service coverage ratio is equal to or greater than 1.40x for two consecutive calendar quarters.
Subordinate and Mezzanine Debt. None.
Permitted Future Mezzanine Debt. Not permitted.
Partial Release. Not permitted.
Ground Lease. None.
THE INFORMATION IN THIS STRUCTURAL AND COLLATERAL TERM SHEET IS NOT COMPLETE AND MAY BE AMENDED PRIOR TO THE TIME OF SALE. THIS TERM SHEET IS NOT AN OFFER TO SELL THESE SECURITIES AND IT IS NOT A SOLICITATION OF AN OFFER TO BUY THESE SECURITIES IN ANY JURISDICTION WHERE THE OFFER OR SALE IS NOT PERMITTED. |
| | 139 | |
| Structural and Collateral Term Sheet | | BMO 2024-C8 |
| No. 11 – Woodfield Mall |
| Mortgage Loan Information | | Property Information |
| Mortgage Loan Seller: | BMO | | Single Asset / Portfolio: | Single Asset |
| Original Principal Balance(1): | $20,000,000 | | Title: | Fee |
| Cut-off Date Principal Balance(1): | $20,000,000 | | Property Type – Subtype: | Retail – Super Regional Mall |
| % of IPB: | 2.9% | | Net Rentable Area (SF): | 1,064,590 |
| Loan Purpose: | Refinance | | Location: | Schaumburg, IL |
| Borrower: | Woodfield Mall LLC | | Year Built / Renovated: | 1971, 1995 / 2015, 2016, 2018 |
| Borrower Sponsors(2): | Simon Property Group, L.P. and Institutional Mall Investors LLC | | Occupancy(6): | 96.1% |
| Interest Rate: | 6.335403409% | | Occupancy Date: | 11/14/2023 |
| Note Date: | 11/22/2023 | | 4th Most Recent NOI (As of): | $27,546,528 (12/31/2020) |
| Maturity Date: | 12/1/2033 | | 3rd Most Recent NOI (As of): | $37,229,630 (12/31/2021) |
| Interest-only Period: | 120 months | | 2nd Most Recent NOI (As of): | $36,506,153 (12/31/2022) |
| Original Term: | 120 months | | Most Recent NOI (As of): | $36,477,631 (TTM 10/31/2023) |
| Original Amortization Term: | None | | UW Economic Occupancy: | 95.5% |
| Amortization Type: | Interest Only | | UW Revenues: | $74,931,706 |
| Call Protection(3): | L(27),D(87),O(6) | | UW Expenses: | $32,816,238 |
| Lockbox / Cash Management(4): | Hard / Springing | | UW NOI: | $42,115,468 |
| Additional Debt(1): | Yes | | UW NCF: | $41,055,801 |
| Additional Debt Balance(1): | $244,000,000 / $30,000,000 | | Appraised Value / Per SF: | $694,000,000 / $652 |
| Additional Debt Type(1): | Pari Passu / Subordinate Debt | | Appraisal Date: | 10/27/2023 |
| | | | | |
| Escrows and Reserves | | Financial Information(1) |
| | Initial | Monthly | Initial Cap | | | Senior Loan | Whole Loan |
| Taxes: | $0 | Springing | N/A | | Cut-off Date Loan / SF: | $248 | $276 |
| Insurance: | $0 | Springing | N/A | | Maturity Date Loan / SF: | $248 | $276 |
| Replacement Reserves: | $0 | Springing | N/A | | Cut-off Date LTV: | 38.0% | 42.4% |
| TI/LC: | $0 | Springing | N/A | | Maturity Date LTV: | 38.0% | 42.4% |
| Other(5): | $7,299,496 | $0 | N/A | | UW NCF DSCR: | 2.42x | 2.05x |
| | | | | | UW NOI Debt Yield: | 16.0% | 14.3% |
| | | | | | | | |
| Sources and Uses |
| Sources | Proceeds | % of Total | | | Uses | Proceeds | % of Total | |
| Senior Loan | $264,000,000 | 68.9 | % | | Loan Payoff | $373,692,064 | 97.6 | % | |
| Subordinate Companion Loan | 30,000,000 | 7.8 | | | Upfront Reserves | 7,299,496 | 1.9 | | |
| Sponsor Equity | 88,955,402 | 23.2 | | | Closing Costs | 1,963,843 | 0.5 | | |
| Total Sources | $382,955,402 | 100.0 | % | | Total Uses | $382,955,402 | 100.0 | % | |
| (1) | The Woodfield Mall Mortgage Loan (as defined below), with an original aggregate principal balance of $20,000,000, is part of a whole evidenced by 15 senior pari passu promissory notes, with an aggregate original balance of $264,000,000 and three junior pari passu promissory notes, with an aggregate original balance of $30,000,000 (collectively, the “Woodfield Mall Whole Loan”). The UW NCF DSCR for the Woodfield Mall Whole Loan is calculated using the blended rate of approximately 6.71100% per annum. The information under “Financial Information” in the chart above reflects the Woodfield Mall Senior Loan (as defined below) and the Woodfield Mall Whole Loan. For additional information, see “The Loan” below. |
| (2) | Simon Property Group, L.P. (“Simon”) is also the borrower sponsor for the Arundel Mills and Marketplace mortgage loan. |
| (3) | Defeasance of the Woodfield Mall Whole Loan is permitted at any time after the earlier to occur of (a) the end of the two-year period commencing on the closing date of the securitization of the last promissory note representing a portion of the Woodfield Mall Whole Loan to be securitized and (b) June 1, 2027. The assumed defeasance lockout period of 27 payments is based on the closing date of the BMO 2024-C8 transaction in March 2024. The actual defeasance lockout period may be longer. If any pari passu note has not been securitized for two years by June 1, 2027, the borrowers may prepay any such note that has not been securitized for two years upon payment of a prepayment fee equal to the greater of (i) 1% of the prepaid amount and (ii) a yield maintenance charge in conjunction with the defeasance of any securitized pari passu notes that have been securitized for greater than two years by the projected repayment date. |
| (4) | The borrower is required to cause rents to be deposited into a lockbox account established at origination under the Woodfield Mall Whole Loan documents, and the borrower will have access to the funds in the lockbox account and use the lockbox account as an operating account so long as no lockbox event continues. During the continuance of a lockbox event, the borrower will not have any further access to the funds in the lockbox account except as otherwise expressly provided in the Woodfield Mall Whole Loan documents. |
| (5) | Other initial escrows and reserves consist of $6,460,707 for an upfront outstanding TI/LC reserve and approximately $838,789 for an upfront gap rent reserve. |
| (6) | Occupancy for the Woodfield Mall Property (as defined below) includes temporary tenants. As of November 14, 2023, the Woodfield Mall Property was 87.5% occupied excluding temporary tenants. As of November 14, 2023, occupancy for the Woodfield Mall (as defined below) including temporary tenants was 98.1% and excluding temporary tenants was 93.8%. |
THE INFORMATION IN THIS STRUCTURAL AND COLLATERAL TERM SHEET IS NOT COMPLETE AND MAY BE AMENDED PRIOR TO THE TIME OF SALE. THIS TERM SHEET IS NOT AN OFFER TO SELL THESE SECURITIES AND IT IS NOT A SOLICITATION OF AN OFFER TO BUY THESE SECURITIES IN ANY JURISDICTION WHERE THE OFFER OR SALE IS NOT PERMITTED. |
| | 140 | |
| Structural and Collateral Term Sheet | | BMO 2024-C8 |
| No. 11 – Woodfield Mall |
The Loan. The eleventh largest mortgage loan (the “Woodfield Mall Mortgage Loan”) is part of a whole loan evidenced by 18 notes comprising (i) 15 senior pari passu promissory notes in the aggregate original principal amount of $264,000,000 (collectively, the “Woodfield Mall Senior Pari Passu Notes”, and the portion of the Woodfield Mall Whole Loan evidenced by such senior pari passu notes, the “Woodfield Mall Senior Loan”) and (ii) three junior pari passu promissory notes in the aggregate original principal amount of $30,000,000 (collectively, the “Woodfield Mall Subordinate Companion Notes”, and the portion of the Woodfield Mall Whole Loan evidenced by such junior notes, the “Woodfield Mall Subordinate Companion Loan”). The Woodfield Mall Subordinate Companion Notes are subordinate to the Woodfield Mall Senior Pari Passu Notes as and to the extent described in “Description of the Mortgage Pool—The Whole Loans—The Non-Serviced A/B Whole Loan—The Woodfield Mall Whole Loan" in the Preliminary Prospectus. The aggregate outstanding principal balance as of the Cut-off Date of the Woodfield Mall Whole Loan is $294,000,000. The Woodfield Mall Whole Loan was co-originated by Bank of Montreal (“BMO”), Barclays Capital Real Estate Inc. (“Barclays”) and Bank of America, N.A. (“BANA”). The Woodfield Mall Whole Loan proceeds were used to refinance the existing debt on the Woodfield Mall Property, fund upfront reserves and pay origination costs. The Woodfield Mall Whole Loan accrues interest at a fixed rate of approximately 6.71100% per annum. The table below identifies the promissory notes that comprise the Woodfield Mall Whole Loan. The Woodfield Mall Whole Loan is secured by the borrower’s fee interest in a portion of a super-regional mall (the “Woodfield Mall”) located in Schaumburg, Illinois (such portion of the mall securing the Woodfield Mall Whole Loan, the “Woodfield Mall Property”). The borrower ground leased a portion of the Woodfield Mall Property (the “Nordstrom Parcel”) to Nordstrom pursuant to a ground lease (the “Nordstrom Ground Lease”) between Nordstrom, as ground lessee, and the borrower, as ground lessor. The Woodfield Mall Property collectively represents approximately 49.5% of the total 2,152,069 square feet of net rentable area at the Woodfield Mall (the “Total Mall NRA”).
The Woodfield Mall Mortgage Loan is evidenced by three notes, with an aggregate principal balance as of the Cut-off Date of $20,000,000. Payments allocated to the Woodfield Mall Subordinate Companion Loan will be paid only to the holders of the Woodfield Mall Subordinate Companion Loan as described in “Description of the Mortgage Pool—The Whole Loans—The Non-Serviced A/B Whole Loan—The Woodfield Mall Whole Loan” in the Preliminary Prospectus. The Woodfield Mall Whole Loan is serviced pursuant to the pooling and servicing agreement for the BMO 2023-C7 securitization transaction. The relationship between the holders of the Woodfield Mall Whole Loan is governed by a co-lender agreement. Prior to the occurrence of a “control appraisal period” with respect to the Woodfield Mall Whole Loan, the holder of the Woodfield Mall Subordinate Companion Note designated as Note B-1 (i.e., the BMO 2023-C7 securitization trust, which rights will be exercisable by the designated class(es) of holders of the series of loan-specific certificates backed by the Woodfield Mall Subordinate Companion Loan) will be the controlling noteholder. Following the occurrence and during the continuance of such “control appraisal period” with respect to the Woodfield Mall Whole Loan, the holder of the Woodfield Mall Senior Pari Passu Note designated as Note A-1-1 (i.e., the BBCMS 2024-C24 securitization trust) will be the controlling noteholder (the control rights of which are expected to ultimately be exercised by the designated class(es) of holders specified in the pooling and servicing agreement for the BBCMS 2024-C24 securitization trust). See “Description of the Mortgage Pool—The Whole Loans—The Non-Serviced A/B Whole Loan—The Woodfield Mall Whole Loan” in the Preliminary Prospectus.
THE INFORMATION IN THIS STRUCTURAL AND COLLATERAL TERM SHEET IS NOT COMPLETE AND MAY BE AMENDED PRIOR TO THE TIME OF SALE. THIS TERM SHEET IS NOT AN OFFER TO SELL THESE SECURITIES AND IT IS NOT A SOLICITATION OF AN OFFER TO BUY THESE SECURITIES IN ANY JURISDICTION WHERE THE OFFER OR SALE IS NOT PERMITTED. |
| | 141 | |
| Structural and Collateral Term Sheet | | BMO 2024-C8 |
| No. 11 – Woodfield Mall |
| Whole Loan Summary |
| Note | Original Balance | Cut-off Date Balance | | Note Holder | Controlling Piece |
| A-1-1 | $20,000,000 | $20,000,000 | | BBCMS 2024-C24 | No(1) |
| A-1-2 | $55,000,000 | $55,000,000 | | BMO 2023-C7 | No |
| A-1-3 | $10,000,000 | $10,000,000 | | BBCMS 2024-C24 | No |
| A-1-4 | $10,000,000 | $10,000,000 | | BMO 2024-C8 | No |
| A-1-5 | $5,000,000 | $5,000,000 | | BMO 2024-C8 | No |
| A-1-6 | $5,000,000 | $5,000,000 | | BMO 2024-C8 | No |
| A-2-1 | $13,000,000 | $13,000,000 | | BMO 2023-C7 | No |
| A-2-2 | $25,000,000 | $25,000,000 | | BBCMS 2024-C24 | No |
| A-2-3(2) | $20,000,000 | $20,000,000 | | Barclays | No |
| A-2-4 | $12,500,000 | $12,500,000 | | BBCMS 2024-C24 | No |
| A-2-5(2) | $9,000,000 | $9,000,000 | | Barclays | No |
| A-3-1(2) | $40,000,000 | $40,000,000 | | BANA | No |
| A-3-2(2) | $15,000,000 | $15,000,000 | | BANA | No |
| A-3-3(2) | $15,000,000 | $15,000,000 | | BANA | No |
| A-3-4(2) | $9,500,000 | $9,500,000 | | BANA | No |
| Total Senior Loan | $264,000,000 | $264,000,000 | | | |
| B-1 | $11,931,818 | $11,931,818 | | BMO 2023-C7 (Loan-Specific Certificates) | Yes(1) |
| B-2 | $9,034,091 | $9,034,091 | | BMO 2023-C7 (Loan-Specific Certificates) | No(1) |
| B-3 | $9,034,091 | $9,034,091 | | BMO 2023-C7 (Loan-Specific Certificates) | No(1) |
| Whole Loan | $294,000,000 | $294,000,000 | | | |
| (1) | Under the related co-lender agreement, Note B-1 is the designated controlling note; provided that if any interest in Note B-1 is held by the borrower or a “borrower restricted party” within the meaning of the related co-lender agreement when Note B-1 would otherwise be the controlling note, Note B-2 will be the controlling note; and provided, further, that if any interest in Note B-2 is held by the borrower or a borrower restricted party when Note B-2 would otherwise be the controlling note, Note B-3 will be the controlling note. Following the occurrence and during the continuance of a “control appraisal period” with respect to the Woodfield Mall Whole Loan (i.e., a control appraisal period with respect to Note B-1, Note B-2 and Note B-3), Note A-1-1 will be the controlling note, and the controlling class representative of the BBCMS 2024-C24 securitization trust will be entitled to exercise the related control rights. See “Description of the Mortgage Pool—The Whole Loans—The Non-Serviced A/B Whole Loan—The Woodfield Mall Whole Loan” in the Preliminary Prospectus. |
| (2) | Expected to be contributed to one or more future securitization(s). |
The Property. The Woodfield Mall is a two- and three-story partially enclosed Class “A” super-regional mall, totaling 2,152,069 square feet on an approximately 133.05-acre site in Schaumburg, Illinois. The Woodfield Mall was built in 1971 by Taubman Centers and expanded in 1995, with renovations occurring in 2015, 2016 and 2018. The Woodfield Mall provides parking via 8,949 surface parking and parking garage spaces, resulting in a parking ratio of approximately 4.2 spaces per 1,000 square feet of the Total Mall NRA. The Woodfield Mall Property consists of 1,064,590 square feet of net rentable area (approximately 49.5% of the Total Mall NRA).
As of November 14, 2023, the Woodfield Mall Property was 96.1% occupied by over 200 tenants (including temporary tenants, which collectively occupy approximately 8.6% of the Woodfield Mall Property (the “Total Collateral NRA”)). No underwritten base rent is attributable to such temporary tenants. Approximately 47.8% of the Total Collateral NRA is occupied by 20 major tenants (each of which occupies 10,000 or more square feet of net rentable area) and one anchor tenant (Nordstrom).
The portion of the Woodfield Mall occupied by six anchor tenants, namely Macy’s, J.C. Penney, Sears, Primark, Level 257 and Lord & Taylor (the “Non-Collateral Anchors”), representing approximately 50.5% of the Total Mall NRA, is not part of the collateral securing the Woodfield Mall Whole Loan. The Woodfield Mall Property does not include any portion of the mall owned and occupied by the Non-Collateral Anchors. The information relating to the Woodfield Mall Property in this term sheet does not include any space occupied by the Non-Collateral Anchors, unless otherwise indicated.
The most recent expansion of the Woodfield Mall Property occurred in 1995, and such expansion included Nordstrom and the mall shops leading to Nordstrom. Renovations of the Woodfield Mall Property occurred in 2015, 2016 and 2018, with the most recent renovation involving a food court.
Major Tenants. The three largest tenants at the Woodfield Mall Property based on underwritten base rent are H&M, Victoria’s Secret/Pink and Zara.
H&M (27,320 square feet; 2.6% of Total Collateral NRA; 6.1% of underwritten base rent): H&M Hennes & Mauritz (“H&M”) is a global retailer offering affordable apparel for men, women and children. H&M was incorporated in 1947 and remains
THE INFORMATION IN THIS STRUCTURAL AND COLLATERAL TERM SHEET IS NOT COMPLETE AND MAY BE AMENDED PRIOR TO THE TIME OF SALE. THIS TERM SHEET IS NOT AN OFFER TO SELL THESE SECURITIES AND IT IS NOT A SOLICITATION OF AN OFFER TO BUY THESE SECURITIES IN ANY JURISDICTION WHERE THE OFFER OR SALE IS NOT PERMITTED. |
| | 142 | |
| Structural and Collateral Term Sheet | | BMO 2024-C8 |
| No. 11 – Woodfield Mall |
under the control of the family of founder Erling Persson. H&M group’s brands are H&M, H&M Home, COS, Weekday, Monki, & Other Stories, ARKET, Afound and Singular Society. As of 2022, H&M operated over 4,000 stores across 79 markets with approximately 150,000 employees. H&M has been a tenant at the Woodfield Mall Property since 2014 under a lease with an expiration date of January 31, 2029, and no renewal or termination options.
Victoria’s Secret/Pink (18,269 square feet, 1.7% of Total Collateral NRA; 3.7% of underwritten base rent). Victoria’s Secret & Co. (“Victoria’s Secret/Pink”) is a Fortune 500 specialty retailer of modern, fashion-inspired collections including signature bras, panties, lingerie, casual sleepwear, athleisure and swimwear, as well as fragrances and body care. Victoria’s Secret/Pink comprises two brands, Victoria’s Secret and PINK, founded in 1977 by Roy and Gaye Raymond. Victoria’s Secret employs over 30,000 associates across approximately 1,360 retail stores in approximately 70 countries. Victoria’s Secret/Pink has been a tenant at the Woodfield Mall Property since 2013 under a lease with an expiration date of January 31, 2028, and no renewal or termination options.
Zara (21,759 square feet; 2.0% of Total Collateral NRA; 3.6% of underwritten base rent): Zara is a global clothing retailer having approximately 3,000 stores across 96 countries. Zara is the flagship brand of the Inditex Group. Inditex Group has a variety of brands including Zara, Pull&Bear, Massimo Dutti, Bershka, Stradivarius and Oysho Y Zara, located across 213 markets worldwide. The United States has 98 Inditex Group stores as of January 2019. Zara has been a tenant at the Woodfield Mall Property since 2015 under a lease with an expiration date of October 31, 2028, and no renewal or termination options.
The two largest tenants at the Woodfield Mall based on net rentable area are Macy’s and J.C. Penney, both Non-Collateral Anchors, and the largest tenant at the Woodfield Mall Property based on net rentable area is Nordstrom.
Nordstrom (200,000 square feet; 18.8% of Total Collateral NRA; 0.0% of underwritten base rent): Nordstrom (Moody’s/S&P/Fitch: Ba1/BB+/BBB-) was founded in 1901 as a retail shoe business in Seattle, Washington. Nordstrom offers an extensive selection of brand-name and private label merchandise for women, men, young adults and children focused on apparel, shoes, beauty, accessories and home goods. The Nordstrom Ground Lease at the Woodfield Mall Property has an original commencement date of March 3, 1995 and an expiration date of March 2, 2025. The Nordstrom Ground Lease has seven, 10-year renewal options remaining and no termination options. Nordstrom does not pay base rent.
Macy’s (Non-Collateral Anchor; 315,498 square feet; 0.0% of Total Collateral NRA; 0.0% of underwritten base rent): Founded in 1858 and headquartered in New York, New York, Macy’s (Moody’s/S&P/Fitch: Ba2/BB+/BBB-) is a department store chain that operates approximately 725 stores in the United States and Washington, D.C., as well as Guam and Puerto Rico. Macy’s has three banners that include Macy’s, bluemercury and Bloomingdale’s (and accompanying e-commerce sites), that sell men's, women's and children's apparel and accessories, cosmetics, and home furnishings, among other merchandise.
J.C. Penney (Non-Collateral Anchor; 288,550 square feet; 0.0% of Total Collateral NRA; 0.0% of underwritten base rent): Founded in 1902 and headquartered in Plano, Texas, J.C. Penney (Moody’s/S&P/Fitch: NR/NR/NR) is a department store chain with approximately 10,000 employees. J.C. Penney sells products including family apparel, footwear, accessories, fine and fashion jewelry, home furnishings, and beauty products through Sephora.
Environmental. According to the Phase I environmental assessment dated November 7, 2023, there was no evidence of any recognized environmental conditions at the Woodfield Mall Property.
The following table presents certain information relating to the historical occupancy of the Woodfield Mall Property:
| Historical and Current Occupancy |
| 2020(1) | 2021(1) | 2022(1) | Current(2) |
| 91.0% | 93.0% | 95.0% | 96.1% |
| (1) | Historical Occupancies are as of December 31 of each respective year and include temporary tenants. Occupancy does not include net rentable area for Non-Collateral Anchors. |
| (2) | Based on the underwritten rent roll dated November 14, 2023. Current occupancy of the in-line tenants less than 10,000 square feet is 96.3% |
THE INFORMATION IN THIS STRUCTURAL AND COLLATERAL TERM SHEET IS NOT COMPLETE AND MAY BE AMENDED PRIOR TO THE TIME OF SALE. THIS TERM SHEET IS NOT AN OFFER TO SELL THESE SECURITIES AND IT IS NOT A SOLICITATION OF AN OFFER TO BUY THESE SECURITIES IN ANY JURISDICTION WHERE THE OFFER OR SALE IS NOT PERMITTED. |
| | 143 | |
| Structural and Collateral Term Sheet | | BMO 2024-C8 |
| No. 11 – Woodfield Mall |
The following table presents certain information relating to the major tenants (of which, certain tenants have co-tenancy provisions) based on the Total Mall NRA:
| Top Tenant Summary(1) |
| Tenant | Ratings
Moody’s/S&P/Fitch(2) | Total Mall NRA (SF) | % of
Total Collateral NRA(3) | UW Base Rent PSF | UW Base Rent | % of Total
UW Base Rent | TTM September 2023 Sales $(4) | Sales PSF(4) | Occ Cost(4) | Lease
Expiration Date |
| Non-Collateral Anchor Tenants | | | | | | | | | | |
| Macy's | Ba2/BB+/BBB- | 315,498 | NAP | | $0.00 | | $0 | 0.0 | % | $45,400,000 | $143.90 | | NAV | | NAV | |
| J.C. Penney(5) | NR/NR/NR | 288,550 | NAP | | $0.00 | | 0 | 0.0 | | $16,500,000 | $57.18 | | 3.6% | | NAV | |
| Sears(6) | NR/NR/NR | 272,678 | NAP | | $0.00 | | 0 | 0.0 | | NAV | NAV | | NAV | | NAV | |
| Primark(6) | NR/NR/NR | 50,000 | NAP | | $0.00 | | 0 | 0.0 | | NAV | NAV | | NAV | | NAV | |
| Level 257(6) | NR/NR/NR | 42,094 | NAP | | $0.00 | | 0 | 0.0 | | NAV | NAV | | NAV | | NAV | |
| Lord & Taylor(5) | NR/NR/NR | 118,659 | NAP | | $0.00 | | 0 | 0.0 | | NAV | NAV | | NAV | | NAV | |
| Non-Collateral Anchor Tenants Subtotal / Wtd. Avg. | | 1,087,479 | NAP | | $0.00 | | $0 | 0.0 | % | | | | |
| Collateral Anchor Tenant | | | | | | | | | | |
| Nordstrom | Ba1/BB+/BBB- | 200,000 | 18.8 | % | $0.00 | | $0 | 0.0 | % | $42,000,000 | $210.00 | | NAV | | 03/02/2025 | |
| Major Tenants | | | | | | | | | | |
| H&M | NR/NR/NR | 27,320 | 2.6 | % | $82.62 | | $2,257,171 | 6.1 | % | $10,374,930 | $379.76 | | 21.9% | | 1/31/2029 | |
| Victoria's Secret/Pink | NR/NR/NR | 18,269 | 1.7 | | $75.00 | | 1,370,175 | 3.7 | | $11,569,094 | $633.26 | | 20.9% | | 1/31/2028 | |
| Zara | NR/NR/NR | 21,759 | 2.0 | | $61.59 | | 1,340,243 | 3.6 | | $16,127,709 | $741.20 | | 9.3% | | 10/31/2028 | |
| Express/Express Men | NR/NR/NR | 20,176 | 1.9 | | $57.84 | | 1,166,913 | 3.2 | | $5,307,887 | $263.08 | | 24.1% | | 4/30/2029 | |
| Cheesecake Factory | NR/NR/NR | 11,879 | 1.1 | | $68.39 | | 812,428 | 2.2 | | $13,685,994 | $1,152.12 | | 7.9% | | 1/31/2026 | |
| Urban Outfitters | NR/NR/NR | 10,775 | 1.0 | | $66.63 | | 717,884 | 1.9 | | NAV | NAV | | NAV | | 10/31/2033 | |
| The Gap/Gap Kids | NR/NR/NR | 11,202 | 1.1 | | $57.43 | | 643,379 | 1.7 | | $2,409,049 | $215.06 | | 29.1% | | 1/31/2027 | |
| Hollister Co. | NR/NR/NR | 9,210 | 0.9 | | $65.83 | | 606,304 | 1.6 | | $6,343,726 | $688.79 | | 20.0% | | 1/31/2024 | |
| Velocity Esports | NR/NR/NR | 15,360 | 1.4 | | $35.81 | | 550,000 | 1.5 | | NAV | NAV | | NAV | | 5/31/2036 | |
| Uniqlo | NR/NR/NR | 11,384 | 1.1 | | $47.54 | | 541,216 | 1.5 | | $9,919,451 | $871.35 | | 8.5% | | 1/31/2029 | |
| Major Tenants Subtotal / Wtd. Avg. | | 157,334 | 14.8 | % | $63.60 | | $10,005,712 | 27.1 | % | | | | |
| Remaining Occupied | | 665,850 | 62.5 | % | $40.34 | | $26,857,964 | 72.9 | % | | | | |
| Occupied Collateral Total | | 1,023,184 | 96.1 | % | $36.03 | | $36,863,676 | 100.0 | % | | | | |
| Vacant | | 41,406 | 3.9 | | | | | | | | |
| Collateral Total / Wtd. Avg. | | 1,064,590 | 100.0 | % | | $36,863,676 | 100.0 | % | | | | |
| | | | | | | | | | | |
| | | | | | | | | | | |
| Collateral + Non Collateral Total | | 2,152,069 | 100.0 | % | | | | | | | |
| | | | | | | | | | | |
| (1) | Based on the underwritten rent roll dated November 14, 2023. Inclusive of rent steps through November 30, 2024. |
| (2) | In certain instances, ratings provided are those of the parent company of the entity shown, whether or not the parent company guarantees the lease. |
| (3) | % of Total Collateral NRA refers only to the Woodfield Mall Property and does not include the portion of the Woodfield Mall occupied by the Non-Collateral Anchors. |
| (4) | All information regarding sales and occupancy costs presented in this term sheet with respect to the Woodfield Mall is based upon information provided by the borrower sponsor. In certain instances, sales figures represent estimates because the tenants are not required to report, or otherwise may not have reported, sales information on a timely basis. Further, because sales are self-reported, such information is not independently verified by the borrower sponsor. Sales are presented as of the 12 months ended September 2023. |
| (5) | J.C. Penney and Lord & Taylor do not pay rent but pay certain reimbursements. |
| (6) | Sears leases a total of 364,772 square feet. Sears has subleased 50,000 square feet to Primark and 42,094 square feet to Level 257. Sears is dark in the remaining 272,678 square feet but continues to pay contractual reimbursements. |
THE INFORMATION IN THIS STRUCTURAL AND COLLATERAL TERM SHEET IS NOT COMPLETE AND MAY BE AMENDED PRIOR TO THE TIME OF SALE. THIS TERM SHEET IS NOT AN OFFER TO SELL THESE SECURITIES AND IT IS NOT A SOLICITATION OF AN OFFER TO BUY THESE SECURITIES IN ANY JURISDICTION WHERE THE OFFER OR SALE IS NOT PERMITTED. |
| | 144 | |
| Structural and Collateral Term Sheet | | BMO 2024-C8 |
| No. 11 – Woodfield Mall |
The following table presents certain information relating to the tenant sales of the Woodfield Mall Property:
| Comparable In-line Sales(1) |
| Tenants < 10,000 SF | 2019 | 2020(2) | 2021 | 2022 | TTM September 2023 |
| Gross Mall Sales | $274,505,000 | NAP | $269,467,000 | $269,130,000 | $294,883,000 |
| Gross Mall Sales (Ex-Apple) | $220,566,000 | NAP | $240,722,000 | $233,070,000 | $256,280,000 |
| Sales PSF (Inline < 10,000 SF) | $726 | NAP | $755 | $807 | $820 |
| Sales PSF (Inline < 10,000 SF, Ex-Apple) | $597 | NAP | $691 | $717 | $730 |
| Occupancy Cost (Inline < 10,000 SF)(3) | 17.4% | NAP | 16.6% | 15.4% | 14.7% |
| Occupancy Cost (Inline < 10,000 SF, Ex-Apple)(3) | 21.2% | NAP | 18.2% | 17.3% | 16.5% |
| (1) | All information regarding sales and occupancy costs presented herein with respect to the Woodfield Mall Property is based upon information provided by the borrower sponsor. In certain instances, sales figures represent estimates because the tenants are not required to report, or otherwise may not have reported sales information on a timely basis. Further, because sales are self-reported, such information is not independently verified by the borrower sponsor. |
| (2) | The Woodfield Mall was closed due to the COVID-19 pandemic during a portion of 2020. |
| (3) | Occupancy Cost is calculated by the sum of base rents, percentage rents and all expense recoveries divided by annual sales. |
The following table presents certain information relating to the major tenant sales of the Woodfield Mall:
| Major Tenant Sales by Type(1) |
| Tenant Name | 2019 | 2020(2) | 2021 | 2022 | TTM September 2023 |
| Macy's(3) | $51,000,000 | $28,100,000 | $45,900,000 | $45,400,000 | $45,400,000 |
| Nordstrom | $53,600,000 | $37,500,000 | $40,100,000 | $42,000,000 | $42,000,000 |
| J.C. Penney(3) | $21,900,000 | $13,700,000 | $15,100,000 | $16,500,000 | $16,500,000 |
| Department Stores | $126,500,000 | $79,300,000 | $101,100,000 | $103,900,000 | $103,900,000 |
| In-Line Tenants | $337,753,000 | $210,500,000 | $353,998,000 | $362,968,000 | $380,594,000 |
| Apple | $53,939,000 | $21,311,000 | $28,745,000 | $36,060,000 | $38,603,000 |
| Total Woodfield Mall | $518,192,000 | $311,111,000 | $483,843,000 | $502,928,000 | $523,097,000 |
| (1) | All sales information presented herein with respect to the Woodfield Mall is based upon information provided by the borrower sponsor. In certain instances, sales figures represent estimates because the tenants are not required to report, or otherwise may not have reported sales information on a timely basis. Further, because sales are self-reported, such information is not independently verified by the borrower sponsor. |
| (2) | The Woodfield Mall was closed due to the COVID-19 pandemic during a portion of 2020. |
| (3) | Macy’s and J.C. Penney are Non-Collateral Anchors. |
THE INFORMATION IN THIS STRUCTURAL AND COLLATERAL TERM SHEET IS NOT COMPLETE AND MAY BE AMENDED PRIOR TO THE TIME OF SALE. THIS TERM SHEET IS NOT AN OFFER TO SELL THESE SECURITIES AND IT IS NOT A SOLICITATION OF AN OFFER TO BUY THESE SECURITIES IN ANY JURISDICTION WHERE THE OFFER OR SALE IS NOT PERMITTED. |
| | 145 | |
| Structural and Collateral Term Sheet | | BMO 2024-C8 |
| No. 11 – Woodfield Mall |
The following table presents certain information relating to the tenant lease expirations at the Woodfield Mall Property:
| Lease Rollover Schedule(1)(2) |
| Year | Number of Leases Expiring | Net Rentable Area Expiring | % of NRA Expiring | UW Base Rent Expiring(3) | % of UW Base Rent Expiring(3) | Cumulative Net Rentable Area Expiring | Cumulative % of NRA Expiring | Cumulative UW Base Rent Expiring(3) | Cumulative % of UW Base Rent Expiring(3) |
| Vacant | NAP | 41,406 | 3.9 | % | NAP | NA | P | 41,406 | | 3.9% | | NAP | NAP | |
| 2023 & MTM | 7 | 21,886 | 2.1 | | $1,181,355 | 3.2 | % | 63,292 | | 6.0% | | $1,181,355 | 3.2% | |
| 2024 | 25 | 78,764 | 7.4 | | 4,516,592 | 12.3 | | 142,056 | | 13.3% | | $5,697,946 | 15.5% | |
| 2025 | 23 | 265,320 | 24.9 | | 3,245,716 | 8.8 | | 407,376 | | 38.3% | | $8,943,662 | 24.3% | |
| 2026 | 38 | 144,818 | 13.6 | | 6,175,654 | 16.8 | | 552,194 | | 51.9% | | $15,119,316 | 41.0% | |
| 2027 | 18 | 57,775 | 5.4 | | 3,089,980 | 8.4 | | 609,969 | | 57.3% | | $18,209,296 | 49.4% | |
| 2028 | 18 | 80,709 | 7.6 | | 5,357,144 | 14.5 | | 690,678 | | 64.9% | | $23,566,440 | 63.9% | |
| 2029 | 20 | 105,967 | 10.0 | | 6,255,091 | 17.0 | | 796,645 | | 74.8% | | $29,821,530 | 80.9% | |
| 2030 | 7 | 28,745 | 2.7 | | 1,479,397 | 4.0 | | 825,390 | | 77.5% | | $31,300,927 | 84.9% | |
| 2031 | 4 | 7,102 | 0.7 | | 395,209 | 1.1 | | 832,492 | | 78.2% | | $31,696,137 | 86.0% | |
| 2032 | 5 | 18,655 | 1.8 | | 614,059 | 1.7 | | 851,147 | | 80.0% | | $32,310,195 | 87.6% | |
| 2033 | 14 | 43,869 | 4.1 | | 2,661,904 | 7.2 | | 895,016 | | 84.1% | | $34,972,099 | 94.9% | |
| 2034 | 7 | 39,914 | 3.7 | | 1,041,577 | 2.8 | | 934,930 | | 87.8% | | $36,013,676 | 97.7% | |
| 2035 & Beyond | 2 | 38,323 | 3.6 | | 850,000 | 2.3 | | 973,253 | | 91.4% | | $36,863,676 | 100.0% | |
| Temporary Tenants | 24 | 91,337 | 8.6 | | 0 | 0.0 | | 1,064,590 | | 100.0% | | $36,863,676 | 100.0% | |
| Total Collateral | 212 | 1,064,590 | 100.0 | % | $36,863,676 | 100.0 | % | | | | |
| (1) | Based on the underwritten rent roll dated November 14, 2023. |
| (2) | Certain leases may have termination options that are exercisable prior to the originally stated expiration date of the lease and that are not considered in this Lease Rollover Schedule. |
| (3) | UW Base Rent Expiring, % of UW Base Rent Expiring, Cumulative UW Base Rent Expiring and Cumulative % of UW Base Rent Expiring include contractual rent steps through November 2024. |
THE INFORMATION IN THIS STRUCTURAL AND COLLATERAL TERM SHEET IS NOT COMPLETE AND MAY BE AMENDED PRIOR TO THE TIME OF SALE. THIS TERM SHEET IS NOT AN OFFER TO SELL THESE SECURITIES AND IT IS NOT A SOLICITATION OF AN OFFER TO BUY THESE SECURITIES IN ANY JURISDICTION WHERE THE OFFER OR SALE IS NOT PERMITTED. |
| | 146 | |
| Structural and Collateral Term Sheet | | BMO 2024-C8 |
| No. 11 – Woodfield Mall |
The following table presents certain information relating to the operating history and underwritten cash flows of the Woodfield Mall Property:
| Operating History and Underwritten Net Cash Flow |
| | 2019 | 2020 | 2021 | 2022 | 10/31/2023 TTM(1) | Underwritten | Per Square Foot(2) | %(3) |
| Rents in Place | $41,174,170 | $37,184,667 | $34,297,836 | $31,325,141 | $31,995,485 | $36,145,721 | $33.95 | 46.2 | % |
| Rent Steps(1) | 0 | 0 | 0 | 0 | 0 | 717,955 | 0.67 | 0.9 | |
| Percent in Lieu | 445,565 | 1,229,560 | 2,406,499 | 2,469,287 | 2,347,073 | 1,409,551 | 1.32 | 1.8 | |
| Percent Rent | 811,987 | 341,531 | 3,278,507 | 4,355,569 | 4,441,146 | 3,925,259 | 3.69 | 5.0 | |
| Vacant Income(4) | 0 | 0 | 0 | 0 | 0 | 3,245,048 | 3.05 | 4.2 | |
| Gross Potential Rent | $42,431,722 | $38,755,758 | $39,982,842 | $38,149,997 | $38,783,704 | $45,443,534 | $42.69 | 58.1 | % |
| Total Reimbursements | 35,104,199 | 23,802,491 | 25,870,805 | 28,065,713 | 26,816,583 | 26,220,282 | 24.63 | 33.5 | |
| Temporary Tenants | 4,396,324 | 2,837,003 | 4,433,113 | 4,598,726 | 4,329,039 | 4,329,039 | 4.07 | 5.5 | |
| Other Rents | 236,767 | 176,161 | 230,481 | 219,885 | 275,155 | 275,155 | 0.26 | 0.4 | |
| Media Income | 1,309,770 | 709,843 | 1,251,746 | 1,471,910 | 1,480,496 | 1,480,496 | 1.39 | 1.9 | |
| Lease Settlement Income | 472,562 | 909,740 | 1,585,822 | 1,797,721 | 304,962 | 0 | 0.00 | 0.0 | |
| Deferred Rent | 485,119 | 12,837 | 0 | 170,470 | 0 | 0 | 0.00 | 0.0 | |
| Other Income | 617,296 | 533,957 | 348,322 | 391,178 | 428,248 | 428,248 | 0.40 | 0.5 | |
| Net Rental Income | $85,053,759 | $67,737,790 | $73,703,131 | $74,865,600 | $72,418,187 | $78,176,753 | $73.43 | 100.0 | % |
| (Vacancy/Credit Loss)(5) | 0 | 0 | 0 | 0 | 0 | (3,245,048) | (3.05) | (4.2 | ) |
| Effective Gross Income | $85,053,759 | $67,737,790 | $73,703,131 | $74,865,600 | $72,418,187 | $74,931,706 | $70.39 | 95.8 | % |
| Total Expenses(6) | 34,048,763 | 40,191,262 | 36,473,501 | 38,359,447 | 35,940,556 | 32,816,238 | 30.83 | 43.8 | |
| Net Operating Income | $51,004,996 | $27,546,528 | $37,229,630 | $36,506,153 | $36,477,631 | $42,115,468 | $39.56 | 56.2 | % |
| Capital Expenditures | 0 | 0 | 0 | 0 | 0 | 195,077 | 0.18 | 0.3 | |
| TI/LC | 0 | 0 | 0 | 0 | 0 | 864,590 | 0.81 | 1.2 | |
| Net Cash Flow | $51,004,996 | $27,546,528 | $37,229,630 | $36,506,153 | $36,477,631 | $41,055,801 | $38.56 | 54.8 | % |
| (1) | 10/31/2023 TTM reflects the trailing 12-month period ending October 31, 2023. Contractual rent steps are through November 2024. |
| (2) | Per Square Foot is calculated using the Total Collateral NRA. |
| (3) | % column represents percent of Net Rental Income for all revenue lines and represents percent of Effective Gross Income for the remainder of fields. |
| (4) | Vacant Income reflects the gross up of vacancy at average in-place rents. |
| (5) | The underwritten economic occupancy is 95.5%. The Woodfield Mall Property was 96.1% leased based on the November 14, 2023 underwritten rent roll, including leases executed by the origination date. |
| (6) | The management fee is underwritten to reflect 4.00% of below market rate, temporary and overage rents, capped at $1,000,000. Real estate taxes were underwritten based on the actual tax bills for all of the property tax parcels at the Woodfield Mall Property (including the Nordstrom Parcel), inclusive of any tax reimbursements. |
The Market. The Woodfield Mall Property is located in Schaumburg, Illinois, within the Chicago-Naperville-Elgin, IL-IN-WI core-based statistical area (the “Chicago CBSA”). Chicago is a major Great Lakes port and is considered the commercial, financial, industrial and cultural center of the midwestern United States. The region surrounding Chicago is a major warehouse and distribution hub, supported by its comprehensive network of highway, water, rail and air routes. The trade, transportation and utilities sector dominates Chicago CBSA as the largest employment sector with roughly 20.5% of the regional workforce.
The Woodfield Mall Property is easily accessible from both Chicago and its surrounding suburbs. The Woodfield Mall Property is situated in the northwest Chicago suburb and is considered a desirable position within the Chicago MSA due to its proximity to the densely populated residential areas that surround the area and its easy access to both I-90 and I-290. Land uses in the immediate area generally include a mixture of commercial, residential, hotel, and office. The Woodfield Mall Property is located approximately 27 miles from the central business district of Chicago. The O'Hare International Airport is located approximately 13 miles away from the Woodfield Mall Property. Public transit options are also readily available, with the Schaumburg Metra station providing a convenient train connection to Chicago. Additionally, Pace buses service the area, ensuring accessibility for those without personal vehicles.
THE INFORMATION IN THIS STRUCTURAL AND COLLATERAL TERM SHEET IS NOT COMPLETE AND MAY BE AMENDED PRIOR TO THE TIME OF SALE. THIS TERM SHEET IS NOT AN OFFER TO SELL THESE SECURITIES AND IT IS NOT A SOLICITATION OF AN OFFER TO BUY THESE SECURITIES IN ANY JURISDICTION WHERE THE OFFER OR SALE IS NOT PERMITTED. |
| | 147 | |
| Structural and Collateral Term Sheet | | BMO 2024-C8 |
| No. 11 – Woodfield Mall |
Schaumburg is home to 10 industrial parks (including 13.2 million square feet of space in over 400 facilities), 67 shopping centers totaling more than 9.5 million square feet of space and 12.1 million square feet of office space spread throughout more than 90 buildings. Additional economic activity is generated by the Renaissance Schaumburg Hotel & Convention Center and an additional 25 hotels supporting the community. The area is also home to numerous office complexes, including Two Century Centre, an office complex north of the Woodfield Mall Property, past Golf Road (Illinois Route 58), and east of N. Roosevelt Boulevard. In addition, the neighborhood contains several car dealerships, fast food chains and gas stations.
According to the appraisal, the 2022 population within a 5-, 10- and 15-mile radius of the Woodfield Mall Property was 270,430, 949,592 and 2,109,255, respectively. Additionally, for the same time period, the average household income within the same radii was $119,090, $119,024 and $124,631, respectively.
According to the appraisal, the Woodfield Mall Property is located within the Chicago retail market and the Far Northwest retail submarket. As of the second quarter of 2023, the Chicago retail market contains 106,053,000 square feet of space and the overall vacancy rate was 12.7%, which is a decrease from 12.8% in 2018. As of the second quarter of 2023, the Far Northwest retail submarket contained approximately 6.9 million square feet of retail space inventory with a vacancy rate of 11.5% and an average asking rental rate of $18.20 per square foot.
THE INFORMATION IN THIS STRUCTURAL AND COLLATERAL TERM SHEET IS NOT COMPLETE AND MAY BE AMENDED PRIOR TO THE TIME OF SALE. THIS TERM SHEET IS NOT AN OFFER TO SELL THESE SECURITIES AND IT IS NOT A SOLICITATION OF AN OFFER TO BUY THESE SECURITIES IN ANY JURISDICTION WHERE THE OFFER OR SALE IS NOT PERMITTED. |
| | 148 | |
| Structural and Collateral Term Sheet | | BMO 2024-C8 |
| No. 11 – Woodfield Mall |
The following table presents certain information relating to comparable retail centers for the Woodfield Mall Property:
| Competitive Retail Center Summary(1) |
| Property Name/Location | Year Built / Renovated or Expanded | Total NRA (SF) | Total Occupancy | Distance to Subject | Sales PSF | Major Tenants |
Woodfield Mall 5 Woodfield Mall Schaumburg, IL | 1971, 1995 / 2015, 2016, 2018 | 1,064,590(2)(3) | 96.1%(3) | NAP | $730(3)(4) | Macy’s J.C. Penney Nordstrom Sears Lord & Taylor Primark Level 257 |
Streets of Woodfield 601 N Martingale Road Schaumburg, IL | 1991, 1993, 1997, 2009 / 2000 | 692,549 | 96.0% | 0.6 miles | NAV | Dick’s Sporting Goods RH Outlet AMC Loews (20 Screens) Whole Foods Crate & Barrel |
The Arboretum of South Barrington 100 W Higgins Road South Barrington, IL | 2007-2008 / 2016, 2018, 2019, 2022 | 484,409 | 83.0% | 8.1 miles | NAV | L.L. Bean Star Cinema Grill Pinstripes DSW Arhaus |
Fashion Outlets of Chicago 5220 Fashion Outlets Way Rosemont, IL | 2013 / NAP | 538,735 | 99.0% | 12.9 miles | $1,036 | Forever 21 Nike Nordstrom rack Polo Ralph Lauren Bloomingdale’s Outlet Saks Fifth Avenue Off 5th |
Oakbrook Center 100 Oakbrook Center Oak Brook, IL | 1962 / 2014, 2016, 2017, 2021 | 1,886,885 | 92.0% | 15.3 miles | $1,326; $1,129 (Ex-Apple) | Macy’s Nordstrom Neiman Marcus AMC Theater (12 Screens) Crate & Barrel |
Westfield Old Orchard 4905 Old Orchard Center Skokie, IL | 1956 / 2022-2023 | 1,508,431 | 91.0% | 15.5 miles | $902; $830 (Ex-Apple) | Macy’s Nordstrom Bloomingdale’s Cinemax Crate & Barrel |
Northbrook Court 1515 Lake Cook Road Northbrook, IL | 1976 / 1996 | 1,014,506 | 92.0% | 19.2 miles | $833; $705 (Ex-Apple) | Neiman Marcus AMC (14 Screens) Crate & Barrel Forever 21 Gap |
Chicago Ridge Mall 444 Ridgeland Avenue Chicago Ridge, IL | 1981 / 2004 | 832,350 | 73.0% | 30.3 miles | $629 | Kohl’s Dick’s Sporting Goods AMC Theater (6 Screens) Michaels ALDI Old Navy Forever 21 |
| (1) | Source: Appraisal, unless stated otherwise. |
| (2) | Total NRA (SF) includes only the Total Collateral NRA. |
| (3) | Based on the underwritten rent roll dated November 14, 2023. |
| (4) | Represents sales per square foot as of the 12 months ended September 2023 for in-line tenants (excluding Apple). |
THE INFORMATION IN THIS STRUCTURAL AND COLLATERAL TERM SHEET IS NOT COMPLETE AND MAY BE AMENDED PRIOR TO THE TIME OF SALE. THIS TERM SHEET IS NOT AN OFFER TO SELL THESE SECURITIES AND IT IS NOT A SOLICITATION OF AN OFFER TO BUY THESE SECURITIES IN ANY JURISDICTION WHERE THE OFFER OR SALE IS NOT PERMITTED. |
| | 149 | |
| Structural and Collateral Term Sheet | | BMO 2024-C8 |
| No. 12 – Medlock Crossing |
| Mortgage Loan Information | | Property Information |
| Mortgage Loan Seller: | LMF | | Single Asset / Portfolio: | Single Asset |
| Original Principal Balance(1): | $19,850,000 | | Title: | Fee |
| Cut-off Date Principal Balance(1): | $19,850,000 | | Property Type – Subtype: | Retail – Anchored |
| % of IPB: | 2.9% | | Net Rentable Area (SF): | 159,577 |
| Loan Purpose: | Refinance | | Location: | Duluth, GA |
| Borrower: | Medlock Crossing Shopping Center Duluth, GA. Limited Partnership | | Year Built / Renovated: | 1998 / NAP |
| Borrower Sponsor(2): | Avram Glazer | | Occupancy: | 98.6% |
| Interest Rate: | 7.29000% | | Occupancy Date: | 1/30/2024 |
| Note Date: | 2/8/2024 | | 4th Most Recent NOI (As of): | NAV |
| Maturity Date: | 2/6/2034 | | 3rd Most Recent NOI (As of): | $2,805,947 (12/31/2021) |
| Interest-only Period: | 120 months | | 2nd Most Recent NOI (As of): | $2,943,095 (12/31/2022) |
| Original Term: | 120 months | | Most Recent NOI (As of): | $2,909,477 (TTM 12/31/2023) |
| Original Amortization Term: | None | | UW Economic Occupancy: | 95.0% |
| Amortization Type: | Interest Only | | UW Revenues: | $3,866,451 |
| Call Protection(3): | L(25),YM1(88),O(7) | | UW Expenses: | $1,024,836 |
| Lockbox / Cash Management: | Springing | | UW NOI: | $2,841,614 |
| Additional Debt(1): | Yes | | UW NCF: | $2,736,294 |
| Additional Debt Balance(1): | $7,000,000 | | Appraised Value / Per SF: | $42,000,000 / $263 |
| Additional Debt Type(1): | Pari Passu | | Appraisal Date: | 1/5/2024 |
| | | | | |
| Escrows and Reserves | | Financial Information(1) |
| | Initial | Monthly | Initial Cap | | Cut-off Date Loan / SF: | $168 |
| Taxes: | $111,465 | $27,866 | N/A | | Maturity Date Loan / SF: | $168 |
| Insurance: | $86,238 | $8,624 | N/A | | Cut-off Date LTV: | 63.9% |
| Replacement Reserve: | $0 | $2,128 | N/A | | Maturity Date LTV: | 63.9% |
| TI/LC Reserves: | $7,500 | $6,649 | $500,000 | | UW NCF DSCR: | 1.38x |
| Immediate Repairs Reserve: | $324,503 | $0 | N/A | | UW NOI Debt Yield: | 10.6% |
| Free Rent Reserve(4): | $173,939 | $0 | N/A | | | |
| Sources and Uses |
| Sources | Proceeds | % of Total | | Uses | Proceeds | % of Total | |
| Whole Loan(1) | $26,850,000 | 96.4 | % | | Payoff Existing Debt | $26,579,322 | 95.4 | % |
| Borrower Sponsor Equity | 1,007,915 | 3.6 | | | Upfront Reserves | 703,644 | 2.5 | |
| | | | | Closing Costs(5) | 574,949 | 2.1 | |
| Total Sources | $27,857,915 | 100.0 | % | | Total Uses | $27,857,915 | 100.0 | % |
| (1) | The Medlock Crossing Mortgage Loan (as defined below) is part of a whole loan evidenced by 2 pari passu notes with an outstanding original principal balance as of the Cut-off Date of $26,850,000. The Financial Information presented in the chart above is based on the Medlock Crossing Whole Loan (as defined below). The Cut-off Date Principal Balance of $19,850,000 represents the controlling note A-1. |
| (2) | The borrower sponsor is Avram Glazer and the non-recourse carveout guarantor for the Medlock Crossing Whole Loan is Hamilton TFC, LLC (“Hamilton”). Hamilton is a Delaware limited liability company 100% owned by Avram Glazer Irrevocable Exempt Trust U/A/D August 22, 2006, with Avram Glazer as trustee. The guarantor’s net worth consists of approximately 90,000 shares in Manchester United PLC, which as of the origination date was worth approximately $1,950,000. Avram Glazer is a member of the Glazer family, which controls First Allied Corporation and HRG Group, the Tampa Bay Buccaneers of the NFL, and England's Manchester United Football Club. See “Description of the Mortgage Pool—Non-Recourse Carveout Limitations” in the Preliminary Prospectus. |
| (3) | Prepayment of the Medlock Crossing Whole Loan is permitted with a yield maintenance premium at any time from and after the earlier to occur of (a) the end of the two-year period commencing on the closing date of the securitization of the last promissory note representing a portion of the Medlock Crossing Whole Loan to be securitized and (b) March 6, 2027. The assumed lockout period of 25 payments is based on the expected closing date of the BMO 2024-C8 transaction in March 2024. The actual lockout period may be longer. |
| (4) | $123,723 of the free rent reserve amount is attributable to Regal Cinemas and is the result of the tenant’s overpayment of rent. See “Major Tenants” below. The remaining balance in the free rent reserve relates to two smaller tenants. |
| (5) | Closing Costs include $268,500 in origination fees. |
THE INFORMATION IN THIS STRUCTURAL AND COLLATERAL TERM SHEET IS NOT COMPLETE AND MAY BE AMENDED PRIOR TO THE TIME OF SALE. THIS TERM SHEET IS NOT AN OFFER TO SELL THESE SECURITIES AND IT IS NOT A SOLICITATION OF AN OFFER TO BUY THESE SECURITIES IN ANY JURISDICTION WHERE THE OFFER OR SALE IS NOT PERMITTED. |
| | 150 | |
| Structural and Collateral Term Sheet | | BMO 2024-C8 |
| No. 12 – Medlock Crossing |
The Loan. The twelfth largest mortgage loan (the “Medlock Crossing Mortgage Loan”) is part of a fixed rate whole loan (the “Medlock Crossing Whole Loan”) evidenced by two pari passu promissory notes in the aggregate original principal amount of $26,850,000, secured by a first lien mortgage on the borrower’s fee interest in a 159,577 square foot retail property located in Duluth, Georgia (the “Medlock Crossing Property”). The Medlock Crossing Whole Loan has a 10-year interest only term and accrues interest at a rate of 7.29000% per annum on an Actual/360 basis. The Medlock Crossing Whole Loan refinanced a prior loan that was in maturity default. See “Description of the Mortgage Pool—Defaults, Refinancings, Discounted Pay-offs, Foreclosure or REO Property Purchases” in the Preliminary Prospectus. The table below summarizes the promissory notes that comprise the Medlock Crossing Whole Loan. The Medlock Crossing Whole Loan will be serviced pursuant to the pooling and servicing agreement for the BMO 2024-C8 trust. See “Description of the Mortgage Pool—The Whole Loans—The Serviced Pari Passu Whole Loans” and “The Pooling and Servicing Agreement ” in the Preliminary Prospectus.
| Whole Loan Summary |
| Note | Original Balance | Cut-off Date Balance | Note Holder | Controlling Piece |
| A-1 | $19,850,000 | $19,850,000 | BMO 2024-C8 | Yes |
| A-2(1) | $7,000,000 | $7,000,000 | LMF | No |
| Total | $26,850,000 | $26,850,000 | | |
| (1) | Expected to be contributed to one or more securitizations. |
The Property. The Medlock Crossing Property is an anchored retail property located in Duluth, Georgia. The Medlock Crossing Property consists of six, single-story retail buildings situated on 21.74 acres and is comprised of 159,577 square feet. The Medlock Crossing Property is anchored by Regal Cinemas, Inc. Parking is available at the Medlock Crossing Property via 1,354 surface parking spaces, resulting in a parking ratio of 8.5 spaces per 1,000 square feet of rentable area. As of the January 30, 2024, the Medlock Crossing Property was 98.6% occupied.
Major Tenants.
Regal Cinemas, Inc. (70,770 square feet; 44.3% of NRA, 27.2% of Base Rent): Part of Cineworld Group, Regal Cinemas, Inc. (“Regal Cinemas”) operates one of the largest and most geographically diverse theatre circuits in the United States, consisting of 5,808 screens in 428 theatres in 41 states along with Guam and the District of Columbia. Regal Cinemas is the anchor tenant at the Medlock Crossing Property and has been a tenant at the Medlock Crossing Property since 1999, with the current lease term expiring in February 2030. Regal Cinemas has two, five-year renewal options remaining and no termination options. Regal Cinemas currently pays a rental rate of $11.30 per square foot NNN, which will remain flat throughout the term of the lease. Regal Cinemas has an outstanding rent credit of approximately $123,723 as a result of a lease extension and reduction in rent as of January 2023, which was reserved with the lender at origination. Cineworld Group PLC, together with over 100 affiliated debtors including Regal Cinemas previously filed for Chapter 11 bankruptcy protection and completed their financial restructuring process in July 2023. See “Description of the Mortgage Pool—Defaults, Refinancings, Discounted Pay-offs, Foreclosure or REO Property Purchases” in the Preliminary Prospectus.
Nara Cuisine & Lounge (8,010 square feet; 5.0% of NRA, 5.7% of Base Rent): Nara Cuisine & Lounge (“Nara”) is a Middle Eastern restaurant that serves meat dishes and offers a variety of vegan friendly dishes, some with meat substitutes. Nara has been a tenant at the Medlock Crossing Property since 2021, with the current lease term expiring in May 2031. Nara has no renewal options. Nara currently pays a rental rate of $20.22 per square foot NNN, with 3.0% annual escalations, with the next rent step on December 1, 2024. Nara has the right to terminate its lease effective May 31, 2026, by giving at least 12 months prior notification. Nara is currently negotiating the assignment of its lease to a new restaurant operator tenant.
Ari Korean BBQ (7,638 square feet; 4.8% of NRA, 6.7% of Base Rent): Ari Korean BBQ (“Ari”) serves grilled meats and other Korean BBQ fare. Ari has been a tenant at the Medlock Crossing Property since 2017, with the current lease term expiring in June 2027. Ari has two, five-year renewal options. Ari currently pays a rental rate of $25.08 per square foot NNN, with 3.0% annual escalations.
Appraisal. According to the appraisal, the Medlock Crossing Property had an “as-is” appraised value of $42,000,000 as of January 5, 2024.
THE INFORMATION IN THIS STRUCTURAL AND COLLATERAL TERM SHEET IS NOT COMPLETE AND MAY BE AMENDED PRIOR TO THE TIME OF SALE. THIS TERM SHEET IS NOT AN OFFER TO SELL THESE SECURITIES AND IT IS NOT A SOLICITATION OF AN OFFER TO BUY THESE SECURITIES IN ANY JURISDICTION WHERE THE OFFER OR SALE IS NOT PERMITTED. |
| | 151 | |
| Structural and Collateral Term Sheet | | BMO 2024-C8 |
| No. 12 – Medlock Crossing |
The table below shows the appraiser’s “as-is” conclusions.
| Appraisal Valuation Summary(1) |
| Appraisal Approach | Appraised Value | Capitalization Rate(2) |
| Income Capitalization Approach | $42,000,000 | 7.00% |
| (2) | The appraiser used a discounted cash flow approach to arrive at the appraised value. The capitalization rate shown above represents the overall capitalization rate. |
Environmental. According to a Phase I environmental assessment dated January 16, 2024, there is no evidence of any recognized environmental conditions at the Medlock Crossing Property.
The following table presents certain information relating to the historical and current occupancy of the Medlock Crossing Property:
| Historical and Current Occupancy(1) |
| 2021 | 2022 | 2023 | Current(2) |
| 91.2% | 93.7% | 97.6% | 98.6% |
| (1) | Historical Occupancies are as of December 31 of each respective year. |
| (2) | Current Occupancy is as of January 30, 2024. |
The following table presents certain information relating to the largest tenants at the Medlock Crossing Property:
| Top Tenant Summary(1) |
| Tenant | Ratings Moody’s/S&P/Fitch | Net Rentable Area (SF) | % of Total NRA | UW Base Rent PSF(2) | UW Base Rent(2) | | | | Lease Expiration Date |
| % of Total UW Base Rent(2) | Sales Per Screen(3) | Occ. Cost(3) |
| Regal Cinemas, Inc.(4) | NR/NR/NR | 70,770 | 44.3 | % | $11.30 | $800,000 | 27.2 | % | $287,469 | 24.4% | 2/28/2030(5) |
| Nara Cuisine & Lounge(6) | NR/NR/NR | 8,010 | 5.0 | | $20.82 | 166,768 | 5.7 | | NAV | NAV | 5/31/2031(7) |
| Ari Korean BBQ | NR/NR/NR | 7,638 | 4.8 | | $25.83 | 197,290 | 6.7 | | NAV | NAV | 6/30/2027(8) |
| Los Abuelos | NR/NR/NR | 6,048 | 3.8 | | $24.40 | 147,571 | 5. | | NAV | NAV | 9/30/2037(9) |
| Masti – Indian Street Eats | NR/NR/NR | 4,518 | 2.8 | | $24.18 | 109,245 | 3.7 | | NAV | NAV | 11/30/2028 |
| Iron Tribe Fitness | NR/NR/NR | 4,200 | 2.6 | | $19.71 | 82,782 | 2.8 | | NAV | NAV | 9/30/2025(10) |
| Top Tenants | | 101,184 | 63.4 | % | $14.86 | $1,503,656 | 51.2 | % | | | |
| Other Tenants | | 56,193 | 35.2 | % | $25.55 | $1,435,703 | 48.8 | % | | | |
| Occupied Collateral Total | | 157,377 | 98.6 | % | $18.68 | $2,939,359 | 100.0 | % | | | |
| Vacant Space | | 2,200 | 1.4 | % | | | | | | |
| | | | | | | | | | |
| Collateral Total | | 159,577 | 100.0 | % | | | | | | |
| | | | | | | | | | |
| (1) | Based on the underwritten rent roll dated January 30, 2024. |
| (2) | UW Base Rent PSF, UW Base Rent and % of Total UW Base Rent includes rent steps totaling $73,139 through February 2025, and exclude any gross up of vacant space. |
| (3) | Sales Per Screen is based on 2023 total sales figures. Occ. Cost is based on 2023 total sales, UW Base Rent and underwritten reimbursements. |
| (4) | As of May 2023, Regal Cinemas agreed to a lease extension for an additional period of 86 months commencing on January 1, 2023. As part of the extension, the rent was reduced from $15.50 per sq. ft. to $11.30 per sq. ft. retroactive to January 2023. As such, Regal Cinemas has an outstanding rent credit in the amount of $123,722.95 (which was reserved at closing) for the overpayment of base rent between January 2023 and May 2023. |
| (5) | Regal Cinemas has two, five-year renewal options remaining, exercisable upon not less than 5 months and not more than 8 months prior notice with base rent of $11.76 per square foot during the first option term and $12.23 per square foot during the second option term. |
| (6) | Nara is currently looking to assign its lease to a new restaurant operator tenant. The current terms under negotiation for the assignment include a term of 10 years, base rent of $22.00 per square foot with annual increases of 3.0% and no landlord concessions. There can be no assurance that the lease will be assigned or if assigned, it will be assigned pursuant to the terms specified above. |
| (7) | Nara has the right to terminate its lease effective as of May 31, 2026, by providing 12 months prior notification. |
| (8) | Ari has two, five-year extension options remaining, exercisable upon not less than 5 months and not more than 8 months prior written notice, with base rent at the then current market rent. |
| (9) | Los Abuelos has two, five-year extension options remaining, exercisable upon not less than 12 months and not more than 15 months prior written notice, with base rent escalations at 3% annually. |
| (10) | Iron Tribe Fitness has one, five-year renewal option remaining.
|
THE INFORMATION IN THIS STRUCTURAL AND COLLATERAL TERM SHEET IS NOT COMPLETE AND MAY BE AMENDED PRIOR TO THE TIME OF SALE. THIS TERM SHEET IS NOT AN OFFER TO SELL THESE SECURITIES AND IT IS NOT A SOLICITATION OF AN OFFER TO BUY THESE SECURITIES IN ANY JURISDICTION WHERE THE OFFER OR SALE IS NOT PERMITTED. |
| | 152 | |
| Structural and Collateral Term Sheet | | BMO 2024-C8 |
| No. 12 – Medlock Crossing |
The following table contains sales history for the Medlock Crossing Property:
Major Tenant Sales(1) |
Tenant | 2021 Sales | 2021 Sales Per Screen | 2022 Sales | 2022 Sales Per Screen | 2023 Sales | | Occupancy Costs(2) |
| Regal Cinemas, Inc. | $1,937,769 | $107,654 | $4,583,126 | $254,618 | $5,174,449 | $287,469 | 24.4% |
| (1) | Tenant sales are provided by the borrower. |
| (2) | Occupancy Costs is based on 2023 sales, underwritten base rent and underwritten reimbursements. |
The following table presents certain information relating to the tenant lease expiration of the Medlock Crossing Property:
| Lease Rollover Schedule(1)(2) |
| Year | Number of Leases Expiring | Net Rentable Area Expiring | % of NRA Expiring | UW Base Rent Expiring(3) | % of UW Base Rent Expiring(3) | Cumulative Net Rentable Area Expiring | Cumulative % of NRA Expiring | Cumulative UW Base Rent Expiring(3) | Cumulative % of UW Base Rent Expiring(3) |
| Vacant | NAP | 2,200 | 1.4 | % | NAP | NA | P | 2,200 | | 1.4% | | NAP | NAP | |
| 2024 & MTM | 1 | 1,200 | 0.8 | | $28,866 | 1.0 | % | 3,400 | | 2.1% | | $28,866 | 1.0% | |
| 2025 | 6 | 11,197 | 7.0 | | 258,798 | 8.8 | | 14,597 | | 9.1% | | $287,664 | 9.8% | |
| 2026 | 3 | 4,000 | 2.5 | | 93,354 | 3.2 | | 18,597 | | 11.7% | | $381,018 | 13.0% | |
| 2027 | 4 | 12,638 | 7.9 | | 312,165 | 10.6 | | 31,235 | | 19.6% | | $693,182 | 23.6% | |
| 2028 | 8 | 17,940 | 11.2 | | 472,490 | 16.1 | | 49,175 | | 30.8% | | $1,165,672 | 39.7% | |
| 2029 | 3 | 6,900 | 4.3 | | 209,045 | 7.1 | | 56,075 | | 35.1% | | $1,374,716 | 46.8% | |
| 2030 | 5 | 75,220 | 47.1 | | 926,973 | 31.5 | | 131,295 | | 82.3% | | $2,301,689 | 78.3% | |
| 2031 | 2 | 10,010 | 6.3 | | 221,928 | 7.6 | | 141,305 | | 88.5% | | $2,523,617 | 85.9% | |
| 2032 | 2 | 3,404 | 2.1 | | 93,622 | 3.2 | | 144,709 | | 90.7% | | $2,617,239 | 89.0% | |
| 2033 | 1 | 2,250 | 1.4 | | 51,098 | 1.7 | | 146,959 | | 92.1% | | $2,668,337 | 90.8% | |
| 2034 | 0 | 0 | 0.0 | | 0 | 0.0 | | 146,959 | | 92.1% | | $2,668,337 | 90.8% | |
| 2035 & Beyond | 3 | 12,618 | 7.9 | | 271,023 | 9.2 | | 159,577 | | 100.0% | | $2,939,359 | 100.0% | |
| Total | 38 | 159,577 | 100.0 | % | $2,939,359 | 100.0 | % | | | | |
| (1) | Based on the underwritten rent roll dated January 30, 2024. |
| (2) | Certain tenants may have lease termination options that are exercisable prior to the originally stated expiration date of the subject lease, which termination options are not considered in the lease rollover schedule. |
| (3) | UW Base Rent Expiring, % of UW Base Rent Expiring, Cumulative UW Base Rent Expiring and Cumulative % of UW Base Rent Expiring include rent steps totaling $73,139 through February 2025. |
THE INFORMATION IN THIS STRUCTURAL AND COLLATERAL TERM SHEET IS NOT COMPLETE AND MAY BE AMENDED PRIOR TO THE TIME OF SALE. THIS TERM SHEET IS NOT AN OFFER TO SELL THESE SECURITIES AND IT IS NOT A SOLICITATION OF AN OFFER TO BUY THESE SECURITIES IN ANY JURISDICTION WHERE THE OFFER OR SALE IS NOT PERMITTED. |
| | 153 | |
| Structural and Collateral Term Sheet | | BMO 2024-C8 |
| No. 12 – Medlock Crossing |
The following table presents certain information relating to the operating history and underwritten cash flows of the Medlock Crossing Property:
| Operating History and Underwritten Net Cash Flow |
| | 2021 | 2022 | 2023 | Underwritten | Per Square Foot | %(1) |
| Rents in Place(2) | $2,757,401 | $2,889,198 | $2,870,079 | $2,867,571 | $17.97 | 70.5 | % |
| Vacancy Gross Up(3) | 0 | 0 | 0 | 73,730 | 0.46 | 1.8 | |
| Rent Steps(4) | 0 | 0 | 0 | 73,139 | 0.46 | 1.8 | |
| Gross Potential Rent | $2,757,401 | $2,889,198 | $2,870,079 | $3,014,439 | $18.89 | 74.1 | % |
| Total Reimbursements | 1,137,520 | 982,034 | 1,095,978 | 1,055,509 | 6.61 | 25.9 | |
| Net Rental Income | $3,894,921 | $3,871,232 | $3,966,057 | $4,069,948 | $25.50 | 100.0 | % |
| Other Income | 1,480 | 7,366 | 0 | 0 | 0.00 | 0.0 | |
| (Vacancy/Credit Loss)(5) | 0 | 0 | 0 | (203,497) | (1.28) | (5.0 | ) |
| Effective Gross Income | $3,896,401 | $3,878,598 | $3,966,057 | $3,866,451 | $24.23 | 95.0 | % |
| Total Expenses | 1,090,454 | 935,503 | 1,056,580 | 1,024,836 | 6.42 | 26.5 | |
| Net Operating Income | $2,805,947 | $2,943,095 | $2,909,477 | $2,841,614 | $17.81 | 73.5 | % |
| Capital Expenditures | 0 | 0 | 0 | 25,532 | $0.16 | 0.7 | |
| TI/LC | 0 | 0 | 0 | 79,789 | $0.50 | 2.1 | |
| Net Cash Flow | $2,805,947 | $2,943,095 | $2,909,477 | $2,736,294 | $17.15 | 70.8 | % |
| (1) | % column represents percent of Net Rental Income for all revenue lines and represents percent of Effective Gross Income for the remainder of fields. |
| (2) | Underwritten Rents in Place is based on in-place rent as of January 30, 2024. |
| (3) | Lions Vape and Smoke Shop has been delinquent since November 2023 and as such was excluded from the underwriting. The Bank of America ATM is not renewing and has also been excluded from the underwriting. |
| (4) | Rent steps are taken through February 2025. |
| (5) | Underwritten Vacancy/Credit Loss represents the economic vacancy of 5.0%. The Medlock Crossing Property was 98.6% occupied as of January 30, 2024. |
The Market. The Medlock Crossing Property is located in Duluth, Georgia, within the Atlanta-Sandy Springs-Roswell, GA metropolitan statistical area (the “Atlanta MSA”). The Atlanta MSA is located in northwestern Georgia, and includes 29 counties within the state, and is the ninth largest MSA in the country. The Atlanta MSA is part of the Top 20 fastest growing and strongest economies in the United States. The Atlanta MSA is considered the business capital of the southeastern US and a global business hub. Major universities in the Atlanta MSA include Emory University, Georgia Institute of Technology, Georgia State University, Clark Atlanta University, University of West Georgia, Spelman College and Morehouse College. Top industries in the Atlanta MSA include supply chain and advanced manufacturing, creative industries, technology, life sciences and healthcare and CleanTech. The Atlanta MSA is headquarters to 35 Fortune 1,000 companies of which 19 companies are ranked on the Fortune 500 list, including The Home Depot, United Parcel Service (UPS), Delta Air Lines, Inc., The Coca-Cola Company and The Southern Company. The Atlanta MSA is also home to a variety of professional sports teams, including the Atlanta Falcons (National Football League), the Atlanta Braves (Major League Baseball), and the Atlanta Hawks (National Basketball Association). Additionally, FIFA confirmed that Atlanta’s Mercedes-Benz Stadium would host eight matches, including a semifinal match for the 2026 World Cup. The Atlanta MSA is served by Hartsfield-Jackson Atlanta International Airport (ATL). It is one of the world’s busiest and most efficient airports, offering more than 63,000 jobs on site and generating a $34.8 billion economic impact for metro Atlanta. Hartsfield-Jackson is a global gateway, offering nonstop service to more than 150 domestic and 70 international destinations and averaging 275,000 passengers per day.
The city of Duluth is located in the Roswell/Alpharetta retail submarket approximately 27 miles northeast of downtown Atlanta. The Roswell/Alpharetta submarket is one of the most affluent suburbs in the state of Georgia. Primary access to the Medlock Crossing Property is provided by Interstate 85. The city of Duluth has several benefits for businesses, which include a highly educated and trained workforce, dynamic network of technology firms and services, strategic access to Hartsfield-Jackson Atlanta International Airport, rail, Interstates 85, 75, and 20, Savannah and Brunswick Ports, superior digital infrastructure, competitive tax structure, affordable, flexible real estate options and top public and private schools, colleges and universities. Major industries in Duluth include medical and healthcare, information technology, industrial (distribution/warehousing/manufacturing), and automotive repair and maintenance. According to the appraisal, the 2023 population within a one-, three- and five-mile radius of the Medlock Crossing Property was 7,893, 71,224 and 208,995,
THE INFORMATION IN THIS STRUCTURAL AND COLLATERAL TERM SHEET IS NOT COMPLETE AND MAY BE AMENDED PRIOR TO THE TIME OF SALE. THIS TERM SHEET IS NOT AN OFFER TO SELL THESE SECURITIES AND IT IS NOT A SOLICITATION OF AN OFFER TO BUY THESE SECURITIES IN ANY JURISDICTION WHERE THE OFFER OR SALE IS NOT PERMITTED. |
| | 154 | |
| Structural and Collateral Term Sheet | | BMO 2024-C8 |
| No. 12 – Medlock Crossing |
respectively. The 2023 average household income within the same radii was $165,138, $160,846 and $162,138, respectively.
According to the appraisal, the Medlock Crossing Property is located within the Atlanta retail market. As of fourth quarter 2023, the Atlanta retail market reported a retail inventory of approximately 372.5 million square feet with a vacancy rate of 3.5% and an asking rent of $20.02 per square foot.
According to the appraisal, the Medlock Crossing Property is located within the Roswell/Alpharetta retail submarket. As of fourth quarter 2023, the Roswell/Alpharetta retail submarket reported a retail inventory of approximately 22.7 million square feet with a vacancy rate of 5.2% and an asking rent of $24.82 per square foot.
The following table presents certain information relating to the appraisal’s market rent conclusion for the Medlock Crossing Property:
| Market Rent Summary(1) |
| Type | Market Rent PSF | Lease Term (Years) | Rent Increase Projection | Lease Type |
| Cinema: | $12.00 | 10.0 | 2.0% every year | NNN |
| In Line – Tier One Space: | $38.50 | 5.0 | 3.0% every year | NNN |
| In Line – Tier Two Space: | $26.50 | 5.0 | 3.0% every year | NNN |
| In Line – Tier Three Space: | $22.00 | 5.0 | 3.0% every year | NNN |
The following table presents certain information relating to comparable sales for the Medlock Crossing Property:
Comparable Sales(1) |
| Property Location | Sale Date | Total NRA (SF) | Total Occupancy | Sale Price | Sale Price PSF | Adjusted Sales Price PSF |
Medlock Crossing 9700 Medlock Bridge Road Duluth, GA | NAP | 159,577(2) | 98.6%(2) | NAP | NAP | NAP |
Wake Forest Crossing 12516-12646 Capital Boulevard Wake Forest, NC | Oct-2022 | 197,921 | 95.0% | $42,149,000 | $212.96 | $212.96 |
Biscayne Shopping Center 10700 Biscayne Boulevard Biscayne Park, FL | Oct-2022 | 129,303 | 100.0% | $38,000,000 | $293.88 | $293.88 |
Osceola Village 3020 Dyer Boulevard Kissimmee, FL | Aug-2022 | 121,445 | 100.0% | $36,050,000 | $296.84 | $296.84 |
The Shoppes at Webb Gin 1350 Scenic Highway N. Snellville, GA | Jun-2022 | 329,644 | 92.0% | $97,000,000 | $294.26 | $294.26 |
The Forum on Peachtree Parkway 5165 Peachtree Parkway Northwest Peachtree Corners, GA | Mar-2022 | 501,946 | 82.0% | $123,500,000 | $246.04 | $246.04 |
Freedom Town Center 2741 Freedom Parkway Drive Fayetteville, NC | Feb-2022 | 350,838 | 100.0% | $83,000,000 | $236.58 | $236.58 |
Village at Prasada SEC of Waddell Road and Loop 303 Surprise, AZ | Jun-2023 | 309,620 | 99.0% | $88,999,998 | $287.45 | $287.45 |
Cooper Street Plaza Shopping Center 4629 South Cooper Street Arlington, TX | Jun-2023 | 88,877 | 100.0% | $19,050,000 | $214.34 | $214.34 |
Largo Town Center 806-990, 1006-1050 Largo Center Drive Largo, MD | Jul-2023 | 277,104 | 99.0% | $70,000,000 | $252.61 | $252.61 |
Santan Gateway North 1005-1205 South Arizona Avenue Chandler, AZ | Aug-2023 | 123,236 | 96.0% | $26,565,000 | $215.56 | $215.56 |
| (2) | Based on the underwritten rent roll dated January 30, 2024. |
THE INFORMATION IN THIS STRUCTURAL AND COLLATERAL TERM SHEET IS NOT COMPLETE AND MAY BE AMENDED PRIOR TO THE TIME OF SALE. THIS TERM SHEET IS NOT AN OFFER TO SELL THESE SECURITIES AND IT IS NOT A SOLICITATION OF AN OFFER TO BUY THESE SECURITIES IN ANY JURISDICTION WHERE THE OFFER OR SALE IS NOT PERMITTED. |
| | 155 | |
| Structural and Collateral Term Sheet | | BMO 2024-C8 |
| No. 13 – BJ’s Saratoga Springs |
| Mortgage Loan Information | | Property Information |
| Mortgage Loan Seller: | LCF | | Single Asset / Portfolio: | Single Asset |
| Original Principal Balance: | $15,500,000 | | Title: | Fee |
| Cut-off Date Principal Balance: | $15,500,000 | | Property Type – Subtype: | Retail – Single Tenant |
| % of IPB: | 2.3% | | Net Rentable Area (SF): | 116,620 |
| Loan Purpose: | Refinance | | Location: | Saratoga Springs, NY |
| Borrower: | LBW Saratoga LLC | | Year Built / Renovated: | 1992 / NAP |
| Borrower Sponsor(6): | Ladder Capital CRE Equity LLC | | Occupancy: | 100.0% |
| Interest Rate(1): | 7.03000% | | Occupancy Date: | 3/6/2024 |
Note Date: Anticipated Repayment Date(1): | 3/6/2024 3/6/2034 | | 4th Most Recent NOI (As of)(4): | NAV |
| Maturity Date(1): | 9/6/2037 | | 3rd Most Recent NOI (As of)(4): | NAV |
| Interest-only Period(1): | 120 months | | 2nd Most Recent NOI (As of)(4): | NAV |
| Original Term(1): | 120 months | | Most Recent NOI (As of)(4): | NAV |
| Original Amortization Term: | None | | UW Economic Occupancy: | 100.0% |
| Amortization Type: | Interest Only – ARD | | UW Revenues: | $1,872,431 |
| Call Protection: | YM(24),DorYM(89),O(7) | | UW Expenses: | $56,173 |
| Lockbox / Cash Management: | Hard / In Place | | UW NOI: | $1,816,258 |
| Additional Debt: | No | | UW NCF: | $1,804,596 |
| Additional Debt Balance: | N/A | | Appraised Value / Per SF: | $25,200,000 / $216 |
| Additional Debt Type: | N/A | | Appraisal Date: | 3/25/2023 |
| | | | | |
| Escrows and Reserves | | Financial Information |
| | Initial | Monthly | Initial Cap | | Cut-off Date Loan / SF: | $133 |
| Taxes(2): | $0 | Springing | N/A | | Maturity Date Loan / SF(1): | $133 |
| Insurance(3): | $0 | Springing | N/A | | Cut-off Date LTV: | 61.5% |
| Replacement Reserves: | $0 | $0 | N/A | | Maturity Date LTV(1): | 61.5% |
| TI / LC: | $0 | $0 | N/A | | UW NCF DSCR: | 1.63x |
| | | | | | UW NOI Debt Yield: | 11.7% |
| | | | | | | |
| |
| Sources and Uses |
| Sources | Proceeds | % of Total | | Uses | Proceeds | % of Total |
| Loan Amount | $15,500,000 | 100.0% | | Loan Payoff(5) | $15,288,572 | 98.6 | % |
| | | | | Closing Costs | 211,428 | 1.4 | |
| Total Sources | $15,500,000 | 100.0% | | Total Uses | $15,500,000 | 100.0 | % |
| (1) | The BJ’s Saratoga Springs Mortgage Loan (as defined below) is structured with an anticipated repayment date of March 6, 2034, (the “ARD”) and a final maturity of September 6, 2037. From and after the ARD, the BJ’s Saratoga Springs Mortgage Loan will bear interest at a rate per annum equal to the sum of the initial interest rate of 7.0300% and 4.0%. The metrics above are calculated based on the ARD. |
| (2) | The requirement to escrow for taxes is waived as long as the tenant lease is in effect and the tenant is timely paying taxes. |
| (3) | The requirement to escrow for insurance is waived as long as the tenant lease is in effect and the tenant provides the insurance coverage required under the lease. |
| (4) | The property is 100.0% occupied by BJ’s Wholesale Club on a single triple net lease with an expiration date of September 30, 2032. The lease features no landlord obligations, a fixed annual rental rate with steps, and the tenant is responsible for all expenses. Given the BJ’s Saratoga Springs Property is subject to a triple net lease, historical cash flows are not available. |
| (5) | The BJ’s Saratoga Springs Property (as defined below) was previously financed via an intercompany loan. |
| (6) | Ladder Capital CRE Equity LLC is also the borrower sponsor for the BJ’s Mooresville Mortgage Loan, Walgreens Millbrook Mortgage Loan, Walgreens Greenwood Mortgage Loan, and Walgreens Palmview Mortgage Loan. |
THE INFORMATION IN THIS STRUCTURAL AND COLLATERAL TERM SHEET IS NOT COMPLETE AND MAY BE AMENDED PRIOR TO THE TIME OF SALE. THIS TERM SHEET IS NOT AN OFFER TO SELL THESE SECURITIES AND IT IS NOT A SOLICITATION OF AN OFFER TO BUY THESE SECURITIES IN ANY JURISDICTION WHERE THE OFFER OR SALE IS NOT PERMITTED. |
| | 156 | |
| Structural and Collateral Term Sheet | | BMO 2024-C8 |
| No. 13 – BJ’s Saratoga Springs |
The Loan. The thirteenth largest mortgage loan (the “BJ’s Saratoga Springs Mortgage Loan”) is evidenced by a single promissory note in the original principal amount of $15,500,000 and is secured by the borrower’s fee interest in a single tenant retail property located in Saratoga Springs, New York (the “BJ’s Saratoga Springs Property”). The BJ’s Saratoga Springs Mortgage Loan will be included in the BMO 2024-C8 securitization trust and represents approximately 2.3% of the Initial Pool Balance. The BJ’s Saratoga Springs Mortgage Loan was originated on March 6, 2024 by Ladder Capital Finance LLC (“LCF”) and proceeds were used to refinance the existing debt and pay closing costs. The BJ’s Saratoga Springs Mortgage Loan has a ten-year term, is interest only for the entire term, and accrues interest at a fixed rate of 7.03000% per annum on an Actual/360 basis. From and after the ARD, the BJ’s Saratoga Springs Mortgage Loan will bear interest at a rate per annum equal to the sum of the initial interest rate of 7.0300% and 4.0% until the final maturity date of September 6, 2037.
The Property. The BJ’s Saratoga Springs Property is a 116,620 square foot retail property located at 3067 Route 50 in Saratoga Springs (Town of Wilton), New York. Built in 1992, the BJ’s Saratoga Springs Property is situated on a 3.74-acre parcel and is 100.0% leased by BJ’s Wholesale Club (“BJ’s”).
Sole Tenant. The BJ’s Saratoga Springs Property is 100.0% occupied by BJ’s pursuant to a 20-year triple net lease that commenced in September 2012 and has a scheduled expiration date of September 30, 2032, with five, five-year renewal options and no termination options.
BJ’s Wholesale Club (116,620 square feet; 100.0% of NRA, 100.0% of underwritten base rent, Moody’s/S&P/Fitch: Ba1/BB+/NR): Founded in 1984 and headquartered in Marlborough, Massachusetts, BJ’s is a warehouse club operator and retailer with 244 clubs and 175 gas stations, located primarily in the eastern United States. BJ’s is a membership-only retailer and has over 7.0 million members as of February 2024. BJ’s annual total revenue was approximately $19.3 billion in its fiscal year ending 2023.
The following table presents certain information relating to the historical occupancy of the BJ’s Saratoga Springs Property:
| Historical and Current Occupancy |
| 2021(1) | 2022(1) | 2023(1) | Current(2) |
| 100.0% | 100.0% | 100.0% | 100.0% |
| (1) | Historical occupancies are as of December 31 for each year. |
| (2) | Current occupancy is based on rent roll as of March 6, 2024. |
The following table presents certain information relating to the sole tenant of the BJ’s Saratoga Springs Property:
| Tenant Summary(1) |
| Tenant | Ratings
Moody’s/S&P/Fitch(2) | Net Rentable Area (SF) | % of
Total NRA | UW Base Rent PSF | UW Base Rent | % of Total
UW Base Rent | Sales PSF/Year(3) | UW Occ. Costs(4) | Lease
Exp. Date |
| BJ’s Wholesale Club | Ba1/BB+/NR | 116,620 | 100.0% | $14.33 | $1,670,717 | 100.0% | | $473 | | 3.0% | | 9/30/2032 |
| Total Occupied | | 116,620 | 100.0% | $14.33 | $1,670,717 | 100.0% | | | | |
| | | | | | | | | | |
| Vacant Space | | 0 | 0.0% | | | | | | |
| | | | | | | | | | |
| Collateral Total | | 116,620 | 100.0% | | | | | | |
| | | | | | | | | | |
| (1) | Based on the underwritten rent roll as of March 6, 2024. |
| (2) | In certain instances, ratings provided are those of the parent company of the entity shown, whether or not the parent company guarantees the lease. |
| (3) | Sales PSF/Year are as of the trailing 12-month period ending December 31, 2022, for BJ’s as provided by the tenant to the borrower. |
| (4) | UW Occ. Costs are based on UW Base Rent and 2022 sales. |
THE INFORMATION IN THIS STRUCTURAL AND COLLATERAL TERM SHEET IS NOT COMPLETE AND MAY BE AMENDED PRIOR TO THE TIME OF SALE. THIS TERM SHEET IS NOT AN OFFER TO SELL THESE SECURITIES AND IT IS NOT A SOLICITATION OF AN OFFER TO BUY THESE SECURITIES IN ANY JURISDICTION WHERE THE OFFER OR SALE IS NOT PERMITTED. |
| | 157 | |
| Structural and Collateral Term Sheet | | BMO 2024-C8 |
| No. 13 – BJ’s Saratoga Springs |
The following table presents certain information relating to the tenant lease expirations at the BJ’s Saratoga Springs Property:
| Lease Rollover Schedule(1) |
| Year | Number of
Leases Expiring | Net
Rentable
Area Expiring | % of NRA
Expiring | UW Base
Rent
Expiring | % of UW
Base Rent
Expiring | Cumulative
Net Rentable
Area Expiring | Cumulative
% of NRA
Expiring | Cumulative
UW Base
Rent
Expiring | Cumulative
% of UW
Base Rent
Expiring |
| Vacant | NAP | 0 | 0.0% | NAP | NAP | | 0 | 0.0% | NAP | NAP |
| 2024 & MTM | 0 | 0 | 0.0 | $0 | 0.0 | % | 0 | 0.0% | $0 | | 0.0 | % |
| 2025 | 0 | 0 | 0.0 | 0 | 0.0 | | 0 | 0.0% | $0 | | 0.0 | % |
| 2026 | 0 | 0 | 0.0 | 0 | 0.0 | | 0 | 0.0% | $0 | | 0.0 | % |
| 2027 | 0 | 0 | 0.0 | 0 | 0.0 | | 0 | 0.0% | $0 | | 0.0 | % |
| 2028 | 0 | 0 | 0.0 | 0 | 0.0 | | 0 | 0.0% | $0 | | 0.0 | % |
| 2029 | 0 | 0 | 0.0 | 0 | 0.0 | | 0 | 0.0% | $0 | | 0.0 | % |
| 2030 | 0 | 0 | 0.0 | 0 | 0.0 | | 0 | 0.0% | $0 | | 0.0 | % |
| 2031 | 0 | 0 | 0.0 | 0 | 0.0 | | 0 | 0.0% | $0 | | 0.0 | % |
| 2032 | 1 | 116,620 | 100.0 | 1,670,717 | 100.0 | | 116,620 | 100.0% | $1,670,717 | | 100.0 | % |
| 2033 | 0 | 0 | 0.0 | 0 | 0.0 | | 116,620 | 100.0% | $1,670,717 | | 100.0 | % |
| 2034 | 0 | 0 | 0.0 | 0 | 0.0 | | 116,620 | 100.0% | $1,670,717 | | 100.0 | % |
| 2035 & Beyond | 0 | 0 | 0.0 | 0 | 0.0 | | 116,620 | 100.0% | $1,670,717 | | 100.0 | % |
| Total | 1 | 116,620 | 100.0% | $1,670,717 | 100.0 | % | | | | |
| (1) | Based on the underwritten rent roll as of March 6, 2024. |
The following table presents certain information relating to the operating history and underwritten cash flows of the BJ’s Saratoga Springs Property:
| Underwritten Net Cash Flow(1)(2) |
| | Underwritten | Per Square Foot | %(4) |
| Base Rent | $1,670,717 | | $14.33 | | 89.2 | % |
| Straight Line Rent(3) | 145,541 | | 1.25 | | 7.8 | |
| Gross Potential Rent | $1,816,258 | | $15.57 | | 97.0 | % |
| Total Reimbursements | 56,173 | | 0.48 | | 3.0 | |
| Effective Gross Income | $1,872,431 | | $16.06 | | 100.0 | % |
| Management Fee | 56,173 | | 0.48 | | 3.0 | |
| Net Operating Income | $1,816,258 | | $15.57 | | 97.0 | % |
| Capital Expenditures | 11,662 | | 0.10 | | 0.6 | |
| Net Cash Flow | $1,804,596 | | $15.47 | | 96.4 | % |
| (1) | Based on the underwritten rent roll as of March 6, 2024. |
| (2) | The BJ’s Saratoga Springs Property is 100.0% occupied by BJ’s Wholesale Club on a single triple net lease with an expiration date of September 30, 2032. The lease features no landlord obligations, a fixed annual rental rate with steps, and the tenant is responsible for all expenses. Given the BJ’s Saratoga Springs Property is subject to a triple net lease, historical cash flows are not available. |
| (3) | Straight Line Rent represents the average of the rent payable by BJ’s over the remaining term of the lease. |
| (4) | % column represents percent of Effective Gross Income. |
THE INFORMATION IN THIS STRUCTURAL AND COLLATERAL TERM SHEET IS NOT COMPLETE AND MAY BE AMENDED PRIOR TO THE TIME OF SALE. THIS TERM SHEET IS NOT AN OFFER TO SELL THESE SECURITIES AND IT IS NOT A SOLICITATION OF AN OFFER TO BUY THESE SECURITIES IN ANY JURISDICTION WHERE THE OFFER OR SALE IS NOT PERMITTED. |
| | 158 | |
| Structural and Collateral Term Sheet | | BMO 2024-C8 |
| No. 13 – BJ’s Saratoga Springs |
The Market. The BJ’s Saratoga Springs Property is located just off Route 50 and a short distance from Interstate 87 in Saratoga Springs (Town of Wilton), New York. The BJ’s Saratoga Springs Property is located in Saratoga County and is part of the Albany-Schenectady-Troy Metropolitan Statistical Area (“Saratoga Springs MSA”), which includes Albany, Rensselaer, Saratoga, Schenectady, and Schoharie Counties. The BJ’s Saratoga Springs Property is located among a cluster of commercial and retail development near intersection of Route 50 and Interstate 87 (Exit 15). Per the appraisal, combined traffic counts total over 12,450 vehicles per day at the BJ’s Saratoga Springs Property. According to the appraisal, BJ’s is situated within the Saratoga Springs MSA’s main commercial and retail thoroughfares and surrounded by multifamily housing. Surrounding commercial uses include buildings occupied by Wal-Mart, Lowes, Aldi’s, Target, Home Depot, Hannaford, Kohls, T.J. Maxx, and Market 32. Wilton Mall is the largest retail use in the neighborhood and is presently anchored by JC Penney, DICK’s Sporting Goods, Saratoga Hospital, Healthy Living, and Home Goods. In addition, there are several freestanding retail buildings in the market, including Walgreens, Speedway, Taco Bell, Adirondack Trust, and 99 Restaurant, as well as Toyota and Subaru dealerships. Overall, the BJ’s Saratoga Springs Property is located along a primary commercial corridor in the Saratoga market and according to brokers active in the market, there is a strong investor demand for triple-net leased assets in the region, with limited properties available for purchase. In recent years, the immediate area west of Interstate 87 has brought a significant influx of multifamily development. Recently completed apartment complexed include The Paddocks of Saratoga, Park Place at Wilton, McGregor Village Apartments, and Saratoga Heritage Apartments. According to the appraisal, within a 1, 3, and 5-mile radius of the BJ’s Saratoga Springs Property, the 2022 average household income was $122,760, $136,402, and $132,685, respectively; and within the same radii, the 2022 estimated population was 3,539, 26,834, and 45,641, respectively. The appraisal noted the Saratoga Springs MSA 2022 median household income as being $80,046 and the United States Census Bureau noted the 2022 State of New York’s median household income as being $81,386. Since 2000, the population and number of households within the Saratoga Springs MSA has increased, and this increasing trend is projected to continue throughout the county through 2027. As a whole, Saratoga County’s projected population and household growth is on track to outpace the Saratoga Springs MSA and state figures through 2027. According to the appraisal, the top three industries within the area are government, educational and health service, and trade, transportation, and public utilities, which represent a combined total 58% of the workforce. The BJ’s Saratoga Springs Property is located within the Saratoga County retail submarket. According to a CoStar report (per the appraisal), as of the fourth quarter of 2023, the Saratoga County retail submarket reported total inventory of approximately 14.6 million square feet with a 97.4% occupancy rate and average asking rent of $16.99 per square foot. Additionally, the Saratoga County submarket asking rent outperforms the overall Saratoga Springs MSA’s figure of $16.25 per square foot.
The following table presents certain market information related to the BJ’s Saratoga Springs Property identified by the appraiser:
| Comparable Sales(1) |
| |
| Property Name | Location | Rentable Area (SF) | Sale Date | Sale Price (PSF) |
| BJ’s Wholesale Club | Gainesville, VA | 76,267 | Dec-2022 | $269 |
| BJ’s Wholesale Club | Summersville, SC | 89,968 | Aug-2022 | $226 |
| BJ’s Wholesale Club & Gas Station | Baltimore, MD | 89,348 | Dec-2021 | $307 |
| BJ’s Wholesale Club & Gas Station | Wallingford, CT | 119,598 | Aug-2021 | $214 |
| BJ’s Wholesale Club | North Dartmouth, MA | 103,680 | Jun-2021 | $378 |
| BJ’s Wholesale Club | Greece, NY | 119,600 | May-2021 | $137 |
| (1) | Source: Appraisal dated April 14, 2023. |
THE INFORMATION IN THIS STRUCTURAL AND COLLATERAL TERM SHEET IS NOT COMPLETE AND MAY BE AMENDED PRIOR TO THE TIME OF SALE. THIS TERM SHEET IS NOT AN OFFER TO SELL THESE SECURITIES AND IT IS NOT A SOLICITATION OF AN OFFER TO BUY THESE SECURITIES IN ANY JURISDICTION WHERE THE OFFER OR SALE IS NOT PERMITTED. |
| | 159 | |
| Structural and Collateral Term Sheet | | BMO 2024-C8 |
| No. 14 – BJ’s Mooresville |
| Mortgage Loan Information | | Property Information |
| Mortgage Loan Seller: | LCF | | Single Asset / Portfolio: | Single Asset |
| Original Principal Balance: | $13,500,000 | | Title: | Fee |
| Cut-off Date Principal Balance: | $13,500,000 | | Property Type – Subtype: | Retail – Single Tenant |
| % of IPB: | 2.0% | | Net Rentable Area (SF): | 108,528 |
| Loan Purpose: | Refinance | | Location: | Mooresville, NC |
| Borrower: | LBW Mooresville LLC | | Year Built / Renovated: | 2000 / NAP |
| Borrower Sponsor(6): | Ladder Capital CRE Equity LLC | | Occupancy: | 100.0% |
| Interest Rate(1): | 7.03000% | | Occupancy Date: | 3/6/2024 |
Note Date: Anticipated Repayment Date(1): | 3/6/2024 3/6/2034 | | 4th Most Recent NOI (As of)(4): | NAV |
| Maturity Date(1): | 9/6/2037 | | 3rd Most Recent NOI (As of)(4): | NAV |
| Interest-only Period(1): | 120 months | | 2nd Most Recent NOI (As of)(4): | NAV |
| Original Term(1): | 120 months | | Most Recent NOI (As of)(4): | NAV |
| Original Amortization Term: | None | | UW Economic Occupancy: | 100.0% |
| Amortization Type: | Interest Only - ARD | | UW Revenues: | $1,633,601 |
| Call Protection: | YM(24),DorYM(89),O(7) | | UW Expenses: | $49,008 |
| Lockbox / Cash Management: | Hard / In Place | | UW NOI: | $1,584,593 |
| Additional Debt: | No | | UW NCF: | $1,573,740 |
| Additional Debt Balance: | N/A | | Appraised Value / Per SF: | $22,000,000 / $203 |
| Additional Debt Type: | N/A | | Appraisal Date: | 3/30/2023 |
| | | | | |
| Escrows and Reserves | | Financial Information |
| | Initial | Monthly | Initial Cap | | Cut-off Date Loan / SF: | $124 |
| Taxes(2): | $0 | Springing | N/A | | Maturity Date Loan / SF(1): | $124 |
| Insurance(3): | $0 | Springing | N/A | | Cut-off Date LTV: | 61.4% |
| Replacement Reserves: | $0 | $0 | N/A | | Maturity Date LTV(1): | 61.4% |
| TI / LC: | $0 | $0 | N/A | | UW NCF DSCR: | 1.64x |
| | | | | | UW NOI Debt Yield: | 11.7% |
| | | | | | | |
| Sources and Uses |
| Sources | Proceeds | % of Total | | Uses | Proceeds | % of Total | |
| Loan Amount | $13,500,000 | 100.0% | | Loan Payoff(5) | $13,469,077 | 99.8 | % |
| | | | | Closing Costs | 30,923 | 0.2 | |
| Total Sources | $13,500,000 | 100.0% | | Total Uses | $13,500,000 | 100.0 | % |
| (1) | The BJ’s Mooresville Mortgage Loan (as defined below) is structured with an anticipated repayment date of March 6, 2034, (the “ARD”) and a final maturity of September 6, 2037. From and after the ARD, the BJ’s Mooresville Mortgage Loan will bear interest at a rate per annum equal to the sum of the applicable interest rate the initial interest rate of 7.0300% and 4.0%. The metrics above are calculated based on the ARD. |
| (2) | The requirement to escrow for taxes is waived as long as the tenant lease is in effect and the tenant is timely paying taxes. |
| (3) | The requirement to escrow for insurance is waived as long as the tenant lease is in effect and the tenant provides the insurance coverage required under the lease. |
| (4) | The property is 100.0% occupied by BJ’s Wholesale Club on a single triple net lease with an expiration date of September 30, 2032. The lease features no landlord obligations, a fixed annual rental rate with rate steps, and the tenant is responsible for all expenses. Given the BJ’s Mooresville Property is subject to a triple net lease, historical cash flows are not applicable. |
| (5) | The BJ’s Mooresville Property (as defined below) was previously financed via an intercompany loan. |
| (6) | Ladder Capital CRE Equity LLC is also the borrower sponsor for the BJ’s Saratoga Springs Mortgage Loan, Walgreens Millbrook Mortgage Loan, Walgreens Greenwood Mortgage Loan, and Walgreens Palmview Mortgage Loan. |
The Loan. The fourteenth largest mortgage loan (the “BJ’s Mooresville Mortgage Loan”) is evidenced by a single promissory note in the original principal amount of $13,500,000 and is secured by the borrower’s fee interest in single tenant retail property located in Mooresville, North Carolina (the “BJ’s Mooresville Property”). The BJ’s Mooresville Mortgage Loan will be included in the BMO 2024-C8 securitization trust and represents approximately 2.0% of the Initial Pool Balance. The BJ’s Mooresville Mortgage Loan was originated on March 6, 2024, by Ladder Capital Finance LLC (“LCF”) and proceeds were used to refinance the existing debt and pay closing costs. The BJ’s Mooresville Mortgage Loan accrues interest at a fixed rate of 7.03000% per annum on an Actual/360 basis. From and after the ARD, the BJ’s Mooresville Mortgage Loan will bear interest at a rate per annum equal to the sum of the initial interest rate of 7.03000% and 4.0% until the final maturity date of September 6, 2037.
THE INFORMATION IN THIS STRUCTURAL AND COLLATERAL TERM SHEET IS NOT COMPLETE AND MAY BE AMENDED PRIOR TO THE TIME OF SALE. THIS TERM SHEET IS NOT AN OFFER TO SELL THESE SECURITIES AND IT IS NOT A SOLICITATION OF AN OFFER TO BUY THESE SECURITIES IN ANY JURISDICTION WHERE THE OFFER OR SALE IS NOT PERMITTED. |
| | 160 | |
| Structural and Collateral Term Sheet | | BMO 2024-C8 |
| No. 14 – BJ’s Mooresville |
The Property. The BJ’s Mooresville Property is a 108,528 square foot retail property located at 141 Gallery Center Drive in Mooresville, North Carolina. Built in 2000, the BJ’s Mooresville Property is situated on a 14.03-acre parcel and is 100.0% leased by BJ's Wholesale Club (“BJ’s”).
Sole Tenant The BJ’s Mooresville Property is 100.0% occupied by BJ’s pursuant to a 20-year triple net lease that commenced in September 2012 and has a scheduled expiration date of September 30, 2032, with five, five-year renewal options and no termination options.
BJ’s Wholesale Club (108,528 square feet; 100.0% of NRA, 100.0% of underwritten base rent, Moody’s/S&P/Fitch: Ba1/BB+/NR): Founded in 1984 and headquartered in Marlborough, Massachusetts, BJ’s is a warehouse club operator and retailer with 244 clubs and 175 gas stations, located primarily in the eastern United States. BJ’s is a membership-only retailer and has over 7.0 million members as of February 2024. BJ’s annual total revenue was approximately $19.3 billion in its fiscal year ending 2023.
The following table presents certain information relating to the historical occupancy of BJ’s Mooresville Property:
| Historical and Current Occupancy |
| 2021(1) | 2022(1) | 2023(1) | Current(2) |
| 100.0% | 100.0% | 100.0% | 100.0% |
| (1) | Historical occupancies are as of December 31 for each year. |
| (2) | Current occupancy is based on rent roll as of March 6, 2024. |
The following table presents certain information relating to the sole tenant of the BJ’s Mooresville Property:
| Tenant Summary(1) |
| Tenant | Ratings
Moody’s/S&P/Fitch(2) | Net Rentable Area (SF) | % of
Total NRA | UW Base Rent PSF | UW Base Rent | % of Total
UW Base Rent | Sales PSF/Year(3) | UW Occ. Costs(4) | Lease
Exp. Date |
| BJ’s Wholesale Club | Ba1/BB+/NR | 108,528 | 100.0% | $13.43 | $1,457,615 | 100.0% | $284 | 4.7% | 9/30/2032 |
| Total Occupied | | 108,528 | 100.0% | $13.43 | $1,457,615 | 100.0% | | | |
| | | | | | | | | | |
| Vacant Space | | 0 | 0.0% | | | | | | |
| | | | | | | | | | |
| Collateral Total | | 108,528 | 100.0% | | | | | | |
| | | | | | | | | | |
| (1) | Based on the underwritten rent roll as of March 6, 2024. |
| (2) | In certain instances, rating provided are those of the parent company of the entity shown, whether or not the parent company guarantees the lease. |
| (3) | Sales PSF/Year are as of the trailing 12-month period ending December 31, 2022, for BJ’s as provided by the tenant to the borrower. |
| (4) | UW Occ. Costs are based on UW Base Rent and 2022 sales. |
THE INFORMATION IN THIS STRUCTURAL AND COLLATERAL TERM SHEET IS NOT COMPLETE AND MAY BE AMENDED PRIOR TO THE TIME OF SALE. THIS TERM SHEET IS NOT AN OFFER TO SELL THESE SECURITIES AND IT IS NOT A SOLICITATION OF AN OFFER TO BUY THESE SECURITIES IN ANY JURISDICTION WHERE THE OFFER OR SALE IS NOT PERMITTED. |
| | 161 | |
| Structural and Collateral Term Sheet | | BMO 2024-C8 |
| No. 14 – BJ’s Mooresville |
The following table presents certain information relating to the tenant lease expirations at the BJ’s Mooresville Property:
| Lease Rollover Schedule(1) |
| Year | Number of Leases Expiring | Net Rentable Area Expiring | % of NRA Expiring | UW Base Rent Expiring | % of UW Base Rent Expiring | Cumulative Net Rentable Area Expiring | Cumulative % of NRA Expiring | Cumulative UW Base Rent Expiring | Cumulative % of UW Base Rent Expiring |
| Vacant | 0 | 0 | 0.0% | NAP | NAP | | 0 | 0.0% | NAP | NAP |
| 2024 & MTM | 0 | 0 | 0.0 | $0 | 0.0 | % | 0 | 0.0% | $0 | 0.0% |
| 2025 | 0 | 0 | 0.0 | 0 | 0.0 | | 0 | 0.0% | $0 | 0.0% |
| 2026 | 0 | 0 | 0.0 | 0 | 0.0 | | 0 | 0.0% | $0 | 0.0% |
| 2027 | 0 | 0 | 0.0 | 0 | 0.0 | | 0 | 0.0% | $0 | 0.0% |
| 2028 | 0 | 0 | 0.0 | 0 | 0.0 | | 0 | 0.0% | $0 | 0.0% |
| 2029 | 0 | 0 | 0.0 | 0 | 0.0 | | 0 | 0.0% | $0 | 0.0% |
| 2030 | 0 | 0 | 0.0 | 0 | 0.0 | | 0 | 0.0% | $0 | 0.0% |
| 2031 | 0 | 0 | 0.0 | 0 | 0.0 | | 0 | 0.0% | $0 | 0.0% |
| 2032 | 1 | 108,528 | 100.0 | 1,457,615 | 100.0 | | 108,528 | 100.0% | $1,457,615 | 100.0% |
| 2033 | 0 | 0 | 0.0 | 0 | 0.0 | | 108,528 | 100.0% | $1,457,615 | 100.0% |
| 2034 | 0 | 0 | 0.0 | 0 | 0.0 | | 108,528 | 100.0% | $1,457,615 | 100.0% |
| 2035 & Beyond | 0 | 0 | 0.0 | 0 | 0.0 | | 108,528 | 100.0% | $1,457,615 | 100.0% |
| Total | 1 | 108,528 | 100.0% | $1,457,615 | 100.0 | % | | | | |
| (1) | Based on the underwritten rent roll as of March 6, 2024. |
The following table presents certain information relating to the underwritten cash flows of the BJ’s Mooresville Property:
| Underwritten Net Cash Flow(1)(2) |
| | Underwritten | Per Square Foot | %(4) | |
| Base Rent | $1,457,615 | $13.43 | 89.2 | % |
| Straight Line Rent(3) | 126,977 | 1.17 | 7.8 | |
| Gross Potential Rent | $1,584,593 | $14.60 | 97.0 | % |
| Total Reimbursements | 49,008 | 0.45 | 3.0 | |
| Effective Gross Income | $1,633,601 | $15.05 | 100.0 | % |
| Management Fee | 49,008 | 0.45 | 3.0 | |
| Net Operating Income | $1,584,593 | $14.60 | 97.0 | % |
| Capital Expenditures | 10,853 | 0.10 | 0.7 | |
| Net Cash Flow | $1,573,740 | $14.50 | 96.3 | % |
| (1) | Based on the underwritten rent roll as of March 6, 2024. |
| (2) | The BJ’s Mooresville Property is 100.0% occupied by BJ’s Wholesale Club on a single triple net lease with an expiration date of September 30, 2032. The lease features no landlord obligations, a fixed annual rental rate with steps, and the tenant is responsible for all expenses. Given the BJ’s Mooresville Property is subject to a triple net lease, historical cash flows are not available. |
| (3) | Straight Line Rent represents the average of the rent payable by BJ’s over the remaining term of the lease. |
| (4) | % column represents percent of Effective Gross Income. |
THE INFORMATION IN THIS STRUCTURAL AND COLLATERAL TERM SHEET IS NOT COMPLETE AND MAY BE AMENDED PRIOR TO THE TIME OF SALE. THIS TERM SHEET IS NOT AN OFFER TO SELL THESE SECURITIES AND IT IS NOT A SOLICITATION OF AN OFFER TO BUY THESE SECURITIES IN ANY JURISDICTION WHERE THE OFFER OR SALE IS NOT PERMITTED. |
| | 162 | |
| Structural and Collateral Term Sheet | | BMO 2024-C8 |
| No. 14 – BJ’s Mooresville |
The Market. The BJ’s Mooresville Property is located along the east side of Bluefield Road, about one-half of a mile northeast of River Highway (NC Highway 150) and the Exit 36 interchange with I-77. Mooresville’s central business district is 1.5 miles east of the subject, while Charlotte’s central business district is about a 30-minute drive to the south. The subject is located in the Charlotte-Concord-Gastonia, NC-SC Metropolitan Statistical Area (“Charlotte-Concord-Gastonia MSA”) and proximate to major regional interstates and highways that allow easy access to all areas of the metro area. It is in an established suburban market situated about one-half of a mile north of the primary commercial corridor in the area and proximate to other commercial/commuter arteries. Mooresville is significantly influenced by its proximity to Charlotte and Lake Norman, reflective of the significant residential and commercial growth over the last two decades. The property also has a fuel facility component which generates traffic to the site. Growth patterns have occurred along primary commercial thoroughfares like River Highway (NC Highway 150), Brawley School Road, and Williamson Road. The majority of larger and newer development is clustered along River Highway, west of I-77, while density decreases, and older uses are found east of I-77 near the subject. The property is surrounded by residential neighborhoods and is near major employment centers including the Lowe’s Home Improvement corporate campus which is about three miles south of the BJ’s Mooresville Property. Commercial development in the neighborhood consists of neighborhood/community shopping centers, national chain restaurants, gas station/convenience stores, small retail businesses and local service businesses, and garden offices, with industrial and institutional uses interspersed throughout. Bluefield Road is just off the primary commercial corridor (NC Highway 150). Surrounding properties are developed with mix of businesses including car dealerships, gas stations, retail shops, storage units, lodging and more. The Charlotte-Concord-Gastonia MSA has a population of 2,767,131 and a median age of 38 with the largest population group in the 30-39 age range and the smallest population in the 80+ age range. The appraiser noted that population has increased by 523,294 since 2010, reflecting an annual increase of 1.8%. Population is projected to increase by 136,569 between 2022 and 2027, reflecting a 1.0% annual population growth. According to the appraisal, the area features an average household income of $106,619 and a median household income of $73,571. The area includes a total of 1,361,397 employees and has a 3.1% unemployment rate. The top three industries within the area are Health Care/ Social Assistance, Retail Trade and Manufacturing, which represents a combined total of 35% of the workforce. Over the next five years, median household income is expected to increase by 17.2%, or $2,536 per annum. Overall, the subject is in a stable trade area that has experienced strong growth in its population and household base and exhibits a broad range of income demographics.
The following table presents certain market information related to the BJ’s Mooresville Property identified by the appraiser:
| Comparable Sales(1) |
| |
| Property Name | Location | Rentable Area (SF) | Sale Date | Sale Price (PSF) |
| BJ’s Wholesale Club | Orange Park, FL | 109,895 | Mar-2023 | $176 |
| BJ’s Wholesale Club | Gainesville, VA | 76,267 | Dec-2022 | $269 |
| BJ’s Wholesale Club | Summerville, SC | 89,968 | Aug-2022 | $226 |
| BJ’s Wholesale Club & Gas Station | Baltimore, MD | 89,348 | Dec-2021 | $307 |
| BJ’s Wholesale Club | Easton, MD | 63,036 | Jul-2020 | $202 |
| | | | | |
| | (1) | Source: Appraisal dated April 18, 2024. |
THE INFORMATION IN THIS STRUCTURAL AND COLLATERAL TERM SHEET IS NOT COMPLETE AND MAY BE AMENDED PRIOR TO THE TIME OF SALE. THIS TERM SHEET IS NOT AN OFFER TO SELL THESE SECURITIES AND IT IS NOT A SOLICITATION OF AN OFFER TO BUY THESE SECURITIES IN ANY JURISDICTION WHERE THE OFFER OR SALE IS NOT PERMITTED. |
| | 163 | |
| Structural and Collateral Term Sheet | | BMO 2024-C8 |
| No. 15 – Contour Windows Industrial |
| Mortgage Loan Information | | Property Information |
| Mortgage Loan Seller: | BMO | | Single Asset / Portfolio: | Single Asset |
| Original Principal Balance: | $12,000,000 | | Title: | Fee |
| Cut-off Date Principal Balance: | $12,000,000 | | Property Type – Subtype: | Industrial – Manufacturing |
| % of IPB: | 1.8% | | Net Rentable Area (SF): | 360,000 |
| Loan Purpose: | Refinance | | Location: | Central, SC |
| Borrower: | Central Development Associates LLC | | Year Built / Renovated: | 1950 / 2024 |
| Borrower Sponsor: | David Dedvukaj | | Occupancy: | 100.0% |
| Interest Rate: | 7.10000% | | Occupancy Date: | 3/5/2024 |
| Note Date: | 3/5/2024 | | 4th Most Recent NOI (As of)(1): | NAV |
| Maturity Date: | 3/6/2034 | | 3rd Most Recent NOI (As of)(1): | NAV |
| Interest-only Period: | 36 months | | 2nd Most Recent NOI (As of)(1): | NAV |
| Original Term: | 120 months | | Most Recent NOI (As of)(1): | NAV |
| Original Amortization Term: | 360 months | | UW Economic Occupancy: | 95.0% |
| Amortization Type: | Interest Only, Amortizing Balloon | | UW Revenues(2): | $2,106,414 |
| Call Protection: | L(24),D(91),O(5) | | UW Expenses(2): | $543,278 |
| Lockbox / Cash Management: | Hard / Springing | | UW NOI(2): | $1,563,136 |
| Additional Debt: | No | | UW NCF(2): | $1,419,136 |
| Additional Debt Balance: | N/A | | Appraised Value / Per SF(3): | $18,350,000 / $51 |
| Additional Debt Type: | N/A | | Appraisal Date(3): | 5/15/2024 |
| | | | | |
| | | | | |
| Escrows and Reserves | | Financial Information |
| | Initial | Monthly | Initial Cap | | Cut-off Date Loan / SF: | $33 |
| Taxes: | $4,789 | $1,596 | N/A | | Maturity Date Loan / SF: | $31 |
| Insurance: | $38,801 | Springing | N/A | | Cut-off Date LTV(3): | 65.4% |
| CapEx: | $0 | $3,000 | N/A | | Maturity Date LTV(3): | 60.3% |
| TI/LC Reserve: | $0 | Springing | N/A | | UW NCF DSCR(2): | 1.47x |
| Other(4): | $81,875 | $0 | N/A | | UW NOI Debt Yield(2): | 13.0% |
| | | | | | | |
| Sources and Uses |
| Sources | Proceeds | % of Total | | Uses | Proceeds | % of Total | |
| Mortgage Loan | $12,000,000 | 100.0% | | Loan Payoff | $8,553,949 | 71.3 | % | |
| | | | | Return of Equity | 2,479,571 | 20.7 | | |
| | | | | Closing Costs | 841,014 | 7.0 | | |
| | | | | Upfront Reserves | 125,466 | 1.0 | | |
| Total Sources | $12,000,000 | 100.0% | | Total Uses | $12,000,000 | 100.0 | % | |
| (1) | Historical financial information is unavailable because the Contour Windows Industrial Property was acquired in 2022 and underwent renovations through 2024. |
| (2) | The information regarding the underwritten cash flow was calculated using (i) the 15-year absolute triple net lease signed by the sole tenant that is an affiliate of the borrower with a lease start date of January 1, 2024 for income and (ii) the appraisal for assumed expenses. |
| (3) | The Appraised Value / Per SF, Appraisal Date, Cut-off Date LTV and Maturity Date LTV are based on the appraiser’s “prospective value upon completion” value of $18,350,000 as of May 15, 2024, which assumes that the improvements at the mortgaged property have been completed and that the mortgaged property is occupied to a point of economic stabilization and market occupancy by May 15, 2024. It is also assumed that the final version of the fee in lieu of taxes (“FILOT”) agreement will not have any material changes from what has been disclosed in the appraisal and that it will be ratified by Pickens County, South Carolina. The “as-is” appraised value of the mortgaged property as of February 16, 2024 was $18,100,000, which would result in a Cut-off Date LTV and Maturity Date LTV of 66.3% and 61.1%, respectively. |
| (4) | Other initial reserve represents the environmental reserve. |
The Loan. The fifteenth largest mortgage loan (the “Contour Windows Industrial Mortgage Loan”) has an outstanding balance as of the Cut-off Date of $12,000,000, which is secured by a first mortgage encumbering the borrower’s fee interest in a 360,000 square foot, industrial manufacturing facility in Central, South Carolina (the “Contour Windows Industrial Property”). The Contour Windows Industrial Mortgage Loan was originated on March 5, 2024 by Bank of Montreal (“BMO”) and accrues interest at a fixed rate of 7.10000% per annum. The Contour Windows Industrial Mortgage Loan has an initial term of ten-years and is interest-only for the first 36 months then amortizing on a 360-month schedule for the remainder of the
THE INFORMATION IN THIS STRUCTURAL AND COLLATERAL TERM SHEET IS NOT COMPLETE AND MAY BE AMENDED PRIOR TO THE TIME OF SALE. THIS TERM SHEET IS NOT AN OFFER TO SELL THESE SECURITIES AND IT IS NOT A SOLICITATION OF AN OFFER TO BUY THESE SECURITIES IN ANY JURISDICTION WHERE THE OFFER OR SALE IS NOT PERMITTED. |
| | 164 | |
| Structural and Collateral Term Sheet | | BMO 2024-C8 |
| No. 15 – Contour Windows Industrial |
term. The scheduled maturity date of the Contour Windows Industrial Mortgage Loan is the payment date that occurs on March 6, 2034.
The Property. The Contour Windows Industrial Property is a 360,000 square foot, industrial manufacturing facility located in Central, South Carolina. Central is approximately four miles northeast of Clemson, 12 miles west of Easley and 20 miles west of Greenville, South Carolina with primary access via U.S. Routes 76 and 123 and State Route 93. The Contour Windows Industrial Property was built in 1950 and renovated in 2024. The Contour Windows Industrial Property features 26’ clear heights, 16 dock-high doors and one grade door. The Contour Windows Industrial Property spans three single-story buildings situated on an approximately 18.38-acre site, and leased to a single tenant.
As of March 5, 2024, the Contour Windows Industrial Property was 100.0% occupied by Contour Windows-SC, Inc. (“Contour Windows”), an affiliate of the borrower.
Sole Tenant. Contour Windows was founded in 1992 as Vinyl Tech and has since rebranded and expanded under the name Contour Windows. Contour Windows is a custom vinyl window manufacturer that specializes in new constructions, replacements, commercial and residential purposes. Contour Windows utilizes high-tech robotics and cleaning technology to ensure a more accurate, clean, and consistent product than conventional methods provide. With over 30 years of experience, Contour Windows has completed 5,000 projects and currently has 200 staff members. The Contour Windows lease commenced on January 1, 2024 and has a term of 15 years with no renewal or termination options.
Environmental. The Phase I environmental assessment at the Contour Windows Industrial Property dated as of December 4, 2023 identified three recognized environmental conditions related to the following: (i) a historical industrial use at the Contour Windows Industrial Property that likely included the use of hazardous substances and/or petroleum products from the 1950s to the early 2000s, (ii) the former presence of a heating oil underground storage tank for which no closure documentation is available and (iii) the presence of several drums containing hazardous substances and/or petroleum products at a former chemical storage building. The Contour Windows Industrial Mortgage Loan documents require the borrower to complete the required environmental remediation. An environmental reserve equal to $81,875 was established at origination for required environmental remediation. See “Preliminary Prospectus—Description of the Mortgage Pool—Environmental Considerations”.
The following table presents certain information relating to the historical and current occupancy of the Contour Windows Industrial Property:
| Historical and Current Occupancy(1) |
| 2021 | 2022 | 2023 | Current(2) |
| NAV | NAV | NAV | 100.0% |
| (1) | Historical occupancy is unavailable as the Contour Windows Industrial Property was acquired in 2022 and underwent renovations through 2024. |
| (2) | Based on the underwritten rent roll dated as of March 5, 2024. The Contour Windows Industrial Property is 100% occupied by Contour Windows, an affiliate of the borrower. |
The following table presents certain information relating to the sole tenant at the Contour Windows Industrial Property based on underwritten base rent:
| Tenant Summary(1) |
| Tenant | Ratings Moody’s/S&P/Fitch | Net Rentable Area (SF) | % of Total NRA | UW Base Rent PSF | UW Base Rent | % of Total UW Base Rent | Lease Expiration Date |
| Contour Windows(2) | NR/NR/NR | 360,000 | 100.0% | $4.65 | $1,674,000 | 100.0% | 12/31/2038 |
| Total Occupied | | 360,000 | 100.0% | $4.65 | $1,674,000 | 100.0% | |
| Vacant Space | | 0 | 0.0% | | | | |
| Total / Wtd. Avg. | | 360,000 | 100.0% | | | | |
| | | | | | | | |
| (1) | Based on the underwritten rent roll dated March 5, 2024. |
| (2) | The sole tenant is an affiliate of the borrower. |
THE INFORMATION IN THIS STRUCTURAL AND COLLATERAL TERM SHEET IS NOT COMPLETE AND MAY BE AMENDED PRIOR TO THE TIME OF SALE. THIS TERM SHEET IS NOT AN OFFER TO SELL THESE SECURITIES AND IT IS NOT A SOLICITATION OF AN OFFER TO BUY THESE SECURITIES IN ANY JURISDICTION WHERE THE OFFER OR SALE IS NOT PERMITTED. |
| | 165 | |
| Structural and Collateral Term Sheet | | BMO 2024-C8 |
| No. 15 – Contour Windows Industrial |
The following table presents certain information relating to the lease expiration date for the sole tenant at the Contour Windows Industrial Property:
| Lease Rollover Schedule(1) |
Year | Number of Leases Expiring | Net Rentable Area Expiring | % of Net Rental Area Expiring | UW Base Rent Expiring | % of UW Base Rent Expiring | Cumulative Net Rentable Area Expiring | Cumulative % of NRA Expiring | Cumulative UW Base Rent Expiring | Cumulative % of UW Base Rent Expiring |
| Vacant | NAP | 0 | 0.0% | | NAP | NAP | 0 | 0.0% | | NAP | | NAP | |
| 2024 & MTM | 0 | 0 | 0.0 | | $0 | 0.0% | 0 | 0.0% | | $0 | | 0.0% | |
| 2025 | 0 | 0 | 0.0 | | 0 | 0.0 | 0 | 0.0% | | $0 | | 0.0% | |
| 2026 | 0 | 0 | 0.0 | | 0 | 0.0 | 0 | 0.0% | | $0 | | 0.0% | |
| 2027 | 0 | 0 | 0.0 | | 0 | 0.0 | 0 | 0.0% | | $0 | | 0.0% | |
| 2028 | 0 | 0 | 0.0 | | 0 | 0.0 | 0 | 0.0% | | $0 | | 0.0% | |
| 2029 | 0 | 0 | 0.0 | | 0 | 0.0 | 0 | 0.0% | | $0 | | 0.0% | |
| 2030 | 0 | 0 | 0.0 | | 0 | 0.0 | 0 | 0.0% | | $0 | | 0.0% | |
| 2031 | 0 | 0 | 0.0 | | 0 | 0.0 | 0 | 0.0% | | $0 | | 0.0% | |
| 2032 | 0 | 0 | 0.0 | | 0 | 0.0 | 0 | 0.0% | | $0 | | 0.0% | |
| 2033 | 0 | 0 | 0.0 | | 0 | 0.0 | 0 | 0.0% | | $0 | | 0.0% | |
| 2034 | 0 | 0 | 0.0 | | 0 | 0.0 | 0 | 0.0% | | $0 | | 0.0% | |
| 2035 & Beyond | 1 | 360,000 | 100.0 | | 1,674,000 | 100.0 | 360,000 | 100.0% | | $1,674,000 | | 100.0% | |
| Total | 1 | 360,000 | 100.0 | % | $1,674,000 | 100.0% | | | | |
| (1) | Based on the underwritten rent roll dated March 5, 2024. The tenant has no early termination options. |
The following table presents certain information relating to the underwritten cash flows of the Contour Windows Industrial Property:
| Underwritten Net Cash Flow |
| | Underwritten | Per Square Foot | %(1) |
| Rents in Place(2) | $1,674,000 | $4.65 | 75.5 | % |
| Gross Potential Rent | $1,674,000 | $4.65 | 75.5 | % |
| Total Reimbursements(2) | 543,278 | 1.51 | 24.5 | |
| Net Rental Income | $2,217,278 | $6.16 | 100.0 | % |
| (Vacancy/Credit Loss) | (110,864) | (0.31) | (5.0 | ) |
| Effective Gross Income | $2,106,414 | $5.85 | 95.0 | % |
| Real Estate Taxes | 288,572 | 0.80 | 13.7 | |
| Insurance | 40,313 | 0.11 | 1.9 | |
| Management Fee | 63,192 | 0.18 | 3.0 | |
| Other Operating Expenses | 151,200 | 0.42 | 7.2 | |
| Total Expenses(3) | $543,278 | $1.51 | 25.8 | % |
| Net Operating Income | $1,563,136 | $4.34 | 74.2 | % |
| Replacement Reserves | 36,000 | 0.10 | 1.7 | |
| TI/LC | 108,000 | 0.30 | 5.1 | |
| Net Cash Flow | $1,419,136 | $3.94 | 67.4 | % |
| (1) | % column represents percent of Net Rental Income for all revenue fields and represents percent of Effective Gross Income for the remainder of fields. |
| (2) | Based on underwritten rent roll dated March 5, 2024 and the 15-year absolute triple net lease signed by the sole tenant that is an affiliate of the borrower with a lease start date of January 1, 2024. |
| (3) | Total Expenses were underwritten to the assumed expenses in the appraisal. |
THE INFORMATION IN THIS STRUCTURAL AND COLLATERAL TERM SHEET IS NOT COMPLETE AND MAY BE AMENDED PRIOR TO THE TIME OF SALE. THIS TERM SHEET IS NOT AN OFFER TO SELL THESE SECURITIES AND IT IS NOT A SOLICITATION OF AN OFFER TO BUY THESE SECURITIES IN ANY JURISDICTION WHERE THE OFFER OR SALE IS NOT PERMITTED. |
| | 166 | |
| Structural and Collateral Term Sheet | | BMO 2024-C8 |
| No. 15 – Contour Windows Industrial |
The Market. The Contour Windows Industrial Property is located in Central, South Carolina, in Pickens County which is approximately 145 miles north of Atlanta, Georgia, and 92 miles west of Charlotte, North Carolina, and is a part of the Greenville-Anderson metro area (“Greenville-Anderson MSA”). According to the appraisal, Contour Windows Industrial Property has a strategic location near economic hubs, with convenient connections to well-traveled transportation networks. The Contour Windows Industrial Property is also located 4 miles from Clemson University and is located in a stable economy supported by the university, residential, and retail sectors.
According to the appraisal, the Contour Windows Industrial Property is located within the Outlying Pickens County Industrial submarket of the Greenville-Anderson MSA. As of December 31, 2023, the Outlying Pickens County Industrial submarket had inventory of 7,077,493 square feet, a vacancy rate of 5.4% and average asking rent of $4.73 per square foot.
According to the appraisal, the 2022 population within a one-, three- and five-mile radius of the Contour Windows Industrial Property was 4,088, 20,325 and 43,439, respectively. The 2022 median household income within the same radii was $24,654, $45,058, and $47,127, respectively.
The following table presents certain information relating to comparable industrial leases for the Contour Windows Industrial Property:
| Comparable Rental Summary(1) |
| Property Name/Location | Year Built / Renovated | NRA (SF) | Tenant Name | Lease Size (SF) | Rent PSF | Commencement | Lease Term (Years) | Lease Type |
Contour Windows Industrial Property 365 Mauldin Road Central, SC | 1950 / 2024 | 360,000(2) | Contour Windows(2) | 360,000(2) | $4.65(2) | Jan-24(2) | 15.0(2) | NNN(2) |
Clipper Road – Industrial 1150 Clipper Road Sumter, SC | 1974 / NAP | 341,891 | Solar4America and SEM Wafertech, Inc. | 272,561 | $3.50 | Sep-23 | 15.0 | NNN |
1030 Metso Way Industrial Columbia 1030 Metso Way Columbia, SC | 1969 / NAP | 244,945 | Metso Outotec | 244,945 | $3.65 | May-23 | 3.0 | NNN |
Distribution 913 Airport Road Salisbury, NC | 1979 / NAP | 288,000 | Confidential | 288,000 | $3.75 | Jul-22 | 5.0 | NNN |
3309 Laurens Road – Building C 3309 Laurens Road Greenville, SC | 1972 / 2001 | 176,000 | American Plastics | 150,000 | $4.85 | Jun-22 | 5.0 | NNN |
130 Commerce 130 Commerce Center Greenville, SC | 1983 / 2005 | 320,427 | Bostik, Inc | 132,530 | $3.60 | Mar-22 | 11.0 | NNN |
111 Southchase Blvd - Warehouse 111 Southchase Boulevard Fountain Inn, SC | 1989 / 2007 | 168,087 | Grainger | 168,087 | $4.90 | Jan-22 | 4.0 | NNN |
| (1) | Information obtained from the appraisal unless otherwise indicated. |
| (2) | Based on the underwritten rent roll dated as of March 5, 2024. |
THE INFORMATION IN THIS STRUCTURAL AND COLLATERAL TERM SHEET IS NOT COMPLETE AND MAY BE AMENDED PRIOR TO THE TIME OF SALE. THIS TERM SHEET IS NOT AN OFFER TO SELL THESE SECURITIES AND IT IS NOT A SOLICITATION OF AN OFFER TO BUY THESE SECURITIES IN ANY JURISDICTION WHERE THE OFFER OR SALE IS NOT PERMITTED. |
| | 167 | |
| Structural and Collateral Term Sheet | | BMO 2024-C8 |
| Contacts |
| BMO Capital Markets CMBS Capital Markets & Banking |
| Contact | E-mail | Phone Number |
| Paul Vanderslice | paul.vanderslice@bmo.com | (917) 996-4514 |
| Managing Director | | |
| | | |
| David Schell | david.schell@bmo.com | (347) 996-0721 |
| Managing Director | | |
| | | |
| Ravish Kamath | ravish.kamath@bmo.com | (347) 668-1507 |
| Director | | |
| | | |
| BMO Capital Markets CMBS Trading & Structuring |
| Contact | E-Mail | Phone Number |
| Andrew Noonan | andrew.noonan@bmo.com | (347) 466-3147 |
| Managing Director | | |
| | | |
| Mary Kunka | mary.kunka@bmo.com | (347) 956-1226 |
| Managing Director | | |
| | | |
| Kiran Manda | kiran.manda@bmo.com | (347) 831-4776 |
| Managing Director | | |
| | | |
| Michael Chen | lei4.chen@bmo.com | (646) 265-0023 |
| Director | | |
| | | |
| BMO Capital Markets Securitized Products Syndicate |
| Contact | E-Mail | Phone Number |
| Alex Smith-Constantine | alex.smithconstantine@bmo.com | (212) 702-1866 |
| Managing Director | | |
| | | |
| Trinian Donohoe | trinian.donohoe@bmo.com | (212) 702-1866 |
| Vice President | | |
| | | |
| Citigroup CMBS Capital Markets and Securitization | |
| Contact | Contact | Contact |
| Rick Simpson | richard.simpson@citi.com | (212) 816-5343 |
| Managing Director | | |
| | | |
| Jason Mercandetti | jason.mercandetti@citi.com | (212) 816-6384 |
| Director | | |
| | | |
| Citigroup Structuring, Trading & Syndicate | |
| Contact | E-Mail | Phone Number |
| Raul Orozco | raul.d.orozco@citi.com | (212) 723-1295 |
| Managing Director | | |
| | | |
| Matt Perry | mattison.perry@citi.com | (212) 723-1295 |
| Director | | |
| | | |
| Deutsche Bank Securities Banking | |
| Contact | Contact | Contact |
| Lainie Kaye | lainie.kaye@db.com | (212) 250-5270 |
| Managing Director | | |
| | | |
| Michael Miller | michael.miller@db.com | (212) 250-0099 |
| Vice President | | |
| | | |
| Sam Lockwood | sam.lockwood@db.com | (212) 250-4569 |
| Vice President | | |
|
THE INFORMATION IN THIS STRUCTURAL AND COLLATERAL TERM SHEET IS NOT COMPLETE AND MAY BE AMENDED PRIOR TO THE TIME OF SALE. THIS TERM SHEET IS NOT AN OFFER TO SELL THESE SECURITIES AND IT IS NOT A SOLICITATION OF AN OFFER TO BUY THESE SECURITIES IN ANY JURISDICTION WHERE THE OFFER OR SALE IS NOT PERMITTED. |
| | 168 | |
| Structural and Collateral Term Sheet | | BMO 2024-C8 |
| Contacts |
| Deutsche Bank Securities Trading & Structuring | |
| Contact | Contact | Contact |
| Shaishav Agarwal | shaishav.agarwal@db.com | (212) 250-6290 |
| Managing Director | | |
| | | |
| Dan Penn | daniel.penn@db.com | (212) 250-5149 |
| Managing Director | | |
| | | |
| Matt Smith | matt-t.smith@db.com | (212) 250-6155 |
| Director | | |
| | | |
| Ryan Horvath | ryan.horvath@db.com | (212) 250-5149 |
| Director | | |
| | | |
| Goldman Sachs Real Estate Financing Group - Securitization |
| Contact | E-Mail | Phone Number |
| Scott Epperson | scott.epperson@gs.com | (212) 934-2882 |
| Managing Director | | |
| | | |
| Justin Peterson | justin.peterson@gs.com | (212) 902-4283 |
| Vice President | | |
| | | |
| Raymond Todd | raymond.todd@gs.com | (972) 501-3979 |
| Vice President | | |
| | | |
| Goldman Sachs Real Estate Financing Group - Capital Markets |
| Contact | E-Mail | Phone Number |
| Nitin Jagga | nitin.jagga@gs.com | (212) 855-9035 |
| Vice President | | |
| | | |
| Rebecca Bayard | rebecca.bayard@gs.com | (212) 934-0848 |
| Vice President | | |
| | | |
| | | |
| Goldman Sachs Syndicate & Structuring |
| Contact | E-Mail | Phone Number |
| Scott Walter | scott.walter@gs.com | (212) 357-8910 |
| Managing Director | | |
| | | |
| Lisa Schexnayder | lisa.schexnayder@gs.com | (212) 902-2330 |
| Vice President | | |
| | | |
| Wenfei Liu | wenfei.liu@gs.com | (212) 357-0433 |
| Vice President | | |
| | | |
| Morgan Stanley Capital Market - Securitization |
| Contact | E-Mail | Phone Number |
| Jane Lam | jane.lam@morganstanley.com | (212) 761-3507 |
| Managing Director | | |
| | | |
| Jared Smith | jared.smith@morganstanley.com | (212) 761-3075 |
| Vice President | | |
| | | |
| Liya Podokshik | liya.podokshik@morganstanley.com | (212) 761-1943 |
| Vice President | | |
| | | |
| | | |
| | | |
| | | |
| | | |
| | | |
| | | |
THE INFORMATION IN THIS STRUCTURAL AND COLLATERAL TERM SHEET IS NOT COMPLETE AND MAY BE AMENDED PRIOR TO THE TIME OF SALE. THIS TERM SHEET IS NOT AN OFFER TO SELL THESE SECURITIES AND IT IS NOT A SOLICITATION OF AN OFFER TO BUY THESE SECURITIES IN ANY JURISDICTION WHERE THE OFFER OR SALE IS NOT PERMITTED. |
| | 169 | |
| Structural and Collateral Term Sheet | | BMO 2024-C8 |
| Contacts |
| Morgan Stanley Capital Market - Securitization |
| Contact | E-Mail | Phone Number |
| Nishant Kapur | nishant.kapur@morganstanley.com | (212) 761-1483 |
| Executive Director | | |
| | | |
| Newland Baldwin | newland.baldwin@morganstanley.com | (212) 761-7265 |
| Executive Director | | |
| | | |
| Jas Singh | jas.singh@morganstanley.com | (212) 761-9099 |
| Vice President | | |
| | | |
| Charlie Bushnell | charlie.bushnell@morganstanley.com | (212) 761-7534 |
| Vice President | | |
| | | |
| UBS CMBS Capital Markets and Banking | | |
| Contact | E-Mail | Phone Number |
| Nicholas Galeone | nicholas.galeone@ubs.com | (212) 713-8832 |
| Managing Director | | |
| | | |
| Siho Ham | siho.ham@ubs.com | (212) 713-1278 |
| Managing Director | | |
| | | |
| Michael Barbieri | michael.barbieri@ubs.com | (212) 713-1181 |
| Executive Director | | |
| | | |
| UBS CMBS Trading and Syndicate | | |
| Contact | E-Mail | Phone Number |
| Jared Randall | jared.randall@ubs.com | (212) 713-8568 |
| Executive Director | | |
| | | |
| | | |
| | | |
| | | |
THE INFORMATION IN THIS STRUCTURAL AND COLLATERAL TERM SHEET IS NOT COMPLETE AND MAY BE AMENDED PRIOR TO THE TIME OF SALE. THIS TERM SHEET IS NOT AN OFFER TO SELL THESE SECURITIES AND IT IS NOT A SOLICITATION OF AN OFFER TO BUY THESE SECURITIES IN ANY JURISDICTION WHERE THE OFFER OR SALE IS NOT PERMITTED. |
| | 170 | |