| | | FREE WRITING PROSPECTUS |
| | | FILED PURSUANT TO RULE 433 |
| | | REGISTRATION FILE NO.: 333-255934-12 |
| Dated April 19, 2024 | BMO 2024-5C4 |
| Structural and Collateral Term Sheet |
BMO 2024-5C4 Mortgage Trust |
$862,941,672 (Approximate Mortgage Pool Balance) |
| |
$785,276,000 (Approximate Offered Certificates) |
| |
BMO Commercial Mortgage Securities LLC Depositor |
| |
Commercial Mortgage Pass-Through Certificates, SERIES 2024-5C4 |
| |
|
Bank of Montreal Argentic Real Estate Finance 2 LLC Wells Fargo Bank, National Association Starwood Mortgage Capital LLC Citi Real Estate Funding Inc. Goldman Sachs Mortgage Company LMF Commercial, LLC UBS AG German American Capital Corporation Sponsors and Mortgage Loan Sellers |
BMO Capital
Markets | Citigroup | Goldman Sachs &
Co. LLC | Deutsche
Bank
Securities | UBS
Securities
LLC | Wells Fargo
Securities |
| Co-Lead Managers and Joint Bookrunners |
Academy Securities
Co-Manager | Bancroft Capital, LLC
Co-Manager | Drexel Hamilton
Co-Manager |
THE INFORMATION IN THIS STRUCTURAL AND COLLATERAL TERM SHEET IS NOT COMPLETE AND MAY BE AMENDED PRIOR TO THE TIME OF SALE. THIS TERM SHEET IS NOT AN OFFER TO SELL THESE SECURITIES AND IT IS NOT A SOLICITATION OF AN OFFER TO BUY THESE SECURITIES IN ANY JURISDICTION WHERE THE OFFER OR SALE IS NOT PERMITTED. |
| | | |
| Dated April 19, 2024 | BMO 2024-5C4 |
This material is for your information, and none of BMO Capital Markets Corp., Wells Fargo Securities, LLC, Citigroup Global Markets Inc., Goldman Sachs & Co. LLC, Deutsche Bank Securities Inc., UBS Securities LLC, Academy Securities, Inc., Bancroft Capital, LLC and Drexel Hamilton, LLC (collectively, the “Underwriters”) are soliciting any action based upon it. This material is not to be construed as an offer to sell or the solicitation of any offer to buy any security in any jurisdiction where such an offer or solicitation would be illegal.
The depositor has filed a registration statement (including the prospectus) with the Securities and Exchange Commission (File No. 333-255934) for the offering to which this communication relates. Before you invest, you should read the prospectus in the registration statement and other documents the depositor has filed with the Securities and Exchange Commission for more complete information about the depositor, the issuing entity and this offering. You may get these documents for free by visiting EDGAR on the SEC website at www.sec.gov. Alternatively, the depositor or BMO Capital Markets Corp., any other underwriter, or any dealer participating in this offering will arrange to send you the prospectus if you request it by calling 1-866-864-7760. The Offered Certificates referred to in these materials, and the asset pool backing them, are subject to modification or revision (including the possibility that one or more Classes of Certificates may be split, combined or eliminated at any time prior to issuance or availability of a final prospectus) and are offered on a “when, as and if issued” basis. You understand that, when you are considering the purchase of these Certificates, a contract of sale will come into being no sooner than the date on which the relevant Class has been priced and we have verified the allocation of Certificates to be made to you; any “indications of interest” expressed by you, and any “soft circles” generated by us, will not create binding contractual obligations for you or us.
Neither this document nor anything contained in this document shall form the basis for any contract or commitment whatsoever. The information contained in this document is preliminary as of the date of this document, supersedes any previous such information delivered to you and will be superseded by any such information subsequently delivered prior to the time of sale. These materials are subject to change, completion or amendment from time to time. The information should be reviewed only in conjunction with the entire offering document relating to the Commercial Mortgage Pass-Through Certificates, Series 2024-5C4 (the “Offering Document”). All of the information contained herein is subject to the same limitations and qualifications contained in the Offering Document. The information contained herein does not contain all relevant information relating to the underlying mortgage loans or mortgaged properties. Such information is described elsewhere in the Offering Document. The information contained herein will be more fully described elsewhere in the Offering Document. The information contained herein should not be viewed as projections, forecasts, predictions or opinions with respect to value. Prior to making any investment decision, prospective investors are strongly urged to read the Offering Document its entirety. Neither the Securities and Exchange Commission nor any state securities commission has approved or disapproved of these securities or determined if this free writing prospectus is truthful or complete. Any representation to the contrary is a criminal offense.
This document has been prepared by the Underwriters for information purposes only and does not constitute, in whole or in part, a prospectus for the purposes of Regulation (EU) 2017/1129 (as amended or superseded) and/or Part VI of the Financial Services and Markets Act 2000 (as amended) or other offering document.
The attached information contains certain tables and other statistical analyses (the “Computational Materials”) which have been prepared in reliance upon information furnished by the Mortgage Loan Sellers. Numerous assumptions were used in preparing the Computational Materials, which may or may not be reflected herein. As such, no assurance can be given as to the Computational Materials’ accuracy, appropriateness or completeness in any particular context; or as to whether the Computational Materials and/or the assumptions upon which they are based reflect present market conditions or future market performance. The Computational Materials should not be construed as either projections or predictions or as legal, tax, financial or accounting advice. You should consult your own counsel, accountant and other advisors as to the legal, tax, business, financial and related aspects of a purchase of these Certificates. Any weighted average lives, yields and principal payment periods shown in the Computational Materials are based on prepayment and/or loss assumptions, and changes in such prepayment and/or loss assumptions may dramatically affect such weighted average lives, yields and principal payment periods. In addition, it is possible that prepayments or losses on the underlying assets will occur at rates higher or lower than the rates shown in the attached Computational Materials. The specific characteristics of the Certificates may differ from those shown in the Computational Materials due to differences between the final underlying assets and the preliminary underlying assets used in preparing the Computational Materials. The principal amount and designation of any security described in the Computational Materials are subject to change prior to issuance. None of the Underwriters or any of their respective affiliates make any representation or warranty as to the actual rate or timing of payments or losses on any of the underlying assets or the payments or yield on the Certificates. The information in this presentation is based upon management forecasts and reflects prevailing conditions and management’s views as of this date, all of which are subject to change. In preparing this presentation, we have relied upon and assumed, without independent verification, the accuracy and completeness of all information available from public sources or which was provided to us by or on behalf of the Mortgage Loan Sellers or which was otherwise reviewed by us.
This document contains forward-looking statements. If and when included in this document, the words “expects”, “intends”, “anticipates”, “estimates” and analogous expressions and all statements that are not historical facts, including statements about our beliefs or expectations, are intended to identify forward-looking statements. Any forward-looking statements are made subject to risks and uncertainties which could cause actual results to differ materially from those stated. Those risks and uncertainties include, among other things, declines in general economic and business conditions, increased competition, changes in demographics, changes in political and social conditions, regulatory initiatives and changes in consumer preferences, many of which are beyond our control and the control of any other person or entity related to this offering. The forward-looking statements made in this document are made as of the date hereof. We have no obligation to update or revise any forward-looking statement.
BMO Capital Markets is a trade name used by BMO Financial Group for the wholesale banking businesses of Bank of Montreal, BMO Harris Bank N.A. (member FDIC), Bank of Montreal Europe p.l.c, and Bank of Montreal (China) Co. Ltd, the institutional broker dealer business of BMO Capital Markets Corp. (Member FINRA and SIPC) and the agency broker dealer business of Clearpool Execution Services, LLC (Member FINRA and SIPC) in the U.S., and the institutional broker dealer businesses of BMO Nesbitt Burns Inc. (Member Investment Industry Regulatory Organization of Canada and Member Canadian Investor Protection Fund) in Canada and Asia, Bank of Montreal Europe p.l.c. (authorized and regulated by the Central Bank of Ireland) in Europe and BMO Capital Markets Limited (authorized and regulated by the Financial Conduct Authority) in the UK and Australia.
Securities and investment banking activities in the United States are performed by Deutsche Bank Securities Inc., a member of NYSE, FINRA and SIPC, and its broker-dealer affiliates. Lending and other commercial banking activities in the United States are performed by Deutsche Bank AG and its banking affiliates.
Wells Fargo Securities is the trade name for the capital markets and investment banking services of Wells Fargo & Company and its subsidiaries, including but not limited to Wells Fargo Securities, LLC, a member of NYSE, FINRA, NFA and SIPC, Wells Fargo Prime Services, LLC, a member of FINRA, NFA and SIPC, and Wells Fargo Bank, N.A. Wells Fargo Securities, LLC and Wells Fargo Prime Services, LLC are distinct entities from affiliated banks and thrifts.
THE INFORMATION IN THIS STRUCTURAL AND COLLATERAL TERM SHEET IS NOT COMPLETE AND MAY BE AMENDED PRIOR TO THE TIME OF SALE. THIS TERM SHEET IS NOT AN OFFER TO SELL THESE SECURITIES AND IT IS NOT A SOLICITATION OF AN OFFER TO BUY THESE SECURITIES IN ANY JURISDICTION WHERE THE OFFER OR SALE IS NOT PERMITTED. |
| | 2 | |
| Dated April 19, 2024 | BMO 2024-5C4 |
IMPORTANT NOTICE RELATING TO AUTOMATICALLY-GENERATED EMAIL DISCLAIMERS
Any legends, disclaimers or other notices that may appear at the bottom of any email communication to which this document is attached relating to (1) these materials not constituting an offer (or a solicitation of an offer), (2) no representation that these materials are accurate or complete and may not be updated or (3) these materials possibly being confidential, are not applicable to these materials and should be disregarded. Such legends, disclaimers or other notices have been automatically generated as a result of these materials having been sent via Bloomberg or another system.
THE CERTIFICATES REFERRED TO IN THESE MATERIALS ARE SUBJECT TO MODIFICATION OR REVISION (INCLUDING THE POSSIBILITY THAT ONE OR MORE CLASSES OF CERTIFICATES MAY BE SPLIT, COMBINED OR ELIMINATED AT ANY TIME PRIOR TO ISSUANCE OR AVAILABILITY OF A FINAL PROSPECTUS) AND ARE OFFERED ON A “WHEN, AS AND IF ISSUED” BASIS.
THE UNDERWRITERS MAY FROM TIME TO TIME PERFORM INVESTMENT BANKING SERVICES FOR, OR SOLICIT INVESTMENT BANKING BUSINESS FROM, ANY COMPANY NAMED IN THESE MATERIALS. THE UNDERWRITERS AND/OR THEIR AFFILIATES OR RESPECTIVE EMPLOYEES MAY FROM TIME TO TIME HAVE A LONG OR SHORT POSITION IN ANY CERTIFICATE OR CONTRACT DISCUSSED IN THESE MATERIALS.
THE INFORMATION IN THIS STRUCTURAL AND COLLATERAL TERM SHEET IS NOT COMPLETE AND MAY BE AMENDED PRIOR TO THE TIME OF SALE. THIS TERM SHEET IS NOT AN OFFER TO SELL THESE SECURITIES AND IT IS NOT A SOLICITATION OF AN OFFER TO BUY THESE SECURITIES IN ANY JURISDICTION WHERE THE OFFER OR SALE IS NOT PERMITTED. |
| | 3 | |
| Structural and Collateral Term Sheet | | BMO 2024-5C4 |
| Summary of Transaction Terms |
| Offered Certificates | | | | |
Classes of Certificates | Expected Ratings (Fitch/KBRA/S&P)(1) | Approximate Initial Certificate Balance or Notional Amount(2) | Approximate Initial Available Certificate Balance or Notional Amount(2) | Approximate Initial Retained Certificate Balance, Notional Amount or Percentage Interest(2)(3) | Approximate Initial Credit Support(4) | Initial
Pass-
Through Rate(5) | Pass-Through
Rate Description | Expected Weighted Avg. Life (yrs.)(6) | Expected Principal Window(6) |
| Class A-1 | AAAsf/AAA(sf)/AAA(sf) | $5,330,000 | | $5,172,000 | $158,000 | 30.000% | % | (7) | 2.54 | 06/24-11/28 |
| Class A-2 | AAAsf/AAA(sf)/AAA(sf) | (8) | | (8) | (8) | 30.000% | % | (7) | (8) | (8) |
| Class A-3 | AAAsf/AAA(sf)/AAA(sf) | (8) | | (8) | (8) | 30.000% | % | (7) | (8) | (8) |
| Class X-A | AAAsf/AAA(sf)/AAA(sf) | $604,059,000 | (9) | $586,239,000(9) | $17,820,000(9) | N/A | % | Variable IO(10) | N/A | N/A |
| Class X-B | A-sf/AAA(sf)/NR | $181,217,000 | (9) | $175,871,000(9) | $5,346,000(9) | N/A | % | Variable IO(10) | N/A | N/A |
| Class A-S | AAAsf/AAA(sf)/AA-(sf) | $105,710,000 | | $102,591,000 | $3,119,000 | 17.750% | % | (7) | 4.92 | 04/29-04/29 |
| Class B | AA-sf/AA-(sf)/NR | $44,226,000 | | $42,921,000 | $1,305,000 | 12.625% | % | (7) | 4.92 | 04/29-04/29 |
| Class C | A-sf/A-(sf)/NR | $31,281,000 | | $30,358,000 | $923,000 | 9.000% | % | (7) | 4.96 | 04/29-05/29 |
| Non-Offered Certificates(11) | | | | |
Classes of Certificates | Expected Ratings (Fitch/KBRA/S&P)(1) | Approximate Initial Certificate Balance or Notional Amount(2) | Approximate Initial Available Certificate Balance or Notional Amount(2) | Approximate Initial Retained Certificate Balance, Notional Amount or Percentage Interest(2)(3) | Approximate Initial Credit Support(4) | Initial Pass-
Through Rate(5) | Pass-Through Rate Description | Expected Weighted Avg. Life (yrs.)(6) | Expected Principal Window(6) |
| Class X-D | BBB-sf/BBB-(sf)/NR | $23,731,000 | (9) | $23,030,000(9) | $701,000(9) | N/A | % | Variable IO(10) | N/A | N/A |
| Class X-F | BB-sf/BB-(sf)/NR | $14,023,000 | (9) | $13,609,000(9) | $414,000(9) | N/A | % | Variable IO(10) | N/A | N/A |
| Class D | BBBsf/BBB(sf)/NR | $15,102,000 | | $14,656,000 | $446,000 | 7.250% | % | (7) | 5.00 | 05/29-05/29 |
| Class E | BBB-sf/BBB-(sf)/NR | $8,629,000 | | $8,374,000 | $255,000 | 6.250% | % | (7) | 5.00 | 05/29-05/29 |
| Class F | BB-sf/BB-(sf)/NR | $14,023,000 | | $13,609,000 | $414,000 | 4.625% | % | (7) | 5.00 | 05/29-05/29 |
| Class G-RR(3) | B-sf/B(sf)/NR | $8,630,000 | | $8,375,000 | $255,000 | 3.625% | % | (7) | 5.00 | 05/29-05/29 |
| Class J-RR(3) | NR/NR/NR | $31,281,671 | | $30,358,671 | $923,000 | 0.000% | % | (7) | 5.00 | 05/29-05/29 |
| Class R(12) | N/A | N/A | | N/A | N/A | N/A | N/A | N/A | N/A | N/A |
| | | | | | | | | |
| (1) | It is a condition of issuance that the offered certificates and certain classes of non-offered certificates receive the ratings set forth above. The anticipated ratings shown are those of Fitch Ratings, Inc. (“Fitch”), Kroll Bond Rating Agency, LLC (“KBRA”) and S&P Global Ratings (“S&P”), as indicated. Subject to the discussion under “Ratings” in the Preliminary Prospectus, the ratings on the certificates address the likelihood of the timely receipt by holders of all payments of interest to which they are entitled on each distribution date and, except in the case of the interest only certificates, the ultimate receipt by holders of all payments of principal to which they are entitled on or before the applicable rated final distribution date. Certain nationally recognized statistical rating organizations, as defined in Section 3(a)(62) of the Securities Exchange Act of 1934, as amended, that were not hired by the depositor may use information they receive pursuant to Rule 17g-5 under the Securities Exchange Act of 1934, as amended, or otherwise to rate the offered certificates. We cannot assure you as to what ratings a non-hired nationally recognized statistical rating organization would assign. See “Risk Factors—Other Risks Relating to the Certificates—Nationally Recognized Statistical Rating Organizations May Assign Different Ratings to the Certificates; Ratings of the Certificates Reflect Only the Views of the Applicable Rating Agencies as of the Dates Such Ratings Were Issued; Ratings May Affect ERISA Eligibility; Ratings May Be Downgraded” in the Preliminary Prospectus. Fitch, KBRA and S&P have informed us that the “sf” designation in the ratings represents an identifier of structured finance product ratings. For additional information about this identifier, prospective investors can go to the related rating agency’s website. The depositor and the underwriters have not verified, do not adopt and do not accept responsibility for any statements made by the rating agencies on those websites. Credit ratings referenced throughout this Term Sheet are forward-looking opinions about credit risk and express a rating agency’s opinion about the willingness and ability of an issuer of securities to meet its financial obligations in full and on time. Ratings are not indications of investment merit and are not buy, sell or hold recommendations, a measure of asset value or an indication of the suitability of an investment. |
THE INFORMATION IN THIS STRUCTURAL AND COLLATERAL TERM SHEET IS NOT COMPLETE AND MAY BE AMENDED PRIOR TO THE TIME OF SALE. THIS TERM SHEET IS NOT AN OFFER TO SELL THESE SECURITIES AND IT IS NOT A SOLICITATION OF AN OFFER TO BUY THESE SECURITIES IN ANY JURISDICTION WHERE THE OFFER OR SALE IS NOT PERMITTED. |
| | 4 | |
| Structural and Collateral Term Sheet | | BMO 2024-5C4 |
| Summary of Transaction Terms |
| (2) | Approximate, subject to a variance of plus or minus 5% and further subject to any additional variances described in the footnotes below. In addition, the notional amounts of the Class X-A, Class X-B, Class X-D and Class X-F certificates (collectively, the “Class X certificates”) may vary depending upon the final pricing of the respective classes of principal balance certificates (as defined in footnote (7) below) whose certificate balances comprise such notional amounts, and, if as a result of such pricing (a) the pass-through rate of any class of Class X certificates would be equal to zero at all times, such class of certificates will not be issued on the closing date of this securitization or (b) the pass-through rate of any class of principal balance certificates whose certificate balance comprises such notional amount is at all times equal to the weighted average of the net interest rates on the mortgage loans (in each case, adjusted, if necessary, to accrue on the basis of a 360-day year consisting of twelve 30-day months) as in effect from time to time, the certificate balance of such class of principal balance certificates may not be part of, and there may be a corresponding reduction in, such notional amount of the related class of Class X certificates. |
| (3) | On the closing date for this transaction, Argentic Real Estate Finance 2 LLC, as “retaining sponsor” (as such term is defined in Regulation RR), is expected to satisfy its risk retention obligations by: (i) causing a “majority-owned affiliate” to purchase an “eligible vertical interest” in the form of certificates (collectively referred to herein as the “VRR Interest”) (x) representing at least 2.9500% of the initial certificate balance, notional amount or percentage interest, as applicable, of each class of certificates (other than the Class R Certificates), as set forth in the table above under “Approximate Initial Retained Certificate Balance, Notional Amount or Percentage Interest”, and (y) representing approximately 2.9506% of the aggregate principal balance of all the “ABS interests” (i.e., the sum of the aggregate initial certificate balance of all of the classes of certificates (other than the Class R certificates)) issued by the issuing entity on the closing date, as described under “Credit Risk Retention” in the Preliminary Prospectus, and (ii) causing a "majority-owned affiliate" to purchase an “eligible horizontal residual interest” in the form of the Class G-RR and Class J-RR certificates (collectively, the “HRR Certificates”) (in each case excluding the portion of such class comprising the VRR interest) (collectively referred to herein as the “HRR Interest”), representing at least 2.0705% of the aggregate fair value of all of the ABS interests issued by the issuing entity on the closing date. “Majority-owned affiliate”, “eligible vertical interest” and “eligible horizontal residual interest” will have the meanings given to such terms in Regulation RR. See “Credit Risk Retention” in the Preliminary Prospectus. |
| (4) | "Approximate Initial Credit Support" means, with respect to any class of principal balance certificates, the quotient, expressed as a percentage, of (i) the aggregate of the initial certificate balances of all classes of principal balance certificates, if any, junior to the subject class of principal balance certificates, divided by (ii) the aggregate of the initial certificate balances of all classes of principal balance certificates. The approximate initial credit support percentages set forth for the Class A-1, Class A-2 and Class A-3 certificates are represented in the aggregate. |
| (5) | Approximate per annum rate as of the closing date. |
| (6) | Determined assuming no prepayments prior to the maturity date or any anticipated repayment date, as applicable, for any mortgage loan and based on the modeling assumptions described under “Yield, Prepayment and Maturity Considerations” in the Preliminary Prospectus. |
| (7) | The pass-through rate for each class of the Class A-1, Class A-2, Class A-3, Class A-S, Class B, Class C, Class D, Class E, Class F, Class G-RR and Class J-RR certificates (collectively, the “principal balance certificates”, and collectively with the Class X certificates and the Class R certificates, the “certificates”) will generally be equal to one of (i) a fixed per annum rate, (ii) the weighted average of the net interest rates on the mortgage loans (in each case, adjusted, if necessary, to accrue on the basis of a 360-day year consisting of twelve 30-day months) as in effect from time to time, (iii) a rate equal to the lesser of a specified per annum rate and the weighted average rate described in clause (ii), or (iv) the weighted average rate described in clause (ii) less a specified percentage, but no less than 0.000%. See “Description of the Certificates—Distributions—Pass-Through Rates” in the Preliminary Prospectus. |
| (8) | The exact initial certificate balances of the Class A-2 and Class A-3 certificates are unknown and will be determined based on the final pricing of those classes of certificates. However, the respective initial certificate balances, weighted average lives and principal windows of the Class A-2 and Class A-3 certificates are expected to be within the applicable ranges reflected in the following chart. The aggregate initial certificate balance of the Class A-2 and Class A-3 certificates is expected to be approximately $598,729,000 subject to a variance of plus or minus 5%. |
Class of Certificates | Expected Range of Initial Certificate Balances | Expected Range of Initial Available Certificate Balances | Expected Range of Initial Retained Certificate Balances | Expected Range of Weighted Avg. Lives (Yrs) | Expected Range of Principal Windows |
| Class A-2 | $0 - $295,000,000 | $0 - $286,297,000 | $0 - $8,703,000 | N/A – 4.79 | N/A – 11/28-03/29 |
| Class A-3 | $303,729,000 - $598,729,000 | $294,768,000 - $581,066,000 | $8,961,000 - $17,663,000 | 4.84 – 4.90 | 03/29-04/29 – 11/28-04/29 |
THE INFORMATION IN THIS STRUCTURAL AND COLLATERAL TERM SHEET IS NOT COMPLETE AND MAY BE AMENDED PRIOR TO THE TIME OF SALE. THIS TERM SHEET IS NOT AN OFFER TO SELL THESE SECURITIES AND IT IS NOT A SOLICITATION OF AN OFFER TO BUY THESE SECURITIES IN ANY JURISDICTION WHERE THE OFFER OR SALE IS NOT PERMITTED. |
| | 5 | |
| Structural and Collateral Term Sheet | | BMO 2024-5C4 |
| Summary of Transaction Terms |
| (9) | The Class X certificates will not have certificate balances and will not be entitled to receive distributions of principal. Interest will accrue on each class of Class X certificates at the related pass-through rate based upon the related notional amount. The notional amount of each class of the Class X certificates will be equal to the certificate balance or the aggregate of the certificate balances, as applicable, from time to time of the class or classes of principal balance certificates identified in the same row as such class of Class X certificates in the chart below (as to such class of Class X certificates, the “corresponding principal balance certificates”): |
| Class of Class X Certificates | Class(es) of Corresponding
Principal Balance Certificates |
| Class X-A | Class A-1, Class A-2 and Class A-3 |
| Class X-B | Class A-S, Class B and Class C |
| Class X-D | Class D and Class E |
| Class X-F | Class F |
| (10) | The pass-through rate for each class of Class X certificates will generally be a per annum rate equal to the excess, if any, of (i) the weighted average of the net interest rates on the mortgage loans (in each case, adjusted, if necessary, to accrue on the basis of a 360-day year consisting of twelve 30-day months) as in effect from time to time, over (ii) the pass-through rate (or, if applicable, the weighted average of the pass-through rates) of the class or classes of corresponding principal balance certificates as in effect from time to time, as described in the Preliminary Prospectus. |
| (11) | The classes of certificates set forth below “Non-Offered Certificates” in the table are not offered hereby. |
| (12) | The Class R certificates will not have a certificate balance, notional amount, pass-through rate, rating or rated final distribution date. The Class R certificates will represent the residual interests in each of two (2) separate REMICs, as further described in the Preliminary Prospectus. The Class R certificates will not be entitled to distributions of principal or interest. |
THE INFORMATION IN THIS STRUCTURAL AND COLLATERAL TERM SHEET IS NOT COMPLETE AND MAY BE AMENDED PRIOR TO THE TIME OF SALE. THIS TERM SHEET IS NOT AN OFFER TO SELL THESE SECURITIES AND IT IS NOT A SOLICITATION OF AN OFFER TO BUY THESE SECURITIES IN ANY JURISDICTION WHERE THE OFFER OR SALE IS NOT PERMITTED. |
| | 6 | |
| Structural and Collateral Term Sheet | | BMO 2024-5C4 |
| Summary of Transaction Terms |
| Publicly Offered Certificates: | $785,276,000 monthly pay, multi-class, commercial mortgage REMIC Pass-Through Certificates. |
| Co-Lead Managers and Joint Bookrunners: | BMO Capital Markets Corp., Wells Fargo Securities, LLC, Citigroup Global Markets Inc., Goldman Sachs & Co. LLC, Deutsche Bank Securities Inc. and UBS Securities LLC |
| Co-Managers: | Academy Securities, Inc., Bancroft Capital, LLC and Drexel Hamilton, LLC |
| Mortgage Loan Sellers: | Bank of Montreal (“BMO”) (17.4%); Argentic Real Estate Finance 2 LLC (“AREF2”) (26.6%); Wells Fargo Bank, National Association (“WFB”) (14.5%); Starwood Mortgage Capital LLC (“SMC”) (11.1%); Citi Real Estate Funding Inc. (“CREFI”) (11.0%); Goldman Sachs Mortgage Company (“GSMC”) (7.1%); LMF Commercial, LLC (“LMF”) (6.3%); UBS AG (“UBS”) (3.9%); and German American Capital Corporation (“GACC”) (2.0%). |
| Master Servicer: | Midland Loan Services, a Division of PNC Bank, National Association |
| Special Servicer: | Argentic Services Company LP |
| Directing Holder/Controlling Class Representative: | Argentic Securities Income USA 2 LLC (or an affiliate), an affiliate of Argentic Real Estate Finance 2 LLC and Argentic Services Company LP |
| Trustee: | Computershare Trust Company, National Association |
| Certificate Administrator: | Computershare Trust Company, National Association |
| Operating Advisor: | Pentalpha Surveillance LLC |
| Asset Representations Reviewer: | Pentalpha Surveillance LLC |
| Rating Agencies: | Fitch Ratings, Inc. (“Fitch”), Kroll Bond Rating Agency, LLC (“KBRA”) and S&P Global Ratings (“S&P”). |
| U.S. Credit Risk Retention: | For a discussion on the manner in which AREF2, as retaining sponsor, intends to satisfy the U.S. credit risk retention requirements, see “Credit Risk Retention” in the Preliminary Prospectus. |
| EU Credit Risk Retention: | The transaction is not structured to satisfy the EU risk retention and due diligence requirements. |
| Closing Date: | On or about May 15, 2024. |
| Cut-off Date: | With respect to each mortgage loan, the related due date in May 2024, or in the case of any mortgage loan that has its first due date after May 2024, the date that would have been its due date in May 2024 under the terms of that mortgage loan if a monthly debt service payment were scheduled to be due in that month. |
| Distribution Date: | The 4th business day after the Determination Date in each month, commencing in June 2024. |
| Determination Date: | 11th day of each month, or if the 11th day is not a business day, the next succeeding business day, commencing in June 2024. |
| Assumed Final Distribution Date: | The Distribution Date in May 2029 which is the latest anticipated repayment date of the Certificates. |
| Rated Final Distribution Date: | The Distribution Date in May 2057. |
| Tax Treatment: | The Publicly Offered Certificates are expected to be treated as REMIC “regular interests” for U.S. federal income tax purposes. |
| Form of Offering: | The Class A-1, Class A-2, Class A-3, Class X-A, Class X-B, Class A-S, Class B and Class C Certificates (the “Publicly Offered Certificates”) will be offered publicly. The Class X-D, Class X-F, Class D, Class E, Class F, Class G-RR, Class J-RR and Class R Certificates (the “Privately Offered Certificates”) will be offered domestically to Qualified Institutional Buyers and to Institutional Accredited Investors (other than the Class R Certificates) and to institutions that are not U.S. Persons pursuant to Regulation S (other than the Class R Certificates). |
| SMMEA Status: | The Certificates will not constitute “mortgage related securities” for purposes of SMMEA. |
| ERISA: | The Publicly Offered Certificates are expected to be ERISA eligible. |
| Optional Termination: | On any Distribution Date on which the aggregate principal balance of the pool of mortgage loans is less than 1% of the aggregate principal balance of the mortgage loans as of the cut-off date, certain entities specified in the Preliminary Prospectus will have the option to purchase all of the remaining mortgage loans (and all property acquired through exercise of remedies in respect of any mortgage loan) at the price specified in the Preliminary Prospectus. Refer to “Pooling and Servicing Agreement—Termination; Retirement of Certificates” in the Preliminary Prospectus. |
| Minimum Denominations: | The Publicly Offered Certificates (other than the Class X-A and Class X-B Certificates) will be issued in minimum denominations of $10,000 and integral multiples of $1 in excess of $10,000. The Class X-A and Class X-B Certificates will be issued in minimum denominations of $1,000,000 and in integral multiples of $1 in excess of $1,000,000. |
| Settlement Terms: | DTC, Euroclear and Clearstream Banking. |
| Analytics: | The transaction is expected to be modeled by Bloomberg, L.P., Trepp, LLC, Intex Solutions, Inc., BlackRock Financial Management, Inc., CMBS.com, Inc., Moody’s Analytics, Markit Group Limited, RealINSIGHT, Thompson Reuters Corporation, Intercontinental Exchange | ICE Data Services, KBRA Analytics, LLC, DealView Technologies Ltd and Recursion Co.. |
| Risk Factors: | THE CERTIFICATES INVOLVE CERTAIN RISKS AND MAY NOT BE SUITABLE FOR ALL INVESTORS. REFER TO THE “SUMMARY OF RISK FACTORS” AND “RISK FACTORS” SECTIONS OF THE PRELIMINARY PROSPECTUS. |
THE INFORMATION IN THIS STRUCTURAL AND COLLATERAL TERM SHEET IS NOT COMPLETE AND MAY BE AMENDED PRIOR TO THE TIME OF SALE. THIS TERM SHEET IS NOT AN OFFER TO SELL THESE SECURITIES AND IT IS NOT A SOLICITATION OF AN OFFER TO BUY THESE SECURITIES IN ANY JURISDICTION WHERE THE OFFER OR SALE IS NOT PERMITTED. |
| | 7 | |
| Structural and Collateral Term Sheet | | BMO 2024-5C4 |
| Collateral Characteristics |
Mortgage Loan Seller | Number of Mortgage Loans | Number of Mortgaged Properties | Aggregate
Cut-off Date Balance | | Roll-up Aggregate Cut-off Date Balance | Roll-up Aggregate % of Cut-off Date Balance |
| AREF2 | 7 | 10 | $148,172,889 | 17.2% | $229,946,393 | 26.6% |
| BMO | 3 | 24 | $101,550,000 | 11.8% | $150,550,000 | 17.4% |
| WFB | 4 | 4 | $109,383,106 | 12.7% | $125,525,279 | 14.5% |
| SMC | 8 | 14 | $85,645,000 | 9.9% | $95,645,000 | 11.1% |
| CREFI | 3 | 3 | $95,000,000 | 11.0% | $95,000,000 | 11.0% |
| GSMC | 2 | 2 | $61,375,000 | 7.1% | $61,375,000 | 7.1% |
| LMF | 5 | 5 | $54,100,000 | 6.3% | $54,100,000 | 6.3% |
| UBS AG | 3 | 3 | $33,300,000 | 3.9% | $33,300,000 | 3.9% |
| GACC | 1 | 3 | $17,500,000 | 2.0% | $17,500,000 | 2.0% |
| BMO, AREF2, SMC | 1 | 1 | $70,000,000 | 8.1% | - | - |
| AREF2, WFB | 1 | 1 | $48,915,677 | 5.7% | - | - |
| AREF2, BMO | 1 | 1 | $38,000,000 | 4.4% | - | - |
| Total: | 39 | 71 | $862,941,672 | 100.0% | $862,941,672 | 100.0% |
| Loan Pool | |
| | Initial Pool Balance (“IPB”): | $862,941,672 |
| | Number of Mortgage Loans: | 39 |
| | Number of Mortgaged Properties: | 71 |
| | Average Cut-off Date Balance per Mortgage Loan: | $22,126,710 |
| | Weighted Average Current Mortgage Rate: | 7.03612% |
| | 10 Largest Mortgage Loans as % of IPB: | 51.6% |
| | Weighted Average Remaining Term to Maturity: | 59 months |
| | Weighted Average Seasoning: | 1 month |
| | | |
| Credit Statistics | |
| | Weighted Average UW NCF DSCR(1)(2): | 1.71x |
| | Weighted Average UW NOI Debt Yield(1): | 13.2% |
| | Weighted Average Cut-off Date Loan-to-Value Ratio (“LTV”)(1)(3): | 56.7% |
| | Weighted Average Maturity Date/ARD LTV(1)(3): | 56.4% |
| | | |
| Other Statistics | |
| | % of Mortgage Loans with Additional Debt: | 4.4% |
| | % of Mortgage Loans with Single Tenants(4): | 11.8% |
| | % of Mortgage Loans secured by Multiple Properties: | 18.1% |
| | |
| Amortization | |
| | Weighted Average Original Amortization Term(5): | 337 months |
| | Weighted Average Remaining Amortization Term(5): | 336 months |
| | % of Mortgage Loans with Interest-Only: | 85.2% |
| | % of Mortgage Loans with Amortizing Balloon: | 10.8% |
| | % of Mortgage Loans with Partial Interest-Only followed by Amortizing Balloon: | 4.0% |
| | | |
| Lockboxes(6) | |
| | % of Mortgage Loans with Hard Lockboxes: | 58.3% |
| | % of Mortgage Loans with Springing Lockboxes: | 40.6% |
| | % of Mortgage Loans with Soft Lockboxes: | 1.1% |
| | | |
| Reserves | |
| | % of Mortgage Loans Requiring Monthly Tax Reserves: | 90.4% |
| | % of Mortgage Loans Requiring Monthly Insurance Reserves: | 54.6% |
| | % of Mortgage Loans Requiring Monthly CapEx Reserves: | 78.5% |
| | % of Mortgage Loans Requiring Monthly TI/LC Reserves(7): | 51.4% |
(See footnotes on following page)
THE INFORMATION IN THIS STRUCTURAL AND COLLATERAL TERM SHEET IS NOT COMPLETE AND MAY BE AMENDED PRIOR TO THE TIME OF SALE. THIS TERM SHEET IS NOT AN OFFER TO SELL THESE SECURITIES AND IT IS NOT A SOLICITATION OF AN OFFER TO BUY THESE SECURITIES IN ANY JURISDICTION WHERE THE OFFER OR SALE IS NOT PERMITTED. |
| | 8 | |
| Structural and Collateral Term Sheet | | BMO 2024-5C4 |
| Collateral Characteristics |
| (1) | In the case of Loan Nos. 1, 2, 3, 5, 6, 9, 10, 12, 14, 17, 19, 23 and 33, the UW NCF DSCR, UW NOI Debt Yield, Cut-off Date LTV and Maturity Date/ARD LTV calculations include the related Pari Passu Companion Loan(s). In the case of Loan No. 6, the UW NCF DSCR, UW NOI Debt Yield, Cut-off Date LTV and Maturity Date/ARD LTV calculations exclude the related mezzanine loans. |
| (2) | For the mortgage loans that are interest-only for the entire term and accrue interest on an Actual/360 basis, the Monthly Debt Service Amount ($) was calculated as 1/12th of the product of (i) the Original Balance ($), (ii) the Interest Rate % and (iii) 365/360. |
| (3) | In the case of Loan No. 21, the Cut-off Date LTV and Maturity/ARD LTV are calculated by using an appraised value based on a “as complete” assumption. Refer to the definition of “Appraised Value” under “Description of the Mortgage Pool—Certain Calculations and Definitions” in the Preliminary Prospectus for additional details. |
| (4) | Excludes mortgage loans that are secured by multiple properties with multiple tenants. |
| (5) | Excludes 34 mortgage loans that are interest-only for the entire term or until the anticipated repayment date. |
| (6) | For a more detailed description of lockboxes, refer to “Description of the Mortgage Pool—Certain Calculations and Definitions” and “—Certain Terms of the Mortgage Loans—Mortgaged Property Accounts” in the Preliminary Prospectus. |
| (7) | Calculated only with respect to the Cut-off Date Balance of mortgage loans secured or partially secured by office, industrial, retail, multifamily (with commercial tenants) and mixed use properties. |
THE INFORMATION IN THIS STRUCTURAL AND COLLATERAL TERM SHEET IS NOT COMPLETE AND MAY BE AMENDED PRIOR TO THE TIME OF SALE. THIS TERM SHEET IS NOT AN OFFER TO SELL THESE SECURITIES AND IT IS NOT A SOLICITATION OF AN OFFER TO BUY THESE SECURITIES IN ANY JURISDICTION WHERE THE OFFER OR SALE IS NOT PERMITTED. |
| | 9 | |
| Structural and Collateral Term Sheet | | BMO 2024-5C4 |
| Collateral Characteristics |
| Ten Largest Mortgage Loans |
| No. | Loan Name | City, State | Mortgage Loan Seller | No.
of Prop. | Cut-off Date Balance | % of IPB | Square Feet / Rooms / Units | Property Type | UW
NCF DSCR(1)(2) | UW NOI Debt Yield(1) | Cut-off Date LTV(1)(3) | Maturity Date/ARD LTV(1)(3) |
| 1 | 620 W 153rd Street | New York, NY | BMO, AREF2, SMC | 1 | $70,000,000 | 8.1% | 238 | Multifamily | 1.43x | 9.0% | 57.0% | 57.0% |
| 2 | GNL Industrial Portfolio | Various, Various | BMO | 20 | $70,000,000 | 8.1% | 3,908,306 | Various | 2.12x | 12.6% | 53.8% | 53.8% |
| 3 | 28-40 West 23rd Street | New York, NY | CREFI | 1 | $50,000,000 | 5.8% | 578,105 | Mixed Use | 2.39x | 15.4% | 36.9% | 36.9% |
| 4 | Galleria at Sunset | Henderson, NV | AREF2, WFB | 1 | $48,915,677 | 5.7% | 441,712 | Retail | 2.47x | 26.9% | 51.5% | 48.2% |
| 5 | Vero Office Portfolio | Various, Various | AREF2 | 4 | $43,000,000 | 5.0% | 987,072 | Office | 1.91x | 15.7% | 55.2% | 55.2% |
| 6 | Coastline Apartments | Fort Walton Beach, FL | AREF2, BMO | 1 | $38,000,000 | 4.4% | 301 | Multifamily | 1.43x | 8.5% | 72.8% | 72.8% |
| 7 | Sheraton Park City | Park City, UT | GSMC | 1 | $33,000,000 | 3.8% | 200 | Hospitality | 1.40x | 12.4% | 51.1% | 51.1% |
| 8 | McGaw Commerce Center | Columbia, MD | AREF2 | 1 | $32,500,000 | 3.8% | 281,053 | Industrial | 1.22x | 8.5% | 64.9% | 64.9% |
| 9 | Kenwood Towne Centre | Cincinnati, OH | WFB | 1 | $30,000,000 | 3.5% | 1,033,141 | Retail | 2.19x | 14.6% | 45.5% | 45.5% |
| 10 | Staten Island Mall | Staten Island, NY | WFB | 1 | $30,000,000 | 3.5% | 995,900 | Retail | 2.09x | 16.5% | 42.8% | 42.8% |
| | | | | | | | | | | | | |
| | Top 3 Total/Weighted Average | 22 | $190,000,000 | 22.0% | | | 1.94x | 12.0% | 50.5% | 50.5% |
| | Top 5 Total/Weighted Average | 27 | $281,915,677 | 32.7% | | | 2.03x | 15.2% | 51.4% | 50.8% |
| | Top 10 Total/Weighted Average | 32 | $445,415,677 | 51.6% | | | 1.88x | 14.0% | 53.2% | 52.9% |
| | Non-Top 10 Total/Weighted Average | 39 | $417,525,995 | 48.4% | | | 1.52x | 12.5% | 60.5% | 60.1% |
| (1) | In the case of Loan Nos. 1, 2, 3, 5, 6, 9, 10, 12, 14, 17, 19, 23 and 33, the UW NCF DSCR, UW NOI Debt Yield, Cut-off Date LTV and Maturity Date/ARD LTV calculations include the related Pari Passu Companion Loan(s). In the case of Loan No. 6, the UW NCF DSCR, UW NOI Debt Yield, Cut-off Date LTV and Maturity Date/ARD LTV calculations exclude the related mezzanine loans. |
| (2) | For the mortgage loans that are interest-only for the entire term and accrue interest on an Actual/360 basis, the Monthly Debt Service Amount ($) was calculated as 1/12th of the product of (i) the Original Balance ($), (ii) the Interest Rate % and (iii) 365/360. |
| (3) | In the case of Loan No. 21, the Cut-off Date LTV and Maturity/ARD LTV are calculated by using an appraised value based on a “as complete” assumption. Refer to the definition of “Appraised Value” under “Description of the Mortgage Pool—Certain Calculations and Definitions” in the Preliminary Prospectus for additional details. |
THE INFORMATION IN THIS STRUCTURAL AND COLLATERAL TERM SHEET IS NOT COMPLETE AND MAY BE AMENDED PRIOR TO THE TIME OF SALE. THIS TERM SHEET IS NOT AN OFFER TO SELL THESE SECURITIES AND IT IS NOT A SOLICITATION OF AN OFFER TO BUY THESE SECURITIES IN ANY JURISDICTION WHERE THE OFFER OR SALE IS NOT PERMITTED. |
| | 10 | |
| Structural and Collateral Term Sheet | | BMO 2024-5C4 |
| Collateral Characteristics |
| Pari Passu Companion Loan Summary |
No. | Loan Name | | Trust Cut-off Date Balance | Aggregate Pari Passu Loan Cut-off Date Balance(1) | Controlling Pooling/Trust & Servicing Agreement | Master Servicer | Special Servicer | Related Pari Passu Loan(s) Securitizations | Related Pari Passu Loan(s) Original Balance(1) |
| 1 | 620 W 153rd Street | BMO, AREF2, SMC | $70,000,000 | $47,000,000 | BMO 2024-5C4 | Midland | Argentic | Future Securitization(s) | $47,000,000 |
| 2 | GNL Industrial Portfolio | BMO | $70,000,000 | $167,000,000 | BMO 2024-5C4 | Midland | Argentic | Future Securitization(s) | $167,000,000 |
| 3 | 28-40 West 23rd Street | CREFI | $50,000,000 | $105,000,000 | BMO 2024-5C4(2) | Midland(2) | Argentic(2) | Future Securitization(s) | $105,000,000 |
| 5 | Vero Office Portfolio | AREF2 | $43,000,000 | $65,000,000 | BMO 2024-5C4 | Midland | Argentic | Benchmark 2024-V6 | $65,000,000 |
| 6 | Coastline Apartments | AREF2, BMO | $38,000,000 | $10,000,000 | BMO 2024-5C4 | Midland | Argentic | Benchmark 2024-V6 | $10,000,000 |
| 9 | Kenwood Towne Centre | WFB | $30,000,000 | $230,000,000 | BBCMS 2024-5C25(3) | Midland(3) | 3650 REIT(3) | BANK5 Trust 2024-5YR6 Benchmark 2024-V6 BBCMS 2024-5C25 Future Securitizations | $70,000,000 $65,000,000 $50,000,000 $45,000,000 |
| 10 | Staten Island Mall | WFB | $30,000,000 | $170,000,000 | BBCMS 2024-5C25 | Midland | 3650 REIT | BBCMS 2024-5C25 Benchmark 2024-V6 BANK5 Trust 2024-5YR6 BMO 2024-5C3 | $71,500,000 $40,000,000 $30,000,000 $28,500,000 |
| 12 | 1812 North Moore | CREFI | $30,000,000 | $143,000,000 | BMO 2024-5C4(2) | Midland(2) | Argentic(2) | Future Securitization(s) | $143,000,000 |
| 14 | Respara | WFB | $25,000,000 | $36,500,000 | BANK5 Trust 2024-5YR6(4) | Wells Fargo(4) | LNR(4) | BANK5 Trust 2024-5YR6 | $36,500,000 |
| 17 | Lexmark | UBS AG | $23,000,000 | $59,500,000 | Benchmark 2024-V6 | Midland | LNR | Benchmark 2024-V6 Future Securitization(s) | $50,000,000 $9,500,000 |
| 19 | Casa Cipriani | AREF2 | $19,972,889 | $82,887,490 | Benchmark 2024-V6 | Midland | LNR | Benchmark 2024-V6 | $83,000,000 |
| 23 | Euclid Apartments | LMF | $15,000,000 | $38,000,000 | BMO 2024-5C4(2) | Midland(2) | Argentic(2) | Future Securitization(s) | $38,000,000 |
| 33 | AutoNation | AREF2 | $5,900,000 | $49,100,000 | BBCMS 2024-C24 | KeyBank | Argentic | BBCMS 2024-C24 Benchmark 2024-V6 | $42,000,000 $7,100,000 |
| (1) | In the case of Loan No. 6, the Aggregate Pari Passu Loan Cut-off Date Balance and Related Pari Passu Loan(s) Original Balance exclude the related mezzanine loan(s). |
| (2) | In the case of each of Loan Nos. 3, 12 and 23, until the securitization of the related controlling pari passu companion loan, the related whole loan will be serviced and administered pursuant to the pooling and servicing agreement for the BMO 2024-5C4 securitization transaction by the parties thereto. Upon the securitization of the related controlling pari-passu companion loan, servicing of the related whole loan will shift to the servicers under the servicing agreement with respect to such future securitization transaction, which servicing agreement will become the Controlling Pooling/Trust & Servicing Agreement. |
| (3) | In the case of Loan No. 9, until the securitization of the related controlling pari passu companion loan, the related whole loan will be serviced and administered pursuant to the pooling and servicing agreement for the BBCMS 2024-5C25 securitization transaction by the parties thereto. Upon the securitization of the related controlling pari-passu companion loan, servicing of the related whole loan will shift to the servicers under the servicing agreement with respect to such future securitization transaction, which, based on a publicly available preliminary prospectus, is expected to be the BANK5 Trust 2024-5YR6 securitization transaction (which transaction is expected to close after the date of this structural and collateral term sheet and prior to the closing of this securitization transaction), which servicing agreement will become the Controlling Pooling/Trust & Servicing Agreement. |
| (4) | Based on a publicly-available preliminary prospectus. The BANK5 Trust 2024-5YR6 transaction is expected to close after the date of this structural and collateral term sheet and prior to the closing of this securitization transaction.
|
THE INFORMATION IN THIS STRUCTURAL AND COLLATERAL TERM SHEET IS NOT COMPLETE AND MAY BE AMENDED PRIOR TO THE TIME OF SALE. THIS TERM SHEET IS NOT AN OFFER TO SELL THESE SECURITIES AND IT IS NOT A SOLICITATION OF AN OFFER TO BUY THESE SECURITIES IN ANY JURISDICTION WHERE THE OFFER OR SALE IS NOT PERMITTED. |
| | 11 | |
| Structural and Collateral Term Sheet | | BMO 2024-5C4 |
| Collateral Characteristics |
No. | Loan Name | Trust
Cut-off Date Balance | Pari Passu Loan(s) Cut-off Date Balance | Mezzanine Debt Cut-off Date Balance(1) | Total Debt Cut-off Date Balance | Mortgage Loan UW NCF DSCR(2) | Total Debt UW NCF DSCR | Mortgage Loan
Cut-off Date LTV(2) | Total Debt Cut-off Date LTV | Mortgage Loan UW NOI Debt Yield(2) | Total Debt UW NOI Debt Yield |
| 6 | Coastline Apartments | $38,000,000 | $10,000,000 | $11,500,000 | $59,500,000 | 1.43x | 0.94x | 72.8% | 90.3% | 8.5% | 6.9% |
| (1) | In the case of Loan No. 6, subordinate debt represents one subordinate mezzanine loan. |
| (2) | Mortgage Loan UW NCF DSCR, Mortgage Loan Cut-off Date LTV and Mortgage Loan UW NOI Debt Yield calculations include any related Pari Passu Companion Loans (if applicable), but exclude the related one or more mezzanine loans. |
THE INFORMATION IN THIS STRUCTURAL AND COLLATERAL TERM SHEET IS NOT COMPLETE AND MAY BE AMENDED PRIOR TO THE TIME OF SALE. THIS TERM SHEET IS NOT AN OFFER TO SELL THESE SECURITIES AND IT IS NOT A SOLICITATION OF AN OFFER TO BUY THESE SECURITIES IN ANY JURISDICTION WHERE THE OFFER OR SALE IS NOT PERMITTED. |
| | 12 | |
| Structural and Collateral Term Sheet | | BMO 2024-5C4 |
| Collateral Characteristics |
| Mortgaged Properties by Type(1) |
| | | | | | Weighted Average |
| Property Type | Property Subtype | Number of Properties | Cut-off Date Principal Balance | % of IPB | UW
NCF DSCR(2)(3) | UW
NOI Debt Yield(2) | Cut-off Date LTV(2)(4) | Maturity Date/ARD LTV(2)(4) |
| Multifamily | Mid Rise | 9 | $111,515,000 | 12.9% | 1.25x | 8.6% | 64.4% | 64.4% |
| | Garden | 10 | 75,650,000 | 8.8 | 1.45x | 9.9% | 69.5% | 69.5% |
| | High Rise | 1 | 70,000,000 | 8.1 | 1.43x | 9.0% | 57.0% | 57.0% |
| | Low Rise | 1 | 7,000,000 | 0.8 | 1.53x | 11.0% | 58.1% | 58.1% |
| | Independent Living | 1 | 5,300,000 | 0.6 | 2.59x | 18.9% | 58.9% | 58.9% |
| | Student Housing | 1 | 4,100,000 | 0.5 | 1.34x | 12.9% | 48.8% | 48.1% |
| | Subtotal: | 23 | $273,565,000 | 31.7% | 1.39x | 9.4% | 63.4% | 63.4% |
| Industrial | Flex | 2 | $55,500,000 | 6.4% | 1.53x | 11.6% | 63.7% | 63.7% |
| | Warehouse/Distribution | 11 | 50,146,878 | 5.8 | 2.00x | 12.4% | 53.7% | 53.7% |
| | Manufacturing | 4 | 14,896,324 | 1.7 | 2.12x | 12.6% | 53.8% | 53.8% |
| | Manufacturing/Flex | 1 | 3,419,872 | 0.4 | 2.12x | 12.6% | 53.8% | 53.8% |
| | Manufacturing/Warehouse | 1 | 3,093,791 | 0.4 | 2.12x | 12.6% | 53.8% | 53.8% |
| | Distribution/Flex | 1 | 2,552,974 | 0.3 | 2.12x | 12.6% | 53.8% | 53.8% |
| | Manufacturing/Distribution | 1 | 2,529,114 | 0.3 | 2.12x | 12.6% | 53.8% | 53.8% |
| | Warehouse | 1 | 1,781,514 | 0.2 | 2.12x | 12.6% | 53.8% | 53.8% |
| | Subtotal: | 22 | $133,920,468 | 15.5% | 1.83x | 12.1% | 57.9% | 57.9% |
| Office | Suburban | 7 | $97,462,638 | 11.3% | 1.65x | 14.2% | 59.9% | 59.2% |
| | CBD | 2 | 35,900,000 | 4.2 | 1.51x | 13.5% | 54.7% | 53.5% |
| | Subtotal: | 9 | $133,362,638 | 15.5% | 1.62x | 14.1% | 58.5% | 57.7% |
| Retail | Super Regional Mall | 3 | $108,915,677 | 12.6% | 2.29x | 20.6% | 47.5% | 46.0% |
| Mixed Use | Office/Retail | 1 | $50,000,000 | 5.8% | 2.39x | 15.4% | 36.9% | 36.9% |
| | Hospitality/Retail | 1 | 23,750,000 | 2.8 | 1.44x | 13.2% | 56.5% | 56.5% |
| | Hospitality/Event Space | 1 | 19,972,889 | 2.3 | 2.38x | 22.0% | 49.9% | 47.5% |
| | Retail/Office | 1 | 15,000,000 | 1.7 | 1.31x | 10.1% | 53.8% | 53.8% |
| | Subtotal: | 4 | $108,722,889 | 12.6% | 2.03x | 15.4% | 45.9% | 45.5% |
| Hospitality | Extended Stay | 2 | $41,075,000 | 4.8% | 1.58x | 14.1% | 60.6% | 60.6% |
| | Full Service | 1 | 33,000,000 | 3.8 | 1.40x | 12.4% | 51.1% | 51.1% |
| | Limited Service | 3 | 17,500,000 | 2.0 | 1.86x | 16.7% | 53.9% | 53.9% |
| | Subtotal: | 6 | $91,575,000 | 10.6% | 1.57x | 14.0% | 55.9% | 55.9% |
| Self Storage | Self Storage | 3 | $8,176,000 | 0.9% | 1.48x | 11.1% | 60.9% | 60.9% |
| Manufactured Housing | RV Park | 1 | $4,704,000 | 0.5% | 1.78x | 14.1% | 60.0% | 60.0% |
| Total / Weighted Average: | 71 | $862,941,672 | 100.0% | 1.71x | 13.2% | 56.7% | 56.4% |
| (1) | Because this table presents information relating to the mortgaged properties and not mortgage loans, the information for mortgage loans secured by more than one mortgaged property is based on allocated loan amounts, individual appraised values, net cash flow or net operating income with respect to such individual mortgaged properties, as applicable. |
| (2) | In the case of Loan Nos. 1, 2, 3, 5, 6, 9, 10, 12, 14, 17, 19, 23 and 33, the UW NCF DSCR, UW NOI Debt Yield, Cut-off Date LTV and Maturity Date/ARD LTV calculations include the related Pari Passu Companion Loan(s). In the case of Loan No. 6, the UW NCF DSCR, UW NOI Debt Yield, Cut-off Date LTV and Maturity Date/ARD LTV calculations exclude the related mezzanine loans. |
| (3) | For the mortgage loans that are interest-only for the entire term or until the anticipated repayment date and accrue interest on an Actual/360 basis, the Monthly Debt Service Amount ($) was calculated as 1/12th of the product of (i) the Original Balance ($), (ii) the Interest Rate % and (iii) 365/360. |
| (4) | In the case of Loan No. 21, the Cut-off Date LTV and Maturity/ARD LTV are calculated by using an appraised value based on a “as complete” assumption. Refer to the definition of “Appraised Value” under “Description of the Mortgage Pool—Certain Calculations and Definitions” in the Preliminary Prospectus for additional details. |
THE INFORMATION IN THIS STRUCTURAL AND COLLATERAL TERM SHEET IS NOT COMPLETE AND MAY BE AMENDED PRIOR TO THE TIME OF SALE. THIS TERM SHEET IS NOT AN OFFER TO SELL THESE SECURITIES AND IT IS NOT A SOLICITATION OF AN OFFER TO BUY THESE SECURITIES IN ANY JURISDICTION WHERE THE OFFER OR SALE IS NOT PERMITTED. |
| | 13 | |
| Structural and Collateral Term Sheet | | BMO 2024-5C4 |
| Collateral Characteristics |
| Mortgaged Properties by Location(1) |
| | | | | Weighted Average |
State | Number of Properties | Cut-off Date Principal Balance | % of IPB | UW
NCF DSCR(2)(3) | UW
NOI Debt Yield(2) | Cut-off Date LTV(2)(4) | Maturity Date/ARD LTV(2)(4) |
| New York | 14 | $287,237,889 | 33.3% | 1.68x | 12.1% | 53.6% | 53.4% |
| Ohio | 11 | 71,043,791 | 8.2 | 1.88x | 13.3% | 56.5% | 56.5% |
| Florida | 6 | 65,143,146 | 7.5 | 1.55x | 10.8% | 66.2% | 66.2% |
| California | 4 | 61,318,148 | 7.1 | 1.39x | 10.6% | 63.5% | 63.5% |
| Virginia | 5 | 55,064,815 | 6.4 | 1.70x | 15.0% | 54.6% | 53.9% |
| Nevada | 1 | 48,915,677 | 5.7 | 2.47x | 26.9% | 51.5% | 48.2% |
| Texas | 3 | 42,084,670 | 4.9 | 1.68x | 13.9% | 63.8% | 63.8% |
| Maryland | 2 | 34,297,421 | 4.0 | 1.27x | 8.7% | 64.3% | 64.3% |
| Utah | 1 | 33,000,000 | 3.8 | 1.40x | 12.4% | 51.1% | 51.1% |
| Michigan | 3 | 32,202,466 | 3.7 | 2.12x | 12.6% | 53.8% | 53.8% |
| Kentucky | 3 | 30,042,238 | 3.5 | 1.95x | 15.4% | 61.0% | 61.0% |
| Washington | 1 | 24,383,106 | 2.8 | 1.30x | 12.7% | 58.8% | 56.2% |
| New Jersey | 2 | 23,500,000 | 2.7 | 1.34x | 10.6% | 53.7% | 53.7% |
| Georgia | 2 | 15,646,296 | 1.8 | 1.76x | 15.0% | 53.5% | 53.3% |
| North Carolina | 1 | 14,333,333 | 1.7 | 1.91x | 15.7% | 55.2% | 55.2% |
| Illinois | 3 | 9,076,799 | 1.1 | 2.00x | 13.1% | 55.9% | 55.9% |
| South Carolina | 4 | 5,599,046 | 0.6 | 2.12x | 12.6% | 53.8% | 53.8% |
| Kansas | 2 | 3,825,484 | 0.4 | 2.12x | 12.6% | 53.8% | 53.8% |
| Missouri | 2 | 3,674,374 | 0.4 | 2.12x | 12.6% | 53.8% | 53.8% |
| Pennsylvania | 1 | 2,552,974 | 0.3 | 2.12x | 12.6% | 53.8% | 53.8% |
| Total / Weighted Average: | 71 | $862,941,672 | 100.0% | 1.71x | 13.2% | 56.7% | 56.4% |
| (1) | Because this table presents information relating to the mortgaged properties and not mortgage loans, the information for mortgage loans secured by more than one mortgaged property is based on allocated loan amounts, individual appraised values, net cash flow or net operating income with respect to such individual mortgaged properties, as applicable. |
| (2) | In the case of Loan Nos. 1, 2, 3, 5, 6, 9, 10, 12, 14, 17, 19, 23 and 33, the UW NCF DSCR, UW NOI Debt Yield, Cut-off Date LTV and Maturity Date/ARD LTV calculations include the related Pari Passu Companion Loan(s). In the case of Loan No. 6, the UW NCF DSCR, UW NOI Debt Yield, Cut-off Date LTV and Maturity Date/ARD LTV calculations exclude the related mezzanine loans. |
| (3) | For the mortgage loans that are interest-only for the entire term or until the anticipated repayment date and accrue interest on an Actual/360 basis, the Monthly Debt Service Amount ($) was calculated as 1/12th of the product of (i) the Original Balance ($), (ii) the Interest Rate % and (iii) 365/360. |
| (4) | In the case of Loan No. 21, the Cut-off Date LTV and Maturity/ARD LTV are calculated by using an appraised value based on a “as complete” assumption. Refer to the definition of “Appraised Value” under “Description of the Mortgage Pool—Certain Calculations and Definitions” in the Preliminary Prospectus for additional details. |
THE INFORMATION IN THIS STRUCTURAL AND COLLATERAL TERM SHEET IS NOT COMPLETE AND MAY BE AMENDED PRIOR TO THE TIME OF SALE. THIS TERM SHEET IS NOT AN OFFER TO SELL THESE SECURITIES AND IT IS NOT A SOLICITATION OF AN OFFER TO BUY THESE SECURITIES IN ANY JURISDICTION WHERE THE OFFER OR SALE IS NOT PERMITTED. |
| | 14 | |
| Structural and Collateral Term Sheet | | BMO 2024-5C4 |
| Collateral Characteristics |
| Cut-off Date Principal Balance |
| | | | | Weighted Average |
| Range of Cut-off Date Principal Balances | Number of Loans | Cut-off Date Principal Balance | % of IPB | Mortgage Rate | Remaining Loan Term | UW
NCF DSCR(1)(2) | UW
NOI
Debt Yield(1) | Cut-off
Date LTV(1)(3) | Maturity Date/ARD LTV(1)(3) |
| $4,100,000 | - | $4,999,999 | 2 | | $8,200,000 | 1.0 | % | 7.71250% | 57 | 1.33x | 11.3% | 53.3% | 52.9% |
| $5,000,000 | - | $9,999,999 | 11 | | 74,695,000 | 8.7 | | 7.30931% | 59 | 1.48x | 11.2% | 59.2% | 59.2% |
| $10,000,000 | - | $19,999,999 | 8 | | 128,422,889 | 14.9 | | 7.38660% | 58 | 1.62x | 13.4% | 59.9% | 59.5% |
| $20,000,000 | - | $29,999,999 | 6 | | 146,208,106 | 16.9 | | 7.33175% | 59 | 1.44x | 11.9% | 61.8% | 61.4% |
| $30,000,000 | - | $39,999,999 | 7 | | 223,500,000 | 25.9 | | 7.05513% | 59 | 1.62x | 12.4% | 57.6% | 57.4% |
| $40,000,000 | - | $70,000,000 | 5 | | 281,915,677 | 32.7 | | 6.61602% | 59 | 2.03x | 15.2% | 51.4% | 50.8% |
| Total / Weighted Average: | 39 | | $862,941,672 | 100.0 | % | 7.03612% | 59 | 1.71x | 13.2% | 56.7% | 56.4% |
| | | | | Weighted Average |
Range of
Mortgage Interest Rates | Number of Loans | Cut-off Date Principal Balance | % of IPB | Mortgage Rate | Remaining Loan Term | UW
NCF DSCR(1)(2) | UW
NOI
Debt Yield(1) | Cut-off
Date LTV(1)(3) | Maturity Date/ARD LTV(1)(3) |
| 5.74400% | - | 5.99999% | 2 | $108,000,000 | 12.5 | % | 5.74717% | 58 | 1.88x | 11.2% | 60.5% | 60.5% |
| 6.00000% | - | 6.49999% | 7 | 217,250,000 | 25.2 | | 6.19913% | 59 | 1.70x | 11.0% | 53.2% | 53.2% |
| 6.50000% | - | 6.99999% | 4 | 51,245,000 | 5.9 | | 6.85056% | 59 | 1.24x | 8.7% | 64.2% | 64.2% |
| 7.00000% | - | 7.49999% | 9 | 143,872,889 | 16.7 | | 7.31428% | 58 | 1.82x | 14.8% | 59.1% | 58.7% |
| 7.50000% | - | 7.99999% | 12 | 229,908,106 | 26.6 | | 7.69705% | 59 | 1.57x | 13.5% | 55.1% | 54.7% |
| 8.00000% | - | 8.46000% | 5 | 112,665,677 | 13.1 | | 8.26613% | 58 | 1.91x | 19.1% | 56.8% | 55.3% |
| Total / Weighted Average: | 39 | $862,941,672 | 100.0 | % | 7.03612% | 59 | 1.71x | 13.2% | 56.7% | 56.4% |
| Original Term to Maturity in Months |
| | | | | Weighted Average |
Original Term to
Maturity in Months | Number of Loans | Cut-off Date Principal Balance | % of IPB | Mortgage Rate | Remaining Loan Term | UW
NCF DSCR(1)(2) | UW
NOI
Debt Yield(1) | Cut-off
Date LTV(1)(3) | Maturity Date/ARD LTV(1)(3) |
| 60 | 39 | $862,941,672 | 100.0 | % | 7.03612% | 59 | 1.71x | 13.2% | 56.7% | 56.4% |
| Total / Weighted Average: | 39 | $862,941,672 | 100.0 | % | 7.03612% | 59 | 1.71x | 13.2% | 56.7% | 56.4% |
| Remaining Term to Maturity in Months |
| | | | | Weighted Average |
| Range of Remaining Term to Maturity in Months | Number of Loans | Cut-off Date Principal Balance | % of IPB | Mortgage Rate | Remaining Loan Term | UW
NCF DSCR(1)(2) | UW
NOI
Debt Yield(1) | Cut-off
Date LTV(1)(3) | Maturity Date/ARD LTV(1)(3) |
| 55 | - | 60 | 39 | $862,941,672 | 100.0 | % | 7.03612% | 59 | 1.71x | 13.2% | 56.7% | 56.4% |
| Total / Weighted Average: | 39 | $862,941,672 | 100.0 | % | 7.03612% | 59 | 1.71x | 13.2% | 56.7% | 56.4% |
| (1) | In the case of Loan Nos. 1, 2, 3, 5, 6, 9, 10, 12, 14, 17, 19, 23 and 33, the UW NCF DSCR, UW NOI Debt Yield, Cut-off Date LTV and Maturity Date/ARD LTV calculations include the related Pari Passu Companion Loan(s). In the case of Loan No. 6, the UW NCF DSCR, UW NOI Debt Yield, Cut-off Date LTV and Maturity Date/ARD LTV calculations exclude the related mezzanine loans. |
| (2) | For the mortgage loans that are interest-only for the entire term or until the anticipated repayment date and accrue interest on an Actual/360 basis, the Monthly Debt Service Amount ($) was calculated as 1/12th of the product of (i) the Original Balance ($), (ii) the Interest Rate % and (iii) 365/360. |
| (3) | In the case of Loan No. 21, the Cut-off Date LTV and Maturity/ARD LTV are calculated by using an appraised value based on a “as complete” assumption. Refer to the definition of “Appraised Value” under “Description of the Mortgage Pool—Certain Calculations and Definitions” in the Preliminary Prospectus for additional details. |
THE INFORMATION IN THIS STRUCTURAL AND COLLATERAL TERM SHEET IS NOT COMPLETE AND MAY BE AMENDED PRIOR TO THE TIME OF SALE. THIS TERM SHEET IS NOT AN OFFER TO SELL THESE SECURITIES AND IT IS NOT A SOLICITATION OF AN OFFER TO BUY THESE SECURITIES IN ANY JURISDICTION WHERE THE OFFER OR SALE IS NOT PERMITTED. |
| | 15 | |
| Structural and Collateral Term Sheet | | BMO 2024-5C4 |
| Collateral Characteristics |
Original Amortization Term in Months |
| | | | | Weighted Average |
Original
Amortization
Term in Months | Number of Loans | Cut-off Date Principal Balance | % of IPB | Mortgage Rate | Remaining Loan Term | UW
NCF DSCR(1)(2) | UW
NOI
Debt Yield(1) | Cut-off
Date LTV(1)(3) | Maturity Date/ARD LTV(1)(3) |
| Interest Only | 34 | $735,570,000 | 85.2 | % | 6.88139% | 58 | 1.66x | 12.1% | 57.3% | 57.3% |
| 300 | 1 | 48,915,677 | 5.7 | | 8.46000% | 58 | 2.47x | 26.9% | 51.5% | 48.2% |
| 360 | 4 | 78,455,995 | 9.1 | | 7.59907% | 59 | 1.67x | 15.5% | 54.5% | 52.5% |
| Total / Weighted Average: | 39 | $862,941,672 | 100.0 | % | 7.03612% | 59 | 1.71x | 13.2% | 56.7% | 56.4% |
| Remaining Amortization Term in Months |
| | | | | Weighted Average |
| Range of Remaining Amortization Term in Months | Number of Loans | Cut-off Date Principal Balance | % of IPB | Mortgage Rate | Remaining Loan Term | UW
NCF DSCR(1)(2) | UW
NOI
Debt Yield(1) | Cut-off
Date LTV(1)(3) | Maturity Date/ARD LTV(1)(3) |
| Interest Only | 34 | $735,570,000 | 85.2 | % | 6.88139% | 58 | 1.66x | 12.1% | 57.3% | 57.3% |
| 298 | 1 | 48,915,677 | 5.7 | | 8.46000% | 58 | 2.47x | 26.9% | 51.5% | 48.2% |
| 358 | - | 360 | 4 | 78,455,995 | 9.1 | | 7.59907% | 59 | 1.67x | 15.5% | 54.5% | 52.5% |
| Total / Weighted Average: | 39 | $862,941,672 | 100.0 | % | 7.03612% | 59 | 1.71x | 13.2% | 56.7% | 56.4% |
| | | | | | | | | | | | |
| | | | | Weighted Average |
| Amortization Types | Number of Loans | Cut-off Date Principal Balance | % of IPB | Mortgage Rate | Remaining Loan Term | UW
NCF DSCR(1)(2) | UW
NOI
Debt Yield(1) | Cut-off
Date LTV(1)(3) | Maturity Date/ARD LTV(1)(3) |
| Interest Only | 34 | $735,570,000 | 85.2 | % | 6.88139% | 58 | 1.66x | 12.1% | 57.3% | 57.3% |
| Amortizing Balloon | 3 | 93,271,672 | 10.8 | | 8.04440% | 58 | 2.14x | 22.1% | 53.1% | 50.1% |
| Interest Only, Amortizing Balloon | 2 | 34,100,000 | 4.0 | | 7.61597% | 60 | 1.52x | 13.8% | 54.2% | 52.9% |
| Total / Weighted Average: | 39 | $862,941,672 | 100.0 | % | 7.03612% | 59 | 1.71x | 13.2% | 56.7% | 56.4% |
| Underwritten Net Cash Flow Debt Service Coverage Ratios(1)(2) |
| | | | | Weighted Average |
| Range of Underwritten Net Cash Flow Debt Service Coverage Ratios | Number of Loans | Cut-off Date Principal Balance | % of IPB | Mortgage Rate | Remaining Loan Term | UW
NCF DSCR(1)(2) | UW
NOI
Debt Yield(1) | Cut-off
Date LTV(1)(3) | Maturity Date/ARD LTV(1)(3) |
| 1.20x | - | 1.49x | 22 | $417,753,106 | 48.4 | % | 6.95797% | 59 | 1.35x | 10.0% | 61.1% | 60.9% |
| 1.50x | - | 1.59x | 4 | 72,000,000 | 8.3 | | 7.75063% | 60 | 1.55x | 13.3% | 61.1% | 60.5% |
| 1.60x | - | 1.69x | 1 | 15,000,000 | 1.7 | | 7.06000% | 57 | 1.64x | 12.1% | 68.8% | 68.8% |
| 1.70x | - | 1.79x | 1 | 7,800,000 | 0.9 | | 7.65000% | 59 | 1.78x | 14.1% | 60.0% | 60.0% |
| 1.80x | - | 1.89x | 2 | 30,200,000 | 3.5 | | 7.87364% | 58 | 1.86x | 16.6% | 55.0% | 55.0% |
| 1.90x | - | 1.99x | 2 | 66,000,000 | 7.6 | | 7.39048% | 58 | 1.93x | 15.8% | 57.6% | 57.6% |
| 2.00x | - | 2.59x | 7 | 254,188,566 | 29.5 | | 6.75040% | 58 | 2.28x | 17.5% | 47.6% | 46.7% |
| Total / Weighted Average: | 39 | $862,941,672 | 100.0 | % | 7.03612% | 59 | 1.71x | 13.2% | 56.7% | 56.4% |
| (1) | In the case of Loan Nos. 1, 2, 3, 5, 6, 9, 10, 12, 14, 17, 19, 23 and 33, the UW NCF DSCR, UW NOI Debt Yield, Cut-off Date LTV and Maturity Date/ARD LTV calculations include the related Pari Passu Companion Loan(s). In the case of Loan No. 6, the UW NCF DSCR, UW NOI Debt Yield, Cut-off Date LTV and Maturity Date/ARD LTV calculations exclude the related mezzanine loans. |
| (2) | For the mortgage loans that are interest-only for the entire term or until the anticipated repayment date and accrue interest on an Actual/360 basis, the Monthly Debt Service Amount ($) was calculated as 1/12th of the product of (i) the Original Balance ($), (ii) the Interest Rate % and (iii) 365/360. |
| (3) | In the case of Loan No. 21, the Cut-off Date LTV and Maturity/ARD LTV are calculated by using an appraised value based on a “as complete” assumption. Refer to the definition of “Appraised Value” under “Description of the Mortgage Pool—Certain Calculations and Definitions” in the Preliminary Prospectus for additional details. |
THE INFORMATION IN THIS STRUCTURAL AND COLLATERAL TERM SHEET IS NOT COMPLETE AND MAY BE AMENDED PRIOR TO THE TIME OF SALE. THIS TERM SHEET IS NOT AN OFFER TO SELL THESE SECURITIES AND IT IS NOT A SOLICITATION OF AN OFFER TO BUY THESE SECURITIES IN ANY JURISDICTION WHERE THE OFFER OR SALE IS NOT PERMITTED. |
| | 16 | |
| Structural and Collateral Term Sheet | | BMO 2024-5C4 |
| Collateral Characteristics |
| LTV Ratios as of the Cut-off Date(1)(3) |
| | | | | Weighted Average |
Range of
Cut-off Date LTVs | Number of Loans | Cut-off Date Principal Balance | % of IPB | Mortgage Rate | Remaining Loan Term | UW
NCF DSCR(1)(2) | UW
NOI
Debt Yield(1) | Cut-off
Date LTV(1)(3) | Maturity Date/ARD LTV(1)(3) |
| 36.9% | - | 49.9% | 5 | $134,072,889 | 15.5 | % | 6.68784% | 58 | 2.24x | 16.4% | 42.4% | 42.1% |
| 50.0% | - | 59.9% | 18 | 436,698,782 | 50.6 | | 7.17131% | 59 | 1.74x | 14.1% | 54.9% | 54.3% |
| 60.0% | - | 64.9% | 10 | 161,655,000 | 18.7 | | 7.13094% | 59 | 1.43x | 10.9% | 63.5% | 63.5% |
| 65.0% | - | 69.9% | 5 | 92,515,000 | 10.7 | | 7.26409% | 58 | 1.41x | 10.7% | 67.7% | 67.7% |
| 70.0% | - | 72.8% | 1 | 38,000,000 | 4.4 | | 5.75300% | 57 | 1.43x | 8.5% | 72.8% | 72.8% |
| Total / Weighted Average: | 39 | $862,941,672 | 100.0 | % | 7.03612% | 59 | 1.71x | 13.2% | 56.7% | 56.4% |
| LTV Ratios as of the Maturity Date(1)(3) |
| | | | | Weighted Average |
Range of
Maturity Date LTVs | Number of Loans | Cut-off Date Principal Balance | % of IPB | Mortgage Rate | Remaining Loan Term | UW
NCF DSCR(1)(2) | UW
NOI
Debt Yield(1) | Cut-off
Date LTV(1)(3) | Maturity Date/ARD LTV(1)(3) |
| 36.9% | - | 49.9% | 6 | $182,988,566 | 21.2 | % | 7.16156% | 58 | 2.30x | 19.2% | 44.9% | 43.7% |
| 50.0% | - | 59.9% | 17 | 387,783,106 | 44.9 | | 7.00875% | 59 | 1.64x | 12.5% | 55.3% | 55.1% |
| 60.0% | - | 64.9% | 10 | 161,655,000 | 18.7 | | 7.13094% | 59 | 1.43x | 10.9% | 63.5% | 63.5% |
| 65.0% | - | 69.9% | 5 | 92,515,000 | 10.7 | | 7.26409% | 58 | 1.41x | 10.7% | 67.7% | 67.7% |
| 70.0% | - | 72.8% | 1 | 38,000,000 | 4.4 | | 5.75300% | 57 | 1.43x | 8.5% | 72.8% | 72.8% |
| Total / Weighted Average: | 39 | $862,941,672 | 100.0 | % | 7.03612% | 59 | 1.71x | 13.2% | 56.7% | 56.4% |
| | | | | Weighted Average |
| Prepayment Protection | Number of Loans | Cut-off Date Principal Balance | % of IPB | Mortgage Rate | Remaining Loan Term | UW
NCF DSCR(1)(2) | UW
NOI
Debt Yield(1) | Cut-off
Date LTV(1)(3) | Maturity Date/ARD LTV(1)(3) |
| Defeasance | 33 | $699,158,566 | 81.0 | % | 7.13923% | 59 | 1.70x | 13.5% | 56.1% | 55.8% |
| Defeasance or Yield Maintenance | 3 | 119,383,106 | 13.8 | | 6.28955% | 59 | 1.77x | 11.7% | 57.4% | 56.9% |
| Yield Maintenance | 3 | 44,400,000 | 5.1 | | 7.41989% | 58 | 1.61x | 12.7% | 64.4% | 64.4% |
| Total / Weighted Average: | 39 | $862,941,672 | 100.0 | % | 7.03612% | 59 | 1.71x | 13.2% | 56.7% | 56.4% |
| | | | | Weighted Average |
| Loan Purpose | Number of Loans | Cut-off Date Principal Balance | % of IPB | Mortgage Rate | Remaining Loan Term | UW
NCF DSCR(1)(2) | UW
NOI
Debt Yield(1) | Cut-off
Date LTV(1)(3) | Maturity Date/ARD LTV(1)(3) |
| Refinance | 31 | $687,745,995 | 79.7 | % | 6.95861% | 59 | 1.65x | 12.3% | 56.1% | 55.9% |
| Recapitalization | 4 | 109,080,000 | 12.6 | | 6.79859% | 58 | 1.73x | 13.0% | 63.1% | 63.1% |
| Acquisition | 3 | 58,315,677 | 6.8 | | 8.31247% | 58 | 2.40x | 25.2% | 52.0% | 49.2% |
| Refinance/Acquisition | 1 | 7,800,000 | 0.9 | | 7.65000% | 59 | 1.78x | 14.1% | 60.0% | 60.0% |
| Total / Weighted Average: | 39 | $862,941,672 | 100.0 | % | 7.03612% | 59 | 1.71x | 13.2% | 56.7% | 56.4% |
| (1) | In the case of Loan Nos. 1, 2, 3, 5, 6, 9, 10, 12, 14, 17, 19, 23 and 33, the UW NCF DSCR, UW NOI Debt Yield, Cut-off Date LTV and Maturity Date/ARD LTV calculations include the related Pari Passu Companion Loan(s). In the case of Loan No. 6, the UW NCF DSCR, UW NOI Debt Yield, Cut-off Date LTV and Maturity Date/ARD LTV calculations exclude the related mezzanine loans. |
| (2) | For the mortgage loans that are interest-only for the entire term or until the anticipated repayment date and accrue interest on an Actual/360 basis, the Monthly Debt Service Amount ($) was calculated as 1/12th of the product of (i) the Original Balance ($), (ii) the Interest Rate % and (iii) 365/360. |
| (3) | In the case of Loan No. 21, the Cut-off Date LTV and Maturity/ARD LTV are calculated by using an appraised value based on a “as complete” assumption. Refer to the definition of “Appraised Value” under “Description of the Mortgage Pool—Certain Calculations and Definitions” in the Preliminary Prospectus for additional details. |
THE INFORMATION IN THIS STRUCTURAL AND COLLATERAL TERM SHEET IS NOT COMPLETE AND MAY BE AMENDED PRIOR TO THE TIME OF SALE. THIS TERM SHEET IS NOT AN OFFER TO SELL THESE SECURITIES AND IT IS NOT A SOLICITATION OF AN OFFER TO BUY THESE SECURITIES IN ANY JURISDICTION WHERE THE OFFER OR SALE IS NOT PERMITTED. |
| | 17 | |
| Structural and Collateral Term Sheet | | BMO 2024-5C4 |
| Collateral Characteristics |
| Previous Securitization History(1) |
| No. | Mortgage Loan Seller | Loan/Property Name | Location | Property Type | Cut-off Date
Principal
Balance | % of IPB | Previous Securitization |
| 1 | BMO, AREF2, SMC | 620 W 153rd Street | New York, NY | Multifamily | $70,000,000 | 8.1% | HIG 2023-FL1 |
| 3 | CREFI | 28-40 West 23rd Street | New York, NY | Mixed Use | $50,000,000 | 5.8% | CGCMT 2014-GC23 |
| 11 | AREF2 | Rialto I & II | Austin, TX | Office | $30,000,000 | 3.5% | AREIT 2019-CRE3 |
| 26 | AREF2 | Home2 Suites Pensacola | Pensacola, FL | Hospitality | $12,700,000 | 1.5% | AREIT 2019-CRE3 |
| 36 | SMC | Mini U Storage Vacaville | Vacaville, CA | Self Storage | $5,080,000 | 0.6% | WFRBS 2014-C24 |
| 38 | AREF2 | The Hill | Columbus, GA | Multifamily | $4,100,000 | 0.5% | UBSCM 2017-C1 |
| (1) | The table above represents the properties for which the previously existing debt was most recently securitized, based on information provided by the related borrower or obtained through searches of a third-party database. |
THE INFORMATION IN THIS STRUCTURAL AND COLLATERAL TERM SHEET IS NOT COMPLETE AND MAY BE AMENDED PRIOR TO THE TIME OF SALE. THIS TERM SHEET IS NOT AN OFFER TO SELL THESE SECURITIES AND IT IS NOT A SOLICITATION OF AN OFFER TO BUY THESE SECURITIES IN ANY JURISDICTION WHERE THE OFFER OR SALE IS NOT PERMITTED. |
| | 18 | |
| Structural and Collateral Term Sheet | | BMO 2024-5C4 |
| Structural Overview |
| ■ Certificates: | | The “Certificates” will consist of the Class A-1, Class A-2, Class A-3, Class X-A, Class X-B, Class X-D, Class X-F, Class A-S, Class B, Class C, Class D, Class E, Class F, Class G-RR, Class J-RR and Class R certificates. The Certificates other than the Class R Certificates are referred to as the “Regular Certificates”. The Class A-1, Class A-2, Class A-3, Class A-S, Class B, Class C, Class D, Class E, Class F, Class G-RR and Class J-RR certificates are collectively referred to as the “Principal Balance Certificates”. The Class X-A, Class X-B, Class X-D and Class X-F certificates are collectively referred to as the “Class X Certificates”. |
| ■ Accrual: | | Each Class of Certificates (other than the Class R Certificates) will accrue interest on a 30/360 basis. The Class R Certificates will not accrue interest. |
| ■ Distributions: | | The aggregate amount available for distribution to holders of the Certificates on each distribution date will be the gross amount of interest, principal, yield maintenance charges and prepayment premiums collected with respect to the mortgage loans in the applicable one-month collection period, net of specified expenses of the issuing entity, including fees payable therefrom to, and losses, liabilities, advances (with interest thereon), costs and expenses reimbursable or indemnifiable therefrom to, the master servicer, the special servicer, the certificate administrator, the trustee, the operating advisor, the asset representations reviewer and CREFC®. On each Distribution Date, funds available for distribution to holders of the Certificates (exclusive of any portion thereof that represents (i) any yield maintenance charges and prepayment premiums collected on the mortgage loans and/or (ii) any excess interest accrued after the related anticipated repayment date on any mortgage loan with an anticipated repayment date) (“ Available Funds”) will be distributed in the following amounts and order of priority (in each case to the extent of remaining available funds): 1. Class A-1, Class A-2, Class A-3, Class X-A, Class X-B, Class X-D and Class X-F certificates: to interest on the Class A-1, Class A-2, Class A-3, Class X-A, Class X-B, Class X-D and Class X-F certificates, up to, and pro rata in accordance with, their respective interest entitlements. 2. Class A-1, Class A-2 and Class A-3 certificates: to the extent of Available Funds allocable to principal received or advanced on the mortgage loans, (i) first to principal on the Class A-1 certificates until their certificate balance is reduced to zero, (ii) second to principal on the Class A-2 certificates until their certificate balance is reduced to zero, all funds available for distribution of principal remaining after the distribution to the Class A-1 certificates in clause (i) above, and (iii) then to principal on the Class A-3 certificates until their certificate balance is reduced to zero, all funds available for distribution of principal remaining after the distributions to the Class A-1 and Class A-2 certificates in clauses (i) and (ii) above. However, if the certificate balances of each and every class of the Class A-S, Class B, Class C, Class D, Class E, Class F, Class G-RR and Class J-RR certificates have been reduced to zero as a result of the allocation of mortgage loan losses and other unanticipated expenses to those certificates, then Available Funds allocable to principal will be distributed to the Class A-1, Class A-2 and Class A-3 certificates, pro rata, based on their respective certificate balances. 3. Class A-1, Class A-2 and Class A-3 certificates: to reimburse the Class A-1, Class A-2 and Class A-3 certificates, pro rata, for any unreimbursed losses on the mortgage loans that were previously allocated to reduce the certificate balances of those classes, together with interest at their respective pass-through rates. 4. Class A-S certificates: (i) first, to interest on the Class A-S certificates in the amount of their interest entitlement; (ii) next, to the extent of Available Funds allocable to principal remaining after distributions in respect of principal to each class of Principal Balance Certificates with a higher principal payment priority (in this case, the Class A-1, Class A-2 and Class A-3 certificates), to principal on the Class A-S certificates until their certificate balance is reduced to zero; and (iii) next, to reimburse the Class A-S certificates for any unreimbursed losses on the mortgage loans that were previously allocated to reduce the certificate balance of that class, together with interest at its pass-through rate. 5. Class B certificates: (i) first, to interest on the Class B certificates in the amount of their interest entitlement; (ii) next, to the extent of Available Funds allocable to principal remaining after distributions in respect of principal to each class of Principal Balance Certificates with a higher principal payment priority (in this case, the Class A-1, Class A-2, Class A-3 and Class A-S certificates), to principal on the Class B certificates until their certificate balance is reduced to zero; and (iii) next, to reimburse Class B certificates for any unreimbursed losses on the mortgage loans that were previously allocated to reduce the certificate balance of that class, together with interest at its pass-through rate. 6. Class C certificates: (i) first, to interest on the Class C certificates in the amount of their interest entitlement; (ii) next, to the extent of Available Funds allocable to principal remaining after distributions in respect of principal to each class of Principal Balance Certificates with a higher principal payment priority (in this case, the Class A-1, Class A-2, Class A-3, Class A-S and Class |
THE INFORMATION IN THIS STRUCTURAL AND COLLATERAL TERM SHEET IS NOT COMPLETE AND MAY BE AMENDED PRIOR TO THE TIME OF SALE. THIS TERM SHEET IS NOT AN OFFER TO SELL THESE SECURITIES AND IT IS NOT A SOLICITATION OF AN OFFER TO BUY THESE SECURITIES IN ANY JURISDICTION WHERE THE OFFER OR SALE IS NOT PERMITTED. |
| | 19 | |
| Structural and Collateral Term Sheet | | BMO 2024-5C4 |
| Structural Overview |
| | B certificates), to principal on the Class C certificates until their certificate balance is reduced to zero; and (iii) next, to reimburse the Class C certificates for any unreimbursed losses on the mortgage loans that were previously allocated to reduce the certificate balance of that class, together with interest at its pass-through rate. 7. After the Class A-1, Class A-2, Class A-3, Class X-A, Class X-B, Class X-D, Class X-F, Class A-S, Class B and Class C certificates are paid all amounts to which they are entitled on such Distribution Date, the remaining Available Funds will be used to pay interest to the Class D, Class E, Class F, Class G-RR and Class J-RR certificates, and to pay principal to, and to reimburse (with interest) any unreimbursed losses to, the Class D, Class E, Class F, Class G-RR and Class J-RR certificates, sequentially in order, and with respect to each such class of Principal Balance Certificates, in a manner analogous to the Class C certificates pursuant to clause 6 above. |
■ Realized Losses: | | The certificate balances of the Principal Balance Certificates will each be reduced without distribution on any Distribution Date as a write-off to the extent of any loss realized on the mortgage loans allocated to the related class on such Distribution Date. On each Distribution Date, any such losses will be applied to the respective classes of Principal Balance Certificates in the following order, in each case until the related certificate balance is reduced to zero: first to the Class J-RR certificates; second, to the Class G-RR certificates; third, to the Class F certificates; fourth, to the Class E certificates; fifth, to the Class D certificates; sixth, to the Class C certificates; seventh, to the Class B certificates; eighth, to the Class A-S certificates; and, finally pro rata, to the Class A-1, Class A-2 and Class A-3 certificates, based on their then current respective certificate balances. The notional amount of each class of Class X Certificates will be reduced to reflect reductions in the certificate balance(s) of the class (or classes, as applicable) of Corresponding Principal Balance Certificates as a result of allocations of losses realized on the mortgage loans to such class(es) of Principal Balance Certificates. |
| ■ Prepayment Premiums and Yield Maintenance Charges: | | On each Distribution Date, until the notional amounts of the Class X-A, Class X-B and Class X-D certificates and the certificate balances of the Class A-1, Class A-2, Class A-3, Class A-S, Class B, Class C, Class D and Class E certificates have been reduced to zero, each yield maintenance charge collected on the mortgage loans during the related one-month collection period (or, in the case of an outside serviced mortgage loan, that accompanied a principal prepayment included in the Available Funds for such Distribution Date) is required to be distributed to holders of the Regular Certificates (excluding holders of the Class F, Class G-RR and Class J-RR certificates) as follows: (a) first such yield maintenance charge will be allocated among (i) the group (the “YM Group A”) of the Class A-1, Class A-2, Class A-3 and Class X-A certificates, (ii) the group (the “YM Group A-S/B/C”) comprised of the Class A-S, Class B, Class C and Class X-B certificates and (iii) the group (the “YM Group D/E”, and the YM Group A, the YM Group A-S/B/C and the YM Group D/E, collectively, the “YM Groups”) comprised of the Class D, Class E and Class X-D certificates, pro rata, based upon the aggregate amount of principal distributed to the class or classes of Principal Balance Certificates in each YM Group on such Distribution Date, and (b) then the portion of such yield maintenance charge allocated to each YM Group will be further allocated as among the classes of Regular Certificates in such YM Group, in the following manner: (i) each class of Principal Balance Certificates in such YM Group will entitle the applicable certificateholders to receive on the applicable Distribution Date that portion of such yield maintenance charge equal to the product of (X) a fraction whose numerator is the amount of principal distributed to such class of Principal Balance Certificates on such Distribution Date and whose denominator is the total amount of principal distributed to all of the Principal Balance Certificates in that YM Group on such Distribution Date, (Y) except in the case of any YM Group comprised solely of one or more classes of Principal Balance Certificates, the Base Interest Fraction (as defined in the Preliminary Prospectus) for the related principal prepayment and such class of Principal Balance Certificates, and (Z) the portion of such yield maintenance charge allocated to such YM Group, and (ii) the portion of such yield maintenance charge allocated to such YM Group and remaining after such distributions with respect to the Principal Balance Certificates in such YM Group will be distributed to the class of Class X Certificates (if any) in such YM Group. If there is more than one class of Principal Balance Certificates in any YM Group entitled to distributions of principal on any particular Distribution Date on which yield maintenance charges are distributable to such classes, the aggregate portion of such yield maintenance charges allocated to such YM Group will be allocated among all such classes of Principal Balance Certificates up to, and on a pro rata basis in accordance with, their respective entitlements to those yield maintenance charges in accordance with the prior sentence of this paragraph. If a prepayment premium (calculated as a percentage of the amount prepaid) is imposed in connection with a prepayment rather than a yield maintenance charge, then the prepayment premium so collected will be allocated as described above. For this purpose, the discount rate used to calculate the Base Interest Fraction will be the discount rate used to determine the yield maintenance charge for mortgage loans that require payment at the greater of a yield maintenance charge or a minimum amount equal to a fixed percentage of the principal balance of the mortgage loan or, for mortgage loans that only have a prepayment premium based on a fixed percentage of the principal balance of the mortgage loan, such other discount rate as may be specified in the related loan documents. |
THE INFORMATION IN THIS STRUCTURAL AND COLLATERAL TERM SHEET IS NOT COMPLETE AND MAY BE AMENDED PRIOR TO THE TIME OF SALE. THIS TERM SHEET IS NOT AN OFFER TO SELL THESE SECURITIES AND IT IS NOT A SOLICITATION OF AN OFFER TO BUY THESE SECURITIES IN ANY JURISDICTION WHERE THE OFFER OR SALE IS NOT PERMITTED. |
| | 20 | |
| Structural and Collateral Term Sheet | | BMO 2024-5C4 |
| Structural Overview |
| | After the notional amounts of the Class X-A, Class X-B and Class X-D certificates and the certificate balances of the Class A-1, Class A-2, Class A-3, Class A-S, Class B, Class C, Class D and Class E certificates have been reduced to zero, all prepayment premiums and yield maintenance charges with respect to the mortgage loans will be allocated among the holders of the Class F, Class G-RR and Class J-RR certificates as provided in the BMO 2024-5C4 pooling and servicing agreement. No yield maintenance charges or prepayment premiums will be distributed to the holders of the Class X-F and Class R certificates. For a description of prepayment premiums and yield maintenance charges required on the mortgage loans, see Annex A to the Preliminary Prospectus. See also “Certain Legal Aspects of the Mortgage Loans—Default Interest and Limitations on Prepayments” in the Preliminary Prospectus. |
| ■ Advances: | | The master servicer and, if it fails to do so, the trustee, will be obligated to make P&I advances with respect to each mortgage loan in the issuing entity and, with respect to all of the mortgage loans serviced under the BMO 2024-5C4 pooling and servicing agreement, servicing advances, including paying delinquent property taxes, condominium assessments, insurance premiums and ground lease rents, but only to the extent that those advances are not deemed non-recoverable from collections on the related mortgage loan and, in the case of servicing advances, any related companion loans as described below. P&I advances are subject to reduction in connection with any appraisal reductions that may occur. The special servicer will have no obligation to make any advances, provided that, in an urgent or emergency situation requiring the making of a property protection advance, the special servicer may, in its sole discretion, make a property protection advance and will be entitled to reimbursement from the master servicer for such advance. The master servicer, the special servicer and the trustee will each be entitled to receive interest on advances they make at the prime rate (and, solely in the case of the master servicer, subject to a floor of 2.0% per annum), compounded annually. |
■ Serviced Mortgage Loans/Outside Serviced Mortgage Loans: | | One or more whole loans may each constitute an “outside serviced whole loan”, in which case (as identified under “Collateral Characteristics—Pari Passu Companion Loan Summary” above), the BMO 2024-5C4 pooling and servicing agreement is not the Controlling PSA, and each related mortgage loan constitutes an “outside serviced mortgage loan,” each related companion loan constitutes an “outside serviced companion loan,” and each related Controlling PSA constitutes an “outside servicing agreement.” One or more whole loans may be identified in the Preliminary Prospectus as a “servicing shift whole loan”, in which case the related mortgage loan constitutes a “servicing shift mortgage loan” and each related companion loan constitutes a “servicing shift companion loan”. Any servicing shift whole loan will initially be serviced pursuant to the BMO 2024-5C4 pooling and servicing agreement during which time such mortgage loan, such whole loan and each related companion loan will be a serviced mortgage loan, a serviced whole loan and a serviced companion loan (each as defined below), respectively. However, upon the inclusion of the related controlling pari passu companion loan in a future securitization transaction, the servicing of such mortgage loan will shift to the servicing agreement governing such securitization transaction, and such mortgage loan, such whole loan and each related companion loan will be an outside serviced mortgage loan, an outside serviced whole loan and an outside serviced companion loan, respectively. All of the mortgage loans transferred to the issuing entity (other than any outside serviced mortgage loan) are sometimes referred to in this Term Sheet as the “serviced mortgage loans” and, together with any related companion loans, as the “serviced loans” (which signifies that they are being serviced by the master servicer and the special servicer under the BMO 2024-5C4 pooling and servicing agreement); each related whole loan constitutes a “serviced whole loan”; and each related companion loan constitutes a “serviced companion loan.” See “Description of the Mortgage Pool—The Whole Loans” in the Preliminary Prospectus. |
| ■ Appraisal Reduction Amounts: | | An Appraisal Reduction Amount generally will be created with respect to a required appraisal loan (which is a serviced loan as to which certain defaults, modifications or insolvency events have occurred (as further described in the Preliminary Prospectus)) in the amount, if any, by which the principal balance of such required appraisal loan, plus other amounts overdue or advanced in connection with such required appraisal loan, exceeds 90% of the appraised value of the related mortgaged property (subject to certain downward adjustments permitted under the BMO 2024-5C4 pooling and servicing agreement) plus certain escrows and reserves (including letters of credit) held with respect to such required appraisal loan; provided that, if so provided in the related co-lender agreement, the holder of a subordinate companion loan may be permitted to post cash or a letter of credit to offset some or all of an Appraisal Reduction Amount. In the case of an outside serviced mortgage loan, any Appraisal Reduction Amounts will be calculated pursuant to, and by a party to, the related outside servicing agreement. In general, any Appraisal Reduction Amount calculated with respect to a whole loan will be allocated first, to any related subordinate companion loan(s) (up to the outstanding principal balance(s) thereof), and then, to the related mortgage loan and any related pari passu companion loan(s) on a pro rata basis in accordance with their respective outstanding principal balances. As a result of an Appraisal Reduction Amount being calculated for and/or allocated to a given mortgage loan, the interest portion of any P&I advance for such mortgage loan will be reduced, which (to the extent of the reduction in such P&I advance) will have the effect of reducing the amount of interest available to the most subordinate class(es) of Certificates then outstanding (i.e., first, to the |
THE INFORMATION IN THIS STRUCTURAL AND COLLATERAL TERM SHEET IS NOT COMPLETE AND MAY BE AMENDED PRIOR TO THE TIME OF SALE. THIS TERM SHEET IS NOT AN OFFER TO SELL THESE SECURITIES AND IT IS NOT A SOLICITATION OF AN OFFER TO BUY THESE SECURITIES IN ANY JURISDICTION WHERE THE OFFER OR SALE IS NOT PERMITTED. |
| | 21 | |
| Structural and Collateral Term Sheet | | BMO 2024-5C4 |
| Structural Overview |
| | Class J-RR certificates, then, to the Class G-RR certificates, then, to the Class F certificates, then, to the Class E certificates, then, to the Class D certificates, then, to the Class C certificates, then, to the Class B certificates, then, to the Class A-S certificates, and then, pro rata based on interest entitlements, to the Class A-1, Class A-2, Class A-3, Class X-A, Class X-B, Class X-D and Class X-F certificates). In general, a serviced loan will cease to be a required appraisal loan, and no longer be subject to an Appraisal Reduction Amount, when the same has ceased to be a specially serviced loan (if applicable), has been brought current for at least three consecutive months and no other circumstances exist that would cause such serviced loan to be a required appraisal loan. For various purposes under the BMO 2024-5C4 pooling and servicing agreement (including, with respect to the Principal Balance Certificates, for purposes of determining the Non-Reduced Certificates and the Controlling Class, as well as the occurrence of a Control Termination Event and an Operating Advisor Consultation Trigger Event), any Appraisal Reduction Amounts in respect of or allocated to the mortgage loans will be allocated to notionally reduce the certificate balances of the Principal Balance Certificates as follows: first, to the Class J-RR, Class G-RR, Class F, Class E, Class D, Class C, Class B and Class A-S certificates, in that order, in each case until the related certificate balance is notionally reduced to zero; and then to the Class A-1, Class A-2 and Class A-3 certificates, pro rata based on certificate balance. |
■ Cumulative Appraisal Reduction Amounts: | | A “Cumulative Appraisal Reduction Amount”, as calculated as of any date of determination, is equal to the sum of (i) all Appraisal Reduction Amounts then in effect, and (ii) with respect to any AB Modified Loans, any Collateral Deficiency Amount then in effect. With respect to any class of certificates, references to any Cumulative Appraisal Reduction Amount allocable thereto mean the aggregate portion of any Appraisal Reduction Amounts and/or Collateral Deficiency Amounts comprising such Cumulative Appraisal Reduction Amount that are allocable to such class under the Pooling and Servicing Agreement. “Collateral Deficiency Amount” means, with respect to any AB Modified Loan as of any date of determination, the excess of (i) the stated principal balance of such AB Modified Loan (taking into account the related junior note(s) included therein), over (ii) the sum of (in the case of a whole loan, solely to the extent allocable to the subject mortgage loan) (x) the most recent appraised value for the related mortgaged property or mortgaged properties, plus (y) solely to the extent not reflected or taken into account in such appraised value and to the extent on deposit with, or otherwise under the control of, the lender as of the date of such determination, any capital or additional collateral contributed by the related borrower at the time the mortgage loan became (and as part of the modification related to) such AB Modified Loan for the benefit of the related mortgaged property or mortgaged properties (provided, that in the case of an outside serviced mortgage loan, the amounts set forth in this clause (y) will be taken into account solely to the extent relevant information is received), plus (z) any other escrows or reserves (in addition to any amounts set forth in the immediately preceding clause (y)) held by the lender in respect of such AB Modified Loan as of the date of such determination. For purposes of determining the identity of the Controlling Class and the existence of a Control Termination Event and an Operating Advisor Consultation Trigger Event, Collateral Deficiency Amounts will be allocable to the respective classes of Control Eligible Certificates (as defined below), in reverse alphabetical order of class designation, in a manner similar to the allocation of Appraisal Reduction Amounts to such classes. “AB Modified Loan” means any corrected mortgage loan (1) that became a corrected mortgage loan (which includes for purposes of this definition any outside serviced mortgage loan that became a “corrected” mortgage loan (or any term substantially similar thereto) pursuant to the related outside servicing agreement) due to a modification thereto that resulted in the creation of an A/B note structure (or similar structure) and as to which the new junior note(s) did not previously exist or the principal amount of the new junior note(s) was previously part of either an A note held by the trust or the original unmodified mortgage loan and (2) as to which an Appraisal Reduction Amount is not in effect. |
| ■ Age of Appraisals: | | Appraisals (which can be an update of a prior appraisal) with respect to a serviced loan are required to be no older than 9 months for purposes of determining appraisal reductions (other than the annual re-appraisal), market value, and other calculations as described in the Preliminary Prospectus. |
| ■ Sale of Defaulted Loans: | | There will be no “Fair Market Value Purchase Option”. Instead, defaulted mortgage loans will be sold in a process similar to the sale process for REO property. With respect to an outside serviced whole loan, the party acting as special servicer with respect to such outside serviced whole loan pursuant to the related outside servicing agreement (the “outside special servicer”) may offer to sell to any person (or may offer to purchase) for cash such outside serviced whole loan in accordance with the terms of the related outside servicing agreement during such time as such outside serviced whole loan constitutes a defaulted mortgage loan qualifying for sale thereunder and, in connection with any such sale, the related outside special servicer is required to sell both the applicable outside serviced mortgage loan and the related outside serviced pari passu companion loan(s) and, if so provided in the related co-lender agreement or the Controlling PSA, any related subordinate companion loan(s), together as one defaulted loan. |
THE INFORMATION IN THIS STRUCTURAL AND COLLATERAL TERM SHEET IS NOT COMPLETE AND MAY BE AMENDED PRIOR TO THE TIME OF SALE. THIS TERM SHEET IS NOT AN OFFER TO SELL THESE SECURITIES AND IT IS NOT A SOLICITATION OF AN OFFER TO BUY THESE SECURITIES IN ANY JURISDICTION WHERE THE OFFER OR SALE IS NOT PERMITTED. |
| | 22 | |
| Structural and Collateral Term Sheet | | BMO 2024-5C4 |
| Structural Overview |
| ■ Directing Holder: | | The “Directing Holder” with respect to any mortgage loan or whole loan serviced under the BMO 2024-5C4 pooling and servicing agreement will be: ● except (i) with respect to an excluded mortgage loan, (ii) with respect to a serviced whole loan as to which the Controlling Note is held outside the issuing entity (sometimes referred to in this Term Sheet as a “serviced outside controlled whole loan”), and (iii) during any period that a Control Termination Event has occurred and is continuing, the Controlling Class Representative; and ● with respect to any serviced outside controlled whole loan (which may include a servicing shift whole loan or any other serviced whole loan with a controlling companion loan held outside the issuing entity), if and for so long as such holder is entitled under the related co-lender agreement to exercise consent rights similar to those entitled to be exercised by the Controlling Class Representative, the holder of the related Controlling Note (during any such period, the “outside controlling note holder”). The applicable directing holder (or equivalent party) with respect to any outside serviced mortgage loan will be, in general, (i) in the event the related Controlling Note is included in the subject outside securitization transaction, the controlling class representative (or equivalent entity) under the related outside servicing agreement, and (ii) in all other cases, the third party holder of the related Controlling Note or its representative (which may be a controlling class representative (or equivalent entity) under a separate securitization transaction to which such note has been transferred (if any)), as provided in the related co-lender agreement. An “excluded mortgage loan” is, if the Controlling Class Representative is the Directing Holder with respect to the subject mortgage loan, a mortgage loan or related whole loan with respect to which the Controlling Class Representative or the holder(s) of more than 50% of the Controlling Class (by certificate balance) is (or are) a Borrower Party (as defined in the Preliminary Prospectus). |
■ Controlling Class
Representative: | | The “Controlling Class Representative” will be the controlling class certificateholder or other representative designated by at least a majority of the controlling class certificateholders by certificate balance. The “Controlling Class” is, as of any time of determination, the most subordinate class of the Control Eligible Certificates that has an outstanding certificate balance as notionally reduced by any Cumulative Appraisal Reduction Amount allocable to such class, at least equal to 25% of the initial certificate balance of that class of certificates; provided that (except under the circumstances set forth in the next proviso) if no such class meets the preceding requirement, then the Class G-RR certificates will be the controlling class; provided, further, however, that if, at any time, the aggregate outstanding certificate balance of the classes of Principal Balance Certificates senior to the Control Eligible Certificates has been reduced to zero (without regard to the allocation of any Cumulative Appraisal Reduction Amounts), then the “Controlling Class” will be the most subordinate class of Control Eligible Certificates with an outstanding certificate balance greater than zero (without regard to the allocation of any Cumulative Appraisal Reduction Amounts). The “Control Eligible Certificates” consist of the Class G-RR and Class J-RR certificates. See “The Pooling and Servicing Agreement—Directing Holder” in the Preliminary Prospectus. No other class of certificates will be eligible to act as the controlling class or appoint a Controlling Class Representative. No person may exercise any of the rights and powers of the Controlling Class Representative with respect to an excluded mortgage loan. It is anticipated that on the closing date (i) Argentic Securities Holdings 2 Cayman Limited, an affiliate of Argentic Real Estate Finance 2 LLC and Argentic Services Company LP, will be the holder of the VRR Interest and the HRR Interest, (ii) Argentic Securities Income USA 2 LLC or an affiliate is expected to be the initial controlling class certificateholder and be appointed as the initial directing holder with respect to each mortgage loan (other than (a) any non-serviced mortgage loans or (b) any excluded loan with respect to the directing holder) and (iii) Argentic CMBS Holdings II Ltd is expected to purchase the Class X-F and Class F certificates (in each case, other than the portion that comprises the “VRR interest” as described in “Credit Risk Retention” in the Preliminary Prospectus). |
■ Control Termination Event: | | A “Control Termination Event” will: with respect to any mortgage loan either (a) occur when none of the classes of the Control Eligible Certificates has an outstanding certificate balance (as notionally reduced by any Cumulative Appraisal Reduction Amount then allocable to such class) that is at least equal to 25% of the initial certificate balance of that class of certificates or (b) be deemed to occur as described below; provided, however, that a Control Termination Event will in no event exist at any time that the certificate balance of each class of the Principal Balance Certificates senior to the Control Eligible Certificates (without regard to the allocation of Cumulative Appraisal Reduction Amounts) has been reduced to zero. With respect to excluded mortgage loans as to which the Controlling Class Representative would otherwise be the Directing Holder, a Control Termination Event will be deemed to exist. |
THE INFORMATION IN THIS STRUCTURAL AND COLLATERAL TERM SHEET IS NOT COMPLETE AND MAY BE AMENDED PRIOR TO THE TIME OF SALE. THIS TERM SHEET IS NOT AN OFFER TO SELL THESE SECURITIES AND IT IS NOT A SOLICITATION OF AN OFFER TO BUY THESE SECURITIES IN ANY JURISDICTION WHERE THE OFFER OR SALE IS NOT PERMITTED. |
| | 23 | |
| Structural and Collateral Term Sheet | | BMO 2024-5C4 |
| Structural Overview |
| | The holders of Certificates representing the majority of the certificate balance of the most senior class of Control Eligible Certificates whose certificate balance is notionally reduced to less than 25% of the initial certificate balance of that class as a result of an allocation of an Appraisal Reduction Amount or a Collateral Deficiency Amount, as applicable, to such class will have the right to challenge the Special Servicer’s Appraisal Reduction Amount determination or a Collateral Deficiency Amount determination, as applicable, and, at their sole expense, obtain a second appraisal for any serviced loan for which an Appraisal Reduction Event has occurred or as to which there exists a Collateral Deficiency Amount, under the circumstances described in the Preliminary Prospectus. |
■ Consultation Termination Event: | | A “Consultation Termination Event” with respect to any mortgage loan, (a) when none of the classes of Control Eligible Certificates has an outstanding certificate balance, without regard to the allocation of any Cumulative Appraisal Reduction Amount, that is equal to or greater than 25% of the initial certificate balance of that class of certificates or (b) be deemed to occur as described below; provided, however, that a Consultation Termination Event will in no event exist at any time that the certificate balance of each class of the Principal Balance Certificates senior to the Control Eligible Certificates (without regard to the allocation of Cumulative Appraisal Reduction Amounts) has been reduced to zero. With respect to excluded mortgage loans as to which the Controlling Class Representative would otherwise be a Consulting Party, a Consultation Termination Event will be deemed to exist. |
■ Control/Consultation Rights: | | With respect to any Serviced Loan, the applicable Directing Holder will be entitled to have consent and/or consultation rights under the BMO 2024-5C4 pooling and servicing agreement with respect to certain major decisions (including with respect to assumptions, waivers, certain loan modifications and workouts) and other matters with respect to each serviced loan. After the occurrence and during the continuance of a Control Termination Event, the consent rights of the Controlling Class Representative will terminate, and the Controlling Class Representative will retain non-binding consultation rights under the BMO 2024-5C4 pooling and servicing agreement with respect to certain major decisions and other matters with respect to the serviced mortgage loans, other than (i) any excluded mortgage loan and (ii) any serviced outside controlled whole loan. After the occurrence and during the continuance of a Consultation Termination Event, all of these rights of the Controlling Class Representative with respect to the applicable serviced loans will terminate. With respect to any serviced outside controlled whole loan (including any servicing shift whole loan for so long as it is serviced under the BMO 2024-5C4 pooling and servicing agreement), the holder of the related Controlling Note or its representative (which holder or representative will not be the Controlling Class Representative) will instead be entitled to exercise the above-described consent and consultation rights, to the extent provided under the related co-lender agreement. With respect to each outside serviced whole loan, the applicable outside controlling class representative or other related controlling noteholder pursuant to, and subject to the limitations set forth in, the related outside servicing agreement and the related co-lender agreement will have consent, consultation, approval and direction rights with respect to certain major decisions (including with respect to assumptions, waivers, loan modifications and workouts) regarding such outside serviced whole loan, as provided for in the related co-lender agreement and in the related outside servicing agreement. To the extent permitted under the related co-lender agreement, the Controlling Class Representative (so long as a Consultation Termination Event does not exist) may have certain consultation rights with respect to each outside serviced whole loan. See “Description of the Mortgage Pool—The Whole Loans” in the Preliminary Prospectus. |
■ Risk Retention Consultation
Party: | | The “risk retention consultation party”, with respect to any serviced mortgage loan or, if applicable, serviced whole loan will be the party selected by Argentic Real Estate Finance 2 LLC. The risk retention consultation party will have certain non-binding consultation rights in certain circumstances, (i) for so long as no Consultation Termination Event is continuing, with respect to any specially serviced loan (other than any outside serviced mortgage loan), and (ii) during the continuance of a Consultation Termination Event, with respect to any mortgage loan (other than any outside serviced mortgage loan), as further described in the Preliminary Prospectus. Notwithstanding the foregoing, the risk retention consultation party will not have any consultation rights with respect to any mortgage loan that is an excluded RRCP mortgage loan with respect to such party. With respect to any risk retention consultation party, an “excluded RRCP mortgage loan” is a mortgage loan or whole loan with respect to which such risk retention consultation party, or the person(s) entitled to appoint such risk retention consultation party, is a Borrower Party. |
THE INFORMATION IN THIS STRUCTURAL AND COLLATERAL TERM SHEET IS NOT COMPLETE AND MAY BE AMENDED PRIOR TO THE TIME OF SALE. THIS TERM SHEET IS NOT AN OFFER TO SELL THESE SECURITIES AND IT IS NOT A SOLICITATION OF AN OFFER TO BUY THESE SECURITIES IN ANY JURISDICTION WHERE THE OFFER OR SALE IS NOT PERMITTED. |
| | 24 | |
| Structural and Collateral Term Sheet | | BMO 2024-5C4 |
| Structural Overview |
| ■ Termination of Special Servicer: | | At any time, the special servicer (but not any outside special servicer for any outside serviced whole loan) may be removed and replaced by the applicable Directing Holder, if any, with or without cause upon satisfaction of certain conditions specified in the BMO 2024-5C4 pooling and servicing agreement. After the occurrence and during the continuance of a Control Termination Event, the holders of at least 25% of the voting rights of the Certificates (without regard to the application of any Appraisal Reduction Amounts) may request a vote to replace the special servicer (with respect to all of the serviced loans other than any serviced outside controlled whole loan). The subsequent vote may result in the termination and replacement of the special servicer if, within 180 days of the initial request for that vote, the holders of (a) at least 66-2/3% of the voting rights allocable to the Certificates of those holders that voted on the matter (provided that holders representing the applicable Certificateholder Quorum voted on the matter), or (b) more than 50% of the voting rights of each class of Certificates that are Non-Reduced Certificates vote affirmatively to so replace. “Non-Reduced Certificates” means each class of Principal Balance Certificates that has an outstanding certificate balance as may be notionally reduced by any Appraisal Reduction Amounts allocated to that class, equal to or greater than 25% of an amount equal to the initial certificate balance of that class of certificates minus all principal payments made on such class of certificates. Notwithstanding the foregoing, but subject to the discussion in the next paragraph, solely with respect to a serviced outside controlled whole loan (including any servicing shift whole loan, for so long as it is serviced pursuant to the BMO 2024-5C4 pooling and servicing agreement), only the holder of the related Controlling Note or its representative may terminate the special servicer without cause (solely with respect to the related whole loan) and appoint a replacement special servicer for that whole loan. If the operating advisor determines, in its sole discretion exercised in good faith, that (1) the special servicer has failed to comply with the servicing standard and (2) a replacement of the special servicer would be in the best interest of the certificateholders (as a collective whole), the operating advisor will have the right to recommend the replacement of the special servicer with respect to the serviced loans, resulting in a solicitation of a certificateholder vote. The subsequent vote may result in the termination and replacement of the special servicer if, within 180 days of the initial request for that vote, the holders of at least a majority of the aggregate outstanding principal balance of the Certificates of those holders that voted on the matter (provided that holders representing the applicable Certificateholder Quorum vote on the matter) vote affirmatively to so replace. “Certificateholder Quorum” means a quorum that: (a) for purposes of a vote to terminate and replace the special servicer or the asset representations reviewer at the request of the holders of Certificates evidencing not less than 25% of the voting rights (without regard to the application of any Appraisal Reduction Amounts), consists of the holders of Certificates evidencing at least 50% of the voting rights (taking into account the allocation of any Appraisal Reduction Amounts to notionally reduce the certificate balances of the respective classes of Principal Balance Certificates) of all of the Certificates, on an aggregate basis; and (b) for purposes of a vote to terminate and replace the special servicer based on a recommendation of the operating advisor, consists of the holders of Certificates evidencing at least 20% of the aggregate of the outstanding principal balances of all Certificates, with such quorum including at least (3) holders and/or beneficial owners of Certificates that are not “affiliated” (as defined in Regulation RR) with each other. The related outside special servicer under each outside servicing agreement generally may be (or, if the applicable outside servicing agreement has not yet been executed, it is anticipated that such outside special servicer may be) replaced by the related outside controlling class representative (or an equivalent party), or the vote of the requisite holders of certificates issued, under the applicable outside servicing agreement (depending on whether or not the equivalent of a control termination event or a consultation termination event exists under that outside servicing agreement) or by any applicable other controlling noteholder under the related co-lender agreement in a manner generally similar to the manner in which the special servicer may be replaced under the BMO 2024-5C4 pooling and servicing agreement as described above in this “Termination of Special Servicer” section (although there will be differences, in particular as regards certificateholder votes and the timing of when an outside special servicer may be terminated based on the recommendation of an operating advisor). If the special servicer, to its knowledge, becomes a Borrower Party with respect to a mortgage loan, the special servicer will not be permitted to act as special servicer with respect to that mortgage loan. Subject to certain limitations described in the Preliminary Prospectus, any applicable Directing Holder will be entitled to appoint a replacement special servicer for that mortgage loan. If there is no applicable Directing Holder or if the applicable Directing Holder does not take action to appoint a replacement special servicer within the requisite time period, a replacement special servicer will be appointed in the manner specified in the BMO 2024-5C4 pooling and servicing agreement. |
THE INFORMATION IN THIS STRUCTURAL AND COLLATERAL TERM SHEET IS NOT COMPLETE AND MAY BE AMENDED PRIOR TO THE TIME OF SALE. THIS TERM SHEET IS NOT AN OFFER TO SELL THESE SECURITIES AND IT IS NOT A SOLICITATION OF AN OFFER TO BUY THESE SECURITIES IN ANY JURISDICTION WHERE THE OFFER OR SALE IS NOT PERMITTED. |
| | 25 | |
| Structural and Collateral Term Sheet | | BMO 2024-5C4 |
| Structural Overview |
| ■ Voting Rights: | | At all times during the term of the BMO 2024-5C4 pooling and servicing agreement, the voting rights for the Certificates (the “voting rights”) will be allocated among the respective classes of certificateholders in the following percentages: (1) 1% in the aggregate in the case of the respective classes of the Class X Certificates, allocated pro rata based upon their respective notional amounts as of the date of determination (for so long as the notional amount of at least one class of the Class X Certificates is greater than zero), and (2) in the case of any class of Principal Balance Certificates, a percentage equal to the product of 99% (or, if the notional amounts of all classes of the Class X Certificates have been reduced to zero, 100%) and a fraction, the numerator of which is equal to the certificate balance of such class of Principal Balance Certificates as of the date of determination, and the denominator of which is equal to the aggregate of the certificate balances of all classes of the Principal Balance Certificates, in each case, as of the date of determination, provided, that in certain circumstances described under “The Pooling and Servicing Agreement” in the Preliminary Prospectus, voting rights will only be exercisable by holders of Certificates that are Non-Reduced Certificates and/or may otherwise be exercisable or allocated in a manner that takes into account the allocation of Appraisal Reduction Amounts. The voting rights of any class of certificates are required to be allocated among certificateholders of such class in proportion to their respective percentage interests. The Class R certificates will not be entitled to any voting rights. |
| ■ Servicing Compensation: | | Modification Fees: Certain fees resulting from modifications, amendments, waivers or other changes to the terms of the loan documents, as more fully described in the Preliminary Prospectus, will be used to offset expenses on the related serviced mortgage loan (i.e. reimburse the trust for certain expenses, including unreimbursed advances and interest on unreimbursed advances previously incurred (other than special servicing fees, workout fees and liquidation fees) on the related serviced mortgage loan but not yet reimbursed to the trust or servicers or to pay expenses (other than special servicing fees, workout fees and liquidation fees) that are still outstanding in each case unless as part of the written modification the related borrower is required to pay these amounts on a going forward basis or in the future). Any excess modification fees not so applied to offset expenses will be available as compensation to the master servicer and/or special servicer. Within any prior 12-month period, all such excess modification fees earned by the master servicer or by the special servicer (after taking into account the offset described below applied during such 12-month period) with respect to any serviced mortgage loan will be subject to a cap equal to the greater of (i) 1% of the outstanding principal balance of such mortgage loan after giving effect to such transaction and (ii) $25,000. All excess modification fees earned by the special servicer will be required to offset any future workout fees or liquidation fees payable with respect to the related serviced mortgage loan or related REO property; provided, that if the serviced mortgage loan ceases being a corrected loan, and is subject to a subsequent modification, any excess modification fees earned by the special servicer prior to such serviced mortgage loan ceasing to be a corrected loan will no longer be offset against future liquidation fees and workout fees unless such serviced mortgage loan ceased to be a corrected loan within 18 months of it becoming a modified mortgage loan. Penalty Fees: All late fees and default interest will first be used to reimburse certain expenses previously incurred with respect to the related mortgage loan (including special servicing fees, workout fees and liquidation fees) but not yet reimbursed to the trust, the master servicer or the special servicer or to pay certain expenses (including special servicing fees, workout fees and liquidation fees) that are still outstanding on the related mortgage loan, and any excess received with respect to a serviced loan will be paid to the master servicer (for penalty fees accrued while a non-specially serviced loan) and the special servicer (for penalty fees accrued while a specially serviced loan). To the extent any amounts reimbursed out of penalty charges are subsequently recovered on a related serviced loan, they will be paid to the master servicer or special servicer who would have been entitled to the related penalty charges that were previously used to reimburse such expense. Liquidation / Workout Fees: Liquidation fees will be calculated at the lesser of (a) 1.0% or (b) with respect to any serviced mortgage loan (or related serviced whole loan, if applicable) or related REO Property, such lesser rate as would result in a liquidation fee of $1,000,000, for each serviced loan that is a specially serviced loan and any REO property, subject in any case to a minimum liquidation fee of $25,000. For any serviced loan that is a corrected loan, workout fees will be calculated at the lesser of (a) 1.0% and (b) such lower rate as would result in a workout fee of $1,000,000 when applied to each expected payment of principal and interest (other than (i) default interest and (ii) any “excess interest” accrued after the related anticipated repayment date on any mortgage loan with an anticipated repayment date) on the related serviced loan (or related serviced whole loan, if applicable) from the date such serviced loan becomes a corrected loan through and including the then related maturity date, subject in any case to a minimum workout fee of $25,000. |
THE INFORMATION IN THIS STRUCTURAL AND COLLATERAL TERM SHEET IS NOT COMPLETE AND MAY BE AMENDED PRIOR TO THE TIME OF SALE. THIS TERM SHEET IS NOT AN OFFER TO SELL THESE SECURITIES AND IT IS NOT A SOLICITATION OF AN OFFER TO BUY THESE SECURITIES IN ANY JURISDICTION WHERE THE OFFER OR SALE IS NOT PERMITTED. |
| | 26 | |
| Structural and Collateral Term Sheet | | BMO 2024-5C4 |
| Structural Overview |
| | Notwithstanding the foregoing, in connection with a maturity default, no liquidation or workout fee will be payable in connection with a payoff or refinancing of the related serviced loan within 90 days of the maturity default, but the special servicer may collect and retain appropriate fees from the related borrower in connection with the subject liquidation or workout. In the case of an outside serviced whole loan, calculation of the foregoing amounts payable to the related outside servicer or outside special servicer may be different than as described above. For example, the extent to which modification fees and penalty fees are applied to offset expenses may be different and liquidation fees and workout fees may be subject to different caps or no caps. |
| ■ Operating Advisor: | | The operating advisor will, in general and under certain circumstances described in the Preliminary Prospectus, have the following rights and responsibilities with respect to the serviced mortgage loans: ● reviewing the actions of the special servicer with respect to specially serviced loans and with respect to certain major decisions regarding non-specially serviced loans as to which the operating advisor has consultation rights; ● reviewing reports provided by the special servicer to the extent set forth in the BMO 2024-5C4 pooling and servicing agreement; ● reviewing for accuracy certain calculations made by the special servicer; ● issuing an annual report generally setting forth, among other things, its assessment of whether the special servicer is performing its duties in compliance with the servicing standard and the BMO 2024-5C4 pooling and servicing agreement and identifying any material deviations therefrom; ● recommending the replacement of the special servicer if the operating advisor determines, in its sole discretion exercised in good faith, that (1) the special servicer has failed to comply with the servicing standard and (2) a replacement of the special servicer would be in the best interest of the certificateholders (as a collective whole); and ● after the occurrence and during the continuance of an Operating Advisor Consultation Trigger Event, consulting on a non-binding basis with the special servicer with respect to certain major decisions (and such other matters as are set forth in the BMO 2024-5C4 pooling and servicing agreement) in respect of the applicable serviced mortgage loan(s) and/or related companion loan(s). An “Operating Advisor Consultation Trigger Event” will occur when the aggregate outstanding certificate balance of the HRR Certificates (as notionally reduced by any Cumulative Appraisal Reduction Amounts then allocable to the HRR Certificates) is 25% or less of the initial aggregate certificate balance of the HRR Certificates. With respect to excluded mortgage loans, an Operating Advisor Consultation Trigger Event will be deemed to exist. Notwithstanding the foregoing, the operating advisor will generally have no obligations or consultation rights as operating advisor under the BMO 2024-5C4 pooling and servicing agreement with respect to any outside serviced mortgage loan or any related REO property. The operating advisor will be subject to termination and replacement if the holders of at least 15% of the voting rights of Non-Reduced Certificates vote to terminate and replace the operating advisor and such termination and replacement is affirmatively voted for by the holders of more than 50% of the voting rights allocable to the Non-Reduced Certificates of those holders that exercise their right to vote (provided that holders entitled to exercise at least 50% of the voting rights allocable to the Non-Reduced Certificates exercise their right to vote within 180 days of the initial request for a vote). The holders initiating such vote will be responsible for the fees and expenses in connection with the vote and replacement. See “The Pooling and Servicing Agreement—Operating Advisor” in the Preliminary Prospectus. |
| ■ Asset Representations Reviewer: | | The asset representations reviewer will be required to review certain delinquent mortgage loans after a specified delinquency threshold has been exceeded and the required percentage of certificateholders vote to direct a review of such delinquent mortgage loans. An asset review will occur when either (1) mortgage loans with an aggregate outstanding principal balance of 25% or more of the aggregate outstanding principal balance of all of the mortgage loans (including any REO mortgage loans) held by the issuing entity as of the end of the applicable collection period are at least 60 days delinquent in respect of their related monthly payments or balloon payment, if any (for purposes of this paragraph, “delinquent loans”) or (2) at least 15 mortgage loans are delinquent loans as of the end of the applicable collection period and the aggregate outstanding principal balance of such delinquent loans constitutes at least 20% of the aggregate outstanding principal balance of all of the mortgage loans (including any REO mortgage loans) held by the issuing entity as of the end of the applicable collection period. |
THE INFORMATION IN THIS STRUCTURAL AND COLLATERAL TERM SHEET IS NOT COMPLETE AND MAY BE AMENDED PRIOR TO THE TIME OF SALE. THIS TERM SHEET IS NOT AN OFFER TO SELL THESE SECURITIES AND IT IS NOT A SOLICITATION OF AN OFFER TO BUY THESE SECURITIES IN ANY JURISDICTION WHERE THE OFFER OR SALE IS NOT PERMITTED. |
| | 27 | |
| Structural and Collateral Term Sheet | | BMO 2024-5C4 |
| Structural Overview |
| | The asset representations reviewer may be terminated and replaced without cause. Upon (i) the written direction of certificateholders evidencing not less than 25% of the voting rights requesting a vote to terminate and replace the asset representations reviewer with a proposed successor asset representations reviewer that is an eligible asset representations reviewer, and (ii) payment by such holders to the certificate administrator of the reasonable fees and expenses to be incurred by the certificate administrator in connection with administering such vote, the certificate administrator will promptly provide notice of such request to all certificateholders and the asset representations reviewer by posting such notice on its internet website, and by mailing such notice to all certificateholders and the asset representations reviewer. Upon the affirmative vote of certificateholders evidencing at least 75% of the voting rights allocable to those holders that exercise their right to vote (provided that holders representing the applicable Certificateholder Quorum exercise their right to vote within 180 days of the initial request for a vote), the trustee will be required to terminate all of the rights and obligations of the asset representations reviewer under the BMO 2024-5C4 pooling and servicing agreement by written notice to the asset representations reviewer, and the proposed successor asset representations reviewer will be appointed. See “The Pooling and Servicing Agreement—The Asset Representations Reviewer” in the Preliminary Prospectus. |
| ■ Dispute Resolution Provisions: | | The mortgage loan sellers will be subject to the dispute resolution provisions set forth in the BMO 2024-5C4 pooling and servicing agreement to the extent those provisions are triggered with respect to any mortgage loan sold to the depositor by a mortgage loan seller and such mortgage loan seller will be obligated under the related mortgage loan purchase agreement to comply with all applicable provisions and to take part in any mediation or arbitration proceedings that may result. Generally, in the event that a Repurchase Request (as defined in the Preliminary Prospectus) with respect to a mortgage loan is not “Resolved” (as defined below) within 180 days after the related mortgage loan seller receives such Repurchase Request, then the enforcing servicer will be required to send a notice to the “Initial Requesting Certificateholder” (if any) indicating the enforcing servicer’s intended course of action with respect to the Repurchase Request. If (a) the enforcing servicer’s intended course of action with respect to the Repurchase Request does not involve pursuing further action to exercise rights against the applicable mortgage loan seller with respect to the Repurchase Request and the Initial Requesting Certificateholder, if any, or any other certificateholder or certificate owner of Certificates wishes to exercise its right to refer the matter to mediation (including nonbinding arbitration) or arbitration, or (b) the enforcing servicer’s intended course of action is to pursue further action to exercise rights against the related mortgage loan seller with respect to the Repurchase Request but the Initial Requesting Certificateholder, if any, or any other certificateholder or certificate owner of Certificates does not agree with the dispute resolution method selected by the enforcing servicer, then the Initial Requesting Certificateholder, if any, or such other certificateholder or certificate owner may deliver a written notice to the enforcing servicer indicating its intent to exercise its right to refer the matter to either mediation or arbitration. In addition, any other certificateholder or certificate owner of Certificates may deliver, within the time frame provided in the BMO 2024-5C4 pooling and servicing agreement, a written notice requesting the right to participate in any dispute resolution consultation that is conducted by the enforcing servicer following the enforcing servicer’s receipt of the notice described in the preceding sentence. “Resolved” means, with respect to a Repurchase Request, (i) that any material breach of representations and warranties or a material document defect has been cured, (ii) the related mortgage loan has been repurchased in accordance with the related mortgage loan purchase agreement, (iii) a mortgage loan has been substituted for the related mortgage loan in accordance with the related mortgage loan purchase agreement, (iv) the applicable mortgage loan seller has made a “loss of value payment”, (v) a contractually binding agreement has been entered into between the enforcing servicer, on behalf of the issuing entity, and the related mortgage loan seller that settles the related mortgage loan seller’s obligations under the related mortgage loan purchase agreement, or (vi) the related mortgage loan is no longer property of the issuing entity as a result of a sale or other disposition in accordance with the BMO 2024-5C4 pooling and servicing agreement. See “The Pooling and Servicing Agreement—Dispute Resolution Provisions” in the Preliminary Prospectus. |
| ■ Liquidated Loan Waterfall: | | Upon liquidation of any mortgage loan, all net liquidation proceeds related to the mortgage loan (but not any related companion loan) will be applied (after allocation to offset certain advances and expenses) so that amounts allocated as a recovery of accrued and unpaid interest will not, in the first instance, include any delinquent interest that was not advanced as a result of Appraisal Reduction Amounts or interest that accrued on any junior note(s) if such mortgage loan is an AB Modified Loan. After the adjusted interest amount is so allocated, any remaining liquidation proceeds will be allocated to pay principal on the mortgage loan until the unpaid principal amount of the mortgage loan has been reduced to zero. Any remaining liquidation proceeds will then be allocated to pay delinquent interest that was not advanced as a result of Appraisal Reduction Amounts and any interest that accrued on any junior note(s) if such mortgage loan is an AB Modified Loan. |
THE INFORMATION IN THIS STRUCTURAL AND COLLATERAL TERM SHEET IS NOT COMPLETE AND MAY BE AMENDED PRIOR TO THE TIME OF SALE. THIS TERM SHEET IS NOT AN OFFER TO SELL THESE SECURITIES AND IT IS NOT A SOLICITATION OF AN OFFER TO BUY THESE SECURITIES IN ANY JURISDICTION WHERE THE OFFER OR SALE IS NOT PERMITTED. |
| | 28 | |
| Structural and Collateral Term Sheet | | BMO 2024-5C4 |
| Structural Overview |
| ■ Credit Risk Retention: | | This securitization transaction will be subject to the credit risk retention rules of Section 15G of the Securities Exchange Act of 1934, as amended. An economic interest in the credit risk of the mortgage loans in this transaction is expected to be retained pursuant to risk retention regulations (as codified at 12 CFR Part 244) promulgated under Section 15G (“Regulation RR”), as a combination of (A) an “eligible vertical interest” in the form of the VRR Interest and (B) an “eligible horizontal residual interest” in the form of the HRR Interest. Argentic Real Estate Finance 2 LLC will act as retaining sponsor under Regulation RR for this securitization transaction and is expected, on the Closing Date, to satisfy its risk retention obligation through the purchase (through its majority-owned affiliate, which is expected to be Argentic Securities Holdings 2 Cayman Limited) of the VRR Interest and the HRR Interest. For a further discussion of the manner in which the credit risk retention requirements are expected to be satisfied by Argentic Real Estate Finance 2 LLC, as retaining sponsor for this securitization transaction, see “Credit Risk Retention” in the Preliminary Prospectus. |
| ■ Investor Communications: | | The certificate administrator is required to include on any Form 10–D any request received from a certificateholder to communicate with other certificateholders related to certificateholders exercising their rights under the terms of the BMO 2024-5C4 pooling and servicing agreement. Any certificateholder wishing to communicate with other certificateholders regarding the exercise of its rights under the terms of the BMO 2024-5C4 pooling and servicing agreement will be able to deliver a written request signed by an authorized representative of the requesting investor to the certificate administrator. |
| ■ Deal Website: | | The certificate administrator will maintain a deal website including, but not limited to: ● all special notices delivered. ● summaries of final asset status reports. ● all appraisals in connection with an appraisal reduction plus any subsequent appraisal updates. ● an “Investor Q&A Forum” and a voluntary investor registry. |
| ■ Cleanup Call: | | On any Distribution Date on which the aggregate unpaid principal balance of the mortgage loans (including mortgage loans as to which the related mortgaged properties have become REO properties) remaining in the issuing entity is less than 1% of the aggregate principal balance of the pool of mortgage loans as of the Cut-off Date (excluding for the purposes of this calculation, the unpaid principal balance of any mortgage loan with an anticipated repayment date, but in such case only if the option described above is exercised after the Distribution Date related to the collection period in which the corresponding anticipated repayment date occurs), certain specified persons will have the option to purchase all of the remaining mortgage loans (and all property acquired through exercise of remedies in respect of any mortgage loan) at the price specified in the Preliminary Prospectus. Exercise of the option will terminate the issuing entity and retire the then outstanding certificates. If the aggregate certificate balances of the Class A-1, Class A-2, Class A-3, Class A-S, Class B, Class C, Class D and Class E certificates and the notional amounts of the Class X-A, Class X-B and Class X-D certificates have been reduced to zero and if the master servicer has received from the remaining certificateholders the payment specified in the BMO 2024-5C4 pooling and servicing agreement, the issuing entity could also be terminated in connection with an exchange of all the then-outstanding certificates (excluding the Class R certificates) for the mortgage loans remaining in the issuing entity, as further described under “The Pooling and Servicing Agreement—Optional Termination; Optional Mortgage Loan Purchase” in the Preliminary Prospectus. |
The Offered Certificates involve certain risks and may not be suitable for all investors. For information regarding certain risks associated with an investment in the Offered Certificates, see “Summary of Risk Factors” and “Risk Factors” in the Preliminary Prospectus. Capitalized terms used but not otherwise defined in this Term Sheet have the respective meanings assigned to those terms in the Preliminary Prospectus.
THE INFORMATION IN THIS STRUCTURAL AND COLLATERAL TERM SHEET IS NOT COMPLETE AND MAY BE AMENDED PRIOR TO THE TIME OF SALE. THIS TERM SHEET IS NOT AN OFFER TO SELL THESE SECURITIES AND IT IS NOT A SOLICITATION OF AN OFFER TO BUY THESE SECURITIES IN ANY JURISDICTION WHERE THE OFFER OR SALE IS NOT PERMITTED. |
| | 29 | |
| Structural and Collateral Term Sheet | | BMO 2024-5C4 |
| No. 1 – 620 W 153rd Street |

THE INFORMATION IN THIS STRUCTURAL AND COLLATERAL TERM SHEET IS NOT COMPLETE AND MAY BE AMENDED PRIOR TO THE TIME OF SALE. THIS TERM SHEET IS NOT AN OFFER TO SELL THESE SECURITIES AND IT IS NOT A SOLICITATION OF AN OFFER TO BUY THESE SECURITIES IN ANY JURISDICTION WHERE THE OFFER OR SALE IS NOT PERMITTED. |
| | 30 | |
| Structural and Collateral Term Sheet | | BMO 2024-5C4 |
| No. 1 – 620 W 153rd Street |
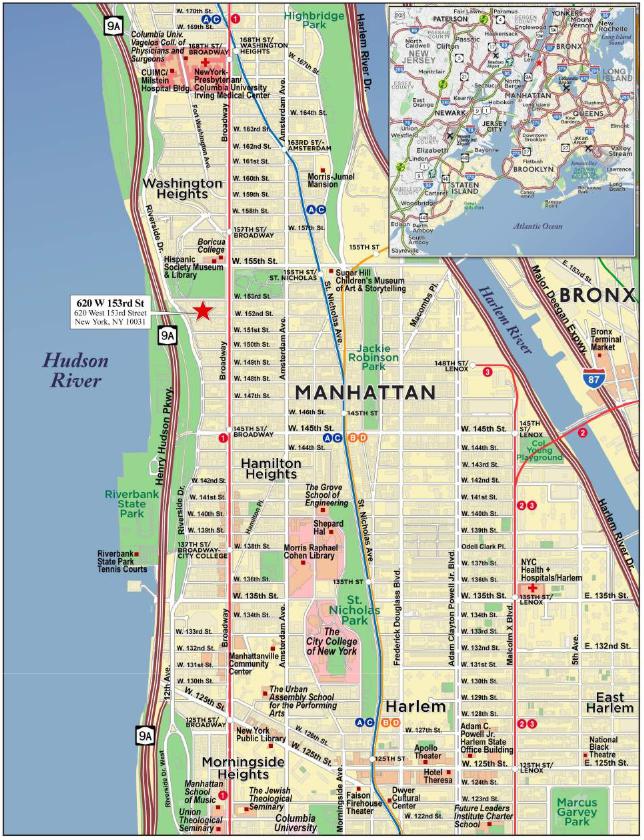
THE INFORMATION IN THIS STRUCTURAL AND COLLATERAL TERM SHEET IS NOT COMPLETE AND MAY BE AMENDED PRIOR TO THE TIME OF SALE. THIS TERM SHEET IS NOT AN OFFER TO SELL THESE SECURITIES AND IT IS NOT A SOLICITATION OF AN OFFER TO BUY THESE SECURITIES IN ANY JURISDICTION WHERE THE OFFER OR SALE IS NOT PERMITTED. |
| | 31 | |
| Structural and Collateral Term Sheet | | BMO 2024-5C4 |
| No. 1 – 620 W 153rd Street |
| Mortgage Loan Information | | Property Information |
| Mortgage Loan Seller: | BMO, AREF2, SMC | | Single Asset / Portfolio: | Single Asset |
| Original Principal Balance(1): | $70,000,000 | | Title: | Fee |
| Cut-off Date Principal Balance(1): | $70,000,000 | | Property Type – Subtype(5): | Multifamily – High Rise |
| % of IPB: | 8.1% | | Net Rentable Area (Units): | 238 |
| Loan Purpose: | Refinance | | Location: | New York, NY |
| Borrowers: | ABS 153 LLC, 620W153AA LLC and 620 W 153 Realty LLC | | Year Built / Renovated: | 2023 / NAP |
| Borrower Sponsors: | Jacob Kohn, Abraham Kohn, Jacob Aini, Eli Chetrit and Isaac Chetrit | | Occupancy(5): | 89.9% |
| Interest Rate: | 6.13000% | | Occupancy Date: | 4/1/2024 |
| Note Date: | 4/2/2024 | | 4th Most Recent NOI (As of)(6): | NAV |
| Maturity Date: | 4/6/2029 | | 3rd Most Recent NOI (As of)(6): | NAV |
| Interest-only Period: | 60 months | | 2nd Most Recent NOI (As of)(6): | NAV |
| Original Term: | 60 months | | Most Recent NOI (As of)(7): | $6,703,204 (2/29/2024) |
| Original Amortization Term: | None | | UW Economic Occupancy: | 94.3% |
| Amortization Type: | Interest Only | | UW Revenues: | $11,953,146 |
| Call Protection(2): | L(25),D(29),O(6) | | UW Expenses: | $1,465,007 |
| Lockbox / Cash Management: | Springing / Springing | | UW NOI: | $10,488,139 |
| Additional Debt(1): | Yes | | UW NCF: | $10,410,143 |
| Additional Debt Balance(1): | $47,000,000 | | Appraised Value / Per Unit: | $205,200,000 / $862,185 |
| Additional Debt Type(1): | Pari Passu | | Appraisal Date: | 2/28/2024 |
| | | | | |
| | | | | |
| Escrows and Reserves(3) | | Financial Information(1) |
| | Initial | Monthly | Initial Cap | | | Whole Loan |
| Taxes: | $20,811 | $4,162 | N/A | | Cut-off Date Loan / Unit: | $491,597 |
| Insurance: | $150,978 | $12,582 | N/A | | Maturity Date Loan / Unit: | $491,597 |
| Replacement Reserve: | $0 | $4,561 | N/A | | Cut-off Date LTV: | 57.0% |
| TI/LC: | $0 | $1,939 | $69,804 | | Maturity Date LTV: | 57.0% |
| Other(4): | $482,738 | $0 | N/A | | UW NCF DSCR: | 1.43x |
| | | | | | UW NOI Debt Yield: | 9.0% |
| | | | | | | |
| Sources and Uses |
| Sources | Proceeds | % of Total | | Uses | Proceeds | % of Total | |
| Whole Loan | $117,000,000 | 100.0% | | Loan Payoff | $110,927,653 | 94.8 | % |
| | | | | Closing Costs(8) | 4,900,604 | 4.2 | |
| | | | | Reserves | 654,527 | 0.6 | |
| | | | | Return of Equity | 517,215 | 0.4 | |
| Total Sources | $117,000,000 | 100.0% | | Total Uses | $117,000,000 | 100.0 | % |
| (1) | The 620 W 153rd Street Whole Loan (as defined below) is part of a whole loan evidenced by nine pari passu notes with an aggregate original principal balance and aggregate Cut-off Date Balance of $117,000,000. The Financial Information presented in the chart above reflects the 620 W 153rd Street Whole Loan. For additional information, see the “Whole Loan Summary” chart herein. |
| (2) | The borrowers may defease the 620 W 153rd Street Whole Loan in whole (but not in part) at any time after the earlier to occur of (x) April 2, 2027 and (y) the date that is two years after the closing date of the securitization that includes the last pari passu note to be securitized. The assumed lockout period of 25 payments is based on the expected BMO 2024-5C4 securitization closing date in May 2024. The actual lockout period may be longer. |
| (3) | For a full description of Escrows and Reserves, see “Escrows and Reserves” below. |
| (4) | Other Reserves include a rent reserve of $309,400 and a rent concession reserve of approximately $173,338. See “Escrows and Reserves” below. |
| (5) | The 620 W 153rd Street Property (as defined below) contains three commercial units totaling 31,306 square feet of commercial space, which are 100% occupied by two retail tenants which represent approximately 7.0% of the net rental income from the 620 W 153rd Street Property. The information regarding occupancy and number of units shown does not include any commercial space at the 620 W 153rd Street Property unless otherwise indicated herein. |
| (6) | Historical financial information is not available because the improvements were completed in 2023. |
| (7) | Most Recent NOI is as of the annualized trailing three month period ending February 29, 2024. |
| (8) | Closing Costs include an interest rate buydown of $1,170,000. |
THE INFORMATION IN THIS STRUCTURAL AND COLLATERAL TERM SHEET IS NOT COMPLETE AND MAY BE AMENDED PRIOR TO THE TIME OF SALE. THIS TERM SHEET IS NOT AN OFFER TO SELL THESE SECURITIES AND IT IS NOT A SOLICITATION OF AN OFFER TO BUY THESE SECURITIES IN ANY JURISDICTION WHERE THE OFFER OR SALE IS NOT PERMITTED. |
| | 32 | |
| Structural and Collateral Term Sheet | | BMO 2024-5C4 |
| No. 1 – 620 W 153rd Street |
The Loan. The largest mortgage loan (the “620 W 153rd Street Mortgage Loan”) is part of a whole loan (the “620 W 153rd Street Whole Loan”) secured by the borrowers’ fee interest in a multifamily high-rise located in New York, New York (the “620 W 153rd Street Property”). The 620 W 153rd Street Whole Loan is comprised of nine pari passu notes, with an aggregate outstanding principal balance as of the Cut-off Date of $117,000,000. The 620 W 153rd Street Whole Loan was originated on April 2, 2024 by Bank of Montreal (“BMO”) and Argentic Real Estate Finance 2 LLC (“AREF2”), and accrues interest at a fixed rate of 6.13000% per annum on an Actual/360 basis. The 620 W 153rd Street Whole Loan has an initial term of five-years and is interest-only for the full term. The scheduled maturity date of the 620 W 153rd Street Whole Loan is the payment date that occurs in April 2029. On April 10, 2024, BMO transferred Notes A-1-2 and A-1-5, in the aggregate original principal amount of $20,000,000, to Starwood Mortgage Capital LLC. The 620 W 153rd Street Mortgage Loan is evidenced by the controlling Note A-1-1 and the non-controlling Note A-1-5 and Note A-2-1 with an aggregate outstanding principal balance as of the Cut-off Date of $70,000,000.
The table below identifies the promissory notes that comprise the 620 W 153rd Street Whole Loan. The relationship between the holders of the 620 W 153rd Street Whole Loan will be governed by a co-lender agreement. The 620 W 153rd Street Whole Loan will be serviced under the BMO 2024-5C4 pooling and servicing agreement. See “Description of the Mortgage Pool—The Whole Loans—The Serviced Pari Passu Whole Loans” and “The Pooling and Servicing Agreement” in the Preliminary Prospectus.
| Whole Loan Summary |
| Note | Original Balance | Cut-off Date Balance | Note Holder | Controlling
Piece |
| A-1-1 | $35,000,000 | $35,000,000 | BMO 2024-5C4 | Yes |
| A-1-2(1) | $10,000,000 | $10,000,000 | SMC | No |
| A-1-3(1) | $10,000,000 | $10,000,000 | BMO | No |
| A-1-4(1) | $10,000,000 | $10,000,000 | BMO | No |
| A-1-5 | $10,000,000 | $10,000,000 | BMO 2024-5C4 | No |
| A-2-1 | $25,000,000 | $25,000,000 | BMO 2024-5C4 | No |
| A-2-2(1) | $10,000,000 | $10,000,000 | AREF2 | No |
| A-2-3(1) | $5,000,000 | $5,000,000 | AREF2 | No |
| A-2-4(1) | $2,000,000 | $2,000,000 | AREF2 | No |
| Whole Loan | $117,000,000 | $117,000,000 | | |
| (1) | Expected to be contributed to one or more securitization trust(s). |
The Property. The 620 W 153rd Street Property was constructed in early 2023. The 0.57-acre parcel is improved with a 28-story apartment building with 15,513 square feet of commercial space on the garden level and first floor operated as a preschool, and 15,793 square feet of commercial space on the second floor operated as a 96-space parking garage. The 620 W 153rd Street Property features 238 units in total with studio, one-, two- and three-bedroom layouts, 72 of which are rent-stabilized, ranging in size from 325 to 1,055 square feet. Stabilized rents range from $2,350 to $3,550 per month, with an average stabilized rent of approximately $2,784 and an average unit size of approximately 490 square feet. Market rents range from $2,885 to $5,150 per month, with an average market rent of approximately $4,154 and an average unit size of 614 square feet. Unit features include hardwood floor living areas with tiled bathrooms and full tubs, in-unit washer and dryer, dishwasher, gas range/oven, and top freezer refrigerator. Some of the units have a private outdoor terrace. As of April 1, 2024, the 166 market rate residential units at the 620 W 153rd Street Property were 94.6% occupied, and the 72 rent-stabilized units at the 620 W 153rd Street Property were 79.2% occupied, resulting in a total occupancy of 89.9%.
The borrowers, as landlord, and 180 E 125th Realty LLC (the “Master Tenant”), an affiliate of the borrower sponsors, have entered into a Master Lease Agreement, dated as of March 28, 2024, for nine vacant market rate units, for a term commencing on April 1, 2024, and continuing through and including the maturity date, at a rental rate equal to $42,000 per month. The master lease rent was included in the calculation of the underwritten net cash flow. So long as no event of default has occurred and is continuing, upon the borrowers’ written request following the occurrence of the Rent Reserve Release Date (as defined below), the lender is required to consent to a complete or partial termination of the master lease by the borrowers and the Master Tenant.
The 620 W 153rd Street Property is subject to the 421-a tax exemption program that requires at least 30% of the total number of dwelling units at the 620 W 153rd Street Property to remain affordable to, and restricted to occupancy by, households earning no more than 130% of area median income for at least 35 years after the completion of the construction
THE INFORMATION IN THIS STRUCTURAL AND COLLATERAL TERM SHEET IS NOT COMPLETE AND MAY BE AMENDED PRIOR TO THE TIME OF SALE. THIS TERM SHEET IS NOT AN OFFER TO SELL THESE SECURITIES AND IT IS NOT A SOLICITATION OF AN OFFER TO BUY THESE SECURITIES IN ANY JURISDICTION WHERE THE OFFER OR SALE IS NOT PERMITTED. |
| | 33 | |
| Structural and Collateral Term Sheet | | BMO 2024-5C4 |
| No. 1 – 620 W 153rd Street |
of the 620 W 153rd Street Property. See “Description of the Mortgage Pool—Statistical Characteristics of the Mortgage Loans—Property Types—Multifamily Properties” and “Description of the Mortgage Pool—Real Estate and Other Tax Considerations” in the Preliminary Prospectus.
The following table presents certain information relating to the commercial tenants at the 620 W 153rd Street Property:
| Commercial Tenant Summary(1) |
| Tenant | Suite | Credit Rating (Moody’s/Fitch/S&P) | Net Rentable Area (Sq. Ft.) | % of Net Rentable Area | Annual UW Base Rent | Annual UW Base Rent Per Sq. Ft.(2) | % of Total Annual U/W Commercial Rental Income(2) | Lease Expiration(3) |
| Round the Clock Nursery, Inc. | Garden Level, 1st Floor | NR/NR/NR | 15,513 | 49.6 | % | $632,930 | $40.80 | 78.2 | % | 6/30/2038 |
| Stable Car Parking Inc. | 2nd Floor | NR/NR/NR | 15,793 | 50.4 | | 176,000 | 11.14 | 21.8 | | 3/14/2044 |
| Total Occupied | | | 31,306 | 100.0 | % | $808,930 | $25.84 | 100.0 | % | |
| Vacant | | | 0 | 0.0 | | 0. | | | |
| Total / Wtd. Avg. | | | 31,306 | 100.0 | % | $808,930 | | | |
| | | | | | | | |
| (1) | Based on the underwritten commercial rent roll dated March 15, 2024. |
| (2) | The total UW commercial income attributable to the commercial tenants at the 620 W 153rd Street Property represents approximately 7.0% of the Total Underwritten Net Rental Income. |
| (3) | No commercial tenants have an early termination option. |
The following table presents certain information relating to the residential units at the 620 W 153rd Street Property:
| Unit Type Summary(1) |
| Unit Type | Units | Occupancy % | Annual Residential Rental Income(2) | % of Total Annual Residential Rental Income |
| Studio MR | 17 | 100.0% | | $673,500 | | 6.6 | % |
| 1BR MR | 51 | 94.1 | | $2,291,700 | | 22.3 | |
| 2BR / 1BA MR | 8 | 75.0 | | $349,800 | | 3.4 | |
| 2BR / 2BA MR | 74 | 94.6 | | $4,065,000 | | 39.6 | |
| 3BR MR | 16 | 100.0 | | $990,600 | | 9.6 | |
| Market Rent Total | 166 | 94.6% | | $8,370,600 | | 81.5 | % |
| Studio RS | 18 | 100.0 | | $513,600 | | 5.0 | |
| 1BR RS | 18 | 100.0 | | $565,800 | | 5.5 | |
| 2BR / 1BA RS | 34 | 55.9 | | $744,600 | | 7.2 | |
| 2BR / 2BA RS | 2 | 100.0 | | $80,400 | | 0.8 | |
| Rent Stabilized Total | 72 | 79.2% | | $1,904,400 | | 18.5 | % |
| Total/Wtd. Avg. | 238 | 89.9% | | $10,275,000 | | 100.0 | % |
| (1) | Based on the underwritten rent roll dated April 1, 2024. |
| (2) | Annual Residential Rental Income (i) excludes rent from nine vacant market rate units that are subject to a master lease pursuant to which the Master Tenant is required to pay $42,000 per month and (ii) reflects the annual in-place rents without taking into account any rent concessions provided to the tenants. At origination, the borrowers deposited $173,338 into a rent concession reserve. See “Escrows and Reserves” below. |
THE INFORMATION IN THIS STRUCTURAL AND COLLATERAL TERM SHEET IS NOT COMPLETE AND MAY BE AMENDED PRIOR TO THE TIME OF SALE. THIS TERM SHEET IS NOT AN OFFER TO SELL THESE SECURITIES AND IT IS NOT A SOLICITATION OF AN OFFER TO BUY THESE SECURITIES IN ANY JURISDICTION WHERE THE OFFER OR SALE IS NOT PERMITTED. |
| | 34 | |
| Structural and Collateral Term Sheet | | BMO 2024-5C4 |
| No. 1 – 620 W 153rd Street |
The following table presents detailed information with respect to the market rate units at the 620 W 153rd Street Property:
| Market Rate Unit Summary |
| Unit Type | No. of Units(1) | % of Total(2) | Average Unit Size (SF)(1) | Average Monthly Rental Rate(1)(3) | Average Monthly Rental Rate per SF(1)(3) | Average Monthly Market Rental Rate(4) | Average Monthly Market Rental Rate per SF(4) |
| Studio | 17 | 10.2 | % | 392 | $3,301 | $8.43 | $3,100 | $7.92 |
| 1BR | 51 | 30.7 | | 551 | $3,979 | $7.15 | $4,000 | $7.26 |
| 2BR / 1BA | 8 | 4.8 | | 649 | $4,858 | $7.42 | $5,000 | $7.71 |
| 2BR / 2BA | 74 | 44.6 | | 770 | $4,839 | $6.30 | $5,000 | $6.49 |
| 3BR | 16 | 9.6 | | 865 | $5,159 | $5.96 | $5,150 | $5.95 |
| Total/Wtd. Avg. | 166 | 100.0 | % | 667 | $4,443 | $6.65 | $4,513 | $6.76 |
| (1) | Based on the underwritten rent roll as of April 1, 2024. |
| (2) | % of Total represents the percentage of the total market rate units at the 620 W 153rd Street Property. |
| (3) | Average Monthly Rental Rate and Average Monthly Rental Rate per SF excludes nine vacant market rate units and were determined without taking into account any rent concessions that may be provided to the tenants. The borrower is master leasing all nine vacant market rate units to an affiliate of the borrower sponsors. |
The following table presents detailed information with respect to the rent-stabilized units at the 620 W 153rd Street Property:
| Rent-Stabilized Unit Summary |
| Unit Type | No. of Units(1) | % of Total(2) | Average Unit Size (SF)(1) | Average Monthly Rental Rate(1)(3) | Average Monthly Rental Rate per SF(1)(3) |
| Studio | 18 | 25.0 | % | 334 | $2,378 | $7.11 |
| 1 BR | 18 | 25.0 | | 397 | $2,619 | $6.60 |
| 2BR / 1BA | 34 | 47.2 | | 613 | $3,266 | $5.33 |
| 2BR / 2BA | 2 | 2.8 | | 620 | $3,350 | $5.41 |
| Total/Wtd. Avg. | 72 | 100.0 | % | 490 | $2,784 | $6.09 |
| (1) | Based on the underwritten rent roll as of April 1, 2024. |
| (2) | % of Total represents the percentage of the total rent-stabilized units at the 620 W 153rd Street Property. |
| (3) | Average Monthly Rental Rate and Average Monthly Rental Rate per SF excludes 15 vacant rent-stabilized units and do not take into account any rent concessions that may be provided to the tenants. |
Appraisal. According to the appraisal, the 620 W 153rd Street Property had an “as-is” appraised value of $205,200,000 as of February 28, 2024, as shown in the table below. Based on the “as-is” value of $205,200,000, the Cut-off Date LTV and Maturity Date LTV for the 620 W 153rd Street Whole Loan are 57.0%.
| 620 W 153rd Street Appraised Value |
| Property | Value(1) | Capitalization Rate |
| 620 W 153rd Street | $205,200,000 | 5.00% |
Environmental. According to the Phase I environmental assessment dated March 6, 2024, there was no evidence of any recognized environmental conditions at the 620 W 153rd Street Property.
The following table presents certain information relating to the historical and current occupancy of the 620 W 153rd Street Property:
| Historical and Current Occupancy(1) |
| 2021 | 2022 | 2023 | Current(2) |
| NAV | NAV | NAV | 89.9% |
| (1) | Historical Occupancy is not available as the 620 W 153rd Street Property was built in 2023. |
| (2) | Current Occupancy is as of April 1, 2024. |
THE INFORMATION IN THIS STRUCTURAL AND COLLATERAL TERM SHEET IS NOT COMPLETE AND MAY BE AMENDED PRIOR TO THE TIME OF SALE. THIS TERM SHEET IS NOT AN OFFER TO SELL THESE SECURITIES AND IT IS NOT A SOLICITATION OF AN OFFER TO BUY THESE SECURITIES IN ANY JURISDICTION WHERE THE OFFER OR SALE IS NOT PERMITTED. |
| | 35 | |
| Structural and Collateral Term Sheet | | BMO 2024-5C4 |
| No. 1 – 620 W 153rd Street |
The following table presents certain information relating to the operating history and underwritten cash flows of the 620 W 153rd Street Property:
| Underwritten Net Cash Flow and Operating History |
| | T-3(1) | Underwritten | Per Unit | %(2) |
| Gross Potential Rent (Residential) | $7,836,172 | $11,439,420(3) | $48,065 | 99.1 | % |
| Commercial Income(4) | 0 | 808,930 | 3,399 | 7.0 | |
| (Vacancy/Credit Loss) | 0 | (700,867) | (2,945) | (6.1 | ) |
| Net Rental Income | $7,836,172 | $11,547,484(3) | $48,519 | 100.0 | % |
| Reimbursements | 0 | 5,662 | 24 | 0.0 | |
| Other Income | 57,897 | 400,000 | 1,681 | 3.5 | |
| Effective Gross Income | $7,894,069 | $11,953,146 | $50,223 | 103.5 | % |
| Total Expenses(5) | $1,190,865 | $1,465,007 | $6,155 | 12.3 | % |
| Net Operating Income | $6,703,204 | $10,488,139 | $44,068 | 87.7 | % |
| Total TI/LC, Capex/RR | 0 | 77,996 | 328 | 0.7 | |
| Net Cash Flow | $6,703,204 | $10,410,143 | $43,740 | 87.1 | % |
| (1) | T-3 reflects the annualized trailing three months period ending February 29, 2024. |
| (2) | % column represents percent of Net Rental Income for revenue fields and represents percent of Effective Gross Income for the remainder of fields. |
| (3) | Affordable units are marked to the legal limits imposed by the New York City Department of Housing Preservation and Development. The Underwritten Net Rental Income includes the in-place rent payable under the master lease relating to the nine vacant market rate units (representing approximately 4.4% of the Gross Potential Rent (Residential) and Net Rental Income). It is higher than the T-3 Gross Potential Rent (Residential) as the mortgaged property was in lease-up over this period. |
| (4) | Commercial Income represents three commercial units totaling 31,306 square feet of commercial space, which are 100% occupied by two retail tenants, representing approximately 7.0% of the Underwritten Net Rental Income from the 620 W 153rd Street Property. |
| (5) | Includes real estate taxes equal to approximately $81,474 based on present value of the 5-year average taxes based on the 421-a tax exemption. The 421-a tax exemption commenced in 2023 and is a 35-year abatement that phases out in the last ten years at 30.25% of tax exemption. |
The Market. The 620 W 153rd Street Property is located within the Harlem apartment submarket of the New York Metro market.
The 620 W 153rd Street Property is located in the Hamilton Heights neighborhood of Manhattan, New York. The Hamilton Heights neighborhood is located on the West Side of northern Manhattan. According to the appraisal, as of the fourth quarter of 2023, the New York Metro market had an inventory of 1,932,715 units and a vacancy rate of 3.2%.
According to the appraisal, as of the fourth quarter of 2023, the Harlem apartment submarket had an inventory of 190,150 units, and a vacancy rate of 2.0%, which is expected to increase to $2,562 by 2027.
According to the related appraisal, the 2023 population within the 10031 zip code and New York County were 53,393 and 1,658,642, respectively. The 2023 median household income within the same locations were $56,674 and $89,885, respectively.
THE INFORMATION IN THIS STRUCTURAL AND COLLATERAL TERM SHEET IS NOT COMPLETE AND MAY BE AMENDED PRIOR TO THE TIME OF SALE. THIS TERM SHEET IS NOT AN OFFER TO SELL THESE SECURITIES AND IT IS NOT A SOLICITATION OF AN OFFER TO BUY THESE SECURITIES IN ANY JURISDICTION WHERE THE OFFER OR SALE IS NOT PERMITTED. |
| | 36 | |
| Structural and Collateral Term Sheet | | BMO 2024-5C4 |
| No. 1 – 620 W 153rd Street |
The following table presents certain information relating to comparable multifamily rentals to the 620 W 153rd Street Property:
| Competitive Rental Summary(1) |
| Property Name / Property Address | Year Built / Renovated | Occupancy | # of Units(2) | Unit Mix | Average SF per Unit | Average Rent per SF(3) | Average Rent per Unit(3) | Fair Market Average Rent |
620 W 153rd Street(4) 620 West 153rd Street | 2023 / NAP | 89.9% | 238 | Studio MR Studio RS 1BR MR 1BR RS 2BR/1BA MR 2BR/1BA RS 2BR/2BA MR 2BR/2BA RS 3BR/2BA MR | 392 334 551 397 649 613 770 620 865 | $8.43 $7.11 $7.15 $6.60 $7.42 $5.33 $6.30 $5.41 $5.96 | $3,301 $2,378 $3,979 $2,619 $4,858 $3,266 $4,839 $3,350 $5,159 | $3,100 $2,885 $4,000 $3,080 $5,000 $3,669 $5,000 $3,669 $5,150 |
| 618 West 143rd Street | 2009 / NAP | N/A | 86 | 0BR 1BR 2BR 3BR | 495 700 1,000 1,200 | $4.95 $4.42 $4.00 $4.58 | $2,450 $3,095 $3,995 $5,495 | $3,100 $4,000 $5,000 $5,150 |
| 101 Macombs Place | 2024 / NAP | N/A | 29 | 0BR 1BR 2BR 3BR | 400 664 715 900 | $7.75 $5.57 $6.57 $5.00 | $3,100 $3,700 $4,700 $4,500 | $3,100 $4,000 $5,000 $5,150 |
| 2351 Adam Clayton Powell Jr Boulevard | 2019 / NAP | N/A | 134 | 0BR 1BR 2BR 3BR | 573 628 1,050 1,177 | $4.28 $4.70 $4.14 $4.42 | $2,450 $2,950 $4,350 $5,200 | $3,100 $4,000 $5,000 $5,150 |
| 2130 Adam Clayton Powell Boulevard | 2007 / NAP | N/A | 46 | 0BR 1BR 2BR 3BR | 533 701 1,000 1,800 | $5.37 $4.39 $4.65 $3.44 | $2,860 $3,080 $4,650 $6,200 | $3,100 $4,000 $5,000 $5,150 |
| 224 West 124th Street | 2022 / NAP | N/A | 168 | 0BR 1BR 2BR 3BR | N/A 400 600 1,425 | N/A $11.05 $9.67 $5.26 | N/A $4,418 $5,800 $7,489 | $3,100 $4,000 $5,000 $5,150 |
| 543 West 122nd Street | 2019 / NAP | N/A | 183 | 0BR 1BR 2BR 3BR | 546 831 1,243 N/A | $8.24 $6.62 $5.23 N/A | $4,500 $5,500 $6,500 N/A | $3,100 $4,000 $5,000 $5,150 |
| (1) | Source: Appraisal, unless otherwise indicated. |
| (2) | # of Units for the 620 W 153rd Street Property is inclusive of market rate (MR) and rent-stabilized (RS) units. # of Units for comparable properties is inclusive of only market rate units. |
| (3) | Average Rent per SF and Average Rent per Unit excludes vacant units. |
| (4) | Based on the underwritten rent roll as of April 1, 2024. |
The Borrowers. The borrowers are ABS 153 LLC, 620W153AA LLC and 620 W 153 Realty LLC, as tenants-in-common with respect to the 620 W 153rd Street Whole Loan. Each borrower is a Delaware limited liability company and special purpose entity with one independent director. Legal counsel to the borrowers provided a non-consolidation opinion in connection with the origination of the 620 W 153rd Street Whole Loan.
The Borrower Sponsors. The borrower sponsors and non-recourse carveout guarantors are Jacob Kohn, Abraham Kohn, Jacob Aini, Eli Chetrit and Isaac Chetrit, each a natural person. Collectively, the sponsors have over 120 years of experience in real estate. The sponsors own a combined 144 properties across various states. The sponsors have a combined net worth of approximately $1.0 billion and liquidity in excess of $20.0 million.
Property Management. The 620 W 153rd Street Property is managed by The Jay Group Inc., a New York corporation and an affiliate of the borrower sponsors.
Escrows and Reserves. At origination, the borrowers were required to deposit into escrow (i) approximately $20,811 for real estate taxes, (ii) approximately $150,978 for insurance premiums, (iii) 309,400 for a rent reserve and (iv) approximately $173,338 for a rent concession reserve.
Tax Escrows – The borrowers are required to escrow 1/12th of the annual estimated tax payments on a monthly basis, which currently equates to approximately $4,162.
Insurance Escrows – The borrowers are required to escrow 1/12th of the annual estimated insurance premiums on a monthly basis, which currently equates to approximately $12,582.
THE INFORMATION IN THIS STRUCTURAL AND COLLATERAL TERM SHEET IS NOT COMPLETE AND MAY BE AMENDED PRIOR TO THE TIME OF SALE. THIS TERM SHEET IS NOT AN OFFER TO SELL THESE SECURITIES AND IT IS NOT A SOLICITATION OF AN OFFER TO BUY THESE SECURITIES IN ANY JURISDICTION WHERE THE OFFER OR SALE IS NOT PERMITTED. |
| | 37 | |
| Structural and Collateral Term Sheet | | BMO 2024-5C4 |
| No. 1 – 620 W 153rd Street |
Replacement Reserves – On a monthly basis, the borrowers are required to escrow $4,561 for replacement reserves.
TI/LC Reserves – On a monthly basis, the borrowers are required to escrow $1,939 for TI/LC reserves (subject to a cap equal to $69,804).
Rent Reserve – All amounts on deposit in the rent reserve account will be released to the borrowers, so long as no event of default under the 620 W 153rd Street Whole Loan agreement has occurred and is continuing, upon the borrowers’ written request following the date on which all of the following conditions have been simultaneously satisfied (as determined by the lender) (the “Rent Reserve Release Date”): (a) the debt yield (calculated using gross income from operations for the one full calendar month period preceding the date of calculation, annualized) is equal to or greater than 8.75%; provided that in order to satisfy such debt yield requirement the applicable underwritten net cash flow (as annualized in accordance with the terms of the 620 W 153rd Street Whole Loan documents) must be no less than $10,237,500; (b) the borrowers will have entered into leases (in accordance with the 620 W 153rd Street Whole Loan agreement) demising, in the aggregate, at least 95% of the residential units at the 620 W 153rd Street Property, pursuant to which each of the tenants thereunder has accepted possession, and is in occupancy, of all of the space demised under its respective lease; and (c) no Trigger Period (as defined below) is continuing.
Rent Concession Reserve – So long as no event of default under the 620 W 153rd Street Whole Loan agreement has occurred and then be continuing, provided sufficient sums then remain in the rent concession reserve, the lender will be required to transfer the applicable amount set forth below on each payment date in each calendar month set forth below either (x) if a Trigger Period is continuing, to the cash management account, to be applied in accordance with the 620 W 153rd Street Whole Loan agreement, or (y) if no Trigger Period is then continuing, to the borrowers.
| Rent Concession Schedule |
| Month | 5/2024 | 6/2024 | 7/2024 | 8/2024 | 9/2024 | 10/2024 | 11/2024 | 12/2024 | Total |
| $ | $21,362.50 | $36,800.00 | $67,687.50 | $28,587.50 | $5,025.00 | $2,475.00 | $2,575.00 | $8,825.00 | $173,337.50 |
Lockbox / Cash Management. The 620 W 153rd Street Whole Loan is structured with a springing lockbox and springing cash management. Upon the occurrence of a Trigger Period, the 620 W 153rd Street Whole Loan requires the borrowers to, or cause the property manager to, immediately deposit all revenue from the 620 W 153rd Street Property received by the borrowers or property manager into the lockbox account (or in the case of the lease termination payments, deposit directly into the TI/LC reserve) within two business days of receipt. In addition, within five days of the occurrence of such Trigger Period, the borrowers are required to send a notice to all tenants directing them to pay all rents directly into the lockbox account. Upon the occurrence and during the continuance of a Trigger Period, all funds in the lockbox account are required to be swept on each business day to a cash management account under the control of the lender to be applied and disbursed in accordance with the 620 W 153rd Street Whole Loan documents, and all excess cash flow funds remaining in the cash management account after the application of such funds in accordance with the 620 W 153rd Street Whole Loan documents are required to be disbursed to an excess cash reserve.
A “Trigger Period” will commence upon the earliest of the following: (i) the occurrence of an event of default under the 620 W 153rd Street Whole Loan documents; (ii) on or after the payment date occurring in October 2024, the debt service coverage ratio for the 620 W 153rd Street Whole Loan being less than 1.15x for one calendar quarter or (iii) on or after the payment date occurring in October 2024, the commencement of a Significant Tenant Trigger Period (as defined below).
A Trigger Period will end: (a) with regard to clause (i) of the prior sentence, upon the cure of such event of default; (b) with regard to clause (ii) of the prior sentence, upon the debt service coverage ratio for the 620 W 153rd Street Whole Loan being greater than or equal to 1.15x for one consecutive calendar quarter; and (c) with regard to clause (iii) of the prior sentence, termination of such Significant Tenant Trigger Period.
A ”Significant Tenant Trigger Period” means a period of time (A) commencing upon the earliest of (i) the occurrence of a Significant Tenant Non-Renewal Event (as defined below), (ii) the occurrence of a Significant Tenant Termination Event (as defined below), (iii) the occurrence of a Significant Tenant Default Event (as defined below), (iv) the occurrence of a Significant Tenant Go-Dark Event (as defined below) or (v) the occurrence of a Significant Tenant Bankruptcy Action (as defined below); and (B) expiring upon (v) with regard to clause (A)(i) above, the cure of a Significant Tenant Non-Renewal
THE INFORMATION IN THIS STRUCTURAL AND COLLATERAL TERM SHEET IS NOT COMPLETE AND MAY BE AMENDED PRIOR TO THE TIME OF SALE. THIS TERM SHEET IS NOT AN OFFER TO SELL THESE SECURITIES AND IT IS NOT A SOLICITATION OF AN OFFER TO BUY THESE SECURITIES IN ANY JURISDICTION WHERE THE OFFER OR SALE IS NOT PERMITTED. |
| | 38 | |
| Structural and Collateral Term Sheet | | BMO 2024-5C4 |
| No. 1 – 620 W 153rd Street |
Event with respect to the applicable Significant Tenant Lease (as defined below), (w) with regard to clause (A)(ii) above, the cure of a Significant Tenant Termination Event with respect to the applicable Significant Tenant Lease, (x) with regard to clause (A)(iii) above, the cure of a Significant Tenant Default Event with respect to the applicable Significant Tenant Lease, (y) with regard to clause (A)(iv) above, the cure of a Significant Tenant Go-Dark Event with respect to the applicable Significant Tenant Lease, and (z) with regard to clause (A)(v) above, the cure of a Significant Tenant Bankruptcy Action with respect to the applicable Significant Tenant.
A ”Significant Tenant Lease” means (i) any lease which, together with all other leases to the same tenant and to all affiliates of such tenant (and assuming the exercise of all expansion rights and all preferential rights to lease additional space at the 620 W 153rd Street Property pursuant to such lease(s), if any), either (a) provides for rental income representing 15% or more of the total rental income for the 620 W 153rd Street Property, in the aggregate, and/or (b) demises more than 15% of the total net rentable area at the 620 W 153rd Street Property, in the aggregate, and (ii) any replacement lease or leases of all or any portion of the applicable space entered into pursuant to and in accordance with the provisions of the 620 W 153rd Street Whole Loan documents.
A ”Significant Tenant” means any tenant under a Significant Tenant Lease. There is no Significant Tenant at the 620 W 153rd Street Property as of the Cut-off Date.
A ”Significant Tenant Non-Renewal Event” means (1) with respect to any Significant Tenant Lease, the date which is the earlier of (x) 12 months prior to the then-current expiration date of such Significant Tenant Lease or (y) the date required under such Significant Tenant Lease by which the applicable Significant Tenant is required to give notice of its exercise of a renewal option thereunder (if any), whether such Significant Tenant Lease is in its initial term or an extension term, unless as of such date, (i) such Significant Tenant has irrevocably exercised in writing its renewal option (if any), in accordance with and pursuant to such Significant Tenant Lease, to extend the term of such Significant Tenant Lease for an additional term following the then-current expiration date of such Significant Tenant Lease and (ii) the borrowers have delivered to the lender evidence of such extension notice in form and substance reasonably acceptable to the lender; and cured upon (2) with respect to any Significant Tenant Lease, the date on which the borrowers have satisfied all of the following conditions: (A) either (i) the applicable Significant Tenant signs a new lease in accordance with the applicable provisions of the 620 W 153rd Street Whole Loan documents for all or substantially all of the premises demised under the applicable Significant Tenant Lease, which new lease will be for an initial term of not less than five years, have a net effective rental rate of not less than the net effective rental rate of the applicable Significant Tenant Lease as of the date on which the applicable Significant Tenant Non-Renewal Event occurred and is otherwise in form and substance acceptable to the lender (a “Significant Tenant New Lease”), or (ii) all or substantially all of the premises demised under the applicable Significant Tenant Lease is demised pursuant to a replacement lease in accordance with the applicable provisions of the 620 W 153rd Street Whole Loan documents, which replacement lease will be for an initial term of not less than five years, have a net effective rental rate of not less than the net effective rental rate of the applicable Significant Tenant Lease as of the date on which the applicable Significant Tenant Non-Renewal Event occurred and is otherwise in form and substance acceptable to the lender (a “Significant Tenant Replacement Lease”); (B) the borrowers have delivered to the lender (i) a copy of such Significant Tenant New Lease or such Significant Tenant Replacement Lease, as applicable, and (ii) an acceptable tenant estoppel certificate from the applicable Significant Tenant or the replacement tenant, as applicable, with respect to such Significant Tenant New Lease or such Significant Tenant Replacement Lease, as applicable; and (C) the borrowers have paid all leasing brokerage commissions payable by the borrowers in connection with such Significant Tenant New Lease or such Significant Tenant Replacement Lease, as applicable, and delivered to the lender a paid invoice reasonably satisfactory to the lender evidencing the payment of the same.
A ”Significant Tenant Termination Event” means, with respect to any Significant Tenant Lease, the earlier to occur of (i) the date on which the applicable Significant Tenant notifies the borrowers, the property manager or any affiliate of any individual borrower or the property manager or any of their respective agents or representatives in writing of such Significant Tenant’s intention to terminate such Significant Tenant Lease or (ii) the termination of such Significant Tenant Lease; and cured upon with respect to any Significant Tenant Lease, the date on which the borrowers have satisfied all of the following conditions: (A) either (i) the applicable Significant Tenant signs a Significant Tenant New Lease or (ii) all or substantially all of the premises demised under the applicable Significant Tenant Lease is demised pursuant to a Significant Tenant Replacement Lease; (B) the borrowers have delivered to the lender (i) a copy of such Significant Tenant New Lease or such Significant Tenant Replacement Lease, as applicable, and (ii) an acceptable tenant estoppel certificate from the applicable Significant Tenant or the replacement tenant, as applicable, with respect to such Significant Tenant New Lease or such
THE INFORMATION IN THIS STRUCTURAL AND COLLATERAL TERM SHEET IS NOT COMPLETE AND MAY BE AMENDED PRIOR TO THE TIME OF SALE. THIS TERM SHEET IS NOT AN OFFER TO SELL THESE SECURITIES AND IT IS NOT A SOLICITATION OF AN OFFER TO BUY THESE SECURITIES IN ANY JURISDICTION WHERE THE OFFER OR SALE IS NOT PERMITTED. |
| | 39 | |
| Structural and Collateral Term Sheet | | BMO 2024-5C4 |
| No. 1 – 620 W 153rd Street |
Significant Tenant Replacement Lease, as applicable; and (C) the borrowers have paid all leasing brokerage commissions payable by the borrowers in connection with such Significant Tenant New Lease or such Significant Tenant Replacement Lease, as applicable, and delivered to the lender a paid invoice reasonably satisfactory to the lender evidencing the payment of same.
A ”Significant Tenant Default Event” means with respect to any Significant Tenant Lease, the occurrence of any event of default (beyond any applicable notice and/or cure period) by the applicable Significant Tenant under such Significant Tenant Lease; and cured upon, with respect to any Significant Tenant Lease, the date on which the applicable event of default under such Significant Tenant Lease has been cured and no other event of default then exists under such Significant Tenant Lease.
A ”Significant Tenant Go-Dark Event” means, with respect to any Significant Tenant Lease, the earlier to occur of (i) the date on which the applicable Significant Tenant vacates, surrenders or ceases to conduct its normal business operations in all or substantially all of the applicable space or otherwise “goes dark” at the 620 W 153rd Street Property (other than temporary closures for repairs in connection with a casualty or renovations which are expressly permitted under such Significant Tenant Lease) or (ii) the date on which the applicable Significant Tenant notifies the borrowers, the property manager or any affiliate of any individual borrower or the property manager or any of their respective agents or representatives in writing of such Significant Tenant’s intention to do any of the acts set forth in the foregoing clause (i); and cured upon, with respect to any Significant Tenant Lease, the date on which the borrowers have satisfied all of the following conditions: (A) the applicable Significant Tenant has resumed operations and been open for business to the public at the 620 W 153rd Street Property in all or substantially all of the applicable space (and no event of default has occurred and is then continuing); and (B) the borrowers have delivered an acceptable tenant estoppel certificate from such Significant Tenant with respect to such Significant Tenant Lease.
A ”Significant Tenant Bankruptcy Action” means, with respect to any Significant Tenant, if: (i) such Significant Tenant makes an assignment for the benefit of creditors; (ii) such Significant Tenant files a voluntary petition in bankruptcy; (iii) such Significant Tenant is adjudged as bankrupt or insolvent, or has entered against it an order for relief, in any bankruptcy or insolvency proceedings; (iv) such Significant Tenant consents to or files a petition or answer seeking for itself any reorganization, arrangement, composition, readjustment, liquidation, dissolution or similar relief under any statute, law or regulation; (v) such Significant Tenant files an answer or other pleading admitting or failing to contest the material allegations of a petition filed against it in any bankruptcy or insolvency proceeding; (vi) such Significant Tenant seeks, consents to or acquiesces in the appointment of a trustee, receiver, liquidator, sequestrator, custodian or any similar official of or for such Significant Tenant or of all or any substantial part of its properties; (vii) within 60 days after the commencement of any proceeding against such Significant Tenant seeking reorganization, arrangement, composition, readjustment, liquidation, dissolution or similar relief under any statute, law or regulation, the proceeding has not been dismissed; (viii) within 45 days after the appointment without such Significant Tenant’s consent or acquiescence of a trustee, receiver or liquidator of such Significant Tenant or of all or any substantial part of its properties, the appointment is not vacated or stayed, or within 45 days after the expiration of any such stay, the appointment is not vacated; or (ix) such Significant Tenant takes any action in furtherance of any of the foregoing. A Significant Tenant Bankruptcy Action is cured on the date on which the applicable Significant Tenant Bankruptcy Action has been dismissed and the applicable Significant Tenant Lease has been affirmed by such Significant Tenant.
Subordinate and Mezzanine Debt. None.
Permitted Future Mezzanine or Secured Subordinate Indebtedness. None.
Partial Release. None Permitted.
Ground Lease. None.
THE INFORMATION IN THIS STRUCTURAL AND COLLATERAL TERM SHEET IS NOT COMPLETE AND MAY BE AMENDED PRIOR TO THE TIME OF SALE. THIS TERM SHEET IS NOT AN OFFER TO SELL THESE SECURITIES AND IT IS NOT A SOLICITATION OF AN OFFER TO BUY THESE SECURITIES IN ANY JURISDICTION WHERE THE OFFER OR SALE IS NOT PERMITTED. |
| | 40 | |
| Structural and Collateral Term Sheet | | BMO 2024-5C4 |
| No. 2 – GNL Industrial Portfolio |
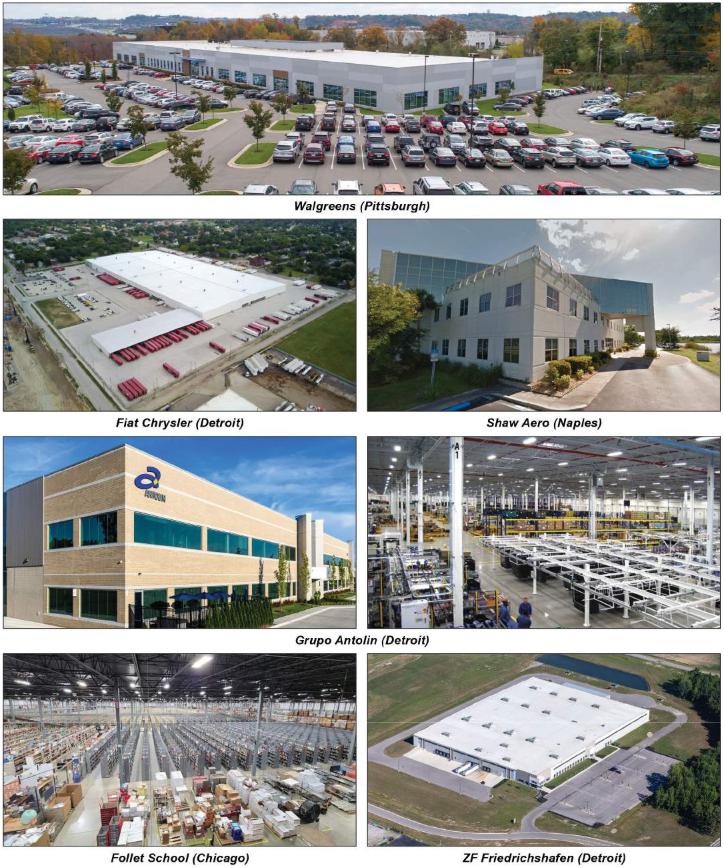
THE INFORMATION IN THIS STRUCTURAL AND COLLATERAL TERM SHEET IS NOT COMPLETE AND MAY BE AMENDED PRIOR TO THE TIME OF SALE. THIS TERM SHEET IS NOT AN OFFER TO SELL THESE SECURITIES AND IT IS NOT A SOLICITATION OF AN OFFER TO BUY THESE SECURITIES IN ANY JURISDICTION WHERE THE OFFER OR SALE IS NOT PERMITTED. |
| | 41 | |
| Structural and Collateral Term Sheet | | BMO 2024-5C4 |
| No. 2 – GNL Industrial Portfolio |
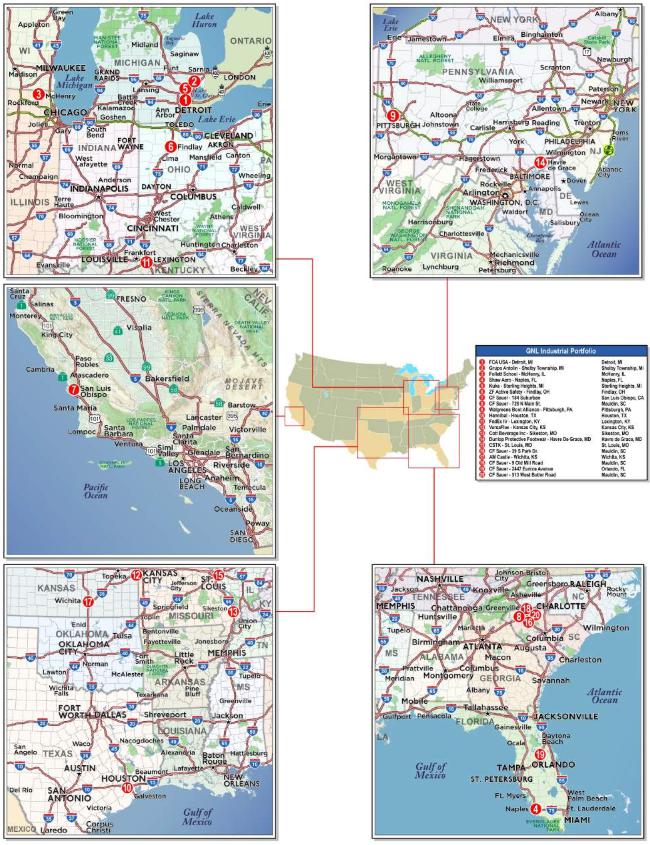
THE INFORMATION IN THIS STRUCTURAL AND COLLATERAL TERM SHEET IS NOT COMPLETE AND MAY BE AMENDED PRIOR TO THE TIME OF SALE. THIS TERM SHEET IS NOT AN OFFER TO SELL THESE SECURITIES AND IT IS NOT A SOLICITATION OF AN OFFER TO BUY THESE SECURITIES IN ANY JURISDICTION WHERE THE OFFER OR SALE IS NOT PERMITTED. |
| | 42 | |
| Structural and Collateral Term Sheet | | BMO 2024-5C4 |
| No. 2 – GNL Industrial Portfolio |
| Mortgage Loan Information | | Property Information |
| Mortgage Loan Seller: | BMO | | Single Asset / Portfolio: | Portfolio |
| Original Principal Balance(1): | $70,000,000 | | Title: | Fee |
| Cut-off Date Principal Balance(1): | $70,000,000 | | Property Type – Subtype(7): | Various – Various |
| % of IPB: | 8.1% | | Net Rentable Area (SF): | 3,908,306 |
| Loan Purpose: | Refinance | | Location(7): | Various |
| Borrowers(2): | Various | | Year Built / Renovated(7): | Various |
| Borrower Sponsor: | Global Net Lease Operating Partnership, L.P. | | Occupancy: | 100.0% |
| Interest Rate: | 5.74400% | | Occupancy Date: | 5/6/2024 |
| Note Date: | 4/5/2024 | | 4th Most Recent NOI (As of)(8): | NAV |
| Maturity Date: | 4/6/2029 | | 3rd Most Recent NOI (As of): | $26,588,345 (12/31/2021) |
| Interest-only Period: | 60 months | | 2nd Most Recent NOI (As of): | $27,583,927 (12/31/2022) |
| Original Term: | 60 months | | Most Recent NOI (As of): | $28,146,019 (12/31/2023) |
| Original Amortization Term: | None | | UW Economic Occupancy: | 100.0% |
| Amortization Type: | Interest Only | | UW Revenues: | $32,612,362 |
| Call Protection(3): | L(11),YM1(14),DorYM1(28),O(7) | | UW Expenses: | $2,698,321 |
| Lockbox / Cash Management: | Hard / Springing | | UW NOI: | $29,914,041 |
| Additional Debt(1): | Yes | | UW NCF: | $29,327,795 |
| Additional Debt Balance(1): | $167,000,000 | | Appraised Value / Per SF: | $440,475,000 / $113 |
| Additional Debt Type(1): | Pari Passu | | Appraisal Date(9): | Various |
| | | | | |
| Escrows and Reserves(4) | | Financial Information(1) |
| | Initial | Monthly | Initial Cap | | Cut-off Date Loan / SF: | $61 |
| Taxes: | $376,843 | $94,211(5) | N/A | | Maturity Date Loan / SF: | $61 |
| Insurance: | $0 | Springing | N/A | | Cut-off Date LTV: | 53.8% |
| Replacement Reserves: | $0 | Springing | N/A | | Maturity Date LTV: | 53.8% |
| TI/LC: | $0 | Springing | N/A | | UW NCF DSCR: | 2.12x |
| Other(6): | $1,634,412 | $0 | N/A | | UW NOI Debt Yield: | 12.6% |
| | | | | | | |
| Sources and Uses |
| Sources | Proceeds | % of Total | | Uses | Proceeds | % of Total |
| Whole Loan Amount | $237,000,000 | 95.1 | % | | Loan Payoff | $240,000,000 | 96.3 | % |
| Borrower Sponsor Equity | 12,312,601 | 4.9 | | | Closing Costs(10) | 7,301,346 | 2.9 | |
| | | | | Reserves | 2,011,255 | 0.8 | |
| Total Sources | $249,312,601 | 100.0 | % | | Total Uses | $249,312,601 | 100.0 | % |
| (1) | The GNL Industrial Portfolio Mortgage Loan (as defined below) is part of the GNL Industrial Portfolio Whole Loan (as defined below), which is evidenced by 17 pari passu promissory notes with an aggregate principal balance of $237,000,000. The Financial Information presented above is based on the aggregate principal balance of the promissory notes comprising the GNL Industrial Portfolio Whole Loan. |
| (2) | See “The Borrowers” below. |
| (3) | The GNL Industrial Portfolio Whole Loan may be voluntarily prepaid in whole (but not in part, other than in connection with the release of an individual property, to cure a Debt Yield Trigger (as defined below) or to obtain the DSCR threshold necessary for casualty/condemnation proceeds to be made available to the borrowers), at any time after April 5, 2025, with the payment of a yield maintenance premium if such prepayment is made prior to October 6, 2028. From and after October 6, 2028, the GNL Industrial Portfolio Whole Loan may be voluntarily prepaid in whole (but not in part, other than in connection with the release of an individual property, to cure a Debt Yield Trigger or to obtain the DSCR threshold necessary for casualty/condemnation proceeds to be made available to the borrowers), without the payment of a yield maintenance premium. The GNL Industrial Portfolio Whole Loan may be defeased in whole (but not in part, other than in connection with the release of an individual property pursuant to the GNL Industrial Portfolio Whole Loan documents) at any time after the earlier to occur of (i) April 5, 2027 and (ii) the date that is two years from the closing date of the securitization that includes the last pari passu note of the GNL Industrial Portfolio Whole Loan to be securitized. The assumed defeasance lockout period of 25 payments is based on the expected BMO 2024-5C4 securitization closing date in May 2024. The actual lockout period may be longer. |
| (4) | See “Escrows and Reserves” below for further discussion of reserve information. |
| (5) | The borrowers are required to deposit approximately $94,211 for five of the GNL Industrial Portfolio Properties. With respect to the remaining 15 properties, reserves for taxes are springing as discussed in “Tax Reserve” below. |
| (6) | Other Reserves include Follet Replacement Work Reserve (as defined below) of approximately $741,403, a free rent reserve of $553,119, a Cott Beverage Concrete Work Reserve (as defined below) of $230,000 and an outstanding TI/LC reserve of $109,890. |
| (7) | See “The Properties” below. |
| (8) | Fourth most recent revenue is unavailable because the GNL Industrial Portfolio Properties were acquired by the borrower sponsor on various dates between 2014 and 2020. |
| (9) | Appraisals are dated between February 28, 2024 and March 7, 2024. |
| (10) | Closing Costs includes an interest rate buy-down fee of approximately $4,740,000. |
THE INFORMATION IN THIS STRUCTURAL AND COLLATERAL TERM SHEET IS NOT COMPLETE AND MAY BE AMENDED PRIOR TO THE TIME OF SALE. THIS TERM SHEET IS NOT AN OFFER TO SELL THESE SECURITIES AND IT IS NOT A SOLICITATION OF AN OFFER TO BUY THESE SECURITIES IN ANY JURISDICTION WHERE THE OFFER OR SALE IS NOT PERMITTED. |
| | 43 | |
| Structural and Collateral Term Sheet | | BMO 2024-5C4 |
| No. 2 – GNL Industrial Portfolio |
The Loan. The second largest mortgage loan (the “GNL Industrial Portfolio Mortgage Loan”) is part of a whole loan (the “GNL Industrial Portfolio Whole Loan”) evidenced by 17 pari passu promissory notes in the aggregate original principal amount of $237,000,000. The GNL Industrial Portfolio Mortgage Loan is evidenced by the controlling Note A-1 which has an outstanding principal balance as of the Cut-off Date of $70,000,000. The GNL Industrial Portfolio Mortgage Loan will be included in the BMO 2024-5C4 securitization trust and represents approximately 8.1% of the Initial Pool Balance. The GNL Industrial Portfolio Whole Loan was co-originated on April 5, 2024 by Bank of Montreal (“BMO”), Société Générale Financial Corporation (“SGFC”), Barclays Capital Real Estate Inc. (“Barclays”) and KeyBank National Association (“KeyBank”). The GNL Industrial Portfolio Whole Loan is secured by the borrowers’ fee simple interest in 19 industrial properties and one office property (the “GNL Industrial Portfolio Properties”). The GNL Industrial Portfolio Whole Loan has a five-year term that is interest-only for the full term and accrues interest at a rate of 5.74400% per annum on an Actual/360 basis.
The table below identifies the promissory notes that comprise the GNL Industrial Portfolio Whole Loan. The GNL Industrial Portfolio Whole Loan will be serviced pursuant to the pooling and servicing agreement for the BMO 2024-5C4 trust securitization. The relationship between the holders of the GNL Industrial Portfolio Whole Loan is governed by a co-lender agreement as described under “Description of the Mortgage Pool --The Whole Loans --The Serviced Pari Passu Whole Loans” and “The Pooling and Servicing Agreement” in the Preliminary Prospectus.
| Whole Loan Summary |
| Note | Original Balance | Cut-off Date Balance | Note Holder | Controlling Piece |
| A-1 | $70,000,000 | $70,000,000 | BMO 2024-5C4 | Yes |
| A-2(1) | $15,000,000 | $15,000,000 | BMO | No |
| A-3(1) | $10,000,000 | $10,000,000 | BMO | No |
| A-4(1) | $8,000,000 | $8,000,000 | BMO | No |
| A-5(1) | $3,650,000 | $3,650,000 | BMO | No |
| A-6(1) | $16,500,000 | $16,500,000 | Barclays | No |
| A-7(1) | $12,500,000 | $12,500,000 | Barclays | No |
| A-8(1) | $8,000,000 | $8,000,000 | Barclays | No |
| A-9(1) | $6,400,000 | $6,400,000 | Barclays | No |
| A-10(1) | $4,000,000 | $4,000,000 | Barclays | No |
| A-11(1) | $15,000,000 | $15,000,000 | SGFC | No |
| A-12(1) | $10,550,000 | $10,550,000 | SGFC | No |
| A-13(1) | $10,000,000 | $10,000,000 | SGFC | No |
| A-14(1) | $20,000,000 | $20,000,000 | KeyBank | No |
| A-15(1) | $12,000,000 | $12,000,000 | KeyBank | No |
| A-16(1) | $10,000,000 | $10,000,000 | KeyBank | No |
| A-17(1) | $5,400,000 | $5,400,000 | KeyBank | No |
| Whole Loan | $237,000,000 | $237,000,000 | | |
| (1) | Expected to be contributed to one or more future securitization trusts. |
The Properties. The GNL Industrial Portfolio Properties are comprised of 19 industrial properties and one office property totaling 3,908,306 square feet and located across 12 states. Built between 1960 and 2018, the GNL Industrial Portfolio Properties range in size from 60,000 square feet to 997,022 square feet. Each individual GNL Industrial Portfolio Property is leased to a single tenant, and 100% of net rentable area at five mortgaged properties is leased to C.F. Sauer Company under a master lease.
THE INFORMATION IN THIS STRUCTURAL AND COLLATERAL TERM SHEET IS NOT COMPLETE AND MAY BE AMENDED PRIOR TO THE TIME OF SALE. THIS TERM SHEET IS NOT AN OFFER TO SELL THESE SECURITIES AND IT IS NOT A SOLICITATION OF AN OFFER TO BUY THESE SECURITIES IN ANY JURISDICTION WHERE THE OFFER OR SALE IS NOT PERMITTED. |
| | 44 | |
| Structural and Collateral Term Sheet | | BMO 2024-5C4 |
| No. 2 – GNL Industrial Portfolio |
The following table presents geographical information relating to the GNL Industrial Portfolio Properties:
| GNL Industrial Portfolio Properties by State(1) |
| State | Number of Properties | Square Feet | % of Total
Square Feet |
| Michigan | 3 | 1,556,829 | 39.8% |
| South Carolina | 4 | 485,000 | 12.4% |
| Illinois | 1 | 486,868 | 12.5% |
| Kansas | 2 | 240,600 | 6.2% |
| Missouri | 2 | 226,029 | 5.8% |
| Ohio | 1 | 216,300 | 5.5% |
| Kentucky | 1 | 138,487 | 3.5% |
| Florida | 2 | 137,481 | 3.5% |
| Maryland | 1 | 120,000 | 3.1% |
| Texas | 1 | 109,000 | 2.8% |
| California | 1 | 106,066 | 2.7% |
| Pennsylvania | 1 | 85,646 | 2.2% |
| Total/Weighted Average | 20 | 3,908,306 | 100.0% |
| (1) | Based on the underwritten rent rolls dated May 6, 2024. |
THE INFORMATION IN THIS STRUCTURAL AND COLLATERAL TERM SHEET IS NOT COMPLETE AND MAY BE AMENDED PRIOR TO THE TIME OF SALE. THIS TERM SHEET IS NOT AN OFFER TO SELL THESE SECURITIES AND IT IS NOT A SOLICITATION OF AN OFFER TO BUY THESE SECURITIES IN ANY JURISDICTION WHERE THE OFFER OR SALE IS NOT PERMITTED. |
| | 45 | |
| Structural and Collateral Term Sheet | | BMO 2024-5C4 |
| No. 2 – GNL Industrial Portfolio |
The following table presents certain information relating to the GNL Industrial Portfolio Properties, which are presented in descending order of their allocated loan amounts:
| GNL Industrial Portfolio Summary |
| Property Name | City, State(1) | Property Type – Subtype(1) | Year Built / Renovated (1) | SF(2) | Occupancy(2) | Allocated Whole Loan Cut-off Date Balance | % of Allocated Whole Loan Cut-off Date Balance | Appraised Value(1)(3) | % of UW Base Rent(2) |
| FCA USA - Detroit, MI | Detroit, MI | Industrial / Warehouse/Distribution | 2015 / 2017,
2020 | 997,022 | 100.0% | $70,495,484 | 29.7% | $130,900,000 | 29.0% |
| Grupo Antolin - Shelby Township, MI | Shelby Township, MI | Industrial / Manufacturing | 2017 / NAP | 359,807 | 100.0% | 27,788,900 | 11.7 | 52,000,000 | 12.9 |
| Follett School - McHenry, IL | McHenry, IL | Industrial / Warehouse/Distribution | 1996 / 2002 | 486,868 | 100.0% | 20,249,276 | 8.5 | 37,600,000 | 7.5 |
| Shaw Aero - Naples, FL | Naples, FL | Industrial / Manufacturing/Flex | 1999 / NAP | 130,581 | 100.0% | 11,578,708 | 4.9 | 21,500,000 | 3.8 |
| Kuka - Sterling Heights, MI | Sterling Heights, MI | Industrial / Warehouse/Distribution | 2006 / NAP | 200,000 | 100.0% | 10,743,964 | 4.5 | 19,950,000 | 4.1 |
| ZF Active Safety - Findlay, OH | Findlay, OH | Industrial / Manufacturing/Warehouse | 2018 / NAP | 216,300 | 100.0% | 10,474,692 | 4.4 | 19,450,000 | 5.8 |
| CF Sauer - 184 Suburban | San Luis Obispo, CA | Industrial / Warehouse/Distribution | 1998 / NAP | 106,066 | 100.0% | 9,693,802 | 4.1 | 18,000,000 | 4.0 |
| CF Sauer - 728 N Main St. | Mauldin, SC | Industrial / Warehouse/Distribution | 1970 / NAP | 247,000 | 100.0% | 9,639,948 | 4.1 | 17,900,000 | 4.2 |
| Walgreens Boot Alliance - Pittsburgh, PA | Pittsburgh, PA | Industrial / Distribution/Flex | 2015 / 2024 | 85,646 | 100.0% | 8,643,640 | 3.6 | 16,050,000 | 3.6 |
| Hannibal - Houston, TX | Houston, TX | Industrial / Manufacturing/Distribution | 1978 / 2016 | 109,000 | 100.0% | 8,562,859 | 3.6 | 15,900,000 | 4.0 |
| FedEx IV - Lexington, KY | Lexington, KY | Industrial / Warehouse/Distribution | 2006 / 2012 | 138,487 | 100.0% | 7,916,605 | 3.3 | 14,700,000 | 2.9 |
| VersaFlex - Kansas City, KS | Kansas City, KS | Industrial / Manufacturing | 1977 / 1990 | 113,000 | 100.0% | 7,243,424 | 3.1 | 13,450,000 | 2.6 |
| Cott Beverage Inc - Sikeston, MO | Sikeston, MO | Industrial / Warehouse/Distribution | 2016 / NAP | 170,000 | 100.0% | 6,408,680 | 2.7 | 11,900,000 | 3.0 |
| Dunlop Protective Footwear - Havre De Grace, MD | Havre de Grace, MD | Industrial / Warehouse/Distribution | 2002 / NAP | 120,000 | 100.0% | 6,085,554 | 2.6 | 11,300,000 | 2.3 |
| CSTK - St. Louis, MO | St. Louis, MO | Industrial / Warehouse | 2015 / NAP | 56,029 | 100.0% | 6,031,699 | 2.5 | 11,200,000 | 3.4 |
| CF Sauer - 39 S Park Dr. | Mauldin, SC | Industrial / Warehouse/Distribution | 1982 / NAP | 152,000 | 100.0% | 5,923,990 | 2.5 | 11,000,000 | 2.6 |
| AM Castle - Wichita, KS | Wichita, KS | Industrial / Manufacturing | 1976 / NAP | 127,600 | 100.0% | 5,708,572 | 2.4 | 10,600,000 | 2.8 |
| CF Sauer - 9 Old Mill Road | Mauldin, SC | Industrial / Warehouse/Distribution | 1960 / 2004 | 80,000 | 100.0% | 3,123,558 | 1.3 | 5,800,000 | 1.3 |
| CF Sauer - 2447 Eunice Avenue | Orlando, FL | Industrial / Warehouse/Distribution | 1971 / NAP | 6,900 | 100.0% | 417,372 | 0.2 | 775,000 | 0.2 |
| CF Sauer - 513 West Butler Road | Mauldin, SC | Office / Suburban | 2000 / 2004 | 6,000 | 100.0% | 269,273 | 0.1 | 500,000 | 0.1 |
| Total/Weighted Average | | | | | 100.0% | $237,000,000 | 100.0% | $440,475,000(3) | 100.0% |
| (1) | Information obtained from the appraisals. |
| (2) | Based on the underwritten rent rolls dated May 6, 2024. |
| (3) | The appraised value represents the aggregate of the “as-is” appraised values of the GNL Industrial Portfolio Properties, which results in a Cut-off Date LTV and Maturity Date LTV of 53.8%. The individual appraisal valuation dates are between February 28, 2024, and March 7, 2024. |
THE INFORMATION IN THIS STRUCTURAL AND COLLATERAL TERM SHEET IS NOT COMPLETE AND MAY BE AMENDED PRIOR TO THE TIME OF SALE. THIS TERM SHEET IS NOT AN OFFER TO SELL THESE SECURITIES AND IT IS NOT A SOLICITATION OF AN OFFER TO BUY THESE SECURITIES IN ANY JURISDICTION WHERE THE OFFER OR SALE IS NOT PERMITTED. |
| | 46 | |
| Structural and Collateral Term Sheet | | BMO 2024-5C4 |
| No. 2 – GNL Industrial Portfolio |
Appraisals. According to the appraisals, the GNL Industrial Portfolio Properties had an aggregate “as-is” value of $440,475,000 as of various dates between February 28, 2024 and March 7, 2024. Based on the aggregate of the “as-is” appraised values of $440,475,000, the Cut-off Date LTV and Maturity Date LTV for the GNL Industrial Portfolio Whole Loan is 53.8%.
| GNL Industrial Portfolio Appraised Value(1) |
| Properties | Value | Capitalization Rate |
| FCA USA - Detroit, MI | $130,900,000 | 6.50% |
| Grupo Antolin - Shelby Township, MI | 52,000,000 | 6.25% |
| Follett School - McHenry, IL | 37,600,000 | 5.75% |
| Shaw Aero - Naples, FL | 21,500,000 | 5.00% |
| Kuka - Sterling Heights, MI | 19,950,000 | 6.00% |
| ZF Active Safety - Findlay, OH | 19,450,000 | 7.75% |
| CF Sauer - 184 Suburban | 18,000,000 | 6.25% |
| CF Sauer - 728 N Main St. | 17,900,000 | 6.75% |
| Walgreens Boot Alliance - Pittsburgh, PA | 16,050,000 | 6.50% |
| Hannibal - Houston, TX | 15,900,000 | 7.25% |
| FedEx IV - Lexington, KY | 14,700,000 | 5.75% |
| VersaFlex - Kansas City, KS | 13,450,000 | 5.75% |
| Cott Beverage Inc - Sikeston, MO | 11,900,000 | 7.50% |
| Dunlop Protective Footwear - Havre De Grace, MD | 11,300,000 | 6.00% |
| CSTK - St. Louis, MO | 11,200,000 | 8.50% |
| CF Sauer - 39 S Park Dr. | 11,000,000 | 6.75% |
| AM Castle - Wichita, KS | 10,600,000 | 7.25% |
| CF Sauer - 9 Old Mill Road | 5,800,000 | 6.75% |
| CF Sauer - 2447 Eunice Avenue | 775,000 | 6.50% |
| CF Sauer - 513 West Butler Road | 500,000 | 7.75% |
| Total / Wtd. Avg. | $440,475,000(2) | 6.44% |
| (2) | Total / Wtd. Avg. represents the aggregate of the “as-is” appraised values of the GNL Industrial Portfolio Properties. |
Environmental. According to the Phase I environmental assessments dated various dates in March 2024, there were no recognized environmental conditions at any of the GNL Industrial Portfolio Properties. However, several controlled recognized environmental conditions were identified at each of the FCA USA - Detroit, MI, Kuka - Sterling Heights, MI, CSTK - St. Louis, MO and AM Castle - Wichita, KS properties. See “Description of the Mortgage Pool—Environmental Conditions.”
The following table presents certain information relating to the historical and current occupancy of the GNL Industrial Portfolio Properties:
| Historical and Current Occupancy(1) |
| 2021 | 2022 | 2023 | Current |
| 100.0% | 100.0% | 100.0% | 100.0% |
| (1) | Based on the underwritten rent rolls dated May 6, 2024. |
Major Tenants.
Fiat Chrysler (997,022 square feet; 25.5% of portfolio NRA; 29.0% of portfolio underwritten base rent). Fiat Chrysler Automobiles N.V. (“Fiat Chrysler”) was an Italian-American automobile company that is now a subsidiary of Stellantis N.V. (“Stellantis”). Stellantis was formed in a 2021 merger between Fiat Chrysler and Peugeot S.A. and features 14 iconic automotive brands. industrial operations in more than 30 countries and customers in more than 130 markets. Fiat Chrysler occupies 997,022 square feet at the FCA USA – Detroit, MI mortgaged property with a lease expiration date of July 2, 2030, and two, five-year renewal options remaining. Fiat Chrysler does not have any termination options at any of the mortgaged properties.
Grupo Antolin (359,807 square feet; 9.2% of portfolio NRA; 12.9% of portfolio underwritten base rent). Grupo Antolin (“Grupo Antolin”) is a manufacturer in the development, design and manufacture of interior components for the automobile industry (overhead, doors, lighting and cockpits and consoles). Grupo Antolin has 24,000 employees and 130 factories worldwide, spanning across 25 countries. Grupo Antolin occupies 359,807 square feet at the Grupo Antolin – Shelby Township, MI mortgaged property with a lease expiration date of October 31, 2032, and two, five-year renewal options remaining. Grupo Antolin has one option to terminate the lease at the end of 138th month of the lease term (i.e., May 2029)
THE INFORMATION IN THIS STRUCTURAL AND COLLATERAL TERM SHEET IS NOT COMPLETE AND MAY BE AMENDED PRIOR TO THE TIME OF SALE. THIS TERM SHEET IS NOT AN OFFER TO SELL THESE SECURITIES AND IT IS NOT A SOLICITATION OF AN OFFER TO BUY THESE SECURITIES IN ANY JURISDICTION WHERE THE OFFER OR SALE IS NOT PERMITTED. |
| | 47 | |
| Structural and Collateral Term Sheet | | BMO 2024-5C4 |
| No. 2 – GNL Industrial Portfolio |
if it has not defaulted under the lease, by giving the landlord written notice of such termination no later than 126th month of the lease term. If Grupo Antolin fails to meet the conditions to such earlier termination under the lease and/or fails to timely vacate its space, then its option to terminate the lease will be null and void and of no further effect, and the lease will remain in force. Under the lease, Grupo Antolin has the right to request that the borrower construct an addition to the building pursuant to the terms of the lease, and the lender is required to permit the commencement of such construction if certain conditions set forth in the GNL Industrial Portfolio Whole Loan agreement (including customary REMIC requirements) are satisfied. If there are seven or more years remaining on the lease term (including any exercised extension options) following the completion of such construction, the construction will be at the borrower’s cost. In such case, the borrower will be required to deliver a letter of credit to the lender in an amount equal to 110% of the construction budget, and the failure to deliver such a letter of credit will trigger recourse to the borrower and the non-recourse carveout guarantor, capped at the amount of the allocated loan amount for the related Mortgaged Property. Additionally, there is a losses carveout for any losses that the lender incurs due to any exercise by the tenant of its construction right under its lease from the date lender acquires the Grupo Antolin, Shelby Township, MI property upon a foreclosure or action in lieu thereof until the lender sells or otherwise transfers title to the Grupo Antolin, Shelby Township, MI property to an unaffiliated third party. See “Description of the Mortgage Pool—Certain Terms of the Mortgage Loans—Additions to the Mortgaged Property” in the Preliminary Prospectus.
Sauer Brands (597,966 square feet; 15.3% of portfolio NRA; 12.3% of portfolio underwritten base rent). C.F. Sauer Company (“Sauer Brands”) is a cooking products business that makes extracts and other food products. Sauer Brands was founded in 1887 and is headquartered in Richmond, Virginia. Sauer Brands occupies 106,066 square feet at the CF Sauer - 184 Suburban mortgaged property with a lease expiration date of July 31, 2039, and two, five-year renewal options remaining. Sauer Brands occupies 247,000 square feet at the CF Sauer - 728 N Main St. mortgaged property with a lease expiration date of July 31, 2039, and two, five-year renewal options remaining. Sauer Brands occupies 152,000 square feet at the CF Sauer - 39 S Park Dr. mortgaged property with a lease expiration date of July 31, 2039, and two, five-year renewal options remaining. Sauer Brands occupies 80,000 square feet at the CF Sauer - 9 Old Mill Road mortgaged property with a lease expiration date of July 31, 2039, and two, five-year renewal options remaining. Sauer Brands occupies 6,900 square feet at the CF Sauer - 2447 Eunice Avenue mortgaged property with a lease expiration date of July 31, 2039, and two, five-year renewal options remaining. Sauer Brands occupies 6,000 square feet at the CF Sauer - 513 West Butler Road mortgaged property with a lease expiration date of July 31, 2039, and has two, five-year renewal options remaining. Sauer Brands does not have any termination options at any of the GNL Industrial Portfolio Properties.
THE INFORMATION IN THIS STRUCTURAL AND COLLATERAL TERM SHEET IS NOT COMPLETE AND MAY BE AMENDED PRIOR TO THE TIME OF SALE. THIS TERM SHEET IS NOT AN OFFER TO SELL THESE SECURITIES AND IT IS NOT A SOLICITATION OF AN OFFER TO BUY THESE SECURITIES IN ANY JURISDICTION WHERE THE OFFER OR SALE IS NOT PERMITTED. |
| | 48 | |
| Structural and Collateral Term Sheet | | BMO 2024-5C4 |
| No. 2 – GNL Industrial Portfolio |
The following table presents certain information relating to the tenants at the GNL Industrial Portfolio Properties:
| Tenant Summary(1) |
Tenant | Ratings
Moody’s/S&P/Fitch(2) | Net Rentable Area (SF) | % of
Total NRA | UW
Base Rent PSF |
UW
Base Rent
| % of Total
UW Base Rent | Lease
Exp. Date | Renewal Options |
| Fiat Chrysler | Baa2 / BBB / BBB+ | 997,022 | 25.5 | % | $8.54 | $8,513,498 | 29.0 | % | 7/02/2030 | 2 x 5 years |
| Grupo Antolin(3) | B3 / B- / NR | 359,807 | 9.2 | | $10.57 | 3,802,404 | 12.9 | | 10/31/2032 | 2 x 5 years |
| Sauer Brands(4) | NR / NR / NR | 597,966 | 15.3 | | $6.05 | 3,615,710 | 12.3 | | 7/31/2039 | 2 x 5 years |
| Follett School Solutions | NR / NR / NR | 486,868 | 12.5 | | $4.54 | 2,212,474 | 7.5 | | 12/31/2029 | 1 x 5 years |
| ZF Active Safety(5) | Ba1 / BB+ / NR | 216,300 | 5.5 | | $7.91 | 1,711,423 | 5.8 | | 10/31/2033 | 2 x 5 years |
| KUKA Systems | NR / BBB+ / NR | 200,000 | 5.1 | | $6.00 | 1,200,000 | 4.1 | | 6/30/2034 | 1 x 5 years |
| Hannibal Industries | Baa1 / A- / A- | 109,000 | 2.8 | | $10.89 | 1,186,508 | 4.0 | | 9/30/2029 | 2 x 5 years |
| Shaw Aero Devices | Baa1 / BBB+ / BBB+ | 130,581 | 3.3 | | $8.49 | 1,108,751 | 3.8 | | 12/31/2032 | 2 x 5 years |
| Walgreens | Ba2 / BBB- / NR | 85,646 | 2.2 | | $12.26 | 1,050,038 | 3.6 | | 11/30/2030 | 3 x 5 years |
| Central States Thermo King | NR / NR / NR | 56,029 | 1.4 | | $17.72 | 992,862 | 3.4 | | 3/25/2030 | 2 x 5 years |
| Cott Beverages | NR / NR / NR | 170,000 | 4.3 | | $5.10 | 867,512 | 3.0 | | 1/31/2027 | 4 x 5 years |
| FedEx Ground | Baa2 / BBB / NR | 138,487 | 3.5 | | $6.18 | 855,554 | 2.9 | | 4/30/2032 | 2 x 5 years |
| A.M. Castle & Co(6) | NR / NR / NR | 127,600 | 3.3 | | $6.36 | 811,272 | 2.8 | | 10/31/2029 | 2 x 5 years |
| VersaFlex | A3 / BBB+ / BBB+ | 113,000 | 2.9 | | $6.85 | 774,000 | 2.6 | | 12/31/2038 | 4 x 5 years |
| Dunlop Protective Footwear | NR / NR / NR | 120,000 | 3.1 | | $5.68 | 681,932 | 2.3 | | 1/17/2031 | 3 x 5 years |
| Total Occupied | | 3,908,306 | 100.0 | % | $7.52 | $29,383,938 | 100.0 | % | | |
| Vacant Space | | 0 | 0.0 | | | | | | |
| Totals/ Wtd. Avg. | | 3,908,306 | 100.0 | % | | | | | |
| (1) | Based on the underwritten rent rolls dated May 6, 2024. |
| (2) | Certain ratings are those of the parent company whether or not the parent guarantees the lease. |
| (3) | Grupo Antolin has a one-time option to terminate its lease at the end of the 138th month of the lease term (i.e., May 2029) if it has not defaulted under the lease, by giving the landlord written notice of such termination no later than the 126th month of the lease term. If Grupo Antolin fails to meet the conditions to such earlier termination under the lease and/or fails to timely vacate, then its option to terminate the lease will be null and void and of no further effect, and the lease will remain in force. Under the lease, Grupo Antolin has the right to request that the borrower construct an addition to the building pursuant to the terms of the lease. See “Description of the Mortgage Pool—Certain Terms of the Mortgage Loans—Additions to the Mortgaged Property” in the Preliminary Prospectus. |
| (4) | Sauer Brands leases 100% of net rentable area at five mortgaged properties under a master lease. |
| (5) | ZF Active Safety may terminate its lease as of the last day of the 120th month of the term (the “ZF Active Safety Early Termination Date”). To exercise such early termination right, ZF Active Safety must (a) deliver written notice to the landlord that ZF Active Safety desires to terminate its lease at least twelve months prior to the ZF Active Safety Early Termination Date; and (b) pay the landlord a payment equal to the net present value of all remaining rent for the remainder of the initial term calculated using an interest rate of 5% concurrently with delivery of such notice. |
| (6) | A.M. Castle & Co may terminate its lease as the end of the 10th lease year (the “A.M. Castle & Co Early Termination Date”). To exercise such early termination right, A.M. Castle & Co must (a) deliver written notice to the landlord that A.M. Castle & Co desires to terminate its lease at least 180 days prior to the A.M. Castle & Co Early Termination Date; and (b) pay the landlord an amount equal to $1,622,544. |
THE INFORMATION IN THIS STRUCTURAL AND COLLATERAL TERM SHEET IS NOT COMPLETE AND MAY BE AMENDED PRIOR TO THE TIME OF SALE. THIS TERM SHEET IS NOT AN OFFER TO SELL THESE SECURITIES AND IT IS NOT A SOLICITATION OF AN OFFER TO BUY THESE SECURITIES IN ANY JURISDICTION WHERE THE OFFER OR SALE IS NOT PERMITTED. |
| | 49 | |
| Structural and Collateral Term Sheet | | BMO 2024-5C4 |
| No. 2 – GNL Industrial Portfolio |
The following table presents certain information relating to the lease rollover schedule at the GNL Industrial Portfolio Properties:
| Lease Rollover Schedule(1) |
| Year | Number of Leases Expiring | Net Rentable Area Expiring | % of NRA Expiring | UW Base Rent Expiring | % of UW Base Rent Expiring | Cumulative Net Rentable Area Expiring | Cumulative % of NRA Expiring | Cumulative UW Base Rent Expiring | Cumulative % of UW Base Rent Expiring |
| Vacant | NAP | 0 | 0.0 | % | NAP | NAP | | 0 | 0.0% | | NAP | NAP |
| 2024 & MTM | 0 | 0 | 0.0 | | $0 | 0.0 | % | 0 | 0.0% | | $0 | 0.0% |
| 2025 | 0 | 0 | 0.0 | | 0 | 0.0 | | 0 | 0.0% | | $0 | 0.0% |
| 2026 | 0 | 0 | 0.0 | | 0 | 0.0 | | 0 | 0.0% | | $0 | 0.0% |
| 2027 | 1 | 170,000 | 4.3 | | 867,512 | 3.0 | | 170,000 | 4.3% | | $867,512 | 3.0% |
| 2028 | 0 | 0 | 0.0 | | 0 | 0.0 | | 170,000 | 4.3% | | $867,512 | 3.0% |
| 2029 | 3 | 723,468 | 18.5 | | 4,210,254 | 14.3 | | 893,468 | 22.9% | | $5,077,766 | 17.3% |
| 2030 | 3 | 1,138,697 | 29.1 | | 10,556,397 | 35.9 | | 2,032,165 | 52.0% | | $15,634,164 | 53.2% |
| 2031 | 1 | 120,000 | 3.1 | | 681,932 | 2.3 | | 2,152,165 | 55.1% | | $16,316,096 | 55.5% |
| 2032 | 3 | 628,875 | 16.1 | | 5,766,710 | 19.6 | | 2,781,040 | 71.2% | | $22,082,805 | 75.2% |
| 2033 | 1 | 216,300 | 5.5 | | 1,711,423 | 5.8 | | 2,997,340 | 76.7% | | $23,794,228 | 81.0% |
| 2034 | 1 | 200,000 | 5.1 | | 1,200,000 | 4.1 | | 3,197,340 | 81.8% | | $24,994,228 | 85.1% |
| 2035 & Beyond | 3(2) | 710,966 | 18.2 | | 4,389,710 | 14.9 | | 3,908,306 | 100.0% | | $29,383,938 | 100.0% |
| Total | 16(2) | 3,908,306 | 100.0 | % | $29,383,938 | 100.0 | % | | | | |
| (1) | Based on the underwritten rent rolls dated May 6, 2024. |
| (2) | Sauer Brands leases 100% of net rentable area at five mortgaged properties under a master lease. |
The following table presents certain information relating to the operating history and underwritten cash flows of the GNL Industrial Portfolio Properties:
Operating History and Underwritten Net Cash Flow(1) |
| | 2021 | 2022 | 2023 | Underwritten | Per Square Foot | %(2) |
| Base Rent | $26,802,840 | $27,593,953 | $28,172,655 | $28,646,464 | $7.33 | 87.8 | % |
| Rent Steps(3) | 0 | 0 | 0 | 737,474 | 0.19 | 2.3 | |
| Straight-Line Rent | 0 | 0 | 0 | 924,060 | 0.24 | 2.8 | |
| Total Reimbursements(4) | 1,137,641 | 2,395,564 | 1,911,018 | 2,304,364 | 0.59 | 7.1 | |
| Gross Potential Rent | $27,940,480 | $29,989,517 | $30,083,673 | $32,612,362 | $8.34 | 100.0 | % |
| (Vacancy/Credit Loss) | 0 | 0 | 0 | 0 | 0.00 | (0.0) | |
| Effective Gross Income | $27,940,480 | $29,989,517 | $30,083,673 | $32,612,362 | $8.34 | 100.0 | % |
| Total Expenses | $1,352,135 | $2,405,590 | $1,937,654 | $2,698,321 | $0.69 | 8.3 | % |
| Net Operating Income | $26,588,345 | $27,583,927 | $28,146,019 | $29,914,041 | $7.65 | 91.7 | % |
| Capital Expenditures | 0 | 0 | 0 | 586,246 | 0.15 | 1.8 | |
| TI/LC | 0 | 0 | 0 | 0 | 0.00 | 0.0 | |
| Net Cash Flow | $26,588,345 | $27,583,927 | $28,146,019 | $29,327,795 | $7.50 | 89.9 | % |
| (1) | Based on the underwritten rent rolls dated as of May 6, 2024. |
| (2) | % column represents percent of Gross Potential Rent for all revenue lines and represents percent of Effective Gross Income for the remainder of fields. |
| (3) | Represents contractual rent steps through April 1, 2025. |
| (4) | Reimbursements include tax recoveries, insurance recoveries, operating expense recoveries, management fee recoveries and triple-net recovery offset. |
THE INFORMATION IN THIS STRUCTURAL AND COLLATERAL TERM SHEET IS NOT COMPLETE AND MAY BE AMENDED PRIOR TO THE TIME OF SALE. THIS TERM SHEET IS NOT AN OFFER TO SELL THESE SECURITIES AND IT IS NOT A SOLICITATION OF AN OFFER TO BUY THESE SECURITIES IN ANY JURISDICTION WHERE THE OFFER OR SALE IS NOT PERMITTED. |
| | 50 | |
| Structural and Collateral Term Sheet | | BMO 2024-5C4 |
| No. 2 – GNL Industrial Portfolio |
The Market. The following table presents certain market information relating to the GNL Industrial Portfolio Properties:
| Market Area Summary(1) |
| Property | Concluded Market Rent PSF | Market | Submarket | Submarket Inventory (SF)(2) | Submarket Vacancy(2) | Submarket NNN Rent PSF(2) |
| FCA USA - Detroit, MI | $8.25 | Detroit | Detroit East | 44,415,145 | 6.0% | $6.76 |
| Grupo Antolin - Shelby Township, MI | $8.50 | Detroit | Groesbeck North | 33,592,703 | 2.4% | $8.94 |
| Follett School - McHenry, IL | $5.25 | McHenry | Collar Counties | 94,236 | 0.0% | N/A |
| Shaw Aero - Naples, FL | $10.00 | Naples | Naples | 1,570,498 | 3.3% | $16.97 |
| Kuka - Sterling Heights, MI | $6.50 | Detroit | W of Van Dyke/Macomb | 64,273,233 | 1.1% | $9.27 |
| ZF Active Safety - Findlay, OH | $6.00 | US Industrial | Northwest Ohio | 36,189,339 | 0.6% | $3.81 |
| CF Sauer - 184 Suburban | $10.80 | San Luis Obispo | South San Luis Obispo | 3,900,000 | 3.9% | N/A |
| CF Sauer - 728 N Main St. | $4.85 | Greenville-Spartanburg | I-85/Wenwood/ICAR | 10,405,749 | 6.7% | $4.32 |
| Walgreens Boot Alliance - Pittsburgh, PA | $12.00 | Pittsburgh | Parkway West Corridor | 11,152,677 | 11.2% | $9.77 |
| Hannibal - Houston, TX | $10.67 | Houston | Northwest-Far | 88,750,582 | 8.0% | $7.39 |
| FedEx IV - Lexington, KY | $6.00 | US Office | West Lexington/Fayette | 19,182 | 7.2% | N/A |
| VersaFlex - Kansas City, KS | $5.75 | Kansas City | Wyandotte | 36,022,386 | 2.7% | $4.35 |
| Cott Beverage Inc - Sikeston, MO | $5.00 | Sikeston | Scott & New Madrid Counties | 5,600,000 | 4.6% | $4.96 |
| Dunlop Protective Footwear - Havre De Grace, MD | $6.50 | I-95 North Corridor | Harford | 24,895,364 | 0.7% | N/A |
| CSTK - St. Louis, MO | $16.00 | St. Louis | St Louis City North | 227,100,000 | 3.1% | $6.61 |
| CF Sauer - 39 S Park Dr. | $4.85 | Greenville-Spartanburg | I-85/Wenwood/ICAR | 10,405,749 | 6.7% | $4.32 |
| AM Castle - Wichita, KS | $5.75 | Wichita | Southeast | 5,573,557 | 6.8% | $5.92 |
| CF Sauer - 9 Old Mill Road | $5.00 | US Office | I-85/Wenwood/ICAR | 146,169,579 | 5.4% | $6.78 |
| CF Sauer - 2447 Eunice Avenue | $11.00 | Orlando | Orlando-NW/Silver Star/Apopka | 22,373,308 | 2.3% | $11.45 |
| CF Sauer - 513 West Butler Road | $12.00 | US Office | Mauldin/Fountain | 1,424,482 | 2.1% | $22.10 |
| (1) | Information obtained from the appraisals, unless otherwise indicated. |
| (2) | Submarket Inventory, Submarket Vacancy, and Submarket NNN Rent PSF represent the trailing twelve month period as of the third quarter of 2023. |
The Borrowers. The borrowers for the GNL Industrial Portfolio Whole Loan are ARG CFSRSLB001, LLC, ARC SANPLFL001, LLC, ARC FSMCHIL001, LLC, ARC AMWCHKS001, LLC, ARG VFKCYKS001, LLC, ARC FELEXKY001, LLC, ARC OGHDGMD001, LLC, ARC KUSTHMI001, LLC, ARG FCDETMI001, LLC, ARG GASTNMI001, LLC, ARG CBSKSMO001, LLC, ARG CSSTLMO001, LLC, ARG ZFFINOH001, LLC, ARG WGPTBPA001, LLC, ARG CFSRSLB002, LLC and ARC HLHSNTX001, LLC, each a Delaware limited liability company with two independent directors. Legal counsel to the borrowers delivered a non-consolidation opinion in connection with the origination of the GNL Industrial Portfolio Whole Loan.
The Borrower Sponsor. The borrower sponsor is Global Net Lease Operating Partnership, L.P. (“GNL”), a publicly traded real estate investment trust listed on the NYSE focused on acquiring a global portfolio of commercial properties, with an emphasis on sale-leaseback transactions involving single tenant, mission critical income producing net-leased assets across the United States, Western and Northern Europe, and necessity retail assets in strategic locations. GNL owns over 1,300 properties, encompassing over 66 million square feet in 11 countries. GNL is the guarantor of certain nonrecourse carveout liabilities under the GNL Industrial Portfolio Whole Loan.
Property Management. The GNL Industrial Portfolio Properties are currently managed by Global Net Lease Properties, LLC, a Delaware limited liability company, an affiliate of the borrower sponsor.
Escrows and Reserves. At origination of the GNL Industrial Portfolio Whole Loan, the borrowers deposited (i) approximately $376,843 for the tax reserve, (ii) $109,890 for the outstanding TI/LC reserve fund, (iii) 553,119 for the free rent reserve, (iv) $230,000 for the cost of certain concrete repairs and replacement required in connection with the Cott Beverage Inc - Sikeston, MO Property (the “Cott Beverage Concrete Work Fund”) and (v) approximately $741,403 for the replacement costs in connection with the Follett School - McHenry, IL Property (the “Follet Replacement Work Fund”).
THE INFORMATION IN THIS STRUCTURAL AND COLLATERAL TERM SHEET IS NOT COMPLETE AND MAY BE AMENDED PRIOR TO THE TIME OF SALE. THIS TERM SHEET IS NOT AN OFFER TO SELL THESE SECURITIES AND IT IS NOT A SOLICITATION OF AN OFFER TO BUY THESE SECURITIES IN ANY JURISDICTION WHERE THE OFFER OR SALE IS NOT PERMITTED. |
| | 51 | |
| Structural and Collateral Term Sheet | | BMO 2024-5C4 |
| No. 2 – GNL Industrial Portfolio |
Tax Reserve – The borrowers are required to deposit into a real estate tax reserve, on a monthly basis, 1/12th of the taxes that the lender estimates will be payable over the next-ensuing 12-month period (currently equal to approximately $94,211 for five of the GNL Industrial Portfolio Properties). The borrowers are not required to make monthly tax deposits for an individual property if (i) no event of default has occurred and is continuing, (ii) such individual property is leased to a single tenant, (iii) the tenant at such individual property occupies one or more entire tax parcels and is required to pay all taxes and other charges due with respect to the individual property directly to the applicable taxing authorities and actually does pay such taxes, (iv) the borrowers provide the lender satisfactory evidence of payment of taxes prior to the date such taxes become delinquent, (v) the lease at such individual property is in full force and effect and there is no default under such lease and (vi) no Cash Sweep Period (as defined below) is in effect.
Insurance Reserve – The borrowers are required to escrow 1/12th of the annual estimated insurance payments on a monthly basis. The borrowers are not required to make monthly deposits to the insurance reserve for an individual property if (a) borrowers maintain blanket policies of insurance in accordance with the GNL Industrial Portfolio Whole Loan documents or (b) the following conditions are satisfied: (i) no event of default has occurred or is continuing, (ii) such individual property is leased to a single tenant, (iii) the tenant is required to maintain insurance for the individual property that complies with the GNL Industrial Portfolio Whole Loan documents pursuant to its lease, and is in fact maintaining such insurance, (iv) the borrowers provide evidence to the lender that all insurance premiums with regard to the required insurance have been paid no later than 30 days prior to the expiration of such insurance, (v) the lease at such individual property is in full force and effect and there is no default thereunder, and (vi) no Cash Sweep Period is in effect.
Replacement Reserve – During the continuance of a Cash Sweep Period, the borrowers are required to deposit into an account for repairs and replacements (the “Replacement Reserve”), on a monthly basis, an amount equal to 1/12th of $0.15 multiplied by the total number of rentable square feet. In the event of a partial release, the monthly deposit will be reduced by an amount equal to 1/12th of the product obtained by multiplying $0.15 by the total number of rentable square feet of the individual mortgaged property that is subject of such partial release.
TI / LC Reserve – During a Cash Sweep Period, the borrowers are required to deposit into a reserve for tenant improvements and leasing commissions (the “Rollover Reserve”), on a monthly basis, an amount equal to 1/12th of $0.25 multiplied by the total number of rentable square feet. In the event of a partial release, the monthly deposit will be reduced by an amount equal to 1/12th of the product obtained by multiplying $0.25 by the total number of rentable square feet of the individual mortgaged property that is subject of such partial release.
Lockbox / Cash Management. The GNL Industrial Portfolio Whole Loan is structured with a hard lockbox and springing cash management. The borrowers and the property manager are required to cause all rents to be deposited directly into a lender-controlled lockbox account. All revenues received by the borrowers or property manager are required to be deposited in the lockbox account within one business day of receipt. During the continuance of a Cash Sweep Period, all funds on deposit in the lockbox account are required to be swept on each business day into a lender-controlled cash management account and applied on each payment date and disbursed in accordance with the GNL Industrial Portfolio Whole Loan documents.
A “Cash Sweep Period” means a period (A) commencing on the occurrence of any of the following (i) an event of default, or (ii) a Debt Yield Trigger Event (as defined below), and (B) ending upon (a) with respect to clause (i) above, a cure of the event of default or, (b) with respect to a Debt Yield Trigger Event, (i) the occurrence of a Debt Yield Cure (as defined below), (ii) the deliverance of a Debt Yield Cure - Letter of Credit (as defined below), or (iii) the borrowers’ completion of a Debt Yield Cure - Partial Prepayment (as defined below).
A “Debt Yield Trigger Event” means either (a) the debt yield being less than 9.0% for two consecutive calendar quarters based on a trailing twelve month period, or (b) if the borrowers previously cured or prevented a Debt Yield Trigger Event by depositing a Debt Yield Cure - Letter of Credit with the lender, the expiration of the three month period that commenced on the date that the borrowers delivered such Debt Yield Cure - Letter of Credit to the lender; provided, however, that a Debt Yield Trigger Event will not be deemed to have occurred if, within five business days of the date described in clause (a) or (b) of this definition, the borrowers deposit with the lender the applicable Debt Yield Cure - Letter of Credit or completes the applicable Debt Yield Cure - Partial Prepayment.
THE INFORMATION IN THIS STRUCTURAL AND COLLATERAL TERM SHEET IS NOT COMPLETE AND MAY BE AMENDED PRIOR TO THE TIME OF SALE. THIS TERM SHEET IS NOT AN OFFER TO SELL THESE SECURITIES AND IT IS NOT A SOLICITATION OF AN OFFER TO BUY THESE SECURITIES IN ANY JURISDICTION WHERE THE OFFER OR SALE IS NOT PERMITTED. |
| | 52 | |
| Structural and Collateral Term Sheet | | BMO 2024-5C4 |
| No. 2 – GNL Industrial Portfolio |
A “Debt Yield Cure” means the debt yield being greater than or equal to 9.0% for two consecutive calendar quarters based on a trailing twelve month period.
A “Debt Yield Cure - Letter of Credit” means a letter of credit in an amount equal to the excess cash flow that would have been swept in the three month period immediately preceding the applicable date of determination if a Cash Sweep Period had been in effect during such time, as reasonably determined by the lender. Each Debt Yield Cure - Letter of Credit will be effective for a period of three months and the borrowers may continue to prevent subsequent Debt Yield Trigger Events after each three month period by depositing with the lender additional Debt Yield Cure - Letters of Credit on, or prior to, the expiration of each such three month period. The Debt Yield Cure - Letter of Credit and all proceeds thereof will be deemed part of the reserve funds and will be held in escrow by the lender. The borrowers will pay all costs associated with the initial issuance, any modification or re-issuance of the Debt Yield Cure - Letter of Credit, now or in the future, in connection with any transfer of the GNL Industrial Portfolio Whole Loan by the lender, in connection with any securitization or otherwise. Upon such transfer, the borrowers agree that the lender is released from all liability in respect of the Debt Yield Cure - Letter of Credit, and that the borrowers will look solely to the transferee with respect to all matters relating to the Debt Yield Cure - Letter of Credit. In the event that a Debt Yield Cure occurs during a period wherein the lender is in possession of the Debt Yield Cure - Letter of Credit (or proceeds therefrom), the lender will promptly return the Debt Yield Cure - Letter of Credit (or proceeds therefrom) to the borrowers.
A “Debt Yield Cure – Partial Prepayment” means a partial prepayment of the GNL Industrial Portfolio Whole Loan in an amount (including any required yield maintenance premium) that results in a reduction of the then-outstanding principal balance of the GNL Industrial Portfolio Whole Loan sufficient to achieve a debt yield equal to or greater than 9.0% for the trailing twelve month period immediately preceding the date of determination.
Current Mezzanine or Secured Subordinate Indebtedness. None.
Permitted Future Mezzanine or Secured Subordinate Indebtedness. None.
Release of Collateral. On any payment date following (a) April 5, 2025 (with payment of a yield maintenance premium) or (b) the earlier of two years following the last note to be securitized or April 5, 2027 (with a partial defeasance), the borrowers may obtain the release of any of the GNL Industrial Portfolio Properties with 15 days’ notice if the following conditions (among others) are met: (i) no event of default has occurred and is continuing; (ii) the borrowers pay all costs and provide customary documentation as described in the GNL Industrial Portfolio Whole Loan documents; (iii) as of the date of consummation of the partial release, (a) the debt service coverage ratio with respect to the remaining individual mortgaged properties (as determined in accordance with the terms of the GNL Industrial Portfolio Whole Loan documents) will be no less than 2.12x (i.e., the debt service coverage ratio as of the origination date) or (b) if the released property is a Distressed Property (defined below), then such debt service coverage ratio with respect to the remaining individual mortgaged properties will be no less than 1.80x; (iv) as of the date of consummation of the partial release, (a) the debt yield with respect to the remaining individual mortgaged properties (as determined in accordance with the terms of the GNL Industrial Portfolio Whole Loan agreement) will be no less than 12.63% (i.e., the debt yield as of the origination date) or (b) if the released property is a Distressed Property, then such debt yield with respect to the remaining individual mortgaged properties will be no less than 10.75%; (v) payment of the release amount equal to (a) 130% of the allocated loan amount for such individual property if such individual property is a Distressed Property and (b) 115% of the allocated loan amount for such individual property for all other individual properties (including any applicable yield maintenance premium); and (vi) satisfaction of customary REMIC requirements. If the related borrower effectuates a partial release of the CF Sauer – 9 Old Mill Road property while the CF Sauer – 728 N Main St. property remains subject to the lien of the security instrument, then as a condition to the partial release of the CF Sauer – 9 Old Mill Road property, such borrower is required to enter into and record a reciprocal easement agreement that grants ingress and egress rights and easements for parking and access that provide the CF Sauer – 728 N Main St. property with ingress, egress, parking and access comparable to that existing as of the origination date.
A “Distressed Property” means an individual property, that as of the proposed partial release date for such property, and as reasonably determined by the lender, (i) is vacant and/or (ii) at which the tenant is not paying rent in violation of the applicable lease.
Ground Lease. None.
THE INFORMATION IN THIS STRUCTURAL AND COLLATERAL TERM SHEET IS NOT COMPLETE AND MAY BE AMENDED PRIOR TO THE TIME OF SALE. THIS TERM SHEET IS NOT AN OFFER TO SELL THESE SECURITIES AND IT IS NOT A SOLICITATION OF AN OFFER TO BUY THESE SECURITIES IN ANY JURISDICTION WHERE THE OFFER OR SALE IS NOT PERMITTED. |
| | 53 | |
| Structural and Collateral Term Sheet | | BMO 2024-5C4 |
| No. 3 – 28-40 West 23rd Street |
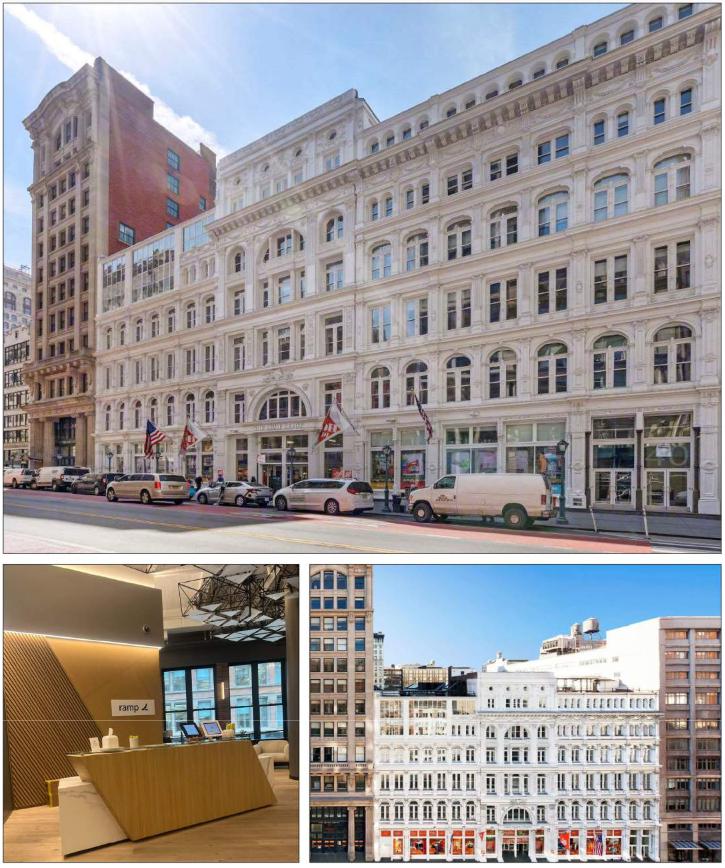
THE INFORMATION IN THIS STRUCTURAL AND COLLATERAL TERM SHEET IS NOT COMPLETE AND MAY BE AMENDED PRIOR TO THE TIME OF SALE. THIS TERM SHEET IS NOT AN OFFER TO SELL THESE SECURITIES AND IT IS NOT A SOLICITATION OF AN OFFER TO BUY THESE SECURITIES IN ANY JURISDICTION WHERE THE OFFER OR SALE IS NOT PERMITTED. |
| | 54 | |
| Structural and Collateral Term Sheet | | BMO 2024-5C4 |
| No. 3 – 28-40 West 23rd Street |
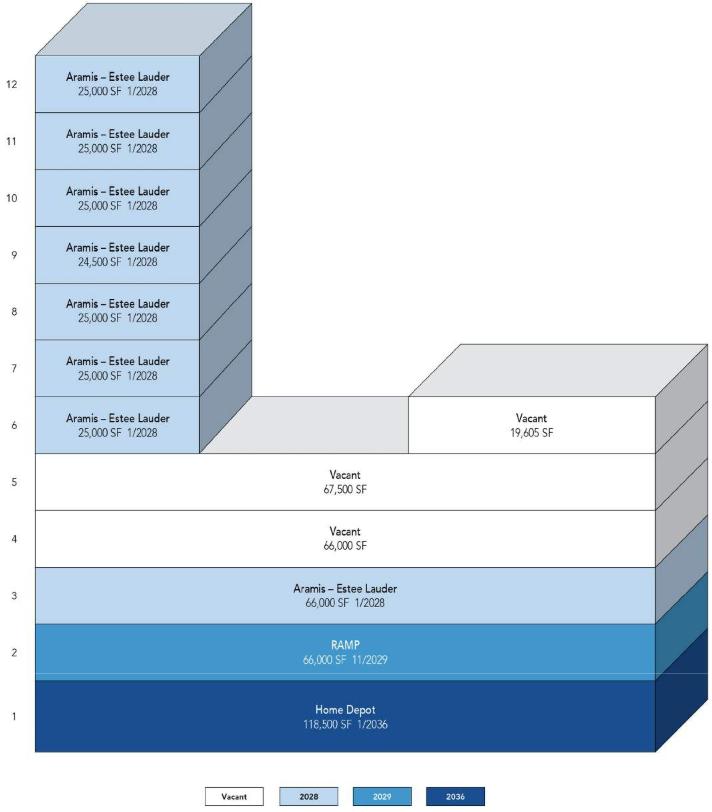
THE INFORMATION IN THIS STRUCTURAL AND COLLATERAL TERM SHEET IS NOT COMPLETE AND MAY BE AMENDED PRIOR TO THE TIME OF SALE. THIS TERM SHEET IS NOT AN OFFER TO SELL THESE SECURITIES AND IT IS NOT A SOLICITATION OF AN OFFER TO BUY THESE SECURITIES IN ANY JURISDICTION WHERE THE OFFER OR SALE IS NOT PERMITTED. |
| | 55 | |
| Structural and Collateral Term Sheet | | BMO 2024-5C4 |
| No. 3 – 28-40 West 23rd Street |
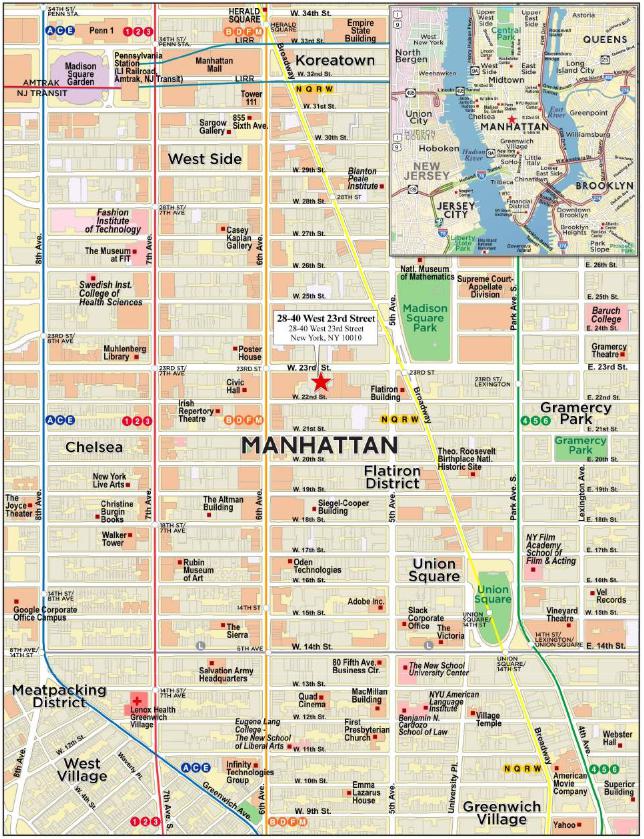
THE INFORMATION IN THIS STRUCTURAL AND COLLATERAL TERM SHEET IS NOT COMPLETE AND MAY BE AMENDED PRIOR TO THE TIME OF SALE. THIS TERM SHEET IS NOT AN OFFER TO SELL THESE SECURITIES AND IT IS NOT A SOLICITATION OF AN OFFER TO BUY THESE SECURITIES IN ANY JURISDICTION WHERE THE OFFER OR SALE IS NOT PERMITTED. |
| | 56 | |
| Structural and Collateral Term Sheet | | BMO 2024-5C4 |
| No. 3 – 28-40 West 23rd Street |
| Whole Loan Information | | Property Information |
| Whole Loan Seller: | CREFI | | Single Asset / Portfolio: | Single Asset |
| Original Principal Balance(1): | $50,000,000 | | Title: | Fee |
| Cut-off Date Principal Balance(1): | $50,000,000 | | Property Type – Subtype: | Mixed Use – Office / Retail |
| % of IPB: | 5.8% | | Net Rentable Area (SF): | 578,105 |
| Loan Purpose: | Refinance | | Location: | New York, NY |
| Borrower: | 23rd Street Properties LLC | | Year Built / Renovated: | 1911 / 1987 |
| Borrower Sponsors: | Robert B. Getreu, Michael T. Cohen and Andrew H. Roos | | Occupancy: | 73.5% |
| Interest Rate: | 6.07000% | | Occupancy Date: | 4/1/2024 |
| Note Date: | 4/5/2024 | | 4th Most Recent NOI (As of): | NAV |
| Maturity Date: | 4/6/2029 | | 3rd Most Recent NOI (As of): | $31,038,555 (12/31/2021) |
| Interest-only Period: | 60 months | | 2nd Most Recent NOI (As of): | $30,708,273 (12/31/2022) |
| Original Term: | 60 months | | Most Recent NOI (As of)(6): | $33,517,438 (12/31/2023) |
| Original Amortization Term: | None | | UW Economic Occupancy: | 74.9% |
| Amortization Type: | Interest Only | | UW Revenues: | $41,557,426 |
| Call Protection(2): | L(25),D(28),O(7) | | UW Expenses: | $17,664,098 |
| Lockbox / Cash Management: | Springing / Springing | | UW NOI(6): | $23,893,328 |
| Additional Debt(1): | Yes | | UW NCF: | $22,754,765 |
| Additional Debt Balance(1): | $105,000,000 | | Appraised Value / Per SF: | $420,000,000 / $727 |
| Additional Debt Type(1): | Pari Passu | | Appraisal Date: | 2/15/2024 |
| | | | | |
| Escrows and Reserves(3) | | Financial Information(1) |
| | Initial | Monthly | Initial Cap | | Cut-off Date Loan / SF: | $268 |
| Taxes(4): | $4,088,374 | $1,022,093 | N/A | | Maturity Date Loan / SF: | $268 |
| Insurance: | $0 | Springing | N/A | | Cut-off Date LTV: | 36.9% |
| Replacement Reserves: | $0 | $9,635 | $346,863 | | Maturity Date LTV: | 36.9% |
| TI/LC: | $0 | $0 | N/A | | UW NCF DSCR: | 2.39x |
| Other Reserves(5) | $27,248,306 | $0 | N/A | | UW NOI Debt Yield: | 15.4% |
| | | | | | | |
| | | | | | | |
| Sources and Uses |
| Sources | Proceeds | % of Total | | Uses | Proceeds | % of Total |
| Loan Amount | $155,000,000 | 89.6 | % | | Loan Payoff | $139,632,947 | 80.7 | % |
| Equity Contribution | 12,777,258 | 7.4 | | | Reserves(4) | 31,336,680 | 18.1 | |
| Other Sources(4) | 5,206,287 | 3.0 | | | Closing Costs | 2,013,918 | 1.2 | |
| Total Sources | $172,983,545 | 100.0 | % | | Total Uses | $172,983,545 | 100.0 | % |
| (1) | The 28-40 West 23rd Street Mortgage Loan (as defined below) is part of the 28-40 West 23rd Street Whole Loan (as defined below) which is comprised of five pari passu promissory notes with an aggregate original principal balance of $155,000,000. The 28-40 West 23rd Street Whole Loan was originated by Citi Real Estate Funding Inc. (“CREFI”). The Financial Information in the chart above is based on the aggregate outstanding principal balance as of the Cut-off Date of the 28-40 West 23rd Street Whole Loan. |
| (2) | The lockout period will be at least 25 payment dates beginning with and including the first payment date on May 6, 2024. Defeasance of the 28-40 West 23rd Street Whole Loan is permitted at any time after the earlier to occur of (a) the end of the two-year period commencing on the closing date of the securitization of the last promissory note representing a portion of the 28-40 West 23rd Street Whole Loan to be securitized and (b) April 5, 2027. The assumed defeasance lockout period of 25 payments is based on the expected BMO 2024-5C4 securitization closing date in May 2024. The actual lockout period may be longer. |
| (3) | See “Escrows and Reserves” below for further discussion of reserve information. |
| (4) | Initial Taxes funded from the existing tax reserve held in connection with the prior loan secured by the 28-40 West 23rd Street Property (as defined below). |
| (5) | Other Reserves consist of an initial future capital expenditures reserve of $23,149,913 and an initial unfunded obligations reserve of approximately $4,098,393. |
| (6) | The decrease from Most Recent NOI to UW NOI is primarily attributable to Xandr vacating their space at the 28-40 West 23rd Street Property at the end of their lease term in March 2024. The Xandr lease accounted for 153,105 square feet and $13,547,475 of annual base rent. |
The Loan. The third largest mortgage loan (the “28-40 West 23rd Street Mortgage Loan”) is part of a whole loan (the “28-40 West 23rd Street Whole Loan”) secured by the borrower’s fee interest in a mixed use office/retail property totaling 578,105 square feet located in New York, New York (the “28-40 West 23rd Street Property”). The 28-40 West 23rd Street Whole Loan is comprised of five pari passu notes, with an aggregate outstanding principal balance as of the Cut-off Date of $155,000,000. The 28-40 West 23rd Street Whole Loan was originated on April 5, 2024 by CREFI and accrues interest
THE INFORMATION IN THIS STRUCTURAL AND COLLATERAL TERM SHEET IS NOT COMPLETE AND MAY BE AMENDED PRIOR TO THE TIME OF SALE. THIS TERM SHEET IS NOT AN OFFER TO SELL THESE SECURITIES AND IT IS NOT A SOLICITATION OF AN OFFER TO BUY THESE SECURITIES IN ANY JURISDICTION WHERE THE OFFER OR SALE IS NOT PERMITTED. |
| | 57 | |
| Structural and Collateral Term Sheet | | BMO 2024-5C4 |
| No. 3 – 28-40 West 23rd Street |
at a fixed rate of 6.07000% per annum on an Actual/360 basis. The 28-40 West 23rd Street Whole Loan has an initial term of five years and is interest-only for the full term. The scheduled maturity date of the 28-40 West 23rd Street Whole Loan is the payment date that occurs on April 6, 2029. The 28-40 West 23rd Street Mortgage Loan is evidenced by the non-controlling Note A-2 with an outstanding principal balance as of the Cut-off Date of $50,000,000. The remaining notes are currently held by CREFI and are expected to be contributed to one or more future securitization trust(s).
The table below identifies the promissory notes that comprise the 28-40 West 23rd Street Whole Loan. The relationship between the holders of the 28-40 West 23rd Street Whole Loan is governed by a co-lender agreement as described under “Description of the Mortgage Pool—The Whole Loans—The Serviced Pari Passu Whole Loans” and “—The Outside Serviced Pari Passu Whole Loans” in the Preliminary Prospectus. The 28-40 West 23rd Street Whole Loan will initially be serviced under the pooling and servicing agreement for the BMO 2024-5C4 transaction until the controlling Note A-1 is contributed to a securitization, at which point the 28-40 West 23rd Street Whole Loan will be serviced under the pooling and servicing agreement for the securitization transaction to which Note A-1 is contributed. See “The Pooling and Servicing Agreement—Servicing of the Mortgage Loans” and “—Servicing of the Outside Serviced Whole Loans” in the Preliminary Prospectus.
| Whole Loan Summary |
| Note | Original Balance | Cut-off Date Balance | Note Holder | Controlling Piece |
| A-1(1) | $65,000,000 | $65,000,000 | CREFI | Yes |
| A-2 | $50,000,000 | $50,000,000 | BMO 2024-5C4 | No |
| A-3(1) | $25,000,000 | $25,000,000 | CREFI | No |
| A-4(1) | $10,000,000 | $10,000,000 | CREFI | No |
| A-5(1) | $5,000,000 | $5,000,000 | CREFI | No |
| Whole Loan | $155,000,000 | $155,000,000 | | |
| (1) | Expected to be contributed to one or more securitization trust(s). |
The Property. The 28-40 West 23rd Street Property is a part six and part 12-story, mixed use office and retail property totaling 578,105 square feet in New York, New York. The 28-40 West 23rd Street Property is situated on a 1.285-acre site along the south side of West 23rd Street, between Fifth and Sixth Avenue, in the Flatiron/Union Square submarket of New York, New York. The 28-40 West 23rd Street Property was originally constructed in 1911 and most recently renovated in 1987. At origination of the 28-40 West 23rd Street Whole Loan the borrower reserved $23,149,913 for future capital expenditures at the 28-40 West 23rd Street Property including renovations to the 4th through 6th floors which were recently vacated, upgrades to the roof deck, atrium and 7th floor terrace, expanding the skylight and atriums that run through the center of the building, and elevator modernization.
The 28-40 West 23rd Street Property consists of 459,605 square feet of office space and 118,500 square feet of retail space. As of April 1, 2024, the retail space was 100.0% leased by Home Depot who has been at the 28-40 West 23rd Street Property since August 2003 and has a current lease term through January 2036. As of April 1, 2024, the office space was 66.7% leased by RAMP and Aramis – Estee Lauder (“Estee Lauder”). As of April 1, 2024, the 28-40 West 23rd Street Property was in aggregate 73.5% occupied.
Major Tenants. The three largest tenants based on net rentable area are Estee Lauder, Home Depot and RAMP.
Estee Lauder (240,500 square feet; 41.6% of net rentable area; 61.9% of underwritten base rent) Estee Lauder (NYSE: EL), operates its Aramis brand out of the 28-40 West 23rd Street Property. Aramis is a New York-based company that manufactures and markets a brand of men’s fragrance and grooming products that are sold mainly in department stores. The brand was launched in 1963 and is now sold in approximately 150 countries around the world. Estee Lauder has been a tenant at the 28-40 West 23rd Street Property since January 2014 and has a current lease term through January 2028 with one, five-year renewal option and no termination options.
Home Depot (118,500 square feet; 20.5% of net rentable area; 22.6% of underwritten base rent) Founded in 1978, Home Depot is a home improvement retailer that sells a wide assortment of building materials, home improvement, and lawn and garden products. Home Depot has approximately 475,000 employees across more than 2,300 stores in the U.S., Canada
THE INFORMATION IN THIS STRUCTURAL AND COLLATERAL TERM SHEET IS NOT COMPLETE AND MAY BE AMENDED PRIOR TO THE TIME OF SALE. THIS TERM SHEET IS NOT AN OFFER TO SELL THESE SECURITIES AND IT IS NOT A SOLICITATION OF AN OFFER TO BUY THESE SECURITIES IN ANY JURISDICTION WHERE THE OFFER OR SALE IS NOT PERMITTED. |
| | 58 | |
| Structural and Collateral Term Sheet | | BMO 2024-5C4 |
| No. 3 – 28-40 West 23rd Street |
and Mexico. Home Depot has been at the 28-40 West 23rd Street Property since August 2003 and has a current lease term through January 2036 with one, ten-year renewal option and no termination options.
RAMP (66,000 square feet; 11.4% of net rentable area; 15.5% of underwritten base rent) RAMP is a fintech company that utilizes their space at the 28-40 West 23rd Street Property as their corporate headquarters. RAMP offers financial solutions for startups, small businesses, mid-markets, and enterprises with services including corporate cards, expense management, procurement, and easy-to-use mobile apps. RAMP recently commenced their lease at the 28-40 West 23rd Street Property in April 2024 and has a current lease term through November 2029 with one, five-year renewal option and no termination options.
Appraisal. According to the appraisal, the 28-40 West 23rd Street Property had an “as-is” appraised value of $420,000,000 as of February 15, 2024, as shown in the table below. Based on the “as-is” value of $420,000,000, the Cut-off Date LTV and Maturity Date LTV for the 28-40 West 23rd Street Whole Loan are 36.9%.
| 28-40 West 23rd Street Appraised Value |
| Property | Value(1) | Capitalization Rate |
| 28-40 West 23rd Street | $420,000,000 | 5.75% |
Environmental. The Phase I environmental assessment of the 28-40 West 23rd Street Property dated February 23, 2024 identified no recognized environmental conditions, controlled environmental conditions or significant data gaps with the property. See “Description of the Mortgage Pool—Environmental Considerations” in the Preliminary Prospectus.
The following table presents certain information relating to the historical occupancy of the 28-40 West 23rd Street Property:
| Historical and Current Occupancy(1) |
| 2021 | 2022 | 2023 | Current(2)(3) |
| 100.0% | 100.0% | 100.0% | 73.5% |
| (1) | Historical Occupancies are as of December 31 of each respective year, unless otherwise specified. |
| (2) | Based on the underwritten rent roll dated April 1, 2024. |
| (3) | The decrease between historical and current occupancy is driven by the former tenant Xandr being marked as vacant as its lease expired in March 2024. |
The following table presents certain information relating to the major tenants at the 28-40 West 23rd Street Property:
| Top Tenant Summary(1) |
| Tenant | Ratings
Moody’s/S&P/Fitch(2) | Net Rentable Area (SF) | % of
Total NRA | UW
Base Rent PSF |
UW
Base Rent | % of Total
UW Base Rent | Lease
Exp. Date |
| Estee Lauder | A1/A/NR | 240,500 | 41.6 | % | $87.97 | $21,156,188 | 61.9 | % | 1/31/2028 |
| Home Depot | A2/A/A | 118,500 | 20.5 | | $65.20 | 7,726,052 | 22.6 | | 1/31/2036 |
| RAMP | NR/NR/NR | 66,000 | 11.4 | | $80.00 | 5,280,000 | 15.5 | | 11/30/2029 |
| Total Occupied | | 425,000 | 73.5 | % | $80.38 | $34,162,241 | 100.0 | % | |
| Vacant Space | | 153,105 | 26.5 | | | | | |
| Totals/ Wtd. Avg. | | 578,105 | 100.0 | % | | | | |
| (1) | Based on the underwritten rent roll dated April 1, 2024, inclusive of $1,697,993 of straight line rent steps. |
| (2) | Certain ratings are those of the parent company whether or not the parent guarantees the lease. |
THE INFORMATION IN THIS STRUCTURAL AND COLLATERAL TERM SHEET IS NOT COMPLETE AND MAY BE AMENDED PRIOR TO THE TIME OF SALE. THIS TERM SHEET IS NOT AN OFFER TO SELL THESE SECURITIES AND IT IS NOT A SOLICITATION OF AN OFFER TO BUY THESE SECURITIES IN ANY JURISDICTION WHERE THE OFFER OR SALE IS NOT PERMITTED. |
| | 59 | |
| Structural and Collateral Term Sheet | | BMO 2024-5C4 |
| No. 3 – 28-40 West 23rd Street |
The following table presents certain information relating to the lease rollover schedule at the 28-40 West 23rd Street Property:
| Lease Rollover Schedule(1) |
| Year | Number of Leases Expiring | Net Rentable Area Expiring | % of NRA Expiring | UW Base Rent Expiring | % of UW Base Rent Expiring | Cumulative Net Rentable Area Expiring | Cumulative % of NRA Expiring | Cumulative UW Base Rent Expiring | Cumulative % of UW Base Rent Expiring |
| Vacant | 0 | 153,105 | 26.5 | % | NAP | NAP | | 153,105 | | 26.5% | | NAP | NAP |
| 2024 | 0 | 0 | 0.0 | | $0 | 0.0 | % | 153,105 | | 26.5% | | $0 | 0.0% |
| 2025 | 0 | 0 | 0.0 | | 0 | 0.0 | | 153,105 | | 26.5% | | $0 | 0.0% |
| 2026 | 0 | 0 | 0.0 | | 0 | 0.0 | | 153,105 | | 26.5% | | $0 | 0.0% |
| 2027 | 0 | 0 | 0.0 | | 0 | 0.0 | | 153,105 | | 26.5% | | $0 | 0.0% |
| 2028 | 1 | 240,500 | 41.6 | | 21,156,188 | 61.9 | | 393,605 | | 68.1% | | $21,156,188 | 61.9% |
| 2029 | 1 | 66,000 | 11.4 | | 5,280,000 | 15.5 | | 459,605 | | 79.5% | | $26,436,188 | 77.4% |
| 2030 | 0 | 0 | 0.0 | | 0 | 0.0 | | 459,605 | | 79.5% | | $26,436,188 | 77.4% |
| 2031 | 0 | 0 | 0.0 | | 0 | 0.0 | | 459,605 | | 79.5% | | $26,436,188 | 77.4% |
| 2032 | 0 | 0 | 0.0 | | 0 | 0.0 | | 459,605 | | 79.5% | | $26,436,188 | 77.4% |
| 2033 | 0 | 0 | 0.0 | | 0 | 0.0 | | 459,605 | | 79.5% | | $26,436,188 | 77.4% |
| 2034 | 0 | 0 | 0.0 | | 0 | 0.0 | | 459,605 | | 79.5% | | $26,436,188 | 77.4% |
| 2035 & Beyond | 1 | 118,500 | 20.5 | | 7,726,052 | 22.6 | | 578,105 | | 100.0% | | $34,162,241 | 100.0% |
| Total | 3 | 578,105 | 100.0 | % | $34,162,241 | 100.0 | % | | | | |
| (1) | Based on the underwritten rent roll dated April 1, 2024, inclusive of $1,697,993 of straight line rent steps for investment grade tenants. |
THE INFORMATION IN THIS STRUCTURAL AND COLLATERAL TERM SHEET IS NOT COMPLETE AND MAY BE AMENDED PRIOR TO THE TIME OF SALE. THIS TERM SHEET IS NOT AN OFFER TO SELL THESE SECURITIES AND IT IS NOT A SOLICITATION OF AN OFFER TO BUY THESE SECURITIES IN ANY JURISDICTION WHERE THE OFFER OR SALE IS NOT PERMITTED. |
| | 60 | |
| Structural and Collateral Term Sheet | | BMO 2024-5C4 |
| No. 3 – 28-40 West 23rd Street |
The following table presents certain information relating to the underwritten cash flows of the 28-40 West 23rd Street Property:
| Operating History and Underwritten Net Cash Flow |
| | | 2021 | 2022 | 2023 | Underwritten | Per Square Foot | %(1) |
| In Place Rent(2) | | $38,720,183 | $39,188,548 | $42,377,811 | $32,464,248 | $56.16 | 60.1 | % |
| Contractual Rent Steps(2) | | 0 | 0 | 0 | 1,697,993 | 2.94 | 3.1 | |
| Potential Income from Vacant Space | | 0 | 0 | 0 | 13,547,475 | 23.43 | 25.1 | |
| Gross Potential Rent | | $38,720,183 | $39,188,548 | $42,377,811 | $47,709,716 | $82.53 | 88.3 | % |
| Total Reimbursements | | 7,206,856 | 7,759,949 | 8,050,131 | 6,309,666 | 10.91 | 11.7 | |
| Total Gross Income | | $45,927,039 | $46,948,497 | $50,427,942 | $54,019,382 | $93.44 | 100.0 | % |
| Other Income(3) | | 1,039,396 | 1,067,740 | 1,218,146 | 1,085,519 | 1.88 | 2.0 | |
| (Vacancy/Credit Loss) | | 0 | 0 | 0 | (13,547,475) | (23.43) | (25.1 | ) |
| Effective Gross Income | | $46,966,435 | $48,016,236 | $51,646,088 | $41,557,426 | $71.89 | 76.9 | % |
| Management Fee | | 1,935,310 | 1,910,130 | 2,035,502 | 1,000,000 | 1.73 | 2.4 | |
| Real Estate Taxes | | 9,886,525 | 10,764,763 | 11,440,323 | 12,039,136 | 20.83 | 29.0 | |
| Insurance | | 294,213 | 275,035 | 301,302 | 273,440 | 0.47 | 0.7 | |
| Other Expenses(4) | | 3,811,832 | 4,358,036 | 4,351,523 | 4,351,523 | 7.53 | 10.5 | |
| Total Expenses | | $15,927,879 | $17,307,963 | $18,128,650 | $17,664,098 | $30.56 | 42.5 | % |
| Net Operating Income | | $31,038,555 | $30,708,273 | $33,517,438 | $23,893,328 | $41.33 | 57.5 | % |
| Capital Expenditures | | 0 | 0 | 0 | 115,621 | 0.20 | 0.3 | |
| TI/LC | | 0 | 0 | 0 | 1,022,942 | 1.77 | 2.5 | |
| Net Cash Flow | | $31,038,555 | $30,708,273 | $33,517,438 | $22,754,765 | $39.36 | 54.8 | % |
| (1) | Revenue-related figures are calculated as a percentage of Total Gross Income. All non-revenue related figures are calculated as a percentage of Effective Gross Income. |
| (2) | Underwritten In Place Rent is based on the underwritten rent roll dated April 1, 2024. Contractual Rent Steps are inclusive of $1,697,993 of straight line rent steps for investment grade tenants. |
| (3) | Underwritten Other Income includes condenser water, overtime HVAC, water and sewer, and additional miscellaneous income. |
| (4) | Other Expenses include payroll and benefits, repairs and maintenance, utilities and general and administrative expenses. |
The Market. The 28-40 West 23rd Street Property is located in between Fifth and Sixth Avenue in the Flatiron District of New York, New York and is a part of the Flatiron/Union Square office submarket and the Flatiron retail submarket of Manhattan. The 28-40 West 23rd Street Property is located in close proximity to Madison Square Park and is accessible via the 1, 2, 3, N, R, 4, 5, and 6 trains.
According to the appraisal, as of December 31, 2023, the Flatiron/Union Square office submarket had a total inventory of approximately 24.7 million square feet, an overall vacancy rate of 23.8% and an overall asking rent of $83.91 per square foot. Furthermore, as of December 31, 2023 the Flatiron retail submarket had an overall vacancy rate of 15.7% and average asking rent of $221 per square foot.
THE INFORMATION IN THIS STRUCTURAL AND COLLATERAL TERM SHEET IS NOT COMPLETE AND MAY BE AMENDED PRIOR TO THE TIME OF SALE. THIS TERM SHEET IS NOT AN OFFER TO SELL THESE SECURITIES AND IT IS NOT A SOLICITATION OF AN OFFER TO BUY THESE SECURITIES IN ANY JURISDICTION WHERE THE OFFER OR SALE IS NOT PERMITTED. |
| | 61 | |
| Structural and Collateral Term Sheet | | BMO 2024-5C4 |
| No. 3 – 28-40 West 23rd Street |
The following table presents information relating to comparable office leases for the 28-40 West 23rd Street Property:
| Comparable Office Rental Summary(1) |
| Property Name | Tenant | Suite Size (SF) | Lease Commencement | Lease Term (Mos) | Rent (PSF) |
| 28-40 West 23rd Street | Various | Various | Various | Various | $81.33(2) |
Confidential Park Avenue South | Confidential | 25,000 SF | April 2024 | 120 mos. | $100.00 |
| 295 Fifth Avenue | Quinn Emanuel | 131,661 SF | March 2024 | 199 mos. | $83.50 |
| 888 Broadway | Connaught | 5,339 SF | December 2023 | 93 mos. | $91.00 |
| 817 Broadway | Inspired Capital | 9,943 SF | December 2023 | 121 mos. | $99.00 |
| 200 Fifth Avenue | Doordash | 115,382 SF | December 2023 | 120 mos. | $101.00 |
| (2) | Based on the underwritten rent roll dated April 1, 2024. Rent (PSF) does not include rent steps. |
The following table presents information relating to comparable retail leases for the 28-40 West 23rd Street Property:
| Comparable Retail Rental Summary(1) |
| Property Name | Tenant | Suite Size (SF) | Lease Commencement | Lease Term (Yrs) | Rent (PSF) |
| 28-40 West 23rd Street | Home Depot | 118,500 SF | November 2020 | 183 mos. | $63.59(2) |
| 7 West 21st Street | Bathhouse | 34,328 SF | March 2021 | 180 mos. | $58.26 |
| 881 Broadway | Crate & Barrel | 35,000 SF | January 2023 | 120 mos. | $94.29 |
| 44 Union Square East | Petco | 29,989 SF | January 2022 | 120 mos. | $105.04 |
| 620 Avenues of the Americas | Bed Bath & Beyond | 92,025 SF | February 2021 | 120 mos. | $92.37 |
| 401 East 60th Street | Home Depot | 119,882 SF | January 2021 | 241 mos. | $94.26 |
| (2) | Based on the underwritten rent roll dated April 1, 2024. Rent (PSF) does not include rent steps. |
The Borrower. The borrower is 23rd Street Properties LLC, a Delaware limited liability company with one independent director. Legal counsel to the borrower delivered a non-consolidation opinion in connection with the origination of the 28-40 West 23rd Street Whole Loan.
The Borrower Sponsors. The borrower sponsors are Robert B. Getreu, Michael T. Cohen and Andrew H. Roos of Williams Equities. Founded in 1926, Williams Equities is a fourth generation real estate investment company that owns a portfolio of twelve New York City office buildings. The related 28-40 West 23rd Street Whole Loan documents do not provide for a separate carveout guarantor or environmental indemnitor that is distinct from the borrower.
Property Management. The 28-40 West 23rd Street Property is managed by Colliers International NY LLC, an affiliate of the borrower sponsors.
Escrows and Reserves. At origination of the 28-40 West 23rd Street Whole Loan, the borrower deposited approximately: (i) $4,088,374 into a tax reserve (ii) $4,098,393 into an unfunded obligations reserve, and (iii) $23,149,913 into a future capital expenditures reserve.
Tax Reserve – The borrower is required to deposit into a real estate tax reserve, on a monthly basis, 1/12th of the taxes that the lender estimates will be payable over the next-ensuing 12-month period (initially estimated to be approximately $1,022,093). Notwithstanding the foregoing, the borrower may pay (or cause to be paid) the initial tax deposit by April 30, 2024 in such amount as may be required by the lender.
THE INFORMATION IN THIS STRUCTURAL AND COLLATERAL TERM SHEET IS NOT COMPLETE AND MAY BE AMENDED PRIOR TO THE TIME OF SALE. THIS TERM SHEET IS NOT AN OFFER TO SELL THESE SECURITIES AND IT IS NOT A SOLICITATION OF AN OFFER TO BUY THESE SECURITIES IN ANY JURISDICTION WHERE THE OFFER OR SALE IS NOT PERMITTED. |
| | 62 | |
| Structural and Collateral Term Sheet | | BMO 2024-5C4 |
| No. 3 – 28-40 West 23rd Street |
Insurance Reserve – The borrower is required to deposit into an insurance reserve, on a monthly basis, 1/12th of the amount which will be sufficient to pay the insurance premiums due for the renewal of coverage afforded by such policies; provided, however, such insurance reserve has been conditionally waived so long as the borrower maintains a blanket policy meeting the requirements of the 28-40 West 23rd Street Whole Loan documents.
Replacement Reserve – The borrower is required to deposit into a replacement reserve, on a monthly basis, approximately $9,635, subject to a cap of $346,863.
Lockbox / Cash Management. The 28-40 West 23rd Street Whole Loan is structured with a springing lockbox and springing cash management. Upon the first occurrence of a Trigger Period (as defined below), the lender is permitted to deliver on the borrower’s behalf direction letters to all tenants at the 28-40 West 23rd Street Property directing them to pay to a lender-controlled lockbox account all rent and other sums which would otherwise be paid to the borrower. After the first occurrence of a Trigger Period, the borrower is required to cause revenue received by the borrower or the property manager to be deposited into such lender-controlled lockbox account. All funds deposited into the lockbox are required to be transferred on each business day to or at the direction of the borrower unless a Trigger Period exists and the lender elects (in its sole and absolute discretion) to deliver a restricted account notice. Upon the occurrence and during the continuance of a Trigger Period, all funds in the lockbox account are required to be swept on each business day to a cash management account under the control of the lender to be applied and disbursed in accordance with the 28-40 West 23rd Street Whole Loan documents; and all excess cash flow funds remaining in the cash management account after the application of such funds in accordance with the 28-40 West 23rd Street Whole Loan documents are required to be held by the lender in an excess cash flow reserve account as additional collateral for the 28-40 West 23rd Street Whole Loan; provided, however, that if no event of default has occurred and is continuing, any excess cash flow funds collected during the continuance of a Specified Tenant Trigger Period (as defined below) will be disbursed to the borrower to cover approved Specified Tenant (as defined below) leasing costs. Upon the cure of the applicable Trigger Period, so long as no other Trigger Period exists, the lender is required to return any amounts remaining on deposit in the excess cash flow reserve account to the borrower; provided, however, any excess cash flow funds required to satisfy the Specified Tenant Excess Cash Flow Condition (as defined below) or to satisfy the ST Cap Condition (as defined below) will be retained by the lender in the excess cash flow account until certain stabilization conditions are satisfied. Upon an event of default under the 28-40 West 23rd Street Whole Loan documents, the lender may apply funds to the debt in such priority as it may determine.
A “Trigger Period” means a period (A) commencing upon the earliest of (i) the occurrence and continuance of an event of default, (ii) the debt yield falling below 8.0%, and (iii) the occurrence of a Specified Tenant Trigger Period; and (B) expiring upon (x) with regard to any Trigger Period commenced in connection with clause (i) above, the cure (if applicable) of such event of default, (y) with regard to any Trigger Period commenced in connection with clause (ii) above, the date that the debt yield is equal to or greater than 8.0% for one calendar quarter, and (z) with regard to any Trigger Period commenced in connection with clause (iii) above, a Specified Tenant Trigger Period ceasing to exist.
A “Specified Tenant” means, as applicable, (i) Estee Lauder, together with its successors and/or assigns, (ii) any other tenant whose lease, individually or when aggregated with all other leases at the 28-40 West 23rd Street Property with the same tenant or its affiliates, either accounts for 33% or more of (A) the total rental income for the 28-40 West 23rd Street Property or (B) the square footage of the 28-40 West 23rd Street Property and (iii) any guarantors, if any, of the applicable related Specified Tenant leases. As of the date of origination of the 28-40 West 23rd Street Whole Loan, Home Depot was not a Specified Tenant.
A “Specified Tenant Trigger Period” means a period (A) commencing upon the first to occur of (i) Specified Tenant being in monetary or material non-monetary default under the applicable Specified Tenant lease beyond applicable notice and cure periods, (ii) Specified Tenant failing to be in actual, physical possession of the Specified Tenant space (or applicable portion thereof), (iii) Specified Tenant failing to be open for business during customary hours and/or “going dark” in 30% or more of the Specified Tenant Space (or applicable portion thereof), (iv) Specified Tenant giving notice that it is terminating its lease for all or any portion of the Specified Tenant space (or applicable portion thereof), (v) any termination or cancellation of any Specified Tenant lease (including, without limitation, rejection in any bankruptcy or similar insolvency proceeding) and/or any Specified Tenant lease failing to otherwise be in full force and effect, (vi) any bankruptcy or similar insolvency of Specified Tenant, and (vii) Specified Tenant failing to extend or renew the applicable Specified Tenant lease as required under the terms of the 28-40 West 23rd Street Whole Loan documents and (B) expiring upon the first to occur of the lender’s receipt of evidence reasonably acceptable to the lender of (1) the satisfaction of the applicable Specified Tenant Cure Conditions (as defined below); (2) the borrower leasing (A) the entire Specified Tenant space (or applicable portion thereof)
THE INFORMATION IN THIS STRUCTURAL AND COLLATERAL TERM SHEET IS NOT COMPLETE AND MAY BE AMENDED PRIOR TO THE TIME OF SALE. THIS TERM SHEET IS NOT AN OFFER TO SELL THESE SECURITIES AND IT IS NOT A SOLICITATION OF AN OFFER TO BUY THESE SECURITIES IN ANY JURISDICTION WHERE THE OFFER OR SALE IS NOT PERMITTED. |
| | 63 | |
| Structural and Collateral Term Sheet | | BMO 2024-5C4 |
| No. 3 – 28-40 West 23rd Street |
pursuant to one or more leases in accordance with the applicable terms and conditions of the 28-40 West 23rd Street Whole Loan documents, the applicable tenant(s) under such lease(s) being in actual, physical occupancy of the space demised, and, in the lender’s judgment, the applicable Specified Tenant Excess Cash Flow Condition is satisfied in connection therewith, or (B) a portion of the applicable Specified Tenant space pursuant to one or more leases in accordance with the applicable terms and conditions of the 28-40 West 23rd Street Whole Loan documents the applicable tenant(s) under such lease(s) being in actual, physical occupancy of the space demised, each such lease has commenced, a rent commencement date has been established under each such lease for a minimum lease term of 5 years, the gross rent payable under each such lease(s) is equal to or greater than the gross rent for the entirety of the applicable Specified Tenant space as of the date of origination of the 28-40 West 23rd Street Whole Loan, and in the lender’s reasonable judgment, the applicable Specified Tenant Excess Cash Flow Condition is satisfied; or (3) solely with respect to a Specified Tenant Trigger Period contemplated in clause (A)(vii) of the definition of “Specified Tenant Trigger Period”, the date upon which both of the following has occurred: (I) the debt yield is equal to or greater than 12% exclusive of any rental income of the applicable Specified Tenant and (II) the ST Cap Condition is satisfied with respect to the applicable Specified Tenant space by (x) the amount of funds on deposit in excess cash flow account collected during the continuance of such Specified Tenant Trigger Period satisfying the ST Cap Condition and/or (y) the borrower depositing cash into the excess cash flow account and/or posting a letter of credit with the lender for such purpose, in each case, in an amount to satisfy the ST Cap Condition.
“Specified Tenant Cure Conditions” means each of the following, as applicable, (i) the Specified Tenant has cured all defaults under the applicable Specified Tenant lease, (ii) the applicable Specified Tenant is in actual, physical possession of the Specified Tenant space (or applicable portion thereof) and open for business during customary hours and not “dark” in the Specified Tenant space (or applicable portion thereof), (iii) the applicable Specified Tenant has revoked or rescinded all termination or cancellation notices with respect to the applicable Specified Tenant lease and has re-affirmed the applicable Specified Tenant lease as being in full force and effect, (iv) the applicable Specified Tenant has renewed or extended the applicable Specified Tenant lease in accordance with the terms of the 28-40 West 23rd Street Whole Loan documents and, in Lender’s reasonable judgment, the applicable Specified Tenant Excess Cash Flow Condition is satisfied in connection therewith, (v) if applicable, the Specified Tenant is no longer insolvent or subject to any bankruptcy or insolvency proceedings and has affirmed the applicable Specified Tenant lease pursuant to final, non-appealable order of a court of competent jurisdiction, and (vi) the applicable Specified Tenant is paying full, unabated rent under the applicable Specified Tenant lease unless: (x) such non-payment of rent is solely the result of an abatement thereunder and (y) the borrower has reserved an amount equal to the total unabated rent that would otherwise be due and payable.
“Specified Tenant Excess Cash Flow Condition” means, with respect to curing any Specified Tenant Trigger Period by re-tenanting the applicable Specified Tenant space or renewal/extension of any Specified Tenant lease, sufficient funds have been accumulated in the excess cash flow account and the leasing reserve account (during the continuance of the subject Specified Tenant Trigger Period) to cover all anticipated leasing commissions, tenant improvement costs, tenant allowances, free rent periods, and/or rent abatement periods to be incurred in connection with any such re-tenanting or renewal/extension.
“ST Cap Condition” means that the amount on deposit in the excess cash flow account is equal to or greater than (x) $100, multiplied by (y) the number of leasable square feet demised pursuant to the applicable Specified Tenant lease with respect to which the applicable Specified Tenant Trigger Period has occurred.
Subordinate and Mezzanine Debt. None.
Permitted Future Debt. Not Permitted.
Partial Release. Not Permitted.
Ground Lease. None.
THE INFORMATION IN THIS STRUCTURAL AND COLLATERAL TERM SHEET IS NOT COMPLETE AND MAY BE AMENDED PRIOR TO THE TIME OF SALE. THIS TERM SHEET IS NOT AN OFFER TO SELL THESE SECURITIES AND IT IS NOT A SOLICITATION OF AN OFFER TO BUY THESE SECURITIES IN ANY JURISDICTION WHERE THE OFFER OR SALE IS NOT PERMITTED. |
| | 64 | |
| Structural and Collateral Term Sheet | | BMO 2024-5C4 |
| No. 4 – Galleria at Sunset |
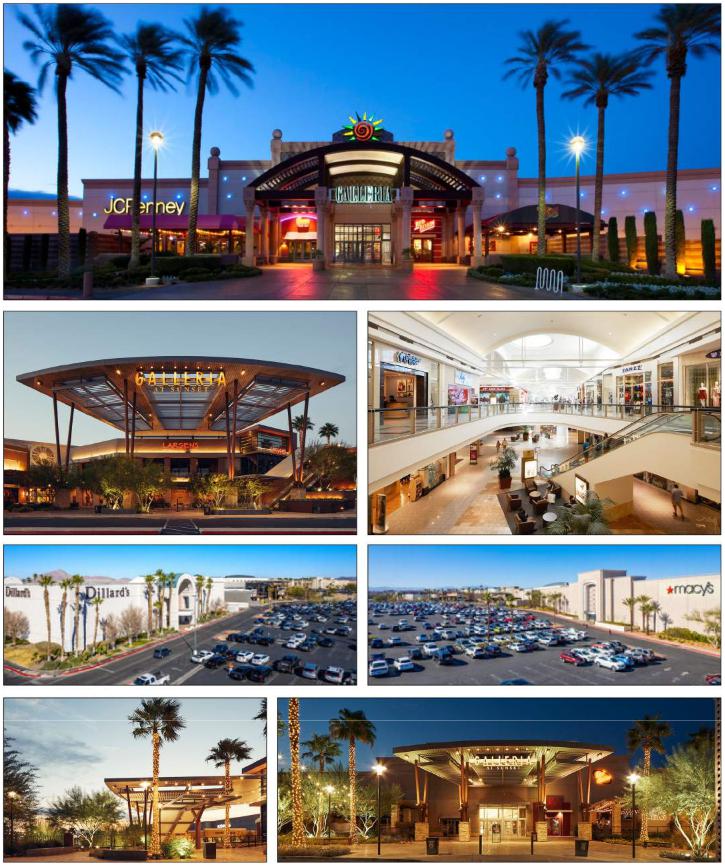
THE INFORMATION IN THIS STRUCTURAL AND COLLATERAL TERM SHEET IS NOT COMPLETE AND MAY BE AMENDED PRIOR TO THE TIME OF SALE. THIS TERM SHEET IS NOT AN OFFER TO SELL THESE SECURITIES AND IT IS NOT A SOLICITATION OF AN OFFER TO BUY THESE SECURITIES IN ANY JURISDICTION WHERE THE OFFER OR SALE IS NOT PERMITTED. |
| | 65 | |
| Structural and Collateral Term Sheet | | BMO 2024-5C4 |
| No. 4 – Galleria at Sunset |
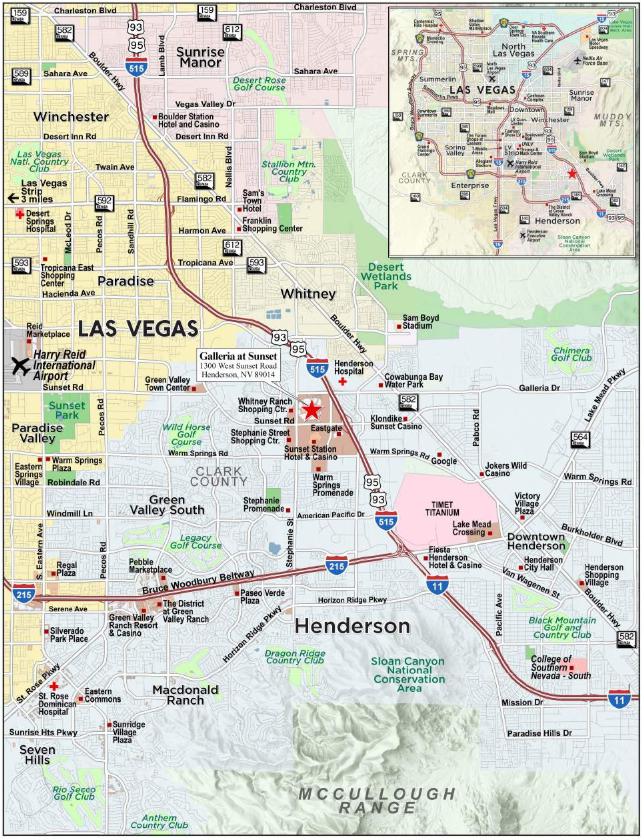
THE INFORMATION IN THIS STRUCTURAL AND COLLATERAL TERM SHEET IS NOT COMPLETE AND MAY BE AMENDED PRIOR TO THE TIME OF SALE. THIS TERM SHEET IS NOT AN OFFER TO SELL THESE SECURITIES AND IT IS NOT A SOLICITATION OF AN OFFER TO BUY THESE SECURITIES IN ANY JURISDICTION WHERE THE OFFER OR SALE IS NOT PERMITTED. |
| | 66 | |
| Structural and Collateral Term Sheet | | BMO 2024-5C4 |
| No. 4 – Galleria at Sunset |
| Mortgage Loan Information | | Property Information |
| Mortgage Loan Seller: | AREF2, WFB | | Single Asset / Portfolio: | Single Asset |
| Original Principal Balance: | $49,000,000 | | Title: | Fee |
| Cut-off Date Principal Balance: | $48,915,677 | | Property Type – Subtype: | Retail – Super Regional Mall |
| % of IPB: | 5.7% | | Net Rentable Area (SF): | 441,712 |
| Loan Purpose: | Acquisition | | Location: | Henderson, NV |
| Borrower: | Mershops Galleria at Sunset LLC | | Year Built / Renovated: | 1996 / 2014 |
| Borrower Sponsor: | George Mersho | | Occupancy: | 83.2% |
| Interest Rate: | 8.46000% | | Occupancy Date: | 1/1/2024 |
| Note Date: | 2/28/2024 | | 4th Most Recent NOI (As of): | $10,360,260 (12/31/2020) |
| Maturity Date: | 3/6/2029 | | 3rd Most Recent NOI (As of): | $9,272,871 (12/31/2021) |
| Interest-only Period: | None | | 2nd Most Recent NOI (As of): | $13,011,815 (12/31/2022) |
| Original Term: | 60 months | | Most Recent NOI (As of): | $13,389,658 (TTM 11/30/2023) |
| Original Amortization Term: | 300 months | | UW Economic Occupancy: | 77.1% |
| Amortization Type: | Amortizing Balloon | | UW Revenues: | $18,385,416 |
| Call Protection: | L(26),D(27),O(7) | | UW Expenses: | $5,231,739 |
| Lockbox / Cash Management: | Hard / Springing | | UW NOI: | $13,153,676 |
| Additional Debt: | No | | UW NCF: | $11,647,404 |
| Additional Debt Balance: | NAP | | Appraised Value / Per SF: | $95,000,000 / $215 |
| Additional Debt Type: | NAP | | Appraisal Date: | 11/28/2023 |
| | | | | |
| Escrows and Reserves(1) | | Financial Information |
| | Initial | Monthly | Initial Cap | | Cut-off Date Loan / SF: | $111 |
| Taxes: | $170,055 | $85,027 | N/A | | Maturity Date Loan / SF: | $104 |
| Insurance: | $90,552 | $18,110 | N/A | | Cut-off Date LTV: | 51.5% |
| Immediate Repairs: | $562,235 | $0 | N/A | | Maturity Date LTV: | 48.2% |
| Replacement Reserves: | $400,000 | $26,761 | N/A | | UW NCF DSCR: | 2.47x |
| TI/LC: | $1,200,000 | $110,428 | N/A | | UW NOI Debt Yield: | 26.9% |
| Other Reserves(2): | $959,466 | $0 | N/A | | | |
| | | | | | | |
| Sources and Uses |
| Sources | Proceeds | % of Total | | Uses | Proceeds | % of Total | |
| Loan Amount | $49,000,000 | 51.2 | % | | Purchase Price | $91,200,000 | 95.3 | % |
| Equity Contribution | 46,701,523 | 48.8 | | | Upfront Reserves | 3,382,308 | 3.5 | |
| | | | | Closing Costs | 1,119,215 | 1.2 | |
| Total Sources | $95,701,523 | 100.0 | % | | Total Uses | $95,701,523 | 100.0 | % |
| (1) | For a full description of Escrows and Reserves, please refer to “Escrows and Reserves” below. |
| (2) | Other Reserves consist of an Outstanding TI/LC Reserve ($846,191) and a Gap Rent Reserve ($113,275). |
The Loan. The fourth largest mortgage loan (the “Galleria at Sunset Mortgage Loan”) is secured by a first mortgage lien on the borrowers’ fee simple interest in a super regional mall property located in Henderson, Nevada (the “Galleria at Sunset Property”). The Galleria at Sunset Mortgage Loan was originated on February 28, 2024 by Argentic Real Estate Finance 2 LLC and Wells Fargo Bank, National Association and accrues interest at an interest rate of 8.46000% per annum on an Actual/360 basis. The Galleria at Sunset Mortgage Loan has an original term of 60 months, has a remaining term of 58 months and amortizes on a 25-year schedule. The scheduled maturity date of the Galleria at Sunset Mortgage Loan is March 6, 2029.
The Property. The Galleria at Sunset Property is comprised of a 441,712 square feet portion of an enclosed two-story super regional mall known as Galleria at Sunset located in Henderson, Nevada. Situated on a 53.8-acre site, the Galleria at Sunset Property was built in 1996 and has been renovated throughout the years, including an approximately $7 million modernization of the flooring, paint, and signage in 2014. The Galleria at Sunset Property is anchored by Macy’s, Dillard’s, Kohl’s and JCPenney. Only JCPenney, which is on a ground lease through 2046, is part of the owned collateral for the Galleria at Sunset Mortgage Loan, as the Macy’s, Dillard’s and Kohl’s parcels are all separately owned. The three separately
THE INFORMATION IN THIS STRUCTURAL AND COLLATERAL TERM SHEET IS NOT COMPLETE AND MAY BE AMENDED PRIOR TO THE TIME OF SALE. THIS TERM SHEET IS NOT AN OFFER TO SELL THESE SECURITIES AND IT IS NOT A SOLICITATION OF AN OFFER TO BUY THESE SECURITIES IN ANY JURISDICTION WHERE THE OFFER OR SALE IS NOT PERMITTED. |
| | 67 | |
| Structural and Collateral Term Sheet | | BMO 2024-5C4 |
| No. 4 – Galleria at Sunset |
owned anchor tenant spaces are part of the larger overall mall which also includes 19 outparcels that are non-collateral. The Galleria at Sunset Property includes over 100 in-line and food court tenants. The Galleria at Sunset Property also has access to parking via 3,921 surface parking spaces, resulting in a parking ratio of approximately 8.9 spaces per 1,000 square feet of net rentable area.
As of January 1, 2024, the Galleria at Sunset Property was 83.2% occupied by 90 tenants. The largest tenant, Dick’s Sporting Goods, makes up 18.4% of the net rentable area and 10.1% of underwritten base rent. The remaining rent roll is granular, with no tenant comprising greater than 4.3% of the net rentable area and 4.2% of underwritten base rent. Historical occupancy has been strong, with occupancy averaging 90.4% from 2019 through 2022. Occupancy decreased to current levels as the acquisition of the Galleria at Sunset Property was finalizing, but since acquiring the asset in December 2023, the borrower sponsor has executed lease renewals with Express, Kids Foot Locker, and American Eagle. Additionally, the borrower sponsor completed tours with prospective tenants of 28,000 square feet and has had preliminary conversations with several additional prospective tenants. Sales for major tenants are shown in the chart below. Based on the appraisal, the weighted average occupancy cost for the in-line space (tenants less than 10,000 square feet) was 13.7% which was concluded to be in-line with the Galleria at Sunset Property’s peer group.
Major Tenants. The three largest tenants at the Galleria at Sunset Property are Dick’s Sporting Goods, H&M, and Victoria’s Secret.
Dick’s Sporting Goods (81,312 square feet; 18.4% of NRA, 10.1% of underwritten base rent, Moody’s/S&P/Fitch: Baa3/BBB/NR): Dick’s Sporting Goods (NYSE: DKS) is a chain of sporting goods stores founded in 1948. The company is based in Coraopolis, Pennsylvania and has approximately 787 stores across the United States and has 50,100 employees. Dick’s Sporting Goods has been a tenant at the Galleria at Sunset Property since October 2002 when it signed a 15-year lease. The tenant exercised a renewal option at the end of its initial lease term and most recently signed a renewal in May 2022 to extend its lease term through January 2028. The tenant reported sales of $14,322,628 ($176 per square foot) for the trailing twelve months ending January 31, 2024. Dick’s Sporting Goods has two, five-year renewal options remaining.
H&M (19,213 square feet; 4.3% of NRA, 3.9% of underwritten base rent, Moody’s/S&P/Fitch: NR/BBB/NR): H&M is a multinational clothing company based in Sweden. The company was founded in 1947 and is the second largest international clothing retailer in the world. H&M operates in 77 geographical markets with 4,338 stores and 143,000 employees. H&M has been a tenant at the Galleria at Sunset Property since September 2013 when it signed a 10-year lease. The tenant exercised its first renewal option that commenced on February 1, 2024 and extended its lease expiration date to January 2029. H&M has one, five-year renewal option remaining.
Victoria’s Secret (11,712 square feet; 2.7% of NRA, 4.2% of underwritten base rent, Moody’s/S&P/Fitch: Ba3/BB-/NR): Victoria’s Secret (NYSE: VSCO) is an American lingerie, clothing, and beauty retailer. The company was founded in 1977 and is headquartered in Reynoldsburg, Ohio. Victoria’s Secret operates approximately 1,360 stores in 70 countries and employs approximately 30,000 people. Victoria’s Secret has been a tenant at the Galleria at Sunset Property since February 2006 when it signed a 10-year lease for 8,179 square feet. In March 2014, the tenant signed a new 10-year lease for 11,712 square feet expiring in January 2025. Victoria’s Secret does not have any renewal options remaining.
The following tables present certain information relating to the sales of the tenants at the Galleria at Sunset Property:
| Major Tenant Sales |
| Tenant Name | Owned / Non-Owned | Size | Lease Expiration | Reported Sales | Sales / SF | National Average(1) | National Average / SF |
| Macy's | Non-owned | 220,000 | 2/28/2046 | $26,000,000(2) | $118 | $23,200,000 | $170 |
| Dillard's | Non-owned | 208,186 | 2/28/2046 | $22,000,000(2) | $106 | $19,300,000 | $115 |
| JCPenney | Owned Ground Lease | 125,264 | 2/28/2046 | $14,000,000(2) | $112 | $10,000,000 | $95 |
| Kohl's w/ Sephora | Non-owned | 83,232 | 2/28/2046 | NAV | NAV | $11,500,000 | $135 |
| Dick's Sporting Goods | Owned | 81,312 | 1/31/2028 | $14,322,628(3) | $176 | $13,900,000 | $280 |
| H&M | Owned | 19,213 | 1/31/2029 | $5,325,034(3) | $277 | NAV | NAV |
| Victoria's Secret | Owned | 11,712 | 1/31/2025 | $6,949,153(3) | $593 | $4,200,000 | $480 |
| | (1) | Information obtained from a third-party report. |
| | (2) | Information provided by the seller of the Galleria at Sunset Property as of July 2023. |
| (3) | Information obtained from the borrower sponsor. Reported sales are as of the trailing twelve months ending January 31, 2024 for Dick’s Sporting Goods and the trailing twelve months ending October 31, 2023 for H&M, Victoria’s Secret, and Forever 21. |
THE INFORMATION IN THIS STRUCTURAL AND COLLATERAL TERM SHEET IS NOT COMPLETE AND MAY BE AMENDED PRIOR TO THE TIME OF SALE. THIS TERM SHEET IS NOT AN OFFER TO SELL THESE SECURITIES AND IT IS NOT A SOLICITATION OF AN OFFER TO BUY THESE SECURITIES IN ANY JURISDICTION WHERE THE OFFER OR SALE IS NOT PERMITTED. |
| | 68 | |
| Structural and Collateral Term Sheet | | BMO 2024-5C4 |
| No. 4 – Galleria at Sunset |
| Sales History(1) |
| Tenancy Type | 2019 | 2020 | 2021 | 2022 | TTM October 2023 |
| Total In-Line Tenants < 10,000 SF | | | | | |
| Total Sales(2) | $97,902,807 | $70,305,392 | $104,689,135 | $101,492,646 | $94,584,627 |
| Total SF Reporting | 238,943 | 208,480 | 202,650 | 217,579 | 219,961 |
| Sales Per SF(2) | $410 | $337 | $517 | $466 | $430 |
| Total In-Line Tenants(3) | | | | | |
| Total Sales(2) | $106,139,800 | $75,667,479 | $113,116,553 | $109,685,226 | $101,635,519 |
| Total SF Reporting | 250,655 | 220,192 | 214,362 | 239,588 | 231,673 |
| Sales Per SF(2) | $423 | $344 | $528 | $458 | $439 |
| (2) | Sales figures only include sales and square footage from tenants who were in place for the full year for the respective time periods shown. |
| (3) | Excludes sales for Dick’s Sporting Goods and JCPenney. |
Appraisal. According to the appraisal, the Galleria at Sunset Property had an “as-is” appraised value of $95,000,000 as of November 28, 2023, as shown in the table below. Based on the “as-is” value of $95,000,000, the Cut-off Date LTV and Maturity Date LTV for the Galleria at Sunset Mortgage Loan are 51.5% and 48.2%, respectively.
| Galleria at Sunset Appraised Value(1) |
| Property | Value | Capitalization Rate |
| Galleria at Sunset | $95,000,000 | 13.00% |
Environmental. According to the Phase I environmental assessment dated January 24, 2024, there was no evidence of any recognized environmental conditions at the Galleria at Sunset Property.
The following table presents certain information relating to the historical occupancy of the Galleria at Sunset Property:
| Historical and Current Occupancy |
| 2021(1) | 2022(1) | 11/30/2023 | Current(2) |
| 89.9% | 90.1% | 85.2% | 83.2% |
| (1) | Historical Occupancies are as of December 31 of each respective year. |
| (2) | Current Occupancy is as of January 1, 2024. |
THE INFORMATION IN THIS STRUCTURAL AND COLLATERAL TERM SHEET IS NOT COMPLETE AND MAY BE AMENDED PRIOR TO THE TIME OF SALE. THIS TERM SHEET IS NOT AN OFFER TO SELL THESE SECURITIES AND IT IS NOT A SOLICITATION OF AN OFFER TO BUY THESE SECURITIES IN ANY JURISDICTION WHERE THE OFFER OR SALE IS NOT PERMITTED. |
| | 69 | |
| Structural and Collateral Term Sheet | | BMO 2024-5C4 |
| No. 4 – Galleria at Sunset |
The following table presents certain information relating to the largest tenants at the Galleria at Sunset Property:
| Top 10 Tenant Summary(1)(2) |
| Tenant | Ratings
Moody’s/S&P/Fitch(3) | Net Rentable Area (SF) | % of
Total NRA | UW Base Rent PSF(4) | UW Base Rent(4) | % of Total
UW Base Rent(4) | Lease
Exp. Date |
| Dick's Sporting Goods | Baa3/BBB/NR | 81,312 | 18.4 | % | $15.25 | | $1,240,000 | 10.1 | % | 1/31/2028 | |
| H&M | NR/BBB/NR | 19,213 | 4.3 | | $25.12 | | 482,555 | 3.9 | | 1/31/2029 | |
| Victoria's Secret | Ba3/BB-/NR | 11,712 | 2.7 | | $44.00 | | 515,328 | 4.2 | | 1/31/2025 | |
| Jellyland | NR/NR/NR | 10,297 | 2.3 | | $15.71 | | 161,750 | 1.3 | | 9/30/2029 | |
| Forever 21(5) | NR/NR/NR | 9,900 | 2.2 | | $0.00 | | 0 | 0.0 | | 1/31/2027 | |
| Express | NR/NR/NR | 8,568 | 1.9 | | $10.27 | | 88,000 | 0.7 | | 1/31/2026 | |
| Charlotte Russe | NR/NR/NR | 8,262 | 1.9 | | $29.05 | | 240,000 | 2.0 | | 1/31/2026 | |
| Rise & Flow | NR/NR/NR | 7,507 | 1.7 | | $9.60 | | 72,074 | 0.6 | | 10/31/2025 | |
| Hayashi Sushi & Japanese | NR/NR/NR | 7,075 | 1.6 | | $31.85 | | 225,371 | 1.8 | | 5/31/2033 | |
| Rhapsodielle | NR/NR/NR | 7,052 | 1.6 | | $12.70 | | 89,579 | 0.7 | | 10/31/2026 | |
| Major Tenants | | 170,898 | 38.7 | % | $18.23 | | $3,114,657 | 25.5 | % | |
| Other Tenants | | 196,519 | 44.5 | % | $46.41 | | $9,120,695 | 74.5 | % | |
| Occupied Collateral Total / Wtd. Avg. | | 367,417 | 83.2 | % | $33.30 | | $12,235,353 | 100.0 | % | |
| | | | | | | | |
| Vacant Space | | 74,295 | 16.8 | % | | | | |
| | | | | | | | |
| Collateral Total | | 441,712 | 100.0 | % | | | | |
| | | | | | | | |
| (1) | Based on the underwritten rent roll dated January 1, 2024. |
| (2) | The Galleria at Sunset Property is anchored by five tenants. Only one of the anchor tenants, Dick’s Sporting Goods, is part of the collateral for the Galleria at Sunset Mortgage Loan. JCPenney operates on a ground lease with the borrower as lessor, therefore the square footage occupied by the tenant is not included in the collateral square footage. |
| (3) | In certain instances, ratings provided are those of the parent company of the entity shown, whether or not the parent company guarantees the lease |
| (4) | UW Base Rent, % of Total UW Base Rent and UW Base Rent PSF include contractual rent steps through December 2024. |
| (5) | Forever 21 pays percentage rent only equal to 16.0% of sales. The underwritten percentage rent for Forever 21 is $218,553, which is based on sales for the trailing-twelve months ending October 31, 2023. |
THE INFORMATION IN THIS STRUCTURAL AND COLLATERAL TERM SHEET IS NOT COMPLETE AND MAY BE AMENDED PRIOR TO THE TIME OF SALE. THIS TERM SHEET IS NOT AN OFFER TO SELL THESE SECURITIES AND IT IS NOT A SOLICITATION OF AN OFFER TO BUY THESE SECURITIES IN ANY JURISDICTION WHERE THE OFFER OR SALE IS NOT PERMITTED. |
| | 70 | |
| Structural and Collateral Term Sheet | | BMO 2024-5C4 |
| No. 4 – Galleria at Sunset |
The following table presents certain information relating to the tenant lease expirations at the Galleria at Sunset Property:
| Lease Rollover Schedule(1)(2)(3) |
| Year | Number of Leases Expiring | Net Rentable Area Expiring | % of NRA Expiring | UW Base Rent Expiring(4) | % of UW Base Rent Expiring(4) | Cumulative Net Rentable Area Expiring | Cumulative % of NRA Expiring | Cumulative UW Base Rent Expiring(4) | Cumulative % of UW Base Rent Expiring(4) |
| Vacant | NAP | 74,295 | 16.8 | % | NAP | NAP | | 74,295 | | 16.8% | | NAP | NAP | |
| 2024 & MTM | 16 | 28,955 | 6.6 | | $1,370,879 | 11.2% | | 103,250 | | 23.4% | | $1,370,879 | 11.2% | |
| 2025 | 20 | 60,960 | 13.8 | | 2,713,426 | 22.2 | | 164,210 | | 37.2% | | $4,084,305 | 33.4% | |
| 2026 | 12 | 56,140 | 12.7 | | 1,527,714 | 12.5 | | 220,350 | | 49.9% | | $5,612,019 | 45.9% | |
| 2027 | 14 | 36,749 | 8.3 | | 1,677,469 | 13.7 | | 257,099 | | 58.2% | | $7,289,488 | 59.6% | |
| 2028 | 11 | 110,832 | 25.1 | | 2,629,196 | 21.5 | | 367,931 | | 83.3% | | $9,918,684 | 81.1% | |
| 2029 | 5 | 37,618 | 8.5 | | 1,093,803 | 8.9 | | 405,549 | | 91.8% | | $11,012,488 | 90.0% | |
| 2030 | 5 | 10,811 | 2.4 | | 477,000 | 3.9 | | 416,360 | | 94.3% | | $11,489,488 | 93.9% | |
| 2031 | 4 | 13,573 | 3.1 | | 373,670 | 3.1 | | 429,933 | | 97.3% | | $11,863,158 | 97.0% | |
| 2032 | 1 | 3,802 | 0.9 | | 0 | 0.0 | | 433,735 | | 98.2% | | $11,863,158 | 97.0% | |
| 2033 | 2 | 7,977 | 1.8 | | 372,195 | 3.0 | | 441,712 | | 100.0% | | $12,235,353 | 100.0% | |
| 2034 | 0 | 0 | 0.0 | | 0 | 0.0 | | 441,712 | | 100.0% | | $12,235,353 | 100.0% | |
| 2035 & Beyond | 0 | 0 | 0.0 | | 0 | 0.0 | | 441,712 | | 100.0% | | $12,235,353 | 100.0% | |
| Total | 90 | 441,712 | 100.0 | % | $12,235,353 | 100.0 | % | | | | |
| (1) | Based on the underwritten rent roll dated January 1, 2024. |
| (2) | Certain leases may have termination options that are exercisable prior to the originally stated expiration date of the lease and that are not considered in this Lease Rollover Schedule. |
| (3) | The Galleria at Sunset Property is anchored by five tenants. Only one of the anchor tenants, Dick’s Sporting Goods, is part of the collateral for the Galleria at Sunset Mortgage Loan. JCPenney operates on a ground lease with the borrower as lessor, therefore the square footage occupied by the tenant is not included in the collateral square footage. |
| (4) | UW Base Rent Expiring, % of UW Base Rent Expiring, Cumulative UW Base Rent Expiring and Cumulative % of UW Base Rent Expiring include contractual rent steps through December 2024. |
The following table presents certain information relating to the operating history and underwritten cash flows of the Galleria at Sunset Property:
| Operating History and Underwritten Net Cash Flow |
| | 2020 | 2021 | 2022 | 11/30/2023 TTM(1) | Underwritten | Per Square Foot | %(1) |
| Rents in Place(2) | $10,755,473 | $10,519,907 | $10,958,224 | $12,132,734 | $12,235,353 | $27.70 | | 52.6 | % |
| Vacant Income | 0 | 0 | 0 | 0 | 4,856,840 | 11.00 | | 20.9 | |
| Gross Potential Rent | $10,755,473 | $10,519,907 | $10,958,224 | $12,132,734 | $17,092,193 | $38.70 | | 73.5 | % |
| Percentage Rent | 578,728 | 1,690,115 | 1,349,930 | 822,453 | 790,886 | 1.79 | | 3.4 | |
| Total Reimbursements | 4,330,506 | 3,787,006 | 3,583,566 | 3,655,057 | 3,349,283 | 7.58 | | 14.4 | |
| Other Income(3) | 1,341,576 | 1,735,769 | 1,959,422 | 2,009,893 | 2,009,893 | 4.55 | | 8.6 | |
| Net Rental Income | $17,006,282 | $17,732,797 | $17,851,143 | $18,620,138 | $23,242,256 | $52.62 | | 100.0 | % |
| (Vacancy/Credit Loss/Abatements) | (1,796,109) | (3,934,194) | 135,630 | (146,180) | (4,856,840) | (11.00) | | (20.9 | ) |
| Effective Gross Income | $15,210,173 | $13,798,603 | $17,986,772 | $18,473,957 | $18,385,416 | $41.62 | | 79.1 | % |
| Total Expenses | 4,849,913 | 4,525,732 | 4,974,957 | 5,084,300 | 5,231,739 | 11.84 | | 28.5 | |
| Net Operating Income | $10,360,260 | $9,272,871 | $13,011,815 | $13,389,658 | $13,153,676 | $29.78 | | 71.5 | % |
| Capital Expenditures(4) | 0 | 0 | 0 | 0 | 301,136 | 0.68 | | 1.6 | |
| TI/LC(5) | 0 | 0 | 0 | 0 | 1,205,136 | 2.73 | | 6.6 | |
| Net Cash Flow | $10,360,260 | $9,272,871 | $13,011,815 | $13,389,658 | $11,647,404 | $26.37 | | 63.4 | % |
| (1) | % column represents percent of Net Rental Income for all revenue lines and represents percent of Effective Gross Income for the remainder of fields. |
| (2) | Underwritten rents include contractual rent steps through December 2024. |
| (3) | Other Income includes storage rent, kiosk rent, antenna rent, vending income and other miscellaneous fees. |
| (4) | Underwritten Capital Expenditures is net of a 5% credit for the $400,000 upfront replacement reserve. |
| (5) | Underwritten TI/LC shown is net of a 10% credit for the $1,200,000 upfront TI/LC reserve. |
THE INFORMATION IN THIS STRUCTURAL AND COLLATERAL TERM SHEET IS NOT COMPLETE AND MAY BE AMENDED PRIOR TO THE TIME OF SALE. THIS TERM SHEET IS NOT AN OFFER TO SELL THESE SECURITIES AND IT IS NOT A SOLICITATION OF AN OFFER TO BUY THESE SECURITIES IN ANY JURISDICTION WHERE THE OFFER OR SALE IS NOT PERMITTED. |
| | 71 | |
| Structural and Collateral Term Sheet | | BMO 2024-5C4 |
| No. 4 – Galleria at Sunset |
The Market. The Galleria at Sunset Property is located in the main retail corridor of Henderson, Nevada, approximately 10 miles west of the Las Vegas Strip. Primary access is provided by Interstate 515, which is located adjacent to the larger retail center at which the Galleria at Sunset Property is located in. The immediate area surrounding the Galleria at Sunset Property consists of approximately 22 million square feet of retail, including names such as Costco, Home Depot, Target, Hobby Lobby, Best Buy, Walmart, Buffalo Wild Wings, and Sunset Station Hotel and Casino. According to a third-party report, the Las Vegas region is home to nine malls, with only four (including the Galleria at Sunset Property) being located off the Las Vegas Strip or not being connected to a casino. The Galleria at Sunset Property is the only regional mall in Henderson and the three other malls in the region that are not located on the Las Vegas Strip are not considered to compete with the Galleria at Sunset Property.
According to the appraisal, the 2023 population within a one-, three-, and five-mile radius of the Galleria at Sunset Property was 11,643, 140,171 and 326,535, respectively. Additionally, for the same radii, the median household income was $62,189, $62,597 and $64,210, respectively.
According to the appraisal, the Galleria at Sunset Property is located within the Las Vegas retail market and the Southeast Las Vegas retail submarket. As of the third quarter of 2023, the Las Vegas retail market contained approximately 122.0 million square feet of retail space inventory with a vacancy rate of 5.0% and an average asking rental rate of $22.52 per square foot. The Southeast Las Vegas retail submarket contained approximately 22.8 million square feet of retail space with a vacancy rate of 4.8% and an average asking rental rate of $21.74 per square foot as of the third quarter of 2023.
The following table presents certain information relating to the appraiser’s market rent conclusions at the Galleria at Sunset Property:
| Market Rent Summary(1) |
| Space Type | Market Rent (per
square foot) |
| 0 - 1,500 SF Space | $85.00 |
| 1,501 - 2,500 SF Space | $70.00 |
| 2,501 - 4,000 SF Space | $65.00 |
| 4,001 - 6,500 Space | $40.00 |
| 6,501 - 10,000 SF Space | $25.00 |
| >10,000 SF Space | $30.00 |
| Jr Anchor Space | $16.00 |
| Anchor Space | $4.00 |
| Jewelry Space | $150.00 |
| Restaurant Space | $45.00 |
| Snack Bar Space | $100.00 |
| Food Court Space | $155.00 |
| (1) | Information obtained from the appraisal. |
THE INFORMATION IN THIS STRUCTURAL AND COLLATERAL TERM SHEET IS NOT COMPLETE AND MAY BE AMENDED PRIOR TO THE TIME OF SALE. THIS TERM SHEET IS NOT AN OFFER TO SELL THESE SECURITIES AND IT IS NOT A SOLICITATION OF AN OFFER TO BUY THESE SECURITIES IN ANY JURISDICTION WHERE THE OFFER OR SALE IS NOT PERMITTED. |
| | 72 | |
| Structural and Collateral Term Sheet | | BMO 2024-5C4 |
| No. 4 – Galleria at Sunset |
The following table presents certain information relating to comparable retail centers for the Galleria at Sunset Property:
| Competitive Retail Center Summary(1) |
| Property Name/Location | Year Built | Total NRA (SF) | Total Occupancy | Distance to Subject | Anchor Tenants |
Galleria at Sunset 1300 West Sunset Road Henderson, NV | 1996 | 441,712(2) | 83.2%(2) | NAP | Macy’s Dillard’s Kohl’s JCPenney Dick’s Sporting Goods |
The Boulevard Mall 3528 South Maryland Parkway Las Vegas, NV | 1968 | 1,178,517 | 72.0% | 10 miles | Galaxy Theatre |
Miracle Mile Shops 3663 South Las Vegas Boulevard Las Vegas, NV | 2000 | 475,000 | 88.0% | 10 miles | None (Planet Hollywood Casino) |
Las Vegas South Premium Outlets 7400 South Las Vegas Boulevard Las Vegas, NV | 1993 | 537,765 | 99.0% | 9 miles | Nike Outlet |
Meadows Mall 4300 Meadows Lane Las Vegas, NV | 1978 | 945,209 | 89.0% | 15 miles | Macy’s JCPenney Dillard’s Clearance Curacao Round 1 Bowling |
| (1) | Source: Appraisal, unless stated otherwise. |
| (2) | Based on the underwritten rent roll dated January 1, 2024. |
The Borrower. The borrower for the Galleria at Sunset Mortgage Loan is Mershops Galleria at Sunset LLC, a single purpose Delaware limited liability company with two independent directors. Legal counsel to the borrower delivered a non-consolidation opinion in connection with the origination of the Galleria at Sunset Mortgage Loan.
The Borrower Sponsor. The borrower sponsor and non-recourse carveout guarantor is George Mersho. In addition to standard non-recourse carveouts, the guarantor provided a limited guaranty in the amount of $4,900,000 to the extent Macy’s permanently vacates its leased premises or otherwise terminates its lease (“Macy's Recourse”). In the event that Macy’s vacates or terminates its lease, the Macy's Recourse remains in place until such time all of the leased premises currently occupied by Macy’s has been fully leased pursuant to a replacement lease or replacement leases which satisfy any applicable co-tenancy requirements of the leases then in effect at the Galleria at Sunset Property which allow the tenants thereunder to pay reduced rent and/or terminate their leases to the extent one or more commercial tenants are not open for business in the leased premises currently occupied by Macy's.
Property Management. The Galleria at Sunset Property is managed by Spinoso Management Group, LLC, a third-party manager.
Escrows and Reserves. At origination, the borrower was required to deposit (i) $170,055 into a real estate tax reserve, (ii) $90,552 into an insurance premium reserve, (iii) $562,235 into an immediate repairs reserve, (iv) $400,000 into a replacement reserve, (v) $1,200,000 into a TI/LC reserve, (vi) $846,191 into an outstanding TI/LC reserve, and (vii) $113,275 into a gap rent reserve.
Tax Escrows – On a monthly basis, the borrower is required to escrow 1/12th of the annual estimated tax payments, which currently equates to $85,027.
Insurance Escrows – On a monthly basis, the borrower is required to escrow 1/12th of the annual estimated insurance premiums, which currently equates to approximately $18,110.
Replacement Reserves – On a monthly basis, the borrower is required to escrow approximately $26,761 for replacement reserves (which equates to $0.20 per square foot annually).
TI/LC Reserve – On a monthly basis, the borrower is required to escrow approximately $110,428 for tenant improvements and leasing commissions (which equates to $3.00 per square foot annually).
THE INFORMATION IN THIS STRUCTURAL AND COLLATERAL TERM SHEET IS NOT COMPLETE AND MAY BE AMENDED PRIOR TO THE TIME OF SALE. THIS TERM SHEET IS NOT AN OFFER TO SELL THESE SECURITIES AND IT IS NOT A SOLICITATION OF AN OFFER TO BUY THESE SECURITIES IN ANY JURISDICTION WHERE THE OFFER OR SALE IS NOT PERMITTED. |
| | 73 | |
| Structural and Collateral Term Sheet | | BMO 2024-5C4 |
| No. 4 – Galleria at Sunset |
Lockbox / Cash Management. The Galleria at Sunset Mortgage Loan is structured with a hard lockbox and springing cash management. The borrower is required to cause all rents to be transmitted directly by tenants at the Galleria at Sunset Property into a lender-controlled lockbox account. In addition, the borrower is required to cause all rents received by the borrower or the property manager with respect to the Galleria at Sunset Property to be deposited into such lockbox account within one business day of receipt. All amounts in the lockbox account are required to be remitted on a daily basis to the borrower’s operating account at any time other than during the continuance of a Cash Management Period (as defined below). Upon the occurrence and during the continuance of a Cash Management Period, all amounts are required to be remitted to a lender-controlled cash management account on a daily basis to be applied and disbursed in accordance with the Galleria at Sunset Mortgage Loan documents. During the continuance of a Cash Management Period, all excess cash flow funds remaining in the cash management account after the application of such funds in accordance with the Galleria at Sunset Mortgage Loan documents will be held by the lender, during the continuance of a Cash Management Period continuing solely as a result of a Lease Sweep Period (as defined below), in a special rollover reserve subaccount, or otherwise in a cash collateral subaccount as additional collateral for the Galleria at Sunset Mortgage Loan.
A “Cash Management Period” means the period commencing upon the occurrence of (i) the stated maturity date, (ii) an event of default, (iii) the debt service coverage ratio falls below 1.50x as of the last day of any calendar quarter, (iv) the debt yield is less than 16.0% as of the last day of any calendar quarter, (v) the commencement of a Lease Sweep Period, or (vi) the total annual sales generated by the retail tenants measured at the end of any calendar quarter is less than $90,000,000. A Cash Management Period will end (a) with respect to the matters described in clause (i) above, the Galleria at Sunset Mortgage Loan and all other obligations under the loan documents have been repaid in full, (b) with respect to the matters described in clause (ii) above, such event of default is no longer continuing and no other event of default has occurred and is continuing, (c) with respect to the matters described in clause (iii) above, the debt service coverage ratio is at least 1.75x as of the last day of any calendar quarter for two consecutive calendar quarters, (d) with respect to the matters described in clause (iv) above, the debt yield is at least 17.0% as of the last day of any calendar quarter for two consecutive calendar quarters, (e) with respect to clause (v) above, such Lease Sweep Period has ended, or (f) with respect to the matters described in clause (vi) above, the total annual sales generated by the retail tenants measured at the end of any calendar quarter is greater than $90,000,000.
A “Lease Sweep Period” commences upon the occurrence of any of the following: (i) the earlier of (a) the date that is 9 months prior to the end of the term of any Critical Tenant Lease (as defined below) (including any renewal terms) and (b) the date required under a Critical Tenant Lease by which the applicable tenant is required to give notice of its exercise of a renewal option thereunder (and in the case of either the foregoing, such renewal has not been so exercised) or the date that any tenant under a Critical Tenant Lease gives notice of its intention not to renew or extend its Critical Tenant Lease; (ii) two or more Lease Sweep Leases (as defined below) are surrendered, cancelled, or terminated prior to their then current expiration date or two or more tenants under a Lease Sweep Lease give notice of their intention to terminate, surrender, or cancel their lease; (iii) two or more tenants under a Lease Sweep Lease have discontinued business in all or such portion of their applicable leased premises which triggers any material co-tenancy rights under other leases or give written notice that they intend to do the same; (iv) the occurrence and continuance (beyond any applicable notice and cure periods) of a default under two or more Lease Sweep Leases by the applicable tenants thereunder; or (v) the occurrence with respect to two or more Lease Sweep Leases of an insolvency or bankruptcy proceeding, among other things, by any tenant under a Lease Sweep Lease, its parent company or the lease guarantor under a Lease Sweep Lease, as described in the Galleria at Sunset Mortgage Loan documents (“Lease Sweep Tenant Insolvency Proceeding”), and, in the case of any of clauses (i) through (v), the borrower fails to timely deposit cash and/or a letter of credit equal to $20,000,000 as described in the Galleria at Sunset Mortgage Loan documents.
A Lease Sweep Period ends upon the occurrence of any of the following: (1) with respect to a Lease Sweep Period caused by a matter described in clause (i) above, upon the earlier to occur of (A) the date on which the subject tenant irrevocably exercises its renewal or extension option (or otherwise enters into an extension agreement with the borrower and acceptable to the lender) with respect to all of the space demised under its Critical Tenant Lease and (B) the date on which all of the space demised under the subject Critical Tenant Lease that gave rise to the subject Lease Sweep Period has been fully leased pursuant to a replacement lease or replacement leases approved by the lender, and all approved leasing expenses (and any other expenses in connection with the re-tenanting of such space) have been paid in full; (2) with respect to a Lease Sweep Period caused by a matter described in clauses (ii) or (iii) above, upon the earlier to occur of (A) the date on which one or more of the subject tenants irrevocably exercises its renewal or extension option (or otherwise enters into an extension agreement with the borrower and acceptable to the lender) with respect to all of the space demised under its Lease Sweep Lease and (B) the date on which all of the space demised under one or more of the subject Lease Sweep
THE INFORMATION IN THIS STRUCTURAL AND COLLATERAL TERM SHEET IS NOT COMPLETE AND MAY BE AMENDED PRIOR TO THE TIME OF SALE. THIS TERM SHEET IS NOT AN OFFER TO SELL THESE SECURITIES AND IT IS NOT A SOLICITATION OF AN OFFER TO BUY THESE SECURITIES IN ANY JURISDICTION WHERE THE OFFER OR SALE IS NOT PERMITTED. |
| | 74 | |
| Structural and Collateral Term Sheet | | BMO 2024-5C4 |
| No. 4 – Galleria at Sunset |
Leases that gave rise to the subject Lease Sweep Period has been fully leased pursuant to a replacement lease or replacement leases approved by the lender, and all approved leasing expenses (and any other expenses in connection with the re-tenanting of such space) have been paid in full; (3) with respect to a Lease Sweep Period caused by a matter described in clause (iv) above, if one or more of the subject tenant defaults has been cured, and no other tenant default has occurred for a period of three consecutive months following such cure; or (4) with respect to a Lease Sweep Period caused by a matter described in clause (v) above, if the applicable Lease Sweep Tenant Insolvency Proceeding as to one or more of the Lease Sweep Lease(s) has terminated and the applicable Lease Sweep Lease(s) has been affirmed, assumed or assigned.
“Critical Tenant Lease” means the existing lease with Dick’s Sporting Goods or any replacement lease for all or a portion of its leased premises.
“Lease Sweep Lease” means any Critical Tenant Lease, the existing lease with any of Macy’s, Dillard’s, JCPenney, or Kohl’s and any future lease (leased by such tenant and/or its affiliates) which covers 10% or more of the total rentable square feet of the improvements at the Galleria at Sunset Property.
Subordinate Debt and Mezzanine Debt. None.
Permitted Future Debt. Not permitted.
Partial Release. The borrower may obtain a release of one or more of four certain vacant land parcels with a 120% paydown of the allocated loan amount for the released parcel subject to certain conditions including, among others, (i) the debt yield of the remaining property is at least the greater of (a) 23.5% and (b) the debt yield immediately prior to the release, (ii) the DSCR of the remaining property is at least the greater of (a) 2.45x and (b) the DSCR immediately prior to the release, and (iii) satisfaction of REMIC requirements.
Ground Lease. None.
THE INFORMATION IN THIS STRUCTURAL AND COLLATERAL TERM SHEET IS NOT COMPLETE AND MAY BE AMENDED PRIOR TO THE TIME OF SALE. THIS TERM SHEET IS NOT AN OFFER TO SELL THESE SECURITIES AND IT IS NOT A SOLICITATION OF AN OFFER TO BUY THESE SECURITIES IN ANY JURISDICTION WHERE THE OFFER OR SALE IS NOT PERMITTED. |
| | 75 | |
| Structural and Collateral Term Sheet | | BMO 2024-5C4 |
| No. 5 – Vero Office Portfolio |
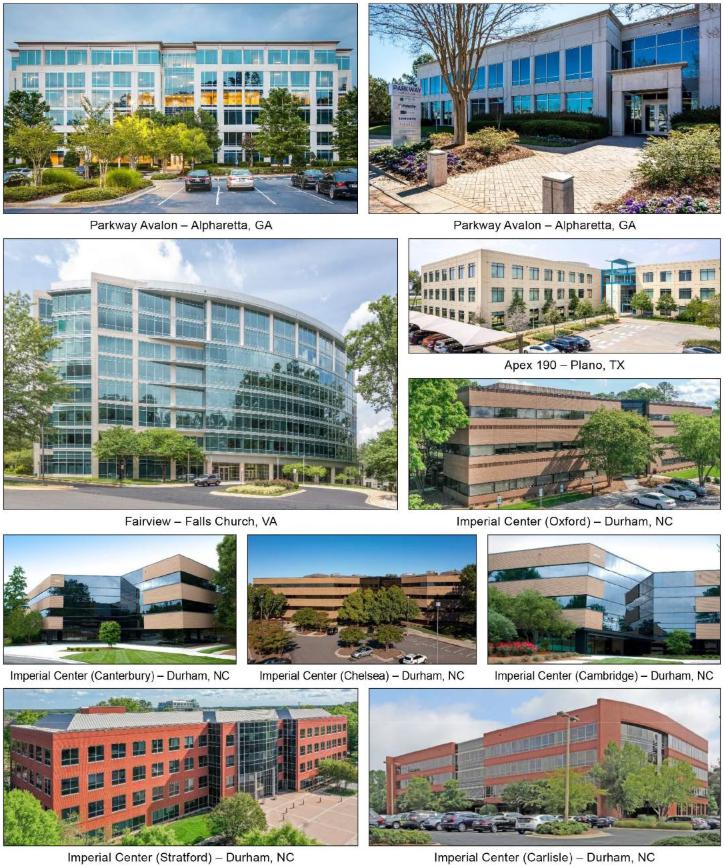
THE INFORMATION IN THIS STRUCTURAL AND COLLATERAL TERM SHEET IS NOT COMPLETE AND MAY BE AMENDED PRIOR TO THE TIME OF SALE. THIS TERM SHEET IS NOT AN OFFER TO SELL THESE SECURITIES AND IT IS NOT A SOLICITATION OF AN OFFER TO BUY THESE SECURITIES IN ANY JURISDICTION WHERE THE OFFER OR SALE IS NOT PERMITTED. |
| | 76 | |
| Structural and Collateral Term Sheet | | BMO 2024-5C4 |
| No. 5 – Vero Office Portfolio |
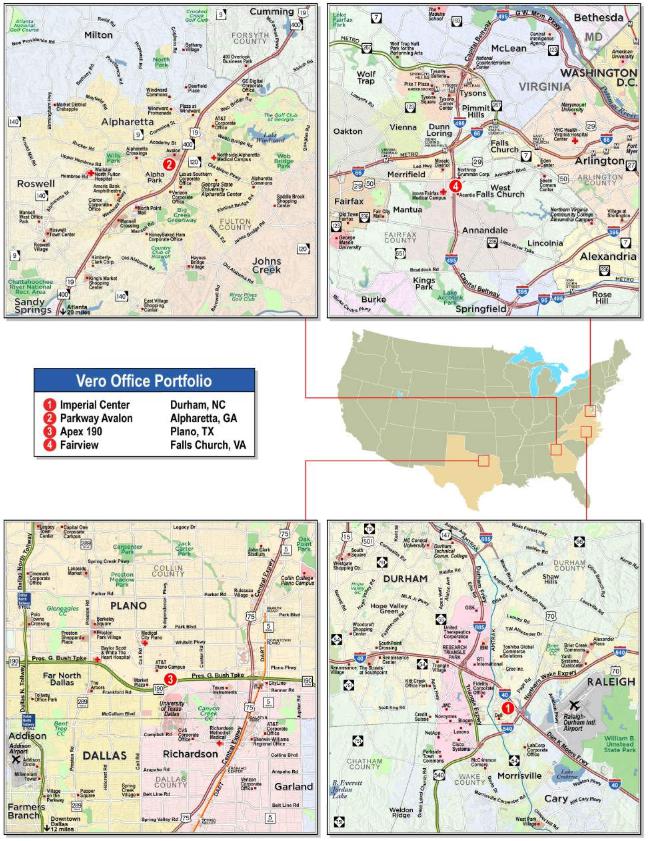
THE INFORMATION IN THIS STRUCTURAL AND COLLATERAL TERM SHEET IS NOT COMPLETE AND MAY BE AMENDED PRIOR TO THE TIME OF SALE. THIS TERM SHEET IS NOT AN OFFER TO SELL THESE SECURITIES AND IT IS NOT A SOLICITATION OF AN OFFER TO BUY THESE SECURITIES IN ANY JURISDICTION WHERE THE OFFER OR SALE IS NOT PERMITTED. |
| | 77 | |
| Structural and Collateral Term Sheet | | BMO 2024-5C4 |
| No. 5 – Vero Office Portfolio |
Mortgage Loan Information | | Property Information |
| Mortgage Loan Seller: | AREF2 | | Single Asset / Portfolio: | Portfolio |
| Original Principal Balance(1): | $43,000,000 | | Title: | Fee |
| Cut-off Date Principal Balance(1): | $43,000,000 | | Property Type – Subtype: | Office – Suburban |
| % of IPB: | 5.0% | | Net Rentable Area (SF): | 987,072 |
| Loan Purpose(2): | Recapitalization | | Location(5): | Various |
| Borrowers: | Apex Building Owner LLC, Fairview Building Owner LLC, Parkway Building Owner LLC and Imperial Center Building Owner LLC | | Year Built / Renovated(5): | Various / NAP |
| Borrower Sponsor: | Admiral 2R Management LLC | | Occupancy: | 82.4% |
| Interest Rate: | 7.36400% | | Occupancy Date: | 12/31/2023 |
| Note Date: | 3/1/2024 | | 4th Most Recent NOI (As of)(6): | NAV |
| Maturity Date: | 3/6/2029 | | 3rd Most Recent NOI (As of)(6): | NAV |
| Interest-only Period: | 60 months | | 2nd Most Recent NOI (As of): | $14,562,062 (12/31/2022) |
| Original Term: | 60 months | | Most Recent NOI (As of)(7): | $14,647,569 (12/31/2023) |
| Original Amortization Term: | None | | UW Economic Occupancy: | 81.7% |
| Amortization Type: | Interest Only | | UW Revenues: | $27,017,073 |
| Call Protection: | L(26),D(27),O(7) | | UW Expenses: | $10,082,300 |
| Lockbox / Cash Management: | Hard / Springing | | UW NOI(7): | $16,934,772 |
| Additional Debt(1): | Yes | | UW NCF: | $15,429,432 |
| Additional Debt Balance(1): | $65,000,000 | | Appraised Value / Per SF: | $195,500,000 / $198 |
| Additional Debt Type(1): | Pari Passu | | Appraisal Date: | Various |
| | | | | |
| Escrows and Reserves(3) | | Financial Information(1) |
| | Initial | Monthly | Initial Cap | | Cut-off Date Loan / SF: | $109 |
| Taxes: | $717,296 | $192,136 | N/A | | Maturity Date Loan / SF: | $109 |
| Insurance: | $0 | Springing | N/A | | Cut-off Date LTV: | 55.2% |
| Replacement Reserves: | $3,500,000 | $27,144 | N/A | | Maturity Date LTV: | 55.2% |
| TI / LC Reserve: | $10,000,000 | Springing | $5,000,000 | | UW NCF DSCR: | 1.91x |
| Unfunded Obligations(4): | $8,533,957 | $0 | N/A | | UW NOI Debt Yield: | 15.7% |
| | | | | | | |
| Sources and Uses |
| Sources | Proceeds | % of Total | | Uses | Proceeds | % of Total |
| Whole Loan(1) | $108,000,000 | 61.9 | % | | Recapitalization(2) | $143,733,229 | 82.4 | % |
| Borrower Sponsor Equity | 66,537,811 | 38.1 | | | Upfront Reserves | 22,751,253 | 13.0 | |
| | | | | Closing Costs | 8,053,330 | 4.6 | |
| Total Sources | $174,537,811 | 100.0 | % | | Total Uses | $174,537,811 | 100.0 | % |
| (1) | The Vero Office Portfolio Mortgage Loan (as defined below) is part of the Vero Office Portfolio Whole Loan (as defined below), which is evidenced by four pari passu promissory notes with an aggregate principal balance as of the Cut-off Date of $108,000,000. The Financial Information in the chart above is based on the aggregate outstanding principal balance of the Vero Office Portfolio Whole Loan. |
| (2) | The borrowers paid off the prior loan at a discounted amount of approximately $143.7 million ($145.62 PSF), which represents 72.6% of the fully funded principal balance of $198.0 million. In connection with the payoff of the prior loan and recapitalization of the portfolio, entities owned and controlled by Vero Capital (Common Member and Managing Member, 18.8% of ownership in the joint venture) entered into a joint venture with entities owned and controlled by Prime Finance (Preferred Member, 81.2% of ownership in the joint venture). The joint venture agreement provides that Prime Finance may make a future contribution, which will result in Vero Capital owning 17% and Prime Finance owning 83% of the joint venture. The joint venture contributed approximately $66.5 million of fresh equity to facilitate the transaction. |
| (3) | See “Escrows and Reserves” below for further discussion of reserve information. |
| (4) | The unfunded obligations reserve consists of $4,751,515 for an outstanding TI/LC reserve and approximately $3,782,442 for a gap and free rent reserve. |
| (5) | See the “Portfolio Summary” chart below. |
| (6) | Full year 2020 and 2021 financials are not available given the borrower sponsor purchased the Vero Office Portfolio Properties (as defined below) between October and December 2021. |
| (7) | The increase from the most recent NOI to UW NOI is primarily due to approximately 374,483 SF (37.9% of total SF) of recent leasing that has been executed across the Vero Office Portfolio since 2022. Of the total recent leasing, 197,995 SF (20.1% of total SF) are new leases and 176,488 SF (17.9% of total SF) are renewals. |
The Loan. The fifth largest mortgage loan (the “Vero Office Portfolio Mortgage Loan”) is part of a whole loan (the “Vero Office Portfolio Whole Loan”) secured by first deeds of trust encumbering the borrowers’ fee interests in 10 office buildings
THE INFORMATION IN THIS STRUCTURAL AND COLLATERAL TERM SHEET IS NOT COMPLETE AND MAY BE AMENDED PRIOR TO THE TIME OF SALE. THIS TERM SHEET IS NOT AN OFFER TO SELL THESE SECURITIES AND IT IS NOT A SOLICITATION OF AN OFFER TO BUY THESE SECURITIES IN ANY JURISDICTION WHERE THE OFFER OR SALE IS NOT PERMITTED. |
| | 78 | |
| Structural and Collateral Term Sheet | | BMO 2024-5C4 |
| No. 5 – Vero Office Portfolio |
located across 4 properties in Alpharetta, Georgia, Plano, Texas, Falls Church, Virginia, and Durham, North Carolina (collectively, the “Vero Office Portfolio Properties” or the “Vero Office Portfolio” and each individually, a “Vero Office Portfolio Property”). The Vero Office Portfolio Whole Loan is comprised of four pari passu promissory notes with an aggregate outstanding principal balance as of the Cut-off Date of $108,000,000. The Vero Office Portfolio Whole Loan was originated on March 1, 2024 by Goldman Sachs Bank USA (“GS”). GS completed a sale of the controlling note A-1 and non-controlling note A-2 to Argentic Real Estate Finance 2 LLC (“AREF2”) on March 6, 2024. The borrowers paid off the prior loan at a discounted amount of approximately $143.7 million ($145.62 PSF), which represents 72.6% of the fully funded principal balance of $198.0 million. In connection with the payoff of the prior loan and recapitalization of the portfolio, entities owned and controlled by Vero Capital (Common Member and Managing Member, 18.8% of ownership in the joint venture) entered into a joint venture with entities owned and controlled Prime Finance (Preferred Member, 81.2% of ownership in the joint venture). The joint venture agreement provides that Prime Finance may make a future contribution, which will result in Vero Capital owning 17% and Prime Finance owning 83% of the joint venture. The joint venture contributed approximately $66.5 million of fresh equity to facilitate the transaction. The Vero Office Portfolio Whole Loan has an initial term of 60 months and has a remaining term of 58 months as of the Cut-off Date. The Vero Office Portfolio Whole Loan requires interest-only payments during its entire term and accrues interest at a fixed rate of 7.36400% per annum. The scheduled maturity date of the Vero Office Portfolio Whole Loan is the payment date in March 2029. The Vero Office Portfolio Mortgage Loan is evidenced by the controlling note A-1 and non-controlling note A-2 with an outstanding principal balance as of the Cut-off Date of $43,000,000.
The table below summarizes the promissory notes that comprise the Vero Office Portfolio Whole Loan. The relationship between the holders of the Vero Office Portfolio Whole Loan will be governed by a co-lender agreement. The Vero Office Portfolio Whole Loan will be serviced pursuant to the pooling and servicing agreement for the BMO 2024-5C4 securitization trust. See “Description of the Mortgage Pool—The Whole Loans—The Serviced Pari Passu Whole Loans” and “The Pooling and Servicing Agreement” in the Preliminary Prospectus.
| Whole Loan Summary |
| Note | Original Balance | Cut-off Date Balance | Note Holder | Controlling Piece |
| A-1 | $23,000,000 | $23,000,000 | BMO 2024-5C4 | Yes |
| A-2 | $20,000,000 | $20,000,000 | BMO 2024-5C4 | No |
| A-3 | $32,500,000 | $32,500,000 | Benchmark 2024-V6 | No |
| A-4 | $32,500,000 | $32,500,000 | Benchmark 2024-V6 | No |
| Whole Loan | $108,000,000 | $108,000,000 | | |
The Properties. The Vero Office Portfolio Properties are comprised of four assets, totaling 987,072 SF across ten buildings. The Vero Office Portfolio Properties are located in Alpharetta, Georgia (the “Parkway Avalon Property”), Plano, Texas (the “Apex 190 Property”), Durham, North Carolina (the “Imperial Center Property”) and Falls Church, Virginia (the “Fairview Property”). The Vero Office Portfolio Properties are currently 82.4% occupied by approximately 85 tenants as of December 31, 2023, with a weighted average remaining lease term of 5.0 years as of the Cut-off Date. The three largest tenants at the Vero Office Portfolio Properties by NRA are Paragon Healthcare, Inc. (10.5% Total SF), Bioventus, LLC (5.3% of Total SF), and Open Text - GXS (4.2% Total SF), two of which, Paragon Healthcare, Inc. and Bioventus, LLC, are headquartered at their respective Vero Office Portfolio Properties.
THE INFORMATION IN THIS STRUCTURAL AND COLLATERAL TERM SHEET IS NOT COMPLETE AND MAY BE AMENDED PRIOR TO THE TIME OF SALE. THIS TERM SHEET IS NOT AN OFFER TO SELL THESE SECURITIES AND IT IS NOT A SOLICITATION OF AN OFFER TO BUY THESE SECURITIES IN ANY JURISDICTION WHERE THE OFFER OR SALE IS NOT PERMITTED. |
| | 79 | |
| Structural and Collateral Term Sheet | | BMO 2024-5C4 |
| No. 5 – Vero Office Portfolio |
The following table presents certain information relating to the Vero Office Portfolio Properties:
| Portfolio Summary(1) |
| Property | City, State | Year Built / Renovated | Net Rentable Area (SF)(2) | Occupancy %(2) | Allocated Whole Loan Amount(3) | % of Allocated Whole Loan Amount(3) | Appraised Value | UW NCF(2) | % of UW NCF(2) |
| Imperial Center | Durham, NC | 1984-2007 / NAP | 408,938 | 69.7% | 36,000,000 | 33.3% | $67,000,000 | $4,574,406 | 29.6% |
| Parkway Avalon | Alpharetta, GA | 2000-2001 / NAP | 196,659 | 89.0% | 29,000,000 | 26.9% | $48,900,000 | $4,120,962 | 26.7% |
| Apex 190 | Plano, TX | 2007 / NAP | 186,215 | 100.0% | 24,000,000 | 22.2% | $36,200,000 | $3,194,102 | 20.7% |
| Fairview | Falls Church, VA | 2008 / NAP | 195,260 | 85.6% | 19,000,000 | 17.6% | $43,400,000 | $3,539,962 | 22.9% |
| Total / Wtd. Avg. | | | 987,072 | 82.4% | $108,000,000 | 100.0% | $195,500,000 | $15,429,432 | 100.0% |
| | (1) | Source: Appraisals, unless otherwise indicated. |
| | (2) | Based on the underwritten cash flow and rent rolls dated December 31, 2023, with rent steps through March 31, 2025. |
| | (3) | Based on the Vero Office Portfolio Whole Loan documents. |
Major Tenants. The three largest tenants based on underwritten base rent are Paragon Healthcare, Inc., Open Text – GXS and Bioventus, LLC.
Paragon Healthcare, Inc. (103,249 SF; 10.5% of net rentable area; 12.8% of underwritten base rent) was founded in 2002, and is a provider of infusion services to patients through its network of ambulatory infusion centers, home infusion pharmacies and other specialty pharmacy services. The company provides care to patients with chronic and acute conditions. The company is headquartered at the Apex 190 Property and operates locations in the following nine states: Alabama, Colorado, Florida, Georgia, Louisiana, Missouri, Oklahoma, Texas and Tennessee. Paragon Healthcare, Inc. has two, five-year renewal options remaining and no early termination options.
Open Text - GXS (41,382 SF; 4.2% of net rentable area; 6.0% of underwritten base rent) is a subsidiary of OpenText Corporation headquartered in Gaithersburg, Maryland. Open Text - GXS provides business-to-business integration and on-demand supply chain integration, synchronization, and collaboration solutions over its various platforms. OpenText Corporation, based in Waterloo, Canada, announced their acquisition of Open Text - GXS in 2014. OpenText Corporation is a Canadian company that develops and sells enterprise information management software. Open Text - GXS has a one-time right to terminate its lease, effective April 30, 2027, subject to providing no less than nine months prior written notice and payment of a termination fee. The tenant has one, five-year renewal option remaining.
Bioventus, LLC (52,121 SF; 5.3% of net rentable area; 6.0% of underwritten base rent) is a global leader of innovations for active healing. Through a combination of internal product development, product/business acquisition, and distribution agreements, Bioventus, LLC brings to market products which address a growing need for clinically effective, cost efficient, minimally invasive medical treatments that engage and enhance the body’s natural healing processes. Bioventus, LLC is headquartered at the Imperial Center Property and operates locations across the globe. Bioventus, LLC has two, five-year renewal options remaining and no early termination options.
Appraisals. According to the appraisals, the Vero Office Portfolio Properties had an aggregate “as-is” value of $195,500,000 as of various dates between January 17, 2024 and January 23, 2024. Based on the aggregate of the “as-is” appraised value of $195,500,000, the Cut-off Date LTV and Maturity Date LTV for the Vero Office Portfolio Whole Loan are 55.2%.
| Vero Office Portfolio Appraised Value(1) |
| Properties | Value | Capitalization Rate |
| Imperial Center | | $67,000,000 | | 8.25% |
| Parkway Avalon | | 48,900,000 | | 9.75% |
| Apex 190 | | 36,200,000 | | 8.00% |
| Fairview | | 43,400,000 | | 8.00% |
| Total / Wtd. Avg. | | $195,500,000 | (2) | 8.52% |
| (2) | Total / Wtd. Avg. represents the aggregate of the “as-is” appraised values of the Vero Office Portfolio Properties. |
Environmental. The Phase I environmental assessments of the Vero Office Portfolio Properties dated January 18, 2024 identified no recognized environmental conditions, controlled environmental conditions or significant data gaps.
The following table presents certain information relating to the historical and current occupancy of the Vero Office Portfolio Properties:
THE INFORMATION IN THIS STRUCTURAL AND COLLATERAL TERM SHEET IS NOT COMPLETE AND MAY BE AMENDED PRIOR TO THE TIME OF SALE. THIS TERM SHEET IS NOT AN OFFER TO SELL THESE SECURITIES AND IT IS NOT A SOLICITATION OF AN OFFER TO BUY THESE SECURITIES IN ANY JURISDICTION WHERE THE OFFER OR SALE IS NOT PERMITTED. |
| | 80 | |
| Structural and Collateral Term Sheet | | BMO 2024-5C4 |
| No. 5 – Vero Office Portfolio |
| Historical and Current Occupancy(1) |
| | 2020 | 2021 | 2022 | Current(2) |
| Imperial Center | 85.3% | 88.0% | 85.8% | 69.7% |
| Parkway Avalon | 85.2% | 83.9% | 77.8% | 89.0% |
| Apex 190 | 61.8% | 80.6% | 93.3% | 100.0% |
| Fairview | 79.5% | 74.5% | 65.4% | 85.6% |
| Wtd. Avg. | 79.7% | 83.1% | 81.6% | 82.4% |
| (1) | Historical occupancies are as of December 31 of each respective year. |
| (2) | Current occupancies are as of December 31, 2023. |
The following table presents certain information relating to the tenants at the Vero Office Portfolio Properties:
| Tenant Summary(1) |
| Tenant | Ratings Moody’s /S&P/Fitch(2) | Net Rentable Area (SF) | % of Total NRA | UW Rent PSF(3) | UW Rent(3) | % of Total UW Rent(3) | Lease Exp. Date |
| Paragon Healthcare, Inc. | NR/NR/NR | 103,249 | 10.5% | $33.97 | $3,507,245 | 12.8% | 12/31/2030 |
| Open Text - GXS(4) | Ba2/BB+/BB+ | 41,382 | 4.2 | $39.92 | 1,651,992 | 6.0 | 4/30/2029 |
| Bioventus, LLC | NR/NR/NR | 52,121 | 5.3 | $31.59 | 1,646,302 | 6.0 | 9/30/2028 |
| Kimley-Horn and Associates(5) | NR/NR/NR | 35,407 | 3.6 | $35.22 | 1,246,969 | 4.5 | 2/29/2028 |
| Republic Title of Texas, Inc.(6) | NR/NR/NR | 35,010 | 3.5 | $33.50 | 1,172,676 | 4.3 | 5/31/2035 |
| Principled Tech | NR/NR/NR | 41,176 | 4.2 | $27.77 | 1,143,458 | 4.2 | 3/31/2028 |
| Samsung SDS Global SCL America, Inc. | NR/NR/NR | 32,424 | 3.3 | $33.94 | 1,100,617 | 4.0 | 6/30/2025 |
| Spin Systems Inc.(7) | NR/NR/NR | 24,513 | 2.5 | $38.19 | 936,098 | 3.4 | 8/31/2028 |
| Marken LLP | NR/NR/NR | 29,319 | 3 | $30.72 | 900,680 | 3.3 | 10/31/2028 |
| Total Quality Logistics (aka TQL)(8) | NR/NR/NR | 27,307 | 2.8 | $30.18 | 824,173 | 3.0 | 12/31/2027 |
| Largest Tenants Total / Wtd. Avg. | | 421,908 | 42.7% | $33.49 | $14,130,210 | 51.5% | |
| Remaining Occupied(9) | | 391,510 | 39.7 | $34.02 | 13,320,154 | 48.5 | |
| Occupied Collateral Total / Wtd. Avg. | | 813,418 | 82.4% | $33.75 | $27,450,364 | 100.0% | |
| | | | | | | | |
| Vacant Space | | 173,654 | 17.6% | | | | |
| | | | | | | | |
| Collateral Total | | 987,072 | 100.0% | | | | |
| | | | | | | | |
| (1) | Based on the underwritten rent roll dated December 31, 2023, with rent steps through March 31, 2025. |
| (2) | Certain ratings are those of the parent company whether or not the parent guarantees the lease. |
| (3) | UW Rent PSF, UW Rent, and % of Total UW Rent includes commercial reimbursement revenue. |
| (4) | Open Text - GXS has a one-time right to terminate its lease, effective April 30, 2027, subject to providing no less than nine months’ prior written notice and payment of a termination fee. |
| (5) | Kimley-Horn and Associates has a one-time right to terminate the expansion space (Suite 550 containing 10,317 square feet), effective September 30, 2025, subject to providing written notice on or before September 30, 2024 and payment of a termination fee. |
| (6) | Republic Title of Texas, Inc. has a lease commencement date of June 1, 2024 and is obligated to begin paying rent once the tenant opens for business. We cannot assure you that the tenant will take occupancy, or begin paying rent, on the lease commencement date or at all. |
| (7) | Spin Systems Inc. has a continuous right to terminate its lease during the initial term of its lease effective any time after August 31, 2024 provided that the tenant provides at least 12 months’ prior written notice, along with a termination fee. |
| (8) | Total Quality Logistics (aka TQL) has a one-time option to terminate its lease on February 28, 2026 with 12 months’ prior written notice and payment of a termination fee. |
| (9) | Remaining Occupied includes an engineering office (528 square feet) and a fitness center (2,307 square feet) for which no rent was underwritten. |
THE INFORMATION IN THIS STRUCTURAL AND COLLATERAL TERM SHEET IS NOT COMPLETE AND MAY BE AMENDED PRIOR TO THE TIME OF SALE. THIS TERM SHEET IS NOT AN OFFER TO SELL THESE SECURITIES AND IT IS NOT A SOLICITATION OF AN OFFER TO BUY THESE SECURITIES IN ANY JURISDICTION WHERE THE OFFER OR SALE IS NOT PERMITTED. |
| | 81 | |
| Structural and Collateral Term Sheet | | BMO 2024-5C4 |
| No. 5 – Vero Office Portfolio |
The following table presents certain information relating to the tenant lease expiration dates for the Vero Office Portfolio Properties:
| Lease Rollover Schedule(1)(2) |
| Year | Number of Leases Expiring | Net Rentable Area Expiring | % of NRA Expiring | UW Rent Expiring(3) | % of UW Rent Expiring(3) | Cumulative Net Rentable Area Expiring | Cumulative % of NRA Expiring | Cumulative UW Rent Expiring(3) | Cumulative % of UW Rent Expiring(3) |
| Vacant | NAP | 173,654 | 17.6% | NAP | NAP | 173,654 | 17.6% | NAP | NAP |
| 2024 & MTM | 10 | 23,966 | 2.4 | $814,475 | 3.0% | 197,620 | 20.0% | $814,475 | 3.0% |
| 2025(4) | 16 | 96,762 | 9.8 | 3,089,183 | 11.3 | 294,382 | 29.8% | $3,903,658 | 14.2% |
| 2026 | 12 | 48,533 | 4.9 | 1,580,562 | 5.8 | 342,915 | 34.7% | $5,484,220 | 20.0% |
| 2027 | 7 | 54,570 | 5.5 | 1,717,867 | 6.3 | 397,485 | 40.3% | $7,202,087 | 26.2% |
| 2028 | 18 | 268,268 | 27.2 | 9,001,012 | 32.8 | 665,753 | 67.4% | $16,203,099 | 59.0% |
| 2029 | 8 | 87,027 | 8.8 | 3,272,357 | 11.9 | 752,780 | 76.3% | $19,475,456 | 70.9% |
| 2030 | 5 | 125,442 | 12.7 | 4,313,094 | 15.7 | 878,222 | 89.0% | $23,788,550 | 86.7% |
| 2031 | 1 | 8,225 | 0.8 | 323,831 | 1.2 | 886,447 | 89.8% | $24,112,381 | 87.8% |
| 2032 | 1 | 17,437 | 1.8 | 684,402 | 2.5 | 903,884 | 91.6% | $24,796,784 | 90.3% |
| 2033 | 2 | 17,110 | 1.7 | 590,547 | 2.2 | 920,994 | 93.3% | $25,387,331 | 92.5% |
| 2034 | 3 | 24,009 | 2.4 | 824,080 | 3 | 945,003 | 95.7% | $26,211,411 | 95.5% |
| 2035 & Beyond(5) | 4 | 42,069 | 4.3 | 1,238,953 | 4.5 | 987,072 | 100.0% | $27,450,364 | 100.0% |
| Total | 87 | 987,072 | 100.0% | $27,450,364 | 100.0% | | | | |
| (1) | Based on the underwritten rent roll dated December 31, 2023. |
| (2) | Certain tenants may have lease termination options that are exercisable prior to the originally stated expiration date of the related lease and are not considered in the rollover schedule. |
| (3) | UW Rent Expiring, % of UW Rent Expiring, Cumulative UW Rent Expiring, and Cumulative % of UW Rent Expiring include commercial reimbursement revenue. |
| (4) | Includes a fitness center that comprises 2,307 square feet for which no rent was underwritten. |
| (5) | Includes an engineering office that comprises 528 square feet for which no rent was underwritten. |
The following table presents certain information relating to the historical operating performance and underwritten cash flows of the Vero Office Portfolio Properties:
| Operating History and Underwritten Net Cash Flow(1) |
| | 2022 | 2023 | Underwritten | Per Square Foot | %(2) |
| Base Rent(3) | $22,653,847 | $24,507,725 | $24,830,826 | $25.16 | 75.1% |
| Rent Steps | 0 | 0 | 29,132 | 0.03 | 0.1 |
| Gross Up Vacancy | 0 | 0 | 5,594,954 | 5.67 | 16.9 |
| Gross Potential Rent | $22,653,847 | $24,507,725 | $30,454,912 | $30.85 | 92.1% |
| Commercial Rent Abatements | (840,712) | (2,860,533) | 0 | 0.00 | 0.0 |
| Total Reimbursements | 2,594,460 | 2,604,208 | 2,619,538 | 2.65 | 7.9 |
| Other Revenue | 27,679 | 49,870 | 7,200 | 0.01 | 0.0 |
| Net Rental Income | $24,435,274 | $24,301,270 | $33,081,649 | $33.51 | 100.0% |
| Vacancy/Credit Loss | 0 | 0 | (6,064,577) | (6.14) | (18.3) |
| Effective Gross Income | $24,435,274 | $24,301,270 | $27,017,073 | $27.37 | 81.7% |
| Total Expenses(4) | 9,873,212 | 9,653,701 | 10,082,300 | 10.21 | 37.3 |
| Net Operating Income(5) | $14,562,062 | $14,647,569 | $16,934,772 | $17.16 | 62.7% |
| Capital Expenditures | 0 | 0 | 325,734 | 0.33 | 1.2 |
| TI/LC | 0 | 0 | 1,179,606 | 1.20 | 4.4 |
| Net Cash Flow | $14,562,062 | $14,647,569 | $15,429,432 | $15.63 | 57.1% |
| (1) | Full year 2020 and 2021 financials are not available given the borrower sponsor purchased the Vero Office Portfolio Properties between October and December 2021. |
| (2) | % column represents percent of Net Rental Income for revenue fields and represents percent of Effective Gross Income for the remainder of fields. |
| (3) | Underwritten Base Rent is based on the underwritten rent rolls dated December 31, 2023, with rent steps through March 31, 2025. |
| (4) | Underwritten Total Expenses includes real estate taxes of approximately $2,758,452 and insurance expense of approximately $295,078. |
| (5) | The increase from the most recent NOI to UW NOI is primarily due to approximately 374,483 SF (37.9% of total SF) of recent leasing that has been executed across the Vero Office Portfolio since 2022. Of the total recent leasing, 197,995 SF (20.1% of total SF) are new leases and 176,488 SF (17.9% of total SF) are renewals. |
THE INFORMATION IN THIS STRUCTURAL AND COLLATERAL TERM SHEET IS NOT COMPLETE AND MAY BE AMENDED PRIOR TO THE TIME OF SALE. THIS TERM SHEET IS NOT AN OFFER TO SELL THESE SECURITIES AND IT IS NOT A SOLICITATION OF AN OFFER TO BUY THESE SECURITIES IN ANY JURISDICTION WHERE THE OFFER OR SALE IS NOT PERMITTED. |
| | 82 | |
| Structural and Collateral Term Sheet | | BMO 2024-5C4 |
| No. 5 – Vero Office Portfolio |
The Market. The Vero Office Portfolio Properties are located in Durham, North Carolina, Alpharetta, Georgia, Falls Church, Virginia and Plano, Texas.
The Imperial Center Property is located in Durham, North Carolina, within the Office – Research Triangle submarket. As of Q1 2024, the Office – Research Triangle submarket reports 14.2 million SF with a 10.9% vacancy rate and asking office rent of $32.50 per SF, per a third-party market research report.
The Parkway Avalon Property is located in Alpharetta, Georgia, within the Office – North Fulton/Forsyth County submarket. As of Q1 2024, the Office – North Fulton/Forsyth County submarket reports 40.6 million SF of inventory with an 18.2% vacancy rate and asking office rent between $34 and $42 per SF, per a third-party market research report.
The Apex 190 Property is located in Plano, Texas, within the Office – Plano submarket. As of Q1 2024, the Office – Plano submarket reports 11.7 million SF of inventory with a 12.4% vacancy rate and asking office rent between $20 and $25 per SF, per a third-party market research report.
The Fairview Property is located in Falls Church, Virginia, within the Office – Merrifield submarket. As of Q1 2024, the Office – Merrifield submarket reports 10.7 million SF of inventory with a 13.5% vacancy rate and asking office rent between $30 and $34 per SF, per a third-party market research report.
The Borrowers. The borrowers for the Vero Office Portfolio Whole Loan are Parkway Building Owner LLC, Apex Building Owner LLC, Imperial Center Building Owner LLC, and Fairview Building Owner LLC, each a Delaware limited liability company and single purpose entity with two independent directors. Legal counsel to the borrowers delivered a non-consolidation opinion in connection with the origination of the Vero Office Portfolio Whole Loan.
The Borrower Sponsor. The borrower sponsor and one of the non-recourse carveout guarantors is Admiral 2R Management LLC, a Delaware limited liability company. Each of A2R Founders Legacy LLC, A2R Real Estate Fund II LP, VPF Preferred JV LLC and Prime Finance Special Situations 2020 Fund, L.P. is also a non-recourse carveout guarantor. Prime Finance Special Situations 2020 Fund, L.P.’s guaranty is limited to bankruptcy related recourse events.
Property Management. The Vero Office Portfolio Properties are managed by (i) Colliers International Management - Atlanta, LLC and Admiral 2R Management LLC (in the case of the Parkway Avalon Property); (ii) HPI Commercial Real Estate, LLC and Admiral 2R Management LLC (in the case of the Apex 190 Property); (iii) Moore & Associates, Inc. and Admiral 2R Management LLC (in the case of the Fairview Property); and (iv) TRI Properties, LLC and Admiral 2R Management LLC (in the case of the Imperial Center Property). Admiral 2R Management LLC is an affiliate of the borrower sponsor.
Escrows and Reserves. At origination, the borrowers deposited approximately (A) $717,296 into a real estate tax reserve (B) $10,000,000 into a tenant improvement and leasing commission reserve, (C) $3,500,000 into a capital expenditures reserve and (D) $8,533,957 into an unfunded obligations reserve (comprised of approximately $4,751,515 for the TI/LC portion and approximately $3,782,442 for the free rent and gap rent portion of such reserve).
Tax Reserve – The borrowers are required to deposit into a real estate tax reserve, on a monthly basis, 1/12th of the annual estimated tax payments payable during the next ensuing 12 months, an amount currently equal to approximately $192,136.
Insurance Reserve – The borrowers are required to deposit into an insurance reserve, on a monthly basis, 1/12th of the annual estimated insurance payments, except if the Vero Office Portfolio Properties are insured under a blanket policy meeting the requirements set forth in the related loan agreement (in which case, no insurance escrows will be required).
Replacement Reserve – On a monthly basis, the borrowers are required to escrow an amount equal to approximately $27,144 for capital expenditures.
TI/LC Reserve – On each payment date which occurs on or after the date the DSCR (as defined below), determined as of the first day of any two consecutive fiscal quarters, is less than 1.50x and continuing until the DSCR, determined as of the first day of any two consecutive fiscal quarters, is equal to or greater than 1.55x, the borrowers are required to deposit the
THE INFORMATION IN THIS STRUCTURAL AND COLLATERAL TERM SHEET IS NOT COMPLETE AND MAY BE AMENDED PRIOR TO THE TIME OF SALE. THIS TERM SHEET IS NOT AN OFFER TO SELL THESE SECURITIES AND IT IS NOT A SOLICITATION OF AN OFFER TO BUY THESE SECURITIES IN ANY JURISDICTION WHERE THE OFFER OR SALE IS NOT PERMITTED. |
| | 83 | |
| Structural and Collateral Term Sheet | | BMO 2024-5C4 |
| No. 5 – Vero Office Portfolio |
Monthly Rollover Amount (as defined below) into a tenant improvement and leasing commission reserve without consideration for the $2,000,000 and $5,000,000 thresholds described below. Otherwise, beginning when the amount in the tenant improvement and leasing commission reserve is less than $2,000,000, the borrowers are required to deposit the Monthly Rollover Amount, which is currently approximately $106,933, on a monthly basis into such reserve, subject to a cap of $5,000,000.
“DSCR” means, as of the date of determination, the quotient obtained by dividing (x) net operating income by (y) the product of (i) the original principal balance of the Vero Office Portfolio Whole Loan, (ii) 8.279% and (iii) a fraction, the numerator of which is the actual number of days in the succeeding 12-month period and the denominator of which is 360.
“Monthly Rollover Amount” at any time means 1/12th of the product of (x) either (a) during any point in time the DSCR, determined as of the first day of any two consecutive fiscal quarters, is less than 1.50x and continuing until the DSCR is equal to or greater than 1.55x as of the last day of two consecutive fiscal quarters thereafter, $1.50 or (b) otherwise, $1.30, and (y) the aggregate number of rentable square feet then contained in the Vero Office Portfolio Properties.
Lockbox / Cash Management. The Vero Office Portfolio Whole Loan is structured with a hard lockbox and springing cash management. The borrowers are required to direct the tenants to pay rent directly into the lockbox account, and to deposit any rents otherwise received in such account by the end of the first business day after receipt. During the continuance of a Cash Management Period (as defined below), all funds in the lockbox account are required to be swept periodically to a lender-controlled cash management account. Funds in the cash management account are required to be applied to debt service and the reserves and escrows described above, with any excess funds (i) to be deposited into an excess cash flow reserve account held by the lender as cash collateral for the Vero Office Portfolio Whole Loan, or (ii) if no Cash Management Period is continuing, absent a continuing event of default, disbursed to an operating account maintained by the borrowers.
“Cash Management Period” means any of the following periods: (i) the period from the commencement of a Trigger Period (as defined below) until the earlier to occur of the end of such Trigger Period or the indebtedness due under the Vero Office Portfolio Whole Loan documents is paid in full; or (ii) the period from the occurrence of an event of default until the earlier to occur of such event of default is waived by the lender or the indebtedness due under the Vero Office Portfolio Whole Loan documents is paid in full. A Cash Management Period will not be terminated unless, at the time the borrowers satisfy the conditions for termination of the applicable Cash Management Period as set forth in clause (i) or clause (ii) above, there is no continuing event of default and no other event has occurred which would cause an additional Cash Management Period as described above. In the event that a Cash Management Period is terminated as set forth in clause (i) or clause (ii) above, a Cash Management Period will be reinstated upon the subsequent occurrence of a Trigger Period or event of default.
A “Trigger Period” means (a) each period that (i) commences when DSCR, determined as of the first day of any two consecutive fiscal quarters, is less than 1.30x (each, a “DSCR Trigger Event”), and the borrowers have not timely made the cash deposit into an excess cash flow reserve account held by the lender or deposited with the lender a letter of credit following the lender’s notification of such DSCR Trigger Event as described in the loan agreement, and (ii) concludes when DSCR is equal to or greater than 1.35x as of the last day of two consecutive fiscal quarters thereafter, or when an appropriate deposit of cash is made to the excess cash flow reserve account held by the lender or a letter of credit is deposited with the lender as permitted pursuant to the loan agreement, whichever is earlier; and (b) if the financial reports required under the loan agreement are not delivered to the lender as and when required thereunder, subject, in any event to the notice and cure period specified in the loan agreement, a Trigger Period will be deemed to have commenced and be ongoing, unless and until such reports are delivered and they indicate that, in fact, no Trigger Period is ongoing under subsection (a) immediately above.
Subordinate Debt and Mezzanine Debt. None.
Permitted Future Debt. Not permitted.
Partial Release. Provided that no event of default is continuing under the Vero Office Portfolio Whole Loan documents, at any time after the date that is two years after the closing date of the BMO 2024-5C4 securitization, the borrowers may deliver defeasance collateral and obtain release of up to two individual Vero Office Portfolio Properties, provided that, among other conditions, (i) the borrowers deliver defeasance collateral in an amount equal to the allocated release price for each
THE INFORMATION IN THIS STRUCTURAL AND COLLATERAL TERM SHEET IS NOT COMPLETE AND MAY BE AMENDED PRIOR TO THE TIME OF SALE. THIS TERM SHEET IS NOT AN OFFER TO SELL THESE SECURITIES AND IT IS NOT A SOLICITATION OF AN OFFER TO BUY THESE SECURITIES IN ANY JURISDICTION WHERE THE OFFER OR SALE IS NOT PERMITTED. |
| | 84 | |
| Structural and Collateral Term Sheet | | BMO 2024-5C4 |
| No. 5 – Vero Office Portfolio |
released Vero Office Portfolio Property, (ii) the DSCR and the debt yield for the 12-month period ending on the last day of the then most recently ended fiscal quarter of the remaining Vero Office Portfolio Properties after such release is no less than (a) the greater of (x) 1.89x and (y) the DSCR immediately prior to such release and (b) the greater of (x) 15.68% and (y) the debt yield immediately prior to such release, as applicable, (iii) the loan-to-value ratio of the remaining Vero Office Portfolio Properties, as determined by a current or updated appraisal, is no more than the lesser of (x) 55.2% and (y) the loan-to-value ratio of the remaining Vero Office Portfolio Properties immediately prior to such release, (iv) the physical occupancy of each of the remaining Vero Office Portfolio Properties is not less than 85.0% and (v) customary REMIC requirements are satisfied. In addition, provided no event of default exists, the borrowers may obtain the release of an approximate four-acre parcel located at the Apex 190 Property that was attributed no value in the appraisal delivered to the lender as of the loan origination date, upon satisfaction of certain conditions set forth in the Vero Office Portfolio Whole Loan documents.
Ground Lease. None.
THE INFORMATION IN THIS STRUCTURAL AND COLLATERAL TERM SHEET IS NOT COMPLETE AND MAY BE AMENDED PRIOR TO THE TIME OF SALE. THIS TERM SHEET IS NOT AN OFFER TO SELL THESE SECURITIES AND IT IS NOT A SOLICITATION OF AN OFFER TO BUY THESE SECURITIES IN ANY JURISDICTION WHERE THE OFFER OR SALE IS NOT PERMITTED. |
| | 85 | |
| Structural and Collateral Term Sheet | | BMO 2024-5C4 |
| No. 6 – Coastline Apartments |
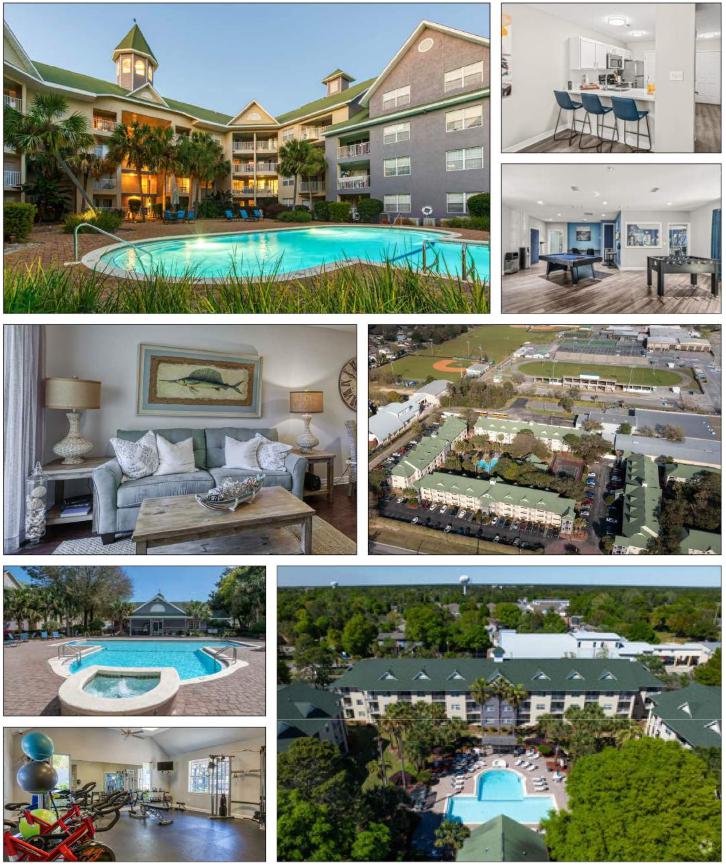
THE INFORMATION IN THIS STRUCTURAL AND COLLATERAL TERM SHEET IS NOT COMPLETE AND MAY BE AMENDED PRIOR TO THE TIME OF SALE. THIS TERM SHEET IS NOT AN OFFER TO SELL THESE SECURITIES AND IT IS NOT A SOLICITATION OF AN OFFER TO BUY THESE SECURITIES IN ANY JURISDICTION WHERE THE OFFER OR SALE IS NOT PERMITTED. |
| | 86 | |
| Structural and Collateral Term Sheet | | BMO 2024-5C4 |
| No. 6 – Coastline Apartments |
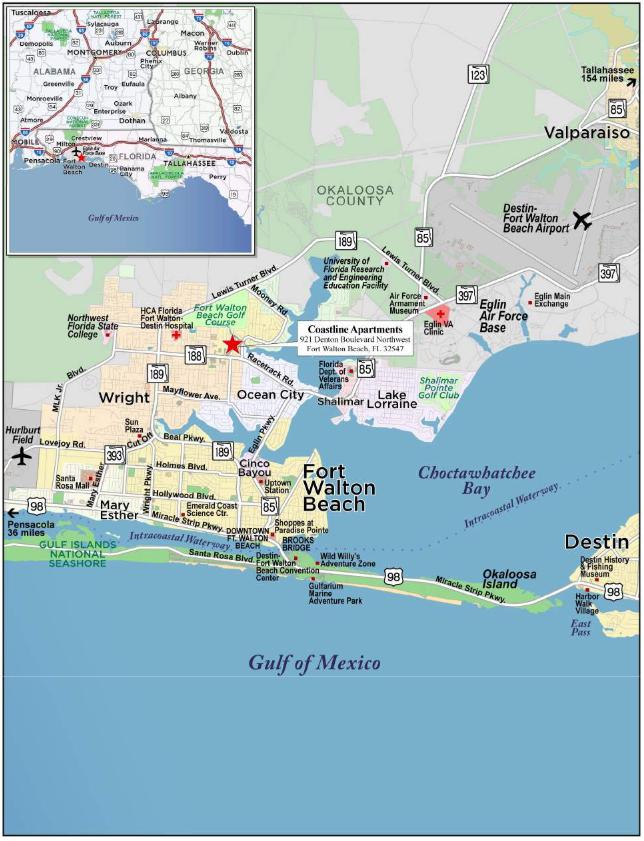
THE INFORMATION IN THIS STRUCTURAL AND COLLATERAL TERM SHEET IS NOT COMPLETE AND MAY BE AMENDED PRIOR TO THE TIME OF SALE. THIS TERM SHEET IS NOT AN OFFER TO SELL THESE SECURITIES AND IT IS NOT A SOLICITATION OF AN OFFER TO BUY THESE SECURITIES IN ANY JURISDICTION WHERE THE OFFER OR SALE IS NOT PERMITTED. |
| | 87 | |
| Structural and Collateral Term Sheet | | BMO 2024-5C4 |
| No. 6 – Coastline Apartments |
| Mortgage Loan Information | | Property Information |
| Mortgage Loan Seller: | AREF2, BMO | | Single Asset / Portfolio: | Single Asset |
| Original Principal Balance(1): | $38,000,000 | | Title: | Fee |
| Cut-off Date Principal Balance(1): | $38,000,000 | | Property Type – Subtype: | Multifamily – Garden |
| % of IPB: | 4.4% | | Net Rentable Area (Units): | 301 |
| Loan Purpose(2): | Recapitalization | | Location: | Fort Walton Beach, FL |
| Borrowers(3): | Various | | Year Built / Renovated: | 1989 / 2019 |
| Borrower Sponsor: | Ben Beitel | | Occupancy: | 97.3% |
| Interest Rate: | 5.75300% | | Occupancy Date: | 1/18/2024 |
| Note Date: | 1/31/2024 | | 4th Most Recent NOI (As of)(6): | NAV |
| Maturity Date: | 2/6/2029 | | 3rd Most Recent NOI (As of): | $3,383,114 (T-6 Ann. 12/31/2021) |
| Interest-only Period: | 60 months | | 2nd Most Recent NOI (As of): | $3,764,399 (12/31/2022) |
| Original Term: | 60 months | | Most Recent NOI (As of): | $4,420,779 (12/31/2023) |
| Original Amortization Term: | None | | UW Economic Occupancy: | 93.9% |
| Amortization Type: | Interest Only | | UW Revenues: | $6,225,121 |
| Call Protection: | L(27),D(29),O(4) | | UW Expenses: | $2,146,846 |
| Lockbox / Cash Management: | Springing / Springing | | UW NOI: | $4,078,275 |
| Additional Debt(1): | Yes | | UW NCF: | $3,996,102 |
| Additional Debt Balance(1)(4): | $11,500,000 / $10,000,000 | | Appraised Value / Per Unit: | $65,900,000 / $218,937 |
| Additional Debt Type(1)(4): | Mezzanine / Pari Passu | | Appraisal Date: | 1/3/2024 |
| | | | | |
| Escrows and Reserves(5) | | Financial Information(1) |
| | Initial | Monthly | Initial Cap | | | Whole Loan | Total Debt | |
| Taxes: | $207,833 | $51,958 | N/A | | Cut-off Date Loan / Unit: | $159,468 | $197,674 | |
| Insurance: | $80,244 | $40,122 | N/A | | Maturity Date Loan / Unit: | $159,468 | $197,674 | |
| Replacement Reserves: | $0 | $6,850 | N/A | | Cut-off Date LTV: | 72.8% | 90.3% | |
| Required Upgrade Reserve: | $500,000 | Springing | N/A | | Maturity Date LTV: | 72.8% | 90.3% | |
| | | | | | UW NCF DSCR: | 1.43x | 0.94x | |
| | | | | | UW NOI Debt Yield: | 8.5% | 6.9% | |
| | | | | | | | |
| Sources and Uses |
| Sources | Proceeds | % of Total | | Uses | Proceeds | % of Total |
| Whole Loan | $48,000,000 | 55.4 | % | | Recapitalization(2) | $80,000,000 | 92.3 | % |
| Equity Contribution(2) | 27,182,254 | 31.4 | | | Closing Costs(7) | 5,894,176 | 6.8 | |
| Mezzanine Loan | 11,500,000 | 13.3 | | | Upfront Reserves | 788,078 | 0.9 | |
| Total Sources | $86,682,254 | 100.0 | % | | Total Uses | $86,682,254 | 100.0 | % |
| (1) | The Coastline Apartments Mortgage Loan (as defined below) is part of the Coastline Apartments Whole Loan (as defined below) evidenced by three pari passu promissory notes in the aggregate original principal amount of $48,000,000. Financial Information in the table above is based on the Coastline Apartments Whole Loan and the Coastline Apartments Total Debt (as defined below) inclusive of $11,500,000 Mezzanine Loan. |
| (2) | The Coastline Apartments Mortgage Loan facilitated the buyout of an existing limited partner which contributed 90% of the original equity. |
| (3) | The borrowers are New Emerald Florida Apartments LLC, New Emerald Florida Apartments II LLC, New Emerald Florida Apartments III LLC, New Emerald Florida Apartments IV LLC and New Emerald Florida Apartments V LLC. |
| (4) | For a full description of the Coastline Apartments Mezzanine Loan (as defined below), please refer to “Mezzanine Debt” below. |
| (5) | For a full description of Escrows and Reserves, please refer to “Escrows and Reserves” below. |
| (6) | The 4th Most Recent NOI is not available as the borrower sponsor acquired the Coastline Apartments Property (as defined below) in June 2021. |
| (7) | Closing Costs include an origination fee of $4,000,000. |
The Loan. The sixth largest mortgage loan (the “Coastline Apartments Mortgage Loan”) is part of a whole loan evidenced by three pari passu promissory notes in the aggregate original principal amount of $48,000,000 (the “Coastline Apartments Whole Loan”) and is secured by the borrowers’ fee interest in a 301-unit, garden-style multifamily property consisting of nine apartment buildings and two clubhouse buildings located in Fort Walton Beach, Florida (the “Coastline Apartments Property”). The Coastline Apartments Whole Loan was originated on January 31, 2024 by Argentic Real Estate Finance 2 LLC (“AREF2”) and Bank of Montreal. The Coastline Apartments Whole Loan accrues interest at an interest rate of 5.75300% per annum on an Actual/360 basis. The Coastline Apartments Whole Loan has an original term of 60 months,
THE INFORMATION IN THIS STRUCTURAL AND COLLATERAL TERM SHEET IS NOT COMPLETE AND MAY BE AMENDED PRIOR TO THE TIME OF SALE. THIS TERM SHEET IS NOT AN OFFER TO SELL THESE SECURITIES AND IT IS NOT A SOLICITATION OF AN OFFER TO BUY THESE SECURITIES IN ANY JURISDICTION WHERE THE OFFER OR SALE IS NOT PERMITTED. |
| | 88 | |
| Structural and Collateral Term Sheet | | BMO 2024-5C4 |
| No. 6 – Coastline Apartments |
has a remaining term of 57 months and is interest only for the entire term. The scheduled maturity date of the Coastline Apartments Whole Loan is February 6, 2029.
The controlling Note A-1 and non-controlling Note A-2-2, with an aggregate original principal balance of $38,000,000, will be included in the BMO 2024-5C4 securitization trust. The Coastline Apartments Whole Loan is currently serviced pursuant to the pooling and servicing agreement for the BMARK 2024-V6 securitization trust, and on or after the closing date of the BMO 2024-5C4 securitization, the Coastline Apartments Whole Loan will be serviced pursuant to the pooling and servicing agreement for the BMO 2024-5C4 securitization trust. The relationship between the holders of the notes evidencing the Coastline Apartments Whole Loan will be governed by a co-lender agreement. See “The Pooling and Servicing Agreement” and “Description of the Mortgage Pool—The Whole Loans—The Serviced Pari Passu Whole Loans” in the Preliminary Prospectus.
| Whole Loan Summary |
| Note | Original Balance | Cut-off Date Balance | | Note Holder | Controlling Piece |
| A-1 | $24,000,000 | $24,000,000 | | BMO 2024-5C4 | Yes |
| A-2-1 | $10,000,000 | $10,000,000 | | Benchmark 2024-V6 | No |
| A-2-2 | $14,000,000 | $14,000,000 | | BMO 2024-5C4 | No |
| Whole Loan | $48,000,000 | $48,000,000 | | | |
The Property. The Coastline Apartments Property consists of a 301-unit, garden-style multifamily property on approximately 9.21 acres in Fort Walton Beach, Florida. The Coastline Apartments Property was built in 1989, and renovations were most recently completed in 2019. The unit mix includes studio, one-bedroom, two-bedroom, and three-bedroom floorplans. Community amenities include a clubhouse, business center, laundry facility, fitness center, three swimming pools, dry sauna, dog park, and package services. The Coastline Apartments Property has 460 surface parking spaces resulting in a ratio of approximately 1.53 parking spaces per unit.
Between 2015 and 2019, approximately $1.4 million was invested on exterior and interior renovations. Exterior renovations included new paint, pool resurfacing, fitness center upgrades, clubhouse renovations, and installing a dog park. Interior renovations included the renovations of 120 units or 40% of units, which were updated to include white shaker cabinets, quartz countertops, stainless steel appliances, and updated fixtures. The borrower sponsor plans to renovate most of the remaining 181 unrenovated units up to the same standard as the currently renovated units. Pursuant to the Coastline Apartments Whole Loan documents, the borrowers are required to renovate at least 75% of the units at the Coastline Apartments Property by February 6, 2028 or upon failure to do so, replenish the required upgrade reserve described below or enter a Cash Management Period (as defined below) to ensure there is a minimum of $14,000 per unit at the Coastline Apartments Property that has not received the required upgrades. The loan guarantors also provided a completion guaranty for the renovations of the 136 units based on an estimated renovation cost of $14,000 per unit, which burns off as units are upgraded. At origination, the borrower deposited $500,000 into a required upgrade reserve to be contributed towards the renovations and is required to replenish the required upgrade reserve (separate from the ongoing capital expenditure reserve) by $500 per rentable unit at the Coastline Apartments Property if the reserve balance falls below $200,000.
As of January 18, 2024, the Coastline Apartments Property was 97.3% occupied. Between 2021 and 2023, occupancy at the Coastline Apartments Property averaged 94.2%, never falling below 90.7%.
THE INFORMATION IN THIS STRUCTURAL AND COLLATERAL TERM SHEET IS NOT COMPLETE AND MAY BE AMENDED PRIOR TO THE TIME OF SALE. THIS TERM SHEET IS NOT AN OFFER TO SELL THESE SECURITIES AND IT IS NOT A SOLICITATION OF AN OFFER TO BUY THESE SECURITIES IN ANY JURISDICTION WHERE THE OFFER OR SALE IS NOT PERMITTED. |
| | 89 | |
| Structural and Collateral Term Sheet | | BMO 2024-5C4 |
| No. 6 – Coastline Apartments |
The following table presents detailed information with respect to the unit mix at the Coastline Apartments Property:
| Unit Mix Summary(1) |
| Unit Type | No. of Units | % of Total Units | Average Unit Size (SF) | Average Monthly Rental Rate per Unit(1) | Average Monthly Rental Rate per SF(1) | Average Monthly Market Rental Rate per Unit | Average Monthly Market Rental Rate per SF |
| Studio | 5 | 1.7 | % | 336 | $1,357 | $4.04 | $1,360 | $4.05 |
| 1 Bedroom | 84 | 27.9 | | 658 | $1,511 | $2.30 | $1,525 | $2.32 |
| 1 Bedroom - Renovated | 64 | 21.3 | | 599 | $1,635 | $2.73 | $1,645 | $2.75 |
| 2 Bedroom | 94 | 31.2 | | 1,002 | $1,715 | $1.71 | $1,719 | $1.71 |
| 2 Bedroom - Renovated | 50 | 16.6 | | 987 | $1,931 | $1.96 | $1,941 | $1.97 |
| 3 Bedroom | 3 | 1.0 | | 1,560 | $2,033 | $1.30 | $2,035 | $1.30 |
| 3 Bedroom - Renovated | 1 | 0.3 | | 1,560 | $2,294 | $1.47 | $2,300 | $1.47 |
| Total/Wtd. Avg. | 301 | 100.0 | % | 814 | $1,678 | $2.05 | $1,685 | $2.07 |
| (1) | Based on the underwritten rent roll as of January 18, 2024. Average Monthly Rental Rate per Unit and Average Monthly Rental Rate per SF reflect average monthly in-place rent for occupied units. |
Appraisal. According to the appraisal, the Coastline Apartments Property had an “as-is” appraised value of $65,900,000 as of January 3, 2024, as shown in the table below. Based on the “as-is” value of $65,900,000, the Cut-off Date LTV and Maturity Date LTV for the Coastline Apartments Whole Loan are 72.8%.
| Coastline Apartments Appraised Value(1) |
| Property | Value | Capitalization Rate |
| Coastline Apartments | $65,900,000 | 6.25% |
Environmental. According to the Phase I environmental assessment dated January 9, 2024, there was no evidence of any recognized environmental conditions at the Coastline Apartments Property.
The following table presents certain information relating to the historical and current occupancy of the Coastline Apartments Property:
| Historical and Current Multifamily Occupancy |
| 2021(1) | 2022(1) | 2023(1) | Current(2) |
| 95.1% | 92.3% | 95.3% | 97.3% |
| (1) | Historical occupancies are as of December 31 of each respective year. |
| (2) | Current occupancy is based on the underwritten rent roll dated as of January 18, 2024. |
THE INFORMATION IN THIS STRUCTURAL AND COLLATERAL TERM SHEET IS NOT COMPLETE AND MAY BE AMENDED PRIOR TO THE TIME OF SALE. THIS TERM SHEET IS NOT AN OFFER TO SELL THESE SECURITIES AND IT IS NOT A SOLICITATION OF AN OFFER TO BUY THESE SECURITIES IN ANY JURISDICTION WHERE THE OFFER OR SALE IS NOT PERMITTED. |
| | 90 | |
| Structural and Collateral Term Sheet | | BMO 2024-5C4 |
| No. 6 – Coastline Apartments |
The following table presents certain information relating to the operating history and underwritten cash flows of the Coastline Apartments Property:
| Operating History and Underwritten Net Cash Flow(1) |
| | 2021(2) | 2022 | TTM(3) | Underwritten | Per Unit | %(4) |
| Gross Potential Rent | $6,516,760 | $6,634,462 | $6,114,910 | $6,055,843 | | $20,119 | | 106.5 | % |
| (Vacancy/Concessions/Credit Loss) | (1,614,561) | (1,260,497) | (280,449) | (367,561) | | (1,221) | | (6.5 | ) |
| Net Rental Income | $4,902,199 | $5,373,966 | $5,834,461 | $5,688,282 | | $18,898 | | 100.0 | % |
| Other Income(5) | 285,089 | 384,803 | 536,839 | 536,839 | | 1,784 | | 9.4 | |
| Effective Gross Income | $5,187,288 | $5,758,768 | $6,371,300 | $6,225,121 | | $20,681 | | 109.4 | % |
| | | | | | | |
| Total Expenses | $1,804,174 | $1,994,369 | $1,950,521 | $2,146,846 | | $7,132 | | 34.5 | % |
| | | | | | | |
| Net Operating Income | $3,383,114 | $3,764,399 | $4,420,779 | $4,078,275 | | $13,549 | | 65.5 | % |
| | | | | | | |
| Replacement Reserve | 0 | 0 | 0 | 82,173 | | 273 | | 1.3 | |
| | | | | | | |
| Net Cash Flow | $3,383,114 | $3,764,399 | $4,420,779 | $3,996,102 | | $13,276 | | 64.2 | % |
| | | | | | | |
| | | | | | | |
| (1) | Historical cash flows were not provided for any year prior to 2021 because the borrower sponsor acquired the Coastline Apartments Property in June 2021. |
| (2) | Reflects the cash flows for the annualized trailing six-month period ending December 31, 2021. |
| (3) | TTM reflects the trailing 12 months ending December 31, 2023. |
| (4) | % column represents percent of Net Rental Income for revenue fields and represents percent of effective gross income for the remainder of fields. |
| (5) | Other Income includes utility reimbursement income and other miscellaneous fees. |
The Market. The Coastline Apartments Property is located in Fort Walton Beach, Florida approximately 6 miles north of Okaloosa Island. Primary access is provided by Denton Boulevard Northwest, State Route 189, and State Route 188. The economy in the surrounding area is primarily supported by tourism and military operations. The Fort Walton Beach area offers various recreational activities such as fishing, boating, and water sports, which contribute to demand for vacation rentals and second homes. The Coastline Apartments Property is approximately six miles north of Okaloosa Island, which offers public beach access and is home to a boardwalk, an aquarium, a fishing pier, and dozens of hotels and restaurants. Additionally, the Coastline Apartments Property is within proximity to military sites including Eglin Air Force Base and Hurlburt Field.
According to the appraisal, the 2023 estimated population within a one-, three-, and five-mile radius of the Coastline Apartments Property is 12,214, 58,150, and 76,871, respectively. According to the appraisal, the 2023 median household income within the same radii is $54,762, $60,654, and $62,737, respectively.
According to the appraisal, the Coastline Apartments Property is situated in the Okaloosa County submarket. As of the fourth quarter of 2023, the Okaloosa County submarket had an inventory of 10,759 units and an overall vacancy rate of 10.0%. The average rent per unit was $1,494. The appraiser concluded to market rents for the Coastline Apartments Property of $1,360 for studio units, $1,410-$1,920 for one-bedroom units, $1,680-$2,020 for two-bedroom units, and $2,035-$2,300 for three-bedroom units.
THE INFORMATION IN THIS STRUCTURAL AND COLLATERAL TERM SHEET IS NOT COMPLETE AND MAY BE AMENDED PRIOR TO THE TIME OF SALE. THIS TERM SHEET IS NOT AN OFFER TO SELL THESE SECURITIES AND IT IS NOT A SOLICITATION OF AN OFFER TO BUY THESE SECURITIES IN ANY JURISDICTION WHERE THE OFFER OR SALE IS NOT PERMITTED. |
| | 91 | |
| Structural and Collateral Term Sheet | | BMO 2024-5C4 |
| No. 6 – Coastline Apartments |
The following table presents certain information relating to comparable multifamily rental properties to the Coastline Apartments Property:
| Comparable Apartment Rentals(1) |
| Property / Location | Year Built | Total Units | Occupancy | Average Base Rent per Unit | Average Base Rent per Square Foot |
Coastline Apartments
Fort Walton Beach, FL | 1989 | 301 | 97.3%(2) | $1,678(2) | $2.05(2) |
The Cordelia
Fort Walton Beach, FL | 1985 | 124 | 70.0% | $1,875 | $1.70 |
Residences at Cypress Preserve
Fort Walton Beach, FL | 2009 | 178 | 89.0% | $1,806 | $1.75 |
Elan Apartments by ARIUM
Fort Walton Beach, FL | 2006 | 267 | 95.0% | $1,756 | $1.66 |
The Aria Apartments
Fort Walton Beach, FL | 1998 | 108 | 97.0% | $1,875 | $1.91 |
Crosswinds Apartments
Fort Walton Beach, FL | 2013 | 176 | 96.0% | $1,723 | $1.67 |
Renaissance at Santa Rosa
Mary Esther, FL | 2021 | 229 | 94.0% | $2,120 | $2.14 |
| (1) | Source: Appraisal, unless otherwise indicated. |
| (2) | Based on underwritten rent roll dated as of January 18, 2024. |
The Borrowers. The borrowers under the Coastline Apartments Whole Loan are New Emerald Florida Apartments LLC, New Emerald Florida Apartments II LLC, New Emerald Florida Apartments III LLC, New Emerald Florida Apartments IV LLC and New Emerald Florida Apartments V LLC collectively as tenants-in-common, each a special-purpose entity and Delaware limited liability company with two independent directors. Legal counsel to the borrowers delivered a non-consolidation opinion in connection with the origination of the Coastline Apartments Whole Loan.
The Borrower Sponsor. The borrower sponsor and non-recourse carveout guarantor is Ben Beitel. Ben Beitel is the CEO of Beitel Group. Beitel Group acquires and develops multifamily properties and other asset types with a focus on value-add opportunity. Ben Beitel’s current portfolio includes 35 properties across the Southeast, Midwest, and Northeast with a current valuation of approximately $2 billion.
Property Management. The Coastline Apartments Property is managed by Carroll Management Group, LLC, a third-party property manager.
Escrows and Reserves. At origination of the Coastline Apartments Whole Loan, the borrowers deposited (i) approximately $207,833 into a real estate tax reserve account, (ii) approximately $80,244 into an insurance reserve account and (iii) $500,000 into a required upgrade reserve.
Tax Escrows – On a monthly basis, the borrowers are required to escrow 1/12th of the annual estimated tax payments, which currently equates to approximately $51,958.
Insurance Escrows – On a monthly basis, the borrowers are required to escrow 1/12th of the annual estimated insurance payments, which currently equates to approximately $40,122.
Replacement Reserves – The borrowers are required to deposit into a replacement reserve, on a monthly basis, an amount equal to approximately $6,850.
Required Upgrade Reserve – If at any point the balance in the required upgrade reserve falls below $200,000, the borrowers are required to deposit an amount equal to $500 per rentable unit.
THE INFORMATION IN THIS STRUCTURAL AND COLLATERAL TERM SHEET IS NOT COMPLETE AND MAY BE AMENDED PRIOR TO THE TIME OF SALE. THIS TERM SHEET IS NOT AN OFFER TO SELL THESE SECURITIES AND IT IS NOT A SOLICITATION OF AN OFFER TO BUY THESE SECURITIES IN ANY JURISDICTION WHERE THE OFFER OR SALE IS NOT PERMITTED. |
| | 92 | |
| Structural and Collateral Term Sheet | | BMO 2024-5C4 |
| No. 6 – Coastline Apartments |
Lockbox / Cash Management. The Coastline Apartments Whole Loan is structured with a springing lockbox and springing cash management. Upon the first occurrence of a Cash Management Period, the borrowers will be required to establish and deposit all rents into a lockbox account with an eligible institution acceptable to the lender. In addition, the borrowers are required to cause all rents received by the borrowers or the property manager with respect to the Coastline Apartments Property to be deposited into such lockbox account within one business day of receipt. All amounts deposited into the lockbox account are required to be remitted to a lender-controlled cash management account on a daily basis to be applied and disbursed in accordance with the Coastline Apartments Whole Loan documents. During the continuance of a Cash Management Period, all amounts deposited into the lockbox account during the immediately preceding interest period will be applied on each payment date in accordance with the Coastline Apartments Whole Loan documents, and all excess cash flow funds will be deposited, during the continuance of a Cash Management Period, into the subordinate deposit account established under the mezzanine loan, or otherwise, held by the lender in a cash collateral subaccount as additional collateral for the Coastline Apartments Whole Loan.
A “Cash Management Period” will commence upon, on or after the calculation date in October 2024, (i) the stated maturity date, (ii) the occurrence of an event of default, (iii) the debt service coverage ratio for the Coastline Apartments Whole Loan as of the last day of any calendar quarter is less than 1.10x, (iv) the debt yield for the Coastline Apartments Whole Loan is less than 7.00%, or (v) the borrower fails to replenish the amounts into the required upgrade reserve when required in an amount equal to $14,000 per unit at the Coastline Apartments Property that has not received the required upgrades. A Cash Management Period will end when (A) with respect to clause (i) above, the Coastline Apartments Whole Loan and all other obligations have been paid in full, (B) with respect to clause (ii) above, such event of default has been cured and no other event of default is continuing, (C) with respect to clause (iii) above, the Coastline Apartments Property achieves a debt service coverage ratio of at least 1.15x for three months, (D) with respect to clause (iv) above, the Coastline Apartments Property achieves a debt yield of at least 7.25% for three months or (E) with respect to clause (v) above, the required upgrade reserve balance is an amount equal to $14,000 per unit at the Coastline Apartments Property that has not received the required upgrades.
Subordinate Debt. None.
Mezzanine Debt. PMRP V Coastline, L.L.C. originated a mezzanine loan (the “Coastline Apartments Mezzanine Loan”, and together with the Coastline Apartments Whole Loan, the “Coastline Apartments Total Debt”) in the amount of $11,500,000, secured by the direct equity ownership in the borrowers of the Coastline Apartments Whole Loan. The Coastline Apartments Mezzanine Loan is coterminous with the Coastline Apartments Whole Loan. The Coastline Apartments Mezzanine Loan accrues interest at a rate of 12.50000% per annum and requires interest-only payments until its maturity date. The lenders of the Coastline Apartments Whole Loan and the Coastline Apartments Mezzanine Loan have entered into an intercreditor agreement that governs their rights.
Partial Release. Not permitted.
Ground Lease. None.
THE INFORMATION IN THIS STRUCTURAL AND COLLATERAL TERM SHEET IS NOT COMPLETE AND MAY BE AMENDED PRIOR TO THE TIME OF SALE. THIS TERM SHEET IS NOT AN OFFER TO SELL THESE SECURITIES AND IT IS NOT A SOLICITATION OF AN OFFER TO BUY THESE SECURITIES IN ANY JURISDICTION WHERE THE OFFER OR SALE IS NOT PERMITTED. |
| | 93 | |
| Structural and Collateral Term Sheet | | BMO 2024-5C4 |
| No. 7 – Sheraton Park City |
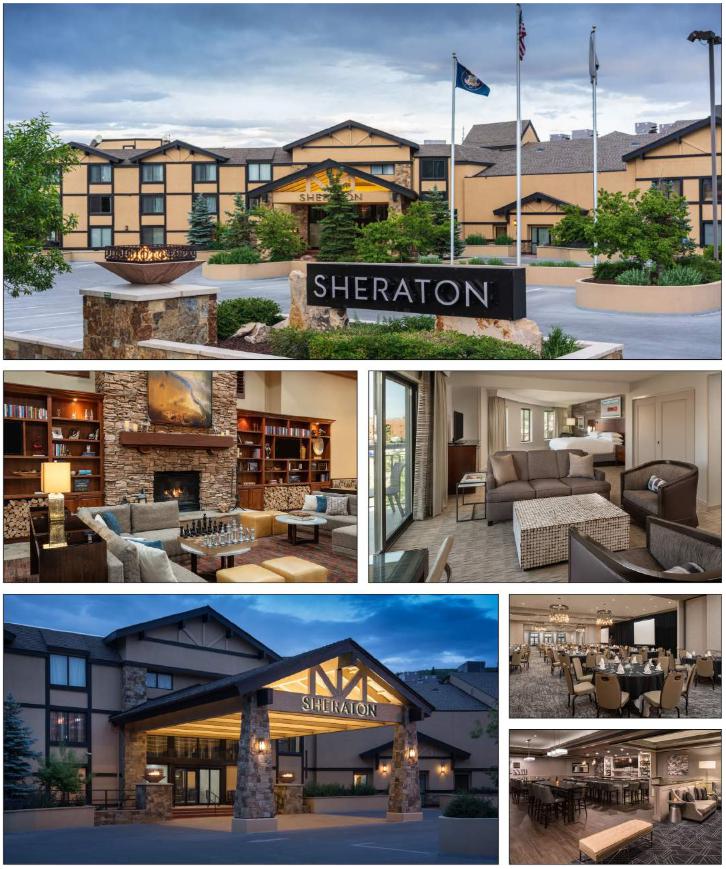
THE INFORMATION IN THIS STRUCTURAL AND COLLATERAL TERM SHEET IS NOT COMPLETE AND MAY BE AMENDED PRIOR TO THE TIME OF SALE. THIS TERM SHEET IS NOT AN OFFER TO SELL THESE SECURITIES AND IT IS NOT A SOLICITATION OF AN OFFER TO BUY THESE SECURITIES IN ANY JURISDICTION WHERE THE OFFER OR SALE IS NOT PERMITTED. |
| | 94 | |
| Structural and Collateral Term Sheet | | BMO 2024-5C4 |
| No. 7 – Sheraton Park City |
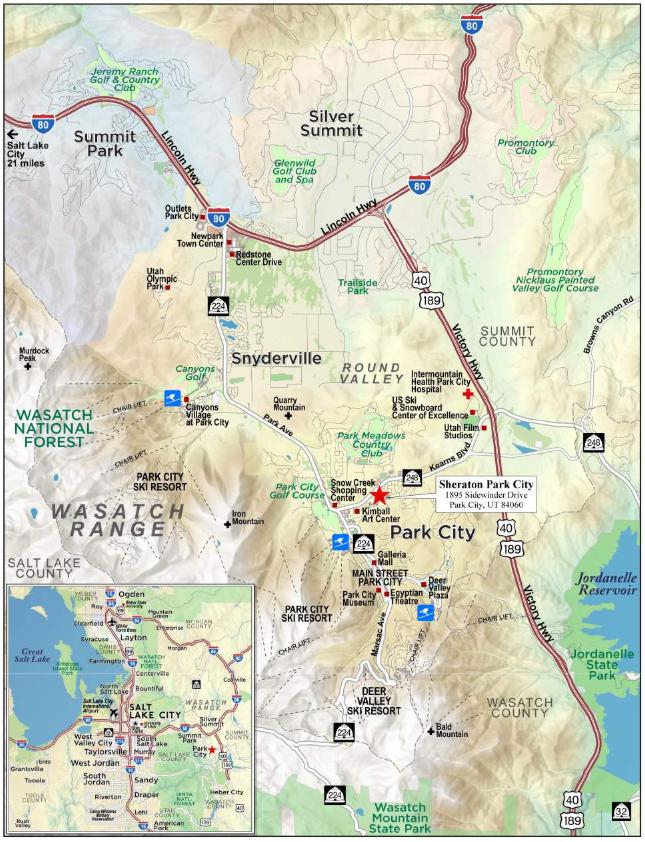
THE INFORMATION IN THIS STRUCTURAL AND COLLATERAL TERM SHEET IS NOT COMPLETE AND MAY BE AMENDED PRIOR TO THE TIME OF SALE. THIS TERM SHEET IS NOT AN OFFER TO SELL THESE SECURITIES AND IT IS NOT A SOLICITATION OF AN OFFER TO BUY THESE SECURITIES IN ANY JURISDICTION WHERE THE OFFER OR SALE IS NOT PERMITTED. |
| | 95 | |
| Structural and Collateral Term Sheet | | BMO 2024-5C4 |
| No. 7 – Sheraton Park City |
| Mortgage Loan Information | | Property Information |
| Mortgage Loan Seller: | GSMC | | Single Asset / Portfolio: | Single Asset |
| Original Principal Balance: | $33,000,000 | | Title: | Fee |
| Cut-off Date Principal Balance: | $33,000,000 | | Property Type - Subtype: | Hospitality – Full Service |
| % of Pool by IPB: | 3.8% | | Net Rentable Area (Rooms): | 200 |
| Loan Purpose: | Refinance | | Location: | Park City, UT |
| Borrower: | 1895 Sidewinder Park City Owner, LLC | | Year Built / Renovated: | 1985 / NAP |
| Borrower Sponsor: | Driftwood Acquisition & Development L.P. | | Occupancy / ADR / RevPAR: | 53.8% / $224.96 / $121.11 |
| Interest Rate: | 7.64000% | | Occupancy / ADR / RevPAR Date: | 2/29/2024 |
| Note Date: | 4/12/2024 | | 4th Most Recent NOI (As of): | $3,144,951 (12/31/2021) |
| Maturity Date: | 5/6/2029 | | 3rd Most Recent NOI (As of): | $4,607,053 (12/31/2022) |
| Interest-only Period: | 60 months | | 2nd Most Recent NOI (As of): | $4,428,112 (12/31/2023) |
| Original Term: | 60 months | | Most Recent NOI (As of): | $4,128,030 (TTM 2/29/2024) |
| Original Amortization: | None | | UW Occupancy / ADR / RevPAR: | 53.8% / $224.96 / $121.11 |
| Amortization Type: | Interest Only | | UW Revenues: | $12,447,965 |
| Call Protection: | L(24),D(29),O(7) | | UW Expenses: | $8,371,358 |
| Lockbox / Cash Management: | Hard / Springing | | UW NOI: | $4,076,607 |
| Additional Debt: | No | | UW NCF: | $3,578,688 |
| Additional Debt Balance: | N/A | | Appraised Value / Per Room: | $64,600,000 / $323,000 |
| Additional Debt Type: | N/A | | Appraisal Date: | 12/27/2023 |
| | | | | |
| Escrows and Reserves(1) | | Financial Information |
| | Initial | Monthly | Initial Cap | | Cut-off Date Loan / Room: | $165,000 |
| Taxes: | $107,639 | $15,377 | N/A | | Maturity Date Loan / Room: | $165,000 |
| Insurance: | $0 | Springing | N/A | | Cut-off Date LTV: | 51.1% |
| FF&E Reserves: | $0 | $46,805 | N/A | | Maturity Date LTV: | 51.1% |
| Engineering Reserve: | $415,990 | $0 | N/A | | UW NCF DSCR: | 1.40x |
| Seasonality Reserve: | $978,000 | $326,000 | $978,000 | | UW NOI Debt Yield: | 12.4% |
| | | | | | | |
| Sources and Uses |
| Sources | Proceeds | % of Total | | Uses | Proceeds | % of Total | |
| Mortgage Loan | $33,000,000 | 100.0 | % | | Loan Payoff | $19,668,611 | 59.6 | % |
| | | | | Equity Distribution | 10,422,375 | 31.6 | |
| | | | | Upfront Reserves | 1,501,629 | 4.6 | |
| | | | | Closing Costs(2) | 1,407,386 | 4.3 | |
| Total Sources | $33,000,000 | 100.0 | % | | Total Uses | $33,000,000 | 100.0 | % |
| (1) | For a full description of escrows and reserves, see “Escrows and Reserves” below. |
| (2) | Closing Costs include a rate buydown of $417,239. |
The Loan. The seventh largest mortgage loan (the “Sheraton Park City Mortgage Loan”) has an outstanding principal balance as of the Cut-off Date of $33,000,000 and is secured by the borrower’s fee interest in a 200-room, full service hotel located in Park City, Utah (the “Sheraton Park City Property”). The Sheraton Park City Mortgage Loan was originated on April 12, 2024 by Goldman Sachs Bank USA (“GS”). The Sheraton Park City Mortgage Loan has a 5-year term, with an interest-only period accruing interest at a rate of 7.64000% per annum on an Actual/360 basis.
THE INFORMATION IN THIS STRUCTURAL AND COLLATERAL TERM SHEET IS NOT COMPLETE AND MAY BE AMENDED PRIOR TO THE TIME OF SALE. THIS TERM SHEET IS NOT AN OFFER TO SELL THESE SECURITIES AND IT IS NOT A SOLICITATION OF AN OFFER TO BUY THESE SECURITIES IN ANY JURISDICTION WHERE THE OFFER OR SALE IS NOT PERMITTED. |
| | 96 | |
| Structural and Collateral Term Sheet | | BMO 2024-5C4 |
| No. 7 – Sheraton Park City |
The Property. The Sheraton Park City Property is a 200-room, full-service hotel located in Park City, Utah approximately 35 miles from Salt Lake International Airport. Park City is a ski destination with Park City/Canyons Resort and Deer Valley Resort less than 5 miles from the Sheraton Park City Property. The area is known for having the largest lift-accessible ski terrain in the United States and is also recognized for its Olympic legacy, home of the last games to be hosted on U.S. soil (2002) and is a candidate for the 2034 Winter Olympics.
Driftwood Hospitality purchased the Sheraton Park City Property in 2017 and has invested over $7.9 million (approximately $39,500 per key) since acquisition updating the Sheraton Park City Property. Post-acquisition, Driftwood reflagged the Sheraton Park City Property as a Sheraton and secured a long-term franchise agreement expiring in June 2037. The Sheraton Park City Property has 54 king rooms, 139 double rooms, and 7 suites. Amenities at the Sheraton Park City Property include an indoor atrium pool with hot tub and sauna, a youth game room, an on-site Starbucks, a gift shop and the Timbers Restaurant and Lounge with outside covered patio and fire pits. Guests have access to Park City via shuttle services to the historic Main Street and Park City Resorts. In addition to skiing, guests can enjoy tubing, snowmobiling, ATV rides, hiking, mountain biking, hot air balloon rides, fly fishing, golf, spas, restaurants, shopping, museums, and art galleries. The Sheraton Park City Property is one of the few hotels in the area able to capture group business with 12,349 SF of meeting space (nearly 7% of Park City’s meeting space). The Sheraton Park City Property is one of the headquarter hotels for the Sundance Film Festival (over 85,000 attendees in 2023).
Appraisal. According to the appraisal, the Sheraton Park City Property had an “as-is” appraised value of $64,600,000 as of December 27, 2023. The table below shows the appraisal’s “as-is” conclusions.
| Appraisal Valuation Summary(1) |
| Appraisal Approach | Appraised Value | Capitalization Rate |
| Income Capitalization Approach | $64,600,000 | 7.00% |
Environmental. According to the Phase I environmental assessment dated January 3, 2024, there is a controlled recognized environmental condition at the Sheraton Park City Property in connection with residual soil impacts, including lead and arsenic, resulting from former mining operations and a related tailings pond at the Sheraton Park City Property. According to the Phase I environmental site assessment, Park City enacted a soil ordinance for areas affected by former mining operations requiring cover over surface soils and landscaping to prevent exposure to the surface soils and associated dust. According to the Phase I environmental site assessment, Park City issued a certificate of compliance for the Sheraton Park City Property with the soil ordinance in 1989 and the development of the Sheraton Park City Property likely removed much of the surface soils. See “Description of the Mortgage Pool—Environmental Considerations” in the Preliminary Prospectus. No further action is recommended.
The Market. The Sheraton Park City Property is located in the Salt Lake City, UT lodging market, which consists of approximately 25,040 hotel rooms located primarily in Salt Lake County. The primary municipal feeder market is Salt Lake City, which has a population of approximately 1.6 million with an income per capita of $54,000 as of January 2023. This indicates that the feeder group size, which is the number of persons within a certain feeder market that are present for the sale of each room night, is 89 persons per sold room. The Park City submarket has consistently captured approximately 40% of the skier days in the state of Utah since 1996. Park City is considered to offer world class skiing, accommodations, dining and nightlife. The Sheraton Park City Property serves Deer Valley Resort and Park City Mountain Resort/The Canyons Village, which are annually ranked among the top three resorts in North America by industry publications. Several of the alpine ski events in the 2002 Salt Lake City Winter Olympics were hosted at Deer Valley and Park City resorts.
THE INFORMATION IN THIS STRUCTURAL AND COLLATERAL TERM SHEET IS NOT COMPLETE AND MAY BE AMENDED PRIOR TO THE TIME OF SALE. THIS TERM SHEET IS NOT AN OFFER TO SELL THESE SECURITIES AND IT IS NOT A SOLICITATION OF AN OFFER TO BUY THESE SECURITIES IN ANY JURISDICTION WHERE THE OFFER OR SALE IS NOT PERMITTED. |
| | 97 | |
| Structural and Collateral Term Sheet | | BMO 2024-5C4 |
| No. 7 – Sheraton Park City |
The following table presents certain information relating to the current and historical occupancy, ADR and RevPAR at the Sheraton Park City Property and its competitors:
| Historical Occupancy, ADR, RevPAR(1) |
| | Competitive Set(2) | Sheraton Park City | Penetration Factor |
| Year | Occupancy | ADR | RevPAR | Occupancy | ADR | RevPAR | Occupancy | ADR | RevPAR |
| 2020 | 39.1% | $200.95 | $78.48 | 42.3% | $182.47 | $77.13 | 108.2% | 90.8% | 98.3% |
| 2021 | 49.1% | $175.92 | $86.44 | 56.1% | $175.78 | $98.56 | 114.3% | 99.9% | 114.0% |
| 2022 | 53.8% | $218.28 | $117.38 | 57.5% | $217.89 | $125.37 | 106.9% | 99.8% | 106.8% |
| TTM(3) | 50.8% | $230.31 | $117.06 | 56.4% | $227.62 | $128.32 | 111.0% | 98.9% | 109.6% |
| (2) | The competitive set includes AC Hotels by Marriott Park City, Peaks Hotel Park City, DoubleTree by Hilton - The Yarrow, Grand Summit Hotel, a RockResort and Hyatt Place Park City. |
| (3) | TTM represents the trailing 12-month period ending November 30, 2023. |
The following table presents certain information with respect to the historical and underwritten cash flows of the Sheraton Park City Property:
Operating History and Underwritten Net Cash Flow |
| | 2019 | 2020 | 2021 | 2022 | 2023 | TTM(1) | Underwritten | Per Room(2) | %(3) |
| Occupancy | 62.3 | % | 42.3% | 56.1% | 57.5% | 55.8% | 53.8% | 53.8% | | |
| ADR | $182.93 | | $182.47 | $175.78 | $217.89 | $226.11 | $224.96 | $224.96 | | |
| RevPAR | $114.03 | | $77.13 | $98.56 | $125.37 | $126.06 | $121.11 | $121.11 | | |
| Room Revenue | $8,282,307 | | $5,617,656 | $7,194,585 | $9,151,904 | $9,202,332 | $8,865,314 | $8,841,091 | $44,205 | | 71.0% | |
| Food & Beverage Revenue | 2,123,228 | | 637,097 | 1,458,516 | 2,446,569 | 2,413,604 | 2,324,649 | 2,318,298 | 11,591 | | 18.6 | |
| Other Departmental Revenue | 1,125,923 | | 880,764 | 1,144,202 | 1,478,273 | 1,365,565 | 1,292,106 | 1,288,576 | 6,443 | | 10.4 | |
| Total Revenue | $11,531,459 | | $7,135,517 | $9,797,303 | $13,076,746 | $12,981,501 | $12,482,069 | $12,447,965 | $62,240 | | 100.0% | |
| Room Expense | 2,329,503 | | 1,412,670 | 1,767,476 | 2,293,086 | 2,212,240 | 2,170,139 | 2,164,209 | 10,821 | | 24.5 | |
| Food & Beverage Expenses | 1,544,802 | | 574,206 | 1,103,013 | 1,589,196 | 1,486,210 | 1,450,569 | 1,446,606 | 7,233 | | 62.4 | |
| Other Departmental Expenses | 152,852 | | 83,699 | 139,394 | 159,783 | 180,640 | 176,343 | 175,861 | 879 | | 13.6 | |
| Departmental Expenses | $4,027,156 | | $2,070,575 | $3,009,883 | $4,042,065 | $3,879,090 | $3,797,050 | $3,786,676 | $18,933 | | 30.4% | |
| Departmental Income | $7,504,303 | | $5,064,942 | $6,787,420 | $9,034,681 | $9,102,411 | $8,685,019 | $8,661,289 | $43,306 | | 69.6% | |
| Total Other Expenses(4) | $4,403,705 | | $2,916,943 | $3,642,469 | $4,427,628 | $4,674,299 | $4,556,988 | $4,584,682 | $22,923 | | 36.8% | |
| Net Operating Income | $3,100,598 | | $2,147,999 | $3,144,951 | $4,607,053 | $4,428,112 | $4,128,030 | $4,076,607 | $20,383 | | 32.7% | |
| FF&E | 461,258 | | 285,421 | 391,892 | 523,070 | 519,260 | 499,283 | 497,919 | 2,490 | | 4.0 | |
| Net Cash Flow | $2,639,339 | | $1,862,578 | $2,753,059 | $4,083,983 | $3,908,852 | $3,628,748 | $3,578,688 | $17,893 | | 28.7% | |
| (1) | TTM represents the trailing 12-month period ending February 29, 2024. |
| (2) | Per Room values are based on 200 rooms. |
| (3) | % column represents percent of Total Revenue except for Room Expense, Food & Beverage Expenses and Other Departmental Expenses, which are based on their corresponding revenue line items. |
| (4) | Total Other Expenses consists of administrative and general, information and telecommunications systems, sales and marketing, franchise fees, property operation and maintenance, utilities, base management fee, property and other taxes, insurance and other non-operating expenses. |
The Borrower. The borrower is 1895 Sidewinder Park City Owner, LLC, a Delaware limited liability company and special purpose entity with one independent director. Legal counsel to the borrower provided a non-consolidation opinion in connection with the origination of the Sheraton Park City Mortgage Loan.
The Borrower Sponsor. The borrower sponsor and guarantor is Driftwood Acquisition & Development L.P., an affiliate of Driftwood Capital, LLC (“Driftwood”). Driftwood is a commercial real estate investment, development, and lending platform specializing in the hospitality sector. The principals of Driftwood have over 30 years of experience in the hospitality industry. Driftwood currently operates 86 hotels with more than 16,500 rooms throughout the United States, the Bahamas and Costa Rica. Driftwood’s portfolio includes several brands that range from full-service hotels and resorts to midsize select-service, extended stay, and independent boutiques. Driftwood’s hotels include Marriott, Hilton, Hyatt, IHG and Wyndham flagged properties.
THE INFORMATION IN THIS STRUCTURAL AND COLLATERAL TERM SHEET IS NOT COMPLETE AND MAY BE AMENDED PRIOR TO THE TIME OF SALE. THIS TERM SHEET IS NOT AN OFFER TO SELL THESE SECURITIES AND IT IS NOT A SOLICITATION OF AN OFFER TO BUY THESE SECURITIES IN ANY JURISDICTION WHERE THE OFFER OR SALE IS NOT PERMITTED. |
| | 98 | |
| Structural and Collateral Term Sheet | | BMO 2024-5C4 |
| No. 7 – Sheraton Park City |
Property Management. The Sheraton Park City Property is managed by Driftwood Hospitality Management II, LLC, an affiliate of the borrower.
Escrows and Reserves. At origination, the borrower deposited approximately (i) $107,639 into a real estate tax reserve account, (ii) $415,990 into a required repairs account, to be used for certain designated repairs to the on-site parking garage and (iii) $978,000 into a seasonality reserve account.
Tax Escrows – On a monthly basis, the borrower is required to escrow 1/12th of the annual estimated tax payments, which currently equates to $15,376.94.
Insurance Escrows – On a monthly basis, the borrower is required to escrow 1/12th of the annual estimated insurance payments; however, such monthly insurance escrow is suspended so long as the borrower maintains a blanket policy acceptable to the lender and no event of default is ongoing, among other conditions. The monthly insurance escrow is currently suspended.
FF&E Reserves – On a monthly basis, the borrower is required to escrow an amount equal to 1/12th of 4% of annual gross revenues, which currently equates to $46,804.75.
Seasonality Reserve – On a monthly basis in March, April and May of each year, commencing in 2025, the borrower is required to deposit $326,000, subject to a cap of $978,000. The lender is required to disburse from the seasonality reserve to the borrower on the first business day in (i) the month of June, $380,000 and (ii) the months of January, February, July, August, September, October, November and December, $74,750.
Lockbox / Cash Management. The Sheraton Park City Mortgage Loan is structured with a hard lockbox and springing cash management. The borrower is required to cause all credit card receipts and other gross revenue to be deposited into the lender-controlled lockbox account. The borrower delivered direction letters to each of the credit card companies with which the borrower has entered into a merchants or other credit card receipt agreement instructing them to transfer all credit card receipts received with respect to the Sheraton Park City Property to the lockbox account. The borrower or property manager, as applicable, is required to deposit any credit card receipts or other gross revenue otherwise received from the Sheraton Park City Property into the lockbox account within two business days of receipt. On each business day, all funds in the lockbox account will be swept into the borrower’s operating account. Upon the occurrence and during the continuance of a Sheraton Park City Sweep Event Period (as defined below), all funds in the lockbox account are required to be swept daily to a cash management account under the control of the lender to be applied and disbursed in accordance with the Sheraton Park City Mortgage Loan documents, and all excess cash flow funds remaining in the cash management account after the application of such funds in accordance with the Sheraton Park City Mortgage Loan documents are required to be held by the lender in an excess cash flow reserve account as additional collateral for the Sheraton Park City Mortgage Loan. To the extent that no Sheraton Park City Sweep Event Period is continuing, all excess cash flow funds are required to be disbursed to the borrower.
A “Sheraton Park City Sweep Event Period” will commence upon the earliest of the following: (i) the occurrence of an event of default under the Sheraton Park City Mortgage Loan documents; (ii) the date on which the debt service coverage ratio is less than 1.30x based on the trailing 12 months; (iii) the expiration of the franchise agreement; (iv) a default under the franchise agreement; (v) the borrower or franchisor delivers notice of its intent to termination the franchise agreement; or (vi) the termination of the franchise agreement.
A Sheraton Park City Sweep Event Period will end: (a) with regard to clause (i), upon the cure of such event of default and the lender’s acceptance of such cure in its sole and absolute discretion; (b) with regard to clause (ii), upon the debt service coverage ratio based on the trailing 12-month period being at least 1.35x for two consecutive fiscal quarters; (c) with regard to clauses (iii), (iv), (v), and (vi), upon the borrower (x) entering into a qualified franchise agreement, (y) the term of the related franchise agreement commencing and (z) the borrower delivers to the lender a comfort letter from the franchisor; (d) with regard to clause (iv), upon the cure of such default; and (e) with regard to clause (v), upon the borrower or franchisor withdrawing its notice to terminate the franchise agreement.
Subordinate Debt. None.
THE INFORMATION IN THIS STRUCTURAL AND COLLATERAL TERM SHEET IS NOT COMPLETE AND MAY BE AMENDED PRIOR TO THE TIME OF SALE. THIS TERM SHEET IS NOT AN OFFER TO SELL THESE SECURITIES AND IT IS NOT A SOLICITATION OF AN OFFER TO BUY THESE SECURITIES IN ANY JURISDICTION WHERE THE OFFER OR SALE IS NOT PERMITTED. |
| | 99 | |
| Structural and Collateral Term Sheet | | BMO 2024-5C4 |
| No. 7 – Sheraton Park City |
Mezzanine Debt. From and after April 12, 2026, the borrower is permitted to obtain mezzanine debt from an acceptable mezzanine lender under the following conditions, among others: (a) minimum combined debt service coverage ratio of 1.40x, (b) aggregate maximum loan-to-value ratio of 75.0%, (c) the Sheraton Park City Property will have satisfied a minimum debt yield of 15.0% for at least two consecutive non-overlapping trailing 12 month calendar periods, (d) delivery of an intercreditor agreement satisfactory to the mortgage lender and (e) receipt of rating agency confirmation.
Partial Release. None.
Ground Lease. None.
THE INFORMATION IN THIS STRUCTURAL AND COLLATERAL TERM SHEET IS NOT COMPLETE AND MAY BE AMENDED PRIOR TO THE TIME OF SALE. THIS TERM SHEET IS NOT AN OFFER TO SELL THESE SECURITIES AND IT IS NOT A SOLICITATION OF AN OFFER TO BUY THESE SECURITIES IN ANY JURISDICTION WHERE THE OFFER OR SALE IS NOT PERMITTED. |
| | 100 | |
| Structural and Collateral Term Sheet | | BMO 2024-5C4 |
| No. 8 – McGaw Commerce Center |
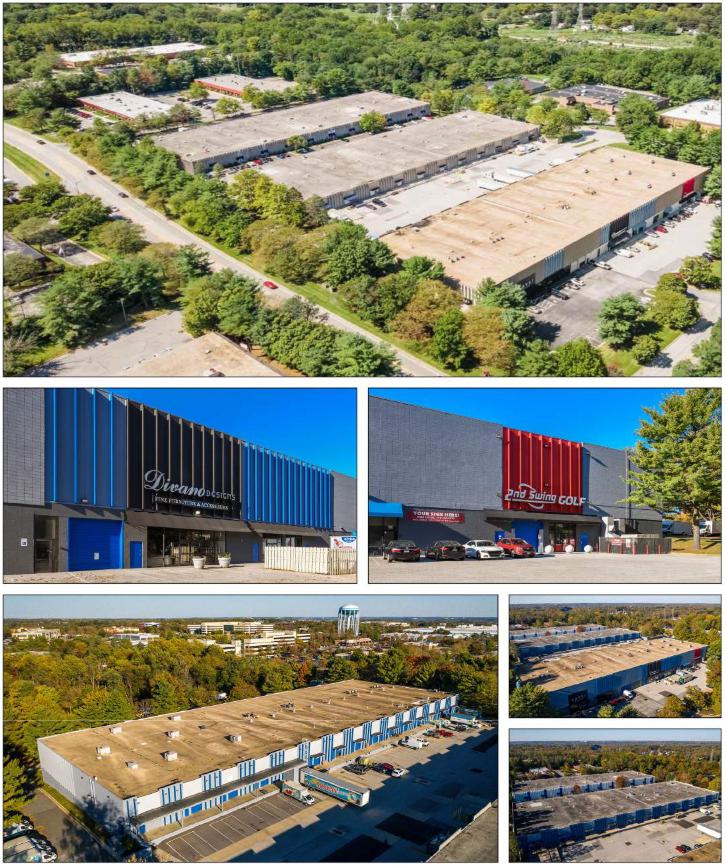
THE INFORMATION IN THIS STRUCTURAL AND COLLATERAL TERM SHEET IS NOT COMPLETE AND MAY BE AMENDED PRIOR TO THE TIME OF SALE. THIS TERM SHEET IS NOT AN OFFER TO SELL THESE SECURITIES AND IT IS NOT A SOLICITATION OF AN OFFER TO BUY THESE SECURITIES IN ANY JURISDICTION WHERE THE OFFER OR SALE IS NOT PERMITTED. |
| | 101 | |
| Structural and Collateral Term Sheet | | BMO 2024-5C4 |
| No. 8 – McGaw Commerce Center |
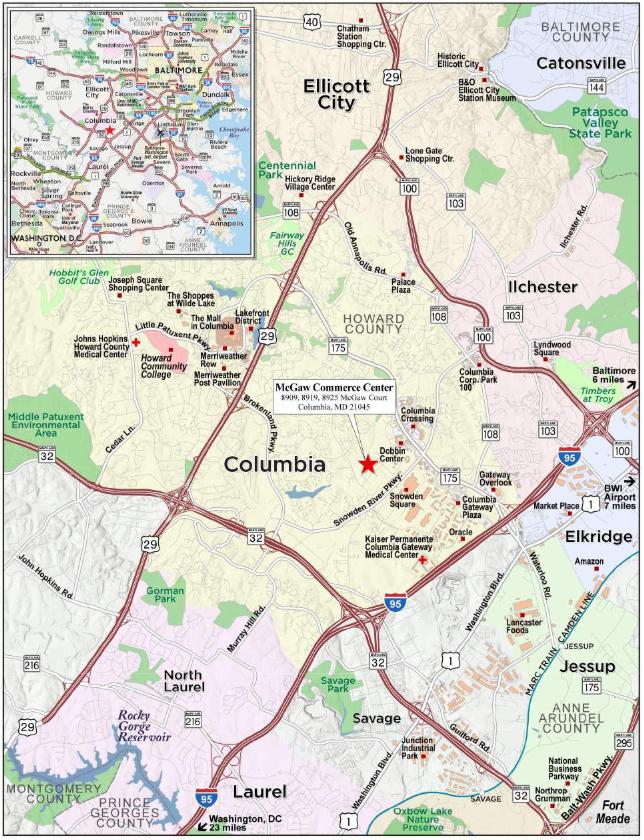
THE INFORMATION IN THIS STRUCTURAL AND COLLATERAL TERM SHEET IS NOT COMPLETE AND MAY BE AMENDED PRIOR TO THE TIME OF SALE. THIS TERM SHEET IS NOT AN OFFER TO SELL THESE SECURITIES AND IT IS NOT A SOLICITATION OF AN OFFER TO BUY THESE SECURITIES IN ANY JURISDICTION WHERE THE OFFER OR SALE IS NOT PERMITTED. |
| | 102 | |
| Structural and Collateral Term Sheet | | BMO 2024-5C4 |
| No. 8 – McGaw Commerce Center |
| Mortgage Loan Information | | Property Information |
| Mortgage Loan Seller: | AREF2 | | Single Asset / Portfolio: | Single Asset |
| Original Principal Balance: | $32,500,000 | | Title: | Fee |
| Cut-off Date Principal Balance: | $32,500,000 | | Property Type – Subtype: | Industrial – Flex |
| % of IPB: | 3.8% | | Net Rentable Area (SF): | 281,053 |
| Loan Purpose: | Refinance | | Location: | Columbia, MD |
| Borrower: | McGaw Court Holding LLC | | Year Built / Renovated: | 1974 / NAP |
| Borrower Sponsor: | Buligo Capital Partners Inc. | | Occupancy: | 94.6% |
| Interest Rate: | 6.82300% | | Occupancy Date: | 2/8/2024 |
| Note Date: | 3/22/2024 | | 4th Most Recent NOI (As of): | $1,427,562 (12/31/2020) |
| Maturity Date: | 4/6/2029 | | 3rd Most Recent NOI (As of): | $1,969,752 (12/31/2021) |
| Interest-only Period: | 60 months | | 2nd Most Recent NOI (As of)(3): | $1,770,919 (12/31/2022) |
| Original Term: | 60 months | | Most Recent NOI (As of)(3): | $2,876,464 (12/31/2023) |
| Original Amortization Term: | None | | UW Economic Occupancy: | 93.8% |
| Amortization Type: | Interest Only | | UW Revenues: | $3,356,173 |
| Call Protection: | L(25),D(28),O(7) | | UW Expenses: | $595,724 |
| Lockbox / Cash Management: | Hard / Springing | | UW NOI: | $2,760,449 |
| Additional Debt: | No | | UW NCF: | $2,732,344 |
| Additional Debt Balance: | NAP | | Appraised Value / Per SF: | $50,100,000 / $178 |
| Additional Debt Type: | NAP | | Appraisal Date: | 2/14/2024 |
| | | | | |
| Escrows and Reserves(1) | | Financial Information |
| | Initial | Monthly | Initial Cap | | Cut-off Date Loan / SF: | $116 |
| Taxes: | $240,403 | $30,050 | N/A | | Maturity Date Loan / SF: | $116 |
| Insurance: | $45,473 | $5,053 | N/A | | Cut-off Date LTV: | 64.9% |
| Replacement Reserves: | $0 | $2,342 | N/A | | Maturity Date LTV: | 64.9% |
| TI/LC Reserve: | $750,000 | $0 | N/A | | UW NCF DSCR: | 1.22x |
| Deferred Maintenance(2): | $377,313 | $0 | N/A | | UW NOI Debt Yield: | 8.5% |
| Outstanding TI/LC: | $40,000 | $0 | N/A | | | |
| | | | | | | |
| Sources and Uses |
| Sources | Proceeds | % of Total | | | Uses | Proceeds | % of Total |
| Mortgage Loan | $32,500,000 | 97.1 | % | | Loan Payoff | $30,013,899 | 89.7 | % |
| Sponsor Equity | 975,197 | 2.9 | | | Closing Costs(4) | 2,008,110 | 6.0 | |
| | | | | Upfront Reserves | 1,453,188 | 4.3 | |
| Total Sources | $33,475,197 | 100.0 | % | | Total Uses | $33,475,197 | 100.0 | % |
| (1) | For a full description of Escrows and Reserves, please refer to “Escrows and Reserves” below. |
| (2) | The Deferred Maintenance reserves include $345,000 which is allocated for roof replacements. The borrower is currently in negotiations with a prospective solar lease tenant for the placement of solar energy generating equipment on each rooftop. Pursuant to the prospective lease, the solar tenant would be required to replace the roofs at its own expense prior to the installation of its equipment and offset such expense against its rent. |
| (3) | The increase from 2nd Most Recent NOI to Most Recent NOI is primarily due to new and renewal leases signed in 2022 making up 38.3% of the net rentable area. |
| (4) | Closing Costs include an origination fee of $1,625,000. |
The Loan. The eighth largest mortgage loan (the “McGaw Commerce Center Mortgage Loan”) is secured by the borrower’s fee interest in a 281,053 square foot, industrial property located in Columbia, Maryland (the “McGaw Commerce Center Property”). The McGaw Commerce Center Mortgage Loan was originated on March 22, 2024 by Argentic Real Estate Finance 2 LLC. The McGaw Commerce Center Mortgage Loan accrues interest at an interest rate of 6.82300% per annum on an Actual/360 basis. The McGaw Commerce Center Mortgage Loan has an original term of 60 months, has a remaining term of 59 months and is interest only for the entire term. The scheduled maturity date of the McGaw Commerce Center Mortgage Loan is April 6, 2029.
The Property. The McGaw Commerce Center Property is a 281,053 square foot industrial flex property located in Columbia, Maryland approximately 16 miles southwest of Baltimore. The improvements consist of three single-story buildings constructed in 1974. Since the first quarter of 2022, the borrower sponsor has spent approximately $1.1 million on interior
THE INFORMATION IN THIS STRUCTURAL AND COLLATERAL TERM SHEET IS NOT COMPLETE AND MAY BE AMENDED PRIOR TO THE TIME OF SALE. THIS TERM SHEET IS NOT AN OFFER TO SELL THESE SECURITIES AND IT IS NOT A SOLICITATION OF AN OFFER TO BUY THESE SECURITIES IN ANY JURISDICTION WHERE THE OFFER OR SALE IS NOT PERMITTED. |
| | 103 | |
| Structural and Collateral Term Sheet | | BMO 2024-5C4 |
| No. 8 – McGaw Commerce Center |
and exterior renovations including white boxing various spaces, painting, and landscaping. The buildings contain approximately 20% office finish with the remaining rentable area consisting of warehouse space. The warehouse space features clear heights ranging from 17’ to 21’ and is served by 37 grade level overhead doors and five dock high doors. The McGaw Commerce Center Property also has 250 surface parking spaces, resulting in a parking ratio of 0.89 spaces per 1,000 square feet.
As of February 8, 2024, the McGaw Commerce Center Property was 94.6% leased to 13 office tenants. Between 2020 and 2023, occupancy at the McGaw Commerce Center Property averaged 92.4%. The average in place rents at the McGaw Commerce Center Property were approximately 12.4% below the concluded market rent in the appraisal.
Major Tenants.
BA Products (82,446 square feet; 29.3% of NRA; 37.3% of underwritten base rent). BA Products designs, develops, and distributes products used in the towing, fire rescue, industrial, and agricultural industries. The company offers a premium line of chain and wire rope assemblies along with straps, lighting, safety, and other truck accessories. BA Products utilizes the McGaw Commerce Center Property as its headquarters and for light manufacturing. BA Products has been a tenant at the McGaw Commerce Center Property since March 2014 when it signed a lease for 6,318 square feet. The tenant has expanded its square footage twice to its current footprint of 82,446 square feet and most recently signed a renewal on its entire 82,446 square feet of space, extending its lease expiration from September 2022 to September 2027. The tenant has no termination options, but has the right to downsize its space by 12,636 square feet effective as of September 30, 2025 by delivering written notice to the landlord on or prior to March 31, 2025. BA Products has one, five-year renewal option remaining.
KC Beauty & Cosmetics Columbia, Inc. (28,695 square feet; 10.2% of NRA; 9.1% of underwritten base rent). KC Beauty & Cosmetics Columbia, Inc. (“KC Beauty”) offers hundreds of brands of retail cosmetics as well as hair services, facials, and waxing. KC Beauty opened its first store in 1995 and has since grown to open seven stores in total. KC Beauty has been a tenant at the McGaw Commerce Center Property since May 2016 when it commenced a 126-month lease that expires in October 2026. The tenant has two, five-year renewal options remaining and no early termination options.
Utz Quality Foods, LLC (23,439 square feet; 8.3% of NRA; 5.9% of underwritten base rent). Utz Quality Foods, LLC (“Utz”) (NYSE: UTZ) produces a variety of potato chips, pretzels, and other snack foods, with most of the company’s distribution focused on the eastern United States. Utz has been a tenant at the McGaw Commerce Center Property since September 2018 when it commenced a 125-month lease that expires in January 2029. The tenant has two, five-year renewal options remaining and no early termination options.
Appraisal. According to the appraisal, the McGaw Commerce Center Property had an “as-is” appraised value of $50,100,000 as of February 14, 2024, as shown in the table below. Based on the “as-is” value of $50,100,000, the Cut-off Date LTV and Maturity Date LTV for the McGaw Commerce Center Mortgage Loan are 64.9%.
| McGaw Commerce Center Appraised Value(1) |
| Property | Value | Capitalization Rate |
| McGaw Commerce Center | $50,100,000 | 5.50% |
Environmental. According to the Phase I environmental assessment dated February 16, 2024, there was no evidence of any recognized environmental conditions at the McGaw Commerce Center Property.
The following table presents certain information relating to the historical and current occupancy of the McGaw Commerce Center Property:
| Historical and Current Occupancy(1) |
| 2020 | 2021 | 2022 | 2023 | Current(2) |
| 86.8% | 95.1% | 88.7% | 99.0% | 94.6% |
| (1) | Historical Occupancies are as of December 31 of each respective year. |
| (2) | Current Occupancy is based on the rent roll dated February 8, 2024. |
THE INFORMATION IN THIS STRUCTURAL AND COLLATERAL TERM SHEET IS NOT COMPLETE AND MAY BE AMENDED PRIOR TO THE TIME OF SALE. THIS TERM SHEET IS NOT AN OFFER TO SELL THESE SECURITIES AND IT IS NOT A SOLICITATION OF AN OFFER TO BUY THESE SECURITIES IN ANY JURISDICTION WHERE THE OFFER OR SALE IS NOT PERMITTED. |
| | 104 | |
| Structural and Collateral Term Sheet | | BMO 2024-5C4 |
| No. 8 – McGaw Commerce Center |
The following table presents certain information relating to the largest tenants based on underwritten base rent of the McGaw Commerce Center Property:
| Top Tenant Summary(1) |
| Tenant | Ratings Moody’s/S&P/Fitch | Net Rentable Area (SF) | % of
Total
NRA | UW Base Rent PSF | UW Base Rent | % of Total UW Base Rent | Lease Expiration Date |
| BA Products(2) | NR/NR/NR | 82,446 | | 29.3 | % | $12.65 | $1,042,758 | 37.3 | % | 9/30/2027 |
| KC Beauty & Cosmetics Columbia, Inc. | NR/NR/NR | 28,695 | | 10.2 | | $8.87 | 254,450 | 9.1 | | 10/31/2026 |
| Utz Quality Foods, LLC | NR/B/NR | 23,439 | | 8.3 | | $7.03 | 164,820 | 5.9 | | 1/31/2029 |
| Habitat for Humanity of the Chesapeake, Inc. | NR/NR/NR | 19,363 | | 6.9 | | $7.09 | 137,240 | 4.9 | | 6/30/2026 |
| Potomac Cricket Sports Club, LLC | NR/NR/NR | 18,954 | | 6.7 | | $10.38 | 196,760 | 7.0 | | 1/31/2027 |
| NAFA Express Transportation | NR/NR/NR | 18,759 | | 6.7 | | $11.36 | 213,042 | 7.6 | | 10/31/2027 |
| Seasons & Reasons | NR/NR/NR | 18,387 | | 6.5 | | $10.46 | 192,280 | 6.9 | | 6/30/2031 |
| Golfstix, Inc.(3) | NR/NR/NR | 14,549 | | 5.2 | | $10.61 | 154,365 | 5.5 | | 2/28/2029 |
| Carpentry & Hardware Services, Inc. | NR/NR/NR | 12,948 | | 4.6 | | $11.39 | 147,413 | 5.3 | | 10/31/2028 |
| Dazzle Premium, LLC | NR/NR/NR | 9,401 | | 3.3 | | $7.10 | 66,773 | 2.4 | | 7/31/2026 |
| Top Tenants | | 246,941 | | 87.9 | % | $10.41 | $2,569,900 | 92.0 | % | |
| Remaining Tenants | | 18,992 | | 6.8 | | $11.83 | 224,656 | 8.0 | | |
| Occupied Collateral Total / Wtd. Avg. | | 265,933 | | 94.6 | % | $10.51 | $2,794,556 | 100.0 | % | |
| Vacant Space | | 15,120 | | 5.4 | | | | | |
| Collateral Total | | 281,053 | | 100.0 | % | | | | |
| (1) | Based on underwritten rent roll dated February 8, 2024. Includes rent steps through November 2024. |
| (2) | BA Products has the right to downsize its space by 12,636 square feet effective as of September 30, 2025 by delivering written notice to the landlord on or prior to March 31, 2025. |
| (3) | Golfstix, Inc. has the right to terminate its lease effective February 28, 2027 by delivering written notice to the landlord at least 12 months prior to the termination. |
The following table presents certain information relating to the tenant lease expirations of the McGaw Commerce Center Property:
| Lease Rollover Schedule(1)(2) |
| Year | Number of Leases Expiring | NRA
Expiring | % of NRA
Expiring | UW Base
Rent
Expiring(3) | % of UW
Base Rent Expiring(3) | Cumulative
Net Rentable Area Expiring | Cumulative
% of NRA Expiring | Cumulative UW Base Rent Expiring(3) | Cumulative% of UW Base Rent Expiring(3) |
| Vacant | NAP | 15,120 | | 5 | .4% | NAP | NAP | 15,120 | | 5.4% | | NAP | NAP |
| 2024 & MTM | 0 | 0 | | 0 | | $0 | 0 | .0% | 15,120 | | 5.4% | | $0 | 0.0% | |
| 2025 | 1 | 6,356 | | 2 | .3 | 82,501 | 3 | .0 | 21,476 | | 7.6% | | $82,501 | 3.0% | |
| 2026 | 3 | 57,459 | | 20 | .4 | 458,462 | 16 | .4 | 78,935 | | 28.1% | | $540,963 | 19.4% | |
| 2027 | 4 | 126,477 | | 45 | .0 | 1,518,899 | 54 | .4 | 205,412 | | 73.1% | | $2,059,862 | 73.7% | |
| 2028 | 1 | 12,948 | | 4 | .6 | 147,413 | 5 | .3 | 218,360 | | 77.7% | | $2,207,275 | 79.0% | |
| 2029 | 3 | 44,306 | | 15 | .8 | 395,000 | 14 | .1 | 262,666 | | 93.5% | | $2,602,276 | 93.1% | |
| 2030 | 0 | 0 | | 0 | .0 | 0 | 0 | .0 | 262,666 | | 93.5% | | $2,602,276 | 93.1% | |
| 2031 | 1 | 18,387 | | 6 | .5 | 192,280 | 6 | .9 | 281,053 | | 100.0% | | $2,794,556 | 100.0% | |
| 2032 | 0 | 0 | | 0 | | 0 | 0 | | 281,053 | | 100.0% | | $2,794,556 | 100.0% | |
| 2033 | 0 | 0 | | 0 | | 0 | 0 | | 281,053 | | 100.0% | | $2,794,556 | 100.0% | |
| 2034 | 0 | 0 | | 0 | | 0 | 0 | | 281,053 | | 100.0% | | $2,794,556 | 100.0% | |
| 2035 & Beyond | 0 | 0 | | 0 | | 0 | 0 | | 281,053 | | 100.0% | | $2,794,556 | 100.0% | |
| Total | 13 | 281,053 | | 100 | .0% | $2,794,556 | 100 | .0% | | | | |
| (1) | Based on the underwritten rent roll dated February 8, 2024. |
| (2) | Certain leases may have termination options that are exercisable prior to the originally stated expiration date of the lease and that are not considered in this Lease Rollover Schedule. |
| (3) | UW Base Rent Expiring, % of UW Base Rent Expiring, Cumulative UW Base Rent Expiring and Cumulative % of UW Base Rent Expiring are comprised of contractual rent steps through November 2024. |
THE INFORMATION IN THIS STRUCTURAL AND COLLATERAL TERM SHEET IS NOT COMPLETE AND MAY BE AMENDED PRIOR TO THE TIME OF SALE. THIS TERM SHEET IS NOT AN OFFER TO SELL THESE SECURITIES AND IT IS NOT A SOLICITATION OF AN OFFER TO BUY THESE SECURITIES IN ANY JURISDICTION WHERE THE OFFER OR SALE IS NOT PERMITTED. |
| | 105 | |
| Structural and Collateral Term Sheet | | BMO 2024-5C4 |
| No. 8 – McGaw Commerce Center |
The following table presents certain information relating to the operating history and underwritten cash flows of the McGaw Commerce Center Property:
| Operating History and Underwritten Net Cash Flow |
| | 2020 | 2021 | 2022 | 2023 | Underwritten | Per
Square Foot | %(1) |
| Commercial Rent(2) | $1,465,593 | $2,017,353 | $1,882,177 | $2,771,897 | $2,794,556 | | $9.94 | | 83.3 | % |
| Reimbursements | 351,274 | 534,185 | 393,524 | 728,900 | 559,673 | | 1.99 | | 16.7 | |
| Vacancy Gross Up | 0 | 0 | 0 | 0 | 220,415 | | 0.78 | | 6.6 | |
| Gross Potential Rent | $1,816,867 | $2,551,538 | $2,275,701 | $3,500,797 | $3,574,643 | | $12.72 | | 106.6 | % |
| (Vacancy/Abatements/Credit Loss) | (31,602) | (49,092) | (4,825) | (11,869) | (220,415) | | (0.78 | ) | (6.6 | ) |
| Net Rental Income | $1,785,265 | $2,502,446 | $2,270,876 | $3,488,928 | $3,354,229 | | $11.93 | | 100.0 | % |
| Other Income | 29,473 | 11,788 | 0 | 1,944 | 1,944 | | 0.01 | | 0.1 | |
| Effective Gross Income | $1,814,738 | $2,514,234 | $2,270,876 | $3,490,872 | $3,356,173 | | $11.94 | | 100.1 | % |
| Total Expenses | 387,175 | 544,482 | 499,958 | 614,409 | 595,724 | | 2.12 | | 17.8 | |
| Net Operating Income(3) | $1,427,562 | $1,969,752 | $1,770,919 | $2,876,464 | $2,760,449 | | $9.82 | | 82.2 | % |
| Capital Expenditures | 0 | 0 | 0 | 0 | 28,105 | | 0.10 | | 0.8 | |
| TI / LC | 0 | 0 | 0 | 0 | 0 | | 0.00 | | 0.0 | |
| Net Cash Flow | $1,427,562 | $1,969,752 | $1,770,919 | $2,876,464 | $2,732,344 | | $9.72 | | 81.4 | % |
| (1) | % column represents percent of Net Rental Income for all revenue lines and represents percent of Effective Gross Income for the remainder of the fields. |
| (2) | Commercial Rent is based on the underwritten rent roll dated February 8, 2024 and includes approximately $85,260 of contractual rent steps through November 2024. |
| (3) | The increase from 2nd Most Recent NOI to Most Recent NOI is primarily due to new and renewal leases signed in 2022 making up 38.3% of the net rentable area. |
The Market. The McGaw Commerce Center Property is located in Columbia, Maryland approximately 16 miles southwest of Baltimore. Primary access is provided by Interstate 95 and Route 32. The Columbia area is characterized by high income levels and home values compared to the overall Baltimore metropolitan area. The neighborhood surrounding the McGaw Commerce Center Property consists of a mixture of commercial and residential development, and contains approximately 20 million square feet of office, industrial, and flex inventory located within several business parks. The McGaw Commerce Center Property is located in a primary commercial node of Columbia, and is located within 1.5 miles of a Walmart, Home Depot, Wegmans, Hobby Lobby and BJ’s.
According to the appraisal, the 2023 estimated population within a one-, three-, and five-mile radius of the McGaw Commerce Center Property is 7,142, 97,723, and 218,368, respectively. According to the appraisal, the 2023 median household income within the same radii is $136,729, $120,687, and $127,198, respectively.
According to a third-party market research report, the McGaw Commerce Center Property is located in the Columbia South warehouse submarket. As of the fourth quarter of 2023, the Columbia South warehouse submarket reported total inventory of approximately 11.7 million square feet with a 4.7% vacancy rate and average asking rent of $13.46 PSF. The appraisal concluded a market rent of $12.00 per square foot NNN for the flex space and $10.50 per square foot NNN for the warehouse space at the McGaw Commerce Center Property.
THE INFORMATION IN THIS STRUCTURAL AND COLLATERAL TERM SHEET IS NOT COMPLETE AND MAY BE AMENDED PRIOR TO THE TIME OF SALE. THIS TERM SHEET IS NOT AN OFFER TO SELL THESE SECURITIES AND IT IS NOT A SOLICITATION OF AN OFFER TO BUY THESE SECURITIES IN ANY JURISDICTION WHERE THE OFFER OR SALE IS NOT PERMITTED. |
| | 106 | |
| Structural and Collateral Term Sheet | | BMO 2024-5C4 |
| No. 8 – McGaw Commerce Center |
The following table presents information relating to comparable retail leases for the McGaw Commerce Center Property:
| Comparable Industrial Leases(1) |
| Property / Location | Tenant SF | Year Built / Renovated | Tenant | Rent PSF | Commencement Date | Lease Term (Yrs.) | Lease Type |
| McGaw Commerce Center | 82,446(2) | 1974 / NAP | BA Products | $12.65(2) | Oct-22(2) | 5.0(2) | NNN(2) |
| Columbia, MD |
| Washington Industrial Property | 9,000 | 1988 / NAP | Revamped, LLC | $11.10 | May-24 | 5.0 | NNN |
| Savage, MD |
| Northrop Grumman Facility | 93,996 | 1989 / NAP | Northrop Grumman Systems Corporation | $14.25 | Dec-22 | 10.0 | NNN |
| Annapolis Junction, MD |
| Patuxent Woods | 3,404 | 1986 / NAP | Synergy ECP | $13.50 | May-22 | 5.3 | NNN |
| Columbia, MD |
| Multi-tenant Warehouse | 26,200 | 1987 / NAP | Mom's Organic Market, LLC | $9.00 | Apr-22 | 5.3 | NNN |
| Elkridge, MD |
| RREEF Columbia Flex | 36,308 | 1999 / NAP | Convergint | $13.50 | Feb-22 | 8.8 | NNN |
| Columbia, MD |
| (1) | Source: Appraisal unless otherwise indicated. |
| (2) | Based on the underwritten rent roll dated February 8, 2024. |
The Borrower. The borrower for the McGaw Commerce Center Mortgage Loan is McGaw Court Holding LLC, a single purpose Delaware limited liability company with one independent director. Legal counsel to the borrower delivered a non-consolidation opinion in connection with the origination of the McGaw Commerce Center Mortgage Loan.
The Borrower Sponsor. The borrower sponsor and non-recourse carveout guarantor is Buligo Capital Partners Inc. Buligo Capital Partners Inc. is a global real estate investment firm whose portfolio in the United States consists of 55 properties valued at approximately $2.2 billion.
Property Management. The McGaw Commerce Center Property is managed by Jones Lang LaSalle Americas, Inc.
Escrows and Reserves. At origination, the borrower was required to deposit (i) $240,403 into a real estate tax reserve, (ii) $45,473 into an insurance premium reserve, (iii) $377,313 into an immediate repairs reserve, (iv) $750,000 into a TI/LC reserve, and (v) $40,000 into an outstanding TI/LC reserve.
Tax Escrows – On a monthly basis, the borrower is required to escrow 1/12th of the annual estimated tax payments, which currently equates to $30,050.
Insurance Escrows – On a monthly basis, the borrower is required to escrow 1/12th of the annual estimated insurance premiums, which currently equates to approximately $5,053. The borrower will not be obligated to make such deposits into the insurance escrow if, among other things, the McGaw Commerce Center Property is insured pursuant to an acceptable blanket insurance policy in accordance with the McGaw Commerce Center Mortgage Loan documents.
Replacement Reserves – On a monthly basis, the borrower is required to escrow approximately $2,342 for replacement reserves (which equates to $0.10 per square foot annually).
Lockbox / Cash Management. The McGaw Commerce Center Mortgage Loan is structured with a hard lockbox and springing cash management. The borrower is required to cause all rents to be transmitted directly by tenants at the McGaw Commerce Center Property into a lender-controlled lockbox account. In addition, the borrower is required to cause all rents received by the borrower or the property manager with respect to the McGaw Commerce Center Property to be deposited into such lockbox account within two business days of receipt. All amounts in the lockbox account are required to be remitted on a daily basis to the borrower’s operating account at any time other than during the continuance of a Cash Management Period (as defined below). Upon the occurrence and during the continuance of a Cash Management Period, all amounts are required to be remitted to a lender-controlled cash management account on a daily basis to be applied and disbursed in accordance with the McGaw Commerce Center Mortgage Loan documents. During the continuance of a Cash Management Period, all excess cash flow funds remaining in the cash management account after the application of such funds in accordance with the McGaw Commerce Center Mortgage Loan documents will be held by the lender, during the continuance of a Cash Management Period continuing solely as a result of a Trigger Lease Sweep Period (as defined below), in a special rollover reserve subaccount, or otherwise in a cash collateral subaccount as additional collateral for the McGaw Commerce Center Mortgage Loan.
THE INFORMATION IN THIS STRUCTURAL AND COLLATERAL TERM SHEET IS NOT COMPLETE AND MAY BE AMENDED PRIOR TO THE TIME OF SALE. THIS TERM SHEET IS NOT AN OFFER TO SELL THESE SECURITIES AND IT IS NOT A SOLICITATION OF AN OFFER TO BUY THESE SECURITIES IN ANY JURISDICTION WHERE THE OFFER OR SALE IS NOT PERMITTED. |
| | 107 | |
| Structural and Collateral Term Sheet | | BMO 2024-5C4 |
| No. 8 – McGaw Commerce Center |
A “Cash Management Period” means the period commencing upon the occurrence of (i) the stated maturity date, (ii) an event of default, (iii) the debt service coverage ratio falls below 1.10x as of the last day of any calendar quarter, or (iv) the commencement of a Trigger Lease Sweep Period. A Cash Management Period will end (a) with respect to the matters described in clause (i) above, the McGaw Commerce Center Mortgage Loan and all other obligations under the loan documents have been repaid in full, (b) with respect to the matters described in clause (ii) above, such event of default has been cured and no other event of default has occurred and is continuing, (c) with respect to the matters described in clause (iii) above, the debt service coverage ratio is at least 1.15x as of the last day of any calendar quarter for two consecutive calendar quarters, or (d) with respect to clause (iv) above, such Trigger Lease Sweep Period has ended.
A “Trigger Lease Sweep Period” commences upon the occurrence of any of the following: (i) the earlier of (a) the date that is 9 months prior to the end of the term of any Trigger Lease (as defined below) (including any renewal terms) or (b) the date the applicable tenant under a Trigger Lease actually gives notice of its intention not to renew or extend; (ii) the date required under a Trigger Lease by which the applicable tenant is required to give notice of its exercise of a renewal option thereunder (and such renewal has not been so exercised) or the date that any tenant under a Trigger Lease gives notice of its intention not to renew or extend its Trigger Lease; (iii) any Trigger Lease (or any material portion thereof) is surrendered, cancelled, or terminated prior to its then current expiration date or any tenant under a Trigger Lease gives notice of its intention to terminate, surrender, or cancel their lease (or any material portion thereof); (iv) any tenant under a Trigger Lease has discontinued its business in any material portion of its premises or gives notice that it intends to do the same; (v) the occurrence and continuance (beyond any applicable notice and cure periods) of a monetary or material non-monetary default under a Trigger Lease by the applicable tenant thereunder; or (vi) the occurrence of an insolvency or bankruptcy proceeding, among other things, by any tenant under a Trigger Lease, its parent company or the lease guarantor under a Trigger Lease, as described in the McGaw Commerce Center Mortgage Loan documents (“Trigger Tenant Insolvency Proceeding”).
A Trigger Lease Sweep Period ends upon the earlier to occur of (y) the determination by the lender that sufficient funds have been accumulated in the special rollover reserve subaccount to pay for all anticipated expenses in connection with the re-leasing of the space under the applicable lease(s) that gave rise to the subject Trigger Lease Sweep Period, including brokerage commissions and tenant improvements, and any anticipated shortfalls of payments required under the loan documents during any period of time that rents are insufficient as a result of down-time or free rent periods, or (z) the occurrence of any of the following: (1) with respect to a Trigger Lease Sweep Period caused by a matter described in clauses (i), (ii), (iii) or (iv) above, upon the earlier to occur of (A) the date on which the subject tenant irrevocably exercises its renewal or extension option (or otherwise enters into an extension agreement with the borrower and acceptable to the lender) with respect to all of the space demised under its Trigger Lease and (B) the date on which at least 75% of the space (which leases account for not less than 100% of the rents from the applicable Trigger Lease) demised under the subject Trigger Lease that gave rise to the subject Trigger Lease Sweep Period has been fully leased pursuant to a replacement lease or replacement leases approved by the lender, and all approved leasing expenses (and any other expenses in connection with the re-tenanting of such space) have been paid in full; (2) with respect to a Trigger Lease Sweep Period caused by a matter described in clause (v) above, if the subject tenant default has been cured, and no other tenant default has occurred for a period of six consecutive months following such cure; or (3) with respect to a Trigger Lease Sweep Period caused by a matter described in clause (vi) above, if the applicable Lease Sweep Tenant Insolvency Proceeding has terminated and the applicable Trigger Lease has been affirmed, assumed or assigned.
“Trigger Lease” means any lease that covers 40,000 or more rentable square feet at the McGaw Commerce Center Property.
Subordinate and Mezzanine Debt. None.
Permitted Future Debt. Not permitted.
Ground Lease. None.
THE INFORMATION IN THIS STRUCTURAL AND COLLATERAL TERM SHEET IS NOT COMPLETE AND MAY BE AMENDED PRIOR TO THE TIME OF SALE. THIS TERM SHEET IS NOT AN OFFER TO SELL THESE SECURITIES AND IT IS NOT A SOLICITATION OF AN OFFER TO BUY THESE SECURITIES IN ANY JURISDICTION WHERE THE OFFER OR SALE IS NOT PERMITTED. |
| | 108 | |
| Structural and Collateral Term Sheet | | BMO 2024-5C4 |
| No. 9 – Kenwood Towne Centre |
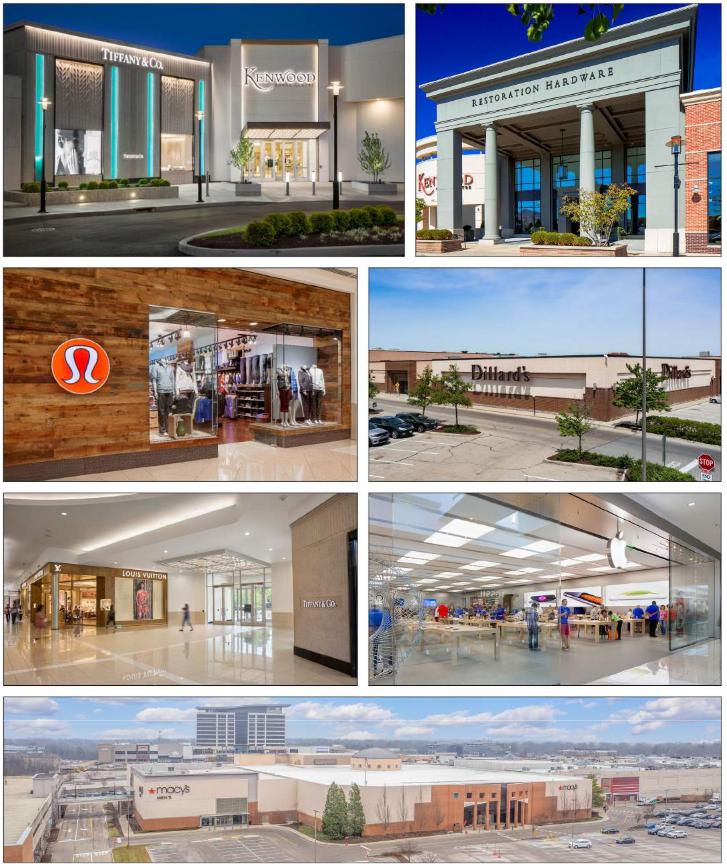
THE INFORMATION IN THIS STRUCTURAL AND COLLATERAL TERM SHEET IS NOT COMPLETE AND MAY BE AMENDED PRIOR TO THE TIME OF SALE. THIS TERM SHEET IS NOT AN OFFER TO SELL THESE SECURITIES AND IT IS NOT A SOLICITATION OF AN OFFER TO BUY THESE SECURITIES IN ANY JURISDICTION WHERE THE OFFER OR SALE IS NOT PERMITTED. |
| | 109 | |
| Structural and Collateral Term Sheet | | BMO 2024-5C4 |
| No. 9 – Kenwood Towne Centre |
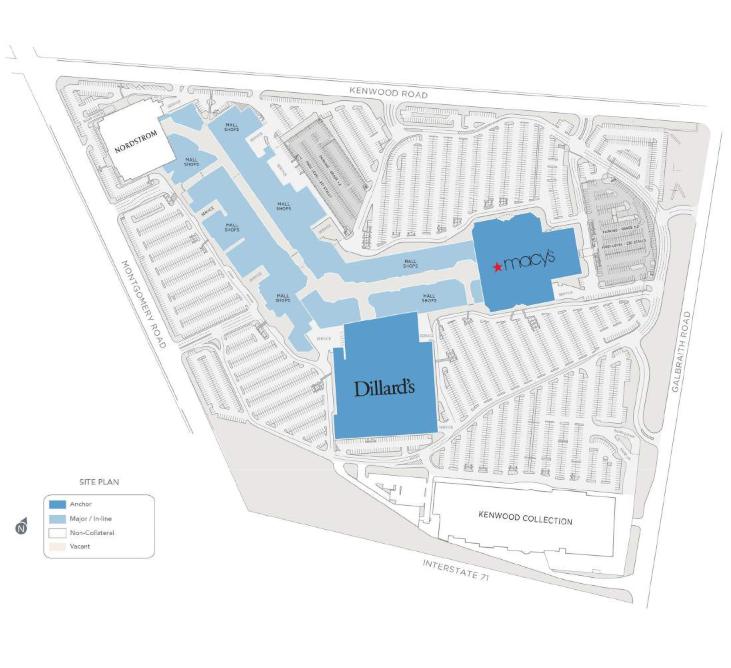
THE INFORMATION IN THIS STRUCTURAL AND COLLATERAL TERM SHEET IS NOT COMPLETE AND MAY BE AMENDED PRIOR TO THE TIME OF SALE. THIS TERM SHEET IS NOT AN OFFER TO SELL THESE SECURITIES AND IT IS NOT A SOLICITATION OF AN OFFER TO BUY THESE SECURITIES IN ANY JURISDICTION WHERE THE OFFER OR SALE IS NOT PERMITTED. |
| | 110 | |
| Structural and Collateral Term Sheet | | BMO 2024-5C4 |
| No. 9 – Kenwood Towne Centre |
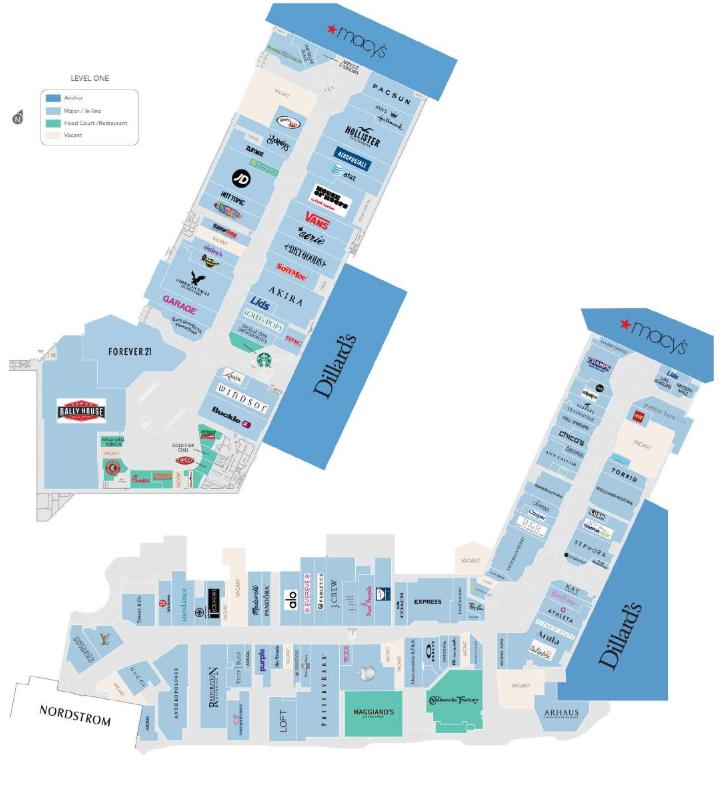
THE INFORMATION IN THIS STRUCTURAL AND COLLATERAL TERM SHEET IS NOT COMPLETE AND MAY BE AMENDED PRIOR TO THE TIME OF SALE. THIS TERM SHEET IS NOT AN OFFER TO SELL THESE SECURITIES AND IT IS NOT A SOLICITATION OF AN OFFER TO BUY THESE SECURITIES IN ANY JURISDICTION WHERE THE OFFER OR SALE IS NOT PERMITTED. |
| | 111 | |
| Structural and Collateral Term Sheet | | BMO 2024-5C4 |
| No. 9 – Kenwood Towne Centre |

THE INFORMATION IN THIS STRUCTURAL AND COLLATERAL TERM SHEET IS NOT COMPLETE AND MAY BE AMENDED PRIOR TO THE TIME OF SALE. THIS TERM SHEET IS NOT AN OFFER TO SELL THESE SECURITIES AND IT IS NOT A SOLICITATION OF AN OFFER TO BUY THESE SECURITIES IN ANY JURISDICTION WHERE THE OFFER OR SALE IS NOT PERMITTED. |
| | 112 | |
| Structural and Collateral Term Sheet | | BMO 2024-5C4 |
| No. 9 – Kenwood Towne Centre |
| Mortgage Loan Information | | Property Information |
| Mortgage Loan Sellers: | WFB | | Single Asset / Portfolio: | Single Asset |
| Original Principal Balance(1): | $30,000,000 | | Title: | Fee |
| Cut-off Date Principal Balance(1): | $30,000,000 | | Property Type – Subtype: | Retail – Super Regional Mall |
| % of IPB: | 3.5% | | Net Rentable Area (SF): | 1,033,141 |
| Loan Purpose: | Refinance | | Location: | Cincinnati, OH |
| Borrower: | Kenwood Mall L.L.C. | | Year Built / Renovated: | 1958 / 1988, 2003, 2009, 2019-2023 |
| Borrower Sponsors(2): | Brookfield Properties Retail Holding LLC and Teachers' Retirement System of the State of Illinois | | Occupancy: | 95.2% |
| Interest Rate: | 6.27100% | | Occupancy Date: | 12/31/2023 |
| Note Date: | 2/9/2024 | | 4th Most Recent NOI (As of): | $33,864,264 (12/31/2020) |
| Maturity Date: | 3/1/2029 | | 3rd Most Recent NOI (As of)(6): | $33,772,475 (12/31/2021) |
| Interest-only Period: | 60 months | | 2nd Most Recent NOI (As of)(6): | $37,154,574 (12/31/2022) |
| Original Term: | 60 months | | Most Recent NOI (As of): | $37,685,851 (12/31/2023) |
| Original Amortization Term: | None | | UW Economic Occupancy: | 92.8% |
| Amortization Type: | Interest Only | | UW Revenues: | $50,721,444 |
| Call Protection(3): | L(26),D(27),O(7) | | UW Expenses: | $12,770,752 |
| Lockbox / Cash Management: | Hard / Springing | | UW NOI: | $37,950,692 |
| Additional Debt(1): | Yes | | UW NCF: | $36,139,189 |
| Additional Debt Balance(1): | $230,000,000 | | Appraised Value / Per SF: | $571,200,000 / $553 |
| Additional Debt Type(1): | Pari Passu | | Appraisal Date: | 1/23/2024 |
| | | | | |
| Escrows and Reserves(4) | | Financial Information(1) |
| | Initial | Monthly | Initial Cap | | Cut-off Date Loan / SF: | $252 | |
| Taxes: | $0 | Springing | N/A | | Maturity Date Loan / SF: | $252 | |
| Insurance: | $0 | Springing | N/A | | Cut-off Date LTV: | 45.5% | |
| Replacement Reserves: | $0 | Springing | $516,571 | | Maturity Date LTV: | 45.5% | |
| TI/LC Reserve: | $0 | $129,143 | $3,099,423 | | UW NCF DSCR: | 2.19x | |
| Other Reserves(5): | $3,966,953 | $0 | N/A | | UW NOI Debt Yield: | 14.6% | |
| | | | | | | |
| Sources and Uses |
| Sources | Proceeds | % of Total | | Uses | Proceeds | % of Total |
| Whole Loan | $260,000,000 | 100.0% | | Loan Payoff | $211,601,763 | 81.4 | % |
| | | | | Return of Equity | 41,225,744 | 15.9 | |
| | | | | Upfront Reserves | 3,966,953 | 1.5 | |
| | | | | Closing Costs | 3,205,539 | 1.2 | |
| Total Sources | $260,000,000 | 100.0% | | Total Uses | $260,000,000 | 100.0 | % |
| (1) | The Kenwood Towne Centre Mortgage Loan (as defined below) is part of a whole loan comprised of 11 pari passu promissory notes, with an aggregate original principal balance and Cut-off Date Balance of $260,000,000 (the “Kenwood Towne Centre Whole Loan”). The Kenwood Towne Centre Whole Loan was co-originated by Wells Fargo Bank, National Association (“WFB”), Goldman Sachs Bank USA (“GS”) and Societe Generale Financial Corporation (“SGFC”). The Financial Information in the chart above is based on the aggregate outstanding principal balance as of the Cut-off Date of the Kenwood Towne Centre Whole Loan. |
| (2) | Brookfield Properties Retail Holding LLC, one of the borrower sponsors, is related to the borrower sponsor for the Staten Island Mall Whole Loan. |
| (3) | The lockout period will be at least 26 payment dates beginning with and including the first payment date on April 1, 2024. Defeasance of the Kenwood Towne Centre Whole Loan in full is permitted at any time after the earlier to occur of (i) the date that is two years from the closing date of the securitization that includes the last pari passu note of the Kenwood Towne Centre Whole Loan to be securitized and (ii) February 9, 2027. The assumed lockout period of 26 payment dates is based on the expected BMO 2024-5C4 securitization closing date in May 2024. The actual lockout period may be longer. |
| (4) | For a full description of escrows and reserves, please refer to “Escrows and Reserves” below. |
| (5) | Other initial escrows and reserves consist of approximately $3,732,395 for an existing TI/LC reserve and approximately $234,558 for a gap rent reserve. |
| (6) | The increase in NOI from 2021 to 2022 is primarily attributed to the borrower sponsor signing new leases and lease renewals during 2021 and 2022 for approximately 21 tenants with associated underwritten rents (8.2% of Total Collateral NRA (as defined below) and 20.1% of the underwritten base rent). |
The Loan. The Kenwood Towne Centre mortgage loan (the “Kenwood Towne Centre Mortgage Loan”) is part of a whole loan secured by the borrower’s fee interest in the Kenwood Towne Centre, a super regional mall located in Cincinnati, Ohio (the “Kenwood Towne Centre Property”). The Kenwood Towne Centre Whole Loan is comprised of 11 pari passu notes, with an aggregate outstanding principal balance as of the Cut-off Date of $260,000,000 and accrues interest at a rate of
THE INFORMATION IN THIS STRUCTURAL AND COLLATERAL TERM SHEET IS NOT COMPLETE AND MAY BE AMENDED PRIOR TO THE TIME OF SALE. THIS TERM SHEET IS NOT AN OFFER TO SELL THESE SECURITIES AND IT IS NOT A SOLICITATION OF AN OFFER TO BUY THESE SECURITIES IN ANY JURISDICTION WHERE THE OFFER OR SALE IS NOT PERMITTED. |
| | 113 | |
| Structural and Collateral Term Sheet | | BMO 2024-5C4 |
| No. 9 – Kenwood Towne Centre |
6.27100% per annum. The Kenwood Towne Centre Whole Loan has a five-year term, is interest-only for the full term of the loan and accrues interest on an Actual/360 basis. The Kenwood Towne Centre Mortgage Loan is evidenced by the non-controlling Notes A-1-3 and A-1-4, with an aggregate outstanding principal balance as of the Cut-off Date of $30,000,000. The Kenwood Towne Centre Whole Loan was co-originated by WFB, GS and SGFC. The relationship between the holders of the Kenwood Towne Centre Whole Loan is governed by a co-lender agreement as described under the “Description of the Mortgage Pool—The Whole Loans—The Outside Serviced Pari Passu Whole Loans” in the Preliminary Prospectus. The Kenwood Towne Centre Whole Loan will initially be serviced pursuant to the pooling and servicing agreement for the BBCMS 2024-5C25 securitization trust; however, following the securitization of the controlling Note A-1-1, the Kenwood Towne Centre Whole Loan will be serviced pursuant to the pooling and servicing agreement for BANK5 Trust 2024-5YR6 transaction. See “The Pooling and Servicing Agreement—Servicing of Outside Serviced Mortgage Loans” in the Preliminary Prospectus.
The promissory notes comprising the Kenwood Towne Centre Whole Loan are summarized in the below table:
| Whole Loan Summary |
| Note | Original Balance | Cut-off Date Balance | | Note Holder | Controlling Piece |
| A-1-1(1) | $55,000,000 | $55,000,000 | | BANK5 Trust 2024-5YR6 | Yes |
| A-1-2-A(1) | $15,000,000 | $15,000,000 | | BANK5 Trust 2024-5YR6 | No |
| A-1-2-B(2) | $30,000,000 | $30,000,000 | | WFB | No |
| A-1-3 | $20,000,000 | $20,000,000 | | BMO 2024-5C4 | No |
| A-1-4 | $10,000,000 | $10,000,000 | | BMO 2024-5C4 | No |
| A-2-1 | $40,000,000 | $40,000,000 | | Benchmark 2024-V6 | No |
| A-2-2 | $15,000,000 | $15,000,000 | | Benchmark 2024-V6 | No |
| A-2-3 | $10,000,000 | $10,000,000 | | Benchmark 2024-V6 | No |
| A-3-1 | $30,000,000 | $30,000,000 | | BBCMS 2024-5C25 | No |
| A-3-2 | $20,000,000 | $20,000,000 | | BBCMS 2024-5C25 | No |
| A-3-3(2) | $15,000,000 | $15,000,000 | | SGFC | No |
| Whole Loan | $260,000,000 | $260,000,000 | | | |
| (1) | The BANK5 Trust 2024-5YR6 transaction is expected to close on May 6, 2024. |
| (2) | Expected to be contributed to one or more future securitization trust(s). |
The Property. The Kenwood Towne Centre Property is a three-story, Class A super regional mall, comprising an approximately 1,033,141 square foot (the “Total Collateral NRA”) portion of a larger 1,170,977 square foot (the “Total Mall NRA”) center situated on an approximately 154-acre site in Cincinnati, Ohio. Kenwood Towne Centre was built in 1958 and renovated multiple times between 1988 and 2023 and is anchored by (i) Macy’s, which owns its improvements and ground leases the underlying land from the borrower, (ii) Dillard’s and (iii) Nordstrom, which owns its improvements and the underlying land and is not part of the collateral. Other notable retailers include Louis Vuitton, Gucci, Tiffany & Co., Apple, Pottery Barn, Lululemon Athletica and Restoration Hardware.
As of December 31, 2023, the Kenwood Towne Centre Property was 95.2% occupied by 129 tenants (including temporary tenants, comprising approximately 2.7% of the Total Collateral NRA and 0.0% of the underwritten base rent). Since 2019, the borrower sponsors have invested over $30.0 million into the Kenwood Towne Centre Property for renovations and capital improvements including HVAC repairs, roof repairs, escalator repairs, pavement restoration, garage restoration, camera replacements and irrigation system upgrades among other improvements to individual tenant spaces. In-line sales for tenants comprising less than 10,000 square feet as of December 2023 were $1,018 per square foot (10.8% occupancy cost) including Apple and $779 per square foot (13.8% occupancy cost) excluding Apple. The Kenwood Towne Centre Property provides parking via 5,881 surface parking and parking garage spaces, resulting in a parking ratio of approximately 5.02 spaces per 1,000 square feet of the Total Mall NRA.
Major Tenants.
Apple (9,383 square feet; 0.9% of Total Collateral NRA; 4.3% of underwritten base rent): Apple is a retailer that designs, manufactures and markets smartphones, personal computers, tablets, wearables and accessories, and sells a variety of related services. Apple has been a tenant at the Kenwood Towne Centre Property since 2001 under a lease with an expiration date of January 31, 2026 and no renewal options or termination options.
Altar’D State/Arula/Tulla (12,838 square feet; 1.2% of Total Collateral NRA; 3.3% of underwritten base rent): Altar’D State/Arula/Tulla operates within the Stand Out For Good, Inc. parent company, which is a purpose-based, lifestyle and
THE INFORMATION IN THIS STRUCTURAL AND COLLATERAL TERM SHEET IS NOT COMPLETE AND MAY BE AMENDED PRIOR TO THE TIME OF SALE. THIS TERM SHEET IS NOT AN OFFER TO SELL THESE SECURITIES AND IT IS NOT A SOLICITATION OF AN OFFER TO BUY THESE SECURITIES IN ANY JURISDICTION WHERE THE OFFER OR SALE IS NOT PERMITTED. |
| | 114 | |
| Structural and Collateral Term Sheet | | BMO 2024-5C4 |
| No. 9 – Kenwood Towne Centre |
fashion family of brands that was founded in 2009 and operates 176 stores and boutiques across its three brands in 38 states. Altar'D State/Arula/Tulla has been a tenant at the Kenwood Towne Centre Property since opening in 2022 under a lease with an expiration date of March 31, 2032, with one, five-year renewal option remaining and a termination option that is exercisable if the tenant’s net sales fail to exceed $7,509,607 during the period between either December 1, 2026 and November 30, 2027 or December 1, 2027 and November 30, 2028, along with payment of a termination fee.
Pottery Barn (15,913 square feet; 1.5% of Total Collateral NRA; 2.4% of underwritten base rent): Pottery Barn is a home furnishing retailer that was founded in 1948 and operates 184 stores as of 2023. Pottery Barn is a wholly owned subsidiary of Williams-Sonoma, Inc. Pottery Barn has been a tenant at the Kenwood Towne Centre Property since 2003 under a lease with an expiration date of January 31, 2030 and has no renewal or termination options.
Appraisal. According to the appraisal, Kenwood Towne Centre Property had an “as-is” appraised value of $571,200,000 as of January 23, 2024. The table below shows the appraiser’s “as-is” conclusions.
| Appraisal Valuation Summary(1) |
| Appraisal Approach | Appraised Value | Capitalization Rate(2) |
| Income Capitalization Approach | $571,200,000 | 6.50% |
| (2) | The appraiser used an income capitalization approach to arrive at the appraised value. The capitalization rate shown above represents the overall capitalization rate. |
Environmental. According to the Phase I environmental assessment dated January 17, 2024, there was no evidence of any recognized environmental conditions at the Kenwood Towne Centre Property.
The following table presents certain information relating to the historical occupancy of the Kenwood Towne Centre Property:
| Historical and Current Occupancy |
| 2020(1) | 2021(1) | 2022(1) | Current(2)(3) |
| 90.6% | 93.9% | 96.1% | 95.2% |
| (1) | Historical Occupancies are as of December 31 of each respective year and includes temporary tenants. Historical Occupancies do not include net rentable area for anchor tenants and the non-collateral anchor tenant. |
| (2) | Current Occupancy excluding the anchor tenants and the non-collateral anchor tenant is 90.6%. |
| (3) | Current Occupancy is as of December 31, 2023 |
THE INFORMATION IN THIS STRUCTURAL AND COLLATERAL TERM SHEET IS NOT COMPLETE AND MAY BE AMENDED PRIOR TO THE TIME OF SALE. THIS TERM SHEET IS NOT AN OFFER TO SELL THESE SECURITIES AND IT IS NOT A SOLICITATION OF AN OFFER TO BUY THESE SECURITIES IN ANY JURISDICTION WHERE THE OFFER OR SALE IS NOT PERMITTED. |
| | 115 | |
| Structural and Collateral Term Sheet | | BMO 2024-5C4 |
| No. 9 – Kenwood Towne Centre |
| Top Tenant Summary(1) |
| Tenant | Ratings
Moody’s/S&P/Fitch(2) | Net Rentable Area (SF) | % of
Total Collateral NRA(3) | UW Base Rent PSF(4) | UW Base Rent(4) | % of Total
UW Base Rent(4) | Sales PSF(5) | Occ Cost(6) | Lease
Expiration Date |
| Non-Collateral Anchor Tenant | | | | | | | | | |
| Nordstrom(7) | Ba1/BB+/BB+ | 137,836 | NAP | | $0.00 | | $0 | 0.0 | % | NAV | NAV | | NAV |
Non-Collateral Anchor Tenant Subtotal / Wtd. Avg. | | 137,836 | NAP | | $0.00 | | $0 | 0.0 | % | | | |
| | | | | | | | | | |
| Anchors | | | | | | | | | |
| Macy's(8) | Ba2/BB+/BBB- | 262,829 | 25.4 | % | $0.00 | | $0 | 0.0 | % | $186.66 | 0.7% | | 9/10/2028 |
| Dillard’s(9) | Baa3/BB+/BBB- | 240,656 | 23.3 | | $2.51 | | 604,525 | 2.0 | | 117.61 | 2.5 | | 1/31/2029 |
| | | | | | | | | | |
| Major Tenants | | | | | | | | | |
| Apple | Aaa/AA+/NR | 9,383 | 0.9 | % | $135.00 | | $1,266,730 | 4.3 | % | $8,826.84 | 1.5% | | 1/31/2026 |
| Altar’D State/Arula/Tulla(10) | NR/NR/NR | 12,838 | 1.2 | | $77.09 | | 989,681 | 3.3 | | 446.92 | 21.2 | | 3/31/2032 |
| Pottery Barn | NR/NR/NR | 15,913 | 1.5 | | $45.27 | | 720,339 | 2.4 | | 619.63 | 15.2 | | 1/31/2030 |
| Anthropologie | NR/NR/NR | 11,890 | 1.2 | | $54.99 | | 653,854 | 2.2 | | 419.68 | 13.1 | | 1/31/2026 |
| Arhaus Furniture | NR/NR/NR | 16,925 | 1.6 | | $36.60 | | 619,455 | 2.1 | | 626.73 | 9.8 | | 1/31/2032 |
| American Eagle Outfitters(11) | NR/NR/NR | 6,044 | 0.6 | | $98.76 | | 596,905 | 2.0 | | 676.88 | 14.6 | | 3/31/2032 |
| Maggiano’s Little Italy | B1/BB-/NR | 12,611 | 1.2 | | $46.08 | | 581,115 | 2.0 | | 783.49 | 9.0 | | 9/30/2034 |
| Watches of Switzerland(12) | NR/NR/NR | 4,902 | 0.5 | | $118.46 | | 580,691 | 2.0 | | 1,944.81 | 8.8 | | 11/30/2031 |
| The Cheesecake Factory | NR/NR/NR | 12,243 | 1.2 | | $45.00 | | 550,935 | 1.9 | | 1,001.42 | 8.6 | | 1/31/2025 |
| Largest Tenants | | 606,234 | 58.7 | % | $11.82 | | $7,164,230 | 24.2 | % | | | |
| Remaining Occupied | | 377,278 | 36.5 | | $59.49 | | 22,443,982 | 75.8 | | | | |
| Occupied Collateral Total | | 983,512 | 95.2 | % | $30.10 | | $29,608,212 | 100.0 | % | | | |
| Vacant | | 49,629 | 4.8 | | | | | | | |
| Collateral Total / Wtd. Avg. | | 1,033,141 | 100.0 | % | | | | | | |
| | | | | | | | | | |
| (1) | Based on the underwritten rent roll dated December 31, 2023. |
| (2) | In certain instances, ratings provided are those of the parent company of the entity shown, whether or not the parent company guarantees the lease. |
| (3) | % of Total Collateral NRA refers only to the Kenwood Towne Centre Property collateral and does not include the portion of the Kenwood Towne Centre Property occupied by Nordstrom, which owns its improvements and the underlying land. |
| (4) | UW Base Rent, UW Base Rent PSF and % of Total UW Base Rent include $674,713 in contractual rent steps through February 2025. |
| (5) | Sales PSF are presented as of the 12 months ended December 2023, as provided by the borrower sponsors. |
| (6) | Occupancy costs are calculated by the annual gross rent divided by the respective tenant annual sales. |
| (7) | Nordstrom (non-collateral anchor) does not pay rent but pays certain reimbursements. |
| (8) | Macy’s owns its improvements and ground leases the underlying land from the borrower sponsors. Macy’s has five, five-year renewal options remaining and no termination options. Macy’s pays the greater of: (i) Minimum Rent (as defined below) or (ii) 1% of the amount by which Macy’s gross sales exceed $30,000,000 during such fiscal year (“Percentage Rent”). “Minimum Rent” equals $0, except if Macy’s ceases operations as a department store for more than 12 months and thereafter exercises any renewal option, then during the five-year renewal period, the annual Minimum Rent will be the sum of $50,000 plus the greater of: (i) the annual Minimum Rent in effect at the time of exercising the extension option or (ii) $200,000. Currently, Macy’s pays Percentage Rent, currently underwritten as $190,590 per year ($0.73 per square foot) and certain reimbursements that in the aggregate totals 0.7% of total UW gross rent. |
| (9) | Dillard’s has one, 10-year renewal option remaining and a one-time option to surrender the expansion premises (approximately 90,000 square feet). |
(10) Altar'D State/Arula/Tulla has a termination option that is exercisable if the tenant’s net sales fail to exceed $7,509,607 during the period between either December 1, 2026 and November 30, 2027 or December 1, 2027 and November 30, 2028, along with payment of a termination fee.
| (11) | American Eagle Outfitters has a termination option that is exercisable if the tenant’s net sales fail to exceed $3,688,916 during the period between April 2027 and March 2028, along with payment of a termination fee. |
| (12) | Watches of Switzerland has a termination option that is exercisable if the tenant’s net sales fail to exceed $5,000,000 during the period between October 2025 and September 2026, along with payment of a termination fee. |
THE INFORMATION IN THIS STRUCTURAL AND COLLATERAL TERM SHEET IS NOT COMPLETE AND MAY BE AMENDED PRIOR TO THE TIME OF SALE. THIS TERM SHEET IS NOT AN OFFER TO SELL THESE SECURITIES AND IT IS NOT A SOLICITATION OF AN OFFER TO BUY THESE SECURITIES IN ANY JURISDICTION WHERE THE OFFER OR SALE IS NOT PERMITTED. |
| | 116 | |
| Structural and Collateral Term Sheet | | BMO 2024-5C4 |
| No. 9 – Kenwood Towne Centre |
The following tables presents certain information relating to the tenant sales of the Kenwood Towne Centre Property:
| Sales History(1)(2) |
| Tenancy Type | 2019 | 2020(3) | 2021 | 2022 | 2023 |
| Gross Mall Sales(4) | $356.1 million | $252.8 million | $370.1 million | $392.9 million | $395.0 million |
| Gross Mall Sales (Ex-Apple)(4) | $267.9 million | $207.7 million | $293.1 million | $311.7 million | $312.2 million |
| Comparable Sales PSF (Inline < 10,000 SF) | $881 | $618 | $995 | $1,034 | $1,018 |
| Comparable Sales PSF (Inline < 10,000 SF, Ex- Apple) | $637 | $489 | $767 | $786 | $779 |
| Occupancy Cost (Inline < 10,000 SF) | 11.6% | 15.7% | 9.6% | 10.3% | 10.8% |
| Occupancy Cost (Inline < 10,000 SF, Ex-Apple) | 16.0% | 19.6% | 12.3% | 13.5% | 13.8% |
| (1) | Information is as provided by the borrower sponsors and only includes tenants reporting sales. Certain tenants may not have been in occupancy during the entire reporting period. |
| (2) | All figures are approximate. |
| (3) | The Kenwood Towne Centre Property was closed from March 24, 2020 until May 12, 2020, due to the COVID-19 pandemic. |
| (4) | Excludes sales for Dillard’s, Macy’s and Nordstrom (non-collateral anchor). |
| Anchor & Major Tenant Sales History(1)(2) |
| Tenant Name | 2019 | PSF | 2020 | PSF | 2021 | PSF | 2022 | PSF | 2023 | PSF |
| Anchor Tenants(3) | | | | | | | | | | |
| Macy’s | $53.3 million | $203 | $31.3 million | $119 | $52.4 million | $199 | $62.2 million | $237 | $49.1 million | $187 |
| Dillard’s | $26.7 million | $111 | $16.6 million | $69 | $28.6 million | $119 | $30.5 million | $127 | $28.3 million | $118 |
| Inline Tenants > 10,000 SF | | | | | | | | | | |
| Arhaus Furniture | $5.6 million | $333 | $5.1 million | $299 | $7.4 million | $439 | $10.9 million | $643 | $10.6 million | $627 |
| Forever 21 | $3.7 million | $225 | $2.7 million | $161 | $4.8 million | $290 | $3.7 million | $221 | $2.7 million | $162 |
| Pottery Barn | $8.1 million | $511 | $7.4 million | $466 | $9.1 million | $574 | $11.6 million | $729 | $9.9 million | $620 |
| Anthropologie | $2.9 million | $243 | $3.0 million | $249 | $2.1 million | $177 | $5.0 million | $420 | $5.0 million | $420 |
| Restoration Hardware | $9.0 million | $840 | $9.5 million | $881 | $12.2 million | $1,133 | $10.2 million | $952 | $7.4 million | $683 |
| (1) | Information is provided by the borrower sponsors. |
| (2) | All figures are approximate. |
| (3) | Represents estimated gross sales figures between 2019 and 2022. |
| Lease Rollover Schedule(1)(2) |
| Year | Number of Leases Expiring | Net Rentable Area Expiring | % of NRA Expiring | UW Base Rent Expiring(3) | % of UW Base Rent Expiring(3) | Cumulative Net Rentable Area Expiring | Cumulative % of NRA Expiring | Cumulative UW Base Rent Expiring(3) | Cumulative % of UW Base Rent Expiring(3) |
| Vacant | NAP | 49,629 | | 4.8% | NAP | NAP | 49,629 | | 4.8% | | NAP | NAP | |
| 2024 & MTM | 13 | 74,671 | | 7.2 | $1,708,181 | 5.8% | 124,300 | | 12.0% | | $1,708,181 | 5.8% | |
| 2025 | 18 | 70,050 | | 6.8 | 4,112,221 | 13.9 | 194,350 | | 18.8% | | $5,820,402 | 19.7% | |
| 2026 | 21 | 74,060 | | 7.2 | 5,574,367 | 18.8 | 268,410 | | 26.0% | | $11,394,769 | 38.5% | |
| 2027 | 12 | 37,792 | | 3.7 | 2,153,733 | 7.3 | 306,202 | | 29.6% | | $13,548,502 | 45.8% | |
| 2028 | 14 | 294,188 | | 28.5 | 2,511,303 | 8.5 | 600,390 | | 58.1% | | $16,059,805 | 54.2% | |
| 2029 | 13 | 270,173 | | 26.2 | 2,864,580 | 9.7 | 870,563 | | 84.3% | | $18,924,385 | 63.9% | |
| 2030 | 7 | 27,885 | | 2.7 | 1,678,725 | 5.7 | 898,448 | | 87.0% | | $20,603,110 | 69.6% | |
| 2031 | 9 | 38,049 | | 3.7 | 2,469,759 | 8.3 | 936,497 | | 90.6% | | $23,072,869 | 77.9% | |
| 2032 | 11 | 61,220 | | 5.9 | 3,869,773 | 13.1 | 997,717 | | 96.6% | | $26,942,642 | 91.0% | |
| 2033 | 5 | 14,271 | | 1.4 | 1,103,347 | 3.7 | 1,011,988 | | 98.0% | | $28,045,989 | 94.7% | |
| 2034 | 6 | 21,153 | | 2.0 | 1,562,223 | 5.3 | 1,033,141 | | 100.0% | | $29,608,212 | 100.0% | |
| 2035 & Beyond | 0 | 0 | | 0.0 | 0 | 0.0 | 1,033,141 | | 100.0% | | $29,608,212 | 100.0% | |
| Total Collateral | 129 | 1,033,141 | | 100.0% | $29,608,212 | 100.0% | | | | |
| (1) | Based on the underwritten rent roll dated December 31, 2023. |
| (2) | Certain leases may have termination options that are exercisable prior to the originally stated expiration date of the lease and that are not considered in this Lease Rollover Schedule. |
| (3) | UW Base Rent Expiring, % of UW Base Rent Expiring, Cumulative UW Base Rent Expiring and Cumulative % of UW Base Rent Expiring include contractual rent steps totaling $674,713 through February 2025. |
THE INFORMATION IN THIS STRUCTURAL AND COLLATERAL TERM SHEET IS NOT COMPLETE AND MAY BE AMENDED PRIOR TO THE TIME OF SALE. THIS TERM SHEET IS NOT AN OFFER TO SELL THESE SECURITIES AND IT IS NOT A SOLICITATION OF AN OFFER TO BUY THESE SECURITIES IN ANY JURISDICTION WHERE THE OFFER OR SALE IS NOT PERMITTED. |
| | 117 | |
| Structural and Collateral Term Sheet | | BMO 2024-5C4 |
| No. 9 – Kenwood Towne Centre |
| Operating History and Underwritten Net Cash Flow(1) |
| | 2019 | 2020 | 2021 | 2022 | 2023 | Underwritten | Per Square Foot(2) | %(3) |
| Rents in Place | $28,077,213 | $26,265,745 | $23,925,987 | $26,120,002 | $27,822,362 | $28,933,499 | | $28.01 | | 54.1 | % |
| Rent Steps(4) | 0 | 0 | 0 | 0 | 0 | 674,713 | | 0.65 | | 1.3 | |
| Percent Rent | 1,629,756 | 1,688,542 | 4,688,543 | 6,133,051 | 4,437,293 | 2,990,230 | | 2.89 | | 5.6 | |
| Vacant Income | 0 | 0 | 0 | 0 | 0 | 2,799,141 | | 2.71 | | 5.2 | |
| Gross Potential Rent | $29,706,969 | $27,954,287 | $28,614,530 | $32,253,053 | $32,259,655 | $35,397,583 | | $34.26 | | 66.1 | % |
| Total Reimbursements | 15,881,057 | 15,036,147 | 12,925,944 | 13,725,762 | 14,242,630 | 14,008,669 | | 13.56 | | 26.2 | |
| Temporary Tenants | 3,537,191 | 2,511,184 | 3,678,791 | 3,701,297 | 3,468,467 | 3,725,061 | | 3.61 | | 7.0 | |
| Lease Termination Income | 0 | 823,989 | 908,941 | 163,925 | 702,334 | 0 | | 0.00 | | 0.0 | |
| Other Income(5) | 516,526 | 360,323 | 440,807 | 462,098 | 400,361 | 389,272 | | 0.38 | | 0.7 | |
| Net Rental Income | $49,641,743 | $46,685,930 | $46,569,013 | $50,306,135 | $51,073,447 | $53,520,585 | | $51.80 | | 100.0 | % |
| (Vacancy/Credit Loss)(6) | (322,345) | (1,223,127) | 55,455 | 142,623 | 83,265 | (2,799,141) | | (2.71) | | (5.2 | ) |
| Effective Gross Income | $49,319,398 | $45,462,803 | $46,624,468 | $50,448,758 | $51,156,712 | $50,721,444 | | $49.09 | | 94.8 | % |
| Total Expenses | 12,297,984 | 11,598,539 | 12,851,993 | 13,294,184 | 13,470,861 | 12,770,752 | | 12.36 | | 25.2 | |
| Net Operating Income(7) | $37,021,414 | $33,864,264 | $33,772,475 | $37,154,574 | $37,685,851 | $37,950,692 | | $36.73 | | 74.8 | % |
| Capital Expenditures | 0 | 0 | 0 | 0 | 0 | 206,628 | | 0.20 | | 0.4 | |
| TI/LC | 0 | 0 | 0 | 0 | 0 | 1,604,875 | | 1.55 | | 3.2 | |
| Net Cash Flow | $37,021,414 | $33,864,264 | $33,772,475 | $37,154,574 | $37,685,851 | $36,139,189 | | $34.98 | | 71.3 | % |
| (1) | Certain items such as capital expenditures and TI/LC were excluded from the historical presentation and are not considered for the underwritten cash flow. |
| (2) | Per Square Foot is based on the Total Collateral NRA. |
| (3) | % column represents percent of Net Rental Income for all revenue lines and represents percent of Effective Gross Income for the remainder of fields. |
| (4) | Contractual rent steps are through February 2025. |
| (5) | Other Income includes revenue from trash pad rental and valet parking income. |
| (6) | The underwritten economic occupancy is 92.8%. The Kenwood Towne Centre Property was 95.2% leased based on the December 31, 2023 underwritten rent roll. |
| (7) | The increase in Net Operating Income from 2021 to 2022 is primarily attributed to the borrower sponsors signing new leases and lease renewals during 2021 and 2022 for approximately 21 tenants with associated underwritten rents (8.2% of Total Collateral NRA and 20.1% of the underwritten base rent). |
The Market. The Kenwood Towne Centre Property is located in Cincinnati, Ohio, within the Cincinnati core-based statistical area (the “Cincinnati CBSA”). The Cincinnati CBSA spans 15 counties in the states of Ohio, Kentucky and Indiana and is home to seven Fortune 500 companies including Kroger, Proctor & Gamble, Fifth Third Bancorp, Western & Southern Financial Group, American Financial Group Inc., Cincinnati Financial Corp. and Cintas. The Cincinnati CBSA’s largest employment sectors include trade, transportation & utilities (20.6% of the regional workforce), professional & business services (15.7%) and education & health services (14.9%). The largest employers in the Cincinnati CBSA are Kroger Co., Cincinnati Children’s Hospital, TriHealth, University of Cincinnati and St. Elizabeth Healthcare.
The Kenwood Towne Centre Property is situated at the northeast corner of Kenwood and Montgomery Roads, approximately 10 miles from the Cincinnati central business district. Interstate 71 is located adjacent to the Kenwood Towne Centre Property and provides north/south regional access through Cincinnati. Interstate 71 has an average daily traffic count of approximately 123,971 vehicles per day. The Kenwood Towne Centre Property serves a 10-mile trade area and is a major shopping destination for this portion of the region, which acts as a commercial/retail hub for the area, anchoring retail and commercial development along Montgomery and Kenwood Roads.
According to the appraisal, the 2022 population within a five-, 10- and 15-mile radius of the Kenwood Towne Centre Property was 169,911, 703,702 and 1,308,287, respectively, and the average household income within the same radii was $105,507, $102,106 and $98,654, respectively. According to a third-party market research report, the Kenwood Towne Centre Property is located in the Kenwood retail submarket, which contained 5,569,882 square feet of retail space as of the first quarter of 2024. The Kenwood retail submarket reported a vacancy rate of 6.7% and an average rental rate of $23.29 per square foot.
THE INFORMATION IN THIS STRUCTURAL AND COLLATERAL TERM SHEET IS NOT COMPLETE AND MAY BE AMENDED PRIOR TO THE TIME OF SALE. THIS TERM SHEET IS NOT AN OFFER TO SELL THESE SECURITIES AND IT IS NOT A SOLICITATION OF AN OFFER TO BUY THESE SECURITIES IN ANY JURISDICTION WHERE THE OFFER OR SALE IS NOT PERMITTED. |
| | 118 | |
| Structural and Collateral Term Sheet | | BMO 2024-5C4 |
| No. 9 – Kenwood Towne Centre |
The following table presents certain information relating to comparable retail centers for the Kenwood Towne Centre Property:
| Competitive Retail Center Summary(1) |
| Property Name/Location | Year Built / Renovated | Total GLA (SF) | Total Occupancy | Distance to Subject | Sales PSF | Anchor Tenants |
Kenwood Towne Centre 7875 Montgomery Road Cincinnati, OH | 1958 / 1988, 2003, 2009, 2019-2023 | 1,033,141(2) | 95.2%(3) | NAP | $779(4)(5) | Macy’s Dillard’s Nordstrom (non-collateral anchor) |
Eastgate Mall 4601-200 Eastgate Boulevard Cincinnati, OH | 1980 / 2003 | 858,783 | 86.0% | 8.5 miles | $377 | Dillard's JC Penney Kohl's |
Northgate Mall 9501 Colerain Avenue Cincinnati, OH | 1972 / 2015 | 1,100,000 | 79.0% | 12.0 miles | $259 | Ashley Furniture Burlington DSW Marshalls Overstock Furniture Xscape Theatres |
Florence Mall 2028 Florence Mall Florence, KY | 1976 / 2011 | 940,967 | 86.0% | 21.0 miles | $447 | JC Penney Macy's Macy's Home |
| (1) | Source: Appraisal, unless stated otherwise. The retail properties displayed in the chart reflect the primary competition for the Kenwood Towne Centre Property. |
| (2) | Total GLA (SF) for the Kenwood Towne Centre Property excludes the square footage for Nordstrom (non-collateral anchor). |
| (3) | Based on the underwritten rent roll dated December 31, 2023 excluding Nordstrom (non-collateral anchor). |
| (4) | Represents comparable sales per square foot as of the 12 months ended December 2023 for in-line tenants (excluding Apple). |
| (5) | Information is as provided by the borrower sponsors and only includes tenants reporting sales. |
The Borrower. The borrower for the Kenwood Towne Centre Whole Loan is Kenwood Mall L.L.C., a Delaware limited liability company and single purpose entity with two independent directors. Legal counsel to the borrower delivered a non-consolidation opinion in connection with the origination of the Kenwood Towne Centre Whole Loan.
The Borrower Sponsors. The borrower sponsors are Brookfield Properties Retail Holding LLC (“Brookfield Retail”) and Teachers’ Retirement System of the State of Illinois (“TRSIL”), each of which indirectly owns a 50% interest in the borrower. The non-recourse carveout guarantor is GGP-TRS L.L.C., an affiliate of Brookfield Retail and the 100% owner of the borrower. Brookfield Retail is a fully integrated, diversified global real estate services company that has portfolio management and development capabilities across the real estate investment strategies of Brookfield Corporation. Brookfield Property Partners owns, operates and develops a large portfolio of office, retail, multifamily, industrial, hospitality, triple net lease, student housing and manufactured housing assets. Brookfield Retail owns over 160 retail properties totaling over 130 million square feet throughout the United States.
TRSIL is an Illinois state government agency dealing with pensions and other financial benefits for teachers and other workers in education in Illinois. The Illinois General Assembly created TRSIL in 1939 for the purpose of providing retirement annuities and disability and survivor benefits for educators employed in public schools outside the city of Chicago. As of February 29, 2024, TRSIL had approximately $69.5 billion of assets under management.
Property Management. The Kenwood Towne Centre Property is managed by Brookfield Properties Retail Inc., an affiliate of Brookfield Retail.
Escrows and Reserves. At origination, the borrower deposited into escrow approximately (i) $3,732,395 into an existing tenant improvement allowances reserve and (ii) $234,558 for a gap rent reserve in connection with Ray Ban (approximately $206,556) and Rowan (approximately $28,002).
Tax Escrows – During the continuance of a Reserve Trigger Period (as defined below) or Cash Management Period (as defined below), the borrower is required make monthly deposits equal to 1/12th of the annual estimated tax payments during the next ensuing 12 months.
Insurance Escrows – During the continuance of a Reserve Trigger Period or Cash Management Period, the borrower is required to make monthly deposits equal to 1/12th of the annual estimated insurance payments, except if the Kenwood
THE INFORMATION IN THIS STRUCTURAL AND COLLATERAL TERM SHEET IS NOT COMPLETE AND MAY BE AMENDED PRIOR TO THE TIME OF SALE. THIS TERM SHEET IS NOT AN OFFER TO SELL THESE SECURITIES AND IT IS NOT A SOLICITATION OF AN OFFER TO BUY THESE SECURITIES IN ANY JURISDICTION WHERE THE OFFER OR SALE IS NOT PERMITTED. |
| | 119 | |
| Structural and Collateral Term Sheet | | BMO 2024-5C4 |
| No. 9 – Kenwood Towne Centre |
Towne Centre Property is insured under a blanket policy meeting the requirements set forth in the related Kenwood Towne Centre Whole Loan documents (in which case, no insurance escrows will be required).
Replacement Reserves – During the continuance of a Reserve Trigger Period or Cash Management Period, the borrower is required to escrow $21,524 per month, capped at $516,571.
Rollover Reserve – On each monthly payment date, the borrower is required to escrow an amount equal to approximately $129,143 for rollover reserves, capped at $3,099,423.
Anchor Reserve – During the continuance of an Anchor Trigger Event (as defined below), the borrower is required to deposit an amount equal to all initial excess cash flow with respect to any particular interest period for tenant improvements and leasing commissions, construction costs, required landlord work and other related costs associated with re-tenanting the applicable space or any other space at the Kenwood Towne Centre Property; provided, that deposits be capped at the amount equal to the product of (x) $50.00 and (y) the aggregate amount of gross leasable square footage of the applicable Anchor Parcel (as defined below) (the “Individual Anchor Threshold Amount”). The reserve will not be replenished if the funds in the anchor reserve account allocable to such individual Anchor Trigger Event falls below the related Individual Anchor Threshold Amount thereafter due to any disbursement to the borrower in accordance with the terms of the Kenwood Towne Centre Whole Loan documents.
Lockbox / Cash Management. The Kenwood Towne Centre Whole Loan is structured with a hard lockbox and springing cash management. The borrower is required to cause all tenants at the Kenwood Towne Centre Property (other than tenants under Seasonal Leases (as defined below)) to pay rents (other than Non-Core Income (as defined below)) directly into the account controlled by the lender (the “Lockbox Account”), and to deposit any rents otherwise received by the manager or the property manager (other than Non-Core Income) into such Lockbox Account within two business days after receipt. Prior to a Cash Management Period, all funds in the Lockbox Account will be swept daily to the borrower’s operating account. During the continuance of a Cash Management Period, all funds deposited into the Lockbox Account are required to be swept each business day into a deposit account controlled by the lender (the “Cash Management Account”) to be applied and disbursed in accordance with the Kenwood Towne Centre Whole Loan documents to pay, including but not limited to, (i) the tax and insurance escrow deposits, if any, described above, (ii) provided that no default exists as to which the lender has initiated an enforcement action, budgeted operating expenses (or actual operating expenses to the extent not more than 115% of budgeted operating expenses), budgeted capital expenses (or actual capital expenses to the extent not more than 110% of budgeted capital expenses) and lender-approved extraordinary expenses and (iii) the replacement and rollover reserve deposits, if any, described above. During the continuance of a Cash Management Period, any excess cash is required to be deposited into an excess cash reserve account to be held by the lender as additional security for the Kenwood Towne Centre Whole Loan; provided, that, funds on deposit in such account will be made available to the borrower for the payment of certain property-level expenses and other uses, including REIT distributions up to $200,000.
“Non-Core Income” means (i) certain de minimis amounts of rents from miscellaneous revenue items such as holiday photos and change retrieved from fountains (but will not include rent from Seasonal Leases) and (ii) certain rents generated pursuant to multi-property sponsorship and advertising programs which are directly attributable to the Kenwood Towne Centre Property.
“Seasonal Leases” means leases and/or license agreements having a maximum term of one year or less.
A “Reserve Trigger Period” will commence upon the net operating income debt yield (“NOI DY”) falling below 10.5% for two consecutive calendar quarters and will end upon the NOI DY being at least 10.5% for two consecutive calendar quarters.
A “Cash Management Period” will commence upon the occurrence of any of the following events: (i) an event of default, (ii) the debt yield is less than 9.75% as of the end of any two consecutive calendar quarters or (iii) the commencement of an Anchor Trigger Event. A Cash Management Period will end as applicable with respect to: (1) clause (i) above, if such event of default is cured or waived (provided that no Cash Management Period remains in effect pursuant to clauses (ii) or (iii) above), (2) clause (ii) above, either (a) upon the date that the debt yield is equal to or in excess of the 9.75% for two consecutive calendar quarters (provided that no Cash Management Period remains in effect pursuant to clauses (i) or (iii) above) or (b) the borrower has either (x) partially prepaid the Kenwood Towne Centre Whole Loan (with payment of a yield maintenance if partial prepayment occurs prior to September 1, 2028), (y) delivered cash to the lender or (z) delivered a letter of credit to the lender, in each case in an amount that if subtracted from the outstanding principal balance of the
THE INFORMATION IN THIS STRUCTURAL AND COLLATERAL TERM SHEET IS NOT COMPLETE AND MAY BE AMENDED PRIOR TO THE TIME OF SALE. THIS TERM SHEET IS NOT AN OFFER TO SELL THESE SECURITIES AND IT IS NOT A SOLICITATION OF AN OFFER TO BUY THESE SECURITIES IN ANY JURISDICTION WHERE THE OFFER OR SALE IS NOT PERMITTED. |
| | 120 | |
| Structural and Collateral Term Sheet | | BMO 2024-5C4 |
| No. 9 – Kenwood Towne Centre |
Kenwood Towne Centre Whole Loan would cause the debt yield to equal or exceed 9.75% for two consecutive calendar quarters, or (3) clause (iii) above, an applicable Anchor Trigger Cessation Event (as defined below) has occurred.
An ”Anchor Trigger Event” will occur if Dillard’s, Macy’s, Nordstrom or any replacement tenant (each an “Anchor” and the premises occupied, the “Anchor Parcel”): (i) has (A) “gone dark” (other than a temporary closure in connection with: (w) a restoration, repair or renovation, (x) compliance with applicable law, regulations and/or governmental mandates, (y) an event of force majeure or (z) any reason not to exceed 60 days) or (B) vacated its Anchor Parcel, (ii) is the subject of certain bankruptcy or insolvency events, (iii) terminates, surrenders or cancels its lease (or gives notice of its intent to do any of the foregoing) or (iv) to the extent such Anchor Parcel is owned by the borrower, the Anchor fails to renew its lease prior to the earlier of: (x) the date specified in such lease and (y) the date that is 12 months prior to such Anchor’s lease expiration.
An “Anchor Trigger Cessation Event” means for any Anchor Trigger Event: (1) described in clause (i) of the definition of Anchor Trigger Event, such Anchor operates the demised premises (to the extent not subject to any permitted subletting) for a period of no less than 30 consecutive operating days; (2) described in clause (ii) of the definition of Anchor Trigger Event, (x) if such premises occupied by the Anchor are then owned by the Anchor, such bankruptcy action is dismissed or the Anchor has emerged from such bankruptcy action and is continuing to occupy its premises or a substantial portion thereof, and (y) if such premises occupied by the Anchor are then leased by the borrower to the Anchor, such lease is accepted and affirmed by the Anchor in the bankruptcy action; (3) described in clause (iii) of the definition of Anchor Trigger Event, such Anchor rescinds its notice of cancellation, termination or non-renewal in writing; (4) described in clause (iv) of the definition of Anchor Trigger Event, such Anchor renews and/or extends its lease pursuant to the terms thereof; (5) if such Anchor Parcel is owned by the borrower, the entire Anchor Parcel or not less than 75% of the aggregate gross leasable square footage of the Anchor Parcel becomes owned or leased by one or more replacement tenants pursuant to leases entered into in accordance with the terms of the Kenwood Towne Centre Whole Loan documents or otherwise, in each case, reasonably approved by the lender (such approval not to be unreasonably withheld, conditioned or delayed); or (6) the borrower will have satisfied the conditions set forth in the Kenwood Towne Centre Whole Loan documents.
Subordinate and Mezzanine Debt. None.
Permitted Future Mezzanine Debt. Not permitted.
Partial Release. The borrower may obtain the release of (A) one or more vacant, non-income producing and unimproved (or improved only by landscaping, surface parking or utility facilities that are either readily re-locatable or will continue to serve the Kenwood Towne Centre Property) parcels (including “air rights” parcels) or outlots (provided, however, that this condition will not apply to any Kenwood Towne Centre Expansion Parcel (as defined below), or (B) any Kenwood Towne Centre Acquired Parcel (as defined below), including, if applicable, any Anchor Parcel, upon satisfaction of specified conditions including, among other things, that (i) there is no event of default, (ii) the borrower delivers evidence that the parcel subject to release is not necessary for the borrower’s operation or use of the remaining Kenwood Towne Centre Property and may be readily separated from the Kenwood Towne Centre Property without a material diminution in value, (iii) the parcel subject to release has been legally subdivided and after giving effect to such transfer, the release parcel and the remaining Kenwood Towne Centre Property conform to legal requirements and constitute separate tax lots (or all action has been taken to effectuate the same), (iv) the parcel subject to the release is not necessary for the remaining portion of the Kenwood Towne Centre Property to comply with zoning or legal requirements, (v) receipt of a rating agency confirmation from the applicable rating agencies (provided that such confirmation will not be required for release of a Kenwood Towne Centre Expansion Parcel or if the rating agency has waived review or failed to respond within 30 days to a request for such confirmation) and (vi) the release will comply with REMIC requirements.
In addition, the borrower has the right, at its own expense, to acquire one or more parcels of land that constitutes an integral part of, adjoins or is proximately located near, the shopping center of which the Kenwood Towne Centre Property is a part, which land was not owned by the borrower on the origination date of the Kenwood Towne Centre Whole Loan and is not a Kenwood Towne Centre Acquired Parcel (such acquired land, a “Kenwood Towne Centre Expansion Parcel”), to become additional collateral for the Kenwood Towne Centre Whole Loan, upon satisfaction of specified conditions including, among other things, that (i) there is no event of default, (ii) the borrower acquires a fee simple or leasehold interest in the applicable Kenwood Towne Centre Expansion Parcel and (iii) the borrower delivers, among other things, (a) an environmental report indicating no hazardous substances except for nominal amounts (except as permitted under clause (d) below), unless the Kenwood Towne Centre Expansion Parcel is already covered by the environmental report delivered at origination, (b) security documents creating a mortgage lien on the Kenwood Towne Centre Expansion Parcel and title insurance, (c) a
THE INFORMATION IN THIS STRUCTURAL AND COLLATERAL TERM SHEET IS NOT COMPLETE AND MAY BE AMENDED PRIOR TO THE TIME OF SALE. THIS TERM SHEET IS NOT AN OFFER TO SELL THESE SECURITIES AND IT IS NOT A SOLICITATION OF AN OFFER TO BUY THESE SECURITIES IN ANY JURISDICTION WHERE THE OFFER OR SALE IS NOT PERMITTED. |
| | 121 | |
| Structural and Collateral Term Sheet | | BMO 2024-5C4 |
| No. 9 – Kenwood Towne Centre |
property condition report indicating that the Kenwood Towne Centre Expansion Parcel is in good condition if the Kenwood Towne Centre Expansion Parcel is improved, subject to certain exceptions, and (d) if repairs are recommended by the property condition report or if the environmental report discloses the presence of hazardous materials at the Kenwood Towne Centre Expansion Parcel, and the cost of such repairs or remediation is reasonably likely to exceed 10% of the original principal balance of the Kenwood Towne Centre Whole Loan, cash or an indemnity from the guarantor, certain of its affiliates or an entity otherwise meeting ratings or financial tests set forth in the Kenwood Towne Centre Whole Loan documents, in an amount equal to 125% of any estimated repairs or remediation costs, as applicable.
The borrower is also permitted to obtain the release of collateral parcels (each, a “Kenwood Towne Centre Exchange Parcel”) from the lien of the mortgage in exchange for the substitution of new parcels of real property in which the borrower acquires a fee or leasehold interest (each, a “Kenwood Towne Centre Acquired Parcel”) as collateral for the Kenwood Towne Centre Whole Loan upon 20 days’ prior notice, subject to the satisfaction of certain conditions, including, among other things, that: (i) the Kenwood Towne Centre Exchange Parcel (unless it is a Kenwood Towne Centre Expansion Parcel) is vacant, non-income producing and unimproved or improved only by landscaping, surface parking or utility facilities that are readily re-locatable or that will continue to serve the Kenwood Towne Centre Property (and the borrower is able to make certain zoning representations as to the Kenwood Towne Centre Acquired Parcel to the same extent as made with respect to the Kenwood Towne Centre Exchange Parcel), (ii) the Kenwood Towne Centre Acquired Parcel is reasonably equivalent in value to the Kenwood Towne Centre Exchange Parcel, as established by a letter of value from the appraiser that appraised the Kenwood Towne Centre Property or an appraiser of comparable experience selected by the borrower, (iii) with respect to the Kenwood Towne Centre Acquired Parcel, the borrower has delivered, among other things, (a) an environmental report indicating no hazardous substances except for nominal amounts (except as permitted under clause (d) below), unless the Kenwood Towne Centre Acquired Parcel is already covered by the environmental report delivered at origination, (b) security documents creating a mortgage lien on the Kenwood Towne Centre Acquired Parcel and title insurance, (c) a property condition report indicating that the Kenwood Towne Centre Acquired Parcel is in good condition if the Kenwood Towne Centre Acquired Parcel is improved, subject to certain exceptions, (d) if repairs are recommended by the property condition report or if the environmental report discloses the presence of hazardous materials at the Kenwood Towne Centre Acquired Parcel, and the cost of such repairs or remediation is likely to exceed 10% of the original principal balance of the Kenwood Towne Centre Whole Loan, cash or an indemnity from the guarantor, certain of its affiliates or an entity otherwise meeting ratings or financial tests set forth in the Kenwood Towne Centre Whole Loan documents, in an amount equal to 125% of any estimated repairs or remediation costs, as applicable, (e) the release will comply with REMIC requirements and (f) the lender has received a rating agency confirmation from the applicable rating agencies.
Ground Lease. None.
THE INFORMATION IN THIS STRUCTURAL AND COLLATERAL TERM SHEET IS NOT COMPLETE AND MAY BE AMENDED PRIOR TO THE TIME OF SALE. THIS TERM SHEET IS NOT AN OFFER TO SELL THESE SECURITIES AND IT IS NOT A SOLICITATION OF AN OFFER TO BUY THESE SECURITIES IN ANY JURISDICTION WHERE THE OFFER OR SALE IS NOT PERMITTED. |
| | 122 | |
| Structural and Collateral Term Sheet | | BMO 2024-5C4 |
| No. 10 – Staten Island Mall |
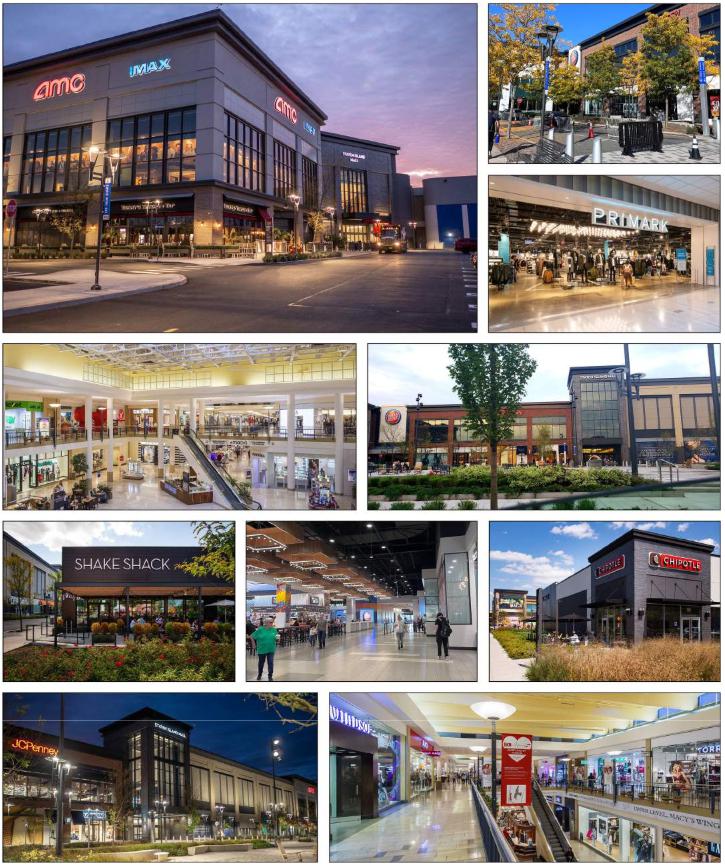
THE INFORMATION IN THIS STRUCTURAL AND COLLATERAL TERM SHEET IS NOT COMPLETE AND MAY BE AMENDED PRIOR TO THE TIME OF SALE. THIS TERM SHEET IS NOT AN OFFER TO SELL THESE SECURITIES AND IT IS NOT A SOLICITATION OF AN OFFER TO BUY THESE SECURITIES IN ANY JURISDICTION WHERE THE OFFER OR SALE IS NOT PERMITTED. |
| | 123 | |
| Structural and Collateral Term Sheet | | BMO 2024-5C4 |
| No. 10 – Staten Island Mall |
THE INFORMATION IN THIS STRUCTURAL AND COLLATERAL TERM SHEET IS NOT COMPLETE AND MAY BE AMENDED PRIOR TO THE TIME OF SALE. THIS TERM SHEET IS NOT AN OFFER TO SELL THESE SECURITIES AND IT IS NOT A SOLICITATION OF AN OFFER TO BUY THESE SECURITIES IN ANY JURISDICTION WHERE THE OFFER OR SALE IS NOT PERMITTED. |
| | 124 | |
| Structural and Collateral Term Sheet | | BMO 2024-5C4 |
| No. 10 – Staten Island Mall |
THE INFORMATION IN THIS STRUCTURAL AND COLLATERAL TERM SHEET IS NOT COMPLETE AND MAY BE AMENDED PRIOR TO THE TIME OF SALE. THIS TERM SHEET IS NOT AN OFFER TO SELL THESE SECURITIES AND IT IS NOT A SOLICITATION OF AN OFFER TO BUY THESE SECURITIES IN ANY JURISDICTION WHERE THE OFFER OR SALE IS NOT PERMITTED. |
| | 125 | |
| Structural and Collateral Term Sheet | | BMO 2024-5C4 |
| No. 10 – Staten Island Mall |
THE INFORMATION IN THIS STRUCTURAL AND COLLATERAL TERM SHEET IS NOT COMPLETE AND MAY BE AMENDED PRIOR TO THE TIME OF SALE. THIS TERM SHEET IS NOT AN OFFER TO SELL THESE SECURITIES AND IT IS NOT A SOLICITATION OF AN OFFER TO BUY THESE SECURITIES IN ANY JURISDICTION WHERE THE OFFER OR SALE IS NOT PERMITTED. |
| | 126 | |
| Structural and Collateral Term Sheet | | BMO 2024-5C4 |
| No. 10 – Staten Island Mall |
THE INFORMATION IN THIS STRUCTURAL AND COLLATERAL TERM SHEET IS NOT COMPLETE AND MAY BE AMENDED PRIOR TO THE TIME OF SALE. THIS TERM SHEET IS NOT AN OFFER TO SELL THESE SECURITIES AND IT IS NOT A SOLICITATION OF AN OFFER TO BUY THESE SECURITIES IN ANY JURISDICTION WHERE THE OFFER OR SALE IS NOT PERMITTED. |
| | 127 | |
| Structural and Collateral Term Sheet | | BMO 2024-5C4 |
| No. 10 – Staten Island Mall |
THE INFORMATION IN THIS STRUCTURAL AND COLLATERAL TERM SHEET IS NOT COMPLETE AND MAY BE AMENDED PRIOR TO THE TIME OF SALE. THIS TERM SHEET IS NOT AN OFFER TO SELL THESE SECURITIES AND IT IS NOT A SOLICITATION OF AN OFFER TO BUY THESE SECURITIES IN ANY JURISDICTION WHERE THE OFFER OR SALE IS NOT PERMITTED. |
| | 128 | |
| Structural and Collateral Term Sheet | | BMO 2024-5C4 |
| No. 10 – Staten Island Mall |
| Mortgage Loan Information | | Property Information |
| Mortgage Loan Seller: | WFB | | Single Asset / Portfolio: | Single Asset |
| Original Principal Balance(1): | $30,000,000 | | Title: | Fee |
| Cut-off Date Principal Balance(1): | $30,000,000 | | Property Type – Subtype: | Retail – Super Regional Mall |
| % of IPB: | 3.5% | | Net Rentable Area (SF)(4): | 995,900 |
| Loan Purpose: | Refinance | | Location: | Staten Island, NY |
| Borrowers: | GGP Staten Island Mall, LLC and Staten Island FS Anchor Parcel LLC | | Year Built / Renovated: | 1972 / 1993, 2018 |
| Borrower Sponsor(2): | BPR Nimbus LLC | | Occupancy: | 87.3% |
| Interest Rate: | 7.53400% | | Occupancy Date: | 11/30/2023 |
| Note Date: | 1/18/2024 | | 4th Most Recent NOI (As of): | $30,602,548 (12/31/2020) |
| Maturity Date: | 2/1/2029 | | 3rd Most Recent NOI (As of): | $23,965,918 (12/31/2021) |
| Interest-only Period: | 60 months | | 2nd Most Recent NOI (As of): | $33,279,822 (12/31/2022) |
| Original Term: | 60 months | | Most Recent NOI (As of): | $36,582,216 (TTM 10/31/2023) |
| Original Amortization Term: | None | | UW Economic Occupancy: | 87.5% |
| Amortization Type: | Interest Only | | UW Revenues: | $63,861,272 |
| Call Protection: | L(27),D(26),O(7) | | UW Expenses: | $30,795,311 |
| Lockbox / Cash Management: | Hard / Springing | | UW NOI: | $33,065,961 |
| Additional Debt(1): | Yes | | UW NCF: | $31,870,881 |
| Additional Debt Balance(1): | $170,000,000 | | Appraised Value / Per SF: | $467,000,000 / $469 |
| Additional Debt Type(1): | Pari Passu | | Appraisal Date: | 8/22/2023 |
| | | | | |
| Escrows and Reserves(3) | | Financial Information(1) |
| | Initial | Monthly | Initial Cap | | Cut-off Date Loan / Unit: | $201 |
| Taxes: | $0 | Springing | N/A | | Maturity Date Loan / Unit: | $201 |
| Insurance: | $0 | Springing | N/A | | Cut-off Date LTV: | 42.8% |
| Replacement Reserves: | $0 | Springing | $497,950 | | Maturity Date LTV: | 42.8% |
| TI/LC: | $4,580,787 | Springing | $1,991,800 | | UW NCF DSCR: | 2.09x |
| Gap Rent: | $403,197 | $0 | N/A | | UW NOI Debt Yield: | 16.5% |
| Other Reserves: | $0 | Springing | N/A | | | |
| | | | | | | |
| Sources and Uses |
| Sources | Proceeds | % of Total | | Uses | Proceeds | % of Total |
| Whole Loan(1) | $200,000,000 | 94.7 | % | | Loan Payoff | $204,429,707 | 96.8 | % |
| Equity Contribution | 11,179,744 | 5.3 | | | Upfront Reserves | 4,983,984 | 2.4 | |
| | | | | Closing Costs | 1,766,053 | 0.8 | |
| | | | | | | |
| Total Sources | $211,179,744 | 100.0 | % | | Total Uses | $211,179,744 | 100.0 | % |
| (1) | The Staten Island Mall Mortgage Loan (as defined below) is part of a whole loan that is comprised of 12 pari passu notes with an aggregate original principal balance and Cut-off Date Balance of $200,000,000 (the “Staten Island Mall Whole Loan”). The Staten Island Mall Whole Loan was co-originated by Deutsche Bank AG, New York Branch (“DBNY”), Wells Fargo Bank, National Association (“WFBNA”) and Barclays Capital Real Estate Inc. (“Barclays”). The Financial Information in the chart above is based on the aggregate outstanding principal balance as of the Cut-off Date of the Staten Island Mall Whole Loan. |
| (2) | The borrower sponsor on the Staten Island Whole Loan is related to the borrower sponsor for the Kenwood Towne Centre Mortgage Loan. |
| (3) | For a full description of Escrows and Reserves see “Escrows and Reserves” below. |
| (4) | The Staten Island Mall Property is the collateral portion of a larger mall containing 1,462,822 square feet. |
The Loan. The tenth largest mortgage loan (the “Staten Island Mall Mortgage Loan”) is part of a whole loan (the “Staten Island Mall Whole Loan”) that is evidenced by 12 pari passu notes with an aggregate outstanding principal balance as of the Cut-off Date of $200,000,000, and accrues interest at a fixed rate of 7.53400% per annum. The Staten Island Mall Whole Loan is secured by the fee simple interest in a 995,900 square foot portion (the “Staten Island Mall Property”) of the Staten Island Mall, an enclosed, 1,462,822 square foot super-regional mall located at 2655 Richmond Avenue in Staten Island, New York (the “Staten Island Mall”). The Staten Island Mall Mortgage Loan, which is evidenced by the non-controlling notes A-10 and A-11, has an outstanding principal balance as of the Cut-off Date of $30,000,000.
THE INFORMATION IN THIS STRUCTURAL AND COLLATERAL TERM SHEET IS NOT COMPLETE AND MAY BE AMENDED PRIOR TO THE TIME OF SALE. THIS TERM SHEET IS NOT AN OFFER TO SELL THESE SECURITIES AND IT IS NOT A SOLICITATION OF AN OFFER TO BUY THESE SECURITIES IN ANY JURISDICTION WHERE THE OFFER OR SALE IS NOT PERMITTED. |
| | 129 | |
| Structural and Collateral Term Sheet | | BMO 2024-5C4 |
| No. 10 – Staten Island Mall |
The relationship between the holders of the Staten Island Mall Whole Loan will be governed by a co-lender agreement as described under “Description of the Mortgage Pool—The Whole Loans—The Non-Serviced Pari Passu Whole Loans” in the Preliminary Prospectus. The Staten Island Mall Whole Loan will be serviced under the BBCMS 2024-5C25 pooling and servicing agreement. See “The Pooling and Servicing Agreement” in the Preliminary Prospectus.
The table below identifies the promissory notes that comprise the Staten Island Mall Whole Loan.
| Whole Loan Summary |
| Note | Original Balance | Cut-off Date Balance | Note Holder | Controlling Piece |
| A-1 | $28,500,000 | | $28,500,000 | | BMO 2024-5C3 | No |
| A-2 | $25,000,000 | | $25,000,000 | | BBCMS 2024-5C25 | Yes |
| A-3 | $15,000,000 | | $15,000,000 | | Benchmark 2024-V6 | No |
| A-4 | $11,500,000 | | $11,500,000 | | BBCMS 2024-5C25 | No |
| A-5 | $30,000,000 | | $30,000,000 | | BBCMS 2024-5C25 | No |
| A-6 | $15,000,000 | | $15,000,000 | | Benchmark 2024-V6 | No |
| A-7 | $10,000,000 | | $10,000,000 | | Benchmark 2024-V6 | No |
| A-8 | $5,000,000 | | $5,000,000 | | BBCMS 2024-5C25 | No |
| A-9 | $25,000,000 | | $25,000,000 | | BANK5 Trust 2024-5YR6(1) | No |
| A-10 | $20,000,000 | | $20,000,000 | | BMO 2024-5C4 | No |
| A-11 | $10,000,000 | | $10,000,000 | | BMO 2024-5C4 | No |
| A-12 | $5,000,000 | | $5,000,000 | | BANK5 Trust 2024-5YR6(1) | No |
| Whole Loan | $200,000,000 | | $200,000,000 | | | |
| (1) | The BANK5 Trust 2024-5YR6 transaction is expected to close on May 6, 2024. |
The Property. The Staten Island Mall Property is a 995,900 square foot collateral portion of the Staten Island Mall, a 1,462,822 square foot super regional mall located in Staten Island, New York. Staten Island Mall was built in 1972 and is anchored by Macy’s and JC Penney (both non-collateral), along with a line-up of junior anchors including Dave & Buster’s, AMC Theatres, Primark, LIDL, and Hobby Lobby. Macy’s (289,512 square feet) and JC Penney (177,410 square feet) both own their respective boxes and are not included as part of the Staten Island Mall Property. The Staten Island Mall Property is comprised of five buildings located on 78.54 acres, has 167 tenants and has 6,900 parking spaces in total for a ratio of 4.72 spaces per 1,000 square feet. In 2018, the Staten Island Mall underwent a $231 million redevelopment and expansion, which added a lifestyle component to the mall. The expansion included a new food court, new plaza area, and additional decked parking.
The Staten Island Mall benefits from being the only regional mall on Staten Island. The Staten Island Mall sees more than 12 million shoppers every year due in part to its location within an approximately 15-mile radius of every resident on the island. The Staten Island Mall Property caters to a trade area of over 485,000 people with an average household income of over $110,000. Staten Island is accessed by the nearby metropolitan areas through the Staten Island Ferry, which serves over 22 million people annually, combined with accessibility through motor traffic from New Jersey and Brooklyn.
As part of the redevelopment and expansion, the borrower sponsor executed leases with retailers such as AMC Theatres, Barnes & Noble, Dave & Busters, Chipotle, Shake Shack, Ulta Beauty, and Zara, which have helped diversify the tenant mix and product offerings at the Staten Island Mall Property. Recently, the borrower signed a new 10-year lease with Hobby Lobby, an arts and crafts retailer, which took occupancy of 42,768 square feet in June 2023. Earlier in 2023, The Mighty Crab, a Cajun seafood restaurant, opened a 5,536 square foot restaurant, adding another food offering at the Staten Island Mall Property. In addition to these newly signed leases, the borrower has signed a 10-year lease with Uniqlo to occupy 10,929 square feet, which is expected to commence in November 2024 and is included in underwritten base rent.
As of October 31, 2023 TTM, sales for the in-line (<10,000 square feet) tenant category are $765 per square foot, with an occupancy cost ratio of 13.9%. Excluding Apple, the in-line (<10,000 square feet) tenant sales are $628 per square foot, with an occupancy cost ratio of 17.0%. The major tenants (>10,000 square feet) have experienced growth since the COVID-19 pandemic, reaching October 31, 2023 TTM sales of $37.9 million ($236 per square foot), a 5.2% increase from 2019 sales of $36.1 million ($225 per square foot).
THE INFORMATION IN THIS STRUCTURAL AND COLLATERAL TERM SHEET IS NOT COMPLETE AND MAY BE AMENDED PRIOR TO THE TIME OF SALE. THIS TERM SHEET IS NOT AN OFFER TO SELL THESE SECURITIES AND IT IS NOT A SOLICITATION OF AN OFFER TO BUY THESE SECURITIES IN ANY JURISDICTION WHERE THE OFFER OR SALE IS NOT PERMITTED. |
| | 130 | |
| Structural and Collateral Term Sheet | | BMO 2024-5C4 |
| No. 10 – Staten Island Mall |
The following table presents tenant sales history for the Staten Island Mall Property:
Historical Sales |
Tenancy Type | 2019 Sales | 2019 PSF(1) | 2020 Sales | 2020 PSF(1) | 2021 Sales | 2021 PSF(1) | 2022 Sales | | TTM Sales(2) | |
| Anchor | $19,348,080 | $203 | $11,665,021 | $122 | $4,812,283 | $51 | $14,946,714 | $157 | $18,112,475 | $190 |
| Major (> 10,000 SF) | $36,053,132 | $225 | $28,514,242 | $178 | $27,589,556 | $172 | $39,111,833 | $244 | $37,935,043 | $236 |
| Inline (< 10,000 SF)(3) | $198,823,588 | $816 | $109,228,240 | $435 | $197,610,950 | $775 | $198,565,374 | $762 | $197,182,104 | $765 |
| Inline (< 10,000 SF) excluding Apple | $156,300,975 | $654 | $86,304,641 | $350 | $159,814,024 | $638 | $160,124,694 | $625 | $158,932,145 | $628 |
| Total Sales | $254,224,800 | $509 | $149,407,502 | $295 | $230,012,789 | $450 | $252,623,922 | $489 | $253,229,623 | $493 |
| (1) | Based on the underwritten rent roll dated November 30, 2023. |
| (2) | TTM is as of October 31, 2023. |
| (3) | Several Inline (<10,000 SF) tenants at the property do not report sales. |
Major Tenants. The three largest tenants based on underwritten base rent are AMC Theatres, Zara and Primark.
AMC Theatres (54,000 square feet; 5.4% of net rentable area; 6.8% of underwritten base rent) is a large movie exhibition company in the United States and worldwide. As of year-end 2022, the company operates over 2,800 screens in over 350 European theatres along with over 7,500 screens in 586 American theatres. At the Staten Island Mall Property, AMC Theatres features 11 screens, has a lease expiration in February 2034, and produced October 31, 2023 TTM sales of $10,181,272 ($925,570 per screen), which in 2019 was $9,464,419 ($860,402 per screen). There are no termination options and there are three five-year extension options.
Zara (29,141 square feet; 2.9% of net rentable area; 5.1% of underwritten base rent): is a Spanish multi-national clothing chain with operations in over 90 countries that was founded in 1974. Headquartered in Artexio, Spain, the company acts as the flagship brand of the Inditex Group with over 547 stores in Spain, 229 stores in China, 145 stores in France and 98 stores in the United States. In May 2021, Zara expanded its product offerings with its first beauty line, Zara Beauty. At the Staten Island Mall Property, Zara has a lease expiration in April 2028. The tenant had sales of $419 PSF as of October 31, 2023 TTM. Zara has the right to terminate its lease if its net sales from the leased premises fail to exceed $12,000,000 during the measuring period beginning on the first day of the 49th full calendar month following the date the tenant opened for business, (the “Open Date”) and ending on the last day of the 60th full calendar month following the Open Date, upon written notice delivered on or before the 120th day following the end of the measuring period. If such notice is given, the lease will terminate 365 days after such notice is received by the landlord. There are no extension options.
Primark (73,647 square feet; 7.4% of net rentable area; 4.9% of underwritten base rent) is an international clothing retailer headquartered in Dublin, Ireland with outlets across Europe and the United States. The company was established in 1969 in Ireland and in 2006 began expanding into the rest of Europe by opening stores in Spain, The Netherlands, Portugal, Germany, Belgium and other European countries. In 2015, the company opened its first store in the United States in Boston. The company operates with 72,000 team members in 15 countries. At the Staten Island Mall Property, Primark has occupied its 73,647 square foot location since 2017 and has a lease expiration in June 2027. Primark does not report sales. There are four five-year extension options.
Appraisal. The appraiser concluded to an “as-is” value for the Staten Island Mall Property of $467,000,000 as of August 22, 2023
| Appraisal Valuation Summary(1) |
| Appraisal Approach | Appraised Value | Capitalization Rate(2) |
| Income Capitalization Approach | $467,000,000 | 7.50% |
| (2) | The appraiser used an income capitalization approach to arrive at the appraised value. The capitalization rate shown above represents the overall capitalization rate. |
Environmental. The Phase I environmental site assessment dated September 5, 2023 identified a recognized environmental condition associated with contaminated soils. All remedial work has been completed, subject to the New York City Office of Environmental Remediation’s final approval and issuance of a notice of completion. See “Description of the Mortgage Pool – Environmental Considerations” in the Preliminary Prospectus.
THE INFORMATION IN THIS STRUCTURAL AND COLLATERAL TERM SHEET IS NOT COMPLETE AND MAY BE AMENDED PRIOR TO THE TIME OF SALE. THIS TERM SHEET IS NOT AN OFFER TO SELL THESE SECURITIES AND IT IS NOT A SOLICITATION OF AN OFFER TO BUY THESE SECURITIES IN ANY JURISDICTION WHERE THE OFFER OR SALE IS NOT PERMITTED. |
| | 131 | |
| Structural and Collateral Term Sheet | | BMO 2024-5C4 |
| No. 10 – Staten Island Mall |
The following table presents certain information relating to the historical occupancy of the Staten Island Mall Property:
| Historical and Current Occupancy(1) |
| 2020 | 2021 | 2022 | Current(2) |
| 83.1% | 83.8% | 84.0% | 87.3% |
| (1) | Historical Occupancies are as of December 31 of each respective year, unless otherwise specified. |
| (2) | Based on the underwritten rent roll dated November 30, 2023. |
The following table presents certain information relating to the major tenants (of which, certain tenants may have
co-tenancy provisions) at the Staten Island Mall Property:
| Top Tenant Summary(1) |
| Tenant | Ratings
Moody’s/S&P/Fitch(2) | Net Rentable Area (SF) | % of
Total NRA | UW
Base Rent PSF |
UW
Base Rent | % of Total
UW Base Rent | Lease
Exp. Date |
| AMC Theatres | Caa2/CCC+/NR | 54,000 | 5.4 | % | $41.78 | $2,256,000 | 6.8 | % | 2/28/2034 |
| Zara(3) | NR/NR/NR | 29,141 | 2.9 | | $57.96 | 1,689,120 | 5.1 | | 4/30/2028 |
| Primark | NR/A/NR | 73,647 | 7.4 | | $22.00 | 1,620,234 | 4.9 | | 6/30/2027 |
| Lidl | NR/NR/NR | 37,403 | 3.8 | | $42.35 | 1,584,017 | 4.8 | | 1/31/2039 |
| Dave & Buster’s | NR/NR/NR | 41,241 | 4.1 | | $38.00 | 1,567,158 | 4.7 | | 1/31/2033 |
| The Container Store | NR/B/NR | 24,075 | 2.4 | | $41.80 | 1,006,335 | 3.0 | | 2/28/2033 |
| H&M(4) | NR/BBB/NR | 25,471 | 2.6 | | $37.12 | 945,420 | 2.9 | | 1/31/2030 |
| Barnes & Noble Bookseller | NR/NR/NR | 20,084 | 2.0 | | $42.50 | 853,570 | 2.6 | | 1/31/2029 |
| Hobby Lobby | NR/NR/NR | 42,768 | 4.3 | | $17.00 | 727,056 | 2.2 | | 5/31/2033 |
| Express | NR/NR/NR | 12,928 | 1.3 | | $51.25 | 662,560 | 2.0 | | 1/31/2025 |
| Ten Largest Owned Tenants(5) | | 360,758 | 36.2 | % | $35.79 | $12,911,470 | 39.1 | % | |
| Remaining Owned Tenants | | 508,219 | 51.0 | | $39.57 | 20,108,716 | 60.9 | | |
| Total Occupied | | 868,977 | 87.3 | % | $38.00 | $33,020,186 | 100.0 | % | |
| Vacant Spaces (Owned Space) | | 126,923 | 12.7 | | | | | |
| Totals / Wtd. Avg. All Owned Tenants | | 995,900 | 100.0 | % | | | | |
| (1) | Based on the underwritten rent roll dated November 30, 2023. |
| (2) | In certain instances, ratings provided are those of the parent company of the entity shown, whether or not the parent company guarantees the lease. |
| (3) | Zara has the right to terminate its lease if its net sales from the leased premises fail to exceed $12,000,000 during the measuring period beginning on the first day of the 49th full calendar month following the date the tenant opened for business, (the “Open Date”) and ending on the last day of the 60th full calendar month following the Open Date, upon written notice delivered on or before the 120th day following the end of the measuring period. If such notice is given, the lease will terminate 365 days after such notice is received by the landlord. |
| (4) | H&M has the right to terminate its lease if its net sales from the leased premises fail to exceed (i) $6,874,269 in the fourth full lease year after the rental commencement date or (ii) $7,151,989.47 in the sixth full lease year after the rental commencement date, in each case upon not less than 365 days’ notice given within 180 days following the end of the applicable measuring period. |
| (5) | XXI Forever is excluded from the top ten tenants because they are not currently paying base rent. |
THE INFORMATION IN THIS STRUCTURAL AND COLLATERAL TERM SHEET IS NOT COMPLETE AND MAY BE AMENDED PRIOR TO THE TIME OF SALE. THIS TERM SHEET IS NOT AN OFFER TO SELL THESE SECURITIES AND IT IS NOT A SOLICITATION OF AN OFFER TO BUY THESE SECURITIES IN ANY JURISDICTION WHERE THE OFFER OR SALE IS NOT PERMITTED. |
| | 132 | |
| Structural and Collateral Term Sheet | | BMO 2024-5C4 |
| No. 10 – Staten Island Mall |
The following table presents certain information relating to the top tenant sales at the Staten Island Mall Property:
| Top Tenants by Total Sales(1) |
| Tenant Name | Tenant SF | 2021 Sales | 2021 Sales PSF | 2022 Sales | 2022 Sales PSF | TTM 10/31/2023 Sales | TTM 10/31/2023 Sales PSF | TTM 10/31/2023 Occupancy Cost |
| Dave & Busters | 41,241 | | $4,585,015 | $111 | $6,798,354 | $165 | $7,931,203 | $192 | 30.3% |
| AMC Theatres | 54,000 | | $227,268 | $4 | $8,148,360 | $151 | $10,181,272 | $189 | 22.2% |
| Primark | 73,647 | | NAV | NAV | NAV | NAV | NAV | NAV | NAV |
| LIDL | 37,403 | | NAV | NAV | NAV | NAV | NAV | NAV | NAV |
| XXI Forever | 17,143 | | $3,181,970 | $186 | $2,736,207 | $160 | $2,339,787 | $136 | 0.0% |
| H&M | 25,471 | | $5,454,584 | $214 | $5,771,924 | $227 | $5,666,392 | $222 | 18.8% |
| Ulta Beauty | 10,170 | | $2,428,999 | $239 | $2,428,999 | $239 | $2,428,999 | $239 | 24.4% |
| Uniqlo | 10,929 | | NAV | NAV | NAV | NAV | NAV | NAV | NAV |
| Zara | 29,141 | | $2,295,898 | $79 | $11,937,958 | $410 | $12,202,782 | $419 | 14.5% |
| Barnes & Noble Bookseller | 20,084 | | $2,580,992 | $129 | $3,766,049 | $188 | $3,756,858 | $187 | 22.8% |
| (1) | All sales information presented herein with respect to the Staten Island Mall Property is sourced from information provided by the borrower sponsor. |
The following table presents certain information relating to the lease rollover schedule at the Staten Island Mall Property:
| Lease Rollover Schedule(1)(2) |
| Year | Number of Leases Expiring | Net Rentable Area Expiring | % of NRA Expiring | UW Base Rent Expiring | % of UW Base Rent Expiring | Cumulative Net Rentable Area Expiring | Cumulative % of NRA Expiring | Cumulative UW Base Rent Expiring | Cumulative % of UW Base Rent Expiring |
| Vacant | NAP | 126,923 | 12.7% | NAP | NAP | 126,923 | 12.7% | | NAP | NAP |
| MTM & 2024 | 39 | 127,620 | 12.8 | $2,313,310 | 7.0% | 254,543 | 25.6% | | $2,313,310 | 7.0% |
| 2025 | 38 | 107,281 | 10.8 | 5,059,889 | 15.3% | 361,824 | 36.3% | | $7,373,199 | 22.3% |
| 2026 | 17 | 60,152 | 6.0 | 2,401,754 | 7.3% | 421,976 | 42.4% | | $9,774,953 | 29.6% |
| 2027 | 19 | 142,425 | 14.3 | 4,218,491 | 12.8% | 564,401 | 56.7% | | $13,993,444 | 42.4% |
| 2028 | 25 | 82,873 | 8.3 | 4,852,666 | 14.7% | 647,274 | 65.0% | | $18,846,111 | 57.1% |
| 2029 | 10 | 54,184 | 5.4 | 3,371,346 | 10.2% | 701,458 | 70.4% | | $22,217,457 | 67.3% |
| 2030 | 5 | 41,232 | 4.1 | 1,406,524 | 4.3% | 742,690 | 74.6% | | $23,623,981 | 71.5% |
| 2031 | 2 | 1,030 | 0.1 | 85,602 | 0.3% | 743,720 | 74.7% | | $23,709,583 | 71.8% |
| 2032 | 6 | 16,981 | 1.7 | 735,198 | 2.2% | 760,701 | 76.4% | | $24,444,781 | 74.0% |
| 2033 & Beyond | 13 | 235,199 | 23.6 | 8,575,405 | 26.0% | 995,900 | 100.0% | | $33,020,186 | 100.0% |
| Total | 174 | 995,900 | 100.0% | $33,020,186 | 100.0% | | | | |
| (1) | Based on the underwritten rent roll dated November 30, 2023. |
| (2) | Certain tenants may have termination options that are not considered in the above lease rollover schedule. |
THE INFORMATION IN THIS STRUCTURAL AND COLLATERAL TERM SHEET IS NOT COMPLETE AND MAY BE AMENDED PRIOR TO THE TIME OF SALE. THIS TERM SHEET IS NOT AN OFFER TO SELL THESE SECURITIES AND IT IS NOT A SOLICITATION OF AN OFFER TO BUY THESE SECURITIES IN ANY JURISDICTION WHERE THE OFFER OR SALE IS NOT PERMITTED. |
| | 133 | |
| Structural and Collateral Term Sheet | | BMO 2024-5C4 |
| No. 10 – Staten Island Mall |
The following table presents certain information relating to the operating history and underwritten cash flows of the Staten Island Mall Property:
| Operating History and Underwritten Net Cash Flow |
| | 2019 | 2020 | 2021 | 2022 | TTM 10/31/2023 | Underwritten | Per Square Foot | %(1) |
| Rents in Place(2) | $38,297,987 | $35,160,641 | $31,511,074 | $33,302,007 | $33,191,879 | $33,020,186 | | $33.16 | | 51.5% | |
| Rent Steps(3) | 0 | 0 | 0 | 0 | 0 | 647,911 | | 0.65 | | 1.0 | |
| Vacant Income | 0 | 0 | 0 | 0 | 0 | 9,103,273 | | 9.14 | | 14.2 | |
| Gross Potential Rent | $38,297,987 | $35,160,641 | $31,511,074 | $33,302,007 | $33,191,879 | $42,771,370 | | $42.95 | | 66.7% | |
| Total Reimbursements | 28,837,736 | 26,841,040 | 18,268,336 | 19,230,163 | 21,224,797 | 21,343,090 | | 21.43 | | 33.3 | |
| Net Rental Income | $67,135,723 | $62,001,681 | $49,779,410 | $52,532,170 | $54,416,676 | $64,114,460 | | $64.38 | | 100.0% | |
| Other Income | 9,849,626 | 5,151,946 | 8,136,933 | 9,628,520 | 9,322,478 | 8,850,085 | | 8.89 | | 13.8 | |
| (Vacancy/Credit Loss) | (448,500) | (4,564,271) | (1,862,967) | 2,597,330 | (1,037,038) | (9,103,273) | | (9.14) | | (14.2) | |
| Effective Gross Income | $76,536,848 | $62,589,356 | $56,053,376 | $64,758,020 | $62,702,116 | $63,861,272 | | $64.12 | | 99.6% | |
| Total Expenses(4) | 35,170,586 | 31,986,808 | 32,087,459 | 31,478,198 | 26,119,900 | 30,795,311 | | 30.92 | | 48.2 | |
| Net Operating Income | $41,366,262 | $30,602,548 | $23,965,918 | $33,279,822 | $36,582,216 | $33,065,961 | | $33.20 | | 51.8% | |
| Total TI/LC, Capex/RR | 0 | 0 | 0 | 0 | 0 | 1,195,080 | | 1.20 | | 1.9 | |
| Net Cash Flow | $41,366,262 | $30,602,548 | $23,965,918 | $33,279,822 | $36,582,216 | $31,870,881 | | $32.00 | | 49.9% | |
| (1) | % column represents percent of Net Rental Income for all revenue lines and represents percent of Effective Gross Income for the remainder of fields. |
| (2) | Based on the underwritten rent roll dated November 30, 2023. |
| (3) | Includes underwritten rent steps through January 1, 2025. |
| (4) | Total Expenses include real estate taxes. Portions of the Staten Island Mall Property benefit from either a New York City Industrial and Commercial Incentive Program (“ICIP”) exemption or a New York City Industrial & Commercial Abatement Program (“ICAP”) abatement. Real estate taxes were underwritten based on the appraisal real estate taxes for the 2023/2024 tax year, less the ICIP/ICAP abatement amounts shown in the appraisal for such tax year. There is one parcel (Block 2400 Lot 77) for which real estate taxes were not underwritten as the tenant is directly responsible for taxes. |
The Market. The Staten Island Mall Property is located in the heart of Staten Island, New York the southernmost of New York City’s five boroughs. The Staten Mall Property is located along Richmond Avenue between Platinum Road and Richmond Hill Road in the New Springville neighborhood of Staten Island. New Springville is located within the central portion of Staten Island, which is a primary residential neighborhood with excellent access to Richmond Avenue, the prime retail / commercial area in Staten Island.
Being located in the New York City market, the Staten Island Mall Property benefits from a large local consumer base. There are a variety of large industries in Staten Island, with the top employers including Global Container Terminal, Amazon Fulfillment Center, Matrix Global Logistics Park, Pratt Mill Paper Industry, and the Corporate Park of Staten Island. Collectively, these companies employ over 25,000 people. As of 2022, within a 10 and 20 minute drive of the Staten Island Mall Property, the population was 53,743 and 390,102, respectively with an average household income of $127,282 and $121,680, respectively.
The Staten Island Mall Property is located within the New York City retail market and the Staten Island retail submarket. According to a third party report, as of December 2023, the vacancy rate in the submarket was 5.1%. The total submarket is comprised of 20,474,522 square feet with only 3,015 square feet currently under construction. Average rents as of December 2023 were $37.08 per square foot, which is a 2.7% increase from where they were a year ago. In the past three years, rents have increased a cumulative 8.3%.
THE INFORMATION IN THIS STRUCTURAL AND COLLATERAL TERM SHEET IS NOT COMPLETE AND MAY BE AMENDED PRIOR TO THE TIME OF SALE. THIS TERM SHEET IS NOT AN OFFER TO SELL THESE SECURITIES AND IT IS NOT A SOLICITATION OF AN OFFER TO BUY THESE SECURITIES IN ANY JURISDICTION WHERE THE OFFER OR SALE IS NOT PERMITTED. |
| | 134 | |
| Structural and Collateral Term Sheet | | BMO 2024-5C4 |
| No. 10 – Staten Island Mall |
The following table presents certain information relating to competitive retail centers for the Staten Island Mall Property:
| Competitive Retail Centers(1) |
| Property Name | Year Built/ Renovated | GLA (SF) | Occupancy | Estimated # of Customers | Anchor / Major Tenants |
| Staten Island Mall | 1972 / 1993, 2018 | 1,462,822(2) | 87.3%(2) | 11,800,000 | AMC, Zara, Primark |
| Woodbridge Center | 1971 / 2003 | 1,661,324 | 67.0% | 6,400,000 | Boscov’s, JC Penney, Macy’s |
| Menlo Park Mall | 1960 / 2015 | 1,323,156 | 90.0% | 10,400,000 | Macy’s, Nordstrom, AMC |
| The Mills at Jersey Gardens | 1999 / NAP | 1,301,776 | 100.0% | 10,100,000 | Bed, Bath & Beyond, Burlington, Cohoes, Forever XXI, Lowes Cineplex, Marshalls, Neiman Marcus Last Call, Portabella, Saks Off Fifth Avenue |
| Newport Centre | 1987 / 2002 | 1,149,147 | 92.0% | 5,900,000 | JC Penney, Sears, Macy’s, Kohl’s, AMC |
| Kings Plaza | 1970 / 2018 | 1,146,000 | 99.0% | 7,600,000 | Lowe’s, Macy’s, Primark, Target |
| Wtd. Avg. Competitive Set | | | 88.1%(3) | 8,057,674(3) | |
| (1) | Source: Appraisal, unless otherwise specified. |
| (2) | Based on the underwritten rent roll as of November 30, 2023. Includes 466,922 square feet of non-collateral space. Occupancy for the Staten Island Mall Property is as of November 30, 2023. |
| (3) | Excludes subject property. |
The Borrowers. The borrowers are GGP Staten Island Mall, LLC and Staten Island FS Anchor Parcel LLC, each a Delaware limited liability company and single purpose entity with two independent directors. Legal counsel to the borrowers delivered a non-consolidation opinion in connection with the origination of the Staten Island Mall Whole Loan.
The Borrower Sponsor. The non-recourse carve-out guarantor is BPR Nimbus LLC. BPR Nimbus LLC is a subsidiary of Brookfield Properties (“BPR”).
The non-recourse carveout guarantor’s recourse obligations with respect to bankruptcy or insolvency related events is capped at 20% of the outstanding principal balance of the Staten Island Mall Whole Loan, plus third party costs actually incurred by the lender (including reasonable attorneys’ fees and costs) in connection with collection of amounts due under the non-recourse carveout guaranty.
Brookfield Properties is one of the largest fully integrated, global real estate services companies in the world with over $900 billion in assets under management. BPR ranks among the largest retail real estate companies in the United States with a portfolio of malls that spans across more than 160 retail centers, representing over 130 million square feet of retail space. The company is focused exclusively on managing, leasing and redeveloping high-quality retail properties. BPR is headquartered in Chicago and owned by affiliates of Brookfield Asset Management (NYSE: BAM).
Property Management. The Staten Island Mall Property is managed by Brookfield Properties Retail Inc., an affiliate of the non-recourse carveout guarantor.
Escrows and Reserves. At origination, the borrowers deposited approximately $4,580,787 into a TI/LC reserve and $403,197 into a gap rent reserve.
Tax Escrows – During the continuance of a Cash Management Period (as defined below), the borrowers are required to escrow 1/12th of the annual estimated tax payments payable during the next ensuing 12 months on a monthly basis.
Insurance Escrows – During the continuance of a Cash Management Period, the borrowers are required to escrow 1/12th of the annual estimated insurance payments on a monthly basis, unless no event of default is continuing as to which the lender has initiated an enforcement action and the Staten Island Mall Property is insured under a blanket policy meeting the requirements set forth in the related loan agreement (in which case, no insurance escrows will be required, notwithstanding the continuance of a Cash Management Period).
Replacement Reserve – During the continuance of a Cash Management Period, the borrowers are required to deposit monthly, with or on behalf of the lender, an amount equal to the owned leasable square feet of the Staten Island Mall Property multiplied by $0.25 and divided by 12 (initially, approximately $20,748) into a replacement reserve account subject to a cap of 24 times the required monthly deposit (initially, $497,950).
THE INFORMATION IN THIS STRUCTURAL AND COLLATERAL TERM SHEET IS NOT COMPLETE AND MAY BE AMENDED PRIOR TO THE TIME OF SALE. THIS TERM SHEET IS NOT AN OFFER TO SELL THESE SECURITIES AND IT IS NOT A SOLICITATION OF AN OFFER TO BUY THESE SECURITIES IN ANY JURISDICTION WHERE THE OFFER OR SALE IS NOT PERMITTED. |
| | 135 | |
| Structural and Collateral Term Sheet | | BMO 2024-5C4 |
| No. 10 – Staten Island Mall |
TI/LC Escrows – During the continuance of a Cash Management Period, the borrowers are required to deposit monthly, with or on behalf of the lender, an amount equal to the owned leasable square feet of the Staten Island Mall Property multiplied by $1.00 and divided by 12 (initially, approximately $82,992) into a replacement reserve account subject to a cap of 24 times the required monthly deposit (initially, $1,991,800).
Anchor Tenant Reserve – During the continuance of an Anchor Tenant Trigger Event (as defined below), the borrowers are required to deposit monthly an amount equal to all initial excess cash flow with respect to any particular interest period for tenant improvements and leasing commissions, budgeted construction costs, required landlord work and other related costs associated with re-tenanting the applicable space.
Lockbox / Cash Management. The Staten Island Mall Whole Loan is structured with a hard lockbox and springing cash management. All rents from the Staten Island Mall Property are required to be deposited directly into a lockbox account controlled by the lender (the “Lockbox Account”), pursuant to written instructions delivered to all tenants under leases (excluding seasonal leases and excluding tenants which have already been instructed to deposit rents into the Lockbox Account), and any rents otherwise received by borrowers or the property manager are required to be deposited into the Lockbox Account within two business days after receipt. Prior to a Cash Management Period, the borrowers may utilize the Lockbox Account as the borrowers’ operating account. During the continuance of a Cash Management Period, the borrowers will no longer have access to the Lockbox Account, and all funds deposited into the Lockbox Account are required to be swept on each business day into a deposit account controlled by the lender (the “Cash Collateral Account”), to be applied and disbursed in accordance with the Staten Island Mall Whole Loan documents, provided no Cut-off Event (as defined below) is continuing, to pay debt service, the reserves and escrows described above, budgeted operating expenses, lender-approved extraordinary expenses, and capital projects undertaken in accordance with the loan documents. During the continuance of a Cash Sweep Period (as defined below), any excess cash is required to be deposited into an eligible account (the “Excess Cash Flow Reserve Account”) and held by the lender as additional security for the Staten Island Mall Whole Loan; provided, that, funds on deposit in the Excess Cash Flow Reserve Account will be made available to the borrowers for the payment of certain property-level expenses and other uses as set forth in the Staten Island Mall Whole Loan documents, including required REIT distributions in an amount up to $200,000. All sums remaining on deposit in the Excess Cash Flow Reserve Account will be disbursed to the borrowers on the earlier to occur of (i) payment in full of the debt, (ii) a defeasance event or (iii) discontinuation of a Cash Sweep Period.
A “Cut-off Event” means the occurrence of an event of default and the earlier of (i) an enforcement action (which has not been cured) or (ii) the tendering of a deed in lieu of foreclosure.
A “Cash Management Period” will commence upon the debt yield dropping below 11.0% as of the end of two consecutive calendar quarters, and will cease and terminate upon (A) the date that the debt yield is equal to or in excess of 11.0% for two consecutive calendar quarters or (B) delivery to lender of debt yield cure collateral or receipt by Lender of a debt yield cure prepayment, in each case, in satisfaction of the conditions set forth in the Staten Island Mall Loan documents.
A “Cash Sweep Period” will commence upon (i) an event of default (ii) the occurrence of the debt yield dropping below 10.50% as of the end of two consecutive calendar quarters, and will cease and terminate upon (A) the date that the debt yield is equal to or in excess of 10.50% for two consecutive calendar quarters or (B) delivery to lender of debt yield cure collateral or receipt by Lender of a debt yield cure prepayment, in each case, in satisfaction of the conditions set forth in the Staten Island Mall Loan documents or (C) in the case of a Cash Sweep Period due to the occurrence of an event of default if such event of default is thereafter cured or waived.
An “Anchor Tenant Trigger Event” means any Anchor Tenant (as defined below) (i) has “gone dark”, (ii) is the subject of a bankruptcy proceeding, (iii) has vacated its premises (or has given written notice of its intention to vacate), (iv) has terminated, canceled or surrendered its Anchor Lease (or delivered written notice of its intent to do so), or (v) fails to renew its Anchor Lease (as defined below) within the applicable renewal option period provided in such Anchor Lease.
An “Anchor Tenant” means Macy’s, JC Penney or AMC Theatres.
An “Anchor Lease” means any lease with an Anchor Tenant.
Subordinate and Mezzanine Debt. None.
Permitted Future Mezzanine Debt. Not Permitted.
THE INFORMATION IN THIS STRUCTURAL AND COLLATERAL TERM SHEET IS NOT COMPLETE AND MAY BE AMENDED PRIOR TO THE TIME OF SALE. THIS TERM SHEET IS NOT AN OFFER TO SELL THESE SECURITIES AND IT IS NOT A SOLICITATION OF AN OFFER TO BUY THESE SECURITIES IN ANY JURISDICTION WHERE THE OFFER OR SALE IS NOT PERMITTED. |
| | 136 | |
| Structural and Collateral Term Sheet | | BMO 2024-5C4 |
| No. 10 – Staten Island Mall |
Partial Release. Provided no event of default exists, and subject to REMIC LTV requirements, the borrowers are permitted to release or swap vacant, non-income producing and unimproved parcels (unless these requirements are waived by Lender), non-income producing parcels improved only by landscaping, or non-income producing parcels improved only by surface parking areas, and also acquire any parcels that may constitute an integral part of an individual property subject to adequate parking and other customary requirements to be set forth in the Staten Island Mall Whole Loan documents.
The loan documents provide for the release of certain portions of the property (“exchange parcels”) in connection with the corresponding acquisition and encumbrance of other acquired parcels (“substitutions”), subject to payment of lender’s reasonable out-of-pocket fees and expenses and certain other conditions. See “Description of the Mortgage Pool—Certain Terms of the Mortgage Loans—Releases; Partial Releases; Property Additions” in the Preliminary Prospectus.
Ground Lease. None.
Terrorism Insurance. The borrowers are required to obtain and maintain property insurance and business interruption insurance for 36 months. Such insurance is required to cover acts of terror or similar acts of sabotage; provided that if the Terrorism Risk Insurance Program Reauthorization Act of 2019 (as further modified, amended or extended) is no longer in effect, the borrowers will only be required to pay for terrorism insurance up to a maximum of 200% of the then annual insurance premiums payable for the Staten Island Mall Property at the time with respect to stand-alone property and business income or rental income insurance interruption policies. See “Risk Factors—Risks Relating to the Mortgage Loans—Terrorism Insurance May Not Be Available for All Mortgaged Properties” in the Preliminary Prospectus.
THE INFORMATION IN THIS STRUCTURAL AND COLLATERAL TERM SHEET IS NOT COMPLETE AND MAY BE AMENDED PRIOR TO THE TIME OF SALE. THIS TERM SHEET IS NOT AN OFFER TO SELL THESE SECURITIES AND IT IS NOT A SOLICITATION OF AN OFFER TO BUY THESE SECURITIES IN ANY JURISDICTION WHERE THE OFFER OR SALE IS NOT PERMITTED. |
| | 137 | |
| Structural and Collateral Term Sheet | | BMO 2024-5C4 |
| No. 11 – Rialto I & II |
| Mortgage Loan Information | | Property Information |
| Mortgage Loan Seller: | AREF2 | | Single Asset / Portfolio: | Single Asset |
| Original Principal Balance: | $30,000,000 | | Title: | Fee |
| Cut-off Date Principal Balance: | $30,000,000 | | Property Type – Subtype: | Office – Suburban |
| % of IPB: | 3.5% | | Net Rentable Area (SF): | 155,483 |
| Loan Purpose: | Refinance | | Location: | Austin, TX |
| Borrower: | Rialto Owner LLC | | Year Built / Renovated: | 2002, 2006 / NAP |
| Borrower Sponsors: | Roy Bajtel and Joel Sher | | Occupancy: | 91.5% |
| Interest Rate: | 8.14300% | | Occupancy Date: | 3/15/2024 |
| Note Date: | 3/19/2024 | | 4th Most Recent NOI (As of): | $3,142,467 (12/31/2020) |
| Maturity Date: | 4/6/2029 | | 3rd Most Recent NOI (As of): | $3,379,982 (12/31/2021) |
| Interest-only Period: | 60 months | | 2nd Most Recent NOI (As of): | $3,339,911 (12/31/2022) |
| Original Term: | 60 months | | Most Recent NOI (As of)(2): | $3,415,473 (TTM 12/31/2023) |
| Original Amortization Term: | None | | UW Economic Occupancy: | 92.0% |
| Amortization Type: | Interest Only | | UW Revenues: | $6,323,608 |
| Call Protection: | L(25),D(30),O(5) | | UW Expenses: | $2,305,206 |
| Lockbox / Cash Management: | Hard / Springing | | UW NOI(2): | $4,018,401 |
| Additional Debt: | No | | UW NCF: | $3,881,822 |
| Additional Debt Balance: | N/A | | Appraised Value / Per SF: | $44,500,000 / $286 |
| Additional Debt Type: | N/A | | Appraisal Date: | 1/18/2024 |
| | | | | |
| Escrows and Reserves | | Financial Information |
| | Initial | Monthly | Initial Cap | | Cut-off Date Loan / SF: | $193 |
| Taxes: | $260,505 | $65,126 | N/A | | Maturity Date Loan / SF: | $193 |
| Insurance: | $98,750 | $7,596 | N/A | | Cut-off Date LTV: | 67.4% |
| Replacement Reserves: | $0 | $2,591 | N/A | | Maturity Date LTV: | 67.4% |
| TI / LC Reserve: | $500,000 | $12,957 | $950,000 | | UW NCF DSCR: | 1.57x |
| Other Reserves(1): | $28,301 | $0 | N/A | | UW NOI Debt Yield: | 13.4% |
| | | | | | | |
| Sources and Uses |
| Sources | Proceeds | % of Total | | | Uses | Proceeds | % of Total |
| Mortgage Loan | $30,000,000 | 78.7 | % | | Loan Payoff | $36,760,745 | 96.4 | % |
| Sponsor Equity | 8,133,450 | 21.3 | | | Upfront Reserves | 887,556 | 2.3 | |
| | | | | Closing Costs | 485,149 | 1.3 | |
| Total Sources | $38,133,450 | 100.0 | % | | Total Uses | $38,133,450 | 100.0 | % |
| (1) | Other Reserves consist of a Free Rent Reserve ($25,921) and an Outstanding TI Reserve ($2,380). |
| (2) | The increase from Most Recent NOI to UW NOI is primarily due to new and renewal leases that commenced in 2023 and 2024 encompassing 12.8% of the net rentable area and total underwritten rent steps of $97,356 through February 2025. |
The Loan. The eleventh largest mortgage loan (the “Rialto I & II Mortgage Loan”) is secured by the borrower’s fee interest in a 155,483 square foot, suburban office property located in Austin, Texas (the “Rialto I & II Property”). The Rialto I & II Mortgage Loan was originated on March 19, 2024 by Argentic Real Estate Finance 2 LLC. The Rialto I & II Mortgage Loan accrues interest at an interest rate of 8.14300% per annum on an Actual/360 basis. The Rialto I & II Mortgage Loan has an original term of 60 months, has a remaining term of 59 months and is interest only for the entire term. The scheduled maturity date of the Rialto I & II Mortgage Loan is April 6, 2029.
The Property. The Rialto I & II Property is a 155,483 square foot suburban office complex located in Austin, Texas approximately 10 miles west of downtown Austin. The improvements feature two, two-story buildings that were constructed in 2002 and 2006 on a 29.23-acre site. Common amenities at the Rialto I & II Property include a conference facility, controlled access, indoor athletic facility, and a public business center. The Rialto I & II Property features a two-story parking garage offering 205 spaces in addition to 463 surface parking spaces, resulting in a parking ratio of 4.3 spaces per 1,000 square feet.
THE INFORMATION IN THIS STRUCTURAL AND COLLATERAL TERM SHEET IS NOT COMPLETE AND MAY BE AMENDED PRIOR TO THE TIME OF SALE. THIS TERM SHEET IS NOT AN OFFER TO SELL THESE SECURITIES AND IT IS NOT A SOLICITATION OF AN OFFER TO BUY THESE SECURITIES IN ANY JURISDICTION WHERE THE OFFER OR SALE IS NOT PERMITTED. |
| | 138 | |
| Structural and Collateral Term Sheet | | BMO 2024-5C4 |
| No. 11 – Rialto I & II |
As of March 15, 2024, the Rialto I & II Property was 91.5% occupied by 21 tenants. Historical occupancy has been strong, with occupancy averaging 90.6% from 2020 to 2023. The Rialto I & II Property features a granular rent roll, with the largest tenant making up 18.7% of the net rentable area and no other tenant occupying more than 9.3% of the net rentable area.
Major Tenants.
LJA Engineering, Inc. (29,032 square feet; 18.7% of NRA; 19.9% of underwritten base rent). LJA Engineering, Inc. (“LJA”) is a consulting firm that operates in nine comprehensive sectors including public infrastructure, land development, transportation, water resources, energy services, rail services, surveying, construction engineering, and environmental/coastal. LJA specializes in building project teams that are made up of civil, structural, and electrical engineers, plus hydrologists, planners, landscape architects, construction managers, and surveyors. LJA commenced a 122-month lease in 2019 for 19,845 square feet and has since expanded into an additional 9,187 square feet, which spaces are co-terminus with the original lease. LJA has the one-time right to terminate its lease effective April 30, 2026 by delivering written notice to the landlord at least 12 months prior to April 30, 2026. The tenant has one, seven-year renewal option remaining.
RGN-Austin VIII LLC (14,521 square feet; 9.3% of NRA; 8.7% of underwritten base rent). RGN-Austin VIII LLC (“Regus”) is a multinational provider of serviced offices, co-working spaces, business lounges, virtual offices, meeting rooms, and video teleconference services. Regus has been a tenant at the Rialto I & II Property since February 2014 and has a lease expiration in February 2025. The tenant has two, five-year renewal options remaining and no early termination options.
Hospitalists Now, Inc. (14,254 square feet; 9.2% of NRA; 10.3% of underwritten base rent). Hospitalists Now, Inc., doing business as HNI Healthcare, is a technology-enabled physician practice management company focused on the delivery of full-service facility-based physician programs to improve the quality of patient care. The company enables healthcare facilities to improve key quality and performance metrics through a more clinically integrated care model. Hospitalists Now, Inc. has been a tenant at the Rialto I & II Property since 2012 when it commenced a 34-month lease for 3,751 square feet. The tenant has since expanded three times and now occupies 14,254 square feet with a lease expiration in February 2025. The tenant has one, three-year renewal option remaining and no early termination options.
Environmental. According to the Phase I environmental assessment dated January 22, 2024, there was no evidence of any recognized environmental conditions at the Rialto I & II Property.
The following table presents certain information relating to the historical and current occupancy of the Rialto I & II Property:
| Historical and Current Occupancy(1) |
| 2020 | 2021 | 2022 | 2023 | Current(2) |
| 91.9% | 91.4% | 90.3% | 88.8% | 91.5% |
| (1) | Historical occupancies represent the average occupancy over the course of each respective year. |
| (2) | Current occupancy is based on the rent roll dated March 15, 2024. |
THE INFORMATION IN THIS STRUCTURAL AND COLLATERAL TERM SHEET IS NOT COMPLETE AND MAY BE AMENDED PRIOR TO THE TIME OF SALE. THIS TERM SHEET IS NOT AN OFFER TO SELL THESE SECURITIES AND IT IS NOT A SOLICITATION OF AN OFFER TO BUY THESE SECURITIES IN ANY JURISDICTION WHERE THE OFFER OR SALE IS NOT PERMITTED. |
| | 139 | |
| Structural and Collateral Term Sheet | | BMO 2024-5C4 |
| No. 11 – Rialto I & II |
The following table presents certain information relating to the largest tenants based on underwritten base rent of the Rialto I & II Property:
| Top Tenant Summary(1) |
| Tenant | Ratings Moody’s/S&P/Fitch | Net Rentable Area (SF) | % of
Total
NRA | | UW Base Rent PSF | UW Base Rent | % of Total UW Base Rent | Lease Expiration Date |
| LJA(2) | NR/NR/NR | 29,032 | | 18.7 | % | $27.25 | $791,122 | | 19.9 | % | 4/30/2029 |
| Regus | NR/NR/NR | 14,521 | | 9.3 | | $23.75 | 344,874 | | 8.7 | | 2/17/2025 |
| Hospitalists Now, Inc. | NR/NR/NR | 14,254 | | 9.2 | | $28.66 | 408,520 | | 10.3 | | 2/28/2025 |
| Amica Mutual Insurance Company | NR/NR/NR | 13,584 | | 8.7 | | $29.04 | 394,479 | | 9.9 | | 7/31/2027 |
| Sheehy, Ware, Pappas & Grubbs, P.C. | NR/NR/NR | 9,964 | | 6.4 | | $29.35 | 292,457 | | 7.4 | | 3/31/2034 |
| Medici Technologies, LLC | NR/NR/NR | 6,907 | | 4.4 | | $29.26 | 202,121 | | 5.1 | | 10/31/2025 |
| Strategic Partnerships, Inc(3) | NR/NR/NR | 6,599 | | 4.2 | | $27.81 | 183,518 | | 4.6 | | 9/30/2028 |
| Alpha & Omega Semiconductor, Inc. | NR/NR/NR | 5,142 | | 3.3 | | $28.65 | 147,318 | | 3.7 | | 2/28/2025 |
| LNV, Inc. | NR/NR/NR | 5,089 | | 3.3 | | $28.96 | 147,363 | | 3.7 | | 2/28/2026 |
| Flueid Software Corp. | NR/NR/NR | 4,961 | | 3.2 | | $28.75 | 142,629 | | 3.6 | | 8/31/2025 |
| Top Tenants | | 110,053 | | 70.8 | % | $27.75 | $3,054,401 | | 76.8 | % | |
| Remaining Tenants | | 32,227 | | 20.7 | | $28.59 | 921,400 | | 23.2 | | |
| Occupied Collateral Total / Wtd. Avg. | | 142,280 | | 91.5 | % | $27.94 | $3,975,801 | | 100.0 | % | |
| Vacant Space | | 13,203 | | 8.5 | | | | | |
| Collateral Total | | 155,483 | | 100.0 | % | | | | |
| (1) | Based on underwritten rent roll dated March 15, 2024. Includes contractual rent steps through February 2025. |
| (2) | LJA has the right to terminate its lease effective April 30, 2026 by delivering written notice to the landlord at least 12 months prior to April 30, 2026. |
| (3) | Strategic Partnerships, Inc has the right to terminate its lease effective November 30, 2026 by delivering written notice to the landlord at least nine months prior to November 30, 2026. |
The following table presents certain information relating to the tenant lease expirations of the Rialto I & II Property:
| Lease Rollover Schedule(1)(2) |
| Year | Number of Leases Expiring | NRA
Expiring | % of NRA
Expiring | UW Base
Rent
Expiring(3) | | % of UW
Base Rent Expiring(3) | Cumulative Net Rentable Area Expiring | Cumulative
% of NRA Expiring | Cumulative UW Base Rent Expiring(3) | Cumulative% of UW Base Rent Expiring(3) |
| Vacant | NAP | 13,203 | | 8.5 | % | NAP | | NA | P | 13,203 | | 8.5% | | NAP | NAP |
| 2024 & MTM | 3 | 8,624 | | 5.5 | | $248,452 | | 6.2 | % | 21,827 | | 14.0% | | $248,452 | 6.2% |
| 2025 | 5 | 45,785 | | 29.4 | | 1,245,462 | | 31.3 | | 67,612 | | 43.5% | | $1,493,914 | 37.6% |
| 2026 | 4 | 15,322 | | 9.9 | | 449,842 | | 11.3 | | 82,934 | | 53.3% | | $1,943,755 | 48.9% |
| 2027 | 3 | 20,613 | | 13.3 | | 600,096 | | 15.1 | | 103,547 | | 66.6% | | $2,543,851 | 64.0% |
| 2028 | 1 | 6,599 | | 4.2 | | 183,518 | | 4.6 | | 110,146 | | 70.8% | | $2,727,369 | 68.6% |
| 2029 | 2 | 30,038 | | 19.3 | | 819,109 | | 20.6 | | 140,184 | | 90.2% | | $3,546,478 | 89.2% |
| 2030 | 1 | 4,832 | | 3.1 | | 136,866 | | 3.4 | | 145,016 | | 93.3% | | $3,683,345 | 92.6% |
| 2031 | 0 | 0 | | 0.0 | | 0 | | 0.0 | | 145,016 | | 93.3% | | $3,683,345 | 92.6% |
| 2032 | 0 | 0 | | 0.0 | | 0 | | 0.0 | | 145,016 | | 93.3% | | $3,683,345 | 92.6% |
| 2033(4) | 1 | 503 | | 0.3 | | 0 | | 0.0 | | 145,519 | | 93.6% | | $3,683,345 | 92.6% |
| 2034 | 1 | 9,964 | | 6.4 | | 292,457 | | 7.4 | | 155,483 | | 100.0% | | $3,975,801 | 100.0% |
| 2035 & Beyond | 0 | 0 | | 0.0 | | 0 | | 0.0 | | 155,483 | | 100.0% | | $3,975,801 | 100.0% |
| Total | 21 | 155,483 | | 100.0 | % | $3,975,801 | | 100.0 | % | | | | |
| (1) | Based on- the underwritten rent roll dated March 15, 2024. |
| (2) | Certain leases may have termination options that are exercisable prior to the originally stated expiration date of the lease and that are not considered in this Lease Rollover Schedule. |
| (3) | UW Base Rent Expiring, % of UW Base Rent Expiring, Cumulative UW Base Rent Expiring and Cumulative % of UW Base Rent Expiring include contractual rent steps through February 2025. |
| (4) | Includes a 503 square foot management office for which no rent was underwritten. |
THE INFORMATION IN THIS STRUCTURAL AND COLLATERAL TERM SHEET IS NOT COMPLETE AND MAY BE AMENDED PRIOR TO THE TIME OF SALE. THIS TERM SHEET IS NOT AN OFFER TO SELL THESE SECURITIES AND IT IS NOT A SOLICITATION OF AN OFFER TO BUY THESE SECURITIES IN ANY JURISDICTION WHERE THE OFFER OR SALE IS NOT PERMITTED. |
| | 140 | |
| Structural and Collateral Term Sheet | | BMO 2024-5C4 |
| No. 11 – Rialto I & II |
The following table presents certain information relating to the operating history and underwritten cash flows of the Rialto I & II Property:
| Operating History and Underwritten Net Cash Flow(1) |
| | 2020 | 2021 | 2022 | 2023 | Underwritten | Per
Square Foot | %(2) |
| Commercial Rent | $3,398,431 | $3,490,717 | $3,667,088 | $3,391,383 | $3,975,801 | $25.57 | | 63.3 | % |
| Reimbursements | 2,188,121 | 2,105,074 | 2,255,875 | 2,299,676 | 2,305,206 | 14.83 | | 36.7 | |
| Vacancy Gross Up | 0 | 0 | 0 | 0 | 544,490 | 3.50 | | 8.7 | |
| Gross Potential Rent | $5,586,552 | $5,595,790 | $5,922,963 | $5,691,059 | $6,825,498 | $43.90 | | 108.7 | % |
| (Vacancy/Credit Loss) | (145,792) | 0 | 0 | 0 | (544,490) | (3.50 | ) | (8.7 | ) |
| Net Rental Income | $5,440,760 | $5,595,790 | $5,922,963 | $5,691,059 | $6,281,008 | $40.40 | | 100.0 | % |
| Other Income(3) | 38,216 | 104,383 | 61,992 | 42,600 | 42,600 | 0.27 | | 0.7 | |
| Effective Gross Income | $5,478,976 | $5,700,173 | $5,984,955 | $5,733,659 | $6,323,608 | $40.67 | | 100.7 | % |
| Total Expenses | 2,336,508 | 2,320,191 | 2,645,044 | 2,318,186 | 2,305,206 | 14.83 | | 36.5 | |
| Net Operating Income(4) | $3,142,467 | $3,379,982 | $3,339,911 | $3,415,473 | $4,018,401 | $25.84 | | 63.5 | % |
| Capital Expenditures | 0 | 0 | 0 | 0 | 31,097 | 0.20 | | 0.5 | |
| TI/LC(5) | 0 | 0 | 0 | 0 | 105,483 | 0.68 | | 1.7 | |
| Net Cash Flow | $3,142,467 | $3,379,982 | $3,339,911 | $3,415,473 | $3,881,822 | $24.97 | | 61.4 | % |
| (1) | Based on the underwritten rent roll dated March 15, 2024. Includes contractual rent steps through February 2025. |
| (2) | % column represents percent of Net Rental Income for all revenue lines and represents percent of Effective Gross Income for the remainder of the fields. |
| (3) | Other Income includes antenna income and other miscellaneous fees. |
| (4) | The increase from 2023 Net Operating Income to Underwritten Net Operating Income is primarily due to new and renewal leases that commenced in 2023 and 2024 encompassing 12.8% of the net rentable area and total underwritten rent steps of $97,356 through February 2025 |
| (5) | Underwritten TI/LC shown is net of a $50,000 credit for the upfront $500,000 TI/LC Reserve. |
The Market. The Rialto I & II Property is located in Austin, Texas, approximately 10 miles west of downtown Austin. Primary access is provided by Highway 290 and Southwest Parkway. The neighborhood surrounding the Rialto I & II Property benefits from its proximity to Westlake Hills and Rollingwood, which are considered two of Austin’s most prestigious residential neighborhoods. The Rialto I & II Property is located in the Austin-Round Rock, TX Metropolitan Statistical Area (“Austin MSA”). The top three industries in the Austin MSA are professional/scientific/technical services, healthcare/social assistance, and educational services. The Austin MSA has a well-educated labor force, with a high concentration of technology-oriented business and a relatively low cost of doing business. The top 5 employers in the Austin MSA are H-E-B, Ascension Seton, Dell Technologies Inc., Tesla, and St Davids.
According to the appraisal, the 2023 estimated population within a one-, three-, and five-mile radius of the Rialto I & II Property is 7,473, 49,501, and 125,741, respectively. According to the appraisal, the 2023 median household income within the same radii is $84,856, $117,061, and $114,734, respectively.
According to a third-party market research report, the Rialto I & II Property is located in the Southwest office submarket of the Austin – TX market. As of the third quarter of 2023, the Southwest office submarket reported total inventory of approximately 16.9 million square feet with a 15.9% vacancy rate and average asking rent of $43.49 per square foot.
THE INFORMATION IN THIS STRUCTURAL AND COLLATERAL TERM SHEET IS NOT COMPLETE AND MAY BE AMENDED PRIOR TO THE TIME OF SALE. THIS TERM SHEET IS NOT AN OFFER TO SELL THESE SECURITIES AND IT IS NOT A SOLICITATION OF AN OFFER TO BUY THESE SECURITIES IN ANY JURISDICTION WHERE THE OFFER OR SALE IS NOT PERMITTED. |
| | 141 | |
| Structural and Collateral Term Sheet | | BMO 2024-5C4 |
| No. 11 – Rialto I & II |
The following table presents information relating to comparable office leases for the Rialto I & II Property:
| Comparable Office Leases(1) |
| Property / Location | Year Built / Renovated | Gross Building SF | Tenant SF | Tenant | Rent PSF | Commencement Date | Lease Term (Yrs.) | Lease Type |
| Rialto I & II | 2002, 2006 / NAP | 155,483(2) | 29,032(2) | LJA Engineering, Inc. | $27.25(2) | Mar-19(2) | 10.2(2) | NNN |
| Austin, TX |
| Uplands Corporate Center | 2007 / 2021 | 291,450 | 19,601 | Kimley Horn | $29.00 | Sep-21 | 5.4 | NNN |
| Austin, TX |
| Travis Oaks | 2002 / NAP | 123,513 | 3,880 | Halff International Associates | $29.00 | Apr-23 | 6.0 | NNN |
| Austin, TX |
| Encino Trace I and II | 2015 / NAP | 320,488 | 29,038 | Progressive Casualty Insurance | $28.00 | Feb-24 | 5.5 | NNN |
| Austin, TX |
| One - Four Barton Skyway | 1999 / NAP | 786,845 | 10,041 | Cadence McShane | $31.50 | Mar-24 | 7.4 | NNN |
| Austin, TX |
| Parkway at Oak Hill | 2007 / NAP | 145,789 | 1,297 | AG&E | $28.25 | Apr-23 | 5.5 | NNN |
| Austin, TX |
| Wild Basin II | 1986 / NAP | 70,745 | 1,004 | Sensuron | $26.50 | Apr-23 | 1.0 | NNN |
| Austin, TX |
| (1) | Source: Appraisal unless otherwise indicated. |
| (2) | Based on the underwritten rent roll dated March 15, 2024. |
THE INFORMATION IN THIS STRUCTURAL AND COLLATERAL TERM SHEET IS NOT COMPLETE AND MAY BE AMENDED PRIOR TO THE TIME OF SALE. THIS TERM SHEET IS NOT AN OFFER TO SELL THESE SECURITIES AND IT IS NOT A SOLICITATION OF AN OFFER TO BUY THESE SECURITIES IN ANY JURISDICTION WHERE THE OFFER OR SALE IS NOT PERMITTED. |
| | 142 | |
| Structural and Collateral Term Sheet | | BMO 2024-5C4 |
| No. 12 – 1812 North Moore |
| Whole Loan Information | | Property Information |
| Whole Loan Seller: | CREFI | | Single Asset / Portfolio: | Single Asset |
| Original Principal Balance(1): | $30,000,000 | | Title: | Fee |
| Cut-off Date Principal Balance(1): | $30,000,000 | | Property Type – Subtype: | Office – CBD |
| % of IPB: | 3.5% | | Net Rentable Area (SF): | 543,697 |
| Loan Purpose: | Refinance | | Location: | Arlington, VA |
| Borrower: | 1812 Holdings, LLC | | Year Built / Renovated: | 2013 / NAP |
| Borrower Sponsor: | Anthony Westreich | | Occupancy: | 83.8% |
| Interest Rate: | 7.53000% | | Occupancy Date: | 3/1/2024 |
| Note Date: | 4/10/2024 | | 4th Most Recent NOI (As of): | NAV |
| Maturity Date: | 5/6/2029 | | 3rd Most Recent NOI (As of): | $17,467,776 (12/31/2022) |
| Interest-only Period: | 24 months | | 2nd Most Recent NOI (As of): | $18,791,006 (12/31/2023) |
| Original Term: | 60 months | | Most Recent NOI (As of)(4): | $18,774,842 (TTM 1/31/2024) |
| Original Amortization Term: | 360 months | | UW Economic Occupancy: | 86.7% |
| Amortization Type: | Interest Only, Amortizing Balloon | | UW Revenues: | $33,560,948 |
| Call Protection(2): | L(24),D(29),O(7) | | UW Expenses: | $9,502,562 |
| Lockbox / Cash Management: | Hard / Springing | | UW NOI(4): | $24,058,387 |
| Additional Debt(1): | Yes | | UW NCF: | $22,589,645 |
| Additional Debt Balance(1): | $143,000,000 | | Appraised Value / Per SF: | $315,000,000 / $579 |
| Additional Debt Type(1): | Pari Passu | | Appraisal Date: | 2/20/2024 |
| | | | | |
| Escrows and Reserves | | Financial Information(1) |
| | Initial | Monthly | Initial Cap | | Cut-off Date Loan / SF: | $318 |
| Taxes: | $1,847,102 | $307,850 | N/A | | Maturity Date Loan / SF: | $310 |
| Insurance: | $22,645 | $2,516 | N/A | | Cut-off Date LTV: | 54.9% |
| Replacement Reserves: | $0 | $9,062 | N/A | | Maturity Date LTV: | 53.5% |
| TI/LC: | $0 | $113,334 | N/A | | UW NCF DSCR: | 1.55x |
| Other Reserves(3) | $7,781,444 | $0 | N/A | | UW NOI Debt Yield: | 13.9% |
| | | | | | | |
| | | | | | | |
| Sources and Uses |
| Sources | Proceeds | % of Total | | Uses | Proceeds | % of Total |
| Whole Loan Amount | $173,000,000 | 96.3 | % | | Loan Payoff(5) | $160,681,751 | 89.4 | % |
| Other Sources(5) | 6,657,808 | 3.7 | | | Reserves | 9,651,191 | 5.4 | |
| | | | | Sponsor Equity | 7,850,142 | 4.4 | |
| | | | | Closing Costs | 1,474,724 | 0.8 | |
| Total Sources | $179,657,808 | 100.0 | % | | Total Uses | $179,657,808 | 100.0 | % |
| (1) | The 1812 North Moore Mortgage Loan (as defined below) is part of the 1812 North Moore Whole Loan (as defined below) which is comprised of four pari passu promissory notes with an aggregate original principal balance of $173,000,000. The 1812 North Moore Whole Loan was originated by Citi Real Estate Funding Inc. (“CREFI”). The Financial Information in the chart above is based on the aggregate outstanding principal balance as of the Cut-off Date of the 1812 North Moore Whole Loan. |
| (2) | The lockout period will be at least 24 payment dates beginning with and including the first payment date on June 6, 2024. Defeasance of the 1812 North Moore Whole Loan is permitted in whole (but not in part) at any time after the earlier to occur of (a) the end of the two-year period commencing on the closing date of the securitization of the last promissory note representing a portion of the 1812 North Moore Whole Loan to be securitized and (b) April 10, 2028. The assumed defeasance lockout period of 24 payments is based on the expected BMO 2024-5C4 securitization closing date in May 2024. The actual lockout period may be longer. |
| (3) | Other Reserves consist of an initial unfunded obligations reserve of $6,245,853 and an initial free rent reserve of $1,535,591. |
| (4) | The increase from Most Recent NOI to UW NOI is primarily attributed to the execution of three new leases from September 2023 through January 2024. |
| (5) | Other Sources include escrows and credits from previous debt which were used to payoff the prior loan on the 1812 North Moore Property (as defined below). |
The Loan. The 12th largest mortgage loan (the “1812 North Moore Mortgage Loan”) is part of a whole loan (the “1812 North Moore Whole Loan”) secured by the borrower’s fee interest in an office property totaling 543,697 square feet located in Arlington, Virginia (the “1812 North Moore Property”). The 1812 North Moore Whole Loan is comprised of four pari passu notes, with an aggregate outstanding principal balance as of the Cut-off Date of $173,000,000. The 1812 North Moore Whole Loan was originated on April 10, 2024 by CREFI and accrues interest at a fixed rate of 7.53000% per annum on an Actual/360 basis. The 1812 North Moore Whole Loan has an initial term of five years and is interest-only for the first 24 months followed by amortization on a 30-year basis. The scheduled maturity date of the 1812 North Moore Whole Loan is the payment date that occurs on May 6, 2029. The 1812 North Moore Mortgage Loan is evidenced by the non-controlling
THE INFORMATION IN THIS STRUCTURAL AND COLLATERAL TERM SHEET IS NOT COMPLETE AND MAY BE AMENDED PRIOR TO THE TIME OF SALE. THIS TERM SHEET IS NOT AN OFFER TO SELL THESE SECURITIES AND IT IS NOT A SOLICITATION OF AN OFFER TO BUY THESE SECURITIES IN ANY JURISDICTION WHERE THE OFFER OR SALE IS NOT PERMITTED. |
| | 143 | |
| Structural and Collateral Term Sheet | | BMO 2024-5C4 |
| No. 12 – 1812 North Moore |
Note A-3 with an outstanding principal balance as of the Cut-off Date of $30,000,000. The remaining notes are currently held by CREFI and are expected to be contributed to one or more future securitization trust(s).
The table below identifies the promissory notes that comprise the 1812 North Moore Whole Loan. The relationship between the holders of the 1812 North Moore Whole Loan is governed by a co-lender agreement as described under “Description of the Mortgage Pool—The Whole Loans—The Serviced Pari Passu Whole Loans” and “The Outside Serviced Pari Passu Whole Loans” in the Preliminary Prospectus. The 1812 North Moore Whole Loan will initially be serviced under the pooling and servicing agreement for the BMO 2024-5C4 transaction until the controlling Note A-1 is contributed to a securitization, at which point the 1812 North Moore Whole Loan will be serviced under the pooling and servicing agreement for the securitization transaction to which Note A-1 is contributed. See “The Pooling and Servicing Agreement—Servicing of the Mortgage Loans” and “—Servicing of the Outside Serviced Whole Loans” in the Preliminary Prospectus.
| Whole Loan Summary |
| Note | Original Balance | Cut-off Date Balance | Note Holder | Controlling Piece |
| A-1(1) | | $80,000,000 | | | $80,000,000 | | CREFI | Yes |
| A-2(1) | | $50,000,000 | | | $50,000,000 | | CREFI | No |
| A-3 | | $30,000,000 | | | $30,000,000 | | BMO 2024-5C4 | No |
| A-4(1) | | $13,000,000 | | | $13,000,000 | | CREFI | No |
| Whole Loan | | $173,000,000 | | | $173,000,000 | | | |
| (1) | Expected to be contributed to one or more securitization trust(s). |
The Property. The 1812 North Moore Property is a 35-story, Class A office property totaling 543,697 square feet in Arlington, Virginia. The 1812 North Moore Property was constructed in 2013 and is situated on an approximately 0.685-acre site along the west side of North Moore Street, adjacent to the Rosslyn Metrorail station in the Rosslyn submarket of Arlington, Virginia. The 1812 North Moore Property serves as the corporate headquarters for Nestle USA, Inc. (“Nestle”) which relocated to the 1812 North Moore Property in 2017. The 1812 North Moore Property has access to 480 garage parking spaces, including 15 stations for charging electric cars, resulting in a parking ratio of approximately 0.88 spaces per 1,000 square feet. Amenities at the 1812 North Moore Property include a fitness center, conferencing center, tenant lounge and storage bays available for tenant use.
As of March 1, 2024, the 1812 North Moore Property was 83.8% occupied by nine tenants. The tenants at the 1812 North Moore Property have a weighted average lease term remaining of 8.4 years with 3.4% of net rentable area rolling during the 1812 North Moore Whole Loan term. The tenancy also includes three investment grade rated tenants which account for 88.2% of underwritten base rent. Additionally, there have been three LOI’s executed at the 1812 North Moore Property accounting for 20,537 square feet and $1,170,609 of rent which were not underwritten.
Major Tenants. The three largest tenants based on net rentable area are Nestle, Humana Inc. (“Humana”) and Oracle America, Inc. (“Oracle”).
Nestle (299,779 square feet; 55.1% of net rentable area; 68.4% of underwritten base rent) Founded in 1866, Nestle is a diversified food and beverages company with a global footprint and sells products in 188 countries. Nestle utilizes its space at the 1812 North Moore Property as its US headquarters and has been at the 1812 North Moore Property since December 2017 with a current lease term through November 2032 with no termination options and two, five-year renewal options. Nestle has two options to contract its space at the 1812 North Moore Property. The first option provides Nestle with the right to reduce its space as to the lowest full floor that is part of its leased premises, effective any time beginning February 1, 2027 by providing written notice no later than 12 months prior to the first contraction date. The second option provides Nestle with the one-time right to reduce its space (x) if the foregoing contraction option was exercised, then only as to the lowest full floor that is then part of the leased premises, and (y) if the foregoing contraction option was not exercised, then only as to the lowest floor or the lowest two floors that are then part of the leased premises, in each case effective only as of the last day of January 2030 by providing written notice no later than 12 months prior to the second contraction date.
Humana (46,784 square feet; 8.6% of net rentable area; 10.0% of underwritten base rent) Founded in 1961, Humana (NYSE: HUM) is a for-profit health insurance company headquartered in Louisville, Kentucky with approximately 11.6 million
THE INFORMATION IN THIS STRUCTURAL AND COLLATERAL TERM SHEET IS NOT COMPLETE AND MAY BE AMENDED PRIOR TO THE TIME OF SALE. THIS TERM SHEET IS NOT AN OFFER TO SELL THESE SECURITIES AND IT IS NOT A SOLICITATION OF AN OFFER TO BUY THESE SECURITIES IN ANY JURISDICTION WHERE THE OFFER OR SALE IS NOT PERMITTED. |
| | 144 | |
| Structural and Collateral Term Sheet | | BMO 2024-5C4 |
| No. 12 – 1812 North Moore |
medical members and 48,700 employees. Humana has been at the 1812 North Moore Property since April 2020 and has a current lease term through May 2031 with two, five-year renewal options and no termination options.
Oracle (46,262 square feet; 8.5% of net rentable area; 9.8% of underwritten base rent) Founded in 1977, Oracle is an integrated technology company that has been utilized by more than 430,000 customers across 175 countries and is the number one embedded database, application servicer and enterprise performance management platform. On June 8, 2022, Oracle acquired Cerner, a provider of digital information systems used within hospitals and health systems to enable medical professionals to deliver better healthcare to individual patients and communities. Cerner was previously in occupancy at the 1812 North Moore Property with multiple leases beginning in January 2019 and July 2019 respectively and running through December 2029 and June 2030, respectively. Subsequent to the acquisition Oracle assumed the leases from Cerner Corporation. Oracle leases 38,075 SF of space that expires in December 2029 and 8,187 SF that expires in June 2030 with no termination options and one, five-year renewal option.
Environmental. The Phase I environmental assessment of the 1812 North Moore Property dated March 15, 2024 identified no recognized environmental conditions, controlled environmental conditions or significant data gaps with the property.
The following table presents certain information relating to the historical occupancy of the 1812 North Moore Property:
| Historical and Current Occupancy(1) |
| 2022 | 2023 | Current(2) |
| 74.3% | 77.2% | 83.8% |
| (1) | Historical Occupancies are as of December 31 of each respective year, unless otherwise specified. |
| (2) | Based on the underwritten rent roll dated March 1, 2024. |
THE INFORMATION IN THIS STRUCTURAL AND COLLATERAL TERM SHEET IS NOT COMPLETE AND MAY BE AMENDED PRIOR TO THE TIME OF SALE. THIS TERM SHEET IS NOT AN OFFER TO SELL THESE SECURITIES AND IT IS NOT A SOLICITATION OF AN OFFER TO BUY THESE SECURITIES IN ANY JURISDICTION WHERE THE OFFER OR SALE IS NOT PERMITTED. |
| | 145 | |
| Structural and Collateral Term Sheet | | BMO 2024-5C4 |
| No. 12 – 1812 North Moore |
The following table presents certain information relating to the major tenants at the 1812 North Moore Property:
| Top Tenant Summary(1) |
| Tenant | Ratings Moody’s/S&P/Fitch(2) | Net Rentable Area (SF) | % of Total NRA | UW Base Rent PSF | UW Base Rent | % of Total UW Base Rent | Lease Exp. Date |
| Nestle USA, Inc.(3) | Aa3/AA-/A+ | 299,779 | 55.1% | $71.84 | $21,534,987 | 68.4 | % | 11/30/2032 |
| Humana Inc. | Baa2/BBB/BBB | 46,784 | 8.6 | $67.10 | 3,139,113 | 10.0 | | 5/31/2031 |
| Oracle America, Inc.(4) | Baa2/BBB/BBB | 46,262 | 8.5 | $66.77 | 3,088,751 | 9.8 | | Various |
| Graham Holdings Company(5) | Ba1/BB/NR | 24,023 | 4.4 | $60.00 | 1,441,380 | 4.6 | | 4/30/2040 |
| National Electrical Manufacturers Association(6) | NR/NR/NR | 11,839 | 2.2 | $60.00 | 710,340 | 2.3 | | 9/30/2036 |
| RFS OPCO LLC | NR/NR/NR | 8,598 | 1.6 | $58.43 | 502,381 | 1.6 | | 3/31/2029 |
| Evolent Health, LLC | NR/NR/NR | 8,514 | 1.6 | $58.43 | 497,473 | 1.6 | | 1/31/2031 |
| Favor TechConsulting, LLC(7) | NR/NR/NR | 5,724 | 1.1 | $60.20 | 344,585 | 1.1 | | 2/29/2028 |
| Rocade LLC(8) | NR/NR/NR | 3,893 | 0.7 | $57.91 | 225,444 | 0.7 | | 4/30/2029 |
| Total Occupied | | 455,416 | 83.8% | $69.13 | $31,484,453 | 100.0 | % | |
| Vacant Space | | 88,281 | 16.2 | | | | |
| Totals/ Wtd. Avg. | | 543,697 | 100.0% | | | | |
| (1) | Based on the underwritten rent roll dated March 1, 2024, inclusive of $39,175 of contractual rent steps underwritten through January 1, 2025 and $1,837,678 in straight line rent steps for Nestle, Humana and Oracle. |
| (2) | Certain ratings are those of the parent company whether or not the parent guarantees the lease. |
| (3) | Nestle has two options to contract its space at the 1812 North Moore Property. The first option specifies Nestle can reduce its space only for the lowest full floor that is part of the premises, effective any time after January 31, 2027 by providing written notice no later than 12 months prior to the first contraction date. The second option specifies Nestle has the one-time right to reduce its space (x) if the foregoing contraction option was exercised, then only as to the lowest full floor that is then part of the leased premises, and (y) if the foregoing contraction option was not exercised, then only as to the lowest floor or the lowest two floors that are then part of the leased premises, in each case effective any time after the last day of January 2030 by providing written notice no later than 12 months prior to the first contraction date. |
| (4) | Oracle leases 38,075 SF of space that expires in December 2029 and 8,187 SF that expires in June 2030. |
| (5) | Graham Holdings Company executed a lease dated April 2, 2024. Graham Holdings Company has a lease commencement date of May 2025 and may accelerate the expiration date of its lease to August 2036 by providing written notice no later than June 30, 2035 along with payment of a termination fee. |
| (6) | National Electrical Manufacturers Association executed a lease dated January 6, 2024. National Electrical Manufacturers Association has a lease commencement date of January 2025 and has the one time right to terminate its lease effective on the last day of the 105th full calendar month after the commencement date, (September 2033), by giving prior written notice 12 months prior to the termination date. |
| (7) | Favor TechConsulting, LLC may terminate its lease effective on the last day of 65th month, February 28, 2026, with 12 months’ prior notice if its subcontract with Oracle is terminated. |
| (8) | Rocade LLC may terminate its lease effective on the last day of the 43rd full calendar month (April 30, 2027) of the term following the commencement date by giving prior written notice before the last day of the 34th full calendar month (July 31, 2026). |
THE INFORMATION IN THIS STRUCTURAL AND COLLATERAL TERM SHEET IS NOT COMPLETE AND MAY BE AMENDED PRIOR TO THE TIME OF SALE. THIS TERM SHEET IS NOT AN OFFER TO SELL THESE SECURITIES AND IT IS NOT A SOLICITATION OF AN OFFER TO BUY THESE SECURITIES IN ANY JURISDICTION WHERE THE OFFER OR SALE IS NOT PERMITTED. |
| | 146 | |
| Structural and Collateral Term Sheet | | BMO 2024-5C4 |
| No. 12 – 1812 North Moore |
The following table presents certain information relating to the lease rollover schedule at the 1812 North Moore Property:
| Lease Rollover Schedule(1)(2) |
| Year | Number of Leases Expiring | Net Rentable Area Expiring | % of NRA Expiring | UW Base Rent Expiring | % of UW Base Rent Expiring | Cumulative Net Rentable Area Expiring | Cumulative % of NRA Expiring | Cumulative UW Base Rent Expiring | Cumulative % of UW Base Rent Expiring |
| Vacant | 0 | 88,281 | | 16.2% | | NAP | | NAP | | 88,281 | | 16.2% | | NAP | | NAP |
| 2024 | 0 | 0 | | 0.0 | | $0 | | 0.0% | | 88,281 | | 16.2% | | $0 | | 0.0% |
| 2025 | 0 | 0 | | 0.0 | | 0 | | 0.0 | | 88,281 | | 16.2% | | $0 | | 0.0% |
| 2026 | 0 | 0 | | 0.0 | | 0 | | 0.0 | | 88,281 | | 16.2% | | $0 | | 0.0% |
| 2027 | 0 | 0 | | 0.0 | | 0 | | 0.0 | | 88,281 | | 16.2% | | $0 | | 0.0% |
| 2028 | 1 | 5,724 | | 1.1 | | 344,585 | | 1.1 | | 94,005 | | 17.3% | | $344,585 | | 1.1% |
| 2029 | 3 | 50,566 | | 9.3 | | 3,280,982 | | 10.4 | | 144,571 | | 26.6% | | $3,625,567 | | 11.5% |
| 2030 | 1 | 8,187 | | 1.5 | | 535,594 | | 1.7 | | 152,758 | | 28.1% | | $4,161,160 | | 13.2% |
| 2031 | 2 | 55,298 | | 10.2 | | 3,636,586 | | 11.6 | | 208,056 | | 38.3% | | $7,797,746 | | 24.8% |
| 2032 | 1 | 299,779 | | 55.1 | | 21,534,987 | | 68.4 | | 507,835 | | 93.4% | | $29,332,733 | | 93.2% |
| 2033 | 0 | 0 | | 0.0 | | 0 | | 0.0 | | 507,835 | | 93.4% | | $29,332,733 | | 93.2% |
| 2034 | 0 | 0 | | 0.0 | | 0 | | 0.0 | | 507,835 | | 93.4% | | $29,332,733 | | 93.2% |
| 2035 & Beyond | 2 | 35,862 | | 6.6 | | 2,151,720 | | 6.8 | | 543,697 | | 100.0% | | $31,484,453 | | 100.0% |
| Total | 10 | 543,697 | | 100.0% | | $31,484,453 | | 100.0% | | | | | |
| (1) | Based on the underwritten rent roll dated March 1, 2024, inclusive of $39,175 of contractual rent steps underwritten through January 1, 2025 and $1,837,678 in straight line rent steps for the investment grade tenants. |
| (2) | Certain tenants may have lease termination options that are exercisable prior to the stated expiration date of the subject lease or leases which are not considered in the Lease Rollover Schedule. |
THE INFORMATION IN THIS STRUCTURAL AND COLLATERAL TERM SHEET IS NOT COMPLETE AND MAY BE AMENDED PRIOR TO THE TIME OF SALE. THIS TERM SHEET IS NOT AN OFFER TO SELL THESE SECURITIES AND IT IS NOT A SOLICITATION OF AN OFFER TO BUY THESE SECURITIES IN ANY JURISDICTION WHERE THE OFFER OR SALE IS NOT PERMITTED. |
| | 147 | |
| Structural and Collateral Term Sheet | | BMO 2024-5C4 |
| No. 12 – 1812 North Moore |
The following table presents certain information relating to the underwritten cash flows of the 1812 North Moore Property:
| Operating History and Underwriting Net Cash Flow |
| | 2022 | 2023 | TTM Jan 2024(1) | Underwritten(1) | Per Square Foot | %(2) |
| In Place Rent(3) | $25,172,705 | $25,981,040 | $26,129,848 | $29,607,600 | $54.46 | 79.0% |
| Commercial Rent Steps(4) | 0 | 0 | 0 | 1,876,853 | 3.45 | 5.0 |
| Potential Income from Vacant Space | 0 | 0 | 0 | 4,982,717 | 9.16 | 13.3 |
| Gross Potential Rent | $25,172,705 | $25,981,040 | $26,129,848 | $36,467,170 | $67.07 | 97.4% |
| Total Reimbursements | 981,721 | 1,424,077 | 1,412,350 | 988,455 | 1.82 | 2.6 |
| Total Gross Income | $26,154,426 | $27,405,117 | $27,542,198 | $37,455,625 | $68.89 | 100.0% |
| Other Income(5) | 987,106 | 1,085,970 | 1,088,040 | 1,088,040 | 2.00 | 2.9 |
| (Vacancy/Credit Loss) | (700,434) | (230,570) | (330,182) | (4,982,717) | (9.16) | (13.3) |
| Effective Gross Income | $26,441,098 | $28,260,517 | $28,300,056 | $33,560,948 | $61.73 | 89.6% |
| Management Fee | 533,713 | 573,958 | 576,019 | 1,006,828 | 1.85 | 3.0 |
| Real Estate Taxes | 3,400,928 | 3,518,290 | 3,499,281 | 3,143,763 | 5.78 | 9.4 |
| Insurance | 265,641 | 273,770 | 273,594 | 217,440 | 0.40 | 0.6 |
| Other Expenses(6) | 4,773,039 | 5,103,493 | 5,176,320 | 5,134,530 | 9.44 | 15.3 |
| Total Expenses | $8,973,322 | $9,469,511 | $9,525,214 | $9,502,562 | $17.48 | 28.3% |
| Net Operating Income | $17,467,776 | $18,791,006 | $18,774,842 | $24,058,387 | $44.25 | 71.7% |
| Capital Expenditures | 0 | 0 | 0 | 108,739 | 0.20 | 0.3 |
| TI/LC | 0 | 0 | 0 | 1,360,002 | 2.50 | 4.1 |
| Net Cash Flow | $17,467,776 | $18,791,006 | $18,774,842 | $22,589,645 | $41.55 | 67.3% |
| (1) | The increase from TTM Jan 2024 Net Operating Income to Underwritten Net Operating Income is primarily attributed to the execution of three new leases from September 2023 through January 2024. |
| (2) | Revenue-related figures are calculated as a % of Total Gross Income. All non-revenue related figures are calculated as a % of Effective Gross Income. |
| (3) | Underwritten In Place Rent is based on the underwritten rent roll dated March 1, 2024. |
| (4) | Commercial Rent steps include $39,175 of contractual rent steps underwritten through January 1, 2025 and $1,837,678 in straight line rent steps for the investment grade tenants. |
| (5) | Underwritten Other Income includes parking income, overtime HVAC, plumbing and additional miscellaneous income. |
| (6) | Other Expenses include cleaning, contract services, repairs and maintenance, utilities, general and administrative, non-recoverable expenses, parking and amenity expenses. |
The Market. The 1812 North Moore Property is located along the west side of North Moore Street in the Rosslyn submarket of Arlington, Virginia. Rosslyn is situated on the banks of the Potomac River, across from Georgetown and within minutes of Foggy Bottom. Rosslyn has experienced significant renovation activity in recent years due to zoning changes allowing building heights of 300 feet with approval by the Arlington County Board. Access to Rosslyn is provided by Interstate 66, the George Washington Parkway and the Rosslyn Metrorail station which is adjacent to the 1812 North Moore Property.
According to the appraisal, as of December 31, 2023, the Rosslyn office submarket had a total inventory of 10,323,508 square feet across 39 buildings, an overall vacancy rate of 20.0% and average asking rent of $40.83 per square foot. In 2023 there was 276,986 square feet of direct leasing activity in the submarket.
According to the appraisal for the 1812 North Moore Property, the 2022 population and average household income in a one-, three- and five-mile radius are 40,072, 321,726 and 811,603 and $181,039, $191,678 and $185,977, respectively.
THE INFORMATION IN THIS STRUCTURAL AND COLLATERAL TERM SHEET IS NOT COMPLETE AND MAY BE AMENDED PRIOR TO THE TIME OF SALE. THIS TERM SHEET IS NOT AN OFFER TO SELL THESE SECURITIES AND IT IS NOT A SOLICITATION OF AN OFFER TO BUY THESE SECURITIES IN ANY JURISDICTION WHERE THE OFFER OR SALE IS NOT PERMITTED. |
| | 148 | |
| Structural and Collateral Term Sheet | | BMO 2024-5C4 |
| No. 12 – 1812 North Moore |
| Comparable Office Rental Summary(1) |
| Property Name | Tenant | Suite Size (SF) | Lease Commencement | Lease Term (Mos) | Rent (PSF) |
| 1812 North Moore(2) | Various | Various | Various | Various | $65.01(2) |
| 1000 Wilson | Curtis Process Consulting | 8,397 SF | September 2023 | 98 mos. | $54.00 |
| 1100 Wilson | National Association of Corporate Directors | 41,948 SF | November 2023 | 146 mos. | $54.50 |
| Arlington Tower | WSP USA Inc. | 10,254 SF | May 2023 | 41 mos. | $58.00 |
| Commonwealth Tower | Langan Engineering | 14,342 SF | November 2023 | 65 mos. | $50.00 |
| Potomac Tower | Venture Global LNG, Inc. | 6,330 SF | November 2022 | 131 mos. | $57.50 |
| (2) | Based on the underwritten rent roll dated March 1, 2024. Rent (PSF) does not include rent steps. |
THE INFORMATION IN THIS STRUCTURAL AND COLLATERAL TERM SHEET IS NOT COMPLETE AND MAY BE AMENDED PRIOR TO THE TIME OF SALE. THIS TERM SHEET IS NOT AN OFFER TO SELL THESE SECURITIES AND IT IS NOT A SOLICITATION OF AN OFFER TO BUY THESE SECURITIES IN ANY JURISDICTION WHERE THE OFFER OR SALE IS NOT PERMITTED. |
| | 149 | |
| Structural and Collateral Term Sheet | | BMO 2024-5C4 |
| No. 13 – Homewood Suites San Diego Mission Valley Zoo |
| Mortgage Loan Information | | Property Information |
| Mortgage Loan Seller: | GSMC | | Single Asset / Portfolio: | Single Asset |
| Original Principal Balance: | $28,375,000 | | Title: | Fee |
| Cut-off Date Principal Balance: | $28,375,000 | | Property Type - Subtype: | Hospitality – Extended Stay |
| % of Pool by IPB: | 3.3% | | Net Rentable Area (Rooms): | 118 |
| Loan Purpose: | Refinance | | Location: | San Diego, CA |
| Borrower: | M7 DEV, LLC | | Year Built / Renovated: | 2016 / NAP |
| Borrower Sponsor: | Mayur B. Patel | | Occupancy / ADR / RevPAR: | 93.1% / $216.90 / $201.85 |
| Interest Rate: | 7.88600% | | Occupancy / ADR / RevPAR Date: | 2/29/2024 |
| Note Date: | 4/3/2024 | | 4th Most Recent NOI (As of): | $2,563,012(12/31/2021) |
| Maturity Date: | 4/6/2029 | | 3rd Most Recent NOI (As of): | $3,763,598 (12/31/2022) |
| Interest-only Period: | 60 months | | 2nd Most Recent NOI (As of): | $3,748,852(12/31/2023) |
| Original Term: | 60 months | | Most Recent NOI (As of): | $3,827,984 (TTM 2/29/2024) |
| Original Amortization Term: | None | | UW Occupancy / ADR / RevPAR: | 93.1% / $216.90 / $201.85 |
| Amortization Type: | Interest Only | | UW Revenues: | $9,345,646 |
| Call Protection: | L(25),D(28),O(7) | | UW Expenses: | $5,654,583 |
| Lockbox / Cash Management: | Hard / Springing | | UW NOI: | $3,691,064 |
| Additional Debt: | No | | UW NCF: | $3,317,238 |
| Additional Debt Balance: | N/A | | Appraised Value / Per Room: | $45,400,000 / $384,746 |
| Additional Debt Type: | N/A | | Appraisal Date: | 3/4/2024 |
| | | | | |
| Escrows and Reserves | | Financial Information |
| | Initial | Monthly | Initial Cap | | Cut-off Date Loan / Room: | $240,466 |
| Taxes: | $23,069 | $23,069 | N/A | | Maturity Date Loan / Room: | $240,466 |
| Insurance: | $0 | Springing | N/A | | Cut-off Date LTV: | 62.5% |
| FF&E Reserve: | $0 | $31,237(1) | N/A | | Maturity Date LTV: | 62.5% |
| | | | | | UW NCF DSCR: | 1.46x |
| | | | | | UW NOI Debt Yield: | 13.0% |
| | | | | | | |
| Sources and Uses |
| Sources | Proceeds | % of Total | | Uses | Proceeds | % of Total |
| Mortgage Loan | $28,375,000 | 100.0% | | Loan Payoff | $22,753,289 | 80.2 | % |
| | | | | Equity Distribution | 5,359,127 | 18.9 | |
| | | | | Closing Costs | 239,514 | 0.8 | |
| | | | | Reserves | 23,069 | 0.1 | |
| Total Sources | $28,375,000 | 100.0% | | Total Uses | $28,375,000 | 100.0 | % |
| (1) | The monthly deposits into the FF&E Reserve will be equal to (x) $31,237 for the payment dates in May 2024 through April 2025 and (y) thereafter for the payment dates in May through April of the following year, the greater of (1) any franchise-mandated amount and (2) 1/12th of 4% of the borrower’s gross revenues over the trailing 12-month period. |
The Loan. The thirteenth largest mortgage loan (the “HSSDMVZ Mortgage Loan”) is secured by a first lien mortgage on the borrower’s fee simple interest in a 118-room extended-stay hospitality property located in San Diego, California (the “HSSDMVZ Property”). The HSSDMVZ Mortgage Loan was originated on April 3, 2024 by Goldman Sachs Bank USA (“GSBI”), has an outstanding balance as of the Cut-Off Date of $28,375,000 and accrues interest at a fixed rate of 7.88600% per annum on an Actual/360 basis. The scheduled maturity date of the HSSDMVZ Mortgage Loan is the payment date that occurs on April 6, 2029.
The Property. The HSSDMVZ Property is a five-story, 118-room extended-stay hospitality property located in San Diego, California. The HSSDMVZ Property contains 64 queen/queen one-bedroom suites, 43 studio suites and 11 king one-bedroom suites. The HSSDMVZ Property features a breakfast dining area, 252 square feet of meeting space, an outdoor pool, a fitness room, a lobby workstation, a market pantry, a guest laundry room, an outdoor patio and a guest lounge. The HSSDMVZ Property’s franchise agreement with Homewood Suites Franchise LLC (“Hilton”) has an initial term of 20 years that expires in 2036, seven years beyond loan maturity. Among other things, the franchise agreement requires the borrowers to pay Hilton a royalty fee of 5.0% of room revenue and a monthly program fee of 4.0% of room revenue.
THE INFORMATION IN THIS STRUCTURAL AND COLLATERAL TERM SHEET IS NOT COMPLETE AND MAY BE AMENDED PRIOR TO THE TIME OF SALE. THIS TERM SHEET IS NOT AN OFFER TO SELL THESE SECURITIES AND IT IS NOT A SOLICITATION OF AN OFFER TO BUY THESE SECURITIES IN ANY JURISDICTION WHERE THE OFFER OR SALE IS NOT PERMITTED. |
| | 150 | |
| Structural and Collateral Term Sheet | | BMO 2024-5C4 |
| No. 13 – Homewood Suites San Diego Mission Valley Zoo |
Environmental. According to the Phase I environmental assessment dated March 8, 2024, there was no evidence of any recognized environmental conditions at the HSSDMVZ Property.
The following table presents certain information relating to the operating history and underwritten cash flows of the HSSDMVZ Property:
| Operating History and Underwritten Net Cash Flow |
| | 2022 | 2023 | TTM Feb 2024(1) | UW | UW Per Room(2) | %(3) |
| Occupancy | 91.3% | 91.8% | 93.1% | 93.1% | | |
| ADR | $206.85 | $218.46 | $216.90 | $216.90 | | |
| RevPAR | $188.86 | $200.54 | $201.85 | $201.85 | | |
| | | | | | | |
| Rooms Revenue | $8,134,037 | $8,637,389 | $8,717,531 | $8,693,713 | $73,676 | | 93.0% |
| Other Revenue(4) | 537,175 | 642,150 | 653,614 | 651,934 | 5,525 | | 7.0 |
| Total Revenue | $8,671,212 | $9,279,539 | $9,371,145 | $9,345,646 | $79,200 | | 100.0% |
| | | | | | | |
| Rooms Expense | 1,677,222 | 2,020,972 | 2,039,939 | 2,034,365 | 17,240 | | 23.4 |
| Other Departmental Expenses | 26,217 | 27,767 | 27,835 | 27,759 | 235 | | 4.3 |
| Departmental Expenses | $1,703,439 | $2,048,739 | $2,067,773 | $2,062,124 | $17,476 | | 22.1% |
| | | | | | | |
| Departmental Profit | $6,967,773 | $7,230,800 | $7,303,372 | $7,283,523 | $61,725 | | 77.9% |
| | | | | | | |
| Management Fee | 195,099 | 208,790 | 210,828 | 210,277 | 1,782 | | 2.3 |
| Marketing and Franchise Fee | 1,097,318 | 1,217,096 | 1,223,967 | 1,222,772 | 10,362 | | 13.1 |
| Other Undistributed Expenses(5) | 1,505,421 | 1,668,065 | 1,648,094 | 1,648,094 | 13,967 | | 17.6 |
| Total Undistributed Expenses | $2,797,837 | $3,093,950 | $3,082,889 | $3,081,143 | $26,111 | | 33.0% |
| | | | | | | |
| Real Estate Taxes | 261,059 | 265,740 | 265,891 | 349,013 | 2,958 | | 3.7 |
| Property Insurance | 145,279 | 122,258 | 126,608 | 162,303 | 1,375 | | 1.7 |
| Net Operating Income | $3,763,598 | $3,748,852 | $3,827,984 | $3,691,064 | $31,280 | | 39.5% |
| | | | | | | |
| FF&E Reserve | 0 | 0 | 0 | 373,826 | 3,168 | | 4.0 |
| Net Cash Flow | $3,763,598 | $3,748,852 | $3,827,984 | $3,317,238 | $28,112 | | 35.5% |
| (1) | TTM Feb 2024 represents the trailing 12-month period ending February 29, 2024. |
| (2) | UW Per Room values are based on 118 rooms. |
| (3) | % column represents percent of Total Revenue except for Rooms Expense and Other Departmental Expenses which are based on their corresponding revenue line items. |
| (4) | Other Revenue is primarily derived from parking fees (approximately $20 per vehicle). |
| (5) | Other Undistributed Expenses include administrative and general, Information and telecommunications systems, property operation and maintenance and utilities expenses. |
The Market. The HSSDMVZ Property is located at 445 Camino del Rio South in San Diego, California. The HSSDMVZ Property is located in the Mission Valley submarket of San Diego and is within six miles of major tourist demand drivers, including the San Diego Zoo, PetCo Park, SeaWorld, and Balboa Park. Additional demand drivers include San Diego State University and the University of California San Diego. The HSSDMVZ Property also benefits from close proximity to major thoroughfares, including Interstate 8 and State Highway 163.
The following table presents certain information relating to the primary competition for the HSSDMVZ Property:
| Competitive Set(1) |
| Property | Number of Rooms | Year Built(2) | Estimated 2023 Occupancy | Estimated 2023 ADR | Estimated 2023 RevPAR |
| HSSDMVZ Property(2) | 118 | 2016 | 91.8% | $218.46 | $200.54 |
| Candlewood Suites San Diego | 50 | 1999 | 90% – 95% | $180 – $190 | $170 – $180 |
| SpringHill Suites by Marriott San Diego Mission Valley | 135 | 2016 | 85% – 90% | $210 – $220 | $180 – $190 |
| Homewood Suites by Hilton San Diego Hotel Circle/SeaWorld | 245 | 2017 | 90% – 95% | $180 – $190 | $170 – $180 |
| Homewood Suites by Hilton San Diego Airport Liberty Station | 150 | 2007 | 90% – 95% | $220 – $230 | $200 – $210 |
| TownePlace Suites by Marriott San Diego Airport Liberty Station | 222 | 2019 | 90% – 95% | $220 – $230 | $210 – $220 |
| Total Avg. Competitive Set | | | 93.3% | $208.67 | $194.71 |
THE INFORMATION IN THIS STRUCTURAL AND COLLATERAL TERM SHEET IS NOT COMPLETE AND MAY BE AMENDED PRIOR TO THE TIME OF SALE. THIS TERM SHEET IS NOT AN OFFER TO SELL THESE SECURITIES AND IT IS NOT A SOLICITATION OF AN OFFER TO BUY THESE SECURITIES IN ANY JURISDICTION WHERE THE OFFER OR SALE IS NOT PERMITTED. |
| | 151 | |
| Structural and Collateral Term Sheet | | BMO 2024-5C4 |
| No. 14 – Respara |
| Mortgage Loan Information |
| Mortgage Loan Seller: | WFB |
| Original Principal Balance(1): | $25,000,000 |
| Cut-off Date Principal Balance(1): | $25,000,000 |
| % of IPB: | 2.9% |
| Loan Purpose: | Refinance |
| Borrower: | 11601 Dunstan Partners, L.P. |
| Borrower Sponsors: | Christopher M. Liebes and
Hugh H. Evans, III |
| Interest Rate: | 6.30000% |
| Note Date: | 2/6/2024 |
| Maturity Date: | 2/11/2029 |
| Interest-only Period: | 60 months |
| Original Term: | 60 months |
| Original Amortization Term: | None |
| Amortization Type: | Interest Only |
| Call Protection: | L(27),DorYM1(26),O(7) |
| Lockbox / Cash Management: | Springing / Springing |
| Additional Debt(1): | Yes |
| Additional Debt Balance(1): | $36,500,000 |
| Additional Debt Type(1): | Pari Passu |
| |
| Escrows and Reserves |
| | Initial | Monthly | Initial Cap |
| Taxes: | $55,544 | $55,544 | N/A |
| Insurance: | $0 | Springing | N/A |
| Replacement Reserves: | $0 | $1,125 | $40,500 |
| | | | |
| | | | |
| | | | |
| |
| Property Information |
| Single Asset / Portfolio: | Single Asset |
| Title: | Fee |
| Property Type – Subtype: | Multifamily – Mid Rise |
| Net Rentable Area (Units): | 54 |
| Location: | Los Angeles, CA |
| Year Built / Renovated: | 2022 / NAP |
| Occupancy: | 96.3% |
| Occupancy Date: | 2/1/2024 |
| 4th Most Recent NOI (As of)(2): | NAV |
| 3rd Most Recent NOI (As of)(2): | NAV |
| 2nd Most Recent NOI (As of)(2): | NAV |
| Most Recent NOI (As of) (2): | NAV |
| UW Economic Occupancy: | 94.9% |
| UW Revenues: | $6,722,232 |
| UW Expenses: | $1,803,306 |
| UW NOI: | $4,918,926 |
| UW NCF: | $4,905,426 |
| Appraised Value / Per Unit: | $93,000,000 / $1,722,222 |
| Appraisal Date: | 1/5/2024 |
| |
| Financial Information(1) |
| Cut-off Date Loan / Unit: | $1,138,889 |
| Maturity Date Loan / Unit: | $1,138,889 |
| Cut-off Date LTV: | 66.1% |
| Maturity Date LTV: | 66.1% |
| UW NCF DSCR: | 1.25x |
| UW NOI Debt Yield: | 8.0% |
| | |
| |
| Sources and Uses |
| Sources | Proceeds | % of Total | | Uses | Proceeds | % of Total |
| Whole Loan(1) | $61,500,000 | 100.0% | | Loan Payoff | $54,463,006 | 88.6 | % |
| | | | | Upfront Reserves | 55,544 | 0.1 | |
| | | | | Closing Costs(3) | 1,174,578 | 1.9 | |
| | | | | Return of Equity | 5,806,872 | 9.4 | |
| Total Sources | $61,500,000 | 100.0% | | Total Uses | $61,500,000 | 100.0 | % |
| (1) | The Respara Mortgage Loan (as defined below) is part of the Respara Whole Loan (as defined below) with an original aggregate principal balance of $61,500,000. The Financial Information in the chart above is based on the aggregate outstanding principal balance as of the Cut-off Date of the Respara Whole Loan. |
| (2) | Historical financial information is not available as the Respara Property (as defined below) was delivered in December 2022 and has been undergoing lease up. |
| (3) | Closing Costs include a rate buydown totaling $615,000. |
The Loan. The fourteenth largest mortgage loan (the “Respara Mortgage Loan”) is part of a whole loan (the “Respara Whole Loan”) evidenced by two pari passu promissory notes in the aggregate original principal amount of $61,500,000 and secured by a first priority fee mortgage encumbering a 54-unit luxury multifamily apartment complex located in Los Angeles, California (the “Respara Property”). The Respara Mortgage Loan was originated on February 6, 2024 by Wells Fargo Bank, National Association and accrues interest at a fixed rate of 6.30000% per annum. The Respara Mortgage Loan is evidenced by the non-controlling Note A-2, in the original principal amount of $25,000,000 and will be contributed to the BMO 2024-5C4 securitization trust.
The relationship between the holders of the Respara Whole Loan will be governed by a co-lender agreement as described under “Description of the Mortgage Pool—The Whole Loans—The Non-Serviced Pari Passu Whole Loans” in the Preliminary Prospectus. The Respara Whole Loan will be serviced under the BANK5 Trust 2024-5YR6 pooling and servicing agreement. See “The Pooling and Servicing Agreement” in the Preliminary Prospectus.
THE INFORMATION IN THIS STRUCTURAL AND COLLATERAL TERM SHEET IS NOT COMPLETE AND MAY BE AMENDED PRIOR TO THE TIME OF SALE. THIS TERM SHEET IS NOT AN OFFER TO SELL THESE SECURITIES AND IT IS NOT A SOLICITATION OF AN OFFER TO BUY THESE SECURITIES IN ANY JURISDICTION WHERE THE OFFER OR SALE IS NOT PERMITTED. |
| | 152 | |
| Structural and Collateral Term Sheet | | BMO 2024-5C4 |
| No. 14 – Respara |
The table below identifies the promissory notes that comprise the Respara Whole Loan:
| Whole Loan Summary |
| Note | Original Balance | Cut-off Date Balance | Note Holder | Controlling Piece |
| A-1(1) | $36,500,000 | $36,500,000 | BANK5 Trust 2024-5YR6 | Yes |
| A-2 | $25,000,000 | $25,000,000 | BMO 2024-5C4 | No |
| Whole Loan | $61,500,000 | $61,500,000 | | |
| (1) | BANK5 Trust 2024-5YR6 is expected to close on May 6, 2024. |
The Property. The Respara Property is a four-story, luxury apartment building totaling 54 units located in the Brentwood neighborhood of Los Angeles, California. Constructed in 2022, the property is situated on a 1.1-acre site on a private cul-de-sac. Amenities include an interior courtyard, swimming pool and spa with cabanas, barbeque areas, and a pizza oven, two rooftop decks, a private screening room, a resident lounge, a conference room, a fitness center, bicycle storage, on-site overnight courtesy patrol, concierge, controlled access, security surveillance, two elevators, on-site management, and a subterranean parking with 134 spaces (2.5 spaces per unit). The property includes one studio unit, 14 one-bedroom units, 35 two-bedroom units, and four three-bedrooms units. Unit amenities include white oak flooring in living and bedroom areas, quartz countertops with waterfall edges, custom cabinetry, built-in Fisher-Paykel appliances, wine coolers, Grohe and Toto fixtures, floor-to ceiling sliding glass doors in living areas, in-unit washer/dryers, central HVAC, and private patio/balconies. As of February 1, 2024, the property was 96.3% occupied.
Environmental. According to the Phase I environmental site assessment dated January 10, 2024, there was no evidence of any recognized environmental conditions at the Respara Property.
The following table presents certain information relating to the historical and current occupancy of the Respara Property:
| Historical and Current Occupancy(1) |
| 2020 | 2021 | 2022 | 2023 | Current(2) |
| NAV | NAV | NAV | NAV | 96.3% |
| (1) | Historical occupancy is not available as the property was delivered in November 2022 and was undergoing lease up. |
| (2) | Current Occupancy is based on the underwritten rent roll dated February 1, 2024. |
The following table presents detailed information with respect to the current market rate units at the Respara Property:
| Unit Mix(1) |
| Unit Type | Total No. of Units | Occupied Units | % of Total Units | Occupancy | Average Unit Size (SF) | Average Underwritten Monthly Rent per Unit |
| Studio | 1 | 1 | 1.9% | 100.0% | 428 | $3,850 |
| 1 Bedroom | 14 | 14 | 25.9% | 100.0% | 910 | $7,118 |
| 2 Bedrooms(2) | 35 | 34 | 64.8% | 97.1% | 1,366 | $11,539 |
| 3 Bedrooms | 4 | 3 | 7.4% | 75.0% | 1,978 | $18,425 |
| Total/Weighted Average | 54 | 52 | 100.0% | 96.3% | 1,276 | $10,598 |
| (1) | Information based on the underwritten rent roll dated February 1, 2024. |
| (2) | The Borrower Sponsor leases a two-bedroom unit at the Respara Property. |
THE INFORMATION IN THIS STRUCTURAL AND COLLATERAL TERM SHEET IS NOT COMPLETE AND MAY BE AMENDED PRIOR TO THE TIME OF SALE. THIS TERM SHEET IS NOT AN OFFER TO SELL THESE SECURITIES AND IT IS NOT A SOLICITATION OF AN OFFER TO BUY THESE SECURITIES IN ANY JURISDICTION WHERE THE OFFER OR SALE IS NOT PERMITTED. |
| | 153 | |
| Structural and Collateral Term Sheet | | BMO 2024-5C4 |
| No. 14 – Respara |
The following table presents certain information relating to the underwritten cash flows of the Respara Property:
| Underwritten Net Cash Flow(1) |
| | Underwritten | Per unit | %(3) |
| Base Rent(2) | $6,617,580 | $122,548 | 93.5% |
| Grossed Up Vacant Space | 355,200 | 6,578 | 5.0 |
| Gross Potential Rent | $6,972,780 | $129,126 | 98.5% |
| Concessions | (94,800) | (1,756) | (1.3) |
| Other Income(4) | 199,452 | 3,694 | 2.8 |
| Net Rental Income | $7,077,432 | $131,064 | 100.0% |
| (Vacancy / Credit Loss) | (355,200) | (6,578) | (5.0) |
| Effective Gross Income | $6,722,232 | $124,486 | 95.0% |
| | | | |
| Real Estate Taxes | 739,841 | 13,701 | 11.0 |
| Insurance | 98,000 | 1,815 | 1.5 |
| Other Operating Expenses | 965,465 | 17,879 | 14.4 |
| Total Operating Expenses | $1,803,306 | $33,395 | 26.8% |
| | | | |
| Net Operating Income | $4,918,926 | $91,091 | 73.2% |
| Replacement Reserves | 13,500 | 250 | 0.2 |
| Net Cash Flow | $4,905,426 | $90,841 | 73.0% |
| | | | |
| (1) | Historical operating history is not presented as the Respara Property was delivered in December 2022 and has been undergoing lease up. |
| (2) | Based on the underwritten rent roll dated February 1, 2024. |
| (3) | % column represents percent of Net Rental Income for all revenue lines and represents percent of Effective Gross Income for the remainder of the fields. |
| (4) | Underwritten Other Income includes parking, vending, late fees, application fees, pet fees, cancellation/termination fees, MTM fees, storage, renters’ insurance, cable/satellite TV charges, and miscellaneous income. |
THE INFORMATION IN THIS STRUCTURAL AND COLLATERAL TERM SHEET IS NOT COMPLETE AND MAY BE AMENDED PRIOR TO THE TIME OF SALE. THIS TERM SHEET IS NOT AN OFFER TO SELL THESE SECURITIES AND IT IS NOT A SOLICITATION OF AN OFFER TO BUY THESE SECURITIES IN ANY JURISDICTION WHERE THE OFFER OR SALE IS NOT PERMITTED. |
| | 154 | |
| Structural and Collateral Term Sheet | | BMO 2024-5C4 |
| No. 14 – Respara |
The Market. The Respara Property is located in the Brentwood neighborhood of Los Angeles, California. The median household income in Brentwood ($146,507) is 91% higher than Los Angeles County ($76,610) and the median home value in Brentwood ($2,000,001) is 138% higher than the average Los Angeles County ($842,000). The property is located less than 0.5 miles from a number of restaurants and retail destinations along Sunset Boulevard and San Vicente Boulevard, approximately 1.0 mile northwest of I-405, 4.0 miles northeast of Santa Monica, and 6.4 miles northwest of Century City.
According to a third party market research report, the property is located in the West Los Angeles/Westwood/Brentwood submarket of the Los Angeles apartment market. As of October 2023, the submarket reported total inventory of 38,087 units with a 4.2% vacancy rate and average asking rents of $3,240 per month.
The appraisal identified six directly competitive multifamily comparables with average asking rents ranging from $3,376 to $22,731 per unit and are further detailed in the table below:
The following table presents certain information relating to comparable multifamily rental properties to the Respara Property:
| Competitive Set(1) |
| | Respara (Subject) | The Landmark Los
Angeles Apartments | The Park | Ten Thousand | 8500 Burton | 1221 Ocean
Avenue | Sway |
| Location | Los Angeles, CA | Los Angeles, CA | Santa Monica, CA | Los Angeles, CA | Los Angeles, CA | Santa Monica, CA | Santa Monica, CA |
| Distance to Subject | -- | 0.9 miles | 3.3 miles | 3.1 Miles | 5.3 miles | 3.5 Miles | 3.3 miles |
| Property Type | Multifamily / Mid Rise | Multifamily / High Rise | Multifamily / Mid Rise | Multifamily / High Rise | Multifamily / Mid Rise | Multifamily / High Rise | Multifamily / Mid Rise |
| Year Built/Renovated | 2022/NAP | 2022/NAP | 2021/NAP | 2016/NAP | 2012/NAP | 1971/2018 | 2015/NAP |
| Number of Units | 54(2) | 376 | 249 | 283 | 87 | 120 | 122 |
| Average Monthly Rent (per unit) | | | | | | | |
| Studio | $3,850(2) | $3,376 | $4,414 | NAP | NAP | NAP | $3,465 |
| 1 Bedroom | $7,118(2) | $5,299 | $5,657 | $9,380 | $7,845 | $12,664 | $4,909 |
| 2 Bedrooms | $11,539(2) | $10,238 | $9,380 | $18,539 | $13,356 | $14,846 | $6,919 |
| 3 Bedrooms | $18,425(2) | NAP | $12,794 | $22,241 | NAP | $22,731 | NAP |
| Occupancy | 96.3%(2) | 97.0% | 93.0% | 98.0% | 88.0% | 96.0% | 93.0% |
| (1) | Source: Appraisal, unless otherwise indicated. |
| (2) | Information obtained from the underwritten rent roll dated February 1, 2024. |
THE INFORMATION IN THIS STRUCTURAL AND COLLATERAL TERM SHEET IS NOT COMPLETE AND MAY BE AMENDED PRIOR TO THE TIME OF SALE. THIS TERM SHEET IS NOT AN OFFER TO SELL THESE SECURITIES AND IT IS NOT A SOLICITATION OF AN OFFER TO BUY THESE SECURITIES IN ANY JURISDICTION WHERE THE OFFER OR SALE IS NOT PERMITTED. |
| | 155 | |
| Structural and Collateral Term Sheet | | BMO 2024-5C4 |
| No. 15 – Point Plaza West |
| Mortgage Loan Information | | Property Information |
| Mortgage Loan Seller: | WFB | | Single Asset / Portfolio: | Single Asset |
| Original Principal Balance: | $24,400,000 | | Title: | Fee |
| Cut-off Date Principal Balance: | $24,383,106 | | Property Type – Subtype: | Office – Suburban |
| % of IPB: | 2.8% | | Net Rentable Area (SF): | 200,967 |
| Loan Purpose: | Refinance | | Location: | Tumwater, WA |
| Borrower: | Vine Street Investors – Conduit Eight, LLC | | Year Built / Renovated: | 1998, 2000 / NAP |
| | | | Occupancy: | 90.7% |
| Borrower Sponsors(1): | Robert E. Woolf, Kathleen B. Woolf, J. Brent McKinley and Connie K. McKinley | | Occupancy Date: | 3/18/2024 |
| | | | 4th Most Recent NOI (As of): | $3,028,170 (12/31/2020) |
| Interest Rate: | 7.84500% | | 3rd Most Recent NOI (As of): | $2,987,502 (12/31/2021) |
| Note Date: | 3/22/2024 | | 2nd Most Recent NOI (As of): | $3,061,566 (12/31/2022) |
| Maturity Date: | 4/11/2029 | | Most Recent NOI (As of): | $3,218,791 (12/31/2023) |
| Interest-only Period: | None | | UW Economic Occupancy: | 90.6% |
| Original Term: | 60 months | | UW Revenues: | $4,268,237 |
| Original Amortization Term: | 360 months | | UW Expenses: | $1,169,420 |
| Amortization Type: | Amortizing Balloon | | UW NOI: | $3,098,817 |
| Call Protection: | L(25),DorYM1(28),O(7) | | UW NCF: | $2,757,173 |
| Lockbox / Cash Management(2): | Hard / In Place | | Appraised Value / Per SF: | $41,500,000 / $207 |
| Additional Debt: | No | | Appraisal Date: | 11/8/2023 |
| Additional Debt Balance: | N/A | | | |
| Additional Debt Type: | N/A | | | |
| | | | | |
| | | | | |
| Escrows and Reserves | | Financial Information |
| | Initial | Monthly | Initial Cap | | Cut-off Date Loan / SF: | $121 | |
| Taxes: | $0 | $47,995 | N/A | | Maturity Date Loan / SF: | $116 | |
| Insurance: | $0 | Springing | N/A | | Cut-off Date LTV: | 58.8% | |
| Replacement Reserves: | $0 | $3,349 | N/A | | Maturity Date LTV: | 56.2% | |
| TI/LC: | $400,000 | $25,121 | N/A | | UW NCF DSCR: | 1.30x | |
| Existing TI/LC: | $168,561 | $0 | N/A | | UW NOI Debt Yield: | 12.7% | |
| | | | | | | | |
| | | | | | | |
| Sources and Uses |
| Sources | Proceeds | % of Total | | | Uses | Proceeds | % of Total | |
Mortgage Loan | $24,400,000 | 88.9 | % | | Loan Payoff | $25,620,669 | 93.3 | % |
| Sponsor Equity | 3,055,975 | 11.1 | | | Upfront Reserves | 568,561 | 2.1 | |
| | | | | Closing Costs(3) | 1,266,745 | 4.6 | |
| | | | | | | |
| Total Sources | $27,455,975 | 100.0 | % | | Total Uses | $27,455,975 | 100.0 | % |
| (1) | The Point Plaza West Mortgage Loan (as defined below) is full recourse for the life of the loan to Robert E. Woolf, Kathleen B. Woolf, J. Brent McKinley, and Connie K. McKinley. |
| (2) | Commencing on the monthly payment date in May 2024, through the monthly payment date in April 2027, the borrower is required to deposit all excess cash flow in a collateral reserve account held with the lender as additional security for the Point Plaza West Mortgage Loan. Upon the occurrence of an event of default, the lender has the right to apply all or any portion of the funds in the collateral reserve account to the payment of the debt in any order, portion, or priority the lender determines. The lender may also, in its sole and absolute discretion, disburse funds from the collateral reserve account to the borrower for the payment of leasing costs. |
| (3) | Closing costs include a loan origination fee of $488,000. |
The Loan. The fifteenth largest mortgage loan (the “Point Plaza West Mortgage Loan”) is secured by a first lien mortgage on the borrower’s fee simple interest in a four building, suburban office complex totaling 200,967 square feet (the “Point Plaza West Property”) located in Tumwater, Washington. The Point Plaza West Mortgage Loan was originated on March 22, 2024 by Wells Fargo Bank, National Association and has an outstanding principal balance as of the Cut-off Date of $24,383,106. The Point Plaza West Mortgage Loan has a 5-year term, amortizes on a 30-year schedule and accrues interest at a rate of 7.84500% per annum on an Actual/360 basis.
THE INFORMATION IN THIS STRUCTURAL AND COLLATERAL TERM SHEET IS NOT COMPLETE AND MAY BE AMENDED PRIOR TO THE TIME OF SALE. THIS TERM SHEET IS NOT AN OFFER TO SELL THESE SECURITIES AND IT IS NOT A SOLICITATION OF AN OFFER TO BUY THESE SECURITIES IN ANY JURISDICTION WHERE THE OFFER OR SALE IS NOT PERMITTED. |
| | 156 | |
| Structural and Collateral Term Sheet | | BMO 2024-5C4 |
| No. 15 – Point Plaza West |
The Property. The Point Plaza West Property consists of four, three- and four- story Class B office buildings totaling 200,967 square feet. Built in 1998 and 2000, the buildings are situated on an 8.88-acre parcel. Each building has a similar layout with a reception area on the ground floor and men’s and women’s restrooms near the elevator bays. Each floor contains private offices around the perimeter, with the remainder of the floor containing cubicles, kitchenettes, break rooms, and conference rooms. The site is landscaped with mature shrubs and trees, and includes surface parking at a parking ratio of 3.2 spaces per 1,000 square feet.
The Point Plaza West Property is 90.7% leased, as of March 18, 2024, to three divisions of the State of Washington. The Washington State Department of Social and Health Services (“DSHS”) occupies buildings one and two, the Washington State Department of Retirement Systems (“DRS”) occupies building three, and the Washington State Department of Financial Institutions (“DFI”) occupies building four. The Point Plaza West Property has averaged 98.6% occupancy since 1999.
Major Tenants.
DSHS (78,396 square feet; 39.0% of NRA; 41.1% of underwritten base rent; Aaa/AA+/AA+: Moody’s/S&P/Fitch) is made up of seven divisions that focus on aging, behavioral health, developmental disabilities, vocational rehabilitation and economic and financial services. DSHS occupies buildings one and two and has been a tenant at the Point Plaza West Property since 1998, expanding several times. Currently it operates under four separate leases with expiration dates of January 31, 2027, April 30, 2027, and February 28, 2029. DSHS previously occupied 100% of building two, however, as of February 2024, the tenant downsized by 18,744 (9.3% of NRA), and renewed the remaining space in that building, 31,240 square feet, for an additional five-year term. The tenant has one, 5-year renewal option and no termination options, except as described below.
DSHS has an appropriations’-based termination option on its space in building two, 31,240 square feet, if the federal funds for that space are reduced by 50% or more, or not allocated by the U.S. Congress, with written notice of at least 90 days.
DRS (57,741 square feet; 28.7% of NRA; 34.4% of underwritten base rent; Aaa/AA+/AA+: Moody’s/S&P/Fitch) serves a population of more than 330,000 Washington public employees including firefighters, teachers and police officers. It administers a public retirement system with 15 plans across eight individual retirement systems. DRS occupies building three and has been a tenant since 1999, most recently renewing in 2019 with a lease expiration of February 28, 2029. This is the tenant’s only location. DRS has one, 5-year renewal option and no termination options.
DFI (46,086 square feet; 22.9% of NRA; 24.4% of underwritten base rent; Aaa/AA+/AA+; Moody’s/S&P/Fitch) protects consumers and advances the financial health of Washington State by providing fair regulations of financial services and educating consumers to make informed financial decisions. DFI occupies building four and has been a tenant at the Point Plaza West Property since 2003. The tenant most recently renewed in March 2023 with a lease expiration of February 28, 2028. The tenant has one, 5-year renewal option and no termination options.
The State of Washington has announced a state-wide reduction of its office space. See “Description of the Mortgage Pool – Tenant Issues - Termination Rights of Government Sponsored Tenants” in the Preliminary Prospectus.
Environmental. The Phase I environmental assessment dated November, 21, 2023 did not identify any recognized environmental conditions at the Point Plaza West Property.
The following table presents certain information relating to the historical and current occupancy of the Point Plaza West Property:
| Historical and Current Occupancy(1) |
| 2020 | 2021 | 2022 | 2023 | Current(2) |
| 96.7% | 96.7% | 100.0% | 100.0% | 90.7% |
| (1) | Historical occupancy was provided by the borrower and represents full year occupancy for each respective year. |
| (2) | Current Occupancy is based on the underwritten rent roll dated as of March 18, 2024. |
THE INFORMATION IN THIS STRUCTURAL AND COLLATERAL TERM SHEET IS NOT COMPLETE AND MAY BE AMENDED PRIOR TO THE TIME OF SALE. THIS TERM SHEET IS NOT AN OFFER TO SELL THESE SECURITIES AND IT IS NOT A SOLICITATION OF AN OFFER TO BUY THESE SECURITIES IN ANY JURISDICTION WHERE THE OFFER OR SALE IS NOT PERMITTED. |
| | 157 | |
| Structural and Collateral Term Sheet | | BMO 2024-5C4 |
| No. 15 – Point Plaza West |
The following table presents certain information relating to the largest tenants based on underwritten base rent at the Point Plaza West Property:
| Top Tenant Summary(1) |
| Tenant | Ratings Moody’s/S&P/Fitch | Net Rentable Area (SF) | % of Total NRA | UW Base Rent PSF | UW Base Rent | % of Total UW Base Rent(2) | Lease Expiration Date |
| DSHS | Aaa/AA+/AA+ | 78,396 | 39.0% | $21.77 | $1,706,343 | 41.1% | Various(3) |
| DRS | Aaa/AA+/AA+ | 57,741 | 28.7 | 24.75 | 1,429,090 | 34.4 | 2/28/2029 |
| DFI | Aaa/AA+/AA+ | 46,086 | 22.9 | 22.00 | 1,013,892 | 24.4 | 2/28/2028 |
| Largest Tenants | | 182,223 | 90.7% | $22.77 | $4,149,325 | 100.0% | |
| Remaining Tenants | | 0 | 0.0 | 0.00 | 0 | 0.0 | |
| Total Occupied | | 182,223 | 90.7% | $22.77 | $4,149,325 | 100.0% | |
| Vacant Space | | 18,744 | 9.3 | | | | |
| Total / Wtd. Avg. | | 200,967 | 100.0% | | | | |
| | | | | | | | |
| (1) | Based on the underwritten rent roll dated March 18, 2024. |
| (2) | % of Total UW Base Rent excludes vacant space. |
| (3) | DSHS has four leases with the following expiration dates: (i) 31,320 square feet expiring January 31, 2027, (ii) 9,199 square feet expiring April 30, 2027, (iii) 6,637 square feet expiring April 30, 2027, and (iv) 31,240 square feet expiring February 28, 2029. |
The following table presents certain information relating to tenant lease expirations at the Point Plaza West Property:
| Lease Rollover Schedule(1)(2) |
| Year | Number
of
Leases
Expiring | Net
Rentable
Area
Expiring | % of
NRA
Expiring | UW Base
Rent
Expiring | % of UW Base Rent
Expiring | Cumulative
Net Rentable
Area Expiring | Cumulative
% of NRA Expiring | Cumulative UW Base Rent Expiring | Cumulative % of UW Base Rent Expiring |
| Vacant | NAP | 18,744 | 9.3% | NAP | NAP | 18,744 | 9.3% | NAP | NAP |
| 2024 & MTM | 0 | 0 | 0.0 | $0 | 0.0% | 18,744 | 9.3% | $0 | 0.0% |
| 2025 | 0 | 0 | 0.0 | 0 | 0.0 | 18,744 | 9.3% | $0 | 0.0% |
| 2026 | 0 | 0 | 0.0 | 0 | 0.0 | 18,744 | 9.3% | $0 | 0.0% |
| 2027 | 3 | 47,156 | 23.5 | 970,016 | 23.4 | 65,900 | 32.8% | $970,016 | 23.4% |
| 2028 | 1 | 46,086 | 22.9 | 1,013,892 | 24.4 | 111,986 | 55.7% | $1,983,908 | 47.8% |
| 2029 | 2 | 88,981 | 44.3 | 2,165,416 | 52.2 | 200,967 | 100.0% | $4,149,325 | 100.0% |
| 2030 | 0 | 0 | 0.0 | 0 | 0.0 | 200,967 | 100.0% | $4,149,325 | 100.0% |
| 2031 | 0 | 0 | 0.0 | 0 | 0.0 | 200,967 | 100.0% | $4,149,325 | 100.0% |
| 2032 | 0 | 0 | 0.0 | 0 | 0.0 | 200,967 | 100.0% | $4,149,325 | 100.0% |
| 2033 | 0 | 0 | 0.0 | 0 | 0.0 | 200,967 | 100.0% | $4,149,325 | 100.0% |
| 2034 | 0 | 0 | 0.0 | 0 | 0.0 | 200,967 | 100.0% | $4,149,325 | 100.0% |
| 2035 & Beyond | 0 | 0 | 0.0 | 0 | 0.0 | 200,967 | 100.0% | $4,149,325 | 100.0% |
| Total | 6 | 200,967 | 100.0% | $4,149,325 | 100.0% | | | | |
| (1) | Based on the underwritten rent roll dated March 18, 2024. |
| (2) | Certain tenants may have lease termination options that are exercisable prior to the originally stated expiration date of the subject lease and that are not considered in the Lease Expiration Schedule |
THE INFORMATION IN THIS STRUCTURAL AND COLLATERAL TERM SHEET IS NOT COMPLETE AND MAY BE AMENDED PRIOR TO THE TIME OF SALE. THIS TERM SHEET IS NOT AN OFFER TO SELL THESE SECURITIES AND IT IS NOT A SOLICITATION OF AN OFFER TO BUY THESE SECURITIES IN ANY JURISDICTION WHERE THE OFFER OR SALE IS NOT PERMITTED. |
| | 158 | |
| Structural and Collateral Term Sheet | | BMO 2024-5C4 |
| No. 15 – Point Plaza West |
The following table presents certain information relating to operating history and underwritten cash flows at Point Plaza West Property:
| Operating History and Underwritten Net Cash Flow |
| | 2020 | 2021 | 2022 | 2023 | Underwritten | Per Square
Foot | %(2) | |
| Base Rent(1) | $3,987,451 | $3,987,409 | $4,082,570 | $4,288,397 | $4,149,325 | $20.65 | 90.6 | % |
| Vacant Income | 0 | 0 | 0 | 0 | 431,112 | 2.15 | 9.4 | |
| Gross Potential Rent | $3,987,451 | $3,987,409 | $4,082,570 | $4,288,397 | $4,580,437 | $22.79 | 100 | % |
| (Vacancy/Credit Loss) | 0 | 0 | 0 | 0 | (431,112) | (2.15) | (9.4) | |
| Expense Reimbursements | 76,078 | 90,757 | 104,662 | 118,912 | 118,912 | 0.59 | 2.6 | |
| Effective Gross Income | $4,063,528 | $4,078,166 | $4,187,232 | $4,407,309 | $4,268,237 | $21.24 | 93.2 | % |
| Total Expenses | $1,035,358 | $1,090,664 | $1,125,666 | $1,188,518 | $1,169,420 | $5.82 | 27.4 | % |
| Net Operating Income | $3,028,170 | $2,987,502 | $3,061,566 | $3,218,791 | $3,098,817 | $15.42 | 72.6 | % |
| Capital Expenditures | 0 | 0 | 0 | 0 | 40,193 | 0.20 | 0.9 | |
| TI/LC | 0 | 0 | 0 | 0 | 301,451 | 1.50 | 7.1 | |
| Net Cash Flow | $3,028,170 | $2,987,502 | $3,061,566 | $3,218,791 | $2,757,173 | $13.72 | 64.6 | % |
| (1) | Based on the underwritten rent roll dated March 18, 2024. |
| (2) | % column represents percent of Gross Potential Rent for all revenue lines and represents percent of Effective Gross Income for the remainder of fields. |
The Market. The Point Plaza West Property is located in Tumwater, Washington, located approximately 4.3 miles south of Olympia, Washington. Located east of Interstate 5, the closest on ramp is approximately 0.9 miles from the Point Plaza West Property. The area immediately surrounding the property is primarily light industrial uses including warehouses, distribution centers and manufacturing companies. Residential and commercial uses are located primarily along Capitol Boulevard.
According to the appraisal, the Point Plaza West Property is located in Thurston County, and specifically in the Tumwater/South Olympia submarket. The largest office user in the county is Washington State. The Tumwater/South Olympia submarket is comprised of 165 buildings with a total of 1.9 million square feet. As of the fourth quarter of 2023, the vacancy rate was 0.9%, with a five year average vacancy rate of 1.3% There is nothing under construction, and nothing has been delivered in the past three years.
The following table presents certain information relating to comparable office for the Point Plaza West Property:
| Comparable Office Rental Summary(1) |
| Building/Address | Year Built | Tenant Name | Lease Start Date | Term | Lease Type | Tenant Size (SF) | Base Rent PSF | Rent Steps/yr |
Recent Subject Leases Various(2) Tumwater, WA | 1998, 2000 | DSHS(3) DFI(3) | March-24 March-23 | 5 Yrs.(3) 5 Yrs.(3) | MG MG | 31,240(3) 46,086(3) | $23.57(3) $22.00(3) | Flat(3) Flat(3) |
Sunset Point 3003 Sunset Way SE Tumwater, WA | 2013 | Image Source, Inc. | Feb-22 | 28 Mos 27 Mos | MG | 6,191 5,578 | $20.03 $18.00 | Flat 3.0% |
| | | | | | | | | |
Airdustrial Office Park 7141 Cleanwater Dr. SW Tumwater, WA | 2004 | Washington State Office of the Attorney General | Dec-21 | 10 Yrs | MG | 148,311 | $22.75 | 7.7% in Year 5 |
Chandler Court Building 2430 Chandler Court SW Olympia, WA | 1991 | Board of Industrial Insurance Appeals | Jun-21 | 5 Yrs | MG | 48,874 | $20.80 | 1.2% in Year 4 |
Town Center East – Bldg. 1 101 Israel Rd. SE Tumwater, WA | 2003 | Washington State Dept. of Enterprise Services | Mar-21 | 5 Yrs | MG | 99,621 | $22.75 | Flat |
| | | | | | | | | |
| | | | | | | | | |
| (2) | 6639 Capitol Boulevard South, 6737 Capitol Boulevard South, 6825 & 6835 Capitol Boulevard South, 150 Israel Road Southwest. |
| (3) | Based on underwritten rent roll dated March 18, 2024. |
THE INFORMATION IN THIS STRUCTURAL AND COLLATERAL TERM SHEET IS NOT COMPLETE AND MAY BE AMENDED PRIOR TO THE TIME OF SALE. THIS TERM SHEET IS NOT AN OFFER TO SELL THESE SECURITIES AND IT IS NOT A SOLICITATION OF AN OFFER TO BUY THESE SECURITIES IN ANY JURISDICTION WHERE THE OFFER OR SALE IS NOT PERMITTED. |
| | 159 | |
| Structural and Collateral Term Sheet | | BMO 2024-5C4 |
| No. 15 – Point Plaza West |
The following table presents certain information relating to comparable office sales for the Point Plaza West Property:
| Comparable Sales(1) |
| Name / Property Location | Sale Date | Total NRA (SF) | Sale Price | Sale Price PSF | Adjusted Sales Price PSF |
| | | | | | |
Erling O. Mark Building 1501 Market St. Tacoma, WA | Sep-2023 | 149,330 | $27,271,000 | $183 | $187 |
Sunset Point Office Buildings 3003 & 3200 Sunset Way SE Tumwater, WA | May-2022 | 49,850 | $10,700,000 | $215 | $193 |
Airdustrial Office Park 7141 Cleanwater Ln. SW Tumwater, WA | Mar-2022 | 148,311 | $39,750,000 | $268 | $263 |
Kent Business Campus 823-841 Central Ave. N. Kent, WA | Jan-2022 | 108,726 | $21,261,140 | $196 | $183 |
Eastside Plaza 1102-1206 Quince St. SE Olympia, WA | Jan-2022 | 128,941 | $30,400,000 | $236 | $233 |
THE INFORMATION IN THIS STRUCTURAL AND COLLATERAL TERM SHEET IS NOT COMPLETE AND MAY BE AMENDED PRIOR TO THE TIME OF SALE. THIS TERM SHEET IS NOT AN OFFER TO SELL THESE SECURITIES AND IT IS NOT A SOLICITATION OF AN OFFER TO BUY THESE SECURITIES IN ANY JURISDICTION WHERE THE OFFER OR SALE IS NOT PERMITTED. |
| | 160 | |
| Structural and Collateral Term Sheet | | BMO 2024-5C4 |
| Contacts |
| BMO Capital Markets CMBS Capital Markets & Banking |
| Contact | E-mail | Phone Number |
| Paul Vanderslice | paul.vanderslice@bmo.com | (917) 996-4514 |
| Managing Director | | |
| | | |
| David Schell | david.schell@bmo.com | (347) 996-0721 |
| Managing Director | | |
| | | |
| Ravish Kamath | ravish.kamath@bmo.com | (347) 668-1507 |
| Director | | |
| | | |
| BMO Capital Markets CMBS Trading & Structuring |
| Contact | E-Mail | Phone Number |
| Andrew Noonan | andrew.noonan@bmo.com | (347) 466-3147 |
| Managing Director | | |
| | | |
| Mary Kunka | mary.kunka@bmo.com | (347) 956-1226 |
| Managing Director | | |
| | | |
| Kiran Manda | kiran.manda@bmo.com | (347) 831-4776 |
| Managing Director | | |
| | | |
| Michael Chen | lei4.chen@bmo.com | (646) 265-0023 |
| Director | | |
| | | |
| BMO Capital Markets Securitized Products Syndicate |
| Contact | E-Mail | Phone Number |
| Alex Smith-Constantine | alex.smithconstantine@bmo.com | (212) 702-1866 |
| Managing Director | | |
| | | |
| Trinian Donohoe | trinian.donohoe@bmo.com | (212) 702-1866 |
| Vice President | | |
| | | |
| Wells Fargo Securities, LLC - Real Estate Securitization & Capital Markets - CMBS Banking & Capital Markets |
| Contact | E-Mail | Phone Number |
| A.J. Sfarra | anthony.sfarra@wellsfargo.com | (917) 359-0302 |
| Managing Director | | |
| | | |
| Alex Wong | alex.wong1@wellsfargo.com | (917) 232-9620 |
| Managing Director | | |
| | | |
| Lee Green | lee.green@wellsfargo.com | (917) 301-5132 |
| Managing Director | | |
| | | |
| Sean Duffy | sean.duffy@wellsfargo.com | (773) 573-6386 |
| Managing Director | | |
| | | |
| Wells Fargo Securities, LLC - Real Estate Securitization & Capital Markets - Structuring |
| Contact | E-Mail | Phone Number |
| Guenter Meyer | guenter.meyer@wellsfargo.com | (212) 214-8712 |
| Executive Director | | |
| | | |
| Matthew DeAngelis | matthew.deangelis@wellsfargo.com | (212) 214-5612 |
| Executive Director | | |
| | | |
| | | |
| | | |
| | | |
| | | |
| | | |
THE INFORMATION IN THIS STRUCTURAL AND COLLATERAL TERM SHEET IS NOT COMPLETE AND MAY BE AMENDED PRIOR TO THE TIME OF SALE. THIS TERM SHEET IS NOT AN OFFER TO SELL THESE SECURITIES AND IT IS NOT A SOLICITATION OF AN OFFER TO BUY THESE SECURITIES IN ANY JURISDICTION WHERE THE OFFER OR SALE IS NOT PERMITTED. |
| | 161 | |
| Structural and Collateral Term Sheet | | BMO 2024-5C4 |
| Contacts |
| Citigroup CMBS Capital Markets and Securitization | |
| Contact | Contact | Contact |
| Rick Simpson | richard.simpson@citi.com | (212) 816-5343 |
| Managing Director | | |
| | | |
| Jason Mercandetti | jason.mercandetti@citi.com | (212) 816-6384 |
| Director | | |
| | | |
| Citigroup Structuring, Trading & Syndicate | |
| Contact | E-Mail | Phone Number |
| Raul Orozco | raul.d.orozco@citi.com | (212) 723-1295 |
| Managing Director | | |
| | | |
| Matt Perry | mattison.perry@citi.com | (212) 723-1295 |
| Director | | |
| | | |
| Goldman Sachs Real Estate Financing Group - Securitization |
| Contact | E-Mail | Phone Number |
| Scott Epperson | scott.epperson@gs.com | (212) 934-2882 |
| Managing Director | | |
| | | |
| Justin Peterson | justin.peterson@gs.com | (212) 902-4283 |
| Vice President | | |
| | | |
| Raymond Todd | raymond.todd@gs.com | (972) 501-3979 |
| Vice President | | |
| | | |
| Goldman Sachs Real Estate Financing Group - Capital Markets |
| Contact | E-Mail | Phone Number |
| Nitin Jagga | nitin.jagga@gs.com | (212) 855-9035 |
| Vice President | | |
| | | |
| Rebecca Bayard | rebecca.bayard@gs.com | (212) 934-0848 |
| Vice President | | |
| | | |
| Goldman Sachs Syndicate & Structuring |
| Contact | E-Mail | Phone Number |
| Scott Walter | scott.walter@gs.com | (212) 357-8910 |
| Managing Director | | |
| | | |
| Lisa Schexnayder | lisa.schexnayder@gs.com | (212) 902-2330 |
| Vice President | | |
| | | |
| Deutsche Bank Securities Banking | |
| Contact | Contact | Contact |
| Lainie Kaye | lainie.kaye@db.com | (212) 250-5270 |
| Managing Director | | |
| | | |
| Michael Miller | michael.miller@db.com | (212) 250-0099 |
| Vice President | | |
| | | |
| Sam Lockwood | sam.lockwood@db.com | (212) 250-4569 |
| Vice President | | |
| | | |
| | | |
| | | |
| | | |
THE INFORMATION IN THIS STRUCTURAL AND COLLATERAL TERM SHEET IS NOT COMPLETE AND MAY BE AMENDED PRIOR TO THE TIME OF SALE. THIS TERM SHEET IS NOT AN OFFER TO SELL THESE SECURITIES AND IT IS NOT A SOLICITATION OF AN OFFER TO BUY THESE SECURITIES IN ANY JURISDICTION WHERE THE OFFER OR SALE IS NOT PERMITTED. |
| | 162 | |
| Structural and Collateral Term Sheet | | BMO 2024-5C4 |
| Contacts |
| Deutsche Bank Securities Trading & Structuring | |
| Contact | Contact | Contact |
| Shaishav Agarwal | shaishav.agarwal@db.com | (212) 250-6290 |
| Managing Director | | |
| | | |
| Daniel Penn | daniel.penn@db.com | (212) 250-5149 |
| Managing Director | | |
| | | |
| Matt Smith | matt-t.smith@db.com | (212) 250-6155 |
| Director | | |
| | | |
| Ryan Horvath | ryan.horvath@db.com | (212) 250-5149 |
| Director | | |
| | | |
| UBS CMBS Capital Markets and Banking |
| Contact | E-Mail | Phone Number |
| Nicholas Galeone | nicholas.galeone@ubs.com | (212) 713-8832 |
| Managing Director | | |
| | | |
| Siho Ham | siho.ham@ubs.com | (212) 713-1278 |
| Managing Director | | |
| | | |
| Michael Barbieri | michael.barbieri@ubs.com | (212) 713-1181 |
| Executive Director | | |
| | | |
| UBS CMBS Trading and Syndicate |
| Contact | E-Mail | Phone Number |
| Jared Randall | jared.randall@ubs.com | (212) 713-8568 |
| Executive Director | | |
| | | |
| | |
| | | |
| | | |
| | | |
| | | |
THE INFORMATION IN THIS STRUCTURAL AND COLLATERAL TERM SHEET IS NOT COMPLETE AND MAY BE AMENDED PRIOR TO THE TIME OF SALE. THIS TERM SHEET IS NOT AN OFFER TO SELL THESE SECURITIES AND IT IS NOT A SOLICITATION OF AN OFFER TO BUY THESE SECURITIES IN ANY JURISDICTION WHERE THE OFFER OR SALE IS NOT PERMITTED. |
| | 163 | |