as additional paid in capital in the consolidated balance sheet as of September 30, 2008. These shares were also included in the calculation of the average number of common shares outstanding used in the basic EPS calculation in the consolidated statement of income for the three and nine months ended September 30, 2008.
A review of capital resources and liquidity should also consider other contractual obligations and commitments, which are further disclosed in Note 12 – “Commitments and Contingencies” to the Consolidated Financial Statements of the Corporations’ 10-K Annual Report and Note 12 – “Commitments and Contingencies” of the Quarterly Report on Form 10-Q under the caption “Electric Purchase Commitments.”
Decisions to fund Central Hudson’s pension plan (the “Retirement Plan”) are based on several factors, including the value of plan assets relative to plan liabilities, legislative requirements, regulatory considerations, and available corporate resources. The liabilities are affected by the discount rate used to determine benefit obligations and the accruing of additional benefits. Central Hudson considers the provisions of the Pension Protection Act of 2006 to determine funding requirements for the near-term and future periods. Funding for the 2008 Retirement Plan year totaled $12.5 million as of September 30, 2008. No additional funding is expected in 2008.
Employer contributions for OPEB totaled $4.2 million and $4.7 million during the nine months ended September 30, 2008, and 2007, respectively. The determination of future funding depends on a number of factors, including the discount rate, expected return on plan assets, medical claims assumptions used, benefit changes and corporate resources. No further funding is anticipated for the 2008 OPEB Plan year.
The recent volatility in the financial markets has reduced the values of the Retirement Plan and the OPEB assets. Management believes that increasing discount rates will also reduce the present value of the plans’ liabilities. The net effect on the funded status of the plans may result in a reduction of the proportion of the plans liability that is currently funded. If future market conditions do not improve sufficiently to offset these changes, additional contributions will likely become necessary in 2009 under the terms of the Pension Protection Act. Management expects that such contributions will be incorporated in the rate making process over time. Central Hudson has investment policies for these plans which include asset allocation ranges designed to achieve a reasonable return over the long-term, recognizing the impact of market volatility. Management cannot currently predict what impact the recent financial market volatility may have on the expected rate of return on plan assets or future funding decisions.
2008 has been a challenging year in the financial markets. Financial stress among lenders has constrained the availability of credit and increased short-term
borrowing costs, despite cuts in the federal funds target rate to 1.5%. Aversion to risk has driven up credit spreads and the overall cost of issuing long-term debt, as well as impacted the availability of access to credit markets. Equity values have fallen significantly, making equity financing less attractive. Despite these conditions, CH Energy Group remains well-positioned with a strong balance sheet and liquidity. Significant capacity remains on CH Energy Group’s and Central Hudson’s committed credit facilities. Despite rising credit spreads, Central Hudson’s strong credit ratings help facilitate access to long-term debt. However, management can make no assurance in regards to the availability or resulting terms and costs. With the exception of the use of treasury shares for several restricted share grants and performance share awards earned, no equity issuance is expected in 2008. CH Energy Group common stock has maintained a market premium to its book value, which is a preferred position should equity financing be sought.
At September 30, 2008, CH Energy Group and its subsidiaries maintain credit facilities with JPMorgan Chase Bank, N.A., Bank of America, N.A., HSBC Bank USA, N.A. and Keybank National Association. The availability of these facilities is contingent upon the ability of lenders to fulfill these commitments.
At September 30, 2008, CH Energy Group, on a consolidated basis, had $71.5 million of short-term debt outstanding and cash and cash equivalents of $11.3 million.
CH Energy Group, the holding company, has a $150 million revolving credit agreement with several commercial banks, which as of September 30, 2008, had an outstanding balance of $15 million.
Central Hudson maintains a revolving credit agreement with several commercial banks, pursuant to PSC authorization, in the amount of $125 million, for a five-year term ending January 2, 2012. As of September 30, 2008, Central Hudson’s outstanding loan balance under this agreement was $15 million. As of December 31, 2007 and September 30, 2007, there were no borrowings under Central Hudson’s revolving credit agreement.
Central Hudson also maintains certain uncommitted lines of credit that diversify its sources and provide competitive options to minimize its cost of short-term debt. As of September 30, 2008, December 31, 2007 and September 30, 2007, Central Hudson’s outstanding balance on these lines of credit, in aggregate, was $21.5 million, $42.5 million and $36.0 million, respectively.
In addition to the $36.5 million in total short-term notes payable discussed above, at September 30, 2008, Central Hudson had $20 million in current maturities of long-term debt. On January 15, 2009, Central Hudson’s $20 million 1999 Series C 6% notes will mature. Central Hudson plans to refinance the notes.
Central Hudson’s current senior unsecured debt rating/outlook is A/stable by both Standard & Poor’s Rating Services (“Standard & Poor’s”) and Fitch Ratings and
- 65 -
A2/negative by Moody’s Investors Service (“Moody’s”). On September 19, 2008, Moody’s affirmed Central Hudson’s A2 rating, but changed the rating outlook to negative from stable. Moody’s cited concerns about weaker than expected 2008 financial performance, higher than historical average projected capital expenditures, and an increasing need for rate relief to bolster financial results as the primary reasons for the change in outlook.
In January 2008, Griffith established an uncommitted line of credit of up to $25 million with a commercial bank for the purpose of funding seasonal working capital. At September 30, 2008, this line of credit had no outstanding balance.
CH Energy Group and Central Hudson believe they will be able to meet their reasonably likely short-term and long-term cash requirements, assuming that Central Hudson’s future rate plans reflect the costs of service, including a reasonable return on invested capital.
Central Hudson has five debt series that were issued in conjunction with the sale of tax-exempt pollution control revenue bonds by New York State Energy Research and Development Authority (“NYSERDA”). These NYSERDA bonds, totaling $166 million, are insured by AMBAC Assurance Corporation (“AMBAC”). On June 5, 2008, Standard & Poor’s lowered its financial strength ratings on AMBAC to ‘AA’ from ‘AAA’ and placed the ratings on Credit Watch with negative implications. On August 14, 2008, Standard & Poor’s removed AMBAC from review for downgrade, but maintained a negative outlook. On June 19, 2008, Moody’s downgraded the insurance financial strength ratings of AMBAC to Aa3 from Aaa, and assigned a negative outlook. On September 18, 2008, Moody’s placed its Aa3 insurance financial strength rating for AMBAC under review for possible downgrade. Rating actions by Standard & Poor’s and Moody’s extend to Central Hudson’s five AMBAC-insured issues. Central Hudson is not able to predict the impact that the downgrade of AMBAC and other bond insurers will have on the market for insured municipal debt, but does not currently believe this situation will have a significant impact on the Company’s earnings or its ability to obtain debt financing. The underlying rating and outlook on these bonds and Central Hudson’s other senior unsecured debt is A/stable by Standard & Poor’s and Fitch Ratings and A2/negative by Moody’s.
Central Hudson’s 1998 NYSERDA Series A Bonds, totaling $16.7 million have a term interest rate of 3.0% that is scheduled to end on December 1, 2008. Central Hudson plans to re-market the bonds at then-current rates under the terms of the applicable indenture.
Central Hudson’s 1999 NYSERDA Series A Bonds, totaling $33.4 million, have an interest rate that is fixed to maturity in 2027 at 5.45%.
Central Hudson’s 1999 NYSERDA Bonds, Series B, C, and D, totaling $115.9 million, are multi-modal bonds that are currently in auction rate mode. Beginning in 1999 when the bonds were issued, the bonds’ interest rate has been reset every 35
- 66 -
days in a dutch auction. Auctions in the market for municipal auction rate securities have experienced widespread failures since early in 2008. Generally, an auction failure occurs because there is an insufficient level of demand to purchase the bonds and the bondholders who want to sell must hold the bonds for the next interest rate period. Since February 2008, all auctions for Central Hudson’s three series of auction rate bonds have failed. As a consequence, the interest rate paid to the bondholders has been set to the then prevailing maximum rate defined in the trust indenture. Central Hudson’s maximum rate results in interest rates that are generally higher than expected results from the auction process. For the foreseeable future, Central Hudson expects the maximum rate, determined on the date of each auction, to be 175% of the yield on an index of tax-exempt short-term debt, or its approximate equivalent. Since the first auction failure in February, the applicable maximum rate for Central Hudson’s bonds has ranged from 2.62% to 9.01%. In its Orders, the PSC has authorized deferral accounting treatment for the interest costs from Central Hudson’s three series of 1999 NYSERDA Bonds. As a result, variations in interest rates on these bonds are deferred for future recovery from or refunding to customers and Central Hudson does not expect the auction failures to have any adverse impact on earnings. To mitigate the potential impact of unexpected increases in short-term interest rates, Central Hudson purchases interest rate caps based on an index for short-term tax-exempt debt. A two-year, 4.5% cap on $115.9 million of debt expired March 31, 2008. Central Hudson replaced the expiring cap, effective April 1, 2008, with a one-year cap set at 3.0%. The interest rate cap is evaluated quarterly and Central Hudson would receive a payout under the terms of the cap if the index for short-term tax-exempt debt exceeds an average of 3.0% for the quarter.
Central Hudson is currently evaluating what actions, if any, it may take in the future in connection with its 1999 NYSERDA Bonds, Series B, C and D. Potential actions may include converting the debt from auction rate to another interest rate mode or refinancing with taxable bonds.
For additional information related to CH Energy Group’s and Central Hudson’s financing program, please see Note 7 – “Short-term Borrowing Arrangements”, Note 8 – “Capitalization – Common and Preferred Stock”, and Note 9 – “Capitalization – Long-term Debt” to the Consolidated Financial Statements of the Corporations’ 10-K Annual Report.
- 67 -
EARNINGS PER SHARE
CH Energy Group Consolidated
| | | | | | | | | | |
| | Three Months Ended September 30, | |
| |
| |
Earnings per Share (Basic) | | 2008 | | 2007 | | Change | |
| |
| |
| |
| |
|
Central Hudson - Electric | | $ | 0.49 | | $ | 0.48 | | $ | 0.01 | |
Central Hudson - Natural Gas | | | (0.12 | ) | | (0.11 | ) | | (0.01 | ) |
Griffith | | | (0.28 | ) | | (0.21 | ) | | (0.07 | ) |
Other Businesses and Investments | | | 0.09 | | | 0.11 | | | (0.02 | ) |
| |
|
| |
|
| |
|
| |
| | $ | 0.18 | | $ | 0.27 | | $ | (0.09 | ) |
| |
|
| |
|
| |
|
| |
| | | | | | | | | | |
| | Nine Months Ended September 30, | |
| |
| |
Earnings per Share (Basic) | | 2008 | | 2007 | | Change | |
| |
| |
| |
| |
|
Central Hudson - Electric | | $ | 1.11 | | $ | 1.21 | | $ | (0.10 | ) |
Central Hudson - Natural Gas | | | 0.24 | | | 0.31 | | | (0.07 | ) |
Griffith | | | (0.08 | ) | | 0.11 | | | (0.19 | ) |
Other Businesses and Investments | | | 0.24 | | | 0.35 | | | (0.11 | ) |
| |
|
| |
|
| |
|
| |
| | $ | 1.51 | | $ | 1.98 | | $ | (0.47 | ) |
| |
|
| |
|
| |
|
| |
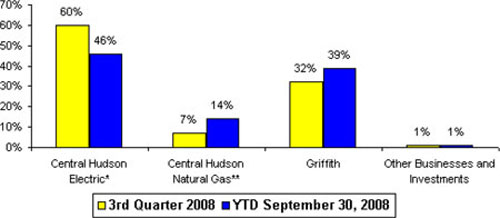
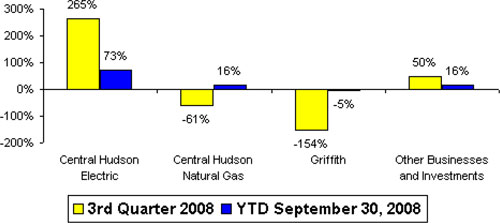
Earnings for CH Energy Group totaled $0.18 per share in 2008, versus $0.27 per share in the third quarter of 2007. Year-to-date earnings were $1.51 per share compared to $1.98 posted during the first nine months of 2007.
The results for the third quarter reflect a continuation of recent trends. Management believes that customers continue to actively manage their energy use. In addition, the weakening economy and high commodity costs have affected the ability of some customers to pay their bills on a timely basis.
- 68 -
Central Hudson
| | | | | | | | | | |
| | Three Months Ended September 30, | |
| |
| |
Earnings per Share (Basic) | | 2008 | | 2007 | | Change | |
| |
| |
| |
| |
|
Electric | | $ | 0.49 | | $ | 0.48 | | $ | 0.01 | |
Natural Gas | | | (0.12 | ) | | (0.11 | ) | | (0.01 | ) |
| |
|
| |
|
| |
|
| |
| | $ | 0.37 | | $ | 0.37 | | $ | — | |
| |
|
| |
|
| |
|
| |
Central Hudson’s earnings per share in the third quarter of 2008 were unchanged compared to the same period in 2007, due to the following:
| | | | |
Regulatory Mechanisms and Unusual Events: | | | | |
Shared earnings recorded in 2007 | | $ | (0.01 | ) |
Reliability Assessment | | | 0.01 | |
Rate Increases | | | 0.01 | |
Lower Injuries & Damages Reserve Requirements | | | 0.03 | |
Higher Depreciation | | | (0.03 | ) |
Higher Uncollectible Accounts | | | (0.04 | ) |
Weather-Normalized Sales | | | 0.03 | |
| |
|
| |
| | $ | — | |
| |
|
| |
| | | | | | | | | | |
| | Nine Months Ended September 30, | |
| |
| |
Earnings per Share (Basic) | | 2008 | | 2007 | | Change | |
| |
| |
| |
| |
|
Electric | | $ | 1.11 | | $ | 1.21 | | $ | (0.10 | ) |
Natural Gas | | | 0.24 | | | 0.31 | | | (0.07 | ) |
| |
|
| |
|
| |
|
| |
| | $ | 1.35 | | $ | 1.52 | | $ | (0.17 | ) |
| |
|
| |
|
| |
|
| |
Central Hudson’s earnings decreased $(0.17) per share in the first nine months of 2008 compared to the same period in 2007, due to the following:
| | | | |
Regulatory Mechanisms and Unusual Events: | | | | |
Shared earnings recorded in 2007 | | $ | 0.04 | |
Gain on Non-Utility Property Sales in 2007 | | | (0.02 | ) |
Reliability Assessment | | | 0.01 | |
Cable Attachment Rents in 2008 | | | 0.03 | |
Rate Increases | | | 0.11 | |
Weather Impact on Sales (Including Hedging) | | | (0.04 | ) |
Higher Storm Restoration Expense | | | (0.09 | ) |
Higher Income and Other Taxes | | | (0.07 | ) |
Lower Injuries & Damages Reserve Requirements | | | 0.04 | |
Higher Depreciation | | | (0.06 | ) |
Higher Uncollectible Accounts | | | (0.13 | ) |
Higher Interest Expense and Carrying Charges | | | (0.05 | ) |
Weather-Normalized Sales | | | 0.02 | |
Other | | | 0.04 | |
| |
|
| |
| | $ | (0.17 | ) |
| |
|
| |
For the third quarter, a delivery rate increase that was phased in at the beginning of the quarter and an increase in sales to new customers contributed favorably to
- 69 -
earnings. Higher uncollectible accounts negatively impacted third quarter and year-to-date results. Higher storm restoration expenses, taxes, and depreciation also contributed to the reduced year-to-date results. A request to increase delivery rates was filed July 31, 2008, and is under review by the New York State Public Service Commission.
Higher reserves for uncollectible accounts have reduced this quarter’s earnings by $0.04 per share and by $0.13 per share so far this year compared to the same periods in 2007. Central Hudson has experienced an approximately 50-percent increase in the dollar amount of accounts that have become past due compared to 2006. Central Hudson will continue to evaluate all options as to how to sensitively manage this matter.
- 70 -
Griffith
| | | | | | | | | | |
Earnings per Share (Basic) | | Three Months Ended September 30, | |
| |
| |
| | 2008 | | 2007 | | Change | |
| |
| |
| |
| |
| | $ | (0.28 | ) | $ | (0.21 | ) | $ | (0.07 | ) |
| |
|
| |
|
| |
|
| |
Griffith’s earnings decreased $(0.07) per share in the third quarter of 2008 compared to 2007, due to the following:
| | | | |
Margin on Petroleum Sales and Services | | $ | (0.01 | ) |
Weather Impact on Sales (Including Hedging) | | | (0.02 | ) |
Weather-Normalized Sales | | | (0.01 | ) |
Higher Uncollectible Accounts | | | (0.06 | ) |
Operating Expenses | | | 0.02 | |
Other | | | 0.01 | |
| |
|
| |
| | $ | (0.07 | ) |
| |
|
| |
| | | | | | | | | | |
Earnings per Share (Basic) | | Nine Months Ended September 30, | |
| |
| |
| | 2008 | | 2007 | | Change | |
| |
| |
| |
| |
| | $ | (0.08 | ) | $ | 0.11 | | $ | (0.19 | ) |
| |
|
| |
|
| |
|
| |
Griffith’s earnings decreased $(0.19) per share in the first nine months of 2008 compared to 2007, due to the following:
| | | | |
Acquisitions(1) | | $ | 0.05 | |
Margin on Petroleum Sales and Services | | | 0.04 | |
Weather Impact on Sales (Including Hedging) | | | (0.09 | ) |
Weather-Normalized Sales | | | (0.07 | ) |
Higher Uncollectible Accounts | | | (0.09 | ) |
Operating Expenses | | | (0.03 | ) |
| |
|
| |
| | $ | (0.19 | ) |
| |
|
| |
| |
(1) | For the purposes of the above charts, “Acquisitions” represents the incremental affect of acquisitions made by Griffith in 2008 and 2007. |
Griffith posted a ($0.28) loss per share during the third quarter of 2008, compared to a ($0.21) loss during the same three months of 2007. Higher reserves for doubtful accounts, customer conservation, and lower service revenues dampened earnings during the third quarter, a period when a loss is anticipated due to the seasonal nature of Griffith’s fuel oil delivery business. Griffith posted an ($0.08) loss per share during the first nine months of 2008 compared to earnings of $0.11 per share during the first nine months of 2007.
- 71 -
Other Businesses and Investments
| | | | | | | | | | |
Earnings per Share (Basic) | | Three Months Ended September 30, | |
| |
| |
| | 2008 | | 2007 | | Change | |
| |
| |
| |
| |
| | $ | 0.09 | | $ | 0.11 | | $ | (0.02 | ) |
| |
|
| |
|
| |
|
| |
The variation in earnings per share from CH Energy Group (the holding company) and CHEC’s partnership and other investment interests in the third quarter of 2008 compared to 2007 is due to the following:
| | | | | | | | | | |
Lower Interest and Investment Income | | | | | | | | $ | (0.02 | ) |
| | | | | | | |
|
| |
| | | | | | | | $ | (0.02 | ) |
| | | | | | | |
|
| |
| | | | | | | | | | |
Earnings per Share (Basic) | | Nine Months Ended September 30, | |
| |
| |
| | 2008 | | 2007 | | Change | |
| |
| |
| |
| |
| | $ | 0.24 | | $ | 0.35 | | $ | (0.11 | ) |
| |
|
| |
|
| |
|
| |
The variation in earnings per share from CH Energy Group (the holding company) and CHEC’s partnership and other investment interests in the first nine months of 2008 compared to 2007 is due to the following:
| | | | |
Cornhusker Investment | | $ | (0.07 | ) |
Lyonsdale Investment | | | 0.03 | |
Lower Interest and Investment Income | | | (0.07 | ) |
| |
|
| |
| | $ | (0.11 | ) |
| |
|
| |
Earnings per share from CH Energy Group’s other unregulated businesses for the third quarter and nine months ended September 30, 2008 decreased due to reduced interest and investment income. Lower returns on the Cornhusker investment compared to 2007 also impacted the year-to-date period.
- 72 -
RESULTS OF OPERATIONS
Central Hudson
The following discussions and analyses include explanations of significant changes in revenues and expenses between the three and nine months ended September 30, 2008, and the three and nine months ended September 30, 2007, for Central Hudson’s regulated electric and natural gas businesses.
| | | | | | | | | | | | | |
| | Three Months Ended
September 30, 2008
Over/(Under) same period
in 2007 | | Nine Months Ended
September 30, 2008
Over/(Under) same period
in 2007 | |
| |
| |
| |
Central Hudson
Income Statement Variances | | Amount
(In Thousands) | | Percent
Change | | Amount
(In Thousands) | | Percent
Change | |
| |
| |
| |
| |
| |
Operating Revenues | | $ | 11,203 | | | 6 | % | $ | 14,802 | | | 2 | % |
| | | | | | | | | | | | | |
Operating Expenses: | | | | | | | | | | | | | |
Purchased electric, fuel and natural gas | | | 8,984 | | | 7 | % | | 5,055 | | | 1 | % |
Depreciation and Amortization | | | 483 | | | 7 | % | | 867 | | | 4 | % |
Other operating expenses | | | 1,246 | | | 3 | % | | 9,833 | | | 7 | % |
| |
| |
| |
| |
| |
Total operating expenses | | $ | 10,713 | | | 6 | % | $ | 15,755 | | | 3 | % |
| |
| |
| |
| |
| |
Operating Income | | | 490 | | | 3 | % | | (953 | ) | | (2 | )% |
Other income, net | | | 62 | | | 6 | % | | 299 | | | 8 | % |
Interest Charges | | | 345 | | | 6 | % | | 1,839 | | | 11 | % |
| |
| |
| |
| |
| |
Income before income taxes | | | 207 | | | 2 | % | | (2,493 | ) | | (6 | )% |
Income Taxes | | | 185 | | | 4 | % | | 180 | | | 1 | % |
| |
| |
| |
| |
| |
Net (loss)/income | | $ | 22 | | | — | % | $ | (2,673 | ) | | (11 | )% |
| |
|
| |
|
| |
|
| |
|
| |
Delivery Volumes
Delivery volumes for Central Hudson vary in response to weather conditions and customer behavior. Electric deliveries typically peak in the summer and deliveries of natural gas used for heating purposes typically peak in the winter. Delivery volumes also vary as customers respond to the price of the particular energy product and changes in local economic conditions.
The following chart reflects the change in the level of electric and natural gas deliveries for Central Hudson for the three and nine months ended September 30, 2008, as compared to the same periods for 2007. Deliveries of electricity and natural gas to residential and commercial customers contribute the most to Central Hudson’s earnings. Industrial sales and interruptible sales have a negligible impact on earnings.
- 73 -
| | | | | | | | | | | | | |
| | Actual Deliveries | |
| |
| |
| | Three Months Ended
September 30, 2008
Increase (Decrease) from
same period in 2007 | | Nine Months Ended
September 30, 2008
Increase (Decrease) from
same period in 2007 | |
| |
| |
| |
| | Electric | | Natural Gas | | Electric | | Natural Gas | |
| |
| |
| |
| |
| |
Residential | | (2 | )% | | (5 | )% | | (2 | )% | | (3 | )% | |
Commercial | | (1 | )% | | (2 | )% | | (2 | )% | | (4 | )% | |
Industrial and Other(a) | | (7 | )% | | 0 | % | | (6 | )% | | 2 | % | |
| |
|
| |
|
| |
|
| |
|
| |
Total Deliveries | | (3 | )% | | (2 | )% | | (3 | )% | | (2 | )% | |
| |
|
| |
|
| |
|
| |
|
| |
| |
(a) | Excludes interruptible natural gas deliveries. |
| | | | | | | | | | | | | |
| | Weather Normalized Deliveries | |
| |
| |
| | Three Months Ended
September 30, 2008
Increase (Decrease) from
same period in 2007 | | Nine Months Ended
September 30, 2008
Increase (Decrease) from
same period in 2007 | |
| |
| |
| |
| | Electric | | Natural Gas | | Electric | | Natural Gas | |
| |
| |
| |
| |
| |
Residential | | (1 | )% | | (1 | )% | | 0 | % | | (1 | )% | |
Commercial | | 0 | % | | 2 | % | | (1 | )% | | (1 | )% | |
Industrial and Other(a) | | (7 | )% | | 4 | % | | (6 | )% | | (1 | )% | |
| |
|
| |
|
| |
|
| |
|
| |
Total Deliveries | | (2 | )% | | 1 | % | | (2 | )% | | (1 | )% | |
| |
|
| |
|
| |
|
| |
|
| |
| |
(a) | Excludes interruptible natural gas deliveries. |
Electric and natural gas deliveries to residential and commercial customers during the three months and nine months ended September 30, 2008, were impacted primarily by weather and by what management believes is price-induced customer conservation. Conservation was less evident for commercial customers during the three-month period. However, management expects conservation trends to continue as long as prices continue to be volatile.
Milder weather in the three months and nine months ended September 30, 2008, compared to the similar period in 2007 negatively impacted deliveries of electric and natural gas to residential and commercial customers. This negative effect of weather was partially offset by a modest increase in the number of electric and natural gas residential and commercial customers.
- 74 -
Revenues
Central Hudson’s revenues consist of two major categories: those which offset specific expenses in the current period (matching revenues), and those that impact earnings. Matching revenues recover Central Hudson’s actual costs for particular expenses. Any difference between these revenues and the actual expenses incurred is deferred for future recovery from or refund to customers and therefore does not impact earnings.
- 75 -
Three Months Ended September 30, 2008
Increase (Decrease) from same period in 2007
(In Thousands)
| | | | | | | | | | |
| | Electric | | Natural Gas | | Total | |
| |
| |
| |
| |
Revenues with Matching Offsets:(a) | | | | | | | | | | |
Energy cost adjustment | | $ | 9,397 | | $ | 1,577 | | $ | 10,974 | |
Sales to others for resale | | | (239 | ) | | (1,751 | ) | | (1,990 | ) |
Pension, OPEB and other revenues | | | 426 | | | 95 | | | 521 | |
| |
|
| |
|
| |
|
| |
Subtotal | | | 9,584 | | | (79 | ) | | 9,505 | |
| | | | | | | | | | |
Revenues Impacting Earnings: | | | | | | | | | | |
Customer sales | | | (532 | ) | | (185 | ) | | (717 | ) |
Other regulatory mechanisms | | | 768 | | | 352 | | | 1,120 | |
Pole attachments and other rents | | | 67 | | | — | | | 67 | |
Weather-hedging contracts | | | 370 | | | — | | | 370 | |
Other revenues | | | 795 | | | 63 | | | 858 | |
| |
|
| |
|
| |
|
| |
Subtotal | | | 1,468 | | | 230 | | | 1,698 | |
| |
|
| |
|
| |
|
| |
Total | | $ | 11,052 | | $ | 151 | | $ | 11,203 | |
| |
|
| |
|
| |
|
| |
| |
(a) | Revenues with matching offsets do not affect earnings since they offset related costs, the most significant being energy cost adjustment revenues, which provide for the recovery of purchased electricity and natural gas costs. Other related costs are pensions, OPEB, and the cost of special programs authorized by the PSC, which are funded with certain available credits. Changes in revenues from electric sales to other utilities also do not affect earnings since any related profits or losses are returned or charged, respectively, to customers. For natural gas sales to other entities for resale, 85% of such profits are returned to customers. |
Nine Months Ended September 30, 2008
Increase (Decrease) from same period in 2007
(In Thousands)
| | | | | | | | | | |
| | Electric | | Natural Gas | | Total | |
| |
| |
| |
| |
Revenues with Matching Offsets:(a) | | | | | | | | | | |
Energy cost adjustment | | $ | (6,108 | ) | $ | 3,107 | | $ | (3,001 | ) |
Sales to others for resale | | | (2,004 | ) | | 10,060 | | | 8,056 | |
Pension, OPEB and other revenues | | | 1,158 | | | 2,810 | | | 3,968 | |
| |
|
| |
|
| |
|
| |
Subtotal | | | (6,954 | ) | | 15,977 | | | 9,023 | |
| | | | | | | | | | |
Revenues Impacting Earnings: | | | | | | | | | | |
Customer sales | | | 668 | | | 272 | | | 940 | |
Other regulatory mechanisms | | | 2,546 | | | 314 | | | 2,860 | |
Pole attachments and other rents | | | 934 | | | — | | | 934 | |
Weather-hedging contracts | | | 23 | | | 37 | | | 60 | |
Other revenues | | | 1,373 | | | (388 | ) | | 985 | |
| |
|
| |
|
| |
|
| |
Subtotal | | | 5,544 | | | 235 | | | 5,779 | |
| |
|
| |
|
| |
|
| |
Total | | $ | (1,410 | ) | $ | 16,212 | | $ | 14,802 | |
| |
|
| |
|
| |
|
| |
| |
(a) | Revenues with matching offsets do not affect earnings since they offset related costs, the most significant being energy cost adjustment revenues, which provide for the recovery of purchased electricity and natural gas costs. Other related costs are pensions, OPEB, and the cost of special programs authorized by the PSC, which are funded with certain available credits. Changes in revenues from electric sales to other utilities also do not affect earnings since any related profits or losses are returned or charged, respectively, to customers. For natural gas sales to other entities for resale, 85% of such profits are returned to customers. |
- 76 -
Electric revenues increased for the three months ended September 30, 2008, as compared to the same period in 2007 due to higher revenues with matching offsets, primarily energy cost adjustment revenues. This increase reflects higher wholesale prices for purchased electricity in 2008 as well as the recovery of previously deferred energy costs, partially offset by lower delivery volumes.
Electric revenues decreased for the nine months ended September 30, 2008, as compared to the same period in 2007 due primarily to lower energy cost adjustment revenues driven by lower delivery volumes, partially offset by higher wholesale costs.
Natural gas revenues increased for the three months and nine months ended September 30, 2008, as compared to the same period in 2007, due to higher energy cost adjustment revenues as a result of higher wholesale costs, partially offset by lower delivery volumes. The increase for the nine month period was also due to higher revenues from gas sales to others for resale, and an increase in other revenues with matching offsets pursuant to the 2006 Order.
Operating Expenses
The most significant elements of Central Hudson’s operating expenses are purchased electricity and purchased natural gas; however, changes in these costs do not affect earnings since they are offset by changes in related revenues recovered through Central Hudson’s energy cost adjustment mechanisms. Additionally, there are other costs that are matched to revenues largely from customer billings, notably the cost of pensions and OPEBs.
Total utility operating expenses for the three months and nine months ended September 30, 2008 increased 6% and 3%, respectively, compared to the same periods last year. The following summarizes the change in operating expenses:
- 77 -
| | | | | | | |
| | Increase (Decrease) from same period in 2007 | |
| | Three Months
Ended
September 30, 2008 | | Nine Months
Ended
September 30, 2008 | |
| |
| |
| | Change
(In Thousands) | |
| |
| |
Expenses Currently Matched to Revenues:(1) | | | | | | | |
Purchased electricity | | $ | 9,158 | | $ | (8,112 | ) |
Purchased natural gas | | | (174 | ) | | 13,167 | |
Residual gas deferred balances | | | 9 | | | 2,774 | |
Environmental clean-up - MGP sites | | | — | | | 826 | |
Other matched expenses | | | 510 | | | 404 | |
| |
|
| |
|
| |
Subtotal | | | 9,503 | | | 9,059 | |
| | | | | | | |
Other Expense Variations: | | | | | | | |
Uncollectible reserve | | | 898 | | | 2,010 | |
Property taxes | | | 55 | | | 1,151 | |
Storm restoration expenses | | | 133 | | | 2,306 | |
Other expenses | | | 124 | | | 1,229 | |
| |
|
| |
|
| |
Subtotal | | | 1,210 | | | 6,696 | |
| | | | | | | |
Total Increase in Operating Expenses | | $ | 10,713 | | $ | 15,755 | |
| |
|
| |
|
| |
| |
(1) | Includes expenses that, in accordance with the 2006 Order, are adjusted in the current period to equal the revenues earned for the applicable expenses. |
In addition to the required adjustment to match revenues collected from customers, the variations in purchased electricity expense for the three months and nine months ended September 30, 2008, reflect the net effect of lower volumes delivered (influenced by weather and customer conservation) and higher wholesale prices. The increase in natural gas costs in both periods primarily reflects higher wholesale costs, partially offset by lower volumes delivered and was also influenced by customer conservation. The nine month period was also impacted by higher volumes of natural gas sold to others for resale. The increase in other revenue-matched expenses for the nine month period results primarily from the 2006 Order which allowed for rate changes corresponding to these expenses.
The increase in the uncollectible reserve in both periods results from higher energy prices, which along with unfavorable local economic conditions, have impacted customers’ ability to pay their bills. Property taxes increased at a rate close to the level projected in Central Hudson’s rate plan. The increase in storm restoration costs in the nine month period results from higher and more severe storm activity in 2008 than experienced during the same period in 2007.
- 78 -
Other Income
Other income and deductions for Central Hudson for the three months ended September 30, 2008, as compared to the same period in 2007, was virtually unchanged, while the nine month period ended September 30, 2008 increased $0.3 million due primarily to the recording of regulatory carrying charges on balances due from customers.
Interest Charges
Central Hudson’s interest charges increased $0.3 million for the three months ended September 30, 2008, and $1.8 million for the nine months ended September 30, 2008 compared to 2007 largely due to an increase in long-term debt resulting from the issuance of medium term notes in September 2007, the proceeds of which were used to finance ongoing investments in capital improvements.
Income Taxes
Income taxes for Central Hudson increased $0.2 million in the third quarter of 2008 compared to the same period in 2007. The increase in income taxes was primarily due to the unfavorable impact of flow through items related to depreciation and reserves and an increase in pre-tax book earnings. Income taxes for the nine months ended September 30, 2008 increased $0.2 million over the same period in 2007 with unfavorable impacts related to depreciation, reserves, the Medicare Act Subsidy and tax exempt interest offset by a decrease in pre-tax book income.
CH Energy Group
In addition to the impacts of Central Hudson discussed above, CH Energy Group’s sales volumes, revenues and operating expenses, income taxes and other income were impacted by Griffith and the other businesses described below. The results of Griffith and the other businesses described below exclude intercompany interest income and expense which are eliminated in consolidation.
- 79 -
| | | | | | | | | | | | | |
| | Three Months Ended
September 30, 2008
Over/(Under) same period
in 2007 | | Nine Months Ended
September 30, 2008
Over/(Under) same period
in 2007 | |
| |
| |
| |
CH Energy Group
Income Statement Variances | | Amount
(In Thousands) | | Percent
Change | | Amount
(In Thousands) | | Percent
Change | |
| |
| |
| |
| |
| |
Operating Revenues | | $ | 40,671 | | | 16 | % | $ | 149,754 | | | 17 | % |
| | | | | | | | | | | | | |
Operating Expenses: | | | | | | | | | | | | | |
Purchased electric, fuel, natural gas and petroleum | | | 36,775 | | | 21 | % | | 131,224 | | | 22 | % |
Depreciation and Amortization | | | 757 | | | 9 | % | | 1,636 | | | 6 | % |
Other operating expenses | | | 4,401 | | | 7 | % | | 21,714 | | | 11 | % |
| |
|
| |
|
| |
|
| |
|
| |
Total operating expenses | | $ | 41,933 | | | 17 | % | $ | 154,574 | | | 19 | % |
| |
|
| |
|
| |
|
| |
|
| |
Operating Income | | | (1,262 | ) | | (12 | )% | | (4,820 | ) | | (8 | )% |
Other income, net | | | (435 | ) | | (23 | )% | | (2,072 | ) | | (31 | )% |
Interest charges | | | 455 | | | 8 | % | | 2,365 | | | 14 | % |
Income before income taxes, preferred dividends of subsidiaries, and minority interest | | | (2,152 | ) | | (33 | )% | | (9,257 | ) | | (19 | )% |
Income taxes | | | (692 | ) | | (37 | )% | | (2,039 | ) | | (13 | )% |
| |
|
| |
|
| |
|
| |
|
| |
Net loss | | $ | (1,444 | ) | | (33 | )% | $ | (7,360 | ) | | (24 | )% |
| |
|
| |
|
| |
|
| |
|
| |
Griffith
Sales Volumes
Delivery and sales volumes for Griffith vary in response to weather conditions and customer behavior. Deliveries of petroleum products used for heating purposes peak in the winter. Sales also vary as customers respond to the price of the particular energy product and changes in local economic conditions.
Changes in sales volumes of petroleum products, including the impact of acquisitions, are set forth below.
- 80 -
| | | | | | | | | |
| | Actual Deliveries | |
| |
| |
| |
| | Three Months Ended
September 30, 2008 | | Nine Months Ended
September 30, 2008 | |
| |
| |
| |
| | % Change
from same
period in 2007 | | 2008
Volumes as %
of
Total Volume | | % Change
from same
period in 2007 | | 2008
Volumes as %
of
Total Volume | |
| |
| |
| |
| |
| |
|
Heating Oil | | | | | | | | | |
Base Company Volume(1) | | (25 | )% | 15 | % | (15 | )% | 34 | % |
Acquisitions Volume(2) | | 7 | % | 5 | % | 15 | % | 13 | % |
| |
| |
| |
| |
| |
Total Heating Oil | | (18 | )% | 20 | % | — | % | 47 | % |
| |
| |
| |
| |
| |
| | | | | | | | | |
Motor Fuels | | | | | | | | | |
Base Company Volume | | (6 | )% | 70 | % | (7 | )% | 46 | % |
Acquisitions Volume | | 6 | % | 8 | % | 9 | % | 5 | % |
| |
| |
| |
| |
| |
Total Motor Fuels | | — | % | 78 | % | 2 | % | 51 | % |
| |
| |
| |
| |
| |
| | | | | | | | | |
Propane and Other | | | | | | | | | |
Base Company Volume | | 7 | % | 2 | % | 5 | % | 2 | % |
Acquisitions Volume | | — | % | — | % | — | % | — | % |
| |
| |
| |
| |
| |
Total Propane and Other | | 7 | % | 2 | % | 5 | % | 2 | % |
| |
| |
| |
| |
| |
| | | | | | | | | |
Total | | | | | | | | | |
Base Company Volume | | (10 | )% | 87 | % | (11 | )% | 82 | % |
Acquisitions Volume | | 6 | % | 13 | % | 12 | % | 18 | % |
| |
| |
| |
| |
| |
Total | | (4 | )% | 100 | % | 1 | % | 100 | % |
| |
| |
| |
| |
| |
| |
(1) | For the purposes of this chart, “Base Company” means Griffith as constituted at January 1, 2007 (i.e., without any impact from acquisitions made by Griffith in 2008 and 2007). |
| |
(2) | For the purposes of this chart, “Acquisitions” represent the incremental effect of acquisitions made by Griffith in 2008 and 2007. |
Sales of petroleum products decreased 4% and increased 1% in the three and nine months ended September 30, 2008 respectively compared to the same periods in 2007. The decrease in the three month period was due primarily to reduced consumption due to price-related conservation partially offset by sales from acquisitions made in 2007 and 2008. The increase in sales for the nine months ended September 30, 2008 was due primarily to sales from the acquisitions made in 2007 and 2008. This increase was partially offset by reduced consumption by customers due to fewer heating degree days and price induced conservation. This decrease was due to weather that was 10% warmer in the first nine months of 2008 in comparison to 2007 as measured by heating degree days.
- 81 -
| | | | | | | | | |
| | Weather Normalized Deliveries | |
| |
| |
| | Three Months Ended
September 30, 2008 | | Nine Months Ended
September 30, 2008 | |
| |
| |
| |
| | % Change
from same
period in 2007 | | 2008
Volumes as %
of
Total Volume | | % Change
from same
period in 2007 | | 2008
Volumes as %
of
Total Volume | |
| |
| |
| |
| |
| |
|
Heating Oil | | | | | | | | | |
Base Company Volume(1) | | (18 | )% | 16 | % | (6 | )% | 36 | % |
Acquisitions Volume(2) | | 8 | % | 5 | % | 17 | % | 13 | % |
| |
| |
| |
| |
| |
Total Heating Oil | | (10 | )% | 21 | % | 11 | % | 49 | % |
| |
| |
| |
| |
| |
| | | | | | | | | |
Motor Fuels | | | | | | | | | |
Base Company Volume | | (6 | )% | 69 | % | (7 | )% | 44 | % |
Acquisitions Volume | | 6 | % | 8 | % | 9 | % | 5 | % |
| |
| |
| |
| |
| |
Total Motor Fuels | | — | % | 77 | % | 2 | % | 49 | % |
| |
| |
| |
| |
| |
| | | | | | | | | |
Propane and Other | | | | | | | | | |
Base Company Volume | | 14 | % | 2 | % | 14 | % | 2 | % |
Acquisitions Volume | | — | % | — | % | — | % | — | % |
| |
| |
| |
| |
| |
Total Propane and Other | | 14 | % | 2 | % | 14 | % | 2 | % |
| |
| |
| |
| |
| |
| | | | | | | | | |
Total | | | | | | | | | |
Base Company Volume | | (8 | )% | 87 | % | (6 | )% | 82 | % |
Acquisitions Volume | | 6 | % | 13 | % | 13 | % | 18 | % |
| |
| |
| |
| |
| |
Total | | (2 | )% | 100 | % | 7 | % | 100 | % |
| |
| |
| |
| |
| |
| |
(1) | For the purposes of this chart, “Base Company” means Griffith as constituted at January 1, 2007 (i.e., without any impact from acquisitions made by Griffith in 2008 and 2007). |
|
(2) | For the purposes of this chart, “Acquisitions” represent the incremental effect of acquisitions made by Griffith in 2008 and 2007. |
- 82 -
Revenues
Griffith Revenues
Increase (Decrease) from same period in 2007
(In Thousands)
| | | | | | | |
| | Three Months Ended
September 30, 2008 | | Nine Months Ended
September 30, 2008 | |
| |
| |
| |
Heating Oil | | | | | | | |
Base Company(1) | | $ | 2,207 | | $ | 23,986 | |
Acquisitions(2) | | | 2,707 | | | 32,536 | |
| |
|
| |
|
| |
Total Heating Oil | | $ | 4,914 | | $ | 56,522 | |
| |
|
| |
|
| |
Motor Fuels | | | | | | | |
Base Company | | $ | 17,602 | | $ | 51,468 | |
Acquisitions | | | 5,114 | | | 18,374 | |
| |
|
| |
|
| |
Total Motor Fuels | | $ | 22,716 | | $ | 69,842 | |
| |
|
| |
|
| |
Service Revenues | | | | | | | |
Base Company | | $ | (225 | ) | $ | (210 | ) |
Acquisitions | | | 1,361 | | | 4,357 | |
| |
|
| |
|
| |
Total Service Revenues | | $ | 1,136 | | $ | 4,147 | |
| |
|
| |
|
| |
Other | | | | | | | |
Propane | | $ | 305 | | $ | 1,201 | |
Weather-Hedging Contracts | | | — | | | 938 | |
Other | | | 253 | | | 523 | |
| |
|
| |
|
| |
Total Other | | $ | 558 | | $ | 2,662 | |
| |
|
| |
|
| |
| | | | | | | |
Total Revenues | | $ | 29,324 | | $ | 133,173 | |
| |
|
| |
|
| |
| |
(1) | For the purposes of this chart, “Base Company” means Griffith as constituted at January 1, 2007 (i.e., without any impact from acquisitions made by Griffith in 2008 and 2007). |
| |
(2) | For the purposes of this chart, “Acquisitions” represents the incremental effect of acquisitions made by Griffith in 2008 and 2007. |
Revenues, net of the effect of weather hedging contracts, increased in the three and nine months ended September 30, 2008 compared to the three and nine months ended September 30, 2007. These increases were due largely to an increase in average selling price per gallon in the third quarter and first nine months of 2008 compared to the same period in 2007, which resulted primarily from higher wholesale prices for petroleum products. Additionally, revenues increased due to revenues related to the acquisitions made in 2007 and 2008.
Operating Expenses
For the three months ended September 30, 2008, operating expenses increased $31 million, or 43%, from $72.5 million in 2007 to $103.5 million in 2008. The cost of petroleum products increased $27.8 million, or 51% due to an increase in the wholesale price of petroleum products.
Other operating expenses increased $3.2 million for the quarter due primarily to an increase in the expenses associated with the increased sales volumes noted above, an
- 83 -
increase in expenses associated with the increase in the cost of petroleum products, and an increase in the provision for uncollectible accounts.
For the nine months ended September 30, 2008, operating expenses increased $137.4 million, or 52%, from $266.2 million in 2007 to $403.6 million in 2008. The cost of petroleum products increased $125.4 million, or 60% due to an increase in sales volume resulting primarily from acquisitions and an increase in the wholesale price of petroleum products.
Other operating expenses increased $12 million year-to-date due primarily to an increase in the expenses associated with the increased sales volumes noted above, an increase in expenses associated with the increase in the cost of petroleum products, and an increase in the provision for uncollectible accounts.
Other Businesses and Investments
Revenues and Operating Expenses
The operating results of Lyonsdale are consolidated in the Consolidated Financial Statements of CH Energy Group. Results for the three months ended September 30, 2008 compared to the same period in 2007 reflect an increase in operating revenues of $0.2 million and increased total operating expenses of $0.2 million with a net decrease in CH Energy Group’s net income of $46,000. Results for the nine months ended September 30, 2008 reflect an increase in operating revenues of $1.8 million and increased total operating expenses of $1.2 million. These results reflect a higher capacity factor at Lyonsdale during the first nine months of 2008 compared to the same period in 2007, resulting in a net increase in CH Energy Group’s net income of $0.4 million.
Other Income
Other income and deductions for the balance of CH Energy Group, primarily the holding company and CHEC’s investments in partnerships and other investments (other than Griffith), decreased $0.3 million and $2.1 million for the three months ended and nine months ended September 30, 2008, respectively. This is primarily attributable to decreased interest and investment income as a result of the redeployment of capital from short-term investments to CH Energy Group’s subsidiaries. The lower interest and investment income reduced earnings by $0.4 million and $1.1 million for the three months and nine months ended September 30, 2008, respectively.
Lower earnings of CH Energy Group’s Cornhusker Holdings investment also impacted the nine month period. Lower crush margins, the difference between the price of the feedstock inputs (corn) and the output (ethanol), was the primary reason for the decrease in Cornhusker Holdings earnings of $1.0 million for the nine months ended September 30, 2008.
- 84 -
Income Taxes
Income taxes for CH Energy Group decreased $0.7 million in the third quarter of 2008 compared to the same period in 2007. The decrease in income taxes was primarily due to decreased pre-tax book earnings at Griffith and CH Energy Group’s other businesses and investments offset by slightly higher income taxes for Central Hudson. Income taxes for the nine months ended September 30, 2008 decreased $2.0 million from the same period in 2007 due primarily to a decrease in pre-tax book income for Griffith and CH Energy Group’s other businesses and investments offset by slightly higher income taxes for Central Hudson.
CRITICAL ACCOUNTING POLICIES
Use of Estimates: Preparation of the consolidated Financial Statements in accordance with accounting principles generally accepted in The United States of America (“GAAP”) includes the use of estimates and assumptions by management that affect financial results. Actual results may differ from those estimated; however the methods used by CH Energy Group to prepare estimates have historically produced reliable results.
Expense items most affected by the use of estimates are depreciation and amortization (including amortization of intangible assets), reserves for uncollectible accounts receivable, other operating reserves, unbilled revenues, and pension and other post-retirement benefits.
Depreciation and amortization is based on estimates of the useful lives and estimated net salvage value of properties. For Central Hudson, these estimates are subject to change as the result of a future rate proceeding. Historical changes have not been material to the company’s financial results. For Griffith and Lyonsdale, any changes in estimates used for depreciation are not expected to have a material impact on CH Energy Group’s financial results. The amortization of CH Energy Group’s other intangible assets is discussed in detail below under the caption “Goodwill and Other Intangible Assets.”
Estimates for uncollectible accounts are based on customer accounts receivable aging data as well as consideration of various quantitative and qualitative factors, including special collection issues. The estimates for other operating reserves are based on assessments of future obligations related to injuries and damages and workers compensation claims. Unbilled revenues are determined based on the estimated sales for bimonthly accounts that have not been billed by Central Hudson in the current month. The estimation methods used in determining these sales are the same methods used for billing customers when actual meter readings cannot be obtained. Historical changes to these items have not been material to the company’s financial results.
- 85 -
See Note 1 – “Summary of Significant Accounting Policies” under the caption “Use of Estimates” to the Consolidated Financial Statements of the Corporations’ 10-K Annual Report for additional discussion.
Goodwill and Other Intangible Assets: The balances reflected on CH Energy Group’s Consolidated Balance Sheet at September 30, 2008, December 31, 2007, and September 30, 2007 for “Goodwill” and “Other intangible assets – net” relate to Griffith. Goodwill represents the excess of cost over the fair value of the net tangible and identifiable intangible assets of businesses acquired as of the date of acquisition.
As required by Statement of Financial Accounting Standards (“SFAS”) No. 142, titled Goodwill and Other Intangible Assets (“SFAS 142”), both goodwill and intangible assets not subject to amortization are tested at least annually for impairment and whenever events or circumstances make it more likely than not that an impairment may have occurred, such as a significant adverse change in the business climate or a decision to sell or dispose of a reporting unit. In assessing whether an impairment exists the fair value of the reporting units is compared to the carrying amount of assets. Fair value of goodwill is estimated using a discounted cash flow measurement. When available and as appropriate, comparative market multiples are used to corroborate discounted cash flows. In applying this methodology, reliance is placed on a number of factors, including actual operating results, future business plans, economic projections and market data. The carrying amount for goodwill was $67.6 million as of September 30, 2008, $63.4 million as of December 31, 2007, and $58.4 million as of September 30, 2007. Historical impairment tests have not resulted in the recognition of any impairment. However, if the operating cash flows of Griffith decline significantly in the future, the result could be recognition of a future goodwill impairment charge to operations and the amount could be material to CH Energy Group’s Consolidated Financial Statements.
The most significant assumptions used in the discounted cash flow valuation regarding Griffith’s fair value in connection with goodwill valuations are: (1) detailed five year cash flow projections, (2) the risk adjusted discount rate, and (3) Griffith’s expected long-term growth rate, which approximates the growth rate imputed from the discrete period cash flow projections on key aspects of the business. The primary drivers of Griffith’s cash flow projections include sales volumes, margin rates and inflationary increases, particularly for labor. The risk adjusted discount rate represents Griffith’s weighted average cost of capital and is established based on (1) the 30 year risk-free rate, which is impacted by events external to Griffith, such as investor expectations regarding economic activity, (2) Griffith’s required rate of return on equity, and (3) the current after tax rate of return on debt. In valuing its goodwill for 2007, Griffith used an average risk adjusted discount rate of 9.9%. Had the risk-adjusted discount rate been 25 basis points higher, the aggregate estimated fair value of the reporting units would have decreased by $4.1 million, or 2.7%. In addition, Griffith used an average expected terminal growth rate of 1.5%. If the expected terminal growth rate was 25 basis points lower, the aggregate estimated fair value of the reporting units would have decreased by $2.9 million, or 1.9%. Had each year in Griffith’s five-year cash flow projections been
- 86 -
lower by 1.0%, the aggregate estimated fair value of the reporting units would have decreased by $0.5 million, or 0.3%.
Other intangible assets - net relate to Griffith and are comprised of customer relationships, trademarks and covenants not to compete. If events indicate that an impairment exists, these assets are tested for impairment by comparing the carrying amount to the sum of undiscounted cash flows expected to be generated by the asset.
In accordance with SFAS 142 intangible assets that have finite useful lives continue to be amortized over their useful lives. The estimated useful life for customer relationships is 15 years, which is believed to be appropriate in view of average historical customer turnover. However, if customer turnover were to substantially increase, a shorter amortization period would be used, resulting in an increase in amortization expense. For example, if a ten-year amortization period were initially used, annual amortization expense would increase by approximately $1.8 million. The estimated useful lives of trademarks range from five to fifteen years and are based upon management’s assessment of several variables such as brand recognition, management’s plan for the use of the trademark, and other factors which will affect the duration of the trademark’s life. The useful life of a covenant not to compete is based on the expiration date of the covenant, generally between two and ten years. The weighted average amortization periods for customer relationships, trademarks and covenants not to compete are 15 years, 11 years, and 8.7 years, respectively. The weighted average amortization period for all amortizable intangible assets is 14.6 years. The estimated useful life of Griffith’s customer relationships is tested annually based on actual experience. The amortizable life of these assets has not changed since Griffith was acquired. Griffith will complete its annual impairment testing in the fourth quarter. Despite the unfavorable impact of oil price volatility and the weakening economy, Griffith’s management believes this is temporary and therefore does not anticipate this testing to result in impairment of its goodwill or other intangible assets.
See Note 6 – “Goodwill and Other Intangible Assets” for additional discussion.
Post-Employment Benefits: Central Hudson’s reported costs of providing non-contributory defined pension benefits as well as certain health care and the life insurance benefits for retired employees are dependent upon numerous factors resulting from actual plan experience and assumptions of future plan performance.
The significant assumptions and estimates used to account for the Retirement Plan and other post-retirement benefit expenses and liabilities are the discount rate, the expected long-term rate of return on the pension plan and other post-retirement plan assets, health care cost trend rate, the rate of compensation increase, and the method of amortizing gains and losses.
For 2007 the Projected Benefit Obligation (“PBO”) for Central Hudson’s Retirement Plan ($409 million) and its obligation for post-retirement health-care (“OPEB”) costs ($148 million) were determined using 6.2% and 6.4% discount rates,
- 87 -
respectively. These rates were determined using the Citigroup Pension Discount Curve reflecting projected cash flows. A 0.25% change in the discount rate would affect the projection of the pension PBO by approximately $11.8 million and the OPEB obligation by approximately $4.6 million. Declines in the market value of the pension Trust Fund’s investment portfolio, which occurred from 2000 through 2002, and a reduction in the discount rate have resulted in a significant increase in pension and OPEB costs since 2001. Similar changes in the future could have similar results on these costs. The recent volatility in the financial markets has reduced the values of the Retirement Plan and the OPEB assets. Management believes that increasing discount rates will also reduce the present value of the plans’ liabilities. The net effect on the funded status of the plans may result in a reduction of the proportion of the plans liability that is currently funded. If future market conditions do not improve sufficiently to offset these changes, additional contributions will likely become necessary in 2009 under the terms of the Pension Protection Act. Management expects that such contributions will be incorporated in the rate making process over time. Central Hudson has investment policies for these plans which include asset allocation ranges designed to achieve a reasonable return over the long-term, recognizing the impact of market volatility. Management cannot currently predict what impact the recent financial market volatility may have on the expected rate of return on plan assets or future funding decisions. A 0.25% change in the discount rate would impact the net periodic benefit cost by $1.3 million for the Retirement Plan and $0.5 million for OPEBs. In order to reduce the total costs of benefits, OPEB plan changes were negotiated with the IBEW Local 320 for unionized employees and certain retired employees effective May 1, 2008. The discount rate sensitivity does not reflect recent plan design modifications, however, it should be noted that based on these modifications resulting from these negotiations, the estimated PBO for the OPEB plan has decreased from $148 million at December 31, 2007 to approximately $120 million.
Central Hudson amortizes actuarial gains and losses related to these obligations over ten years in accordance with PSC-prescribed provisions.
The expected long-term rate of return on Retirement Plan and OPEB assets is 8.0%, net of investment expense. In determining the expected long-term rate of return on these assets, Central Hudson considered the current level of expected returns on risk-free investments (primarily United States government bonds), the historical level of risk premiums associated with other asset classes, and the expectations of future returns over a 20-year time horizon on each asset class, based on the views of leading financial advisors and economists. The expected return for each asset class was then weighted based on each plan’s target asset allocation. Central Hudson also considered expectations of value-added by active management, net of investment expenses. The actual annual return on Central Hudson’s Retirement Plan assets has ranged from 7.4% to 19.9% and from 4.1% to 18.7% on its OPEB assets over the last five years. A 25 basis point decrease in the expected long-term rate of return on Retirement Plan and OPEB assets would have the following impact: increase the net periodic benefit cost by $0.9 million for the pension plan and $0.2 million for OPEBs. The expected long-term rate of return is reviewed annually in the fourth quarter and updated if the determinants
- 88 -
have changed. The current market conditions will be considered in the next valuation, which will occur as of December 31, 2008.
The estimates of health care cost trend rates are based on a review of actual recent trends and projected future trends. Assumed health care cost trend rates have a significant effect on the amounts reported for the health care plan. A 1% change in assumed health care cost trend rates would have the following effects:
| | | | | | | | | | | |
| | One Percentage
Point Increase | | One Percentage
Point Decrease | |
| |
| |
| |
| | (In Thousands) | |
Effect on total of service and interest cost components for 2007 | | | $ | 1,854 | | | | $ | (1,500 | ) | |
| | | | | | | | | | | |
Effect on year-end 2007 post-retirement benefit obligation | | | $ | 14,991 | | | | $ | (12,522 | ) | |
In accordance with the terms of the 2006 Order, Central Hudson is authorized to defer any differences between rate allowances and actual costs for both its Retirement and OPEB plans.
See Note 10 – “Post-Employment Benefits” for additional discussion.
Accounting for Derivatives: CH Energy Group and its subsidiaries use derivatives to manage their commodity and financial market risks; they do not enter into derivative instruments for speculative purposes. As a result of deferrals under Central Hudson’s regulatory mechanisms and offsetting changes of commodity prices for both Central Hudson and Griffith, derivatives that CH Energy Group and Central Hudson enter into do not materially impact earnings.
All derivatives, other than those specifically excepted, are reported on the Consolidated Balance Sheet at fair value. For discussions relating to market risk and derivative instruments, see Item 7A – “Quantitative and Qualitative disclosure About Market Risk” and Note 14 – “Accounting for Derivative Instruments and Hedging Activities” of the Consolidated Financial Statements of the Corporations’ 10-K Annual Report.
See Note 14 – “Accounting for Derivative Instruments and Hedging Activities” of this Form 10-Q for additional discussion.
COMMON STOCK DIVIDENDS
CH Energy Group’s ability to pay dividends may be affected by the ability of its subsidiaries to pay dividends. The Federal Power Act limits the payment of dividends by Central Hudson to its retained earnings. More restrictive is the PSC’s limit on the
- 89 -
dividends Central Hudson may pay to CH Energy Group which is 100% of the average annual income available for common stock, calculated on a two-year rolling average basis. Central Hudson’s dividend would be reduced below 100% of its annual average income in the event of a downgrade of its senior debt rating below “BBB+” by more than one rating agency if the stated reason for the downgrade is related to CH Energy Group or any of Central Hudson’s affiliates. Central Hudson is currently rated “A” or the equivalent. As of September 30, 2008, the amount of Central Hudson’s retained earnings that were free of restrictions was $30.2 million. CH Energy Group’s other subsidiaries do not have restrictions on their ability to pay dividends.
Reference is made to the caption “Common Stock Dividends and Price Ranges” of Part II, Item 7 of the Corporations’ 10-K Annual Report for a discussion of CH Energy Group’s dividend payments. On September 30, 2008, the Board of Directors of CH Energy Group declared a quarterly dividend of $0.54 per share, payable November 3, 2008, to shareholders of record as of October 10, 2008.
On October 2, 2007, the Board of Directors of CH Energy Group declared a quarterly dividend of $0.54 per share, payable November 1, 2007, to shareholders of record as of October 12, 2007. Although this dividend was declared at the beginning of the fourth quarter, it represented the third quarter 2007 dividend declaration.
OTHER MATTERS
Changes in Accounting Standards: See Note 1 – “Summary of Significant Accounting Policies” and Note 3 – “New Accounting Standards and Other FASB Projects” for discussion of relevant changes, which discussion is incorporated by reference herein.
FORWARD-LOOKING STATEMENTS
Statements included in this Quarterly Report on Form 10-Q and any documents incorporated by reference which are not historical in nature are intended to be, and are hereby identified as, “forward-looking statements” for purposes of the safe harbor provided by Section 21E of the Exchange Act. Forward-looking statements may be identified by words including “anticipates,” “intends,” “estimates,” “believes,” “projects,” “expects,” “plans,” “assumes,” “seeks,” and similar expressions. Forward-looking statements including, without limitation, those relating to CH Energy Group’s and Central Hudson’s future business prospects, revenues, proceeds, working capital, liquidity, income, and margins, are subject to certain risks and uncertainties that could cause actual results to differ materially from those indicated in the forward-looking statements, due to several important factors, including those identified from time-to-time in the forward-looking statements. Those factors include, but are not limited to: deviations from normal seasonal weather and storm activity; fuel prices; corn and ethanol prices; plant capacity factors; energy supply and demand; interest rates; potential future acquisitions; legislative, regulatory, and competitive developments; market risks; electric and natural gas industry restructuring and cost recovery; the ability
- 90 -
to obtain adequate and timely rate relief; changes in fuel supply or costs including future market prices for energy, capacity, and ancillary services; the success of strategies to satisfy electricity, natural gas, fuel oil, and propane requirements; the outcome of pending litigation and certain environmental matters, particularly the status of inactive hazardous waste disposal sites and waste site remediation requirements; and certain presently unknown or unforeseen factors, including, but not limited to, acts of terrorism. CH Energy Group and Central Hudson undertake no obligation to update publicly any forward-looking statements, whether as a result of new information, future events, or otherwise.
Given these uncertainties, undue reliance should not be placed on the forward-looking statements.
| |
ITEM 3 – | QUANTITATIVE AND QUALITATIVE DISCLOSURES ABOUT MARKET RISK |
Reference is made to Part II, Item 7A of the Corporations’ 10-K Annual Report for a discussion of market risk. 2008 has been a challenging year in the financial markets with extraordinary volatility of commodity prices and interest rates. The practices employed by CH Energy Group and Central Hudson to mitigate these risks discussed in the Corporations’ 10-K Annual Report continue to operate effectively. For related discussion on this activity, see, in the Consolidated Financial Statements of the Corporations’ 10-K Annual Report, Note 14 – “Accounting for Derivative Instruments and Hedging Activities” and Item 7 – “Management’s Discussion and Analysis of Financial Condition and Results of Operations” under the subcaption “Capital Resources and Liquidity,” and Note 9 – Long-Term Debt, and Item 7A – “Management’s Discussion and Analysis of Financial Condition and Results of Operations” under the subcaption “Financing Program” of this form 10-Q.
| |
ITEM 4 – | CONTROLS AND PROCEDURES |
The Chief Executive Officer and Chief Financial Officer of CH Energy Group and Central Hudson evaluated the effectiveness of the disclosure controls and procedures (as defined in Rule 13a-15(e) under the Securities Exchange Act of 1934, as amended) as of the end of the period covered by this Quarterly Report on Form 10-Q and based on the evaluation, concluded that, as of the end of the period covered by this Quarterly Report on Form 10-Q, the Corporations’ controls and procedures are effective.
There were no changes to the Corporations’ internal control over financial reporting that occurred during the Corporations’ last fiscal quarter that have materially affected, or are reasonably likely to materially affect, the Corporations’ internal control over financial reporting.
- 91 -
PART II – OTHER INFORMATION
For information about developments regarding certain legal proceedings, see Item 3 (“Legal Proceedings”) of the Corporations’ 10-K Annual Report, and Note 12 – “Commitments and Contingencies” of that 10-K and/or Note 12 – “Commitments and Contingencies” of this 10-Q.
Central Hudson:
| |
| Former Manufactured Gas Plant Facilities
Little Britain Road
Newburgh Consolidated Iron Works
Asbestos Litigation |
CHEC:
Griffith’s remediation efforts at its Kable Oil bulk plant.
For a discussion identifying risk factors that could cause actual results to differ materially from those anticipated, see the discussion under “Item 1A – Risk Factors” of the Corporations’ 10-K Annual Report.
The Profitability of CHEC’s Investments in Ethanol Projects May Be Adversely Impacted by Commodity Price Changes or the Lack of Capital Available to Project Developers to Complete New Projects
Description and Sources of Risk:
| |
| CHEC’s management believes that increases in wholesale corn prices and/or decreases in ethanol prices are caused by a variety of factors, including, but not limited to the following: |
| | | |
| | o | Actions by the federal government that reduce the demand for, or increase the supply of, ethanol. Such actions could include, but are not limited to, a reduction in the required level of ethanol blending, decreases in tax credits to refiners and/or reductions in tariffs on imported ethanol. |
| | | |
| | o | Imbalances in the supply of and demand for corn. This could be caused by, among other things (1) drought, flood or other acts of nature, (2) changes in agricultural markets, technology or regulations, (3) increased construction of new ethanol production facilities or (4) governmental |
- 92 -
| | | |
| | | actions that discourage raising corn for use in ethanol production (such as providing tax credits for corn grown for human consumption). |
| | | |
| | o | Volatility in domestic and/or foreign markets may result in increased corn prices and/or lower ethanol prices. |
| | | |
| Potential Impacts: Prolonged increases in corn prices and/or decreases in ethanol prices could have a material adverse impact on the earnings of Cornhusker Holdings, which could lead to an impairment of CHEC’s investment. |
| |
| Additionally, prolonged increases in corn prices and/or decreases in ethanol prices could reduce cash flows of Cornhusker Energy Lexington, LLC which, in turn, could lead to loan defaults. Loan defaults could adversely impact CHEC’s level of investments, cash flows or future earnings. |
Incorporated herein by reference to the Exhibit Index for this 10-Q Quarterly Report, which is located immediately after the signature pages to this report.
- 93 -
SIGNATURES
Pursuant to the requirements of the Securities Exchange Act of 1934, the registrants have duly caused this report to be signed on their behalf by the undersigned thereunto duly authorized.
| | | |
| | | CH ENERGY GROUP, INC. |
| | | (Registrant) |
| | | |
| | By: | /s/ Kimberly J. Wright |
| | |
|
| | | Kimberly J. Wright |
| | | Vice President - Accounting and Controller |
| | | |
| | | CENTRAL HUDSON GAS & ELECTRIC |
| | | CORPORATION |
| | | (Co-Registrant) |
| | | |
| | By: | /s/ Kimberly J. Wright |
| | |
|
| | | Kimberly J. Wright |
| | | Controller |
| | | |
Dated: November 4, 2008 | | | |
- 94 -
EXHIBIT INDEX
Following is the list of Exhibits, as required by Item 601 of Regulation S-K, filed as part of this Quarterly Report on Form 10-Q:
Exhibit No.
Regulation S-K
Item 601
- 95 -