
1 Q3 2022 Earnings November 2022 Putting an accessible and affordable quality health service in the hands of every person on Earth
Disclaimer Use of Non-IFRS Financial Measures This presentation includes certain financial measures to evaluate Babylon’s historical and projected financial and operating performance, and measures calculated based on these measures, including Adjusted EBITDA, Adjusted EBITDA Margin, Medical Loss Ratio and Medical Margin, that are not prepared in accordance with IFRS. EBITDA is defined as profit (loss) for the period, adjusted for finance costs and income, depreciation and amortization, and tax provision or benefit. Adjusted EBITDA is defined as profit (loss) for the period, adjusted for finance costs and income, depreciation and amortization, tax provision or benefit, change in fair value of warrant liabilities, loss on settlement of warrants, share-based compensation, impairment expenses, foreign exchange gain, restructuring and other one-time benefit arrangements, or loss and gain or loss on sale of subsidiaries. Loss for the period is the most directly comparable IFRS measure to Adjusted EBITDA. Adjusted EBITDA Margin is defined as Adjusted EBITDA divided by Total revenue for the corresponding period. IFRS Loss for the period margin is the most directly comparable IFRS measure to Adjusted EBITDA Margin. Medical Loss Ratio and Medical Margin are derived from amounts presented in the Statement of Profit and other Comprehensive Loss included in the “Financial Statements and Reconciliations” section of this presentation. We believe that EBITDA, Adjusted EBITDA, Adjusted EBITDA Margin, Medical Loss Ratio and Medical Margin are useful metrics for investors to understand and evaluate our operating results and ongoing profitability because they permit investors to evaluate our recurring profitability from our ongoing operating activities. EBITDA, Adjusted EBITDA, Adjusted EBITDA Margin, Medical Loss Ratio and Medical Margin have certain limitations, and you should not consider them in isolation or as a substitute for analysis of our results of operations as reported under IFRS. We caution investors that amounts presented in accordance with our definitions of EBITDA, Adjusted EBITDA, Adjusted EBITDA Margin, Medical Loss Ratio and Medical Margin may not be comparable to similar measures disclosed by other issuers, because some issuers calculate EBITDA, Adjusted EBITDA, Adjusted EBITDA Margin, Medical Loss Ratio and Medical Margin differently or not at all, limiting their usefulness as direct comparative measures. A reconciliation of EBITDA and Adjusted EBITDA from the most directly comparable IFRS measure, Loss for the period, and the calculations of IFRS Loss for the period margin, Adjusted EBITDA Margin, Medical Loss Ratio and Medical Margin been provided in the “Financial Statements and Reconciliations” section of this presentation. We are not able to reconcile projected 2022 Adjusted EBITDA to the respective most directly comparable IFRS measure as we are not able to forecast IFRS loss on a forward-looking basis without unreasonable efforts due to the high variability and difficulty in predicting certain items that affect IFRS loss for the period, including, but not limited to, impairment expense, share-based compensation, restructuring and other one-time benefit expenses, foreign exchange gains or losses, and gains and losses on sale of subsidiaries. Adjusted EBITDA should not be used to predict IFRS loss as the difference between the two measures is variable and may be significant. Additional information and where to find it Babylon Holdings Limited (“Babylon”) is subject to the informational reporting requirements of the Securities Exchange Act of 1934, as amended (the “Exchange Act”). We file reports and other information with the Securities and Exchange Commission (the “SEC”) under the Exchange Act. Our SEC filings are available over the Internet at the SEC’s website at www.sec.gov. Forward-looking statements This presentation contains “forward-looking statements” as defined in the Private Securities Litigation Reform Act of 1995. Forward-looking statements generally relate to future events or our future financial or operating performance. When used in this presentation, the words “estimates,” “projected,” “expects,” “anticipates,” “forecasts,” “plans,” “intends,” “believes,” “seeks,” “may,” “will,” “should,” “future,” “propose” and variations of these words or similar expressions (or the negative versions of such words or expressions) are intended to identify forward-looking statements. These forward-looking statements include, without limitation, information concerning Babylon’s possible or assumed future results of operations, business strategies, debt levels, competitive position, industry environment and potential growth opportunities. These forward-looking statements are not guarantees of future performance, conditions, or results, and involve a number of known and unknown risks, uncertainties, assumptions and other important factors, many of which are outside of Babylon’s management’s control, that could cause actual results to differ materially from the results discussed in the forward-looking statements. These risks, uncertainties, assumptions and other important factors include, but are not limited to our future financial and operating results and ability to generate profits in the future; that we may require additional financing and our ability to obtain additional financing on favorable terms; our ability to sell the Meritage Medical Network/IPA business, including the timing of the sale and the sale price; the impact of our planned reverse share split on the price and trading market for our Class A ordinary shares; if we fail to comply with the NYSE’s continued listing standards and rules, the NYSE may delist our Class A ordinary shares; uncertainties related to our ability to continue as a going concern; our ability to successfully execute our planned cost reduction actions and realize the expected cost savings; the growth of our business and organization; risks associated with impairment of goodwill and other intangible assets; our failure to compete successfully; our ability to renew contracts with existing customers, and risks of contract renewals at lower fee levels, or significant reductions in members, pricing or premiums under our contracts due to factors outside our control; our dependence on our relationships with physician-owned entities; our ability to maintain and expand a network of qualified providers; our ability to increase engagement of individual members or realize the member healthcare cost savings that we expect; a significant portion of our revenue comes from a limited number of customers; the uncertainty and potential inadequacy of our claims liability estimates for medical costs and expenses; risks associated with estimating the amount and timing of revenue recognized under our licensing agreements and value-based care agreements with health plans; risks associated with our physician partners’ failure to accurately, timely and sufficiently document their services; risks associated with inaccurate or unsupportable information regarding risk adjustment scores of members in records and submissions to health plans; risks associated with reduction of reimbursement rates paid by third-party payers or federal or state healthcare programs; risks associated with regulatory proposals directed at containing or lowering the cost of healthcare, including the ACO REACH model; immaturity and volatility of the market for telemedicine and our unproven digital-first approach; our ability to develop and release new solutions and services; difficulty in hiring and retaining talent to operate our business; risks associated with our international operations, economic uncertainty, or downturns; the impact of COVID-19 or any other pandemic, epidemic or outbreak of an infectious disease in the United States or worldwide on our business; risks associated with foreign currency exchange rate fluctuations and restrictions; and the other risks and uncertainties identified in Babylon’s Annual Report on Form 20-F filed with the SEC on March 30, 2022, and in other documents filed or to be filed by Babylon with the SEC and available at the SEC’s website at www.sec.gov. Babylon cautions that the foregoing list of factors is not exclusive and cautions readers not to place undue reliance upon any forward-looking statements, which speak only as of the date made. Except as required by law, Babylon does not undertake any obligation to update or revise its forward-looking statements to reflect events or circumstances after the date of this presentation. Information sources The information herein is derived from various internal and external sources. Unless otherwise indicated, information contained in this presentation concerning Babylon’s industry and the regions in which it operates, including Babylon’s general expectations and market position, market opportunity, market share and other management estimates, is based on information obtained from various independent publicly available sources and reports provided to us, and other industry publications, surveys and forecasts. We have not independently verified the accuracy or completeness of any third-party information. Similarly, internal surveys, industry forecasts and market research, which we believe to be reliable based upon our management’s knowledge of the industry, have not been independently verified. While we believe that the market data, industry forecasts and similar information included in this presentation are generally reliable, such information is inherently imprecise. In addition, assumptions and estimates of our future performance and growth objectives and the future performance of our industry and the markets in which we operate are necessarily subject to a high degree of uncertainty and risk due to a variety of factors, including those discussed under the heading “Forward-looking statements” and our filings with the SEC. This presentation contains references to trademarks, trade names and service marks belonging to other entities. Solely for convenience, trademarks, trade names and service marks referred to in this presentation may appear without the ® or TM symbols, but such references are not intended to indicate, in any way, that the applicable licensor does not assert, to the fullest extent under applicable law, its rights to these trademarks and trade names. We do not intend our use or display of other companies’ trade names, trademarks or service marks to imply a relationship with, or endorsement or sponsorship of us by, any other companies. 2
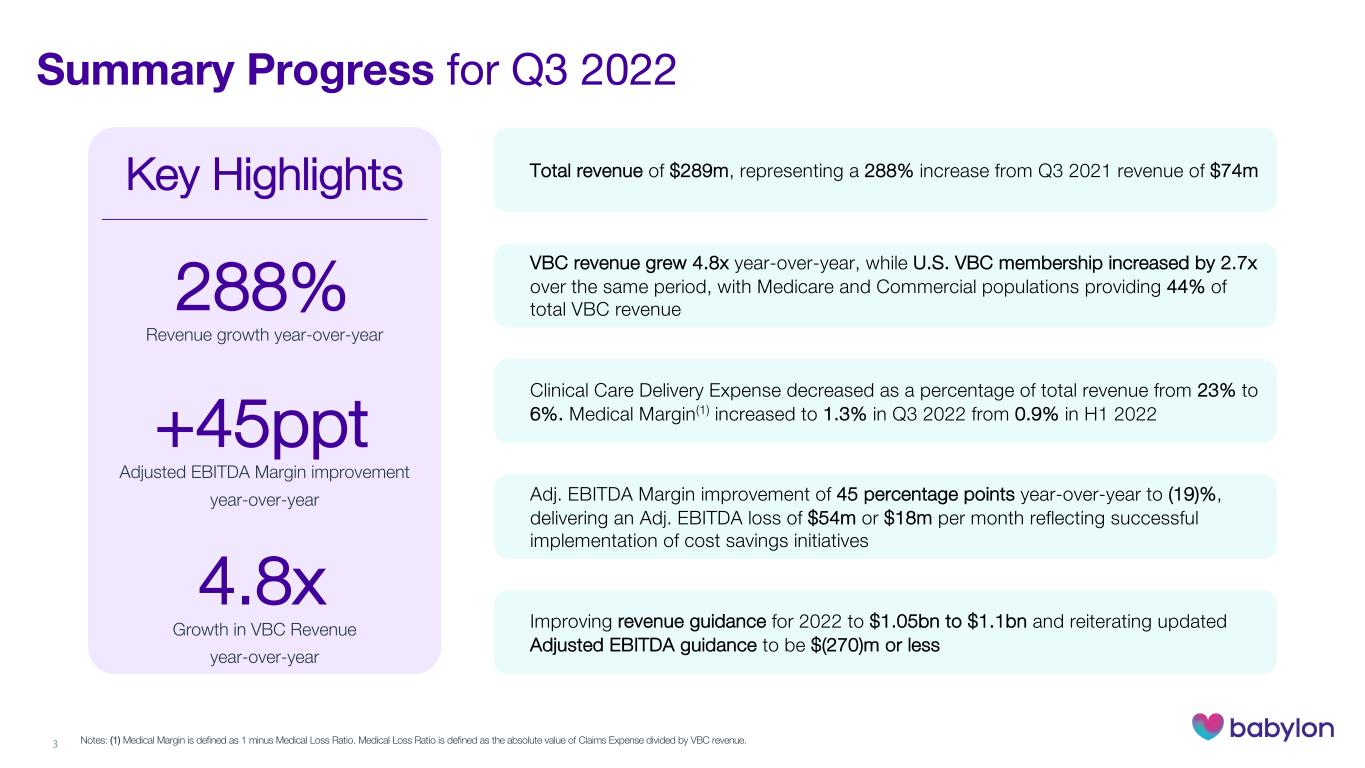
Summary Progress for Q3 2022 3 288% Revenue growth year-over-year +45ppt Adjusted EBITDA Margin improvement year-over-year 4.8x Growth in VBC Revenue year-over-year Key Highlights Total revenue of $289m, representing a 288% increase from Q3 2021 revenue of $74m Improving revenue guidance for 2022 to $1.05bn to $1.1bn and reiterating updated Adjusted EBITDA guidance to be $(270)m or less Clinical Care Delivery Expense decreased as a percentage of total revenue from 23% to 6%. Medical Margin(1) increased to 1.3% in Q3 2022 from 0.9% in H1 2022 Adj. EBITDA Margin improvement of 45 percentage points year-over-year to (19)%, delivering an Adj. EBITDA loss of $54m or $18m per month reflecting successful implementation of cost savings initiatives VBC revenue grew 4.8x year-over-year, while U.S. VBC membership increased by 2.7x over the same period, with Medicare and Commercial populations providing 44% of total VBC revenue Notes: (1) Medical Margin is defined as 1 minus Medical Loss Ratio. Medical Loss Ratio is defined as the absolute value of Claims Expense divided by VBC revenue.
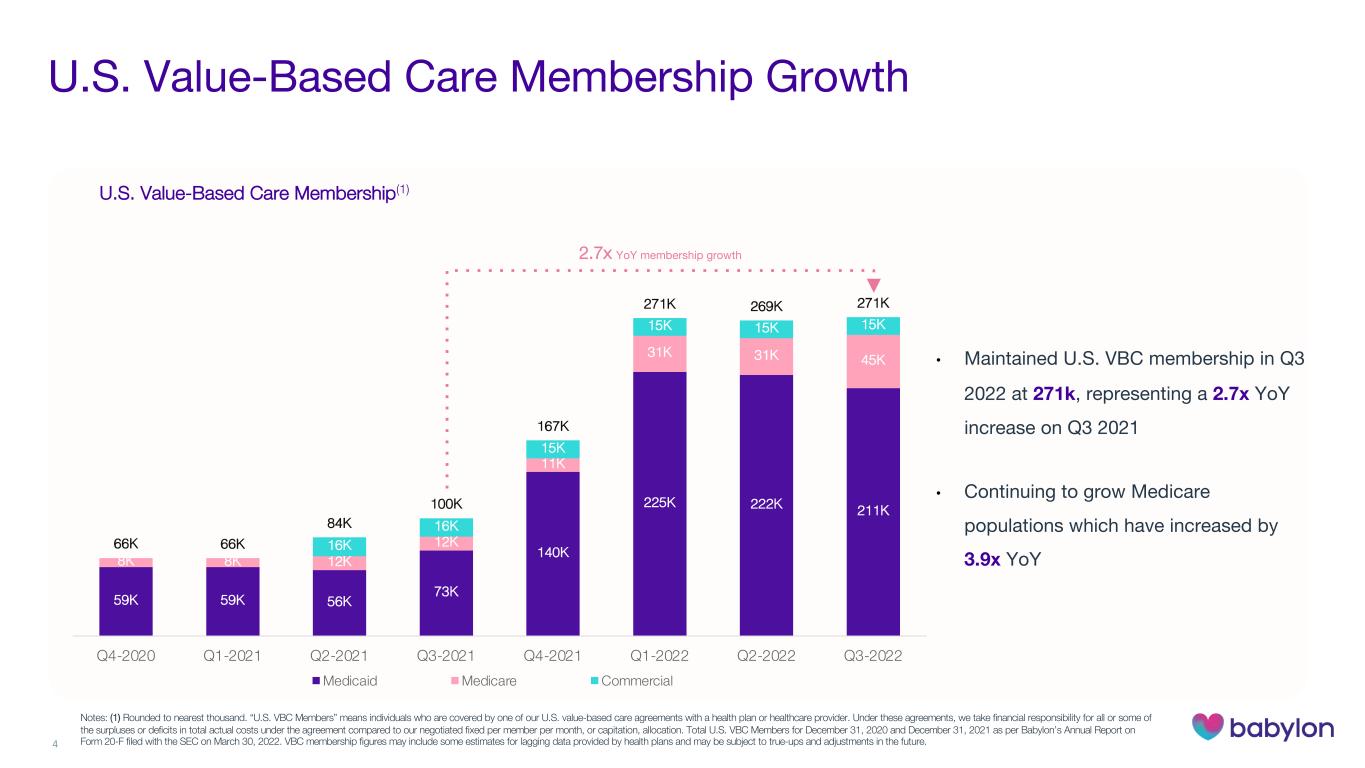
59K 59K 56K 73K 140K 225K 222K 211K 8K 8K 12K 12K 11K 31K 31K 45K 16K 16K 15K 15K 15K 15K 66K 66K 84K 100K 167K 271K 269K 271K Q4-2020 Q1-2021 Q2-2021 Q3-2021 Q4-2021 Q1-2022 Q2-2022 Q3-2022 Medicaid Medicare Commercial 4 U.S. Value-Based Care Membership Growth U.S. Value-Based Care Membership(1) • Maintained U.S. VBC membership in Q3 2022 at 271k, representing a 2.7x YoY increase on Q3 2021 • Continuing to grow Medicare populations which have increased by 3.9x YoY Notes: (1) Rounded to nearest thousand. “U.S. VBC Members” means individuals who are covered by one of our U.S. value-based care agreements with a health plan or healthcare provider. Under these agreements, we take financial responsibility for all or some of the surpluses or deficits in total actual costs under the agreement compared to our negotiated fixed per member per month, or capitation, allocation. Total U.S. VBC Members for December 31, 2020 and December 31, 2021 as per Babylon’s Annual Report on Form 20-F filed with the SEC on March 30, 2022. VBC membership figures may include some estimates for lagging data provided by health plans and may be subject to true-ups and adjustments in the future. 2.7x YoY membership growth
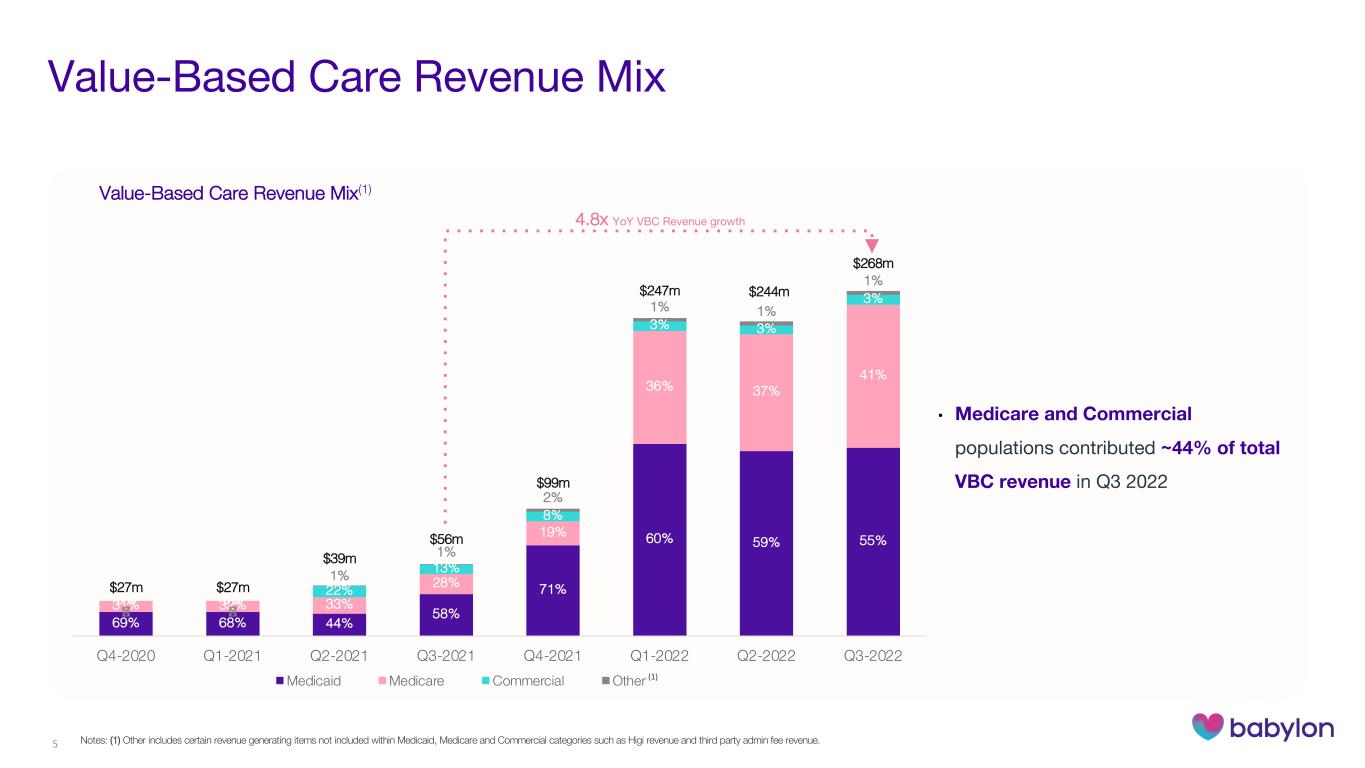
69% 68% 44% 58% 71% 60% 59% 55% 31% 32% 33% 28% 19% 36% 37% 41% 0% 0% 22% 13% 8% 3% 3% 3% � � 1% 1% 2% 1% 1% 1% $27m $27m $39m $56m $99m $247m $244m $268m Q4-2020 Q1-2021 Q2-2021 Q3-2021 Q4-2021 Q1-2022 Q2-2022 Q3-2022 Medicaid Medicare Commercial Other 5 Value-Based Care Revenue Mix Value-Based Care Revenue Mix(1) • Medicare and Commercial populations contributed ~44% of total VBC revenue in Q3 2022 Notes: (1) Other includes certain revenue generating items not included within Medicaid, Medicare and Commercial categories such as Higi revenue and third party admin fee revenue. 4.8x YoY VBC Revenue growth (1)
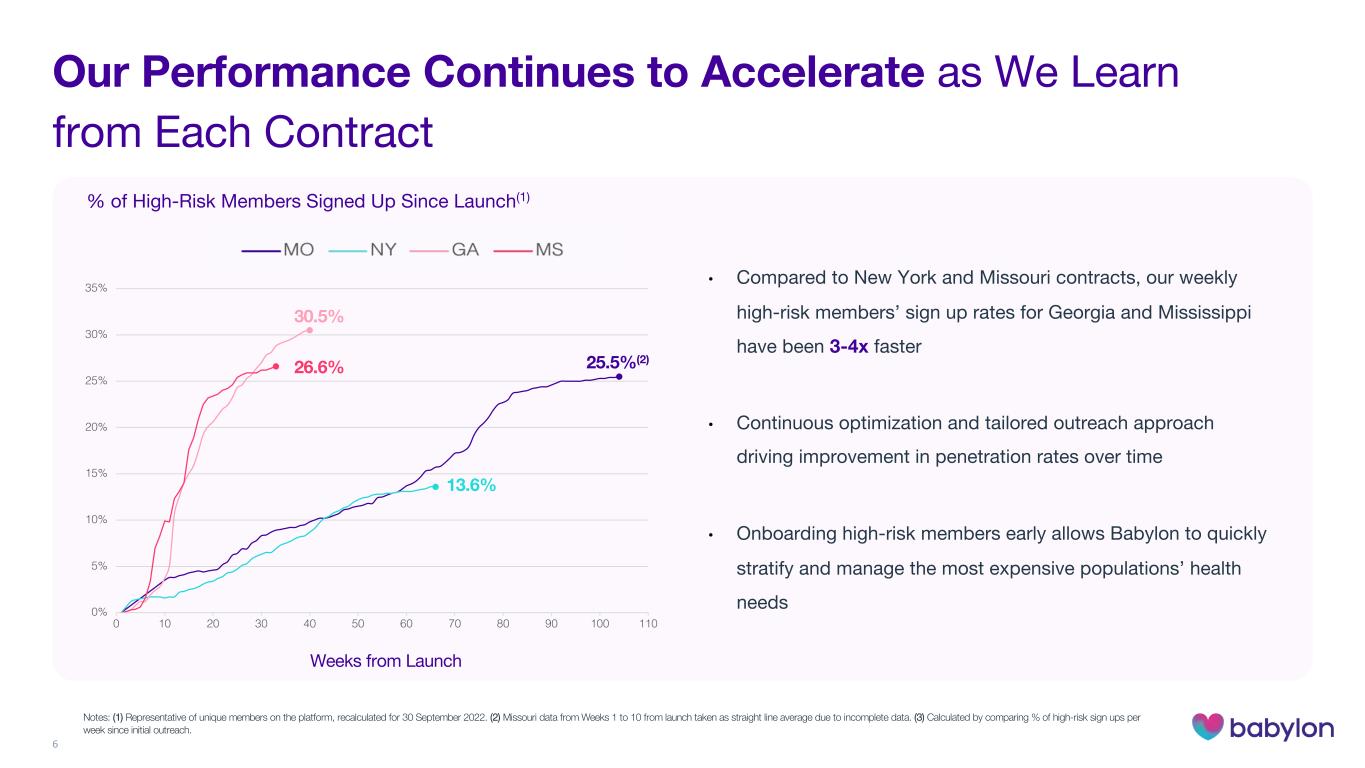
6 • Compared to New York and Missouri contracts, our weekly high-risk members’ sign up rates for Georgia and Mississippi have been 3-4x faster • Continuous optimization and tailored outreach approach driving improvement in penetration rates over time • Onboarding high-risk members early allows Babylon to quickly stratify and manage the most expensive populations’ health needs % of High-Risk Members Signed Up Since Launch(1) 0% 5% 10% 15% 20% 25% 30% 35% 0 10 20 30 40 50 60 70 80 90 100 110 25.5%(2) 30.5% 26.6% 13.6% Weeks from Launch Our Performance Continues to Accelerate as We Learn from Each Contract Notes: (1) Representative of unique members on the platform, recalculated for 30 September 2022. (2) Missouri data from Weeks 1 to 10 from launch taken as straight line average due to incomplete data. (3) Calculated by comparing % of high-risk sign ups per week since initial outreach.
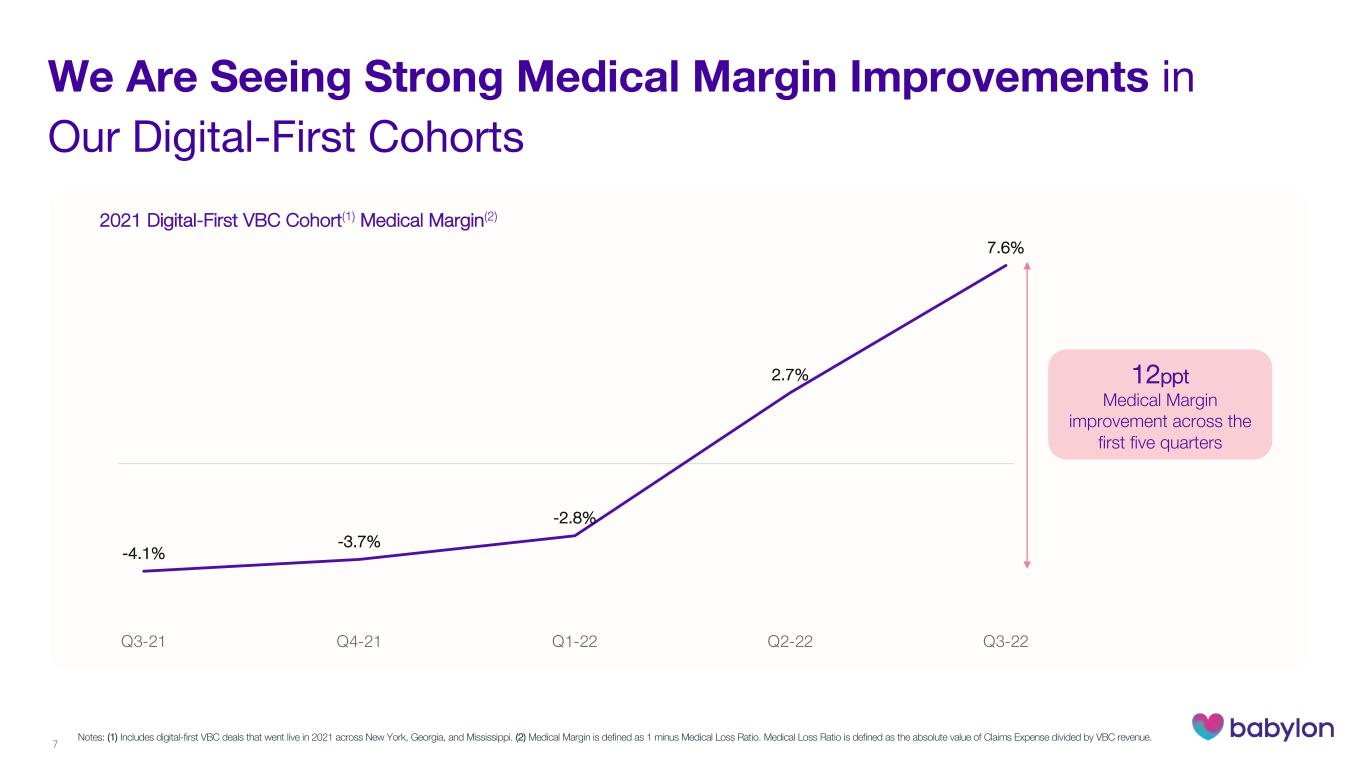
-4.1% -3.7% -2.8% 2.7% 7.6% Q3-21 Q4-21 Q1-22 Q2-22 Q3-22 We Are Seeing Strong Medical Margin Improvements in Our Digital-First Cohorts Notes: (1) Includes digital-first VBC deals that went live in 2021 across New York, Georgia, and Mississippi. (2) Medical Margin is defined as 1 minus Medical Loss Ratio. Medical Loss Ratio is defined as the absolute value of Claims Expense divided by VBC revenue. 2021 Digital-First VBC Cohort(1) Medical Margin(2) 7 12ppt Medical Margin improvement across the first five quarters
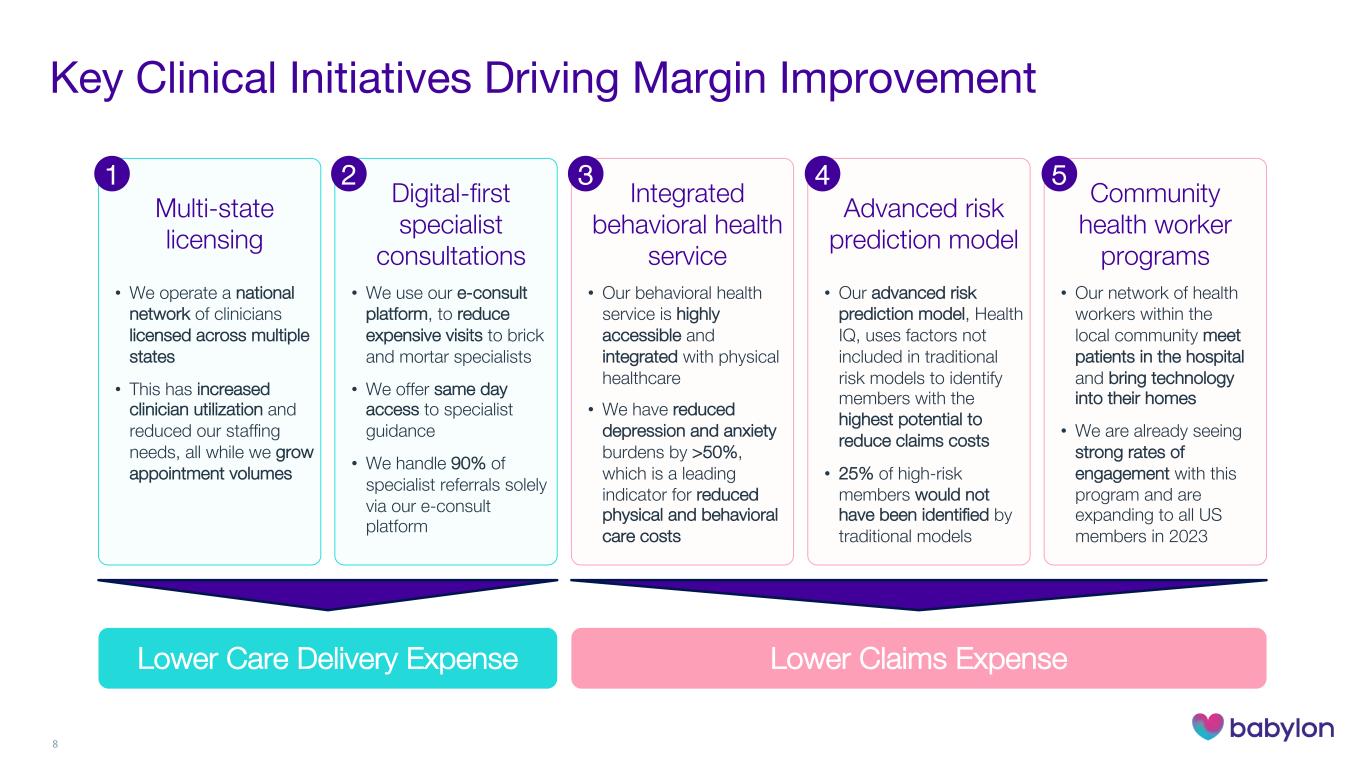
Key Clinical Initiatives Driving Margin Improvement 8 Integrated behavioral health service • Our behavioral health service is highly accessible and integrated with physical healthcare • We have reduced depression and anxiety burdens by >50%, which is a leading indicator for reduced physical and behavioral care costs Advanced risk prediction model • Our advanced risk prediction model, Health IQ, uses factors not included in traditional risk models to identify members with the highest potential to reduce claims costs • 25% of high-risk members would not have been identified by traditional models Community health worker programs • Our network of health workers within the local community meet patients in the hospital and bring technology into their homes • We are already seeing strong rates of engagement with this program and are expanding to all US members in 2023 Lower Claims Expense Multi-state licensing • We operate a national network of clinicians licensed across multiple states • This has increased clinician utilization and reduced our staffing needs, all while we grow appointment volumes Digital-first specialist consultations • We use our e-consult platform, to reduce expensive visits to brick and mortar specialists • We offer same day access to specialist guidance • We handle 90% of specialist referrals solely via our e-consult platform Lower Care Delivery Expense 1 2 3 4 5

9 Revenue and Revenue Growth (unaudited) $43m $28m $16m $41m $71m $57m $74m $120m $266m $265m $289m Q3-2020 Q4-2020 Q1-2021 Q2-2021 Q3-2021 Q4-2021 Q1-2022 Q2-2022 Q3-2022 +159% +5% +34% +30% +61% +123% Revenue Growth Notes: (1) $28.4m of one-off upfront revenue recognition in connection with a software licensing arrangement in Q1 2021. (1) 288% YoY growth 9%-0%
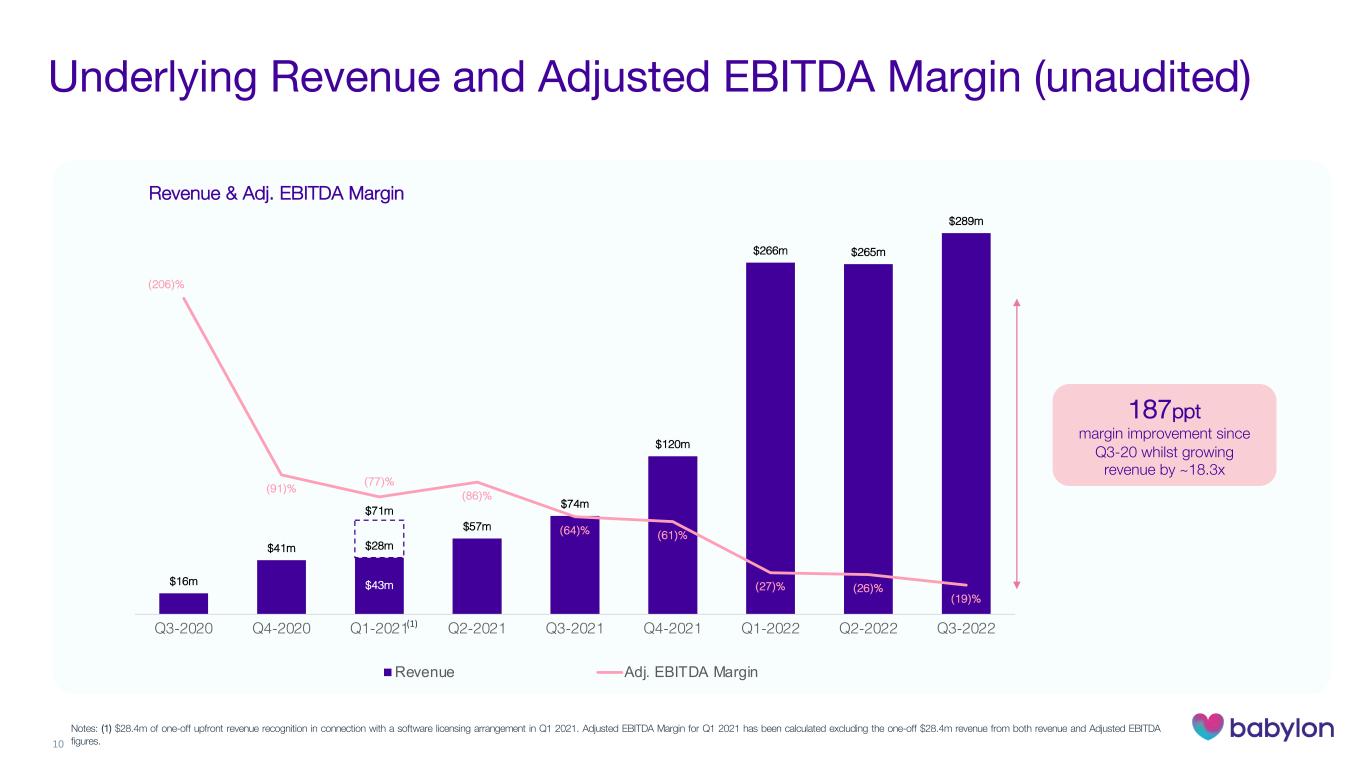
10 $43m $28m $16m $41m $71m $57m $74m $120m $266m $265m $289m Q3-2020 Q4-2020 Q1-2021 Q2-2021 Q3-2021 Q4-2021 Q1-2022 Q2-2022 Q3-2022 Revenue (1) Notes: (1) $28.4m of one-off upfront revenue recognition in connection with a software licensing arrangement in Q1 2021. Adjusted EBITDA Margin for Q1 2021 has been calculated excluding the one-off $28.4m revenue from both revenue and Adjusted EBITDA figures. (206)% (91)% (77)% (86)% (64)% (61)% (27)% (26)% (19)% Adj. EBITDA Margin Revenue & Adj. EBITDA Margin Underlying Revenue and Adjusted EBITDA Margin (unaudited) 187ppt margin improvement since Q3-20 whilst growing revenue by ~18.3x
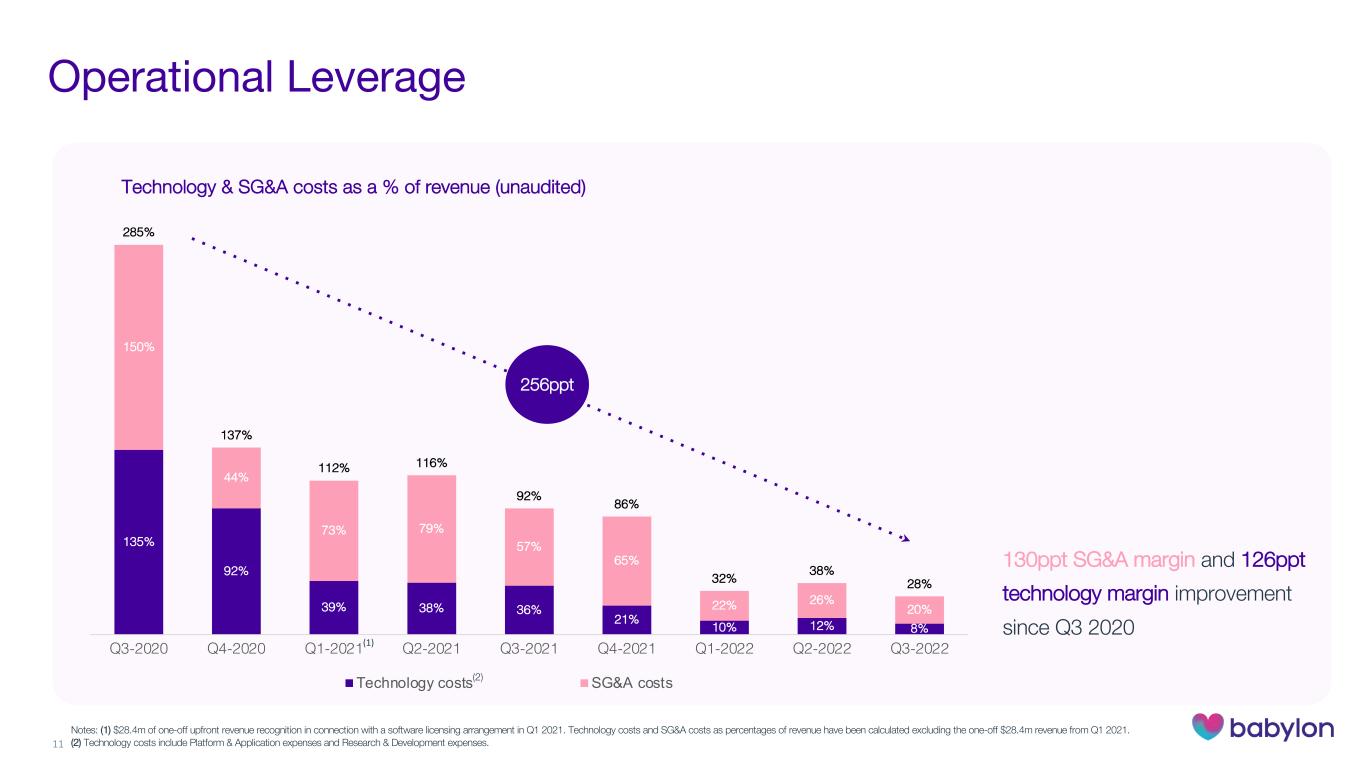
11 135% 92% 39% 38% 36% 21% 10% 12% 8% 150% 44% 73% 79% 57% 65% 22% 26% 20% 285% 137% 112% 116% 92% 86% 32% 38% 28% Q3-2020 Q4-2020 Q1-2021 Q2-2021 Q3-2021 Q4-2021 Q1-2022 Q2-2022 Q3-2022 Technology costs SG&A costs 256ppt 130ppt SG&A margin and 126ppt technology margin improvement since Q3 2020 Notes: (1) $28.4m of one-off upfront revenue recognition in connection with a software licensing arrangement in Q1 2021. Technology costs and SG&A costs as percentages of revenue have been calculated excluding the one-off $28.4m revenue from Q1 2021. (2) Technology costs include Platform & Application expenses and Research & Development expenses. (1) Technology & SG&A costs as a % of revenue (unaudited) Operational Leverage (2)
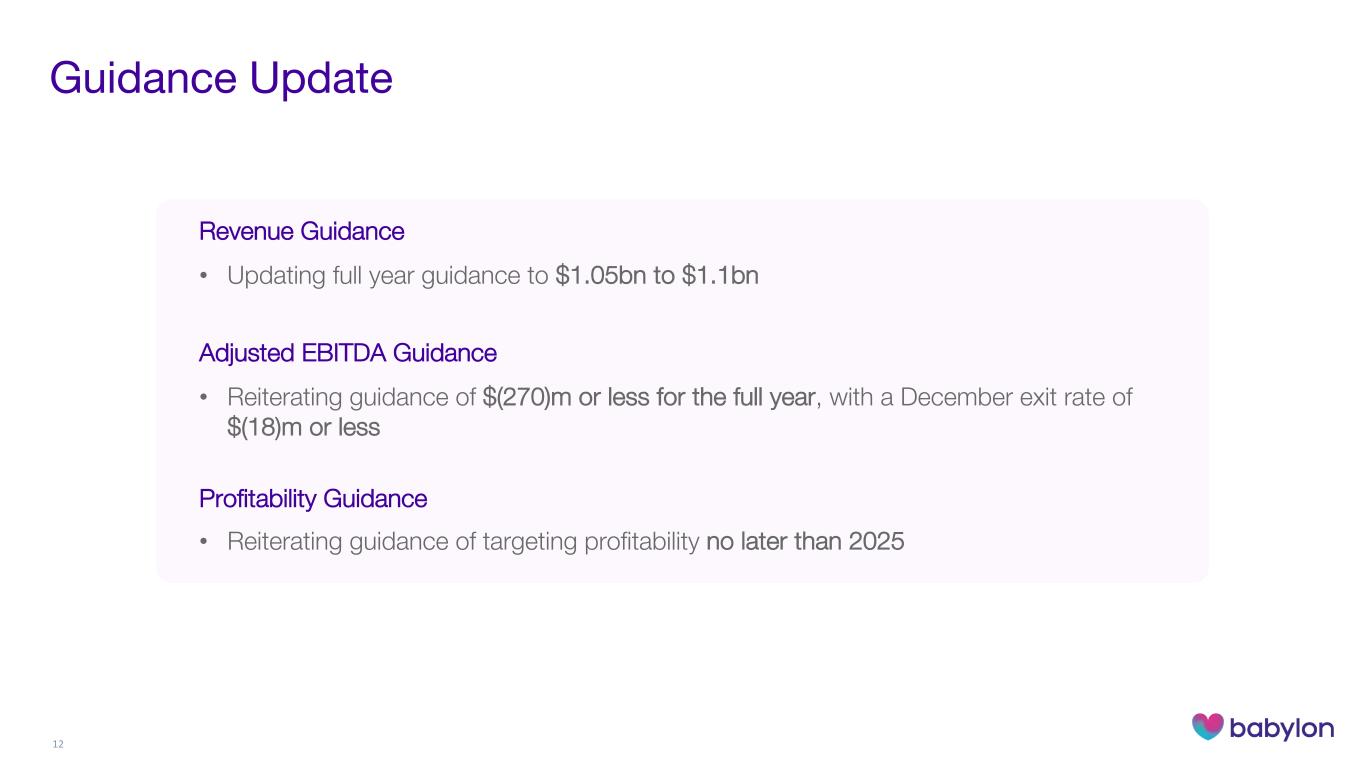
Guidance Update Revenue Guidance • Updating full year guidance to $1.05bn to $1.1bn Adjusted EBITDA Guidance • Reiterating guidance of $(270)m or less for the full year, with a December exit rate of $(18)m or less Profitability Guidance • Reiterating guidance of targeting profitability no later than 2025 12

13 21 Financial Statements and Reconciliations

Q3-2021 Q4-2021 Q1-2022 Q2-2022 Q3-2022 $’000 $’000 $’000 $’000 $’000 Software licensing revenue 7,983 7,824 7,756 7,375 7,168 Clincial services revenue 10,764 13,119 12,115 13,889 14,044 Value-based care revenue 55,715 98,745 246,575 244,098 267,686 Revenue 74,462 119,688 266,446 265,362 288,898 Claims expense (51,298) (104,026) (247,552) (238,764) (264,283) Clinical care delivery expense (17,038) (25,173) (23,927) (21,649) (18,505) Platform & application expenses (7,127) (14,325) (16,703) (13,356) (8,307) Research & development expenses (19,339) (10,994) (10,057) (18,658) (16,231) Sales, general & administrative expenses (42,166) (77,902) (58,310) (67,969) (57,439) Impairment expense — — — (53,224) (1,400) Listing expense — (148,722) — — — Operating loss (62,506) (261,454) (90,103) (148,258) (77,267) Finance costs and income (2,049) (9,701) (6,373) (9,688) (8,617) Change in fair value of warrant liabilities — 27,811 5,575 10,791 1,143 Loss on settlement of warrants — — — (2,375) (22) Exchange (loss) / gain (396) 1,355 (447) (7,350) (4,848) Net finance expense (2,445) 19,465 (1,245) (8,622) (12,344) Gain on remeasurement of equity interest — 10,495 — — — Share of loss of equity-accounted investees (1,017) (309) — — — Loss before taxation (65,968) (231,803) (91,348) (156,880) (89,611) Tax (provision) / benefit (7) (1,012) (9) (199) (280) Loss for the period (65,975) (232,815) (91,357) (157,079) (89,891) Other comprehensive loss Items that may be reclassified subsequently to profit or loss: Currency translation differences (159) (1,476) (3,753) 1,495 (102) Other comprehensive loss for the period, net of income tax (159) (1,476) (3,753) 1,495 (102) Total comprehensive loss for the period (66,134) (234,291) (95,110) (155,584) (89,993) Loss attributable to: Equity holders of the parent (65,247) (228,329) (91,357) (157,079) (89,891) Non-controlling interest (728) (4,486) — — — (65,975) (232,815) (91,357) (157,079) (89,891) Total comprehensive loss attributable to: Equity holders of the parent (65,406) (229,805) (95,110) (155,584) (89,993) Non-controlling interest (728) (4,486) — — — (66,134) (234,291) (95,110) (155,584) (89,993) Consolidated Statement of Profit and Other Comprehensive Loss (unaudited) 14
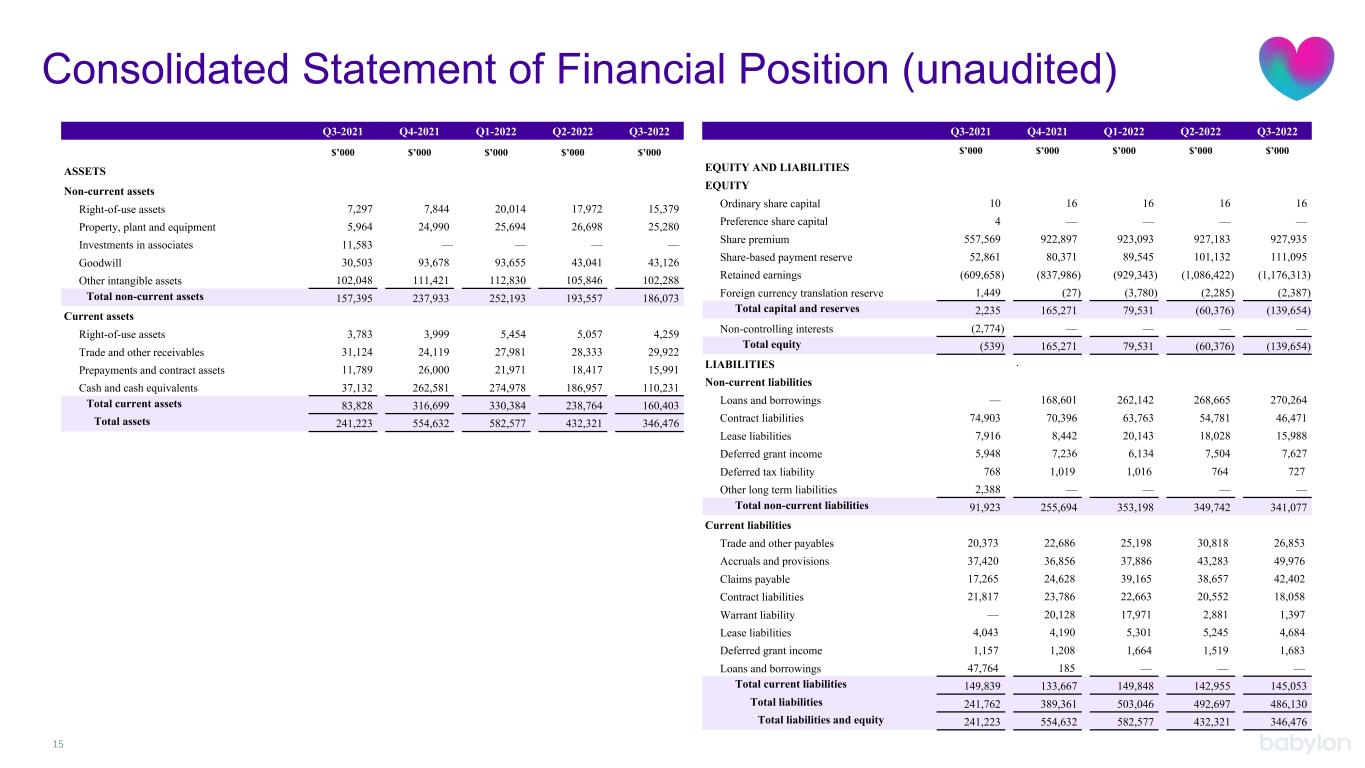
Consolidated Statement of Financial Position (unaudited) 15 Q3-2021 Q4-2021 Q1-2022 Q2-2022 Q3-2022 $’000 $’000 $’000 $’000 $’000 ASSETS Non-current assets Right-of-use assets 7,297 7,844 20,014 17,972 15,379 Property, plant and equipment 5,964 24,990 25,694 26,698 25,280 Investments in associates 11,583 — — — — Goodwill 30,503 93,678 93,655 43,041 43,126 Other intangible assets 102,048 111,421 112,830 105,846 102,288 Total non-current assets 157,395 237,933 252,193 193,557 186,073 Current assets Right-of-use assets 3,783 3,999 5,454 5,057 4,259 Trade and other receivables 31,124 24,119 27,981 28,333 29,922 Prepayments and contract assets 11,789 26,000 21,971 18,417 15,991 Cash and cash equivalents 37,132 262,581 274,978 186,957 110,231 Total current assets 83,828 316,699 330,384 238,764 160,403 Total assets 241,223 554,632 582,577 432,321 346,476 Q3-2021 Q4-2021 Q1-2022 Q2-2022 Q3-2022 $’000 $’000 $’000 $’000 $’000 EQUITY AND LIABILITIES EQUITY Ordinary share capital 10 16 16 16 16 Preference share capital 4 — — — — Share premium 557,569 922,897 923,093 927,183 927,935 Share-based payment reserve 52,861 80,371 89,545 101,132 111,095 Retained earnings (609,658) (837,986) (929,343) (1,086,422) (1,176,313) Foreign currency translation reserve 1,449 (27) (3,780) (2,285) (2,387) Total capital and reserves 2,235 165,271 79,531 (60,376) (139,654) Non-controlling interests (2,774) — — — — Total equity (539) 165,271 79,531 (60,376) (139,654) LIABILITIES . Non-current liabilities Loans and borrowings — 168,601 262,142 268,665 270,264 Contract liabilities 74,903 70,396 63,763 54,781 46,471 Lease liabilities 7,916 8,442 20,143 18,028 15,988 Deferred grant income 5,948 7,236 6,134 7,504 7,627 Deferred tax liability 768 1,019 1,016 764 727 Other long term liabilities 2,388 — — — — Total non-current liabilities 91,923 255,694 353,198 349,742 341,077 Current liabilities Trade and other payables 20,373 22,686 25,198 30,818 26,853 Accruals and provisions 37,420 36,856 37,886 43,283 49,976 Claims payable 17,265 24,628 39,165 38,657 42,402 Contract liabilities 21,817 23,786 22,663 20,552 18,058 Warrant liability — 20,128 17,971 2,881 1,397 Lease liabilities 4,043 4,190 5,301 5,245 4,684 Deferred grant income 1,157 1,208 1,664 1,519 1,683 Loans and borrowings 47,764 185 — — — Total current liabilities 149,839 133,667 149,848 142,955 145,053 Total liabilities 241,762 389,361 503,046 492,697 486,130 Total liabilities and equity 241,223 554,632 582,577 432,321 346,476 15
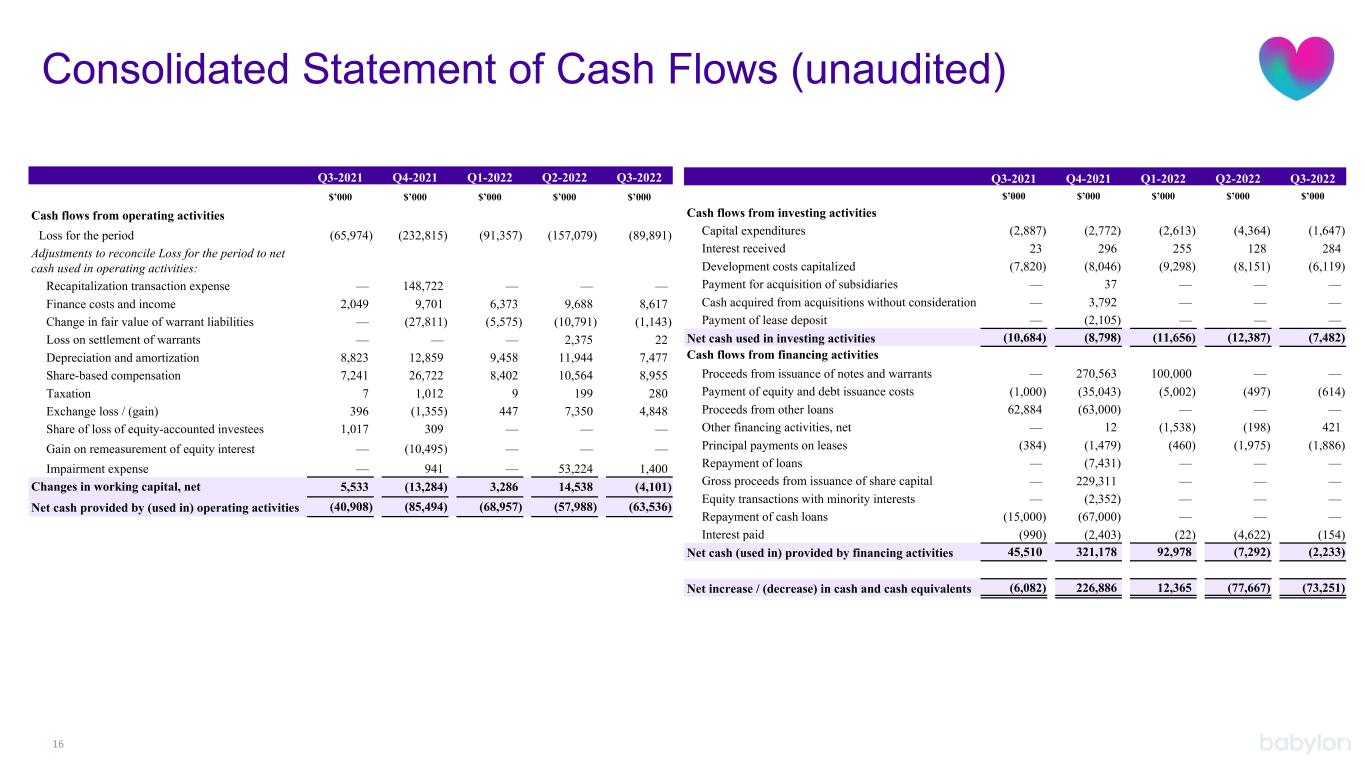
15 Q3-2021 Q4-2021 Q1-2022 Q2-2022 Q3-2022 $’000 $’000 $’000 $’000 $’000 Cash flows from operating activities Loss for the period (65,974) (232,815) (91,357) (157,079) (89,891) Adjustments to reconcile Loss for the period to net cash used in operating activities: Recapitalization transaction expense — 148,722 — — — Finance costs and income 2,049 9,701 6,373 9,688 8,617 Change in fair value of warrant liabilities — (27,811) (5,575) (10,791) (1,143) Loss on settlement of warrants — — — 2,375 22 Depreciation and amortization 8,823 12,859 9,458 11,944 7,477 Share-based compensation 7,241 26,722 8,402 10,564 8,955 Taxation 7 1,012 9 199 280 Exchange loss / (gain) 396 (1,355) 447 7,350 4,848 Share of loss of equity-accounted investees 1,017 309 — — — Gain on remeasurement of equity interest — (10,495) — — — Impairment expense — 941 — 53,224 1,400 Changes in working capital, net 5,533 (13,284) 3,286 14,538 (4,101) Net cash provided by (used in) operating activities (40,908) (85,494) (68,957) (57,988) (63,536) Q3-2021 Q4-2021 Q1-2022 Q2-2022 Q3-2022 $’000 $’000 $’000 $’000 $’000 Cash flows from investing activities Capital expenditures (2,887) (2,772) (2,613) (4,364) (1,647) Interest received 23 296 255 128 284 Development costs capitalized (7,820) (8,046) (9,298) (8,151) (6,119) Payment for acquisition of subsidiaries — 37 — — — Cash acquired from acquisitions without consideration — 3,792 — — — Payment of lease deposit — (2,105) — — — Net cash used in investing activities (10,684) (8,798) (11,656) (12,387) (7,482) Cash flows from financing activities Proceeds from issuance of notes and warrants — 270,563 100,000 — — Payment of equity and debt issuance costs (1,000) (35,043) (5,002) (497) (614) Proceeds from other loans 62,884 (63,000) — — — Other financing activities, net — 12 (1,538) (198) 421 Principal payments on leases (384) (1,479) (460) (1,975) (1,886) Repayment of loans — (7,431) — — — Gross proceeds from issuance of share capital — 229,311 — — — Equity transactions with minority interests — (2,352) — — — Repayment of cash loans (15,000) (67,000) — — — Interest paid (990) (2,403) (22) (4,622) (154) Net cash (used in) provided by financing activities 45,510 321,178 92,978 (7,292) (2,233) Net increase / (decrease) in cash and cash equivalents (6,082) 226,886 12,365 (77,667) (73,251) Consolidated Statement of Cash Flows (unaudited) 16

Reconciliation of Adjusted EBITDA and Other Non-IFRS Measures 17 Note: We are not able to reconcile projected 2022 Adjusted EBITDA or 2022 Adjusted EBITDA Margin to their respective most directly comparable IFRS measures as we are not able to forecast IFRS loss for the period on a forward-looking basis without unreasonable efforts due to the high variability and difficulty in predicting certain items that affect IFRS loss for the period, including, but not limited to, changes in fair value of warrant liabilities, impairment expense, share-based compensation, restructuring and other one-time benefits, foreign exchange gains or losses and gains and losses on sale of subsidiaries. Adjusted EBITDA should not be used to predict IFRS loss for the period as the difference between the two measures is variable and may be significant. Q3-2020 Q4-2020 Q1-2021 Q2-2021 Q3-2021 Q4-2021 Q1-2022 Q2-2022 Q3-2022 $’000 $’000 $’000 $’000 $’000 $’000 $’000 $’000 $’000 Loss for the period (37,986) (59,230) (10,847) (64,875) (65,975) (232,815) (91,357) (157,079) (89,891) Adjustments to calculate EBITDA: Depreciation and amortization 3,072 4,956 5,848 7,474 8,823 12,859 9,458 11,944 7,477 Finance costs and income 478 879 978 1,237 2,049 9,701 6,373 9,688 8,617 Tax provision / (benefit) 63 1,639 8 (2,501) 7 1,012 9 199 280 EBITDA (34,373) (51,756) (4,013) (58,665) (55,096) (209,243) (75,517) (135,248) (73,517) Adjustments to calculate Adjusted EBITDA: Share-based compensation 2,019 7,105 2,802 9,542 7,241 26,722 8,402 10,564 8,955 Change in fair value of warrant liabilities — — — — — (27,811) (5,575) (10,791) (1,143) Loss on settlement of warrants — — — — — — — 2,375 22 Gain on remeasurement of equity interest — — — — — (10,495) — — — Gain on sale of subsidiary — — (3,917) — — — — — — Impairment expense — — — — — — — 53,224 1,400 Restructuring and other one-time benefit arrangements — 6,404 — — — 941 — 3,848 5,135 Exchange (gain) / loss (259) 949 573 (482) 396 (1,355) 447 7,350 4,848 Recapitalization transaction expense — — — — — 148,722 — — — Adjusted EBITDA (32,613) (37,298) (4,555) (49,605) (47,459) (72,519) (72,243) (68,678) (54,300) Total revenue 15,811 40,958 71,293 57,478 74,462 119,688 266,446 265,362 288,898 IFRS Loss for the Period Margin (240.3)% (144.6)% (15.2)% (112.9)% (88.6)% (194.5)% (34.3)% (59.2)% (31.1)% Adjusted EBITDA Margin (206.3)% (91.1)% (6.4)% (86.3)% (63.7)% (60.6)% (27.1)% (25.9)% (18.8)% Value-based care revenue — 26,038 27,259 39,133 55,715 98,745 246,575 244,098 267,686 Claims expense — — (23,917) (40,384) (51,298) (104,026) (247,552) (238,764) (264,283) Medical Loss Ratio — — 87.7% 103.2% 92.1% 105.3% 100.4% 97.8% 98.7% Medical Margin — — 12.3% (3.2)% 7.9% (5.3)% (0.4)% 2.2% 1.3% 17

18 30 Thank you!
• We have a history of incurring losses, may not be able to achieve or maintain profitability, and may require additional financing to support our business. Additional financing may not be available on favorable terms or at all; • Our historical operating results and dependency on further capital raising indicate significant doubt exists related to our ability to continue as a going concern; • Our ability to sell the Meritage Medical Network/IPA business, including the timing of the sale and the sale price; • The impact of our planned reverse share split on the price and trading market for our Class A ordinary shares; • If we fail to comply with the NYSE’s continuing listing requirements and rules, the NYSE may delist our Class A ordinary shares; • If we fail to effectively manage our growth, we may be unable to execute our business plan, adequately address competitive challenges, maintain our corporate culture or grow at the rates we historically have achieved or at all; • Our ability to successfully execute our planned cost reduction actions and realize the expected cost savings; • Goodwill and other intangible assets represent a significant portion of our assets, and an impairment of these assets could have a material adverse effect on our business, financial condition and results of operations; • We may face intense competition, which could limit our ability to maintain or expand market share within our industry; • Our existing customers may not continue or renew their contracts with us, or may renew at lower fee levels or decline to license additional applications and services from us, and significant reductions in members, per member per month (PMPM) fees, pricing or premiums under these contracts could occur due to factors outside our control; • We are dependent on our relationships with physician-owned entities and our business could be harmed if those relationships or our arrangements with our providers or our customers were disrupted; • Failure to maintain and expand a network of qualified providers could adversely affect our future growth and profitability; • We may be unable to increase engagement of the individual members that interact with our platform, and even if we are successful in increasing member engagement, if are unable to realize the member healthcare cost savings that we expect, our future profitability could be adversely affected; • A significant portion of our revenue comes from a limited number of customers, and the loss of a material contract could adversely affect our business; • The recognition of a portion of our revenue is subject to realizing healthcare cost savings and achieving quality performance metrics, and may not be representative of revenue for future periods; • Our claims liability estimates for medical costs and expenses are uncertain and may not be adequate, and adjustments to our estimates may unfavorably impact our financial condition. If our estimates of the amount and timing of revenue recognized under our licensing agreements and value- based care agreements with health plans are materially inaccurate, our revenue recognition could be impacted; • Our physician partners’ failure to accurately, timely and sufficiently document their services could result in nonpayment for services rendered or allegations of fraud. Our records and submissions to a health plan may contain inaccurate or unsupportable information regarding risk adjustment scores of members; • Reimbursement rates paid by third-party payers or federal, state or foreign healthcare programs may be reduced, and third-party payers or government payers may restrain our ability to obtain or provide services to our members; • Regulatory proposals directed at containing or lowering the cost of healthcare, including the ACO REACH model, and our participation in such proposed models, could impact our business and results of operations; • The market for telemedicine is immature and volatile and our digital-first approach is relatively new and unproven; • We may not be able to develop and release new solutions and services, or successful enhancements, new features and modifications to our existing solutions and services. Our proprietary solutions may not properly operate or interoperate with our customers’ existing and future infrastructures; • Our relatively limited operating history makes it difficult to evaluate our current business and future prospects; • If we are unable to hire and retain talent to operate our business, we may not be able to grow effectively; • Our growth depends in part on the success of our relationships with third parties; Risk Factors Summary 19

• Our quarterly results may fluctuate significantly, adversely impacting the value of our Class A ordinary shares; • Risks associated with our international operations, economic uncertainty, or downturns; • Failure to adequately expand our direct sales force will impede our growth; • We may invest in or acquire other business and we may have difficulty integrating any such acquisitions successfully. We may also enter into collaborations and strategic alliances with third parties that may not result in the development of commercially viable solutions or the generation of significant future revenues; • Our use of open-source software could adversely affect our ability to offer our solutions and subject us to possible litigation; • Catastrophic events and man-made problems, and a pandemic, epidemic, or outbreak of an infectious disease, including the COVID-19 pandemic, could adversely affect our business; • Our sales and implementation cycle can be long and unpredictable and requires considerable time, expense and ongoing support, the failure of which may adversely affect our customer relationships; • Failure to obtain or maintain insurance licenses or authorizations allowing our participation in risk- sharing arrangements with payers could subject us to significant penalties and adversely impact our operations; • Foreign currency exchange rate fluctuations and restrictions could adversely affect our business; • We operate in a heavily regulated industry, and we are subject to evolving laws and government regulations; • The changes in tax laws in different geographic jurisdictions could materially impact our business. We may be treated as a dual resident company for United Kingdom tax purposes. The applicability of tax laws on our business is uncertain and adverse tax laws could be applied to us or our customers; • We may be unable to sufficiently protect our intellectual property, and our ability to successfully commercialize our technology may be adversely affected. We may be subject to intellectual property infringement claims, medical liability claims or other litigation or regulatory investigations; • Certain of our software products could become subject to U.S. Food and Drug Administration oversight, and certain of our products and operations are subject to medical device regulations; • Cyberattacks, security breaches and other incidents, and other disruptions have compromised and could in the future compromise sensitive information and adversely affect our business and reputation. Our failure to comply with data privacy laws or to adequately secure the information we hold could result in significant liability or reputational harm. Any disruption of service at our third-party data and call centers or Amazon Web Services, or of third party infrastructure provider services, could interrupt our ability to serve customers, expose us to litigation and negatively impact our relationships with customers and members; • The trading price of our Class A ordinary shares is volatile, and the value of our Class A ordinary shares may decline. An active trading market for our securities may not develop or be sustained; • Our status as an “emerging growth company” and a “foreign private issuer” may make our ordinary shares less attractive and affords less protection to our shareholders. We will no longer qualify as a foreign private issuer as of January 1, 2023; • Our issuance of additional Class A ordinary shares in connection with any future financings, acquisitions, investments, under our stock incentive plans, or otherwise will dilute all other shareholders and could cause the market price of our Class A ordinary shares to drop significantly, even if our business is doing well; • We do not currently intend to pay dividends on our Class A ordinary shares; • Some of our management team has limited experience managing a public company, and our management is required to devote substantial time to public company compliance; • If our remediation of our identified material weaknesses is not effective, or if we fail to develop an effective internal control system, our ability to produce timely and accurate financial statements or comply with applicable laws could be impaired; • U.S. holders that own 10% or more of our equity interests may be subject to adverse U.S. federal income tax consequences. Our U.S. holders may suffer adverse tax consequences if we are classified as a “passive foreign investment company.” The Internal Revenue Service may not agree that we are a non-U.S. corporation for U.S. federal income tax purposes; • Our shareholders’ rights and responsibilities are governed by Jersey law, which differs materially from U.S. companies’ shareholders rights and responsibilities. It may be difficult to enforce a U.S. judgment or to assert U.S. securities law claims outside of the United States; and • The other matters discussed in the “Risk Factors” section of our Annual Report on Form 20-F filed with the SEC on March 30, 2022, and in our other SEC filings. Risk Factors Summary (Continued) 20


