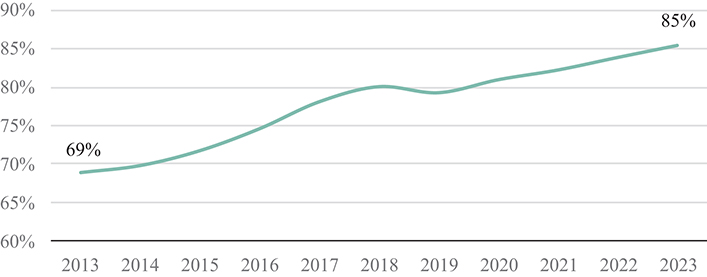
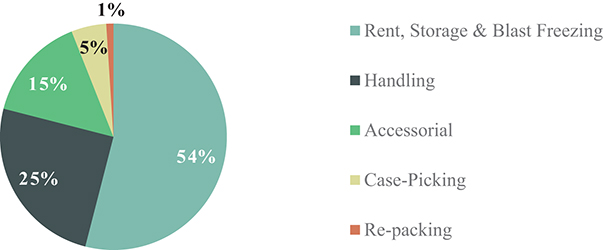
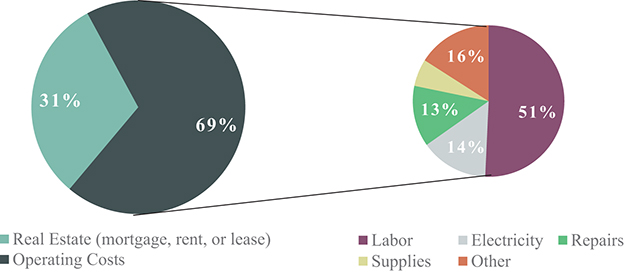
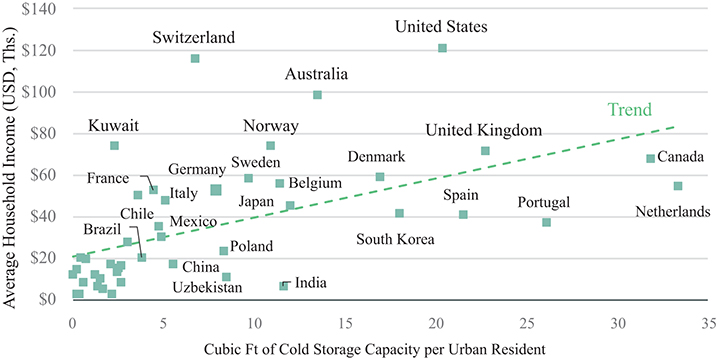
Table of Contents
As filed with the Securities and Exchange Commission on July 22, 2024
Registration Statement No. 333-280470
UNITED STATES
SECURITIES AND EXCHANGE COMMISSION
Washington, D.C. 20549
AMENDMENT NO. 2 TO
FORM S-11
FOR REGISTRATION
UNDER
THE SECURITIES ACT OF 1933
OF SECURITIES OF CERTAIN REAL ESTATE COMPANIES
Lineage, Inc.
(Exact name of registrant as specified in its governing instruments)
46500 Humboldt Drive
Novi, Michigan 48377
(800) 678-7271
(Address, including Zip Code and Telephone Number, Including Area Code, of Registrant’s Principal Executive Offices)
Natalie Matsler
Chief Legal Officer
46500 Humboldt Drive
Novi, Michigan 48377
(800) 678-7271
(Name, Address, including Zip Code and Telephone Number, Including Area Code, of Agent for Service)
Copies to:
Julian T.H. Kleindorfer, Esq. Lewis W. Kneib, Esq. Latham & Watkins LLP 355 South Grand Avenue Los Angeles, California 90071-1560 (213) 485-1234 | Scott C. Chase, Esq. David H. Roberts, Esq. Goodwin Procter LLP 100 Northern Avenue Boston, Massachusetts 02210 (617) 570-1000 |
Approximate date of commencement of proposed sale to the public:
As soon as practicable after this Registration Statement becomes effective.
If any of the securities being registered on this Form are to be offered on a delayed or continuous basis pursuant to Rule 415 under the Securities Act of 1933, check the following box: ☐
If this Form is filed to register additional securities for an offering pursuant to Rule 462(b) under the Securities Act, check the following box and list the Securities Act registration statement number of the earlier effective registration statement for the same offering. ☐
If this Form is a post-effective amendment filed pursuant to Rule 462(c) under the Securities Act, check the following box and list the Securities Act registration statement number of the earlier effective registration statement for the same offering. ☐
If this Form is a post-effective amendment filed pursuant to Rule 462(d) under the Securities Act, check the following box and list the Securities Act registration statement number of the earlier effective registration statement for the same offering. ☐
If delivery of the prospectus is expected to be made pursuant to Rule 434, check the following box. ☐
Indicate by check mark whether the registrant is a large accelerated filer, an accelerated filer, a non-accelerated filer, a smaller reporting company, or an emerging growth company. See the definitions of “large accelerated filer,” “accelerated filer,” “smaller reporting company” and “emerging growth company” in Rule 12b-2 of the Exchange Act. (check one):
Large accelerated filer | ☐ | Accelerated filer | ☐ | |||
Non-accelerated filer | ☒ | Smaller reporting company | ☐ | |||
Emerging growth company | ☐ |
If an emerging growth company, indicate by check mark if the registrant has elected not to use the extended transition period for complying with any new or revised financial accounting standards provided pursuant to Section 7(a)(2)(B) of the Securities Act ☐
The registrant hereby amends this registration statement on such date or dates as may be necessary to delay its effective date until the registrant shall file a further amendment that specifically states that this registration statement shall thereafter become effective in accordance with Section 8(a) of the Securities Act of 1933, as amended, or until the registration statement shall become effective on such date as the Commission, acting pursuant to said Section 8(a), may determine.
Table of Contents
The information in this preliminary prospectus is not complete and may be changed. We may not sell these securities until the registration statement filed with the Securities and Exchange Commission is effective. This preliminary prospectus is not an offer to sell these securities and it is not soliciting an offer to buy these securities in any jurisdiction where the offer or sale is not permitted.
Subject to Completion, dated July 22, 2024
47,000,000 Shares
Common Stock
Lineage, Inc.
We are offering 47,000,000 shares of our common stock. All of the shares of common stock offered by this prospectus are being sold by us. This is our initial public offering, and no public market currently exists for our common stock. We expect the initial public offering price of our common stock to be between $70.00 and $82.00 per share.
We expect that our common stock will be approved for listing, subject to notice of issuance, on the Nasdaq Global Select Market, under the symbol “LINE.”
We have elected and believe we have qualified to be taxed as a real estate investment trust, or REIT, for U.S. federal income tax purposes commencing with our taxable year ended December 31, 2020. To assist us in qualifying as a REIT, our charter prohibits, with certain exceptions, the beneficial or constructive ownership by any person of more than 9.8% in value of the aggregate of the outstanding shares of our capital stock or more than 9.8% (in value or in number of shares, whichever is more restrictive) of the aggregate of the outstanding shares of our common stock. In addition, our charter contains various other restrictions on the ownership and transfer of our common stock and capital stock. See “Description of Our Capital Stock—Restrictions on Ownership and Transfer” for a description of the ownership and transfer restrictions applicable to our common stock.
After the completion of this offering, affiliates of Bay Grove Capital Group, LLC will continue to own a majority of the voting power of shares of our common stock eligible to vote in the election of our directors. As a result, we will be a “controlled company” within the meaning of the corporate governance standards of the Nasdaq Global Select Market. See “Management—Controlled Company Exception” and “Principal Stockholders.”
Investing in our common stock involves risks. See “Risk Factors” beginning on page 55 for factors you should consider before investing in our common stock.
Neither the Securities and Exchange Commission nor any state securities commission has approved or disapproved of these securities or determined if this prospectus is truthful or complete. Any representation to the contrary is a criminal offense.
Per Share | Total | |||||||
Initial public offering price | $ | $ | ||||||
Underwriting discounts(1) | $ | $ | ||||||
Proceeds, before expenses, to us | $ | $ |
(1) | We refer you to “Underwriters” beginning on page 371 of this prospectus for additional information regarding underwriting compensation. |
At our request, the underwriters have reserved six percent of the shares of common stock to be issued by us and offered by this prospectus for sale, at the initial public offering price, to (i) certain of our directors, officers and employees, (ii) friends and family members of certain of our directors and officers, (iii) individuals associated with certain of our customers, vendors, landlords and service providers and (iv) certain of our legacy investors, former owners of acquired companies and properties and other industry partners. The number of shares of common stock available for sale to the general public will be reduced to the extent these individuals purchase such reserved shares. Any reserved shares that are not so purchased will be offered by the underwriters to the general public on the same basis as the other shares offered by this prospectus. See “Underwriters—Directed Share Program” for additional information.
To the extent that the underwriters sell more than 47,000,000 shares of common stock, the underwriters have the option, exercisable within 30 days from the date of this prospectus, to purchase up to an additional 7,050,000 shares from us at the initial public offering price less the underwriting discounts and commissions.
KKR Capital Markets LLC is acting as our Lead financial advisor in connection with this offering. BDT & MSD Partners, Seven Lakes Partners, and Eastdil Secured Advisors, LLC are also acting as financial advisors in connection with this offering.
The underwriters expect to deliver the shares of common stock to purchasers on or about .
Norges Bank Investment Management, a division of Norges Bank (the “cornerstone investor”), has indicated an interest in purchasing up to an aggregate of $900 million in shares of common stock in this offering at the initial public offering price. The shares of common stock to be purchased by the cornerstone investor will not be subject to a lock-up agreement with the underwriters. Because this indication of interest is not a binding agreement or commitment to purchase, the cornerstone investor may determine to purchase more, less or no shares in this offering or the underwriters may determine to sell more, less or no shares to the cornerstone investor. The underwriters will receive the same underwriting discounts and commissions on any of our shares of common stock purchased by the cornerstone investor as they will from any other shares of common stock sold to the public in this offering.
Joint Bookrunning Managers
Morgan Stanley | Goldman Sachs & Co. LLC | BofA Securities | J.P. Morgan | Wells Fargo Securities |
RBC Capital Markets | Rabo Securities | Scotiabank | UBS Investment Bank | Capital One Securities | Truist Securities |
Evercore ISI | Baird | KeyBanc Capital Markets | Mizuho | PNC Capital Markets LLC | Deutsche Bank Securities | CBRE | HSBC | Piper Sandler | Regions Securities LLC |
Co-Managers
Blaylock Van, LLC | Cabrera Capital Markets LLC | C.L. King & Associates | Drexel Hamilton | Guzman & Company | Loop Capital Markets | Roberts & Ryan | R. Seelaus & Co., LLC |
Prospectus dated , 2024
Table of Contents
Table of Contents
Table of Contents
Table of Contents
Page | ||||
vi | ||||
1 | ||||
44 | ||||
SUMMARY SELECTED HISTORICAL AND PRO FORMA CONDENSED CONSOLIDATED FINANCIAL AND OTHER DATA | 47 | |||
55 | ||||
108 | ||||
110 | ||||
112 | ||||
113 | ||||
115 | ||||
MANAGEMENT’S DISCUSSION AND ANALYSIS OF FINANCIAL CONDITION AND RESULTS OF OPERATIONS | 117 | |||
162 | ||||
185 | ||||
232 | ||||
245 | ||||
281 | ||||
297 |
Page | ||||
308 | ||||
311 | ||||
DESCRIPTION OF THE OPERATING AGREEMENT OF LINEAGE LOGISTICS HOLDINGS, LLC | 321 | |||
327 | ||||
329 | ||||
CERTAIN PROVISIONS OF MARYLAND LAW AND OF OUR CHARTER ANDBYLAWS | 334 | |||
341 | ||||
344 | ||||
368 | ||||
371 | ||||
381 | ||||
382 | ||||
383 | ||||
F-1 |
Through and including , 2024 (the 25th day after the date of this prospectus), all dealers effecting transactions in these securities, whether or not participating in this offering, may be required to deliver a prospectus. This is in addition to a dealer’s obligation to deliver a prospectus when acting as an underwriter and with respect to an unsold allotment or subscription.
You should rely only on the information contained in this prospectus or in any free writing prospectus prepared by us. We have not, and the underwriters have not, authorized anyone to provide you with different information. If anyone provides you with different or inconsistent information, you should not rely on it. We are not, and the underwriters are not, making an offer to sell these securities in any jurisdiction where the offer or sale is not permitted. You should assume that the information appearing in this prospectus and any free writing prospectus prepared by us is accurate only as of their respective dates or on the date or dates which are specified in these documents. Our business, financial condition, liquidity, results of operations and prospects may have changed since those dates.
We use market data and industry forecasts and projections throughout this prospectus and, in particular, in the sections entitled “Prospectus Summary,” “Industry Overview” and “Business and Properties.” We have obtained certain of this information from a market study prepared for us in connection with this offering by CBRE, Inc., or CBRE, a nationally recognized real estate services firm. Such information is included in this prospectus in reliance on CBRE’s authority as an expert on such matters. Any forecasts prepared by CBRE are based on data (including third party data), models and experience of various professionals and are based on various assumptions, all of which are subject to change without notice. See “Experts.” In addition, we have obtained certain market and industry data from publicly available industry publications. These sources generally state that the information they provide has been obtained from sources believed to be reliable but that the
i
Table of Contents
accuracy and completeness of the information are not guaranteed. Capacity and market share data provided by the Global Cold Chain Alliance, or GCCA, reflects capacity of companies that report to GCCA. North American GCCA data includes GCCA’s estimate of capacity owned and operated by U.S. customers themselves based on data from U.S. Department of Agriculture surveys. Global GCCA data also reflects GCCA’s estimate of capacity of companies that do not report to GCCA. The forecasts and projections are based on industry surveys and the preparers’ experience in the industry, and there is no assurance that any of the projected amounts will be achieved. We have not independently verified this information.
Non-GAAP Financial Measures
In this prospectus, we use certain non-GAAP financial measures as supplemental performance measures of our business, including NOI, segment NOI, FFO, Core FFO, Adjusted FFO, EBITDA, EBITDAre, Adjusted EBITDA, net debt, adjusted net debt and adjusted net debt to Adjusted EBITDA. For definitions of these metrics, reconciliations of these metrics to our net loss of $48.0 million and net income of $18.6 million for the three months ended March 31, 2024 and 2023, respectively, and our net loss of $96.2 million, $76.0 million and $176.5 million for the years ended December 31, 2023, 2022 and 2021, respectively, and a statement of why our management believes the presentation of these metrics provides useful information to investors and any additional purposes for which management uses such metrics, see “Summary Selected Historical and Pro Forma Condensed Consolidated Financial and Other Data—Non-GAAP Financial Measures.”
Certain Terms Used in This Prospectus
Unless the context otherwise requires, the following terms and phrases are used throughout this prospectus as described below:
• | “2024 Plan” means the Amended and Restated Lineage 2024 Incentive Award Plan, as amended from time to time; |
• | “average economic occupancy” means the average number of physical pallets on hand and any additional pallet positions otherwise contractually committed and paid for by customers for a given period divided by the approximate number of average physical pallet positions in our warehouses for the applicable period; |
• | “average physical occupancy” means the average number of physical pallets on hand divided by the approximate number of average physical pallet positions in our warehouses for the applicable period; |
• | “Bay Grove” means Bay Grove Capital Group, LLC, a private owner-operator firm founded by our Co-Founders and Co-Executive Chairmen, Adam Forste and Kevin Marchetti, and, unless the context otherwise requires, its affiliates (excluding BGLH but including our Co-Founders); |
• | “BentallGreenOak” means BGO Cold Storage Holdings II, LP and, unless the context otherwise requires, its affiliates; |
• | “BG Cold” means BG Cold, LLC, an affiliate of Bay Grove; |
• | “BGLH” means BG Lineage Holdings, LLC, an affiliate of Bay Grove; |
• | “BGLH Restricted Units” means Class B units in BGLH that were issued as compensatory awards and are held by certain of our current and former executive officers, directors and employees; |
• | “Cash Settlement” refers to the settlement by our legacy investors of their BGLH equity or Legacy OP Units for cash in connection with liquidity that we will have arranged, which settlement for cash will generally be effected pursuant to a sale of shares of our common stock back to us or a sale of OP units to us; |
• | “CMBS” means commercial mortgage-backed securities; |
• | “Co-Founders” means our Co-Executive Chairmen, Adam Forste and Kevin Marchetti; |
ii
Table of Contents
• | “Core WMS” means Core Warehouse Management Systems; |
• | “D1 Capital” means D1 Master Holdco II LLC and, unless the context otherwise requires, its affiliates; |
• | “Delayed Draw Term Loan” means our senior unsecured term loan facility with an aggregate principal balance of approximately $2.4 billion; |
• | “EBITDA” means earnings before interest, taxes, depreciation and amortization; |
• | “formation transactions” means the formation transactions described under "Structure and Formation of our Company;” |
• | “Founders Equity Share” means a share of the profits on, and solely borne by, legacy equity that accrues to BG Cold, and more specifically: (i) with respect to our operating partnership, the sub-unit of each Legacy Class A OP Unit referred to herein as the C-Piece Sub-Unit, which C-Piece Sub-Unit represents a share of the profits contained within each Legacy Class A OP Unit; such share of profits is calculated based on a historical formula applicable solely to our legacy investors and borne solely by the Legacy Class A OP Units (and not any other OP units); and such share of profits belongs to BG Cold; and (ii) with respect to BGLH, the right of the Class C units of BGLH to a share of the profits derived from each BGLH Class A unit; such share of profits is calculated based on a historical formula applicable solely to BGLH investors and borne solely within BGLH; and such share of profits belongs to BG Cold; |
• | “fully diluted basis” means information is presented assuming all outstanding Legacy OP Units, OP units and OPEUs have been exchanged for shares of common stock on a one-for-one basis and all equity awards to be issued to our management and members of our board of directors in connection with this offering are outstanding (this definition is not the same as the meaning of “fully diluted” under GAAP); |
• | “GAAP” means generally accepted accounting principles as promulgated by the Financial Accounting Standards Board in the United States of America; |
• | “ICE4 CMBS loan” means our secured senior mortgage debt that had an original principal amount of $2.35 billion; |
• | “IT” means information technology; |
• | “KPI” means key performance indicator; |
• | “Legacy Class A OP Units” means a class of Legacy OP Units held by our legacy pre-offering investors that bears the Founders Equity Share; each Legacy Class A OP Unit represents the same proportionate share of ownership in our operating partnership as a single OP unit, but each Legacy Class A OP Unit is comprised of two sub-units, the A-Piece Sub-Unit and the C-Piece Sub-Unit, which have different beneficial owners; |
• | “Legacy Class B OP Units” means a class of Legacy OP Units held by our legacy pre-offering investors (including certain of our current and former officers and employees) that does not bear the Founders Equity Share; each Legacy Class B OP Unit represents the same proportionate share of ownership in our operating partnership as a single OP unit; |
• | “Legacy OP Units” means units of partnership interest in our operating partnership that represent pre-offering rights of legacy investors in our operating partnership; each Legacy OP Unit represents the same proportionate share of ownership in our operating partnership as a single OP unit; the Legacy OP Units are made up of both Legacy Class A OP Units and Legacy Class B OP Units; |
• | “LHR” means the “Legacy Holder Representative” appointed by holders of Legacy OP Units to act as their representative pursuant to the partnership agreement of our operating partnership. The initial LHR will be an affiliate of BGLH; |
• | “Lineage,” “we,” “our,” “us” and “our company” mean Lineage, Inc., a Maryland corporation, together with its consolidated subsidiaries, including our operating partnership; |
iii
Table of Contents
• | “Lineage Holdings” means Lineage Logistics Holdings, LLC; |
• | “Lineage OP” means Lineage OP, LLC, a Delaware limited liability company; |
• | “LMEP Units” means existing Class C Units in LLH MGMT Profits, LLC and LLH MGMT Profits II, LLC, which units are incentive equity interests held by certain of our current and former officers and employees; |
• | “LTIP units” means units of our operating partnership intended to constitute “profits interests” within the meaning of the relevant IRS Revenue Procedure guidance; |
• | “LVCP Awards” means awards granted under the LVCP Plans; |
• | “LVCP Plans” means, collectively, the following historic incentive plans for certain of our officers and employees: the Lineage Logistics Holdings, LLC 2021 Value Creation Unit Plan, the Amended and Restated Lineage Logistics Holdings, LLC 2015 Value Creation Unit Plan and any other plan under which we or our affiliates have granted awards of “value creation units,” each as amended or supplemented from time to time; |
• | “maintenance capital expenditures” means capitalized funds used to maintain assets that will result in an extended useful life; |
• | “minimum storage guarantees” mean contractual provisions in our agreements with customers that provide us with minimum or fixed storage fees for pallet positions, whether or not a minimum number of pallet positions are physically occupied in a particular period; |
• | “Nasdaq” means the Nasdaq Global Select Market; |
• | “NOI” means net operating income; |
• | “OPEUs” means units of our subsidiary, Lineage Holdings, that are intended to be economically equivalent to, and exchangeable into, OP units; |
• | “OP units” means common units of partnership interest in our operating partnership; |
• | “our operating partnership” means, prior to its conversion to a Maryland limited partnership in connection with the formation transactions, Lineage OP, LLC, a Delaware limited liability company, and after such conversion, Lineage OP, LP, a Maryland limited partnership, through which we will hold substantially all of our assets and conduct our operations; |
• | “Oxford” means Oxford Properties Group, OMERS Administration Corporation or any of their respective affiliates; |
• | “pro forma basis” means information is presented assuming the completion of this offering, the formation transactions and the other adjustments described in our unaudited pro forma condensed consolidated financial statements included elsewhere in this prospectus had occurred on March 31, 2024 for purposes of the unaudited pro forma condensed consolidated balance sheet data and on January 1, 2023 for purposes of the unaudited pro forma condensed consolidated statements of operations; |
• | “REIT” means real estate investment trust for U.S. federal income tax purposes; |
• | “Revolving Credit and Term Loan Agreement” means our $4.5 billion revolving credit and term loan agreement; |
• | “Revolving Credit Facility” means our $3.5 billion senior unsecured revolving credit facility pursuant to the Revolving Credit and Term Loan Agreement; |
• | “same warehouse” means warehouses that were owned, leased or managed for the entirety of two comparable periods and that have reported at least twelve months of consecutive normalized operations prior to January 1 of the prior calendar year; |
iv
Table of Contents
• | “same warehouse NOI” means revenues for the same warehouse population less its cost of operations (excluding any depreciation and amortization, impairment charges and corporate-level general and administrative expenses, corporate-level acquisition, transaction, and other expense, corporate-level restructuring and impairment expense and gain or loss on sale of real estate); |
• | “Securities Settlement” refers to the settlement by our legacy investors of their BGLH equity for shares of our common stock or their Legacy OP Units for OP units; |
• | “segment NOI” means segment net operating income, calculated as a segment’s revenues less its cost of operations (excluding any depreciation and amortization, impairment charges, corporate-level general and administrative expenses, corporate-level acquisition, transaction, and other expense and corporate-level restructuring and impairment expenses); |
• | “Senior Unsecured Notes” means, collectively, our Series A Senior Notes, Series B Senior Note, Series C Senior Notes, Series D Senior Notes, Series E Senior Note, Series F Senior Note, Series G Senior Note, Series H Senior Notes and Series I Senior Notes; |
• | “stockholders agreement” means the stockholders agreement among us, BGLH, D1 Capital, Stonepeak, BentallGreenOak, Adam Forste and Kevin Marchetti that we intend to enter into in connection with this offering and the formation transactions; |
• | “Stonepeak” means Stonepeak Aspen Holdings LLC and, unless the context otherwise requires, its affiliates; |
• | “Term Loan” means our $1.0 billion senior unsecured term loan facility pursuant to the Revolving Credit and Term Loan Agreement; and |
• | “throughput” means the volume of inbound pallets that enter our warehouses plus the volume of outbound pallets that exit our warehouses, divided by two. |
v
Table of Contents
Dear Prospective Investors,
In 2008, from a small office on Battery Street in San Francisco, we committed to a simple but ambitious vision: to build a company that we would want to own forever. We were inspired by the type of business we would build, the people we would build it with and the belief we would build it to last. Sixteen years later, Lineage has come a long way in achieving that vision. Preparing for our IPO has allowed us to further distill our thinking—not only as we explain Lineage to you, but also as we define what success looks like for the next fifteen years and beyond.
We are fond of saying that our IPO is the opposite of an exit. It is a new beginning. Now, as we take this important step, we think it would be helpful to share why we are going public. We have been privileged to raise a considerable amount of private capital from some of the highest quality investors in the world. We are humbled by their belief in Lineage and are grateful for their long-term alignment with us. We have no pressure to go public and believe a significant portion of our current investors will want to remain long-term owners of Lineage as a publicly traded company, ourselves included.
Becoming a publicly traded company is a momentous decision and not without certain well-known considerations. However, we strongly believe the public market is the best way to deliver growth at scale by providing us with the advantages of a liquid currency and direct access to a lower cost of capital to further fuel our growth flywheel. Moreover, we believe that if we can remain true to what has made us successful as a private company, we will be even more successful as a publicly traded one.
Many companies and investors talk about building for the long term. What that has meant for us from the beginning, and even more so today, is being focused on one thing: building Lineage into the most dynamic and durable company it can be. This has been our only focus for the last sixteen years and will remain our life’s work going forward. In fact, we believe we are still in the very early innings of a long, successful journey. After many years of making hard, expensive, forward-thinking decisions to build a forever company, establish an irreplaceable network and develop a differentiated technology platform, it is really beginning to get fun.
The business we built. When we were getting our idea off the ground in late 2008, we wanted to build something durable that we could grow. The stability of cold storage and the opportunity to accretively deploy capital in a fragmented and growing industry really appealed to us. Most of all, we were drawn to the quiet complexity of something that seemed so simple from the outside. Acquiring Seafreeze and spending a year in Seattle learning how to make money in the business only reinforced our view that the operating intensity of this business was going to be our greatest moat. It was also clear that with effort, time and capital, we could pull powerful operating levers at a network-wide scale.
We also saw enormous waste in the system—clear opportunities to innovate and make the asset, network, and ecosystem more efficient. It was readily apparent that the industry was not zero-sum but rather additive-sum and that we could simultaneously create customer value, grow shareholder value, and reduce resource consumption by building a better supply chain. Over the last sixteen years, we have invested our capital into our portfolio, as well as big data, automation, data science, and, most importantly, talent. We believe we have created a scaled, tech-enabled company with both tangible and intangible assets that can continue to compound value. We are also confident we can continue to do good while doing well by driving greater sustainability and reducing food waste at a global scale.
The people we built with. It all started with our friendship from our early days in the bullpen at Morgan Stanley. We are fortunate to have grown that into a business partnership that continues to thrive after sixteen very intense years. The trust built from those early experiences, and a shared view that culture really matters, has been at our foundation from the beginning.
vi
Table of Contents
We often remind ourselves that culture is extremely difficult to build and very easy to lose. Our personal reputation as founders and the reputation of Lineage is very important to us. We work hard with the leadership team to make Lineage a special, fulfilling, and safe place to work for our team members. We strive to do right by people inside and outside of our company, including investing in our communities and fighting food insecurity. We are committed to being an excellent partner to our customers, our suppliers, our investors, our communities, our advisors, and the companies we acquire. We do what we say we are going to do.
At an even simpler level, it is about working with people you enjoy being around and having fun. Lineage’s esprit de corps is part of our secret sauce. We have been privileged to have so many incredible people join Lineage from diverse backgrounds and through acquired companies to create a whole that is greater than the sum of its parts. We have acquired numerous family-owned companies, and from our early days, we wanted Lineage to feel like a family. Fueled by our purpose—to transform the global food supply chain to eliminate waste and help feed the world—we work at building community every day, especially as our company has grown. For us, it is about getting to know our colleagues and their families and celebrating our wins together. But we also hold each other accountable, remain humble and acknowledge that every day is a day we can learn and do better together.
As founders, we have been “all-in” since day one and have committed to building that ownership mindset throughout the organization. It led us to form our first employee equity ownership plan in 2010 and now inspires us to expand it into a broad-based equity plan as part of our IPO. A deep ownership mentality is a key to how Lineage has become what it is today and will be a crucible of how to keep our strong culture and our drive as a publicly traded company.
Built for the future. For us, long term is an ethos. “Forever” was the defining idea from the beginning and led us to do many things differently than we might otherwise have if our horizon had been shorter. Partly because we started Lineage with a blank sheet as industry outsiders and partly due to the timing of when we started the company, we could shape what we wanted to build and do it in a differentiated way. For any key decision, we always asked ourselves to look into the distant future and imagine that Lineage was the disruptor in a global, mission-critical industry and work backwards from there. Often, the more difficult and more expensive solutions were the ones we believed would better position us for the competitive landscape in the future.
After culture, we focused on portfolio design. Though we did not come from real estate backgrounds, we knew location matters and intentionally bought and built what we believed was the highest quality portfolio of buildings in the markets with the best rent growth potential and lowest cap rates. We often decided to pay a little more or construct at a higher quality because we believed it would provide the best and most sustainable long-term portfolio for our customers. We then invested to maintain those assets at the highest level. We intend to continue this approach as a publicly traded company and seek to deploy our capital into strategically and financially accretive opportunities with an emphasis on compounding long-term shareholder value while driving the highest relative value quotient throughout our network for our customers.
We were also able to take a differentiated strategy towards technology. Acting on our deep conviction that innovation would be the way to modernize this industry and eliminate waste at a global level, we have consistently stayed on the leading (sometimes bleeding) edge of technology. Going directly to cloud technologies early in our journey enabled us to scale the business quickly. It also allowed us to create a large, centralized data asset onto which we could build innovative, proprietary tools. We have invested heavily in our transformational technology (over $725 million since 2019) to enhance customer experience, make our team members more successful and optimize both energy usage and our physical assets while simultaneously reducing waste in the supply chain.
Reflecting on the last sixteen years is motivating. At inception, it was impossible to imagine we could grow from one warehouse with about 340,000 square feet and around 100 team members to a global business with over 480 warehouses, comprising over 84 million square feet, and supported by over 26,000 team members in 19 countries. In hindsight, the strategy was sound, and the timing was good. However, what really made the
vii
Table of Contents
difference was the compounding impact of having an aligned organization that strove to make good decisions; worked hard; put our team members, customers and communities first; delivered for our investors; and consistently thought about the long term. If we continue to do that from here, then the best is yet to come.
A key part of our culture is pausing to recognize each other for living our purpose, embodying our values, and acknowledging the little and the big things we do to take the company forward. At a moment like this, it is inspiring to think about how many people have helped Lineage become what it is today. From the customers that store their most important products with us, to our team members who brave the cold and help grow the business, to the families that sold us their businesses, to our existing investors who continue to believe in us, it all comes down to Trust (with a big T). We are thrilled to have the opportunity to earn yours!
Adam Forste & Kevin Marchetti
Founders and Co-Executive Chairmen
viii
Table of Contents
The following summary highlights information contained elsewhere in this prospectus. This summary is not complete and does not contain all of the information that you should consider before investing in our common stock. You should read the entire prospectus carefully, including the section entitled “Risk Factors,” as well as our consolidated financial statements and related notes included elsewhere in this prospectus, before making an investment decision. Unless otherwise indicated, the information contained in this prospectus assumes that the shares of common stock to be offered by this prospectus are sold at $76.00 per share, which is the mid-point of the price range set forth on the front cover of this prospectus and that the underwriters’ option to purchase additional shares is not exercised.
Our Purpose
Our purpose is to transform the global food supply chain to eliminate waste and help feed the world.
Built with the vision of creating a more sustainable future, we are a leading mission-critical, temperature-controlled infrastructure provider for the storage, handling and movement of food around the world. It is estimated that approximately one-third of the food produced globally is lost or wasted and 12% is lost due to a lack of refrigeration. We offer solutions to the complexities of the cold chain—the vital network linking food from farm to fork—through our strategically located and scaled network of temperature-controlled warehouses and our technology-enabled platform.
Our Company
We are the world’s largest global temperature-controlled warehouse REIT, with a modern and strategically located network of properties. Our business is competitively positioned to deliver a seamless end-to-end, technology-enabled, customer experience for thousands of customers, each with their own unique requirements in the temperature-controlled supply chain. As of March 31, 2024, we operated an interconnected global temperature-controlled warehouse network, comprising over 84.1 million square feet and 3.0 billion cubic feet of capacity across 482 warehouses predominantly located in densely populated critical-distribution markets, with 312 in North America, 82 in Europe and 88 in Asia-Pacific. We have a well-diversified and stable customer base and currently serve more than 13,000 customers that include household names of the largest food retailers, manufacturers, processors and food service distributors in the industry. For the twelve months ended March 31, 2024, no single customer accounted for more than 3.3% of our revenues. In the twelve months ended March 31, 2024, we generated $5.3 billion of revenue, $162.8 million of net loss, $1.8 billion of NOI and $1.3 billion of Adjusted EBITDA.
We operate our business through two segments:
• | Global warehousing, which utilizes our high-quality industrial real estate properties to provide temperature-controlled warehousing storage and services to our customers and represented approximately 86% of our total NOI for the twelve months ended March 31, 2024; and |
• | Global integrated solutions, which complements warehousing with supply chain services to facilitate the movement of products through the food supply chain to generate cost savings for customers and additional revenue streams for our company and represented approximately 14% of our total NOI for the twelve months ended March 31, 2024. |
To augment our leading position in the temperature-controlled warehousing sector, we have invested more than $725 million since the start of 2019 in transformational technology initiatives to deliver enhanced customer value and operational efficiencies, including software development and implementation, establishment of in-house data science, product development and automation teams and selected acquisitions. We believe that we are
1
Table of Contents
an industry leader in technological innovation and that deploying these technologies supports potential strong same warehouse NOI growth and cash flow generation. Key elements of our technology strategy include leveraging both proprietary and what we believe are best-in-class systems to integrate acquisitions and development projects onto common information technology platforms to enable increased operational standardization and productivity; developing and deploying innovative tools to enhance our operations; deploying our in-house data science team to create optimization opportunities; developing patented innovations supporting critical areas of our business; and offering industry-leading automation capabilities. We have been recognized by multiple third parties as a leading industry innovator, including being listed among the CNBC Disruptor 50 in 2021, 2022, 2023 and 2024 and being recognized by Fast Company as one of the 50 Most Innovative Companies of 2019, including being ranked first in the Data Science category.
Our team members are the bedrock of Lineage, and we employ a workforce of over 26,000 team members across 19 countries. We were recognized as a U.S. Best Managed Company by Deloitte and the Wall Street Journal in both 2022 and 2023. We are headquartered in Novi, Michigan, and we were listed as one of Michigan’s Top Workplaces in 2022 by The Detroit Free Press. Our focus on our six core values of safe, trust, respect, innovation, bold and servant leadership drive our company forward every day.
Our Founding Story
Our journey began in late 2008 when Adam Forste and Kevin Marchetti acquired Seafreeze, our first cold storage warehouse in Seattle. The strategy and vision behind this investment was simple—build a company to own forever with durable, growing cash flows and the ability to compound capital efficiently over a long duration.
We have always believed that temperature-controlled warehousing is a sector ripe for long-term investment to build a differentiated and institutional-quality platform. The driving forces of our temperature-controlled warehousing investment thesis at our founding remain true today:
• | temperature-controlled warehousing demand is driven by frozen and refrigerated food, and such demand is growing and naturally resilient across macroeconomic cycles; |
• | temperature-controlled warehousing is asset-rich and operationally complex, both of which serve as the foundations for building a well-capitalized and disruptive industry leader; |
• | the temperature-controlled warehousing market is fragmented and is likely to benefit from institutional ownership, increased capital investment and large-scale innovation; and |
• | temperature-controlled warehousing is mission critical to customers and often represents a relatively modest expense compared to their other supply chain costs and a small portion of overall costs of goods sold. |
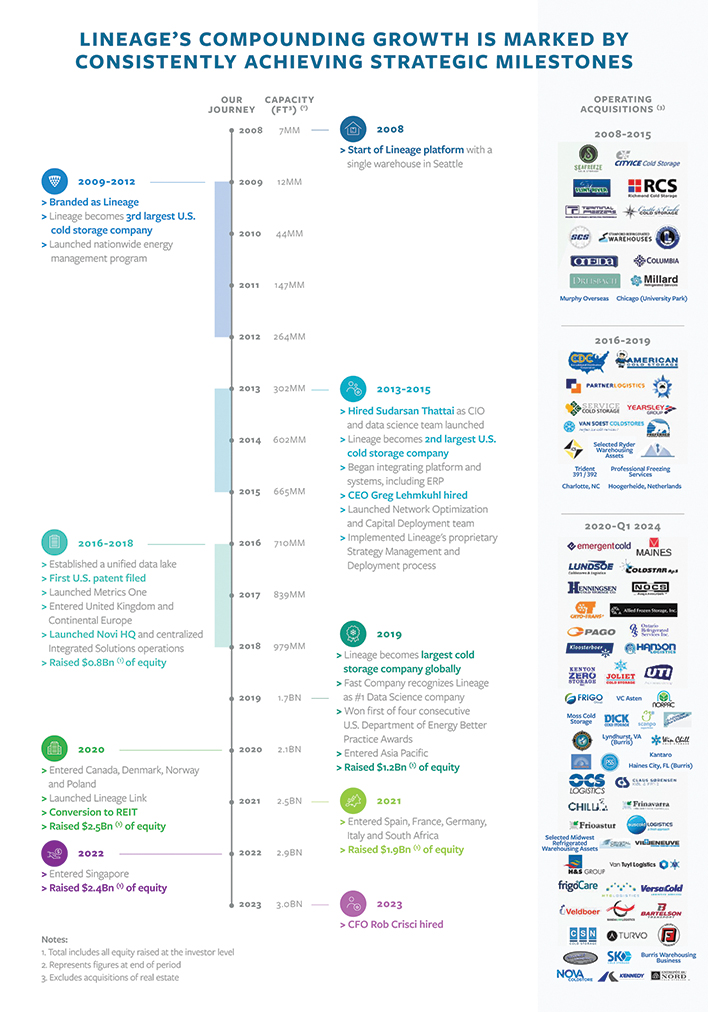
We believe that cold storage is an attractive, growing and durable industry that plays a mission-critical role in the food supply chain. In 2012, after making several acquisitions, we rebranded our company as Lineage and adopted the Lineage shield as our logo. Lineage’s roots run deep, dating as far back as the founding of New Orleans Cold Storage in 1886. Over the last 16 years, we have welcomed some of the most prestigious and well-respected cold chain companies in the world into the Lineage family through 116 acquisitions through March 31, 2024. Most of these companies were family owned and operated, and we have always placed significant value on the legacies of the companies that have become part of the Lineage story. Many of the owners of these companies have become investors in our company, and many of the family members and employees of these companies continue to work with us today. The Lineage name reflects the heritage and pedigree of all these companies while the Lineage shield logo represents our strength and conviction that the whole is greater than the sum of our parts.
2
Table of Contents
3
Table of Contents
Lineage Today
Today, we are an organization that is still deeply rooted in generations of temperature-controlled warehousing expertise while also pushing the cutting edge of technology and innovation in our sector. When we welcome new companies into our organization, we strive to integrate their best practices, insights and accomplishments into our existing processes to drive value for our customers and stockholders.
Since our founding nearly 16 years ago, we have been focused on reducing waste in the food supply chain, which creates customer value, drives Lineage’s profitability and often reduces resource consumption broadly with a positive sustainability benefit. We have built a dynamic culture to support doing good while doing well.
Throughout our history as a private company, we have focused on making decisions based on the long-term interests of our company and its stakeholders. As a public company, we intend to continue taking a long-term approach in our journey to build a more efficient, sustainable and resilient food supply chain—all while taking care of our customers, team members and communities and maximizing stockholder value.
Our Global Warehousing Segment
The backbone of our business is our mission-critical network of sophisticated, modern and strategically-located temperature-controlled warehouses.
As of March 31, 2024, our warehousing portfolio encompassed 463 warehouses featuring distribution, public, production advantaged and managed warehouse operations and contained approximately 81.9 million square feet, 2.9 billion cubic feet and 9.8 million pallet positions, with a cubic-foot weighted average age of 21 years. We also believe we have the largest automated temperature-controlled portfolio with 81 automated facilities, 24 of which are fully automated and 57 of which are semi-automated. The following table provides summary information regarding the warehouses in our portfolio that we owned, leased, or managed as of, or for the twelve months ended, March 31, 2024, as applicable.
Region | Number of Warehouses | Cubic feet (in millions) | Percent of total cubic feet | Pallet positions (in thousands) | Average economic occupancy | Average physical occupancy | Revenues (in millions) | Segment NOI (in millions) | ||||||||||||||||||||||||
North America | 293 | 2,057 | 70.5 | % | 6,198 | 86.6 | % | 78.8 | % | $ | 2,924 | $ | 1,191 | |||||||||||||||||||
Europe | 82 | 616 | 21.1 | % | 2,599 | 82.8 | % | 79.5 | % | 598 | 201 | |||||||||||||||||||||
Asia-Pacific | 88 | 244 | 8.4 | % | 1,008 | 81.8 | % | 79.0 | % | 346 | 115 | |||||||||||||||||||||
|
|
|
|
|
|
|
|
|
|
|
|
|
|
|
| |||||||||||||||||
Average/Total(1) | 463 | 2,917 | 100.0 | % | 9,804 | 85.1 | % | 79.0 | % | $ | 3,868 | $ | 1,507 | |||||||||||||||||||
|
|
|
|
|
|
|
|
|
|
|
|
|
|
|
|
(1) | Totals may not sum due to rounding. Excludes 19 warehouses in our global integrated solutions segment. We categorize warehouses as part of our global integrated solutions segment if the primary business conducted in those warehouses is within our global integrated solutions segment. |
As of March 31, 2024, we owned, operated, leased and managed multiple types of temperature-controlled warehouses across our global network, which we group into four types: distribution, public, production advantaged and managed warehouses.
• | Distribution centers are warehouses that typically store products for multiple customers often in or near difficult to duplicate metropolitan, infill or port locations. |
• | Public warehouses are warehouses that typically store products for multiple customers usually outside metropolitan and infill locations. |
• | Production advantaged warehouses are warehouses adjacent to or near customer production facilities. |
4
Table of Contents
• | Managed warehouses are facilities owned or leased by the customer for which we manage the warehouse operations on their behalf. |
Warehouse Type | Cubic Feet (in millions) | Pallet Positions (in thousands) | Number of Warehouses | NOI (in millions)(3) | Percentage of total NOI(3) | |||||||||||||||
Distribution | 2,035 | 6,666 | 283 | $ | 1,150 | 76.3 | % | |||||||||||||
Public | 474 | 1,975 | 124 | 180 | 11.9 | % | ||||||||||||||
Production Advantaged | 291 | 1,163 | 41 | 159 | 10.6 | % | ||||||||||||||
Managed / Other(1) | 117 | — | 15 | 18 | 1.2 | % | ||||||||||||||
|
|
|
|
|
|
|
|
|
| |||||||||||
Total(2) | 2,917 | 9,804 | 463 | $ | 1,507 | 100 | % | |||||||||||||
|
|
|
|
|
|
|
|
|
|
(1) | Includes costs associated with land held for development. |
(2) | Totals may not sum due to rounding. Excludes 19 warehouses in our global integrated solutions segment. We categorize warehouses as part of our global integrated solutions segment if the primary business conducted in those warehouses is within our global integrated solutions segment. |
(3) | For the twelve months ended March 31, 2024. |
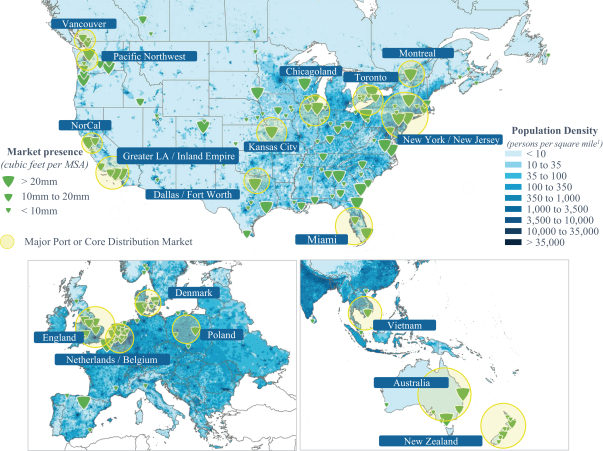
Our broad network of warehouses is weighted towards high-population density markets and port locations, with a weighted average population density of approximately 3,100 persons per square mile and 241 port facilities across our network. We define a warehouse as a port facility if it is within 30 miles of a port that performs commercial or trade-related activity. These markets feature high value real estate that serve as critical nodes in our customers’ supply chains, which we believe in turn supports high economic occupancy, low volatility in demand, productive NOI generation and strong growth.
5
Table of Contents
The following maps show the locations of our temperature-controlled warehouses around the world as of March 31, 2024.
Note: Includes 19 warehouses in our global integrated solutions segment and countries where we only have a presence through our global integrated solutions segment.
(1) | Based on global warehousing segment revenues for the twelve months ended March 31, 2024. Reflects countries in which our local network of temperature-controlled warehouses is the largest, as measured by cubic feet capacity. |
6
Table of Contents
Global Map of Assets with Population Density
(1) | U.S. data per U.S. Census Bureau, ArcGis, public filings and SNL. |
(2) | Non-U.S. data per NASA Socioeconomic Data and Applications Center (SEDAC) managed by the Center for International Earth Science Information Network (CIESIN), Earth Institute, Columbia University. |
We store frozen and perishable food and other products and provide related warehouse services for our customers. Storage revenues relate to the act of storing products for our customers within our warehouses. Storage revenues can be in the form of storage fees we charge customers for utilization of non-exclusive space or a set amount of reserved space in a warehouse, blast freezing fees we charge customers for utilization of specific ultra-cold spaces within a warehouse designed to rapidly reduce product temperature and rent we charge customers for the lease of warehouse space pursuant to a lease agreement. Warehouse services fees relate to handling and other services required to prepare and move customers’ pallets into, out of and around our facilities. As part of our warehouse services, we offer handling, case picking, order assembly and load consolidation, quality control, re-packaging and government-approved inspections, among other services, for which we charge fees. Across our warehouses, we primarily offer frozen storage temperatures and in many facilities we also offer chill temperatures, which are higher than freezing but lower than ambient. We also manage warehouses for customers on a limited basis.
7
Table of Contents
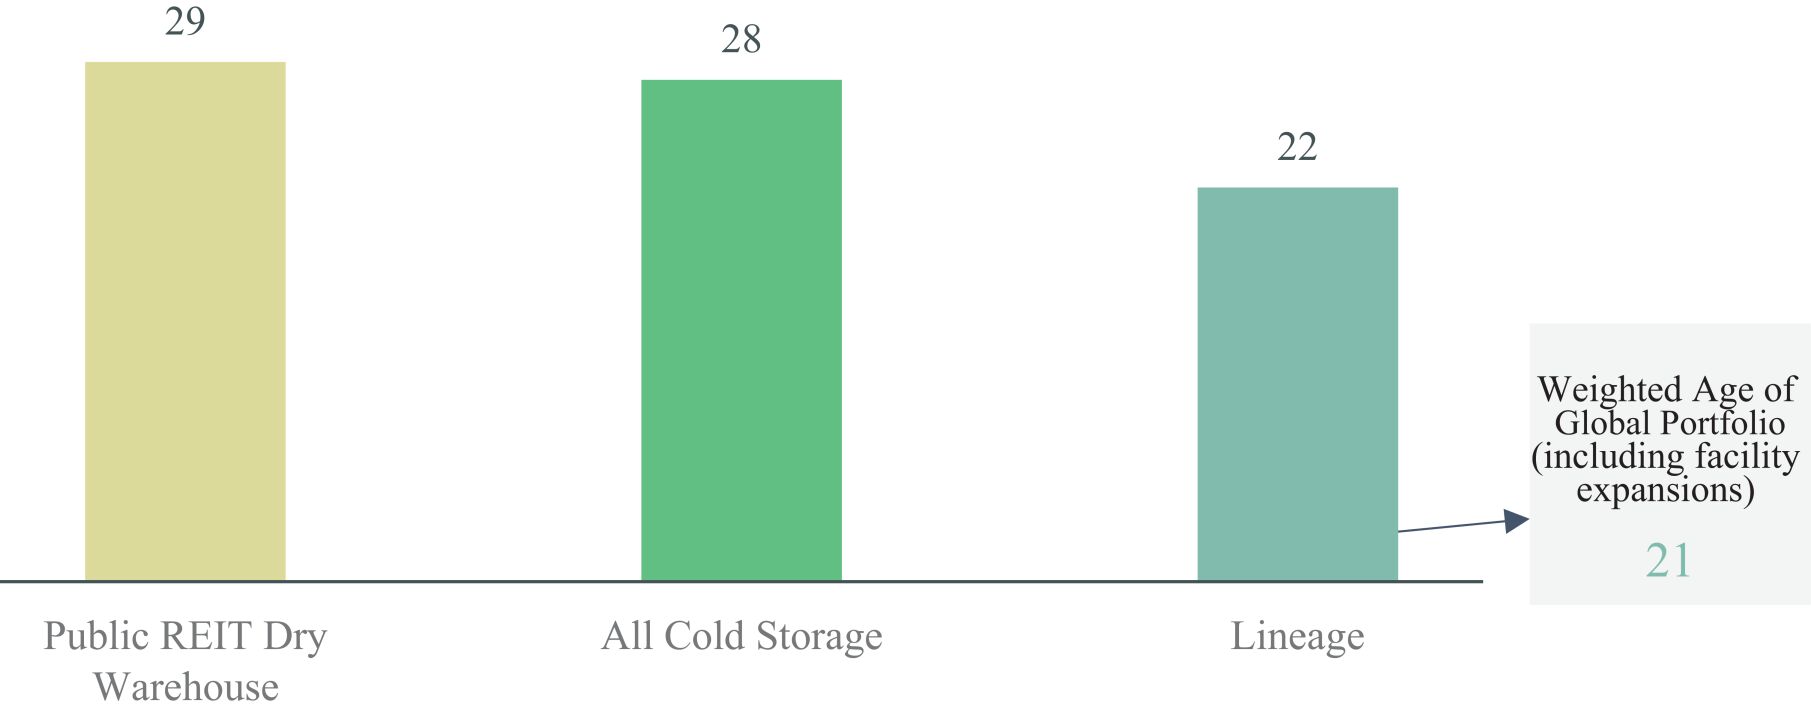
As of March 31, 2024, the cubic-foot weighted average age of our portfolio was approximately 21 years, which we believe is significantly younger than that of the broader temperature-controlled industry. In addition, many of our warehouses may operate in a way that is functionally younger than their age given the substantial investments or refurbishments we have made that do not factor into the age calculation in areas such as maintenance, automation, energy efficiency and sustainability. From 2021 through March 31, 2024, we have invested over $474 million in recurring maintenance capital and integration expenditures we incur when we acquire new warehouses and approximately $366 million in repair and maintenance operating expense across our existing warehouse network because we believe that a more modern and consistently maintained network enhances prospects of winning new customers, retaining existing customers, extending our network’s useful lives and driving more efficient operations, improved profitability and greater cash flow.
Our Global Integrated Solutions Segment
Our global integrated solutions segment provides our customers with solutions to move products through the food supply chain. The majority of our customers’ supply chain costs come from the movement of their products between warehouse nodes, rather than from the cost of warehousing. We believe transportation represents on average more than three times the cost of warehousing as part of our customers’ supply chain expense. Our integrated solutions provide value-added benefits to warehousing customers, helping them to reduce transport costs while enabling us to generate additional revenue on the same product stored.
We operate several critical and value-added temperature-controlled business lines within our global integrated solutions segment, including, among others, transportation and refrigerated rail car leasing. Within transportation, which is the largest area within our global integrated solutions segment, our core focus areas are multi-vendor less-than-full-truckload consolidation, drayage services to and from ports, over-the-road trucking and freight forwarding. We also provide foodservice distribution in select markets and e-commerce fulfillment services. For the twelve months ended March 31, 2024, transportation and refrigerated rail car leasing together accounted for approximately 67% of our global integrated solutions segment NOI.
We believe that data-driven visibility into our customers’ warehouse volumes and shipping destinations enables us to provide efficient integrated solutions. These services deepen our customer relationships, allow for an “all services under one roof” experience and promote cross-sale opportunities within our warehouses. As we collaborate with our customers across their supply chains, we seek to reduce waste and redundancy and deliver more cost efficient and sustainable solutions for them. We believe that our comprehensive set of integrated solutions offerings differentiates us from our competitors, positions us well to win new business, strengthens customer retention and enhances the value of our warehousing business.
8
Table of Contents
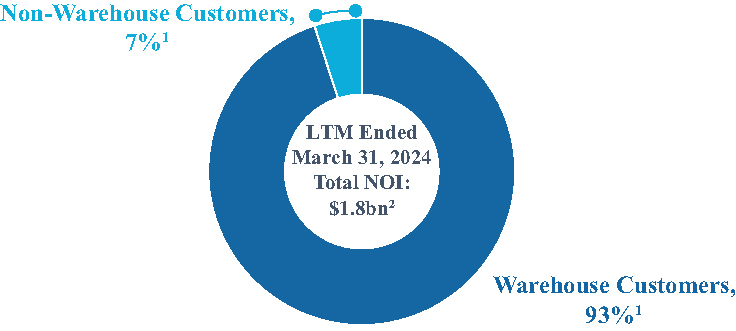
The following chart summarizes our total NOI generation from Lineage customers who utilize our warehousing business and Lineage customers who exclusively utilize Lineage integrated solutions:
NOI by Customer Type
(1) | Estimated based on global warehousing segment NOI for the twelve months ended March 31, 2024 and, as it relates to Lineage’s global integrated solutions segment NOI, the relative revenue contribution from Lineage customers who utilize our warehousing business and Lineage customers who exclusively utilize Lineage integrated solutions. |
(2) | Total NOI represents the sum of both the global warehousing segment and global integrated solutions segment. |
Market Opportunity
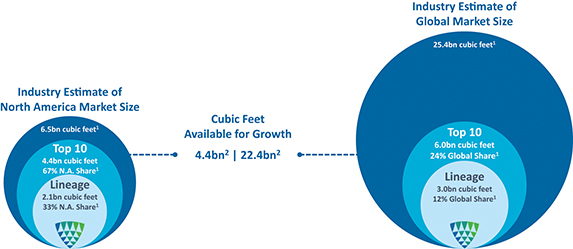
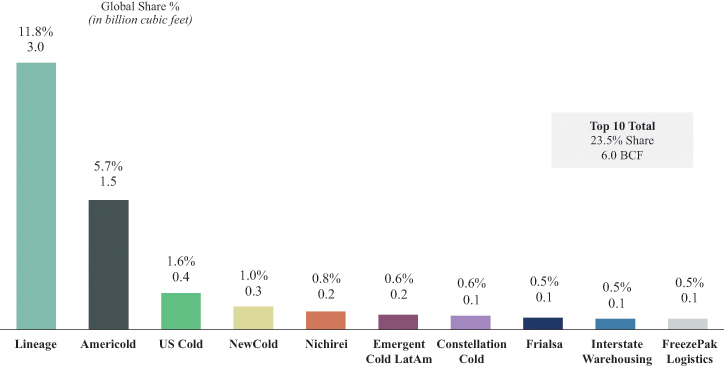
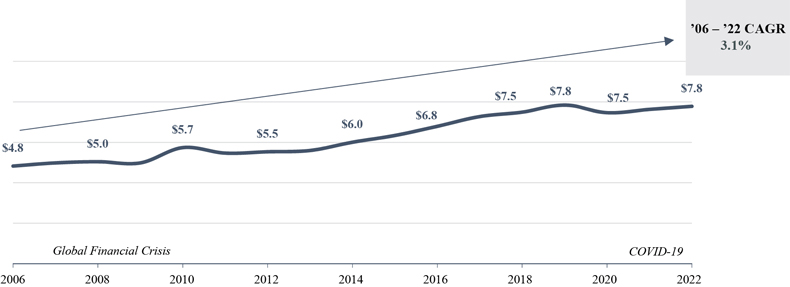
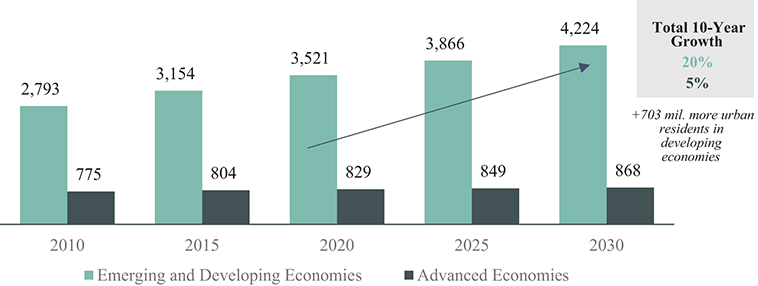
We believe temperature-controlled warehousing and integrated solutions are an essential part of safeguarding the global food supply chain, as they provide perishable food producers, distributors, retailers and foodservice providers access to food-grade storage facilities and supply chain services critical for maintaining food safety, while promoting sustainability from farm to table. IBISWorld projects that U.S. cold storage revenue will grow 3% annually over the next five years to $9.6 billion in 2028. We also believe that the temperature-controlled warehousing market is large, growing and resilient, driven by the durability of food consumption through macro cycles, stock-keeping unit proliferation, global population growth, rising disposable incomes and shifting consumer preferences towards perishable foods. These factors further increase the need for additional temperature-controlled warehousing capacity to meet current and anticipated future market demand. The market remains fragmented, with the top ten temperature-controlled warehousing operators representing only 23.5% of the global public temperature-controlled warehousing cubic feet capacity. Given the fragmented nature of the market, we believe that large, well-capitalized operators like Lineage are often best positioned to meet the growing demand for cold storage, provide value-added integrated solutions to their customers and differentiate themselves through investments in technology.
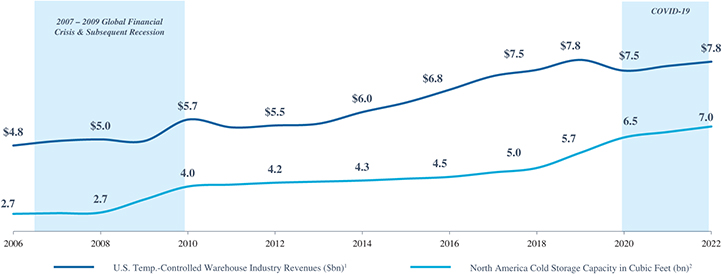
Generally, steady demand in the food industry has created consistent cold chain demand, which has provided our business with strong cash flows even during periods of broader economic stress. As shown in the figure below, the U.S. temperature-controlled warehousing industry has experienced relatively stable revenue growth, even in periods marked by significant turmoil in the global financial markets, commodity shocks, secular
9
Table of Contents
shifts in consumer habits and preferences, the global COVID-19 pandemic and the ensuing supply chain disruption and periods of significant global inflation.
Resilient Industry Dynamic
(1) | Per IBISWorld report. |
(2) | 2023 GCCA North America Top 25 List (May 2023). |
Our Competitive Strengths
We believe we are the premier technology-enabled temperature-controlled warehousing REIT in the world, as evidenced by the following competitive strengths:
We are the global leader in a fragmented industry with meaningful scale and network benefits.
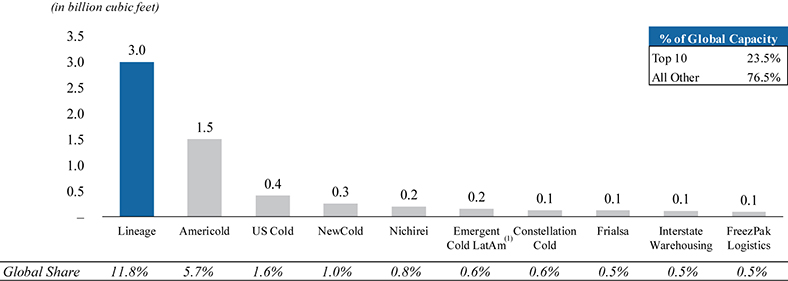
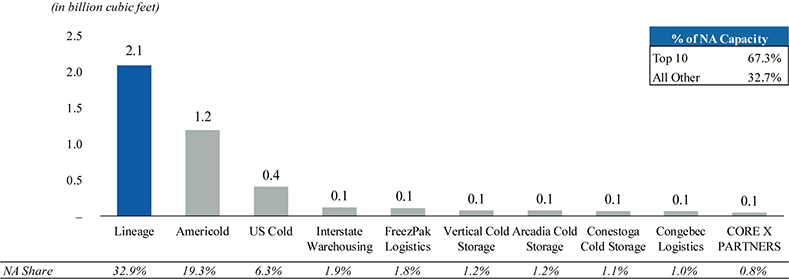
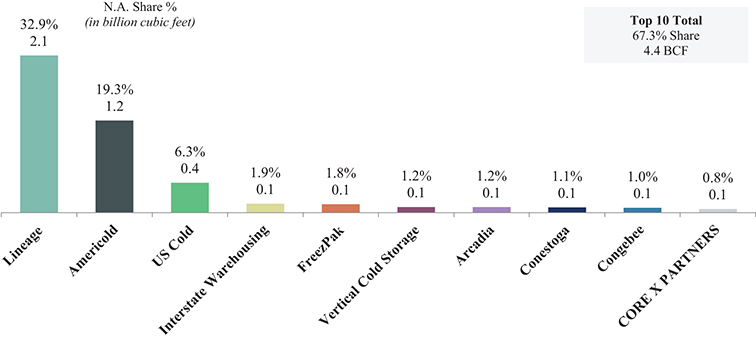
We are the largest temperature-controlled warehousing company globally, including in some of the world’s largest developed markets such as the United States, Canada, the United Kingdom, Continental Europe, Australia and New Zealand. As measured by cubic feet of storage space, we are approximately twice the size of our next largest competitor globally and are as large as our next nine global competitors combined, as reflected in the charts below.
Estimate of Top 10 Global Temperature-Controlled
Companies’ Cubic Feet Capacity and Market Share
10
Table of Contents
Source: | 2024 GCCA Global Top 25 List (April 2024), except Lineage figures, which are based on company data as of March 31, 2024, and Americold Realty Trust, Inc. (“Americold”) figures, which are based on public filings of Americold with the U.S. Securities and Exchange Commission (“SEC”) as of March 31, 2024. We present data with respect to Americold, as Americold is our largest competitor for whom data is publicly available. Global market share is based on total global capacity from 2020 GCCA Global Cold Storage Capacity Report (August 2020). |
(1) | As of March 31, 2024, Lineage owned 9.0% of the investment interests in Emergent Cold LatAm Holdings LLC as well as a right to receive an additional portion of certain profits generated by Emergent Cold LatAm Holdings LLC, which could represent anywhere from zero to 10% of the additional profits generated on invested capital. |
Estimate of Top 10 North American Temperature-Controlled
Companies’ Cubic Feet Capacity and Market Share
Source: | 2024 GCCA North America Top 25 List (April 2024), except Lineage figures, which are based on company data as of March 31, 2024, and Americold figures, which are based on public filings of Americold with the Securities and Exchange Commission, or the SEC, as of March 31, 2024. North America market share based total North American capacity from 2020 GCCA Global Cold Storage Capacity Report (August 2020). |
Approximately 97% of our global warehousing segment revenues are from countries in which our local network of temperature-controlled warehouses is the largest, as measured by cubic feet of capacity. The interconnected nature of our global warehouse network aligns with the global nature of many of our customers, allowing us to provide warehousing services to many of them across multiple geographies. On average, our top 25 customers utilize 23 of our facilities per customer, and eight of our top 10 customers use our facilities in multiple countries.
We believe that our network and the economies of scale in our business drive operational leverage and allow us to invest in customer service and technology, which, in turn, attracts more customers. With a larger customer base, we believe that we can leverage our resources more efficiently, supporting strong profitability. Moreover, our growing customer base enables us to gather and analyze vast amounts of data. We believe that this data-driven approach empowers us to continuously refine our operations, improve productivity and lower operating costs, creating a “win-win” scenario for both our customers and Lineage.
We believe that it would be difficult and costly to replace or replicate our network of temperature-controlled facilities given the high and rising value of industrial land, difficulties in obtaining land and zoning entitlements and
11
Table of Contents
approvals and the significant and increasing construction costs of temperature-controlled warehouses. As of March 31, 2024, we owned approximately 80% of our global warehousing portfolio as a percentage of square feet, including ground leases and real estate for which we possess bargain purchase options, and we leased or managed 20% of our global warehousing portfolio as a percentage of square feet.
Our high quality portfolio is located in highly desirable and strategic locations around the world.
Our cubic-foot weighted average facility age is approximately 21 years, which we believe is significantly younger than that of the broader temperature-controlled warehousing industry. Moreover, our portfolio includes 81 fully- and semi-automated warehouses, which we believe is the most of any cold storage provider in the world, making our network the most technologically advanced in our industry. We believe that modern warehouses are more desirable to our customers because of their increased operational efficiency and enhanced ability to meet today’s most sophisticated customer needs.
We have a robust presence in key metropolitan statistical areas, or MSAs, and ports throughout the United States with a larger number of facilities in such locations relative to our largest competitor, which drives a significantly higher weighted average population density of approximately 3,100 persons per square mile.
We have a particularly strong presence in top-tier U.S. markets, including New York/New Jersey, Los Angeles and Southern California, Chicago, Dallas-Fort Worth, Houston, Kansas City, Denver, Philadelphia, Miami, Atlanta, Boston, the Bay Area and Northern California, Seattle and the Pacific Northwest. We consider these U.S. markets to be key geographies, as we believe they have among the highest industrial real estate values and lowest cap rates in our industry.
Our business is highly diversified across geographies, commodities and a high-quality, loyal customer base.
Our business profile is highly diversified, which reduces risks to our cash flows from potential headwinds linked to any one facility, market, commodity, food consumption channel or customer. We have 482 facilities globally, with no facility accounting for more than 1.1% of revenues during the twelve months ended March 31, 2024.
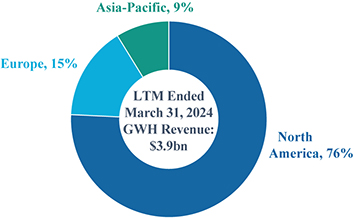
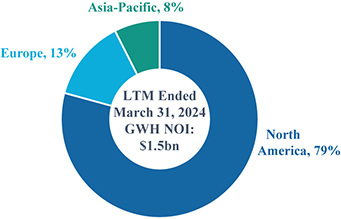
The following charts provide information regarding the temperature-controlled warehouses in our global warehousing segment that we owned, leased or managed in each of the regions in which we operated as of March 31, 2024.
Warehouse Segment Geographic Revenue and NOI Diversification
Note: Percentages may not sum to 100% due to rounding.
12
Table of Contents
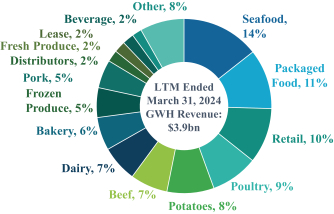
In addition, our global warehousing segment revenues for the twelve months ended March 31, 2024 were diversified by commodity type as demonstrated by the graph below.
Commodity Type as Percentage of Global Warehousing Segment Revenue
Note: Percentages may not sum to 100% due to rounding.
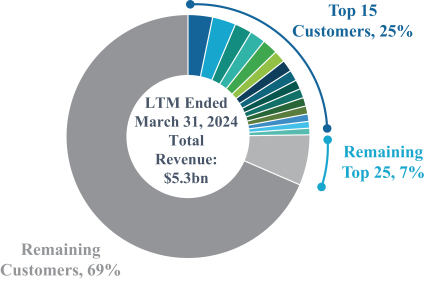
As of March 31, 2024, we served more than 13,000 customers around the world across numerous commodity categories and with complex requirements in the food supply chain. Our customer base was highly diversified, with no customer accounting for more than 3.3% of revenues for the twelve months ended March 31, 2024.
The following chart sets forth the percentage of our total revenues attributable to our top 15 and top 25 customers for the twelve months ended March 31, 2024.
Customers as Percentage of Total Revenue
13
Table of Contents
We target dependable customers with strong credit profiles, as evidenced by the fact that over 60% of the revenue generated from our top 25 customers is from companies with at least one investment grade rating at the parent or subsidiary level from Moody’s, S&P or Fitch. Additionally, 93% of our top 25 customers that are publicly-traded or have a publicly-traded parent company also have at least one investment grade rating.
Our customer base is loyal, with a weighted average customer relationship, including relationships with legacy companies we have acquired, of over 30 years across our current top 25 customers based on revenues for the twelve months ended March 31, 2024. We believe this loyalty is driven by:
• | the mission-critical role we play in our customers’ cold chain; |
• | the expansive and interconnected nature of our warehouse network; |
• | the locations of our warehouses and the services we offer; |
• | the comprehensive suite of integrated solutions that we offer to our customers; and |
• | excellent customer service and innovative technologies. |
Our complementary, value-added global integrated solutions segment drives customer value, retention and growth.
In addition to our temperature-controlled warehousing operations, we offer a comprehensive suite of value-added integrated solutions that we believe are highly complementary and valuable to our warehouse customers. These services deepen our customer relationships by providing an “all services under one roof” experience and promoting cross-sell opportunities. Given the majority of our customers’ supply chain costs come from product movement versus storage, this integration provides a value-added benefit to warehousing customers of reducing transport costs while enabling us to generate additional revenue on the same product stored. For the twelve months ended March 31, 2024, we estimate that approximately 93% of our total NOI was generated by our warehouse customers (based on our global warehousing segment NOI and, as it relates to our global integrated solutions segment NOI, the relative revenue contribution from our customers who utilize our warehousing business and our customers who exclusively utilize our integrated solutions).
We believe we can grow our global integrated solutions segment by offering these services to customers who have not yet utilized them, often with minimal incremental capital investments required, and likewise that our integrated solutions offerings can generate customer leads for our global warehousing segment.
Our highly synergistic platform differentiates us from our competitors, supports a strong win rate with new business, enhances customer loyalty and increases the value of our warehousing business.
We believe we are an innovative industry leader driving disruption with differentiated technology.
In a traditionally analog, fragmented and family-owned industry, we believe that our innovation and large-scale deployment of cutting-edge technology provides a comprehensive service offering for our customers that enhances our competitive position relative to our peers, while driving industry-leading growth and margins. Since the start of 2019, we have invested more than $725 million into transformational technology initiatives, which include developing, acquiring and deploying both proprietary operating systems and third-party platforms, an amount we believe is more than any of our industry competitors. In addition, since the start of 2019, we have deployed approximately $380 million to capital and operating expenses in information technology investments. This investment encompasses migrating workloads to the cloud, implementing SaaS-based tools, rolling out next-generation SD-WAN, and upgrading our core human capital and financial ERP software. These initiatives are strategically designed to standardize, integrate, and enhance the technological framework across our enterprise. In addition, our deliberate and forward-thinking focus has allowed us to create what we believe is the largest automated portfolio in the industry with 81 fully-and semi-automated facilities backed by innovative proprietary software and an in-house automation team.
14
Table of Contents
Due to the increasing demand for automated solutions from our customers, the higher construction cost of automated facilities and the complexity of implementing automated solutions, we expect the growth of automation in our warehouse network to be a key differentiator for Lineage over time.
Some key elements of our technology strategy include the following:
• | Establishing a highly integrated platform. We use a standardized and disciplined approach to apply our best practices to integrating acquired companies. This has been a core part of our strategy since our inception. As of March 31, 2024, approximately 95% of our global warehousing segment revenue for the twelve months ended March 31, 2024 was integrated on our human capital and financial enterprise resource planning (“ERP”) software. As of March 31, 2024, approximately 69% of our global warehousing segment revenue for the twelve months ended March 31, 2024 flowed through one of our four Core WMS, excluding facilities leased to customers and managed facilities. We are in the process of growing this percentage across our network. From 2019 through March 31, 2024, we converted over 100 facilities to Core WMS, demonstrating our strong conversion record and ability to increase the penetration rate quickly. As of March 31, 2024, all of our global warehousing segment revenue was reporting on metricsOne, a proprietary operating KPI dashboard that provides enhanced visibility into our operational execution, labor, safety and financial performance. |
• | Providing a superior customer experience to support growth and retention. We have deployed proprietary operating systems and third-party platforms to improve customer experience and retention. We have developed Lineage Link, a proprietary customer visibility platform that empowers customers to actively manage their inventories, orders, shipments and transportation appointment scheduling across our warehouse network, which seeks to drive incremental NOI through increased efficiencies for customers and Lineage. Through March 31, 2024, Lineage Link had been rolled out across approximately 63% of our network as measured by global warehousing segment revenues for the twelve months ended March 31, 2024, and we are in the process of further growing its penetration. We believe these technologies will support customer retention as we improve our responsiveness to our customers’ complex and evolving needs. |
• | Maximizing yield and productivity to support leading NOI growth. We are in the initial phases of deploying proprietary operating systems and third-party platforms to seek to drive NOI yield, operational productivity and process automation across our warehouse network and thereby drive margin improvement. Our specialized warehouse execution system, LinOS, is engineered to boost our operational efficiency. It employs unique, patented algorithms to optimize task allocation among team members and strategically prioritize tasks within our warehouses. Currently operational in select automated facilities, LinOS shows significant potential for extensive deployment across our conventional warehouse network in the future. In addition, we are implementing a third-party contracting and invoicing platform that automates the processes of quoting, contracting and invoicing, which we believe will lead to more dynamic and standardized implementation of revenue growth initiatives. As of March 31, 2024, this platform had been rolled out across facilities comprising approximately 58% of our network as measured by global warehousing segment revenues for the twelve months ended March 31, 2024, and we are in the process of further growing its penetration. In addition, our productivity and process automation initiatives are supported by our in-house data science team, which is comprised of 50 applied science and product professionals that provide data-driven business intelligence and innovations to maximize operational efficiencies, revenues, profitability, energy efficiency and cash flows. Our innovations have yielded 96 patents issued and 151 patents pending as of March 31, 2024, in such areas as facility design, methods and mechanisms for operating facilities, refrigeration and thermodynamic designs and cold-rated instrumentation. |
We have a purpose-driven, experienced and aligned management team and board of directors that believe robust corporate governance is essential to long-term value creation for all stockholders.
Our experienced management team and board of directors have proven backgrounds both inside and outside the temperature-controlled warehousing industry. Since founding Lineage with a single asset in 2008, our
15
Table of Contents
Co-Founders and Co-Executive Chairmen have developed a strong operating and capital deployment track record while displaying a commitment to building a durable business. The average tenure of members of our senior management is over eight years. Our management team is led by our Chief Executive Officer, Greg Lehmkuhl, who joined our company in 2015.
Finally, as evidence of the confidence in our company, our current equity holders represent some of the strongest and most sophisticated institutional investors globally. We have raised more than $9.0 billion of equity capital since inception and more than $8.5 billion since the start of 2018 from these investors over multiple capital raises (in each case, including equity issued to sellers in connection with our acquisitions and reinvestment by our Co-Founders).
We have a strong and flexible balance sheet and we have demonstrated access to debt and equity capital to support growth.
As of March 31, 2024, after giving effect to the repayment of debt with net proceeds of this offering, our balance sheet will be significantly de-levered, 69% of our debt will be unsecured and 77% of our debt will be fixed or interest rate hedged and our total liquidity, including cash on hand and available revolver capacity, will be $2.0 billion, supporting our external growth strategy. We will have also increased our unencumbered asset pool to over $16.3 billion on a pro forma basis as of March 31, 2024, which we believe will provide us with the ability to upsize our facilities while maintaining future flexibility once we become a public company. We intend to preserve a flexible capital structure with an investment grade profile. We believe that our balance sheet flexibility and strength will allow us to continue expanding our business and pursue new growth opportunities.
We operate with the purpose to transform the global food supply chain to eliminate waste and help feed the world.
As we strive to play a key role in shaping the global food chain, we recognize our responsibility to help create a more sustainable, equitable future. Accordingly, we work to strategically integrate sustainability initiatives into the way we do business, working to act in alignment with our core values to guide our policies.
To help tackle food insecurity, we established the Lineage Foundation for Good as a non-profit charity to serve the communities in which we operate. In response to COVID-19, we launched our “Share a Meal” Campaign with Feeding America, supporting the organization’s temperature-controlled supply chain needs with our assets. Since 2020, we have donated the equivalent of over 176 million meals, including through our “Share a Meal” Campaign and in partnership with customers donating surplus product, team members donating food to local food banks and grants issued to help build capacity at food banks around the globe. As a result of these and other initiatives, we were named a Visionary Partner of Feeding America and a Fast Company’s 2021 World Changing Ideas Awards finalist in the Pandemic Response category.
We have also signed The Climate Pledge, committing to achieve net zero carbon emissions across our global operations by 2040. Through solar installations at our facilities, we are the fifth-largest corporate producer in the United States, and the second-largest REIT producer, of on-site solar and battery capacity per the 2022 Solar Means Business Report published by the Solar Energy Industry Association (SEIA). Our goal is to achieve a top-three corporate ranking in the coming years. Our energy efficiency initiatives have resulted in four consecutive awards from the U.S. Department of Energy from 2019 to 2022 for innovations and leadership in flywheeling, blast freezing, energy procurement and hedging and deployment of advanced refrigeration control systems.
Our Growth Strategy
Our objective is to maximize stockholder value by growing our business to expand solutions for our customers, creating opportunities for new and existing team members and driving innovation across our business
16
Table of Contents
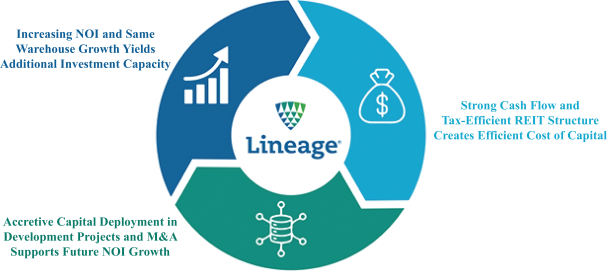
and the supply chain to create efficiencies and increase sustainability. We believe these objectives are supported by our strategy for growth illustrated in our growth flywheel:
• | We grow our same warehouse NOI and free cash flow through numerous organic business initiatives we have developed over many years. This growth helps delever our balance sheet and creates capacity for new investments. |
• | Our strong cash flows and our tax efficient REIT structure help to create an efficient and attractive cost of capital to support our inorganic growth. |
• | We deploy our capital into a deep pipeline of investments within our existing facilities, accretive greenfield and expansion development projects and acquisition opportunities at returns in excess of our cost of capital. |
• | We then use our organic business initiatives and drive operational and administrative synergies to seek to grow our same warehouse NOI and cash flows post investment. |
• | We then repeat the process through our growth flywheel. |
Same Warehouse Growth
We have a history of robust same warehouse growth with strong operating leverage and cash flow generation. In 2023, our same warehouse NOI was $1,210.9 million, representing growth of 15.3% compared to same warehouse NOI of $1,050.6 million the prior year, and in 2022, our same warehouse NOI was $936.2 million, representing growth of 12.7% compared to same warehouse NOI of $830.5 million in 2021, which growth rates compare favorably to those of our largest competitor and publicly traded peer. Our same warehouse NOI margins of 40.3% in 2023 compared to 37.2% in the prior year and 39.0% in 2022 compared to 38.8% in the prior year compare favorably to those of our largest publicly traded competitor. In addition, we increased our global same warehouse storage revenue per economic pallet 6.2% and 8.1% and our same warehouse services revenue per pallet 7.4% and 13.8% in 2023 and 2022, respectively.
We expect to continue our organic growth through the following business initiatives:
• | Leverage the scale of our warehouse network and the breadth of our integrated solutions offerings to win new customers and expand our footprint with existing customers; |
17
Table of Contents
• | Maximize our same warehouse NOI growth through occupancy and commercial optimization initiatives; |
• | Further implement productivity tools and cost containment measures; |
• | Use our integrated platform, scalable corporate infrastructure and business processes to realize synergies from recent acquisitions and drive same warehouse growth post-acquisition; |
• | Strategically deploy innovative technologies to provide customers more sophisticated solutions while enhancing profitability; and |
• | Transform the industry through our data science driven approach to warehouse control and design. |
Accretive Capital Deployment
A cross functional network optimization, data science and automation team has overseen 39 major greenfield or expansion projects since the start of 2019, with total cost of approximately $1.2 billion, representing an NOI yield of approximately 9% to 11%. The total aggregate cubic feet of these projects is approximately 291 million, which is equivalent to the total warehousing capacity of the fourth largest standalone global temperature-controlled warehousing company. Since 2019, this team has also supported more than 375 economic return on capital projects within our warehouses to enhance organic growth. We have spent significant time and cost to establish a team of experts in construction, energy, automation and innovation, and we believe our development process and expertise, together with our robust pipeline of facility expansions and greenfield development, has the potential ability to drive future growth and ongoing value to our stockholders.
We believe we are an acquiror of choice in the industry, as demonstrated by our long history of acquiring leading companies through direct sourcing and long-term relationships with their owners. Our acquisition strategy targets profitable businesses with strategic, high-quality assets that complement our network and customers’ needs. These businesses often present opportunities to accretively deploy capital and recognize revenue and cost synergies. We have extensive experience acquiring cold chain companies of all sizes. In the last 16 years through March 31, 2024, we have executed 116 acquisitions with nearly two-thirds of those proprietarily sourced. Moreover, through 2023, we have achieved an approximately 12% NOI compounded annual growth rate from the temperature-controlled warehousing companies we acquired during the period of 2011 through 2021, excluding additional NOI growth as a result of post-acquisition greenfield and expansion initiatives, demonstrating the positive impact of Lineage’s comprehensive approach to integration and Lineage’s ability to compound capital over a long period of time.
We intend to continue our track record of accretive capital deployment through the following business initiatives:
• | Invest in potentially accretive projects across our existing facilities to enhance same warehouse growth; |
• | Execute on our greenfield and existing facility expansion initiatives; and |
• | Capitalize on strategically attractive and financially accretive acquisition opportunities. |
Same Warehouse Growth
Same Warehouse Growth: Leverage the scale of our warehouse network and the breadth of our integrated solutions offerings to win new customers and expand our footprint with existing customers.
As the world’s largest temperature-controlled warehouse REIT based on cubic feet, we believe our portfolio of strategically located temperature-controlled warehouses and comprehensive set of integrated solutions create the scale and breadth of services to maximize value for both existing and new customers. Our platform includes 482 warehouses and is supported by more than 26,000 dedicated team members across 19 countries. Our modern warehousing assets are predominantly located in key port and infill locations that are strategic to customers of the
18
Table of Contents
cold chain. We believe the interconnected nature of our network and our presence in these strategic locations enables us to provide comprehensive solutions, competitively positioning us to both win new business and expand our footprint with existing customers.
Our warehouse portfolio is complemented by our integrated solutions business, offering an “all services under one roof” experience for our customers, providing our customers a holistic solution to their complex needs. This approach supports our growth by deepening our relationships with existing customers as well as allowing us to compete effectively for new customers. Additionally, the depth of our relationships allows us to seek to increase the penetration of customers utilizing both warehousing and integrated solutions.
Providing a global system of top-tier warehouses and ever broadening services has deepened our customer relationships with a growing customer base. As evidence of the interconnected nature of our warehouse and integrated solutions segments, as of March 31, 2024 our top 25 customers utilize an average of 23 of our warehouses per customer, with eight of our top 10 customers using our facilities in multiple countries. The interconnected nature of our integrated solutions business is demonstrated by our estimate that approximately 93% of our total NOI was generated by our warehouse customers for the twelve months ended March 31, 2024 (based on our global warehousing segment NOI and, as it relates to our global integrated solutions segment NOI, the relative revenue contribution from our customers who utilize our warehousing business and our customers who exclusively utilize our integrated solutions).
Same Warehouse Growth: Maximize our same warehouse NOI growth through occupancy and commercial optimization initiatives.
We seek to grow our same warehouse NOI through occupancy and commercial optimization initiatives. Our occupancy initiatives are highlighted by a focus on optimizing physical warehouse occupancy and improving economic occupancy through increased use of minimum storage guarantees, while our commercial optimization initiatives are enabled by customer profitability tools and allowing us to align rates charged to customers with our cost to serve.
• | Optimizing Physical Warehouse Occupancy Through Increased Utilization. Increases in warehouse physical occupancy generate high flow-through to NOI due to operational leverage. We seek to optimize physical occupancy in our existing warehouse network by winning new customers, expanding our business with existing customers and more efficiently matching customer profiles to the best available pallet positions in our markets. We support these initiatives with a team of sales and customer account management people who are focused on using the Lineage network to solve customers’ supply chain needs. These utilization initiatives have increased our physical occupancy from 78.0% in 2021 to 79.2% in 2022 and to 80.0% in 2023. |
• | Increasing use of Minimum Storage Guarantees to Improve Economic Occupancy. We plan to expand our use of minimum storage guarantees that pay us minimum or fixed storage fees for pallet positions, whether they are physically occupied or not. We believe that transitioning certain customer contracts from on-demand, as-utilized structures to minimum storage guarantee structures will drive greater consistency of our NOI by increasing revenue predictability and enabling us to better manage our labor force while meeting customers’ needs. This strategy helps maintain our storage revenues during periods of lower inventories—matching ongoing revenue streams with fixed warehousing costs while allowing customers to reserve space to meet their needs. We believe that implementing minimum storage guarantees will continue to boost recurring revenue and enhance stability of cash flows, while allowing customers to plan for periods of increased need by reserving capacity and ultimately enabling a better temperature-controlled warehousing experience for our customers. Our minimum storage guarantee initiatives have increased our economic occupancy from 82.3% in 2021 to 83.2% in 2022 and to 86.0% in 2023. |
19
Table of Contents
• | Commercial Optimization Initiatives. We employ three main types of customer contracts: warehouse agreements, rate letters and tariff sheets. We also earn rent under lease agreements pursuant to which we lease a portion of a warehouse or an entire warehouse. Warehouse agreements and rate letters generally provide us with some flexibility to pass on rate increases to customers during the term of the contract. Warehouse agreements and rate letters often also include mechanisms to adjust rates for inflationary cost increases and customer profile changes, while tariff sheets are short-term in nature and can generally be updated upon 30 days advance notice. We are generally able to translate industry-wide rent increases into storage rate increases to customers, and our various rate adjustment mechanisms generally allow us to pass on both storage and handling rate increases to customers as necessary to account for inflation in operational costs such as wages, power and warehouse supplies as well. Additionally, we have been refining an array of tools to evaluate relative customer profitability to ensure that we are allocating our warehouse space to the customers that value it the most. |
• | Aligning Rates with Cost to Serve. We are deploying technologies such as a third-party contracting and invoicing platform to professionalize our commercial optimization capabilities across our company. We are driving standardization of rates across our warehouse network as well as seeking to implement standardized billing practices to ensure that we are adequately compensated for all services performed. Incremental cost to serve charges capturing previously unbilled services are anticipated to support NOI growth as these initiatives are implemented across our warehouse network. In addition, to deliver the best service and most efficient cost to serve, we seek to closely monitor agreed-upon customer profiles in our contracts and make pricing adjustments as necessary to compensate for variances. |
Same Warehouse Growth: Further implement productivity and cost containment measures to grow same warehouse NOI.
We seek to grow our NOI by reducing our operating expenses with a specific emphasis on two of the largest cost drivers facing the temperature-controlled warehouse industry: labor and energy.
• | Labor Productivity. Labor and benefits represent the largest variable cost of operating a temperature-controlled warehouse. We employ multiple strategies to maximize labor productivity, such as our focus on lean operating principles and our emphasis on team member retention. The implementation of lean operating principles drives operational excellence, which we believe leads to greater productivity and consistency over time resulting in better customer service and better operating results in certified warehouses. We anticipate the implementation of these operating principles will support NOI growth as we significantly expand internal certification in our portfolio from 67 warehouses certified out of 482 total warehouses as of March 31, 2024. We internally certify warehouses based on their progression across six categories—culture, standardized work, visual management, problem solving, just-in-time and quality process. Our focus on labor retention through total rewards, market wage benchmarking, team member onboarding and training leads to increased tenure and reduced turnover, which generally increases productivity, reduces recruiting costs and has knock-on benefits in other areas of the warehouse such as reduced maintenance expense and claims, as well as better customer service. We have extensive experience with many of these tools through various labor market conditions, including the challenging labor market driven by COVID-19. We are seeing evidence that these tools are having a positive impact as the labor market continues to normalize post pandemic. |
• | Energy Efficiency. We seek to maximize energy efficiency in our warehouses through the application of best practices, implementation of the latest technology and generation of alternative sources of energy. Our best practices include energy hedging strategies and a centralized energy and sustainability team that deploys these initiatives across our network to ensure standardization and minimization of energy waste. The technologies we deploy to optimize energy efficiency include variable frequency drives, advanced refrigeration control systems, rapid close doors, motion sensor technology, LED lighting and “flywheeling,” an innovative process that leverages machine learning and artificial |
20
Table of Contents
intelligence to manage energy load based on predictions of power prices based on fluctuations in demand. Our approach to generating alternative sources of energy is primarily through the deployment of onsite solar, onsite battery capacity and onsite generators. Our focus on energy efficiency in our portfolio reduces our operating costs and supports stronger and more predictable NOI margins and growth while also supporting our sustainability initiatives. |
Same Warehouse Growth: Use our integrated platform, scalable corporate infrastructure and business processes to realize synergies from recent acquisitions and drive same warehouse growth post-acquisition.
We have a long history of acquiring and integrating companies into the Lineage platform and expect to continue to drive growth from more recently acquired companies as well as acquisitions in the future. We anticipate driving future growth by leveraging our broad and deep customer relationships, applying our management best practices, driving penetration of our suite of integrated solutions and technology offerings, investing growth capital and generating cost efficiencies through our corporate scale and elimination of redundant overhead expenses.
Since inception, we have demonstrated an ability to drive growth from the integration of acquisitions to capture synergies and fuel greater future earnings potential. We believe we will continue to unlock potential substantial value from acquired companies. Moreover, through 2023, we have achieved an approximately 12% NOI compounded annual growth rate from the temperature-controlled warehousing companies we acquired during the period of 2011 through 2021, excluding additional NOI growth as a result of post-acquisition greenfield and expansion initiatives, demonstrating the positive impact of Lineage’s comprehensive approach to integration and Lineage’s ability to compound capital over a long period of time.
Our rapid pace of inorganic expansion and the need for significant integration resources and the expense related to Core WMS conversions have resulted in substantial growth in general and administrative expenses. As we integrate our many acquired businesses, we are focused on realizing the benefits of scale and operational leverage and believe we have opportunities to further eliminate redundant overhead expenses and reduce expenditures on integration resources over time. Historically, as we have integrated acquired companies, we have also often been able to generate synergies in areas such as procurement, benefits and insurance, where our corporate programs are often more efficient than those of the acquired companies and anticipate continuing to do so in the future.
Same Warehouse Growth: Strategically deploy innovative technologies to provide customers more sophisticated solutions while enhancing profitability.
We view innovative technologies as core to who we are at Lineage and strategic to maintaining our competitive position relative to our peers, driving industry leading margins and growth and providing the best service to our customers. We believe our significant previous investments have allowed us to build a superior technology-enabled platform designed to meet the needs of our customers into the future and anticipate that deploying these technologies will support potential continued growth in our NOI while transforming the experience for our customers with a digitally connected cold chain and enhancing operational excellence inside our warehouses.
• | Transforming the experience for our customers with a digitally connected cold chain. We plan to continue the roll out of proprietary operating systems and third-party platforms focused on providing a superior customer experience and increasing customer loyalty. Our proprietary Lineage Link platform empowers customers to digitally manage their inventories, orders, shipments and transportation appointment scheduling across our warehouse network through a dynamic user interface that significantly improves the customer experience. This tool also replaces antiquated paper and email based processes that lead to faster interactions, fewer errors and a meaningfully lower cost to serve, which should drive potential incremental NOI. As of March 31, 2024, Lineage Link has been rolled out |
21
Table of Contents
across approximately 63% of our network as measured by global warehousing segment revenues for the twelve months ended March 31, 2024. We believe the continued roll out of this tool and continued product enhancement will yield attractive future benefits. |
• | Enhancing operational excellence inside our warehouses. We seek to integrate our network onto our common technology systems to standardize operations and increase productivity. We have already largely integrated all of our facilities into our human capital and financial ERP software and our proprietary metricsOne operating KPI dashboard. We are working to increase the number of our warehouses that utilize one of our four Core WMS systems. As of March 31, 2024, approximately 69% of our global warehousing segment revenue for the twelve months ended March 31, 2024 flowed through one of our four Core WMS, excluding facilities leased to customers and managed facilities. We are in the process of growing this percentage across our network. We expect increased penetration of our four Core WMS throughout our network to drive operational productivity, reduce general and administrative expenses and accelerate our ability to deploy digital technology solutions network-wide. We believe that the development and subsequent deployment of LinOS and a third-party contracting and invoicing platform will make our operations more efficient and potentially generate NOI growth once fully integrated. |
Additionally, our general and administrative spend currently includes substantial growth and technology investments, which we refer to as transformational technology G&A, such as the development and subsequent deployment of our technology operating systems. Once fully integrated, we believe we will benefit from operating leverage as these new investments are spread across our growing portfolio.
Same Warehouse Growth: Transform the industry through our data science driven approach to warehouse control and design.
Our productivity and process automation initiatives are supported by our in-house data science team, which is comprised of 50 applied science and product professionals that provide data-driven business intelligence and innovations to maximize operational efficiencies, revenues, profitability, energy efficiency and cash flows. Our innovations have yielded 96 patents issued and 151 patents pending as of March 31, 2024, in such areas as facility design, methods and mechanisms for operating facilities, refrigeration and thermodynamic designs and cold-rated instrumentation. These innovations offer numerous ways to potentially grow our NOI, including through optimization of our conventional racking systems, algorithms that better allocate tasks in the warehouse and improvements in electricity consumption for blast freezing. We believe that many of these innovations have now been successfully piloted and can be rolled out to other similar use cases.
Accretive Capital Deployment
Accretive Capital Deployment: Invest in potentially accretive projects across our existing facilities to enhance same warehouse growth.
We continually evaluate opportunities to drive organic growth within our existing facilities through accretive capital deployment into high economic return on capital opportunities, such as re-racking projects to increase pallet capacity, installation of opportunity chargers, solar projects to improve energy efficiency and the addition of blast cell capacity. In addition to potentially generating incremental revenues and NOI, return-on-capital projects are intended to enhance our facilities’ ability to best serve our customers’ needs with the most advanced and customized solutions available. Many of these projects are supported by our applied science, energy management and product professionals that provide data-driven business intelligence and innovations to maximize operational efficiencies, revenues, profitability, energy efficiency and cash flows. Since 2019, our team has supported more than 375 economic return on capital projects within our warehouses to enhance organic growth.
Accretive Capital Deployment: Execute on our greenfield and existing facility expansion initiatives.
Because of our reputation for delivering innovative new development projects and the benefits of participating in our industry-leading warehouse network, customers often choose to partner with us for their
22
Table of Contents
largest and most important projects. In addition, we have spent considerable time and investment establishing an in-house warehouse network optimization team comprised of warehouse design, automation and construction experts. We expect our development expertise will continue to support our growth as we potentially realize the returns on our recently completed greenfield and expansion projects and deliver on our industry-leading pipeline of greenfield development and expansion opportunities.
• | Recently Completed Greenfield and Expansion Projects. Since March 31, 2021 through March 31, 2024, we completed 25 greenfield and expansion projects totaling approximately $922 million in costs. |
Recently Completed Projects | Square Feet (in millions) | Cubic Feet (in millions) | Pallet Positions (in thousands) | Total Cost (in millions)(1) | Twelve Months Ended March 31, 2024 Revenue Less Operating Expenses (in millions) | Weighted Average Targeted NOI Yield | ||||||||||||||||||
25 | 3.3 | 179 | 571 | $ | 922 | $ | 47 | | 9%-12% |
(1) | Includes approximately $7 million of remaining spend. |
No assurance can be given that our weighted average targeted NOI yield range will be achieved. For additional information regarding the calculation methodology and assumptions relating to our weighted average targeted NOI yield range for greenfield and expansion projects, please see “Business and Properties—Our Growth Strategy—Accretive Capital Deployment: Execute on our greenfield and existing facility expansion initiatives.”
• | Industry-Leading Pipeline of Greenfield and Expansion Opportunities. |
• | Under Construction Pipeline. As of March 31, 2024, we had eight greenfield development and expansion projects under construction. |
Under Construction Projects | Estimated Square Feet (in millions) | Estimated Cubic Feet (in millions) | Estimated Pallet Positions (in thousands) | Estimated Total Cost (in millions) | Remaining Spend (in millions) | Twelve Months Ended March 31, 2024 Revenue Less Operating Expenses (in millions) | Weighted Average Target NOI Yield | |||||||||||||||||||||
8 | 1.2 | 70.3 | 235 | $ | 578 | $ | 310 | ($ | 4 | ) | 9% -11 | % |
No assurance can be given that we will complete any of these projects on the terms currently contemplated, or at all, that the actual cost or completion dates of any of these projects will not exceed our estimates or that the targeted NOI yield range of these projects will be consistent with our current projects.
We believe we have industry-leading automation capabilities, including 24 fully automated facilities totaling 386 million cubic feet and 57 semi-automated facilities totaling 361 million cubic feet as of March 31, 2024, which we believe is the most of any temperature-controlled warehousing provider in the world. Our proprietary technology and unique approach to automation enables us to provide customers with truly customizable solutions to address their warehouse needs. For many years, we have been building our own in-house team of automation and software integration experts. All of our development projects are designed in-house based on actual customer data and profiles. Unique to our industry, we have developed proprietary automation control software that helps us optimize our automated warehouse operations. For new developments, because we own our own software, we can select the best hardware regardless of manufacturer, to build what we believe are the most cost-effective and most advanced automated warehouses in our industry. We intend to continue our leadership in temperature-controlled warehouse automation through development of next-generation automated warehouses as part of our pipeline. We anticipate approximately 58% of the total added
23
Table of Contents
pallet positions of our facilities under construction as of March 31, 2024 will be fully automated. Automated facilities generally produce a lower cost to serve and lower resource consumption, presenting an attractive solution to our customers and positioning us well to win new business and grow our cash flows from operations.
• | Future Long-Term Pipeline. As of March 31, 2024, we owned approximately 1,227 acres of undeveloped land or “Land Bank” in addition to the owned land included in our under-construction pipeline. Our Land Bank has the potential to support future greenfield development and expansion opportunities, with an estimated cost to replace as of March 31, 2024 of approximately $462 million based on broker inquiries, comparable land sales and our internal estimates. As of March 31, 2024, we were researching or underwriting a range of greenfield development and expansion opportunities as part of our future long-term pipeline, including 16 projects globally at various phases of research and underwriting. The projects in our future long-term pipeline include both projects where we already own the land and projects for which we will need to acquire incremental land. We currently expect that the targeted weighted average NOI yield range of these projects will be generally consistent with our recent projects. |
Estimated Land (in acres) | Estimated Square Feet (in millions)(1) | Estimated Cubic Feet (in millions)(1) | Estimated Pallet Positions (in millions)(1) | Estimated Cost to Replace (in millions)(2) | ||||||||||||
1,227 | 17.7 | 728 | 2.4 | $462 | ||||||||||||
Greenfield | Estimated Square Feet (in millions)(3) | Estimated Cubic Feet (in millions)(3) | Estimated Pallet Positions (in thousands)(3) | Estimated Construction Cost (in millions)(2) | ||||||||||||
16 | 4.1 | 246 | 748 | $1,850 |
(1) | Square feet, cubic feet and pallet positions reflect potential capacity undeveloped land can support through future greenfield development and expansion based on typical warehouse designs. |
(2) | Estimated cost to replace is based on broker inquiries, comparable land sales and our internal estimates as of March 31, 2024. |
(3) | Square feet, cubic feet and pallet positions reflect potential capacity of greenfield development and expansion opportunities based on current research and underwriting. |
We have not commenced construction on any potential projects in our long-term pipeline, the completion of which is subject to various factors, including budgeting, diligence, internal and third-party approvals and other factors. No assurance can be given that we will pursue or complete any of these projects on the terms currently contemplated, or at all, that the actual cost or completion dates of any of these projects will not exceed our estimates or that the targeted NOI yield range of these projects will be consistent with our current projects.
Accretive Capital Deployment: Capitalize on strategically attractive and financially accretive acquisition opportunities.
The temperature-controlled warehousing sector remains highly fragmented and is generally comprised of many family-owned and independent companies that may lack the capital, technology, customer relationships, development expertise, technical knowledge and management sophistication that we possess. For example, we estimate based on GCCA data that over 100 temperature-controlled warehousing companies operate in the U.S. market alone and that there are approximately 4.4 billion cubic feet available for growth in North America. We believe that there remain substantial whitespace opportunities in geographies such as Europe, Asia, the Middle East and Africa and that there are approximately 22.4 billion cubic feet available for growth globally. As a result, we see significant potential opportunity in continuing to execute on our proven acquisition strategy, which targets profitable businesses with strategic, high-quality assets that complement our warehouse network and customers’
24
Table of Contents
needs. In addition to operating businesses, there also remain real estate opportunities to acquire triple-net-leased facilities and execute sale-leaseback transactions with customers and other cold storage operators.
Industry Estimate of North America and Global Market Size
(1) | 2024 GCCA Global Top 25 List (April 2024) and 2024 GCCA North America Top 25 List (April 2024), except Lineage figures, which are based on company data as of March 31, 2024. Global market share is based on total global capacity from 2020 GCCA Global Cold Storage Capacity Report (August 2020). |
(2) | Represents total cubic feet for the market excluding Lineage. |
• | Status as an Acquiror of Choice Supports Robust Acquisition Opportunities. We believe we are an acquiror of choice in the industry, as demonstrated by our long history of executing strategic acquisitions through direct sourcing and long-term relationships with their owners. We have extensive experience acquiring cold chain companies of all sizes, and to date former owners of acquired companies have rolled approximately $664 million of equity to become investors in Lineage, while hundreds of members of management of acquired companies have stayed on and grown with our company over time. Over the course of our extensive acquisition history, we have successfully leveraged existing relationships and direct sourcing channels for nearly two-thirds of the companies we have acquired, with the remainder coming to fruition through successful bidding in advisor-led sale processes. In addition, we believe we enjoy multiple advantages when participating in sale processes, including our prolific transaction experience and track record of quickly closing transactions and our flexible balance sheet. |
• | Multiple Levers to Drive Value Creation Post Acquisitions. As described above in our other internal and external growth strategies, we can drive value creation through multiple levers, including revenue growth, cost efficiencies, deployment of capital and implementation of technology. Our proprietary integration playbook includes over 500 steps to completion and has been refined throughout the last decade to develop a consistent and successful gameplan for acquisition integration. As acquisitions are incorporated into the Lineage network, the opportunity set for deploying these strategies grows. We have a standardized and disciplined approach to integrating acquired companies while bringing acquired team members into the Lineage family. Through this approach and an open mindset to learn and adopt best practices of newly acquired business, we can seek to capitalize on growth opportunities beyond the acquisition date. |
25
Table of Contents
Preliminary Estimates for the Quarter Ended June 30, 2024
Based on our preliminary estimates as of the date of this prospectus, management preliminarily expects to report for the quarter ended June 30, 3024:
• | total revenue between $1,324 million and $1,337 million, or a decrease of 1.6% to 0.7% compared to the same period in 2023, with Global Warehousing segment revenue between $956 million and $965 million, or a decrease of 0.8% to flat compared to the same period in 2023, and Global Integrated Solutions segment revenue between $368 million and $372 million, or a decrease of 3.7% to 2.6% compared to the same period in 2023; |
• | NOI between $441 and $446 million, or flat to an increase of 1.1% compared to the same period in 2023; |
• | same warehouse NOI reflecting a decrease between 2.0% and 2.5% compared to an increase of 19.0% in the same period in 2023; |
• | Adjusted EBITDA between $327 million and $333 million, or an increase of 1.2% to 3.1% compared to the same period in 2023; |
• | average physical occupancy of approximately 76.7%, or a decrease of approximately 310bps compared to the same period in 2023; |
• | average economic occupancy of approximately 83.1%, or a decrease of approximately 200 bps compared to the same period in 2023; and |
• | throughput pallets (in thousands) of approximately 13,177, or an increase of approximately 2.8% compared to the same period in 2023. |
NOI and Adjusted EBITDA are non-GAAP financial measures. For definitions of NOI and Adjusted EBITDA and a statement of why our management believes the presentation of these metrics provides useful information to investors and any additional purposes for which management uses these metrics, see “Summary Selected Historical and Pro Forma Condensed Consolidated Financial and Other Data—Non-GAAP Financial Measures” below. Preliminary estimates of net income (loss) for the quarter ended June 30, 2024 are not available at this time due to the lack of availability of certain financial information, such as preliminary estimates of certain adjustments (including income tax expense and non-consolidated entity results) that are necessary to provide preliminary estimates of net income (loss). Accordingly, quantitative reconciliations of our preliminary estimates of NOI and Adjusted EBITDA to net income (loss) are not available without unreasonable efforts. We are therefore unable to address the probable significance of the unavailable information.
These preliminary estimates regarding our company and our portfolio for the quarter ended June 30, 2024 are subject to change upon completion of our financial statements for the quarter ended June 30, 2024, including all disclosures required by GAAP, and any such change could be material. There can be no assurance that the range of our preliminary estimates of total revenue, NOI, same warehouse NOI, and Adjusted EBITDA for the quarter ended June 30, 2024 or our preliminary estimates of average physical occupancy, average economic occupancy and throughput pallets for the quarter ended June 30, 2024 are indicative of what our results are likely to be for the quarter ended June 30, 2024 or in future periods as a result of the completion of our financial closing procedures, final adjustments and other developments arising between now and the time that our financial results for the quarter ended and as of June 30, 2024 are finalized. The preliminary estimates included in this prospectus have been prepared by, and are the responsibility of, our management. Our independent registered public accounting firm, KPMG LLP, has not audited, reviewed, compiled, or applied agreed-upon procedures with respect to these preliminary estimates. Accordingly, our independent registered public accounting firm does not express an opinion or any other form of assurance with respect thereto.
Our consolidated financial statements and related notes as of and for the quarter ended June 30, 2024 are not expected to be filed with the SEC until after this offering is completed. Our actual results may differ materially from the preliminary estimates for the quarter ended June 30, 2024 set forth herein. Accordingly, you should not place undue reliance on these preliminary estimates. These preliminary estimates should not be viewed as a substitute for
26
Table of Contents
full interim financial statements prepared in accordance with GAAP. In addition, these preliminary estimates for the quarter ended June 30, 2024 are not necessarily indicative of the results to be achieved in any future period.
Industry Overview
Under “Industry Overview,” we have included a report prepared by CBRE. Except for information pertaining to our company, the following is a summary of that report.
Introduction
“Cold storage” refers to temperature-controlled warehouses that enable secure storage and handling of goods that require (or benefit from) refrigeration or freezing, most notably food products. Cold storage properties make up a small but high-growth subset of overall industrial real estate and are a critical component of the global food supply chain. Cold storage real estate and related operations are increasingly valuable as the global population continues to become larger and more urban. Today, global cold storage capacity is estimated to be approximately 25-30 billion cubic feet, and market researchers broadly expect growth in both capacity and revenue generation as demand continues to increase.
Operating Models
The industry is broadly categorized into two operating models: third-party (i.e., public) and private. Over the past 30 years, it is estimated that about 75% of total U.S. freezer/cooler capacity has been operated by third-party providers. Food manufacturers are the primary customers of third-party operated space, whereas retailers, grocers, and distributors utilize the bulk of private cold storage capacity. Given the costs and complexity of cold storage, outsourcing has risen in recent years.
U.S. Cold Storage Customer Types by Operating Model
Source: | CBRE Valuation and Advisory (private capacity), Lineage and Americold filings (public warehousing revenue). Private capacity reflects customer shares of privately-operated cold storage space (in cubic feet) based on 73 U.S. market studies as of October 2023. Public warehousing revenue reflects the average customer shares in 2023 financials for Lineage and Americold (who together account for more than 50% of total North American cold storage capacity). |
Operating Conditions
Rental fees for storage space make up the primary revenue stream for most cold storage facilities, with customers paying either variable rates for space as it is needed or fixed rates for a set amount of space committed over a longer period. Most cold storage facilities also offer additional warehousing services, such as case-picking and product handling, to maximize the yield of their footprint.
Operating costs are typically higher for cold storage facilities relative to dry warehouses, primarily due to labor (e.g., more training and safety requirements, specialized clothing and equipment, etc.) and utilities.
27
Table of Contents
Given the significant cost and efficiency advantages for newer, more technologically advanced cold storage facilities, demand has waned for older facilities. CBRE estimates that the average age of U.S. cold storage facilities is 28 years, and the GCCA estimates as of 2021 that only about 5% cold storage operations were automated. As inventory becomes increasingly obsolete, owners and operators of modern facilities will be at a significant advantage in offering lower costs and faster service to customers.
U.S. Cold Storage and Dry Warehouse Average Age Benchmarking
Source: | Lineage, CoStar Group and CBRE Valuation and Advisory. Ages (other than Lineage) based on 73 U.S. market studies as of October 2023. Ages estimated as of December 31, 2023. Refer to detailed note on methodology under “Industry Overview” section. |
To lower operational costs, increase storage capacity, and enhance customer service levels, development and implementation of new technologies has risen in recent years among cold storage industry leaders. There are four areas in which technological advances are having the most pronounced impact on the industry: automation, software development and deployment, energy usage and data science. Innovations in these areas are also highly interrelated. As modern supply chain management continues to become more complex, we believe that operators that can offer customers a combination of physical and digital infrastructure will be most competitive. Given the significant investments required to develop and implement new technologies at scale, as well as the critical role of insights gleaned through analysis of large sets of warehouse operations data, the largest operators may be best positioned to capitalize on this opportunity.
Market Size and Competitive Landscape
In 2020, the GCCA estimated that the cold storage market is 5.5 billion cubic feet in the U.S. and 25 billion cubic feet globally. CBRE estimates that the U.S. cold storage market today is likely closer to 7 billion cubic feet, implying current global capacity of approximately 30 billion cubic feet.
The competitive landscape of the cold storage industry varies by location, but the general trend is for significant amounts of space to be consolidated among a few key companies with the rest of the market highly fragmented across many local and regional players. Globally, the top ten temperature-controlled warehousing operators represent only 23.5% of the public temperature-controlled warehousing cubic feet capacity.
28
Table of Contents
Consolidation in the cold storage industry reflects the significant advantages from economies of scale due to increased brand recognition, breadth and depth of industry relationships, greater access to and lower cost of capital, and more extensive property networks. Consolidation is likely to continue, particularly as the competitive advantages for operators leveraging modern technology and data science become more pronounced.
Barriers to Entry
The increased complexity and additional materials and equipment required to build a cold storage warehouse typically lead to construction costs that are 2-4 times higher than an otherwise similar dry warehouse. These substantial cost constraints limit new development, making the cold storage market generally less vulnerable to supply-side risk than conventional dry warehouses.
In addition to high and increasing construction costs, new developers often must lease their space directly to food manufacturers or local distributors, which reduces the available tenant pool. This can prove challenging, since most food manufacturers prefer to outsource their temperature-controlled warehousing needs rather than operate themselves. Developers that want to operate their properties must be prepared to contend with large competitors in securing and retaining customers and skilled labor.
Growth Drivers
The U.S. temperature-controlled warehousing industry has experienced relatively stable revenue growth, even in periods marked by significant turmoil in the global financial markets, commodity shocks, secular shifts in consumer habits and preferences, the global COVID-19 pandemic and the ensuing supply chain disruption and periods of significant global inflation.
The primary drivers of growth in the cold storage industry are how much food is consumed overall and what kinds of food consumers prefer. Between 2023 and 2030, the global population is projected to increase by nearly 500 million people, average household incomes are projected to rise by 10%, and inflation-adjusted consumer spending on food to rise by 15%, according to Oxford Economics.
Urbanization is also a major catalyst for cold storage growth. As populations urbanize, they are much more likely to consume food produced outside of their immediate area and to utilize grocery stores, markets and restaurants that rely on cold storage networks. UNDESA expects the percent of the global population that is urbanized to reach 68% by 2050, up from 56% in 2020.
The most significant opportunity for industry growth in the coming years is within developing economies. Nearly all these countries currently have less than three cubic feet of cold storage space per urban resident, compared to ratios in developed economies that are roughly 5-10 times higher.
In advanced economies, growth in cold storage demand will be fueled more by ongoing trends in consumer preferences (e.g., shifting more spending to fresh and frozen foods), online grocery adoption and the replacement of obsolete and energy-inefficient infrastructure.
Real Estate Performance
Post-pandemic inflows of institutional capital and steep rent gains led to a wave of speculative projects in recent years, which have historically been very rare in this sector given the unique development challenges. Despite record construction activity, the U.S. construction pipeline represents a relatively modest 3.9% of existing stock in 2023 and 3.5% in 2024 (as measured in square feet), which is similar to the expected annual pace of demand
29
Table of Contents
growth. After 2024, new deliveries are expected to slow substantially to 1.8% in 2025 as fewer projects have broken ground in the last two years, due in large part to higher construction costs, interest rates, financing challenges and some softening in occupancy.
On average, cap rates for refrigerated warehouses have been similar to dry warehouses, with significant compression over the prior decade. The average U.S. cap rate fell by nearly a full percentage point from the start of 2020 to the end of 2021 and remained 20-40 bps lower than the dry warehouse average during this period, based on data from Real Capital Analytics.
As investment volume slowed and the number of high-quality assets listed for sale increasingly dwindled, cap rates for refrigerated warehouses have risen but remain in line with pre-pandemic norms from 2018 to 2019. For cold storage, location factors are a major determinant of asset values. In general, cold storage cap rates are lowest for distribution facilities, particularly those located in or near ports and major population centers. General public refrigerated warehouses and production-advantaged warehouses generally have higher cap rates, with cap rates for individual assets varying based on location, tenant quality and other factors.
U.S. Average Cap Rate By Warehouse Type
Source: MSCI/Real Capital Analytics, Q3 2023 refrigerated warehouse cap rate is interpolated due to limited transaction activity.
Summary Risk Factors
You should carefully consider the matters discussed in the “Risk Factors” section beginning on page 55 of this prospectus for factors you should consider before investing in our common stock. Some of these risks include:
• | Our investments are concentrated in the temperature-controlled warehouse industry, and our business would be materially and adversely affected by an economic downturn in that industry or the market for our customers’ products. |
• | The temperature-controlled warehouses that comprise our global warehousing business are concentrated in certain geographic areas, some of which are particularly susceptible to adverse local conditions. Our inability to quickly and effectively restore operations following adverse weather or a localized disaster or economic or other disturbance in a key geography could materially and adversely affect us. |
• | Global market and economic conditions may materially and adversely affect us. |
30
Table of Contents
• | Many of our costs, such as operating expenses, interest expense and real estate acquisition and construction costs, could be adversely impacted by periods of heightened inflation. |
• | Labor shortages, increased turnover and work stoppages have in the past and may in the future continue to disrupt our or our customers’ operations, increase costs and negatively impact our profitability. |
• | Supply chain disruptions may continue to negatively impact our business. |
• | We are exposed to risks associated with expansion and development, which could result in returns below expectations and unforeseen costs and liabilities. |
• | Our integrated solutions business depends on the performance of our global warehousing business. |
• | Our growth may strain our management and resources, which may have a material adverse effect on us. |
• | A portion of our future growth depends upon acquisitions and we may be unable to identify, complete and successfully integrate acquisitions, which may impede our growth, and our future acquisitions may not achieve their intended benefits or may disrupt our plans and operations. |
• | We are dependent on Bay Grove to provide certain services to us pursuant to the transition services agreement, and it may be difficult to replace the services provided under such agreement. |
• | We may be vulnerable to security breaches or cyber-attacks which could disrupt our operations and have a material adverse effect on our financial condition and operating results. |
• | We depend on IT systems to operate our business, and issues with maintaining, upgrading or implementing these systems, could have a material adverse effect on our business. |
• | We are subject to additional risks with respect to our current and potential international operations and properties. |
• | Power costs may increase or be subject to volatility, which could result in increased costs that we may be unable to recover. |
• | We depend on key personnel and specialty personnel, and a deterioration of employee relations could harm our business and operating and financial results. |
• | Upon the listing of our shares on Nasdaq, we will be a “controlled company” within the meaning of Nasdaq rules and, as a result, will qualify for, and may rely on, exemptions from certain corporate governance requirements. You will not have the same protections afforded to stockholders of companies that are subject to such requirements. |
• | We could incur significant costs under environmental laws relating to the presence and management of asbestos, anhydrous ammonia and other chemicals and underground storage tanks. |
• | We are currently invested in various joint ventures and may invest in additional joint ventures in the future and face risks stemming from our partial ownership interests in such properties, which could materially and adversely affect the value of any such joint venture investments. |
• | We have significant indebtedness outstanding, which may expose us to the risk of default under our debt obligations. |
• | Increases in interest rates could increase the amount of our debt payments. |
• | Market conditions could adversely affect our ability to refinance existing indebtedness or obtain additional financing for growth on acceptable terms or at all, which could materially and adversely affect us. |
• | Our Co-Founders will have substantial influence over our business, and our Co-Founders’ interests, and the interests of certain members of our management, will differ from our interests and those of our other stockholders in certain respects. |
31
Table of Contents
• | Our charter and bylaws contain provisions that may delay, defer or prevent an acquisition of our common stock or a change in control. |
• | There can be no assurance that we will be able to make or maintain cash distributions, and certain agreements relating to our indebtedness may, under certain circumstances, limit or eliminate our ability to make distributions to our common stockholders. |
• | Future contractual repurchase obligations may materially and adversely affect the market price of shares of our common stock and may reduce future distributions. |
• | Failure to qualify as a REIT would cause us to be taxed as a regular C corporation, which would substantially reduce funds available for distributions to stockholders. |
Structure and Formation of Our Company
Our Operating Partnership
Following the completion of this offering and the formation transactions, we will be the general partner of our operating partnership. Substantially all of our assets will be held by, and our operations will be conducted through, our operating partnership, either directly or through its subsidiaries. Our interest in our operating partnership will generally entitle us to share in cash distributions from, and in the profits and losses of, our operating partnership in proportion to our percentage ownership. Through our general partner interest in our operating partnership, we will generally have the exclusive power under the partnership agreement to manage and conduct its business and affairs, subject to certain approval and voting rights of the limited partners, which are described more fully below in “Description of the Partnership Agreement of Lineage OP, LP.”
Beginning on and after the date that is 14 months after the issuance of the OP units to a partner in our operating partnership, such partner will have the right to require our operating partnership to redeem some or all of its OP units (excluding any Legacy OP Units) for cash, based upon the value of an equivalent number of shares of our common stock at the time of the redemption, or, at our election, shares of our common stock on a one-for-one basis, subject to certain adjustments and the restrictions on ownership and transfer of our stock set forth in our charter and described under the section entitled “Description of Our Capital Stock—Restrictions on Ownership and Transfer.” Except for the one-time special redemption and top-up rights with respect to Legacy Class A-4 OP Units described elsewhere in this prospectus, Legacy OP Units do not have any redemption rights prior to being reclassified as OP units, but once a Legacy OP Unit has been so reclassified (assuming it is not otherwise in the process of Cash Settlement), it will have the same redemption rights as the other OP units but will not be subject to the 14-month waiting period. Such redemption of OP units will increase our percentage ownership interest in our operating partnership and our share of its cash distributions and profits and losses.
Over the course of the first three years following the initial closing of this offering, all of the Legacy OP Units will ultimately be reclassified into OP units. Reclassification will be on a one-for-one basis, with each Legacy OP Unit becoming a single OP unit upon its reclassification. Following any such reclassification, Legacy OP Unit holders will thereafter hold such OP units for such period of time as they determine or receive cash pursuant to a sale of their OP units to us in connection with the reclassification event (or a combination thereof). These reclassifications, and any related sales to us of the OP units, will occur at such times as directed by the LHR, acting on behalf of the Legacy OP Unit holders. The LHR will be an affiliate of our current majority stockholder, BGLH. BGLH will have the right to require us to conduct offerings of shares of our common stock from time to time to fund our purchases of such OP units. Each purchase of OP units will increase our percentage ownership interest in our operating partnership and our share of its cash distributions and profits and losses. See “Description of the Partnership Agreement of Lineage OP, LP.”
32
Table of Contents
Formation Transactions
Prior to or simultaneously with the completion of this offering, we will engage in formation transactions, which are designed to facilitate this offering. Through the formation transactions, the following have occurred or will occur prior to or concurrently with the completion of this offering.
• | Operating Partnership Conversion and Reclassification of Units. Lineage OP, LLC will convert from a Delaware limited liability company to a Maryland limited partnership, change its name to Lineage OP, LP and adopt the Agreement of Limited Partnership pursuant to which, among other things: |
(i) | We will become Lineage OP, LP’s sole general partner. |
(ii) | All operating partnership units that are owned by our company—all of which are currently classified as Lineage OP Class A units—will be reclassified into OP units. |
(iii) | All operating partnership units that are not owned by our company—all of which are currently classified as Lineage OP Class A units, Lineage OP Class B units or Lineage OP Class C units—will be reclassified into Legacy OP Units with various subclasses, each of which will have certain terms that differ from OP units in order to continue pre-existing rights of Lineage OP, LLC’s members for a period of up to three years following the initial closing of this offering, as described below. This also allows a coordinated settlement process to be conducted for our legacy equity holders as described below. |
(A) | Legacy Class A OP Units. |
• | Prior to the offering, each Lineage OP Class A unit that is not owned by our company is paired with a corresponding Lineage OP Class C unit interest that is entitled to a share of the profits in respect of that Lineage OP Class A unit. These Lineage OP Class A units are owned by various legacy investors that pre-exist this offering, and the Lineage OP Class C unit interest in respect of each Lineage OP Class A unit is owned by BG Cold in order to provide BG Cold with profit sharing on the success of each Lineage OP Class A unit. We refer to this profit sharing as the Founders Equity Share, and this profit sharing applies solely to legacy equity that pre-exists this offering. |
• | Through the formation transactions, each pre-existing Lineage OP Class A unit that is not owned by our company, and the corresponding pre-existing Lineage OP Class C unit interest that is paired with such Lineage OP Class A unit, will be reclassified together into a single Legacy Class A OP Unit with two legally separate sub-units that comprise such single Legacy Class A OP Unit. The single Legacy Class A OP Unit into which they are reclassified, and its sub-unit components, are new classifications that will be created as part of the formation transactions when Lineage OP, LLC converts into the limited partnership that serves as our operating partnership. |
• | The two sub-units that comprise a single Legacy Class A OP Unit are legally separate interests referred to as the “A-Piece Sub-Unit” and the “C-Piece Sub-Unit.” The A-Piece Sub-Units and the C-Piece Sub-Units each retain the economic characteristics of the former Lineage OP Class A units and Lineage OP Class C units, respectively. The A-Piece Sub-Units and C-Piece Sub-Units will continue a historic calculation applicable solely to our legacy investors that determines how the holders of the A-Piece Sub-Units and the holders of the C-Piece Sub-Units will share in the settlement of Legacy Class A OP Units when they are ultimately reclassified into OP units. This enables BG Cold to continue accruing the Founders Equity Share in order to align the economic interests of our Co-Founders with the performance of our shares and OP units when our legacy investors settle their pre-existing equity and have the option to achieve liquidity. |
33
Table of Contents
• | Each Legacy Class A OP Unit will be designated to one of four sub-class demarcations: Legacy Class A-1, Legacy Class A-2, Legacy Class A-3 or Legacy Class A-4, which provide for different calculations as between the sub-unit holders within a given Legacy Class A OP Unit to determine what share of a Legacy Class A OP Unit belongs to the A-Piece Sub-Unit holder and what share belongs to the C-Piece Sub-Unit holder. |
• | Except as set forth in the following sentence, each Legacy Class A OP Unit regardless of sub-class will be economically equivalent to one OP unit, meaning that one Legacy Class A OP Unit will have the same value and represent the same share of equity in our operating partnership as an OP unit. The Legacy Class A-4 OP Units may be an exception to this because they have a special one-time redemption right that the holders of such units may exercise during a 45-day window beginning on March 1, 2025 at a guaranteed minimum value that may exceed the value of an OP unit. This special redemption right allows the holders of Legacy Class A-4 OP Units to (1) redeem any or all of the Legacy Class A-4 OP Units at a guaranteed minimum price ranging between $106.59 and $113.25 per unit depending on our share price at that time (less certain distributions received after June 26, 2024) or, if greater, the then-current fair market value of the Legacy Class A-4 OP Units to be redeemed or (2) during the same window, receive a one-time true-up paid in cash or through the issuance of new Legacy Class A-4 OP Units or new OP units (or any combination of cash and units) in the amount by which the guaranteed minimum value of $106.59 per unit (less certain distributions received after June 26, 2024) exceeds the then-current fair market value of the Legacy Class A-4 OP Units (if at all). Legacy Class A-4 OP Units can also be reclassified into an equal number of OP units at any time as may be agreed by the holders of Legacy Class A-4 OP Units and the LHR, or under certain other circumstances at the discretion of the LHR acting as representative of such holders. Immediately following the formation transactions, there will be 319,006 outstanding Legacy Class A-4 OP Units. |
• | Each Legacy Class A OP Unit will have the same voting rights and voting power as an OP unit. The LHR will be appointed by each holder of Legacy Class A OP Units to exercise the voting power for all Legacy Class A OP Units until they are reclassified into OP units. |
• | Legacy Class A OP Units can be reclassified into an equal number of OP units at any time at the discretion of the LHR, acting as representative of the holders of Legacy Class A OP Units, and all such units will from time to time between the initial closing of this offering and the third anniversary of the initial closing of this offering be so reclassified. Whenever Legacy Class A OP Units are reclassified into OP units, the holders of A-Piece Sub-Units and the holders of C-Piece Sub-Units will each separately receive their respective shares of the OP units into which the Legacy Class A OP Units are reclassified, according to formulas that fix their respective sharing in such reclassified OP units. The total number of OP units will nevertheless remain constant with the number of Legacy Class A OP Units that have been so reclassified, except as described above for up to 319,006 Legacy Class A-4 OP Units. |
(B) | Legacy Class B OP Units. |
• | Prior to the offering, all Lineage OP Class B units are owned by various legacy investors that pre-exist this offering, and such units do not bear any Founders Equity Share. |
• | Through the formation transactions, each pre-existing Lineage OP Class B unit will be reclassified into a Legacy Class B OP Unit. Legacy Class B OP Units will not be subject |
34
Table of Contents
to any Founders Equity Share and will not have any separate A-Piece Sub-Units or C-Piece Sub-Units. |
• | The Legacy Class B OP Units retain the economic characteristics of the former Lineage OP Class B units. |
• | Each Legacy Class B OP Unit will be economically equivalent to one OP unit, meaning that one Legacy Class B OP Unit will have the same value and represent the same share of equity in our operating partnership as an OP unit. |
• | Each Legacy Class B OP Unit will have the same voting rights and voting power as an OP unit. The LHR will be appointed by each holder of Legacy Class B OP Units to exercise the voting power for all Legacy Class B OP Units until they are reclassified into OP units. |
• | Legacy Class B OP Units can be reclassified into an equal number of OP units at any time at the discretion of the LHR, acting as representative of the holders of Legacy Class B OP Units, and all such units will from time to time between the initial closing of this offering and the third anniversary of the initial closing of this offering be so reclassified. |
(iv) | The LHR will be appointed by each holder of Legacy OP Units as its representative (A) to administer on its behalf a coordinated settlement process for all legacy equity as described in the next paragraph (clause (v)) below and (B) to exercise the voting rights attributable to Legacy OP Units on various matters for so long as Legacy OP Units exist and have not been reclassified into OP units. |
(v) | BGLH, on its own behalf, and the LHR (an affiliate of BGLH) on behalf of the holders of Legacy OP Units, will administer a coordinated settlement process for the settlement of all legacy BGLH equity and all legacy operating partnership equity in cash, in our shares, in OP units or any combination of the foregoing, as elected by each of our legacy investors, over a period of up to three years following the first closing of our offering. By the end of this up-to-three-year period, BGLH will no longer be our controlling stockholder and the Legacy OP Units will no longer exist. At some point after this coordinated liquidity and settlement period is complete, BGLH intends to dissolve, liquidate and terminate its existence, as all legacy investors will either be direct holders in the company or our operating partnership, or they will have disposed of their shares and OP units. |
• | Historic Management Incentive Equity. Prior to this offering, certain of our current and former officers and employees hold LMEP Units through two incentive equity pooling entities, LLH MGMT Profits, LLC and LLH MGMT Profits II, LLC, which each hold corresponding historic accrued management incentive equity interests in Lineage Holdings for the benefit of these officers and employees. As part of the formation transactions, we will have purchased in exchange for 80,950 shares of our common stock the vested awards of LMEP Units valued at less than $3.0 million per individual that are held by certain of our officers and employees who are not named executive officers. After such purchase, each of LLH MGMT Profits, LLC and LLH MGMT Profits II, LLC will contribute its vested management incentive equity interests in Lineage Holdings to our operating partnership in exchange for 2,204,162 Legacy Class B OP Units. This results in the vested LMEP Units not purchased by us becoming a fixed number of Legacy Class B OP Units prior to such time as the LMEP Units would otherwise be paid pursuant to their rights under the terms of the existing awards. Following the contribution, each of LLH MGMT Profits, LLC and LLH MGMT Profits II, LLC will distribute the Legacy Class B OP Units to its members, including certain of our officers and employees whose LMEP Units are not purchased in exchange for shares of our common stock, in complete liquidation of each such entity. Following such distribution, officers, employees and others to whom such Legacy Class B OP Units are distributed will generally continue to hold such Legacy Class B OP Units subject to settlement over a period of up to three years as part of the same settlement process that applies to all of our legacy investor equity. All outstanding LMEP Units that remain unvested as of the date of such contribution and distribution will |
35
Table of Contents
automatically terminate at such time and will be replaced with equity-based awards under the 2024 Plan. For additional information on these awards, see “Structure and Formation of Our Company—Benefits to Related Parties.” In addition, all BGLH Restricted Units that remain unvested as of immediately prior to the completion of this offering will automatically vest in full at such time. |
• | Internalization of Bay Grove Services. |
(i) | We are internalizing certain operating, consulting, strategic development and financial services that have historically been provided by Bay Grove. Prior to this offering, Bay Grove provides operating services to Lineage Holdings pursuant to a perpetual operating services agreement, and Bay Grove also holds a profits interest at Lineage Holdings that entitles Bay Grove to quarterly profits interest equity accruals (the “equity accrual right”). In connection with this internalization, we will have terminated that operating services agreement between Lineage Holdings and Bay Grove and we will have terminated all rights of Bay Grove to accrue additional future profits interests at Lineage Holdings pursuant to the equity accrual right. In exchange for these terminations, Bay Grove will receive a one-time increase in its profit share attributable to the existing profits interest it holds in Lineage Holdings equal to $200.0 million, approximately $14.0 million of which will instead be allocated to our operating partnership in settlement of prior distribution advances made to Bay Grove, its owners and their affiliates (with such amount becoming part of our operating partnership’s equity holdings in Lineage Holdings, and such amount also restoring other distribution rights of Bay Grove, its owners and their affiliates through our operating partnership and BGLH in the same amount) and the remaining approximately $186.0 million of which will be reclassified into 2,447,990 OPEUs held by Bay Grove. In connection with such one-time net increase in Bay Grove’s profits interest and corresponding reclassification of a portion of that amount into 2,447,990 OPEUs, there will be a corresponding reduction to the interests in BGLH held by Bay Grove’s owners and their affiliates to effect a true-up for a portion of this increase, the effect of which is that Bay Grove’s net increase in equity (taking into account both its direct interests in Lineage Holdings and the reduction in interests held by Bay Grove’s owners and their affiliates in BGLH) is $133.4 million rather than $200.0 million. |
(ii) | Also in connection with the internalization described above, following the one-time net increase in Bay Grove’s profits interest and corresponding reclassification of a portion of that amount into a fixed number of OPEUs described immediately above, Lineage Holdings will repurchase 986,842 OPEUs from Bay Grove for cash in the amount of $75.0 million. |
(iii) | The remaining 1,461,148 OPEUs will be exchangeable in the future (after a two-year initial holding period) on a one-for-one basis for OP units, subject to certain adjustments, and no additional OPEUs will be created in respect of any equity accrual right after the formation transactions have been completed. OP units issued in exchange for such OPEUs will not be redeemable until after the settlement of all legacy BGLH equity and all Legacy OP Units. |
(iv) | We will amend the operating agreement of Lineage Holdings to reflect the resulting ownership of Lineage Holdings by our operating partnership and Bay Grove after giving effect to these transactions. |
(v) | We will have entered into a transition services agreement with Bay Grove for a period of three years for certain transition services supporting capital deployment and mergers and acquisitions activity to help us build our full internal capability during that period. |
• | Rollover Put Option. Certain sellers of assets we acquired who previously received rollover equity in BGLH or Lineage OP were provided with separate classes of equity of BGLH or Lineage OP that in some cases included special one-time redemption features with minimum value guarantees and/or the alternative option to elect cash or equity top-up rights to achieve a certain minimum equity valuation at a specific date (collectively, the “Guarantee Rights”). To ensure that the financial obligations associated with all Guarantee Rights proportionately impact investors at Lineage, our operating partnership, and |
36
Table of Contents
Lineage Holdings, each of those entities has agreed to provide successive special repurchase rights and cash and equity top-up rights to such legacy investors that mirror those given by BGLH to its investors (the “Rollover Holder Put Option”) and those given by Lineage OP to its investors, in each case in connection with the Guarantee Rights (the “Lineage OP Put Option”). For more information, see “Certain Relationships and Related Party Transactions—Put Option Agreement.” |
• | Contribution of Offering Net Proceeds. We will contribute the net proceeds from this offering to our operating partnership and receive 47,000,000 OP units (or 54,050,000 OP units if the underwriters exercise their option to purchase up to an additional 7,050,000 shares of our common stock in full), resulting in a 90.4% ownership interest in the operating partnership (90.7% if the underwriters exercise their option to purchase up to an additional 7,050,000 shares of our common stock in full), with holders of Legacy OP Units and Lineage management holding 8.7% and 0.9% ownership interests in the operating partnership, respectively (8.4% and 0.9% if the underwriters exercise their option to purchase up to an additional 7,050,000 shares of our common stock in full). |
• | Series A Preferred Stock Redemption. In connection with this offering, we will redeem our outstanding 12.0% Series A Cumulative Non-Voting Preferred Stock, $0.01 par value per share (the “Series A preferred stock”) for $0.6 million in cash plus any accrued but unpaid dividends. |
37
Table of Contents
Our Structure
The following chart sets forth information about our company, our operating partnership, certain related parties and the ownership interests therein on a pro forma basis after giving effect to the formation transactions. Ownership percentages in our company and our operating partnership are presented based on the assumption that the underwriters’ option to purchase additional shares is not exercised and the other assumptions regarding the number of shares of our common stock and OP units to be outstanding after this offering and the formation transactions described under the heading “The Offering.”
(1) | OP units in our operating partnership are redeemable for cash or, at our option, exchangeable for common shares on a one-for-one basis, subject to certain adjustments, beginning 14 months after the original issuance of such units (other than OP units that were previously classified as Legacy OP Units, which generally have such redemption rights at any time and are not subject to such 14-month waiting period). |
(2) | Except for the one-time special redemption and top-up rights with respect to 319,006 Legacy Class A-4 OP Units as described under “Structure and Formation of Our Company—Formation Transactions—Operating Partnership Conversion and Reclassification of Units,” each Legacy Class A OP Unit is economically equivalent to one OP unit, meaning that one Legacy Class A OP Unit will have the same value and represent the same share of our operating partnership’s equity as an OP Unit. Legacy Class A OP Units can generally be reclassified into an equal number of OP units at any time at the discretion of the LHR, and they will all ultimately be so reclassified by the third anniversary of the initial closing of this offering. Each Legacy Class A OP Unit will also have the same voting rights and voting power as an OP unit; however, the |
38
Table of Contents
LHR will have voting and dispositive power over each Legacy Class A OP Unit until it is reclassified into an OP unit. After giving effect to the completion of the formation transactions, our operating partnership will have 11,593,846 Legacy Class A OP Units outstanding. |
(3) | Each Legacy Class B OP Unit is economically equivalent to one OP unit, meaning that one Legacy Class B OP Unit will have the same value and represent the same share of our operating partnership’s equity as an OP Unit. Legacy Class B OP Units can generally be reclassified into an equal number of OP units at any time at the discretion of the LHR, and they will all ultimately be so reclassified by the third anniversary of the initial closing of this offering. Each Legacy Class B OP Unit will also have the same voting rights and voting power as an OP unit; however, the LHR will have voting and dispositive power over each Legacy Class B OP Unit until it is reclassified into an OP unit. After giving effect to the completion of the formation transactions, our operating partnership will have 10,638,862 Legacy Class B OP Units outstanding. |
(4) | OPEUs will be exchangeable at the election of BG Maverick, LLC, an affiliate of Bay Grove, for OP units on a one-for-one basis, subject to adjustment in certain circumstances, at any time beginning two years after the initial closing date of this offering. Holders of OP units issued in exchange for such OPEUs, which will include Messrs. Forste and Marchetti or their affiliates, will not be able to redeem such OP units until after the settlement of all legacy BGLH equity and all Legacy OP Units. After giving effect to the completion of the formation transactions, Lineage Holdings will have 1,461,148 OPEUs outstanding. |
Benefits to Related Parties
Upon completion of this offering and the formation transactions, Bay Grove and our directors, executive officers and employees will receive material benefits, including the following:
• | BG Cold will hold a continuing right to receive the Founders Equity Share from our operating partnership through its C-Piece Sub-Units in the Legacy Class A OP Units and similar amounts from BGLH, our majority stockholder, as described in “Certain Relationships and Related Party Transactions—Transactions with BG Lineage Holdings, LLC” and “Certain Relationships and Related Party Transactions—Transactions with Lineage OP, LLC.” However, BG Cold will no longer receive advance distributions against the Founders Equity Share, which were historically received prior to the formation transactions. All such rights to advances will terminate in connection with the formation transactions. See “Certain Relationships and Related Party Transactions—Transactions with BG Lineage Holdings, LLC,” “Certain Relationships and Related Party Transactions—Transactions with Lineage OP, LLC” and “Description of the Partnership Agreement of Lineage OP, LP—Legacy OP Units—Legacy Class A OP Units.” |
• | Affiliates of Bay Grove will continue to hold 71.3% of the Legacy Class B OP Units of our operating partnership. See “Description of the Partnership Agreement of Lineage OP, LP—Legacy OP Units—Legacy Class B OP Units.” |
• | The stockholders agreement will provide that we, on our own behalf and in our capacity as general partner of the operating partnership, must use commercially reasonable efforts to (i) structure certain significant exit transactions (including mergers, consolidations and sales of substantially all of our assets or the assets of our operating partnership and its subsidiaries) in a manner that is tax-deferred to Messrs. Marchetti and Forste, their respective estate planning vehicles, family members and controlled affiliates, does not cause such parties to recognize gain for federal income tax purposes, and provides for substantially similar tax protections after such transactions, and (ii) cause our operating partnership or its subsidiaries to continuously maintain sufficient levels of indebtedness that are allocable for federal income tax purposes to Messrs. Marchetti and Forste and their respective personal holding entities to prevent them from recognizing gain as a result of any negative tax capital account or insufficient debt allocation, provided that such amount of debt shall not be required to exceed the amount allocable to the parties immediately following this offering, subject to certain exceptions. See “Certain Relationships and Related Party Transactions—Stockholders Agreement.” |
39
Table of Contents
• | Bay Grove will have received a one-time increase in its profit share attributable to the existing profits interest it holds in Lineage Holdings equal to $200.0 million, approximately $14.0 million of which will instead have been allocated to our operating partnership in settlement of prior distribution advances made to Bay Grove, its owners and their affiliates (with such amount becoming part of our operating partnership’s equity holdings in Lineage Holdings, and such amount also restoring other distribution rights of Bay Grove, its owners and their affiliates through our operating partnership and BGLH in the same amount) and the remaining approximately $186.0 million of which will have been reclassified into 2,447,990 OPEUs held by Bay Grove. See “Structure and Formation of Our Company—Formation Transactions.” |
• | Affiliates of Bay Grove will have received $75.0 million in cash from Lineage Holdings’ repurchase of 986,842 OPEUs from Bay Grove pursuant to the formation transactions, and affiliates of Bay Grove will continue to hold the remaining OPEUs that have not been repurchased pursuant to the formation transactions. See “Structure and Formation of Our Company—Formation Transactions.” |
• | BGLH will receive $0.5 million in cash, plus any accrued but unpaid dividends, in connection with the redemption of our Series A preferred stock. |
• | We will have entered into a transition services agreement with Bay Grove, pursuant to which (1) Bay Grove will provide us with certain transition services supporting capital deployment and mergers and acquisitions activity for three years following the closing of this offering to help us build our full internal capability during that period, and (2) we will pay Bay Grove an annual fee equal to $8.0 million. See “Certain Relationships and Related Party Transactions—Transactions with Bay Grove—Operating Services Agreement” and “Certain Relationships and Related Party Transactions—Transition Services Agreement.” |
• | We will have entered into a registration rights agreement with BGLH, pursuant to which we will grant it and certain of its affiliates with certain “demand” registration rights and customary “piggyback” registration rights. We will also have entered into one or more registration rights agreements with Mr. Forste and Mr. Marchetti, pursuant to which we will grant them with certain registration rights. See “Certain Relationships and Related Party Transactions—Registration Rights Agreements.” |
• | We, our operating partnership and Lineage Holdings will have entered into an agreement providing successive special repurchase rights and cash and equity top-up rights to certain legacy investors that benefits BGLH by ensuring that all Guarantee Rights will ultimately be satisfied by Lineage Holdings so that all investors in BGLH, Lineage, our operating partnership and Lineage Holdings are proportionately impacted by the Guarantee Rights based on their direct and indirect ownership interests in Lineage Holdings. For more information, see “Certain Relationships and Related Party Transactions—Put Option Agreement.” |
• | Lineage Holdings will have entered into an expense reimbursement and indemnification agreement with BGLH, the LHR and Bay Grove pursuant to which Lineage Holdings will agree to (i) advance to or reimburse such entities for all of their expenses in any way related to our company, including expenses incurred in connection with the coordinated settlement process that will occur for up to three years for all legacy investors in both BGLH and our operating partnership and (ii) indemnify such entities to the fullest extent permitted by applicable law against liabilities that may arise in any way related to our company, including liabilities incurred in connection with or as a result of the coordinated settlement process. See “Certain Relationships and Related Party Transactions—Indemnification Agreements—Bay Grove.” |
• | We will have entered into indemnification agreements with each of our directors and executive officers providing for the indemnification by us for certain liabilities and expenses incurred as a result of actions brought, or threatened to be brought, against our directors and executive officers in their capacities as such. |
40
Table of Contents
• | We will have entered into certain agreements with Messrs. Forste and Marchetti, pursuant to which Messrs. Forste and Marchetti will agree that for a period of three years following the completion of this offering (or, if less, such period during which they directly or indirectly own any equity in our company) they will not compete with our business. |
• | We will have purchased in exchange for 80,950 shares of our common stock the vested awards of LMEP Units valued at less than $3.0 million per individual that are held by certain of our officers and employees who are not named executive officers. Thereafter, we will have settled the remaining vested LMEP Units for 2,204,162 Legacy Class B OP Units. This results in the vested LMEP Units not purchased by us becoming a fixed number of Legacy Class B OP Units prior to such time as the LMEP Units would otherwise be paid pursuant to the terms of the existing awards. Following the contribution, each of LLH MGMT Profits, LLC and LLH MGMT Profits II, LLC will distribute the Legacy Class B OP Units to its members, including certain of our officers and employees whose LMEP Units are not purchased in exchange for shares of our common stock, in complete liquidation of each such entity. Following such distribution, officers, employees and others to whom such Legacy Class B OP Units are distributed will generally continue to hold such Legacy Class B OP Units subject to settlement over a period of up to three years as part of the same settlement process that applies to all of our legacy investor equity. As discussed in greater detail below, all outstanding LMEP Units that remain unvested as of the date of such contribution and distribution will automatically terminate at such time and will be replaced with equity-based awards under the 2024 Plan. In addition, all BGLH Restricted Units that remain unvested as of immediately prior to the completion of this offering will automatically vest in full at such time. |
• | We will have adopted the 2024 Plan, under which we will grant cash and equity-based incentive awards to eligible service providers in order to attract, motivate and retain the talent for which we compete. |
• | In connection with the completion of this offering, we will grant certain of our executive officers and employees one-time awards in the form of an aggregate of $52.9 million in cash, 184,946 restricted stock units and 1,362,248 shares of our common stock. Such awards will be fully vested at the time of grant, in the case of shares of common stock, or subject to time-based vesting, in the case of restricted stock units. |
• | As discussed above regarding holders of LMEP Units with a value less than $3.0 million, we will issue to certain of our employees, other than our executive officers, an aggregate of 80,950 shares of our common stock. Such awards will be fully vested at the time of issuance. |
• | As discussed above, in connection with the completion of this offering, we will grant certain of our executive officers and employees one-time awards covering an aggregate of 346,722 restricted stock units and 720,041 LTIP units in respect of certain vested LMEP Units and/or the cancellation of unvested LMEP Units. Such awards will be subject to time-based vesting. |
• | As part of our annual equity award program, we will grant certain of our executive officers and employees an aggregate of 2,677,622 restricted stock units and/or LTIP units. Such awards will be subject to time- and/or performance-based vesting. |
• | In connection with the completion of this offering, we will grant certain of our non-employee directors an aggregate of 8,226 restricted stock units. Such awards will be subject to time-based vesting. |
• | In connection with the completion of this offering, we will grant certain of our employees one-time awards covering an aggregate of 657,190 restricted stock units in respect of certain vested LVCP Awards and/or the cancellation of unvested LVCP Awards. Such restricted stock units will be subject to time-based vesting. |
41
Table of Contents
See “Executive Compensation—Treatment of LMEP Units and BGLH Restricted Units in Connection with this Offering” and “Executive Compensation—Equity Awards in Connection with the IPO” for further details.
• | Certain LVCP Awards will vest and be settled in an aggregate of $17.9 million of cash and 179,838 shares of our common stock. |
Distribution Policy
We have elected to qualify as a REIT for U.S. federal income tax purposes. To qualify as a REIT, we must distribute annually at least 90% of our REIT taxable income, determined without regard to the dividends paid deduction and excluding any net capital gains. To the extent we satisfy the distribution requirement but distribute less than 100% of our REIT taxable income (determined without regard to the dividends paid deduction and including any net capital gains), we will be subject to federal corporate income tax on our undistributed taxable income. In addition, as a REIT, we will be required to pay a 4% nondeductible excise tax on the amount, if any, by which the distributions we make in a calendar year are less than the sum of 85% of our ordinary income, 95% of our capital gain net income and 100% of our undistributed income from prior years. For more information, see “Federal Income Tax Considerations—Taxation of Our Company—Annual Distribution Requirements.” To satisfy the requirements to qualify as a REIT and to avoid paying tax on our income, we intend to make quarterly distributions of all, or substantially all, of our REIT taxable income (including net capital gains) to our stockholders. In addition, we have a long-term target of distributing approximately 50% of our Adjusted FFO to our stockholders annually.
To the extent we are prevented by provisions of our financing arrangements or otherwise from distributing 100% of our REIT taxable income or otherwise do not distribute 100% of our REIT taxable income, we will be subject to income tax, and potentially excise tax, on the retained amounts. If our operations do not generate sufficient cash flow to enable us to pay our intended or required distributions, we may be required either to fund distributions from alternative sources, including working capital, borrowings, asset sales or equity capital, or reduce such distributions. Our actual results of operations will be affected by a number of factors, including the revenues we generate, our operating expenses, interest expense and unanticipated expenditures, among others. See “Distribution Policy.”
Restrictions on Ownership and Transfer of Our Common Stock
Our charter, subject to certain exceptions, authorizes our board of directors to take such actions as are necessary or appropriate to allow us to qualify and to preserve our status as a REIT. Furthermore, our charter prohibits, with certain exceptions, the beneficial or constructive ownership by any person of more than 9.8% in value of the aggregate of the outstanding shares of our capital stock or more than 9.8% (in value or in number of shares, whichever is more restrictive) of the aggregate of the outstanding shares of our common stock. In addition, our charter contains various other restrictions on the ownership and transfer of our common stock and capital stock, including restrictions to prevent us for a limited period from not qualifying as a domestically controlled qualified investment entity. Our board of directors, in its sole and absolute discretion, may exempt a person, prospectively or retroactively, and subject to such conditions and limitations as our board of directors may deem appropriate, from these ownership limits if certain conditions are satisfied. However, our board of directors may not grant an exemption from these ownership limits if such exemption would cause us to fail to qualify as a REIT. The ownership limits may delay or impede a transaction or a change of control that might be in your best interest. See “Description of Our Capital Stock—Restrictions on Ownership and Transfer.”
Our Tax Status
We have elected and believe we have qualified to be taxed as a REIT for U.S. federal income tax purposes commencing with our taxable year ended December 31, 2020. We believe that our organization and operations will allow us to continue to qualify as a REIT for federal income tax purposes. To maintain REIT status, we must
42
Table of Contents
meet a number of organizational and operational requirements, including a requirement that we annually distribute to our stockholders at least 90% of our REIT taxable income, determined without regard to the dividends paid deduction and excluding any net capital gains. See “Federal Income Tax Considerations.”
Corporate Information
We were formed in April 2017. Our principal executive office is located at 46500 Humboldt Drive, Novi, Michigan 48377. Our telephone number is (800) 678-7271.
43
Table of Contents
Common stock offered by us | 47,000,000 shares (plus up to an additional 7,050,000 shares of our common stock that we may issue and sell upon the exercise in full of the underwriters’ option to purchase additional shares). |
Common stock to be outstanding after this offering | 210,008,463 shares(1) |
Common stock and OP units to be outstanding after this offering (excluding OP units held directly or indirectly by us) and the formation transactions | 233,702,319 shares of common stock and OP units(1)(2) |
Use of proceeds | We estimate that the net proceeds to us from this offering will be approximately $3.4 billion, or $3.9 billion if the underwriters exercise in full their option to purchase additional shares, after deducting underwriting discounts and commissions and other estimated expenses, in each case, based on an assumed initial public offering price of $76.00 per share, which is the mid-point of the price range set forth on the front cover of this prospectus. We intend to use the net proceeds from this offering to repay borrowings outstanding under the Delayed Draw Term Loan, repay borrowings outstanding under the Revolving Credit Facility, fund one-time cash grants to certain of our employees in connection with this offering and estimated cash to pay tax withholding obligations associated with stock grants and redeem our Series A preferred stock. Following such uses, we expect to use the remainder of the net proceeds for general corporate purposes, which may include the repayment of additional borrowings outstanding under the Revolving Credit Facility. See “Use of Proceeds.” |
Directed Share Program | At our request, the underwriters have reserved six percent of the shares of common stock to be issued by us and offered by this prospectus for sale, at the initial public offering price, to (i) certain of our directors, officers and employees, (ii) friends and family members of certain of our directors and officers, (iii) individuals associated with certain of our customers, vendors, landlords and service providers and (iv) certain of our legacy investors, former owners of acquired companies and properties and other industry partners. The number of shares of common stock available for sale to the general public will be reduced to the extent these individuals purchase such reserved shares. Any reserved shares that are not so purchased will be offered by the underwriters to the general public on the same basis as the other shares offered by this prospectus. See “Underwriters—Directed Share Program” for additional information. |
Risk factors | Investing in our common stock involves risks. You should carefully read and consider the information set forth under the heading “Risk Factors” beginning on page 55 and other information included in this prospectus before investing in our common stock. |
44
Table of Contents
Proposed Nasdaq symbol | “LINE” |
(1) | The shares of our common stock to be outstanding after this offering include: |
• | 161,924,302 shares of our common stock outstanding prior to this offering; |
• | 47,000,000 shares of our common stock to be issued in this offering; |
• | 139,966 shares of our common stock to be issued to our executives and employees under the 2024 Plan as initial public offering bonuses; |
• | 746,251 shares of our common stock to be awarded to certain of our employees under the 2024 Plan in connection with the completion of this offering; |
• | 80,950 shares of our common stock that may be issued to certain of our employees under the 2024 Plan, and to employees, former employees and others, in private placements, in settlement of outstanding vested LMEP Units; and |
• | 116,994 shares of our common stock that may be issued to certain of our employees under the 2024 Plan in settlement of outstanding vested LVCP Awards. |
The above shares of our common stock are presented on a net basis, assuming that an aggregate of 538,875 shares of our common stock issued to our executives and employees will be remitted to our company to satisfy tax withholding obligations, representing a blended withholding rate of approximately 35%. As a result, such 538,875 shares of our common stock will be held as authorized and unissued shares of our common stock and are not reflected in the shares of our common stock to be outstanding after this offering.
The shares of our common stock to be outstanding after this offering exclude:
• | 7,050,000 shares of our common stock issuable upon the exercise in full of the underwriters’ option to purchase additional shares; |
• | 32,202 shares of our common stock underlying restricted stock units subject to time-based vesting awarded to certain of our executive officers and employees under the Lineage 2024 Incentive Award Plan prior to this offering; |
• | 284,299 shares of our common stock underlying restricted stock units subject to time-based vesting awarded or to be awarded to certain of our executive officers and employees under the 2024 Plan as part of our annual equity award program; |
• | 184,946 shares of our common stock underlying restricted stock units subject to time-based vesting to be awarded to certain of our employees under the 2024 Plan in connection with the completion of this offering; |
• | 8,226 shares of our common stock underlying restricted stock units subject to time-based vesting awarded or to be awarded to certain of our non-employee directors under the 2024 Plan in connection with the completion of this offering; |
• | 346,722 shares of our common stock underlying restricted stock units subject to time-based vesting awarded or to be awarded to certain of our executive officers and employees under the 2024 Plan in respect of certain vested LMEP Units and/or the cancellation of unvested LMEP Units; |
• | 657,190 shares of our common stock underlying restricted stock units subject to time-based vesting awarded or to be awarded to certain of our employees under the 2024 Plan in respect of certain vested LVCP Awards and/or the cancellation of unvested LVCP Awards; |
• | up to 236,422 shares of our common stock underlying restricted stock units subject to performance-based vesting awarded or to be awarded under the 2024 Plan in connection with this offering as part of our annual equity award program (the number of shares of our common stock reflected in this bullet |
45
Table of Contents
assumes maximum performance for performance-based awards—to the extent that we do not attain maximum performance with respect to the applicable performance goals, the actual number of shares issued under those awards will be less than the number reflected in this bullet); and |
• | 7,009,993 shares of our common stock issuable in the future under the 2024 Plan, as more fully described in “Executive and Director Compensation—Amended and Restated Lineage 2024 Incentive Award Plan.” |
(2) | The OP units to be outstanding after this offering include 23,693,856 OP units to be outstanding after the formation transactions, excluding OP units held by our company and including (i) 22,232,708 OP units into which Legacy OP Units may be reclassified and (ii) 1,461,148 OP units issuable upon exchange of OPEUs. |
The OP units to be outstanding after this offering exclude:
• | 720,041 LTIP units subject to time-based vesting awarded or to be awarded to certain of our executive officers and employees under the 2024 Plan in respect of certain vested LMEP Units and/or the cancellation of unvested LMEP Units; |
• | 498,691 LTIP units subject to time-based vesting awarded or to be awarded in connection with this offering to certain of our executive officers and employees under the 2024 Plan as part of our annual equity award program; and |
• | up to 1,776,421 LTIP units subject to performance-based vesting awarded or to be awarded in connection with this offering to certain of our executive officers and employees under the 2024 Plan as part of our annual equity award program (the number of LTIP units reflected in this sentence assumes maximum performance for performance-based awards—to the extent that we do not attain maximum performance with respect to the applicable performance goals, the actual number of LTIP units that vest under those awards will be less than the number reflected in this bullet). |
OPEUs will be exchangeable at Bay Grove’s election for OP units on a one-for-one basis, subject to adjustment in certain circumstances, at any time beginning two years after the initial closing date of this offering. OP units, other than Legacy OP Units (until they are reclassified as OP units) and OP units issued upon exchange of OPEUs, are redeemable for cash or, at our election, shares of our common stock on a one-for-one basis, subject to adjustment in certain circumstances, beginning 14 months after the original issuance of such units (other than OP units that were previously classified as Legacy OP Units, which have such redemption rights at any time after their reclassification into OP units and are not subject to such 14-month waiting period). Holders of OP units issued in exchange for such OPEUs will not be able to redeem such OP units until after the settlement of all legacy BGLH equity and all Legacy OP Units. Vested LTIP units are convertible as described under “Description of the Partnership Agreement of Lineage OP, LP—LTIP Units—Conversion Rights.”
46
Table of Contents
SUMMARY SELECTED HISTORICAL AND PRO FORMA
CONDENSED CONSOLIDATED FINANCIAL AND OTHER DATA
Set forth below is summary selected consolidated financial and other data presented on (i) a historical basis and (ii) a pro forma basis. Lineage, Inc.’s historical consolidated balance sheet data as of December 31, 2023 and 2022 and consolidated operating data for the years ended December 31, 2023, 2022 and 2021 have been derived from Lineage, Inc.’s audited historical consolidated financial statements included elsewhere in this prospectus. Lineage, Inc.’s historical condensed consolidated balance sheet data as of March 31, 2024 and the condensed consolidated operating data for the three months ended March 31, 2024 and 2023 have been derived from Lineage, Inc.’s unaudited condensed consolidated financial statements included elsewhere in this prospectus. These unaudited condensed consolidated financial statements have been prepared on a basis consistent with Lineage, Inc.’s audited consolidated financial statements. In the opinion of our management, the unaudited historical financial data reflect all adjustments, consisting only of normal and recurring adjustments, necessary for a fair statement of the results for those periods. The historical consolidated financial data included below and set forth elsewhere in this prospectus are not necessarily indicative of our future performance, and results for any interim period are not necessarily indicative of the results for any full year.
Lineage, Inc.’s unaudited pro forma condensed consolidated balance sheet data as of March 31, 2024 and unaudited pro forma condensed consolidated operating data for the three months ended March 31, 2024 and year ended December 31, 2023 have been derived from Lineage, Inc.’s unaudited pro forma condensed consolidated financial statements included elsewhere in this prospectus. Our unaudited pro forma condensed consolidated financial data assume the completion of this offering, the formation transactions and the other adjustments described in our unaudited pro forma condensed consolidated financial statements had occurred on March 31, 2024 for purposes of the unaudited pro forma condensed consolidated balance sheet data and on January 1, 2023 for purposes of the unaudited pro forma condensed consolidated statements of operations data for the three months ended March 31, 2024 and year ended December 31, 2023. Our unaudited pro forma financial information is not necessarily indicative of what our actual financial position and results of operations would have been as of the date and for the period indicated, nor does it purport to represent our future financial position or results of operations.
You should read the following summary selected historical and pro forma condensed consolidated financial and other data together with “Management’s Discussion and Analysis of Financial Condition and Results of Operations,” “Business and Properties” and our historical and pro forma condensed consolidated financial statements and related notes appearing elsewhere in this prospectus.
Three Months Ended March 31, | Year Ended December 31, | |||||||||||||||||||||||||||
(in millions) | 2024 Pro Forma (Unaudited) | 2024 Historical (Unaudited) | 2023 Historical (Unaudited) | 2023 Pro Forma (Unaudited) | 2023 Historical | 2022 Historical | 2021 Historical | |||||||||||||||||||||
Operating Data: | ||||||||||||||||||||||||||||
Total revenues | $ | 1,328.0 | $ | 1,328.0 | $ | 1,333.3 | $ | 5,341.5 | $ | 5,341.5 | $ | 4,928.3 | $ | 3,702.0 | ||||||||||||||
Total global warehousing segment revenue | 968.6 | 968.6 | 957.6 | 3,856.9 | 3,856.9 | 3,432.6 | 2,655.8 | |||||||||||||||||||||
Net income (loss) | (4.4 | ) | (48.0 | ) | 18.6 | (536.6 | ) | (96.2 | ) | (76.0 | ) | (176.5 | ) | |||||||||||||||
NOI(1) | 443.4 | 444.2 | 443.1 | 1,748.5 | 1,751.7 | 1,455.1 | 1,130.6 | |||||||||||||||||||||
Global warehousing segment NOI(2) | 384.1 | 384.5 | 385.2 | 1,506.1 | 1,507.8 | 1,221.5 | 971.5 | |||||||||||||||||||||
Global integrated solutions segment | 59.3 | 59.7 | 57.9 | 242.4 | 243.9 | 233.6 | 159.1 |
47
Table of Contents
As of March 31, | As of December 31, | |||||||||||||||||||
(in millions) | 2024 Pro Forma (Unaudited) | 2024 Historical (Unaudited) | 2023 Historical | 2022 Historical | 2021 Historical | |||||||||||||||
Balance Sheet Data: | ||||||||||||||||||||
Cash and cash equivalents | $ | 91.2 | $ | 91.2 | $ | 68.2 | $ | 170.6 | $ | 209.1 | ||||||||||
Total assets | 18,716.7 | 18,734.4 | 18,871.0 | 18,557.4 | 16,404.1 | |||||||||||||||
Long-term debt, net | 6,007.7 | 9,246.0 | 8,958.2 | 8,697.4 | 7,567.3 | |||||||||||||||
Stockholders’ equity | 7,832.5 | 4,978.0 | 5,050.5 | 5,167.0 | 4,356.5 |
Three Months Ended March 31, | Year Ended December 31, | |||||||||||||||||||||||||||
(in millions) | 2024 Pro Forma (Unaudited) | 2024 Historical (Unaudited) | 2023 Historical (Unaudited) | 2023 Pro Forma (Unaudited) | 2023 Historical | 2022 Historical | 2021 Historical | |||||||||||||||||||||
Other Data: | ||||||||||||||||||||||||||||
FFO(1) | $ | 82.6 | $ | 39.0 | $ | 103.0 | $ | (191.9 | ) | $ | 248.5 | $ | 229.1 | $ | 75.7 | |||||||||||||
Core FFO(1) | 123.4 | 86.3 | 135.3 | 433.4 | 415.7 | 400.2 | 335.4 | |||||||||||||||||||||
Adjusted FFO(1) | 206.3 | 148.3 | 183.3 | 789.3 | 562.3 | 551.9 | 465.5 | |||||||||||||||||||||
EBITDAre(1) | 276.4 | 291.4 | 312.7 | 462.4 | 1,147.3 | 953.5 | 656.0 | |||||||||||||||||||||
Adjusted EBITDA(1) | 328.2 | 326.6 | 333.8 | 1,279.6 | 1,278.2 | 1,074.4 | 857.8 |
(1) | NOI, FFO, Core FFO Adjusted FFO, EBITDAre and Adjusted EBITDA are non-GAAP financial measures. For definitions of FFO, Core FFO Adjusted FFO, EBITDAre and Adjusted EBITDA, reconciliations of these metrics to net income, the most directly comparable GAAP financial measure, and a statement of why our management believes the presentation of these metrics provides useful information to investors and any additional purposes for which management uses these metrics, see “—Non-GAAP Financial Measures” below. |
(2) | We evaluate the performance of our primary business segments based on their net operating income relative to our overall results of operations. We use the term “segment net operating income” or “segment NOI” to mean a segment’s revenues less its cost of operations (excluding any depreciation and amortization, impairment charges, corporate-level general and administrative expenses, corporate-level acquisition, transaction, and other expense and corporate-level restructuring and impairment expense). We use segment net operating income to evaluate our segments for purposes of making operating decisions and assessing performance in accordance with Financial Accounting Standards Board, or FASB, ASC, Topic 280, Segment Reporting. |
Non-GAAP Financial Measures
We use the following non-GAAP financial measures as supplemental performance measures of our business: NOI, segment NOI, FFO, Core FFO, Adjusted FFO, EBITDA, EBITDAre, Adjusted EBITDA, net debt, adjusted net debt and adjusted net debt to Adjusted EBITDA.
We calculate NOI as our total revenues less our cost of operations (excluding any depreciation and amortization, impairment charges, corporate-level general and administrative expenses, corporate-level acquisition, transaction, and other expense and corporate-level restructuring and impairment expense). We calculate segment NOI as a segment’s revenues less its cost of operations (excluding any depreciation and amortization, impairment charges, corporate-level general and administrative expenses, corporate-level acquisition, transaction, and other expense and corporate-level restructuring and impairment expense). We use segment NOI to evaluate our segments for purposes of making operating decisions and assessing performance in accordance with FASB ASC, Topic 280, Segment Reporting. We believe NOI and segment NOI are helpful to investors as a supplemental performance measure to net income because they assist both investors and management in understanding the core operations of
48
Table of Contents
our business. There is no industry definition of NOI or segment NOI and, as a result, other REITs may calculate NOI or segment NOI, or other similarly-captioned metrics, in a manner different than we do. The table below reconciles NOI to net income (loss), which is the most directly comparable financial measure calculated in accordance with GAAP, and sets forth our NOI by segment.
Three Months Ended March 31, | Year ended December 31, | |||||||||||||||||||||||||||
(in millions) | 2024 Pro Forma (Unaudited) | 2024 Historical (Unaudited) | 2023 Historical (Unaudited) | 2023 Pro Forma (Unaudited) | 2023 Historical | 2022 Historical | 2021 Historical | |||||||||||||||||||||
Net income (loss) | $ | (4.4 | ) | $ | (48.0 | ) | $ | 18.6 | $ | (536.6 | ) | $ | (96.2 | ) | $ | (76.0 | ) | $ | (176.5 | ) | ||||||||
General and administrative expense | 144.8 | 124.1 | 114.9 | 593.5 | 501.8 | 398.9 | 289.3 | |||||||||||||||||||||
Depreciation expense | 157.7 | 157.7 | 129.5 | 551.9 | 551.9 | 479.5 | 416.1 | |||||||||||||||||||||
Amortization expense | 53.4 | 53.4 | 51.7 | 207.8 | 207.8 | 197.7 | 187.6 | |||||||||||||||||||||
Acquisition, transaction, and other expense | 8.6 | 8.6 | 10.8 | 641.6 | 60.0 | 66.2 | 123.6 | |||||||||||||||||||||
Restructuring, impairment, and (gain) loss on disposals | (0.4 | ) | (0.4 | ) | 4.2 | 31.8 | 31.8 | 15.5 | 26.3 | |||||||||||||||||||
Equity (income) loss, net of tax | 1.8 | 1.8 | (0.2 | ) | 2.6 | 2.6 | 0.2 | 0.3 | ||||||||||||||||||||
(Gain) loss on foreign currency transactions, net | 10.7 | 10.7 | 1.3 | (3.9 | ) | (3.9 | ) | 23.8 | 34.0 | |||||||||||||||||||
Interest expense, net | 82.6 | 138.8 | 114.7 | 277.4 | 490.4 | 347.0 | 259.6 | |||||||||||||||||||||
(Gain) loss on extinguishment of debt | — | 6.5 | — | 8.4 | — | (1.4 | ) | 4.1 | ||||||||||||||||||||
Other nonoperating (income) expense, net | 0.7 | 0.7 | 0.2 | 19.4 | 19.4 | (2.3 | ) | (4.5 | ) | |||||||||||||||||||
Income tax expense (benefit) | (12.1 | ) | (9.7 | ) | (2.6 | ) | (45.4 | ) | (13.9 | ) | 6.0 | (29.3 | ) | |||||||||||||||
|
|
|
|
|
|
|
|
|
|
|
|
|
| |||||||||||||||
NOI | $ | 443.4 | $ | 444.2 | $ | 443.1 | $ | 1,748.5 | $ | 1,751.7 | $ | 1,455.1 | $ | 1,130.6 | ||||||||||||||
NOI by Segment: | ||||||||||||||||||||||||||||
Global warehousing segment NOI | $ | 384.1 | $ | 384.5 | $ | 385.2 | $ | 1,506.1 | $ | 1,507.8 | $ | 1,221.5 | $ | 971.5 | ||||||||||||||
Global integrated solutions segment NOI | $ | 59.3 | $ | 59.7 | $ | 57.9 | $ | 242.4 | $ | 243.9 | $ | 233.6 | $ | 159.1 |
We calculate funds from operations, or FFO, in accordance with the standards established by the Board of Governors of the National Association of Real Estate Investment Trusts, or NAREIT. NAREIT defines FFO as net income or loss determined in accordance with GAAP, excluding extraordinary items as defined under GAAP and gains or losses from sales of previously depreciated operating real estate assets, plus specified non-cash items, such as real estate asset depreciation and amortization, in-place lease intangible amortization, real estate asset impairment and our share of reconciling items for partially owned entities. We believe that FFO is helpful to investors as a supplemental performance measure because it excludes the effect of depreciation, amortization and gains or losses from sales of real estate, all of which are based on historical costs, which implicitly assumes that the value of real estate diminishes predictably over time. Since real estate values instead have historically risen or fallen with market conditions, FFO can facilitate comparisons of operating performance between periods and among other equity REITs.
We calculate core funds from operations, or Core FFO, as FFO adjusted for the effects of gain or loss on the sale of non-real estate assets, finance lease ROU asset amortization -real estate, non-real estate impairments, acquisition, restructuring and other, other income or expense, loss on debt extinguishment and modifications and the effects of gain or loss on foreign currency exchange. We also adjust for the impact attributable to non-real estate impairments on unconsolidated joint ventures and natural disaster and COVID. We believe that Core FFO is helpful to investors as a supplemental performance measure because it excludes the effects of certain items which can create significant earnings volatility, but which do not directly relate to our core business operations.
49
Table of Contents
We believe Core FFO can facilitate comparisons of operating performance between periods, while also providing a more meaningful predictor of future earnings potential.
However, because FFO and Core FFO add back real estate depreciation and amortization and do not capture the level of maintenance capital expenditures necessary to maintain the operating performance of our properties, both of which have material economic impacts on our results from operations, we believe the utility of FFO and Core FFO as a measure of our performance may be limited.
We calculate adjusted funds from operations, or Adjusted FFO, as Core FFO adjusted for the effects of amortization of deferred financing costs, amortization of debt discount/premium amortization of above or below market leases, straight-line net operating rent, provision or benefit from deferred income taxes, stock-based compensation expense from grants under our equity incentive plans, non-real estate depreciation and amortization, finance lease ROU asset amortization -non-real estate and maintenance capital expenditures. We also adjust for Adjusted FFO attributable to our share of reconciling items of partially owned entities. We believe that Adjusted FFO is helpful to investors as a meaningful supplemental comparative performance measure of our ability to make incremental capital investments in our business and to assess our ability to fund distribution requirements from our operating activities.
FFO, Core FFO and Adjusted FFO are used by management, investors and industry analysts as supplemental measures of operating performance of equity REITs. FFO, Core FFO and Adjusted FFO should be evaluated along with GAAP net income and net income per diluted share (the most directly comparable GAAP measures) in evaluating our operating performance. FFO, Core FFO and Adjusted FFO do not represent net income or cash flows from operating activities in accordance with GAAP and are not indicative of our results of operations or cash flows from operating activities as disclosed in our consolidated statements of operations included elsewhere in this prospectus. FFO, Core FFO and Adjusted FFO should be considered as supplements, but not alternatives, to our net income or cash flows from operating activities as indicators of our operating performance. Moreover, other REITs may not calculate FFO in accordance with the NAREIT definition or may interpret the NAREIT definition differently than we do. Accordingly, our FFO may not be comparable to FFO as calculated by other REITs. In addition, there is no industry definition of Core FFO or Adjusted FFO and, as a result, other REITs may also calculate Core FFO or Adjusted FFO, or other similarly-captioned metrics, in a manner different than we do. The table below reconciles FFO, Core FFO and Adjusted FFO to net income (loss), which is the most directly comparable financial measure calculated in accordance with GAAP.
Three Months Ended March 31, | Year Ended December 31, | |||||||||||||||||||||||||||
(in millions) | 2024 Pro Forma (Unaudited) | 2024 Historical (Unaudited) | 2023 Historical (Unaudited) | 2023 Pro Forma (Unaudited) | 2023 Historical | 2022 Historical | 2021 Historical | |||||||||||||||||||||
Net income (loss) | $ | (4.4 | ) | $ | (48.0 | ) | $ | 18.6 | $ | (536.6 | ) | $ | (96.2 | ) | $ | (76.0 | ) | $ | (176.5 | ) | ||||||||
Adjustments: | ||||||||||||||||||||||||||||
Real estate depreciation | 85.3 | 85.3 | 80.1 | 324.5 | 324.5 | 291.6 | 240.7 | |||||||||||||||||||||
In-place lease intangible amortization | 1.5 | 1.5 | 2.1 | 7.5 | 7.5 | 8.9 | 8.8 | |||||||||||||||||||||
Net loss (gain) on sale of real estate assets | — | — | 1.2 | 7.8 | 7.8 | 4.0 | 1.0 | |||||||||||||||||||||
Impairment write-downs on real estate property | — | — | 0.3 | 1.7 | 1.7 | 0.6 | — | |||||||||||||||||||||
Real estate depreciation, (gain) loss on sale of real estate and real estate impairments on unconsolidated JVs | 0.6 | 0.6 | 0.8 | 3.4 | 3.4 | 2.9 | 3.1 | |||||||||||||||||||||
Allocation of noncontrolling interests | (0.4 | ) | (0.4 | ) | (0.1 | ) | (0.2 | ) | (0.2 | ) | (2.9 | ) | (1.4 | ) | ||||||||||||||
|
|
|
|
|
|
|
|
|
|
|
|
|
| |||||||||||||||
FFO | $ | 82.6 | $ | 39.0 | $ | 103.0 | $ | (191.9 | ) | $ | 248.5 | $ | 229.1 | $ | 75.7 |
50
Table of Contents
Three Months Ended March 31, | Year Ended December 31, | |||||||||||||||||||||||||||
(in millions) | 2024 Pro Forma (Unaudited) | 2024 Historical (Unaudited) | 2023 Historical (Unaudited) | 2023 Pro Forma (Unaudited) | 2023 Historical | 2022 Historical | 2021 Historical | |||||||||||||||||||||
Adjustments: | ||||||||||||||||||||||||||||
Net (gain) loss on sale of non-real estate assets | (0.5 | ) | (0.5 | ) | (1.3 | ) | 2.3 | 2.3 | 4.8 | 2.5 | ||||||||||||||||||
Finance lease ROU asset amortization - real estate related | 17.8 | 17.8 | 17.4 | 69.5 | 69.5 | 73.9 | 77.4 | |||||||||||||||||||||
Non-real estate impairment | — | — | — | — | — | — | 7.1 | |||||||||||||||||||||
Impairment of intangible assets | — | — | — | 7.0 | 7.0 | — | — | |||||||||||||||||||||
Other nonoperating (income) expense, net | 0.7 | 0.7 | 0.2 | 19.4 | 19.4 | (2.3 | ) | (4.5 | ) | |||||||||||||||||||
Acquisition, restructuring and other | 8.7 | 8.7 | 14.7 | 522.6 | 72.9 | 72.3 | 136.9 | |||||||||||||||||||||
Technology transformation | 3.4 | 3.4 | — | — | — | — | — | |||||||||||||||||||||
(Gain) loss on foreign currency transactions, net | 10.7 | 10.7 | 1.3 | (3.9 | ) | (3.9 | ) | 23.8 | 34.0 | |||||||||||||||||||
(Gain) loss on extinguishment of debt | — | 6.5 | — | 8.4 | — | (1.4 | ) | 4.1 | ||||||||||||||||||||
Natural disaster and COVID | — | — | — | — | — | — | 1.7 | |||||||||||||||||||||
Allocation related to unconsolidated JVs | — | — | — | — | — | — | 0.5 | |||||||||||||||||||||
|
|
|
|
|
|
|
|
|
|
|
|
|
| |||||||||||||||
Core FFO | $ | 123.4 | $ | 86.3 | $ | 135.3 | $ | 433.4 | $ | 415.7 | $ | 400.2 | $ | 335.4 | ||||||||||||||
Adjustments: | ||||||||||||||||||||||||||||
Non-real estate depreciation and amortization | 100.0 | 100.0 | 75.8 | 334.5 | 334.5 | 288.4 | 263.0 | |||||||||||||||||||||
Finance lease ROU asset amortization - non-real estate | 6.5 | 6.5 | 5.9 | 23.7 | 23.7 | 14.3 | 13.8 | |||||||||||||||||||||
Amortization of deferred financing costs | 3.6 | 5.6 | 4.8 | 16.1 | 19.0 | 17.8 | 16.7 | |||||||||||||||||||||
Amortization of debt discount / premium | 0.2 | 0.2 | 0.8 | 1.5 | 1.5 | (0.8 | ) | (0.9 | ) | |||||||||||||||||||
Deferred income taxes expense (benefit) | (23.1 | ) | (22.9 | ) | (15.0 | ) | (74.1 | ) | (58.1 | ) | (41.6 | ) | (69.0 | ) | ||||||||||||||
Straight line net operating rent | (2.3 | ) | (2.3 | ) | 1.2 | 6.5 | 6.5 | 0.2 | 3.9 | |||||||||||||||||||
Amortization of above market leases | 0.2 | 0.2 | 0.5 | 1.4 | 1.4 | 2.1 | 2.3 | |||||||||||||||||||||
Amortization of below market leases | (0.2 | ) | (0.2 | ) | (0.4 | ) | (1.0 | ) | (1.0 | ) | (1.1 | ) | (1.7 | ) | ||||||||||||||
Stock-based compensation expense | 27.6 | 4.5 | 4.3 | 253.5 | 25.3 | 16.8 | 14.6 | |||||||||||||||||||||
Recurring maintenance capital expenditures | (29.9 | ) | (29.9 | ) | (29.9 | ) | (208.2 | ) | (208.2 | ) | (144.7 | ) | (111.8 | ) | ||||||||||||||
Allocation related to unconsolidated JVs | 0.6 | 0.6 | 0.4 | 3.0 | 3.0 | 0.4 | (0.4 | ) | ||||||||||||||||||||
Allocation of noncontrolling interests | (0.3 | ) | (0.3 | ) | (0.4 | ) | (1.0 | ) | (1.0 | ) | (0.1 | ) | (0.4 | ) | ||||||||||||||
|
|
|
|
|
|
|
|
|
|
|
|
|
| |||||||||||||||
Adjusted FFO | $ | 206.3 | $ | 148.3 | $ | 183.3 | $ | 789.3 | $ | 562.3 | $ | 551.9 | $ | 465.5 | ||||||||||||||
|
|
|
|
|
|
|
|
|
|
|
|
|
|
51
Table of Contents
We calculate EBITDA for Real Estate, or EBITDAre, in accordance with the standards established by the Board of Governors of NAREIT, defined as earnings before interest income or expense, taxes, depreciation and amortization, net loss or gain on sale of real estate, net of withholding taxes, impairment write-downs on real estate property and adjustment to reflect share of EBITDAre of partially owned entities. EBITDAre is a measure commonly used in our industry, and we present EBITDAre to enhance investor understanding of our operating performance. We believe that EBITDAre provides investors and analysts with a measure of operating results unaffected by differences in capital structures, capital investment cycles and useful life of related assets among otherwise comparable companies.
We also calculate our Adjusted EBITDA as EBITDAre further adjusted for the effects of gain or loss on the sale of non-real estate assets, other income or expense, acquisition, restructuring and other, foreign currency exchange gain or loss, stock-based compensation expense, loss or gain on debt extinguishment and modification, impairment of investments in non-real estate, natural disaster and COVID, and reduction in EBITDAre from partially owned entities. We believe that the presentation of Adjusted EBITDA provides a measurement of our operations that is meaningful to investors because it excludes the effects of certain items that are otherwise included in EBITDAre but which we do not believe are indicative of our core business operations. EBITDAre and Adjusted EBITDA are not measurements of financial performance under GAAP, and our EBITDAre and Adjusted EBITDA may not be comparable to similarly titled measures of other companies. You should not consider our EBITDAre and Adjusted EBITDA as alternatives to net income or cash flows from operating activities determined in accordance with GAAP. Our calculations of EBITDAre and Adjusted EBITDA have limitations as analytical tools, including:
• | these measures do not reflect our historical or future cash requirements for maintenance capital expenditures or growth and expansion capital expenditures; |
• | these measures do not reflect changes in, or cash requirements for, our working capital needs; |
• | these measures do not reflect the interest expense, or the cash requirements necessary to service interest or principal payments, on our indebtedness; |
• | these measures do not reflect our tax expense or the cash requirements to pay our taxes; and |
• | although depreciation and amortization are non-cash charges, the assets being depreciated and amortized will often have to be replaced in the future and these measures do not reflect any cash requirements for such replacements. |
52
Table of Contents
We use EBITDA, EBITDAre and Adjusted EBITDA as measures of our operating performance and not as measures of liquidity. The table below reconciles EBITDA, EBITDAre and Adjusted EBITDA to net (loss) income, which is the most directly comparable financial measure calculated in accordance with GAAP. The table below reconciles EBITDAre and Adjusted EBITDA to net income (loss), which is the most directly comparable financial measure calculated in accordance with GAAP.
Three Months Ended March 31, | Year Ended December 31, | |||||||||||||||||||||||||||
(in millions) | 2024 Pro Forma (Unaudited) | 2024 Historical (Unaudited) | 2023 Historical (Unaudited) | 2023 Pro Forma (Unaudited) | 2023 Historical | 2022 Historical | 2021 Historical | |||||||||||||||||||||
Net income (loss) | $ | (4.4 | ) | $ | (48.0 | ) | $ | 18.6 | $ | (536.6 | ) | $ | (96.2 | ) | $ | (76.0 | ) | $ | (176.5 | ) | ||||||||
Adjustments: | ||||||||||||||||||||||||||||
Depreciation and amortization expense | 211.1 | 211.1 | 181.2 | 759.7 | 759.7 | 677.2 | 603.7 | |||||||||||||||||||||
Interest expense, net | 82.6 | 138.8 | 114.7 | 277.4 | 490.4 | 347.0 | 259.6 | |||||||||||||||||||||
Income tax expense (benefit) | (12.1 | ) | (9.7 | ) | (2.6 | ) | (45.4 | ) | (13.9 | ) | 6.0 | (29.3 | ) | |||||||||||||||
|
|
|
|
|
|
|
|
|
|
|
|
|
| |||||||||||||||
EBITDA | $ | 277.2 | $ | 292.2 | $ | 311.9 | $ | 455.1 | $ | 1,140.0 | $ | 954.2 | $ | 657.5 | ||||||||||||||
Adjustments: | ||||||||||||||||||||||||||||
Net loss (gain) on sale of real estate assets | — | — | 1.2 | 7.8 | 7.8 | 4.0 | 1.0 | |||||||||||||||||||||
Impairment write-downs on real estate property | — | — | 0.3 | 1.7 | 1.7 | 0.6 | — | |||||||||||||||||||||
Net loss (gain) on sale of real estate and impairment write-downs of investments in unconsolidated affiliates | — | — | — | — | — | — | 0.2 | |||||||||||||||||||||
Allocation of EBITDAre of noncontrolling interests | (0.8 | ) | (0.8 | ) | (0.7 | ) | (2.2 | ) | (2.2 | ) | (5.3 | ) | (2.7 | ) | ||||||||||||||
|
|
|
|
|
|
|
|
|
|
|
|
|
| |||||||||||||||
EBITDAre | $ | 276.4 | $ | 291.4 | $ | 312.7 | $ | 462.4 | $ | 1,147.3 | $ | 953.5 | $ | 656.0 | ||||||||||||||
Adjustments: | ||||||||||||||||||||||||||||
Net (gain) loss on sale of non-real estate assets | (0.5 | ) | (0.5 | ) | (1.3 | ) | 2.3 | 2.3 | 4.8 | 2.5 | ||||||||||||||||||
Other nonoperating (income) expense, net | 0.7 | 0.7 | 0.2 | 19.4 | 19.4 | (2.3 | ) | (4.5 | ) | |||||||||||||||||||
Acquisition, restructuring and other | 8.7 | 8.7 | 14.7 | 522.6 | 72.9 | 72.3 | 136.9 | |||||||||||||||||||||
Technology transformation | 3.4 | 3.4 | — | — | — | — | — | |||||||||||||||||||||
Interest expense and tax expense from unconsolidated JVs | 0.3 | 0.3 | 0.9 | 2.9 | 2.9 | 3.0 | 1.0 | |||||||||||||||||||||
Depreciation and amortization expense from unconsolidated JVs | 0.9 | 0.9 | 1.0 | 5.3 | 5.3 | 3.7 | 3.9 | |||||||||||||||||||||
(Gain) loss on foreign currency transactions, net | 10.7 | 10.7 | 1.3 | (3.9 | ) | (3.9 | ) | 23.8 | 34.0 | |||||||||||||||||||
Stock-based compensation expense | 27.6 | 4.5 | 4.3 | 253.5 | 25.3 | 16.8 | 14.6 | |||||||||||||||||||||
(Gain) loss on extinguishment of debt | — | 6.5 | — | 8.4 | — | (1.4 | ) | 4.1 | ||||||||||||||||||||
Natural disaster and COVID | — | — | — | — | — | — | 1.7 | |||||||||||||||||||||
Non-real estate impairment | — | — | — | — | — | — | 7.1 | |||||||||||||||||||||
Impairment of intangible assets | — | — | — | 7.0 | 7.0 | — | — | |||||||||||||||||||||
Impairment write-downs of investments in unconsolidated JVs | — | — | — | — | — | — | 0.5 | |||||||||||||||||||||
Allocation adjustments of noncontrolling interests | — | — | — | (0.3 | ) | (0.3 | ) | 0.2 | — | |||||||||||||||||||
|
|
|
|
|
|
|
|
|
|
|
|
|
| |||||||||||||||
Adjusted EBITDA | $ | 328.2 | $ | 326.6 | $ | 333.8 | $ | 1,279.6 | $ | 1,278.2 | $ | 1,074.4 | $ | 857.8 | ||||||||||||||
|
|
|
|
|
|
|
|
|
|
|
|
|
|
53
Table of Contents
Net debt is a non-GAAP financial measure reflecting our gross debt (defined as total debt, net plus finance lease obligations, failed sale-leaseback financing obligations, deferred financing costs, above/below market debt, net and the Kloosterboer preference shares), less cash and cash equivalents. We calculated adjusted net debt as net debt further adjusted for the repayment of debt with the net proceeds of this offering. Adjusted net debt to Adjusted EBITDA is calculated using adjusted net debt as of period end divided by Adjusted EBITDA for the twelve months then ended. We use this ratio to evaluate our capital structure and financial leverage. This ratio is also commonly used in our industry, and we believe it provides investors, lenders and rating agencies a meaningful supplemental measure of our ability to repay and service our debt obligations. Other REITs may also calculate this ratio or other similarly-captioned metrics in a manner different than we do. The table below includes a reconciliation of net debt and adjusted net debt to total debt and debt-like obligation as of March 31, 2024, which is the most directly comparable financial measure calculated in accordance with GAAP. As of March 31, 2024, after giving effect to the repayment of debt with net proceeds of this offering, our ratio of total debt and debt-like obligations (defined as total debt, net plus finance lease obligations, failed sale-leaseback financing obligations and the Kloosterboer preference shares) to net income (loss) for the twelve months ended March 31, 2024 will be (47.4)x.
March 31, 2024 | ||||
(in millions) | As Adjusted (Unaudited) | |||
Total debt, net | $ | 9,267.7 | ||
Finance lease obligations | 1,361.1 | |||
Failed sale-leaseback financing obligations | 74.2 | |||
Kloosterboer preference shares(1) | 246.6 | |||
|
| |||
Total debt and debt-like obligations | $ | 10,949.6 | ||
|
| |||
Deferred financing costs | 21.9 | |||
Above/below market debt, net | 2.5 | |||
|
| |||
Gross debt | $ | 10,974.0 | ||
|
| |||
Cash and cash equivalents | 91.2 | |||
|
| |||
Net debt | $ | 10,882.8 | ||
Adjustment: | ||||
Offering net proceeds used to repay debt(2) | $ | 3,238.7 | ||
|
| |||
Adjusted net debt | $ | 7,644.1 | ||
|
| |||
Adjusted EBITDA (for the twelve months then ended)(3) | $ | 1,271.0 | ||
Adjusted net debt to Adjusted EBITDA | 6.0x |
(1) | In connection with this offering and the formation transactions, the Kloosterboer preference shares will be reclassified from redeemable noncontrolling interests to other long-term liabilities at fair value. We have therefore included such amount in total debt and debt-like obligations. |
(2) | In connection with this offering, our operating partnership will repay approximately $3,327.1 million of debt (inclusive of interest and fees) with the net proceeds of this offering. See “Use of Proceeds.” This adjustment represents the corresponding amount of such debt reflected on our balance sheet as of March 31, 2024. |
(3) | Adjusted EBITDA for the twelve months ended March 31, 2024 is calculated as the sum of Adjusted EBITDA for each of the three months ended June 30, 2023, September 30, 2023, December 31, 2023 and March 31, 2024. For a reconciliation of Adjusted EBITDA to net income (loss) for each of these periods, see “Management’s Discussion and Analysis of Financial Condition and Results of Operations—Quarterly Results of Operations and Other Data.” |
54
Table of Contents
Investing in our common stock involves risks. Before you invest in our common stock, you should carefully consider the risk factors below together with all of the other information included in this prospectus. If any of the risks discussed in this prospectus were to occur, our business, financial condition, liquidity, results of operations and prospects and our ability to service our debt and make distributions to our stockholders could be materially and adversely affected (which we refer to collectively as “materially and adversely affecting us” or having “a material adverse effect on us” and comparable phrases), the market price of our common stock could decline significantly and you could lose all or part of your investment in our common stock. Some statements in this prospectus, including statements in the following risk factors, constitute forward-looking statements. Please refer to the section in this prospectus entitled “Special Note Regarding Forward-Looking Statements.”
Risks Related to Our Business and Operations
Our investments are concentrated in the temperature-controlled warehouse industry, and our business would be materially and adversely affected by an economic downturn in that industry or the market for our customers’ products.
Our investments in real estate assets are concentrated in the industrial real estate industry, specifically in temperature-controlled warehouses. This concentration exposes us to the risk of economic downturns in this industry to a greater extent than if our business activities included a more significant portion of other sectors of the real estate market. We are also exposed to fluctuations in the markets for, and production of, the commodities and finished products that we store in our warehouses. For example, the demand for seafood, packaged foods and proteins such as poultry, pork and beef and the production of such products directly impacts the need for temperature-controlled warehouse space to store such products for our customers. Although our customers collectively store a diverse product mix in our temperature-controlled warehouses, declines in production of or demand for their products could cause our customers to reduce their inventory levels at and throughput through our warehouses, which could reduce the storage, handling and other fees payable to us and materially and adversely affect us.
The temperature-controlled warehouses that comprise our global warehousing business are concentrated in certain geographic areas, some of which are particularly susceptible to adverse local conditions. Our inability to quickly and effectively restore operations following adverse weather or a localized disaster, or economic or other disturbance in a key geography could materially and adversely affect us.
Although we own or hold leasehold interests in warehouses across the United States and globally, many of these warehouses are concentrated in a few geographic areas. For example, approximately 9% of our owned or leased warehouses were located in Washington, 8% were in the Netherlands, 8% were in California, 6% were in Texas and 6% were in Illinois (in each case, on a cubic-foot basis based on information as of March 31, 2024). This geographic concentration could adversely affect our operating performance if conditions become less favorable in any of the states or markets within such states in which we have a concentration of properties. We cannot assure you that any of our markets will grow, not experience adverse developments or that underlying real estate fundamentals will be favorable to owners and operators of service-oriented or experience-based properties. Our operations may also be affected if competing properties are built in our markets. Local conditions may include natural disasters, periods of economic slowdown or recession, regulatory changes, labor shortages or strikes, localized oversupply in warehousing space or reductions in demand for warehousing space, adverse agricultural events, road or rail line closures, disruptions in logistics systems, such as transportation and tracking systems for our customers’ inventory, and power outages.
We also maintain facilities in areas that may be susceptible to natural disasters or other serious disruptions caused by record or sustained high temperatures, fire, earthquakes, or other causes that may spoil, damage or destroy a significant portion of customer inventory. In addition, adverse weather patterns may affect local
55
Table of Contents
harvests, which could have an adverse effect on our customers and cause them to reduce their inventory levels at our warehouses, which could in turn materially and adversely affect us. Our inability to quickly and effectively restore operations following adverse weather or a localized disaster, or economic or other disturbance in a key geography could materially and adversely affect us. Although our property insurance typically insures us against such risks, these policies are subject to deductibles and customary exclusions, and there can be no assurance that such potential liability will not exceed the applicable coverage limits under our insurance policies.
Global market and economic conditions may materially and adversely affect us.
Adverse economic conditions such as high unemployment levels, interest rates, tax rates and fuel and energy costs may have an impact on the results of operations and financial conditions. The success of our business will be affected by general economic and market conditions, as well as by changes in laws, currency exchange controls and national and international political, environmental and socio-economic circumstances. Specifically, our business operations are sensitive to the systemic impact of inflation, the availability and cost of credit, declines in the real estate market, increases in fuel, energy and power costs and geopolitical issues. A severe or prolonged economic downturn may adversely impact the general availability of credit to businesses and could lead to a weakening of the U.S. and global economies. While it is difficult to determine the breadth and duration of any unfavorable market or economic conditions and the many ways in which they may affect our customers and our business in general, unfavorable market or economic conditions may result in:
• | changes in consumer trends, demand and preferences for products we store in our warehouses; |
• | customer defaults on their contracts with us; |
• | reduced demand for our warehouse space, increased vacancies at our warehouses and a reduced ability, or an inability, to retain our customers or acquire new customers; |
• | reduced demand for the other supply chain services that comprise our integrated solutions business; |
• | lower rates from, and economic concessions to, our customers; |
• | increased operating costs, including increased energy, labor and fuel costs, and supply-chain challenges; |
• | our inability to raise capital on favorable terms, or at all, when desired; |
• | decreased value of our properties and related impact on our ability to obtain attractive prices on sales or to obtain debt financing; and |
• | illiquidity and decreased value of our short-term investments and cash deposits. |
Any of the foregoing events could result in substantial or total losses to our business in respect of certain properties, which will likely be exacerbated by the terms of our indebtedness.
Many of our costs, such as operating expenses, interest expense and real estate acquisition and construction costs, could be adversely impacted by periods of heightened inflation.
Inflation in North America, Europe and the Asia-Pacific region has risen to levels not experienced in recent decades and we are seeing its impact on various aspects of our business. Certain of our expenses, including, but not limited to, labor costs, utility costs (power in particular), interest expense, property taxes, insurance premiums, equipment repair and replacement, and other operating expenses are subject to inflationary pressures that have and may continue to negatively impact our business and results of operations. While we seek to reduce the impact of inflation by increased operating efficiencies and embedded rate escalation or price increases to our customers to offset increased costs and while regulators’ efforts to reduce inflation have been achieved varying levels of success, there can be no assurance that we will be able to offset future inflationary cost increases in whole or in part, which could adversely impact our profit margins. We may be limited in our ability to obtain
56
Table of Contents
reimbursement from customers under existing contracts for any increases in operating expenses such as labor, electricity charges, maintenance costs, taxes, including real estate and income taxes, or other real estate-related costs. Unless we are able to offset any unexpected costs in a timely manner, or at all, with sufficient revenues through new contracts or new customers, increases in these costs would lower our operating margins and could materially and adversely affect us.
Additionally, inflation may have a negative effect on the construction costs necessary to complete our greenfield development and expansion projects, including, but not limited to, costs of construction materials, labor and services from third-party contractors and suppliers. We rely on a number of third-party suppliers and contractors to supply raw materials, skilled labor and services for our construction projects. Notwithstanding our efforts to manage certain increases in the costs of construction materials in our greenfield development and expansion projects through either general budget contingencies built into our overall project construction costs estimates or guaranteed maximum price construction contracts (which stipulate a maximum price for certain construction costs and shift inflation risk to our construction general contractors), no assurance can be given that our budget contingencies would accurately account for potential construction cost increases given the current severity of inflation and variety of contributing factors, or that our general contractors would be able to absorb such increases in costs and complete our construction projects timely, within budget, or at all.
Higher construction costs could adversely impact our investments in real estate assets and expected yields on our greenfield development and expansion projects, which may make otherwise lucrative investment opportunities less profitable to us. Our reliance on a number of third-party suppliers and contractors may also make such investment opportunities unattainable if we are unable to sufficiently fund our projects due to significant cost increases, or are unable to obtain the resources and materials to do so reasonably due to disrupted supply chains. As a result, our business, financial condition, results of operations, cash flows, liquidity and ability to satisfy our debt service obligations and to pay dividends and distributions to security holders could be adversely affected over time.
In March 2022, the Federal Reserve began, and it has continued and may continue, to raise interest rates in an effort to curb inflation. Our exposure to increases in interest rates in the short term is limited to our variable-rate borrowings, which consist of borrowings under our Revolving Credit Facility, our Term Loan and our CMBS loans. As of March 31, 2024, on a pro forma basis after giving effect to the formation transactions, this offering and the use of the net proceeds from this offering, we had $3.9 billion of our outstanding consolidated indebtedness that is variable-rate debt. However, the effect of inflation on interest rates could increase our financing costs over time, either through near-term borrowings on our floating-rate lines of credit or refinancing of our existing borrowings that may incur higher interest expenses related to the issuance of new debt. For more information, see “Risk Factors—Risks Related to Our Indebtedness—Increases in interest rates could increase the amount of our debt payments.”
In addition, historically, during periods of increasing interest rates, real estate valuations have generally decreased as a result of rising capitalization rates, which tend to be positively correlated with interest rates. Consequently, prolonged periods of higher interest rates may negatively impact the valuation of our portfolio and result in the decline of the quoted trading price of our securities and market capitalization, as well as lower sales proceeds from future dispositions.
Labor shortages, increased turnover and work stoppages have in the past and may in the future continue to disrupt our or our customers’ operations, increase costs and negatively impact our profitability.
We hire our own workforce to handle product in and out of storage for our customers in most of our facilities. Our ability to successfully implement our business strategy depends upon our ability to attract and retain talented people and effectively manage our human capital. The labor markets in the industries in which we operate are competitive, and we have historically experienced some level of ordinary course turnover of employees. A number of factors have had and may continue to have adverse effects on the labor force available
57
Table of Contents
to us, including reduced employment pools and shortages in other industries with which we compete for labor, government regulations, which include laws and regulations related to workers’ health and safety, wage and hour practices and immigration. In addition, we seek to optimize our mix of permanent and temporary team members in our facilities, as temporary team members typically result in higher costs and lower efficiency. Labor shortages and increased turnover rates within our team member ranks have led to and could in the future lead to increased costs, such as increased overtime to meet demand, increased time and resources related to training new team members, and increased wage rates to attract and retain team members, and could negatively affect our ability to efficiently operate our facilities or otherwise operate at full capacity. An overall or prolonged labor shortage, lack of skilled labor, inability to maintain a stable mix of permanent to temporary team members, increased turnover and labor cost inflation could have a material adverse impact on us. In addition, we may not be able to succesfully implement our labor productivity and lean operating principles initiatives, which may impede our growth.
Furthermore, certain portions of our operations are subject to collective bargaining agreements. As of March 31, 2024, fewer than 5% of our team members in the United States were represented by various local labor unions and associations. Globally (including the United States), approximately 17% (based on team members for whom we are able to ascertain union status) or 26% (assuming that the entire 9% of our team members for whom we are not able to ascertain union status due to applicable privacy or freedom of association laws are represented by labor unions and associations) of our total team members were represented by various local labor unions and associations. Strikes, slowdowns, lockouts or other industrial disputes could cause us to experience a significant disruption in our operations, as well as increase our operating costs, which could materially and adversely affect us. If a greater percentage of our workforce becomes unionized, or if we fail to re-negotiate our expired or expiring collective bargaining agreements on favorable terms in a timely manner or at all, we could be materially and adversely affected.
In addition, our customers’ operations are subject to labor shortages and disruptions that could continue to negatively impact their production capability, resulting in reduced volume of product for storage. In addition, labor shortages and disruptions impacting the transportation industry may hamper the timely movement of goods into and out of our warehouses. These labor shortages and disruptions could in turn have a material adverse effect on us.
Wage increases driven by competitive pressures or applicable legislation on employee wages and benefits could negatively affect our operating margins and our ability to attract qualified personnel.
Our hourly team members in the United States and internationally are typically paid wage rates above the applicable minimum wage. However, increases in the minimum wage may increase our labor costs if we are to continue paying our hourly team members above the applicable minimum wage. If we are unable to continue paying our hourly team members above the applicable minimum wage or at otherwise competitive wages, we may be unable to hire and retain qualified personnel. For example, beginning in 2020 and through 2023, we saw wage inflation on a global basis at all levels in our organization, which increased labor costs. For each of the years ended December 31, 2023, 2022 and 2021, labor and benefits expenses in our global warehousing segment accounted for 36.4%, 37.0% and 37.6% of the segment’s revenues, respectively, and for the three months ended March 31, 2024 and 2023, labor and benefits expenses in our global warehousing segment accounted for 36.6% and 35.7%, respectively, of the segment’s revenues. Increases in the rates we pay our team members would negatively affect our operating margins unless we are able to increase our income streams in order to pass increased labor costs on to our customers. Our standard contract forms include some rate protection for uncontrollable costs such as labor, or costs associated with regulatory action, however, despite such provisions, we may not be able to fully pass through these increased costs.
Competitive pressures may also require that we enhance our pay and benefits package to compete effectively for such personnel (including costs associated with health insurance coverage or workers’ compensation insurance) or offer retention bonuses. If we fail to attract and retain qualified and skilled personnel, we could be materially and adversely affected.
58
Table of Contents
Supply chain disruptions may continue to negatively impact our business.
Our business has been impacted by ongoing supply chain disruptions, which have impacted, among other things, labor availability, raw material availability, manufacturing and food production, construction materials and transportation, including increased costs, reduced options, and timing delays with respect to the foregoing. Continued disruptions in the supply chain impacting the availability of materials, causing delays in manufacturing and production, including in our customers’ products, shipping delays and other supply chain problems could materially and adversely impact us.
We are exposed to risks associated with expansion and development, which could result in returns below expectations and unforeseen costs and liabilities.
We have engaged and we expect to continue to engage, in expansion and development activities, including greenfield development and expansion projects, with respect to certain of our properties. Expansion and development activities will subject us to certain risks not present in the acquisition of existing properties (the risks of which are described below), including, without limitation, the following:
• | our pipeline of expansion and development opportunities is at various stages of discussion and consideration and, based on historical experiences, many of them may not be pursued or completed as contemplated or at all; |
• | the availability and timing of financing on favorable terms or at all; |
• | the availability and timely receipt of environmental studies and entitlement, zoning and regulatory approvals, which could result in increased costs and could require us to abandon our activities entirely with respect to any given warehouse for which we are unable to obtain permits or authorizations; |
• | the cost and timely completion within budget of construction due to increased land, materials, equipment, labor or other costs (including risks beyond our control, such as strikes, uninsurable losses, weather or labor conditions, or material shortages), which could make completion of any given warehouse or the expansion thereof uneconomical, and we may not be able to increase revenues to compensate for the increase in construction costs; |
• | we may be unable to complete construction of a warehouse or the expansion thereof on schedule due to the availability of labor, equipment or materials or other factors outside of our control, resulting in increased debt service expense and construction costs; |
• | supply chain disruptions or delays in receiving materials or support from vendors or contractors could impact the timing of stabilization of expansion and development projects; |
• | the potential that we may expend funds on and devote management time and attention to projects which we do not complete; |
• | newly developed properties do not have an operating history that would allow objective pricing decisions in determining whether to invest our capital in such properties; |
• | market conditions may change during the course of development, which may make such development less attractive than at the time it was commenced; |
• | a completed expansion project or a newly-developed warehouse may fail to achieve, or take longer than anticipated to achieve, expected occupancy rates and may fail to perform as expected; |
• | we may not be able to successfully integrate expanded or newly-developed properties; |
• | projects to automate our existing or new warehouses may not perform as expected or achieve the anticipated operational efficiencies; and |
• | we may not be able to achieve targeted returns and budgeted stabilized returns on invested capital on our expansion and development opportunities due to the risks described above, and an expansion or development may not be profitable and could lose money. |
59
Table of Contents
These risks could create substantial unanticipated delays and expenses and, in certain circumstances, prevent the initiation or completion of expansion or development as contemplated or at all, any of which could materially and adversely affect us.
The actual initial full year stabilized NOI yields from our greenfield development and expansion projects may not be consistent with the targeted NOI yield ranges set forth in this prospectus.
As of March 31, 2024, we had 25 greenfield development and expansion projects that had been completed since March 31, 2021 and eight greenfield development and expansion projects under construction. As a part of our standard development and expansion underwriting process, we analyze the estimated initial full year stabilized NOI yield we expect to derive from each greenfield development project and the estimated incremental initial full year stabilized NOI yield we expect to derive from each expansion project, as applicable, and establish a targeted NOI yield range. We define estimated initial full year stabilized NOI yield as the percentage of the total estimated cost to complete the greenfield development or expansion project represented by the estimated initial full year stabilized NOI from the greenfield development project or the estimated incremental initial full year stabilized NOI from the expansion project. For greenfield development projects, we calculate the estimated initial full year stabilized NOI by subtracting the greenfield development project’s estimated initial full year stabilized operating expenses (before interest expense, income taxes (if any) and depreciation and amortization) from its estimated initial full year stabilized revenue. For expansion projects, we calculate the estimated incremental initial full year stabilized NOI by subtracting the expansion project’s estimated incremental initial full year stabilized operating expenses (before interest expense, income taxes (if any) and depreciation and amortization) from its estimated incremental initial full year stabilized revenue.
We caution you not to place undue reliance on the targeted NOI yield ranges for our greenfield development and expansion projects because they are based solely on our estimates, using data currently available to us in our development and expansion underwriting processes. For our greenfield development and expansion projects under construction, our total cost to complete the project may differ substantially from our estimates due to various factors, including unanticipated expenses, delays in the estimated start and/or completion date and other contingencies. In addition, our actual initial full year stabilized NOI from our greenfield development and expansion projects may differ substantially from our estimates based on numerous other factors, including delays and/or difficulties in leasing or stabilizing the facilities, failure to achieve estimated occupancy and rental rates, inability to collect anticipated revenues, customer bankruptcies and unanticipated expenses at the facilities that we cannot pass on to customers. We can provide no assurance that the actual initial full year stabilized NOI yields from our greenfield development and expansion projects will be consistent with the targeted NOI yield ranges set forth in this prospectus.
Our future greenfield development and expansion activity may not be consistent with the estimates relating to our future long-term pipeline set forth in this prospectus.
As of March 31, 2024, we were researching or underwriting a range of greenfield development and expansion opportunities as part of our future long-term pipeline, including 16 projects globally at various phases of research and underwriting, with an estimated construction cost of approximately $1.9 billion and potential contribution of approximately 4.1 million square feet, approximately 246 million cubic feet and approximately 748 thousand pallet positions. The projects in our future long-term pipeline include both projects where we already own the land and projects for which we will need to acquire incremental land.
We caution you not to place undue reliance on the projections relating to our future long-term pipeline because they are based solely our estimates, using data currently available to us, and our business plans as of the date of this prospectus. Our actual greenfield development and expansion activity may differ substantially from our projections based on numerous factors, including our inability to acquire the necessary incremental land or obtain necessary zoning, land use and other required entitlements, as well as building and other required governmental permits and authorizations, and changes in the entitlement, permitting and authorization processes
60
Table of Contents
that may restrict or delay our ability to execute on our future long-term pipeline. Moreover, we may strategically choose not to execute on our future long-term pipeline or be unable to do so as a result of factors beyond our control, including our inability to obtain financing on terms and conditions that we find acceptable, or at all, and fund our development and expansion activities. We can provide no assurance that actual greenfield development and expansion activity and/or any particular project will be consistent with the projections for our future long-term pipeline set forth in this prospectus.
The short-term nature and lack of minimum storage guarantees in many of our customer contracts exposes us to certain risks that could have a material adverse effect on us.
For the twelve months ended March 31, 2024, approximately 41.8% of our storage revenues were generated from agreements with customers that contained minimum storage guarantees. However, despite such guarantees, in the event a customer were to terminate such a contract with us, our remedies are typically limited to the amount of the guarantee.
Our customer contracts that do not contain minimum storage guarantees typically do not require our customers to utilize a minimum number of pallet positions or provide for guaranteed fixed payment obligations from our customers to us. As a result, most of our customers may discontinue or otherwise reduce their use of our warehouses or other services in their discretion at any time which could have a material adverse effect on us. Additionally, we have discrete pricing for our customers based upon their unique profiles. Therefore, a shift in the mix of business types or customers could negatively impact our financial results.
The storage and other fees we generate from customers with month-to-month warehouse rate agreements may be adversely affected by declines in market storage and other fee rates more quickly than with respect to our contracts that contain stated terms. There also can be no assurance that we will be able to retain any customers upon the expiration of their contracts (whether month-to-month warehouse rate agreements or contracts) or leases. If we cannot retain our customers, or if our customers that are not party to contracts with minimum storage guarantees elect not to store goods in our warehouses, we may be unable to find replacement customers on favorable terms or at all or on a timely basis and we may incur significant expenses in obtaining replacement customers and repositioning warehouses to meet their needs. Any of the foregoing could materially and adversely affect us.
In addition, while we plan to expand our use of contracts with minimum storage guarantees, there can no assurance that we will be able to do so or that that strategy will result in increases in recurring revenue, enhanced stability of cash flows or increases in our economic occupancy, which could impede our growth.
Our integrated solutions business depends on the performance of our global warehousing business.
Our integrated solutions business complements our global warehousing services. For example, within transportation, which is the largest area within our integrated solutions business, our core focus areas are multi-vendor less-than-full-truckload consolidation, transportation brokerage and drayage services to and from ports. Because we provide this integrated solutions business to our warehouse customers, the success of our integrated solutions business depends on the performance of our global warehousing business. A reduction in the number of our customers or in our customers’ inventory or throughput levels for any reason could in turn result in reduced demand for our integrated solutions services, which may adversely affect our operations.
Our growth may strain our management and resources, which may have a material adverse effect on us.
We have grown rapidly in recent years, including by expanding our internal resources, undertaking expansion and development projects, making acquisitions, providing expanded service offerings and entering new markets. Our growth has, and may continue to, place a strain on our management, operational, financial and information systems, and procedures and controls to expand, train and control our employee base. Our need for working capital will increase as our operations grow. There can be no assurance that we will be able to adapt our
61
Table of Contents
portfolio management, administrative, accounting, IT and operational systems to support any growth we may experience. Failure to oversee our current portfolio of properties and manage our growth effectively, or to obtain necessary working capital and funds for capital improvements, could have a material adverse effect on us. In addition, our inability to obtain necessary working capital and funds for capital improvements or to successfully deploy capital on accretive projects could impede our growth.
A portion of our future growth depends upon acquisitions and we may be unable to identify, complete and successfully integrate acquisitions, which may impede our growth, and our future acquisitions may not achieve their intended benefits or may disrupt our plans and operations.
We have executed on 116 acquisitions since our first acquisition in 2008 through March 31, 2024, of which 75 were executed in the four years since 2020. Our ability to expand through acquisitions requires us to identify and complete acquisitions that are compatible with our growth strategy and to successfully integrate and operate these newly-acquired companies and/or properties. We continually evaluate acquisition opportunities but cannot guarantee that suitable opportunities currently exist or will exist in the future. In addition, future acquisitions may generate lower returns than past acquisitions and past acquisitions may not generate the same returns as they did previously. Our ability to identify and complete acquisitions of suitable companies and/or properties on favorable terms, or at all, and to successfully integrate and operate them to meet our financial, operational and strategic expectations may be constrained by the following risks, among others:
• | we face competition from other real estate investors with significant capital, including REITs and institutional investment funds, which may be able to accept more risk than we can prudently manage, including risks associated with paying higher acquisition prices; |
• | we face competition from other potential acquirers that may significantly increase the purchase price for a company and/or property we acquire, which could reduce our growth prospects or returns; |
• | we may incur significant costs and divert management’s attention in connection with evaluating and negotiating potential acquisitions, including ones that we are subsequently unable to complete; |
• | we may acquire companies or properties that are not accretive to our operating and financial results upon acquisition, and we may be unsuccessful in integrating and operating such companies or properties in accordance with our expectations; |
• | our cash flow from an acquired company or property may be insufficient to meet our required principal and interest payments with respect to any debt used to finance the acquisition of such company or property; |
• | we may discover unexpected items, such as unknown liabilities, during our due diligence investigation of a potential acquisition or other customary closing conditions may not be satisfied, causing us to abandon an acquisition opportunity after incurring expenses related thereto; |
• | we may face opposition from governmental authorities or third parties alleging that potential acquisition transactions are anti-competitive, and as a result, we may have to spend a significant amount of time and expense to respond to related inquiries, or governmental authorities may prohibit the transaction or impose terms or conditions that are unacceptable to us; |
• | we may fail to obtain the necessary regulatory approvals or other approvals required in connection with any potential acquisition or we may fail to satisfy certain conditions required to complete a transaction in a timely manner; |
• | we may be required to acquire a company and/or property through one or more of our taxable REIT subsidiary, or TRS, entities, but no more than 20% of the value of our gross assets may consist of securities in TRSs, and as a result, compliance with these requirements could limit our ability to complete a transaction; |
62
Table of Contents
• | we may fail to discover design or construction defects of an acquired property following the completion of an acquisition that may require unforeseen capital expenditures, special reports or maintenance expenses; |
• | we may fail to obtain financing for an acquisition on favorable terms or at all; |
• | we may be unable to make, or may spend more than budgeted amounts to make, necessary improvements or renovations to acquired properties; |
• | we may spend more than budgeted amounts to meet customer specifications on a newly-acquired warehouse; |
• | market conditions may result in higher than expected vacancy rates and lower than expected storage charges, rent or fees from our global warehousing business and lower utilization of and revenue from our integrated solutions business; |
• | engineering, seismic and other reports on which we rely as part of our pre-acquisition due diligence investigations of these properties may be inaccurate or deficient, at least in part because defects may be difficult or impossible to ascertain; or |
• | we may, without any recourse, or with only limited recourse, acquire properties subject to liabilities, such as liabilities for clean-up of undisclosed environmental contamination, defects of design, construction, title or other problems, claims by employees, customers, vendors or other persons dealing with the former owners of the properties, liabilities incurred in the ordinary course of business and claims for indemnification by general partners, directors, officers and others indemnified by the former owners of the properties. |
If any of the foregoing risks were to materialize, they could materially and adversely affect us.
We may be unable to successfully expand our operations into new markets or new lines of business.
If the opportunity arises, we may acquire or develop properties in new markets. In addition to the risks described above relating to our acquisition, expansion and development activities, the acquisition, expansion or development of properties in new markets will subject us to the risks associated with a lack of understanding of the related economy and unfamiliarity with government and permitting procedures. We will also not possess the same level of familiarity with the dynamics and market conditions of any new market that we may enter, which could adversely affect our ability to successfully expand and operate in such market. We may be unable to build a significant market share or achieve a desired return on our investments in new markets. If we are unsuccessful in expanding and operating in new, high-growth markets, it could have a material adverse effect on us.
In addition, from time to time, we may develop, grow and/or acquire new lines of business or offer new services within existing lines of business. There are substantial risks and uncertainties associated with these efforts, particularly in instances where the markets for these services are not fully developed. In developing and marketing new lines of business and/or new services, we may invest significant time and resources. Initial timetables for the introduction and development of new lines of business and/or new services may not be achieved, and price and profitability targets may not prove feasible. External factors, such as compliance with regulations, competitive alternatives and shifting market preferences, may also impact the successful implementation of a new line of business or a new service. Furthermore, the burden on management and our IT of introducing any new line of business and/or new service could have a significant impact on the effectiveness of our system of internal controls. Failure to successfully manage these risks in the development and implementation of new lines of business or new services could have a material adverse effect on us.
We are dependent on Bay Grove to provide certain services to us pursuant to the transition services agreement, and it may be difficult to replace the services provided under such agreement.
Historically, we have relied on Bay Grove to provide certain operating, consulting, strategic development and financial services, including advice and assistance concerning operational aspects of Lineage Holdings and its
63
Table of Contents
subsidiaries, and we will continue to rely on Bay Grove for transition services supporting capital deployment and mergers and acquisitions activity for three years following the initial closing of this offering pursuant to the transition services agreement that we plan to enter into with Bay Grove in connection with this offering. See “Certain Relationships and Related Party Transactions—Transition Services Agreement.” In addition, it may be difficult for us to replace the services provided by Bay Grove under the transition services agreement, and the terms of any agreements to replace such services may be less favorable to us. Any failure by Bay Grove in the performance of such services, or any failure on our part to successfully transition these services away from Bay Grove by the expiration of the transition services agreement, could materially harm our business and financial performance.
We can only terminate the transition services agreement with Bay Grove under limited circumstances and will be required to pay fees thereunder even if Bay Grove does not perform the services required.
The transition services agreement that we plan to enter into with Bay Grove in connection with this offering will provide that the agreement can only be terminated by mutual written consent of us and Bay Grove or by us for cause (as defined in the transition services agreement), which does not include any failure of Bay Grove to provide services under the agreement. Accordingly, even if Bay Grove were to fail to provide the services required pursuant to the transition services agreement, we would be obligated to pay Bay Grove $8 million per year for the term of the agreement. In such event, we could incur operational difficulties or losses, including the incurrence of additional costs to transition such services, that could have a material and adverse effect on us.
We will have uncapped expense payment and indemnification obligations with respect to various costs incurred by BGLH, Bay Grove and their affiliates.
In connection with this offering, Lineage Holdings will have entered into an expense reimbursement and indemnification agreement with BGLH, the LHR and Bay Grove, pursuant to which Lineage Holdings will agree to (i) advance to or reimburse such entities for all of their expenses in any way related to our company, including expenses incurred in connection with the coordinated settlement process that will occur for up to three years for all legacy investors in both BGLH and our operating partnership, and (ii) indemnify such entities to the fullest extent permitted by applicable law against liabilities that may arise in any way related to our company, including liabilities incurred in connection with or as a result of the coordinated settlement process. There is no limit to the amounts we may be required to pay under this agreement. Accordingly, there can be no assurance that our future payment obligations under this agreement will not have a material adverse effect on us.
We have no experience operating as a publicly traded REIT.
We have no experience operating as a publicly traded REIT. As a publicly traded REIT, we will be required to develop and implement substantial control systems, policies and procedures in order to maintain our REIT qualification and satisfy our periodic SEC reporting, SEC compliance and Nasdaq listing requirements. We cannot assure you that our management’s past experience will be sufficient to successfully develop and implement these systems, policies and procedures and to operate our company as a publicly traded REIT. Any difficulty we have in operating as a publicly traded REIT in compliance with these requirements could subject us to significant fines, sanctions and other liabilities and jeopardize our status as a REIT or as a public company listed on Nasdaq, which could materially and adversely affect us. See also “Risk Factors—Risks Related to Our REIT Status and Other Tax Risks—Failure to qualify as a REIT would cause us to be taxed as a regular C corporation, which would substantially reduce funds available for distributions to stockholders.”
Pandemics or disease outbreaks, and associated responses, may disrupt our business, including among other things, increasing our costs, impacting our supply chain, and impacting demand for cold storage, which could have a material adverse impact on our business.
We face various risks and uncertainties related to public health crises, including:
• | supply chain disruptions; |
64
Table of Contents
• | potential work stoppages, including stoppages due to spread of the disease among our team members or our customers’ work forces or due to shutdowns that may be requested or mandated by governmental authorities; |
• | labor unrest, including unrest due to risks of disease from working with other team members and outside vendors; |
• | economic impacts, including increased labor costs, from mitigation and other measures undertaken by us and/or third parties to support and protect our team members or the food supply; |
• | completing developments on time or an inability of our contractors to perform as a result of spread of disease among team members of our contractors and other construction partners, travel restrictions or due to shutdowns that may be requested or mandated by governmental authorities; |
• | limiting the ability of our customers to comply with the terms of their contracts with us, including making timely payments to us, due to, among other factors, labor shortages impacting our customers’ ability to manufacture and transport product; |
• | limiting the ability of our suppliers and partners to comply with the terms of their contracts with us, including in making timely delivery of supplies to us necessary for the operation of our temperature-controlled warehouses; |
• | long-term volatility in or reduced demand for temperature-controlled warehouse storage and related handling and other warehouse services; |
• | adverse impact on the value of our real estate; and |
• | reduced ability to execute our growth strategies, including identifying and completing acquisitions and expanding into new markets. |
The extent to which a public health emergency impacts our operations will depend on future developments, which are highly uncertain and cannot be predicted with any degree of confidence, including the scope, severity, duration and geographies of the outbreak, the actions taken or not taken to contain the outbreak or mitigate its impact requested or mandated by governmental authorities or otherwise voluntarily taken or not taken by individuals or businesses, and the direct and indirect economic effects of the illness and containment measures, among others.
We may be vulnerable to security breaches or cyber-attacks which could disrupt our operations and have a material adverse effect on our financial condition and operating results.
We rely extensively on information systems to process transactions, operate and manage our business. Our ability to efficiently manage our business depends significantly on the reliability and capacity of these systems. The risk of a security breach or disruption, particularly through cyber-attack or cyber intrusion, including by computer hackers, foreign governments and cyber terrorists, has generally increased as the number, intensity and sophistication of attempted attacks and intrusions from around the world have increased. Our IT networks and related systems are essential to the operation of our business and our ability to perform day-to-day operations (including managing and operating our warehouses and our integrated solutions business), and, in some cases, may be critical to the operations of our customers. The failure of our IT systems to perform as anticipated, and the failure to integrate disparate systems effectively or to collect data accurately and consolidate it a useable manner efficiently could adversely affect our business through transaction errors, billing and invoicing errors, processing inefficiencies or errors and loss of sales, receivables, collections and customers, in each case, which could result in reputational damage and have an ongoing adverse effect on our business, results of operation and financial condition.
We recognize the increasing volume of cyber-attacks and employ commercially practical efforts to provide reasonable assurance such attacks are appropriately mitigated. We may be required to expend significant financial resources and management time to protect against or respond to such breaches. Techniques used to
65
Table of Contents
breach security change frequently and are generally not recognized until launched against a target, so we may not be able to promptly detect that a security breach or unauthorized access has occurred. We also may not be able to implement security measures in a timely manner or, if and when implemented, we may not be able to determine the extent to which these measures could be circumvented. If an actual or perceived security breach occurs, the market’s perception of our security measures could be harmed and we could lose current and potential tenants, and such a breach could be harmful to our brand and reputation. Any breaches that may occur could expose us to increased risk of lawsuits, material monetary damages, potential violations of applicable privacy and other laws, penalties and fines, harm to our reputation and increases in our security and insurance costs. In the event of a breach resulting in loss of data, such as personally identifiable information or other such data protected by data privacy or other laws, we may be liable for damages, fines and penalties for such losses under applicable regulatory frameworks despite not handling the data. We cannot guarantee that any backup systems, regular data backups, security protocols, network protection mechanisms and other procedures currently in place, or that may be in place in the future, will be adequate to prevent network and service interruption, system failure, damage to one or more of our systems or data loss in the event of a security breach or attack. In addition, our customers rely extensively on computer systems to process transactions and manage their businesses and thus their businesses are also at risk from, and may be impacted by, cybersecurity attacks. An interruption in the business operations of our customers or a deterioration in their reputation resulting from a cybersecurity attack could indirectly impact our business operations. We carry insurance, including cyber insurance, commensurate with the size and nature of our operations; however, there can be no assurance that such potential liability will not exceed the applicable coverage limits under our insurance policies.
However, there can be no assurance that our efforts to maintain the security and integrity of these types of IT networks and related systems will be effective or that attempted security breaches or disruptions would not be successful or damaging. Like other businesses, we have been and expect to continue to be subject to unauthorized access, mishandling or misuse, computer viruses or malware, cyber-attacks and other events of varying degrees. Historically, these events have not significantly affected our operations or business and were not individually or in the aggregate material. While these incidents did not have a material impact on us, there can be no assurance that future incidents will not have a material adverse effect on us.
We depend on IT systems to operate our business, and issues with maintaining, upgrading or implementing these systems, could have a material adverse effect on our business.
We rely on the efficient and uninterrupted operation of IT systems to process, transmit and store electronic information in our day-to-day operations. All IT systems are vulnerable to damage or interruption from a variety of sources. Our business has grown in size and complexity; this has placed, and will continue to place, significant demands on our IT systems. In connection with this growth, we rely on 81 fully-and semi-automated facilities in a traditionally analog industry. To effectively manage this growth, our information systems and applications require an ongoing commitment of significant resources to maintain, protect, enhance and upgrade existing systems and develop and implement new systems to keep pace with changing technology and our business needs. Since the start of 2019, we have invested more than $725 million into transformational technology initiatives, which include developing, acquiring and deploying both proprietary operating systems and third-party platforms. In addition, since the start of 2019, we have deployed approximately $380 million to capital and operating expenses in information technology investments. This investment encompasses migrating workloads to the cloud, implementing SaaS-based tools, rolling out next-generation SD-WAN and upgrading our core human capital and financial ERP software. These initiatives are strategically designed to standardize, integrate and enhance the technological framework across our enterprise. This development entails certain risks, including difficulties with changes in business processes that could disrupt our operations, manage our supply chain and aggregate financial and operational data. We may continue to rely on legacy information systems, which may be costly or inefficient, while the implementation of new initiatives may not achieve the anticipated benefits and may divert management’s attention from other operational activities, negatively affect team member morale, or have other unintended consequences. Delays in integration or disruptions to our business from implementation of new or upgraded systems could have a material adverse impact on our financial condition and operating results.
66
Table of Contents
Additionally, if we are not able to accurately anticipate expenses and capitalized costs related to system upgrades and changes or if we are unable to realize the expected benefits from our technology initiatives, this may have an adverse impact on our financial condition and operating results.
If the information we rely upon to run our businesses were to be found to be inaccurate or unreliable, if we fail to maintain or protect our IT systems and data integrity effectively, if we fail to develop and implement new or upgraded systems to meet our business needs in a timely manner, or if we fail to anticipate, plan for or manage significant disruptions to these systems, our competitive position could be harmed, we could have operational disruptions, we could lose existing customers, have difficulty preventing, detecting, and controlling fraud, have disputes with customers, have regulatory sanctions or penalties imposed or other legal problems, incur increased operating and administrative expenses, lose revenues as a result of a data privacy breach or theft of intellectual property or suffer other adverse consequences, any of which could have a material adverse effect on our business, results of operations, financial condition or cash flows.
Privacy and data security concerns, and data collection and transfer restrictions and related regulations may adversely affect our business.
Many foreign countries and governmental bodies, including the European Union, where we conduct business, have laws and regulations concerning the collection and use of personal data obtained from their residents or by businesses operating within their jurisdiction. These laws and regulations often are more restrictive than those in the United States. Laws and regulations in these jurisdictions apply broadly to the collection, use, storage, disclosure and security of data that identifies or may be used to identify or locate an individual, such as names, email addresses and, in some jurisdictions, IP addresses.
Recently, there has been heightened interest and enforcement focus on data protection regulations and standards both in the United States and abroad. For example, in January 2023, amendments to California’s Consumer Privacy Act of 2018 went into effect, increasing data privacy requirements for our business. We expect that there will continue to be new proposed laws, regulations and industry standards concerning privacy, data protection and information security in the United States, the European Union, and other jurisdictions. In addition, the European Commission adopted a General Data Protection Regulation (“GDPR”), that became fully effective on May 25, 2018, superseding prior European Union data protection legislation, imposing more stringent European Union data protection requirements, and providing for greater penalties for noncompliance. The United Kingdom enacted the Data Protection Act that substantially implements the GDPR. More generally, we cannot yet fully determine the impact these or future laws, regulations and standards may have on our business. Privacy, data protection and information security laws and regulations are often subject to differing interpretations, may be inconsistent among jurisdictions, and may be alleged to be inconsistent with our current or future practices. Additionally, we may be bound by contractual requirements applicable to our collection, use, processing, and disclosure of various types of data, including personal data, and may be bound by, or voluntarily comply with, self-regulatory or other industry standards relating to these matters. These and other requirements could increase our costs, impair our ability to grow our business, or restrict our ability to store and process data or, in some cases, impact our ability to operate our business in some locations and may subject us to liability. Any failure or perceived failure to comply with applicable laws, regulations, industry standards, and contractual obligations may adversely affect our business.
Further, in view of new or modified foreign laws and regulations, industry standards, contractual obligations and other legal obligations, or any changes in their interpretation, we may find it necessary or desirable to fundamentally change our business activities and practices or to expend significant resources to adapt to these changes. We may be unable to make such changes and modifications in a commercially reasonable manner or at all.
The costs of compliance with and other burdens imposed by laws, regulations and standards may limit the use and adoption of our service and reduce overall demand for it. Failure to comply with applicable data
67
Table of Contents
protection regulations or standards may expose us to litigation, fines, sanctions or other penalties, which could damage our reputation and adversely impact our business, results of operation and financial condition. Privacy, information security, and data protection concerns may inhibit market adoption of our business, particularly in certain industries and foreign countries.
If any of the foregoing risks were to materialize, they could materially and adversely affect us.
We are subject to additional risks with respect to our current and potential international operations and properties.
As of March 31, 2024, we owned or had a leasehold interest in 201 temperature-controlled warehouses outside the United States. We also intend to strategically grow our portfolio globally through acquisitions of temperature-controlled warehouses in attractive international markets to service demonstrable customer demand where we believe the anticipated risk-adjusted returns are consistent with our investment objectives. However, there can be no assurance that our existing customer relationships will support our international operations in any meaningful way or at all. Our international operations and properties could be affected by factors specific to the laws, regulations and business practices of the jurisdictions in which our warehouses are located. These laws, regulations and business practices expose us to risks that are different than or in addition to those commonly found in the United States. Risks relating to our international operations and properties include:
• | changing governmental rules and policies, including changes in land use and zoning laws; |
• | enactment of laws relating to the international ownership and leasing of real property or mortgages and laws restricting the ability to remove profits earned from activities within a particular country to a person’s or company’s country of origin; |
• | changes in laws or policies governing foreign trade or investment and use of foreign operations or workers, and any negative sentiments towards multinational companies as a result of any such changes to laws, regulations or policies or due to trends such as political populism and economic nationalism; |
• | variations in currency exchange rates and the imposition of currency controls; |
• | adverse market conditions caused by terrorism, civil unrest, natural disasters, infectious disease and changes in international, national or local governmental or economic conditions; |
• | the willingness of U.S. or international lenders to make mortgage loans in certain countries and changes in the availability, cost and terms of secured and unsecured debt resulting from varying governmental policies, economic conditions or otherwise; |
• | business disruptions arising from public health crises and outbreaks of communicable diseases; |
• | the imposition of non-U.S. income and withholding taxes, value added taxes, and other taxes on dividends, interest, capital gains, income, gains, gross sales or other disposition proceeds and changes in real estate and other tax rates and other operating expenses in particular countries, including the potential imposition of adverse or confiscatory taxes; |
• | general political and economic instability; |
• | geopolitical risks, including the ongoing conflict between Russia and Ukraine and the blockage of the Suez Canal affecting the flow of trade out of Asia; |
• | potential liability under the Foreign Corrupt Practices Act of 1977, as amended, and the U.K. Bribery Act 2010, anticorruption regulations with broad jurisdictional authority; |
• | our limited experience and expertise in foreign countries relative to our experience and expertise in the United States; |
• | restrictions on our ability to repatriate earnings generated from our international operations and adverse tax consequences in the applicable jurisdictions, such as double taxation; |
68
Table of Contents
• | potential liability under, and costs of complying with, more stringent environmental laws or changes in the requirements or interpretation of existing laws, or environmental consequences of less stringent environmental management practices in foreign countries relative to the United States; and |
• | disruptions to our business or that of our customers and/or our suppliers resulting from trade tensions, tariffs imposed by the U.S. and other governments, actual or threatened modifications to or withdrawals from international trade agreements, treaties, policies, tariffs, quotas or any other trade rules or restrictions. |
If any of the foregoing risks were to materialize, they could materially and adversely affect us.
Competition in our markets may increase over time if our competitors open new warehouses or expand their logistics or integrated service offerings that compete with our offerings.
We compete with other owners and operators of temperature-controlled warehouses (including our customers or potential customers who may choose to provide temperature-controlled warehousing in-house), some of which own properties similar to ours in similar geographic locations, as well with as various logistics companies. In recent years, certain of our competitors, including Americold, United States Cold Storage, NewCold, and FreezPak Logistics, have added, through construction, development and acquisition, temperature-controlled warehouses in certain of our markets. In addition, our customers or potential customers may choose to develop new temperature-controlled warehouses, expand their existing temperature-controlled warehouses or upgrade their equipment. As newer warehouses and equipment come onto the market, we may lose existing or potential customers, and we may be pressured to reduce our rent and storage and other fees below those we currently charge in order to retain customers. If we lose one or more customers, we cannot assure you that we would be able to replace those customers on attractive terms or at all. We also may be forced to invest in new construction or reposition existing warehouses at significant costs in order to remain competitive. Increased capital expenditures or the loss of global warehousing segment revenues resulting from lower occupancy or storage rates could have a material adverse effect on us. We may also compete with other logistics providers that are able to offer more attractive services or rates. Such competition may affect our profitability in respect of our integrated solutions services and our intended expansion of such services. In addition, such competition could make it difficult to gain new customers and expand our business with existing customers, which could impede our utilization initiatives to increase physical occupancy. Such competition could also make it difficult to successfully implement our commercial optimization initiatives and our initiative to align rates with costs to serve, which could adversely impact our results of operations and our growth.
Power costs may increase or be subject to volatility, which could result in increased costs that we may be unable to recover.
Power is a major operating cost for temperature-controlled warehouses, and the price of power varies substantially between the markets in which we operate, depending on the power source and supply and demand factors. For each of the years ended December 31, 2023, 2022 and 2021, power costs in our global warehousing segment accounted for 5.3%, 6.4% and 5.9% of the segment’s revenues, respectively. For the three months ended March 31, 2024 and 2023, power costs in our global warehousing segment accounted for 4.9% and 5.0% of the segment’s revenues, respectively.
We have implemented programs across several of our warehouses to reduce overall consumption and to reduce consumption at peak demand periods, when power prices are typically highest. Additionally, we have introduced alternative sources of energy at several of our warehouses through on-site solar and battery capacity and linear generators. However, there can be no assurance that these programs will be effective in reducing our power consumption or cost of power, which could adversely impact our growth and the predictability of our margins.
We have entered into, or may in the future enter into, fixed price power purchase agreements in certain deregulated markets whereby we contract for the right to purchase an amount of electric capacity at a fixed rate
69
Table of Contents
per kilowatt. Typically, these contracts do not obligate us to purchase any minimum amounts but would require negotiation if our capacity requirements were to materially differ from historical usage or exceed the thresholds agreed upon. For example, exceeding these thresholds could have an adverse impact on our incremental power purchase costs if we were to be unable to obtain favorable rates on the incremental purchases.
If the cost of electric power to operate our warehouses increases dramatically or fluctuates widely and we are unable to pass such costs through to customers, we could be materially and adversely affected.
We depend on certain customers for a substantial amount of our revenues.
Our 25 largest customers contributed approximately 32% of our total revenues for the twelve months ended March 31, 2024. As of March 31, 2024, we had five customers that each accounted for at least 2% of our total revenues for the twelve months ended March 31, 2024. In addition, as of March 31, 2024, 34 of our warehouses were predominantly single-customer warehouses. If any of our most significant customers were to discontinue or otherwise reduce their use of our warehouses or other services, which they are generally free to do at any time unless they are party to a contract that includes a minimum storage commitment, we would be materially and adversely affected. While we have contracts with stated terms with certain of our customers, many of our contracts do not obligate our customers to use our warehouses or provide for minimum storage commitments. Moreover, a decrease in demand for certain commodities or products produced by our significant customers and stored in our temperature-controlled warehouses would lower our physical occupancy rates and use of our services, without lowering our fixed costs, which could have a material adverse effect on us. In addition, any of our significant customers could experience a downturn in their businesses which may weaken their financial condition and liquidity and result in their failure to make timely payments to us or otherwise default under their contracts. Cancellation of, or failure of a significant customer to perform under, a contract could require us to seek replacement customers. However, there can be no assurance that we would be able to find suitable replacements on favorable terms in a timely manner or at all or reposition the warehouses without incurring significant costs. Moreover, a bankruptcy filing by or relating to any of our significant customers could prevent or delay us from collecting pre-bankruptcy obligations. The bankruptcy, insolvency or financial deterioration of our significant customers, could materially and adversely affect us. In addition, some of our significant customers also utilize our integrated solutions, and a loss of such customer as a warehouse customer would also impact our integrated solutions segment, thereby exacerbating the risks described above.
In addition, while some of our warehouses are located in primary markets, others are located in secondary and tertiary markets that are specifically suited to the particular needs of the customer utilizing these warehouses. For example, our production advantaged warehouses typically serve one or a small number of customers. These warehouses are also generally located adjacent to or otherwise in close proximity to customer processing or production facilities and were often build-to-suit at the time of their construction. If customers who utilize this type of warehouse, which may be located in remote areas, relocate their processing or production plants, default or otherwise cease to use our warehouses, then we may be unable to find replacement customers for these warehouses on favorable terms or at all or, if we find replacement customers, we may have to incur significant costs to reposition these warehouses for the replacement customers’ needs, any of which could have a material adverse effect on us.
Interest rate and hedging activity exposes us to risks, including the risks that a counterparty will not perform and that the hedge will not yield the economic benefits we anticipate.
As of March 31, 2024, we were a party to 13 interest rate hedges, which effectively convert $6.2 billion of our variable-rate indebtedness to fixed-rate once the strike rates of the caps are exceeded. In addition, we have entered into certain forward contracts and other hedging arrangements in order to fix power costs for anticipated electricity requirements. These hedging transactions expose us to certain risks, such as the risk that counterparties may fail to honor their obligations under these arrangements, and that these arrangements may not be effective in reducing our exposure to interest rate and power cost changes. Moreover, there can be no assurance that our
70
Table of Contents
hedging arrangements will qualify for hedge accounting or that our hedging activities will have the desired beneficial impact on our results of operations or cash flows. Should we desire to terminate a hedging agreement, there could be significant costs and cash requirements involved to fulfill our obligation under the hedging agreement. Failure to hedge effectively against interest rate and power cost changes could have a material adverse effect on us. When a hedging agreement is required under the terms of a mortgage loan, it is often a condition that the hedge counterparty maintains a specified credit rating. With the current volatility in the financial markets, there is an increased risk that hedge counterparties could have their credit ratings downgraded to a level that would not be acceptable under the loan provisions. If we were unable to renegotiate the credit rating condition with the lender or find an alternative counterparty with an acceptable credit rating, we could be in default under the loan and the lender could seize that property through foreclosure, which could have a material adverse effect on us.
Our business operations outside the United States expose us to losses resulting from currency fluctuations, as the revenues associated with our international operations and properties are typically generated in the local currency of each of the countries in which the properties are located. Fluctuations in exchange rates between these currencies and the U.S. dollar will therefore give rise to non-U.S. currency exposure, which could materially and adversely affect us. We hedge this exposure by incurring operating costs in the same currency as the revenue generated by the related property. We also attempt to mitigate any such effects by entering into currency exchange rate hedging arrangements where it is practical to do so and where such hedging arrangements are available and by structuring debt in local currency. As of March 31, 2024, we were a party to cross currency swaps on certain of our loans, and to interest rate swaps on our variable rate indebtedness. Periodically we enter into foreign currency forward contracts to manage our exposure to fluctuations in exchange rates. In addition, we have entered into certain forward contracts and other hedging arrangements in order to fix power costs for anticipated electricity requirements.
These hedging arrangements may bear substantial costs, however, and may not eliminate all related risks. These hedging transactions also expose us to certain risks, such as the risk that counterparties may fail to honor their obligations under these arrangements, and that these arrangements may not be effective in reducing our exposure to foreign exchange rate, interest rate, and power cost changes. We cannot assure you that our efforts will successfully mitigate our currency risks. Moreover, if we do engage in currency exchange rate hedging activities, any income recognized with respect to these hedges (as well as any foreign currency gain recognized with respect to changes in exchange rates) may not qualify under the 75% gross income test or the 95% gross income test that we must satisfy annually in order to qualify as a REIT under the Internal Revenue Code of 1986, as amended, or the Code. Accordingly, our ability to enter into hedging activities may be limited. In addition, changes in foreign currency exchange rates used to value a REIT’s foreign assets may be considered changes in the value of the REIT’s assets. These changes may adversely affect our status as a REIT. Further, bank accounts in a foreign currency which are not considered cash or cash equivalents may adversely affect our status as a REIT. See “Federal Income Tax Considerations—Taxation of Our Company.” For more information regarding our currency exposure, see “Management’s Discussion and Analysis of Financial Condition and Results of Operations—Quantitative and Qualitative Disclosures about Market Risks—Foreign Currency Risk.” Moreover, there can be no assurance that our hedging arrangements will qualify for hedge accounting or that our hedging activities will have the desired beneficial impact on our results of operations or cash flows. Should we desire to terminate a hedging agreement, there could be significant costs and cash requirements involved to fulfill our obligation under the hedging agreement. Failure to hedge effectively against foreign exchange rates, interest rates and power cost changes could have a material adverse effect on us.
We may incur liabilities or harm our reputation as a result of quality-control issues associated with our global warehouse storage business and other services provided by our integrated solutions business.
We store frozen and perishable food and other products and provide food processing, repackaging and other services. Product contamination, spoilage, other adulteration, product tampering or other quality control issues could occur at any of our facilities or during the transportation of these products, which could cause our
71
Table of Contents
customers to lose all or a portion of their inventory. We could be liable for the costs incurred by our customers as a result of the lost inventory, and we also may be subject to liability, which could be material, if any of the frozen and perishable food products we stored, processed, repackaged or transported caused injury, illness or death. The occurrence of any of the foregoing may negatively impact our brand and reputation and otherwise have a material adverse effect on us.
We are subject to risks related to corporate social and environmental responsibility and reputation.
A number of factors influence our reputation and brand value, including how we are perceived by our customers, business partners, investors, team members, other stakeholders and the communities in which we do business. We face increasing scrutiny related to environmental, social and governance (“ESG”) activities and disclosures and risk damage to our reputation if we fail to act appropriately and responsibly in ESG matters, including, among others, environmental stewardship, supply chain management, climate change, human rights, diversity, equity and inclusion, workplace ethics and conduct, philanthropic activity and support for the communities we serve and in which we operate. Any damage to our reputation could impact the willingness of our business partners and customers to do business with us, or could negatively impact our team member hiring, engagement and retention, all of which could have a material adverse effect on our business, results of operations and cash flows. We could also incur additional costs and devote additional resources to monitoring, reporting, and implementing various ESG practices.
We may be unable to achieve or demonstrate progress on our goal of carbon neutrality for our global operations by calendar 2040.
In 2021, we announced we had signed onto The Climate Pledge and committed to a goal to achieve carbon neutrality by calendar 2040. Achievement of this goal depends on our execution of operational strategies relating to energy efficiency measures, onsite energy generation and storage, and network-wide standards to minimize and eliminate carbon emissions associated with daily operations.
Execution of these strategies, as well as demonstrable progress on and achievement of our calendar 2040 goal, is subject to risks and uncertainties, many of which are outside of our control. These risks and uncertainties include, but are not limited to:
• | our ability to successfully implement our business strategy, effectively respond to changes in market dynamics and achieve the anticipated benefits and associated cost savings of such strategies and actions; |
• | the availability and cost of, and our ability to acquire, solar-panels, alternative fuel vehicles, alternative fuels, global electrical charging infrastructure and other materials and components, which may not be available at scale; |
• | unforeseen production, design, operational and technological difficulties; |
• | the outcome of research efforts and future technology developments, including the ability to scale projects and technologies on a commercially competitive basis such as carbon sequestration and/or other related processes; |
• | compliance with, and changes or additions to, global and regional regulations, taxes, charges, mandates or requirements relating to greenhouse gas emissions, carbon costs or climate-related goals; |
• | labor-related regulations and requirements that restrict or prohibit our ability to impose requirements on third parties who provide contracted transportation for our transportation networks; |
• | adapting products to customer preferences and customer acceptance of sustainable supply chain solutions and potentially increased prices for our services; and the actions of competitors and competitive pressures. |
72
Table of Contents
There can be no assurance that we will be able to successfully execute our strategies and achieve or demonstrate progress on our calendar 2040 goal of carbon neutrality. Additionally, we may determine that it is in our best interests to prioritize other business, social, governance or sustainable investments and/or initiatives over the achievement of our calendar 2040 goal based on economic, regulatory or social factors, business strategy or other reasons. Failure to achieve or demonstrate progress on our calendar 2040 goal could damage our reputation and customer and other stakeholder relationships. Further, given investors’ and banks’ increased focus related to ESG matters, such a failure could cause large stockholders to reduce their ownership of our common stock and limit our access to financing. Such conditions could materially and adversely affect us, as well as on the market price of our common stock.
Our temperature-controlled warehouse infrastructure and systems may become obsolete or unmarketable and we may not be able to upgrade our equipment cost-effectively or at all.
The infrastructure at our temperature-controlled warehouses and systems may become obsolete or unmarketable due to the development of, or demand for, more advanced equipment or enhanced technologies, including increased automation of our warehouses. Increased automation may entail significant time and start-up costs and lost revenue opportunity, and may not perform as expected. In addition, our IT platform pursuant to which we provide inventory management and other services to our customers may become outdated. When customers demand new equipment or technologies, the cost could be significant and we may not be able to upgrade our warehouses on a cost-effective basis in a timely manner, or at all, due to, among other things, increased expenses to us that cannot be passed on to customers or insufficient resources to fund the necessary capital expenditures. The obsolescence of our infrastructure or our inability to upgrade our warehouses would likely reduce global warehousing segment revenues, which could have a material adverse effect on us.
The transportation services provided by our integrated solutions business are dependent in part on in-house trucking services and in part on third-party truckload carrier and rail services, each of which subjects us to risks.
We use in-house trucking services to provide transportation services to our customers, and any increased severity or frequency of accidents or other claims, delays or disruptions in services or changes in regulations could have a material adverse effect on us.
We use in-house trucking transportation services to provide refrigerated transportation services to certain customers. The potential liability associated with accidents in the trucking industry is severe and occurrences are unpredictable. A material increase in the frequency or severity of accidents or workers’ compensation claims or the unfavorable development of existing claims could materially and adversely affect our results of operations. In the event that accidents occur, we may be unable to obtain desired contractual indemnities, and, although we believe our aggregate insurance limits should be sufficient to cover our historic claims amounts, the commercial trucking industry has experienced a wave of blockbuster or so-called “nuclear” verdicts, including some instances in which juries have awarded hundreds of millions of dollars to those injured in accidents and their families. As a result, our insurance may prove inadequate in certain cases. The occurrence of an event not fully insured or indemnified against or the failure or inability of a customer or insurer to meet its indemnification or insurance obligations could result in substantial losses. Moreover, in connection with any such delays or disruptions, or if customers’ products are damaged or destroyed during transport, we may incur financial obligations or be subject to lawsuits by our customers. Any of these risks could have a material adverse effect on us. In addition, our trucking services are subject to regulation as a motor carrier by the U.S. Department of Transportation, by various state agencies and by similar authorities in our international operations, whose regulations include certain permit requirements of state highway and safety authorities. These regulatory authorities exercise broad powers over our trucking operations. The trucking industry is subject to possible regulatory and legislative changes that may impact our operations and affect the economics of the industry by requiring changes in operating practices or by changing the demand for or the costs of providing trucking services. Some of these possible changes include increasingly stringent fuel emission limits, including potential
73
Table of Contents
limits on carbon emissions, changes in the regulations that govern the amount of time a driver may drive or work in any specific period, classification of independent drivers, “restart” rules, limits on vehicle weight and size and other matters including safety requirements.
We also rely on third-party truckload carriers and rail services to transport customer inventory.
We also act as a transportation broker and depend on third-party truckload carriers and rail services to transport customer inventory. We do not have an exclusive or long-term contractual relationship with third-party trucking or rail service providers, and there can be no assurance that our customers will have uninterrupted or unlimited access to their transportation assets or services. Additionally, we may not be able to renegotiate additional transportation contracts to expand capacity, add additional routes, obtain multiple providers, or obtain services at current cost levels, any of which may limit the availability of services to our customers. Our ability to secure the services of these third parties, or increases in the prices we or our customers must pay to secure such services, is affected by many factors outside our control and failure to secure transportation services, or to obtain such services on desirable terms, may adversely affect us.
Factors outside our control could adversely affect our ability to offer transportation services, which could reduce the confidence our customers have in our ability to provide transportation services and could impair our ability to retain existing customers and/or attract new customers and could otherwise increase operating costs, reduce profits and affect our relationships with our customers. Such factors include increases in the cost of transportation services, including in relation to any increase in fuel costs, the overall attractiveness of transportation service options, changes in the reliability of available transportation options, transportation delays or disruptions, including those caused by weather-related events, labor shortages, supply-chain issues and delays relating to manufacture and delivery of new equipment, equipment failures and national security or other incidents that affect transportation routes or rail lines.
We may be unable to maintain railcar assets on lease at satisfactory lease rates.
The profitability of our railcar leasing business depends on our ability to lease railcars to customers at satisfactory lease rates, to re-lease railcars at satisfactory lease rates upon the expiration and non-renewal of existing leases, and to sell railcars in the secondary market as part of our ordinary course of business. Our ability to accomplish these objectives is dependent upon several factors, including, among others:
• | the cost of and demand for leases or ownership of newer or specific-use railcar types; |
• | the general availability in the market of competing used or new railcars; |
• | the degree of obsolescence of leased or unleased railcars, including railcars subject to regulatory obsolescence; |
• | the prevailing market and economic conditions, including the availability of credit, interest rates, and inflation rates; |
• | the market demand or governmental mandate for refurbishment; and |
• | the volume and nature of railcar traffic and loadings. |
A downturn in the industries in which our lessees operate and decreased demand for railcars could also increase our exposure to re-marketing risk because lessees may demand shorter lease terms or newer railcars, requiring us to re-market leased railcars more frequently. Furthermore, the resale market for previously leased railcars has a limited number of potential buyers. Our inability to re-lease or sell leased or unleased railcars in a timely manner on favorable terms could result in lower lease rates, lower lease utilization percentages, and reduced revenues and operating profit.
Our railcar leasing business is regulated by multiple governmental regulatory agencies, such as the U.S. Department of Transportation and the administrative agencies it oversees and industry authorities such as the
74
Table of Contents
Association of American Railroads. All such agencies and authorities promulgate rules, regulations, specifications, or operating standards affecting railcar design, configuration, and mechanics; maintenance; and rail-related safety standards for railroad equipment. Future regulatory changes or the determination that our railcars are not in compliance with applicable requirements, rules, regulations, specifications or standards could result in additional operating expenses, administrative fines or penalties or loss of business that could have a material adverse effect on our financial condition and operations.
In addition, we are exposed to asset risk resulting from ownership of the railcars we lease to customers. Asset risk arises from fluctuations in supply and demand for the leased railcar. We are exposed to the risk that, at the end of the lease term or in the event of early termination, the value of the railcar will be lower than expected, resulting in reduced future lease income over the remaining life of the railcar or a lower sale value. Demand for and the valuation of the railcar is sensitive to shifts in economic and market trends and governmental regulations. Although we regularly monitor the value of the railcars we own, there is no assurance that the value of these assets will not be adversely impacted by factors outside of our control.
We depend on key personnel and specialty personnel, and a deterioration of employee relations could harm our business and operating and financial results.
Our success following this offering depends to a significant degree upon the continued contributions of certain key personnel, including our Co-Founders and Co-Executive Chairmen, Adam Forste and Kevin Marchetti, as well as our President and Chief Executive Officer, Greg Lehmkuhl, each of whom would be difficult to replace. If any of our key personnel were to cease employment with us, our operating and financial results could suffer. Further, such a loss could be negatively perceived in the capital markets. We have not obtained and do not expect to obtain key man life insurance on any of our key personnel. Our ability to retain our management group or to attract suitable replacements should any members of our management team leave is dependent on the competitive nature of the employment market. The loss of services from key members of our management team or a limitation of their availability could materially and adversely affect us.
We also believe that our future success, particularly in international markets, will depend in large part upon our ability to hire and retain highly skilled managerial, investment, financing, operational and marketing personnel. The customer service, marketing skills and knowledge of local market demand and competitive dynamics of our employees are contributing factors to our ability to maximize our income and to achieve the highest sustainable storage levels at each of our warehouses. We may be unsuccessful in attracting and retaining such skilled personnel. In addition, our temperature-controlled warehouse business depends on the continued availability of skilled personnel with engineering expertise and experience. Competition for such personnel is intense, and we may be unable to hire and retain such personnel.
We could experience power outages, disruptions in the supply of utilities, outbreak of fire or other calamity or breakdowns of our refrigeration equipment.
Our warehouses are subject to electrical power outages, disruptions in the supply of utilities such as water, outbreak of fire or other calamity and breakdowns of our refrigeration equipment. We attempt to limit exposure to such occasions by conducting regular maintenance and upgrades to our refrigeration equipment, and, in several locations, using backup generators and power supplies, generally at a significantly higher operating cost than we would pay for an equivalent amount of power from a local utility. However, we may not be able to limit our exposure entirely even with these protections in place. Power outages that last beyond our backup and alternative power arrangements and refrigeration equipment breakdowns would harm our customers and our business. During prolonged power outages and refrigeration equipment breakdowns, changes in humidity and temperature could spoil or otherwise contaminate the frozen and perishable food and other products stored by our customers. We could incur financial obligations to, or be subject to lawsuits by, our customers in connection with these occurrences, which may not be covered by insurance. Any loss of services or product damage could reduce the confidence of our customers in our services and could consequently impair our ability to attract and retain
75
Table of Contents
customers. Additionally, in the event of the complete failure of our refrigeration equipment, we would incur significant costs in repairing or replacing our refrigeration equipment, which may not be covered by insurance. In addition, an outbreak of fire in a warehouse could result in significant damage or even total loss of the warehouse, which would harm our customers and our business, and the business interruption insurance we carry may not be sufficient to compensate us fully for losses or damages that may occur because of such events. In April 2024, we experienced a fire at a warehouse, which represented 0.5% of our global warehousing segment revenue for the twelve months ended March 31, 2024, that resulted in a complete loss of the warehouse. We generally carry comprehensive liability and property insurance covering the warehouses we own, but there can be no assurance that insurance will be sufficient to fully compensate us for all losses. Any of the foregoing could have a material adverse effect on us.
We hold leasehold interests in 114 of our warehouses, and we may be forced to vacate our warehouses if we default on our obligations thereunder and we will be forced to vacate our warehouses if we are unable to renew such leases upon their expiration.
As of March 31, 2024, we held leasehold interests in 114 of our warehouses, out of our total of 482 warehouses. These leases expire (taking into account our extension options) from 2024 to 2060, and have a weighted average remaining term of 23.0 years. If we default on any of these leases, we may be liable for damages and could lose our leasehold interest in the applicable property, including all improvements. We would incur significant costs if we were forced to vacate any of these leased warehouses due to, among other matters, the high costs of relocating the equipment in our warehouses. If we were forced to vacate any of these leased warehouses, we could lose customers that chose our storage or other services based on our location, which could have a material adverse effect on us. Our landlords could attempt to evict us for reasons beyond our control. Further, we may be unable to maintain good working relationships with our landlords, which could adversely affect our relationship with our customers and could result in the loss of customers. In addition, we cannot assure you that we will be able to renew these leases prior to their expiration dates on favorable terms or at all. If we are unable to renew our lease agreements, we will lose our right to operate these warehouses and be unable to derive revenues from these warehouses and, in the case of ground leases, we forfeit all improvements on the land. We could also lose the customers using these warehouses who are unwilling to relocate to another one of our warehouses, which could have a material adverse effect on us. Furthermore, unless we purchase the underlying fee interests in these properties, as to which no assurance can be given, we will not share in any increase in value of the land or improvements beyond the term of such lease, notwithstanding any capital we have invested in the applicable warehouse, especially warehouses subject to ground leases. Even if we are able to renew these leases, the terms and other costs of renewal may be less favorable than our existing lease arrangements. Failure to sufficiently increase revenues from customers at these warehouses to offset these projected higher costs could have a material adverse effect on us.
We are subject to risks relating to the manufacture and sale of food products for human consumption.
Certain services within our integrated solutions segment constitute the manufacture and sale of food products for human consumption. The manufacture and sale of food products for human consumption involves the risk of injury, illness or death to consumers and we and/or our customers may be subject to product recalls, claims or lawsuits should the consumption of any food products manufactured by us and/or our customers cause injury, illness or death. Injuries may result from product tampering by third parties, product contamination or spoilage, or the presence of foreign objects, chemicals, or other agents in the product. Even if a product liability claim is invalid, unsuccessful or not fully pursued, the claims may be expensive to defend and may generate negative publicity that adversely affects our reputation, operations and overall profitability, or that of its customers. Any insurance coverage maintained by us may be unavailable or insufficient to cover a judgment against us in regard to any of these matters. A judgment awarded in excess of our insurance liability may adversely affect our financial condition and operations. Additionally, a judgment may affect our ability to maintain existing insurance coverage or find replacement coverage, if at all, at a reasonable cost or on acceptable terms; and a judgment may adversely affect our ability to retain or attract our customers.
76
Table of Contents
Our results of operations are affected by certain commodity markets.
Our results of operations are affected by certain commodity markets. Changes in the overall environment affecting any specific commodity can have a significant and potentially negative impact on our results of operation. The commodity markets may be affected by factors such as weather patterns, fluctuations in input prices, trade barriers, international political conflicts, change in consumer preference, disease outbreaks, seasonal availability, or overall economic conditions. Our concentration of customers in commodity businesses ties our performance to the health of the commodity markets. Any adverse change in the commodity markets may have negative derivative impact on our financial performance.
We face ongoing litigation risks which could result in material liabilities and harm to our business regardless of whether we prevail in any particular matter.
We operate in multiple U.S. and international jurisdictions, with thousands of team members and business counterparts. As such, there is an ongoing risk that we may become involved in legal disputes or litigation with these parties or others. The costs and liabilities with respect to such legal disputes may be material and may exceed our amounts accrued, if any, for such liabilities and costs. In addition, our defense of legal disputes or resulting litigation could result in the diversion of our management’s time and attention from the operation of our business, each of which could impede our ability to achieve our business objectives. Some or all of the amounts we may be required to pay to defend or to satisfy a judgment or settlement of any or all of our disputes and litigation may not be covered by insurance.
Upon the listing of our shares on Nasdaq, we will be a “controlled company” within the meaning of Nasdaq rules and, as a result, will qualify for, and may rely on, exemptions from certain corporate governance requirements. You will not have the same protections afforded to stockholders of companies that are subject to such requirements.
After completion of this offering, affiliates of Bay Grove will continue to control a majority of the combined voting power of all classes of our stock entitled to vote generally in the election of directors. Moreover, under the stockholders agreement with Bay Grove and its affiliates that will be in effect as of the completion of this offering, so long as Bay Grove and its affiliates together continue to beneficially own at least 5% of the total outstanding equity interests in our company, we will agree to nominate for election to our board of directors individuals designated by Bay Grove, whom we refer to as the “BGLH Directors,” as specified in our stockholders agreement. As a result, we will be a “controlled company” within the meaning of the Nasdaq corporate governance standards. Under these rules, a company of which more than 50% of the voting power in the election of directors is held by an individual, group or another company is a “controlled company” and may elect not to comply with certain corporate governance requirements, including the requirements that, within one year of the date of the listing of our common stock:
• | a majority of our board of directors consist of independent directors; |
• | our board of directors have a compensation committee that is comprised entirely of independent directors with a written charter addressing the committee’s purpose and responsibilities; and |
• | our board of directors have a nominating and corporate governance committee that is comprised entirely of independent directors with a written charter addressing the committee’s purpose and responsibilities. |
Although upon completion of this offering a majority of our board of directors will consist of independent directors, our compensation and nominating and corporate governance committees will not be composed entirely of independent directors, and we may utilize any of these exemptions prior to the time we cease to be a “controlled company.” Accordingly, to the extent and for so long as we utilize these exemptions, you will not have the same protections afforded to stockholders of companies that are subject to all of these corporate governance requirements. Accordingly, you will not have the same protections afforded to stockholders of companies that are subject to all of the Nasdaq corporate governance requirements.
77
Table of Contents
We will incur significantly increased costs as a result of operating as a public company, and our management will be required to devote substantial time and attention to compliance efforts.
We will incur significant legal, accounting, insurance and other expenses as a result of becoming a public company upon the completion of this offering. As a public company with listed equity securities, we will need to comply with new laws, regulations and requirements, including the requirements of the Securities Exchange Act of 1934, as amended, or the Exchange Act, certain corporate governance provisions of the Sarbanes-Oxley Act of 2002, or the Sarbanes-Oxley Act, related regulations of the SEC and requirements of Nasdaq, with which we were not required to comply as a private company. The Exchange Act requires that we file annual, quarterly and current reports with respect to our business, operations and financial statements. The Sarbanes-Oxley Act requires, among other things, that we establish and maintain effective internal controls and procedures for financial reporting.
Section 404 of the Sarbanes-Oxley Act will require our management and independent registered public accounting firm to report annually on the effectiveness of our internal control over financial reporting. Substantial work on our part will be required to implement appropriate processes, document the system of internal control over key processes, assess their design, remediate any deficiencies identified and test their operation. This process is expected to be both costly and challenging.
These reporting and other obligations will place significant demands on our management and our administrative, operational and accounting resources and will cause us to incur significant expenses. We may need to upgrade our systems or create new systems, implement additional financial and other controls, reporting systems and procedures. If we are unable to accomplish these objectives in a timely and effective fashion, our ability to comply with the financial reporting requirements and other rules that apply to public companies could be impaired.
If we fail to implement and maintain an effective system of internal control over financial reporting, we may not be able to accurately determine or disclose our financial results. As a result, our stockholders could lose confidence in our financial results.
Upon completion of this offering, we will become subject to the informational requirements of the Exchange Act and will be required to file reports and other information with the SEC. As a publicly-traded company, we will be required to maintain disclosure controls and procedures that are designed to ensure that information required to be disclosed in the reports that we file with, or submit to, the SEC is recorded, processed, summarized and reported,
within the time periods specified in the SEC’s rules and forms. They include controls and procedures designed to ensure that information required to be disclosed in reports filed with, or submitted to, the SEC is accumulated and communicated to management, including our principal executive and principal financial officers, to allow timely decisions regarding required disclosure. Effective disclosure controls and procedures are necessary for us to provide reliable reports, effectively prevent and detect fraud, and to operate successfully as a public company. Designing and implementing effective disclosure controls and procedures is a continuous effort that requires significant resources and devotion of time. We may discover deficiencies in our disclosure controls and procedures that may be difficult or time consuming to remediate in a timely manner. Any failure to maintain effective disclosure controls and procedures or to timely effect any necessary improvements thereto could cause us to fail to meet our reporting obligations (which could affect the listing of our common stock on Nasdaq). Additionally, ineffective disclosure controls and procedures could also adversely affect our ability to prevent or detect fraud, harm our reputation and cause investors to lose confidence in our reports filed with, or submitted to, the SEC, which would likely have a negative effect on the market price of our common stock.
78
Table of Contents
In connection with its audit of our consolidated financial statements for the year ended December 31, 2023, our independent registered public accounting firm identified a material weakness in internal control over financial reporting. Material weaknesses or a failure to maintain an effective system of internal control over financial reporting could prevent us from accurately reporting our financial results in a timely manner, which would likely have a negative effect on the market price of our common stock.
As a publicly-traded company, we will be required to report annual audited consolidated financial statements and quarterly unaudited interim consolidated financial statements prepared in accordance with GAAP. We will rely on our internal control over financial reporting to provide reasonable assurance regarding the reliability of financial reporting and the preparation of our consolidated financial statements for external purposes in accordance with GAAP. More broadly, effective internal control over financial reporting is a necessary component of our program to seek to prevent, and to detect any, fraud and to operate successfully as a public company.
In connection with its audit of our consolidated financial statements for the year ended December 31, 2023, our independent registered public accounting firm identified a material weakness in internal control over financial reporting. A material weakness is a deficiency, or a combination of deficiencies, in internal control over financial reporting such that there is a reasonable possibility that a material misstatement of our annual or interim consolidated financial statements will not be prevented or detected on a timely basis. The identified material weakness arises from our failure to timely complete our risk assessment and design, implement and/or effectively operate controls for a sufficient period of time. We are actively engaged in the planning for, and implementation of, remediation efforts to address this material weakness, including the hiring of additional internal resources and the engagement of third-party specialists.
There can be no assurance that our remediation efforts to address this material weakness described above, which may be time consuming and costly, will be successful, that we will not identify material weaknesses in the future or that our internal control over financial reporting will be effective in accomplishing all of its objectives. Furthermore, as we grow, our business, and hence our internal control over financial reporting, will likely become more complex, and we may require significantly more resources to develop and maintain effective controls. Designing and implementing an effective system of internal control over financial reporting is a continuous effort that requires significant resources, including the expenditure of a significant amount of time by senior members of our management team.
In addition, as a public company, we will be required to document and test our internal control over financial reporting pursuant to Section 404 of the Sarbanes-Oxley Act so that our management can certify as to the effectiveness of our internal control over financial reporting. Management’s initial certification under Section 404 of the Sarbanes-Oxley Act will be required with our annual report on Form 10-K for the year ending December 31, 2025. In support of such certifications, we will be required to document and make significant changes and enhancements, including potentially hiring additional personnel, to our internal control over financial reporting. Likewise, our independent registered public accounting firm will be required to provide an attestation report on the effectiveness of our internal control over financial reporting as of December 31, 2025. To date, neither our management nor an independent registered public accounting firm has performed an evaluation of our internal control over financial reporting in accordance with the requirements of Section 404 of the Sarbanes-Oxley Act because no such evaluation has been required. In connection with our ongoing monitoring of our internal control over financial reporting or audits of our consolidated financial statements or our management’s assessment of the effectiveness of internal control over financial reporting, we or our auditors may identify additional deficiencies in our internal control over financial reporting that may be significant or rise to the level of material weaknesses. Any failure to maintain effective internal control over financial reporting or to timely effect any necessary improvements to such controls could cause us to fail to meet our reporting obligations (which could affect the listing of our common stock on Nasdaq). Additionally, ineffective internal control over financial reporting could also adversely affect our ability to prevent or detect fraud, harm our reputation, subject us to regulatory scrutiny and cause investors to lose confidence in our reported financial information, which would likely have a negative effect on the market price of our common stock.
79
Table of Contents
Our business could be adversely impacted if we have deficiencies in our disclosure controls and procedures or internal control over financial reporting, including as a result of the material weakness identified by management and discussed above.
The design and effectiveness of our disclosure controls and procedures and internal control over financial reporting, including new and revised financial and IT-related controls that we have been designing, implementing and operating, may not prevent all errors, misstatements or misrepresentations. While management will continue to review the effectiveness of our disclosure controls and procedures and internal control over financial reporting, there can be no guarantee that our internal control over financial reporting will be effective in accomplishing all control objectives all of the time. Deficiencies in our internal control over financial reporting, including any material weakness which may occur in the future, could result in misstatements of our results of operations, restatements of our financial statements, a decline in our stock price, or otherwise materially adversely affect our business, reputation, results of operations, financial condition or liquidity.
Charges for impairment of goodwill or other long-lived assets and declines in real estate valuations could adversely affect our financial condition and results of operations.
We regularly monitor the recoverability of our long-lived assets, such as buildings and improvements and machinery and equipment, and evaluate their carrying value for potential impairment, whenever events or changes in circumstances indicate that the carrying amount of such assets may not be fully recoverable. We review goodwill on an annual basis to determine if impairment has occurred and review the recoverability of fixed assets and intangible assets, generally on a quarterly basis and whenever events or changes in circumstances indicate that impairment may have occurred or the value of such assets may not be fully recoverable. Examples of indicators of potential impairment of our long-lived assets may include a significant decrease in the market price, an adverse change in how a property is being used, an accumulation of costs significantly in excess of the amount originally expected for the acquisition or development, a change in our intended holding period due to our intention to sell an asset, a history of operating losses or a material decline in profitability (of a property or a reporting unit). If such reviews indicate that impairment has occurred, we are required to record a non-cash impairment charge for the difference between the carrying value and fair value of the long-lived assets in the period the determination is made. The testing of long-lived assets and goodwill for impairment requires the use of estimates based on significant assumptions about our future revenue, profitability, cash flows, fair value of assets and liabilities, weighted average cost of capital, as well as other assumptions. Changes in these estimates, or changes in actual performance compared with these estimates, may affect the fair value of long-lived assets, which could result in an impairment charge.
Geopolitical conflicts, including the conflict between Russia and Ukraine and continued instability in the Middle East, including from the Houthi rebels in Yemen, may adversely affect our business and results of operations.
We have operations or activities in numerous countries and regions outside the United States, including throughout Europe and Asia-Pacific. As a result, our global operations are affected by economic, political and other conditions in the foreign countries in which we do business as well as U.S. laws regulating international trade. Specifically, although we neither have warehouses nor conduct business in Russia or Ukraine, the current conflict between Russia and Ukraine is creating substantial uncertainty about the future impact on the global economy. Countries across the globe are instituting sanctions and other penalties against Russia. The retaliatory measures that have been taken, and could be taken in the future, by the U.S., NATO, and other countries have created global security concerns that could result in broader European military and political conflicts and otherwise have a substantial impact on regional and global economies, any or all of which could adversely affect our business, particularly our European operations.
While the broader consequences are uncertain at this time, the continuation and/or escalation of the Russian and Ukraine conflict, along with any expansion of the conflict to surrounding areas, create a number of risks that could adversely impact our business and results of operations, including:
• | increased inflation and significant volatility in commodity prices; |
80
Table of Contents
• | disruptions to our global technology infrastructure, including through cyberattacks, ransom attacks or cyber-intrusion; |
• | adverse changes in international trade policies and relations; |
• | our ability to maintain or increase our prices, including freight in response to rising fuel costs; |
• | disruptions in global supply chains, specifically within the food supply chain and construction materials; |
• | increased exposure to foreign currency fluctuations; and |
• | constraints, volatility or disruption in the credit and capital markets. |
To the extent the current conflict between Russia and Ukraine adversely affects our business, it may also have the effect of heightening many other risks disclosed in this prospectus, any of which could materially and adversely affect our business and results of operations. We are continuing to monitor the situation in the Ukraine and globally and assess its potential impact on our business.
Further, the Houthi movement, which controls parts of Yemen, has targeted and launched numerous attacks on commercial marine vessels in the Red Sea as the ships approach the Suez Canal, resulting in many shipping companies re-routing to avoid the region altogether. While the consequences of this conflict on our and our customers’ businesses are uncertain at this time, the continuation and/or escalation of the Suez Canal blockage create a number of risks that could adversely impact our business and results of operations, including:
• | worsening supply chain issues, including delays |
• | increased transportation costs; and |
• | decreased throughput as a result of longer shipping times. |
General Risks Related to the Real Estate Industry
Our performance and value are subject to economic conditions affecting the real estate market generally, and temperature-controlled warehouses in particular, as well as the broader economy.
Our performance and value depend on the amount of revenues earned, as well as the expenses incurred, in connection with operating our warehouses. If our temperature-controlled warehouses do not generate revenues and operating cash flows sufficient to meet our operating expenses, including debt service and capital expenditures, we could be materially and adversely affected. In addition, there are significant expenditures associated with our real estate (such as real estate taxes, maintenance costs and debt service payments) that generally do not decline when circumstances reduce the revenues from our warehouses. Accordingly, our expenditures may stay constant, or increase, even if our revenues decline. The real estate market is affected by many factors that are beyond our control, and revenues from, and the value of, our properties may be materially and adversely affected by:
• | changes in the national, international or local economic climate; |
• | availability, cost and terms of financing; |
• | technological changes, such as expansion of e-commerce, reconfiguration of supply chains, automation, robotics or other technologies; |
• | the attractiveness of our properties to potential customers; |
• | inability to collect storage charges, rent and other fees from customers; |
• | the ongoing need for, and significant expense of, capital improvements and addressing obsolescence in a timely manner, particularly in older structures; |
• | changes in supply of, or demand for, similar or competing properties in an area; |
• | customer retention and turnover; |
81
Table of Contents
• | excess supply in the market area; |
• | availability of labor and transportation to service our sites; |
• | financial difficulties, defaults or bankruptcies by our customers; |
• | changes in operating costs and expenses and a general decrease in real estate property rental rates; |
• | changes in or increased costs of compliance with governmental rules, regulations and fiscal policies, including changes in tax, real estate, environmental and zoning laws, and our potential liability thereunder; |
• | our ability to provide adequate maintenance and insurance; |
• | changes in the cost or availability of insurance, including coverage for mold or asbestos; |
• | unanticipated changes in costs associated with known adverse environmental conditions, newly discovered environmental conditions and retained liabilities for such conditions; |
• | changes in interest rates or other changes in monetary policy; |
• | disruptions in the global supply-chain caused by political, regulatory or other factors such as terrorism, political instability and public health crises; and |
• | civil unrest, acts of war, terrorist attacks and natural disasters, including earthquakes and floods, which may result in uninsured and underinsured losses. |
In addition, periods of economic slowdown or recession, rising interest rates or declining demand for real estate, or the public perception that any of these events may occur, could result in a general decrease in rates or an increased occurrence of defaults under existing contracts, which could materially and adversely affect us. For these and other reasons, we cannot assure you that we will be able to achieve our business objectives.
We could incur significant costs under environmental laws relating to the presence and management of asbestos, anhydrous ammonia and other chemicals and underground storage tanks.
Environmental laws in certain jurisdictions require that owners or operators of buildings containing asbestos properly manage asbestos, adequately inform or train those who may come into contact with asbestos and undertake special precautions, including removal or other abatement, in the event that asbestos is damaged, is decayed, poses a health risk or is disturbed during building renovation or demolition. These laws impose fines and penalties on building owners or operators who fail to comply with these requirements and may allow third parties to seek recovery from owners or operators for personal injury associated with exposure to asbestos and other toxic or hazardous substances. Some of our properties may contain asbestos or asbestos-containing building materials. Asbestos exposure can also cause damage to our customers’ goods stored with us.
Most of our warehouses utilize anhydrous ammonia as a refrigerant. Anhydrous ammonia is classified as a hazardous chemical regulated by the U.S. Environmental Protection Agency, or the EPA and similar international agencies. Releases of anhydrous ammonia occur at our warehouses from time to time, which we have historically identified and reported when required, and any number of unplanned events, including severe storms, fires, earthquakes, vandalism, equipment failure, operational errors, accidents, deliberate acts of team members or third parties, and terrorist acts could result in a significant release of anhydrous ammonia that could result in injuries, loss of life, property damage and a significant interruption at affected facilities. Anhydrous ammonia exposure can also cause damage to our customers’ goods stored with us. For example, in 2020, contractors and subcontractors were working on the blast cells at our freezer warehouse in Statesville, North Carolina when an incident occurred triggering the release of anhydrous ammonia at the facility, resulting in the death of a subcontractor and injury to another subcontractor, as well as damage to customers’ goods. Litigation with respect to this incident is ongoing and while we believe we have strong defenses to claims arising from this incident, there can be no assurance that we will prevail on any claim.
82
Table of Contents
Although our warehouses have risk management programs required by the Occupational Safety and Health Act of 1970, as amended, or OSHA, the EPA and other regulatory agencies in place in the jurisdictions in which we operate, we could incur significant liability in the event of an unanticipated release of anhydrous ammonia from one of our refrigeration systems. Releases could occur at locations or at times when trained personnel may not be available to respond quickly, increasing the risk of injury, loss of life or property damage. Some of our warehouses are not staffed 24 hours a day and, as a result, we may not respond to intentional or accidental events during closed hours as quickly as we could during open hours, which could exacerbate any injuries, loss of life or property damage. We also could incur liability in the event we fail to report such anhydrous ammonia releases in a timely fashion.
Environmental laws and regulations subject us and our customers to liability in connection with the storage, handling and use of anhydrous ammonia and other hazardous substances utilized in our operations. Our warehouses also may have under-floor heating systems, some of which utilize ethylene glycol, petroleum compounds, or other hazardous substances; releases from these systems could potentially contaminate soil and groundwater.
We could incur significant costs related to environmental conditions and liabilities.
The properties we own or have owned in the past may subject us to known and unknown environmental liabilities. Under various federal, state and local laws and regulations relating to the environment, as a current or former owner or operator of real property, we may be liable for costs and damages resulting from environmental matters, including the presence or discharge of hazardous or toxic substances, waste or petroleum products at, on, in, under or migrating from such property, including costs to investigate or clean up such contamination and liability for personal injury, property damage or harm to natural resources. We may face liability regardless of:
• | our knowledge of the contamination; |
• | the timing of the contamination; |
• | the cause of the contamination; or |
• | the party responsible for the contamination of the property. |
There may be environmental liabilities associated with our properties of which we are unaware. In addition, some of our properties have been operated for decades and have known or potential environmental impacts. We obtain Phase I environmental site assessments on nearly all properties we finance or acquire. The Phase I environmental site assessments are limited in scope and therefore may not reveal all environmental conditions affecting a property. Therefore, there could be undiscovered environmental liabilities on the properties we own. Many of our properties contain, or may in the past have contained, features that pose environmental risks including underground tanks for the storage of petroleum products and other hazardous substances as well as floor drains and wastewater collection and discharge systems, hazardous materials storage areas and septic systems. All of these features create a potential for the release of petroleum products or other hazardous substances. Some of our properties are adjacent to or near properties that have known environmental impacts or have in the past stored or handled petroleum products or other hazardous substances that could have resulted in environmental impacts to soils or groundwater that could affect our properties. If environmental contamination exists on our properties, we could be subject to strict, joint and/or several liability for the contamination by virtue of our ownership interest. Some of our properties may contain asbestos-containing materials, or ACM. Environmental laws govern the presence, maintenance and removal of ACM and such laws may impose fines, penalties, or other obligations for failure to comply with these requirements or expose us to third-party liability (e.g., liability for personal injury associated with exposure to asbestos). Environmental laws also apply to other activities that can occur on a property, such as storage of petroleum products or other hazardous toxic substances, air emissions, water discharges and exposure to lead-based paint. Such laws may impose fines and penalties for violations, and may require permits or other governmental approvals to be obtained for the operation of a business involving such activities.
The known or potential presence of hazardous substances on a property may adversely affect our ability to sell, lease or improve the property or to borrow using the property as collateral. In addition, environmental laws
83
Table of Contents
may create liens on contaminated properties in favor of the government for damages and costs it incurs to address such contamination. Moreover, if contamination is discovered on our properties, environmental laws may impose restrictions on the manner in which they may be used or businesses may be operated, and these restrictions may require substantial expenditures.
Our environmental liabilities may include property and natural resources damage, personal injury, investigation and clean-up costs, among other potential environmental liabilities. These costs could be substantial. Although we may obtain insurance for environmental liability for certain properties that are deemed to warrant coverage, our insurance may be insufficient to address any particular environmental situation and we may be unable to continue to obtain insurance for environmental matters, at a reasonable cost or at all, in the future. If our environmental liability insurance is inadequate, we may become subject to material losses for environmental liabilities. Our ability to receive the benefits of any environmental liability insurance policy will depend on the financial stability of our insurance company and the position it takes with respect to our insurance policies. If we were to become subject to significant environmental liabilities, we could be materially and adversely affected.
Moreover, there can be no assurance that (i) future laws, ordinances or regulations will not impose new material environmental obligations or costs, including the potential effects of climate change or new climate change regulations, (ii) we will not incur material liabilities in connection with both known and undiscovered environmental conditions arising out of past activities on our properties or (iii) our properties will not be materially and adversely affected by the operations of customers, by environmental impacts or operations on neighboring properties (such as releases from underground storage tanks), or by the actions of parties unrelated to us.
In the future, our customers may demand lower indirect emissions associated with the storage and transportation of frozen and perishable foods, which could lead customers to seek temperature-controlled storage from our competitors. Further, such demand could require us to implement various processes to reduce emissions from our operations in order to remain competitive, which could materially and adversely affect us.
Risks related to climate change could have a material adverse effect on our results of operations.
Climate change, including the impact of global warming, creates physical and financial risks. Physical risks from climate change include an increase in sea level and changes in weather conditions, such as an increase in storm intensity and severity of weather (e.g., floods, tornados or hurricanes) and extreme temperatures. For example, 84 of our warehouses are in zones subject to what we believe to be a moderate to high risk of flooding. The occurrence of sea level rise or one or more natural disasters, such as floods, tornados, hurricanes, tropical storms, wildfires and earthquakes (whether or not caused by climate change), could cause considerable damage to our warehouses, disrupt our operations and negatively affect our financial performance. Additional risks related to our business and operations as a result of climate change include physical and transition risks such as:
• | higher energy costs as a result of extreme weather events, extreme temperatures or increased demand for limited resources; |
• | utility disruptions or outages due to demand or stress on electrical grids resulting from extreme weather events; |
• | limited availability of water and higher costs due to limited sources and droughts; |
• | higher materials cost due limited availability and environmental impacts of extraction and processing of raw materials and production of finished goods; |
• | lost revenue or increased expense as a result of higher insurance costs, potential uninsured or under insured losses, diminished customer retention stemming from extreme weather events or resource availability constraints; |
• | reduced storage revenue due to crop damage or failure or to reduced protein production as a result of extreme weather events; |
84
Table of Contents
• | decreased occupancy in certain regions as a result of global shifts in shipping routes to account for droughts, such as the ongoing drought in Panama, and extreme weather events; |
• | delays during transit of customers’ products resulting from natural disasters or extreme weather events; and |
• | spoiled, damaged or destroyed customer inventory as a result of natural disasters or other serious disruptions caused by fire, earthquakes. |
In addition, risks associated with new or more stringent laws or regulations or stricter interpretations of existing laws could directly or indirectly affect our customers and could adversely affect our business, financial condition, results of operations and cash flows. For example, various federal, state and regional laws and regulations have been implemented or are under consideration to mitigate the effects of climate change caused by greenhouse gas emissions. Among other things, “green” building codes may seek to reduce emissions through the imposition of standards for design, construction materials, water and energy usage and efficiency, and waste management. Such codes could require us to make improvements to our properties, increase the cost of maintaining, operating or improving our warehouses, or increase taxes and fees assessed on us.
Climate change regulations could also adversely impact companies with which we do business, which in turn may adversely impact our business, financial condition, results or operations or cash flows. In the future, our customers may demand lower indirect emissions associated with the storage and transportation of frozen and perishable food, which could make our facilities less competitive. Further, such demand could require us to implement various processes to reduce emissions from our operations in order to remain competitive, which could materially and adversely affect us.
Our insurance coverage may be insufficient to cover potential environmental liabilities.
We maintain a portfolio environmental insurance policy that provides coverage for sudden and accidental environmental liabilities, subject to the policy’s coverage conditions, deductibles and limits, for most of our properties. There can be no assurance that future environmental claims will be covered under these policies or that, if covered, the loss will not exceed policy limits. From time to time, we may acquire properties, or interests in properties, with known adverse environmental conditions where we believe that the environmental liabilities associated with these conditions are quantifiable and that the acquisition will yield an attractive risk-adjusted return. In such an instance, we factor the estimated costs of environmental investigation, cleanup and monitoring into the net cost. Further, in connection with property dispositions, we may agree to remain responsible for, and to bear the cost of, remediating or monitoring certain environmental conditions on the properties. A failure to accurately estimate these costs, or uninsured environmental liabilities, could materially and adversely affect us.
Our properties may contain or develop harmful molds or have other air quality issues, which could lead to financial liability for adverse health effects to our employees or third parties, and costs of remediating the problem.
Our properties may contain or develop harmful molds or suffer from other air quality issues, which could lead to liability for adverse health effects and costs of remediating the problem. When excessive moisture accumulates in buildings or on building materials, mold growth may occur, particularly if the moisture problem remains undiscovered or is not addressed over a period of time. Some molds produce airborne toxins or irritants. Indoor air quality issues can also stem from inadequate ventilation, poor equipment maintenance, chemical contamination from indoor or outdoor sources and other biological contaminants, such as pollen, viruses and bacteria. Indoor exposure to airborne toxins or irritants present above certain levels can cause a variety of adverse health effects and symptoms, including allergic or other reactions. As a result, the presence of significant mold or other airborne contaminants at any of our properties could require us to undertake a costly remediation program to contain or remove the mold or other airborne contaminants from the affected property, to reduce indoor moisture levels, or to upgrade ventilation systems to improve indoor air quality. In addition, the presence of significant mold or other airborne contaminants could expose us to liability from our team members, our customers, associates of our customers and others if property damage or health concerns arise.
85
Table of Contents
Illiquidity of real estate investments, particularly our specialized temperature-controlled warehouses, could significantly impede our ability to respond to adverse changes in the performance of our business and properties.
Real estate investments are relatively illiquid, and given that our properties are highly specialized temperature-controlled warehouses, including built-in automation, our properties may be more illiquid than other real estate investments. This illiquidity is driven by a number of factors, including the specialized and often customer-specific design of our warehouses, the relatively small number of potential purchasers of temperature-controlled warehouses, the difficulty and expense of repurposing our warehouses and the location of some of our warehouses in secondary or tertiary markets. As a result, we may be unable to complete an exit strategy or quickly sell properties in our portfolio in response to adverse changes in the performance of our properties or in our business generally. We cannot predict whether we will be able to sell any property for the price or on the terms set by us or whether any price or other terms offered by a prospective buyer would be acceptable to us. We also cannot predict the length of time it would take to complete the sale of any such property. Such sales might also require us to expend funds to mitigate or correct defects to the property or make changes or improvements to the property prior to its sale. The ability to sell assets in our portfolio may also be restricted by certain covenants in our credit agreements. Code requirements relating to our status as a REIT may also limit our ability to vary our portfolio promptly in response to changes in economic or other conditions.
We could experience uninsured or under-insured losses relating to our global warehousing business, including our real property, as well as our integrated solutions business.
We carry insurance for the risks arising out of our business and operations, including coverage on all of our properties in an amount that we believe adequately covers any potential casualty losses. However, there are certain losses, including losses from floods, earthquakes, acts of war or riots, that we are not generally insured against or that we are not generally fully insured against because it is not deemed economically feasible or prudent to do so. In addition, changes in the cost or availability of insurance could expose us to uninsured casualty losses. In the event that any of our properties incurs a casualty loss that is not covered by insurance (in part or at all), the value of our assets will be reduced by the amount of any such uninsured loss, and we could experience a significant loss of capital invested and potential revenues in these properties. Any such losses could materially and adversely affect us. In addition, we may have no source of funding to repair or reconstruct the damaged property, and we cannot assure you that any such sources of funding will be available to us for such purposes in the future on favorable terms or at all.
In the event of a fire, flood or other occurrence involving the loss of or damage to stored products held by us but belonging to others, we may be liable for such loss or damage. In April 2024, we experienced a fire at a warehouse, which represented 0.5% of our global warehousing segment revenue for the twelve months ended March 31, 2024, that resulted in a complete loss of the warehouse. Although we have an insurance program in effect, there can be no assurance that such potential liability will not exceed the applicable coverage limits under our insurance policies. In addition, the business interruption insurance we carry may not be sufficient to compensate us fully for losses or damages that may occur because of such events. A number of our properties are located in areas that are known to be subject to earthquake activity, such as California, Washington, Oregon and New Zealand, or in flood zones, such as 84 facilities in zones subject to what we believe to be a moderate to high risk of flooding, in each case exposing them to increased risk of casualty.
If we or one or more of our customers experiences a loss for which we are liable and that loss is uninsured or exceeds policy limits, we could lose the capital invested in the damaged properties as well as the anticipated future cash flows from those properties. In addition, if the damaged properties are subject to recourse indebtedness, we would continue to be liable for the indebtedness, even if these properties were irreparably damaged.
We are self-insured for workers’ compensation and health insurance under a large deductible program, meaning that we have accrued liabilities in amounts that we consider appropriate to cover losses in these areas. In
86
Table of Contents
addition, we maintain excess loss coverage to insure against losses in excess of the reserves that we have established for these claims in amounts that we consider appropriate. However, in the event that our loss experience exceeds our reserves and the limits of our excess loss policies, we could be materially and adversely affected.
Costs of complying with governmental laws and regulations could adversely affect us and our customers.
Our business is highly regulated at the federal, state and local level, as well as regulation outside of the United States in the jurisdictions in which we operate our business. The food industry in all jurisdictions in which we operate is subject to numerous government standards and regulations. While we believe that we are currently in compliance with all applicable government standards and regulations, there can be no assurance that all of our warehouses or our customers’ operations are currently in compliance with, or will be able to comply in the future with, all applicable standards and regulations or that the costs of compliance will not increase in the future.
All real property and the operations conducted on real property are subject to governmental laws and regulations relating to environmental protection and human health and safety. For example, our U.S. warehouses are subject to regulation and inspection by the U.S. Food and Drug Administration and the U.S. Department of Agriculture and our domestic trucking operations are subject to regulation by the U.S. Department of Transportation and the U.S. Federal Highway Administration. In addition, our international facilities are subject to many local laws and regulations which govern a wide range of matters, including food safety, building, environmental, health and safety, hazardous substances, waste minimization, as well as specific requirements for the storage of meats, dairy products, fish, poultry, agricultural and other products. Any products destined for export must also satisfy applicable export requirements. We are required to comply with applicable economic and trade sanctions and export controls imposed by governments around the world with jurisdiction over the operations of our business. These measures can prohibit or restrict transactions and dealings with certain countries, territories, governments and persons. The failure to comply with such applicable laws and regulations could result in civil or criminal penalties, other remedial measures, and legal expenses, which could have a material and adverse effect on us. Our ability to operate and to satisfy our contractual obligations may be affected by permitting and compliance obligations arising under such laws and regulations. Some of these laws and regulations could increase our operating costs, result in fines or impose joint and several liability on customers, owners or operators for the costs to investigate or remediate contamination, regardless of fault or whether the acts causing the contamination were legal.
Some of these laws and regulations have been amended so as to require compliance with new or more stringent standards in the future. Compliance with new or more stringent laws or regulations or stricter interpretation of existing laws may require that we or our customers incur material expenditures. In addition, there are various governmental, environmental, fire, health, safety and similar regulations with which we and our customers may be required to comply and which may subject us and our customers to liability in the form of fines or damages for noncompliance. Any material expenditures, fines or damages imposed on our customers or us could directly or indirectly have a material adverse effect on us. In addition, changes in these governmental laws and regulations, or their interpretation by agencies and courts, could occur.
The Americans with Disabilities Act of 1990, as amended, or the ADA, generally requires that public buildings, including portions of our warehouses, be made accessible to disabled persons. Noncompliance could result in the imposition of fines by the federal government or the award of damages to private litigants. If, under the ADA, we are required to make substantial alterations and capital expenditures in one or more of our warehouses, including the removal of access barriers, it could materially and adversely affect us.
Our U.S. properties are subject to regulation under OSHA, which requires employers to protect team members against many workplace hazards, such as exposure to harmful levels of toxic chemicals, excessive noise levels, mechanical dangers, heat or cold stress and unsanitary conditions. The cost of complying with
87
Table of Contents
OSHA and similar laws enacted by other jurisdictions in which we operate is substantial and any failure to comply with these regulations could expose us to penalties and potentially to liabilities to team members who may be injured at our warehouses, any of which could be material. Furthermore, any fines or violations that we face under OSHA could expose us to reputational risk.
We are currently invested in various joint ventures and may invest in additional joint ventures in the future and face risks stemming from our partial ownership interests in such properties, which could materially and adversely affect the value of any such joint venture investments.
Our current and future joint-venture investments involve risks not present in investments in which a third party is not involved, including the possibility that:
• | we and a co-venturer or partner may reach an impasse on a major decision that requires the approval of both parties; |
• | we may not have exclusive control over the development, financing, management and other aspects of the property or joint venture, which may prevent us from taking actions that are in our best interest but opposed by a co-venturer or partner; |
• | a co-venturer or partner may at any time have economic or business interests or goals that are or may become inconsistent with ours; |
• | a co-venturer or partner may encounter liquidity or insolvency issues or may become bankrupt, which may mean that we and any other remaining co-venturers or partners generally would remain liable for the joint venture’s liabilities; |
• | a co-venturer or partner may be in a position to take action contrary to our instructions, requests, policies or investment objectives, including our current policy with respect to maintaining our qualification as a REIT under the Code; |
• | a co-venturer or partner may take actions that subject us to liabilities in excess of, or other than, those contemplated; |
• | in certain circumstances, we may be liable for actions of our co-venturer or partner; |
• | our joint venture agreements may restrict the transfer of a co-venturer’s or partner’s interest or otherwise restrict our ability to sell the interest when we desire or on advantageous terms; |
• | our joint venture agreements may contain buy-sell provisions pursuant to which one co-venturer or partner may initiate procedures requiring the other co-venturer or partner to choose between buying the other co-venturer’s or partner’s interest or selling its interest to that co-venturer or partner; |
• | if a joint venture agreement is terminated or dissolved, we may not continue to own or operate the interests or investments underlying the joint venture relationship or may need to purchase such interests or investments at a premium to the market price to continue ownership; or |
• | disputes between us and a co-venturer or partner may result in litigation or arbitration that could increase our expenses and prevent our management from focusing their time and attention on our business. |
Any of the above could materially and adversely affect the value of our current joint venture investment or any future joint venture investments and potentially have a material adverse effect on us.
Risks Related to Our Indebtedness
We have significant indebtedness outstanding, which may expose us to the risk of default under our debt obligations.
As of March 31, 2024, we had $9.3 billion of total consolidated indebtedness outstanding, of which $4.2 billion was secured, and borrowing capacity under our Revolving Credit Facility of $1.0 billion (net of
88
Table of Contents
outstanding standby letters of credit in the amount of $66.1 million, which reduce availability), and as of March 31, 2024, on a pro forma basis, we had $6.1 billion of total consolidated indebtedness outstanding, of which $1.8 billion was secured, and borrowing capacity under our Revolving Credit Facility of $1.9 billion. See “Management’s Discussion and Analysis of Financial Condition and Results of Operations—Liquidity and Capital Resources—Outstanding Indebtedness.” Total debt payments for the remainder of 2024 and 2025 are $3.7 billion (including $30.0 million of scheduled amortization). We expect to meet these repayment requirements primarily through financing activity or net cash from operating activities. Our organizational documents contain no limitations regarding the maximum level of indebtedness that we may incur or keep outstanding. Payments of principal and interest on borrowings may leave us with insufficient cash resources to meet our cash needs or make the distributions to our common stockholders currently contemplated or necessary to maintain our status as a REIT. Our level of debt and the limitations imposed on us by our debt agreements could have significant adverse consequences, including the following:
• | our cash flow may be insufficient to meet our required principal and interest payments; |
• | cash interest expense and financial covenants relating to our indebtedness may limit or eliminate our ability to make distributions to our common stockholders; |
• | we may be unable to borrow additional funds as needed or on favorable terms, which could, among other things, adversely affect our ability to capitalize upon investment opportunities or meet operational needs; |
• | we may be unable to refinance our indebtedness at maturity or the refinancing terms may be less favorable than the terms of our original indebtedness; |
• | because a portion of our debt bears interest at variable rates, increases in interest rates could increase our interest expense; |
• | we may be unable to hedge floating rate debt, counterparties may fail to honor their obligations under any hedge agreements we enter into, such agreements may not effectively hedge interest rate fluctuation risk, and, upon the expiration of any hedge agreements we enter into, we would be exposed to then-existing market rates of interest and future interest rate volatility; |
• | we may be forced to dispose of properties, possibly on unfavorable terms or in violation of certain covenants to which we may be subject; |
• | we may default on our obligations and the lenders or mortgagees may foreclose on our properties or our interests in the entities that own the properties that secure their loans and receive an assignment of rents and leases; |
• | we may be restricted from accessing some of our excess cash flow after debt service if certain of our customers fail to meet certain financial performance metric thresholds; |
• | we may violate restrictive covenants in our loan documents, which would entitle the lenders to accelerate our debt obligations; and |
• | our default under any loan with cross default provisions could result in a default on other indebtedness. |
The occurrence of any of these events could materially and adversely affect us. Furthermore, foreclosures could create taxable income without accompanying cash proceeds, which could hinder our ability to meet the REIT distribution requirements imposed by the Code.
Increases in interest rates could increase the amount of our debt payments.
As of March 31, 2024 and on a pro forma basis, we had $7.1 billion and $3.9 billion, respectively, of our outstanding consolidated indebtedness that is variable-rate debt, and we may continue to incur variable-rate debt in the future. We have entered into interest rate swaps to convert $1.0 billion of this indebtedness to fixed-rate. As of March 31, 2024 and on a pro forma basis, we have entered into approximately $5.2 billion and $2.8 billion, respectively, of interest rate caps to protect the majority of remaining variable debt against rising interest rates.
89
Table of Contents
Increases in interest rates may raise our interest costs under any variable-rate debt that is not effectively converted to fixed-rate debt and increase our overall cost of capital, which could materially and adversely affect us, reduce our cash flows and funds from operations, and reduce our ability to use the capital that is being paid in interest in other ways, including to make distributions to our stockholders. Increases in interest rates would also increase our interest expense on future fixed rate borrowings and have the same collateral effects described above. In addition, if we need to repay existing debt during periods of rising interest rates, we could be required to liquidate one or more of our investments in properties at times which may not permit realization of the maximum return on such investments. Interest rate increases may also increase the risk that the counterparties to our swap contracts will default on their obligations, which could further increase our exposure to interest rate increases. Conversely, if interest rates are lower than our swapped fixed rates, we will be required to pay more to service our debt than if we had not entered into the interest rate swaps.
Market conditions could adversely affect our ability to refinance existing indebtedness or obtain additional financing for growth on acceptable terms or at all, which could materially and adversely affect us.
Credit markets have experienced over the past several years, and may continue to experience, significant price volatility, displacement and liquidity disruptions, including the bankruptcy, insolvency or restructuring of certain financial institutions. Such circumstances could materially impact liquidity in the financial markets, making financing terms for borrowers less attractive, and potentially result in the unavailability of various types of debt financing. As a result, we may be unable to obtain debt financing on favorable terms or at all or fully refinance maturing indebtedness with new indebtedness. Reductions in our available borrowing capacity or inability to obtain credit, including the Revolving Credit Facility that we expect to have upon the completion of this offering, when required or when business conditions warrant could materially and adversely affect us.
Our existing indebtedness contains, and any future indebtedness is likely to contain, covenants that restrict our ability to engage in certain activities.
The agreements governing our borrowings contain or are likely to contain financial and other covenants with which we are or will be required to comply and that limit or are likely to limit our ability to operate our business. These covenants, as well as any additional covenants to which we may be subject in the future because of additional borrowings, could cause us to have to forego investment opportunities, reduce or eliminate distributions to our common stockholders or obtain financing that is more expensive than financing we could obtain if we were not subject to the covenants. In addition, the agreements governing our borrowing may have cross default provisions, which provide that a default under one of our debt financing agreements would lead to a default on all of our debt financing agreements.
The covenants and other restrictions under our debt agreements may affect, among other things, our ability to:
• | incur indebtedness; |
• | create liens on assets; |
• | cause our subsidiaries to distribute cash to us to fund distributions to stockholders or to otherwise use in our business; |
• | sell or substitute assets; |
• | modify certain terms of our leases; |
• | manage our cash flows; and |
• | make distributions to equity holders, including our common stockholders. |
Additionally, these restrictions may adversely affect our operating and financial flexibility and may limit our ability to respond to changes in our business or competitive environment, all of which may materially and adversely affect us.
90
Table of Contents
Secured indebtedness exposes us to the possibility of foreclosure, which could result in the loss of our investment in certain of our subsidiaries or in a property or group of properties or other assets subject to indebtedness and limits our ability to raise future capital.
We have granted certain of our lenders security interests in certain of our assets, including equity interests in certain of our subsidiaries and in certain of our real property. Incurring secured indebtedness, including mortgage indebtedness, increases our risk of asset and property losses because defaults on indebtedness secured by our assets, including equity interests in certain of our subsidiaries and in certain of our real property, may result in foreclosure actions initiated by lenders and ultimately our loss of the property or other assets securing any loans for which we are in default. Any foreclosure on a mortgaged property or group of properties could have a material adverse effect on the overall value of our portfolio of properties and more generally on us. For tax purposes, a foreclosure of any of our properties would be treated as a sale of the property for a purchase price equal to the outstanding balance of the indebtedness secured by the mortgage. If the outstanding balance of the indebtedness secured by the mortgage exceeds our tax basis in the property, we would recognize taxable income on foreclosure, but would not receive any cash proceeds, which could materially and adversely affect us, including hindering our ability to meet the REIT distribution requirements imposed by the Code. As a result, our substantial secured indebtedness could have a material adverse effect on us.
Risks Related to Our Organizational Structure
Our Co-Founders will have substantial influence over our business, and our Co-Founders’ interests, and the interests of certain members of our management, will differ from our interests and those of our other stockholders in certain respects.
Immediately after this offering and the formation transactions, Bay Grove and its affiliates, including BGLH, will beneficially own approximately 77.1% of our outstanding shares of common stock and 100% of our outstanding OP units (including Legacy OP Units but excluding OP units held directly or indirectly by us and assuming such affiliates do not purchase any shares of our common stock pursuant to the directed share program or in this offering). As a result, Bay Grove and BGLH will have significant influence in the election of our directors, who in turn will elect our executive officers, set our management policies and exercise overall supervision and control over us and our subsidiaries. Certain potential transactions will affect Bay Grove and/or BGLH differently than other stockholders and it is possible that Bay Grove and/or BGLH will have different interests than those other stockholders with respect to such transactions.
The interests of Bay Grove and BGLH, as well as the interests of other investors in BGLH, will differ from the interests of our other stockholders in certain respects, and Bay Grove’s and BGLH’s significant stockholdings and rights described above may limit other stockholders’ ability to influence corporate matters. In this regard, sales or other dispositions of our properties may have adverse tax implications for Bay Grove, its affiliates and/or other investors in BGLH. In addition, certain additional members of our management have certain equity interests in Bay Grove and its affiliates, including BGLH, that cause Bay Grove and BGLH to have interests that differ from our other stockholders. The concentration of ownership and voting power of Bay Grove and its affiliates, including BGLH, may also delay, defer or even prevent an acquisition by a third party or other change of control of our company and may make some transactions more difficult or impossible without the support of Bay Grove and BGLH, even if such events are in the best interests of our other stockholders. The concentration of voting power in Bay Grove and its affiliates, including BGLH, may have an adverse effect on the market price of our common stock. As a result of Bay Grove’s and BGLH’s influence, we may take actions that our other stockholders do not view as beneficial, which may adversely affect our results of operations and financial condition and cause the value of your investment in us to decline.
Investors in BGLH engage in a broad spectrum of activities, including investments in real estate. In the ordinary course of their business activities, investors in BGLH may engage in activities where their interests conflict with our interests or those of our stockholders. Our charter will provide that, if any director of our company who is also an officer, employee or agent of BentallGreenOak, D1 Capital, Oxford Properties Group,
91
Table of Contents
OMERS Administration Corporation or Stonepeak or any of their respective affiliates acquires knowledge of a potential business opportunity, we renounce any potential interest or expectation in, or right to be offered to participate in, such business opportunity unless it is a retained opportunity (as defined in our charter). Investors in BGLH also may pursue acquisition opportunities that may be complementary to or competitive with our business without our consent and, as a result, those acquisition opportunities may not be available to us. See “Certain Provisions of Maryland Law and of Our Charter and Bylaws—Corporate Opportunities.”
Our rights and the rights of our stockholders to take action against our directors and officers are limited.
Maryland law provides that a director has no liability in the capacity as a director if he or she performs his or her duties in good faith, in a manner he or she reasonably believes to be in our best interests and with the care that an ordinarily prudent person in a like position would use under similar circumstances. As permitted by the Maryland General Corporation Law (the “MGCL”), our charter limits the liability of our directors and officers to us and our stockholders for money damages, except for liability resulting from:
• | actual receipt of an improper benefit or profit in money, property or services; or |
• | a final judgment based upon a finding of active and deliberate dishonesty by the director or officer that was material to the cause of action adjudicated. |
In addition, our charter requires us to indemnify our directors and officers for actions taken by them in those capacities and to pay or reimburse their reasonable expenses in advance of final disposition of a proceeding to the maximum extent permitted by Maryland law, and we intend to enter into indemnification agreements with our directors and executive officers. As a result, we and our stockholders may have more limited rights against our directors and officers than might otherwise exist under common law. Accordingly, in the event that any of our directors or officers are exculpated from, or indemnified against, liability but whose actions impede our performance, our stockholders’ ability to recover damages from that director or officer will be limited.
Our charter and bylaws contain provisions that may delay, defer or prevent an acquisition of our common stock or a change in control.
Our charter and bylaws contain a number of provisions, the exercise or existence of which could delay, defer or prevent a transaction or a change in control that might involve a premium price for our stockholders or otherwise be in their best interests, including the following:
• | Our Charter Contains Restrictions on the Ownership and Transfer of Our Stock. In order for us to qualify as a REIT, no more than 50% of the value of outstanding shares of our stock may be owned, beneficially or constructively, by five or fewer individuals at any time during the last half of each taxable year other than the first year for which we elect to be taxed as a REIT. Subject to certain exceptions, our charter prohibits any stockholder from owning beneficially or constructively more than 9.8% in value or in number of shares, whichever is more restrictive, of the outstanding shares of our common stock, or 9.8% in value of the aggregate of the outstanding shares of all classes or series of our stock. We refer to these restrictions collectively as the “ownership limits.” The constructive ownership rules under the Code are complex and may cause the outstanding stock owned by a group of related individuals or entities to be deemed to be constructively owned by one individual or entity. As a result, the acquisition of less than 9.8% of our outstanding shares of common stock or the outstanding shares of all classes or series of our stock by an individual or entity could cause that individual or entity or another individual or entity to own constructively in excess of the relevant ownership limits. Our charter also prohibits any person from owning shares of our stock that could result in our being “closely held” under Section 856(h) of the Code, otherwise cause us to fail to qualify as a REIT or cause us not to qualify as a domestically controlled qualified investment entity until the third anniversary of our initial public offering or such other date that our board of directors determines that it is no longer in our best interests to attempt to, or continue to, qualify as a domestically controlled qualified investment entity (the “Foreign Ownership Limitation Period”). Any attempt to own or transfer shares of our stock in violation of these restrictions may result in the shares being |
92
Table of Contents
automatically transferred to a charitable trust or may be void. These ownership limits may prevent a third-party from acquiring control of us if our board of directors does not grant an exemption from the ownership limits, even if our stockholders believe the change in control is in their best interests. |
• | Our Board of Directors Has the Power to Cause Us to Issue Additional Shares of Our Stock Without Stockholder Approval. Our charter authorizes us to issue additional authorized but unissued shares of common or preferred stock. In addition, our board of directors may, without stockholder approval, amend our charter to increase or decrease the aggregate number of our shares of common stock or the number of shares of stock of any class or series that we have authority to issue and classify or reclassify any unissued shares of common or preferred stock and set the preferences, rights and other terms of the classified or reclassified shares. As a result, our board of directors may establish a class or series of shares of common or preferred stock that could delay or prevent a transaction or a change in control that might involve payment of a premium price for our shares of common stock or that stockholders may otherwise consider to be in their best interests. |
Certain provisions of Maryland law may limit the ability of a third-party to acquire control of us.
Certain provisions of the MGCL may have the effect of inhibiting a third-party from acquiring us or of impeding a change of control under circumstances that otherwise could provide our common stockholders with the opportunity to realize a premium over the then-prevailing market price of such shares, including:
• | “business combination” provisions that, subject to limitations, prohibit certain business combinations between an “interested stockholder” (defined generally as any person who beneficially owns, directly or indirectly, 10% or more of the voting power of our outstanding shares of voting stock or an affiliate or associate of the corporation who, at any time within the two-year period immediately prior to the date in question, was the beneficial owner, directly or indirectly, of 10% or more of the voting power of the then outstanding stock of the corporation) or an affiliate of any interested stockholder and us for five years after the most recent date on which the stockholder becomes an interested stockholder, and thereafter imposes two super-majority stockholder voting requirements on these combinations; and |
• | “control share” provisions that provide that holders of “control shares” of our company (defined as voting shares of stock that, if aggregated with all other shares of stock owned or controlled by the acquirer, would entitle the acquirer to exercise one of three increasing ranges of voting power in electing directors) acquired in a “control share acquisition” (defined as the direct or indirect acquisition of issued and outstanding “control shares”) have no voting rights except to the extent approved by our stockholders by the affirmative vote of at least two-thirds of all of the votes entitled to be cast on the matter, excluding all interested shares. |
Pursuant to the Maryland Business Combination Act, our board of directors has by resolution exempted from the provisions of the Maryland Business Combination Act business combinations between us and any other person, provided that the business combination is first approved by our board of directors (including a majority of our directors who are not affiliates or associates of such person). Our bylaws contain a provision exempting from the Maryland Control Share Acquisition Act any and all acquisitions by any person of shares of our stock. There can be no assurance that these exemptions or resolutions will not be amended or eliminated at any time in the future.
Additionally, Title 3, Subtitle 8 of the MGCL permits our board of directors, without stockholder approval and regardless of what is currently provided in our charter or bylaws, to implement certain corporate governance provisions, some of which we do not have. In accordance with the MGCL, our charter provides that, without the affirmative vote of a majority of the votes cast on the matter by our stockholders entitled to vote generally in the election of directors, we may not elect to be subject to the provision of Subtitle 8 that permits our board of directors to classify itself.
93
Table of Contents
Termination of the employment of certain members of our senior management team could be costly and prevent a change in control of our company.
The employment, severance and equity award arrangements with certain members of our senior management team provide that if their employment with us terminates under certain circumstances (including in connection with a change in control of our company), we may be required to provide them significant amounts of severance compensation and benefits, thereby making it costly to terminate their employment. Furthermore, these provisions could delay or prevent a transaction or a change in control of our company that might involve a premium paid for shares of our common stock or otherwise be in the best interests of our stockholders.
Our board of directors may change our investment and financing policies without stockholder approval, and we may become more highly leveraged, which may increase our risk of default under our debt obligations.
Our investment and financing policies are exclusively determined by our board of directors. Accordingly, our stockholders do not control these policies. Further, our organizational documents do not limit the amount or percentage of indebtedness, funded or otherwise, that we may incur. Although we are not required to maintain a particular leverage ratio, we generally intend to target a level of net debt (which includes recourse and non-recourse borrowings and any outstanding preferred stock issuance less unrestricted cash and cash equivalents) that, over time, is less than six times our Adjusted EBITDA. However, from time to time, our ratio of net debt to our Adjusted EBITDA may exceed six times. Our board of directors may alter or eliminate our current policy on borrowing at any time without stockholder approval. If this policy changed, we could become more highly leveraged, which could result in an increase in our debt service. Higher leverage also increases the risk of default on our obligations. In addition, a change in our investment policies, including the manner in which we allocate our resources across our portfolio or the types of assets in which we seek to invest, may increase our exposure to interest rate risk, real estate market fluctuations and liquidity risk. Changes to our policies with regards to the foregoing could materially and adversely affect us. We plan to notify stockholders of any material change to our investment and financing policies by disclosing such changes in documents furnished to the SEC, posted on our website or filed with the SEC, such as a current report on Form 8-K and/or a periodic report on Form 10-Q or Form 10-K, as appropriate, to the extent required by applicable laws, rules and regulations.
Upon the completion of this offering and the formation transactions, we will be a holding company with no direct operations and will rely on funds received from our operating partnership to pay liabilities and distributions to our stockholders.
Upon the completion of this offering and the formation transactions, we will be a holding company and will conduct substantially all of our operations through our operating partnership. We will not have, apart from an interest in our operating partnership, any independent operations. As a result, we will rely on distributions from our operating partnership to pay any distributions we might declare on shares of our common stock. We will also rely on distributions from our operating partnership to meet any of our obligations, including any tax liability on taxable income allocated to us from our operating partnership. In addition, because we will be a holding company, your claims as stockholders will be structurally subordinated to all existing and future liabilities and obligations (whether or not for borrowed money) of our operating partnership and its subsidiaries. Therefore, in the event of our bankruptcy, liquidation or reorganization, our assets and those of our operating partnership and its subsidiaries will be able to satisfy the claims of our stockholders only after all of our and our operating partnership’s and its subsidiaries’ liabilities and obligations have been paid in full.
In connection with our future acquisition of properties or otherwise, we may issue units of our operating partnership to third parties. Such issuances would reduce our ownership in our operating partnership. Because you will not directly own units of our operating partnership, you will not have any voting rights with respect to any such issuances or other partnership level activities of our operating partnership.
94
Table of Contents
Conflicts of interest exist or could arise in the future with our operating partnership or its partners.
Conflicts of interest exist or could arise in the future as a result of the relationships between us and our affiliates, on the one hand, and our operating partnership or any partner thereof, on the other. Our directors and officers have duties to our company under applicable Maryland law in connection with their direction of the management of our company. At the same time, we, as general partner of our operating partnership, have duties to our operating partnership and to the limited partners under Maryland law in connection with the management of our operating partnership. Under Maryland law, the general partner of a Maryland limited partnership has fiduciary duties of care and loyalty, and an obligation of good faith, to the partnership and its partners. While these duties and obligations cannot be eliminated entirely in the partnership agreement, Maryland law permits the parties to a partnership agreement to specify certain types or categories of activities that do not violate the general partner’s duty of loyalty and to modify the duty of care and obligation of good faith, so long as such modifications are not unreasonable. These duties as general partner of our operating partnership to the partnership and its partners may come into conflict with the interests of our company. Under the partnership agreement of our operating partnership, the limited partners of our operating partnership will expressly agree that the general partner of our operating partnership is acting for the benefit of the operating partnership, the limited partners of our operating partnership and our stockholders, collectively. The general partner is under no obligation to give priority to the separate interests of the limited partners in deciding whether to cause our operating partnership to take or decline to take any actions. If there is a conflict between the interests of us or our stockholders, on the one hand, and the interests of the limited partners of our operating partnership, on the other, the partnership agreement of our operating partnership will provide that any action or failure to act by the general partner that gives priority to the separate interests of us or our stockholders that does not result in a violation of the contractual rights of the limited partners of our operating partnership under the partnership agreement will not violate the duties that the general partner owes to our operating partnership and its partners.
Additionally, the partnership agreement of our operating partnership will expressly limit our liability by providing that we and our directors, officers, agents and employees will not be liable or accountable to our operating partnership or its partners for money damages. In addition, our operating partnership will be required to indemnify us, as general partner, our directors, officers and employees, employees of our operating partnership and any other persons whom we, as general partner, may designate from and against any and all claims arising from operations of our operating partnership in which any indemnitee may be involved, or is threatened to be involved, as a party or otherwise unless it is established by a final judgment that the act or omission of the indemnitee constituted fraud, intentional harm or gross negligence on the part of the indemnitee, the claim is brought by the indemnitee (other than to enforce the indemnitee’s rights to indemnification or advance of expenses) or the indemnitee is found to be liable to our operating partnership, and then only with respect to each such claim.
No reported decision of a Maryland appellate court has interpreted provisions that are similar to the provisions of the partnership agreement of our operating partnership that modify the fiduciary duties of the general partner of our operating partnership, and we have not obtained an opinion of counsel regarding the enforceability of the provisions of the partnership agreement that purport to waive or modify the fiduciary duties and obligations of the general partner of our operating partnership.
In addition, the stockholders agreement will provide that we, on our own behalf and in our capacity as general partner of the operating partnership, must use commercially reasonable efforts to (i) structure certain significant exit transactions (including mergers, consolidations and sales of substantially all of our assets or the assets of our operating partnership and its subsidiaries) in a manner that is tax-deferred to Messrs. Marchetti and Forste, their respective estate planning vehicles, family members and controlled affiliates, does not cause such parties to recognize gain for federal income tax purposes, and provides for substantially similar tax protections after such transactions, and (ii) cause our operating partnership or its subsidiaries to continuously maintain sufficient levels of indebtedness that are allocable for federal income tax purposes to Messrs. Marchetti and Forste and their respective personal holding entities to prevent them from recognizing gain as a result of any negative tax capital account or insufficient debt allocation, provided that such amount of debt shall not be
95
Table of Contents
required to exceed the amount allocable to the parties immediately following this offering, subject to certain exceptions. In connection with the obligation to maintain sufficient liability allocations, if we or our operating partnership believes insufficient liabilities may be allocated to Messrs. Marchetti and Forste and their respective personal holding entities, we shall, and shall cause our subsidiaries to, provide Messrs. Marchetti and Forste, their respective estate planning vehicles, family members and controlled affiliates with an opportunity to guarantee indebtedness. These rights granted to Messrs. Marchetti and Forste, their respective estate planning vehicles, family members and controlled affiliates will last with respect to each as long as such person (or his estate planning vehicles, family members and controlled affiliates) has not disposed of more than 60% of his interest in us or obtained a fair market value adjusted tax basis as a result of the death of Messrs. Marchetti or Forste, respectively. These requirements could limit our ability to allocate debt to other members of our operating partnership or structure certain transactions in a way that may otherwise be favorable to us and/or our stockholders.
Our bylaws designate any state court of competent jurisdiction in Maryland and the United States District Court located in Maryland, as the sole and exclusive forum for certain types of actions and proceedings that may be initiated by our stockholders and provide that claims relating to causes of action under the Securities Act may only be brought in federal district courts, which could limit our stockholders’ ability to bring a claim in a judicial forum that the stockholders believe is a more favorable judicial forum for disputes with us or our directors, officers or other employees.
Our bylaws provide that, unless we consent in writing to the selection of an alternative forum, any state court of competent jurisdiction in Maryland, or, if such state courts do not have jurisdiction, the United States District Court located within the State of Maryland will, to the fullest extent permitted by law, be the sole and exclusive forum for (a) any derivative action or proceeding brought on our behalf, (b) any Internal Corporate Claim, as such term is defined in the MGCL, including, without limitation, (i) any action asserting a claim based on an alleged breach of any duty owed by any of our directors, officers or other employees to us or to our stockholders or (ii) any action asserting a claim against us or any of our directors, officers or other employees arising pursuant to any provision of the MGCL or our charter or bylaws, or (c) any other action asserting a claim that is governed by the internal affairs doctrine. These choice of forum provisions will not apply to suits brought to enforce a duty or liability created by the Securities Act, the Exchange Act, or any other claim for which federal courts have exclusive jurisdiction. Furthermore, our bylaws provide that, unless we consent in writing to the selection of an alternative forum, the federal district courts of the United States of America shall, to the fullest extent permitted by law, be the sole and exclusive forum for the resolution of any claim arising under the Securities Act. This provision may limit a stockholder’s ability to bring a claim in a judicial forum that the stockholder believes is more favorable for disputes against us or our directors, officers or employees, which may discourage such lawsuits against us and our directors, officers and other employees.
Risks Related to this Offering and Ownership of Shares of Our Common Stock
There has been no public market for our common stock prior to this offering and an active trading market for our common stock may not develop following this offering.
Prior to this offering, there has been no public market for our common stock, and there can be no assurance that an active trading market will develop or be sustained or that shares of our common stock will be resold at or above the initial public offering price. We expect that our common stock will be approved for listing, subject to notice of issuance, on Nasdaq. The initial public offering price of our common stock will be determined by agreement among us and the underwriters, but there can be no assurance that our common stock will not trade below the initial public offering price following the completion of this offering. See “Underwriters.” The market value of our common stock could be substantially affected by general market conditions, including the extent to which a secondary market develops for our common stock following the completion of this offering, the extent of institutional investor interest in us, the general reputation of REITs and the attractiveness of their equity securities in comparison to other equity securities (including securities issued by other real estate-based companies), our financial performance and general stock and bond market conditions.
96
Table of Contents
The market price and trading volume of shares of our common stock may be volatile following this offering.
The market price of shares of our common stock may fluctuate. In addition, the trading volume in shares of our common stock may fluctuate and cause significant price variations to occur. If the market price of shares of our common stock declines significantly, you may be unable to resell your shares of our common stock at or above the public offering price. We cannot assure you that the market price of shares of our common stock will not fluctuate or decline significantly, including a decline below the public offering price, in the future.
Some of the factors that could negatively affect our share price or result in fluctuations in the market price or trading volume of shares of our common stock include:
• | actual or anticipated declines in our quarterly operating results or distributions; |
• | changes in government regulations; |
• | changes in laws affecting REITs and related tax matters; |
• | the announcement of new contracts by us or our competitors; |
• | reductions in our FFO, Core FFO, Adjusted FFO or earnings estimates; |
• | publication of research reports about us or the real estate industry; |
• | increases in market interest rates that lead purchasers of shares of our common stock to demand a higher yield; |
• | future equity issuances, or the perception that they may occur, including issuances of common stock upon exercise or vesting of equity awards or redemption of OP units; |
• | changes in market valuations of similar companies; |
• | adverse market reaction to any increased indebtedness we incur in the future; |
• | additions or departures of key management personnel; |
• | actions by institutional stockholders; |
• | differences between our actual financial and operating results and those expected by investors and analysts; |
• | changes in analysts’ recommendations or projections; |
• | speculation in the press or investment community; and |
• | the realization of any of the other risk factors presented in this prospectus. |
There can be no assurance that we will be able to make or maintain cash distributions, and certain agreements relating to our indebtedness may, under certain circumstances, limit or eliminate our ability to make distributions to our common stockholders.
We intend to make cash distributions to our stockholders in amounts such that all or substantially all of our taxable income in each year, subject to adjustments, is distributed. Our ability to continue to make distributions in the future may be adversely affected by the risk factors described in this prospectus. There can be no assurance that we will be able to make or maintain distributions and certain agreements relating to our indebtedness may, under certain circumstances, limit or eliminate our ability to make distributions to our common stockholders. There can be no assurance that rents from our properties will increase, or that future acquisitions of real properties or other investments will increase our cash available for distributions to stockholders. In addition, any distributions will be authorized at the sole discretion of our board of directors, and their form, timing and amount, if any, will depend upon a number of factors, including our actual and projected results of operations, FFO, Core FFO Adjusted FFO, EBITDA, EBITDAre, Adjusted EBITDA, liquidity, cash flows and financial
97
Table of Contents
condition, the revenue we actually receive from our properties, our operating expenses, our debt service requirements, our capital expenditures, prohibitions and other limitations under our financing arrangements, our REIT taxable income, the annual REIT distribution requirements, applicable law and such other factors as our board of directors deems relevant.
If we do not have sufficient cash available for distributions, we may need to fund the shortage out of working capital or borrow to provide funds for such distributions, which would reduce the amount of proceeds available for real estate investments and increase our future interest costs. Our inability to make distributions, or to make distributions at expected levels, could result in a decrease in the market price of our common stock.
We may use a portion of the net proceeds from this offering to make distributions to our stockholders, which would, among other things, reduce our cash available to acquire properties and may reduce the returns on your investment in our common stock.
Prior to the time we have fully invested the net proceeds from this offering, we may fund distributions to our stockholders out of the net proceeds, which would reduce the amount of cash we have available to acquire properties and may reduce the returns on your investment in our common stock. The use of these net proceeds for distributions to stockholders could materially and adversely affect us. In addition, funding distributions from the net proceeds from this offering may constitute a return of capital to our stockholders, which would have the effect of reducing each stockholder’s tax basis in our common stock.
Increases in market interest rates may result in a decrease in the value of shares of our common stock.
One of the factors that will influence the price of shares of our common stock will be the distribution yield on shares of our common stock (as a percentage of the price of shares of our common stock) relative to market interest rates. An increase in market interest rates may lead prospective purchasers of shares of our common stock to expect a higher distribution yield and higher interest rates would likely increase our borrowing costs and potentially decrease funds available for distribution. Thus, higher market interest rates could cause the market price of our common stock to decrease.
Broad market fluctuations could negatively impact the market price of shares of our common stock.
The stock market may experience extreme price and volume fluctuations that have affected the market price of many companies in industries similar or related to ours and that have been unrelated to these companies’ operating performances. The changes frequently appear to occur without regard to the operating performance of the affected companies. Hence, the price of our common stock could fluctuate based upon factors that have little or nothing to do with us in particular. These broad market fluctuations could reduce the market price of shares of our common stock. Furthermore, our operating results and prospects may be below the expectations of public market analysts and investors or may be lower than those of companies with comparable market capitalizations. Either of these factors could lead to a material decline in the market price of our common stock.
This offering is expected to be dilutive to earnings, and there may be future dilution to earnings related to shares of our common stock.
On a pro forma basis, we expect that this offering will have a dilutive effect on our expected earnings per share, FFO per share and Core FFO per share. The actual amount of dilution cannot be determined at this time and will be based upon numerous factors. The market price of shares of our common stock could decline as a result of issuances or sales of a large number of shares of our common stock in the market after this offering or the perception that such issuances or sales could occur. Additionally, future issuances or sales of substantial amounts of shares of our common stock may be at prices below the initial public offering price of the shares of our common stock offered by this prospectus and may result in further dilution in our earnings, FFO per share and Core FFO per share and/or materially and adversely impact the market price of our common stock. See “Dilution.”
98
Table of Contents
Future offerings of debt, which would be senior to shares of our common stock upon liquidation, and/or preferred equity securities that may be senior to shares of our common stock for purposes of distributions or upon liquidation, may materially and adversely affect the market price of shares of our common stock.
In the future, we may attempt to increase our capital resources by making additional offerings of debt or preferred equity securities (or causing our operating partnership to issue debt securities). Upon liquidation, holders of our debt securities and preferred stock and lenders with respect to other borrowings will receive distributions of our available assets prior to our common stockholders. Additionally, any convertible or exchangeable securities that we issue in the future may have rights, preferences and privileges more favorable than those of our common stock and may result in dilution to owners of our common stock. Our stockholders are not entitled to preemptive rights or other protections against dilution. Our preferred stock, if issued, could have a preference on liquidating distributions or a preference on distribution payments that could limit our right to make distributions to our stockholders. Because our decision to issue securities in any future offering will depend on market conditions and other factors beyond our control, we cannot predict or estimate the amount, timing or nature of our future offerings. Our stockholders bear the risk of our future offerings reducing the market price of our common stock.
Future contractual repurchase obligations may materially and adversely affect the market price of shares of our common stock and may reduce future distributions.
We have issued rollover equity to various sellers of assets acquired by us as part of the purchase price consideration for those assets. This rollover equity has generally taken the form of units in BGLH or units in Lineage OP, although in certain circumstances we have issued such rollover equity at our subsidiaries. Some of these sellers who received rollover equity were provided with separate classes of equity that included special one-time redemption features such as minimum value guarantees and in some cases the alternative option to elect cash or equity top-up rights to achieve a certain minimum equity valuation at a specified date (collectively, the “Guarantee Rights”). The ultimate obligations in respect of the Guarantee Rights, while currently structured at BGLH and Lineage OP, will become obligations of Lineage Holdings in connection with the formation transactions in order to ensure that the financial obligations associated with the Guarantee Rights impact investors in Lineage, our operating partnership and Lineage Holdings proportionately at the time they arise. Any trigger of the Guarantee Rights at BGLH or our operating partnership will result in successive redemptions or successive top-up cash payments or equity issuances between Lineage, our operating partnership and Lineage Holdings to effect this result, which may reduce our liquidity or dilute the ownership interest of our common stockholders. Such amounts could be material and could materially and adversely affect the market price of shares of our common stock and reduce future distributions to our stockholders.
In addition, pursuant to the coordinated settlement process that will occur for up to three years following this offering, all of the shares of our common stock outstanding immediately prior to this offering will transition from the control of BGLH, and all of the Legacy OP Units will transition from the control of BGLH’s subsidiary, the LHR, through (i) Cash Settlements of such equity in amounts that are expected to be material and (ii) Securities Settlements for all remaining amounts of such equity, resulting in the transfer of control of all such securities to the underlying legacy investors who will then determine the timing of their future disposition of such securities. Such transactions may reduce our liquidity and materially and adversely affect the market price of shares of our common stock and reduce funds available for distribution to our stockholders.
Sales of substantial amounts of our common stock in the public markets, or the perception that they might occur, could reduce the price of our common stock and may dilute your voting power and your ownership interest in us.
Sales of substantial amounts of our common stock in the public market following our initial public offering, or the perception that such sales could occur, could adversely affect the market price of our common stock and may make it more difficult for you to sell your common stock at a time and price that you deem appropriate. We expect to have outstanding 210,008,463 shares of our common stock (or 217,058,463 shares of our common stock if the underwriters exercise in full their option to purchase additional shares).
99
Table of Contents
The shares of our common stock that we are selling in this offering (except for shares of our common stock purchased by our directors and officers in the directed share program, which are subject to a 180-day lock-up period) may be resold immediately in the public market unless they are held by “affiliates,” as that term is defined in Rule 144 of the Securities Act. The common stock, OP units, Legacy OP Units and OPEUs to be issued in the formation transactions will be “restricted securities” within the meaning of Rule 144 under the Securities Act and may not be sold in the absence of registration under the Securities Act unless an exemption from registration is available, including the exemptions contained in Rule 144. Bay Grove (as well as our directors, director nominees, officers and certain other persons buying shares of our common stock through the directed share program) has agreed, subject to certain exceptions, not to sell or otherwise dispose of any of its common stock, OP units (which may be exchanged for common stock), Legacy OP Units (which, upon reclassification as OP units, may be exchanged for common stock) or OPEUs from the date of this prospectus continuing through the date 180 days after the date of this prospectus, except with the underwriters’ prior written consent. Pursuant to the coordinated settlement process that will occur for up to three years following this offering, all of the shares of our common stock outstanding immediately prior to this offering will transition from the control of BGLH and all of the Legacy OP Units will transition from the control of BGLH’s subsidiary, the LHR, through (i) Cash Settlements of such equity in amounts that are expected to be material and (ii) Securities Settlements for all remaining amounts of such equity, resulting in the transfer of control of all such securities to the underlying legacy investors who will then determine the timing of their future disposition of such securities. Legacy investors that receive Securities Settlements will have registration rights with respect to shares of our common stock, including common stock that may be issued in exchange for OP units (including OP units that may be issued upon reclassification of Legacy OP Units or exchange of OPEUs). As a result of these registration rights agreements, however, all of these shares of our common stock, including common stock that may be issued in exchange for OP units (including OP units that may be issued upon reclassification of Legacy OP Units or exchange of OPEUs), may be eligible for future sale without restriction, subject to applicable lock-up arrangements. See “Shares Eligible for Future Sale” and “Certain Relationships and Related Party Transactions—Registration Rights Agreements.” Sales of a substantial number of such shares upon expiration of the lock-up agreements, the perception that such sales may occur, or early release of these agreements, could cause the market price of our common stock to fall or make it more difficult for you to sell your common stock at a time and price that you deem appropriate.
In addition, upon completion of this offering, our charter will provide that we may issue up to 500,000,000 shares of common stock and 100,000,000 shares of preferred stock, $0.01 par value per share. Moreover, under Maryland law and as will be provided in our charter, a majority of our entire board of directors will have the power to amend our charter to increase or decrease the aggregate number of shares of stock or the number of shares of stock of any class or series that we are authorized to issue without stockholder approval. Future issuances of shares of our common stock or securities convertible or exchangeable into common stock may dilute the ownership interest of our common stockholders. Because our decision to issue additional equity or convertible or exchangeable securities in any future offering will depend on market conditions and other factors beyond our control, we cannot predict or estimate the amount, timing or nature of our future issuances. In addition, we are not required to offer any such securities to existing stockholders on a preemptive basis. Therefore, it may not be possible for existing stockholders to participate in such future issuances, which may dilute the existing stockholders’ interests in us.
A lack of research analyst coverage or restrictions on the ability of analysts associated with the co-managers of this offering to publish during certain time periods, including when we report our results of operations, could materially and adversely affect the market price and liquidity of our common stock.
We cannot assure you that research analysts, including those associated with the underwriters of this offering, will initiate or maintain research coverage of us or our common stock. In addition, regulatory rules prohibit research analysts associated with the co-managers of this offering from publishing or otherwise distributing a research report or from making a public appearance regarding us for 15 days prior to and after the expiration, waiver or termination of any lock-up agreement that we or certain of our stockholders have entered into with the underwriters of this offering. Accordingly, it could be the case that research concerning our results of operations or the possible effects on us of significant news or a significant event will not be published or will be published on a delayed basis. A lack of research or the inability of certain research analysts to publish research
100
Table of Contents
relating to our results of operations or significant news or a significant event in a timely manner could materially and adversely affect the market price and liquidity of our common stock.
Risks Related to Our REIT Status and Other Tax Risks
Failure to qualify as a REIT would cause us to be taxed as a regular C corporation, which would substantially reduce funds available for distributions to stockholders.
We elected to be taxed as a REIT for U.S. federal income tax purposes commencing with our taxable year ended December 31, 2020. We believe that our organization and method of operation has enabled and will continue to enable us to meet the requirements for qualification and taxation as a REIT for U.S. federal income tax purposes. However, we cannot assure you that we will qualify as such. This is because qualification as a REIT involves the application of highly technical and complex provisions of the Code as to which there are only limited judicial and administrative interpretations and involves the determination of facts and circumstances not entirely within our control. The complexity of these provisions and of the applicable regulations (as in effect from time to time) of the United States Department of the Treasury under the Code is greater in the case of a REIT, like us, that holds assets through a partnership. Future legislation, new regulations, administrative interpretations or court decisions may significantly change the tax laws or the application of the tax laws with respect to qualification as a REIT for federal income tax purposes or the federal income tax consequences of such qualification.
In order to qualify as a REIT, we must satisfy a number of requirements, including requirements regarding the ownership of our stock and the composition of our gross income and assets. Also, a REIT must make distributions to stockholders aggregating annually at least 90% of its REIT taxable income, determined without regard to the dividends paid deduction and excluding any net capital gains.
If we fail to qualify as a REIT in any taxable year, and are unable to obtain relief under certain statutory provisions, we will face material tax consequences that will substantially reduce the funds available for distributions to our stockholders because:
• | we would be subject to regular United States federal corporate income tax on our net income for the years we did not qualify for taxation as a REIT (and, for such years, would not be allowed a deduction for dividends paid to stockholders in computing our taxable income); |
• | we could be subject to a federal alternative minimum tax and possibly increased state and local taxes for such periods; |
• | unless we are entitled to relief under applicable statutory provisions, neither we nor any “successor” company could elect to be taxed as a REIT until the fifth taxable year following the year during which we were disqualified; and |
• | for five years following re-election of REIT status, upon a taxable disposition of an asset owned as of such re-election, we could be subject to corporate level tax with respect to any built-in gain inherent in such asset at the time of re-election. |
As a result of all these factors, our failure to qualify as a REIT could impair our ability to expand our business and raise capital, and it could adversely affect the value of our common stock. If we fail to qualify as a REIT, we would no longer be required to make distributions to our stockholders.
Even if we qualify as a REIT, we may face other tax liabilities that reduce our cash available for distribution to our stockholders.
Even if we have qualified and continue to qualify as a REIT for U.S. federal income tax purposes, we may be subject to certain U.S. federal, state and local taxes on our income and assets, including taxes on any undistributed income, tax on income from some activities conducted as a result of a foreclosure, and state or local
101
Table of Contents
income, property and transfer taxes. In addition, we conduct a significant portion of our U.S. business through TRSs that are regular taxable corporations. Furthermore, our status as a REIT for U.S. federal income tax purposes generally does not reduce non-U.S. taxes on our operations and assets outside of the United States. Moreover, to the extent that we incur non-U.S. taxes outside of a domestic TRS, we have limited ability to utilize credits against our U.S. federal income tax liabilities for foreign taxes paid or accrued. Any of these taxes would decrease cash available for distributions to stockholders.
If our operating partnership or any other subsidiary partnership or limited liability company fails to qualify as a partnership or disregarded entity for U.S. federal income tax purposes, we could fail to qualify as a REIT and would suffer adverse consequences.
We believe that our operating partnership is organized and will be operated in a manner so as to be treated as a partnership, and not an association or publicly traded partnership taxable as a corporation, for U.S. federal income tax purposes. As a partnership, our operating partnership will not be subject to U.S. federal income tax on its income. Instead, each of its partners, including us, will be allocated that partner’s share of our operating partnership’s income. No assurance can be provided, however, that the Internal Revenue Service, or the IRS, will not challenge the status of our operating partnership or any other subsidiary partnership or limited liability company in which we own an interest as a partnership or disregarded entity for U.S. federal income tax purposes, or that a court would not sustain such a challenge. If the IRS were successful in treating our operating partnership or any such other subsidiary partnership or limited liability company as an association or publicly traded partnership taxable as a corporation for U.S. federal income tax purposes, we could fail to meet the gross income tests and certain of the asset tests applicable to REITs and, accordingly, could cease to qualify as a REIT. Also, the failure of our operating partnership or of any such other subsidiary partnership or limited liability company to qualify as a partnership or disregarded entity would cause it to become subject to U.S. federal corporate income tax, which would reduce significantly the amount of its cash available for debt service and for distribution to its partners or members, including us.
Our operating partnership has a carryover tax basis on certain of its assets as a result of certain transactions, and the amount that we have to distribute to stockholders therefore may be higher.
Certain of our operating partnership’s assets were acquired in tax-deferred transactions and have carryover tax bases that are lower than the fair market values of these assets at the time of the acquisition. As a result of this lower aggregate tax basis, our operating partnership will recognize higher taxable gain upon the sale of these assets and our operating partnership will be entitled to lower depreciation deductions on these assets than if it had purchased these assets in taxable transactions at the time of the acquisition. Such lower depreciation deductions and increased gains on sales allocated to us generally will increase the amount of our required distribution under the REIT rules, and will decrease the portion of any distribution that otherwise would have been treated as a “return of capital” distribution.
Our property taxes could increase due to property tax rate changes or reassessment, which could impact our cash flow.
Even if we qualify as a REIT for U.S. federal income tax purposes, we are required to pay state and local property taxes on certain of our assets. The property taxes on our assets may increase as property tax rates change or as our assets are assessed or reassessed by taxing authorities. Therefore, the amount of property taxes we pay in the future may increase substantially from what we have paid in the past. If the property taxes we pay increase, our financial condition, results of operations, cash flow, per share trading price of our common stock, and ability to satisfy our principal and interest obligations and to make distributions to our stockholders could be adversely affected.
We use TRSs, which may cause us to fail to qualify as a REIT.
To qualify as a REIT for U.S. federal income tax purposes, we hold, and plan to continue to hold, substantially all of our non-qualifying REIT assets and conduct certain of our non-qualifying REIT income
102
Table of Contents
activities in or through one or more TRS entities. A TRS is a corporation other than a REIT in which a REIT directly or indirectly holds stock, and that has made a joint election with such REIT to be treated as a TRS. A TRS also includes any corporation other than a REIT with respect to which a TRS owns securities possessing more than 35% of the total voting power or value of the outstanding securities of such corporation. Other than some activities relating to lodging and health care facilities, a TRS may generally engage in any business, including the provision of customary or non-customary services to tenants of its parent REIT. A TRS is subject to U.S. federal income tax as a regular C corporation at a current rate of 21%.
The net income of our TRS entities is not required to be distributed to us, and income that is not distributed to us will generally not be subject to the REIT income distribution requirement. However, our TRS entities may pay dividends. Such dividend income should qualify under the 95%, but not the 75%, gross income test. We will monitor the amount of the dividend and other income from our TRS entities and will take actions intended to keep this income, and any other non-qualifying income, within the limitations of the REIT income tests. While we expect these actions will prevent a violation of the REIT income tests, we cannot guarantee that such actions will in all cases prevent such a violation.
Our ownership of TRS entities is subject to limitations that could prevent us from growing the portion of our business that does not qualify for operating through a REIT, and our transactions with our TRS entities could cause us to be subject to a 100% penalty tax on certain income or deductions if those transactions are not conducted on an arm’s-length basis.
No more than 20% of the value of a REIT’s gross assets may consist of interests in TRS entities. We hold a portion of our business that could adversely impact our status as a REIT, if conducted directly by the REIT, through one or more TRS entities. In addition, we may acquire companies and properties through our TRS entities until such companies or properties can be restructured to operate in a REIT compliant manner. Compliance with the TRS ownership limitation could limit our ability to grow the portion of our business that does not qualify for operating through a REIT. The Code also imposes a 100% excise tax on certain transactions between a TRS and its parent REIT that are not conducted on an arm’s-length basis. Our board of directors may determine in good faith the valuation of our gross assets, including the value of securities in our TRS entities, on a quarterly basis. We will monitor the value of investments in our TRS entities in order to comply with TRS ownership limitations and will structure our transactions with our TRS entities on terms that we believe are arm’s-length to avoid incurring the 100% excise tax described above. There can be no assurance, however, that we will be able to comply with the TRS ownership limitation or be able to avoid application of the 100% excise tax.
REIT distribution requirements could adversely affect our ability to execute our business plans, including because we may be required to borrow funds to make distributions to stockholders or otherwise depend on external sources of capital to fund such distributions.
We generally must distribute annually at least 90% of our REIT taxable income (which is determined without regard to the dividends paid deduction or net capital gain for this purpose) in order to continue to qualify as a REIT. To the extent that we satisfy the distribution requirement but distribute less than 100% of our REIT taxable income (determined without regard to the dividends paid deduction and including any net capital gains), we will be subject to federal corporate income tax on our undistributed taxable income. In addition, we may elect to retain and pay income tax on our net long-term capital gain. In that case, if we so elect, a stockholder would be taxed on its proportionate share of our undistributed long-term gain and would receive a credit or refund for its proportionate share of the tax we paid. A stockholder, including a tax-exempt or non-U.S. stockholder, would have to file a U.S. federal income tax return to claim that credit or refund. Furthermore, we will be subject to a 4% nondeductible excise tax if the actual amount that we distribute to our stockholders in a calendar year is less than a minimum amount specified under federal tax laws.
We intend to make distributions to our stockholders to comply with the REIT requirements of the Code and to avoid corporate income tax and the 4% excise tax. We may be required to make distributions to our
103
Table of Contents
stockholders at times when it would be more advantageous to reinvest cash in our business or when we do not have funds readily available for distribution. Thus, compliance with the REIT requirements may hinder our ability to operate solely on the basis of maximizing profits.
If we do not have other funds available, we could be required to borrow funds on unfavorable terms, sell investments at disadvantageous prices, distribute amounts that would otherwise be invested in future acquisitions or capital expenditures or used for the repayment of debt, pay dividends in the form of taxable stock dividends or find another alternative source of funds to make distributions sufficient to enable us to distribute enough of our taxable income to satisfy the REIT distribution requirement and to avoid corporate income tax and the 4% excise tax in a particular year. These alternatives could increase our costs or adversely affect the value of our common stock.
Complying with REIT requirements may cause us to forgo otherwise attractive opportunities or liquidate otherwise attractive investments.
To continue to qualify as a REIT for U.S. federal income tax purposes, we must continually satisfy tests concerning, among other things, the sources of our income, the nature and diversification of our assets, the amounts we distribute to stockholders and the ownership of our stock. As discussed above, we may be required to make distributions to you at disadvantageous times or when we do not have funds readily available for distribution. Additionally, we may be unable to pursue investments that would be otherwise attractive to us in order to satisfy the requirements for qualifying as a REIT.
At the end of each calendar quarter, at least 75% of the value of our assets must consist of cash, cash items, U.S. government securities and qualified real estate assets, including certain mortgage loans and mortgage-backed securities. The remainder of our investment in securities (other than U.S. government securities and qualified real estate assets) generally cannot include more than 10% of the outstanding voting securities of any one issuer or more than 10% of the total value of the outstanding securities of any one issuer. In addition, in general, no more than 5% of the value of our assets can consist of the securities of any one issuer (other than U.S. government securities and qualified real estate assets) and no more than 20% of the value of our gross assets may be represented by securities of one or more TRS entities. Finally, no more than 25% of our assets may consist of debt investments that are issued by “publicly offered REITs” and would not otherwise be treated as qualifying real estate assets. If we fail to comply with these requirements at the end of any calendar quarter, we must correct such failure within 30 days after the end of the calendar quarter to avoid losing our REIT status and being subject to adverse tax consequences, unless certain relief provisions apply. As a result, compliance with the REIT requirements may hinder our ability to operate solely on the basis of profit maximization and may require us to liquidate investments from our portfolio, or refrain from making otherwise attractive investments. These actions could have the effect of reducing our income and amounts available for distribution to stockholders.
The prohibited transactions tax may limit our ability to engage in transactions, including disposition of assets, which would be treated as sales for U.S. federal income tax purposes.
A REIT’s net income from prohibited transactions is subject to a 100% tax. In general, prohibited transactions are sales or other dispositions of dealer property (i.e., property held primarily for sale to customers in the ordinary course of our trade or business), other than foreclosure property. We may be subject to the prohibited transaction tax upon a disposition of real property. Although a safe-harbor exception to prohibited transaction treatment is available, we cannot assure you that we can comply with such safe harbor or that we will avoid owning property that may be characterized as dealer property. Consequently, we may choose not to engage in certain sales of real property or may conduct such sales through a TRS.
It may be possible to reduce the impact of the prohibited transaction tax by conducting certain activities through a TRS. However, to the extent that we engage in such activities through a TRS, the income associated with such activities will be subject to a corporate income tax. In addition, the IRS may attempt to ignore or otherwise recast such activities in order to impose a prohibited transaction tax on us, and there can be no assurance that such recast will not be successful.
104
Table of Contents
We may recognize substantial amounts of REIT taxable income, which we would be required to distribute to our stockholders, in a year in which we are not profitable under GAAP or other economic measures.
We may recognize substantial amounts of REIT taxable income in years in which we are not profitable under GAAP or other economic measures as a result of the differences between GAAP and tax accounting methods. For instance, certain of our assets may be marked-to-market for GAAP purposes but not for tax purposes, which could result in losses for GAAP purposes that are not recognized in computing our REIT taxable income. Additionally, we may deduct our capital losses only to the extent of our capital gains in computing our REIT taxable income for a given taxable year. Consequently, we could recognize substantial amounts of REIT taxable income and would be required to distribute such income to you in a year in which we are not profitable under GAAP or other economic measures.
Our qualification as a REIT could be jeopardized as a result of an interest in joint ventures.
We may hold certain limited partner or non-managing member interests in partnerships or limited liability companies that are joint ventures. If a partnership or limited liability company in which we own an interest takes or expects to take actions that could jeopardize our qualification as a REIT or require us to pay tax, we may be forced to dispose of our interest in such entity. In addition, it is possible that a partnership or limited liability company could take an action which could cause us to fail a REIT gross income or asset test, and that we would not become aware of such action in time to dispose of our interest in the partnership or limited liability company or take other corrective action on a timely basis. In that case, we could fail to continue to qualify as a REIT unless we are able to qualify for a statutory REIT “savings” provision, which may require us to pay a significant penalty tax to maintain our REIT qualification.
Dividends payable by REITs may be taxed at higher rates.
Dividends payable by REITs may be taxed at higher rates than dividends of non-REIT corporations. The maximum U.S. federal income tax rate for qualified dividends paid by domestic non-REIT corporations to U.S. stockholders that are individuals, trusts or estates is generally 20%. Dividends paid by REITs to such stockholders are generally not eligible for that rate, but under current tax law, such stockholders may deduct up to 20% of ordinary dividends (i.e., dividends not designated as capital gain dividends or qualified dividend income) received from a REIT for taxable years beginning before January 1, 2026. Although this deduction reduces the effective tax rate applicable to certain dividends paid by REITs, such tax rate may still be higher than the tax rate applicable to regular corporate qualified dividends. This may cause investors to view REIT investments as less attractive than investments in non-REIT corporations, which in turn may adversely affect the value of stock of REITs, including our stock. In addition, the relative attractiveness of real estate in general may be adversely affected by the favorable tax treatment given to corporate dividends, which could negatively affect the value of certain of our assets.
In the event we acquire assets of C corporations (including by merger) in carry-over basis transactions, we may inherit material tax liabilities and other tax attributes from such acquired corporations, and we may be required to distribute earnings and profits.
From time to time, we may acquire assets from C corporations in transactions in which the basis of the corporations’ assets in our hands is determined by reference to the basis of the assets in the hands of the acquired corporations (including in connection with post-acquisition integration transactions), or carry-over basis transactions.
If Lineage, Inc. or one of our subsidiaries that have elected or will elect to be treated as REITs under the Code (collectively, “Subsidiary REITs”) acquires any asset from a corporation that is or has been a C corporation in a carry-over basis transaction and Lineage, Inc. or its applicable Subsidiary REIT subsequently recognizes gain on the disposition of the asset during the five-year period beginning on the date on which Lineage, Inc. or its applicable Subsidiary REIT acquired the asset, then Lineage, Inc. or its applicable Subsidiary REIT will be
105
Table of Contents
required to pay tax at the regular corporate tax rate on this gain to the extent of the excess of the fair market value of the asset over Lineage, Inc.’s or its applicable Subsidiary REIT’s adjusted basis in the asset, in each case determined as of the date on which Lineage, Inc. or its applicable Subsidiary REIT acquired the asset (the so-called sting tax). The results described in this paragraph with respect to the recognition of gain assume that the C corporation will refrain from making an election to receive different treatment under applicable Treasury regulations promulgated under the Code (the “Treasury Regulations”) on its tax return for the year in which Lineage, Inc. or its applicable Subsidiary REIT acquires the asset from the C corporation.
We acquired a portion of our assets through a contribution by BGLH of the Lineage Logistics business to us in 2020. Treasury Regulations also apply the rules described above to property transferred to us by a partnership, such as BGLH, that directly or indirectly has partners that are C corporations. Under these rules, any gain that would have been allocated directly or indirectly by the transferor partnership to a C corporation partner, if the property had been sold at fair market value on the date of the contribution of the property to us, would be subject to the sting tax. As a result, a sale of a portion of our assets may be subject to the sting tax.
Any such sting taxes Lineage, Inc. or its applicable Subsidiary REIT pays would reduce the amount available for distribution to our stockholders. The imposition of such tax may require Lineage, Inc. or its applicable Subsidiary REIT to forgo an otherwise attractive disposition of any assets acquired from a C corporation in a carry-over basis transaction and, as a result, may reduce the liquidity of our portfolio of investments. In addition, in such a carry-over basis transaction, Lineage, Inc. or its applicable Subsidiary REIT will succeed to any tax liabilities and earnings and profits of the acquired C corporation. To qualify as a REIT, Lineage, Inc. or its applicable Subsidiary REIT must distribute any non-REIT earnings and profits by the close of the taxable year in which such transaction occurs. Any adjustments to the acquired corporation’s income for taxable years ending on or before the date of the transaction, including as a result of an examination of the corporation’s tax returns by the IRS, could affect the calculation of the corporation’s earnings and profits.
If the IRS were to determine that Lineage, Inc. or its applicable Subsidiary REIT acquired non-REIT earnings and profits from a corporation that Lineage, Inc. or its applicable Subsidiary REIT failed to distribute prior to the end of the taxable year in which the carry-over basis transaction occurred, Lineage, Inc. or its applicable Subsidiary REIT could avoid disqualification as a REIT by paying a “deficiency dividend.” Under these procedures, Lineage, Inc. or its applicable Subsidiary REIT generally would be required to (i) pay a statutory interest charge at a specified rate to the IRS on 50% of any such non-REIT earnings and profits and (ii) distribute any such non-REIT earnings and profits (less any interest charge paid to the IRS) to its stockholders within 90 days of the determination. Such a distribution would be in addition to the distribution of REIT taxable income necessary to satisfy the REIT distribution requirement and may require that we borrow funds to make the distribution even if the then-prevailing market conditions are not favorable for borrowings. In addition, payment of the statutory interest charge could materially and adversely affect us.
Legislative or regulatory tax changes could adversely affect us or our stockholders.
At any time, the U.S. federal income tax laws or regulations governing REITs or the administrative interpretations of those laws or regulations may be amended. We cannot predict when or if any new U.S. federal income tax law, regulation or administrative interpretation, or any amendment to any existing U.S. federal income tax law, regulation or administrative interpretation, will be adopted, promulgated or become effective and any such law, regulation or interpretation may take effect retroactively. Any such change could result in an increase in our, or our stockholders’, tax liability or require changes in the manner in which we operate in order to minimize increases in our tax liability. A shortfall in tax revenues for states and municipalities in which we operate may lead to an increase in the frequency and size of such changes. If such changes occur, we may be required to pay additional taxes on our assets or income or be subject to additional restrictions. These increased tax costs could, among other things, adversely affect our financial condition, the results of operations, and the amount of cash available for the payment of dividends. We and our stockholders could be adversely affected by any such change in, or any new, U.S. federal income tax law, regulation, or administrative interpretation.
106
Table of Contents
We are subject to IRS tax audits that could adversely affect us.
On November 30, 2023, Lineage, Inc. received notice from the IRS that its federal tax return (Form 1120-REIT) for the tax year ended December 31, 2021, has been selected for examination. The audit is ongoing and to date no issues have been identified. It is possible that the results of the audit could nevertheless have a material adverse impact on us and our stockholders. On December 18, 2023, Lineage Holdings received a Notice of Administrative Proceeding (audit) from the IRS for its partnership federal tax return for the tax year ended December 31, 2021. The audit is ongoing and to date no issues have been identified. It is possible that the results of the audit could nevertheless have a material adverse impact on us and our stockholders.
107
Table of Contents
SPECIAL NOTE REGARDING FORWARD-LOOKING STATEMENTS
This prospectus contains forward-looking statements within the meaning of the federal securities laws. In particular, statements pertaining to our business and growth strategies, investment and development activities and trends in our business, contain forward-looking statements. When used in this prospectus, the words “estimate,” “anticipate,” “expect,” “believe,” “intend,” “may,” “will,” “could,” “should,” “would,” “seek,” “position,” “support,” “drive,” “enable,” “optimistic,” “target,” “opportunity,” “approximately” or “plan,” or the negative of these words and phrases or similar words or phrases that are predictions of or indicate future events or trends and that do not relate solely to historical matters are intended to identify forward-looking statements. You can also identify forward-looking statements by discussions of strategy, plans or intentions of management.
Forward-looking statements involve numerous risks and uncertainties, and you should not rely on them as predictions of future events. Forward-looking statements depend on assumptions, data or methods that may be incorrect or imprecise and we may not be able to realize them. We do not guarantee that the transactions and events described will happen as described (or that they will happen at all). The following factors, among others, could cause actual results and future events to differ materially from those set forth or contemplated in the forward-looking statements:
• | general business and economic conditions; |
• | continued volatility and uncertainty in the credit markets and broader financial markets, including potential fluctuations in the Consumer Price Index and changes in foreign currency exchange rates; |
• | other risks inherent in the real estate business, including customer defaults, potential liability relating to environmental matters, illiquidity of real estate investments and potential damages from natural disasters; |
• | the availability of suitable acquisitions and our ability to acquire properties or businesses on favorable terms; |
• | our success in implementing our business strategy and our ability to identify, underwrite, finance, consummate, integrate and manage diversifying acquisitions or investments; |
• | our ability to meet budgeted or stabilized returns on our development and expansion projects within expected time frames, or at all; |
• | our ability to manage our expanded operations, including expansion into new markets or business lines; |
• | our failure to realize the intended benefits from, or disruptions to our plans and operations or unknown or contingent liabilities related to, our recent and future acquisitions; |
• | our failure to successfully integrate and operate acquired or developed properties or businesses; |
• | our ability to renew significant customer contracts; |
• | the impact of supply chain disruptions, including the impact on labor availability, raw material availability, manufacturing and food production and transportation; |
• | difficulties managing an international business and acquiring or operating properties in foreign jurisdictions and unfamiliar metropolitan areas; |
• | changes in political conditions, geopolitical turmoil, political instability, civil disturbances, restrictive governmental actions or nationalization in the countries in which we operate; |
• | the degree and nature of our competition; |
• | our failure to generate sufficient cash flows to service our outstanding indebtedness; |
• | our ability to access debt and equity capital markets; |
• | continued increases and volatility in interest rates; |
108
Table of Contents
• | increased power, labor or construction costs; |
• | changes in consumer demand or preferences for products we store in our warehouses; |
• | decreased storage rates or increased vacancy rates; |
• | labor shortages or our inability to attract and retain talent; |
• | changes in, or the failure or inability to comply with, government regulation; |
• | a failure of our information technology systems, systems conversions and integrations, cybersecurity attacks or a breach of our information security systems, networks or processes; |
• | our failure to maintain our status as a REIT for U.S. federal income tax purposes; |
• | changes in local, state, federal and international laws and regulations, including related to taxation, real estate and zoning laws, and increases in real property tax rates; |
• | the impact of any financial, accounting, legal or regulatory issues or litigation that may affect us; and |
• | additional factors discussed in the sections entitled “Business and Properties,” “Risk Factors” and “Management’s Discussion and Analysis of Financial Condition and Results of Operations” in this prospectus. |
You are cautioned not to place undue reliance on forward-looking statements, which speak only as of the date of this prospectus. While forward-looking statements reflect our good faith beliefs, they are not guarantees of future performance. We undertake no obligation to publicly release the results of any revisions to these forward-looking statements that may be made to reflect events or circumstances after the date of this prospectus or to reflect the occurrence of unanticipated events, except as required by law. In light of these risks and uncertainties, the forward-looking events discussed in this prospectus might not occur as described, or at all.
109
Table of Contents
We estimate that the net proceeds to us from this offering will be approximately $3.4 billion, or $3.9 billion if the underwriters exercise in full their option to purchase additional shares, after deducting underwriting discounts and commissions and other estimated expenses, in each case, based on an assumed initial public offering price of $76.00 per share, which is the mid-point of the price range set forth on the front cover of this prospectus. We will contribute the net proceeds from this offering to our operating partnership in exchange for OP units.
The following table sets forth the estimated sources and estimated uses of funds by our operating partnership that we expect in connection with this offering and the formation transactions. Exact payment amounts may differ from estimates due to the actual initial public offering price per share, additional borrowings, incurrence of additional transaction expenses and prepayment of certain transaction expenses (in millions).
Sources | Uses | |||||||||
Gross proceeds | $ | 3,572.0 | Repayment of borrowings outstanding under the Delayed Draw Term Loan (inclusive of interest and fees) | $ | 2,410.0 | |||||
Repayment of borrowings outstanding under the Revolving Credit Facility | $ | 917.1 | ||||||||
Funding of one-time cash grants to certain of our employees in connection with this offering and estimated cash to pay tax withholding obligations associated with stock grants(1) | $ | 91.6 | ||||||||
Redemption of our Series A preferred stock | $ | 0.6 | ||||||||
Transaction expenses (including underwriting discounts and commissions of $134.0 and other expenses of $18.7 incurred in connection with this offering and the formation transactions(2)) | $ | 152.7 | ||||||||
|
|
|
| |||||||
Total | $ | 3,572.0 | Total | $ | 3,572.0 | |||||
|
|
|
|
(1) | See “Executive Compensation—Equity Awards in Connection with the IPO—Executive and Employee IPO Awards” and “Certain Relationships and Related Party Transactions—Amended and Restated Lineage 2024 Incentive Award Plan.” |
(2) | Excludes $17.3 million of costs incurred in connection with this offering and the formation transactions that have been paid prior to the commencement of this offering and are not a use of net proceeds. |
Following such uses, we expect our operating partnership to use the remainder of the net proceeds for general corporate purposes, which may include the repayment of additional borrowings outstanding under the Revolving Credit Facility.
Pending the permanent use of the net proceeds from these offerings, we intend to invest the net proceeds in interest-bearing, short-term investment-grade securities, money-market accounts or other investments that are consistent with our intention to qualify for taxation as a REIT for federal income tax purposes.
The Delayed Draw Term Loan permits prepayments of principal, in whole or in part, at any time, without premium or penalty. The Delayed Draw Term Loan bears interest at an annual floating rate of term SOFR plus 0.10% (“Adjusted SOFR”) plus a spread of between 1.60% and 2.20% based on our total leverage ratio. Based on our existing total leverage ratio, the interest rate expected to be in effect for our Delayed Draw Term Loan borrowing is Adjusted Term SOFR plus 1.60%. In addition, the Delayed Draw Term Loan is subject to a commitment fee of 0.20% on the average daily unused amount of the commitment. The Delayed Draw Term Loan proceeds were utilized to repay our ICE4 CMBS loan on April 9, 2024, prior to maturity in May 2024, and to repay a portion of the Revolving Credit Facility. Our ICE4 CMBS loan bore interest at an annual floating rate of term SOFR plus a margin of 1.66%.
110
Table of Contents
The Revolving Credit Facility may be voluntarily prepaid in whole or in part at any time without premium or penalty. Amounts borrowed under the Revolving Credit Facility bear interest, at our election, up to either 1.20% over the base rate or 2.20% over (i) for dollar-denominated loans, an adjusted Term Secured Overnight Financing Rate (“adjusted Term SOFR rate”) or (ii) for loans denominated in a foreign currency, an adjusted daily simple RFR (“adjusted Daily Simple RFR”), in each case, with step-downs based on the borrower’s total leverage ratio as defined by the Revolving Credit and Term Loan Agreement. As of July 12, 2024, the Revolving Credit Facility bore interest at 0.10% over the Term SOFR rate or adjusted Daily Simple RFR, as applicable, plus 1.60% spread adjustment. As of July 12, 2024, our Revolving Credit Facility had a total outstanding balance of $2.5 billion.
Certain of the underwriters and/or their respective affiliates are acting as lenders under the Delayed Draw Term Loan and will receive their pro rata portion of the approximately $2.4 billion of the net proceeds from this offering used to repay amounts outstanding under such facility. Certain of the underwriters and/or their respective affiliates are lenders under the Revolving Credit Facility. Therefore, to the extent that we use any net proceeds to reduce the outstanding balance under the Revolving Credit Facility, such underwriters and/or affiliates of such underwriters may receive their pro rata portion of such net proceeds through the repayment of borrowings outstanding under the Revolving Credit Facility. For additional information, see “Underwriters.”
111
Table of Contents
We have elected to qualify as a REIT for U.S. federal income tax purposes. To qualify as a REIT, we must distribute annually at least 90% of our REIT taxable income, determined without regard to the dividends paid deduction and excluding any net capital gains. To the extent we satisfy the distribution requirement but distribute less than 100% of our REIT taxable income (determined without regard to the dividends paid deduction and including any net capital gains), we will be subject to federal corporate income tax on our undistributed taxable income. In addition, as a REIT, we will be required to pay a 4% nondeductible excise tax on the amount, if any, by which the distributions we make in a calendar year are less than the sum of 85% of our ordinary income, 95% of our capital gain net income and 100% of our undistributed income from prior years. For more information, see “Federal Income Tax Considerations—Taxation of Our Company—Annual Distribution Requirements.” To satisfy the requirements to qualify as a REIT and to avoid paying tax on our income, we intend to make quarterly distributions of all, or substantially all, of our REIT taxable income (including net capital gains) to our stockholders. In addition, we have a long-term target of distributing approximately 50% of our Adjusted FFO to our stockholders annually.
Although we anticipate initially making quarterly distributions to our stockholders, the timing, form and amount of distributions, if any, to our stockholders will be at the sole discretion of our board of directors, and their form, timing and amount, if any, will depend upon a number of factors, including our actual and projected results of operations, Core FFO, Adjusted FFO, EBITDA, EBITDAre, Adjusted EBITDA, liquidity, cash flows and financial condition, the revenue we actually receive from our properties, our operating expenses, our debt service requirements, our capital expenditures, prohibitions and other limitations under our financing arrangements, our REIT taxable income, the annual REIT distribution requirements, applicable law, including restrictions on distributions under Maryland law, and such other factors as our board of directors deems relevant. In addition, our charter allows us to issue preferred stock that could have a preference on distributions and could limit our ability to make distributions to our common stockholders.
If our operations do not generate sufficient cash flow to enable us to pay our intended or required distributions, we may be required either to fund distributions from alternative sources, including working capital, borrowings, asset sales or equity capital, or reduce such distributions. Our actual results of operations will be affected by a number of factors, including the revenues we generate, our operating expenses, interest expense and unanticipated expenditures, among others. For more information regarding risk factors that could materially and adversely affect us and our ability to make cash distributions, see “Risk Factors.”
During the year ended December 31, 2023, we declared aggregate distributions of $88.5 million with respect to shares of our common stock, which distributions were paid in January 2024. We have not declared any distributions with respect to shares of our common stock during 2024.
112
Table of Contents
The following table sets forth our historical cash and cash equivalents and capitalization as of March 31, 2024 and our pro forma cash and cash equivalents and capitalization as of March 31, 2024 to give effect to this offering, the formation transactions and the other adjustments described in the unaudited pro forma condensed consolidated financial statements included elsewhere in this prospectus, based on the mid-point of the price range set forth on the front cover of this prospectus. This table should be read in conjunction with the sections entitled “Use of Proceeds,” “Summary Selected Historical and Pro Forma Condensed Consolidated Financial and Other Data,” “Management’s Discussion and Analysis of Financial Condition and Results of Operations” and our historical and pro forma condensed consolidated financial statements and related notes included elsewhere in this prospectus.
As of March 31, 2024 | ||||||||
Historical (Unaudited) | Pro Forma (Unaudited) | |||||||
(in millions, except share and per share amounts) | ||||||||
Cash and cash equivalents | $ | 91.2 | $ | 91.2 | ||||
|
|
|
| |||||
Debt: | ||||||||
Revolving Credit Facility(1) | $ | 2,385.0 | $ | 1,490.5 | ||||
Term Loan | 1,000.0 | 1,000.0 | ||||||
CMBS(2) | 3,706.4 | 1,362.2 | ||||||
Senior Unsecured Notes | 1,690.2 | 1,690.2 | ||||||
Secured mortgage debt | 473.4 | 473.4 | ||||||
Other secured debt | 12.1 | 12.1 | ||||||
Other unsecured debt | 25.0 | 25.0 | ||||||
|
|
|
| |||||
Total debt | 9,292.1 | 6,053.4 | ||||||
|
|
|
| |||||
Stockholders’ equity: | ||||||||
Preferred stock, $0.01 par value per share; 100,000,000 shares authorized, 630 shares issued and outstanding, actual; 100,000,000 shares authorized, 0 shares issued and outstanding, pro forma(3) | 0.6 | — | ||||||
Common stock, $0.01 par value per share; 500,000,000 shares authorized, 162,017,515 shares issued and outstanding, actual; 500,000,000 shares authorized and 209,027,298 shares issued and outstanding, pro forma(4) | 1.6 | 2.1 | ||||||
Additional paid in capital—common stock | 5,990.9 | 9,529.7 | ||||||
Retained earnings (accumulated deficit) | (918.3 | ) | (1,601.1 | ) | ||||
Accumulated other comprehensive income (loss) | (96.8 | ) | (98.2 | ) | ||||
|
|
|
| |||||
Total stockholders’ equity | $ | 4,978.0 | $ | 7,832.5 | ||||
|
|
|
| |||||
Noncontrolling interests | 630.0 | 888.0 | ||||||
|
|
|
| |||||
Total capitalization | $ | 14,900.1 | $ | 14,773.9 | ||||
|
|
|
|
(1) | As of July 12, 2024, our Revolving Credit Facility had a total outstanding balance of $2.5 billion. |
(2) | On April 9, 2024, we repaid in full the $2.34 billion outstanding under our ICE4 CMBS Loan using the proceeds of our $2.4 billion Delayed Draw Term Loan. We intend to repay such Delayed Draw Term Loan in full with the proceeds from this offering. See “Use of Proceeds.” |
(3) | Upon written notice to each record holder of our Series A preferred stock as to the effective date of redemption, we may redeem, the shares of our outstanding Series A preferred stock at our option, in whole or in part, at any time for cash at a price equal to $1,000 per share, for a total of $0.6 million for the 630 shares outstanding, plus all accrued and unpaid dividends thereon to and including the date fixed for redemption. Shares of the Series A preferred stock that are redeemed shall no longer be deemed outstanding shares of our company and all rights of the holders of such shares will terminate. In connection with this offering, we will redeem our outstanding Series A preferred stock. |
113
Table of Contents
(4) | The shares of our common stock to be outstanding after this offering include: |
• | 47,000,000 shares of our common stock to be issued in this offering; |
• | 139,966 shares of our common stock to be issued to our executives and employees under the 2024 Plan as initial public offering bonuses; |
• | 746,251 shares of our common stock to be awarded to certain of our employees under the 2024 Plan in connection with the completion of this offering; |
• | 80,950 shares of our common stock that may be issued to certain of our employees under the 2024 Plan, and to employees, former employees and others, in private placements, in settlement of outstanding vested LMEP Units; and |
• | 116,994 shares of our common stock that may be issued to certain of our employees in settlement of outstanding vested LVCP Awards. |
The above shares of our common stock are presented on a net basis, assuming that an aggregate of 538,875 shares of our common stock issued to our executives and employees will be remitted to our company to satisfy tax withholding obligations, representing a blended withholding rate of approximately 35%. As a result, such 538,875 shares of our common stock will be held as authorized and unissued shares of our common stock and are not reflected in the shares of our common stock to be outstanding after this offering.
The shares of our common stock to be outstanding after this offering exclude:
• | 7,050,000 shares of our common stock issuable upon the exercise in full of the underwriters’ option to purchase additional shares; |
• | 32,202 shares of our common stock underlying restricted stock units subject to time-based vesting awarded to certain of our executive officers and employees under the Lineage 2024 Incentive Award Plan prior to this offering; |
• | 284,299 shares of our common stock underlying restricted stock units subject to time-based vesting awarded or to be awarded to certain of our executive officers and employees under the 2024 Plan as part of our annual equity award program; |
• | 184,946 shares of our common stock underlying restricted stock units subject to time-based vesting to be awarded to certain of our employees under the 2024 Plan in connection with the completion of this offering; |
• | 8,226 shares of our common stock underlying restricted stock units subject to time-based vesting awarded or to be awarded to certain of our non-employee directors under the 2024 Plan in connection with the completion of this offering; |
• | 346,722 shares of our common stock underlying restricted stock units subject to time-based vesting awarded or to be awarded to certain of our executive officers and employees under the 2024 Plan in respect of certain vested LMEP Units and/or the cancellation of unvested LMEP Units; |
• | 657,190 shares of our common stock underlying restricted stock units subject to time-based vesting awarded or to be awarded to certain of our employees under the 2024 Plan in respect of certain vested LVCP Awards and/or the cancellation of unvested LVCP Awards; |
• | up to 236,422 shares of our common stock underlying restricted stock units subject to performance-based vesting awarded or to be awarded in connection with this offering under the 2024 Plan as part of our annual equity award program (the number of shares of our common stock reflected in this bullet assumes maximum performance for performance-based awards—to the extent that we do not attain maximum performance with respect to the applicable performance goals, the actual number of shares issued under those awards will be less than the number reflected in this bullet); and |
• | 7,009,993 shares of our common stock issuable in the future under the 2024 Plan, as more fully described in “Executive and Director Compensation—Amended and Restated Lineage 2024 Incentive Award Plan.” |
114
Table of Contents
Dilution After This Offering
Purchasers of our common stock offered by this prospectus will experience an immediate and substantial dilution of the net tangible book value per share of our common stock from the initial public offering price. Net tangible book value per share represents the amount of total tangible assets less total tangible liabilities, divided by the number of outstanding shares of common stock, assuming the exchange of OP units (including (i) 22,232,708 OP units into which 22,232,708 Legacy OP Units may be reclassified and (ii) 1,461,148 OP units issuable upon exchange of 1,461,148 OPEUs) for shares of our common stock on a one-for-one basis. As of March 31, 2024, we had a net tangible book value of approximately $1,242.3 million, or $6.83 per share. After giving effect to the completion of the formation transactions, this offering and the other adjustments described in the unaudited pro forma condensed consolidated financial statements included elsewhere in this prospectus, our pro forma net tangible book value as of March 31, 2024 would have been $4,133.5 million, or $17.69 per share of common stock, assuming the exchange of OP units for shares of common stock on a one-for-one basis. This amount represents an immediate increase in net tangible book value of $10.86 per share to our continuing investors and an immediate dilution in pro forma net tangible book value of $58.31 per share from the public offering price of $76.00 per share of common stock to our new investors. The following table illustrates this per share dilution, assuming an initial public offering price of $76.00 per share, which is the mid-point of the price range set forth on the front cover of this prospectus.
Initial public offering price per share | $ | 76.00 | ||||||||||
Net tangible book value per share as of March 31, 2024 before the formation transactions, this offering and other pro forma adjustments | $ | 6.83 | ||||||||||
Net decrease in net tangible book value per share attributable to the formation transactions and other pro forma adjustments (other than this offering) | $ | (3.64 | ) | |||||||||
|
| |||||||||||
Pro forma net tangible book value per share as of March 31, 2024 before this offering | $3.19 | |||||||||||
Net increase in net tangible book value per share attributable to this offering | $14.50 | |||||||||||
|
| |||||||||||
Pro forma net tangible book value per share after the formation transactions, this offering and other pro forma adjustments(1) | $ | 17.69 | ||||||||||
|
| |||||||||||
Dilution in pro forma net tangible book value per share to new investors(2) | $ | 58.31 | ||||||||||
|
|
(1) | The pro forma net tangible book value per share after the formation transactions, this offering and other pro forma adjustments was determined by dividing net tangible book value of approximately $4,133.5 million by 233,702,319 shares of common stock and OP units to be outstanding after the formation transactions, this offering and other pro forma adjustments, assuming the exchange of OP units (including (i) 22,232,708 OP units into which 22,232,708 Legacy OP Units may be reclassified and (ii) 1,461,148 OP units issuable upon exchange of 1,461,148 OPEUs) for shares of common stock on a one-for-one basis. This excludes the shares that may be issued by us upon exercise of the underwriters’ option to purchase additional shares, the related proceeds and additional common stock reserved for future issuance under the 2024 Plan. |
(2) | The dilution in pro forma net tangible book value per share to new investors was determined by subtracting pro forma net tangible book value per share after the formation transactions, this offering and other pro forma adjustments from the assumed initial public offering price paid by a new investor for our common stock. |
Assuming the underwriters exercise their option to purchase additional shares of common stock in full, our pro forma net tangible book value as of March 31, 2024 would have been $4,649.2 million, or $19.30 per share of common stock, assuming the exchange of OP units (including (i) 22,232,708 OP units into which 22,232,708 Legacy OP Units may be reclassified and (ii) 1,461,148 OP units issuable upon exchange of 1,461,148 OPEUs)
115
Table of Contents
for shares of common stock on a one-for-one basis. This represents an immediate dilution in pro forma net tangible book value of $56.70 per share of common stock to new investors.
Differences Between New Investors and Continuing Investors
The table below summarizes, as of March 31, 2024, on a pro forma basis after giving effect to the formation transactions and this offering, the differences between the number of shares of common stock and OP units (including (i) 22,232,708 OP units into which Legacy OP Units may be reclassified and (ii) 1,461,148 OP units issuable upon exchange of OPEUs) held by the continuing investors following the formation transactions and the new investors purchasing shares in this offering, the total consideration paid and the average price per share of common stock or OP unit paid by the continuing investors following the formation transactions and paid in cash by the new investors purchasing shares in this offering (based on the net tangible book value attributable to the continuing investors in the formation transactions). In calculating the net tangible book value attributable to cash paid by the new investors purchasing common shares in this offering, we used an assumed initial public offering price of $76.00 per share, which is the mid-point of the price range set forth on the front cover of this prospectus, after deducting underwriting discounts, financial advisory fees and estimated offering expenses payable by us.
Common Stock/OP Units Issued/Granted | Pro Forma Net Tangible Book Value of Contribution/Cash(1) | Average Price Per Share | ||||||||||||||||||
Number | Percentage | Amount | Percentage | |||||||||||||||||
(in millions, except share and per share data) | ||||||||||||||||||||
Continuing investors(2) | 186,702,319 | 79.9 | % | $ | 561.5 | 13.6 | % | $ | 3.01 | |||||||||||
New investors(3) | 47,000,000 | 20.1 | % | 3,572.0 | 86.4 | % | $ | 76.00 | ||||||||||||
|
|
|
|
|
|
|
| |||||||||||||
Total | 233,702,319 | 100.0 | % | $ | 4,133.5 | 100.0 | % | $ | 17.69 | |||||||||||
|
|
|
|
|
|
|
|
(1) | Represents pro forma net tangible book value as of March 31, 2024 after giving effect to the formation transactions and this offering. |
(2) | Includes 22,232,708 OP units into which Legacy OP Units will ultimately be reclassified and 1,461,148 OPEUs into which interests held by Bay Grove are to be reclassified in connection with the formation transactions (which OPEUs are ultimately exchangeable for OP units). Excludes OP units that may be issued to holders of Legacy Class A-4 OP Units upon exercise of the top-up right, or the dilutive effect on our shares or the OP units of the special Class A-4 OP Unit redemption rights or cash top-up rights, in each case as described in “Structure and Formation of Our Company—Formation Transactions—Operating Partnership Conversion and Reclassification of Units,” which cannot be predicted or quantified at this time. |
(3) | Includes 47,000,000 shares of common stock to be sold in this offering. |
The foregoing discussion does not reflect any potential purchases made by participants in the directed share program that are associated with us.
116
Table of Contents
MANAGEMENT’S DISCUSSION AND ANALYSIS OF FINANCIAL CONDITION
AND RESULTS OF OPERATIONS
The following discussion of our financial condition and results of operations should be read together with the “Summary Selected Historical and Pro Forma Condensed Consolidated Financial and Other Data,” “Business and Properties” and consolidated financial statements and related notes that are included elsewhere in this prospectus. Where appropriate, the following discussion includes the effects of the completion of the formation transactions, this offering and the use of the net proceeds therefrom on a pro forma basis. These effects are reflected in our unaudited pro forma condensed consolidated financial statements included elsewhere in this prospectus. In addition, the following discussion contains forward-looking statements, such as statements regarding our expectation for future performance, liquidity and capital resources, that involve risks, uncertainties and assumptions that could cause actual results to differ materially from our expectations. Our actual results may differ materially from those contained in or implied by any forward-looking statements as a result of various factors, including those set forth under “Risk Factors,” “Special Note Regarding Forward-Looking Statements” or in other parts of this prospectus.
Management’s Overview
We are the world’s largest global temperature-controlled warehouse REIT, with a modern and strategically located network of properties. Our business is competitively positioned to deliver a seamless end-to-end, technology-enabled, customer experience for thousands of customers each with their own unique requirements in the temperature-controlled supply chain. As of March 31, 2024, we operated an interconnected global temperature-controlled warehouse network, comprising over 84.1 million square feet and 3.0 billion cubic feet of capacity across 482 warehouses predominantly located in densely populated critical-distribution markets, with 312 in North America, 82 in Europe and 88 in Asia-Pacific. We have a well-diversified and stable customer base and currently serve more than 13,000 customers that include household names of the largest food retailers, manufacturers, processors and food service distributors in the industry. In the three months ended March 31, 2024, we generated $1.3 billion of revenue, $48.0 million of net loss, $444.2 million of NOI and $326.6 million of Adjusted EBITDA. In the year ended December 31, 2023, we generated $5.3 billion of revenue, $96.2 million of net loss, $1.8 billion of NOI and $1.3 billion of Adjusted EBITDA.
We view, manage and report on our business through two segments:
• | Global warehousing, which utilizes our high-quality industrial real estate properties to provide temperature-controlled warehousing storage and services to our customers; and |
• | Global integrated solutions, which complements warehousing with supply chain services to facilitate the movement of products through the food supply chain to generate cost savings for customers and additional revenue streams for our company. |
Components of Our Results of Operations
Global Warehousing Segment. Our primary business is owning and operating temperature-controlled warehouses.
Revenue. Our global warehousing segment revenues are generated from storing frozen and perishable food and other products and providing related warehouse services for our customers. Storage revenues relate to the act of storing products for our customers within our warehouses. Storage revenues can be in the form of storage fees we charge customers for utilization of space in a warehouse, blast freezing fees we charge customers for utilization of specific ultra-cold spaces within a warehouse designed to rapidly reduce product temperature, and rent we charge customers for the lease of warehouse space pursuant to a lease agreement. Warehouse services fees relate to handling and other services required to prepare and move customers’ pallets into, out of and around the facilities. As part of our warehouse services, we offer handling, case-picking, order assembly and load consolidation, quality control, re-packaging and government-approved storage and inspection, among other services, for which we charge fees.
117
Table of Contents
The majority of our fees are contracted with customers via warehouse agreements, rate letters and tariff sheets. We also earn rent under lease agreements pursuant to which we lease a portion of a warehouse or an entire warehouse. Customer warehouse agreements and rate letters generally contain a profile that projects the type, size and number of pallets the customer expects to store over a period of time within a specified warehouse, as well as the length of time pallets are expected to remain in the warehouse, and may include guaranteed revenues based on specific storage, handling or other parameters. Material changes to a customer profile that increase costs can trigger rate changes. Additionally, warehouse agreements include mechanisms to adjust rates for inflationary pressures, and rate letters are typically revised annually for price adjustments. Our tariff sheets are updated annually, and the agreements are also short-term in nature and can generally be updated upon 30-days’ advance notice. These various rate adjustment mechanisms generally allow us to pass on both storage and handling rate increases to customers as necessary to account for increasing rents and inflation in operational costs such as wages, power and warehouse supplies.
Cost of operations. Our global warehousing segment cost of operations consists primarily of labor, power and other warehouse costs. Labor comprises the largest component of the cost of operations from our global warehousing segment and consists primarily of employee wages (both direct and indirect) and benefits. Changes in our labor expense are driven by, among other things, changes in headcount, changes in compensation levels and associated performance incentives, the use of third-party labor to support our operations, changes in terms of collective bargaining agreements, changes in customer requirements and associated work content, workforce productivity, labor availability, governmental policies and regulations and variability in costs associated with employer-provided benefits. Our second-largest cost of operations of our global warehousing segment is electrical power utilized in the operation of our temperature-controlled warehouses. As a result, fluctuations in the price of power in the regions where we operate may have a significant effect on our financial results. We may from time to time hedge our exposure to changes in power prices through fixed rate agreements. In addition, to the extent possible and appropriate, we may seek to mitigate or offset the impact of fluctuations in the price of power on our financial results through rate escalations or power surcharge provisions within our agreements with customers. We also look to implement energy saving alternatives to reduce energy consumption, including the installation of solar panels, state of the art refrigeration control systems, LED lighting, thermal energy storage, motion-sensor technology, variable frequency drives for our fans and compressors and rapid open/close doors, which are all environmentally friendly solutions that have the potential to reduce energy consumption (thereby reducing costs) at the warehouses in which they are installed. Additionally, business mix impacts our power expense depending on the temperature zone and type and frequency of freezing required (e.g., blast freezing). Other warehouse costs include insurance, real estate taxes, utilities other than power, repairs and maintenance, warehouse consumables (e.g., pallets and shrink-wrap), equipment costs, rent under operating leases on both real estate and equipment, personal protective equipment to maintain the health and safety of our team members, and other warehouse operating costs.
Global Integrated Solutions Segment. Our global integrated solutions segment provides our customers with a comprehensive approach to facilitate the movement of products along the supply chain.
Revenues. Our integrated solutions revenues are primarily driven by transportation fees, which may also include fuel and capacity surcharges, to our customers for whom we arrange the transportation of their products. Within transportation, which is the largest component of our global integrated solutions segment, our core focus areas are multi-vendor less-than-full-truckload consolidation, drayage services to and from ports, transportation brokerage and freight forwarding. We also provide rail transportation services and, in select markets, foodservice distribution and e-commerce fulfillment services.
Under our typical multi-vendor less-than-full-truckload consolidation agreements, we earn fees based on the weight, dimensions and density of the customer’s goods and distance that such goods will be shipped. We typically earn flat fees for our drayage services based on the time and mileage required for the round trip. We include fuel surcharges under both our typical multi-vendor less-than-full-truckload consolidation agreements and drayage services agreements, allowing us to pass on increases in the cost of fuel to customers. For
118
Table of Contents
transportation brokerage services, we typically earn fees based on the amounts we charge our shipping customers, generating a margin over what we pay in the form of third-party carrier charges. For rail transportation services, we primarily lease temperature-controlled railcars pursuant to long-term full-service leases. We typically earn revenue for our food distribution services on a cost plus or cost sharing basis and our e-commerce fulfillment services on a fully-loaded cost per shipment basis. Similar to our brokerage services, we typically earn fees under our freight forwarding services based on the amounts we charge our shipping customers, generating a margin over what we pay in the form of third-party carrier charges.
Cost of operations. Our global integrated solutions cost of operations consists primarily of third-party carrier charges, which are impacted by factors affecting those carriers, including truck and ocean liner capacity and driver and equipment availability in certain markets. Additionally, in certain markets we employ drivers and operate assets to serve our customers. Costs to operate these assets include wages, fuel, tolls, insurance and maintenance.
Other Consolidated Operating Expenses. We also incur depreciation and amortization expenses, corporate-level general and administrative expenses, corporate-level acquisition, transaction, and other expenses and corporate-level restructuring, impairment, and (gain) loss on disposals.
Depreciation and amortization. Our depreciation and amortization charges result primarily from the capital-intensive nature of our business. The principal components of depreciation relate to our warehouses, both owned and leased, including buildings and improvements, refrigeration equipment, racking, leasehold improvements, material handling equipment, furniture and fixtures and our computer hardware and software. We also incur depreciation related to owned transportation assets. Amortization relates primarily to intangible assets for customer relationships.
General and administrative expenses. Our corporate-level, general and administrative expenses consist primarily of costs associated with administration of our global warehousing and global integrated solutions segments, including wages and benefits for management, administrative, legal, business development, project management, sales, marketing, engineering, safety and compliance, food optimization, integrated solutions, human resources, finance, accounting, network optimization, data science and information technology personnel, transformational information technology expenses (which include expenses associated with development and deployment of our operating systems), equity incentive plans, communications and data processing, travel, professional fees, credit loss, training, office equipment, supplies and management fees paid to Bay Grove in accordance with the terms of the operating services agreement. Trends in corporate-level general and administrative expenses are influenced by changes in headcount and compensation levels and achievement of incentive compensation targets. In connection with this offering, we intend to internalize certain operating, strategic development and financial services that are currently provided by Bay Grove under the operating services agreement. Accordingly, in connection with this offering, we will terminate the operating services agreement, and we will enter into a transition services agreement with Bay Grove to provide certain of these services for a three-year term while we internalize such functions. See “Certain Relationships and Related Party Transactions—Transition Services Agreement.”
Acquisition, transaction, and other expenses. Our corporate-level acquisition, transaction, and other expenses consist of costs with a high level of variability from period-to-period and include the following: costs associated with business transactions, whether consummated or not, such as advisory, legal, accounting, valuation, other professional or consulting fees, integration costs, and costs related to public company readiness efforts. These costs are expensed as incurred. It also includes employee-related expenses associated with acquisitions, such as acquisition-related severance and consulting agreements and the Lineage Equity-Tracking Plan discussed in Note 16 to our consolidated financial statements included elsewhere in this prospectus.
Restructuring, impairment, and (gain) loss on disposals. Our restructuring, impairment, and (gain) loss on disposals include certain contractual and negotiated severance and separation costs from exited former executives, costs relating to reductions in headcount to achieve operational efficiencies, and costs associated with exiting non-
119
Table of Contents
strategic operations. We record such costs when there is a substantive plan for employee severance or employees are otherwise entitled to benefits (e.g. in case of one-time terminations) and related costs are probable and estimable. It also includes gains (losses) on dispositions of property, plant, and equipment and impairments of long-lived assets.
Key Factors Affecting Our Business and Financial Results
Recent Trends in Our Global Warehousing Segment
The following are key trends emerging in our global warehousing segment:
• | Strategic engagement with customers. We believe that customers are increasingly looking for more bespoke solutions for their supply chain needs, and we have seen customers engaging more deeply with us to support their strategic supply chain initiatives. Our strategic account management team works with our top customers to create a joint roadmap and action plan to optimize each customer’s supply chain needs based on its unique priorities. For example, our strategic account management team may create a plan with a customer based on such customer’s goals to increase volume in a particular region, while transitioning the customer from higher-cost trucking to lower-cost rail transportation in another region. We have seen increased engagement from customers with this approach over the last several years, and we expect this trend to continue as we expand these strategic relationships with our customers. |
• | Automation. We have industry-leading automation capabilities and intend to continue our leadership in temperature-controlled warehouse automation. We also look to direct our high-case volume customers to our automated or semi-automated facilities because we believe these automated facilities can provide lower cost and more customized solutions to our customers, thereby improving the customer experience and driving customer retention. We are seeing increased demand for automated solutions from our customers. We currently have eight greenfield development and expansion projects under construction, which when completed are expected to contribute approximately 235 thousand pallet positions, approximately 58% of which will be fully automated. |
Market Conditions
Our business is impacted by general economic and market conditions, as well as by national and international political, environmental and socio-economic events. Specifically, our business operations are sensitive to the systemic impact of inflation, the availability of labor, the availability and cost of credit, the food supply chain, fuel, energy and power costs, our customers’ production, end-consumer demand for food that requires cold storage and transportation of goods and geopolitical issues.
During the last several years, we have leveraged our assets, customer relationships and management best practices to navigate a volatile macroeconomic period that included inflation, supply chain backlogs and a labor shortage. Significant factors impacting our business have included:
• | Inflation and Customer Rate Increases. Beginning in 2021, we saw significant inflationary impacts across wages, real estate costs, energy and other operational costs. Following customer rate increases in the second half of 2021 and continuing in 2022 and 2023, our operating results improved significantly. At the same time, we believe that higher food costs are now impacting buying decisions by end users for certain commodities, which in turn affects our customers as they adjust to new levels of demand from the end users. As a result, we have seen lower throughput from our customers, which has impacted volume across our network. Over the long-term, we believe that end-consumer demand for food will remain consistent with historic levels and that the mission-critical nature of our warehouse network positions us well to pass through certain inflationary cost pressures. In addition, as overall inflation eases, we expect to see relief across throughput and operational cost pressures, and we believe that our customers also expect lower rate increases going forward. |
120
Table of Contents
• | Occupancy. Following widespread supply chain backlogs during 2021 and early 2022, customers in North America increased production later in 2021 leading to higher inventories by the end of 2022. As a result, we experienced increased physical occupancy in 2023, particularly in North America. In addition, our increased usage of minimum storage guarantees has further driven an increase in economic occupancy. Going forward, we expect physical occupancy may decrease relative to 2023 as customers rationalize inventory levels. To that end, we saw a decrease in occupancy during the first quarter of 2024 as customer inventory levels declined, driven in part by higher interest rates. The year-over-year occupancy headwind was also impacted by the aforementioned elevated occupancy during the three months ended March 31, 2023. At the same time, we expect our increased usage of minimum storage guarantees to mitigate flow-through of declines in physical occupancy to economic occupancy. |
• | Labor. Beginning with the pandemic and lasting through the beginning of 2023, we faced headwinds from wage inflation, labor shortages and team member turnover. Internally, over the last several years, we have been focused on strategic initiatives to decrease turnover through higher wages, engagement best practices and training to help retain talent. More recently in 2023 and into 2024, we saw retention improve due to these internal retention efforts and to macroeconomic factors, including lower competition for labor, slower wage inflation and decreased turnover globally. As turnover continues to decline, we expect increased productivity due to higher tenure of our team members, reduced recruiting costs and reduced wage pressures. |
• | Power Supply. Our European operations saw increased power costs in 2022 arising in connection with of the invasion of Ukraine by Russia. However, we have generally been able to pass such increased power costs through to our customers, and, accordingly, our global operations to date have not been materially impacted by the ongoing conflict. In addition, we generally saw power costs decrease during 2023. |
Refer to “Risk Factors” in this prospectus for additional information.
Economic Occupancy of Our Warehouses
We define average economic occupancy as the aggregate number of physical pallets on hand and any additional pallet positions otherwise contractually committed and paid for by customers for a given period divided by the approximate number of average physical pallet positions in our warehouse for the applicable period. We estimate the number of contractually committed pallet positions by taking into account the actual pallet commitment specified in each customer’s warehouse agreement and subtracting the physical pallets on hand for that customer. We regard economic occupancy as an important driver of our financial results. We plan to expand our use of minimum storage guarantees that pay us minimum or fixed storage fees for pallet positions whether or not a minimum number of pallet positions are physically occupied. We actively seek to enter into minimum storage guarantees when establishing new customer agreements, renewing existing customer agreements or upon a change in the anticipated profile of our customer. We believe that transitioning certain customer contracts from on-demand, as-utilized structures to minimum storage guarantee structures will drive NOI growth and consistency by maintaining our storage revenues during periods of lower inventories.
Physical Occupancy of Our Warehouses
We define average physical occupancy as the average number of physical pallets on hand divided by the estimated number of average physical pallet positions in our warehouses for the applicable period. We estimate the number of physical pallet positions by taking into account actual racked space and by estimating unracked space on an as-if-racked basis. We base this estimate on a formula utilizing the total cubic feet of each room within the warehouse that is unracked divided by the volume of an assumed rack space that is consistent with the characteristics of the relevant warehouse. The number of our pallet positions is reviewed and updated quarterly, taking into account changes in racking configurations and other warehouse attributes. We regard physical occupancy as an important driver of our financial results.
121
Table of Contents
Throughput at Our Warehouses
The level and nature of throughput at our warehouses is an important factor impacting our warehouse services revenues. Throughput refers to the volume of inbound pallets that enter our warehouses plus the volume of outbound pallets that exit our warehouses, divided by two. Higher levels of throughput drive warehouse services revenues in our global warehousing segment, as customers are typically billed transactionally for these services. The nature of throughput may be driven by the expected inventory turns of the underlying product or commodity. Throughput pallets can be influenced by both customers’ production as well as shifts in demand preferences. Customers’ production levels, which respond to market conditions, labor availability, supply chain dynamics and consumer preferences, may impact inbound pallets. Similarly, a change in inventory turnover due to shift in consumer demand may impact outbound pallets.
Foreign Currency Translation Impact on Our Operations
Our consolidated revenues and expenses are subject to variations caused by the net effect of foreign currency translation on revenues and expenses incurred by our operations outside the United States. Future fluctuations of foreign currency exchange rates and their impact on our Consolidated Statements of Operations are inherently uncertain. As a result of the relative size of our international operations, these fluctuations may be material on our results of operations. Our primary currency exposures are to the euro, Canadian dollar, British pound sterling and Australian dollar. Our revenues and expenses from our international operations are typically denominated in the local currency of the country in which they are derived or incurred. Therefore, the impact of foreign currency fluctuations on our results of operations and margins is partially mitigated.
Focus on Our Operational Effectiveness and Cost Structure
We have focused on further enhancing our operational effectiveness and integrating the acquisitions completed over the last several years. We continuously seek to execute on various initiatives aimed at streamlining our business processes and reducing our cost structure, including: integrating acquired businesses and their assets onto common information technology systems within our company; instituting key health, safety, leadership and training programs; implementing standardized operational processes; developing and deploying proprietary and third-party operating systems; and capitalizing on the purchasing power of our network. As we integrate our many acquired businesses, we are focused on realizing the benefits of scale and operational leverage by growing NOI faster than general and administrative expenses. In addition, we believe we have opportunities to eliminate redundant overhead expenses and reduce expenditures on integration resources over time. As we integrate acquired companies, we are also often able to generate synergies in areas such as benefits and insurance, where our corporate programs are often more efficient than those of the acquired businesses.
We employ multiple strategies to maximize labor productivity, including: instituting lean operating principles, improving cultural engagement and driving standardization work processes, visual management, problem-solving, just-in-time management and quality processes; optimizing the mix of permanent and temporary team members; shift optimization relative to throughput; and offering engagement activities, leadership training and competitive wage and benefit programs to incentivize longer-term employment.
We seek to maximize energy efficiency in our warehouses through the application of best practices, the latest technology and alternative energy generation. The technologies we deploy to optimize energy efficiency include variable frequency drives, refrigeration control systems, rapid close doors, motion sensor technology, LED lighting and “flywheeling”—an innovative process that leverages machine learning and artificial intelligence to manage energy load based on predictions of peak demand. Our approach to generating alternative sources of energy is primarily through the deployment of on-site solar, battery capacity and linear generators. These initiatives have allowed us to reduce our consumption of kilowatt hours, optimize rates and reduce overall energy spend. Our alternative energy approach allows us to monetize carbon credits to offset energy costs and is also supportive of our sustainability strategy.
122
Table of Contents
How We Assess the Performance of Our Business
Segment Net Operating Income or “NOI”
We evaluate the performance of our business segments based on their net operating income relative to our overall results of operations. We use the term “segment net operating income” or “segment NOI” to mean a segment’s revenues less its cost of operations (excluding any depreciation and amortization, impairment charges, corporate-level general and administrative expenses, corporate-level acquisition, transaction, and other expense and corporate-level restructuring and impairment expenses). We use segment NOI to evaluate our segments for purposes of making operating decisions and assessing performance in accordance with FASB ASC, Topic 280, Segment Reporting.
We also analyze the “segment NOI margin” for each of our business segments, which we calculate as segment NOI divided by segment revenues.
Same Warehouse Analysis
We define our “same warehouse” population once a year at the beginning of the current calendar year. Our same warehouse population includes properties that were owned, leased or managed for the entirety of two comparable periods and that have reported at least twelve months of consecutive normalized operations prior to January 1 of the current calendar year. We define “normalized operations” as properties that have been open for operation or lease after development or significant modification, including the expansion of a warehouse footprint or a warehouse rehabilitation subsequent to an event, such as a natural disaster or similar event causing disruption to operations. In addition, our definition of “normalized operations” takes into account changes in the ownership structure (e.g., purchase of a previously leased warehouse would result in a change in the nature of expenditures in the compared periods), which would impact comparability in our global warehousing segment NOI.
Acquired properties will be included in the “same warehouse” population if owned or leased by us as of the first business day of the prior calendar year and still owned by us as of the end of the current reporting period, unless the property is under development. The “same warehouse” pool is also adjusted to remove properties that were sold or entering development subsequent to the beginning of the current calendar year. As such, the “same warehouse” population for the period ended March 31, 2024 includes all properties that we owned at January 1, 2023 which had both been owned and had reached “normalized operations” by January 1, 2023, and the “same warehouse” population for the period ended December 31, 2023 includes all properties that we owned at January 1, 2022 which had both been owned and had reached “normalized operations” by January 1, 2022.
We calculate “same warehouse NOI” as revenues for the same warehouse population less its cost of operations (excluding any depreciation and amortization, impairment charges and corporate-level general and administrative expenses, corporate-level acquisition, transaction, and other expense, corporate-level restructuring and impairment expenses and gain or loss on sale of real estate). We evaluate the performance of the warehouses we own, lease or manage using a “same warehouse” analysis, and we believe that same warehouse NOI is helpful to investors as a supplemental performance measure because it includes the operating performance from the population of properties that is consistent from period to period, thereby eliminating the effects of changes in the composition of our warehouse portfolio.
The following table shows the number of same warehouses in our portfolio and the number of warehouses excluded as same warehouses for the three months ended March 31, 2024 and the year ended December 31, 2023.
Three Months Ended March 31, 2024 | Year Ended December 31, 2023 | |||||||
Total warehouses(1) | 463 | 463 | ||||||
Same warehouse facilities | 416 | 351 | ||||||
Non-same warehouse facilities | 47 | 112 |
123
Table of Contents
(1) | Excludes 19 and 18 warehouses in our global integrated solutions segment for periods ended March 31, 2024 and December 31, 2023, respectively. We categorize warehouses as part of our global integrated solutions segment if the primary business conducted in those warehouses is within our global integrated solutions segment. |
Same warehouse NOI is not a measurement of financial performance under GAAP. In addition, other companies providing temperature-controlled warehouse storage and handling and other warehouse services may not define same warehouse or calculate same warehouse NOI in a manner consistent with our definition or calculation. Same warehouse NOI should be considered as a supplement, but not as an alternative, to our results calculated in accordance with GAAP. We provide reconciliations of these measures in the discussions of our comparative results of operations below.
Results of Operations
Comparison of Results for the Three Months Ended March 31, 2024 and 2023
The following table summarizes our NOI for the three months ended March 31, 2024 and 2023:
Three months ended March 31, |
| |||||||||||
2024 | 2023 | Change | ||||||||||
(Dollars in millions) | ||||||||||||
Net income (loss) | $ | (48.0 | ) | $ | 18.6 | (358.1 | )% | |||||
General and administrative expense | 124.1 | 114.9 | 8.0 | % | ||||||||
Depreciation expense | 157.7 | 129.5 | 21.8 | % | ||||||||
Amortization expense | 53.4 | 51.7 | 3.3 | % | ||||||||
Acquisition, transaction, and other expense | 8.6 | 10.8 | (20.4 | )% | ||||||||
Restructuring, impairment, and (gain) loss on disposals | (0.4 | ) | 4.2 | (109.5 | )% | |||||||
Equity (income) loss, net of tax | 1.8 | (0.2 | ) | (1000.0 | )% | |||||||
(Gain) loss on foreign currency transactions, net | 10.7 | 1.3 | 723.1 | % | ||||||||
Interest expense, net | 138.8 | 114.7 | 21.0 | % | ||||||||
(Gain) loss on extinguishment of debt | 6.5 | — | n/a | % | ||||||||
Other nonoperating (income) expense, net | 0.7 | 0.2 | 250.0 | % | ||||||||
Income tax (benefit) expense | (9.7 | ) | (2.6 | ) | 273.1 | % | ||||||
|
|
|
| |||||||||
NOI | $ | 444.2 | $ | 443.1 | 0.2 | % |
Global Warehousing Segment
The following table presents the operating results of our global warehousing segment for the three months ended March 31, 2024 and 2023.
Three months ended March 31, |
| |||||||||||
2024 | 2023 | Change | ||||||||||
(Dollars in millions except revenue per pallet) | ||||||||||||
Warehouse storage | $ | 515.6 | $ | 513.0 | 0.5 | % | ||||||
Warehouse services | 453.0 | 444.6 | 1.9 | % | ||||||||
|
|
|
| |||||||||
Total global warehousing segment revenue | $ | 968.6 | $ | 957.6 | 1.1 | % | ||||||
Power | $ | 47.1 | $ | 48.0 | (1.9 | )% | ||||||
Labor | 354.1 | 342.3 | 3.4 | % | ||||||||
Other warehouse costs(1)(2) | 182.9 | 182.1 | 0.4 | % | ||||||||
|
|
|
| |||||||||
Total global warehousing segment cost of operations | $ | 584.1 | $ | 572.4 | 2.0 | % | ||||||
|
|
|
|
124
Table of Contents
Three months ended March 31, |
| |||||||||||
2024 | 2023 | Change | ||||||||||
(Dollars in millions except revenue per pallet) | ||||||||||||
Global warehousing segment NOI | $ | 384.5 | $ | 385.2 | (0.2 | )% | ||||||
Total global warehousing segment margin | 39.7 | % | 40.2 | % | (50 | ) bps | ||||||
Number of warehouse sites | 463 | 457 | 1.3 | % | ||||||||
Warehouse storage(3) | ||||||||||||
Average economic occupancy(4) | ||||||||||||
Average occupied economic pallets | 8,187 | 8,332 | (1.7 | )% | ||||||||
Economic occupancy percentage | 83.6 | % | 87.3 | % | (370 | ) bps | ||||||
Storage revenue per economic occupied pallet | $ | 62.98 | $ | 61.52 | 2.4 | % | ||||||
Average physical occupancy(5) | ||||||||||||
Average physical occupied pallets | 7,603 | 7,809 | (2.6 | )% | ||||||||
Average physical pallet positions | 9,796 | 9,540 | 2.7 | % | ||||||||
Physical occupancy percentage | 77.6 | % | 81.9 | % | (430 | ) bps | ||||||
Storage revenue per physical occupied pallet | $ | 67.82 | $ | 65.63 | 3.3 | % | ||||||
Warehouse services(3) | ||||||||||||
Throughput pallets (in thousands) | 12,874 | 12,672 | 1.6 | % | ||||||||
Warehouse services revenue per throughput pallet | $ | 32.40 | $ | 32.39 | 0.0 | % |
(1) | Includes real estate rent expense of $25.1 million and $22.2 million for the three months ended March 31, 2024 and 2023, respectively. |
(2) | Includes non-real estate rent expense (equipment lease and rentals) of $4.9 million and $6.4 million for the three months ended March 31, 2024 and 2023, respectively. |
(3) | Warehouse storage and warehouse services metrics exclude managed sites. |
(4) | Calculated as the aggregate number of physical pallets on hand and any additional pallets otherwise contractually committed for a given period divided by the approximate number of average physical pallet positions in our warehouses for the applicable period. |
(5) | Calculated as the average number of physical pallets on hand divided by the approximate number of average physical pallet positions in our warehouses for the applicable period. |
Global warehousing segment revenue was $968.6 million for the three months ended March 31, 2024, an increase of $11.0 million, or 1.1%, compared to $957.6 million for the three months ended March 31, 2023. Revenue was driven by an approximate $13.7 million increase from acquisitions completed during 2023 and 2024 and an approximate $15.0 million increase from our recently completed and in-progress expansion and developments. This growth was offset by $15.5 million decrease in our same warehouse pool. The foreign currency translation of revenues earned by our foreign operations had a $0.8 million favorable impact during the three months ended March 31, 2024.
Global warehousing segment cost of operations was $584.1 million for the three months ended March 31, 2024, an increase of $11.7 million, or 2.0%, compared to $572.4 million for the three months ended March 31, 2023. The cost of operations for our same warehouse pool decreased $4.9 million, representing decreases across power and other warehouse costs. Approximately $9.9 million of the increase was driven by the additional facilities in the global warehousing segment we acquired in connection with the above-mentioned acquisitions. We also incurred higher costs of $8.9 million related to our recently completed and in progress expansion and development projects.
Global warehousing segment NOI was $384.5 million for the three months ended March 31, 2024, a decrease of $0.7 million, or 0.2%, compared to $385.2 million for the three months ended March 31, 2023. The NOI for our same warehouse pool decreased $10.6 million or 2.9% attributable to revenue and cost of operations factors previously described. Global warehousing segment NOI was positively impacted by approximately
125
Table of Contents
$3.8 million related to the above mentioned acquisitions and $6.1 million related to our recently completed and in-process expansion and development projects as they continue to ramp up prior to stabilization. The foreign currency translation of our results of operations had a $0.4 million favorable impact to the global warehousing segment NOI period-over-period.
Same Warehouse Results
We had 416 same warehouses for the three months ended March 31, 2024 and 2023. The following table presents revenues, cost of operations, NOI and margins for our same warehouses with a reconciliation to the total financial metrics of our global warehousing segment for the months ended March 31, 2024 and March 31, 2023.
Three months ended March 31, |
| |||||||||||
2024 | 2023 | Change | ||||||||||
(Dollars in millions except revenue per pallet) | ||||||||||||
Warehouse storage | $ | 459.2 | $ | 470.3 | (2.4 | )% | ||||||
Warehouse services | 399.8 | 404.2 | (1.1 | )% | ||||||||
|
|
|
| |||||||||
Total same warehouse revenues | $ | 859.0 | $ | 874.5 | (1.8 | )% | ||||||
Power | $ | 41.4 | $ | 42.8 | (3.3 | )% | ||||||
Labor | 312.7 | 309.3 | 1.1 | % | ||||||||
Other warehouse costs | 154.8 | 161.7 | (4.3 | )% | ||||||||
|
|
|
| |||||||||
Total same warehouse cost of operations | $ | 508.9 | $ | 513.8 | (1.0 | )% | ||||||
|
|
|
| |||||||||
Same warehouse NOI | $ | 350.1 | $ | 360.7 | (2.9 | )% | ||||||
Total same warehouse margin | 40.8 | % | 41.2 | % | (40 | ) bps | ||||||
Number of same warehouse sites | 416 | 416 | n/a | |||||||||
Warehouse storage(1) | ||||||||||||
Economic occupancy(2) | ||||||||||||
Average occupied economic pallets | 7,307 | 7,655 | (4.5 | )% | ||||||||
Economic occupancy percentage | 85.1 | % | 89.3 | % | (420 | ) bps | ||||||
Storage revenue per economic occupied pallet | $ | 62.84 | $ | 61.46 | 2.2 | % | ||||||
Physical occupancy(3) | ||||||||||||
Average physical occupied pallets | 6,787 | 7,154 | (5.1 | )% | ||||||||
Average physical pallet positions | 8,585 | 8,568 | 0.2 | % | ||||||||
Physical occupancy percentage | 79.1 | % | 83.5 | % | (440 | ) bps | ||||||
Storage revenue per physical occupied pallet | $ | 67.66 | $ | 65.76 | 2.9 | % | ||||||
Warehouse services(1) | ||||||||||||
Throughput pallets (in thousands) | 11,304 | 11,559 | (2.2 | )% | ||||||||
Warehouse services revenue per throughput pallet | $ | 32.49 | $ | 32.23 | 0.8 | % |
(1) | Warehouse storage and warehouse services metrics exclude managed sites. |
(2) | Calculated as the aggregate number of physical pallets on hand and any additional pallets otherwise contractually committed for a given period. |
(3) | Calculated as the average number of occupied pallets divided by the estimated number of average physical pallet positions in our warehouses for the applicable period. |
Economic occupancy at our same warehouses was 85.1% for the three months ended March 31, 2024, a decrease of 420 basis points compared to 89.3% for the three months ended March 31, 2023. Our economic occupancy at our same warehouses was 600 basis points higher than our corresponding average physical occupancy of 79.1%. Economic occupancy was lower than the prior year due to lower physical utilization as customers rationalize their inventory during continued economic pressures driven by higher interest rates. Same warehouse storage revenues per economic occupied pallet increased 2.2% period-over-period, primarily driven by pricing actions taken to offset inflationary pressures.
126
Table of Contents
Throughput pallets at our same warehouses were 11.3 million pallets for the three months ended March 31, 2024, a decrease of 2.2% from 11.6 million pallets for the three months ended March 31, 2023. This decrease was the result of lower turns due to continued economic pressures driven by higher interest rates. Same warehouse services revenue per throughput pallet increased 0.8% compared to the prior year, primarily as a result of pricing actions taken to offset inflationary pressures.
Non-Same Warehouse Results
The following tables present revenues, cost of operations, NOI and margins for our non-same warehouses with a reconciliation to the total financial metrics of our global warehousing segment for the three months ended March 31, 2024 and 2023.
Three months ended March 31, |
| |||||||||||
2024 | 2023 | Change | ||||||||||
(Dollars in millions except revenue per pallet) | ||||||||||||
Warehouse storage | $ | 56.4 | $ | 42.7 | 32.1 | % | ||||||
Warehouse services | 53.2 | 40.4 | 31.7 | % | ||||||||
|
|
|
| |||||||||
Total non-same warehouse revenues | $ | 109.6 | $ | 83.1 | 31.9 | % | ||||||
Power | $ | 5.7 | $ | 5.2 | 9.6 | % | ||||||
Labor | 41.4 | 33.0 | 25.5 | % | ||||||||
Other warehouse costs | 28.1 | 20.4 | 37.7 | % | ||||||||
|
|
|
| |||||||||
Total non-same warehouse cost of operations | $ | 75.2 | $ | 58.6 | 28.3 | % | ||||||
|
|
|
| |||||||||
Non-same warehouse NOI | $ | 34.4 | $ | 24.5 | 40.4 | % | ||||||
Total non-same warehouse margin | 31.4 | % | 29.5 | % | 190 | bps | ||||||
Number of non-same warehouse sites(1) | 47 | 41 | 14.6 | % | ||||||||
Warehouse storage (2) | ||||||||||||
Economic occupancy(3) | ||||||||||||
Average occupied economic pallets | 880 | 677 | 30.0 | % | ||||||||
Economic occupancy percentage | 72.6 | % | 69.6 | % | 300 | bps | ||||||
Storage revenue per economic occupied pallet | $ | 64.13 | $ | 63.28 | 1.3 | % | ||||||
Physical occupancy(4) | ||||||||||||
Average physical occupied pallets | 816 | 655 | 24.6 | % | ||||||||
Average physical pallet positions | 1,211 | 972 | 24.6 | % | ||||||||
Physical occupancy percentage | 67.4 | % | 67.4 | % | 0 | bps | ||||||
Storage revenue per physical occupied pallet | $ | 69.09 | $ | 65.32 | 5.8 | % | ||||||
Warehouse services (2) | ||||||||||||
Throughput pallets (in thousands) | 1,570 | 1,113 | 41.1 | % | ||||||||
Warehouse services revenue per throughput pallet | $ | 31.68 | $ | 34.18 | (7.3 | %) |
(1) | Refer to our “Same Warehouse Analysis,” which describes the composition of our non-same warehouse pool. |
(2) | Warehouse storage and warehouse services metrics exclude managed sites. |
(3) | Calculated as the aggregate number of physical pallets on hand and any additional pallets otherwise contractually committed for a given period. |
(4) | Calculated as the average number of occupied pallets divided by the estimated number of average physical pallet positions in our warehouses for the applicable period. |
127
Table of Contents
Global Integrated Solutions Segment
The following table presents the operating results of our global integrated solutions segment for the three months ended March 31, 2024 and 2023.
Three months ended March 31, | ||||||||||||
2024 | 2023 | Change | ||||||||||
(Dollars in millions) | ||||||||||||
Global Integrated Solutions segment revenues | $ | 359.4 | $ | 375.7 | (4.3 | )% | ||||||
Global Integrated Solutions segment cost of operations | 299.7 | 317.8 | (5.7 | )% | ||||||||
|
|
|
| |||||||||
Global Integrated Solutions segment NOI | $ | 59.7 | $ | 57.9 | 3.1 | % | ||||||
|
|
|
| |||||||||
Global Integrated Solutions margin | 16.6 | % | 15.4 | % | 120 | bps |
Global integrated solutions segment revenues were $359.4 million for the three months ended March 31, 2024, a decrease of $16.3 million, or 4.3%, compared to $375.7 million for the three months ended March 31, 2023. The decrease was due to lower volumes and fuel surcharges and the sale of the Dedert business in September 2023, offset by increases from acquisitions which closed in the fourth quarter of 2023.
Global integrated solutions segment cost of operations was $299.7 million for the three months ended March 31, 2024, a decrease of $18.1 million, or 5.7%, compared to $317.8 million for the three months ended March 31, 2023. The decrease was due to lower volumes, cost controls, and the above-mentioned sale of Dedert, offset by increases from the above-mentioned 2023 acquisitions.
Global integrated solutions segment NOI was $59.7 million for the three months ended March 31, 2024, an increase of $1.8 million, or 3.1%, compared to $57.9 million for the three months ended March 31, 2023.
Other Consolidated Operating Expenses
Three months ended March 31, | Change | |||||||||||
2024 | 2023 | % | ||||||||||
(Dollars in millions) | ||||||||||||
Other consolidated operating expense: | ||||||||||||
Depreciation and amortization expense | $ | 211.1 | $ | 181.2 | 16.5 | % | ||||||
General and administrative expense | $ | 124.1 | $ | 114.9 | 8.0 | % | ||||||
Acquisition, transaction, and other expense | $ | 8.6 | $ | 10.8 | (20.4 | )% | ||||||
Restructuring, impairment, and (gain) loss on disposals | $ | (0.4) | $ | 4.2 | (109.5 | )% |
Depreciation and amortization expense. Depreciation and amortization expense was $211.1 million for the three months ended March 31, 2024, an increase of $29.9 million, or 16.5%, compared to $181.2 million for the three months ended March 31, 2023. The increase was primarily due to information technology investments, acquisitions, greenfields, and expansions projects.
General and administrative expense. Corporate-level general and administrative expenses were $124.1 million for the three months ended March 31, 2024, an increase of $9.2 million, or 8.0%, compared to $114.9 million for the three months ended March 31, 2023.
The increase in general and administrative expense was primarily due to growing our global platform in support of our expanding operations. We expect our general and administrative expenses to stabilize and generate operating leverage. For the three months ended March 31, 2024 and 2023, corporate-level general and administrative expenses were 9.3% and 8.6% of total revenues, respectively.
128
Table of Contents
Acquisition, transaction, and other expense. Corporate-level acquisition, transaction and other expenses were $8.6 million for the three months ended March 31, 2024, a decrease of $2.2 million compared to $10.8 million for the three months ended March 31, 2024, primarily related to fewer acquisition-related costs in 2024 compared to 2023.
Restructuring, impairment, and (gain) loss on disposals. Corporate-level restructuring, impairment, and (gain) loss on disposals were a net (gain) of $0.4 million for the three months ended March 31, 2024, a decrease of $4.6 million compared to net expenses of $4.2 million for the three months ended March 31, 2023. The decrease was primarily related to severance charges that were incurred during the three months ended March 31, 2023.
Other Income (Expense)
The following table presents other items of income and expense for the three months ended March 31, 2024 and 2023.
Three months ended March 31, | Change | |||||||||||
2024 | 2023 | % | ||||||||||
(Dollars in millions) | ||||||||||||
Other income (expense): | ||||||||||||
Interest (expense), net | $ | (138.8 | ) | $ | (114.7 | ) | 21.0 | % | ||||
Gain (loss) on extinguishment of debt | $ | (6.5 | ) | $ | — | 100.0 | % | |||||
Gain (loss) on foreign currency transactions, net | $ | (10.7 | ) | $ | (1.3 | ) | 723.1 | % | ||||
Equity income (loss), net of tax | $ | (1.8 | ) | $ | 0.2 | (1000.0 | )% | |||||
Other nonoperating income (expense) | $ | (0.7 | ) | $ | (0.2 | ) | 250.0 | % |
Interest (expense), net. Interest (expense), net was $138.8 million for the three months ended March 31, 2024, an increase of $24.1 million, or 21.0%, compared to $114.7 million for the three months ended March 31, 2023. The average effective interest rate of our outstanding debt increased from 5.3% for the three months ended March 31, 2023 to 6.1% for the three months ended March 31, 2024, due to higher average borrowings paired with rising interest rates associated primarily with our credit facilities and CMBS loans. When taking into account income (expense) generated from those hedging instruments, the average effective interest rate of our outstanding debt increased from 4.1% for the three months ended March 31, 2023 to 5.0% for the three months ended March 31, 2024.
Gain (loss) on extinguishment of debt. Gain (loss) on debt extinguishment was a loss of $6.5 million for the three months ended March 31, 2024, as the result of various debt refinancing arrangements. There was no gain (loss) on debt extinguishment recognized for the three months ended March 31, 2023. For additional information regarding our debt, see “Note 10, Debt” to Lineage, Inc.’s audited historical consolidated financial statements included elsewhere in this prospectus.
Gain (loss) on foreign currency transactions, net. We reported a net foreign currency exchange loss of $10.7 million for the three months ended March 31, 2024 compared to a net loss of $1.3 million for the three months ended March 31, 2023. The increase in foreign currency exchange loss was due to less favorable foreign currency exchange rates driven by the relative strength of the foreign currencies we transact in against the US dollar.
Equity income (loss), net of tax. We reported a net (loss) from equity method investments of $1.8 million for the three months ended March 31, 2024, as compared to net income of $0.2 million for the three months ended March 31, 2023, primarily related to our investment in Emergent Cold LatAm Holdings LLC.
Other nonoperating income (expense). We reported net nonoperating expense of $0.7 million for the three months ended March 31, 2024, compared to net expense of $0.2 million for the three months ended March 31, 2023. The increase was primarily due to market adjustments on our non-consolidated investments.
129
Table of Contents
Income Tax Expense (Benefit)
Income tax (benefit) for the three months ended March 31, 2024 was $9.7 million, which represented an increase of $7.1 million from an income tax (benefit) of $2.6 million for the three months ended March 31, 2023. The tax (benefit) in 2024 was principally created by tax-effect of pre-tax earnings in various jurisdictions, changes in tax laws, and withholding taxes paid in various jurisdictions. The tax (benefit) in 2023 was principally created by tax-effect of pre-tax earnings and losses in various jurisdictions, tax adjustments related to REIT activity, and changes to uncertain tax positions. Our income taxes are discussed in more detail in Note 9 to the Consolidated Financial Statements.
The Organization for Economic Co-operation and Development (“OECD”) has issued Pillar Two Model Rules introducing a new global minimum tax of 15% intended to be effective on January 1, 2024. While the U.S. has not yet adopted the Pillar Two rules, various other governments around the world are enacting legislation. The Company has consolidated revenue of more than €750 million per annum and therefore is in scope of the Pillar Two rules, which entail tax compliance obligations and can potentially lead to additional taxes where the effective tax rate in a jurisdiction is below 15%. In 2024, we expect to incur insignificant tax expenses in connection with Pillar 2 and are continuing to evaluate the potential impact on our business in future periods.
Comparison of Results for the Years Ended December 31, 2023 and 2022
The following table summarizes our NOI for the years ended December 31, 2023 and 2022:
Year ended December 31, | ||||||||||||
2023 | 2022 | Change | ||||||||||
(Dollars in millions) | ||||||||||||
Net income (loss) | $ | (96.2 | ) | $ | (76.0 | ) | 26.6 | % | ||||
General and administrative expense | 501.8 | 398.9 | 25.8 | % | ||||||||
Depreciation expense | 551.9 | 479.5 | 15.1 | % | ||||||||
Amortization expense | 207.8 | 197.7 | 5.1 | % | ||||||||
Acquisition, transaction, and other expense | 60.0 | 66.2 | (9.4 | )% | ||||||||
Restructuring and impairment expense | 31.8 | 15.5 | 105.2 | % | ||||||||
Equity (income) loss, net of tax | 2.6 | 0.2 | 1,200.0 | % | ||||||||
(Gain) loss on foreign currency transactions, net | (3.9 | ) | 23.8 | (116.4 | )% | |||||||
Interest expense, net | 490.4 | 347.0 | 41.3 | % | ||||||||
(Gain) loss on extinguishment of debt | — | (1.4 | ) | 0.0 | % | |||||||
Other nonoperating (income) expense | 19.4 | (2.3 | ) | (943.5 | )% | |||||||
Income tax expense (benefit) | (13.9 | ) | 6.0 | (331.7 | )% | |||||||
|
|
|
| |||||||||
NOI | $ | 1,751.7 | $ | 1,455.1 | 20.4 | % |
130
Table of Contents
Global Warehousing Segment
The following table presents the operating results of our global warehousing segment for the years ended December 31, 2023 and 2022.
Year Ended December 31, | ||||||||||||
2023 | 2022 | Change | ||||||||||
(Dollars in millions except revenue per pallet) | ||||||||||||
Warehouse storage | $ | 2,070.6 | $ | 1,795.1 | 15.3% | |||||||
Warehouse services | 1,786.3 | 1,637.5 | 9.1% | |||||||||
|
|
|
|
|
| |||||||
Total global warehousing segment revenue | $ | 3,856.9 | $ | 3,432.6 | 12.4% | |||||||
Power | $ | 203.9 | $ | 218.8 | (6.8)% | |||||||
Labor | 1,402.4 | 1,271.1 | 10.3% | |||||||||
Other warehouse costs(1)(2) | 742.8 | 721.2 | 3.0% | |||||||||
|
|
|
|
|
| |||||||
Total global warehousing segment cost of operations | $ | 2,349.1 | $ | 2,211.1 | 6.2% | |||||||
|
|
|
|
|
| |||||||
Global warehousing segment NOI | $ | 1,507.8 | $ | 1,221.5 | 23.4% | |||||||
Total global warehousing segment margin | 39.1% | 35.6% | 350 bps | |||||||||
Number of warehouse sites | 463 | 454 | 2.0% | |||||||||
Warehouse storage(3) | ||||||||||||
Average economic occupancy(4) | ||||||||||||
Average occupied economic pallets | 8,292 | 7,618 | 8.8% | |||||||||
Economic occupancy percentage | 86.0% | 83.2% | 280 bps | |||||||||
Storage revenue per economic occupied pallet | $ | 249.59 | $ | 235.63 | 5.9% | |||||||
Average physical occupancy(5) | ||||||||||||
Average physical occupied pallets | 7,716 | 7,251 | 6.4% | |||||||||
Average physical pallet positions | 9,642 | 9,160 | 5.3% | |||||||||
Physical occupancy percentage | 80.0% | 79.2% | 80 bps | |||||||||
Storage revenue per physical occupied pallet | $ | 268.20 | $ | 247.53 | 8.4% | |||||||
Warehouse services(3) | ||||||||||||
Throughput pallets (in thousands) | 51,601 | 50,427 | 2.3% | |||||||||
Warehouse services revenue per throughput pallet | $ | 31.73 | $ | 29.82 | 6.4% |
(1) | Includes real estate rent expense of $96.4 million and $82.1 million for the year ended December 31, 2023 and 2022, respectively. |
(2) | Includes non-real estate rent expense (equipment lease and rentals) of $21.0 million and $21.4 million for the year ended December 31, 2023 and 2022, respectively. |
(3) | Warehouse storage and warehouse services metrics exclude managed sites. |
(4) | Calculated as the aggregate number of physical pallets on hand and any additional pallets otherwise contractually committed for a given period divided by the approximate number of average physical pallet positions in our warehouses for the applicable period. |
(5) | Calculated as the average number of physical pallets on hand divided by the approximate number of average physical pallet positions in our warehouses for the applicable period. |
Global warehousing segment revenue was $3,856.9 million for the year ended December 31, 2023, an increase of $424.3 million, or 12.4%, compared to $3,432.6 million for the year ended December 31, 2022. This growth was driven by $174.7 million of growth in our same warehouse pool. Additionally, approximately
131
Table of Contents
$144.1 million of the increase was driven by acquisitions completed during 2022 and 2023. Revenue growth was also impacted by our recently completed and in-progress expansion and developments in our non-same warehouse pool, which increased approximately $68.3 million. The foreign currency translation of revenues earned by our foreign operations had a $8.5 million unfavorable impact during the year ended December 31, 2023, which was mainly driven by the strengthening of the U.S. dollar against our foreign subsidiaries’ currencies.
Global warehousing segment cost of operations was $2,349.1 million for the year ended December 31, 2023, an increase of $138.0 million, or 6.2%, compared to $2,211.1 million for the year ended December 31, 2022. The cost of operations for our same warehouse pool increased $14.4 million, representing increases in labor costs that were offset by decreases in power and other warehouse costs. Approximately $83.8 million of the increase was driven by the additional facilities in the global warehousing segment we acquired in connection with the above-mentioned acquisitions. We also incurred higher costs of $39.3 million related to our recently completed and in progress expansion and development projects.
Global warehousing segment NOI was $1,507.8 million for the year ended December 31, 2023, an increase of $286.3 million, or 23.4%, compared to $1,221.5 million for the year ended December 31, 2022. The NOI for our same warehouse pool increased $160.3 million, attributable to revenue and cost of operations factors previously described. Approximately $60.3 million of the increase was driven by the additional facilities in the global warehousing segment as a result of the aforementioned acquisitions. Additionally, global warehousing segment NOI was positively impacted by our recently completed and in-process expansion and development projects in the non-same warehouse pool by $29.0 million as they continue to ramp up prior to stabilization. The foreign currency translation of our results of operations had a $3.3 million unfavorable impact to the global warehousing segment NOI period-over-period.
Same Warehouse Results
We had 351 same warehouses for the years ended December 31, 2023 and 2022. The following table presents revenues, cost of operations, NOI and margins for our same warehouses with a reconciliation to the total financial metrics of our global warehousing segment for the years ended December 31, 2023 and December 31, 2022.
Year Ended December 31, | ||||||||||||
2023 | 2022 | Change | ||||||||||
(Dollars in millions except revenue per pallet) | ||||||||||||
Warehouse storage | $ | 1,576.4 | $ | 1,448.0 | 8.9 | % | ||||||
Warehouse services | 1,424.6 | 1,378.3 | 3.4 | % | ||||||||
|
|
|
|
|
| |||||||
Total same warehouse revenues | $ | 3,001.0 | $ | 2,826.3 | 6.2 | % | ||||||
Power | $ | 142.6 | $ | 166.2 | (14.2 | )% | ||||||
Labor | 1,099.4 | 1,051.2 | 4.6 | % | ||||||||
Other warehouse costs | 548.1 | 558.3 | (1.8 | )% | ||||||||
|
|
|
|
|
| |||||||
Total same warehouse cost of operations | $ | 1,790.1 | $ | 1,775.7 | 0.8 | % | ||||||
|
|
|
|
|
| |||||||
Same warehouse NOI | $ | 1,210.9 | $ | 1,050.6 | 15.3 | % | ||||||
Total same warehouse margin | 40.3 | % | 37.2 | % | 310 | bps | ||||||
Number of same warehouse sites | 351 | 351 | n/a | |||||||||
Warehouse storage(1) | ||||||||||||
Economic occupancy(2) | ||||||||||||
Average occupied economic pallets | 6,335 | 6,178 | 2.5 | % | ||||||||
Economic occupancy percentage | 88.3 | % | 86.0 | % | 230 | bps | ||||||
Storage revenue per economic occupied pallet | $ | 248.84 | $ | 234.39 | 6.2 | % |
132
Table of Contents
Year Ended December 31, | ||||||||||||
2023 | 2022 | Change | ||||||||||
(Dollars in millions except revenue per pallet) | ||||||||||||
Physical occupancy(3) | ||||||||||||
Average physical occupied pallets | 5,913 | 5,911 | 0.0 | % | ||||||||
Average physical pallet positions | 7,175 | 7,180 | (0.1 | )% | ||||||||
Physical occupancy percentage | 82.4 | % | 82.3 | % | 10 | bps | ||||||
Storage revenue per physical occupied pallet | $ | 266.59 | $ | 244.98 | 8.8 | % | ||||||
Warehouse services(1) | ||||||||||||
Throughput pallets (in thousands) | 38,880 | 40,501 | (4.0 | )% | ||||||||
Warehouse services revenue per throughput pallet | $ | 33.10 | $ | 30.81 | 7.4 | % |
(1) | Warehouse storage and warehouse services metrics exclude managed sites. |
(2) | Calculated as the aggregate number of physical pallets on hand and any additional pallets otherwise contractually committed for a given period. |
(3) | Calculated as the average number of occupied pallets divided by the estimated number of average physical pallet positions in our warehouses for the applicable period. |
Economic occupancy at our same warehouses was 88.3% for the year ended December 31, 2023, an increase of 230 basis points compared to 86.0% for the year ended December 31, 2022. Our economic occupancy at our same warehouses was 590 basis points higher than our corresponding average physical occupancy of 82.4%. Economic occupancy was higher than the prior year due to increasing amount of minimum storage guarantees and higher physical utilization. Same warehouse storage revenues per economic occupied pallet increased 6.2% period-over-period, primarily driven by pricing actions taken to offset inflationary pressures.
Throughput pallets at our same warehouses were 38.9 million pallets for the year ended December 31, 2023, a decrease of 4.0% from 40.5 million pallets for the year ended December 31, 2022. This decrease was the result of lower turns as customers focused on rebuilding inventory. Same warehouse services revenue per throughput pallet increased 7.4% compared to the prior year, primarily as a result of pricing actions taken.
Non-Same Warehouse Results
The following tables present revenues, cost of operations, NOI and margins for our non-same warehouses with a reconciliation to the total financial metrics of our global warehousing segment for the years ended December 31, 2023 and 2022.
Year Ended December 31, | ||||||||||||
2023 | 2022 | Change | ||||||||||
(Dollars in millions except revenue per pallet) | ||||||||||||
Warehouse storage | $ | 494.2 | $ | 347.1 | 42.4 | % | ||||||
Warehouse services | 361.7 | 259.2 | 39.5 | % | ||||||||
|
|
|
|
|
| |||||||
Total non-same warehouse revenues | $ | 855.9 | $ | 606.3 | 41.2 | % | ||||||
Power | $ | 61.3 | $ | 52.6 | 16.5 | % | ||||||
Labor | 303.0 | 219.9 | 37.8 | % | ||||||||
Other warehouse costs | 194.7 | 162.9 | 19.5 | % | ||||||||
|
|
|
|
|
| |||||||
Total non-same warehouse cost of operations | $ | 559.0 | $ | 435.4 | 28.4 | % | ||||||
|
|
|
|
|
| |||||||
Non-same warehouse NOI | $ | 296.9 | $ | 170.9 | 73.7 | % | ||||||
Total non-same warehouse margin | 34.7 | % | 28.2 | % | 650 | bps | ||||||
Number of non-same warehouse sites | 112 | 103 | 8.7 | % |
133
Table of Contents
Year Ended December 31, | ||||||||||||
2023 | 2022 | Change | ||||||||||
(Dollars in millions except revenue per pallet) | ||||||||||||
Warehouse storage (1) | ||||||||||||
Economic occupancy(2) | ||||||||||||
Average occupied economic pallets | 1,957 | 1,440 | 35.9 | % | ||||||||
Economic occupancy percentage | 79.4 | % | 72.7 | % | 670 | bps | ||||||
Storage revenue per economic occupied pallet | $ | 252.00 | $ | 240.31 | 4.9 | % | ||||||
Physical occupancy(3) | ||||||||||||
Average physical occupied pallets | 1,803 | 1,340 | 34.6 | % | ||||||||
Average physical pallet positions | 2,466 | 1,980 | 24.5 | % | ||||||||
Physical occupancy percentage | 73.1 | % | 67.7 | % | 540 | bps | ||||||
Storage revenue per physical occupied pallet | $ | 273.49 | $ | 258.84 | 5.7 | % | ||||||
Warehouse services (1) | ||||||||||||
Throughput pallets (in thousands) | 12,722 | 9,926 | 28.2 | % | ||||||||
Warehouse services revenue per throughput pallet | $ | 27.54 | $ | 25.86 | 6.5 | % |
(1) | Warehouse storage and warehouse services metrics exclude managed sites. |
(2) | Calculated as the aggregate number of physical pallets on hand and any additional pallets otherwise contractually committed for a given period. |
(3) | Calculated as the average number of occupied pallets divided by the estimated number of average physical pallet positions in our warehouses for the applicable period. |
Global Integrated Solutions Segment
The following table presents the operating results of our global integrated solutions segment for the years ended December 31, 2023 and 2022.
Year ended December 31, | ||||||||||||
2023 | 2022 | Change | ||||||||||
(Dollars in millions) | ||||||||||||
Global Integrated Solutions segment revenues | $ | 1,484.6 | $ | 1,495.7 | (0.7 | )% | ||||||
Global Integrated Solutions segment cost of operations | 1,240.7 | 1,262.1 | (1.7 | )% | ||||||||
|
|
|
|
|
| |||||||
Global Integrated Solutions segment NOI | $ | 243.9 | $ | 233.6 | 4.4 | % | ||||||
|
|
|
|
|
| |||||||
Global Integrated Solutions margin | 16.4 | % | 15.6 | % | 80 | bps |
Global integrated solutions segment revenues were $1,484.6 million for the year ended December 31, 2023, a decrease of $11.1 million, or 0.7%, compared to $1,495.7 million for the year ended December 31, 2022. The decrease was primarily due to lower fuel prices and lower volumes with some offset from 2022 and 2023 acquisitions.
Global integrated solutions segment cost of operations was $1,240.7 million for the year ended December 31, 2023, a decrease of $21.4 million, or 1.7%, compared to $1,262.1 million for the year ended December 31, 2022. The decrease was primarily due to cost controls and lower fuel costs.
Global integrated solutions segment NOI was $243.9 million for the year ended December 31, 2023, an increase of $10.3 million, or 4.4%, compared to $233.6 million for the year ended December 31, 2022.
134
Table of Contents
Other Consolidated Operating Expenses
Year ended December 31, | Change | |||||||||||
2023 | 2022 | % | ||||||||||
(Dollars in millions) | ||||||||||||
Other consolidated operating expense: | ||||||||||||
Depreciation and amortization expense | $ | 759.7 | $ | 677.2 | 12.2 | % | ||||||
General and administrative expense | $ | 501.8 | $ | 398.9 | 25.8 | % | ||||||
Acquisition, transaction, and other expense | $ | 60.0 | $ | 66.2 | (9.4 | )% | ||||||
Restructuring and impairment expense | $ | 31.8 | $ | 15.5 | 105.2 | % |
Depreciation and amortization expense. Depreciation and amortization expense was $759.7 million for the year ended December 31, 2023, an increase of $82.5 million, or 12.2%, compared to $677.2 million for the year ended December 31, 2022. The increase was primarily due to acquisitions, greenfields, and expansions projects.
General and administrative expense. Corporate-level general and administrative expenses were $501.8 million for the year ended December 31, 2023, an increase of $102.9 million, or 25.8%, compared to $398.9 million for the year ended December 31, 2022.
The increase in general and administrative expenses was due to growing our global platform in support of our expanding operations, including through acquisition and development activity. We expect our general and administrative expenses to stabilize and generate operating leverage. For the years ended December 31, 2023 and 2022, corporate-level general and administrative expenses were 9.4% and 8.1% of total revenues, respectively.
Acquisition, transaction, and other expense. Corporate-level acquisition, transaction, and other expenses were $60.0 million for the year ended December 31, 2023, a decrease of $6.2 million compared to $66.2 million for the year ended December 31, 2022 primarily related to fewer acquisitions in 2023 compared to 2022, partially offset by increases in transaction costs incurred in anticipation of a potential initial public offering.
Restructuring and impairment expense. Corporate-level restructuring and impairment expenses were $31.8 million for the year ended December 31, 2023, an increase of $16.3 million compared to $15.5 million for the year ended December 31, 2022. The increase was primarily related to a $7.0 million impairment related to an indefinite-lived trade name, which we determined to phase out, and increased severance and separation costs.
Other Income (Expense)
The following table presents other items of income and expense for the years ended December 31, 2022 and 2021.
Year ended December 31, | Change | |||||||||||
2023 | 2022 | % | ||||||||||
(Dollars in millions) | ||||||||||||
Other income (expense): | ||||||||||||
Interest expense, net | $ | (490.4 | ) | $ | (347.0 | ) | 41.3 | % | ||||
Gain (loss) on extinguishment of debt | $ | — | $ | 1.4 | (100.0 | )% | ||||||
Gain (loss) on foreign currency transactions, net | $ | 3.9 | $ | (23.8 | ) | (116.4 | )% | |||||
Equity income (loss), net of tax | $ | (2.6 | ) | $ | (0.2 | ) | 1,200.0 | % | ||||
Other nonoperating income (expense) net | $ | (19.4 | ) | $ | 2.3 | (943.5 | )% |
Interest (expense), net. Interest (expense), net was $490.4 million for the year ended December 31, 2023, an increase of $143.4 million, or 41.3%, compared to $347.0 million for the year ended December 31, 2022. The average effective interest rate of our outstanding debt increased from 3.3% for the year ended December 31, 2022 to 5.8% for the year ended December 31, 2023 due to higher average borrowings paired with rising interest rates associated primarily with our credit facilities and CMBS loans. When taking into account income (expense)
135
Table of Contents
generated from those hedging instruments, the average effective interest rate of our outstanding debt increased from 2.9% for the year ended December 31, 2022 to 4.5% for the year ended December 31, 2023.
The following table presents the components of interest expense, net for the years ended December 31, 2023 and 2022:
2023 | 2022 | |||||||||||
(Dollars in millions) | ||||||||||||
Interest expense | $ | 509.1 | $ | 281.5 | ||||||||
(Gain) loss on designated and non-designated hedge instruments | (115.9 | ) | (37.9 | ) | ||||||||
Finance lease liabilities interest | 91.3 | 94.3 | ||||||||||
Amortization of deferred financing costs | 19.0 | 17.8 | ||||||||||
Capitalized interest | (13.1 | ) | (8.6 | ) | ||||||||
Interest income | (5.8 | ) | (3.2 | ) | ||||||||
Other financing fees | 5.8 | 3.1 | ||||||||||
|
|
|
|
|
| |||||||
Interest expense, net | $ | 490.4 | $ | 347.0 | ||||||||
|
|
|
|
|
|
Gain (loss) on extinguishment of debt. Gain (loss) on debt extinguishment was a gain of $1.4 million for the year ended December 31, 2022. There was no gain (loss) on debt extinguishment recognized for the year ended December 31, 2023. In 2022, we recognized a gain on the extinguishment of debt related to our CHHS Sub CDE 23—A1 loan and corresponding note receivable. For additional information regarding our debt, see “Note 10, Debt” to Lineage, Inc.’s audited historical consolidated financial statements included elsewhere in this prospectus.
Gain (loss) on foreign currency transactions, net. We reported a net foreign currency exchange gain of $3.9 million for the year ended December 31, 2023 compared to a net loss of $23.8 million for the year ended December 31, 2022. The increase in foreign currency exchange gain was due to more favorable foreign currency exchange rates driven by the relative strength of the US dollar against foreign currencies that we transact in.
Equity income (loss), net of tax. Income (loss) from equity method investments was $2.6 million for the year ended December 31, 2023, as compared to $0.2 million for the year ended December 31, 2022.
Other nonoperating income (expense). We reported net nonoperating expense of $19.4 million for the year ended December 31, 2023, compared to net income of $2.3 million for the year ended December 31, 2022. For the year ended December 31, 2023, the net expense was primarily driven by a net loss of $20.9 million we recognized on the sale of our 75% interest in Erweda BV and its subsidiaries. For the year ended December 31, 2022, net income was primarily driven by income of $1.1 million from insurance recoveries associated with damages from Hurricane Ida and income of $0.8 million from market adjustments on our non-consolidated investments.
Income Tax Expense (Benefit)
Income tax (benefit) for the year ended December 31, 2023 was $13.9 million, which represented a decrease of $19.9 million from income tax expense of $6.0 million for the year ended December 31, 2022. The tax (benefit) in 2023 was principally created by tax-effect of pre-tax earnings in various jurisdictions, uncertain tax position changes, and tax adjustments related to REIT activity. The tax expense in 2022 was principally created by tax-effect of pre-tax earnings in various jurisdictions, valuation allowance changes, and tax adjustments related to REIT activity. Our income taxes are discussed in more detail in Note 9 to the Consolidated Financial Statements.
136
Table of Contents
Comparison of Results for the Years Ended December 31, 2022 and 2021
The following table summarizes our NOI for the years ended December 31, 2022 and 2021:
Year ended December 31, | ||||||||||||
2022 | 2021 | Change | ||||||||||
(Dollars in millions) | ||||||||||||
Net income (loss) | $ | (76.0) | $ | (176.5) | (56.9)% | |||||||
General and administrative expense | 398.9 | 289.3 | 37.9% | |||||||||
Depreciation expense | 479.5 | 416.1 | 15.2% | |||||||||
Amortization expense | 197.7 | 187.6 | 5.4% | |||||||||
Acquisition, transaction, and other expense | 66.2 | 123.6 | (46.4)% | |||||||||
Restructuring and impairment expense | 15.5 | 26.3 | (41.1)% | |||||||||
Equity (income) loss, net of tax | 0.2 | 0.3 | (33.3)% | |||||||||
(Gain) loss on foreign currency transactions, net | 23.8 | 34.0 | (30.0)% | |||||||||
Interest expense, net | 347.0 | 259.6 | 33.7% | |||||||||
(Gain) loss on extinguishment of debt | (1.4) | 4.1 | (134.1)% | |||||||||
Other nonoperating (income) expense | (2.3) | (4.5) | (48.9)% | |||||||||
Income tax expense (benefit) | 6.0 | (29.3) | (120.5)% | |||||||||
|
|
|
| |||||||||
NOI | $1,455.1 | $1,130.6 | 28.7% |
Global Warehousing Segment
The following table presents the operating results of our global warehousing segment for the years ended December 31, 2022 and 2021.
Year ended December 31, | ||||||||||||
2022 | 2021 | Change | ||||||||||
(Dollars in millions except revenue per pallet) | ||||||||||||
Warehouse storage | $ | 1,795.1 | $ | 1,398.4 | 28.4 | % | ||||||
Warehouse services | 1,637.5 | 1,257.4 | 30.2 | % | ||||||||
|
|
|
|
|
| |||||||
Total global warehousing segment revenue | $ | 3,432.6 | $ | 2,655.8 | 29.2 | % | ||||||
Power | $ | 218.8 | $ | 155.4 | 40.8 | % | ||||||
Labor | 1,271.1 | 997.9 | 27.4 | % | ||||||||
Other warehouse costs(1)(2) | 721.2 | 531.0 | 35.8 | % | ||||||||
|
|
|
|
|
| |||||||
Total global warehousing segment cost of operations | $ | 2,211.1 | $ | 1,684.3 | 31.3 | % | ||||||
Global warehousing segment NOI | $ | 1,221.5 | $ | 971.5 | 25.7 | % | ||||||
Total global warehousing segment margin | 35.6 | % | 36.6 | % | (100 | ) bps | ||||||
Number of warehouse sites | 454 | 409 | 11.0 | % | ||||||||
Warehouse storage(3) | ||||||||||||
Average economic occupancy(4) | ||||||||||||
Average occupied economic pallets | 7,618 | 6,050 | 25.9 | % | ||||||||
Economic occupancy percentage | 83.2 | % | 82.3 | % | 90 | bps | ||||||
Storage revenue per economic occupied pallet | $ | 235.63 | $ | 230.26 | 2.3 | % | ||||||
Average physical occupancy(5) | ||||||||||||
Average physical occupied pallets | 7,251 | 5,735 | 26.4 | % | ||||||||
Average physical pallet positions | 9,160 | 7,350 | 24.6 | % | ||||||||
Physical occupancy percentage | 79.2 | % | 78.0 | % | 120 | bps | ||||||
Storage revenue per physical occupied pallet | $ | 247.53 | $ | 242.90 | 1.9 | % |
137
Table of Contents
Year ended December 31, | ||||||||||||
2022 | 2021 | Change | ||||||||||
(Dollars in millions except revenue per pallet) | ||||||||||||
Warehouse services(3) | ||||||||||||
Throughput pallets (in thousands) | 50,427 | 42,840 | 17.7 | % | ||||||||
Warehouse services revenue per throughput pallet | $ | 29.82 | $ | 26.59 | 12.1 | % |
(1) | Includes real estate rent expense of $82.1 million and $73.9 million for the year ended December 31, 2022 and 2021, respectively. |
(2) | Includes non-real estate rent expense (equipment lease and rentals) of $21.4 million and $17.1 million for the year ended December 31, 2022 and 2021, respectively. |
(3) | Warehouse storage and warehouse services metrics exclude managed sites. |
(4) | Calculated as the aggregate number of physical pallets on hand and any additional pallets otherwise contractually committed for a given period divided by the approximate number of average physical pallet positions in our warehouses for the applicable period. |
(5) | Calculated as the average number of physical pallets on hand divided by the approximate number of average physical pallet positions in our warehouses for the applicable period. |
Global warehousing segment revenue was $3,432.6 million for the year ended December 31, 2022, an increase of $776.8 million, or 29.2%, compared to $2,655.8 million for the year ended December 31, 2021. This growth was driven by $260.7 million of growth in our same warehouse pool. Additionally, approximately $453.3 million of the increase was driven by acquisitions completed during 2021 and 2022. Revenue growth was also impacted by our recently completed and in-progress expansion and developments in our non-same warehouse pool, which increased approximately $99.1 million. The foreign currency translation of revenues earned by our foreign operations had a $102.2 million unfavorable impact during the year ended December 31, 2022, which was mainly driven by the strengthening of the U.S. dollar against our foreign subsidiaries’ currencies.
Global warehousing segment cost of operations was $2,211.1 million for the year ended December 31, 2022, an increase of $526.8 million, or 31.3%, compared to $1,684.3 million for the year ended December 31, 2021. The cost of operations for our same warehouse pool increased $155.0 million representing increases across most of our cost categories due to inflationary pressures and some residual operational inefficiencies stemming from COVID. Approximately $333.3 million of the increase was driven by the additional facilities in the global warehousing segment we acquired in connection with the above-mentioned acquisitions. We also incurred higher costs of $71.1 million related to our recently completed and in progress expansion and development projects.
Global warehousing segment NOI was $1,221.5 million for the year ended December 31, 2022, an increase of $250.0 million, or 25.7%, compared to $971.5 million for the year ended December 31, 2021. The NOI for our same warehouse pool increased $105.7 million, attributable to revenue and cost of operations factors previously described. Approximately $22.0 million of the increase was driven by the additional facilities in the global warehousing segment as a result of the aforementioned acquisitions. Additionally, global warehousing segment NOI was positively impacted by our recently completed and in-process expansion and development projects in the non-same warehouse pool by $28.0 million as they continue to ramp up prior to stabilization. The foreign currency translation of our results of operations had a $29.0 million unfavorable impact to the global warehousing segment NOI period-over-period.
138
Table of Contents
Same Warehouse Results
We had 285 same warehouses for the years ended December 31, 2022 and 2021. The following table presents revenues, cost of operations, NOI and margins for our same warehouses with a reconciliation to the total financial metrics of our global warehousing segment for the years ended December 31, 2022 and December 31, 2021.
Year Ended December 31, | ||||||||||||
2022 | 2021 | Change | ||||||||||
(Dollars in millions except revenue per pallet) | ||||||||||||
Warehouse storage | $ | 1,246.8 | $ | 1,118.8 | 11.4 | % | ||||||
Warehouse services | 1,152.9 | 1,020.2 | 13.0 | % | ||||||||
|
|
|
|
|
| |||||||
Total same warehouse revenues | $ | 2,399.7 | $ | 2,139.0 | 12.2 | % | ||||||
Power | $ | 133.2 | $ | 117.5 | 13.4 | % | ||||||
Labor | 876.6 | 800.4 | 9.5 | % | ||||||||
Other warehouse costs | 453.7 | 390.6 | 16.2 | % | ||||||||
|
|
|
|
|
| |||||||
Total same warehouse cost of operations | $ | 1,463.5 | $ | 1,308.5 | 11.8 | % | ||||||
Same warehouse NOI | $ | 936.2 | $ | 830.5 | 12.7 | % | ||||||
Total same warehouse margin | 39.0 | % | 38.8 | % | 20 | bps | ||||||
Number of same warehouse sites | 285 | 285 | n/a | |||||||||
Warehouse storage(1) | ||||||||||||
Economic occupancy(2) | ||||||||||||
Average occupied economic pallets | 4,967 | 4,801 | 3.5 | % | ||||||||
Economic occupancy percentage | 88.2 | % | 85.8 | % | 240 | bps | ||||||
Storage revenue per economic occupied pallet | $ | 251.04 | $ | 232.18 | 8.1 | % | ||||||
Physical occupancy(3) | ||||||||||||
Average physical occupied pallets | 4,721 | 4,524 | 4.4 | % | ||||||||
Average physical pallet positions | 5,632 | 5,594 | 0.7 | % | ||||||||
Physical occupancy percentage | 83.8 | % | 80.9 | % | 290 | bps | ||||||
Storage revenue per physical occupied pallet | $ | 264.10 | $ | 246.36 | 7.2 | % | ||||||
Warehouse services(1) | ||||||||||||
Throughput pallets (in thousands) | 33,728 | 33,974 | (0.7 | )% | ||||||||
Warehouse services revenue per throughput pallet | $ | 30.35 | $ | 26.66 | 13.8 | % |
(1) | Warehouse storage and warehouse services metrics exclude managed sites. |
(2) | Calculated as the aggregate number of physical pallets on hand and any additional pallets otherwise contractually committed for a given period. |
(3) | Calculated as the average number of occupied pallets divided by the estimated number of average physical pallet positions in our warehouses for the applicable period. |
Economic occupancy at our same warehouses was 88.2% for the year ended December 31, 2022, an increase of 240 basis points compared to 85.8% for the year ended December 31, 2021. Our economic occupancy at our same warehouses was 440 basis points higher than our corresponding average physical occupancy of 83.8%. Economic occupancy was higher than the prior year due to increasing amount of minimum storage guarantees and higher physical utilization. Same warehouse storage revenues per economic occupied pallet increased 8.1% period-over-period, primarily driven by pricing actions taken to offset inflationary pressures.
Throughput pallets at our same warehouses were 33.7 million pallets for the year ended December 31, 2022, a decrease of 0.7% from 34.0 million pallets for the year ended December 31, 2021. This decrease was the result of lower turns as customers focused on rebuilding inventory. Same warehouse services revenue per throughput pallet increased 13.8% compared to the prior year, primarily as a result of pricing actions taken to offset inflationary pressures.
139
Table of Contents
Non-Same Warehouse Results
The following table presents revenues, cost of operations, NOI and margins for our non-same warehouses with a reconciliation to the total financial metrics of our global warehousing segment for the years ended December 31, 2022 and 2021.
Year Ended December 31, | ||||||||||||
2022 | 2021 | Change | ||||||||||
(Dollars in millions except revenue per pallet) | ||||||||||||
Warehouse storage | $ | 548.3 | $ | 279.6 | 96.1 | % | ||||||
Warehouse services | 484.6 | 237.2 | 104.3 | % | ||||||||
|
|
|
|
|
| |||||||
Total non-same warehouse revenues | $ | 1,032.9 | $ | 516.8 | 99.9 | % | ||||||
Power | $ | 85.6 | $ | 37.9 | 125.9 | % | ||||||
Labor | 394.5 | 197.5 | 99.7 | % | ||||||||
Other warehouse costs | 267.5 | 140.4 | 90.5 | % | ||||||||
|
|
|
|
|
| |||||||
Total non-same warehouse cost of operations | $ | 747.6 | $ | 375.8 | 98.9 | % | ||||||
Non-same warehouse NOI | $ | 285.3 | $ | 141.0 | 102.3 | % | ||||||
Total non-same warehouse margin | 27.6 | % | 27.3 | % | 30 | bps | ||||||
Number of non-same warehouse sites | 169 | 124 | 36.3 | % | ||||||||
Warehouse storage(1) | ||||||||||||
Economic occupancy(2) | ||||||||||||
Average occupied economic pallets | 2,651 | 1,250 | 112.1 | % | ||||||||
Economic occupancy percentage | 75.1 | % | 71.2 | % | 390 | bps | ||||||
Storage revenue per economic occupied pallet | $ | 206.74 | $ | 222.89 | (7.2 | )% | ||||||
Physical occupancy(3) | ||||||||||||
Average physical occupied pallets | 2,530 | 1,211 | 108.9 | % | ||||||||
Average physical pallet positions | 3,528 | 1,756 | 100.9 | % | ||||||||
Physical occupancy percentage | 71.7 | % | 69.0 | % | 270 | bps | ||||||
Storage revenue per physical occupied pallet | $ | 216.60 | $ | 229.99 | (5.8 | )% | ||||||
Warehouse services(1) | ||||||||||||
Throughput pallets (in thousands) | 16,699 | 8,866 | 88.3 | % | ||||||||
Warehouse services revenue per throughput pallet | $ | 28.77 | $ | 26.30 | 9.4 | % |
(1) | Warehouse storage and warehouse services metrics exclude managed sites. |
(2) | Calculated as the aggregate number of physical pallets on hand and any additional pallets otherwise contractually committed for a given period. |
(3) | Calculated as the average number of occupied pallets divided by the estimated number of average physical pallet positions in our warehouses for the applicable period. |
Global Integrated Solutions Segment
The following table presents the operating results of our global integrated solutions segment for the years ended December 31, 2022 and 2021.
Year ended December 31, | ||||||||||||
2022 | 2021 | Change | ||||||||||
(Dollars in millions) | ||||||||||||
Global integrated solutions segment revenues | $ | 1,495.7 | $ | 1,046.2 | 43.0 | % | ||||||
Global integrated solutions segment cost of operations | 1,262.1 | 887.1 | 42.3 | % | ||||||||
|
|
|
| |||||||||
Global integrated solutions segment NOI | $ | 233.6 | $ | 159.1 | 46.8 | % | ||||||
|
|
|
| |||||||||
Global integrated solutions segment NOI margin | 15.6 | % | 15.2 | % | 40 | bps |
140
Table of Contents
Global integrated solutions segment revenues were $1,495.7 million for the year ended December 31, 2022, an increase of $449.5 million, or 43.0%, compared to $1,046.2 million for the year ended December 31, 2021. The increase was primarily due to acquisitions in 2022 as well as rising fuel surcharges and higher volumes.
Global integrated solutions segment cost of operations was $1,262.1 million for the year ended December 31, 2022, an increase of $375.0 million, or 42.3%, compared to $887.1 million for the year ended. The increase was primarily due to the above mentioned acquisitions and rising fuel costs.
Global integrated solutions segment NOI was $233.6 million for the year ended December 31, 2022, an increase of $74.5 million, or 46.8%, compared to $159.1 million for the year ended December 31, 2021.
Other Consolidated Operating Expenses
Year ended December 31, | Change | |||||||||||
2022 | 2021 | % | ||||||||||
(Dollars in millions) | ||||||||||||
Other consolidated operating expense: | ||||||||||||
Depreciation and amortization expense | $ | 677.2 | $ | 603.7 | 12.2 | % | ||||||
General and administrative expense | $ | 398.9 | $ | 289.3 | 37.9 | % | ||||||
Acquisition, transaction, and other expense | $ | 66.2 | $ | 123.6 | (46.4 | )% | ||||||
Restructuring and impairment expense | $ | 15.5 | $ | 26.3 | (41.1 | )% |
Depreciation and amortization expense. Depreciation and amortization expense was $677.2 million for the year ended December 31, 2022, an increase of $73.5 million, or 12.2%, compared to $603.7 million for the year ended December 31, 2021. The increase was primarily due to acquisitions, greenfields, and expansions projects, partially offset by the favorable impact of foreign currency translation.
General and administrative expense. Corporate-level general and administrative expenses were $398.9 million for the year ended December 31, 2022, an increase of $109.6 million, or 37.9%, compared to $289.3 million for the year ended December 31, 2021.
The increase in general and administrative expenses was due to growing our global platform in support of our expanding operations, including through acquisition and development activity. We expect our general and administrative expenses to stabilize and generate operating leverage. For the years ended December 31, 2022 and 2021, corporate-level general and administrative expenses were 8.1% and 7.8% of total revenues, respectively.
Acquisition, transaction, and other expense. Corporate-level acquisition, transaction, and other expenses were $66.2 million for the year ended December 31, 2022, a decrease of $57.4 million compared to $123.6 million for the year ended December 31, 2021 primarily related to fewer acquisitions in 2022 compared to 2021.
Restructuring and impairment expense. Corporate-level restructuring and impairment expenses were $15.5 million for the year ended December 31, 2022, a decrease of $10.8 million compared to $26.3 million for the year ended December 31, 2021. During 2021, we incurred legal fees related to the Statesville matter, as well as impairments of approximately $7 million. For additional information regarding the Statesville matter, see “Note 18, Commitments and Contingencies” to Lineage, Inc.’s audited historical consolidated financial statements included elsewhere in this prospectus.
141
Table of Contents
Other Income (Expense)
The following table presents other items of income and expense for the years ended December 31, 2022 and 2021.
Year ended December 31, | Change | |||||||||||
2022 | 2021 | % | ||||||||||
(Dollars in millions) | ||||||||||||
Other income (expense): | ||||||||||||
Interest (expense), net | $ | (347.0 | ) | $ | (259.6 | ) | 33.7 | % | ||||
Gain (loss) on extinguishment of debt | 1.4 | (4.1 | ) | (134.1 | )% | |||||||
Gain (loss) on foreign currency transactions, net | (23.8 | ) | (34.0 | ) | (30.0 | )% | ||||||
Equity income (loss), net of tax | (0.2 | ) | (0.3 | ) | (33.3 | )% | ||||||
Other nonoperating income (expense) | 2.3 | 4.5 | (48.9 | )% |
Interest (expense), net. Interest (expense), net was $347.0 million for the year ended December 31, 2022, an increase of $87.4 million, or 33.7%, compared to $259.6 million for the year ended December 31, 2021. The average effective interest rate of our outstanding debt increased from 2.0% for the year ended December 31, 2021 to 3.3% for the year ended December 31, 2022 due to higher average borrowings paired with rising interest rates associated primarily with our credit facilities and CMBS loans. When taking into account income (expense) generated from those hedging instruments, the average effective interest rate of our outstanding debt increased from 2.2% for the year ended December 31, 2021 to 2.9% for the year ended December 31, 2022.
The following table presents the components of interest expense, net for the years ended December 31, 2022 and 2021:
2022 | 2021 | |||||||
(Dollars in millions) | ||||||||
Interest expense | $ | 281.5 | $ | 141.9 | ||||
(Gain) loss on designated and non-designated hedge instruments | (37.9 | ) | 8.1 | |||||
Finance lease liabilities interest | 94.3 | 99.7 | ||||||
Amortization of deferred financing costs | 17.8 | 16.7 | ||||||
Capitalized interest | (8.6 | ) | (6.6 | ) | ||||
Interest income | (3.2 | ) | (3.7 | ) | ||||
Other financing fees | 3.1 | 3.5 | ||||||
|
|
|
| |||||
Interest expense, net | $ | 347.0 | $ | 259.6 | ||||
|
|
|
|
Gain (loss) on extinguishment of debt. Gain (loss) on debt extinguishment was a gain of $1.4 million for the year ended December 31, 2022 as compared to a loss of $4.1 million for the year ended December 31, 2021. In 2022, we recognized a gain on the extinguishment of debt related to our CHHS Sub CDE 23—A1 loan and corresponding note receivable. In 2021, we recognized loss on extinguishment of debt primarily related to the repayment of the UK CMBS Facility Agreement. For additional information regarding our debt, see “Note 10, Debt” to Lineage, Inc.’s audited historical consolidated financial statements included elsewhere in this prospectus.
Gain (loss) on foreign currency transactions, net. We reported a net foreign currency exchange loss of $23.8 million for the year ended December 31, 2022 compared to a net loss of $34.0 million for the year ended December 31, 2021. The decrease in foreign currency exchange loss was due to more favorable foreign currency exchange rates driven by the relative strength of the US dollar against foreign currencies that we transact in.
Equity income (loss), net of tax. Income (loss) from equity method investments was $0.2 million for the year ended December 31, 2022, as compared to $0.3 million for the year ended December 31, 2021.
142
Table of Contents
Other nonoperating income (expense). Other nonoperating income (expense) was $2.3 million for the year ended December 31, 2022, compared to $4.5 million for the year ended December 31, 2021. For the year ended December 31, 2022, net income was primarily driven by income of $1.1 million from insurance recoveries associated with damages from Hurricane Ida and income of $0.8 million from market adjustments on our non-consolidated investments. For the year ended December 31, 2021, net income was primarily driven by income of $6.1 million from market adjustments on our non-consolidated investments, partially offset by a $2.5 million loss we recognized from the sale of Latin American subsidiaries.
Income Tax Expense (Benefit)
Income tax expense for the year ended December 31, 2022 was $6.0 million, which represented an increase of $35.3 million from an income tax (benefit) of $29.3 million for the year ended December 31, 2021. The tax expense in 2022 was principally created by tax-effect of pre-tax earnings in various jurisdictions, valuation allowance changes, and tax adjustments related to REIT activity. The tax (benefit) in 2021 was principally created by tax-effect of pre-tax earnings and losses in various jurisdictions, valuation allowance changes, tax adjustments related to REIT activity, and uncertain tax positions. Our income taxes are discussed in more detail in Note 9 to the Consolidated Financial Statements.
Quarterly Results of Operations and Other Data
The following tables set forth selected unaudited quarterly data regarding our results of operations for our last eight completed fiscal quarters. The quarterly results of operations presented should be read in conjunction with our consolidated financial statements and related notes appearing elsewhere in this prospectus, and are not necessarily indicative of our operating results for any future period. For definitions of the non-GAAP metrics presented below and a statement of why our management believes the presentation of these metrics provides useful information to investors and any additional purposes for which management uses such metrics, see “Summary Selected Historical and Pro Forma Condensed Consolidated Financial and Other Data—Non-GAAP Financial Measures.”
The following table summarizes revenues for our last nine completed fiscal quarters.
2024 | 2023 | 2022 | ||||||||||||||||||||||||||||||||||
(dollars in millions) | March 31 | December 31 | September 30 | June 30 | March 31 | December 31 | September 30 | June 30 | March 31 | |||||||||||||||||||||||||||
Total Revenues: | ||||||||||||||||||||||||||||||||||||
Global Warehousing | $ | 968.6 | $ | 975.6 | $ | 959.8 | $ | 963.9 | $ | 957.6 | $ | 923.6 | $ | 891.2 | $ | 833.0 | $ | 784.8 | ||||||||||||||||||
Global Integrated Solutions | 359.4 | 357.7 | 369.5 | 381.7 | 375.7 | 404.4 | 364.9 | 384.2 | 342.2 | |||||||||||||||||||||||||||
|
|
|
|
|
|
|
|
|
|
|
|
|
|
|
|
|
| |||||||||||||||||||
Total Revenues | $ | 1,328.0 | $ | 1,333.3 | $ | 1,329.3 | $ | 1,345.6 | $ | 1,333.3 | $ | 1,328.0 | $ | 1,256.1 | $ | 1,217.2 | $ | 1,127.0 |
The table below reconciles NOI to net income (loss), which is the most directly comparable financial measure calculated in accordance with GAAP, and sets forth our NOI by segment and same warehouse NOI results, in each case for the last nine completed fiscal quarters.
2024 | 2023 | 2022 | ||||||||||||||||||||||||||||||||||
(dollars in millions except number of warehouses) | March 31 | December 31 | September 30 | June 30 | March 31 | December 31 | September 30 | June 30 | March 31 | |||||||||||||||||||||||||||
Net income (loss) | $(48.0) | $ | (56.7 | ) | $ | (50.4 | ) | $ | (7.7 | ) | $ | 18.6 | $ | (17.7 | ) | $ | (42.5 | ) | $ | (16.8 | ) | $ | 1.0 | |||||||||||||
General and administrative expense | 124.1 | 141.0 | 121.3 | 124.6 | 114.9 | 112.6 | 102.6 | 96.2 | 87.5 | |||||||||||||||||||||||||||
Depreciation expense | 157.7 | 149.7 | 137.6 | 135.1 | 129.5 | 115.2 | 129.1 | 118.0 | 117.2 | |||||||||||||||||||||||||||
Amortization expense | 53.4 | 53.3 | 50.5 | 52.3 | 51.7 | 52.1 | 47.9 | 49.2 | 48.5 | |||||||||||||||||||||||||||
Acquisition, transaction, and other expense | 8.6 | 14.5 | 19.0 | 15.7 | 10.8 | 14.1 | 20.1 | 13.4 | 18.6 | |||||||||||||||||||||||||||
Restructuring, impairment, and (gain) loss on disposals | (0.4 | ) | 20.7 | 4.5 | 2.4 | 4.2 | 9.5 | 5.5 | 0.1 | 0.4 | ||||||||||||||||||||||||||
Equity (income) loss, net of tax | 1.8 | 0.4 | 2.0 | 0.4 | (0.2 | ) | (0.3 | ) | 0.1 | 0.3 | 0.1 | |||||||||||||||||||||||||
(Gain) loss on foreign currency transactions, net | 10.7 | (12.5 | ) | 4.2 | 3.1 | 1.3 | (18.7 | ) | 16.2 | 28.8 | (2.5 | ) |
143
Table of Contents
2024 | 2023 | 2022 | ||||||||||||||||||||||||||||||||||
(dollars in millions except number of warehouses) | March 31 | December 31 | September 30 | June 30 | March 31 | December 31 | September 30 | June 30 | March 31 | |||||||||||||||||||||||||||
Interest expense, net | 138.8 | 133.1 | 126.8 | 115.8 | 114.7 | 110.8 | 93.4 | 76.5 | 66.3 | |||||||||||||||||||||||||||
(Gain) loss on extinguishment of debt | 6.5 | — | — | — | — | — | (1.4 | ) | — | — | ||||||||||||||||||||||||||
Other nonoperating (income) expense, net | 0.7 | 0.7 | 18.7 | (0.2 | ) | 0.2 | (0.1 | ) | (1.7 | ) | (0.5 | ) | — | |||||||||||||||||||||||
Income tax (benefit) expense | (9.7 | ) | (6.6 | ) | (4.0 | ) | (0.7 | ) | (2.6 | ) | 0.9 | 3.1 | 1.8 | 0.2 | ||||||||||||||||||||||
|
|
|
|
|
|
|
|
|
|
|
|
|
|
|
|
|
| |||||||||||||||||||
NOI | $444.2 | $ | 437.6 | $ | 430.2 | $ | 440.8 | $ | 443.1 | $ | 378.4 | $ | 372.4 | $ | 367.0 | $ | 337.3 | |||||||||||||||||||
NOI by Segment: | ||||||||||||||||||||||||||||||||||||
Warehouse NOI | $384.5 | $ | 374.6 | $ | 366.6 | $ | 381.4 | $ | 385.2 | $ | 327.0 | $ | 311.2 | $ | 298.4 | $ | 284.9 | |||||||||||||||||||
Integrated Solutions NOI | 59.7 | 63.0 | 63.6 | 59.4 | 57.9 | 51.4 | 61.2 | 68.6 | 52.4 | |||||||||||||||||||||||||||
|
|
|
|
|
|
|
|
|
|
|
|
|
|
|
|
|
| |||||||||||||||||||
Total NOI | $444.2 | $ | 437.6 | $ | 430.2 | $ | 440.8 | $ | 443.1 | $ | 378.4 | $ | 372.4 | $ | 367.0 | $ | 337.3 | |||||||||||||||||||
Warehouse NOI: | ||||||||||||||||||||||||||||||||||||
Number of Same Warehouses | 416 | 351 | 351 | 351 | 351 | 285 | 285 | 285 | 285 | |||||||||||||||||||||||||||
Same Warehouse NOI | $ | 350.1 | $ | 295.3 | $ | 294.6 | $ | 308.4 | $ | 312.6 | $ | 237.7 | $ | 237.3 | $ | 232.8 | $ | 228.4 | ||||||||||||||||||
Non-Same Warehouse NOI | 34.4 | 79.3 | 72.0 | 73.0 | 72.6 | 89.3 | 73.9 | 65.6 | 56.5 | |||||||||||||||||||||||||||
|
|
|
|
|
|
|
|
|
|
|
|
|
|
|
|
|
| |||||||||||||||||||
Total Warehouse NOI | $ | 384.5 | $ | 374.6 | $ | 366.6 | $ | 381.4 | $ | 385.2 | $ | 327.0 | $ | 311.2 | $ | 298.4 | $ | 284.9 | ||||||||||||||||||
Prior Year Results: | ||||||||||||||||||||||||||||||||||||
Same Warehouse NOI | $ | 360.7 | $ | 271.0 | $ | 265.3 | $ | 259.2 | $ | 255.1 | ||||||||||||||||||||||||||
Non-Same Warehouse NOI | 24.5 | 56.0 | 45.9 | 39.2 | 29.8 | |||||||||||||||||||||||||||||||
|
|
|
|
|
|
|
|
|
| |||||||||||||||||||||||||||
Total Warehouse NOI | $ | 385.2 | $ | 327.0 | $ | 311.2 | $ | 298.4 | $ | 284.9 | ||||||||||||||||||||||||||
Same Warehouse NOI Year-over-Year Growth | (2.9 | %) | 9.0 | % | 11.0 | % | 19.0 | % | 22.5 | % |
The table below reconciles EBITDA, EBITDAre and Adjusted EBITDA to net income (loss), which is the most directly comparable financial measure calculated in accordance with GAAP, in each case for the last nine completed fiscal quarters.
2024 | 2023 | 2022 | ||||||||||||||||||||||||||||||||||
(in millions) | March 31 | December 31 | September 30 | June 30 | March 31 | December 31 | September 30 | June 30 | March 31 | |||||||||||||||||||||||||||
Net Income (Loss) | $ | (48.0 | ) | $ | (56.7 | ) | $ | (50.4 | ) | $ | (7.7 | ) | $ | 18.6 | $ | (17.7 | ) | $ | (42.5 | ) | $ | (16.8 | ) | $ | 1.0 | |||||||||||
Adjustments: | ||||||||||||||||||||||||||||||||||||
Depreciation and amortization expense | 211.1 | 203.0 | 188.1 | 187.4 | 181.2 | 167.3 | 177.0 | 167.2 | 165.7 | |||||||||||||||||||||||||||
Interest expense, net | 138.8 | 133.1 | 126.8 | 115.8 | 114.7 | 110.8 | 93.4 | 76.5 | 66.3 | |||||||||||||||||||||||||||
Income tax expense (benefit) | (9.7 | ) | (6.6 | ) | (4.0 | ) | (0.7 | ) | (2.6 | ) | 0.9 | 3.1 | 1.8 | 0.2 | ||||||||||||||||||||||
|
|
|
|
|
|
|
|
|
|
|
|
|
|
|
|
|
| |||||||||||||||||||
EBITDA | $ | 292.2 | $ | 272.8 | $ | 260.5 | $ | 294.8 | $ | 311.9 | $ | 261.3 | $ | 231.0 | $ | 228.7 | $ | 233.2 | ||||||||||||||||||
Adjustments: | ||||||||||||||||||||||||||||||||||||
Net loss (gain) on sale of real estate assets | — | 1.2 | 4.0 | 1.4 | 1.2 | 4.0 | — | — | — | |||||||||||||||||||||||||||
Impairment write-downs on real estate property | — | 0.2 | — | 1.2 | 0.3 | 0.6 | — | — | — | |||||||||||||||||||||||||||
Allocation of EBITDAre of noncontrolling interests | (0.8 | ) | (0.5 | ) | (0.2 | ) | (0.8 | ) | (0.7 | ) | (0.7 | ) | (1.8 | ) | (1.7 | ) | (1.1 | ) | ||||||||||||||||||
|
|
|
|
|
|
|
|
|
|
|
|
|
|
|
|
|
| |||||||||||||||||||
EBITDAre | $ | 291.4 | $ | 273.7 | $ | 264.3 | $ | 296.6 | $ | 312.7 | $ | 265.2 | $ | 229.2 | $ | 227.0 | $ | 232.1 | ||||||||||||||||||
Adjustments: | ||||||||||||||||||||||||||||||||||||
Net (gain) loss on sale of non-real estate assets | (0.5 | ) | 4.9 | (1.0 | ) | (0.3 | ) | (1.3 | ) | 5.6 | (0.3 | ) | (0.2 | ) | (0.3 | ) | ||||||||||||||||||||
Other nonoperating (income) expense, net | 0.7 | 0.7 | 18.7 | (0.2 | ) | 0.2 | (0.1 | ) | (1.7 | ) | (0.5 | ) | — | |||||||||||||||||||||||
Acquisition, restructuring and other | 8.7 | 22.1 | 20.3 | 15.8 | 14.7 | 13.5 | 25.8 | 13.7 | 19.3 | |||||||||||||||||||||||||||
Technology transformation | 3.4 | — | — | — | — | — | — | — | — |
144
Table of Contents
2024 | 2023 | 2022 | ||||||||||||||||||||||||||||||||||
(in millions) | March 31 | December 31 | September 30 | June 30 | March 31 | December 31 | September 30 | June 30 | March 31 | |||||||||||||||||||||||||||
Interest expense and tax expense from unconsolidated JVs | 0.3 | 0.5 | 0.7 | 0.8 | 0.9 | 0.7 | 1.3 | 0.5 | 0.5 | |||||||||||||||||||||||||||
Depreciation and amortization expense from unconsolidated JVs | 0.9 | 1.2 | 1.4 | 1.7 | 1.0 | 0.9 | 0.9 | 0.9 | 1.0 | |||||||||||||||||||||||||||
(Gain) loss on foreign currency exchange transactions, net | 10.7 | (12.5 | ) | 4.2 | 3.1 | 1.3 | (18.7 | ) | 16.2 | 28.8 | (2.5 | ) | ||||||||||||||||||||||||
Stock-based compensation expense | 4.5 | 7.4 | 7.8 | 5.8 | 4.3 | 4.1 | 6.9 | 2.0 | 3.8 | |||||||||||||||||||||||||||
(Gain) loss on extinguishment of debt | 6.5 | — | — | — | — | — | (1.4 | ) | — | — | ||||||||||||||||||||||||||
Impairment of intangible assets | — | 7.0 | — | — | — | — | — | — | — | |||||||||||||||||||||||||||
Allocation adjustments of noncontrolling interests | — | — | (0.3 | ) | — | — | (0.2 | ) | 0.4 | 0.1 | (0.1 | ) | ||||||||||||||||||||||||
|
|
|
|
|
|
|
|
|
|
|
|
|
|
|
|
|
| |||||||||||||||||||
Adjusted EBITDA | $ | 326.6 | $ | 305.0 | $ | 316.1 | $ | 323.3 | $ | 333.8 | $ | 271.0 | $ | 277.3 | $ | 272.3 | $ | 253.8 | ||||||||||||||||||
|
|
|
|
|
|
|
|
|
|
|
|
|
|
|
|
|
|
The table below reconciles FFO, Core FFO and Adjusted FFO to net income (loss), which is the most directly comparable financial measure calculated in accordance with GAAP, in each case for the last nine completed fiscal quarters.
2024 | 2023 | 2022 | ||||||||||||||||||||||||||||||||||
(in millions) | March 31 | December 31 | September 30 | June 30 | March 31 | December 31 | September 30 | June 30 | March 31 | |||||||||||||||||||||||||||
Net Income (Loss) | $ | (48.0 | ) | $ | (56.7 | ) | $ | (50.4 | ) | $ | (7.7 | ) | $ | 18.6 | $ | (17.7 | ) | $ | (42.5 | ) | $ | (16.8 | ) | $ | 1.0 | |||||||||||
Adjustments: | ||||||||||||||||||||||||||||||||||||
Real Estate depreciation | 85.3 | 85.3 | 83.0 | 76.1 | 80.1 | 70.0 | 80.7 | 69.6 | 71.3 | |||||||||||||||||||||||||||
In-place lease intangible amortization | 1.5 | 1.7 | 1.8 | 1.9 | 2.1 | 2.1 | 2.0 | 2.4 | 2.4 | |||||||||||||||||||||||||||
Net loss (gain) on sale of real estate assets | — | 1.2 | 4.0 | 1.4 | 1.2 | 4.0 | — | — | — | |||||||||||||||||||||||||||
Impairment write-downs on real estate property | — | 0.2 | — | 1.2 | 0.3 | 0.6 | — | — | — | |||||||||||||||||||||||||||
Real estate depreciation, (gain) loss on sale of real estate and real estate impairments on unconsolidated JVs | 0.6 | 0.8 | 0.8 | 1.0 | 0.8 | 0.7 | 0.8 | 0.7 | 0.7 | |||||||||||||||||||||||||||
Allocation of noncontrolling interests | (0.4 | ) | (0.6 | ) | 0.4 | 0.1 | (0.1 | ) | 0.3 | (1.5 | ) | (1.0 | ) | (0.7 | ) | |||||||||||||||||||||
|
|
|
|
|
|
|
|
|
|
|
|
|
|
|
|
|
| |||||||||||||||||||
FFO | $ | 39.0 | $ | 31.9 | $ | 39.6 | $ | 74.0 | $ | 103.0 | $ | 60.0 | $ | 39.5 | $ | 54.9 | $ | 74.7 | ||||||||||||||||||
Adjustments: | ||||||||||||||||||||||||||||||||||||
Net (gain) loss on sale of non-real estate assets | (0.5 | ) | 4.9 | (1.0 | ) | (0.3 | ) | (1.3 | ) | 5.6 | (0.3 | ) | (0.2 | ) | (0.3 | ) | ||||||||||||||||||||
Finance lease ROU asset amortization - real estate related | 17.8 | 16.9 | 17.3 | 17.9 | 17.4 | 19.0 | 17.6 | 18.6 | 18.7 | |||||||||||||||||||||||||||
Non-real estate impairment | — | — | — | — | — | — | — | — | — | |||||||||||||||||||||||||||
Impairment of intangible assets | — | 7.0 | — | — | — | — | — | — | — | |||||||||||||||||||||||||||
Other nonoperating (income) expense, net | 0.7 | 0.7 | 18.7 | (0.2 | ) | 0.2 | (0.1 | ) | (1.7 | ) | (0.5 | ) | — | |||||||||||||||||||||||
Acquisition, restructuring and other | 8.7 | 22.1 | 20.3 | 15.8 | 14.7 | 13.5 | 25.8 | 13.7 | 19.3 | |||||||||||||||||||||||||||
Technology transformation | 3.4 | — | — | — | — | — | — | — | — | |||||||||||||||||||||||||||
(Gain) loss on foreign currency transactions, net | 10.7 | (12.5 | ) | 4.2 | 3.1 | 1.3 | (18.7 | ) | 16.2 | 28.8 | (2.5 | ) | ||||||||||||||||||||||||
(Gain) loss on extinguishment of debt | 6.5 | — | — | — | — | — | (1.4 | ) | — | — |
145
Table of Contents
2024 | 2023 | 2022 | ||||||||||||||||||||||||||||||||||
(in millions) | March 31 | December 31 | September 30 | June 30 | March 31 | December 31 | September 30 | June 30 | March 31 | |||||||||||||||||||||||||||
Allocation related to unconsolidated JVs | — | — | — | — | — | — | — | — | — | |||||||||||||||||||||||||||
|
|
|
|
|
|
|
|
|
|
|
|
|
|
|
|
|
| |||||||||||||||||||
Core FFO | $ | 86.3 | $ | 71.0 | $ | 99.1 | $ | 110.3 | $ | 135.3 | $ | 79.3 | $ | 95.7 | $ | 115.3 | $ | 109.9 | ||||||||||||||||||
Adjustments: | ||||||||||||||||||||||||||||||||||||
Non-real estate depreciation and amortization | 100.0 | 91.9 | 80.3 | 86.5 | 75.8 | 72.1 | 73.5 | 73.1 | 69.7 | |||||||||||||||||||||||||||
Finance lease ROU asset amortization - non-real estate | 6.5 | 7.2 | 5.6 | 5.0 | 5.9 | 3.9 | 3.4 | 3.5 | 3.5 | |||||||||||||||||||||||||||
Amortization of deferred financing costs | 5.6 | 4.7 | 4.8 | 4.7 | 4.8 | 4.8 | 4.6 | 4.2 | 4.2 | |||||||||||||||||||||||||||
Amortization of debt discount / premium | 0.2 | 0.2 | 0.3 | 0.2 | 0.8 | (0.2 | ) | (0.2 | ) | (0.2 | ) | (0.2 | ) | |||||||||||||||||||||||
Deferred income taxes expense (benefit) | (22.9 | ) | (9.8 | ) | (16.6 | ) | (16.7 | ) | (15.0 | ) | (9.8 | ) | (23.5 | ) | (8.9 | ) | 0.6 | |||||||||||||||||||
Straight line net operating rent | (2.3 | ) | 1.8 | 2.6 | 0.9 | 1.2 | — | 0.5 | (1.3 | ) | 1.0 | |||||||||||||||||||||||||
Amortization of above market leases | 0.2 | 0.3 | 0.2 | 0.4 | 0.5 | 0.6 | 0.5 | 0.5 | 0.5 | |||||||||||||||||||||||||||
Amortization of below market leases | (0.2 | ) | (0.2 | ) | (0.3 | ) | (0.1 | ) | (0.4 | ) | (0.4 | ) | (0.3 | ) | (0.2 | ) | (0.2 | ) | ||||||||||||||||||
Stock-based compensation expense | 4.5 | 7.4 | 7.8 | 5.8 | 4.3 | 4.1 | 6.9 | 2.0 | 3.8 | |||||||||||||||||||||||||||
Recurring maintenance capital expenditures | (29.9 | ) | (88.7 | ) | (48.4 | ) | (41.2 | ) | (29.9 | ) | (54.2 | ) | (32.3 | ) | (32.6 | ) | (25.6 | ) | ||||||||||||||||||
Allocation related to unconsolidated JVs | 0.6 | 1.0 | 0.8 | 0.8 | 0.4 | (0.2 | ) | (0.1 | ) | 0.7 | — | |||||||||||||||||||||||||
Allocation of noncontrolling interests | (0.3 | ) | (0.2 | ) | (0.3 | ) | (0.1 | ) | (0.4 | ) | (0.1 | ) | — | (0.1 | ) | 0.1 | ||||||||||||||||||||
|
|
|
|
|
|
|
|
|
|
|
|
|
|
|
|
|
| |||||||||||||||||||
Adjusted FFO | $ | 148.3 | $ | 86.6 | $ | 135.9 | $ | 156.5 | $ | 183.3 | $ | 99.9 | $ | 128.7 | $ | 156.0 | $ | 167.3 | ||||||||||||||||||
|
|
|
|
|
|
|
|
|
|
|
|
|
|
|
|
|
|
The following table reflects our weighted average common shares and operating partnership units that are not owned by our company outstanding for the last nine completed fiscal quarters:
2024 | 2023 | 2022 | ||||||||||||||||||||||||||||||||||
(in millions) | March 31 | December 31 | September 30 | June 30 | March 31 | December 31 | September 30 | June 30 | March 31 | |||||||||||||||||||||||||||
Weighted average common shares | 161.9 | 162.0 | 162.0 | 162.0 | 161.6 | 157.0 | 154.7 | 149.7 | 148.4 | |||||||||||||||||||||||||||
Weighted average operating partnership units that are not owned by our company | 20.1 | 20.1 | 20.0 | 20.0 | 20.0 | 20.0 | 19.9 | 19.9 | 19.6 | |||||||||||||||||||||||||||
|
|
|
|
|
|
|
|
|
|
|
|
|
|
|
|
|
| |||||||||||||||||||
Total | 182.0 | 182.1 | 182.0 | 182.0 | 181.6 | 177.0 | 174.6 | 169.6 | 168.0 | |||||||||||||||||||||||||||
|
|
|
|
|
|
|
|
|
|
|
|
|
|
|
|
|
|
Liquidity and Capital Resources
As of March 31, 2024, we had $91.2 million of cash and cash equivalents and $1.0 billion available under our Revolving Credit Facility (net of outstanding standby letters of credit in the amount of $66.1 million, which reduce availability). We currently expect that our principal sources of funding will include:
• | current cash balances; |
• | cash flows from operations; |
• | our credit facilities; and |
• | other forms of debt financings and equity offerings. |
146
Table of Contents
Our liquidity requirements and capital commitments primarily consist of:
• | operating activities and overall working capital; |
• | capital expenditures; |
• | development and acquisition activities; |
• | capital contributions; |
• | debt service obligations; and |
• | stockholder distributions. |
As of March 31, 2024, we expect that our funding sources as noted above will be adequate to meet our short-term liquidity requirements and capital commitments for the next 12 months. On February 15, 2024, we closed on our $2.4 billion Delayed Draw Term Loan, the proceeds from which we used to repay our ICE4 CMBS loan on April 9, 2024, prior to maturity. We intend to use a portion of the net proceeds from this offering to repay the Delayed Draw Term Loan and a portion of our outstanding borrowings under the Revolving Credit Facility. See “Use of Proceeds.” Our ICE5 CMBS loan, which matures in November 2024 and as of March 31, 2024 had an outstanding principal balance of $1.3 billion, has a one year extension option that we may exercise, subject to the satisfaction of certain conditions. For more information regarding our ICE4 CMBS loan and ICE5 CMBS loan, see “—Outstanding Indebtedness—CMBS.” We expect to utilize the same sources of capital we will rely on to meet our short-term liquidity requirements to also meet our long-term liquidity requirements, which include funding our operating activities, our debt service obligations and stockholder distributions, and our future development and acquisition activities.
Dividends and Distributions
We are required to distribute at least 90% of our taxable income (excluding capital gains) on an annual basis in order to continue to qualify as a REIT for federal income tax purposes. See “Federal Income Tax Considerations—Taxation of Our Company—Annual Distribution Requirements.” Accordingly, we intend to make, but are not contractually bound to make, regular quarterly distributions to stockholders from cash flows from our operating activities. All such distributions are at the discretion of our board of directors. We consider market factors and our performance in addition to REIT requirements in determining distribution levels. Amounts accumulated for distribution to stockholders are primarily invested in interest-bearing accounts, which are consistent with our intention to maintain REIT status.
As a result of this distribution requirement, we cannot rely on retained earnings to fund our ongoing operations to the same extent that other companies which are not REITs can. We may need to continue to raise capital in the debt and equity markets to fund our working capital needs, as well as potential developments in new or existing properties or acquisitions. In addition, we may be required to use borrowings under our Revolving Credit Facility, if necessary, to meet REIT distribution requirements and maintain our REIT status.
Outstanding Indebtedness
The following table summarizes our outstanding indebtedness as of March 31, 2024 on a pro forma and actual basis (in millions):
As of March 31, | ||||||||
2024 Pro Forma | 2024 Historical | |||||||
Fixed rate | $ | 2,184.4 | $ | 2,184.4 | ||||
Variable rate—hedged | 2,500.0 | 4,844.2 | ||||||
Variable rate—unhedged (includes ICE 5—6% interest rate cap not triggered) | 1,369.0 | 2,263.5 | ||||||
|
|
|
| |||||
Total debt | $ | 6,053.4 | $ | 9,292.1 | ||||
|
|
|
|
147
Table of Contents
As of March 31, | ||||||||
2024 Pro Forma | 2024 Historical | |||||||
Percent of total debt: | ||||||||
Fixed rate | 36 | % | 24 | % | ||||
Variable rate—hedged | 41 | % | 52 | % | ||||
Variable rate—unhedged | 23 | % | 24 | % | ||||
Borrowings under Revolving Credit Facility | 1,490.5 | 2,385.0 | ||||||
Term Loan | 1,000.0 | 1,000.0 | ||||||
Senior Unsecured Notes | 1,690.2 | 1,690.2 | ||||||
CMBS Loans | 1,362.2 | 3,706.4 | ||||||
Secured mortgage debt | 473.4 | 473.4 | ||||||
Other secured debt & Equipment financing | 12.1 | 12.1 | ||||||
Other unsecured debt | 25.0 | 25.0 | ||||||
Finance lease obligations | 1,361.1 | 1,361.1 | ||||||
Failed Sale Leaseback | 74.2 | 74.2 | ||||||
Kloosterboer preference shares . | 246.6 | — | ||||||
|
|
|
| |||||
Total debt and debt-like obligations | $ | 7,735.3 | $ | 10,727.4 | ||||
|
|
|
|
The variable rate debt shown above bears interest at interest rates based on various one-month rates of which SOFR, EURIBOR and CODR are the most significant, depending on the respective agreement governing the debt, including our Revolving Credit Facility and Term Loan. As of March 31, 2024, our debt had a weighted average term to maturity of approximately 3.1 years, assuming exercise of extension options.
For further information regarding outstanding indebtedness, please see Note 10 and Note 11 to our consolidated financial statements included elsewhere in this prospectus.
Revolving Credit and Term Loan Agreement
We have entered into a $4.5 billion revolving credit and term loan agreement (the “Revolving Credit and Term Loan Agreement”), which provides for (i) a senior unsecured revolving credit facility in the aggregate principal amount of $3.5 billion (the “Revolving Credit Facility”) and (ii) a senior unsecured term loan facility that permits aggregate borrowings of up to $1.0 billion (the “Term Loan”). As of March 31, 2024, we had $2.4 billion outstanding under our Revolving Credit Facility, leaving $1.0 billion available for future borrowings (net of outstanding standby letters of credit in the amount of $66.1 million, which reduce availability), and the Term Loan was fully drawn.
Amounts borrowed under the Revolving Credit Facility bear interest, at our election, up to either 1.20% over the base rate or 2.20% over (i) for dollar-denominated loans, an adjusted Term Secured Overnight Financing Rate (“adjusted Term SOFR rate”) or (ii) for loans denominated in a foreign currency, an adjusted daily simple RFR (“adjusted Daily Simple RFR”), in each case, with step-downs based on the borrower’s total leverage ratio as defined by the Revolving Credit and Term Loan Agreement. As of March 31, 2024, the Revolving Credit Facility bore interest at 1.60% over the Term SOFR rate or adjusted Daily Simple RFR, as applicable, plus 0.10% spread adjustment. The Revolving Credit Facility is scheduled to mature on February 15, 2028, subject to two six-month extension options.
The Term Loan bears interest, at our election, up to either 1.20% over a “base rate” (as defined below) or 2.20% over an adjusted Term SOFR rate with step-downs based on the borrower’s total leverage ratio. The base rate is determined by reference to the highest of (i) the rate of interest established by the administrative agent as its “prime rate,” (ii) 0.50% above the greater of the federal funds effective rate and the overnight bank funding rate, (iii) 1.00% above the adjusted Term SOFR rate for dollar deposits with a one-month term, and (iv) 1.00% per annum. As of March 31, 2024, the Term Loan bore interest at 1.60% over the Term SOFR rate plus 0.10% spread adjustment. The Term Loan is scheduled to mature on February 15, 2029.
148
Table of Contents
The Revolving Credit Facility and the Term Loan may be voluntarily prepaid in whole or in part at any time without premium or penalty. Amounts borrowed under the Term Loan and repaid or prepaid may not be reborrowed.
The Revolving Credit and Term Loan Agreement contains covenants that, among other things, limit our ability to incur additional debt, create liens against our assets, make acquisitions, pay dividends or distributions on our stock, merge or consolidate with another entity, and transfer or sell assets. It also contains financial covenants that require us to maintain (i) a total leverage ratio of not more than 60% (or 65% for the four fiscal quarters following a material acquisition), (ii) a fixed charge coverage ratio of at least 1.5:1.0, (iii) a ratio of total unsecured indebtedness to unencumbered asset value of not more than 60% (or 65% for the four fiscal quarters following a material acquisition) and (iv) a ratio of total secured indebtedness to total asset value of not more than 40% (or 45% for the four fiscal quarters following a material acquisition). As of March 31, 2024 and December 31, 2023, we were in compliance with our covenants under the Revolving Credit and Term Loan Agreement. The Revolving Credit and Term Loan Agreement contains customary events of default, including defaults in the payment of principal, interest or fees, defaults in compliance with the covenants set forth in the Revolving Credit and Term Loan Agreement and other loan documentation, cross-defaults to certain other indebtedness, and bankruptcy and other insolvency defaults.
Delayed Draw Term Loan Agreement
We have entered into a $2.4 billion term loan agreement (the “Delayed Draw Term Loan Agreement”), which provides for a senior unsecured term loan facility (the “Delayed Draw Term Loan”). The Delayed Draw Term Loan was fully drawn on April 9, 2024. Amounts borrowed under the Delayed Draw Term Loan bear interest, at our election, up to either 1.20% over the base rate or 2.20% over the adjusted Term SOFR rate with step-downs based on the borrower’s total leverage ratio as defined by the Delayed Draw Term Loan Agreement. The Delayed Draw Term Loan is scheduled to mature on the earlier of February 14, 2025 and the maturity date of the Revolving Credit Facility, subject to an extension option. The Delayed Draw Term Loan is subject to mandatory prepayment upon the occurrence of certain issuances of equity, certain debt issuances to the extent the amount is over $100 million in the aggregate and certain asset dispositions to the extent proceeds received are over $100 million in the aggregate.
The Delayed Draw Term Loan Agreement contains covenants that, among other things, limit our ability to incur additional debt, create liens against our assets, make acquisitions, pay dividends or distributions on our stock, merge or consolidate with another entity, and transfer or sell assets. It also contains financial covenants that require us to maintain (i) a total leverage ratio of not more than 60% (or 65% for the four fiscal quarters following a material acquisition), (ii) a fixed charge coverage ratio of at least 1.5:1.0, (iii) a ratio of total unsecured indebtedness to unencumbered asset value of not more than 60% (or 65% for the four fiscal quarters following a material acquisition) and (iv) a ratio of total secured indebtedness to total asset value of not more than 40% (or 45% for the four fiscal quarters following a material acquisition). The Delayed Draw Term Loan Agreement contains customary events of default, including defaults in the payment of principal, interest or fees, defaults in compliance with the covenants set forth in the Delayed Draw Term Loan Agreement and other loan documentation, cross-defaults to certain other indebtedness, and bankruptcy and other insolvency defaults.
149
Table of Contents
Senior Unsecured Notes
The following table provides details of outstanding Senior Unsecured Notes (balances in millions):
Aggregate Principal Amount at Issuance | Stated Interest Rate(1) | Balance as of | ||||||||||||||||||||||||||
Borrowing Currency | USD | Maturity Date | March 31, 2024 | December 31, 2023 | December 31, 2022 | |||||||||||||||||||||||
Series A Senior Notes | $ | 300.0 | $ | 300.0 | August 20, 2026 | 2.22 | % | $ | 300.0 | $ | 300.0 | $ | 300.0 | |||||||||||||||
Series B Senior Notes | $ | 375.0 | 375.0 | August 20, 2028 | 2.52 | % | 375.0 | 375.0 | 375.0 | |||||||||||||||||||
Series C Senior Notes | € | 128.0 | 150.1 | August 20, 2026 | 0.89 | % | 138.2 | 141.3 | 136.6 | |||||||||||||||||||
Series D Senior Notes | € | 251.0 | 294.4 | August 20, 2031 | 1.26 | % | 270.9 | 277.0 | 268.0 | |||||||||||||||||||
Series E Senior Notes | £ | 145.0 | 200.8 | August 20, 2026 | 1.98 | % | 183.0 | 184.6 | 174.9 | |||||||||||||||||||
Series F Senior Notes | £ | 130.0 | 180.1 | August 20, 2028 | 2.13 | % | 164.1 | 165.5 | 156.8 | |||||||||||||||||||
Series G Senior Notes | € | 80.0 | 82.0 | August 20, 2027 | 3.33 | % | 86.3 | 88.3 | 85.4 | |||||||||||||||||||
Series H Senior Notes | € | 110.0 | 112.7 | August 20, 2029 | 3.54 | % | 118.7 | 121.4 | 117.4 | |||||||||||||||||||
Series I Senior Notes | € | 50.0 | 51.2 | August 20, 2032 | 3.74 | % | 54.0 | 55.2 | 53.4 | |||||||||||||||||||
|
|
|
|
|
| |||||||||||||||||||||||
Total Senior Unsecured Notes |
| $ | 1,690.2 | $ | 1,708.3 | $ | 1,667.5 | |||||||||||||||||||||
|
|
|
|
|
|
(1) | Interest on our Senior Unsecured Notes is payable semi-annually in arrears. |
The Senior Unsecured Notes are the joint and several obligations of Lineage Logistics Holdings, LLC, Lineage Logistics, LLC, certain U.S. subsidiaries that guarantee or otherwise becomes liable, as a borrower or a co-borrower or otherwise, under any of our material debt facilities and, in the case of Senior Unsecured Notes denominated in currencies other than the U.S. dollar, Lineage Treasury Europe B.V. and certain non-U.S. subsidiaries that guarantee or otherwise becomes liable, as a borrower or a co-borrower or otherwise, under any of our material debt facilities. The Senior Unsecured Notes rank pari passu with our other senior unsecure indebtedness, including the Revolving Credit Facility and the Term Loan, and are subordinated to any of the obligors’ existing and future secured debt, including indebtedness incurred under the CMBS loans.
We may prepay the Senior Unsecured Notes in full or in part, at any time, subject to notice requirements and minimum principal amount requirements, at 100% of the principal amount so prepaid, and the make-whole amount determined for the prepayment date with respect to such principal amount, and accrued interest to the date of prepayment. In the event of certain changes in tax law, Lineage Logistics, LLC or Lineage Treasury Europe B.V. may prepay the Senior Unsecured Notes at 100% of the principal amount so prepaid, and a modified make-whole amount and accrued interest to the date of prepayment. Upon a change of control or becoming subject to sanctions, Lineage Logistics, LLC must offer to prepay the entire unpaid principal amount of the Senior Unsecured Notes and accrued interest to the date of prepayment.
The note purchase agreements governing the Senior Unsecured Notes contain covenants that, among other things, limit our ability to incur additional debt, create liens against our assets, make acquisitions, pay dividends or distributions on our stock, repurchase our stock, merge or consolidate with another entity, transfer or sell assets, enter into transactions with affiliates, change our line of business, enter into negative pledges and conduct activities that would result in us being subject to sanctions or violating sanctions. The note purchase agreements also require us to maintain a total leverage ratio, unsecured leverage ratio, secured leverage ratio and fixed charge coverage ratio each quarter at the same levels as those set forth in the Revolving Credit and Term Loan Agreement. As of March 31, 2024 and December 31, 2023, we were in compliance with our covenants under the note purchase agreements. The note purchase agreements governing the Senior Unsecured Notes also contain customary events of default, including defaults in the payment of principal, interest or fees, defaults in compliance with the covenants set forth in the note purchase agreements, cross-defaults to certain other indebtedness and bankruptcy and other insolvency defaults.
CMBS
We have entered into five non-recourse commercial mortgage-backed security (“CMBS”) loans which, as of March 31, 2024, had an aggregate outstanding principal balance of $3.7 billion (before unamortized debt
150
Table of Contents
discounts). The CMBS loans are secured by mortgages on the real property and related assets and, beyond that, are non-recourse to us except for certain non-recourse carveouts that are guaranteed by Lineage Logistics Holdings, LLC. The CMBS loans are not cross-defaulted or cross-collateralized with each other, but they do provide for cross-defaults with certain material agreements like ground leases for properties that are collateral for such loans and the affiliate master leases described below. Our material CMBS loans are further described below. On February 15, 2024, we closed on a $2.4 billion delayed draw term loan, the proceeds from which we used to repay our ICE4 CMBS loan on April 9, 2024.
ICE4 CMBS Loan
This loan was senior mortgage debt that had an original principal amount of $2.35 billion and was originally secured by 64 of our properties. Lineage WA Columbia RE, LLC and certain of the subsidiaries of Lineage Mezz, LLC constituted the borrowers under this loan. The debt was divided into seven components that were securitized. We released two properties as collateral for this loan, leaving 62 of our properties as collateral for this loan and an outstanding principal balance of $2.34 billion as of March 31, 2024.
The loan was scheduled to mature mature on May 9, 2024. This loan bore interest at an annual floating rate of term SOFR plus a margin of 1.66%. This loan required monthly payments of interest only and may be voluntarily prepaid without penalty or premiums, subject to satisfaction of customary prepayment requirements. We repaid the loan in full on April 9, 2024.
This loan was secured by a first priority lien on all of the property owned by the borrowers, all of the reserve accounts established by the loan documents, the rents received by the borrowers under the ICE4 Affiliate Master Lease (as defined below) and the personal property of the borrowers. The borrowers leased the properties to Lineage Logistics, LLC, an affiliate of the borrowers, pursuant to a master lease agreement (the “ICE4 Affiliate Master Lease”). Lineage Logistics, LLC subleased certain of the properties to certain other affiliates of the borrowers.
The loan agreement contained customary events of default, including the non-payment of principal or interest, default in compliance with the covenants contained in the documents evidencing this loan and bankruptcy or other insolvency events. Under our loan agreement we had several borrower covenants, including quarterly and annual financial reporting requirements that were to be provided to the lender and certified by an officer of us. We were required to pay any taxes and other charges levied or assessed or imposed against our properties. We were required to obtain and maintain, in full force, certain insurance policies for ourselves and our properties. We were also required to be in compliance with all applicable environmental laws, except as would not materially adversely affect any of the properties, either individually or in the aggregate. Without lender consent or the satisfaction of specified conditions, we were restricted from any modification of the loan agreement or property releases or substitutions.
All rents and other amounts paid to the borrowers under the ICE4 Affiliate Master Lease were required to be deposited into an account controlled by the lender. Funds sufficient to pay the following month’s debt service and any other amounts then due and payable to the lender were required to be withheld by the lender from such account. If no Cash Sweep Event (as defined below) is continuing, any remaining balance in such account was to be delivered to the ICE4 Borrowers. During the continuance of a Cash Sweep Event, which is defined as (a) the occurrence of an event of default under the loan agreement or (b) any bankruptcy action of the borrowers, funds sufficient to pay the following month’s tax, insurance, ground rent and replacement reserve were required to be deposited into reserve accounts and the remainder will be held by lender as collateral for this loan. As of March 31, 2024, the remaining balance in such account was being delivered to the borrowers and not to such reserve accounts or to lender as collateral for this loan.
ICE5 CMBS Loan
This loan is senior mortgage debt that had an original principal amount of $1.3 billion and was originally secured by 41 of our properties. Certain of our subsidiaries constitute the borrowers under this loan. The debt has been divided into seven components that have been securitized. Of the original loan amount, $133.8 million was initially deposited into an escrow account to be released to the borrowers if additional properties were added as
151
Table of Contents
collateral for this loan following the satisfaction of certain conditions. Four of these properties were subsequently added as collateral for this loan and $111.4 million of the escrowed amount was released to the borrowers. The remaining property was not added as collateral for this loan, so the remaining $22.5 million of the escrow amount was repaid to the lender. As of March 31, 2024, 41 of our properties were collateral for this loan and the outstanding principal balance was $1.3 billion.
The loan will mature on November 9, 2024. The borrowers have an option to extend the maturity date for one year, subject to the satisfaction of certain conditions. This loan bears interest at an annual floating rate of term SOFR plus a margin of 1.97%. This loan requires monthly payments of interest only and may be voluntarily prepaid without penalty or premiums, subject to satisfaction of customary prepayment requirements.
This loan is secured by a first priority lien on all of the property owned by the borrowers, all of the reserve accounts established by the loan documents, the rents received by the borrowers under the ICE5 Affiliate Master Leases (as defined below) and under leases for the one property that is not subject to any of the ICE5 Affiliate Master Leases (the “Bartlett Property”) and the personal property of the borrowers. The borrowers have leased all of the properties (other than the Bartlett Property) to certain affiliates of the borrowers pursuant to multiple master lease agreements (collectively, the “ICE5 Affiliate Master Leases”). Such affiliate tenants have subleased certain of the properties to certain other affiliates of the borrowers.
The loan agreement contains customary events of default, including the non-payment of principal or interest, default in compliance with the covenants contained in the documents evidencing this loan and bankruptcy or other insolvency events. Under our loan agreement we have a number of borrower covenants, including quarterly and annual financial reporting requirements that are to be provided to the lender and certified by an officer of us. We are required to pay any taxes and other charges levied or assessed or imposed against our properties. We are required to obtain and maintain, in full force, certain insurance policies for ourselves and our properties. We are also required to be in compliance with all applicable environmental laws, except as would not materially adversely affect any of the properties, either individually or in the aggregate. Without lender consent or the satisfaction of specified conditions, we are restricted from any modification of the loan agreement or property releases or substitutions.
All rents and other amounts paid to the borrowers under the ICE5 Affiliate Master Leases must be deposited into an account controlled by the lender. Upon the occurrence and during the continuance of a Cash Sweep Event (as defined below), all rents and other amounts paid to the borrowers under leases relating to the Bartlett Property must be deposited into such account controlled by lender. Funds sufficient to pay the following month’s debt service and any other amounts then due and payable to the lender shall be withheld by the lender from such account. If no Cash Sweep Event is continuing, any remaining balance in such account will be delivered to the borrowers. During the continuance of a Cash Sweep Event, which is defined as (a) the occurrence of an event of default under the loan agreement or (b) any bankruptcy action of the borrowers, funds sufficient to pay the following month’s tax, insurance, ground rent and replacement reserve shall be deposited into reserve accounts and the remainder will be held by lender as collateral for this loan. As of March 31, 2024, the remaining balance in such account was being delivered to the borrowers and not to such reserve accounts or to lender as collateral for this loan.
Security Interests in Customers’ Products
By operation of law and in accordance with our warehouse customer contracts (other than leases), we typically receive warehouseman’s liens on products held in our warehouses to secure customer payments. Such liens typically permit us to take control of the products and sell them to third parties in order to recover any monies receivable on a delinquent account, but such products may be perishable or otherwise not available to us for re-sale.
Our credit loss expense relating to customer receivables was $0.9 million and $0.8 million for the three months ended March 31, 2024 and 2023, respectively. For the years ended December 31, 2023, 2022 and 2021, our credit loss expense was $6.2 million, $4.6 million and $4.7 million, respectively. As of March 31, 2024 and December 31, 2023, we maintained allowances for uncollectible balances of approximately $8.0 million and $7.1 million, respectively, which we believed to be adequate.
152
Table of Contents
Maintenance Capital Expenditures and Repair and Maintenance Expenses
Lineage prides itself on maintaining its facilities, fleet and railcars at a high standard. We regularly update long-range maintenance plans by asset to ensure that our assets maintain the high quality and operational efficiency that our customers expect from us.
Maintenance Capital Expenditures
Maintenance capital expenditures are capitalized funds used to maintain assets that will result in an extended useful life. This includes the cost to purchase and install, repair or construct assets when it results in a useful life longer than one year and the installed cost per asset is over a de minimis threshold. Maintenance capital expenditures are related to both our global warehousing segment and global integrated solutions segment, including information technology, and are all, in management’s judgment, recurring in nature. These expenditures include maintenance performed multiple times over the lifetime of the facility or asset such as replacing or repairing roofs, refrigeration systems, racking, material handling equipment and fleet. These expenditures also include information technology maintenance to existing servers, equipment and software.
The following table sets forth our recurring maintenance capital expenditures for the three months ended March 31, 2024 and 2023, and for the years ended December 31, 2023, 2022 and 2021.
Three months ended March 31, | Year ended December 31, | |||||||||||||||||||
2024 | 2023 | 2023 | 2022 | 2021 | ||||||||||||||||
(In millions, except per cubic foot amounts) | ||||||||||||||||||||
Global warehousing | $ | 20.4 | $ | 22.8 | $ | 143.9 | $ | 106.5 | $ | 92.9 | ||||||||||
Global integrated solutions | 4.7 | 4.5 | 27.3 | 23.9 | 8.4 | |||||||||||||||
Information technology and other | 4.8 | 2.6 | 37.4 | 15.4 | 13.3 | |||||||||||||||
|
|
|
|
|
|
|
|
|
| |||||||||||
Maintenance capital expenditures | $ | 29.9 | 29.9 | $ | 208.6 | $ | 145.8 | $ | 114.6 | |||||||||||
|
|
|
|
|
|
|
|
|
| |||||||||||
Global warehousing maintenance capital expenditures per cubic foot | $ | 0.01 | $ | 0.01 | $ | 0.05 | $ | 0.04 | $ | 0.04 |
Repair and Maintenance Expenses
Repair and maintenance expenses are incurred when assets need repair or replacement and do not qualify as capital expenditures. If the work does not materially extend the useful life of the asset or the asset value is less than a de minimis threshold, it would be booked as an operating expense under repair and maintenance expenses. Examples include ordinary repairs on roofs, racking, refrigeration and material handling equipment. Project related expenses are excluded.
The following table sets forth our repair and maintenance expenses for the three months ended March 31, 2024 and 2023, and for the years ended December 31, 2023, 2022 and 2021.
Three months ended March 31, | Year ended December 31, | |||||||||||||||||||
2024 | 2023 | 2023 | 2022 | 2021 | ||||||||||||||||
(In millions, except per cubic foot amounts) | ||||||||||||||||||||
Global warehousing | $ | 33.1 | $ | 33.1 | $ | 141.0 | $ | 111.3 | $ | 80.8 | ||||||||||
Global integrated solutions | 14.0 | 13.4 | 58.5 | $ | 46.5 | $ | 22.0 | |||||||||||||
|
|
|
|
|
|
|
|
|
| |||||||||||
Repair and maintenance expenses | $ | 47.1 | $ | 46.5 | $ | 199.5 | $ | 157.8 | $ | 102.8 | ||||||||||
|
|
|
|
|
|
|
|
|
| |||||||||||
Global warehousing repair and maintenance expenses per cubic foot | $ | 0.01 | 0.01 | $ | 0.05 | $ | 0.04 | $ | 0.03 |
Integration Capital Expenditures
Integration capital expenditures are capitalized funds related to integrating acquired assets and businesses. Integration capital expenditures are one-time expenditures exceeding a de minimis threshold. These are typically
153
Table of Contents
acquisition-related costs, including maintenance on acquired assets that are beyond their useful life at the time of acquisition, rebranding expenditures and information technology expenditures to standardize system usage across our business, and also include certain non-acquisition-related costs, including safety and compliance projects to comply with any applicable policies, laws or codes such as installation of site security or a new fire suppression system, as well as freon to ammonia conversions.
The following table sets forth our integration capital expenditures for each of the three months ended March 31, 2024 and 2023, and for the years ended December 31, 2023, 2022 and 2021.
Three months ended March 31, | Year ended December 31, | |||||||||||||||||||
2024 | 2023 | 2023 | 2022 | 2021 | ||||||||||||||||
(In millions) | ||||||||||||||||||||
Global warehousing | $ | 8.3 | $ | 4.4 | $ | 42.0 | $ | 32.8 | $ | 28.0 | ||||||||||
Global integrated solutions | 0.4 | 4.9 | 20.6 | 4.1 | 1.1 | |||||||||||||||
Information technology and other | 8.6 | 6.7 | 12.0 | 14.6 | 5.8 | |||||||||||||||
|
|
|
|
|
|
|
|
|
| |||||||||||
Integration capital expenditures | $ | 17.3 | 16.0 | $ | 74.6 | $ | 51.5 | $ | 34.9 | |||||||||||
|
|
|
|
|
|
|
|
|
|
External Growth Capital Investments
External growth capital investments include acquisitions, greenfield projects and expansion initiatives, information technology platform enhancements and other capital projects which result in an economic return. We divide growth projects into the following categories:
• | Acquisitions: The purchase of an external company or facility. Also includes the purchase of the real estate of facilities we currently lease. |
• | Greenfields and Expansions: Projects either to build a new facility including the purchase of land, or to increase the size of an existing warehouse (as measured by cubic feet). The cost associated with construction and materials are included. |
• | Energy and Economic Return: Energy return projects are intended to increase energy efficiency by decreasing the amount of kWh or fossil fuels consumed or reducing the cost to procure energy. Common examples include installing new LED technology, installing solar panels at a warehouse and electrification of transportation fleet. Economic return projects require an investment of capital for a future cash flow and/or NOI benefit that is not an acquisition, greenfield, expansion or energy project. Examples include addition of blast cells, racking replacement, re-rack for additional pallet positions, replacing freezer doors, purchasing compressors, buying out leased equipment and purchasing new rail cars. |
The following table sets forth our external growth capital investments for the three months ended March 31, 2024 and 2023, and for the years ended December 31, 2023, 2022 and 2021.
Three months ended March 31, | Year ended December 31, | |||||||||||||||||||
2024 | 2023 | 2023 | 2022 | 2021 | ||||||||||||||||
(In millions) | ||||||||||||||||||||
Acquisitions, including equity issued and net of cash acquired and adjustments | $ | 58.9 | $ | — | $ | 276.0 | $ | 1,686.0 | $ | 2,911.9 | ||||||||||
Asset acquisitions | — | 13.1 | 13.1 | 49.8 | 217.6 | |||||||||||||||
Greenfield and expansion expenditures | 35.6 | 93.8 | 266.7 | 370.7 | 349.4 | |||||||||||||||
Energy and economic return initiatives | 22.1 | 39.5 | 109.7 | 219.9 | 64.4 | |||||||||||||||
Information technology transformation and growth initiatives | 11.8 | 17.1 | 75.0 | 81.4 | 69.7 | |||||||||||||||
|
|
|
|
|
|
|
|
|
| |||||||||||
Total | $ | 128.4 | $ | 163.5 | $ | 740.5 | $ | 2,407.8 | $ | 3,613.0 | ||||||||||
|
|
|
|
|
|
|
|
|
|
154
Table of Contents
We completed one acquisition in each of the three months ended March 31, 2024 and 2023. During the three months ended March 31, 2023, this included the acquisition of one property qualifying as an asset acquisition under FASB ASC, Topic 805, Business Combinations. During the years ended December 31, 2023, 2022 and 2021 we completed six, 12 and 25 acquisitions, respectively, including the acquisition of one property, one property and eight properties, respectively, qualifying as asset acquisitions under FASB ASC, Topic 805, Business Combinations. Refer to Note 4 of the consolidated financial statements included elsewhere in this prospectus for details of the purchase price allocation for each acquisition.
The greenfield and expansion expenditures of $35.6 million during the three months ended March 31, 2024 relate primarily to projects that remain under construction as of March 31, 2024. The greenfield and expansion expenditures of $93.8 million during the three months ended March 31, 2023 related primarily to projects that were completed in 2023 or are expected to be completed in 2024. The greenfield and expansion expenditures of $266.7 million during the year ended December 31, 2023 related primarily to projects that were completed in 2023 or subsequently in 2024. The greenfield and expansion expenditures of $370.7 million during the year ended December 31, 2022 relate primarily to projects that were completed in 2022 or subsequently in 2023, in addition to projects that remained under construction as of December 31, 2023.
Energy and economic return initiatives include $22.1 million and $39.5 million of corporate initiatives and smaller customer driven growth projects incurred during the three months ended March 31, 2024 and 2023, respectively. For the years ended December 31, 2023, 2022 and 2021, we invested $109.7 million, $219.9 million and $64.4 million in these initiatives, respectively.
In implementing and developing new IT systems globally, we invested $11.8 million and $17.1 million during the three months ended March 31, 2024 and 2023, respectively. For the years ended December 31, 2023, 2022 and 2021, we invested $75.0 million, $81.4 million and $69.7 million in these initiatives, respectively.
Historical Cash Flows
The following summary discussion of our cash flows is based on the Consolidated Statements of Cash Flows and is not meant to be an all-inclusive discussion of the changes in our cash flows for the periods presented below.
Three months ended March 31, | Year ended December 31, | |||||||||||||||||||
2024 | 2023 | 2023 | 2022 | 2021 | ||||||||||||||||
(In millions) | ||||||||||||||||||||
Net cash provided by operating activities | $ | 105.3 | $ | 107.5 | $ | 795.1 | $ | 500.9 | $ | 329.9 | ||||||||||
Net cash used in investing activities | $ | (202.4 | ) | $ | (252.5 | ) | $ | (1,065.4 | ) | $ | (2,368.8 | ) | $ | (3,413.5 | ) | |||||
Net cash provided by financing activities | $ | 121.2 | $ | 145.3 | $ | 136.2 | $ | 1,840.2 | $ | 3,027.4 |
We have finance leases for real estate, most significantly warehouses for use in operations, as well as equipment for use within owned and leased warehouses. The following is a summary of the historical cash flows related to these leases:
Three months ended March 31, | Year ended December 31, | |||||||||||||||||||
2024 | 2023 | 2023 | 2022 | 2021 | ||||||||||||||||
(In millions) | ||||||||||||||||||||
Operating cash flows from finance leases | $ | 22.0 | $ | 22.0 | $ | 89.9 | $ | 93.7 | $ | 97.6 | ||||||||||
Finance cash flows from finance leases | $ | 13.6 | $ | 10.4 | $ | 55.3 | $ | 49.5 | $ | 45.8 | ||||||||||
Operating cash flows from operating leases | $ | 22.6 | $ | 23.5 | $ | 92.4 | $ | 93.7 | $ | 85.2 |
Operating cash flows from finance leases relate to interest expense on the corresponding finance lease obligations. Finance cash flows relate to principal payments.
155
Table of Contents
Operating Activities
For the three months ended March 31, 2024, our net cash provided by operating activities was $105.3 million, a decrease of $2.2 million, or 2%, compared to $107.5 million for the three months ended March 31, 2023. The decrease was primarily due to an unfavorable reduction in net income (loss) adjusted for non-cash items, offset by net favorable changes in working capital, most significantly in accounts receivable.
For the year ended December 31, 2023, our net cash provided by operating activities was $795.1 million, an increase of $294.2 million, or 59%, compared to $500.9 million for the year ended December 31, 2022. The increase was primarily due to net favorable changes in working capital, most significantly in accounts receivable. In addition, there was a favorable reduction in net loss adjusted for non-cash items.
For the year ended December 31, 2022, our net cash provided by operating activities was $500.9 million, an increase of $171.0 million, or 52%, compared to $329.9 million for the year ended December 31, 2021. The increase was primarily due to a reduction in net loss adjusted for non-cash items. Within working capital, unfavorable increases in accounts receivable were mostly offset by favorable increases in accounts payable, accrued liabilities and deferred revenue. The changes in working capital were primarily due to acquisitions and organic growth.
Investing Activities
For the three months ended March 31, 2024, cash used for investing activities was $202.4 million. This was primarily driven by $147.5 million in additions to property, plant, and equipment, primarily for growth capital expenditures. In addition, we invested $58.9 million in business combinations, primarily driven by the completion of the acquisition of Entrepôt du Nord Inc.
For the three months ended March 31, 2023, cash used for investing activities was $252.5 million. This was primarily driven by $228.7 million in additions to property, plant, and equipment, primarily for growth capital expenditures. In addition, we invested $13.1 million in a real estate acquisition in Christchurch, New Zealand.
For the year ended December 31, 2023, cash used for investing activities was $1,065.4 million. This was primarily driven by $765.8 million in additions to property, plant, and equipment, primarily for growth capital expenditures. In addition, we invested $269.6 million in business combinations and $13.1 million in a real estate acquisition in Christchurch, New Zealand. We completed several acquisitions in 2023, with the most significant cash investments being in the business combinations of Burris and NOVA Coldstore.
For the year ended December 31, 2022, cash used for investing activities was $2,368.8 million. This was primarily driven by $1,589.8 million for business combinations and $49.8 million for a real estate acquisition in Logan Township, New Jersey. We completed several acquisitions in 2022, with the most significant cash investments being in the business combinations of VersaCold, MTC Logistics, Turvo, and Mandai Link Logistics. In addition, we invested $812.9 million in additions to property, plant, and equipment, primarily for growth capital expenditures. This was partially offset by cash proceeds of $92.9 million related to prior year deposits which were utilized in acquisitions which closed in 2022.
For the year ended December 31, 2021, cash used for investing activities was $3,413.5 million. This was primarily driven by $2,459.5 million for business combinations and $217.6 million for real estate acquisitions, most significantly in Savannah, Georgia and Elizabeth, New Jersey. We completed several business combinations in 2021, with the most significant cash investments being in the business combinations of Kloosterboer, Claus Sorenson, Kenyon Zero Storage, Joliet Cold Storage and Bolingbrook Cold Storage, Hanson Cold Storage, UTI Holding B.V., and Midwest Refrigerated Services. In addition, we invested $689.1 million in additions to property, plant and equipment, primarily for growth capital expenditures. There was also $96.8 million used for deposits on acquisitions which were pending as of December 31, 2021. This was partially offset by cash proceeds of $45.4 million from the sale of Latin American subsidiaries.
156
Table of Contents
Refer to Note 4 to our consolidated financial statements included elsewhere in this prospectus for more information regarding business combinations and asset acquisitions.
Financing Activities
Our net cash provided by financing activities was $121.2 million for the three months ended March 31, 2024. Cash provided by financing activities during 2024 was primarily driven by $1,205.9 million of net borrowings on revolving credit lines, partially offset net outflows of $890.8 million for net repayments of long-term debt and finance leases, $111.4 million for distributions, $44.2 million for financing fees and $25.0 million for redemption of common stock.
Our net cash provided by financing activities was $145.3 million for the three months ended March 31, 2023. Cash provided by financing activities during 2023 was primarily driven by $143.2 million of capital contributions and $60.3 million of net borrowings on revolving credit lines. This was partially offset by outflows of $25.3 million for repayments of long-term debt and finance leases, $11.0 million for distributions, $9.7 million for redemption of units issued as stock compensation and $3.3 million for redemption of common stock.
Our net cash provided by financing activities was $136.2 million for the year ended December 31, 2023. Cash provided by financing activities during 2023 was primarily driven by $214.3 million of net borrowings on revolving credit lines and $144.8 million of capital contributions. This was partially offset by outflows of $95.5 million for repayments of long-term debt and finance leases, $46.5 million for distributions, and $35.6 million for payment of deferred and contingent consideration liabilities.
Our net cash provided by financing activities was $1,840.2 million for the year ended December 31, 2022. Cash provided by financing activities during 2022 was primarily driven by $944.2 million of capital contributions, $843.2 million net proceeds from long term debt and finance leases, and $313.1 million of net borrowing on revolving credit lines. This was partially offset by outflows of $179.7 million for distributions to stockholders and noncontrolling interests, $55.7 million for partial redemption of convertible redeemable noncontrolling interests, $8.8 million for deferred financing fees, and $8.4 million redemption of stock compensation.
Our net cash provided by financing activities was $3,027.4 million for the year ended December 31, 2021. Cash provided by financing activities during 2021 consisted of $2,359.5 million of capital contributions, $962.5 million net proceeds from long term debt and finance leases, $237.0 million of net borrowings on revolving credit lines. This was partially offset by outflows of $275.9 million, for redemption of noncontrolling interests, $199.4 million for distributions to stockholders and noncontrolling interests, $39.6 million redemption of stock compensation, and $15.7 million for deferred financing fees.
Off-Balance Sheet Arrangements
As of March 31, 2024 and December 31, 2023, we had no material off-balance sheet arrangements that have or are reasonably likely to have a current or future material effect on our financial condition, changes in financial condition, revenues or expenses, results of operations, liquidity, capital expenditures or capital resources.
Inflation
As discussed in greater detail above, where possible, our warehouse contracts contain provisions designed to mitigate the adverse impact of inflation in operational costs such as wages, power and warehouse supplies, and generally include rate escalation provisions. Additionally, our warehouse contracts typically provide us with the ability to adjust rates for material increases in power, property taxes, property insurance and regulatory imposed costs to the extent such increases are outside the escalation provisions. For our customers on month-to-month warehouse contracts, we generally have the ability to adjust our rates upon 30 days’ advance notice in order to compensate for changes in our costs of providing storage and handling services.
157
Table of Contents
Critical Accounting Policies and Estimates
The consolidated financial statements have been prepared in accordance with U.S. GAAP, which requires management to make estimates, assumptions, and judgments in certain circumstances that affect the reported amounts of assets, liabilities, and contingencies as of the date of the financial statements and the reported amounts of revenues and expenses during the reporting periods. We base our estimates on historical experience and on various other assumptions that we believe to be most appropriate and reasonable. Actual results may differ from these estimates under different assumptions or conditions. Refer to Note 1 to the consolidated financial statements for our significant accounting policies. The following discussion pertains to accounting policies management believes are most critical to the portrayal of our historical financial condition and results of operations and that require a material level of subjectivity or judgement and relate to inherently highly uncertain matters.
Impairment of long-lived assets and finite lived intangible assets
We evaluate long-lived assets and finite lived intangible assets for impairment when events or changes in circumstances indicate that the carrying value of such assets may not be recoverable or when the assets are held for sale. Asset groups are evaluated at the level of the smallest identifiable group of assets that generate cash inflows that are largely dependent on the cash inflows from other assets and liabilities. Our asset groups are generally defined as individual facilities or warehouses. Triggering events include material adverse changes in projected revenues or operating performance measures, a pattern of net losses, significant relevant negative industry trends, internal plans to dispose of an asset group, significant deterioration in the condition of the asset, and an identified impairment of related goodwill or other non-amortizable intangible assets.
Upon the occurrence of a triggering event, we assess whether the estimated undiscounted cash flows expected from the use of the asset and the residual value from the ultimate disposal of the asset exceed the carrying value. If the undiscounted cash flows are less than the carrying value of the asset, its fair value is measured relying primarily on a discounted cash flow method. If the carrying value exceeds the fair value, we reduce the carrying value to fair value and records an impairment loss in earnings. When an impairment loss is recognized for assets to be held and used, the adjusted carrying amounts of those assets are depreciated over their remaining useful life. Impairments of long-lived assets were $1.7 million, $0.6 million, and $7.1 million for the years ended December 31, 2023, 2022, and 2021, respectively. There were no impairments of finite lived intangible assets in 2023, 2022, or 2021.
Undiscounted cash flows expected from the use of assets and the residual value are estimated based on our judgement using industry experience and knowledge of historical transactions and operations. Fair values are estimated using discounting based on the applicable weighted average cost of capital, independent appraisals, quotes, or expected sales prices, as applicable. Changes in market conditions, the economic environment, and other factors can significantly impact these estimates.
Business combinations
We account for business combinations using the acquisition method of accounting, which requires, among other things, allocation of the fair value of purchase consideration to the tangible and intangible assets acquired and liabilities assumed at their estimated fair values on the acquisition date in accordance with ASC 805, “Business Combinations”. The excess of the fair value of purchase price consideration over the values of these identifiable assets and liabilities is recorded as goodwill. Goodwill is assigned to each reporting unit based upon the relative fair value of the underlying business operations.
When determining the fair values of assets acquired and liabilities assumed, management makes significant estimates and assumptions, especially with respect to real estate and intangible assets. Significant estimates used in valuing intangible assets acquired in a business combination include, but are not limited to, revenue growth rates, obsolescence, customer attrition rates, operating costs and margins, capital expenditures, tax rates, long-term growth rates and discount rates. The income approach is applied, specifically by using one of the following valuation techniques: the relief from royalty method, the multi excess earnings method, or the with-and-without method.
158
Table of Contents
Significant estimates used in valuing land and buildings and improvements acquired in a business combination include, but are not limited to, the selection of comparable real estate sales, estimates of indirect costs, and entrepreneurial profit, which are added to the replacement cost of the acquired assets in order to estimate their fair market value.
With respect to our 2021 acquisition of Kloosterboer Group B.V. and its subsidiaries, Preference Shares issued in connection with the transaction were measured and recorded at fair value upon initial recognition. The valuation technique used was a combination of the income approach and the Black-Scholes Model. Key assumptions include the timing of a conversion event, expected conversion price, volatility, risk-free rate, expected dividend yield, and a market-based discount rate, which was determined based on our cost of borrowing as of the acquisitions date, including a credit risk adjustment for comparable unsecured debt instruments in the market.
Goodwill and other indefinite lived intangible assets
We evaluate the carrying value of goodwill and other intangible assets annually as of October 1 or when events occur or circumstances change that would more likely than not indicate an impairment exists.
Goodwill
We determined our reporting units by identifying components of each operating segment, which are Global Warehousing and Global Integrated Solutions, and assessing these components to determine if they meet the definition of a reporting unit and whether they have similar economic characteristics that would make their aggregation appropriate. In the first quarter of 2023, we identified a change in our reporting structure, which resulted in a change in our reporting units. This represents a change in accounting estimate, for which we accounted for prospectively in 2023, reallocating carrying values of goodwill to the new reporting units using relative fair values.
Fair values of our reporting units are estimated using a combination of equally weighted income approach and market approach. The income approach is based on discounted future cash flows and requires key assumptions, including the following:
• | Future revenue growth: we estimated future growth based on industry forecasts, historical results, and existing long-term contracts. |
• | Operating costs and profitability: we estimated future operating costs based on industry forecasts, historical results, operational focus of management, and market energy cost projections. |
• | Capital requirements: we estimated future capital requirements based on current planned expansions, appropriation requests, and projected growth of existing operations included in the estimate of future revenue growth. |
• | Discount rates: we utilized a weighted average cost of capital (WACC) that considers the cost of capital and cost of debt, with inputs such as risk premiums, relevant comparable public companies’ debt and capital metrics, tax rates, risk-free interest rates, and other assumptions. |
The market approach is based on market EBITDA (defines as earnings before interest, taxes, depreciation, and amortization) multiples and requires judgement in selection of comparable companies and appropriate multiples.
Goodwill is tested for impairment by assessing qualitative factors to determine whether the existence of events or circumstances leads to a determination that it is more likely than not that the fair value of the reporting unit is less than its carrying amount. Qualitative factors assessed include reporting units’ financial performance as compared to budget, macroeconomic conditions, labor and energy cost trends, growth in pricing of our capital raises, and other events and trends impacting fair values of our reporting units. If, after assessing the totality of events or circumstances, or based on management’s judgment, we determine it is more likely than not the fair value of a reporting unit is less than its carrying amount, a quantitative impairment test is performed.
159
Table of Contents
In 2023, we utilized the fair values calculated as of the first quarter of 2023 for the allocation of goodwill to assess the goodwill for impairment after the change in our reporting structure. Carrying value of each reporting unit includes assets and liabilities attributable to its business operations and allocated goodwill. Based on a comparison of the fair values to carrying values, we determined that it was more likely than not the fair values of its reporting units exceeded their carrying values. At our annual impairment testing date of October 1, 2023, we assessed qualitative factors to determine whether events or circumstances indicate that the fair values of its reporting units have deteriorated since the first quarter to the fourth quarter. No such indicators were identified. During the fourth quarter of 2022 and 2021, we tested goodwill for impairment by assessing qualitative factors, concluding that impairment of goodwill was not more likely than not in any of its reporting units and no further quantitative analysis was performed.
Other indefinite-lived intangible assets
Intangible assets with indefinite lives are reviewed for impairment when events or changes in circumstances indicate that the carrying amount may not be recoverable. Indefinite-lived intangibles are tested at least annually in the fourth quarter at the individual asset level. Qualitative factors assessed include financial performance of the related business as compared to budget, macroeconomic conditions, labor and energy cost trends, and our plans regarding continued use of the intangible asset. If qualitative factors indicate that an impairment is likely, a quantitative test is performed, which consists of a comparison of the fair value of the asset to its carrying value as of the impairment testing date. In 2022 and 2021, no adverse qualitative factors were identified and determined to be indicative of an impairment.
In the fourth quarter of 2023, the decision was made to phase out the use of our indefinite-lived trade name. This was determined to be a triggering event. We estimated the fair value of the trade name using the income approach, which is based on discounted future cash flows and requires key assumptions, including the following:
• | Future revenue growth: we estimated future growth based on industry forecasts, historical results, and existing contracts. |
• | Royalty rate: we estimated the royalty rate based on comparable license agreements. |
• | Discount rates: we utilized a weighted average cost of capital (WACC) that considers the cost of capital and cost of debt, with inputs such as risk premiums, relevant comparable public companies’ debt and capital metrics, tax rates, risk-free interest rates, and other assumptions. |
• | Remaining useful life: we estimated the useful life based on our planned phase-out period for the use of the trade name. |
We compared the estimated fair value of the trade name to its carrying value and recorded an impairment loss of $7.0 million to write down the asset to its fair value. The remaining value of the trade name was reclassified to definite-lived and is amortized over the remaining useful life.
New Accounting Pronouncements
Refer to Note 1 to our consolidated financial statements included elsewhere in this prospectus for more information regarding applicable new accounting pronouncements.
Quantitative and Qualitative Disclosures About Market Risk
Interest Rate Risk
Our future income and cash flows relevant to financial instruments are dependent upon prevalent market interest rates. Market risk refers to the risk of loss from adverse changes in market prices and interest rates.
As of December 31, 2023, we had $3,080 million of variable-rate debt under our revolver and term loan agreement bearing interest at 5.12%, plus a margin of up to 1.60%. We have entered into interest rate hedges to
160
Table of Contents
effectively lock in the floating rates on $3,000 million of our variable-rate debt at a weighted average rate of 1.16% plus a margin of 160 basis points, including swapping a total of $1.0 billion of borrowings under the Term Loan to a weighted average fixed interest rate of 0.49% plus a margin of 160 basis points through maturity, with $3.0 billion gradually reducing to $1.5 billion by 2025. As a result, our exposure to changes in interest rates as of December 31, 2023 consists mainly of our $1,298 million of borrowings under our CMBS ICE5, which does have a 6% interest rate cap that as of December 31, 2023 was untriggered. As of December 31, 2023, one-month term and daily SOFR was approximately 5.3%, therefore a 100 basis point increase in market interest rates would result in an increase in interest expense to service our variable-rate debt of approximately $11.0 million. A 100 basis point decrease in market interest rates would result in a decrease in interest of approximately $30.0 million.
As of March 31, 2024, we had $3,385 million of variable-rate debt under our revolver and term loan agreement bearing interest at 5.19%, plus a margin of up to 1.60%. We have entered into interest rate hedges to effectively lock in the floating rates on $2,500 million of our variable-rate debt at a weighted average rate of 1.40% plus a margin of 160 basis points, including swapping a total of $1.0 billion of borrowings under the Term Loan to a weighted average fixed interest rate of 0.49% plus a margin of 160 basis points through maturity, with $2.5 billion gradually reducing to $1.5 billion by 2025. As a result, our exposure to changes in interest rates as of March 31, 2024 consists mainly of our $1,298 million of borrowings under our CMBS ICE5, which does have a 6% interest rate cap that as of March 31, 2024 was untriggered. As of March 31, 2024, one-month term and daily SOFR was approximately 5.3%, therefore a 100 basis point increase in market interest rates would result in an increase in interest expense to service our variable-rate debt of approximately $18.0 million. A 100 basis point decrease in market interest rates would result in a decrease in interest of approximately $38.0 million.
Foreign Currency Risk
We are exposed to foreign currency exchange variability related to investments in and earnings from our foreign subsidiaries, as the revenues and expenses of these subsidiaries are typically generated in the currencies of the countries in which they operate. Foreign currency market risk is the possibility that our results of operations or financial position could be better or worse than planned because of changes in foreign currency exchange rates. When the local currencies in these countries decline relative to our reporting currency, the U.S. dollar, our consolidated revenues, NOI margins and net investment in properties and operations outside the United States decrease. The impact of currency fluctuations on our earnings is partially mitigated by the fact that most operating and other expenses are also incurred and paid in the local currency. The impact of devaluation or depreciating currency on an entity depends on the residual effect on the local economy and the ability of an entity to raise prices and/or reduce expenses. Due to our constantly changing currency exposure and the potential substantial volatility of currency exchange rates, we cannot predict the effect of exchange rate fluctuations on our business. As a result, changes in the relation of the currency of our international operations to U.S. dollars may also affect the book value of our assets and the amount of total equity. A hypothetical 10% depreciation in the U.S. dollar relative to the year-end functional currencies of our foreign subsidiaries, would have resulted in a reduction in our total equity of approximately $330 million as of December 31, 2023.
Gains or losses from translating the financial statements of our foreign subsidiaries are reflected in the accumulated other comprehensive income (loss) component of equity within our consolidated financial statements included in this prospectus.
We enter into foreign currency derivative instruments to manage our exposure to fluctuations in exchange rates between the functional currencies of our subsidiaries and the currencies of the underlying cash flows. All derivatives are recognized on the consolidated balance sheet at fair value.
161
Table of Contents
The following is a market report prepared by CBRE, dated April 26, 2024. Such information is included in this prospectus in reliance on CBRE’s authority as an expert on such matters. Any forecasts prepared by CBRE are based on data (including third party data), models and experience of various professionals and are based on various assumptions with respect to conditions that may exist or events that may occur in the future. While CBRE believes these assumptions to be reasonable for the purpose of the market report, they are dependent upon future events and subject to change without notice, and thus actual conditions may well differ from those assumed. No representations are made or intended, nor should any be inferred, with respect to the likely existence of a particular future set of facts or circumstances.
Introduction
“Cold storage” refers to temperature-controlled warehouses that enable secure storage and handling of goods that require (or benefit from) refrigeration or freezing, most notably food products. Cold storage properties make up a small but high-growth subset of overall industrial real estate and are a critical component of the global food supply chain. Insufficient access to facilities with effective temperature and humidity control is the primary driver of the estimated one billion metric tons of global food waste per year (per the U.S. Environmental Protection Agency). Growth and efficiency gains in the global cold chain have the potential to generate substantial nutritional, environmental, and economic benefits, making cold storage real estate and related operations increasingly valuable as the global population continues to become larger and more urban. Today, global cold storage capacity is estimated to be approximately 25-30 billion cubic feet, and market researchers broadly expect the industry is on a trajectory to expand in both capacity and revenue generation as demand rises for temperature-controlled products and modern facilities to house them.
What is Cold Storage?
Cold storage properties have various configurations of cooler, freezer, and non-refrigerated (“dry”) storage space. Space configurations are highly correlated with different warehouse operating models and can also depend on factors such as building age, location, and whether the property was purpose-built or retrofitted. Facilities that have the capability to store goods at all three temperature ranges may be referred to as “tri-temp,” though this term generally refers to facilities where dry storage makes up a significant portion of the total footprint.
Although most cold storage capacity is devoted to food for human consumption, other common temperature-controlled goods include pharmaceutical products and vaccines, blood and other biological samples, pet food, and certain chemicals and other raw materials. Regardless of commodity type, the roles of cold storage are to allow for consistent supply by preserving shelf-life (particularly for seasonally produced goods); to provide strategically located storage to meet distribution needs; and to facilitate the international flow of temperature-sensitive goods across extended global transportation routes.
Operating Models
The industry is broadly categorized into two operating models: private and third-party. Private warehouses, or “in-house” space, are owned (or sometimes leased) by companies to store their own products. Third-party facilities, or “outsourced” space, are operated (and also typically owned) by third-parties that rent storage space to other companies, typically hosting a variety of different customers and product types within the same facilities. These facilities are also known as public refrigerated warehouses (“PRWs”), so “third-party” and “public” are often used interchangeably to describe this segment of the market. Over the past 30 years, it is estimated that about 75% of total U.S. freezer/cooler capacity has been third-party operated.
Although there is some overlap in customers between third-party and private operators (and some private operators that may also be customers of third-party operators), the degree of competition between the public and private segments is relatively low. Food manufacturers are the primary customers of third-party operated space, whereas food retailers, grocery stores, and distributors utilize the bulk of private cold storage capacity.
162
Table of Contents
U.S. Cold Storage Customer Types by Operating Model
Note: Percentages may not sum to 100% due to rounding.
Source: | CBRE Valuation and Advisory (private capacity), Lineage and Americold filings (public warehousing revenue). Private capacity reflects customer shares of privately-operated cold storage space (in cubic feet) based on 73 U.S. market studies as of October 2023. Public warehousing revenue reflects the average customer shares in 2023 financials for Lineage and Americold (who together account for more than 50% of total North American cold storage capacity). |
The competition between third-party and private operators is also limited by differing real estate characteristics. Based on estimates from CBRE Valuation and Advisory (“VAS”), dedicated freezer/cooler facilities made up 95% of total U.S. public capacity. In contrast, most private cold storage is in tri-temp facilities (57% of U.S. private capacity). As a result, cold storage made up an average of 78% of total square footage in third-party facilities, compared to an average of only 55% in private facilities.
Average Cold Storage Share of Total Facility Square Feet by Operating Model
Source: CBRE Valuation and Advisory. Based on 73 U.S. market studies as of October 2023.
Warehouse Types and Location Factors
Within both the third-party and private segments, cold storage can be further subdivided based on warehouse function and location. There are three primary types of refrigerated warehouse, each of which can be further segmented on secondary location-based distinctions:
• | Distribution warehouses are facilities located in primary metro areas or transportation hubs that typically provide services to multiple customers. These facilities are often located within or on the |
163
Table of Contents
outskirts of large population centers (referred to as “infill”) or commercial ports (referred to as “port-centric”). Infill and port-centric distribution warehouses tend to be the most valuable due to their irreplaceable locations and strong, consistent demand underpinned by a large population of consumers. The customer base is diverse, including the largest food producers, grocers, and other retailers. Distribution warehouses can be either public or private, but they are typically associated with third-party operation. |
• | Public warehouses typically provide services to multiple customers and usually have lower throughput volumes than distribution warehouses. These facilities are also generally located further from major population or transportation hubs. They may cater to small and mid-sized local and regional producers. |
• | Production advantaged warehouses are those associated with a specific production facility that is located in close proximity. With most farming and food processing done at a distance from population centers, most production-advantaged warehouses are not located in primary markets, but they can be found adjacent to ports and are occasionally within smaller metropolitan areas. These facilities may be operated in-house or by third-party operators on behalf of a customer and are typically built-to-suit for a particular set of functions. |
General Categorization of Cold Storage Market
Source: CBRE. Not shown to scale. Facilities may be owned or leased in either operating model.
The third-party operating model generally accounts for the dominant share of cold storage space across markets worldwide, but proportional allocations by warehouse and location type can vary significantly across markets and for different operators within the same market. For example, when comparing the two largest operators, distribution facilities make up 77% of Lineage’s Warehousing NOI, but only 43% of Americold’s.
164
Table of Contents
Share of Warehousing NOI by Warehouse Type for Leading Cold Storage Companies
Source: | Lineage, Americold, reflects FY23 financials for global warehousing segment. “Facility Leased/Managed” reflects locations where the company manages warehouse operations on behalf of the tenant that owns or leases the facility. |
Why Is Cold Storage Predominantly Outsourced?
The industry is dominated by third-party operated space for several reasons. First, the capital requirements to build and operate refrigerated warehouses are significant, and the cost of capital for users such as food manufacturers is often too high to justify the investment. Second, warehousing costs are generally a very small share of customers’ overall cost of goods sold, further reducing the incentive for these firms to invest in in-house operation. Third, transportation costs are typically among the largest portion of customers’ cost of goods sold, which often fuels demand by many customers for the same specific locations at key points of the supply chain. As a result, it is often more economical for third-party operators to build large facilities that can accommodate multiple customers in the same footprint, as opposed to multiple customers building their own smaller and less efficient facilities next to one another. By outsourcing their cold storage needs, customers can direct more of their capital and attention to their core business and area of expertise, while also benefiting from the economies of scale and flexibility associated with being part of a larger network.
Given the costs and complexity of modern supply-chain management, outsourcing of cold storage has risen in recent years for many customer types. Based on the USDA’s monthly survey on stock levels (measured in pounds) of 110 key food commodities stored in U.S. refrigerated warehouses, the average share of total stocks held in public facilities steadily increased from 69% in 2013 to 85% in 2023.
165
Table of Contents
Share Of USDA-Tracked Perishable Food Stocks in Public Cold Storage
Source: | USDA National Agricultural Statistics Service monthly cold storage summary. Reflects total weight of 110 food commodities stored in public warehouses as share of total weight stored in all warehouses. Chart reflects averages of March and September shares for each year. USDA surveys cover a subset of total U.S. cold storage capacity and primarily focus on facilities serving food processors, wholesalers and distributors. Most facilities serving large retailers and grocers do not meet USDA criteria for inclusion in the survey. |
Industry Operating Conditions
Building Features
Relative to standard “dry” warehouses, cold storage facilities have many unique features and additional design considerations, which are often capital intensive and require specialized knowledge to build and maintain. To keep temperature and humidity ranges for stored commodities precise and consistent, while also allowing warehouse employees to work safely and efficiently, facilities generally require specialized electrical, insulation, ventilation, HVAC, monitoring and safety, lighting, and flooring systems. These facilities must also have redundancies in place and/or capacity to generate power in the event of a system failure or emergency.
As land costs have risen, particularly for critical infill locations, refrigerated warehouses are also becoming taller to maximize storage volume (as a secondary benefit, taller facilities also tend to be more energy efficient). Recently developed conventional cold storage facilities typically have clear heights ranging from 45 to 60 feet (with some even higher in particularly expensive real estate markets) compared to typical heights of 32 to 40 feet for modern dry warehouses. Automated cold storage facilities can be significantly taller (since the main limitation for height of conventional warehouses is how high forklifts can be operated by humans), with several examples of facilities with clear heights between 100-150 ft.
As customer demand has fueled greater product movement and faster turnaround times, more activity is also taking place on refrigerated loading docks, sometimes without products ever actually being stored within the warehouse (e.g., freight consolidation and cross-docking). Industry standards as recently as five years ago were for 40-foot-wide docks, but modern cold storage warehouses now have 50-to 90-foot-wide docks to accommodate more traffic.
Operator Revenue Streams
Rental fees for storage space make up the primary revenue stream for most cold storage facilities, with customers paying either variable rates for space as it is needed or fixed rates for a set amount of space committed over a longer period. As demand for high-quality cold storage space has increasingly pressured available supply,
166
Table of Contents
both customer and operator interest in fixed commitments has risen in recent years. Among large cold storage third-party operators, roughly 40%-50% of total storage revenue in 2023 came from longer-term fixed commitments, a marked difference from pre-pandemic norms. This shift reflects the general tightness across the industry, but also generally supports improved planning and less volatile operating conditions for both customers and operators.
Most cold storage facilities also offer customers additional warehousing services beyond storage to provide the most efficient service to customers and maximize the yield of their footprint. According to the GCCA, rental revenue from cold storage space accounted for about 54% of total warehouse revenue in 2022, with the remainder coming from product handling, case-picking (i.e., selecting individual product cases from various pallets and combining into a new pallet) and other supplementary services.
Breakout of Revenue for Typical North American Cold Storage Warehouse
Source: | 2023 GCCA Productivity and Benchmarking Survey, based on survey responses for FY2022. Examples of accessorial services include labeling, order assembly and load consolidation, import/export services, container handling, cross-docking, inspection services, and other ancillary services. |
In addition, refrigerated warehouses are only one part of the “cold chain”—for perishable goods, temperature and humidity controls are also essential for transportation (e.g., refrigerated shipping containers) and delivery (e.g., insulated packing materials). The ability to seamlessly transition between these different stages of the cold chain is crucial to maintaining the safety, quality, and shelf-life of perishable goods. Therefore, some cold storage operators also provide additional solutions outside the four walls of the warehouse, such as refrigerated transportation. Operators with the ability to provide high quality service offerings, both within the warehouse and elsewhere in the supply chain, will generally attract stronger customer demand and loyalty.
Tenancy and Occupancy
Demand for cold storage space can be measured from both tenants and customers. In this industry, “tenancy” refers to the space that is leased to third-party operators and other cold storage users, typically with a long-term, triple-net rate lease structure. “Occupancy” refers to the amount of rack space (i.e., pallet positions) that is in use to store customer goods.
Because customers may rent cold storage pallet positions on either an on-demand basis or through a fixed commitment, there may be a difference between physical occupancy (i.e., the number of occupied pallets during a given period as a share of total possible pallet positions) and “economic” occupancy (i.e., physical occupancy plus any additional pallets that were unoccupied but had been contractually committed and paid for during a
167
Table of Contents
given period). In other words, fixed storage commitments may allow some portions of warehouse space to generate rental revenue even when not physically occupied and could potentially generate multiple revenue streams if customer contracts allow for their unutilized committed pallets to be lent to short-term customers if additional space is needed.
In recent years, the tenant vacancy rate has averaged around 3%-5%, but it is not unusual for many markets to have vacancy rates below 1%. Given the need to leave some space available for unexpected spikes in demand and seasonal fluctuations, refrigerated warehouses are typically considered stabilized when at 85% physical occupancy, though this varies based on warehouse design and operator preferences (and experience).
While storage revenue is driven by occupancy, handling revenue is driven by the volume of goods flowing through these facilities, i.e., throughput. In the wake of pandemic-era supply chain disruptions, throughput has been down moderately from pre-pandemic levels.
Operating Costs
On average, cold storage facilities have higher operating expenses than traditional warehouses, primarily due to higher labor and utilities costs. Higher labor costs are driven by the need for increased safety measures and worker protections (e.g., cold-rated clothing and equipment, additional training, frequent breaks, etc.) as well as employee turnover. Overall, labor costs make up about half of total cold storage operating costs (not including fixed real estate costs), based on the most recent GCCA Productivity and Benchmarking Survey. The relatively limited pool of workers with sufficient industry knowledge (across all types of positions—warehouse, maintenance, supervisory, etc.) also means that hiring and training can be a significant challenge, particularly for smaller or newer operators with less experience and fewer administrative resources.
Higher utility costs are driven by the need for constant temperature regulation, including significant water consumption for condensers and elevated electricity requirements to run the cooling and support systems (e.g., automatic doors, monitoring, safety, etc.), as well as potential backup power supply and offsite extensions. Overall, electricity made up 14% of cold storage operating costs (based on the same GCCA survey), but total utilities would be higher (non-electric utilities were included in the “Other” share). By some estimates, cold storage utility usage can be as much as four times higher than traditional warehouses, but this varies significantly based on the age and degree of automation of the facility.
Breakout of Operating Costs for Typical North American Cold Storage Warehouse
Source: | FY2021 International Association of Refrigerated Warehouses Productivity & Benchmarking Survey. Smaller pie represents the cost breakout of non-real estate operating expenses. |
168
Table of Contents
Technological Advancements
To lower operational costs, increase storage capacity, and enhance customer service levels, development and implementation of new technologies has risen in recent years among cold storage industry leaders. More modern and technologically advanced facilities can often deliver the lowest cost to customers, which may be particularly appealing to food industry customers that may have relatively tight margins. There are four areas in which technological advances are having the most pronounced impact on the industry: automation, software development and deployment, energy usage and data science. Innovations in these areas are also highly interrelated.
Automation runs the gamut from automation of specific processes (e.g., pallet receiving, storage and retrieval systems) to completely automated facilities that significantly reduce the use of manual labor, enabling a small team to manage a disproportionally large quantity of inventory. Automation in the cold storage industry can add value to the customer by supporting increasingly complex customer requirements (e.g., high throughput for a large quantity of SKUs) at a high level of accuracy and efficiency while also driving lower costs of service overall. For operators, it can significantly reduce labor costs and provide some insulation from the impact of labor shortages, which is critical in an industry with physically demanding jobs with high turnover. Automation also allows operators to maximize their real estate footprints. Automated buildings can feature clear heights between 100-150 ft because they are not height-limited by the capabilities of manually-operated forklifts, thereby maximizing pallet capacity per square foot. In addition, an optimally designed automation system can process inventory on smaller loading docks, minimizing the amount of non-revenue generating space required.
Unique design considerations for significant automation (e.g., racking systems that are integrated into the building as structural elements) generally require new purpose-built construction. Reflecting this dynamic, GCCA estimates as of 2021 show that about 11% of operations were automated in cold storage facilities that were less than 10 years old, more than twice the share for all surveyed cold storage facilities.
Example of Modern Automated Facility Interior
Source: Lineage
Operators that can develop proprietary software and deploy third-party applications can gain a unique edge in a traditionally analog sector. Software applications in the cold storage industry include customer experience platforms to facilitate inventory visibility, order management, and customer service; salesforce tools to digitize the critical processes of quoting, contracting, and billing; and warehouse operation platforms. Warehouse operations software can be paired with automated systems as well as provide solutions to challenges in conventional warehouses, such as efficiently assigning tasks to workers via tablets and wrist-mounted devices. The benefits to operators who develop and deploy these tools may include increased market share and reduced customer churn, significantly higher labor productivity, and increased revenue capture.
169
Table of Contents
For energy, examples of technological advancements that help minimize costs (both financial and environmental) include improved refrigeration systems that are more energy-efficient and less hazardous, installation of solar panels, linear generators that can utilize alternative fuels, and thermal flywheeling, which uses machine learning and artificial intelligence to manage energy loads based on predictions of peak demand. In certain circumstances, these strategies can even allow operators to sell pre-purchased capacity back to the grid during energy price spikes (which can result in low or negative power bills).
Advances in each of these areas are underpinned by data science. For example, operators can analyze operational data from facilities across their networks to design and test a warehouse against variations in customer movements, product seasonality and emergencies (like pandemic-induced buying). As a result, operators can design optimal energy-use and automation solutions, such as highly efficient blast freezing systems and highly productive automated case picking systems. Data science capabilities can also benefit warehouse operation by modeling the impacts of different customer profiles on factors like warehouse flows, labor requirements, energy consumption and maintenance. Finally, scaled operators with large networks can leverage data science to identify opportunities to combine inventory of different customers with similar routes and schedules into the same trucks or match outbound inventory to empty trucks already returning to the same destination warehouse. Because transportation costs represent the majority of customers’ supply chain costs and are several times the size of warehousing costs, these kinds of solutions enable significant savings for customers, less congestion on roads and at receiving points, and a decreased carbon footprint.
Given the unique challenges of cold storage operation—particularly around labor and utilities—advances in automation, software, energy efficiency and data science have the potential for more pronounced impacts relative to traditional warehouses. As modern supply chain management continues to become more complex, we believe that operators that can offer customers a combination of physical and digital infrastructure will be most competitive. Given the significant investments required to develop and implement new technologies at scale, as well as the critical role of insights gleaned through analysis of large sets of warehouse operations data, the largest operators may be best positioned to capitalize on this opportunity.
Global Market Size and Competitive Landscape
Based on a combination of survey and government data sources across 48 countries, the GCCA estimated total global cold storage capacity at 25 billion cubic feet as of 2020 (latest available data), up 17% from 2018. Over 60% of the global market is concentrated in the top three countries: the U.S. (5.5 billion cubic feet), India (5.3 billion) and China (4.6 billion). All other countries had less than 1.4 billion cubic feet (most much less).
When looking at the market as of year-end 2023 and including a more comprehensive survey of private capacity, CBRE VAS estimates the core U.S. cold storage market is likely closer to approximately 7 billion cubic feet (excluding facilities where temperature-controlled space represents a minority of the total building footprint). If the U.S. were to account for a similar proportion of the global market as in the GCCA’s 2020 survey, this would imply current global capacity of approximately 30 billion cubic feet.
Many countries are likely underserved in terms of access to cold storage facilities, with pent-up or potential demand exceeding the amount of available supply. When comparing GCCA’s estimates of cold storage market development (defined as cubic feet per urban resident) against countries’ average disposable household income levels, there is a clear correlation between higher incomes and greater cold storage capacity. Nearly all the lowest income countries have less than three cubic feet of cold storage space per urban resident, pointing to a significant need for growth (given that ratios in developed economies are roughly 5-10 times higher). The analysis suggests that even in many higher income countries there is likely additional runway for cold storage development. For some countries—most notably the U.S., Switzerland, and Australia—the ratio of cold storage capacity per urban resident is significantly lower than the trendline would predict.
170
Table of Contents
Relationship Between Country Income Levels and Cold Storage Capacity Development
Source: | 2022 average household disposable income (real, chained 2015 USD) from Oxford Economics; 2020 GCCA Global Cold Storage Capacity Report (July 2020). |
Competitive Landscape
Although the competitive landscape of the cold storage industry can vary across countries and regions, the general trend has been for significant amounts of space to be consolidated among a few key companies with the rest of the market highly fragmented across many local and regional players. Based on the GCCA’s annual list of the largest refrigerated warehousing providers, the top 10 companies owned or operated roughly 6.0 billion cubic feet of cold storage space in 2024, or just below one-quarter of global cold storage capacity (based on the latest 2020 estimate).
The two largest companies—Lineage and Americold—together own or operate over 4.4 billion cubic feet, representing an estimated 17.5% of total global capacity. Estimated market shares for these companies are even higher in North America, with Lineage representing approximately 32.9% of total capacity and Americold approximately 19.3%.
171
Table of Contents
Global Cold Storage Capacity and Estimated Global Share
Source: | Lineage and Americold based on company data as of March 31, 2024. All others based on 2024 GCCA Global Top 25 List (April 2024). Global market share based on total global capacity from 2020 GCCA Global Cold Storage Capacity Report (August 2020). |
North American Cold Storage Capacity and Estimated North America Share
Source: | Lineage and Americold based on company data as of March 31, 2024. All others based on 2024 GCCA North America Top 25 List (April 2024). North American market share based on total global capacity from 2020 GCCA Global Cold Storage Capacity Report (August 2020). |
Advantages to Consolidation
The total capacity among the global top 25 companies increased by roughly 1.6 billion cubic feet, or 32%, between GCCA’s 2020 and 2024 lists. This growth primarily reflects merger and acquisition activity and new
172
Table of Contents
development by the two largest players, as over this period Lineage grew its portfolio by over 1.2 billion cubic feet, or 67%, and Americold grew by 344 million cubic feet, or 31%, during the same period.
This consolidation among the top companies reflects the significant advantages from economies of scale in the cold storage industry. The increased brand recognition, breadth and depth of industry relationships, greater access to and lower cost of capital, and more extensive property networks, generally allow larger operators to be more competitive in terms of rates, speed, and quality of service. These networks provide greater cushion to customers in mitigating risks from both scarcity of space and scarcity of product, as well as the simplicity of working with fewer providers across different geographies. The ability to spread fixed costs, administrative overhead, and technology investments over a larger portfolio also allows these operators to offer a wider range of warehouse types, locations, and services, which attracts a higher number and greater diversity of customers. In contrast, smaller companies not only lack these network benefits but are also more likely to specialize in certain products or be anchored to specific customers or geographic regions, which makes them more vulnerable to the risk of demand shifts, shortages, and other market shocks.
Although there has been notable growth in new PRW operators over the last three years, it can be challenging for these new firms to differentiate and compete with existing large players. Further consolidation is likely to continue, particularly as the competitive advantages for operators leveraging modern technology and data science become more pronounced. Small operators with good regional coverage are expected to be prime targets for future M&A activity.
Long-Term Demand Drivers and Growth Trajectory
Industry Revenue
Because food storage is the primary driver of demand for refrigerated warehouse space, growth in the sector is tied to long-term demographic, economic and technological trends and has been minimally impacted by past economic and real estate cycles. Though downturns may have some impact on what and where consumers eat (e.g., restaurant vs. grocery), overall demand for food is largely inelastic.
In fact, during periods of economic stress or inflation, consumption of frozen foods tends to increase, since frozen foods are typically less expensive than fresh or canned equivalents and also allow for waste reduction and bulk buying to take advantage of sales. Based on data collected by the American Frozen Food Institute and equivalent industry groups in other countries, frozen food sales spiked by 20% or more in 2020 across much of North America and Europe. The global frozen food market is forecasted to grow by $133 billion between 2022 and 2027, according to Technavio, which represents an approximate 8% compound annual growth rate (“CAGR”).
Through the past two economic cycles, increased demand, rent escalation, and the addition of first-generation assets all contributed to relatively stable revenue growth for companies operating in the cold storage space. In addition to the strength of real estate fundamentals, revenue gains for cold storage operators are also tied to the ongoing shift toward outsourcing, with third-party operators receiving a growing share of total expenditures on global cold-chain management.
IBISWorld projections are for U.S. cold storage industry revenue to increase at a CAGR of 3% over the next five years (2023-2028). However, reports from similar research consultancies project much stronger growth rates for the global refrigerated warehouse industry, with low double-digit estimated CAGRs over the next five years.
173
Table of Contents
U.S. Temperature-Controlled Warehousing Industry Revenue
($ in billions)
Source: | IBISWorld: “Refrigerated Storage in the US” (October 2023). The Lineage datapoints referenced in this IBIS report were outdated (undercounted), suggesting that the total industry revenue and growth rates are likely higher than what was reported. |
How do Changes in Food Consumption Impact Cold Storage?
The primary drivers of growth in the cold storage industry are how much food is consumed overall and what kinds of food consumers prefer. Population growth is a reliable indicator for overall consumption, while household income growth and broader economic development are good predictors of food preferences and consumption patterns. As incomes rise, consumption of more premium items that tend to have greater temperature sensitivity, such as meat and dairy, as well as prepared and specialty foods (e.g., organic or allergen-free products) also tends to rise. Increases in income also tend to mean more demand for imported foods and items that were previously unavailable or cost prohibitive. These shifts all fuel stronger demand for cold storage space.
Urbanization has also been a major catalyst for cold storage growth over the past several decades. As populations urbanize, they are much more likely to consume food produced outside of their immediate area and to utilize grocery stores, markets and restaurants that rely on cold storage networks. Urban populations also tend to work longer hours and work further from their homes, which tends to drive greater reliance on refrigerated and frozen convenience foods and prepared meals.
In 2020, approximately 56% of the global population was urbanized, but U.N. Department of Economic and Social Affairs expects this share to rise to 68% of the population by 2050. According to the U.N., 95% of the growth in the urban population from 2020 and 2050 will come from what the organization considers “less developed regions” of the world. These regions currently have far less access to modern cold storage facilities, presenting a major opportunity for industry growth in the next three decades.
Overall, the global population is projected to reach roughly 8.5 billion by 2030, an increase of 6% and nearly 500 million people from 2023 levels, based on estimates from the U.N. and Oxford Economics. Over the same period, Oxford expects that average disposable household incomes will rise by 10%, which is projected to spur an increase of 15% in inflation-adjusted consumer spending on food worldwide, representing an additional $1 trillion above 2023 levels.
174
Table of Contents
Global Urban Population by Country Economic Development
(in millions)
Source: | Oxford Economics, with actual data through 2020 for most countries (modeled estimates from Oxford Economics used in countries with data lags). Economic development country aggregates from International Monetary Fund. |
Emerging and Developing Economies
The strongest growth in food consumption is likely to come from emerging and developing economies in the Asia Pacific (“APAC”) region (group of 30 countries, per International Monetary Fund aggregates). Based on Oxford Economics data, as of 2020, total consumer spending on food in emerging and developing Asia Pacific was about 80% of total food spending in advanced economies (a group of 41 countries across multiple regions). By 2030, Oxford projects that food spending levels will be essentially equal for these two groups of countries, representing over $650 billion worth of additional consumption in real (inflation-adjusted) terms in APAC over the ten-year period.
Real Consumer Food Spending by Country Aggregates
(in 2015 USD billions)
175
Table of Contents
Source: | Oxford Economics. Last year of actual data varies by country with most advanced economies shown through 2022; all other data points are modeled estimates or forecasts from Oxford Economics. Country aggregates from International Monetary Fund. |
As food consumption increases and diversifies in developing economies, this should gradually lead to implementation of more rigorous food safety standards, which would include proper refrigeration and storage for many items. As regulations tighten, global demand for modern cold storage space will rise. This trend is likely to benefit third-party operators, particularly large operators with the experience and capital to ensure regulatory compliance.
Over time, more stringent regulatory oversight will benefit the industry, as it strengthens both consumer and investor confidence in the quality of cold storage facilities and the products moving through them. This confidence will also help facilitate increased international trade of food and other temperature-sensitive goods.
In developing economies where a significant share of GDP is based on agriculture, cold storage facilities themselves function as economic growth engines. The United Nations’ Food and Agriculture Organization estimates that as much as 40% of food in developing countries is lost due to damage or spoilage after harvest. Cold chain developments could dramatically reduce these losses and also increase farmers’ ability to export agricultural products, particularly to advanced economies. This increased productivity and higher earnings could then enable higher consumption, creating a positive feedback loop.
Advanced Economies
In advanced economies, where population and income growth rates will be much more modest, growth in cold storage demand will likely be fueled more by shifts in what consumers are eating and where it comes from, as well as potential growth in non-food sources of demand, such as biotech/pharmaceuticals and high-tech components, particularly given the increased focus and investment (both private and public sector) on domestic production of certain critical commodities.
Survey and consumer spending data consistently point to the continuation of existing trends toward higher consumption of fresh food, as well as organic, allergen-free, plant-based and other health-conscious dietary preferences that tend to include more temperature-sensitive goods. Growth in utilization of meal kits, food delivery, and online grocery will also likely generate greater demand for infill distribution locations, as well as technologically advanced and automated facilities that can help improve cost efficiency.
Overall, e-commerce penetration remains low in the consumer food sector, but it is expected to be among the fastest growing segments, based on projections from Forrester and other retail market researchers. Given that e-commerce fulfillment requires more warehouse space than does traditional retail or wholesale channels, even incremental growth in online food sales could have a marked impact on cold storage demand, as was demonstrated during the initial spike in adoption at the height of the pandemic.
176
Table of Contents
Current Online Share of U.S. Sales vs. 5-Year Online Growth Projection by Retail Category
Source: | Forrester U.S. Online Retail Forecast 2023-2028 (July 2023); orange marks represent categories with high temperature sensitivity. |
Shifting investor preferences may also be a driver of growth in advanced economies with already established cold storage infrastructure. For example, a growing emphasis on sustainability initiatives may put additional pressure on outdated, inefficient cold storage facilities. Replacement of these obsolete facilities with modern warehouses that can offer dramatic energy savings will likely be a continued trend through the long term.
Supply-Side Dynamics
Barriers to Entry
The rising cost of construction materials, labor and contractor margins has made it more challenging to develop new product in recent years, with construction cost inflation impacting cold storage facilities more than other commercial product. According to Producer Price Index (PPI) data from the U.S. Bureau of Labor Statistics, the final cost for new warehouse construction increased 44% from October 2019 to October 2023, while commercial refrigeration equipment increased 65%, indicating more significant inflation for cold storage development.
Lead times for critical HVAC and insulation materials have also significantly increased in the U.S. since the onset of the COVID-19 pandemic. As of September 30, 2023, industrial contractors reported that the average lead time for HVAC equipment remained twice as long as what it was in 2019, while the average lead time for thermal & moisture protection was about 50% longer. Developers outside the U.S. are facing similar challenges around recent inflation and critical materials shortages due to the global nature of these supply chains.
Though the pace of construction cost inflation is generally expected to return to the pre-pandemic norm in 2024, cold storage capabilities will always add a significant cost delta over dry warehouse development due to the increased complexity and the additional materials and equipment required. For a purpose-built facility where refrigerated space can account for 80% or more of the total building area, the development cost could range from 2-4 times a dry warehouse cost. For certain specialized requirements in higher-cost parts of the U.S., new cold storage developments can exceed $500 per square foot, and automated facilities could be even higher. These substantial cost constraints limit new development, making the cold storage market generally less vulnerable to supply-side risk than conventional dry warehouses.
177
Table of Contents
Cost per Sq. Ft. for Construction of
Dry vs. Cold Warehouse in the U.S.
Source: | CBRE estimates as of December 31, 2023. The cost ranges shown indicate the estimated lower and upper quartile ranges, based on a mix of sources, including estimates from CBRE Project Management, third-party reports, project comps, and surveys of U.S. general contractors. Estimates for cold facilities include the cost of core and shell development plus the build out cost of the specified facility type. These data points are for informational purposes, and prices may fall outside of these ranges. Actual pricing will depend on the market, contractor relationships and complexity of the requirement. |
In addition to high and increasing construction costs, new developers face additional hurdles when trying to deliver cold storage capacity to the market, particularly speculative projects. Because large third-party operators that primarily own their facilities typically have such high market shares, new developers often must seek to lease their space directly to food manufacturers or local distributors, which reduces the available tenant pool. Leasing directly to food manufacturers can also prove challenging, since most prefer to outsource their temperature-controlled warehousing needs rather than operate themselves.
Real estate developers that want to get into operations rather than lease their properties must be prepared to contend with large competitors in securing and retaining both customers and skilled labor. Given the high switching costs for customers, winning new business can also be difficult for operators without established brand recognition or proven track records. Relative to new developers, established cold storage operators backed by trusted brands tend to have a significant advantage in leasing-up (stabilizing) a new property and then keeping it well staffed and maintained due to their long-term relationships with customers and vendors and significantly larger salesforces and human resources departments.
Inventory Obsolescence
Given the major cost and efficiency advantages of operating in newer, more technologically advanced facilities, demand has waned for older, increasingly obsolete facilities. Based on an analysis of Costar data in December 2023, approximately 36% of all U.S. cold storage vacancy was within facilities either built or renovated before 1980, despite these facilities accounting for only 18% of the inventory. On average, pre-1980 facilities are about one-third the size (in cubic feet) of modern facilities built or renovated since 2010 and ceiling heights are about two-thirds as high. Most vacant space in pre-1980 facilities is in the South region of the U.S., which is also where the largest share (43%) of facilities have been built or renovated since 2010, indicating that many tenants are eager to trade up for modern space if given the opportunity to do so.
178
Table of Contents
U.S. Cold Storage and Dry Warehouse Average Age Benchmarking
Source: | Lineage, CoStar Group and CBRE Valuation and Advisory. Ages (other than Lineage) based on 73 U.S. market studies as of October 2023. Ages represent weighted averages (by cubic feet) based on the year the facility was built and are estimated as of December 31, 2023. “Public REIT Dry Warehouse” segment includes U.S. warehouse and distribution properties (excluding facilities with cold storage) of at least 50K sq. ft. owned by public REITs. Lineage U.S. portfolio age represents the weighted average (by cubic feet) of all Lineage U.S. warehouses based on year built. Lineage global portfolio age represents the weighted average (by cubic feet) of all Lineage global warehouses based on year built and, for facilities with later expansions, the amount of cubic feet added during the more recent year (e.g., a 3 million cubic foot facility built 20 years ago with a just-completed expansion of an incremental 3 million cubic feet would have a weighted age of 10 years). |
Average Height and Size Of U.S. Cold Storage Facilities by Decade Built or Renovated
Source: | CoStar Group, CBRE Valuation and Advisory. |
Recent Construction Activity
Rising demand for modernized facilities has led to an increase in new development and renovations in recent years. Over one-third of U.S. cold storage inventory (as measured in cubic feet) was built or renovated since 2010. On average, new facilities are about 56% larger (in cubic feet) with 60% higher ceilings than existing facilities.
179
Table of Contents
Though cold storage market fundamentals have been consistently strong for decades, post-pandemic inflows of institutional capital and steep rent gains made the economics of new cold storage construction much more feasible. Alongside broader real estate and capital markets conditions, this led to a marked increase in development activity that began most notably in 2021. According to Costar data, the amount of cold-storage-capable warehouse square footage actively under construction in the U.S. 2021 was about three times greater than any year over the prior decade. Since then, new construction starts have slowed substantially and new product has hit the market, easing the supply-demand imbalance.
Much of this construction wave has been speculative (spec) projects, which have historically been very rare in this sector given the unique development challenges. Among the spec space that has been delivered since 2020 or is currently under construction, CBRE estimates that roughly 40% has been leased or pre-leased. Space that is currently unleased within spec projects recently completed or underway may take longer to stabilize, given that many currently active speculative developers are purely real estate providers without operational capabilities, as well as the preference of public operators to build rather than lease capacity to meet their growing space requirements.
Despite record construction activity in recent years, completions of publicly operated and speculative cold storage in the U.S. represented a relatively moderate 3.9% of existing public inventory in 2023 and is expected to decline to 3.5% in 2024 (as measured in square feet). These shares are similar to the expected annual pace of demand growth, particularly when considering that some portion of currently unleased spec space will eventually be taken by private users. After 2024, new deliveries are expected to slow substantially to 1.8% of inventory in 2025, as fewer projects have broken ground in the last two years (with almost none speculative), due in large part to higher construction costs, interest rates, financing challenges and some softening in occupancy.
U.S. Cold Storage Construction by Year of Completion
(% Indicates Share of Total Public Inventory)
Source: | CBRE Food Facilities Group, CBRE VAS, GCCA, operator and developer websites. Includes projects completed or actively under construction as of April 2024 (excludes projects in planning phases). Excludes private built-to-suit projects and spec space taken by private users. Unleased spec construction reflects projects with no committed tenant as of April 2024 that could ultimately be occupied by either a public or private user. |
Recent construction has largely been limited to a select set of markets. Based on CBRE Estimates, nearly 60% of all publicly operated and speculative U.S. cold storage square footage completed between 2020 and 2023
180
Table of Contents
was in just five states— Texas, Florida, Georgia, New Jersey and Arizona—with 23% concentrated in Texas alone. During this period, new construction in all other states outside the the top five was limited to two facilities or fewer.
While development in the top five states is partially a response to rising demand from growing populations in the Sun Belt, it is also a reflection of the development challenges facing cold storage developers in many other U.S. states (as well as most metro areas in other advanced economies). A combination of limited development sites, competition from dry warehouse users for available land, soaring land and construction costs, and state and local regulatory hurdles has made it especially difficult to develop in prime coastal states like California and New York, especially when compared to Sun Belt states.
Recent Real Estate Trends & Fundamentals
Commercial Real Estate Fundamentals
Although traditional real estate fundamental metrics capture a fairly small portion of the overall cold storage market (since leasing-based metrics exclude activity among owner-operators), trends still generally reflect the supply/demand dynamics of the broader market. From 2007-2023, the cold storage sector experienced immense occupancy growth. In the U.S., annual net absorption has been positive for 17 straight years, which has led to an additional 45 million square feet of newly occupied space, on net. During this period, the U.S. vacancy rate fell steadily to below 3% in 2020, where it stayed until 2023 when it ticked up to 3.8% amid an unprecedented stretch of construction completions.
From 2020-2023, more square feet of refrigerated warehouse space delivered than in any other four-year period on record (going back to 1990), according to data from Costar. While this relieved some of the supply-demand imbalance, the vacancy rate is still very low as of December 31, 2023—indicating there is still ample demand to fill new space as it delivers.
Given the state of real estate fundamentals in the U.S., operators with a large existing footprint in modern facilities should be well-positioned in the coming years. Operators with advanced facilities (particularly in terms of automation) in strategic geographic locations will be especially prepared to capture future customer demand. While the lack of new supply could hinder expansion opportunities for operators in certain markets, it also limits vacant space and supply risk while increasing pressure on pallet rental fees. Operators that own their facilities or are locked into leases that won’t expire for several years, are likely to benefit the most as they do not face immediate pressure on their fixed facilities costs (i.e., rising rents) from the supply/demand imbalance.
U.S. Annual Cold Storage Net Absorption and Vacancy Rate
Source: CBRE, Costar Group, data as of December 2023
181
Table of Contents
Transaction Volume
The strength of cold storage operating conditions and real estate fundamentals, as well as heightened construction deliveries, helped spur a major uptick in investor interest in the sector in recent years. Total acquisition volumes have been driven both by sales of individual assets and by portfolio or entity-level sales (i.e., properties acquired as part of company M&A activity). Individual asset sales are typically the better barometer of prevailing sentiment and cyclical performance within a sector, while portfolio and entity-level sales are a better indicator of broader structural factors for the sector, as well as general capital markets conditions.
The high level of portfolio/entity-level transaction activity (38% of total U.S. cold storage volume, on average, from 2018 to 2023) reflects the consolidation trend in the industry over recent years. Individual asset sales volume held quite steady (hovering at roughly $1.5 billion annually) between 2019-2022, indicating a reliable base pool of investor demand and liquidity.
Cold storage investment slowed in 2023 to the lowest volume since 2013. This is primarily a reflection of financing constraints (e.g., high interest rates, limited capital availability) and other near-term macroeconomic headwinds. This is a consistent trend across commercial real estate sectors—the percent change in volume last year was larger for the industrial sector overall than for refrigerated warehouses—that is likely to ease as economic conditions improve. For cold storage, muted investment is also partially due to limited for-sale inventory, given multiple years of record acquisition activity in a relatively small sector.
U.S. Cold Storage Investment Volume By Deal Type
Source: MSCI/Real Capital Analytics
Cap Rates
On average, transaction cap rates for refrigerated warehouses have been similar to dry warehouses, with significant compression over the prior decade. As more institutional investors entered the cold storage sector and volumes surged in 2020, the average U.S. cap rate fell by nearly a full percentage point from the start of 2020 to the end of 2021 and remained 20-40 bps lower than the dry warehouse average during this period, according to Real Capital Analytics. As investment volume slowed and the number of high-quality assets listed for sale increasingly dwindled, cap rates for refrigerated warehouses have risen but remain in line with pre-pandemic norms from 2018 to 2019.
182
Table of Contents
U.S. Average Cap Rate By Warehouse Type
Source: MSCI/Real Capital Analytics, Q3 2023 refrigerated warehouse cap rate is interpolated due to limited transaction activity.
For cold storage, location factors are a major determinant of asset values. In general, cold storage cap rates are lowest for distribution facilities, particularly those located in or near ports and major population centers. General PRWs and production-advantaged warehouses generally have higher cap rates, with cap rates for individual assets varying based on location, tenant quality and other factors. Even for PRW and production-advantaged facilities with strong anchor customers in place, if the market location is small enough that there would be difficulty securing a suitable new tenant should the current customer ever decide to relocate (or go under), that risk will be priced in and push up cap rates. As a result, cold storage portfolios with larger shares of revenue and NOI tied to distribution properties typically have higher asset values and less volatility.
According to Green Street analyst estimates from their most recent NAV of Americold as of March 7, 2024, which is their only public Cold Storage REIT under coverage, applied cap rates for distribution facilities were about 20-25 bps lower compared to public facilities and about 100-110bps lower compared to production-advantaged cold storage facilities. These data points are for informational purposes and should not be used as the basis for an investment decision. These cap rate spreads are specifically used towards the valuation of Americold’s portfolio in Green Street’s NAV and might not be directly applicable at the sector level or for other companies. The cap rate spreads are nominal cap rates based on an after- SG&A allocation basis as per Green Street’s valuation methodology for normalization of SG&A in the Cold Storage sector. Green Street Research has allowed for dissemination of this information but has had no involvement with the content of this registration statement.
Outlook
For the past two decades, the cold storage sector has performed consistently well in both commercial real estate and industry fundamentals. More recently, the COVID-19 pandemic ushered in a period of significant growth for the cold storage industry. Supply chain disruptions in general, but particularly the persistent shortages of food and medicine during the height of the pandemic, led to a rise in awareness among consumers, governments, and investors around the importance of an optimally functioning global cold chain. This awareness contributed to both public and private capital being funneled into the sector, fueling construction activity and revenue growth that allowed cold storage operators to better respond to rising demand for space.
The pandemic also accelerated trends that had a marked short-term impact on cold storage demand and have the potential to be growth engines for the industry in coming years. Two key examples are the rapid adoption of online food sales and the heightened emphasis on biopharmaceutical production and distribution (the latter
183
Table of Contents
stemming from the lack of suitable facilities for vaccine storage, particularly in developing countries and rural areas of advanced economies).
The inventory of cold storage facilities in the U.S. and globally is relatively old and becoming increasingly obsolete as technology advances and consumer preferences evolve. As the delta between factors such as energy usage, operating costs, and speed of service continues to widen between older and newer cold warehouses, owners and operators of modern facilities will be at an increasing advantage in terms of customer retention and profit margin. This gap will also likely fuel additional investment and development in the industry, particularly as both sustainability initiatives and more stringent food and pharmaceutical safety standards become increasingly common.
However, the significant barriers to entry in the industry will likely continue to limit speculative construction and competition from new market participants, which typically supports high occupancy and steady rent escalation. The high degree of market fragmentation also presents operators with industry expertise and access to capital potential opportunities to acquire and update existing cold storage properties. Given these dynamics, the industry appears well positioned for both near-and long-term growth as global demand for temperature-sensitive goods is expected to rise faster than the limited supply of cold storage facilities.
184
Table of Contents
Overview
We are the world’s largest global temperature-controlled warehouse REIT, with a modern and strategically located network of properties. Our business is competitively positioned to deliver a seamless end-to-end, technology-enabled, customer experience for thousands of customers, each with their own unique requirements in the temperature-controlled supply chain. As of March 31, 2024, we operated an interconnected global temperature-controlled warehouse network, comprising over 84.1 million square feet and 3.0 billion cubic feet of capacity across 482 warehouses predominantly located in densely populated critical-distribution markets, with 312 in North America, 82 in Europe and 88 in Asia-Pacific. We have a well-diversified and stable customer base and currently serve more than 13,000 customers that include household names of the largest food retailers, manufacturers, processors and food service distributors in the industry. For the twelve months ended March 31, 2024, no single customer accounted for more than 3.3% of our revenues. In the twelve months ended March 31, 2024, we generated $5.3 billion of revenue, $162.8 million of net loss, $1.8 billion of NOI and $1.3 billion of Adjusted EBITDA.
Our Business Segments
We view, manage and report on our business through two segments:
• | Global warehousing, which utilizes our high-quality industrial real estate properties to provide temperature-controlled warehousing storage and services to our customers and represented approximately 86% of our total NOI for the twelve months ended March 31, 2024; and |
• | Global integrated solutions, which complements warehousing with supply chain services to facilitate the movement of products through the food supply chain to generate cost savings for customers and additional revenue streams for our company and represented approximately 14% of our total NOI for the twelve months ended March 31, 2024. |
Our Global Warehousing Segment
The backbone of our business is our mission-critical network of sophisticated, modern and strategically-located temperature-controlled warehouses.
As of March 31, 2024, our warehousing portfolio encompassed 463 warehouses featuring distribution, public, production advantaged and managed warehouse operations and contained approximately 81.9 million square feet, 2.9 billion cubic feet and 9.8 million pallet positions. We believe we also have the largest automated temperature-controlled portfolio with 81 automated facilities, 24 of which are fully automated and 57 of which are semi-automated.
As of March 31, 2024, the cubic-foot weighted average age of our portfolio was approximately 21 years, which we believe is significantly younger than that of the broader temperature-controlled industry. In addition, many of our warehouses may operate in a way that is functionally younger than their age given the substantial investments or refurbishments we have made that do not factor into the age calculation in areas such as maintenance, automation, energy efficiency and sustainability. From 2021 through March 31, 2024, we have invested over $474 million in recurring maintenance capital expenditures and integration expenditures we incur when we acquire new warehouses and approximately $366 million in repair and maintenance operating expense, which do not qualify as capital expenditures, across our existing warehouse network because we believe that a more modern and consistently maintained network enhances prospects of winning new customers, retaining existing customers, extending our network’s useful lives and driving more efficient operations, improved profitability and greater cash flow.
185
Table of Contents
Facilities in Our Global Warehousing Segment
The following table provides information regarding the temperature-controlled warehouses in our global warehousing segment that we owned, leased or managed in each of the regions in which we operated as of, or for the twelve months ended, March 31, 2024.
Region | Number of Warehouses | Cubic feet (in millions) | Percent of total cubic feet | Pallets positions (in thousands) | Average economic occupancy | Average physical occupancy | Revenues (in millions) | Segment NOI (in millions) | ||||||||||||||||||||||||
North America | 293 | 2,057 | 70.5 | % | 6,198 | 86.6 | % | 78.8 | % | $ | 2,924 | $ | 1,191 | |||||||||||||||||||
Europe | 82 | 616 | 21.1 | % | 2,599 | 82.8 | % | 79.5 | % | 598 | 201 | |||||||||||||||||||||
Asia-Pacific | 88 | 244 | 8.4 | % | 1,008 | 81.8 | % | 79.0 | % | 346 | 115 | |||||||||||||||||||||
|
|
|
|
|
|
|
|
|
|
|
|
|
|
|
| |||||||||||||||||
Average/Total(1) | 463 | 2,917 | 100.0 | % | 9,804 | 85.1 | % | 79.0 | % | $ | 3,868 | $ | 1,507 | |||||||||||||||||||
|
|
|
|
|
|
|
|
|
|
|
|
|
|
|
|
(1) | Totals may not sum due to rounding. Excludes 19 warehouses in our global integrated solutions segment. We categorize warehouses as part of our global integrated solutions segment if the primary business conducted in those warehouses is within our global integrated solutions segment. |
Our Warehouse Types
As of March 31, 2024, we owned, operated, leased and managed multiple types of temperature-controlled warehouses across our global network, which we group into four types: distribution, public, production advantaged and managed warehouses.
• | Distribution centers are warehouses that typically store products for multiple customers often in or near difficult to duplicate metropolitan, infill or port locations. |
• | Public warehouses are warehouses that typically store products for multiple customers usually outside metropolitan and infill locations. |
• | Production advantaged warehouses are warehouses adjacent to or near customer production facilities |
• | Managed warehouses are facilities owned or leased by the customer for which we manage the warehouse operations on their behalf. |
Warehouse Type | Cubic Feet (in millions) | Pallet Positions (in thousands) | Number of Warehouses | NOI (in millions)(3) | Percentage of Total NOI(3) | |||||||||||||||
Distribution | 2,035 | 6,666 | 283 | $ | 1,150 | 76.3% | ||||||||||||||
Public | 474 | 1,975 | 124 | 180 | 11.9% | |||||||||||||||
Production Advantaged | 291 | 1,163 | 41 | 159 | 10.6% | |||||||||||||||
Managed /Other(1) | 117 | — | 15 | 18 | 1.2% | |||||||||||||||
|
|
|
|
|
|
|
|
|
| |||||||||||
Total(2) | 2,917 | 9,804 | 463 | $ | 1,507 | 100% | ||||||||||||||
|
|
|
|
|
|
|
|
|
|
(1) | Includes costs associated with land held for development. |
(2) | Totals may not sum due to rounding. Excludes 19 warehouses in our global integrated solutions segment. We categorize warehouses as part of our global integrated solutions segment if the primary business conducted in those warehouses is within our global integrated solutions segment. |
(3) | For the twelve months ended March 31, 2024. |
Our broad network of warehouses is weighted towards high-population density markets and port locations, with a weighted average population density of approximately 3,100 persons per square mile and 241 port facilities across our network. We define a warehouse as a port facility if it is within 30 miles of a port that performs commercial or trade-related activity. These markets feature high value real estate that serve as critical nodes in our customers’ supply chains which we believe in turn supports high economic occupancy, low volatility in demand, productive NOI generation and strong growth.
186
Table of Contents
Geographic Diversification
We believe our geographic diversification provides additional stability through exposure to various markets and balancing different seasonality profiles. As of March 31, 2024, we were present in 19 countries, with the United States comprising 70% of our global warehousing segment revenues for the twelve months ended March 31, 2024, and within the United States, we are present in 36 states, with no state accounting for more than 15.4% of our global warehousing segment revenue for the twelve months ended March 31, 2024. As of March 31, 2024, 97% of our global warehousing segment revenue was generated in countries in which we believe our local network of temperature-controlled warehouses is the largest, as measured by cubic feet of capacity. Our portfolio includes locations in top metropolitan statistical areas with high population density, ports with significant global trade, transportation hubs with significant domestic trade and critical food production areas. We believe that this diversification makes our portfolio resilient to local, regional and country-specific impacts such as weather events, labor disputes, currency fluctuations and population shifts.
The following maps show the locations of our temperature-controlled warehouses around the world as of March 31, 2024.
Note: Includes 19 warehouses in our global integrated solutions segment and countries where we only have a presence through our global integrated solutions segment for the twelve months ended March 31, 2024.
(1) | Based on global warehousing segment revenues. Reflects countries in which our local network of temperature-controlled warehouses is the largest, as measured by cubic feet capacity. |
187
Table of Contents
Global Map of Assets with Population Density
(1) | U.S. data per U.S. Census Bureau, ArcGis, public filings and SNL. |
(2) | Non-U.S. data per NASA Socioeconomic Data and Applications Center (SEDAC) managed by the Center for International Earth Science Information Network (CIESIN), Earth Institute, Columbia University. |
Commodity Diversification
We store a wide variety of frozen and perishable food and other products in our temperature-controlled warehouses, such as seafood, packaged foods, proteins, fruits and vegetables and dairy, at all stages of production from processing of raw materials to assembly of finished products. The diversity of the product mix in our temperature-controlled warehouses helps insulate us from commodity volatility, shifts in consumer preferences and other macro-economic forces. The following table sets forth information concerning the types of commodities that our customers store in our warehouses based on a percentage of our global warehousing segment revenues for the twelve months ended March 31, 2024.
188
Table of Contents
Commodity Type as Percentage of Global Warehousing Segment Revenue
Note: Percentages may not sum to 100% due to rounding.
Features of our Warehouses
Our warehouses include features intended to meet the “mission-critical” role they serve in the cold chain. Some of our warehouses include customized racking systems that allow for the storage of products on pallets in horizontal rows across vertically stacked levels in an efficient and secure manner. Our racking systems can accommodate a wide array of different customer storage needs. In addition, some of our warehouses also include advanced conveyors and automated pallet putaway and retrieval systems, high volume refrigeration systems, refrigerated docks, specialized fire suppression systems, insulated and heated floors and state-of-the-art temperature-control systems that can implement distinct climate zones within the same warehouse. We believe that our warehouses are well-maintained and in good operating condition.
Occupancy of our Warehouses
Economic and physical occupancy of an individual warehouse is impacted by a number of factors, including the type of warehouse (i.e., distribution, public, production advantaged or managed), specific customer needs in the markets served by the warehouse, timing of harvests or protein production for customers of the warehouse, the existence of leased but unoccupied pallet positions and the adverse effect of weather or market conditions on the customers of the warehouse. On a portfolio-wide basis, economic and physical occupancy rates and warehouse revenues generally peak between mid-September and early December in connection with the holiday season and the peak harvest season in the northern hemisphere. Economic and physical occupancy rates and warehouse revenues on a portfolio-wide basis are generally the lowest during May and June.
Economic and physical occupancy varies across our warehouse portfolio by warehouse and warehouse type because our warehouses are configured to accommodate the individual needs of our customers. We do not believe that a 100% physical occupancy rate is an ideal target for utilization of our warehouses because optimizing pallet throughput and efficient delivery of relevant warehouse services requires a certain amount of free pallet position capacity at all times in order to be able to efficiently place, store and retrieve products from pallet positions, particularly during periods of greatest occupancy or highest volume.
We plan to expand our use of minimum storage guarantees that pay us minimum or fixed storage fees for pallet positions, whether or not a minimum number of pallet positions are physically occupied. We believe that transitioning customer contracts from on-demand, as-utilized structures to minimum storage guarantee structures
189
Table of Contents
will drive NOI growth and consistency by maintaining our storage revenues during periods of lower inventories, while allowing customers to reserve space to meet their needs. For the twelve months ended March 31, 2024, 41.8% of our storage revenues were subject to minimum storage guarantees. We believe that implementing minimum storage guarantees will continue to boost recurring revenue and enhance stability of cash flows, while allowing customers to plan for periods of increased need by reserving capacity.
The following chart illustrates average economic and physical occupancy in our global warehousing segment for (i) each quarter during the years ended December 31, 2021, 2022 and 2023, (ii) each of the years ended December 31, 2021, 2022 and 2023 and (iii) the quarter and twelve months ended March 31, 2024.
Average Economic and Physical Occupancy
in Our Global Warehousing Segment
Throughput at our Warehouses
The level and nature of throughput at our warehouses is an important factor impacting our warehouse services revenues. Throughput refers to the volume of inbound pallets that enter our warehouses plus the volume of outbound pallets that exit our warehouses, divided by two. Higher levels of throughput drive warehouse services revenues in our global warehousing segment, as customers are typically billed transactionally for these services. The nature of throughput may be driven by the expected inventory turns of the underlying product or commodity.
Ownership of our Real Estate
Historically, we have owned a significant majority of our warehouses as opposed to leasing those warehouses or entering into warehouse management arrangements with third-party owners. As of March 31, 2024, we owned approximately 80% of our global warehousing portfolio as a percentage of square feet, including ground leases and real estate for which we possess bargain purchase options, and we leased or managed 20% of our global warehousing portfolio as a percentage of square feet. We believe that the ownership of our warehouses provides us with cost of capital and balance sheet advantages, stemming from the attractive financing options available to real estate owners and the tax advantages of being a REIT. Additionally, in an acquisition, we would have the ability to utilize our “UPREIT” operating partnership structure to provide attractive tax-advantaged consideration (i.e., interests in our operating partnership) to potential sellers. We also believe that consolidation of the ownership and operation of our warehouses significantly enhances the value of our business by allowing us to provide customers with our complementary suite of warehouse services across one integrated and reliable cold chain network. Ownership of our integrated cold chain network enhances our ability to efficiently reposition customers and undertake capital improvements or other modifications on their behalf without the need to obtain third-party approvals that might otherwise be required for leasehold facilities or managed facilities owned by third parties. Our decision to own, rather than lease, a significant majority of our warehouses provides us with better control over the specialized nature of our assets and greater influence over our warehouse locations on a long-term basis, which is crucial to meeting our customers’ “mission-critical” cold chain needs and allows us to enhance our suite of services.
190
Table of Contents
A variety of factors influence our decision whether to own or to lease particular warehouses, including the rules applicable to REITs under the Code, specific customers’ requirements, our existing capacity and supply-demand imbalances, and, in the case of an acquisition of a temperature-controlled warehouse, the existing ownership structure.
Customer Overview
We believe that the average duration of our customer relationships demonstrate their “sticky” nature irrespective of the type of contract given the size and scope of our integrated warehouse network and the nature, quality and breadth of the services we provide. The weighted average length of our relationship with our 25 largest customers exceeds 30 years. The relationship lengths include periods where a customer was a customer of acquired companies prior to their acquisition.
The following table presents summary information on our 15 largest customers, based on total revenues for the twleve months ended March 31, 2024:
Percentage of Revenue(1) | Relationship Length (years)(3) | Network Utilization | ||||||||||||||||
Customer | Credit Ratings (S&P/Moody’s/Fitch)(2) | Number of Sites | Number of Countries | |||||||||||||||
Fruits & Vegetables | 3.3 | % | BB+ / Ba2 / - | 41 | 26 | 5 | ||||||||||||
Retail Distribution | 3.1 | % | AA / Aa2 / AA | 32 | 18 | 2 | ||||||||||||
Beef / Poultry | 2.3 | % | BBB- / Baa3 / BBB- | 45 | 96 | 5 | ||||||||||||
Beef / Poultry | 2.1 | % | BBB / Baa2 / BBB | 49 | 57 | 4 | ||||||||||||
Packaged Foods | 2.1 | % | - / - / - | 25 | 41 | 9 | ||||||||||||
Retail Distribution | 1.6 | % | BBB / Baa2 / BBB | 49 | 5 | 1 | ||||||||||||
Beef / Poultry | 1.6 | % | BBB- / Ba1 / BBB | 6 | 32 | 4 | ||||||||||||
Packaged Foods | 1.4 | % | AA- / Aa3 / A+ | 14 | 22 | 5 | ||||||||||||
Retail Distribution | 1.2 | % | - / - / - | 48 | 4 | 1 | ||||||||||||
Beef / Poultry | 1.2 | % | A / A2 / A | 44 | 41 | 4 | ||||||||||||
Fruits & Vegetables | 1.1 | % | - / - / - | 36 | 22 | 4 | ||||||||||||
Retail Distribution | 1.1 | % | BBB / Baa2 / - | 8 | 9 | 2 | ||||||||||||
Retail Distribution | 1.0 | % | BBB / Baa1 / BBB | 22 | 35 | 5 | ||||||||||||
Retail Distribution | 0.9 | % | A / Baa2 / - | 18 | 7 | 1 | ||||||||||||
Packaged Foods | 0.9 | % | - / - / - | 40 | 25 | 4 | ||||||||||||
|
|
|
|
|
|
|
| |||||||||||
Total/Weighted Average(4) | 24.8 | % | — | 34 | 32 | 4 | ||||||||||||
|
|
(1) | Based on total revenues for the twleve months ended March 31, 2024. |
(2) | Represents long-term issuer ratings as of March 31, 2024, and includes ratings of customers’ parent entities that may or may not guarantee such customer’s obligations under its contracts with us. |
(3) | Relationship lengths includes periods where a customer was a customer of acquired companies prior to their acquisition. |
(4) | Total relationship length, number of sites and number of countries shown as a revenue-weighted average of top 15 customers. |
Warehouse Storage and Rent
Our global warehousing segment revenues are generated from storing frozen and perishable food and other products and providing related warehouse services for our customers. Storage revenues relate to the act of storing products for our customers within our warehouses. Storage revenues can be in the form of storage fees we charge customers for utilization of non-exclusive space or a set amount of reserved space in a warehouse, blast freezing fees we charge customers for utilization of specific ultra-cold spaces within a warehouse designed to rapidly reduce product temperature and rent we charge customers for the lease of warehouse space pursuant to a lease agreement.
191
Table of Contents
Warehouse Services
We provide warehouse services including, but not limited to:
• | receipt, handling and placement of products into the warehouse for storage and preservation; |
• | retrieval of products from storage upon customer request; |
• | case-picking, which involves selecting product cases from pallets to build a new pallet; |
• | building customized pallets and repackaging, as well as labeling services; |
• | order assembly and load consolidation; |
• | exporting and importing support services; |
• | container handling; |
• | cross-docking, which involves transferring inbound products to outbound trucks utilizing our warehouse docks without storing them in our warehouses; and |
• | government approved temperature-controlled storage and inspection services. |
Nature of Our Customer Contracts in Our Global Warehousing Segment
We utilize one of four types of contracts with our customers for use of space within our warehouses depending upon the individual needs and characteristics of the customer – warehouse agreements, rate letters, tariff sheets and lease agreements. We may have one contract with a customer that covers all of the warehouses where we store products for the customer or, more typically, multiple contracts with the same customer, which may be driven by a variety of factors, such as the geographic location of the products stored by the customer or the type of products stored by the customer or the different business units of a customer.
Warehouse Agreements. Warehouse agreements are intended to specifically outline the parameters of the relationship with the specific customer while incorporating much of our standard commercial business rule framework we seek to apply to all of our contractual relationships. Warehouse agreements are designed to accommodate the individual needs and characteristics of our customers and may include negotiated provisions such as minimum storage guarantees and specified durations. We believe these terms allow our customers access to temperature-controlled warehousing space for their products on a reliable and consistent basis and help us manage and project occupancy and throughput across our warehouse network and generate predictable cash flows. Our warehouse agreements entered into under this framework may include one or more of the following negotiated features:
• | A fixed term, with stated renewal periods. The initial term of our warehouse agreements generally ranges from one to five years for typical customer relationships and 10 to 20 years for build-to-suit warehouses. Renewal periods, in each case, generally range from one to five years. |
• | Transactional pricing for warehouse services, with the pricing for our storage and warehouse services based on the anticipated profile of our customer outlining the anticipated pallet occupancy of the customer, anticipated throughput of pallets delivered and retrieved annually and expectations regarding the warehouse services to be used by the customer. Many of our warehouse agreements provide us the flexibility to seek equitable rate increases if the actual customer relationship is materially different than that contained in the customer profile. |
• | Pricing increase mechanisms based on inflationary cost increases and customer profile changes that materially affect our cost structures. These price increase mechanisms may be fixed or tied to relevant market indices, giving us the ability to recover cost increases which are incorporated in the indices, such as wage increases and increases in rent, power, real estate and other costs. Additionally, for customers whose contracts are not explicitly fixed or tied to relevant market indices, we typically negotiate rate increases annually to offset increases in wages, power or similar operating costs. |
192
Table of Contents
• | A storage fee based on a minimum storage guarantee of the customer, plus additional storage fees based on additional on demand storage used by the customer. Minimum storage guarantees provide us additional clarity around the expected occupancy of our warehouses and give our customers certainty around anticipated storage costs and dependable pallet availability over the term of the agreement. |
• | A warehouseman’s lien on customer products held in our warehouses as security for payments. |
• | Requirement that customers pay for services provided under the contract within 30 days or less after being invoiced and permitting us to charge interest for any late payments. |
Rate Letters. Rate letters are agreements that typically establish storage fee rates on products stored in our warehouses and rates for warehouse services pursuant to terms set forth on a standardized warehouse receipt and related rate schedule. Rate letters may have terms similar to our warehouse agreements, including minimum storage guarantees, and are typically for a term of one year or less. Our standard terms and conditions afford us favorable, industry-standard contractual protections and are generally not subject to negotiation with customers that enter into rate letters, other than relating to minimum storage guarantees or other commitments. Rate letters generally require our customers to pay for storage in seven to 30-day increments, with the majority of our rate letters in the United States using 30-day increments, beginning when customers’ products are delivered to our warehouses. We generally charge storage fees based on the number of pallets our customers occupy under rate letters; however, like warehouse agreements, our rate letters may provide for minimum storage or other guarantees. Rate letters typically also include mechanisms to adjust rates for inflationary cost increases or customer profile changes.
Tariff Sheets. Similar to rate letters, tariff sheets are agreements that establish storage fee rates on products stored in our warehouses and rates for warehouse services on an as-utilized, on-demand basis, pursuant to terms set forth on a standardized warehouse receipt but that do not require the customer to use our warehouse or for us to reserve space for these customers; however, our tariff sheets in certain jurisdictions may provide for a de minimis minimum monthly payment from a customer to maintain its access to a given warehouse. Tariff sheets are non-negotiable and based on our standard terms and conditions and a tariff rate schedule. Our tariff sheets are updated annually, and the agreements are also short-term in nature and can generally be updated upon 30-days’ advance notice, which provides the flexibility to pass through inflationary cost increases.
Leases. We lease space to certain customers that desire to manage their own temperature-controlled warehousing or carry on processing operations in warehouses adjacent, or in close proximity, to their production facilities. As of March 31, 2024, we owned 26 facilities which were wholly leased to customers with approximately 148.5 million cubic feet of temperature-controlled capacity and had separately entered into 165 leases with individual warehouse customers to lease a room or space in our other warehouses. Our customer leased warehouses are typically leased to third parties, such as food producers, distributors and retailers, under triple net lease agreements pursuant to which the customer is responsible for all costs incurred for facility maintenance, insurance, taxes, utilities and other services necessary or appropriate for the applicable warehouse and the business conducted at the applicable warehouse. We typically charge our customers that are party to these leases rent based on the square footage leased in our warehouses. Our leases of less than a full facility to individual customers are typically on a “gross” or “modified gross” basis that generally require the landlord to pay for maintenance and repairs of common areas and building systems and hold the tenant responsible for all or certain other costs. We consider the creditworthiness of a potential tenant to be an important consideration in determining whether to engage in a new lease agreement. Credit evaluations may include a general business credit background and/or business reports with respect to a potential tenant prior to entering into a new lease. With respect to any proposed lease of material size, duration, or capital outlay, we may also require, among other things, historical financial statements for review and evaluation.
The following table sets forth a summary schedule of the expirations for any customer contracts featuring minimum storage guarantees and for leases in effect as of March 31, 2024 and for the partial year beginning April 1, 2024 and each of the periods set forth below occurring thereafter. The information set forth in the table assumes no exercise of extension options under these contracts and leases.
193
Table of Contents
Number of Contracts | Annualized Committed Rent & Storage Revenue(1) | % of Total Rent & Storage Revenue | ||||||||||
Month to Month | 98 | 57,036 | 6.6 | % | ||||||||
2024 | 429 | 345,564 | 39.9 | % | ||||||||
2025 | 152 | 132,561 | 15.3 | % | ||||||||
2026 | 78 | 63,528 | 7.3 | % | ||||||||
2027 | 33 | 30,440 | 3.5 | % | ||||||||
2028 | 37 | 51,058 | 5.9 | % | ||||||||
2029 | 7 | 8,417 | 1.0 | % | ||||||||
2030 | 12 | 14,267 | 1.6 | % | ||||||||
2031 | 5 | 7,522 | 0.9 | % | ||||||||
2032 | 6 | 23,074 | 2.7 | % | ||||||||
2033 | 5 | 8,126 | 0.9 | % | ||||||||
2034 | 1 | 90 | 0.0 | % | ||||||||
2035 and thereafter | 19 | 125,067 | 14.4 | % | ||||||||
|
|
|
|
|
| |||||||
Total | 882 | 866,750 | 100.0 | % | ||||||||
|
|
|
|
|
|
(1) | Represents monthly minimum storage guarantees and lease rental payments under the applicable warehouse agreements, rate letters and leases as of March 31, 2024, multiplied by 12. |
Warehouses in Our Global Warehousing Segment
The following table provides information regarding the temperature-controlled warehouses in our global warehousing segment that we owned, leased or managed as of March 31, 2024:
Size | ||||||||||||||||||||||||||||||
Facility | City | US State | Country | Warehouse Type | Automation Level | 30-Miles from Port | Square Feet (000s) | Cubic Feet (in millions) | Pallet Positions (in 000s) | # Warehouses | ||||||||||||||||||||
Oxford | Laverton | n/a | Australia | Distribution | Semi-Automated | Port | 1,176 | 45 | 163 | 11 | ||||||||||||||||||||
Lurnea | Lurnea | n/a | Australia | Distribution | Conventional | Port | 341 | 12 | 46 | 2 | ||||||||||||||||||||
Laverton | Laverton North | n/a | Australia | Distribution | Conventional | Port | 318 | 13 | 44 | 1 | ||||||||||||||||||||
Allansford | Allansford | n/a | Australia | Production Advantaged | Conventional | Port | 194 | 6 | 36 | 2 | ||||||||||||||||||||
Hemmant 1 & 3 | Hemmant | n/a | Australia | Distribution | Conventional | Port | 220 | 7 | 35 | 2 | ||||||||||||||||||||
Cannon Hill | Cannon Hill | n/a | Australia | Production Advantaged | Conventional | Port | 226 | 7 | 29 | 1 | ||||||||||||||||||||
Truganina | Truganina | n/a | Australia | Distribution | Conventional | Port | 169 | 7 | 29 | 1 | ||||||||||||||||||||
Dry Creek 1-3 | Cavan | n/a | Australia | Distribution | Conventional | Port | 210 | 6 | 28 | 3 | ||||||||||||||||||||
Lyndhurst | Dandenong South | n/a | Australia | Distribution | Conventional | Port | 229 | 6 | 19 | 1 | ||||||||||||||||||||
Hemmant 2 | Hemmant | n/a | Australia | Distribution | Conventional | Port | 187 | 6 | 19 | 1 | ||||||||||||||||||||
Tullamarine | Tullamarine | n/a | Australia | Distribution | Conventional | Port | 182 | 5 | 18 | 2 | ||||||||||||||||||||
Welshpool | Welshpool | n/a | Australia | Distribution | Conventional | Port | 100 | 4 | 18 | 1 | ||||||||||||||||||||
Edinburgh | Adelaide | n/a | Australia | Distribution | Conventional | Port | 152 | 5 | 11 | 1 | ||||||||||||||||||||
Banjup | Jandakot | n/a | Australia | Distribution | Conventional | Port | 200 | 6 | 10 | 1 | ||||||||||||||||||||
Ieper & Y-Frost | Ieper | n/a | Belgium | Public | Automated | 230 | 17 | 105 | 1 | |||||||||||||||||||||
Rijkevorsel | Rijkevorsal | n/a | Belgium | Distribution | Semi-Automated | Port | 184 | 5 | 23 | 1 | ||||||||||||||||||||
Kortrijk | Kortrijk | n/a | Belgium | Distribution | Semi-Automated | 193 | 7 | 19 | 1 | |||||||||||||||||||||
Milton | Milton | n/a | Canada | Distribution | Conventional | 522 | 18 | 50 | 1 | |||||||||||||||||||||
Dawson | Winnipeg | n/a | Canada | Distribution | Conventional | 325 | 9 | 28 | 1 | |||||||||||||||||||||
Walker | Brampton | n/a | Canada | Distribution | Conventional | 251 | 9 | 27 | 1 | |||||||||||||||||||||
Laval | Laval | n/a | Canada | Distribution | Conventional | Port | 177 | 4 | 27 | 1 | ||||||||||||||||||||
Vaughan | Vaughn | n/a | Canada | Distribution | Conventional | 149 | 8 | 24 | 1 | |||||||||||||||||||||
Cote de Liesse | St. Laurent | n/a | Canada | Distribution | Conventional | Port | 192 | 9 | 24 | 1 |
194
Table of Contents
Size | ||||||||||||||||||||||||||||||
Facility | City | US State | Country | Warehouse Type | Automation Level | 30-Miles from Port | Square Feet (000s) | Cubic Feet (in millions) | Pallet Positions (in 000s) | # Warehouses | ||||||||||||||||||||
Valley | Abbotsford | n/a | Canada | Distribution | Conventional | 183 | 5 | 23 | 1 | |||||||||||||||||||||
Thomas Street | Ingersoll | n/a | Canada | Public | Conventional | 287 | 8 | 23 | 1 | |||||||||||||||||||||
Lachine | Lachine | n/a | Canada | Distribution | Conventional | Port | 302 | 9 | 23 | 1 | ||||||||||||||||||||
Great Plains | Calgary | n/a | Canada | Distribution | Conventional | 180 | 7 | 22 | 1 | |||||||||||||||||||||
Bayside | Bayside | n/a | Canada | Public | Conventional | Port | 156 | 3 | 21 | 1 | ||||||||||||||||||||
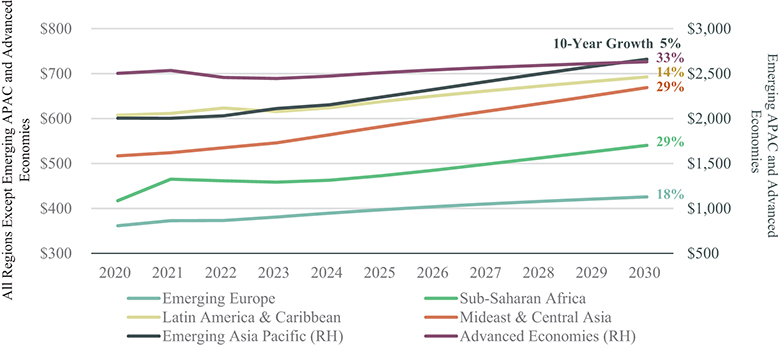
Commerce Way | Woodstock | n/a | Canada | Public | Semi-Automated | 108 | 5 | 19 | 1 | |||||||||||||||||||||
Foothills | Calgary | n/a | Canada | Distribution | Conventional | 142 | 6 | 18 | 1 | |||||||||||||||||||||
London | London | n/a | Canada | Distribution | Conventional | 144 | 3 | 17 | 1 | |||||||||||||||||||||
Ingersoll Street | Ingersoll | n/a | Canada | Public | Conventional | 154 | 3 | 15 | 1 | |||||||||||||||||||||
Parkinson Road | Woodstock | n/a | Canada | Public | Semi-Automated | 101 | 4 | 14 | 1 | |||||||||||||||||||||
St-Francois | Saint-Laurent | n/a | Canada | Distribution | Conventional | Port | 208 | 5 | 13 | 1 | ||||||||||||||||||||
Cliveden | Delta | n/a | Canada | Distribution | Conventional | Port | 93 | 3 | 13 | 1 | ||||||||||||||||||||
Delta | Delta | n/a | Canada | Distribution | Conventional | Port | 88 | 4 | 12 | 1 | ||||||||||||||||||||
Moncton | Moncton | n/a | Canada | Public | Conventional | 137 | 4 | 11 | 1 | |||||||||||||||||||||
Hamilton | Hamilton | n/a | Canada | Distribution | Conventional | 234 | 5 | 11 | 1 | |||||||||||||||||||||
Pettipas | Dartmouth | n/a | Canada | Public | Conventional | Port | 138 | 3 | 9 | 1 | ||||||||||||||||||||
Surrey | Surrey | n/a | Canada | Distribution | Conventional | Port | 74 | 3 | 9 | 1 | ||||||||||||||||||||
Edmonton North | Edmonton | n/a | Canada | Distribution | Conventional | 94 | 3 | 9 | 1 | |||||||||||||||||||||
Brandon | Calgary | n/a | Canada | Distribution | Conventional | 88 | 2 | 7 | 1 | |||||||||||||||||||||
MVI Montreal | Vaudreuil-Dorion | n/a | Canada | Distribution | Conventional | Port | 55 | 2 | 7 | 1 | ||||||||||||||||||||
Lethbridge | Lethbridge | n/a | Canada | Distribution | Conventional | 63 | 2 | 6 | 1 | |||||||||||||||||||||
Derwent | Delta | n/a | Canada | Distribution | Conventional | Port | 85 | 3 | 6 | 1 | ||||||||||||||||||||
Edmonton South | Edmonton | n/a | Canada | Distribution | Conventional | 58 | 1 | 5 | 1 | |||||||||||||||||||||
Mount Pearl | Mt. Pearl | n/a | Canada | Public | Conventional | Port | 50 | 1 | 3 | 1 | ||||||||||||||||||||
127th Ave | Edmonton | n/a | Canada | Distribution | Conventional | 29 | 1 | 2 | 1 | |||||||||||||||||||||
Vejle | Vejle | n/a | Denmark | Distribution | Automated | 323 | 11 | 67 | 1 | |||||||||||||||||||||
Kolding | Kolding | n/a | Denmark | Distribution | Semi-Automated | Port | 262 | 8 | 40 | 1 | ||||||||||||||||||||
Hirtshals | Hirtshals | n/a | Denmark | Public | Semi-Automated | Port | 330 | 8 | 32 | 2 | ||||||||||||||||||||
Padborg | Padborg | n/a | Denmark | Distribution | Semi-Automated | Port | 270 | 6 | 32 | 1 | ||||||||||||||||||||
Hanstholm | Hanstholm | n/a | Denmark | Public | Semi-Automated | Port | 287 | 5 | 30 | 2 | ||||||||||||||||||||
Aarhus | Aarhus | n/a | Denmark | Distribution | Semi-Automated | Port | 159 | 6 | 27 | 1 | ||||||||||||||||||||
Engesvang | Engesvang | n/a | Denmark | Production Advantaged | Semi-Automated | 130 | 3 | 25 | 1 | |||||||||||||||||||||
Kanalholmen 15 (Avedore) | Copenhagen | n/a | Denmark | Distribution | Semi-Automated | Port | 221 | 6 | 19 | 1 | ||||||||||||||||||||
Coldstar | Vejle | n/a | Denmark | Distribution | Automated | 185 | 6 | 17 | 1 | |||||||||||||||||||||
Skagen | Skagen | n/a | Denmark | Public | Semi-Automated | Port | 208 | 4 | 10 | 2 | ||||||||||||||||||||
Scanpo Superfrost | Regstrup | n/a | Denmark | Public | Semi-Automated | 59 | 2 | 9 | 1 | |||||||||||||||||||||
Bellinge | Odense S | n/a | Denmark | Distribution | Conventional | Port | 107 | 2 | 7 | 1 | ||||||||||||||||||||
Svenstrup | Svenstrup | n/a | Denmark | Public | Conventional | Port | 100 | 2 | 5 | 1 | ||||||||||||||||||||
Heywood | Heywood | n/a | England | Distribution | Semi-Automated | 450 | 17 | 79 | 1 | |||||||||||||||||||||
Wisbech 1 | Wisbech | n/a | England | Distribution | Automated | 217 | 17 | 78 | 1 | |||||||||||||||||||||
Gloucester | Gloucester | n/a | England | Production Advantaged | Automated | 233 | 16 | 72 | 1 | |||||||||||||||||||||
Peterborough | Peterborough | n/a | England | Distribution | Automated | 227 | 17 | 71 | 1 | |||||||||||||||||||||
Belle Eau Park | Bilsthorpe | n/a | England | Distribution | Semi-Automated | 465 | 17 | 45 | 2 | |||||||||||||||||||||
Hams Hall | Coleshill | n/a | England | Distribution | Automated | 195 | 13 | 45 | 1 | |||||||||||||||||||||
Grimsby | Grimsby | n/a | England | Public | Automated | Port | 269 | 12 | 42 | 1 | ||||||||||||||||||||
Holmewood | Holmewood | n/a | England | Distribution | Semi-Automated | 342 | 10 | 36 | 1 | |||||||||||||||||||||
Bristol | Bristol | n/a | England | Distribution | Automated | Port | 173 | 7 | 26 | 1 |
195
Table of Contents
Size | ||||||||||||||||||||||||||||||
Facility | City | US State | Country | Warehouse Type | Automation Level | 30-Miles from Port | Square Feet (000s) | Cubic Feet (in millions) | Pallet Positions (in 000s) | # Warehouses | ||||||||||||||||||||
Seaham | Seaham | n/a | England | Public | Semi-Automated | Port | 122 | 4 | 21 | 1 | ||||||||||||||||||||
Coleshill | Coleshill | n/a | England | Distribution | Semi-Automated | 153 | 4 | 12 | 1 | |||||||||||||||||||||
Gillingham | Gillingham | n/a | England | Distribution | Conventional | Port | 60 | 2 | 9 | 1 | ||||||||||||||||||||
Harnes I | Harnes | n/a | France | Distribution | Automated | 400 | 30 | 129 | 1 | |||||||||||||||||||||
Arras | Bailleul Sir Berthoult | n/a | France | Distribution | Semi-Automated | 321 | 22 | 44 | 2 | |||||||||||||||||||||
Romans-sur-Isère—Rue Nicolas Appert | Romans-sur-Isère | n/a | France | Managed | Conventional | 87 | 3 | 0 | 1 | |||||||||||||||||||||
Bremerhaven | Bremerhaven | n/a | Germany | Distribution | Semi-Automated | Port | 213 | 6 | 27 | 1 | ||||||||||||||||||||
Kantaro | Gattatico | n/a | Italy | Distribution | Conventional | 238 | 4 | 10 | 2 | |||||||||||||||||||||
Bergen op Zoom | Bergen op Zoom | n/a | Netherlands | Distribution | Automated | Port | 475 | 37 | 176 | 1 | ||||||||||||||||||||
Vlissingen | TE Nieuwdorp | n/a | Netherlands | Distribution | Conventional | Port | 1,832 | 53 | 176 | 12 | ||||||||||||||||||||
Delta Terminal | LS Rotterdam Maasvlakte | n/a | Netherlands | Distribution | Automated | Port | 457 | 27 | 91 | 1 | ||||||||||||||||||||
Velsen | NK Velsen Noord | n/a | Netherlands | Distribution | Conventional | Port | 573 | 20 | 78 | 1 | ||||||||||||||||||||
Cool Port Rotterdam II | Rotterdam | n/a | Netherlands | Distribution | Automated | Port | 208 | 16 | 58 | 1 | ||||||||||||||||||||
Cool Port Rotterdam | GD ROTTERDAM | n/a | Netherlands | Distribution | Semi-Automated | Port | 379 | 14 | 51 | 1 | ||||||||||||||||||||
Beneden-Leeuwen | Beneden- Leeuwen | n/a | Netherlands | Distribution | Semi-Automated | 386 | 11 | 45 | 1 | |||||||||||||||||||||
Ijmuiden | CB Ijmuiden | n/a | Netherlands | Distribution | Conventional | Port | 269 | 7 | 41 | 1 | ||||||||||||||||||||
Waalwijk | Waalwijk | n/a | Netherlands | Production Advantaged | Automated | 99 | 8 | 36 | 1 | |||||||||||||||||||||
Lelystad | PZ LELYSTAD | n/a | Netherlands | Production Advantaged | Automated | Port | 145 | 9 | 35 | 1 | ||||||||||||||||||||
Heerenberg | Heerenberg | n/a | Netherlands | Public | Semi-Automated | 264 | 8 | 33 | 1 | |||||||||||||||||||||
Gameren | Gameren | n/a | Netherlands | Distribution | Conventional | 322 | 8 | 32 | 1 | |||||||||||||||||||||
Harlingen | NV Harlingen | n/a | Netherlands | Distribution | Conventional | Port | 152 | 4 | 26 | 1 | ||||||||||||||||||||
Venlo | Venlo | n/a | Netherlands | Distribution | Conventional | 112 | 3 | 18 | 1 | |||||||||||||||||||||
Rotterdam frigoCare | Rotterdam | n/a | Netherlands | Distribution | Conventional | Port | 129 | 3 | 15 | 1 | ||||||||||||||||||||
Hoogerheide | Hoogerheide | n/a | Netherlands | Distribution | Conventional | Port | 78 | 2 | 13 | 1 | ||||||||||||||||||||
VC Asten | Asten | n/a | Netherlands | Production Advantaged | Semi-Automated | 92 | 2 | 9 | 1 | |||||||||||||||||||||
De Mossel | Noord- Scharwoude | n/a | Netherlands | Public | Conventional | Port | 46 | 1 | 5 | 2 | ||||||||||||||||||||
83 Beach Road | Richmond | n/a | New Zealand | Distribution | Conventional | Port | 181 | 5 | 42 | 4 | ||||||||||||||||||||
Hawkes Bay 50—E Block | Whakatu | n/a | New Zealand | Distribution | Conventional | Port | 316 | 6 | 32 | 2 | ||||||||||||||||||||
Hawkes Bay 53—W.I.P | Whakatu | n/a | New Zealand | Public | Conventional | Port | 153 | 3 | 21 | 7 | ||||||||||||||||||||
Timaru 32— Dawson St | Timaru | n/a | New Zealand | Public | Conventional | Port | 170 | 3 | 20 | 6 | ||||||||||||||||||||
Auckland 75—Wiri | Auckland | n/a | New Zealand | Distribution | Conventional | Port | 128 | 5 | 19 | 1 | ||||||||||||||||||||
Sulphur Point | Sulphur Point | n/a | New Zealand | Distribution | Conventional | Port | 120 | 4 | 18 | 1 | ||||||||||||||||||||
Hawkes Bay 52—Kirkwood Rd | Whakatu | n/a | New Zealand | Public | Conventional | Port | 115 | 3 | 18 | 3 |
196
Table of Contents
Size | ||||||||||||||||||||||||||||||
Facility | City | US State | Country | Warehouse Type | Automation Level | 30-Miles from Port | Square Feet (000s) | Cubic Feet (in millions) | Pallet Positions (in 000s) | # Warehouses | ||||||||||||||||||||
Tauranga | Tauriko | n/a | New Zealand | Distribution | Conventional | Port | 92 | 3 | 16 | 1 | ||||||||||||||||||||
73 Vickerman Street | Port Nelson | n/a | New Zealand | Public | Conventional | Port | 164 | 4 | 15 | 1 | ||||||||||||||||||||
Christchurch 25—Foundry Drive | Christchurch | n/a | New Zealand | Public | Conventional | Port | 86 | 2 | 15 | 1 | ||||||||||||||||||||
Christchurch 24—Canada Crescent | Christchurch | n/a | New Zealand | Public | Conventional | Port | 102 | 3 | 14 | 2 | ||||||||||||||||||||
Hawkes Bay 59—Portstore | Whakatu | n/a | New Zealand | Public | Conventional | Port | 48 | 1 | 13 | 1 | ||||||||||||||||||||
Timaru 34—DB 2 | Timaru | n/a | New Zealand | Public | Conventional | Port | 72 | 2 | 12 | 1 | ||||||||||||||||||||
Waikato / BOP 65—Kerepehi | Kerepehi | n/a | New Zealand | Public | Conventional | 78 | 2 | 11 | 1 | |||||||||||||||||||||
160 Vickerman Street | Port Nelson | n/a | New Zealand | Public | Conventional | Port | 69 | 2 | 10 | 1 | ||||||||||||||||||||
Dunedin 18—Silverstream | Dunedin | n/a | New Zealand | Public | Conventional | Port | 102 | 2 | 10 | 1 | ||||||||||||||||||||
Christchurch 29—Braeburn Drive | Christchurch | n/a | New Zealand | Public | Conventional | Port | 93 | 2 | 9 | 1 | ||||||||||||||||||||
Broad St. | Christchurch | n/a | New Zealand | Public | Conventional | Port | 101 | 2 | 8 | 2 | ||||||||||||||||||||
Dunedin 10—French St | Dunedin | n/a | New Zealand | Public | Conventional | Port | 31 | 1 | 7 | 1 | ||||||||||||||||||||
Christchurch—Watts Rd | Sockburn | n/a | New Zealand | Distribution | Conventional | Port | 87 | 2 | 7 | 4 | ||||||||||||||||||||
Christchurch 20—Prebbleton | Christchurch | n/a | New Zealand | Public | Conventional | Port | 52 | 1 | 6 | 2 | ||||||||||||||||||||
Te Maire | Mt Maunganui | n/a | New Zealand | Distribution | Conventional | Port | 59 | 1 | 6 | 2 | ||||||||||||||||||||
Timaru 36—Butter Store | Timaru | n/a | New Zealand | Public | Conventional | Port | 41 | 1 | 5 | 1 | ||||||||||||||||||||
Christchurch 26—Curries Rd | Christchurch | n/a | New Zealand | Public | Conventional | Port | 17 | 1 | 3 | 1 | ||||||||||||||||||||
Hawkes Bay 58—Railway Rd | Whakatu | n/a | New Zealand | Public | Conventional | Port | 28 | 1 | 2 | 1 | ||||||||||||||||||||
Oslo (Drammen) | Drammen | n/a | Norway | Distribution | Semi-Automated | Port | 152 | 4 | 32 | 1 | ||||||||||||||||||||
Larvik | Larvik | n/a | Norway | Distribution | Semi-Automated | Port | 98 | 3 | 19 | 1 | ||||||||||||||||||||
Moss | Moss | n/a | Norway | Distribution | Semi-Automated | Port | 103 | 3 | 16 | 1 | ||||||||||||||||||||
Gdansk | Gdańsk | n/a | Poland | Distribution | Semi-Automated | Port | 203 | 8 | 43 | 1 | ||||||||||||||||||||
Dąbrowa Górnicza | Dąbrowa Górnicza | n/a | Poland | Distribution | Semi-Automated | 164 | 7 | 39 | 1 | |||||||||||||||||||||
Lębork | Lębork | n/a | Poland | Production Advantaged | Semi-Automated | 123 | 5 | 34 | 1 | |||||||||||||||||||||
Bieniewo | Bieniewo-Parcela | n/a | Poland | Distribution | Semi-Automated | 230 | 8 | 31 | 1 | |||||||||||||||||||||
Grodzisk | Grodzisk Wielkopolski | n/a | Poland | Public | Semi-Automated | 97 | 5 | 24 | 1 | |||||||||||||||||||||
Gnatowice Stare | Gnatowice Stare | n/a | Poland | Public | Semi-Automated | 116 | 4 | 20 | 1 | |||||||||||||||||||||
Bellshill | Bellshill | n/a | Scotland | Public | Conventional | 133 | 4 | 11 | 1 | |||||||||||||||||||||
Mandai Link—Main | Singapore | n/a | Singapore | Distribution | Automated | Port | 186 | 8 | 27 | 1 |
197
Table of Contents
Size | ||||||||||||||||||||||||||||||
Facility | City | US State | Country | Warehouse Type | Automation Level | 30-Miles from Port | Square Feet (000s) | Cubic Feet (in millions) | Pallet Positions (in 000s) | # Warehouses | ||||||||||||||||||||
Mandai Link—Overflow | Singapore | n/a | Singapore | Distribution | Conventional | Port | 0 | 0 | 3 | 2 | ||||||||||||||||||||
Frinavarra | Navarra | n/a | Spain | Public | Automated | 559 | 24 | 113 | 1 | |||||||||||||||||||||
Serfrial | Murcia | n/a | Spain | Public | Conventional | 326 | 7 | 64 | 1 | |||||||||||||||||||||
Frioastur | Asturias | n/a | Spain | Public | Conventional | Port | 64 | 1 | 4 | 1 | ||||||||||||||||||||
Sri Lanka | Colombo | n/a | Sri Lanka | Distribution | Conventional | Port | 105 | 3 | 15 | 1 | ||||||||||||||||||||
Richland | Richland | WA | USA | Production Advantaged | Automated | 642 | 51 | 159 | 1 | |||||||||||||||||||||
Quincy | Quincy | WA | USA | Production Advantaged | Conventional | 619 | 21 | 135 | 2 | |||||||||||||||||||||
Pasco | Pasco | WA | USA | Public | Conventional | 599 | 10 | 135 | 2 | |||||||||||||||||||||
Joliet | Joliet | IL | USA | Distribution | Conventional | 800 | 35 | 106 | 1 | |||||||||||||||||||||
Stevens Point | Stevens Point | WI | USA | Distribution | Conventional | 706 | 29 | 92 | 1 | |||||||||||||||||||||
Lynden | Lynden | WA | USA | Public | Conventional | Port | 474 | 16 | 90 | 1 | ||||||||||||||||||||
Big Bear | Los Angeles | CA | USA | Distribution | Conventional | Port | 488 | 28 | 89 | 1 | ||||||||||||||||||||
Brockport 1-3 | Brockport | NY | USA | Public | Conventional | 968 | 27 | 87 | 3 | |||||||||||||||||||||
Oxnard | Oxnard | CA | USA | Distribution | Conventional | Port | 536 | 16 | 85 | 8 | ||||||||||||||||||||
Kennewick | Kennewick | WA | USA | Production Advantaged | Conventional | 521 | 19 | 75 | 1 | |||||||||||||||||||||
Fort Worth—Gold Spike | Fort Worth | TX | USA | Distribution | Conventional | 701 | 24 | 72 | 1 | |||||||||||||||||||||
Allentown | Allentown | PA | USA | Distribution | Conventional | 793 | 28 | 68 | 1 | |||||||||||||||||||||
Grandview 2 | Grandview | WA | USA | Public | Conventional | 468 | 14 | 67 | 8 | |||||||||||||||||||||
Win Chill | Sioux Falls | SD | USA | Distribution | Conventional | 454 | 21 | 66 | 1 | |||||||||||||||||||||
Mira Loma | Mira Loma | CA | USA | Distribution | Conventional | 685 | 24 | 64 | 1 | |||||||||||||||||||||
Kansas City (Edwardsville) | Edwardsville | KS | USA | Distribution | Conventional | 655 | 21 | 64 | 1 | |||||||||||||||||||||
Atlanta (McDonough) | McDonough | GA | USA | Distribution | Conventional | 637 | 21 | 61 | 1 | |||||||||||||||||||||
Denver (Henderson) | Henderson | CO | USA | Distribution | Semi-Automated | 553 | 21 | 61 | 1 | |||||||||||||||||||||
Brooks | Brooks | OR | USA | Production advantaged | Conventional | 389 | 12 | 58 | 1 | |||||||||||||||||||||
Twin Falls | Twin Falls | ID | USA | Production Advantaged | Conventional | 471 | 16 | 58 | 2 | |||||||||||||||||||||
Othello | Othello | WA | USA | Production Advantaged | Semi-Automated | 411 | 17 | 58 | 1 | |||||||||||||||||||||
Olathe | Olathe | KS | USA | Distribution | Automated | 395 | 21 | 56 | 1 | |||||||||||||||||||||
Dallas (Sunnyvale) | Sunnyvale | TX | USA | Distribution | Semi-Automated | 409 | 19 | 55 | 1 | |||||||||||||||||||||
Chicago (Geneva) | Geneva | IL | USA | Distribution | Conventional | 603 | 20 | 54 | 1 | |||||||||||||||||||||
Houston Gulf | Pasadena | TX | USA | Distribution | Conventional | Port | 332 | 18 | 51 | 1 | ||||||||||||||||||||
Albany | Albany | GA | USA | Public | Conventional | 839 | 17 | 49 | 9 | |||||||||||||||||||||
Dallas Hunt Southwest | Fort Worth | TX | USA | Distribution | Conventional | 292 | 14 | 49 | 1 | |||||||||||||||||||||
Hobart | Hobart | IN | USA | Distribution | Conventional | 353 | 15 | 45 | 1 | |||||||||||||||||||||
Prosser | Prosser | WA | USA | Public | Conventional | 281 | 9 | 44 | 1 | |||||||||||||||||||||
McAllen—West Military | McAllen | TX | USA | Public | Conventional | 468 | 12 | 42 | 3 | |||||||||||||||||||||
Riverside 1, 2, 3 | Riverside | CA | USA | Distribution | Conventional | 271 | 10 | 42 | 3 | |||||||||||||||||||||
San Leandro | San Leandro | CA | USA | Distribution | Conventional | Port | 244 | 13 | 42 | 1 | ||||||||||||||||||||
Mobile | Mobile | AL | USA | Distribution | Semi-Automated | Port | 293 | 13 | 42 | 1 |
198
Table of Contents
Size | ||||||||||||||||||||||||||||||
Facility | City | US State | Country | Warehouse Type | Automation Level | 30-Miles from Port | Square Feet (000s) | Cubic Feet (in millions) | Pallet Positions (in 000s) | # Warehouses | ||||||||||||||||||||
Houston ColdPort Uvalde | Houston | TX | USA | Distribution | Conventional | Port | 315 | 13 | 40 | 1 | ||||||||||||||||||||
Dallas Dynasty | Dallas | TX | USA | Distribution | Conventional | 246 | 14 | 40 | 1 | |||||||||||||||||||||
Chicago (University Park) | University Park | IL | USA | Distribution | Conventional | 501 | 17 | 39 | 1 | |||||||||||||||||||||
Salem (Building E) | Salem | OR | USA | Public | Conventional | 559 | 17 | 39 | 1 | |||||||||||||||||||||
Hart | Hart | MI | USA | Production Advantaged | Conventional | 289 | 7 | 38 | 1 | |||||||||||||||||||||
Rochelle | Rochelle | IL | USA | Distribution | Conventional | 420 | 14 | 38 | 1 | |||||||||||||||||||||
Charleston | Charleston | SC | USA | Distribution | Conventional | Port | 314 | 14 | 37 | 1 | ||||||||||||||||||||
Jacksonville Doolittle | Jacksonville | FL | USA | Distribution | Conventional | Port | 219 | 13 | 37 | 1 | ||||||||||||||||||||
Chicago III | Chicago | IL | USA | Distribution | Conventional | 216 | 12 | 36 | 1 | |||||||||||||||||||||
WDS Burien | Burien | WA | USA | Distribution | Conventional | Port | 240 | 10 | 36 | 1 | ||||||||||||||||||||
Altoona | Des Moines | IA | USA | Distribution | Conventional | 322 | 12 | 35 | 1 | |||||||||||||||||||||
Seattle—Michigan | Seattle | WA | USA | Distribution | Conventional | Port | 337 | 9 | 34 | 1 | ||||||||||||||||||||
Santa Maria—West La Brea | Santa Maria | CA | USA | Production Advantaged | Conventional | 168 | 6 | 34 | 1 | |||||||||||||||||||||
Woodland | Woodland | WA | USA | Distribution | Conventional | Port | 358 | 12 | 34 | 1 | ||||||||||||||||||||
Portland #2 | Portland | OR | USA | Distribution | Conventional | Port | 219 | 8 | 34 | 1 | ||||||||||||||||||||
Orefield | Orefield | PA | USA | Distribution | Conventional | 352 | 11 | 33 | 1 | |||||||||||||||||||||
7035 Bedford | Chicago | IL | USA | Distribution | Conventional | 297 | 11 | 32 | 1 | |||||||||||||||||||||
Chicago Cold—City | Chicago | IL | USA | Distribution | Semi-Automated | 303 | 8 | 32 | 1 | |||||||||||||||||||||
Santa Maria—South Blosser | Santa Maria | CA | USA | Production Advantaged | Conventional | 300 | 7 | 32 | 1 | |||||||||||||||||||||
Salem #1 | Salem | OR | USA | Public | Conventional | 229 | 10 | 31 | 1 | |||||||||||||||||||||
Milwaukee | Milwaukee | WI | USA | Distribution | Conventional | 271 | 9 | 31 | 1 | |||||||||||||||||||||
Baltimore | Baltimore | MD | USA | Distribution | Conventional | Port | 281 | 12 | 31 | 1 | ||||||||||||||||||||
Jourdan Road | New Orleans | LA | USA | Distribution | Conventional | Port | 329 | 11 | 31 | 1 | ||||||||||||||||||||
Manteca | Manteca | CA | USA | Distribution | Conventional | 322 | 11 | 31 | 1 | |||||||||||||||||||||
Hartford | Hartford | Mi | USA | Public | Conventional | 357 | 9 | 31 | 1 | |||||||||||||||||||||
Miami 4 | Miami | FL | USA | Distribution | Conventional | Port | 183 | 10 | 30 | 1 | ||||||||||||||||||||
Colton—Agua Mansa | Colton | CA | USA | Distribution | Conventional | 409 | 16 | 30 | 1 | |||||||||||||||||||||
Luverne | Luverne | MN | USA | Public | Conventional | 253 | 10 | 30 | 1 | |||||||||||||||||||||
6901 Bedford | Chicago | IL | USA | Distribution | Conventional | 288 | 10 | 28 | 1 | |||||||||||||||||||||
Kearny | Kearny | NJ | USA | Distribution | Conventional | Port | 188 | 11 | 28 | 1 | ||||||||||||||||||||
Logan | Logan Township | NJ | USA | Distribution | Conventional | Port | 188 | 10 | 28 | 1 | ||||||||||||||||||||
McAllen—South Ware | McAllen | TX | USA | Public | Conventional | 204 | 7 | 28 | 1 | |||||||||||||||||||||
Lyndhurst VA | Lyndhurst | VA | USA | Public | Conventional | 222 | 8 | 27 | 1 | |||||||||||||||||||||
McDonough | McDonough | GA | USA | Distribution | Conventional | 250 | 9 | 27 | 1 | |||||||||||||||||||||
Salem #2 | SE Salem | OR | USA | Public | Conventional | 186 | 8 | 27 | 1 | |||||||||||||||||||||
Chicago Cold—Lyons | Lyons | IL | USA | Distribution | Conventional | 309 | 7 | 27 | 1 |
199
Table of Contents
Size | ||||||||||||||||||||||||||||||
Facility | City | US State | Country | Warehouse Type | Automation Level | 30-Miles from Port | Square Feet (000s) | Cubic Feet (in millions) | Pallet Positions (in 000s) | # Warehouses | ||||||||||||||||||||
Elizabeth | Elizabeth | NJ | USA | Distribution | Conventional | Port | 201 | 10 | 27 | 1 | ||||||||||||||||||||
Atlanta II (Atlanta West) | Lithia Springs | GA | USA | Distribution | Conventional | 174 | 9 | 27 | 1 | |||||||||||||||||||||
Attalla | Attalla | AL | USA | Public | Conventional | 300 | 10 | 26 | 1 | |||||||||||||||||||||
Newark | Newark | NJ | USA | Distribution | Conventional | Port | 197 | 9 | 26 | 1 | ||||||||||||||||||||
Norfolk 2 | Portsmouth | VA | USA | Distribution | Automated | Port | 158 | 9 | 26 | 1 | ||||||||||||||||||||
Woodbridge | Avenel | NJ | USA | Distribution | Conventional | Port | 184 | 10 | 26 | 1 | ||||||||||||||||||||
Quincy International | Quincy | WA | USA | Production Advantaged | Conventional | 211 | 10 | 26 | 1 | |||||||||||||||||||||
Chicago II | Chicago | IL | USA | Distribution | Automated | 172 | 9 | 26 | 1 | |||||||||||||||||||||
Louisville | Louisville | KY | USA | Distribution | Conventional | 245 | 8 | 26 | 1 | |||||||||||||||||||||
Norfolk (Chesapeake) | Chesapeake | VA | USA | Distribution | Conventional | Port | 172 | 9 | 25 | 1 | ||||||||||||||||||||
Omaha—Gomez (South) | Omaha | NE | USA | Distribution | Conventional | 226 | 7 | 25 | 1 | |||||||||||||||||||||
Forest Grove | Forest Grove | OR | USA | Distribution | Conventional | Port | 196 | 6 | 25 | 1 | ||||||||||||||||||||
Vernon 1-3 | Vernon | CA | USA | Distribution | Conventional | Port | 256 | 8 | 24 | 2 | ||||||||||||||||||||
Elizabeth II | Linden | NJ | USA | Distribution | Automated | Port | 139 | 8 | 24 | 1 | ||||||||||||||||||||
Dallas Cold Summit | Dallas | TX | USA | Distribution | Conventional | 206 | 17 | 24 | 1 | |||||||||||||||||||||
Jacksonville W Beaver | Jacksonville | FL | USA | Distribution | Conventional | Port | 174 | 9 | 24 | 1 | ||||||||||||||||||||
Proportion Foods Austin | Round Rock | TX | USA | Distribution | Conventional | 192 | 5 | 24 | 1 | |||||||||||||||||||||
Windsor | Windsor | CO | USA | Production Advantaged | Automated | 198 | 7 | 24 | 1 | |||||||||||||||||||||
Vernon 7-8 | Vernon | CA | USA | Distribution | Conventional | Port | 167 | 8 | 24 | 2 | ||||||||||||||||||||
Medley | Medley | FL | USA | Distribution | Conventional | Port | 167 | 8 | 23 | 1 | ||||||||||||||||||||
Long Beach Freeway (LBF) | Vernon | CA | USA | Distribution | Conventional | Port | 183 | 10 | 23 | 1 | ||||||||||||||||||||
Houston Express | Houston | TX | USA | Distribution | Conventional | Port | 225 | 9 | 23 | 1 | ||||||||||||||||||||
BGO Savannah | Savannah | GA | USA | Distribution | Conventional | Port | 281 | 13 | 23 | 1 | ||||||||||||||||||||
Gaston | Gaston | SC | USA | Public | Conventional | 190 | 7 | 23 | 1 | |||||||||||||||||||||
Houston Port | La Porte | TX | USA | Distribution | Conventional | Port | 159 | 8 | 22 | 1 | ||||||||||||||||||||
Jessup | Jessup | MD | USA | Distribution | Conventional | Port | 240 | 7 | 22 | 1 | ||||||||||||||||||||
DPI / Sysco Foods Chicago | Arlington Heights | IL | USA | Distribution | Conventional | 178 | 2 | 22 | 1 | |||||||||||||||||||||
Richland 2 | Richland | WA | USA | Production Advantaged | Conventional | 205 | 7 | 22 | 1 | |||||||||||||||||||||
Grandview | Grandview | WA | USA | Public | Conventional | 111 | 6 | 22 | 1 | |||||||||||||||||||||
Benton Harbor | Sodus | MI | USA | Public | Conventional | 432 | 6 | 21 | 1 | |||||||||||||||||||||
Boston Harbor | Everett | MA | USA | Distribution | Conventional | Port | 219 | 7 | 21 | 1 | ||||||||||||||||||||
Jackson (Richland) | Richland | MS | USA | Public | Conventional | 253 | 8 | 21 | 1 | |||||||||||||||||||||
Westfield | Westfield | MA | USA | Distribution | Conventional | 144 | 7 | 21 | 1 | |||||||||||||||||||||
Louisville (Industry) | Louisville | KY | USA | Distribution | Conventional | 200 | 5 | 21 | 1 | |||||||||||||||||||||
West Seneca | West Seneca | NY | USA | Distribution | Conventional | 192 | 7 | 20 | 1 | |||||||||||||||||||||
Buffalo | Buffalo | NY | USA | Distribution | Conventional | 208 | 5 | 20 | 2 |
200
Table of Contents
Size | ||||||||||||||||||||||||||||||
Facility | City | US State | Country | Warehouse Type | Automation Level | 30-Miles from Port | Square Feet (000s) | Cubic Feet (in millions) | Pallet Positions (in 000s) | # Warehouses | ||||||||||||||||||||
Pendleton | Pendleton | IN | USA | Distribution | Conventional | 158 | 6 | 20 | 1 | |||||||||||||||||||||
Vernon 5-6 | Vernon | CA | USA | Distribution | Conventional | Port | 158 | 5 | 20 | 2 | ||||||||||||||||||||
Washington Blvd | Vernon | CA | USA | Distribution | Conventional | Port | 146 | 7 | 19 | 1 | ||||||||||||||||||||
Grand Forks | South Grand Forks | ND | USA | Production Advantaged | Conventional | 158 | 6 | 19 | 1 | |||||||||||||||||||||
Watsonville—Cascade | Watsonville | CA | USA | Public | Conventional | 132 | 4 | 19 | 1 | |||||||||||||||||||||
Grand Island | Grand Island | NE | USA | Public | Conventional | 208 | 5 | 19 | 1 | |||||||||||||||||||||
Solon | Solon | OH | USA | Distribution | Conventional | 298 | 7 | 19 | 1 | |||||||||||||||||||||
New Castle | New Castle | DE | USA | Distribution | Conventional | Port | 207 | 6 | 19 | 1 | ||||||||||||||||||||
Watsonville—Hilltop | Moss Landing | CA | USA | Public | Conventional | 154 | 5 | 19 | 1 | |||||||||||||||||||||
Lafayette | Lafayette | IN | USA | Public | Conventional | 266 | 8 | 19 | 1 | |||||||||||||||||||||
Chicago (Batavia) | Batavia | IL | USA | Distribution | Conventional | 251 | 7 | 19 | 1 | |||||||||||||||||||||
San Antonio—Profit | San Antonio | TX | USA | Distribution | Conventional | 208 | 6 | 19 | 1 | |||||||||||||||||||||
Port of Oakland | Oakland | CA | USA | Distribution | Conventional | Port | 271 | 9 | 19 | 1 | ||||||||||||||||||||
Atlanta | College Park | GA | USA | Distribution | Conventional | 132 | 7 | 19 | 1 | |||||||||||||||||||||
Perth Amboy | Perth Amboy | NJ | USA | Distribution | Conventional | Port | 241 | 7 | 18 | 1 | ||||||||||||||||||||
Philadelphia | Philadelphia | PA | USA | Distribution | Conventional | Port | 137 | 7 | 18 | 1 | ||||||||||||||||||||
Global Cold—Phillipi | Columbus | OH | USA | Distribution | Conventional | 144 | 7 | 18 | 1 | |||||||||||||||||||||
Raynham | Raynham | MA | USA | Distribution | Conventional | Port | 139 | 7 | 18 | 1 | ||||||||||||||||||||
Jersey City | Jersey City | NJ | USA | Distribution | Conventional | Port | 183 | 6 | 18 | 2 | ||||||||||||||||||||
Bethlehem | Bethlehem | PA | USA | Distribution | Conventional | 253 | 9 | 18 | 1 | |||||||||||||||||||||
Chicago | Chicago | IL | USA | Distribution | Conventional | 125 | 6 | 17 | 1 | |||||||||||||||||||||
Richmond (Sandston) | Sandston | VA | USA | Distribution | Conventional | Port | 182 | 7 | 17 | 1 | ||||||||||||||||||||
Lakeland | Lakeland | FL | USA | Public | Conventional | 117 | 3 | 17 | 1 | |||||||||||||||||||||
South Florida | Miami | FL | USA | Distribution | Conventional | Port | 166 | 6 | 17 | 1 | ||||||||||||||||||||
Bolingbrook | Bolingbrook | IL | USA | Distribution | Conventional | 151 | 5 | 17 | 1 | |||||||||||||||||||||
East Greenville | East Greenville | PA | USA | Distribution | Conventional | 261 | 5 | 17 | 1 | |||||||||||||||||||||
Phoenix | Phoenix | AZ | USA | Distribution | Conventional | 188 | 6 | 17 | 1 | |||||||||||||||||||||
Richmond (Chester) | Chester | VA | USA | Public | Conventional | Port | 168 | 5 | 17 | 1 | ||||||||||||||||||||
Jacksonville | Jacksonville | FL | USA | Distribution | Conventional | Port | 226 | 8 | 16 | 1 | ||||||||||||||||||||
Unadilla | Unadilla | GA | USA | Public | Conventional | 243 | 7 | 16 | 1 | |||||||||||||||||||||
Stilwell | Stilwell | OK | USA | Public | Conventional | 139 | 4 | 16 | 1 | |||||||||||||||||||||
Cranberry Township | Cranberry Township | PA | USA | Distribution | Conventional | 118 | 5 | 16 | 1 | |||||||||||||||||||||
Salt Lake City | Salt Lake City | UT | USA | Distribution | Conventional | 124 | 5 | 16 | 1 | |||||||||||||||||||||
Miami 3 | Hialeah Gardens | FL | USA | Distribution | Conventional | Port | 111 | 6 | 16 | 1 | ||||||||||||||||||||
Portland #1 | Portland | OR | USA | Distribution | Conventional | Port | 142 | 4 | 16 | 1 | ||||||||||||||||||||
Houston West Gulf | Houston | TX | USA | Distribution | Conventional | Port | 161 | 5 | 16 | 1 | ||||||||||||||||||||
Savannah (Rincon) | Rincon | GA | USA | Distribution | Conventional | Port | 256 | 8 | 16 | 1 | ||||||||||||||||||||
Seattle—Garfield (390 / 175) | Seattle | WA | USA | Distribution | Conventional | Port | 316 | 7 | 16 | 3 | ||||||||||||||||||||
Ottumwa | Ottumwa | IA | USA | Production Advantaged | Conventional | 168 | 6 | 15 | 1 |
201
Table of Contents
Size | ||||||||||||||||||||||||||||||
Facility | City | US State | Country | Warehouse Type | Automation Level | 30-Miles from Port | Square Feet (000s) | Cubic Feet (in millions) | Pallet Positions (in 000s) | # Warehouses | ||||||||||||||||||||
Wauwatosa (Milwaukee) | Wauwatosa | WI | USA | Distribution | Conventional | 261 | 5 | 15 | 1 | |||||||||||||||||||||
Avon | Avon | MA | USA | Distribution | Conventional | Port | 164 | 5 | 15 | 1 | ||||||||||||||||||||
Taunton | Taunton | MA | USA | Distribution | Conventional | 116 | 4 | 15 | 1 | |||||||||||||||||||||
Darien | Darien | WI | USA | Production Advantaged | Conventional | 139 | 4 | 15 | 1 | |||||||||||||||||||||
Rialto | Bloomington | CA | USA | Distribution | Conventional | 127 | 4 | 15 | 1 | |||||||||||||||||||||
Wilmington | Wilmington | CA | USA | Distribution | Conventional | Port | 120 | 5 | 15 | 1 | ||||||||||||||||||||
McFarland | McFarland | WI | USA | Distribution | Conventional | 196 | 7 | 15 | 1 | |||||||||||||||||||||
Charlotte | Charlotte | NC | USA | Distribution | Conventional | 204 | 7 | 14 | 1 | |||||||||||||||||||||
Tacoma (Algona) | Algona | WA | USA | Distribution | Conventional | Port | 283 | 8 | 14 | 1 | ||||||||||||||||||||
Decatur, IL | Decatur | IL | USA | Public | Conventional | 185 | 4 | 14 | 1 | |||||||||||||||||||||
Federalsburg #1 | Federalsburg | MD | USA | Public | Conventional | 138 | 4 | 13 | 1 | |||||||||||||||||||||
WDS Kent | Kent | WA | USA | Distribution | Conventional | Port | 177 | 4 | 13 | 1 | ||||||||||||||||||||
Boston | Sharon | MA | USA | Distribution | Conventional | Port | 103 | 5 | 13 | 1 | ||||||||||||||||||||
Richmond—North Hopkins | Richmond | VA | USA | Production Advantaged | Conventional | Port | 74 | 2 | 13 | 1 | ||||||||||||||||||||
Los Angeles | Los Angeles | CA | USA | Distribution | Conventional | Port | 119 | 5 | 12 | 1 | ||||||||||||||||||||
Des Moines | Des Moines | IA | USA | Distribution | Conventional | 150 | 4 | 12 | 1 | |||||||||||||||||||||
Vernon (E 55th) | Vernon | CA | USA | Distribution | Conventional | Port | 109 | 4 | 12 | 1 | ||||||||||||||||||||
Logansport | Logansport | IN | USA | Production Advantaged | Conventional | 149 | 3 | 12 | 1 | |||||||||||||||||||||
Allentown OCS | Allentown | PA | USA | Distribution | Conventional | 267 | 6 | 12 | 1 | |||||||||||||||||||||
Houston Metro | Houston | TX | USA | Distribution | Semi-Automated | Port | 158 | 5 | 12 | 1 | ||||||||||||||||||||
Macon | Macon | GA | USA | Public | Conventional | 132 | 4 | 12 | 1 | |||||||||||||||||||||
Elm Street | Perth Amboy | NJ | USA | Distribution | Conventional | Port | 108 | 3 | 12 | 1 | ||||||||||||||||||||
El Paso | El Paso | TX | USA | Public | Conventional | 139 | 4 | 12 | 1 | |||||||||||||||||||||
Haines City | Haines City | FL | USA | Public | Conventional | 183 | 5 | 11 | 2 | |||||||||||||||||||||
Iowa City | Iowa City | IA | USA | Public | Conventional | 136 | 3 | 11 | 1 | |||||||||||||||||||||
Statesville | Statesville | NC | USA | Public | Conventional | 141 | 4 | 11 | 1 | |||||||||||||||||||||
Columbus Cold—Lockbourne | Columbus | OH | USA | Distribution | Conventional | 172 | 5 | 11 | 1 | |||||||||||||||||||||
Charleston EC | Charleston | SC | USA | Distribution | Conventional | Port | 157 | 5 | 11 | 1 | ||||||||||||||||||||
Norfolk (Smithfield) | Smithfield | VA | USA | Public | Conventional | Port | 126 | 4 | 11 | 1 | ||||||||||||||||||||
Lakeland Annex | Lakeland | FL | USA | Public | Conventional | 137 | 3 | 11 | 1 | |||||||||||||||||||||
Gadsden | Gadsden | AL | USA | Production Advantaged | Conventional | 101 | 4 | 10 | 1 | |||||||||||||||||||||
Scranton | Scranton | PA | USA | Public | Conventional | 159 | 4 | 10 | 1 | |||||||||||||||||||||
Tacoma | Tacoma | WA | USA | Distribution | Conventional | Port | 131 | 4 | 10 | 1 | ||||||||||||||||||||
Waseca | Waseca | MN | USA | Production Advantaged | Conventional | 100 | 3 | 10 | 1 | |||||||||||||||||||||
Dick Cold—Valleyview | Columbus | OH | USA | Distribution | Conventional | 132 | 5 | 10 | 1 | |||||||||||||||||||||
Henry Clay | New Orleans | LA | USA | Distribution | Conventional | Port | 140 | 4 | 10 | 1 | ||||||||||||||||||||
New Castle #1 | New Castle | DE | USA | Distribution | Conventional | Port | 135 | 3 | 10 | 1 | ||||||||||||||||||||
Chicago Cold—Bartlett | Bartlett | IL | USA | Distribution | Conventional | 89 | 3 | 10 | 1 |
202
Table of Contents
Size | ||||||||||||||||||||||||||||||
Facility | City | US State | Country | Warehouse Type | Automation Level | 30-Miles from Port | Square Feet (000s) | Cubic Feet (in millions) | Pallet Positions (in 000s) | # Warehouses | ||||||||||||||||||||
Seattle—Garfield (391 / 392) | Seattle | WA | USA | Distribution | Conventional | Port | 0 | 0 | 10 | 1 | ||||||||||||||||||||
Springfield | Springfield | OH | USA | Production Advantaged | Semi-Automated | 121 | 4 | 10 | 1 | |||||||||||||||||||||
Sandston (Corrugated) | Sandston | VA | USA | Distribution | Conventional | Port | 114 | 4 | 9 | 1 | ||||||||||||||||||||
Lincoln | Lincoln | NE | USA | Public | Conventional | 87 | 2 | 9 | 1 | |||||||||||||||||||||
Greeley | Greeley | CO | USA | Production Advantaged | Conventional | 107 | 3 | 9 | 1 | |||||||||||||||||||||
Conklin | Conklin | NY | USA | Distribution | Conventional | 0 | 0 | 9 | 0 | |||||||||||||||||||||
Denison | Denison | IA | USA | Public | Conventional | 74 | 2 | 9 | 1 | |||||||||||||||||||||
Savannah Fresh | Port Wentworth | GA | USA | Distribution | Conventional | Port | 219 | 8 | 9 | 1 | ||||||||||||||||||||
Dodge City | Dodge City | KS | USA | Production Advantaged | Conventional | 95 | 3 | 8 | 1 | |||||||||||||||||||||
Baton Rouge | Baton Rouge | LA | USA | Public | Conventional | Port | 81 | 2 | 8 | 1 | ||||||||||||||||||||
Friona | Friona | TX | USA | Production Advantaged | Conventional | 88 | 2 | 8 | 1 | |||||||||||||||||||||
Centralia | Centralia | WA | USA | Distribution | Conventional | 155 | 5 | 8 | 1 | |||||||||||||||||||||
Tremonton | Tremonton | UT | USA | Production Advantaged | Conventional | 78 | 3 | 8 | 1 | |||||||||||||||||||||
Sun Valley Swedesboro | Swedesboro | NJ | USA | Distribution | Conventional | Port | 126 | 3 | 8 | 1 | ||||||||||||||||||||
Boonville | Boonville | IN | USA | Production Advantaged | Conventional | 84 | 3 | 8 | 1 | |||||||||||||||||||||
Vernon 4 | Vernon | CA | USA | Distribution | Conventional | Port | 93 | 2 | 8 | 1 | ||||||||||||||||||||
Watsonville—Walker | Watsonville | CA | USA | Public | Conventional | 177 | 4 | 7 | 1 | |||||||||||||||||||||
Yew St. | Forest Grove | OR | USA | Distribution | Conventional | Port | 89 | 1 | 7 | 1 | ||||||||||||||||||||
Norfolk | Norfolk | VA | USA | Distribution | Conventional | Port | 98 | 3 | 7 | 1 | ||||||||||||||||||||
Mount Pleasant | Mount Pleasant | IA | USA | Production Advantaged | Conventional | 59 | 2 | 6 | 1 | |||||||||||||||||||||
Ultrafreeze | Vernon | CA | USA | Distribution | Conventional | Port | 69 | 3 | 6 | 1 | ||||||||||||||||||||
San Antonio—AT&T | San Antonio | TX | USA | Distribution | Conventional | 93 | 2 | 6 | 1 | |||||||||||||||||||||
Cedar Rapids | Cedar Rapids | IA | USA | Production Advantaged | Conventional | 72 | 2 | 5 | 1 | |||||||||||||||||||||
Kedrion | Hillsborough | NJ | USA | Production Advantaged | Semi-Automated | 54 | 2 | 5 | 1 | |||||||||||||||||||||
Omaha—Renfro (West) | Omaha | NE | USA | Distribution | Conventional | 96 | 2 | 5 | 1 | |||||||||||||||||||||
Decatur | Decatur | MI | USA | Production Advantaged | Conventional | 77 | 2 | 5 | 1 | |||||||||||||||||||||
Fall River | Fall River | MA | USA | Distribution | Conventional | 62 | 2 | 5 | 1 | |||||||||||||||||||||
Richmond—Jefferson Davis | Richmond | VA | USA | Production Advantaged | Conventional | Port | 102 | 2 | 3 | 1 | ||||||||||||||||||||
Richmond—Supply Chain | Chester | VA | USA | Managed | Conventional | Port | 164 | 5 | 0 | 1 | ||||||||||||||||||||
Decatur, AL | Decatur | AL | USA | Managed | Conventional | 129 | 4 | 0 | 1 | |||||||||||||||||||||
Murfreesboro | Murfreesboro | TN | USA | Managed | Conventional | 317 | 12 | 0 | 1 | |||||||||||||||||||||
Dothan | Dothan | AL | USA | Managed | Conventional | 49 | 1 | 0 | 1 | |||||||||||||||||||||
Arlington | Arlington | TN | USA | Managed | Conventional | 103 | 4 | 0 | 1 | |||||||||||||||||||||
Fontana | Fontana | CA | USA | Managed | Conventional | 752 | 28 | 0 | 1 |
203
Table of Contents
Size | ||||||||||||||||||||||||||||||
Facility | City | US State | Country | Warehouse Type | Automation Level | 30-Miles from Port | Square Feet (000s) | Cubic Feet (in millions) | Pallet Positions (in 000s) | # Warehouses | ||||||||||||||||||||
Los Angeles (Vernon—Bandini) | Vernon | CA | USA | Managed | Conventional | Port | 140 | 5 | 0 | 1 | ||||||||||||||||||||
Stockton | Stockton | CA | USA | Managed | Conventional | Port | 249 | 8 | 0 | 3 | ||||||||||||||||||||
Los Angeles (Vernon—Sierra Pine) | Vernon | CA | USA | Managed | Conventional | Port | 166 | 6 | 0 | 1 | ||||||||||||||||||||
Riverside—Hunter Park | Riverside | CA | USA | Managed | Conventional | 496 | 21 | 0 | 1 | |||||||||||||||||||||
Los Angeles (Vernon—Long Beach) | Vernon | CA | USA | Managed | Conventional | Port | 257 | 9 | 0 | 1 | ||||||||||||||||||||
Fullerton | Fullerton | CA | USA | Managed | Conventional | Port | 234 | 9 | 0 | 1 | ||||||||||||||||||||
Song Than | Ho Chi Min City | n/a | Vietnam | Distribution | Conventional | Port | 255 | 8 | 36 | 1 | ||||||||||||||||||||
SK Logistics #3 | Hanoi City | n/a | Vietnam | Distribution | Conventional | 280 | 12 | 25 | 1 | |||||||||||||||||||||
PFS Vietnam | Ho Chi Min City | n/a | Vietnam | Distribution | Automated | Port | 134 | 7 | 23 | 1 | ||||||||||||||||||||
Bac Ninh | Hanoi | n/a | Vietnam | Distribution | Conventional | 132 | 5 | 19 | 1 | |||||||||||||||||||||
SK Logistics #2 | Hanoi City | n/a | Vietnam | Distribution | Conventional | 118 | 5 | 13 | 1 | |||||||||||||||||||||
Total | 81,925 | 2,917 | 9,804 | 463 |
Our Global Integrated Solutions Segment
Our global integrated solutions segment provides our customers with solutions to move products through the food supply chain. The majority of our customers’ supply chain costs come from the movement of their products between warehouse nodes, rather than from the cost of warehousing. We believe transportation represents on average more than three times the cost of warehousing as part of our customers’ supply chain expense. Our integrated solutions provide value-added benefits to warehousing customers, helping them to reduce transport costs while enabling us to generate additional revenue on the same product stored.
We operate several critical and value-added temperature-controlled business lines within our global integrated solutions segment, including, among others, transportation and refrigerated rail car leasing. Within transportation, which is the largest area within our global integrated solutions segment, our core focus areas are multi-vendor less-than-full-truckload consolidation, drayage services to and from ports, over-the-road trucking and freight forwarding. We also provide foodservice distribution in select markets and e-commerce fulfillment services. For the twelve months ended March 31, 2024, transportation and refrigerated rail car leasing together accounted for approximately 67% of our global integrated solutions segment NOI.
204
Table of Contents
We believe that data-driven visibility into our customers’ warehouse volumes and shipping destinations enables us to provide efficient integrated solutions. These services deepen our customer relationships, allow for an “all services under one roof” experience and promote cross-sale opportunities within our warehouses. As we collaborate with our customers across their supply chains, we seek to reduce waste and redundancy and deliver more cost efficient and sustainable solutions for them. We believe that our comprehensive set of integrated solutions offerings differentiates us from our competitors, positions us well to win new business, strengthens customer retention and enhances the value of our warehousing business.
As summarized by the following chart, for the twelve months ended March 31, 2024, we estimate that approximately 93% of our total NOI was generated by our warehouse customers (based on our global warehousing segment NOI and, as it relates to our global integrated solutions segment NOI, the relative revenue contribution from our warehouse customers who utilize our warehousing business and our customers who exclusively utilize our integrated solutions):
NOI by Customer Type
(1) | Estimated based on global warehousing segment NOI for the twelve months ended March 31, 2024 and, as it relates to Lineage’s global integrated solutions segment NOI, the relative revenue contribution from Lineage customers who utilize our warehousing business and Lineage customers who exclusively utilize Lineage integrated solutions. |
(2) | Total NOI represents the sum of both the global warehousing segment and global integrated solutions segment. |
Our Competitive Strengths
We believe we are the premier technology-enabled temperature-controlled warehousing REIT in the world, as evidenced by the following competitive strengths:
We are the global leader in a fragmented industry with meaningful scale and network benefits.
We are the largest temperature-controlled warehousing company globally, including in some of the world’s largest developed markets such as the United States, Canada, the United Kingdom, Continental Europe, Australia and New Zealand. As measured by cubic feet of storage space, we are approximately twice the size of our next
205
Table of Contents
largest competitor globally and are as large as our next nine global competitors combined, as reflected in the charts below.
Estimate of Top 10 Global Temperature-Controlled
Companies’ Cubic Feet Capacity and Market Share
Source: | 2024 GCCA Global Top 25 List (April 2024), except Lineage figures, which are based on company data as of March 31, 2024, and Americold Realty Trust, Inc. (“Americold”) figures, which are based on public filings of Americold with the U.S. Securities and Exchange Commission (“SEC”) as of March 31, 2024. We present data with respect to Americold, as Americold is our largest competitor for whom data is publicly available. Global market share is based on total global capacity from 2020 GCCA Global Cold Storage Capacity Report (August 2020). |
(1) | As of March 31, 2024, Lineage owned 9.0% of the investment interests in Emergent Cold LatAm Holdings LLC as well as a right to receive an additional portion of certain profits generated by Emergent Cold LatAm Holdings LLC, which could represent anywhere from zero to 10% of the additional profits generated on invested capital. |
Estimate of Top 10 North American Temperature-Controlled
Companies’ Cubic Feet Capacity and Market Share
Source: | April 2024 GCCA North America Top 25 List (April 2024), except Lineage figures, which are based on company data as of March 31, 2024, and Americold figures, which are based on public filings of |
206
Table of Contents
Americold with the SEC as of March 31, 2024. North America market share based total North American capacity from 2020 GCCA Global Cold Storage Capacity Report (August 2020). |
Approximately 97% of our global warehousing segment revenues are from countries in which our local network of temperature-controlled warehouses is the largest, as measured by cubic feet of capacity. The interconnected nature of our global warehouse network aligns with the global nature of many of our customers, allowing us to provide warehousing services to many of them across multiple geographies. On average, our top 25 customers utilize 23 of our facilities per customer, and eight of our top 10 customers use our facilities in multiple countries. Importantly, we believe customers equate the Lineage brand with service, quality and safety around the world, which provides an advantage over local competitors.
We believe that our network and the economies of scale in our business drive operational leverage and allow us to invest in customer service and technology, which, in turn, attracts more customers. With a larger customer base, we believe that we can leverage our resources more efficiently, supporting strong profitability. Moreover, our growing customer base enables us to gather and analyze vast amounts of data. We believe that this data-driven approach empowers us to continuously refine our operations, improve productivity and lower operating costs, creating a “win-win” scenario for both our customers and Lineage.
We believe that it would be difficult and costly to replace or replicate our network of temperature-controlled facilities given the high and rising value of industrial land, difficulties in obtaining land and zoning entitlements and approvals and the significant and increasing construction costs of temperature-controlled warehouses. As of March 31, 2024, we owned approximately 80% of our global warehousing portfolio as a percentage of square feet, including ground leases and real estate for which we possess bargain purchase options, and we leased or managed 20% of our global warehousing portfolio as a percentage of square feet. We have a deep sales pipeline via the largest existing customer base and sales group in the industry, a recognized and respected brand among customers, the broadest suite of temperature-controlled services through our global integrated solutions segment, our innovative technology, extensive development experience, a broad industry knowledgebase and a flexible balance sheet and favorable cost of capital. In addition, we believe that our skilled and experienced team of over 26,000 team members provide a differentiated service that would be difficult to replicate, as they are trained to operate in a highly-specialized environment while complying with stringent food safety requirements.
Our high quality portfolio is located in highly desirable and strategic locations around the world
Our cubic-foot weighted average facility age is approximately 21 years, which we believe is significantly younger than that of the broader temperature-controlled warehousing industry. Moreover, our portfolio includes 81 fully- and semi-automated warehouses, which we believe is the most of any cold storage provider in the world, making our network the most technologically advanced in our industry. We believe that modern warehouses are more desirable to our customers because of their increased operational efficiency and enhanced ability to meet today’s most sophisticated customer needs.
We have a robust presence in key metropolitan statistical areas, or MSAs, and ports throughout the United States with a larger number of facilities in such locations relative to our largest competitor, which drives a significantly higher weighted average population density of approximately 3,100 persons per square mile.
We have a particularly strong presence in top-tier U.S. markets, including New York/New Jersey, Los Angeles and Southern California, Chicago, Dallas-Fort Worth, Houston, Kansas City, Denver, Philadelphia, Miami, Atlanta, Boston, the Bay Area and Northern California, Seattle and the Pacific Northwest. We consider these U.S. markets to be key geographies, as we believe they have among the highest industrial real estate values and lowest cap rates in our industry.
For the twelve months ended March 31, 2024, 76% of our NOI was from distribution centers and approximately 48% of our NOI was from warehouses located near ports, many of which are in the key distribution markets. This solidifies the mission-critical nature of our portfolio in highly desirable locations for imports, exports and local consumption and distribution. We believe our facilities are strategic to our customer base with locations that serve as critical hubs within their supply chains.
207
Table of Contents
Our business is highly diversified across geographies, commodities and a high-quality, loyal customer base.
Our business profile is highly diversified, which reduces risks to our cash flows from potential headwinds linked to any one facility, market, commodity, food consumption channel or customer. We have 482 facilities globally, with no facility accounting for more than 1.1% of revenues during the twelve months ended March 31, 2024.
The following charts provide information regarding the temperature-controlled warehouses in our global warehousing segment that we owned, leased or managed in each of the regions in which we operated as of March 31, 2024.
Warehouse Segment Geographic Revenue and NOI Diversification
|
Note: Percentages may not sum to 100% due to rounding.
In addition, our global warehousing segment revenues for the twelve months ended March 31, 2024 were diversified by commodity type as demonstrated by the graph below:
Commodity Type as Percentage of Global Warehousing Segment Revenue
Note: Percentages may not sum to 100% due to rounding.
We offer a broad range of warehousing services and integrated solutions around the world for a variety of customers with complex requirements in the food supply chain. As of March 31, 2024, we served more than 13,000 customers around the world across numerous commodity categories and with complex requirements in the food supply chain. Approximately 32.0% of our total revenue for the twelve months ended March 31, 2024 came from our top 25 customers. Our customer base was highly diversified, with no customer accounting for more than 3.3% of revenues for the twelve months ended March 31, 2024.
208
Table of Contents
The following chart sets forth the percentage of our total revenues attributable to our top 15 and top 25 customers for the twelve months ended March 31, 2024.
Customers as Percentage of Total Revenue
We target dependable customers with strong credit profiles, as evidenced by the fact that over 60% of the revenue generated from our top 25 customers is from companies with at least one investment grade rating at the parent or subsidiary level from Moody’s, S&P or Fitch. Additionally, 93% of our top 25 customers that are publicly-traded or have a publicly-traded parent company also have at least one investment grade rating.
The stability of our business is further supported by long-term contracts with most of our largest customers by revenues in our global warehousing segment. These long-term contracts often include minimum storage guarantees that generate minimum or fixed storage revenues regardless of whether the underlying pallet positions are occupied. As of March 31, 2024, 41.8% of Lineage’s storage revenues were subject to minimum storage guarantees.
Our customer base is loyal, with a weighted average customer relationship, including relationships with legacy companies we acquired, of over 30 years across our current top 25 customers based on revenues for the twelve months ended March 31, 2024. We believe this loyalty is driven by:
• | the mission-critical role we play in our customers’ cold chain; |
• | the expansive and interconnected nature of our warehouse network; |
• | the locations of our warehouses and the services we offer; |
• | the comprehensive suite of integrated solutions that we offer to our customers; and |
• | excellent customer service and innovative technologies. |
Through a combination of our vast warehouse network, integrated solutions, innovative technology, and dedicated team of supply chain professionals, we strive to deliver the highest quality of service to our customers, tailored to their specific product and location needs. Our commitment to customer satisfaction is evident in our long-standing partnerships with some of the world’s largest and most critical food producers and retailers, as well as a reputation as a trusted strategic partner in the food supply chain industry.
209
Table of Contents
Our complementary, value-added global integrated solutions segment drives customer value, retention and growth.
In addition to our temperature-controlled warehousing operations, we offer a comprehensive suite of value-added integrated solutions that we believe are highly complementary and valuable to our warehouse customers. These services deepen our customer relationships by providing an “all services under one roof” experience and promoting cross-sell opportunities. Given the majority of our customers’ supply chain costs come from product movement versus storage, this integration provides a value-added benefit to warehousing customers of reducing transport costs while enabling us to generate additional revenue on the same product stored. For the twelve months ended March 31, 2024, we estimate that approximately 93% of our total NOI was generated by our warehouse customers (based on our global warehousing segment NOI and, as it relates to our global integrated solutions segment NOI, the relative revenue contribution from our customers who utilize our warehousing business and our customers who exclusively utilize our integrated solutions).
We believe we can grow our global integrated solutions segment by offering these services to customers who have not yet utilized them, often with minimal incremental capital investments required, and likewise that our integrated solutions offerings can generate customer leads for our global warehousing segment.
Our highly synergistic platform differentiates us from our competitors, supports a strong win rate with new business, enhances customer loyalty and increases the value of our warehousing business.
We believe we are an innovative industry leader driving disruption with differentiated technology.
In a traditionally analog, fragmented and family-owned industry, we believe that our innovation and large-scale deployment of cutting-edge technology provides a comprehensive service offering for our customers that enhances our competitive position relative to our peers, while driving industry-leading growth and margins. Since the start of 2019, we have invested more than $725 million into transformational technology initiatives, which include developing, acquiring and deploying both proprietary operating systems and third-party platforms, an amount we believe is more than any of our industry competitors. In addition, since the start of 2019, we have deployed approximately $380 million to capital and operating expenses in information technology investments. This investment encompasses migrating workloads to the cloud, implementing SaaS-based tools, rolling out next-generation SD-WAN, and upgrading our core human capital and financial ERP software. These initiatives are strategically designed to standardize, integrate, and enhance the technological framework across our enterprise. In addition, our deliberate and forward-thinking focus has allowed us to create what we believe is the largest automated portfolio in the industry with 81 fully-and semi-automated facilities backed by innovative proprietary software and an in-house automation team. Due to the increasing demand for automated solutions from our customers, the higher construction cost of automated facilities and the complexity of implementing automated solutions, we expect the growth of automation in our warehouse network to be a key differentiator for Lineage over time.
Some key elements of our technology strategy include the following:
• | Establishing a highly integrated platform. We use a standardized and disciplined approach to apply our best practices to integrating acquired companies. This has been a core part of our strategy since our inception. As of March 31, 2024, approximately 95% of our global warehousing segment revenue for the twelve months ended March 31, 2024 was integrated on our human capital and financial ERP software. As of March 31, 2024, approximately 69% of our global warehousing segment revenue for the twelve months ended March 31, 2024 flowed through one of our four Core WMS, excluding facilities leased to customers and managed facilities. We are in the process of growing this percentage across our network. From 2019 through March 31, 2024, we converted over 100 facilities to Core WMS, demonstrating our strong conversion record and ability to increase the penetration rate quickly. As of March 31, 2024, all of our global warehousing segment revenue was reporting on metricsOne, a proprietary operating KPI dashboard that provides enhanced visibility into our operational execution, labor, safety and financial performance. |
210
Table of Contents
• | Providing a superior customer experience to support growth and retention. We have deployed proprietary operating systems and third-party platforms to improve customer experience and retention. We have developed Lineage Link, a proprietary customer visibility platform that empowers customers to actively manage their inventories, orders, shipments and transportation appointment scheduling across our warehouse network, which seeks to drive incremental NOI through increased efficiencies for customers and Lineage. Through March 31, 2024, Lineage Link had been rolled out across approximately 63% of our network as measured by global warehousing segment revenues for the twelve months ended March 31, 2024, and we are in the process of further growing its penetration. We believe these technologies will support customer retention as we improve our responsiveness to our customers’ complex and evolving needs. |
• | Maximizing yield and productivity to support leading NOI growth. We are in the initial phases of deploying proprietary operating systems and third-party platforms to seek to drive NOI yield, operational productivity and process automation across our warehouse network and thereby drive margin improvement. Our specialized warehouse execution system, LinOS, is engineered to boost our operational efficiency. It employs unique, patented algorithms to optimize task allocation among team members and strategically prioritize tasks within our warehouses. Currently operational in select automated facilities, LinOS shows significant potential for extensive deployment across our conventional warehouse network in the future. In addition, we are implementing a third-party contracting and invoicing platform that automates the processes of quoting, contracting and invoicing, which we believe will lead to more dynamic and standardized implementation of revenue growth initiatives. As of March 31, 2024, this platform had been rolled out across facilities comprising approximately 58% of our network as measured by global warehousing segment revenues for the twelve months ended March 31, 2024, and we are in the process of further growing its penetration. In addition, our productivity and process automation initiatives are supported by our in-house data science team, which is comprised of 50 applied science and product professionals that provide data-driven business intelligence and innovations to maximize operational efficiencies, revenues, profitability, energy efficiency and cash flows. Our innovations have yielded 96 patents issued and 151 patents pending as of March 31, 2024, in such areas as facility design, methods and mechanisms for operating facilities, refrigeration and thermodynamic designs and cold-rated instrumentation. |
We have a purpose-driven, experienced, and aligned management team and board of directors that believe robust corporate governance is essential to long-term value creation for all stockholders.
Our experienced management team and board of directors have proven backgrounds both inside and outside the temperature-controlled warehousing industry. Since founding Lineage with a single asset in 2008, our Co-Founders and Co-Executive Chairmen have developed a strong operating and capital deployment track record while displaying a commitment to building a durable business. The average tenure of members of our senior management is over eight years. Our management team is led by our Chief Executive Officer, Greg Lehmkuhl, who joined our company in 2015.
Our governance structure, policies and processes are designed to serve the needs of our business, our stockholders and other stakeholders, and to promote a culture of accountability across our company. We believe that fostering a compliant, ethical, accountable and transparent culture requires the full engagement of our board of directors and management. The diversity of our team members’ experiences and backgrounds is core to our innovative culture, and our commitment to Diversity, Equity and Inclusion, or DEI, is highlighted by our establishment of multiple Employee Resource Groups, or ERGs, to support and strengthen our team.
Our board of directors provides oversight and guidance on our most important activities and matters, including the direction and performance of our strategy. We believe our directors offer diversity of thought and a range of experiences and expertise that contribute to the ongoing evolution of our company. Since the beginning of 2022, we added three highly experienced independent female directors to our board of directors. As we pursue our purpose and live our values, we remain focused on maintaining robust governance practices and taking measures to continually enhance our approach to governance. To date, we have undertaken an independence analysis of our
211
Table of Contents
board of directors and have created focused board committees, including an audit committee, compensation committee and a nominating and corporate governance committee.
Finally, as evidence of the confidence in our company, our current equity holders represent some of the strongest and most sophisticated institutional investors globally. We have raised more than $9.0 billion of equity capital since inception and more than $8.5 billion since the start of 2018 from these investors over multiple capital raises (in each case, including equity issued to sellers in connection with our acquisitions and reinvestment by our Co-Founders).
We have a strong and flexible balance sheet and we have demonstrated access to debt and equity capital to support growth.
As of March 31, 2024, after giving effect to the repayment of debt with net proceeds of this offering, our balance sheet will be significantly de-levered, 69% of our debt will be unsecured and 77% of our debt will be fixed or interest rate hedged and our total liquidity, including cash on hand and available revolver capacity, will be $2.0 billion, supporting our external growth strategy. Additionally, our Revolving Credit Facility provides flexibility in funding our greenfield and expansion development pipeline and future acquisition opportunities, while our owned real estate provides us flexibility to access various financing options that may not be available otherwise and, in turn, allows us to access financing markets with the goal of minimizing our cost of capital. We may also attempt to access property-level secured debt, bank debt and the unsecured bond market, in each case across multiple currencies and geographies, which would provide us with capital-raising flexibility to fund our operations. We will have also increased our unencumbered asset pool to over $16.3 billion on a pro forma basis as of March 31, 2024, which we believe will provide us with the ability to upsize our facilities while maintaining future flexibility once we become a public company. We intend to preserve a flexible capital structure with an investment grade profile. We believe that our balance sheet flexibility and strength will allow us to continue expanding our business and pursue new growth opportunities.
We operate with the purpose to transform the global food supply chain to eliminate waste and help feed the world.
As we strive to play a key role in shaping the global food chain, we recognize our responsibility to help create a more sustainable, equitable future. Accordingly, we work to strategically integrate sustainability initiatives into the way we do business, working to act in alignment with our core values to guide our policies.
To help tackle food insecurity, we established the Lineage Foundation for Good as a non-profit charity to serve the communities in which we operate. The foundation partners with Feeding America domestically as well as the Global Food Banking Network internationally to redirect surplus food to those in need. In response to COVID-19, we launched our “Share a Meal” Campaign with Feeding America, supporting the organization’s temperature-controlled supply chain needs with our assets. Since 2020, we have donated the equivalent of over 176 million meals, including through our “Share a Meal” Campaign and in partnership with customers donating surplus product, team members donating food to local food banks and grants issued to help build capacity at food banks around the globe. As a result of these and other initiatives, we were named a Visionary Partner of Feeding America and a Fast Company’s 2021 World Changing Ideas Awards finalist in the Pandemic Response category.
We have also signed The Climate Pledge, committing to achieve net zero carbon emissions across our global operations by 2040. Signing The Climate Pledge demonstrates our commitment to minimize the carbon emissions associated with our daily operations. Through solar installations at our facilities, we had installed capacity of 146 megawatts of solar energy as of March 31, 2024. In addition, as of December 2022, we were the fifth-largest corporate producer in the United States, and the second-largest REIT producer, of on-site solar and battery capacity per the 2022 Solar Means Business Report published by the Solar Energy Industry Association (SEIA). Our goal is to achieve a top-three corporate ranking in the coming years. Having installed 87 megawatts
212
Table of Contents
of solar panels at our facilities between 2020 and December 2022, we completed more on-site solar installations than any other company on the SEIA list during the same period. As a result of our energy efficiency initiatives, in 2023, our same warehouse energy expense decreased 14% and our same warehouse kilowatt-hour consumption decreased by 3%, in each case, relative to 2022. Our energy efficiency initiatives have resulted in four consecutive awards from the U.S. Department of Energy from 2019 to 2022 for innovations and leadership in flywheeling, blast freezing, energy procurement and hedging and deployment of advanced refrigeration control systems.
We seek to maximize energy efficiency in our warehouses through the application of best practices, the latest technology and alternative energy generation. Our best practices include energy hedging strategies and a centralized energy and sustainability team that deploys these initiatives across our network to ensure standardization and minimization of energy waste. In addition to our focus on generating alternative sources of energy, the technologies we deploy to optimize energy efficiency include variable frequency drives, refrigeration control systems, rapid close doors, motion sensor technology, LED lighting and “flywheeling,” an innovative process that leverages machine learning and artificial intelligence to manage energy load based on predictions of peak demand. As multinational corporations increasingly require supplier adherence to their own sustainability goals, Lineage recognizes its role in global sustainability, and we are continuously refining and improving our processes to reduce energy waste.
Further demonstrating our continued commitment to sustainable business practices, our Revolving Credit and Term Loan Facility features a sustainability-linked pricing component, with pricing subject to adjustment based on annual performance targets in areas such as solar energy capacity and female representation in leadership.
Our Growth Strategy
Our objective is to maximize stockholder value by growing our business to expand solutions for our customers, creating opportunities for new and existing team members and driving innovation across our business and the supply chain to create efficiencies and increase sustainability. We believe these objectives are supported by our strategy for growth illustrated in our growth flywheel:
• | We grow our same warehouse NOI and free cash flow through numerous organic business initiatives we have developed over many years. This growth helps delever our balance sheet and creates capacity for new investments. |
• | Our strong cash flows and our tax efficient REIT structure help to create an efficient and attractive cost of capital to support our inorganic growth. |
213
Table of Contents
• | We deploy our capital into a deep pipeline of investments within our existing facilities, accretive greenfield and expansion development projects and acquisition opportunities at returns in excess of our cost of capital. |
• | We then use our organic business initiatives and drive operational and administrative synergies to seek to grow our same warehouse NOI and cash flows post investment. |
• | We then repeat the process through our growth flywheel. |
Same Warehouse Growth
We have a history of robust same warehouse growth with strong operating leverage and cash flow generation. In 2023, our same warehouse NOI was $1,210.9 million, representing growth of 15.3% compared to same warehouse NOI of $1,050.6 million the prior year, and in 2022, our same warehouse NOI was $936.2 million, representing growth of 12.7% compared to same warehouse NOI of $830.5 million in 2021, which growth rates compare favorably to those of our largest competitor and publicly traded peer. Our same warehouse NOI margins of 40.3% in 2023 compared to 37.2% in the prior year and 39.0% in 2022 compared to 38.8% in the prior year compare favorably to those of our largest publicly traded competitor. In addition, we increased our global same warehouse storage revenue per economic pallet 6.2% and 8.1% and our same warehouse services revenue per pallet 7.4% and 13.8% in 2023 and 2022, respectively.
We expect to continue our organic growth through the following business initiatives:
• | Leverage the scale of our warehouse network and the breadth of our integrated solutions offerings to win new customers and expand our footprint with existing customers; |
• | Maximize our same warehouse NOI growth through occupancy and commercial optimization initiatives; |
• | Further implement productivity tools and cost containment measures; |
• | Use our integrated platform, scalable corporate infrastructure and business processes to realize synergies from recent acquisitions and drive same warehouse growth post-acquisition; |
• | Strategically deploy innovative technologies to provide customers more sophisticated solutions while enhancing profitability; and |
• | Transform the industry through our data science driven approach to warehouse control and design. |
Accretive Capital Deployment
A cross functional network optimization, data science and automation team has overseen 39 major greenfield or expansion projects since the start of 2019, with total cost of approximately $1.2 billion, representing an NOI yield of approximately 9% to 11%. The total aggregate cubic feet of these projects is approximately 291 million, which is equivalent to the total warehousing capacity of the fourth largest standalone global temperature-controlled warehousing company. Since 2019, this team has also supported more than 375 economic return on capital projects within our warehouses to enhance organic growth. We have spent significant time and cost to establish a team of experts in construction, energy, automation and innovation, and we believe our development process and expertise, together with our robust pipeline of facility expansions and greenfield development, has the potential ability to drive future growth and ongoing value to our stockholders.
We believe we are an acquiror of choice in the industry, as demonstrated by our long history of acquiring leading companies through direct sourcing and long-term relationships with their owners. Our acquisition strategy targets profitable businesses with strategic, high-quality assets that complement our network and customers’ needs. These businesses often present opportunities to accretively deploy capital and recognize
214
Table of Contents
revenue and cost synergies. We have extensive experience acquiring cold chain companies of all sizes. In the last 16 years through March 31, 2024, we have executed 116 acquisitions with nearly two-thirds of those proprietarily sourced. Moreover, through 2023, we have achieved an approximately 12% NOI compounded annual growth rate from the temperature-controlled warehousing companies we acquired during the period of 2011 through 2021, excluding additional NOI growth as a result of post-acquisition greenfield and expansion initiatives, demonstrating the positive impact of Lineage’s comprehensive approach to integration and Lineage’s ability to compound capital over a long period of time.
We intend to continue our track record of accretive capital deployment through the following business initiatives:
• | Invest in potentially accretive projects across our existing facilities to enhance same warehouse growth; |
• | Execute on our greenfield and existing facility expansion initiatives; and |
• | Capitalize on strategically attractive and financially accretive acquisition opportunities. |
Same Warehouse Growth
Same Warehouse Growth: Leverage the scale of our warehouse network and the breadth of our integrated solutions offerings to win new customers and expand our footprint with existing customers.
As the world’s largest temperature-controlled warehouse REIT based on cubic feet, we believe our portfolio of strategically located temperature-controlled warehouses and comprehensive set of integrated solutions create the scale and breadth of services to maximize value for both existing and new customers. Our platform includes 482 warehouses and is supported by more than 26,000 dedicated team members across 19 countries. Our modern warehousing assets are predominantly located in key port and infill locations that are strategic to customers of the cold chain. We believe the interconnected nature of our network and our presence in these strategic locations enables us to provide comprehensive solutions, competitively positioning us to both win new business and expand our footprint with existing customers.
Our warehouse portfolio is complemented by our integrated solutions business, offering an “all services under one roof” experience for our customers, providing our customers a holistic solution to their complex needs. This approach supports our growth by deepening our relationships with existing customers as well as allowing us to compete effectively for new customers. Additionally, the depth of our relationships allows us to seek to increase the penetration of customers utilizing both warehousing and integrated solutions.
Providing a global system of top-tier warehouses and ever broadening services has deepened our customer relationships with a growing customer base. As evidence of the interconnected nature of our warehouse and integrated solutions segments, as of March 31, 2024 our top 25 customers utilize an average of 23 of our warehouses per customer, with eight of our top 10 customers using our facilities in multiple countries. The interconnected nature of our integrated solutions business is demonstrated by our estimate that approximately 93% of our total NOI was generated by our warehouse customers for the twelve months ended March 31, 2024 (based on our global warehousing segment NOI and, as it relates to our global integrated solutions segment NOI, the relative revenue contribution from our customers who utilize our warehousing business and our customers who exclusively utilize our integrated solutions).
Same Warehouse Growth: Maximize our same warehouse NOI growth through occupancy and commercial optimization initiatives.
We seek to grow our same warehouse NOI through occupancy and commercial optimization initiatives. Our occupancy initiatives are highlighted by a focus on optimizing physical warehouse occupancy and improving economic occupancy through increased use of minimum storage guarantees, while our commercial optimization initiatives are enabled by customer profitability tools and allowing us to align rates charged to customers with our cost to serve.
215
Table of Contents
• | Optimizing Physical Warehouse Occupancy Through Increased Utilization. Increases in warehouse physical occupancy generate high flow-through to NOI due to operational leverage. We seek to optimize physical occupancy in our existing warehouse network by winning new customers, expanding our business with existing customers and more efficiently matching customer profiles to the best available pallet positions in our markets. We support these initiatives with a team of sales and customer account management people who are focused on using the Lineage network to solve customers’ supply chain needs. These utilization initiatives have increased our physical occupancy from 78.0% in 2021 to 79.2% in 2022 and to 80.0% in 2023. |
• | Increasing use of Minimum Storage Guarantees to Improve Economic Occupancy. We plan to expand our use of minimum storage guarantees that pay us minimum or fixed storage fees for pallet positions, whether they are physically occupied or not. We believe that transitioning certain customer contracts from on-demand, as-utilized structures to minimum storage guarantee structures will drive greater consistency of our NOI by increasing revenue predictability and enabling us to better manage our labor force while meeting customers’ needs. This strategy helps maintain our storage revenues during periods of lower inventories matching ongoing revenue streams with fixed warehousing costs while allowing customers to reserve space to meet their needs. We believe that implementing minimum storage guarantees will continue to boost recurring revenue and enhance stability of cash flows, while allowing customers to plan for periods of increased need by reserving capacity and ultimately enabling a better temperature-controlled warehousing experience for our customers. Our minimum storage guarantee initiatives have increased our economic occupancy from 82.3% in 2021 to 83.2% in 2022 and to 86.0% in 2023. |
• | Commercial Optimization Initiatives. We employ three main types of customer contracts: warehouse agreements, rate letters and tariff sheets. We also earn rent under lease agreements pursuant to which we lease a portion of a warehouse or an entire warehouse. Warehouse agreements and rate letters generally provide us with some flexibility to pass on rate increases to customers during the term of the contract. Warehouse agreements and rate letters often also include mechanisms to adjust rates for inflationary cost increases and customer profile changes, while tariff sheets are short-term in nature and can generally be updated upon 30 days advance notice. We are generally able to translate industry-wide rent increases into storage rate increases to customers, and our various rate adjustment mechanisms generally allow us to pass on both storage and handling rate increases to customers as necessary to account for inflation in operational costs such as wages, power and warehouse supplies as well. Additionally, we have been refining an array of tools to evaluate relative customer profitability to ensure that we are allocating our warehouse space to the customers that value it the most. |
• | Aligning Rates with Cost to Serve. We are deploying technologies such as a third-party contracting and invoicing platform to professionalize our commercial optimization capabilities across our company. We are driving standardization of rates across our warehouse network as well as seeking to implement standardized billing practices to ensure that we are adequately compensated for all services performed. Incremental cost to serve charges capturing previously unbilled services are anticipated to support NOI growth as these initiatives are implemented across our warehouse network. In addition, to deliver the best service and most efficient cost to serve, we seek to closely monitor agreed-upon customer profiles in our contracts and make pricing adjustments as necessary to compensate for variances. |
Same Warehouse Growth: Further implement productivity and cost containment measures to grow same warehouse NOI.
We seek to grow our NOI by reducing our operating expenses with a specific emphasis on two of the largest cost drivers facing the temperature-controlled warehouse industry: labor and energy.
• | Labor Productivity. Labor and benefits represent the largest variable cost of operating a temperature-controlled warehouse. We employ multiple strategies to maximize labor productivity, such as our focus on lean operating principles and our emphasis on team member retention. The implementation of lean operating principles drives operational excellence, which we believe leads to greater productivity and |
216
Table of Contents
consistency over time resulting in better customer service and better operating results in certified warehouses. We anticipate the implementation of these operating principles will support NOI growth as we significantly expand internal certification in our portfolio from 67 warehouses certified out of 482 total warehouses as of March 31, 2024. We internally certify warehouses based on their progression across six categories—culture, standardized work, visual management, problem solving, just-in-time and quality process. Our focus on labor retention through total rewards, market wage benchmarking, team member onboarding and training leads to increased tenure and reduced turnover, which generally increases productivity, reduces recruiting costs and has knock-on benefits in other areas of the warehouse such as reduced maintenance expense and claims, as well as better customer service. We have extensive experience with many of these tools through various labor market conditions, including the challenging labor market driven by COVID-19. We are seeing evidence that these tools are having a positive impact as the labor market continues to normalize post pandemic. |
• | Energy Efficiency. We seek to maximize energy efficiency in our warehouses through the application of best practices, implementation of the latest technology and generation of alternative sources of energy. Our best practices include energy hedging strategies and a centralized energy and sustainability team that deploys these initiatives across our network to ensure standardization and minimization of energy waste. The technologies we deploy to optimize energy efficiency include variable frequency drives, advanced refrigeration control systems, rapid close doors, motion sensor technology, LED lighting and “flywheeling,” an innovative process that leverages machine learning and artificial intelligence to manage energy load based on predictions of power prices based on fluctuations in demand. Our approach to generating alternative sources of energy is primarily through the deployment of onsite solar, onsite battery capacity and onsite generators. Our focus on energy efficiency in our portfolio reduces our operating costs and supports stronger and more predictable NOI margins and growth while also supporting our sustainability initiatives. |
Same Warehouse Growth: Use our integrated platform, scalable corporate infrastructure and business processes to realize synergies from recent acquisitions and drive same warehouse growth post-acquisition.
We have a long history of acquiring and integrating companies into the Lineage platform and expect to continue to drive growth from more recently acquired companies as well as acquisitions in the future. We anticipate driving future growth by leveraging our broad and deep customer relationships, applying our management best practices, driving penetration of our suite of integrated solutions and technology offerings, investing growth capital and generating cost efficiencies through our corporate scale and elimination of redundant overhead expenses.
Since inception, we have demonstrated an ability to drive growth from the integration of acquisitions to capture synergies and fuel greater future earnings potential. We believe we will continue to unlock potential substantial value from acquired companies. Moreover, through 2023, we have achieved an approximately 12% NOI compounded annual growth rate from the temperature-controlled warehousing companies we acquired during the period of 2011 through 2021, excluding additional NOI growth as a result of post-acquisition greenfield and expansion initiatives, demonstrating the positive impact of Lineage’s comprehensive approach to integration and Lineage’s ability to compound capital over a long period of time.
Our rapid pace of inorganic expansion and the need for significant integration resources and the expense related to Core WMS conversions have resulted in substantial growth in general and administrative expenses. As we integrate our many acquired businesses, we are focused on realizing the benefits of scale and operational leverage and believe we have opportunities to further eliminate redundant overhead expenses and reduce expenditures on integration resources over time. Historically, as we have integrated acquired companies, we have also often been able to generate synergies in areas such as procurement, benefits and insurance, where our corporate programs are often more efficient than those of the acquired companies and anticipate continuing to do so in the future.
217
Table of Contents
Same Warehouse Growth: Strategically deploy innovative technologies to provide customers more sophisticated solutions while enhancing profitability.
We view innovative technologies as core to who we are at Lineage and strategic to maintaining our competitive position relative to our peers, driving industry leading margins and growth and providing the best service to our customers. We believe our significant previous investments have allowed us to build a superior technology-enabled platform designed to meet the needs of our customers into the future and anticipate that deploying these technologies will support potential continued growth in our NOI while transforming the experience for our customers with a digitally connected cold chain and enhancing operational excellence inside our warehouses.
• | Transforming the experience for our customers with a digitally connected cold chain. We plan to continue the roll out of proprietary operating systems and third-party platforms focused on providing a superior customer experience and increasing customer loyalty. Our proprietary Lineage Link platform empowers customers to digitally manage their inventories, orders, shipments and transportation appointment scheduling across our warehouse network through a dynamic user interface that significantly improves the customer experience. This tool also replaces antiquated paper and email based processes that lead to faster interactions, fewer errors and a meaningfully lower cost to serve, which should drive potential incremental NOI. As of March 31, 2024, Lineage Link has been rolled out across approximately 63% of our network as measured by global warehousing segment revenues for the twelve months ended March 31, 2024. We believe the continued roll out of this tool and continued product enhancement will yield attractive future benefits. |
• | Enhancing operational excellence inside our warehouses. We seek to integrate our network onto our common technology systems to standardize operations and increase productivity. We have already largely integrated all of our facilities into our human capital and financial ERP software and our proprietary metricsOne operating KPI dashboard. We are working to increase the number of our warehouses that utilize one of our four Core WMS systems. As of March 31, 2024, approximately 69% of our global warehousing segment revenue for the twelve months ended March 31, 2024 flowed through one of our four Core WMS, excluding facilities leased to customers and managed facilities. We are in the process of growing this percentage across our network. We expect increased penetration of our four Core WMS throughout our network to drive operational productivity, reduce general and administrative expenses and accelerate our ability to deploy digital technology solutions network-wide. We believe that the development and subsequent deployment of LinOS and a third-party contracting and invoicing platform will make our operations more efficient and potentially generate NOI growth once fully integrated. |
Additionally, our general and administrative spend currently includes substantial growth and technology investments, which we refer to as transformational technology G&A, such as the development and subsequent deployment of our technology operating systems. Once fully integrated, we believe we will benefit from operating leverage as these new investments are spread across our growing portfolio.
Same Warehouse Growth: Transform the industry through our data science driven approach to warehouse control and design.
Our productivity and process automation initiatives are supported by our in-house data science team, which is comprised of 50 applied science and product professionals that provide data-driven business intelligence and innovations to maximize operational efficiencies, revenues, profitability, energy efficiency and cash flows. Our innovations have yielded 96 patents issued and 151 patents pending as of March 31, 2024, in such areas as facility design, methods and mechanisms for operating facilities, refrigeration and thermodynamic designs and cold-rated instrumentation. These innovations offer numerous ways to potentially grow our NOI, including through optimization of our conventional racking systems, algorithms that better allocate tasks in the warehouse and improvements in electricity consumption for blast freezing. We believe that many of these innovations have now been successfully piloted and can be rolled out to other similar use cases.
218
Table of Contents
Accretive Capital Deployment
Accretive Capital Deployment: Invest in potentially accretive projects across our existing facilities to enhance same warehouse growth.
We continually evaluate opportunities to drive organic growth within our existing facilities through accretive capital deployment into high economic return on capital opportunities, such as re-racking projects to increase pallet capacity, installation of opportunity chargers, solar projects to improve energy efficiency and the addition of blast cell capacity. In addition to potentially generating incremental revenues and NOI, return-on-capital projects are intended to enhance our facilities’ ability to best serve our customers’ needs with the most advanced and customized solutions available. Many of these projects are supported by our applied science, energy management and product professionals that provide data-driven business intelligence and innovations to maximize operational efficiencies, revenues, profitability, energy efficiency and cash flows. Since 2019, our team has supported more than 375 economic return on capital projects within our warehouses to enhance organic growth.
Accretive Capital Deployment: Execute on our greenfield and existing facility expansion initiatives.
Because of our reputation for delivering innovative new development projects and the benefits of participating in our industry-leading warehouse network, customers often choose to partner with us for their largest and most important projects. In addition, we have spent considerable time and investment establishing an in-house warehouse network optimization team comprised of warehouse design, automation and construction experts. We expect our development expertise will continue to support our growth as we potentially realize the returns on our recently completed greenfield and expansion projects and deliver on our industry-leading pipeline of greenfield development and expansion opportunities.
• | Recently Completed Greenfield and Expansion Projects. Since March 31, 2021 through March 31, 2024, we completed 25 greenfield and expansion projects totaling approximately $922 million in costs. |
Recently Completed Projects | Square Feet (in millions) | Cubic Feet (in millions) | Pallet Positions (in thousands) | Total Cost | Twelve Months (in millions) | Weighted | ||||||
25 | 3.3 | 179 | 571 | $922 | $47 | 9%-12% |
(1) | Includes approximately $7 million of remaining spend. |
No assurance can be given that our weighted average targeted NOI yield range will be achieved.
• | Industry-Leading Pipeline of Greenfield and Expansion Opportunities. |
• | Under Construction Pipeline. As of March 31, 2024, we had eight greenfield development and expansion projects under construction. |
Under | Estimated Square Feet (in millions) | Estimated Cubic Feet (in millions) | Estimated Pallet Positions (in thousands) | Estimated Total Cost (in millions) | Remaining Spend (in millions) | Twelve Months Ended March 31, 2024 Revenue Less Operating Expenses (in millions) | Weighted Average Target NOI Yield | |||||||
8 | 1.2 | 70.3 | 235 | $578 | $310 | ($4) | 9% -11% |
No assurance can be given that we will complete any of these projects on the terms currently contemplated, or at all, that the actual cost or completion dates of any of these projects will not exceed our estimates or that the targeted NOI yield range of these projects will be consistent with our current projects.
We believe we have industry-leading automation capabilities, including 24 fully automated facilities totaling 386 million cubic feet and 57 semi-automated facilities totaling 361 million cubic feet as of
219
Table of Contents
March 31, 2024, which we believe is the most of any temperature-controlled warehousing provider in the world. Our proprietary technology and unique approach to automation enables us to provide customers with truly customizable solutions to address their warehouse needs. For many years, we have been building our own in-house team of automation and software integration experts. All of our development projects are designed in-house based on actual customer data and profiles. Unique to our industry, we have developed proprietary automation control software that helps us optimize our automated warehouse operations. For new developments, because we own our own software, we can select the best hardware regardless of manufacturer, to build what we believe are the most cost-effective and most advanced automated warehouses in our industry. We intend to continue our leadership in temperature-controlled warehouse automation through development of next-generation automated warehouses as part of our pipeline. We anticipate approximately 58% of the total added pallet positions of our facilities under construction as of March 31, 2024 will be fully automated. Automated facilities generally produce a lower cost to serve and lower resource consumption, presenting an attractive solution to our customers and positioning us well to win new business and grow our cash flows from operations.
• | Future Long-Term Pipeline. As of March 31, 2024, we owned approximately 1,227 acres of undeveloped land or “Land Bank” in addition to the owned land included in our under-construction pipeline. Our Land Bank has the potential to support future greenfield development and expansion opportunities, with an estimated cost to replace as of March 31, 2024 of approximately $462 million based on broker inquiries, comparable land sales and our internal estimates. As of March 31, 2024, we were researching or underwriting a range of greenfield development and expansion opportunities as part of our future long-term pipeline, including 16 projects globally at various phases of research and underwriting. The projects in our future long-term pipeline include both projects where we already own the land and projects for which we will need to acquire incremental land. We currently expect that the targeted weighted average NOI yield range of these projects will be generally consistent with our recent projects. |
Estimated Land Bank (in acres) | Estimated Square Feet (in millions)(1) | Estimated Cubic Feet (in millions)(1) | Estimated Pallet Positions (in millions)(1) | Estimated Cost to Replace (in millions)(2) | ||||||||||||||||
1,227 | 17.7 | 728 | 2.4 | $462 | ||||||||||||||||
Greenfield Development and | Estimated Square Feet (in millions)(3) | Estimated Cubic Feet (in millions)(3) | Estimated Pallet Positions (in thousands)(3) | Estimated Construction Cost (in millions)(2) | ||||||||||||||||
16 | 4.1 | 246 | 748 | $1,850 |
(1) | Square feet, cubic feet and pallet positions reflect potential capacity undeveloped land can support through future greenfield development and expansion based on typical warehouse designs. |
(2) | Estimated cost to replace is based on broker inquiries, comparable land sales and our internal estimates as of March 31, 2024. |
(3) | Square feet, cubic feet and pallet positions reflect potential capacity of greenfield development and expansion opportunities based on current research and underwriting. |
We have not commenced construction on any potential projects in our long-term pipeline, the completion of which is subject to various factors, including budgeting, diligence, internal and third-party approvals and other factors. No assurance can be given that we will pursue or complete any of these projects on the terms currently contemplated, or at all, that the actual cost or completion dates of any of these projects will not exceed our estimates or that the targeted NOI yield range of these projects will be consistent with our current projects.
As a part of our standard development and expansion underwriting process, we analyze the estimated initial full year stabilized NOI yield we expect to derive from each greenfield development project and the estimated incremental initial full year stabilized NOI yield we expect to derive from each expansion project, as applicable,
220
Table of Contents
and establish a targeted NOI yield range. We define estimated initial full year stabilized NOI yield as the percentage of the total estimated cost to complete the greenfield development or expansion project represented by the estimated initial full year stabilized NOI from the greenfield development project or the estimated incremental initial full year stabilized NOI from the expansion project. For development projects, we calculate the estimated initial full year stabilized NOI by subtracting the greenfield development project’s estimated initial full year stabilized operating expenses (before interest expense, income taxes (if any) and depreciation and amortization) from its estimated initial full year stabilized revenue. For expansion projects, we calculate the estimated incremental initial full year stabilized NOI by subtracting the expansion project’s estimated incremental initial full year stabilized operating expenses (before interest expense, income taxes (if any) and depreciation and amortization) from its estimated incremental initial full year stabilized revenue. Our greenfield development and expansion projects are typically stabilized within 24 to 36 months of completion. See “Risk Factors—Risks Related to Our Business and Operations—The actual initial full year stabilized NOI yields from our greenfield development and expansion projects may not be consistent with the targeted NOI yield ranges set forth in this prospectus” and “—Our future greenfield development and expansion activity may not be consistent with the estimates relating to our future long-term pipeline set forth in this prospectus.”
Accretive Capital Deployment: Capitalize on strategically attractive and financially accretive acquisition opportunities.
The temperature-controlled warehousing sector remains highly fragmented and is generally comprised of many family-owned and independent companies that may lack the capital, technology, customer relationships, development expertise, technical knowledge and management sophistication that we possess. For example, we estimate based on GCCA data that over 100 temperature-controlled warehousing companies operate in the U.S. market alone and that there are approximately 4.4 billion cubic feet available for growth in North America. We believe that there remain substantial whitespace opportunities in geographies such as Europe, Asia, the Middle East and Africa, and that there are approximately 22.4 billion cubic feet available for growth globally. As a result, we see significant potential opportunity in continuing to execute on our proven acquisition strategy, which targets profitable businesses with strategic, high-quality assets that complement our warehouse network and customers’ needs. In addition to operating businesses, there also remain real estate opportunities to acquire triple-net-leased facilities and execute sale-leaseback transactions with customers and other cold storage operators.
Industry Estimate of North America and Global Market Size
(1) | 2024 GCCA Global Top 25 List (April 2024) and 2024 GCCA North America Top 25 List (April 2024), except Lineage figures, which are based on company data as of March 31, 2024. Global market share is based on total global capacity from 2020 GCCA Global Cold Storage Capacity Report (August 2020). |
221
Table of Contents
(2) | Represents total cubic feet for the market excluding Lineage. |
• | Status as an Acquiror of Choice Supports Robust Acquisition Opportunities. We believe we are an acquiror of choice in the industry, as demonstrated by our long history of executing strategic acquisitions through direct sourcing and long-term relationships with their owners. We have extensive experience acquiring cold chain companies of all sizes, and to date former owners of acquired companies have rolled approximately $664 million of equity to become investors in Lineage, while hundreds of members of management of acquired companies have stayed on and grown with our company over time. Over the course of our extensive acquisition history, we have successfully leveraged existing relationships and direct sourcing channels for nearly two-thirds of the companies we have acquired, with the remainder coming to fruition through successful bidding in advisor-led sale processes. In addition, we believe we enjoy multiple advantages when participating in sale processes, including our prolific transaction experience and track record of quickly closing transactions and our flexible balance sheet. |
• | Multiple Levers to Drive Value Creation Post Acquisitions. As described above in our other internal and external growth strategies, we can drive value creation through multiple levers, including revenue growth, cost efficiencies, deployment of capital and implementation of technology. Our proprietary integration playbook includes over 500 steps to completion and has been refined throughout the last decade to develop a consistent and successful gameplan for acquisition integration. As acquisitions are incorporated into the Lineage network, the opportunity set for deploying these strategies grows. We have a standardized and disciplined approach to integrating acquired companies while bringing acquired team members into the Lineage family. Through this approach and an open mindset to learn and adopt best practices of newly acquired business, we can seek to capitalize on growth opportunities beyond the acquisition date. |
Information Technology
Our information technology networks and related systems are essential to the operation of our business and our ability to perform day-to-day operations, including managing and operating our warehouses and our integrated solutions business, delivering a smooth customer experience, and processing financial information for internal and external reporting purposes. Furthermore, our ability to effectively manage and maintain our inventory and to receive and ship products to customers on a timely basis depends significantly on the reliability of our WMS. Our transportation management system (“TMS”) is equally crucial to our integrated solutions offerings. Our TMS is integrated to our WMS where appropriate to offer a seamless customer experience. We rely on a combination of proprietary and third-party operating systems to efficiently run our business. In addition to continuous improvements to these applications, we integrate acquisitions and development projects onto these common technology platforms. We are and will continue to invest in implementing common technology platforms across the geographies in which we operate. As of March 31, 2024, approximately 95% of our global warehousing segment revenue was integrated on our human capital and financial ERP software, and approximately 69% of our global warehousing segment revenue for the twelve months ended March 31, 2024 flowed through one of our four Core WMS, excluding facilities leased to customers and managed facilities. As of March 31, 2024, all of our global warehousing segment revenue was reporting on metricsOne, a proprietary operating KPI dashboard that provides enhanced visibility into our operational execution, labor, safety, and financial performance.
Our cloud first strategy allows for the most reliable, scalable, and redundant infrastructure, and our critical applications systems are configured to be highly-available. We continue to enhance our security measures to protect our information technology systems and prevent cyber-attacks, system failures or data or information loss.
In addition, since January 1, 2019, we have invested more than $725 million into transformational information technology initiatives which include developing, acquiring and deploying both proprietary and third-party operating systems. Our innovations have yielded 96 patents issued and 151 patents pending as of March 31, 2024 in such areas as facility design, methods and mechanisms for operating facilities, refrigeration and thermodynamic designs
222
Table of Contents
and cold-rated instrumentation. We have developed Lineage Link, a proprietary customer visibility platform that empowers customers to actively manage their inventories, orders, shipments and transportation appointment scheduling across our warehouse network, which seeks to drive incremental NOI through reduced cost-to-serve. As of March 31, 2024, Lineage Link has been rolled out across 63% of our networks as measured by global warehousing segment revenues. We are in the initial phases of deploying proprietary and third-party operating systems to drive yield and productivity across our warehouse network and thereby drive margin improvement. Our specialized warehouse execution system, LinOS, is engineered to boost our operational efficiency. It employs unique, patented algorithms to optimize task allocation among team members and strategically prioritize tasks within our warehouses. Currently operational in select automated facilities, LinOS shows significant potential for extensive deployment across our conventional warehouse network in the future.
Seasonality
We are involved in providing services to food producers, distributors and retailers whose businesses, in some cases, are seasonal. On a portfolio-wide basis, economic and physical occupancy rates and warehouse revenues generally peak between mid-September and early December in connection with the holiday season and the peak harvest season in the northern hemisphere. Economic and physical occupancy rates and warehouse revenues on a portfolio-wide basis are generally the lowest during May and June. The diversification of our business across different commodities mitigates, in part, the impact of seasonality as peak demand for various products occurs at different times of the year (for example, demand for ice cream is typically highest in the summer while demand for frozen turkeys usually peaks in the late fall). Our southern hemisphere operations in Australia and New Zealand also help balance the impact of seasonality in our global operations, as their growing and harvesting cycles are complementary to North America and Europe. Each of our warehouses sets its own operating hours based on demand, which is heavily driven by growing seasons and seasonal consumer demand for certain products.
Power Costs
The temperature-controlled warehouse business is power-intensive. Keeping food products refrigerated or frozen requires substantial amounts of power and managing power costs is a priority for us and our customers. Power costs accounted for 5.3% of our total global warehousing segment revenues for the year ended December 31, 2023. We seek to maximize energy efficiency in our warehouses through the application of best practices, the latest technology and alternative energy generation.
• | Application of Best Practices: Certain jurisdictions and regions in which we operate, including Texas, Illinois, the Northeast United States, Europe, New Zealand and Australia, have deregulated market-based electricity exchanges. To manage our exposure to volatile power prices, we have entered, and may continue to enter, into arrangements to fix power costs for all or a portion of our anticipated electricity requirements. The durations of these forward contracts are generally one to three years. In addition, we employ a centralized energy and sustainability team that we deploy across our network to promote standardization and minimization of energy waste. |
• | Modern Technologies: The technologies we deploy to optimize energy efficiency include variable frequency drives, refrigeration control systems, rapid close doors, motion sensor technology, LED lighting and “flywheeling,” an innovative process that leverages machine learning and artificial intelligence to manage energy load based on predictions of peak demand. Further, we believe that automated facilities can significantly reduce energy intensity as compared to conventional facilities. Select recent examples within our network indicate reductions of approximately 20% as measured by kWh usage per pallet position in automated facilities relative to conventional facilities in the same metropolitan areas. |
• | Alternative Energy Generation: We are also focused on generating alternative sources of energy through on-site solar, battery storage and linear generators. Our alternative energy approach allows us |
223
Table of Contents
to buy power at a cheaper cost and monetize carbon credits to offset energy costs and is also supportive of our sustainability strategy. Through solar systems at our facilities, we had installed capacity of 146 megawatts of solar energy as of March 31, 2024. |
In addition to maximizing energy efficiency, when appropriate we seek to pass through increases in power costs to our customers.
Commercial Organization
Our relationships with customers, regulators, communities in which we operate and the broader cold chain are essential to our overall purpose to transform the global food supply chain to eliminate waste and help feed the world. Our sales, business development and marketing functions are responsible for developing and strengthening those relationships to promote the safe and efficient movement of food products to consumers worldwide.
Our sales and business development teams actively partner with customers to determine best options for optimizing and streamlining their cold chain services. Accordingly, we work across our business to realize opportunities to serve our customers’ extended cold chains. Our sales and business development teams also play a critical role in the development strategy for new warehouses commissioned by customers who seek out our design and build-to-suit expertise, which is supported by our award-winning data science team. As of March 31, 2024, our sales team was comprised of over 250 team members.
Our commercial team is organized to serve customers by size, segment and solution. Large, multi-national customers are served through our strategic account management team, while our business development team is responsible for new customer acquisition and business expansion. Regional customers are served through a local sales structure that is directly aligned to our operations teams in facility locations, working together to optimize warehouse capacity. We also house product-specific expertise to address the diverse and specialized needs of the numerous commodities we serve.
Our marketing function partners with departments across our company and is organized to include corporate communications, public relations, brand marketing, commercial intelligence and government relations. The primary focus of our marketing team is to grow relationships with new and existing customers as well as promote engagement with Lineage as a trustworthy, innovative and ethical brand. We constantly look to generate awareness and a positive perception of the cold chain as a whole, boosting consumer confidence in how food products move from farm to fork.
Trademarks
The name “Lineage” and the Lineage logo are registered trademarks. We have established considerable goodwill with customers under this brand name and believe its reputation in our industry is a strong competitive advantage.
Regulatory Matters
General
Many laws and governmental regulations are applicable to our properties and changes in these laws and regulations, or interpretation of such laws and regulations by agencies and the courts, occur frequently.
Environmental Matters
Our operations are subject to a wide range of environmental laws and regulations in each of the locations in which we operate, and compliance with these requirements involves expertise, significant capital and operating
224
Table of Contents
costs. Failure to comply with these environmental requirements can result in civil or criminal fines or sanctions, claims for environmental damages, remediation obligations, revocation of permits or restrictions on our operations. Future changes in environmental laws or in the interpretation of those laws, including stricter requirements affecting our operations, could result in increased capital and operating costs, which could materially and adversely affect our business, financial condition, liquidity, results of operations and prospects and, consequently, amounts available for distribution to our stockholders.
Under various United States federal, state and local environmental laws, a current or previous owner or operator of real property may be liable for the entire cost of investigating, removing and remediating hazardous or toxic substances on such property. Such laws often impose liability whether or not the owner or operator knew of, or was responsible for, the contamination. Even if more than one person may have been responsible for the contamination, each person covered by the environmental laws may be held responsible for the entire clean-up cost.
The presence of hazardous or toxic substances on our properties, or the failure to properly remediate contaminated properties, could give rise to liens in favor of the government for failure to address the contamination, or otherwise adversely affect our ability to sell or lease properties or borrow using our properties as collateral. Environmental laws also may impose restrictions on the manner in which properties may be used or how our businesses may be operated.
Under environmental laws, a property owner or operator is subject to compliance obligations, potential government sanctions for violations or natural resource damages, claims from private parties for cleanup contribution or other environmental damages and investigation and remediation costs. In connection with the acquisition, ownership or operation of our properties, we may be exposed to such costs. The cost of resolving environmental, property damage or personal injury claims, of compliance with environmental regulatory requirements, of paying fines, or meeting new or stricter environmental requirements or of remediating contaminated properties could materially adversely affect our business, financial condition, liquidity, results of operations and prospects and, consequently, amounts available for distribution to our stockholders.
In the future, our customers may demand lower indirect emissions associated with the storage and transportation of refrigerated and frozen foods, which, if we are unable to meet these demands, could lead customers to seek temperature-controlled storage from our competitors or increase demand for alternatives to refrigerated and frozen foods. Further, such demand could require us to implement various processes to reduce emissions from our operations in order to remain competitive, which could adversely affect our business, financial condition, liquidity, results of operations and prospects.
Most of our warehouses utilize anhydrous ammonia (NH3) as a refrigerant. Anhydrous ammonia is classified as a hazardous chemical regulated by the U.S. Environmental Protection Agency (EPA) and a significant release of anhydrous ammonia from one of our properties could result in injuries, loss of life and property damage. Releases of anhydrous ammonia may occur at our warehouses from time to time due to routine maintenance or an unanticipated mechanical failure. Although we cannot predict the extent of our liabilities as a result of these incidents, we expect any related product damage claims to be covered by insurance subject to applicable deductibles. Although our warehouses have risk management programs required by U.S. Department of Labor Occupational Safety and Health Administration (OSHA), the EPA and other regulatory agencies in place, we could incur liability in the event of an unanticipated release of anhydrous ammonia from one of our refrigeration systems. Our warehouses also may have under-floor heating systems, some of which utilize chemicals such as ethylene glycol; releases from these systems could potentially contaminate soil and groundwater.
Nearly all of our properties have been the subject of environmental assessments conducted by environmental consultants. However, many of these assessments are not current and most have not been updated for the purposes of this offering. Most of these assessments have not included soil sampling or subsurface
225
Table of Contents
investigations. Many of our older properties have not had asbestos surveys. In many instances, we have not conducted further investigations of environmental conditions disclosed in these environmental assessments nor can we be assured that these environmental assessments have identified all potential environmental liabilities associated with our properties. Material environmental conditions, liabilities or compliance concerns may arise after the date of the environmental assessments on our properties. Moreover, there can be no assurance that (1) future laws, ordinances or regulations will not impose new material environmental obligations or costs, including with respect to the potential effects of climate change or new climate change regulations, (2) we will not incur material liabilities in connection with known or undiscovered environmental conditions arising out of past activities on our properties or (3) our properties will not be adversely affected by the operations of customers, by environmental impacts or operations on neighboring properties (such as releases from underground storage tanks), or by the actions of parties unrelated to us.
Food Safety Regulations
Most of our warehouses are subject to compliance with federal regulations regarding food safety. Under the Public Health Security and Bioterrorism Preparedness and Response Act of 2002, the United States Food and Drug Administration, or the FDA, requires us to register all warehouses in which food is stored and further requires us to maintain records of sources and recipients of food for purposes of food recalls. The Food Safety Modernization Act, or FSMA, was signed into law in January 2011 and significantly expanded the FDA’s authority over food safety, providing the FDA with new tools to proactively ensure the safety of the entire food system, including for example, new hazard analysis and preventive controls requirements, food safety planning, requirements for sanitary transportation of food, increased inspections and mandatory food recalls under certain circumstances. Since the adoption of FSMA, the FDA has issued many new food safety-related final rules, some of which impact our business. The most significant new rule which impacts our business is the Current Good Manufacturing Practice and Hazard Analysis and Risk-Based Preventive Controls for Human Food rule. This rule requires a food facility to establish a food safety system that includes an analysis of hazards and the implementation of risk-based preventive controls, among other steps. This is in addition to requirements that we satisfy existing Good Manufacturing Practices with respect to the holding of foods, as set forth in FDA regulations. The USDA also grants to some of our warehouses “ID status,” which entitles us to handle products of the USDA. As a result of the regulatory framework from the FDA, the USDA and other local regulatory requirements, we subject our warehouses to annual third-party food safety audits. Our third-party food safety audits are conducted by certified providers, including SAI Global, AIB International, Mérieux Nutrisciences, ASI and NSF, following the one of the following schemes: Good Distribution Practices (GDP) or a Global Food Safety Initiative (GFSI) scheme, such as Safe Quality Foods (SQF) or Brand Recognition through Compliance Global Standards (BRCGS) audit programs.
To the extent we fail to comply with existing food safety regulations or contractual obligations, or are required to comply with new regulations or obligations in the future, it could adversely affect our business, financial condition, liquidity, results of operations and prospects, as well as the amount of funds available for distribution to our stockholders.
Occupational Safety and Health Act
Our properties are subject to regulation under OSHA, which requires employers to provide employees with an environment free from recognized hazards likely to cause death or serious physical harm and includes regulations relating to exposure to toxic chemicals, excessive noise levels, mechanical dangers, heat or cold stress and unsanitary conditions. In addition, due to the amount of anhydrous ammonia stored at some of our facilities, we are also subject to compliance with OSHA’s Process Safety Management of Highly Hazardous Chemicals standard and OSHA’s ongoing National Emphasis Program related to potential releases of highly hazardous chemicals. The cost of complying with OSHA and similar laws enacted by states and other jurisdictions in which we operate can be substantial, and any failure to comply with these regulations could expose us to substantial penalties and potentially to liabilities to employees who may be injured at our warehouses.
226
Table of Contents
International Regulations
Our international facilities are subject to many local laws and regulations which govern a wide range of matters, including food safety, building, environmental, health and safety, hazardous substances and waste minimization, as well as specific requirements for the storage of meat, dairy products, fish, poultry, agricultural and other products. Any products destined for export must also satisfy the applicable export requirements. A failure to comply with, or the cost of complying with, these laws and regulations could materially adversely affect our business, financial condition, liquidity, results of operations and prospects and, consequently, the amounts available for distribution to our stockholders.
Other Regulations
Our properties are also subject to various federal, state and local regulatory requirements, such as fire and safety requirements. Failure to comply with these requirements could result in the imposition of fines by governmental authorities or awards of damages to private litigants. We believe that our properties are currently in substantial compliance with all such regulatory requirements. However, there can be no assurance that these requirements will not be changed or that new requirements will not be imposed which would require significant unanticipated expenditures by us, which expenditure could have an adverse effect on our business, financial condition, liquidity, results of operations and prospects.
Insurance
We carry insurance for the risks arising out of our business and operations, including coverage on all of our properties in an amount that we believe adequately covers any potential casualty losses. However, there are certain losses that we are not generally insured against or that we are not generally fully insured against because it is not deemed economically feasible or prudent to do so. In addition, changes in the cost or availability of insurance could expose us to uninsured casualty losses. In the event that any of our properties incurs a casualty loss that is not covered by insurance (in part or at all), the value of our assets will be reduced by the amount of any such uninsured loss, and we could experience a significant loss of capital invested and potential revenues in these properties. Any such losses could materially and adversely affect us. In addition, we may have no source of funding to repair or reconstruct the damaged property, and we cannot assure you that any such sources of funding will be available to us for such purposes in the future on favorable terms or at all.
In the event of a fire, flood or other occurrence involving the loss of or damage to stored products held by us but belonging to others, we may be liable for such loss or damage. Although we have an insurance program in effect, there can be no assurance that such potential liability will not exceed the applicable coverage limits under our insurance policies. Limit adequacy is reviewed annually. We have 84 facilities in zones subject to what we believe to be a moderate to high risk of flooding, in each case exposing them to increased risk of casualty.
If we or one or more of our customers experiences a loss for which we are liable and that loss is uninsured or exceeds policy limits, we could lose the capital invested in the damaged properties as well as the anticipated future cash flows from those properties. In addition, if the damaged properties are subject to recourse indebtedness, we would continue to be liable for the indebtedness, even if these properties were irreparably damaged.
Legal Proceedings
From time to time, we may be party to a variety of legal proceedings arising in the ordinary course of our business. We are not a party to, nor is any of our property a subject of, any material litigation or legal proceedings or, to the best of our knowledge, any threatened litigation or legal proceedings which, in the opinion of management, individually or in the aggregate, would have a material impact on our business, financial condition, liquidity, results of operations and prospects.
227
Table of Contents
Competition
In our global warehousing segment, the principal competitive factors are warehouse location, warehouse and yard size, which represents the square footage of the external area surrounding a loading dock used for truck parking and movement, space availability, warehouse type, design/layout, number of temperature zones, types of service, degree of automation and price. For refrigerated food customers, transportation costs are typically significantly greater than warehousing costs and, accordingly, location and transportation capabilities are major competitive factors. The size of a warehouse is important in part because customers generally prefer to have all of their products needed to serve a given market in a single location and to have the flexibility to increase storage at that single location during seasonal peaks. In areas with direct local competition, customers generally will select a temperature-controlled warehouse based upon service level, price, the quality of the warehouse, the services it offers and their overall network-wide relationship with the warehousing provider. In addition, some food producers and distributors attend to their own warehousing and distribution needs by either building or leasing warehouses, creating a private warehousing market which may compete with the public warehouse industry. Many customers, including those for whom private warehousing is a viable option, will select distribution services based upon service level and price, provided that an appropriate network of related storage facilities is available. Technology offerings and integrated solutions provided are additional and increasingly important bases upon which we compete in the marketplace. In this segment, we compete with Americold in many of our key geographies. In addition, we compete with NewCold in several key geographies including the United States, United Kingdom and Australia. Other than Americold and NewCold, our competition in this segment is primarily composed of local operators which vary by geography. In our largest geography, the United States, we believe our main competitors in addition to Americold and NewCold include US Cold, Interstate Warehousing and FreezPak Logistics. Outside these top operators, the temperature-controlled warehousing industry in the United States is highly fragmented. We believe that other significant competitors in other geographies include Nichirei and Constellation Cold, in addition to Americold, in the Netherlands; Conestoga and Congebec, in addition to Americold, in Canada; and Magnavale in the United Kingdom.
In our global integrated solutions segment, competition is highly fragmented by service offering and geography, and we do not believe that we have a single global competitor across offerings and geographies. In temperature-controlled transportation, the principal competitive factors include service, capacity and rates. We believe we are uniquely positioned by leveraging our temperature-controlled warehousing network and deploying contracting strategies that leverage third-party owner-operators, dedicated third-party fleets, common carriers and our own physical truck assets. In refrigerated rail car leasing, the principal competitive factors include car reliability, car thermal performance, repair and maintenance capabilities and price. In our largest geography, the United States, we believe our main competitors in temperature-controlled transportation include Americold, US Cold and CH Robinson, while in refrigerated rail car leasing we believe that our main competitor is Trinity Rail. Examples of significant local competitors in other geographies include DFDS in the United Kingdom, Wolter Koops in the Netherlands, Primafrio in Spain and Erb Transport and Midland Transport in Canada.
Human Capital Resources
We are committed to creating a work environment that supports the growth and success of our team members. We have employees located throughout the world. As of March 31, 2024, we employed 26,127 people worldwide.
The geographic distribution of our team members as of March 31, 2024 is summarized in the following table:
Region | Number of team members | Percentage of workforce | ||||||
North America | 17,974 | 68.8 | % | |||||
Europe | 5,548 | 21.2 | % | |||||
Asia Pacific | 2,605 | 10.0 | % | |||||
Total | 26,127 | 100.0 | % |
228
Table of Contents
As of March 31, 2024, fewer than 5% of our 16,201 team members in the United States were represented by various local labor unions and associations. Globally (including the United States), approximately 17% (based on team members for whom we are able to ascertain union status) or 26% (assuming that the entire 9% of our team members for whom we are not able to ascertain union status due to applicable privacy or freedom of association laws are represented by labor unions and associations) of our total team members were represented by various local labor unions and associations.
Diversity, Equity and Inclusion
The diversity of our team members’ experiences and backgrounds is core to our innovative culture. We are committed to providing a working environment in which all team members, customers and community partners should know they are respected. Where all team members and partners understand that we are striving to identify and eliminate barriers that could prevent the full participation of any individual or group. It is our policy to recruit talent based on skill, knowledge and experience, without discrimination. We are an equal opportunity employer, with all qualified applicants receiving consideration for employment without regard to race, color, national origin, ancestry, religion, genetic information, physical or mental disability, marital status, age, sexual orientation or identification, gender, veteran status, political affiliation, physical appearance, or any other characteristic protected by federal, state or local law. We evaluate compensation equity regularly and address pay disparities as appropriate. We are committed to developing and implementing programs and practices that create a supportive learning environment and encompasses the inclusion of diverse perspectives and experiences. We are committed to team member development and training. Our team members are offered regular opportunities to participate in formal and informal personal growth and professional development programs and opportunities.
Our commitment to Diversity, Equity and Inclusion is highlighted by our establishment of multiple Employee Resource Groups, or ERGs, to support and strengthen our team. We anchor our overall approach in our six core values of safe, trust, respect, innovation, bold and servant leadership drives how we develop team members and celebrate wins.
Climate
We have long focused on building value through efficiency, innovation, minimizing harmful impacts and doing good for the communities in which we live and work. We have signed The Climate Pledge, committing to achieve net zero carbon emissions across our global operations by 2040, and demonstrating our commitment to minimize the carbon emissions associated with our daily operations. In addition, in 2023, we issued our inaugural sustainability report.
We have made significant progress on our largest scope 2 emissions through solar installations at our facilities. Through solar installations, we had installed capacity of 146 megawatts of solar energy as of March 31, 2024. In addition, as of December 2022, we were the fifth-largest corporate user in the US, and the second-largest REIT user, of on-site solar and battery capacity per the 2022 Solar Means Business Report published by the Solar Energy Industry Association (SEIA). Our goal is to achieve a top-three corporate ranking in coming years. Having installed 87 megawatts of solar panels at our facilities between 2020 and December 2022, we have completed more on-site solar installations than any other company on the SEIA list during the same time period. Our energy efficiency initiatives have resulted in four consecutive awards from the U.S. Department of Energy from 2019 to 2022 for innovations and leadership in flywheeling, blast freezing, energy procurement and hedging and deployment of advanced refrigeration control systems.
Philanthropy
We are consistently guided by our purpose: to transform the global food supply chain to eliminate waste and help feed the world. This singular phrase governs the culture of Lineage – seeking to do good while doing well. To tackle food insecurity, we established the Lineage Foundation for Good as a non-profit charity to serve the
229
Table of Contents
communities in which we operate. Lineage Foundation for Good is bridging the hunger gap across the world and in our local communities—and everyone is invited to be a part of it. Since 2020, Lineage has donated the equivalent of over 176 million meals in partnership with customers donating surplus product, team members donating food to local food banks and grants issued to help build capacity at food banks around the globe.
Lineage Foundation for Good partners with Feeding America domestically as well as the Global Food Banking Network internationally to enable redirection of surplus food to those in need. In response to COVID-19, we launched our “Share a Meal” Campaign with Feeding America, supporting the organization’s temperature supply chain needs with our assets. As a result of these and other initiatives, we were named a Visionary Partner of Feeding America and a Fast Company’s 2021 World Changing Ideas Awards finalist in the Pandemic Response category.
Safety and Wellbeing
At Lineage, “safe” is our first value. The safety of our team members is our number one priority. Our team members receive safety training and conduct emergency response drills throughout the year to equip them with the knowledge and tools that will allow them to conduct their daily tasks safely. Our team members are provided with personal protective equipment appropriate for the performance of their job functions. Lineage has robust safety and compliance policies and programs, and we track safety and compliance metrics throughout the year. Our total global recordable incidence rate (“TIR”) of 3.4 for the year ended December 31, 2023 is approximately 35% better than the industry average of 4.6 for cold warehouses. TIR is a measure of occupational health and safety based on the number of recordable safety incidents reported against the number of hours worked based on the U.S. Occupational Safety and Health Administration (“OSHA”) record-keeping criteria (injuries per 200,000 hours).
Lineage prioritizes near miss reporting and has a Behavioral Based Safety (BBS) Program throughout the network as well as deploys wearable technology at high-risk operations to monitor and reinforce safe working behaviors by actively addressing observations, as well as providing constructive feedback to address “at risk” behaviors.
Because our most valuable asset is our people, we are constantly looking to give team members the wellbeing support they need with the goal of having a healthier and more engaged workforce. Through our comprehensive health and medical benefits, including our Team Member Assistance programs that offer holistic mental health and other benefits to team members and their families, team members have access to a wide range of care options. We look at wellbeing from a holistic perspective inclusive of physical and mental wellness and prioritize psychological safety in addition to physical safety.
Total Rewards
We provide programs and benefits designed to attract, retain and reward high-performing team members. In addition to salaries or hourly wages, our compensation programs, which are market-based, can include performance incentives for front-line workers, annual bonuses, share-based compensation awards, paid time off, retirement savings programs, healthcare and insurance benefits, health savings accounts, flexible work schedules, employee assistance programs and tuition assistance. To foster a stronger sense of ownership, aid in retention and to align the interests of our team members with our stockholders, we plan to provide restricted stock units to eligible team members through our equity incentive programs.
Business Conduct and Ethics
We believe that a strong culture is the foundation of a strong company. At Lineage, our values define who we are and connect us to one another and to our work. We are striving to be the standard for honest, ethical and responsible business in the temperature-controlled warehouse industry. To support this commitment, we recently adopted our refreshed Code of Conduct. Our Code of Conduct is available in the languages in which we conduct
230
Table of Contents
business and addresses global regulatory topics through three substantive sections: acting respectfully and responsibly in the workplace; working ethically with customers and stakeholders; and supporting our surrounding communities and protecting our planet. Our Code of Conduct includes policy statements on psychological safety, human rights, human trafficking and a statement on our commitment to fair labor practices. We provide calls to action in each topic section as well as learning aids to help bring our Code of Conduct to life. We provide an Ethics Hotline, which allows anonymous reporting where permitted by law and is administered by our corporate compliance & ethics and human resources teams. We take all reports to our Speak Up Resources seriously and evaluate all claims, conduct internal or external investigations as appropriate and implement remediation plans if necessary. Our corporate compliance and ethics committee and audit committee are regularly briefed on reports received and have access to reports made through our Ethics Helpline.
Through our global online learning management platform, we provide code of conduct training in multiple native languages so that our team members understand our expectations and how to apply these standards to their work. We also maintain an anti-discrimination and anti-harassment policy that includes mandatory harassment training for team members. We do not tolerate any form of racism, sexism or injustice within our facilities or across our organization.
231
Table of Contents
Our Directors, Director Nominees and Executive Officers
The following table sets forth certain information concerning the individuals who will be our directors and executive officers upon the completion of this offering:
Name | Age | Position | ||
Adam Forste | 46 | Co-Executive Chairman | ||
Kevin Marchetti | 46 | Co-Executive Chairman | ||
Greg Lehmkuhl | 51 | President, Chief Executive Officer and Director Nominee | ||
Robert Crisci | 49 | Chief Financial Officer | ||
Jeffrey Rivera | 51 | Global Chief Operations Officer | ||
Sudarsan Thattai | 51 | Chief Information Officer and Chief Transformation Officer | ||
Sean Vanderelzen | 52 | Chief Human Resources Officer | ||
Natalie Matsler | 48 | Chief Legal Officer and Corporate Secretary | ||
Timothy Smith | 59 | Chief Commercial Officer | ||
Brian McGowan | 50 | Chief Network Optimization Officer | ||
Gregory Bryan | 61 | Chief Integrated Solutions Officer | ||
Abigail Fleming | 42 | Chief Accounting Officer | ||
Shellye Archambeau | 61 | Director Nominee(1) | ||
John Carrafiell | 59 | Director Nominee(1) | ||
Joy Falotico | 56 | Director Nominee(1) | ||
Luke Taylor | 46 | Director Nominee(1) | ||
Michael Turner | 51 | Director Nominee(1) | ||
Lynn Wentworth | 65 | Director Nominee(1)(2) | ||
James Wyper | 34 | Director Nominee(1) |
(1) | These individuals have agreed to become members of our board of directors in connection with this offering. It is expected that each director nominee will become a director immediately upon completion of this offering. |
(2) | Our board of directors intends to appoint Ms. Wentworth as the lead independent director upon completion of this offering. |
Biographical Summaries of Director Nominees and Executive Officers
Director Nominees
Shellye Archambeau. Shellye Archambeau has served on the board of directors of Lineage Holdings since April 2024. From December 2002 until December 2017, Ms. Archambeau was Chief Executive Officer of MetricStream, Inc., a leading provider of governance, risk, compliance and quality management solutions. Prior to that, Ms. Archambeau served as Chief Marketing Officer and Executive Vice President of Sales for Loudcloud, Inc., Chief Marketing Officer of NorthPoint Communications Group, Inc., and President of Blockbuster Inc.’s e-commerce division. Before joining Blockbuster, she held domestic and international executive positions at IBM. Ms. Archambeau has served on the boards of directors of Verizon Communications Inc. (NYSE: VZ) since November 2013, Roper Technologies, Inc. (NASDAQ: ROP) since April 2018 and Okta, Inc. (NASDAQ: OKTA) since December 2018. Ms. Archambeau previously served on the boards of directors of Nordstrom, Inc. (NYSE: JWN) from February 2015 to May 2022 and Arbitron Inc. from 2005 to 2013. Ms. Archambeau holds a Bachelor of Science from the Wharton School of the University of Pennsylvania.
232
Table of Contents
We believe that Ms. Archambeau is qualified to serve as a member of our board of directors because of her experience as a company executive, her valuable knowledge of technology, digital media and communications platforms and her experience serving on other boards.
John Carrafiell. John Carrafiell has been a member of the board of directors of Lineage Holdings since March 2021. Mr. Carrafiell has served as the co-Chief Executive Officer of BentallGreenOak (“BGO”), a global real estate investment and private equity investment management firm, since July 2021. Mr. Carrafiell was a co-Founder of GreenOak Real Estate in May 2010 prior to its 2019 merger with Bentall Kennedy (owned by Sun Life Financial Inc.). He also serves as the chairman of the board of IREIT by BGO, a logistics and industrial REIT launched in July 2023.
Mr. Carrafiell has been a member of the board of directors and audit committee of publicly-traded Klepierre, one of Europe’s largest REITs, since January 2015 and has served as the chairman of the audit committee since July 2018. He has served on the board of European data center company Bulk Infrastructure since December 2020, as a member then observer. Mr. Carrafiell has previously served as a member of the board and the chairman of both the audit committee and the operating committee of Canary Wharf and served as from June 2004 to March 2009 and as a member of the board of Shurgard, a leading European self-storage company, from October 2018 to February 2020.
Mr. Carrafiell is a former Executive Member of the Board of the European Public Real Estate Association. Mr. Carrafiell was previously a member of the Supervisory Boards of publicly-traded Corio (Holland) and Deutsche Immobilien Chancen Group (Germany). Mr. Carrafiell joined Morgan Stanley in 1987 and was based in Europe from September 1989 to December 2009, as Head of European Real Estate from January 1995, and Global Head of Real Estate and a member of the investment bank’s six person global operating management committee from December 2005 to March 2007. Mr. Carrafiell holds a B.A in philosophy from Yale.
We believe that Mr. Carrafiell is qualified to serve on our board of directors because of his extensive real estate, investment and public company experience.
Joy Falotico. Joy Falotico has served on the board of directors of Lineage Holdings since December 2022. Ms. Falotico was formerly the President of Lincoln Motor at Ford Motor Company from March 2018 to November 2022 and also served as Ford Motor Company’s Chief Marketing Officer from March 2018 until January 2021. Prior to that, Ms. Falotico served as Ford Motor Credit Company’s Chief Executive Officer from October 2016 to February 2018 and Chief Operating Officer prior to that period. She has served in a number of leadership roles at Ford Motor Company and Ford Motor Credit Company since 1989. Ms. Falotico serves on the board of Alliant Energy Corp (Nasdaq: LNT), where she is the chair of the audit committee and a member of the executive committee and the operations committee. She previously served on the board and executive committee of American Financial Services Association and the board and audit committee of Ford Motor Credit Company and as the chair of the board of FCE Bank, plc. Ms. Falotico holds a Bachelor of Science, Business Administration from Truman State University and a M.B.A. from DePaul University.
We believe that Ms. Falotico is qualified to serve on our board of directors because of her extensive management, regulatory, board and leadership experience.
Luke Taylor. Luke Taylor has served on the board of directors of Lineage Holdings since May 2018. Mr. Taylor serves as Co-President of Stonepeak, a global infrastructure and real assets investment management firm, where he has served in various roles, including Co-Chief Operating Officer and Senior Managing Director, since 2011. Mr. Taylor is a member of the Stonepeak Executive Committee and a member of all of Stonepeak’s investment committees. In these roles, Mr. Taylor shares broad responsibilities across investing and oversight of the firm’s day-to-day business. Mr. Taylor has been investing across the infrastructure space for over 20 years has served on the board of Stonepeak Infrastructure Logistics Platform since March 2021 and is a former director of Evolve Transition Infrastructure LP (NTSEAM: SNMP), Paradigm Energy Partners, Hygo Energy Transition Ltd.,
233
Table of Contents
Ironclad Energy Partners, LLC, TRAC Intermodal, Casper Crude to Rail Holdings LLC and Tidewater Holdings. Prior to joining Stonepeak, Mr. Taylor was a Senior Vice President with Macquarie Capital. Mr. Taylor has a Bachelor of Commerce and a Master of Business (Distinction) from the University of Otago (New Zealand).
We believe that Mr. Taylor is qualified to serve on our board of directors because of his extensive experience as an infrastructure and real assets investment professional, including his experience in finance and mergers and acquisitions.
Michael Turner. Michael Turner has served on the board of directors of Lineage Holdings since September 2020. Mr. Turner was formerly President of Oxford Properties Group and was the chair of Oxford’s investment committee and executive committee from April 2018 to April 2023, during which time he also served as Global Head of Real Estate for OMERS (Oxford’s shareholder) where he was a member of their management investment committee and transaction approval committee. Previously, Mr. Turner held the positions of Executive Vice President and Senior Vice President at Oxford Properties Group from June of 2010 to April 2018. Prior to joining Oxford, Mr. Turner was Executive Vice President at CBRE Group, Inc. (NYSE:CBRE), a leading global real estate investment services provider. He has also served as a board member for several investment and asset management companies, including M7 Real Estate (UK), Honest Buildings (sold to NYSE: PCOR) and R-Labs. Mr. Turner holds a Bachelor of Arts from the University of British Columbia, a Master of Planning from Queen’s University and a Master of Finance from the University of Toronto, and is a Chartered Financial Analyst (CFA).
We believe that Mr. Turner is qualified to serve on our board of directors because of his extensive real estate investment, financial reporting and management and board experience.
Lynn Wentworth. Lynn Wentworth has served on the board of directors of Lineage Holdings since June 2022. Additionally, Ms. Wentworth has served on the board of directors of Graphic Packaging Holding Company (NYSE: GPK) since November 2009, where she chairs the compensation and management development committee and is a member of the nominating and corporate governance committee, and Benchmark Electronics, Inc. (NYSE: BHE) since June 2021, where she chairs the audit committee. Ms. Wentworth was a director and chair of the audit committee for CyrusOne, Inc. from 2014 until its acquisition by a consortium led by KKR and Global Infrastructure Partners in March 2022 and had served as chair of the board of directors since May 2021. She was also a director and chair of the audit committee of Cincinnati Bell, Inc. from 2008 until its acquisition by Macquarie Asset Management in September 2021 and had served as chair of the board of directors since May 2019. She served as the Senior Vice President, Chief Financial Officer and Treasurer of BlueLinx Holdings Inc. (NYSE: BXC) until her retirement in 2008. Prior to joining BlueLinx in 2007, Ms. Wentworth was with BellSouth Corporation from 1985 to 2007, where she served as Vice President and Chief Financial Officer for the Communications Group from 2004 to 2007 and Vice President Treasurer from 2003 to 2004. Ms. Wentworth holds a Bachelor of Science in Business Administration from Babson College, a Master’s degree in taxation from Bentley College and a M.B.A. from Georgia State University.
We believe that Ms. Wentworth is qualified to serve on our board of directors and as our lead independent director because of her public accounting and corporate finance experience, including her service as Chief Financial Officer of a public company, as well as her extensive board and corporate governance experience.
James Wyper. James Wyper has served on the board of directors of Lineage Holdings since May 2018. Mr. Wyper serves as Senior Managing Director, Global Head of Transportation and Logistics at Stonepeak, where he has served in various roles since 2013. Mr. Wyper also serves on various Stonepeak investment committees. Mr. Wyper has also served on the board of directors of Textainer Holdings since March 2024, Logistec Corporation since January 2024, TRAC Intermodal since March 2020, Seapeak since January 2022, Akumin, Inc. since November 2021, Venture Global Calcasieu Pass since August 2019, Tidewater Holdings since 2015, Intrado Life and Safety since January 2023, Emergent Cold LatAm Holdings LLC since August 2021, and previously on a number of other Stonepeak portfolio companies. He also serves on the board of directors of Streetsquash. He holds a B.A. in Economics from Yale University.
234
Table of Contents
We believe that Mr. Wyper is qualified to serve on our board of directors because of his extensive experience as an infrastructure investment professional, including his experience in finance and mergers and acquisitions.
Executive Officers
Adam Forste. Adam Forste is a Co-Founder of our company and has served as our Co-Executive Chairman since our formation. Mr. Forste is also a co-founder of Bay Grove, our company’s original owner-operator, and has served as a Managing Partner of Bay Grove since 2007. Prior to co-founding Bay Grove, Mr. Forste worked at KKR. Mr. Forste began his career with Morgan Stanley in its investment banking group, both in New York and San Francisco. He serves on the board of directors of the Global Cold Chain Foundation, Emergent Cold LatAm Holdings LLC, Turvo Inc. and ndustrial.io. Mr. Forste is also a Fulbright Fellow and a graduate of Dartmouth College.
We believe that, as a Co-Founder, Mr. Forste’s prior management and board experience, as well has his experience as an investment professional qualifies him to serve on our board of directors.
Kevin Marchetti. Kevin Marchetti is a Co-Founder of our company and has served as our Co-Executive Chairman since our formation. Mr. Marchetti is also a co-founder of Bay Grove, our company’s original owner-operator, and has served as Managing Partner of Bay Grove since 2007. Prior to co-founding Bay Grove, Mr. Marchetti worked at The Yucaipa Companies. Mr. Marchetti began his career with Morgan Stanley in its investment banking group in San Francisco. He currently serves as a Trustee for the San Francisco Museum of Modern Art and previously served on the board of directors of the Pittsburgh Penguins, The San Francisco Zoological Society and The International Association of Refrigerated Warehouses. Mr. Marchetti is a graduate of Duke University.
We believe that, as a Co-Founder, Mr. Marchetti’s prior management and board experience, as well has his experience as an investment professional qualifies him to serve on our board of directors.
Greg Lehmkuhl. Greg Lehmkuhl has served as our President and Chief Executive Officer since June 2015. Prior to joining Lineage, he served in various executive appointments for Con-Way, Inc. (NYSE: CNW) from 2001 to 2011, including President and Corporate Executive Vice President and held management positions at Menlo Logistics, Delphi Automotive and Penske Logistics. Mr. Lehmkuhl has also served on the board of directors of Agree Realty Corp. (NYSE: ADC) since July 2018. Mr. Lehmkuhl received his Bachelor of Material and Logistics Management from Michigan State University and a M.B.A. from Oakland University.
We believe that Mr. Lehmkuhl’s experience as a director and company executive, including his experience in real estate, corporate governance and business management, qualifies him to serve on our board of directors.
Robert Crisci. Robert Crisci has served as our Chief Financial Officer since April 2023. Prior to joining Lineage, Mr. Crisci served in various financial and executive leadership positions at Roper Technologies (NYSE: ROP) from April 2013 to February 2023, in which he helped lead the growth of the company’s market capitalization from $12 billion to over $45 billion. He served as Roper’s Chief Financial Officer from May 2017 to February 2023. Mr. Crisci worked at VRA Partners, a boutique investment bank, from 2012 to April 2013 and Morgan Keegan & Co. Inc., which was subsequently acquired by Raymond James Financial Inc., from 2010 to 2012, where he advised on capital raising and merger and acquisitions transactions. He also served as vice president at Devon Value Advisers from 2004 to 2009 where he worked on various engagements including buy and sell side transaction advisory, recapitalizations, and strategic acquisitions. Prior to working at Devon Value Advisors, Mr. Crisci worked as a consultant at Deloitte & Touche LLP. Mr. Crisci currently serves on the board of directors of MasterBrand Cabinets, Inc. He received his A.B. in Economics from Princeton University and an M.B.A. from Columbia Business School.
Jeffrey Rivera. Jeffrey Rivera has served as our Global Chief Operations Officer since August 2016. Prior to that, he served as Senior Vice President of Operations since July 2015. Prior to joining Lineage, he served in various leadership positions at Con-Way Freight, Inc. Menlo Logistics and General Motors (NYSE: GM). Mr.
235
Table of Contents
Rivera currently serves as the board vice president of the Coalition of Temporary Shelters Detroit and serves on the board of Kem Krest. Mr. Rivera received a B.S. in Mechanical Engineering from Michigan Technical University and a M.S. in Manufacturing Systems from Stanford University.
Sudarsan Thattai. Sudarsan Thattai has served as our Chief Information Officer and Chief Transformation Officer since February 2013. Prior to joining Lineage, he served as Senior Vice President of IT Services at UTi Worldwide Inc. and has held technology leadership positions at Cisco Systems and DFS Group. Mr. Thattai received a B.Sc in Computer Science and a M.Sc in Management Information Technology from University of Sunderland.
Sean Vanderelzen. Sean Vanderelzen has served as our Chief Human Resources Officer since March 2016. Prior to that, he served as our Vice President Human Resources. Prior to joining Lineage, he held a variety of leadership positions at General Motors. Mr. Vanderelzen currently serves on the board and as a member of the compensation committee of the Global Cold Chain Alliance and serves on the board and as a the chair of the private company committee of the HR Policy Association. Mr. Vanderelzen received a bachelor’s degree in Management and Human Relations from Trevecca Nazarene University.
Natalie Matsler. Natalie Matsler has served as our Chief Legal Officer and Corporate Secretary since May 2022. Ms. Matsler rejoined Lineage from McCourt Partners, a private investment platform, where she was a member of the executive team from April 2021 to May 2022 and successfully led several projects in real estate development featuring green technology and resilient design. Ms. Matsler originally joined Lineage in 2014, serving in several legal leadership roles, including Senior Vice President and Deputy General Counsel, through April 2021. Ms. Matsler began her legal career at Latham & Watkins LLP and continued on to Downey Savings and Loan Association and U.S. Bank. Ms. Matsler holds a bachelor’s degree from the University of California at Los Angeles and her J.D. from the University of California at Los Angeles School of Law.
Timothy Smith. Timothy Smith has served as our Chief Commercial Officer since February 2022. Prior to that, he served as our Executive Vice President of Sales and Business Development since January 2011. Prior to joining Lineage, he served in various management positions at Millard Refrigerated Services, CHEP and The Hershey Company. Mr. Smith received a bachelor’s degree from St. Lawrence University and an M.B.A. from Stetson University.
Brian McGowan. Brian McGowan has served as our Chief Network Optimization Officer since May 2022. Previously, he served as our President Eastern US Operations and Executive Vice President, Continuous Improvement since September 2019 and our Senior Vice President of Lean since July 2015. Prior to joining Lineage, Mr. McGowan served as Vice President of Lean for Con-Way Freight and held leadership positions at Menlo Worldwide and the Ford Motor Company. He holds a bachelor’s degree and an M.B.A. from Wayne State University.
Gregory Bryan. Gregory Bryan has served as our Chief Integrated Solutions Officer since June 2023. Prior to that, he served as our President of Global Logistics since November 2022 and our Executive Vice President of Logistics since January 2016. Prior to joining Lineage, Mr. Bryan served as Senior Vice President of Operations for C&S Wholesale Grocers and held transportation leadership positions at Americold Logistics and Ryder Integrated Solutions. He holds a bachelor’s degree and a Master of Business Administration from Pennsylvania State University.
Abigail Fleming. Abigail Fleming has served as our Chief Accounting Officer and Senior Vice President since January 2024. Prior to joining Lineage, Ms. Fleming served as Vice President and Chief Accounting Officer for Visteon Corporation, a global automotive supplier, from August 2020 to January 2024. She also served as Executive Director and Assistant Controller of Tenneco Inc. (formerly Federal-Mogul, LLC) from March 2017 to August 2020, and Director, Capital Markets and Accounting Advisory Services at PricewaterhouseCoopers LLP from March 2015 to March 2017. Ms. Fleming began her career at PricewaterhouseCoopers LLP in August 2004 and is a certified public accountant. She holds a bachelor’s degree from Albion College and a M.S. in accounting from Western Michigan University.
236
Table of Contents
Family Relationships
There are no family relationships among any of our directors or executive officers.
Corporate Governance Profile
We have structured our corporate governance in a manner we believe closely aligns our interests with those of our stockholders. Notable features of our corporate governance structure include the following:
• | our board of directors will not be classified and each of our directors will be subject to election annually, and our charter will provide that we may not elect to be subject to the provision of the MGCL that would permit us to classify our Board, unless we receive prior approval from stockholders; |
• | we will have a lead independent director; |
• | a majority of our board of directors will consist of independent directors; |
• | we will have a fully independent audit committee and independent director representation on our compensation and nominating and corporate governance committees immediately at the time of the offering, and our independent directors will meet regularly in executive sessions without the presence of our corporate officers or non-independent directors; |
• | at least one of our directors will qualify as an “audit committee financial expert” by applicable SEC regulations and all members of the audit committee are financially literate in accordance with Nasdaq listing standards; |
• | we have opted out of the business combination and control share acquisition statutes in the MGCL; |
• | we will not have a stockholder rights plan, and we will not adopt a stockholder rights plan in the future without (i) the approval of our stockholders or (ii) seeking ratification from our stockholders within 12 months of adoption of the plan if our board of directors determines, in the exercise of its duties under applicable law, that it is in our best interest to adopt a rights plan without the delay of seeking prior stockholder approval; |
• | we will have adopted a stock ownership policy that requires each non-employee director, the chief executive officer and each other named executive officer to own a certain amount of specified equity interests in our company; and |
• | our bylaws will provide that our stockholders may alter or repeal any provision of our bylaws and adopt new bylaws if any such alteration, repeal or adoption is approved by the affirmative vote of a majority of the votes entitled to be cast on the matter. |
Our directors will stay informed about our business by attending meetings of our board of directors and the committees on which they serve and through supplemental reports and communications.
Composition of the Board of Directors after this Offering
Upon completion of this offering, our charter and bylaws will provide that our board of directors will consist of such number of directors as may from time to time be fixed by our board of directors, but may not be more than 15 or fewer than the minimum number permitted by Maryland law, which is one. So long as BGLH, Stonepeak, BentallGreenOak, Mr. Forste and Mr. Marchetti, in each case, together with their respective affiliates, continue to beneficially own a certain percentage of the total outstanding equity interests in our company, we will agree to nominate for election as our directors individuals designated by the applicable investor as specified in our stockholders agreement. Each director will serve until our next annual meeting of stockholders and until his or her successor is duly elected and qualifies or until the director’s earlier death, resignation or removal. For a description of our board of directors and each of BGLH’s, Stonepeak’s, BentallGreenOak’s, Mr. Forste’s and Mr. Marchetti’s right to require us to nominate its designees, see “Certain Relationships and Related Party Transactions—Stockholders Agreement.”
237
Table of Contents
Controlled Company Exception
After the completion of this offering, affiliates of Bay Grove will continue to beneficially own shares representing more than 50% of the voting power of shares of our common stock eligible to vote in the election of directors. As a result, we will be a “controlled company” within the meaning of the Nasdaq corporate governance standards and may elect not to comply with certain corporate governance standards, including that: (1) a majority of our board of directors consist of independent directors, (2) our board of directors have a compensation committee that is comprised entirely of independent directors with a written charter addressing the committee’s purpose and responsibilities and (3) our board of directors have a nominating and corporate governance committee that is comprised entirely of independent directors with a written charter addressing the committee’s purpose and responsibilities. Although upon completion of this offering a majority of our board of directors will consist of independent directors, our compensation and nominating and corporate governance committees will not be composed entirely of independent directors, and we may utilize any of these exemptions until the time we cease to be a “controlled company.” Accordingly, to the extent and for so long as we utilize these exemptions, you will not have the same protections afforded to stockholders of companies that are subject to all of these corporate governance requirements. In the event that we cease to be a “controlled company” and shares of our common stock continue to be listed on Nasdaq, we will be required to comply with these provisions within the applicable transition periods.
Director Independence
We expect our board of directors to determine that each of Mses. Archambeau, Falotico and Wentworth and Messrs. Carrafiell, Taylor, Turner and Wyper is an “independent director” as such term is defined by the applicable rules and regulations of Nasdaq.
Board Committees
Upon the completion of this offering, our board of directors will have four standing committees: an audit committee, a compensation committee, an equity award committee and a nominating and corporate governance committee. The principal functions of each committee are briefly described below. Additionally, our board of directors may from time to time establish other committees to facilitate the board’s oversight of management of the business and affairs of our company. The charter of each committee will be available on our website at www.onelineage.com upon the completion of this offering. Our website is not part of this prospectus.
Audit Committee
In connection with this offering, our board of directors will adopt an audit committee charter, which will define the audit committee’s principal functions, including oversight related to:
• | our accounting and financial reporting processes; |
• | the integrity of our consolidated financial statements and financial reporting process; |
• | our systems of disclosure controls and procedures and internal control over financial reporting; |
• | our compliance with financial, legal and regulatory requirements; |
• | reviewing and approving or ratifying related person transactions; |
• | the performance of our internal audit functions; and |
• | our overall risk exposure and management and overseeing the management of our financial risks and information technology risks, including cybersecurity and data privacy risks. |
The audit committee will also be responsible for engaging, evaluating, compensating, and overseeing an independent registered public accounting firm, reviewing with the independent registered public accounting firm
238
Table of Contents
the plans for and results of the audit engagement, approving services that may be provided by the independent registered public accounting firm, including audit and non-audit services, reviewing the independence of the independent registered public accounting firm, considering the range of audit and non-audit fees and reviewing the adequacy of our internal accounting controls. The audit committee also will prepare the audit committee report required by SEC regulations to be included in our annual report.
Upon the completion of this offering, our audit committee will be composed of Mses. Falotico and Wentworth and Mr. Turner. Ms. Falotico will serve as chair of our audit committee. Our board of directors is expected to determine affirmatively that (i) Ms. Falotico qualifies as an “audit committee financial expert” as such term has been defined by the SEC in Item 407(d)(5) of Regulation S-K, (ii) each member of our audit committee is “financially literate” as that term is defined by Nasdaq listing standards and (iii) each member of the audit committee meets the definition for “independence” for the purposes of serving on our audit committee under Nasdaq listing standards and Rule 10A-3 under the Exchange Act.
Compensation Committee
In connection with this offering, our board of directors will adopt a compensation committee charter, which will define the compensation committee’s principal functions to include:
• | reviewing and approving, or recommending for approval by the board of directors, the compensation of our Chief Executive Officer and our other executive officers; |
• | making recommendations to the board of directors with respect to director compensation; |
• | reviewing and approving, or recommending for approval by the board of directors, our incentive compensation and equity-based plans and arrangements; provided that if the compensation committee is not comprised of at least two directors who are “non-employee directors” under Rule 16b-3 of the Exchange Act, grants of equity-based awards to individuals who are subject to the reporting requirements of Section 16 of the Exchange Act must be approved and administered by either the board of directors or the equity award committee; |
• | reviewing and discussing with management our compensation discussion and analysis required by SEC regulations and recommending to the board of directors that such compensation discussion and analysis be included in our annual report; |
• | administering our clawback policy; provided that if the compensation committee is not comprised of at least two directors who are “non-employee directors” under Rule 16b-3 of the Exchange Act, any proposed recovery of equity compensation from individuals who are subject to the reporting requirements of Section 16 of the Exchange Act must be approved by either the board of directors or the equity award committee; |
• | overseeing executive officer succession planning; and |
• | preparing the compensation committee report to be included in our annual report. |
The compensation committee shall have the authority, in its sole discretion, to retain or obtain the advice of a compensation consultant, legal counsel or other adviser as it deems appropriate. The committee may form and delegate authority to subcommittees consisting of one or more members when it deems appropriate. Upon the completion of this offering, our compensation committee will be composed of Messrs. Forste, Carrafiell and Wyper and Ms. Wentworth. Mr. Forste will serve as chair of our compensation committee. Our board of directors is expected to determine affirmatively that Messrs. Carrafiell and Wyper and Ms. Wentworth meet the definition for “independence” for the purpose of serving on our compensation committee under applicable rules of Nasdaq and Ms. Wentworth meets the definition of a “non-employee director” for the purpose of serving on our compensation committee under Rule 16b-3 of the Exchange Act.
239
Table of Contents
Equity Award Committee
In connection with this offering, our board of directors will adopt an equity award committee charter, which will define the equity award committee’s principal functions to include:
• | approving, upon recommendation from the compensation committee, and administering grants of equity-based awards to individuals subject to the provisions of Section 16 of the Exchange Act; |
• | reviewing and approving redemptions of our equity securities held by individuals and entities subject to the provisions of Section 16 of the Exchange Act; |
• | reviewing and approving repurchases of our and our subsidiaries’ equity securities from, and issuances of our and our subsidiaries’ equity securities to, individuals and entities subject to the provisions of Section 16 of the Exchange Act; and |
• | reviewing and approving any proposed recovery of equity compensation pursuant to our clawback policy from any individual subject to the provisions of Section 16 of the Exchange Act. |
The equity award committee shall have the authority, in its sole discretion, to retain or obtain the advice of a compensation consultant, legal counsel or other adviser as it deems appropriate. Upon the completion of this offering, our equity award committee will be composed of Mr. Turner and Ms. Wentworth. Ms. Wentworth will serve as chair of our equity award committee. Our board of directors is expected to determine affirmatively that each member of the equity award committee meets the definition for “independence” for the purpose of serving on a compensation committee under applicable rules of Nasdaq and meets the definition of a “non-employee director” under Rule 16b-3 of the Exchange Act.
Nominating and Corporate Governance Committee
In connection with this offering, our board of directors will adopt a nominating and corporate governance committee charter, which will define the nominating and corporate governance committee’s principal functions, to include:
• | identifying individuals qualified to become members of our board of directors consistent with the stockholders agreement and criteria approved by our board of directors; |
• | ensuring that our board of directors has the requisite expertise and its membership consists of persons with sufficiently diverse and independent backgrounds; |
• | reviewing the committee structure of the board of directors and recommending directors to serve as members of each committee of the board of directors; |
• | periodically reviewing our board of directors’ leadership structure and recommending any proposed changes to our board of directors; |
• | developing and recommending to the board of directors a set of corporate governance guidelines applicable to us and, from time to time as it deems appropriate, reviewing such guidelines and recommending changes to the board of directors for approval as necessary; and |
• | overseeing the self-evaluations of the board of directors. |
Upon the completion of this offering, we will establish a nominating and corporate governance committee comprised of Messrs. Forste and Marchetti and Ms. Archambeau. Mr. Marchetti will serve as chair of our nominating and corporate governance committee. Our board of directors is expected to determine affirmatively that Ms. Archambeau meets the definition of independence under Nasdaq listing standards.
Compensation Committee Interlocks and Insider Participation
None of our executive officers serves, or in the past has served, as a member of the board of directors or compensation committee, or other committee serving an equivalent function, of any entity that has one or more
240
Table of Contents
executive officers who serve as members of our board of directors or our compensation committee. Mr. Forste, a member of our compensation committee, is our Co-Executive Chairman.
Employment Agreements
We have entered into employment arrangements with our Chief Executive Officer and certain of our other executive officers. For a description of the terms of these employment agreements, see “Executive Compensation—2023 Executive Compensation—Narrative to Summary Compensation Table and Grants of Plan-Based Awards Table—Named Executive Officer Employment Agreements.”
Director Compensation
2023 Director Compensation
None of the members of the board of directors of Lineage, Inc. received compensation for their service on our board of directors in 2023. Certain members of the board of directors of Lineage Holdings received an award of BGLH Restricted Units as compensation for the director’s Lineage Holdings board service. Each such award vests on the first anniversary of the grant date, subject to the director’s continued service through the vesting date. Certain members of the board of directors of Lineage Holdings also received a quarterly cash retainer fee equal to $25,000 per quarter, and were eligible to receive the following additional quarterly cash fees:
• | Audit Committee Chair: $6,250 |
• | Audit Committee Non-Chair Member: $3,750 |
• | Compensation Committee Non-Chair Member: $2,500 |
The total compensation earned in 2023 by directors of Lineage Holdings in 2023 who are expected to serve as members of our board of directors upon the completion of this offering is shown in the table below. None of the other members of the board of directors of Lineage Holdings received any compensation in 2023 for their service as a director of Lineage Holdings.
Name | Fees Earned or Paid in Cash ($) | Stock Awards ($)(1) | All Other Compensation ($) | Total ($) | ||||||||||||
Joy Falotico | 86,250 | 150,000 | — | 236,250 | ||||||||||||
Lynn Wentworth | 101,250 | 150,000 | — | 251,250 |
(1) | Amounts reflect the full grant-date fair value of awards of BGLH Restricted Units granted during 2023 computed in accordance with ASC Topic 718. The value of BGLH Restricted Units is based on the equity value of BGLH derived from an independent third-party valuation of Lineage Holdings as of December 31, 2022. |
(2) | As of December 31, 2023, directors of Lineage Holdings held the aggregate numbers of unvested BGLH Restricted Units set forth in the table below. |
Name | BGLH Restricted Units (#) | |||
Joy Falotico | 1,554 | |||
Lynn Wentworth | 1,667 |
Messrs. Forste and Marchetti, each of whom served on the board of directors of Lineage, Inc., received distributions from Bay Grove, BGLH and/or their respective affiliates and/or our affiliates in respect of their direct and indirect ownership interests in such entities and in respect of the services agreement. See “Certain Relationships and Related Party Transactions.” Such amounts are distributions in respect of Messrs. Forste’s and Marchetti’s equity ownership interests in such entities and are not considered compensation paid by us. Neither Mr. Forste nor Mr. Marchetti received any compensation for their service as a director of Lineage, Inc. in 2023.
241
Table of Contents
Post-IPO Non-Employee Director Compensation Program
In connection with this offering, we intend to approve and implement a compensation program (the “Director Compensation Program”) for our non-employee directors (other than directors designated by Stonepeak or BentallGreenOak) (each, an “Eligible Director”) that consists of annual cash retainer fees and a long-term equity awards. An “Eligible Director” shall not include any executive director or Executive Chairman. The material terms of the Director Compensation Program are summarized below.
The Director Compensation Program consists of the following components for Eligible Directors:
Cash Compensation
• | Annual Retainer: $120,000 |
• | Annual Committee Chair Retainers: |
• | Audit Committee: $30,000 |
• | Compensation Committee: $25,000 |
• | Corporate Governance/Nominating Committee: $20,000 |
• | Investment Committee: $25,000 |
• | Other Committees: $25,000 |
• | Annual Non-Chair Committee Member Retainers: |
• | Audit Committee: $15,000 |
• | Compensation Committee: $15,000 |
• | Corporate Governance/Nominating Committee: $10,000 |
• | Investment Committee: $10,000 |
• | Other Committees: $10,000 |
Annual cash retainers will be paid in quarterly installments in advance and will be pro-rated for any partial calendar quarter of service. In addition, under the Director Compensation Program, we will reimburse all of our directors for any out-of-pocket business expenses incurred by them in connection with their board service, up to $30,000 annually.
Equity Compensation
• | Initial Award: Each Eligible Director who is initially elected or appointed to serve on the Board following completion of this offering will be granted an award of RSUs at the time of the election or appointment with a value of approximately $200,000. Each Initial Grant will vest in full on the earlier to occur of (i) the one-year anniversary of the applicable grant date and (ii) the date of the next annual meeting following the grant date, subject to the director’s continued service through the applicable vesting date. Initial grants to Eligible Directors who are elected or appointed other than at an annual meeting of our stockholders will be pro-rated. |
• | Annual Award: Each Eligible Director who is serving on the Board as of the date of each annual meeting of the company’s stockholders beginning in 2025 will be granted, on such annual meeting date, an award of RSUs with a value of approximately $200,000, which will vest in full on the earlier to occur of (i) the one-year anniversary of the applicable grant date and (ii) the date of the next annual meeting following the grant date, subject to the director’s continued service through the applicable vesting date. |
242
Table of Contents
Compensation under the Director Compensation Program is subject to the annual limits on non-employee director compensation set forth in the 2024 Plan, as described below.
Director IPO Awards
We intend to grant an aggregate of 8,226 RSU awards under the 2024 Plan to certain of our Eligible Directors, which will become effective in connection with the completion of this offering. These awards will vest in full on April 1, 2025, subject to the director’s continued service through the vesting date.
Code of Conduct
Our board of directors has adopted a code of conduct that applies to our directors, officers and employees. Among other matters, our code of conduct is designed to deter wrongdoing and to promote:
• | honest and ethical conduct, including the ethical handling of actual or apparent conflicts of interest between personal and professional relationships; |
• | full, fair, accurate, timely and understandable disclosure in our SEC reports and other public communications; |
• | compliance with applicable governmental laws, rules and regulations; |
• | prompt internal reporting of violations of the code to appropriate persons identified in the code; |
• | accountability for adherence to the code of conduct; |
• | the protection of the company’s legitimate business interests, including its assets and corporate opportunities; and |
• | confidentiality of information entrusted to directors, officers and employees by our company and our customers. |
Any waiver of the code of conduct for our directors or executive officers must be approved by a majority of our independent directors, and any such waiver shall be promptly disclosed as required by law and Nasdaq regulations.
Indemnification
We intend to enter into indemnification agreements with each of our directors and executive officers that will obligate us to indemnify them to the maximum extent permitted by Maryland law as discussed under “Certain Provisions of Maryland Law and of Our Charter and Bylaws—Limitation of Liability and Indemnification of Directors and Officers.” The indemnification agreements will provide that, if a director or executive officer is a party to, or witness in, or is threatened to be made a party to, or witness in, any proceeding by reason of his or her service as a director, officer, employee or agent of our company or any individual who, while a director or officer of our company and at our request, serves or has served as a director, officer, trustee, member, manager or partner of another corporation, real estate investment trust, partnership, limited liability company, joint venture, trust, employee benefit plan or any other enterprise and who is made or threatened to be made a party to, or witness in, the proceeding by reason of such person’s service in that capacity, we must indemnify the director or executive officer for all expenses and liabilities actually and reasonably incurred by him or her, or on his or her behalf, to the maximum extent permitted under Maryland law, including in any proceeding brought by the director or executive officer to enforce his or her rights under the indemnification agreement, to the extent provided by the agreement. The indemnification agreements will also require us to advance reasonable expenses incurred by the indemnitee within ten days of the receipt by us of a statement from the indemnitee requesting the advance, provided the statement evidences the expenses and is accompanied or preceded by:
• | a written affirmation of the indemnitee’s good faith belief that he or she has met the standard of conduct necessary for indemnification; and |
243
Table of Contents
• | a written undertaking by the indemnitee or on his or her behalf to repay the amount paid if it shall ultimately be established that the standard of conduct has not been met. |
The indemnification agreements will also provide for procedures for the determination of entitlement to indemnification, including requiring such determination be made by independent counsel after a change of control of us.
Our charter obligates us, to the maximum extent permitted by Maryland law, to indemnify and to pay or reimburse reasonable expenses in advance of final disposition of a proceeding to (i) any present or former director or officer who is made or threatened to be made a party to, or witness in, a proceeding by reason of his or her service in that capacity or (ii) any individual who, while a director or officer of our company and at our request, serves or has served as a director, officer, partner, trustee, member or manager of another corporation, real estate investment trust, limited liability company, partnership, joint venture, trust, employee benefit plan or any other enterprise and who is made or threatened to be made a party to, or witness in, the proceeding by reason of his or her service in that capacity, as discussed under “Certain Provisions of Maryland Law and of Our Charter and Bylaws—Limitation of Liability and Indemnification of Directors and Officers.” Our charter will also permit us, with the approval of our board of directors, to indemnify and advance expenses to any person who served a predecessor of ours in any of the capacities described above and to any employee or agent of our company or a predecessor of our company.
In addition, our directors and officers may be entitled to indemnification pursuant to the terms of the partnership agreement of our operating partnership.
Insofar as indemnification for liabilities arising under the Securities Act may be permitted to directors, officers or persons controlling our company pursuant to the foregoing provisions, we have been informed that in the opinion of the SEC such indemnification is against public policy as expressed in the Securities Act and is therefore unenforceable.
244
Table of Contents
Compensation Discussion and Analysis
General
In this Compensation Discussion and Analysis, we provide an overview and analysis of the compensation awarded to or earned by our named executive officers identified in the Summary Compensation Table below (each, an “NEO”) during 2023, including the elements of our compensation program for NEOs, material compensation decisions made under that program for 2023 and the material factors considered in making those decisions. Our NEOs for the year ended December 31, 2023 are:
• | Greg Lehmkuhl, President and Chief Executive Officer; |
• | Rob Crisci, Chief Financial Officer; |
• | Jeffrey Rivera, Global Chief Operations Officer; |
• | Sudarsan Thattai, Chief Information Officer and Chief Transformation Officer; and |
• | Sean Vanderelzen, Chief Human Resources Officer. |
Mr. Crisci joined our company as its Chief Financial Officer effective April 19, 2023.
Compensation Governance and Best Practices
We are committed to having strong governance standards with respect to our compensation programs, procedures and practices. Our key compensation practices that were either in place during 2023 or that we expect to adopt in connection with this offering, include the following:
What We Do | What We Do Not Do | |||||||
✓ | Emphasize performance-based, at risk compensation. | X | Do not grant uncapped cash incentives. | |||||
✓ | Emphasize the use of equity compensation to promote executive retention and reward long-term value creation. | X | Do not provide single-trigger payments or benefits upon a change in control. | |||||
✓ | Weight the overall pay mix towards incentive compensation for senior executives. | X | Do not guarantee annual salary or target bonus increases. | |||||
✓ | Engage an independent compensation consultant to advise our compensation committee. | X | Do not maintain defined benefit pension plans or supplemental executive retirement plans. | |||||
✓ | Maintain stock ownership guidelines. | |||||||
✓ | Maintain a clawback policy for recovery of erroneously awarded compensation. |
Stockholder Advisory Vote on Executive Compensation
At our first annual meeting of stockholders following the completion of this offering, we expect to ask our stockholders to vote in a non-binding, advisory vote to approve the compensation of our NEOs (the “Say-on-Pay Vote”). Our compensation committee will review the result of this vote, and, depending on the outcome, will consider any necessary changes to our executive compensation program as a result of the vote. At that same annual meeting of stockholders, we also expect to ask our stockholders to vote in a non-binding, advisory vote regarding the frequency in which we will conduct our Say-on-Pay Vote.
Executive Compensation Objectives and Philosophy
The key objective of our executive compensation program is to attract, motivate, and retain valued leaders who create an inclusive and diverse environment and have the skills and experience necessary to successfully
245
Table of Contents
execute on our strategic plan to maximize shareholder value. The fundamental elements and core principals of our executive compensation program are as follows:
• | Paying for performance is our central compensation tenet: Reinforce pay-for-performance and individual accountability through the grant of performance-based cash and equity-based award opportunities |
• | Provide a total pay program that is competitive in terms of level and design: In combination with the above, align with market on vesting periods that encourage our top talent to stay with our company long term. This supports our investment in talent specifically trained to run our unique business |
• | Our compensation supports the attainment of key business, strategic and human capital goals aimed at driving long-term shareholder value: The components of our compensation program are specifically designed to support each driver of our business. We have compensation elements supporting progress toward annual strategic priorities and strong long-term stockholder return |
• | Emphasize alignment across our business by tailoring compensation to reflect organization level and impact to the business with greater focus on variable/performance-based compensation at higher levels |
We strive to be market competitive on all elements of compensation, with significant upside for strong individual and company performance. In addition, we factor in an executive’s experience, performance, scope of position and the competitive demand for proven executive talent, as described further below under “—Determination of Executive Compensation.”
Determination of Executive Compensation
Role of Compensation Committee
Our compensation committee is responsible for establishing and overseeing our executive compensation programs and annually reviews and determines the compensation to be provided to our Chief Executive Officer and our other NEOs, except with respect to equity compensation awards which shall be determined by the full board of directors or by action of two or more “non-employee directors” (within the meaning of Rule 16b-3 of the Exchange Act).
In setting executive compensation, the compensation committee considers a number of factors, including the recommendations of our Chief Executive Officer (other than with respect to his own compensation), current and past total compensation, competitive market data and analysis provided by the compensation committee’s independent compensation consultant, company performance and each executive’s impact on performance, each executive’s relative scope of responsibility and potential, each executive’s individual performance and demonstrated leadership, and internal equity pay considerations.
Role of Compensation Consultant
In order to design a competitive executive compensation program that will continue to attract top executive talent and reflect our compensation philosophy, our compensation committee has retained Pay Governance as an independent compensation consultant to provide executive compensation advisory services, help evaluate our compensation philosophy and objectives and provide guidance in administering our executive compensation program.
Role of the CEO
At the end of each performance year, our Chief Executive Officer assesses the contributions of each executive officer and recommends to our compensation committee the compensation to be awarded based on numerous factors, future contributions, leadership abilities, external market competitiveness, internal pay
246
Table of Contents
comparisons, retention risk and other factors deemed relevant. The compensation committee considers this information and makes final compensation determinations for our executive officers. Our Chief Executive Officer does not participate in any deliberations regarding his own compensation.
Use of Comparative Market Data
Use of Market Data
The compensation committee periodically examines pay practices and pay data for a peer group of 16 companies as a source of market data to better understand the competitiveness of our compensation program and its various elements. Specifically, we review the range of market compensation between the 25th and 75th percentiles of our peer group as well as compensation survey data to develop an understanding of market pay levels for each position.
The external market data reviewed for our 2023 executive compensation program included peer group proxy data and broad industry-comparative compensation surveys. The compensation committee reviews the composition of the peer group on an annual basis and considers the following criteria:
• | Industries that attract and retain similar talent; |
• | Global presence and brand recognition; |
• | Organizational complexity; |
• | Comparable size based on annual revenue, market capitalization, Adjusted EBITDA and number of team members; and |
• | High-growth profile. |
Based on the above, the peer group used for assessing 2023 compensation levels for our NEOs was as follows:
Americold Realty Trust, Inc.
C.H. Robinson Worldwide, Inc.
Conagra Brands, Inc.
Expeditors International of Washington, Inc.
Extra Space Storage Inc.
Hilton Worldwide Holdings Inc.
Hyatt Hotels Corporation
J.B. Hunt Transport Services, Inc.
Kellogg Company
Norfolk Southern Corporation
Old Dominion Freight Line, Inc.
Ryder System, Inc.
Simon Property Group, Inc.
US Foods Holding Corp.
XPO, Inc.
Yum! Brands, Inc.
The compensation committee reviewed the total compensation of our company’s executives relative to compensation of comparable positions among the peer companies but did not set 2023 executive compensation levels at a specific target percentile within the peer group or any other comparator group. The compensation committee does not establish compensation levels solely based on a review of competitive data, and also considers a number of other factors, including: company performance relative to our stakeholder priorities, each executive’s impact and criticality to our strategy and mission, relative scope of responsibility and potential,
247
Table of Contents
individual performance and demonstrated leadership, and internal equity pay considerations. 2023 NEO total compensation levels within the peer group range varied by individual, and were slightly above the median for our CEO and between the 33rd and 89th percentiles (average of +12% of the median) for other NEOs for whom comparable positions were identified in the peer group (which did not include our Chief Information Officer and Chief Transformation Officer).
Elements of Compensation
Pay Mix
In establishing an appropriate mix of fixed and variable pay to reward and retain our NEOs, we consider company-wide and individual performance. The compensation committee balances the importance of meeting our short-term business goals with the need to create shareholder value and drive growth over the long-term. Our compensation framework heavily weights variable compensation to reward achievements against pre-established, quantifiable financial performance objectives and individual strategic performance objectives.
The primary components of our executive compensation program and the purposes of each are set forth below:
Pay Component | Purpose | |
Base Salary | • To recognize an executive’s immediate contribution to the organization • To compensate for assuming a significant level of responsibility • To provide financial stability • To be market competitive | |
Short-Term Incentives | • To reinforce the optimization of operating results throughout the year • To pay for performance and reinforce individual accountability • To reinforce the achievement of Lineage’s goals • To drive shareholder value • To ensure both short and long-term goals of the company are met via compensation elements | |
Long-Term Incentives | • To hold executives accountable for long-term decisions • To reinforce collaboration between key leaders throughout the organization for long-term goals • To retain key talent over the long term • To share success with stockholders • To build executive stock ownership and shareholder value • To be competitive in the markets where we compete for executive talent | |
Benefits | • To provide competitive employee benefit packages in order to attract and retain highly qualified personnel • To avoid materially different approaches to benefit strategy among executive and non-executive populations • To be cost effective through shared expense with executives • To be tax-effective |
Base Salary
The base salaries of our NEOs are an important part of their total compensation package and are intended to reflect their respective positions, duties and responsibilities. The base salary levels of our NEOs are intended to position each individual’s base salary competitively in the labor market in which we compete for talent, as well
248
Table of Contents
as to reflect additional considerations set forth above under “—Determination of Executive Compensation.” Our NEOs’ 2023 base salaries are set forth below:
Name | 2023 Annual Base Salary | |||
Greg Lehmkuhl | $ | 1,200,000 | ||
Rob Crisci | $ | 700,000 | ||
Jeffrey Rivera | $ | 660,000 | ||
Sudarsan Thattai | $ | 630,000 | ||
Sean Vanderelzen | $ | 525,000 |
Annual Bonus Program
Our short-term cash incentive plan has been designed to attract and retain key talent and reward executives based on performance against key financial and strategic priorities.
Target Levels
Each NEO is eligible to receive an annual performance-based cash bonus based on a specified target annual bonus award amount, expressed as a percentage of the NEO’s base salary. In 2023, each of our NEOs participated in our annual cash incentive bonus program at the following target percentages of base salary:
Name | Target Bonus as a Percentage of Base Salary | |||
Greg Lehmkuhl | 175 | % | ||
Rob Crisci | 125 | % | ||
Jeffrey Rivera | 110 | % | ||
Sudarsan Thattai | 100 | % | ||
Sean Vanderelzen | 100 | % |
Mr. Rivera’s target bonus opportunity increased from 100% of base salary in 2022 to 110% of base salary in 2023. The target bonus opportunities for Messrs. Lehmkuhl, Thattai and Vanderelzen in 2023 were not increased or changed from fiscal year 2022. Mr. Crisci was not an employee of our company in 2022.
Financial and Individual Objectives, Targets, and Potential Payouts
The annual bonus program for each of our NEOs includes the following two primary components:
(i) | Company overall financial performance, measured by Management Adjusted EBITDA, weighted at 70%; and |
(ii) Individual performance objectives, as set forth below for each NEO, weighted at 30%.
Company Performance Objective—Management Adjusted EBITDA
Seventy percent of each NEO’s annual cash bonus is based on the extent to which the Management Adjusted EBITDA objective is achieved. The following table provides threshold, target and maximum targets for the Management Adjusted EBITDA objective and provides actual 2023 results and achievement as a percentage of target. For the Management Adjusted EBITDA objective, Mr. Lehmkuhl receives a 0% payout at or below threshold performance, a 100% payout of target at target performance, and a 200% payout of target at maximum performance. Each NEO other than Mr. Lehmkuhl receives a 20% payout of target at threshold performance, a 100% payout of target at target performance, and a 200% payout of target at maximum performance. For all NEOs, the payout for performance between percentages is interpolated on a straight-line basis and performance below threshold results in a 0% payout for the Management Adjusted EBITDA objective.
249
Table of Contents
Financial Objective | Threshold (0% Payout for CEO; 20% Payout for other NEOs)(1) | Target (100% Payout)(1) | Maximum (200% Payout)(1) | Result(1) | Achievement | Payout (% of Target) | ||||||||||||||||||
Management Adjusted | $ | 1,116.6 | $ | 1,246.6 | $ | 1,327.6 | $ | 1,341.6 | 107.6 | % | 200 | % |
(1) | Amounts in millions. |
Management Adjusted EBITDA is calculated as Adjusted EBITDA with additional adjustments to exclude current year acquisitions, dispositions, closed operations, annual bonus program expense, other certain one-time items (both favorable and unfavorable), and management fees paid to Bay Grove in accordance with the terms of the operating services agreement. In addition, Management Adjustment EBITDA is not adjusted for our share of EBITDA related to certain joint ventures or the allocation of our consolidated EBITDA attributable to noncontrolling interests. For a reconciliation of Adjusted EBITDA to net income, see “Summary Selected Historical and Pro Forma Condensed Consolidated Financial and Other Data.”
Individual Performance Objectives
Thirty percent of each NEO’s annual cash bonus (excluding the Supplemental CEO Bonus for Mr. Lehmkuhl) is based on achievement of individual performance objectives. The individual performance objectives varied by NEO depending on their specific responsibilities, and payout percentages at threshold (where applicable) and maximum performance varied by objective. For each NEO other than Mr. Lehmkuhl, the payout for performance between threshold and target and between target and maximum is interpolated on a straight-line basis and performance below threshold results in a 0% payout for the individual performance objectives. Mr. Lehmkuhl’s individual performance objectives are not subject to a threshold, and payout is interpolated on a straight-line basis between 0% performance (corresponding to a 0% payout) and target and between target and maximum.
The following is a summary of each of our NEOs’ individual objectives:
• | Mr. Lehmkuhl’s individual objectives included goals relating to our company’s return on assets (50% of individual objectives), initial public offering readiness (33.33% of individual objectives) and company mergers and acquisitions (16.67% of individual objectives). Because Mr. Lehmkuhl’s initial public offering readiness objective did not include an opportunity for maximum payout above 100% of target, Mr. Lehmkuhl was eligible to receive an additional payout based on our company’s Management Adjusted EBITDA performance above the maximum level established for the company performance objective described above (the “Supplemental CEO Bonus”). The potential payout range of the Supplemental CEO Bonus opportunity was between $0 and $210,000 and was determined based on linear interpolation of performance between 106.5% of the target Management Adjusted EBITDA set forth above ($1,327.6 million) and 108% of target Management Adjusted EBITDA ($1,346.3 million). |
• | Mr. Crisci’s individual objectives included goals relating to his onboarding plan, including his integration into the organization and orientation to our company’s operations, finances and industry at-large. |
• | Mr. Rivera’s individual objectives included goals relating to capital projects, employee and management engagement, reduction of employee turnover, customer experience, positioning for future growth and other operational goals (weightings per goal between 5% and 15% of individual objectives). |
• | Mr. Thattai’s individual objectives included operational, strategic, customer and budget goals relating to our company’s global business, including the deployment of operating systems, warehouse system conversions and core-strategic customer facing technology products (weightings per goal between 5% and 15% of individual objectives). |
250
Table of Contents
• | Mr. Vanderelzen’s individual objectives included goals relating to our company’s global recruiting transformation, harmonizing our company’s global employee compensation and benefit programs, initial public offering readiness, employee retention goals, non-U.S. onboarding and operations objectives, and achieving the G&A budget for our company’s human resources function (weightings per goal between 5% and 30% of individual objectives). |
Following the end of 2023, our compensation committee reviewed and evaluated the performance of each NEO and determined the extent to which the NEO satisfied his individual performance objectives. The compensation committee consulted with Mr. Lehmkuhl regarding each other NEO’s performance with respect to such NEO’s individual objectives.
2023 Annual Incentive Payouts
The following table summarizes each NEO’s 2023 annual incentive plan objectives described above, including the applicable weighting, achievement as a percentage of target performance, payout percentage and payout amount.
Name | Objective | Weighting | Achievement | Payout (% of Target Bonus) | Payout | |||||||||||||
Greg Lehmkuhl | Management Adjusted EBITDA | 70 | % | 107.6 | % | 200 | % | $ | 2,940,000 | |||||||||
Individual Performance Objectives | 30 | % | 100.7 | % | 106.5 | % | $ | 670,950 | ||||||||||
Supplemental CEO Bonus* | — | — | — | $ | 154,000 | |||||||||||||
|
| |||||||||||||||||
Total | $ | 3,764,950 | ||||||||||||||||
|
| |||||||||||||||||
Rob Crisci | Management Adjusted EBITDA | 70 | % | 107.6 | % | 200 | % | $ | 862,534 | |||||||||
Individual Performance Objectives | 30 | % | 135 | % | 135 | % | $ | 249,519 | ||||||||||
|
| |||||||||||||||||
Total | $ | 1,112,053 | ||||||||||||||||
|
| |||||||||||||||||
Jeffrey Rivera | Management Adjusted EBITDA | 70 | % | 107.6 | % | 200 | % | $ | 1,005,768 | |||||||||
Individual Performance Objectives | 30 | % | 135 | % | 135 | % | $ | 290,954 | ||||||||||
|
| |||||||||||||||||
Total | $ | 1,296,722 | ||||||||||||||||
|
| |||||||||||||||||
Sudarsan Thattai | Management Adjusted EBITDA | 70 | % | 107.6 | % | 200 | % | $ | 872,334 | |||||||||
Individual Performance Objectives | 30 | % | 113 | % | 113 | % | $ | 211,230 | ||||||||||
|
| |||||||||||||||||
Total | $ | 1,083,564 | ||||||||||||||||
|
| |||||||||||||||||
Sean Vanderelzen | Management Adjusted EBITDA | 70 | % | 107.6 | % | 200 | % | $ | 723,723 | |||||||||
Individual Performance Objectives | 30 | % | 157 | % | 157 | % | $ | 243,481 | ||||||||||
|
| |||||||||||||||||
Total | $ | 967,204 | ||||||||||||||||
|
|
* | Actual Management Adjusted EBITDA for 2023 was $1,341.6 million, which resulted in a payment to Mr. Lehmkuhl of a Supplemental CEO Bonus equal to $154,000. |
251
Table of Contents
Equity-Based Long-Term Incentive Awards
We view equity-based compensation as a critical component of our balanced total compensation program. Equity-based compensation creates an ownership culture among our employees that provides an incentive to contribute to the continued growth and development of our business and aligns the interest of executives with those of our stockholders.
We have granted to our NEOs Class C Units in LLH MGMT Profits, LLC and LLH MGMT Profits II, LLC (“LMEP Units”), which correspond to the value of Class C Units in Lineage Holdings held by LLH MGMT Profits, LLC and LLH MGMT Profits II, LLC. In addition BGLH has granted to our NEOs Class B Units in BGLH (“BGLH Restricted Units”). The LMEP Units are issued in the form of profits interest units to eligible participants for the performance of services to or for the benefit of our company.
LMEP Units
Awards of LMEP Units typically vest (i) with respect to 50% of the units subject to the award, in five (or, for awards granted in 2023, three) substantially equal annual installments on each of the first five or three anniversaries, respectively of the grant date (the “Time-Based LMEP Units”); and (ii) with respect to the remaining 50% of the units subject to the award, for awards granted to Mr. Lehmkuhl, based on the attainment of Management Adjusted EBITDA performance targets, and for awards granted to our other NEOs, (A) based 50% on the attainment of the applicable individual key performance indicators for each NEO set forth above under “—Annual Bonus Program—Individual Performance Objectives” and (B) based 50% on the attainment of Management Adjusted EBITDA performance targets, each in substantially equal installments over a five-year (or, for awards granted in 2023, three-year) period (the “Performance-Based LMEP Units”), in each case, subject to the NEO’s continued service relationship through the applicable vesting date. For each award of LMEP Units, the key performance indicators and EBITDA targets are established at the beginning of the year in which the applicable Performance-Based LMEP Units are eligible to vest (each, a “Performance Vesting Tranche”). In addition, in connection with his promotion to his current positions with our company in 2022, Mr. Thattai was granted an award of LMEP Units in March 2022 that is subject to vesting based on the achievement of specified performance goals as of March 29, 2024 and Mr. Thattai’s continued employment with our company through March 29, 2025.
In the event that any Performance-Based LMEP Units fail to satisfy the applicable performance targets in the applicable year, such Performance-Based LMEP Units will, unless and until otherwise terminated, remain outstanding and (i) will vest in full upon the occurrence of an exit transaction that generates net proceeds in excess of certain specified thresholds and (ii) may also vest on a discretionary basis as determined by the manager of LLH MGMT Profits, LLC or LLH MGMT Profits II, LLC (as applicable). For purposes of the LMEP Unit award agreements, an exit transaction generally includes certain third party sale transactions resulting in a change in control of our company. For a description of how LMEP Unit awards are treated upon qualifying terminations of employment or in connection with a change in control, see the section entitled, “—Potential Payments Upon Termination or Change in Control—LMEP Awards.”
2023 LMEP Awards
In April 2023, in connection with Mr. Crisci’s commencement of employment with our company, Mr. Crisci was granted a special long-term incentive award of 2,191,000 LMEP Units that are subject to vesting pursuant to the three-year vesting schedule described above. The performance metrics applicable to such LMEP Units included Management Adjusted EBITDA (50%) and the individual performance targets (50%) set forth with respect to Mr. Crisci above under “—Annual Bonus Program—Individual Performance Objectives.” None of our other NEOs received an award of LMEP Units in 2023.
BGLH Restricted Units
The BGLH Restricted Units generally vest in full on December 31 of the calendar year of the grant date, subject to the NEO’s continued service with our company or its affiliates through the vesting date. However,
252
Table of Contents
certain BGLH Restricted Units granted to Mr. Lehmkuhl pursuant to the Original Lehmkuhl Agreement (as defined and described below) vest in two or three substantially equal annual installments commencing on December 31 of the calendar year of the grant date, subject to continued employment. In addition, in connection with Mr. Crisci’s commencement of employment with our company, Mr. Crisci was granted a special long-term incentive award of BGLH Restricted Units in 2023 that will vest in full on the first to occur of the 18-month anniversary of his employment commencement date and the consummation of this offering, in each case, subject to continued employment. BGLH Restricted Units are subject to repurchase in accordance with the limited liability company agreement of BGLH.
2023 BGLH Restricted Unit Awards
In 2023, our NEOs were granted the following awards of BGLH Restricted Units:
Name | Number of BGLH Restricted Units | |||
Greg Lehmkuhl | 48,889 | (1) | ||
Rob Crisci | 111,111 | |||
Jeffrey Rivera | 6,111 | |||
Sudarsan Thattai | 5,556 | |||
Sean Vanderelzen | 6,111 |
(1) | Of the BGLH Restricted Units granted to Mr. Lehmkuhl in 2023, 33,333 vest pursuant to the two-year vesting schedule described above, and the remaining 15,556 vest pursuant to the standard one-year vesting schedule described above. |
Pursuant to a letter agreement dated April 12, 2023, BGLH has also agreed to work with Mr. Crisci in good faith regarding the satisfaction by him of his tax liabilities with respect to the vesting of his 2023 BGLH Restricted Units, subject to compliance with applicable law and company policy.
LMEP Units—2023 Performance Vesting
As of December 31, 2023, the 2023 Performance Vesting Tranches of LMEP Unit awards granted in 2023 and prior years vested as follows based on Management Adjusted EBITDA performance and the satisfaction of individual key performance indicator goals:
Management Adjusted EBITDA
Objective | Target(1) | Result(1) | Achievement | Payout (% of Target Award) | ||||||||||||
Management Adjusted EBITDA | $ | 1,246.6 | $ | 1,341.6 | 107.6 | % | 100 | % |
(1) | Amounts in millions. |
253
Table of Contents
Key Performance Indicators
Key performance indicator goals for our NEOs other than Mr. Lehmkuhl were achieved as follows with respect to 2023 Performance Vesting Tranches. Mr. Lehmkuhl’s LMEP Unit awards are subject only to Management Adjusted EBITDA performance goals and are not subject to any key performance indicators.
LMEP Unit Awards | Key Performance Indicators— Level of Achievement | |||
Rob Crisci | ||||
2023 LMEP Units | 100 | % | ||
Jeffrey Rivera | ||||
2020 LMEP Units | 100 | % | ||
2021 LMEP Units | 100 | % | ||
2022 LMEP Units | 100 | % | ||
Sudarsan Thattai | ||||
2019 LMEP Units | 100 | % | ||
2020 LMEP Units | 100 | % | ||
2021 LMEP Units | 100 | % | ||
2022 LMEP Units | 100 | % | ||
Sean Vanderelzen | ||||
2019 LMEP Units | 100 | % | ||
2020 LMEP Units | 100 | % | ||
2021 LMEP Units | 100 | % | ||
2022 LMEP Units | 100 | % |
Based on such Management Adjusted EBITDA performance and key performance indicator performance, each NEO vested in the following numbers of LMEP Units for 2023 Performance Vesting Tranches:
NEO | Aggregate Number of LMEP Units Subject to 2023 Performance Vesting Tranches (Granted) | Aggregate Number of LMEP Units Subject to 2023 Performance Vesting Tranches (Vested) | ||||||
Greg Lehmkuhl | 187,875 | 187,875 | ||||||
Rob Crisci | 365,167 | 365,167 | ||||||
Jeffrey Rivera | 84,031 | 84,031 | ||||||
Sudarsan Thattai | 134,890 | 134,890 | ||||||
Sean Vanderelzen | 57,910 | 57,910 |
Treatment of LMEP Units and BGLH Restricted Units in Connection with this Offering
In connection with this offering and the formation transactions, we will have purchased in exchange for 80,950 shares of our common stock the vested awards of LMEP Units valued at less than $3.0 million per individual that are held by certain of our officers and employees who are not named executive officers. After such purchase, LLH MGMT Profits I and LLH MGMT Profits II will each contribute their interests in Lineage Holdings to our operating partnership in exchange for 2,204,162 Legacy Class B OP Units as part of the formation transactions. Following the contribution, each of LLH MGMT Profits, LLC and LLH MGMT Profits II, LLC will distribute the Legacy Class B OP Units to its members, including certain of our officers and employees whose LMEP Units are not purchased in exchange for shares of our common stock, in complete liquidation of each such entity.
All officers, employees and others to whom such Legacy Class B OP Units are distributed will generally continue to hold such Legacy Class B OP Units subject to settlement over a period of up to three years as part of the same settlement process that applies to all of our legacy investor equity. See “Structure and Formation of Our Company—Formation Transactions—Historic Management Equity.”
254
Table of Contents
All outstanding LMEP Units that remain unvested as of the contribution and distribution described above will automatically terminate at such time. In connection with this offering and, in part, the termination of outstanding and unvested LMEP Units, we will grant one-time equity-based awards under the 2024 Plan in the form of RSUs covering shares of our common stock and/or LTIP units in our operating partnership that will be subject to vesting based on continued employment over a period of up to three years. The aggregate number of such RSUs and LTIP units granted to all applicable executive officers and employees is expected to be approximately 1,066,763, including awards in the following amounts to our NEOs:
Name | Replacement LMEP RSU Awards (#) | Replacement LMEP LTIP Unit Awards (#) | ||||||
Greg Lehmkuhl | — | — | ||||||
Rob Crisci | — | 55,556 | ||||||
Jeffrey Rivera | — | 80,693 | ||||||
Sudarsan Thattai | — | 187,286 | ||||||
Sean Vanderelzen | 22,473 | 22,473 |
New equity-based awards under the 2024 Plan will not include any new Legacy Class B OP Units. Any new equity-based awards issued at our operating partnership at or following the completion of this offering will be in the form of LTIP units. See “—Amended and Restated Lineage 2024 Incentive Award Plan” below for more information.
All BGLH Restricted Units that remain unvested as of the initial closing of this offering will automatically vest in full in connection with this offering and will be included in the coordinated settlement process for the settlement of all legacy BGLH and legacy operating partnership equity over the up-to-three-year settlement period for such equity following the initial closing of this offering.
Employee Benefits and Perquisites
Retirement Savings
We maintain a 401(k) retirement savings plan for our employees, including our NEOs, who satisfy certain eligibility requirements. Our NEOs are eligible to participate in the 401(k) plan on the same terms as other full- time employees. In 2023, contributions made by participants in the 401(k) plan were matched up to a specified percentage of the employee contributions, and these matching contributions are fully vested when made by our company. We believe that providing a vehicle for tax-deferred retirement savings though our 401(k) plan, and making fully vested matching contributions, adds to the overall desirability of our executive compensation package and further incentivizes our employees, including our NEOs, in accordance with our compensation policies.
Health and Welfare Plans
All of our full-time employees, including our NEOs, are eligible to participate in our health and welfare plans, including medical, dental and vision benefits, medical and dependent care flexible spending accounts, short-term and long-term disability insurance, and life insurance.
Other Perquisites
We provided certain perquisites to each of our NEOs in 2023, including a company-paid annual executive physical. In 2023 we reimbursed certain of our NEOs for certain personal travel, entertainment and other non-business expenses incurred by them and their families, and also provided Mr. Lehmkuhl with a car allowance. Subject to approval by our company in its discretion, each NEO was also permitted certain personal use by the applicable NEO and/or his family of aircraft owned and/or leased by our company or its affiliates. In addition, in 2023, certain of our NEOs received tax gross-up payments related to company-provided family and spousal travel, international assignments, and the grant and/or vesting of BGLH Restricted Units. The personal
255
Table of Contents
expense reimbursement program for our NEOs (other than Mr. Lehmkuhl) and the provision of all tax gross-ups for our NEOs were discontinued as of January 1, 2024. The personal expense reimbursement program for Mr. Lehmkuhl was discontinued as of April 1, 2024.
Severance and Change in Control Arrangements
We have entered into an employment agreement with each of Mr. Lehmkuhl and Mr. Crisci and a letter agreement with Mr. Thattai, which provide for severance benefits and payments upon certain terminations of their employment. Our compensation committee believes that these types of arrangements are necessary to attract and retain executive talent and are a customary component of executive compensation. A description of these arrangements, as well as information on the estimated payments and benefits that our NEOs would have been eligible to receive as of December 31, 2023, are set forth in “—Potential Payments Upon Termination or Change in Control” below.
In connection with this offering, we intend to adopt the Lineage, Inc. Executive Severance Plan (the “Severance Plan”), and expect that each of Messrs. Rivera, Thattai and Vanderelzen will be a participant in the Severance Plan. For a description of the Severance Plan, see “—Potential Payments on Termination or Change in Control—Executive Severance Plan” below.
Other Policies and Considerations
Clawback Policy. We intend to adopt a compensation recovery policy that will require the recovery of certain erroneously paid incentive compensation received by our Section 16 officers on or after the date on which this registration statement becomes effective, as required by new SEC rules and Nasdaq Listing Standards implemented pursuant to the Dodd-Frank Act, and which can be recovered from time-vesting or performance-vesting equity compensation (in addition to other forms of compensation).
Stock Ownership Guidelines. In connection with this offering, we expect to adopt stock ownership guidelines that will be applicable to our executive officers, including our NEOs, and to our non-employee directors.
Section 409A of the Internal Revenue Code. The compensation committee takes into account whether components of the compensation for our executive officers will be adversely impacted by the penalty tax imposed by Section 409A of the Code and aims to structure these components to be compliant with or exempt from Section 409A to avoid such potential adverse tax consequences.
Deductibility of Executive Compensation. Section 162(m) of the Code denies a publicly-traded corporation a federal income tax deduction for remuneration in excess of $1 million per year per person paid to executives designated in Section 162(m) of the Code, including, but not limited to, its chief executive officer, chief financial officer, and the next three highly compensated executive officers. However, we believe that maintaining the discretion to provide compensation that is non-deductible allows us to provide compensation tailored to the needs of our company and our named executive officers and is an important part of our responsibilities and benefits our stockholders.
Accounting for Share-Based Compensation. We follow Financial Accounting Standard Board Accounting Standards Codification Topic 718, (“ASC Topic 718”), for our share-based compensation awards. ASC Topic 718 requires companies to measure the compensation expense for all share-based payment awards made to employees and directors based on the grant date “fair value” of these awards.
256
Table of Contents
2023 Executive Compensation
2023 Summary Compensation Table
The following table sets forth information concerning the compensation of our NEOs for the year ended December 31, 2023.
Name and Principal Position | Salary(1) ($) | Stock Awards(2) ($) | Non-Equity Incentive Plan Compensation(3) ($) | All Other Compensation(4) ($) | Total ($) | |||||||||||||||
Greg Lehmkuhl | 1,197,693 | 5,433,313 | 3,764,950 | 1,183,994 | 11,579,950 | |||||||||||||||
President and Chief Executive Officer | ||||||||||||||||||||
Rob Crisci | 465,769 | 14,367,378 | 1,112,053 | 14,987 | 15,960,187 | |||||||||||||||
Chief Financial Officer | ||||||||||||||||||||
Jeffrey Rivera | 651,923 | 923,356 | 1,296,722 | 274,328 | 3,146,329 | |||||||||||||||
Global Chief Operations Officer | ||||||||||||||||||||
Sudarsan Thattai | 621,924 | 1,255,135 | 1,083,564 | 226,895 | 3,178,518 | |||||||||||||||
Chief Information Officer and Chief Transformation Officer | ||||||||||||||||||||
Sean Vanderelzen | 515,578 | 833,017 | 967,204 | 298,766 | 2,614,565 | |||||||||||||||
Chief Human Resources Officer |
(1) | For Mr. Crisci, amount reflects 2023 base salary earned or paid to him commencing on April 19, 2023 (the start date of his employment with our company). |
(2) | Amounts shown in this column represent the aggregate grant date fair value of (i) time-vesting LMEP Units and BGLH Restricted Units granted to the NEOs in 2023, and (ii) 2023 Performance Vesting Tranches of LMEP Units awarded to the NEOs in 2023 and prior years. For Mr. Crisci, the amounts reflect special long-term incentive awards of LMEP Units and BGLH Restricted Units granted to him in connection with his commencement of employment with our company (see “Compensation Discussion and Analysis—Elements of Compensation—Equity-Based Long-Term Incentive Awards”). All amounts shown are calculated in accordance with FASB ASC Topic 718. For 2023, the following assumptions were used in the calculation of these amounts for LMEP Units: volatility 48.5%, risk free rate 4.68%, and dividend yield 0.00%. The value of BGLH Restricted Units is based on the equity value of BGLH derived from an independent third-party valuation of Lineage Holdings as of December 31, 2022. For 2023 Performance Vesting Tranches of LMEP Units, amounts shown are based on probable outcomes as of the applicable measurement date under FASB ASC Topic 718, which is also maximum level performance. |
(3) | Amounts shown in this column represent amounts earned under our annual bonus program for the year shown and paid in the first quarter of the following year. For a description of our cash annual incentive bonus program see “—Compensation Discussion and Analysis—Elements of Compensation—Annual Bonus Program” above. |
257
Table of Contents
(4) | The following table sets forth the amount of each other item of compensation paid to, or on behalf of, our NEOs during 2023 included in the “All Other Compensation” column. Amounts for each other item of compensation are valued based on the aggregate incremental cost to us, in each case without taking into account the value of any income tax deduction for which we may be eligible. |
Name | Company 401(k) Match(a) ($) | Personal Use of Company Aircraft(b) ($) | Reimbursement of Personal Travel, Entertainment and Other Expenses(c) ($) | Tax Gross-Ups(d) ($) | Other(e) ($) | Total ($) | ||||||||||||||||||
Greg Lehmkuhl | 8,115 | 54,329 | 487,269 | 600,701 | 33,580 | 1,183,994 | ||||||||||||||||||
Rob Crisci | 9,500 | 903 | — | 544 | 4,040 | 14,987 | ||||||||||||||||||
Jeffrey Rivera | 13,200 | 5,812 | 16,132 | 235,604 | 3,580 | 274,328 | ||||||||||||||||||
Sudarsan Thattai | 9,199 | 903 | 7,950 | 207,763 | 1,080 | 226,895 | ||||||||||||||||||
Sean Vanderelzen | 9,008 | 2,610 | 36,066 | 247,502 | 3,580 | 298,766 |
(a) | For 2023, we matched 100% of the first 3% and 50% of the next 2% percent of eligible compensation (subject to applicable Internal Revenue Code limits) contributed on a pre-tax basis to our 401(k) plan. |
(b) | Amounts in this column reflect the incremental cost to our company relating to personal use by the applicable NEO and/or his family of aircraft owned and/or leased by our company or its affiliates. |
(c) | Amounts include, as applicable, reimbursement by our company of airfare, hotel, dining and other personal, entertainment and travel related expenses for the NEO and/or his family. |
(d) | Amounts include tax gross-ups relating to company-provided family and spousal travel, international assignment, and/or the grant and/or vesting of BGLH Restricted Units. |
(e) | Amounts in this column are based on the aggregate incremental cost to our company for company-paid life insurance premiums (Mr. Lehmkuhl- $1,080; Mr. Crisci- $540; Mr. Rivera- $1,080; Mr. Thattai- $1,080; and Mr. Vanderelzen- $1,080), annual executive medical examinations (Mr. Lehmkuhl- $2,500; Mr. Crisci- $3,500; Mr. Rivera- $2,500; and Mr. Vanderelzen- $2,500) and auto allowance (Mr. Lehmkuhl- $30,000). |
In addition to the amounts reflected in the table above, Messrs. Lehmkuhl and Thattai also received payments in respect of the redemption by BGLH of certain BGLH Restricted Units. See “Certain Relationships and Related Party Transactions—Unit Redemptions.” Such amounts are payments with respect to the NEOs’ equity ownership interests in BGLH and are not considered compensation paid by us.
258
Table of Contents
Grants of Plan-Based Awards in 2023
The following table provides information relating to grants of plan-based awards made during 2023.
Name | Grant Date(3) | Estimated Future Payouts Under Non-Equity Incentive Plan Awards(1) | Estimated Future Payouts Under Equity Incentive Plan Awards(2) | All Other Stock Awards: Number of Shares of Stock or Units(5) (#) | Grant Date Fair Value of Stock and Option Awards(6) ($) | |||||||||||||||||||||||||||||||||||
Date of Award(4) | Threshold ($) | Target ($) | Maximum ($) | Threshold (#) | Target (#) | Maximum (#) | ||||||||||||||||||||||||||||||||||
Greg Lehmkuhl | ||||||||||||||||||||||||||||||||||||||||
Annual Incentive Bonus | — | — | — | 2,100,000 | 4,200,000 | — | — | — | — | — | ||||||||||||||||||||||||||||||
BGLH Restricted Units | 1/9/2023 | 1/9/2023 | — | — | — | — | — | — | 15,556 | 1,400,000 | ||||||||||||||||||||||||||||||
BGLH Restricted Units | 2/10/2023 | 2/10/2023 | — | — | — | — | — | — | 33,333 | 3,000,000 | ||||||||||||||||||||||||||||||
LMEP Units (Performance-Vesting) | 1/1/2023 | 1/31/2020 | — | — | — | — | 187,875 | — | — | 1,033,313 | ||||||||||||||||||||||||||||||
Rob Crisci | ||||||||||||||||||||||||||||||||||||||||
Annual Incentive Bonus | — | — | 178,668 | 616,096 | 1,232,192 | — | — | — | — | — | ||||||||||||||||||||||||||||||
BGLH Restricted Units | 4/19/2023 | 4/19/2023 | — | — | — | — | — | — | 111,111 | 9,999,990 | ||||||||||||||||||||||||||||||
LMEP Units (Time-Vesting) | 4/19/2023 | 4/19/2023 | — | — | — | — | — | — | 1,095,498 | 3,275,539 | ||||||||||||||||||||||||||||||
LMEP Units (Performance-Vesting) | 4/19/2023 | 4/19/2023 | — | — | — | — | 365,167 | — | — | 1,091,849 | ||||||||||||||||||||||||||||||
Jeffrey Rivera | ||||||||||||||||||||||||||||||||||||||||
Annual Incentive Bonus | — | — | 208,338 | 718,405 | 1,436,811 | — | — | — | — | — | ||||||||||||||||||||||||||||||
BGLH Restricted Units | 1/9/2023 | — | — | — | — | — | — | — | 6,111 | 550,000 | ||||||||||||||||||||||||||||||
LMEP Units (Performance-Vesting) | 1/1/2023 | 3/29/2022 | — | — | — | — | 29,595 | — | — | 92,928 | ||||||||||||||||||||||||||||||
LMEP Units (Performance-Vesting) | 1/1/2023 | 3/5/2021 | — | — | — | — | 10,598 | — | — | 39,319 | ||||||||||||||||||||||||||||||
LMEP Units (Performance-Vesting) | 1/1/2023 | 3/9/2020 | — | — | — | — | 43,838 | — | — | 241,109 | ||||||||||||||||||||||||||||||
Sudarsan Thattai | ||||||||||||||||||||||||||||||||||||||||
Annual Incentive Bonus | — | — | 180,698 | 623,096 | 1,246,192 | — | — | — | — | — | ||||||||||||||||||||||||||||||
BGLH Restricted Units | 1/9/2023 | — | — | — | — | — | — | — | 5,556 | 500,000 | ||||||||||||||||||||||||||||||
LMEP Units (Performance-Vesting) | 1/1/2023 | 3/29/2022 | — | — | — | — | 18,500 | — | — | 58,090 | ||||||||||||||||||||||||||||||
LMEP Units (Performance-Vesting) | 1/1/2023 | 3/5/2021 | — | — | — | — | 23,316 | — | — | 86,502 | ||||||||||||||||||||||||||||||
LMEP Units (Performance-Vesting) | 1/1/2023 | 3/9/2020 | — | — | — | — | 25,050 | — | — | 137,775 | ||||||||||||||||||||||||||||||
LMEP Units (Performance-Vesting) | 1/1/2023 | 2/28/2019 | — | — | — | — | 68,024 | — | — | 472,767 | ||||||||||||||||||||||||||||||
Sean Vanderelzen | ||||||||||||||||||||||||||||||||||||||||
Annual Incentive Bonus | — | — | 149,914 | 516,945 | 1,033,890 | — | — | — | — | — | ||||||||||||||||||||||||||||||
BGLH Restricted Units | 1/9/2023 | — | — | — | — | — | — | — | 6,111 | 550,000 | ||||||||||||||||||||||||||||||
LMEP Units (Performance-Vesting) | 1/1/2023 | 3/29/2022 | — | — | — | — | 7,400 | — | — | 23,236 | ||||||||||||||||||||||||||||||
LMEP Units (Performance-Vesting) | 1/1/2023 | 3/5/2021 | — | — | — | — | 16,957 | — | — | 62,910 | ||||||||||||||||||||||||||||||
LMEP Units (Performance-Vesting) | 1/1/2023 | 3/9/2020 | — | — | — | — | 25,050 | — | — | 137,775 | ||||||||||||||||||||||||||||||
LMEP Units (Performance-Vesting) | 1/1/2023 | 2/28/2019 | — | — | — | — | 8,503 | — | — | 59,096 |
(1) | Reflects threshold, target and maximum payment opportunities under our 2023 annual bonus program, based on the NEOs’ base salary actually paid for the applicable year. For a description of our annual incentive bonus plan, see “Compensation Discussion and Analysis—Elements of Compensation—Annual Bonus Program.” The actual amounts paid in the first quarter of 2024 under our 2023 annual bonus program are disclosed in the “2023 Summary Compensation Table” under the “Non–Equity Incentive Plan Compensation” column. |
(2) | Reflects 2023 Performance-Vesting Tranches of LMEP Units granted during 2023 and in prior years. The performance criteria and vesting provisions for the performance-vesting LMEP Units are described above in the section titled “Compensation Discussion and Analysis—Elements of Compensation—Equity-Based Long-Term Incentive Awards—LMEP Units.” |
(3) | For LMEP Units (including 2023 Performance Vesting Tranches of LMEP Units awarded in prior years) and BGLH Restricted Units, represents the grant date determined for financial statement reporting purposes pursuant to FASB ASC Topic 718. |
(4) | For 2023 Performance Vesting Tranches of LMEP Units awarded in years prior to 2023, represents the date on which the applicable issuer took action to grant the applicable award (which date differs from the grant date determined for financial statement reporting purposes pursuant to FASB ASC Topic 718). |
(5) | Reflects Time-Based LMEP Units and BGLH Restricted Units granted during 2023. The vesting provisions for the Time-Based LMEP Units and BGLH Restricted Units are described above in the sections titled “Compensation Discussion and Analysis—Elements of Compensation—Equity-Based Long-Term Incentive Awards.” |
259
Table of Contents
(6) | Amounts shown in this column represent the aggregate grant date fair value calculated in accordance with FASB ASC Topic 718. For Performance-Based LMEP Units, amounts are based on probable outcomes as of the grant date, which is also maximum level performance. Assumptions used in the calculation of these amounts are set forth above in Note 2 to the Summary Compensation Table. |
Narrative to Summary Compensation Table and Grants of Plan-Based Awards Table
Named Executive Officer Employment Agreements
We have entered into an employment agreement with each of Mr. Lehmkuhl and Mr. Crisci, and an employment letter with Mr. Rivera. The material terms of the Employment Agreements and Mr. Rivera’s employment letter are described below.
Greg Lehmkuhl
Original Employment Agreement
On January 1, 2020, we entered into an employment agreement with Mr. Lehmkuhl (the “Original Lehmkuhl Agreement”), which provides for Mr. Lehmkuhl’s continued employment with our company as our Chief Executive Officer.
The term of employment under the Original Lehmkuhl Agreement is five years, following which the employment relationship will remain at-will or as otherwise mutually agreed to by the parties. Pursuant to the Original Lehmkuhl Agreement, Mr. Lehmkuhl is entitled to receive an annual base salary of $1,000,000 per year, subject to annual review and increase by our board of directors in its sole discretion. Mr. Lehmkuhl’s 2023 annual base salary was $1,200,000.
Mr. Lehmkuhl is eligible to earn annual cash performance bonuses, based on the attainment of company, individual and/or performance objectives as determined by our board of directors, with target and maximum bonus opportunities equal to 150% and 250%, respectively, of Mr. Lehmkuhl’s annual base salary. The target and maximum bonus amounts may be increased (but not reduced) by our board of directors in its sole discretion. Mr. Lehmkuhl’s 2023 target annual bonus is equal to 175% of his annual base salary.
Mr. Lehmkuhl received an initial award of 65,217 BGLH Restricted Units in connection with his entry into the Original Lehmkuhl Agreement in 2020. In addition, the Original Lehmkuhl Agreement provides for subsequent issuances of BGLH Restricted Units to Mr. Lehmkuhl, each with a value equal to $3,000,000, within the first 60 days of each of 2021, 2022, 2023 and 2024. The BGLH Restricted Units awarded in 2020, 2021 and 2022 vest in three substantially equal annual installments and the BGLH Restricted Units awarded in 2023 will vest in two substantially equal installments, in each case, beginning on the December 31 of the year in which the applicable grant date occurs. The BGLH Restricted Units awarded in 2024 will vest in full on December 31, 2024 (or, if earlier, in connection with the consummation of this offering, as described above). In each case, the vesting of the BGLH Restricted Units is subject to Mr. Lehmkuhl’s continued employment through the applicable vesting date. In addition to the foregoing BGLH Restricted Unit awards granted to Mr. Lehmkuhl pursuant to the Original Lehmkuhl Agreement, Mr. Lehmkuhl has received additional discretionary grants of BGLH Restricted Units.
The Original Lehmkuhl Agreement also provides that BGLH will make certain tax loans to Mr. Lehmkuhl with respect to the BGLH Restricted Units. These loans were forgiven or repaid prior to the consummation of this offering.
Also in connection with Mr. Lehmkuhl’s entry into the Original Lehmkuhl Agreement, Mr. Lehmkuhl received an award of 1,878,750 Class C-10 Units of LLH MGMT Profits, LLC (the “LMEP Class C-10 Units”). The LMEP Class C-10 Units will vest (i) with respect to 50% of such units in five substantially equal annual
260
Table of Contents
installments commencing on December 31, 2020, and (ii) with respect to 50% of such units based on the attainment of EBITDA targets and other performance goals established by our board of directors for calendar years 2020-2024, in each case, subject to Mr. Lehmkuhl’s continued employment through the applicable vesting date.
In addition, the Original Lehmkuhl Agreement contains customary confidentiality and assignment of inventions provisions, as well as (i) non-compete restrictions effective during employment and for 24 months thereafter (or during any period during which LLH MGMT Profits, LLC or BGLH is paying for the repurchase of the LMEP Class C-10 Units or the BGLH Restricted Units respectively, or such purchase price remains payable), and (ii) customer, supplier and service provider non-solicitation provisions, effective during employment and for 24 months thereafter.
The severance benefits and payments payable to Mr. Lehmkuhl upon certain qualifying terminations of his employment are summarized below under the section entitled “—Potential Payments Upon Termination or Change in Control”.
Lehmkuhl Amended Employment Agreement
We intend to enter into an amended and restated employment agreement with Mr. Lehmkuhl (the “Amended Lehmkuhl Agreement”) that will become effective upon the closing of this offering and will amend and restate in its entirety the Original Lehmkuhl Agreement. We expect that the material terms of the Amended Lehmkuhl Agreement will be substantially the same as the Original Lehmkuhl Agreement, except as follows:
• | The Amended Lehmkuhl Agreement provides for an initial five year term of employment commencing on the closing of this offering, with automatic successive one-year renewals, unless either the company or the executive provides notice of such party’s intention not to renew the term at least 90 days prior to the expiration of the then-current term; |
• | The Amended Lehmkuhl Agreement memorializes Mr. Lehmkuhl’s current base salary ($1,200,000) and current target and maximum annual bonus opportunities (175% and 350%, respectively, of his annual base salary); |
• | The Amended Lehmkuhl Agreement provides that Mr. Lehmkuhl will be eligible to receive annual equity-based awards under the 2024 Plan as determined by our board of directors or the compensation committee in its sole discretion; |
• | The Amended Lehmkuhl Agreement includes a “best pay cap” under Section 280G of the Code, pursuant to which any “parachute payments” that become payable to Mr. Lehmkuhl will either be paid in full or reduced so that such payments are not subject to the excise tax under Section 4999 of the Code, whichever results in the better after-tax treatment to Mr. Lehmkuhl; and |
• | The Amended Lehmkuhl Agreement provides for certain severance benefits and payments payable to Mr. Lehmkuhl upon qualifying terminations of his employment that differ from the Original Lehmkuhl Agreement in certain respects, as summarized below under the section entitled “—Potential Payments Upon Termination or Change in Control”. |
The Amended Lehmkuhl Agreement also updates and/or removes certain provisions relating to BGLH Restricted Units and LMEP Units previously granted to Mr. Lehmkuhl.
Rob Crisci
Original Employment Agreement
On April 12, 2023, we entered into an employment agreement with Mr. Crisci (the “Original Crisci Agreement”), which provides for Mr. Crisci’s employment with our company as our Chief Financial Officer.
The term of employment under the Original Crisci Agreement is three years, following which the employment relationship will remain at-will. Pursuant to the Original Crisci Agreement, Mr. Crisci is entitled to
261
Table of Contents
receive an annual base salary of $700,000 per year, pro-rated for any partial years of employment, subject to annual review and increase by our company in its sole discretion.
Mr. Crisci is eligible to earn annual cash performance bonuses, based on the attainment of company, individual and/or performance objectives as determined by our company with a target bonus opportunity equal to 125% of Mr. Crisci’s annual base salary.
In connection with Mr. Crisci’s entry into the Original Crisci Agreement, Mr. Crisci was granted an award of 111,111 BGLH Restricted Units and an award of 2,191,000 LMEP Class C-14 Common Units of LLH MGMT Profits II, LLC. The BGLH Restricted Units will vest in full on the first to occur of (i) the eighteen-month anniversary of the date on which Mr. Crisci commenced employment with our company, and (ii) the consummation of our initial public offering, subject to Mr. Crisci’s continued employment through the vesting date. The LMEP Class C-14 Units will vest (i) with respect to 50% of such units in three substantially equal annual installments commencing on April 19, 2024, and (ii) with respect to 50% of such units based on the attainment of EBITDA targets and other performance goals established by our board of directors for calendar years 2023-2025, in each case, subject to Mr. Crisci’s continued employment through the applicable vesting date.
In connection with entering into the Original Crisci Agreement, Mr. Crisci concurrently entered into a Proprietary Information, Inventions, Non-Solicitation Agreement and a Confidentiality Agreement, containing customary confidentiality and assignment of inventions provisions, as well as (i) standard non-solicitation of personnel and business relationships provisions, effective during employment and for 24 months thereafter and (ii) a non-disparagement provision.
The severance benefits and payments payable to Mr. Crisci upon certain qualifying terminations of his employment are summarized below under the section entitled “—Potential Payments Upon Termination or Change in Control”.
Crisci Amended Employment Agreement
We intend to enter into an amended and restated employment agreement with Mr. Crisci (the “Amended Crisci Agreement”) that will become effective upon the closing of this offering and will amend and restate in its entirety the Original Crisci Agreement. We expect that the material terms of the Amended Crisci Agreement will be substantially the same as the Original Crisci Agreement, except as follows:
• | The Amended Crisci Agreement provides that Mr. Crisci will be eligible to receive annual equity-based awards under the 2024 Plan as determined by our board of directors or the compensation committee in its sole discretion; |
• | The Amended Crisci Agreement includes a “best pay cap” under Section 280G of the Code, pursuant to which any “parachute payments” that become payable to Mr. Crisci will either be paid in full or reduced so that such payments are not subject to the excise tax under Section 4999 of the Code, whichever results in the better after-tax treatment to Mr. Crisci; and |
• | The Amended Crisci Agreement provides for certain severance benefits and payments payable to Mr. Crisci upon qualifying terminations of his employment that differ from the Original Crisci Agreement in certain respects, as summarized below under the section entitled “—Potential Payments Upon Termination or Change in Control”. |
The Amended Crisci Agreement also updates and/or removes certain provisions relating to BGLH Restricted Units and LMEP Units previously granted to Mr. Crisci.
Jeffrey Rivera
We and Mr. Rivera are parties to an employment letter, dated April 5, 2022, which provides for Mr. Rivera’s employment as our Chief Operating Officer on an at-will basis. The letter provides for an annual base salary equal to $630,000 per year and provides that Mr. Rivera will report to our Chief Executive Officer.
262
Table of Contents
Outstanding Equity Awards at Year-End Table
The following table sets forth information regarding outstanding unvested incentive equity awards held by our NEOs as of December 31, 2023.
Stock Awards | ||||||||||||||||||||
Equity Incentive Plan Awards: | Equity Incentive Plan Awards: | |||||||||||||||||||
Name | Grant Date | Number of Shares or Units of Stock That Have Not Vested (#) | Market Value of Shares or Units of Stock That Have Not Vested ($)(1) | Number of Unearned Shares, Units or Other Rights That Have Not Vested (#) | Market or Payout Value of Unearned Shares, Units or Other Rights That Have Not Vested ($) | |||||||||||||||
Greg Lehmkuhl | 1/31/2020 | (2) | 187,875 | 1,162,290 | — | — | ||||||||||||||
1/31/2020 | (3) | — | — | 187,875 | 1,162,290 | |||||||||||||||
2/18/2022 | (4) | 12,423 | 1,198,827 | — | — | |||||||||||||||
2/10/2023 | (5) | 16,667 | 1,608,397 | — | — | |||||||||||||||
Rob Crisci | 4/19/2023 | (6) | 1,095,498 | 219,980 | — | — | ||||||||||||||
4/19/2023 | (7) | — | — | 730,335 | 146,654 | |||||||||||||||
4/19/2023 | (8) | 111,111 | 10,722,212 | — | — | |||||||||||||||
Jeffrey Rivera | 3/9/2020 | (9) | 87,674 | 542,396 | — | — | ||||||||||||||
3/9/2020 | (10) | — | — | 43,838 | 271,204 | |||||||||||||||
3/5/2021 | (11) | 31,794 | 72,060 | — | — | |||||||||||||||
3/5/2021 | (12) | — | — | 21,196 | 48,040 | |||||||||||||||
3/29/2022 | (13) | 118,380 | 70,280 | — | — | |||||||||||||||
3/29/2022 | (14) | — | — | 88,785 | 52,710 | |||||||||||||||
Sudarsan Thattai | 2/28/2019 | (15) | 68,024 | 583,794 | — | — | ||||||||||||||
2/28/2019 | (16) | 4,761 | 40,860 | — | — | |||||||||||||||
3/9/2020 | (17) | 50,100 | 309,944 | — | — | |||||||||||||||
3/9/2020 | 1,753 | (18) | 10,845 | (18) | 25,050 | (19) | 154,972 | (19) | ||||||||||||
3/5/2021 | (20) | 69,946 | 158,530 | — | — | |||||||||||||||
3/5/2021 | 1,632 | (21) | 3,699 | (21) | 46,632 | (22) | 105,690 | (22) | ||||||||||||
3/29/2022 | (23) | — | — | 739,850 | 439,235 | |||||||||||||||
3/29/2022 | (24) | 74,000 | 43,932 | — | — | |||||||||||||||
3/29/2022 | 1,295 | (25) | 769 | (25) | 55,500 | (26) | 32,949 | (26) | ||||||||||||
Sean Vanderelzen | 2/28/2019 | (27) | 8,503 | 72,974 | — | — | ||||||||||||||
3/9/2020 | (28) | 50,100 | 309,944 | — | — | |||||||||||||||
3/9/2020 | (29) | — | — | 25,050 | 154,972 | |||||||||||||||
3/5/2021 | (30) | 50,871 | 115,297 | — | — | |||||||||||||||
3/5/2021 | (31) | — | — | 33,914 | 76,865 | |||||||||||||||
3/29/2022 | (32) | 29,600 | 17,573 | — | — | |||||||||||||||
3/29/2022 | (33) | — | — | 22,200 | 13,180 |
(1) | Amounts in this column reflect the value of the applicable LMEP Unit or BGLH Restricted Unit as of December 31, 2023 multiplied by the number of unvested units subject to the applicable award. Neither the LMEP Units or BGLH Restricted Units were publicly traded as of the end of our last fiscal year and, therefore, there was no ascertainable public market value for the units as of December 31, 2023. The value of the units reported is based on the equity value of Lineage Holdings or BGLH, as applicable, derived from an independent third-party valuation of Lineage Holdings as of December 31, 2023. |
(2) | Reflects the unvested portion of an award of Time-Based LMEP Units granted to Mr. Lehmkuhl on January 31, 2020 that vests in five substantially equal annual installments on December 31 of each year from 2020 through 2024. |
(3) | Reflects the unearned portion of an award of Performance-Based LMEP Units granted to Mr. Lehmkuhl on January 31, 2020 that vests based on the attainment of Management Adjusted EBITDA goals over a five |
263
Table of Contents
calendar year period following the date of grant. See “—Elements of Compensation—Equity-Based Long-Term Incentive Awards—LMEP Units.” |
(4) | Reflects the unvested portion of an award of BGLH Restricted Units granted to Mr. Lehmkuhl on February 18, 2022 that vests in three substantially equal annual installments on December 31 of each year from 2022 through 2024. |
(5) | Reflects the unvested portion of an award of BGLH Restricted Units granted to Mr. Lehmkuhl on February 10, 2023 that vests in two substantially equal annual installments on December 31 of each year from 2023 through 2024. |
(6) | Reflects the unvested portion of an award of Time-Based LMEP Units granted to Mr. Crisci on April 19, 2023 that vests in three substantially equal annual installments on each of the first three anniversaries of the grant date. |
(7) | Reflects the unearned portion of an award of Performance-Based LMEP Units granted to Mr. Crisci on April 19, 2023 that vests based on the attainment of individual key performance indicators and Management Adjusted EBITDA goals over a three calendar year period following the date of grant. See “—Elements of Compensation—Equity-Based Long-Term Incentive Awards—LMEP Units.” |
(8) | Reflects the unvested portion of an award of BGLH Restricted Units granted to Mr. Crisci on April 19, 2023 that vests in 18 months of the grant date or an initial public offering of Lineage. |
(9) | Reflects the unvested portion of an award of Time-Based LMEP Units granted to Mr. Rivera on March 9, 2020 that vests in five substantially equal annual installments on each of the first five anniversaries of the grant date. |
(10) | Reflects the unearned portion of an award of Performance-Based LMEP Units granted to Mr. Rivera on March 9, 2020 that vests based on the attainment of individual key performance indicators and Management Adjusted EBITDA goals over a five calendar year period following the date of grant. See “—Elements of Compensation—Equity-Based Long-Term Incentive Awards—LMEP Units.” |
(11) | Reflects the unvested portion of an award of Time-Based LMEP Units granted to Mr. Rivera on March 5, 2021 that vests in five substantially equal annual installments on each of the first five anniversaries of the grant date. |
(12) | Reflects the unearned portion of an award of Performance-Based LMEP Units granted to Mr. Rivera on March 5, 2021 that vests based on the attainment of individual key performance indicators and Management Adjusted EBITDA goals over a five calendar year period following the date of grant. See “—Elements of Compensation—Equity-Based Long-Term Incentive Awards—LMEP Units.” |
(13) | Reflects the unvested portion of an award of Time-Based LMEP Units granted to Mr. Rivera on March 29, 2022 that vests in five substantially equal annual installments on each of the first five anniversaries of the grant date. |
(14) | Reflects the unearned portion of an award of Performance-Based LMEP Units granted to Mr. Rivera on March 29, 2022 that vests based on the attainment of individual key performance indicators and Management Adjusted EBITDA goals over a five calendar year period following the date of grant. See “—Elements of Compensation—Equity-Based Long-Term Incentive Awards—LMEP Units.” |
(15) | Reflects the unvested portion of an award of Time-Based LMEP Units granted to Mr. Thattai on February 28, 2019 that vests in five substantially equal annual installments on each of the first five anniversaries of the grant date. |
(16) | Reflects LMEP Units granted to Mr. Thattai on February 28, 2019 which were previously subject to, but failed to satisfy, pre-established performance goals. Such LMEP Units remain outstanding and eligible to vest in our sole discretion, without regard to any objective performance goals. |
(17) | Reflects the unvested portion of an award of Time-Based LMEP Units granted to Mr. Thattai on March 9, 2020 that vests in five substantially equal annual installments on each of the first five anniversaries of the grant date. |
(18) | Reflects LMEP Units granted to Mr. Thattai on March 9, 2020 which were previously subject to, but failed to satisfy, pre-established performance goals. Such LMEP Units remain outstanding and eligible to vest in our sole discretion, without regard to any objective performance goals. |
(19) | Reflects the unearned portion of an award of Performance-Based LMEP Units granted to Mr. Thattai on March 9, 2020 that vests based on the attainment of individual key performance indicators and Management |
264
Table of Contents
Adjusted EBITDA goals over a five calendar year period following the date of grant. See “—Elements of Compensation—Equity-Based Long-Term Incentive Awards—LMEP Units.” |
(20) | Reflects the unvested portion of an award of Time-Based LMEP Units granted to Mr. Thattai on March 5, 2021 that vests in five substantially equal annual installments on each of the first five anniversaries of the grant date. |
(21) | Reflects LMEP Units granted to Mr. Thattai on March 5, 2021 which were previously subject to, but failed to satisfy, pre-established performance goals. Such LMEP Units remain outstanding and eligible to vest in our sole discretion, without regard to any objective performance goals. |
(22) | Reflects the unearned portion of an award of Performance-Based LMEP Units granted to Mr. Thattai on March 5, 2021 that vests based on the attainment of individual key performance indicators and Management Adjusted EBITDA goals over a five calendar year period following the date of grant. See “—Elements of Compensation—Equity-Based Long-Term Incentive Awards—LMEP Units.” |
(23) | Reflects the unearned portion of an award of Performance-Based LMEP Units granted to Mr. Thattai on March 29, 2022 that vests based on the attainment of individual key performance indicators on the third anniversary of the date of grant. See “—Elements of Compensation—Equity-Based Long-Term Incentive Awards—LMEP Units.” |
(24) | Reflects the unvested portion of an award of Time-Based LMEP Units granted to Mr. Thattai on March 29, 2022 that vests in five substantially equal annual installments on each of the first five anniversaries of the grant date. |
(25) | Reflects LMEP Units granted to Mr. Thattai on March 29, 2022 which were previously subject to, but failed to satisfy, pre-established performance goals. Such LMEP Units remain outstanding and eligible to vest in our sole discretion, without regard to any objective performance goals. |
(26) | Reflects the unearned portion of an award of Performance-Based LMEP Units granted to Mr. Thattai on March 29, 2022 that vests based on the attainment of individual key performance indicators and Management Adjusted EBITDA goals over a five calendar year period following the date of grant. See “—Elements of Compensation—Equity-Based Long-Term Incentive Awards—LMEP Units.” |
(27) | Reflects the unvested portion of an award of Time-Based LMEP Units granted to Mr. Vanderelzen on February 28, 2019 that vests in five substantially equal annual installments on each of the first five anniversaries of the grant date. |
(28) | Reflects the unvested portion of an award of Time-Based LMEP Units granted to Mr. Vanderelzen on March 9, 2020 that vests in five substantially equal annual installments on each of the first five anniversaries of the grant date. |
(29) | Reflects the unearned portion of an award of Performance-Based LMEP Units granted to Mr. Vanderelzen on March 9, 2020 that vests based on the attainment of individual key performance indicators and Management Adjusted EBITDA goals over a five calendar year period following the date of grant. See “—Elements of Compensation—Equity-Based Long-Term Incentive Awards—LMEP Units.” |
(30) | Reflects the unvested portion of an award of Time-Based LMEP Units granted to Mr. Vanderelzen on March 5, 2021 that vests in five substantially equal annual installments on each of the first five anniversaries of the grant date. |
(31) | Reflects the unearned portion of an award of Performance-Based LMEP Units granted to Mr. Vanderelzen on March 5, 2021 that vests based on the attainment of individual key performance indicators and Management Adjusted EBITDA goals over a five calendar year period following the date of grant. See “—Elements of Compensation—Equity-Based Long-Term Incentive Awards—LMEP Units.” |
(32) | Reflects the unvested portion of an award of Time-Based LMEP Units granted to Mr. Vanderelzen on March 29, 2022 that vests in five substantially equal annual installments on each of the first five anniversaries of the grant date. |
(33) | Reflects the unearned portion of an award of Performance-Based LMEP Units granted to Mr. Vanderelzen on March 29, 2022 that vests based on the attainment of individual key performance indicators and Management Adjusted EBITDA goals over a five calendar year period following the date of grant. See “—Elements of Compensation—Equity-Based Long-Term Incentive Awards—LMEP Units.” |
265
Table of Contents
Option Exercises and Stock Vested in 2023
Stock Awards | ||||||||
Name | Number of Shares Acquired on Vesting (#) | Value Realized on Vesting(1) ($) | ||||||
Greg Lehmkuhl | 435,100 | 8,051,813 | ||||||
Rob Crisci | 365,167 | 73,327 | ||||||
Jeffrey Rivera | 174,172 | 1,215,304 | ||||||
Sudarsan Thattai | 275,335 | 2,141,299 | ||||||
Sean Vanderelzen | 121,931 | 1,125,731 |
(1) | Amounts are calculated by multiplying the number of units vested by the value of the applicable LMEP Unit or BGLH Restricted Unit on the vesting date. Neither the LMEP Units or BGLH Restricted Units were publicly traded as of the applicable vesting date and, therefore, there was no ascertainable public market value for the units as of such date. The value of the units reported is based on the equity value of Lineage Holdings or BGLH, as applicable, derived from an independent third-party valuation of Lineage Holdings as of December 31, 2023. |
Nonqualified Deferred Compensation Table
We maintain the Lineage Logistics Holdings, LLC Deferred Compensation Plan (the “Deferred Compensation Plan”) for a select group of our highly compensated employees, in which all of our NEOs are eligible to participate. The following table contains information regarding the Deferred Compensation Plan.
Name | Executive Contributions in Last Year ($)(1) | Registrant Contributions in Last Year ($) | Aggregate Earnings in Last Year ($) | Aggregate Withdrawals/ Distributions ($) | Aggregate Balance at Last Year End ($) | |||||||||||||||
Greg Lehmkuhl | — | — | — | — | — | |||||||||||||||
Rob Crisci | — | — | — | — | — | |||||||||||||||
Jeffrey Rivera | 451,786 | — | 6,261 | — | 458,047 | |||||||||||||||
Sudarsan Thattai | — | — | — | — | — | |||||||||||||||
Sean Vanderelzen | 146,394 | — | 4,070 | — | 150,464 |
(1) | Mr. Rivera’s and Mr. Vanderelzen’s 2023 contribution to the Deferred Compensation Plan consists of a portion of their 2023 annual cash bonus and was made in 2024 (when 2023 annual cash bonuses were determined and paid). The amounts are included as compensation in the “Summary Compensation Table” for 2023. |
Under the Deferred Compensation Plan, eligible employees, including our NEOs, are permitted to defer receipt of a minimum of 10% up to a maximum of 75% of their base salary and a minimum of 10% up to a maximum of 100% of their annual cash bonus, commissions and/or other cash compensation earned during a plan year. The Deferred Compensation Plan also provides for the deferral of awards under the Lineage Logistics Holdings, LLC 2021 Value Creation Unit Plan (the “2021 LVCP”). However, none of our NEOs participate in the 2021 LVCP and consequently, the provisions relating to 2021 LVCP awards are not included in this description of the Deferred Compensation Plan.
The amounts deferred under the Deferred Compensation Plan are deemed to be invested in investment alternatives chosen by the participant from a range of choices established by the plan administrator. The balances of participant accounts are adjusted to reflect the earnings that would have been obtained if the participant contributions had actually been invested in the applicable investment alternatives.
Participants may allocate their deferred compensation to (i) a retirement account or (ii) one or more flex accounts (i.e. separation accounts and specified date accounts). Participants may also elect whether to receive
266
Table of Contents
distributions of their account balances in a single lump sum amount or in annual installments to be paid over a period not to exceed five years (with respect to specified date accounts) or ten years (with respect to retirement and separation accounts).
We may from time to time in our sole discretion, credit discretionary company contributions in the form of matching, profit sharing or other contributions, to any participant’s retirement account, in any amount. Company contributions shall vest on the schedule specified by the plan administrator (unless they are “make-up matching contributions” or “supplemental matching contributions” which vest at the rate provided under the 401(k) plan), and shall become 100% vested if while the participant is employed, such participant dies, becomes disabled, or there is a change in control (as defined in the Deferred Compensation Plan), the participant attains age 65, or accelerated vesting is otherwise provided for by the participating employer.
A participant’s account becomes payable upon the first to occur of the payment date or events applicable to such account, including: (i) the calendar year specified by the participant, (ii) a separation from service, (iii) death, or (iv) an unforeseeable emergency (upon request of participant and approval of the plan administrator). Notwithstanding the foregoing, the plan administrator in its discretion may cash-out small balances and/or accelerate or delay payments to the extent permitted under Section 409A of the Code.
Payment of a participant’s account will be made or commence, as applicable, as follows: (i) in the case of a specified date account, on the first day of the month specified by the participant, (ii) in the case of a separation from service (other than death), in the calendar year following the year in which the separation from service occurs, unless, with respect to a retirement or separation account, the participant elected a later year (specified date account balances will be paid in a single lump sum, regardless of whether payment commenced pursuant to the preceding subclause (i), as of the date of separation from service), (iii) in the case of death (regardless of whether the participant is an employee at the time of death), all remaining vested account balances shall be paid to his or her beneficiary in a single lump sum no later than December 31 of the year following the year in which the participant’s death occurs, (iv) in the case of an unforeseeable emergency, in a single lump sum within the 90-day period following the plan administrator’s approval of the payment. In the case of a change in control (as defined in the Deferred Compensation Plan) of our company, a participant who experiences a separation from service in the same calendar year, or within 24 months following such Change in Control will receive all of their unpaid account balances in a single lump sum in the calendar year following the separation from service.
The Deferred Compensation Plan is administered by our company, which has the authority to appoint or delegate the administration of the plan to a committee. The Deferred Compensation Plan is an unfunded plan for Federal tax purposes and for purposes of Title I of the Employee Retirement Income Security Act of 1974, as amended. A “rabbi trust” has been established to satisfy our obligations under the Deferred Compensation Plan.
Potential Payments Upon Termination or Change in Control
Original Employment Agreement—Mr. Lehmkuhl
Under the Original Lehmkuhl Agreement, in the event of a termination of Mr. Lehmkuhl’s employment by us without cause, or by Mr. Lehmkuhl for good reason (each as defined in the Original Lehmkuhl Agreement), Mr. Lehmkuhl is eligible to receive the following severance payments and benefits:
(i) | a cash amount equal to two times the sum of (A) his then-current annual base salary, and (B) his then-current annual target cash bonus, payable in substantially equal installments in accordance with our customary payroll practices; |
(ii) | a cash amount equal to Mr. Lehmkuhl’s annual bonus that would have otherwise been earned by him for the year in which the termination occurs (determined in accordance with the Original Lehmkuhl Agreement and pro-rated based on the number of days employed during such year) (the “Pro-Rata Annual Bonus”), payable no later than March 15 of the year following the year in which the termination occurs; |
267
Table of Contents
(iii) | company-subsidized healthcare coverage at the same levels as in effect on the date of termination for up to 24 months following the applicable date of termination; and |
(iv) | accelerated vesting of a pro rata portion of the tranche of any then-outstanding LMEP Class C-10 Units that would, absent such termination, have vested on the next subsequent vesting date following the date of termination. |
In the event of a termination of Mr. Lehmkuhl’s employment due to his death or disability (as defined in the Original Lehmkuhl Agreement), Mr. Lehmkuhl is eligible to receive the following severance payments and benefits:
(i) | the Pro-Rata Annual Bonus; and |
(ii) | each then-outstanding award of LMEP Class C-10 Units held by Mr. Lehmkuhl will vest with respect to an aggregate number of LMEP Class C-10 Units equal to (x) the number of LMEP Class C-10 Units that would have vested prior to such termination had 20% of such award vested on each anniversary of the grant date, plus (y) 20% of such award, plus (z) a pro-rated portion of 20% of such award for the year in which the date of his termination occurs, provided that in no event shall the sum of (x), (y) and (z) be greater than 100% of the award. |
Amended Employment Agreement—Mr. Lehmkuhl
In connection with this offering, we intend to enter into the Amended Lehmkuhl Agreement. We expect that under the Amended Lehmkuhl Agreement, in the event of a termination of Mr. Lehmkuhl’s employment by our company without cause or by Mr. Lehmkuhl for good reason (each as defined in the Amended Lehmkuhl Agreement), Mr. Lehmkuhl will be eligible to receive the following severance payments and benefits:
• | (i) a cash amount equal to two times (2x) (or, in the event such termination occurs on or within 18 months following a “change in control” (as defined in the 2024 Plan), three times (3x)) the sum of (A) his then current annual base salary and (B) his then-current target annual cash bonus, payable in substantially equal installments in accordance with the company’s customary payroll practices; |
• | (ii) the Pro-Rata Annual Bonus, plus any unpaid annual cash bonus for any prior completed year (the “Prior Year Bonus”), payable no later than March 15 of the year following the year in which the termination occurs; and |
• | (iii) company-subsidized healthcare coverage at the same levels as in effect on the date of termination for up to 24 months (or, in the event such termination occurs on or within 18 months following a change in control, 36 months) following the applicable date of termination. |
In addition, we expect that the Amended Lehmkuhl Agreement will provide that in the event of a termination of Mr. Lehmkuhl’s employment due to his death, disability, family disability or retirement (each as defined in the Amended Lehmkuhl Agreement), Mr. Lehmkuhl will be eligible to receive the Pro-Rata Annual Bonus, plus any Prior Year Bonus, as set forth above.
In consideration of the severance payments and benefits described above, Mr. Lehmkuhl will be required to execute a general release of claims in favor of the company and its affiliates.
Original Employment Agreement—Mr. Crisci
Under the Original Crisci Agreement, in the event of a termination of Mr. Crisci’s employment by us without cause, or by Mr. Crisci for good reason (each as defined in the Original Crisci Agreement), Mr. Crisci is eligible to receive an amount equal to the sum of (i) his then-current annual base salary, and (ii) his then-current target annual cash bonus, payable in substantially equal installments in accordance with our customary payroll practices.
268
Table of Contents
In the event of a termination of Mr. Crisci’s employment upon the expiration of the Original Crisci Agreement, Mr. Crisci is entitled to any unpaid annual cash bonus earned in respect of the calendar year immediately preceding the year of expiration, payable in a lump-sum.
Mr. Lehmkuhl’s and Mr. Crisci’s eligibility to receive the severance payments and benefits described above upon certain qualifying terminations of employment, as described above, is subject to the applicable NEO’s (i) timely execution and non-revocation of a general release of claims in favor of our company and (ii) continued compliance with the restrictive covenant obligations described above under “—Narrative to Summary Compensation Table and Grants of Plan-Based Awards Table—Named Executive Officer Employment Agreements.”
Amended Employment Agreement—Mr. Crisci
In connection with this offering, we intend to enter into the Amended Crisci Agreement. We expect that under the Amended Crisci Agreement, in the event of a termination of Mr. Crisci’s employment by the company without cause or by Mr. Crisci for good reason (each as defined in the Amended Crisci Agreement), Mr. Crisci will be eligible to receive the following severance payments and benefits:
• | (i) a cash amount equal to one times (1x) (or, in the event that such termination occurs on or within 18 months following a change in control, one and one-half times (1.5x)) the sum of (A) his then-current annual base salary and (B) his then-current target annual cash bonus, payable in substantially equal installments in accordance with the company’s customary payroll practices; |
• | (ii) any Prior Year Bonus, payable no later than 60 days following the termination date; and |
• | (iii) company-subsidized healthcare coverage at the same levels as in effect on the date of termination for up to 12 months (or, in the event that such termination occurs on or within 18 months following a change in control, 18 months) following the applicable date of termination. |
In addition, we expect that the Amended Crisci Agreement will provide that in the event of a termination of Mr. Crisci’s employment upon the expiration of his amended Employment Agreement, or due to his death, disability, or retirement (each as defined in his Amended Crisci Agreement), Mr. Crisci will be eligible to receive the Prior Year Bonus, payable no later than 60 days following the termination date.
In consideration of the severance payments and benefits described above, Mr. Crisci will be required to execute a general release of claims in favor of the company and its affiliates.
Letter Agreement—Mr. Thattai
We are a party to a letter agreement, dated February 19, 2012, with Mr. Thattai, which provides that in the event of a termination of Mr. Thattai’s employment other than by us for cause, Mr. Thattai will be entitled to continued base salary and employee benefits for a period of six months following the date of termination (or ending on such earlier date on which he accepts employment with a subsequent employer). In the event of a termination by Mr. Thattai, such severance payments and benefits are conditioned on Mr. Thattai’s continued support of our company during the severance period.
LMEP Awards
If a NEO’s service relationship is terminated by us for any reason other than for “cause,” LLH MGMT Profits, LLC or LLH MGMT Profits II, LLC, as applicable, will have the option to purchase the vested LMEP Units at fair market value at any time within six months after the date of such termination.
If a NEO’s service relationship is terminated as a result of his death or disability (as defined in the applicable award agreement), then subject to the timely execution and non-revocation of a release of claims in
269
Table of Contents
favor of LLH MGMT Profits, LLC or LLH MGMT Profits II, LLC, as applicable, Lineage and their affiliates, the LMEP Units will vest on an accelerated basis with respect to an aggregate number of LMEP Units equal to (x) 33% or 20% (depending on whether the time-vesting schedule of the award is a three-year or five-year period) of the total Time-Based LMEP Units, plus (y) a pro-rated portion of 33% or 20% of the Time-Based LMEP Units for the year in which the date of such termination occurs, provided that in no event shall the sum of (x) and (y) be greater than 100% of the total time-based vesting LMEP Units subject to the award.
In the event of an exit transaction, all Time-Based LMEP Units will, subject to the applicable NEO’s timely execution and non-revocation of a release in favor of LLH MGMT Profits, LLC or LLH MGMT Profits II, LLC, as applicable, Lineage and their affiliates, vest upon the earlier to occur of (i) the exit transaction, unless the successor buyer agrees to continue the NEO’s service relationship on terms that are not materially worse, in the aggregate, for the NEO than those applicable to the NEO immediately prior to the exit transaction, and (ii) if the successor buyer agrees to continue the NEO’s service relationship on terms that are not materially worse, in the aggregate, for the NEO than those applicable to the NEO immediately prior to the exit transaction, the date on which the NEO’s service relationship is terminated following an exit transaction for any reason other than a termination of the service relationship (x) by the NEO for any reason, (y) by us or any of our affiliates for Cause or (z) due to death or disability.
In the event of an exit transaction, (i) all Performance-Based LMEP Units that first become eligible to vest in the calendar year in which the closing of the exit transaction occurs, will, subject to the applicable NEO’s timely execution and non-revocation of a release in favor of LLH MGMT Profits, LLC or LLH MGMT Profits II, LLC, applicable, Lineage and their affiliates, vest immediately prior to such closing (irrespective of the achievement of performance criteria); and (ii) all unvested Performance-Based LMEP Units subject to performance vesting in subsequent years will be forfeited. If the exit transaction generates net proceeds in excess of certain specified thresholds, any outstanding Performance-Based LMEP Units that failed to vest in prior years will vest in full upon the occurrence of such exit transaction.
270
Table of Contents
Estimated Potential Payments
The following table summarizes the payments that would be made to our NEOs upon the occurrence of certain qualifying terminations of employment or a change in control, in any case, occurring on December 31, 2023. Amounts shown do not include (i) accrued but unpaid base salary through the date of termination or (ii) other benefits earned or accrued by the NEO during his employment that are available to all salaried employees, such as accrued vacation.
Name | Benefits | Termination Without Cause or for Good Reason (no Change in Control) ($) | Change in Control (no Termination) ($) | Termination Without Cause or for Good Reason in Connection with a Change in Control ($) | Termination due to Death or Disability ($) | Other Terminations ($) | ||||||||||||||||
Greg Lehmkuhl | Cash Severance | 10,364,950 | — | 10,364,950 | 3,764,950 | — | ||||||||||||||||
Equity Acceleration(1) | — | 1,162,209 | 2,324,580 | 2,324,580 | — | |||||||||||||||||
Continued Healthcare(2) | 48,789 | — | 48,789 | — | — | |||||||||||||||||
|
|
|
|
|
|
|
|
|
| |||||||||||||
Total | 10,413,739 | 1,162,290 | 12,738,319 | 6,089,530 | — | |||||||||||||||||
|
|
|
|
|
|
|
|
|
| |||||||||||||
Rob Crisci | Cash Severance | 1,575,000 | — | 1,575,000 | — | — | ||||||||||||||||
Equity Acceleration(1) | — | 73,327 | 239,307 | 73,327 | — | |||||||||||||||||
Continued Healthcare | — | — | — | — | — | |||||||||||||||||
|
|
|
|
|
|
|
|
|
| |||||||||||||
Total | 1,575,000 | 73,327 | 1,868,307 | 73,327 | — | |||||||||||||||||
|
|
|
|
|
|
|
|
|
| |||||||||||||
Jeffrey Rivera | Cash Severance | — | — | — | — | — | ||||||||||||||||
Equity Acceleration(1) | — | 312,794 | 997,530 | 312,788 | — | |||||||||||||||||
Continued Healthcare | — | — | — | — | — | |||||||||||||||||
|
|
|
|
|
|
|
|
|
| |||||||||||||
Total | — | 312,794 | 997,530 | 312,788 | — | |||||||||||||||||
|
|
|
|
|
|
|
|
|
| |||||||||||||
Sudarsan Thattai | Cash Severance | 315,000 | — | 315,000 | 315,000 | 315,000 | ||||||||||||||||
Equity Acceleration(1) | — | 858,767 | 1,954,968 | 802,592 | — | |||||||||||||||||
Continued Benefits(3) | 14,437 | — | 14,437 | 14,437 | 14,437 | |||||||||||||||||
|
|
|
|
|
|
|
|
|
| |||||||||||||
Total | 329,437 | 858,767 | 2,284,405 | 1,132,029 | 329,437 | |||||||||||||||||
|
|
|
|
|
|
|
|
|
| |||||||||||||
Sean Vanderelzen | Cash Severance | — | — | — | — | — | ||||||||||||||||
Equity Acceleration(1) | — | 270,772 | 786,561 | 270,772 | — | |||||||||||||||||
Continued Healthcare | — | — | — | — | — | |||||||||||||||||
|
|
|
|
|
|
|
|
|
| |||||||||||||
Total | — | 270,772 | 786,561 | 270,772 | — | |||||||||||||||||
|
|
|
|
|
|
|
|
|
|
(1) | Equity Acceleration values for LMEP Units are based on the equity value of Lineage Holdings derived from an independent third-party valuation of Lineage Holdings as of December 31, 2023, and, with respect to performance-vesting awards, assume that the applicable performance goals would have been satisfied as of the date of the triggering event. |
271
Table of Contents
(2) | For Mr. Lehmkuhl, amounts reflect the value of 24 months of healthcare coverage using our 2024 COBRA premium rate. |
(3) | Pursuant to Mr. Thattai’s letter agreement, in the event of a termination of his employment for any reason other than by us for cause, Mr. Thattai will be entitled to continued base salary and employee benefits for a period of six months following the date of termination. The amount included for employee benefits reflects our 2024 premium rates for group health, life, long-term disability, and accidental death and dismemberment insurance. |
Executive Severance Plan
In connection with this offering, we intend to adopt the Severance Plan, and expect that each of Messrs. Rivera, Thattai and Vanderelzen will be a participant in the Severance Plan. Messrs. Lehmkuhl and Crisci will not participate in the Severance Plan. The description below summarizes the expected material terms of the Severance Plan.
In connection with the adoption of the Severance Plan, the company expects to enter into a participation agreement with each of the applicable executives with respect to their participation in the Severance Plan. Pursuant to the participation agreement, any prior employment agreement or offer letter between the participant and us (or any of our affiliates) will terminate.
Under the Severance Plan and the applicable participation agreement, in the event that Mr. Rivera’s, Thattai’s or Vanderelzen’s employment with the company is terminated by the company without cause (other than by reason of death or disability) or by the participant for good reason (each, as defined in the Severance Plan), the participant will be entitled to receive the following:
• | A severance payment in an amount equal to one times (1x) (or, in the event that such termination occurs on or within 18 months following a “change in control” (as defined in the Severance Plan), one and one-half times (1.5x)) the sum of (A) the participant’s annual base salary and (B) the participant’s target annual bonus, payable in a lump-sum cash payment within 60 days following the participant’s termination date; |
• | Any Prior Year Bonus, payable in a lump-sum cash payment within 60 days following the participant’s termination date; and |
• | Payment or reimbursement by the company of premiums for healthcare continuation coverage under COBRA for the participant and his or her dependents for up to 12 months (or, in the event that such termination occurs on or within 18 months following a change in control, 18 months) after the termination date. |
In addition, in the event that Mr. Rivera’s, Mr. Thattai’s or Mr. Vanderelzen’s employment with the company is terminated due to the participant’s death, disability or retirement (each as defined in the Severance Plan), the participant will be eligible to receive the Prior Year Bonus, payable no later than 60 days following the termination date.
A participant’s right to receive the severance or other benefits described above will be subject to the participant signing, delivering and not revoking a general release agreement in a form generally used by the company.
The Severance Plan further provides that, to the extent that any payment or benefit received by a participant in connection with a change in control (as defined in the Severance Plan) would be subject to an excise tax under Section 4999 of the Code, as amended, such payments and/or benefits will be subject to a “best pay cap” reduction if such reduction would result in a greater net after-tax benefit to the participant than receiving the full amount of such payments.
Each participation agreement entered into with the applicable executives will contain a confidentiality covenant by the executive that extends indefinitely, a non-disparagement covenant, a noncompetition covenant that
272
Table of Contents
extends during the Executive’s employment and for a period of two years following a termination of the executive’s employment, and a service provider and customer non-solicitation covenant that extends during the Executive’s employment and for a period of two years following a termination of the executive’s employment.
The company may amend or terminate the Severance Plan at any time and for any reason, provided that a participant’s right to receive payments and benefits under the Severance Plan may not, without the participant’s written consent, be adversely affected by an amendment or termination of the Severance Plan made within 12 months prior to the participant’s termination of employment or within 12 months before and after a change of control. The company is required to provide notice to participants within 15 days of any amendment or termination of the Severance Plan.
Amended and Restated Lineage 2024 Incentive Award Plan
On April 24, 2024, our board of directors adopted, and BGLH (as our sole common stockholder) approved, the Lineage 2024 Incentive Award Plan. In connection with this offering, we intend to adopt, subject to approval by BGLH (as our sole common stockholder), an amendment and restatement of the 2024 Plan, under which we may grant cash and equity-based incentive awards to eligible service providers in order to attract, motivate and retain the talent for which we compete. The 2024 Plan authorizes the plan administrator to provide equity-based compensation in the form of stock options, stock appreciation rights, restricted stock, restricted stock units, performance share awards, dividend equivalents, LTIP units of our operating partnership and other stock or cash based awards to eligible service providers. The following summarizes the expected material terms of the 2024 Plan.
Administration
Prior to the closing of this offering, the 2024 Plan will be administered by the board of directors. From and after the closing of this offering, the 2024 Plan will be administered by the compensation committee or another committee or subcommittee appointed by the board of directors (or, with respect to awards granted to our non-employee directors, by the board of directors). Unless otherwise determined by the board of directors, the committee that administers the 2024 Plan will consist solely of two or more non-employee directors, each of whom is intended to qualify as a “non-employee director” as defined by Rule 16b-3 of the Exchange Act and an “independent director” under applicable stock exchange rules. All awards granted to individuals who are subject to Section 16 of the Exchange Act will be granted and administered by the the full board of directors or by action of two or more “non-employee directors” (within the meaning of Rule 16b-3 of the Exchange Act). The board of directors or the compensation committee may delegate its authority to a committee of one or more members of the board of directors or one or more of our officers, other than with respect to awards held by individuals who are subject to Section 16 of the Exchange Act or our officers (or directors) to whom authority to grant or amend awards has been delegated.
Eligibility
Any employee or consultant of our company, our operating partnership or any subsidiary of our company or our operating partnership and any non-employee director of our company is eligible to be granted awards under the 2024 Plan.
Share Authorization
The 2024 Plan provides that the maximum aggregate number of shares of common stock that may be issued pursuant to awards is equal to the sum of (i) 12,500,000 shares and (ii) an annual increase on the first day of each calendar year beginning on and including January 1, 2025 and ending on and including January 1, 2034 equal to (A) a number of shares equal to 1% of the sum of (I) the aggregate number of shares of our common stock outstanding on the final day of the immediately preceding calendar year, plus (II) the aggregate number of OP units (other than OP units that are held by the company and other than any OP units resulting from the conversion of LTIP units) outstanding on the final day of the immediately preceding calendar year, plus (III) the aggregate number of OPEUs
273
Table of Contents
outstanding on the final day of the immediately preceding calendar year, plus (IV) the aggregate number of Legacy OP Units outstanding on the final day of the immediately preceding calendar year, or (B) such smaller number of shares as is determined by the board of directors. The maximum number of shares of common stock that may be issued in connection with awards of ISOs under the 2024 Plan is 12,500,000 shares. Each LTIP unit of our operating partnership subject to an award will count as one share for purposes of calculating the aggregate number of shares available for issuance under the 2024 Plan and for purposes of calculating the non-employee director award limits under the 2024 Plan. The sum of any cash compensation and the value (determined as of the date of grant) of awards that may be granted to any non-employee director during any calendar year may not exceed $1,000,000.
If shares subject to an award under the 2024 Plan are forfeited, expire or are settled for cash, any shares subject to such award may, to the extent of such forfeiture, expiration or cash settlement, be used for new grants under the 2024 Plan. Prior to the tenth anniversary of the effective date of the 2024 Plan, shares tendered or withheld to satisfy the exercise or purchase price or tax withholding obligation for any award will become or again be available for award grants under the 2024 Plan. Further, the payment of dividend equivalents in cash in conjunction with any awards under the 2024 Plan will not reduce the shares available for grant under the 2024 Plan. However, shares purchased on the open market with the cash proceeds from the exercise of an option may not be used again for a grant under the 2024 Plan.
To the extent permitted under applicable securities exchange rules without stockholder approval, awards granted under the 2024 Plan in connection with the assumption, replacement, conversion or adjustment of outstanding equity awards in the context of a corporate acquisition or merger will not reduce the shares authorized for grant under the 2024 Plan.
Awards
• | Stock Options. Stock options provide for the purchase of shares of our common stock in the future at an exercise price set on the grant date. The exercise price of a stock option cannot be less than 100% of the fair market value of the shares of common stock on the date the stock option is granted (or 110% in the case of ISOs granted to certain significant stockholders) except with respect to certain substitute options granted in connection with a corporate transaction. The maximum period in which an option may be exercised will be fixed by the plan administrator but cannot exceed ten years (or five years in the case of ISOs granted to certain significant stockholders). Vesting conditions determined by the plan administrator may apply to stock options and may include continued service, performance and/or other conditions. |
• | Restricted Stock Units. Restricted stock units (“RSUs”) are contractual promises to deliver shares of our common stock (or the fair market value of such shares in cash) in the future, which may also remain forfeitable unless and until specified vesting conditions are met. RSUs generally may not be sold or transferred until vesting conditions are removed or expire. The shares underlying RSUs will not be issued until the RSUs have vested, and recipients of RSUs generally will have no voting or dividend rights prior to the time the RSUs are settled in shares, unless the RSU includes a dividend equivalent right (in which case the holder may be entitled to dividend equivalent payments under certain circumstances). Delivery of the shares underlying the RSUs may be deferred under the terms of the award or at the election of the participant if the plan administrator permits such a deferral. On the settlement date or dates, we will issue to the participant one unrestricted, fully transferable share of our common stock (or the fair market value of one such share in cash) for each vested and nonforfeited RSU. |
• | Restricted Stock Awards. Restricted stock is an award of nontransferable shares of our common stock that remain forfeitable unless and until specified vesting conditions are met. Vesting conditions applicable to restricted stock may be based on continued service, the attainment of performance goals and/or such other conditions as the plan administrator may determine. With respect to restricted stock that is subject to performance-based vesting, dividends which are paid prior to vesting may only be paid to the participant to the extent that the performance-based vesting conditions are subsequently |
274
Table of Contents
satisfied. In general, restricted stock may not be sold or otherwise transferred until all restrictions are removed or expire. |
• | Stock Appreciation Rights. A SAR is an award that entitles its holder, upon exercise, to receive an amount equal to the appreciation of the shares subject to the award between the grant date and the exercise date. The exercise price of a SAR may not be less than 100% of the fair market value of the underlying share on the date of grant (except with respect to certain substitute SARs granted in connection with a corporate transaction) and the term of a SAR may not be longer than ten years. Vesting conditions determined by the plan administrator may apply to SARs and may include continued service, performance and/or other conditions. SARs under the 2024 Plan will be settled in cash or shares of common stock, or in a combination of both, as determined by the plan administrator. |
• | Stock Payments. Stock payments are awards of fully vested shares of our common stock that may, but need not, be made in lieu of base salary, bonuses, fees or other cash compensation otherwise payable to any individual who is eligible to receive awards. Stock payments also include the issuance of shares of our common stock in exchange for, upon, or in connection with, the redemption or settlement of awards of LMEP Units and/or OP units or Legacy OP Units issued in respect of LMEP Units. |
• | Performance Share Awards. Performance share awards represent the right to receive a number (or a range) of shares or the fair market value of such number of shares in cash, the vesting of which may be based on the attainment of specified performance criteria or other criteria, as determined by the plan administrator. |
• | LTIP Units. LTIP units are awards of units of our operating partnership intended to constitute “profits interests” within the meaning of the relevant IRS Revenue Procedure guidance. LTIP units may be granted under the 2024 Plan to the extent authorized under the operating agreement of the operating partnership. |
• | Dividend Equivalents. Dividend equivalents represent the right to receive the equivalent value of dividends paid on shares of our common stock and may be granted alone or in tandem with awards other than stock options or SARs. Dividend equivalents are credited as of dividend payment dates during the period between a specified date and the date such award terminates or expires, as determined by the plan administrator. Dividend equivalents with respect to an award that is subject to performance-based vesting that are based on dividends paid prior to the vesting of the award may only be paid to the participant to the extent that the performance-based vesting conditions are subsequently satisfied. |
• | Other Incentive Awards. Other incentive awards are awards (including cash bonus awards) other than those enumerated in this summary that are denominated in cash or shares, or are otherwise linked to or derived from shares of our common stock or value metrics related to our shares, and may remain forfeitable unless and until specified conditions are met. |
Foreign Participants, Clawback Provisions, Transferability and Participant Payments
The plan administrator may modify award terms, establish subplans and/or adjust other terms and conditions of awards, subject to the non-employee director share limit described above, in order to facilitate grants of awards subject to the laws and/or stock exchange rules of countries outside of the United States.
All awards granted under the 2024 Plan will be subject to the provisions of any clawback policy implemented by our company to the extent set forth in such clawback policy and/or in the applicable award agreement.
With limited exceptions for estate planning, domestic relations orders, certain beneficiary designations and the laws of descent and distribution, awards under the 2024 Plan are generally non-transferable prior to vesting, and are exercisable only by the participant, unless otherwise provided by the plan administrator.
275
Table of Contents
With regard to tax withholding, exercise price and purchase price obligations arising in connection with awards under the 2024 Plan, the plan administrator may, in its discretion, accept cash or check, shares of our common stock held by the participant or that are otherwise issuable pursuant to the award, a “market sell order” or such other consideration as it deems suitable.
Amendment and Termination
The board of directors may amend or terminate the 2024 Plan at any time, provided that, except in connection with certain changes in our capital structure, stockholder approval will be required for any amendment that (i) increases the aggregate number of shares available under the 2024 Plan or the non-employee director award limit under the 2024 Plan, (ii) reduces the price per share of any stock option or SAR, or (iii) cancels any stock option or SAR in exchange for cash or another award when the option or SAR price per share exceeds the fair market value of the underlying shares. In addition, no amendment, suspension or termination of the 2024 Plan may, without the consent of the affected participant, materially impair any rights or obligations under any previously-granted award, unless the award itself otherwise expressly so provides. The 2024 Plan will remain in effect until the 10th anniversary of the date the board of directors adopted the 2024 Plan or, if earlier, the date our stockholders approved the 2024 Plan.
Certain Transactions
The plan administrator has broad discretion to take action under the 2024 Plan, as well as make adjustments to the terms and conditions of existing and future awards, to prevent the dilution or enlargement of intended benefits and facilitate necessary or desirable changes in the event of certain transactions and events affecting our common stock, such as stock dividends, stock splits, mergers, acquisitions, consolidations and other corporate transactions. Such actions may include, without limitation, providing for the assumption, substitution, replacement and/or accelerated vesting of awards, or providing for the termination of awards, including in exchange for the consideration received by other equityholders of our company in such transaction.
In addition, in the event of certain non-reciprocal transactions with our stockholders known as “equity restructurings,” the plan administrator will make equitable adjustments to the 2024 Plan and outstanding awards. In the event of a “change in control” of our company (as defined in the 2024 Plan), to the extent awards are not continued, converted, assumed or replaced by the surviving or successor entity, such awards will become fully vested and, as applicable, exercisable in connection with the transaction (with the performance conditions of awards subject to performance-based vesting deemed satisfied at the actual achievement of applicable performance goals through the date of such transaction, or if the plan administrator determines that such actual achievement cannot reasonably be determined, target level of performance, unless specifically provided otherwise under the applicable award agreement).
REIT Status
No award will be granted or awarded, and no award will vest, be exercisable or be settled to the extent that the grant, vesting, exercise or settlement of such award could cause the participant or any other person to be in violation of the REIT ownership limits in our charter or if the grant, vesting, exercise or settlement of such award could impair our status as a REIT.
Equity Awards in Connection with the IPO
In connection with the completion of this offering, in addition to the RSUs and LTIP units granted with respect to LMEP Units as described above under “Treatment of LMEP Units and BGLH Restricted Units in Connection with this Offering,” we intend to grant certain equity-based awards to our employees and members of our board and/or settle certain previously granted equity-based awards, each as more fully described below.
276
Table of Contents
LVCP Awards
Certain employees and former employees, other than our NEOs, hold awards of “value creation units” under the LVCP Plans. Certain LVCP Awards will vest and be settled in shares of our common stock in connection with the consummation of this offering. LVCP Awards that are not settled in shares of our common stock will be settled in cash, in our discretion. Unless otherwise determined by us, unvested LVCP Awards held by employees will terminate in connection with this offering. In connection with this offering and, in part, the termination of outstanding and unvested LVCP Awards, we will grant one-time equity-based awards under the 2024 Plan in the form of RSUs covering shares of our common stock that will be subject to vesting based on continued employment over a period of up to three years (“LVCP Replacement RSUs”). None of our NEOs holds any LVCP Awards.
The aggregate number of shares of our common stock issuable in respect of any LVCP Awards that are settled in shares of our common stock in connection with the completion of this offering will be approximately 179,838 shares. We expect that the maximum number of LVCP Replacement RSUs granted will be approximately 657,190 RSUs.
Executive and Employee IPO Awards
In connection with the completion of this offering, we intend to grant awards under the 2024 Plan to certain of our employees (including our NEOs) in the form of cash, shares of our common stock or RSUs (the “IPO Awards”). Such IPO Awards may be fully vested at the time of grant or may be subject to vesting over a period of up to three years following the completion of this offering, subject to the grantee’s continued employment on the vesting date. The aggregate number of shares of our common stock or RSUs (as applicable) subject to the IPO Awards will be approximately 1,547,194 shares.
Each of our NEOs may elect to receive a portion of their IPO Award in cash instead of shares of our common stock. The number of shares and the cash amounts subject to the IPO Awards granted to each of our NEOs will be fully vested and are set forth in the table below.
Name | NEO IPO Awards of Shares (#) | Cash NEO IPO Awards ($) | ||||||
Greg Lehmkuhl | — | $ | 4,000,000 | |||||
Rob Crisci | — | $ | 1,250,000 | |||||
Jeffrey Rivera | 8,224 | $ | 625,000 | |||||
Sudarsan Thattai | — | $ | 1,250,000 | |||||
Sean Vanderelzen | 16,448 | $ | — |
Annual Equity-Based Awards
In connection with the completion of this offering, we intend to grant certain employees, including our NEOs, equity-based awards under the 2024 Plan as part of our annual equity award program, consisting of time-vesting and performance-vesting LTIP units in our operating partnership and/or RSUs covering shares of our common stock (“annual awards”). LTIP units are subject to the applicable terms and conditions of the partnership agreement of our operating partnership, and will be eligible to receive certain distributions from our operating partnership, as described further in the section titled, “Description of the Partnership Agreement of Lineage OP, LP.”
The aggregate number of LTIP units and/or RSUs subject to all 2024 annual awards is expected to be approximately 2,795,833 (assuming maximum performance for performance vesting awards), including awards in the amounts set forth in the table below to our NEOs. Each of our NEOs may elect to receive their 2024 annual awards in the form of LTIP Units, RSUs or a combination of LTIP Units and RSUs. To drive long-term value creation and ensure long-term retention of our NEOs, it is currently anticipated that the annual equity-based
277
Table of Contents
awards granted to our NEOs in connection with this offering represent a single award that is intended to cover multiple years of annual equity-based awards to the NEOs.
Name | LTIP Units (#)* | RSUs (#)* | ||||||
Greg Lehmkuhl | 1,214,607 | — | ||||||
Rob Crisci | 238,159 | — | ||||||
Jeffrey Rivera | 71,448 | — | ||||||
Sudarsan Thattai | 238,159 | — | ||||||
Sean Vanderelzen | 83,357 | — |
* | Includes all time-vesting and performance-vesting awards. For performance-vesting awards, assumes maximum performance. |
Time-Vesting Annual Awards
Pursuant to the time-vesting annual awards granted to our NEOs, each executive will be eligible to vest in a number of LTIP units and/or RSUs (as applicable) based on the executive’s continued service with the company.
Each time-vesting award will vest in annual installments over a period of three years, subject to the executive’s continued service through the applicable vesting date.
If an executive’s service is terminated by us other than for cause, by the executive for good reason, or due to the executive’s retirement, death, disability or, if applicable, a non-renewal of the executive’s employment agreement by the company or a family disability (each as defined in the applicable award agreement, a “qualifying termination”), in any case, the time-vesting annual awards will vest with respect to an additional number of LTIP units and/or RSUs (as applicable) that would have vested had the executive remained in continuous service through the first regularly scheduled vesting date following the date of such termination.
Upon an executive’s termination of service for any other reason, any then-unvested LTIP units or RSUs (as applicable) subject to the time-vesting award will automatically be cancelled and forfeited by the executive.
Each time-vesting RSU award will be granted in tandem with corresponding dividend equivalents (“Dividend Equivalents”) entitling the executive to receive payments equal to the dividends paid (if any) on the shares of our common stock underlying RSUs that become vested. Payments in respect of such Dividend Equivalents will be accumulated and made only to the extent that the applicable RSU becomes vested, and will be paid following the applicable vesting date.
The table below sets forth the number of time-vesting LTIP units and/or RSUs that will be granted as annual awards to each of our NEOs in connection with the completion of this offering:
Name | Time-Vesting LTIP Units (#) | Time-Vesting RSUs (#) | ||||||
Greg Lehmkuhl | 268,422 | — | ||||||
Rob Crisci | 52,632 | — | ||||||
Jeffrey Rivera | 15,790 | — | ||||||
Sudarsan Thattai | 52,632 | — | ||||||
Sean Vanderelzen | 18,422 | — |
Performance-Vesting Annual Awards
Pursuant to the performance-vesting annual awards granted to our NEOs, each executive is eligible to vest in a number of LTIP units and/or RSUs (as applicable) ranging from 0% to 100% of the total number of LTIP units granted (which will be equal to the maximum number of units that may vest) or 0% to 200% of the total number of RSUs granted (which will be equal to the target number of units that may vest), based on the
278
Table of Contents
company’s attainment of specified performance goals relating to (i) adjusted core funds from operations (“AFFO per share”); (ii) same warehouse net operating income (“NOI”) growth; and (iii) the company’s relative total shareholder return (“TSR”), during the performance period commencing on January 1, 2024 (for the AFFO per share and NOI goals) or the date of the completion of this offering (for the relative TSR goal), and ending on December 31, 2026 (the “Performance Periods”), subject to the executive’s continued service with the company.
The table below sets forth the number of performance-vesting LTIP units and/or RSUs (as applicable) that will be granted as annual awards to each of our NEOs in connection with the completion of this offering.
Performance-Vesting LTIP Units (1) (2) | ||||||||||||
Name | Total LTIP Units (#) | “Base” LTIP Units (#) | Performance-Vesting RSUs (#) (2)(3) | |||||||||
Greg Lehmkuhl | 946,185 | 805,264 | — | |||||||||
Rob Crisci | 185,527 | 157,895 | — | |||||||||
Jeffrey Rivera | 55,658 | 47,369 | — | |||||||||
Sudarsan Thattai | 185,527 | 157,895 | — | |||||||||
Sean Vanderelzen | 64,935 | 55,264 | — |
(1) | Represents the number of LTIP units based on maximum performance, which is the number of LTIP units subject to the award at the time of grant. The LTIP units included in the “Total LTIP Units” column that are not “base” LTIP units will be distribution equivalent units (as defined and described below) that will vest, if at all, following the end of the applicable Performance Period based upon the number of base LTIP units that become performance-vested, as described below. |
(2) | Sixty percent (60%) of the base LTIP units and/or RSUs (as applicable) will be eligible to vest with respect to the AFFO per share goals (the “AFFO per share units”), and forty percent (40%) of the base LTIP units and/or RSUs (as applicable) will be eligible to vest with respect to the NOI goals (the “NOI units”). |
(3) | Represents the number of RSUs based on target performance, which is the number of RSUs subject to the award at the time of grant. |
In the event that the company achieves AFFO per share and/or same warehouse NOI growth during the applicable Performance Period at the “threshold,” “target” or “maximum” level as specified in the applicable award agreement, a number of AFFO per share units and NOI units (as applicable) will become performance-vested with respect to a percentage of such units, as set forth in the table below. Because the number of LTIP units granted is based on maximum performance and the number of RSUs granted is based on target performance, the vesting percentages applicable to each award have been scaled proportionally in order to reflect the number of units granted.
Performance Vesting Percentage (RSUs) | Performance Vesting Percentage (Base LTIP Units) | |||||||
Below “Threshold Level” | 0 | % | 0 | % | ||||
“Threshold Level” | 50 | % | 25 | % | ||||
“Target Level” | 100 | % | 50 | % | ||||
“Maximum Level” | 200 | % | 100 | % |
The number of LTIP units and/or RSUs that performance-vest based on the foregoing will be modified by multiplying such number of units by a percentage determined in accordance with the following table, based on the company’s TSR relative to the TSR of the S&P 500 over the applicable Performance Period:
S&P 500 Index Relative TSR Performance | Modifying Percentage | |||||||
“Threshold Level” | ≤ | 25th Percentile | 80 | % | ||||
“Target Level” | 50th Percentile | 100 | % | |||||
“Maximum Level” | ≥ | 75th Percentile | 120 | % |
279
Table of Contents
In the event that the applicable performance goal is achieved at less than the “threshold” level, none of the applicable LTIP units and/or RSUs (as applicable) will vest. If the applicable performance goal falls between the levels specified above, the performance-vesting percentage or modifying percentage (as applicable) will be determined using straight-line linear interpolation between such levels.
With respect to each performance-vesting award of LTIP units, an additional number of LTIP units subject to the award (the “distribution equivalent units”) having a value equal to the dividends declared during the Performance Period in respect of the shares of our common stock corresponding to the base units that become performance vested (less any actual distributions made with respect to such units) will vest as of the completion of the Performance Period. For purposes of calculating the number of distribution equivalent units, the dividend amount will be adjusted (plus or minus) to reflect the gain or loss on such amount had the dividends been reinvested in shares of our common stock on the applicable payment dates. Any distribution equivalent units that do not become vested and earned will be cancelled and forfeited upon the completion of the Performance Period.
Each performance-vesting RSU award will be granted in tandem with corresponding Dividend Equivalents entitling the executive to receive payments equal to the dividends paid (if any) on the shares of our common stock underlying the RSUs that become performance vested. Payments in respect of such Dividend Equivalents will be accumulated and made only to the extent that the applicable RSU becomes performance vested, and will be paid following the applicable vesting date.
In the event of a “change in control” of the company (as defined in the 2024 Plan), a number of LTIP units and/or RSUs (as applicable) equal to the number of LTIP units or RSUs that would have performance-vested in accordance with the performance vesting schedule described above (if any) assuming the applicable Performance Period ended as of the date of the change in control (with such adjustments to the AFFO goals and/or NOI goals as determined by the 2024 Plan administrator to reflect the truncated performance period) will vest immediately prior to the change in control. Any LTIP units and/or RSUs (as applicable) that do not vest will be cancelled and forfeited as of the date of the change in control.
Except as otherwise described below, any LTIP units or RSUs (as applicable) that have not fully vested as of the date on which an executive’s service terminates for any reason will be cancelled and forfeited by the executive.
In the event of a qualifying termination prior to the completion of the applicable Performance Period, the performance-vesting award will remain outstanding and eligible to performance vest in accordance with the performance vesting schedule described above, and the number of LTIP units or RSUs (as applicable) that vest upon the completion of the Performance Period will be determined on a pro rata basis, based on the number of days that the executive was employed during the Performance Period. Any LTIP units or RSUs (as applicable) that do not become fully vested will be cancelled and forfeited upon the completion of the Performance Period.
In the event of a qualifying termination following the completion of the applicable Performance Period but prior to the plan administrator’s determination of performance as described above, the performance-vesting award will remain outstanding and eligible to performance vest in accordance with the performance vesting schedule described above upon such determination by the plan administrator.
Director IPO Awards
We intend to grant an aggregate of 8,226 RSU awards under the 2024 Plan to certain of our Eligible Directors, which will become effective in connection with the completion of this offering. See “Director Compensation—Director IPO Awards” above.
280
Table of Contents
CERTAIN RELATIONSHIPS AND RELATED PARTY TRANSACTIONS
Related party transactions are transactions in which we are a participant where the amount involved exceeds $120,000 and a member of our board of directors or a director nominee, an executive officer or a holder of more than 5% of our voting securities (or an immediate family member of any of the foregoing) has a direct or indirect material interest. The following is a summary of related party transactions since January 1, 2021, other than compensation arrangements that are described under the sections of this prospectus entitled “Management—Director Compensation” and “Executive Compensation.”
Transactions with BG Lineage Holdings, LLC
BGLH, an entity indirectly controlled by our Co-Executive Chairmen, Adam Forste and Kevin Marchetti, is currently our sole common stockholder and the holder of a majority of our preferred stock. During the years ended December 31, 2022 and 2021, we distributed $122.1 million and $148.4 million, respectively, in dividends and tax distributions to BGLH as the sole holder of all of our common stock prior to this offering and the holder of a majority of our preferred stock. We did not make any such distributions in the year ended December 31, 2023. During the three months ended March 31, 2024, we distributed $88.5 million in dividends and tax distributions to BGLH.
Messrs. Forste and Marchetti indirectly own Class B units of BGLH entitling them to receive distributions from BGLH in accordance with its operating agreement. For the years ended December 31, 2022 and 2021, BGLH distributed $3.0 million and $3.9 million, respectively, and for the three months ended March 31, 2024, BGLH distributed $2.2 million, in each case, with respect to its Class B units. Of those distributions, Mr. Forste or his personal holding entities received approximately $0.8 million, $1.1 million and $0.6 million, respectively, and Mr. Marchetti or his personal holding entities received approximately $0.8 million, $1.1 million and $0.6 million, respectively. BGLH did not make any distributions with respect to its Class B units in the year ended December 31, 2023.
In addition, BG Cold, an entity indirectly controlled by Messrs. Forste and Marchetti, holds all Class C units in BGLH, which represent the right to receive the Founders Equity Share at BGLH, entitling BG Cold to receive a specified percentage of distributions on, and proceeds from redemptions and repurchases of, Class A units in BGLH held by other investors in BGLH. In order for BG Cold to receive the Founders Equity Share with respect to its Class C units in BGLH, a Class A unit in BGLH must first receive the return of, plus a specified return on, its invested capital. The Founders Equity Share is intended to reward Messrs. Forste and Marchetti for value accretion in a holder’s BGLH Class A units, which value accretion ultimately occurs only if there is value accretion in BGLH’s stockholdings in our company above the valuation at which a BGLH Class A unit holder purchased its Class A units. The Founders Equity Share in respect of each BGLH Class A unit will continue to accrue until, and will be finally calculated and settled at the time of, any repurchase or redemption of such Class A unit or upon the distribution of shares of our common stock to the holder of such Class A unit, but not later than the third anniversary of the initial closing of this offering.
Following the initial closing of this offering, BGLH intends to wind down its holding of our shares over a period of up to three years, during which it will settle all legacy investor equity held through BGLH. To do this, BGLH generally expects to distribute our shares in kind to its investors in settlement of their equity interests in BGLH. These investors will have made elections as to whether they want a Cash Settlement, pursuant to which we will repurchase our shares of common stock held by such investors, or whether they instead want a Securities Settlement such that they can continue holding the shares until such time as they individually determine to arrange their own dispositions. The Cash Settlement option occurs for each share as a one-time event with respect to that share based on the Cash Settlement event that we arrange; there is no ongoing option to cash settle a previously-received share at a later date of an investor’s choosing through a repurchase by our company. The settlement of all legacy investor equity held through BGLH is currently intended to be effected through multiple installments of Cash Settlements and Securities Settlements, until all legacy investor equity held through BGLH has been settled in this manner, at such times and in such amounts (over an up-to-three-year period) as BGLH may determine in its sole discretion, but BGLH could also determine in its sole discretion to effect the settlement
281
Table of Contents
of all legacy BGLH equity through fewer installments or in a single event at any time. If any legacy investor equity held through BGLH has not been settled by the third anniversary of the initial closing of this offering, we expect that BGLH would effect a final Securities Settlement at that time. BGLH could also effect a final Securities Settlement on any earlier date in its sole discretion.
BGLH’s investors will generally be permitted to change their elections regarding Cash Settlement, Securities Settlement or any combination thereof at any time with respect to legacy equity that has not yet been settled, subject to certain administrative limitations established by BGLH. BGLH will in all cases determine the amount available for Cash Settlements and Securities Settlements at any given time, and BGLH will have a contractual right to require us to conduct offerings of shares of our common stock from time to time in order to facilitate Cash Settlements in the amounts and times desired by BGLH pursuant to its registration rights agreement. See “—Registration Rights Agreements.” In certain situations where BGLH determines that it must limit the available amount of Securities Settlements relative to the available amount of Cash Settlements in order to further the goal of optimizing post-offering share price performance, BGLH may determine to effect cutbacks of the Securities Settlements to those of its investors that have elected to receive Securities Settlements. In the event such cutbacks are determined, the impacted BGLH investors will continue to hold the same BGLH units they held prior to the cutback, and those securities will remain eligible for proportionate participation in each future settlement event. In the event that such cutback interests are not able to be settled in securities at future interim settlement events, such settlement in securities could be delayed until the final settlement event occurs up to three years after the first closing of this offering. Each BGLH investor has had the option to elect whether it wants to settle the Founders Equity Share with respect to any cutback amounts at the time of such cutback (rather than at the time of the actual Securities Settlement applicable to the cutback amounts); except in circumstances where Guarantee Rights result in repurchases or top-ups of shares held by BGLH at a valuation above their fair market value (as described in “Certain Relationships and Related Party Transactions—Put Option Agreement”), the settlement of Founders Equity Share in all situations occurs within BGLH’s existing equity and does not dilute any of our investors or any investors in our operating partnership, other than solely our legacy investors who own BGLH equity.
On the date that is 30 days after the initial closing of this offering, BGLH intends to distribute an aggregate of 4,465,640 shares of our common stock to certain BGLH investors (including certain of our officers and directors) who have been identified as being part of an investor relationship that directly or indirectly holds fewer than 113,000 Class A Units and Class B Units in BGLH and our operating partnership (each such investor, a “small holder”) in full settlement of such small holders’ legacy equity. Small holders will receive shares of our common stock that will be considered “restricted” securities under the meaning of Rule 144 under the Securities Act. Accordingly, small holders will need to hold such shares of common stock for at least six months before being entitled to sell such shares under Rule 144. See “Shares Available for Future Sale—Rule 144.”
After the third anniversary of the initial closing of this offering, all rights to receive the Founders Equity Share are expected to terminate, and we currently expect that BGLH will cease to hold any of our shares at that point. Prior to the formation transactions, BG Cold is entitled to receive certain advances against its future Founders Equity Share distributions, and Messrs. Forste and Marchetti are entitled to a portion of such advances; however, the right to those advances will terminate as part of the formation transactions.
For the years ended December 31, 2022 and 2021, BGLH distributed $7.4 million and $11.8 million, respectively, with respect to its Class C units (or Founders Equity Share). All such amounts were received by BG Cold. Of those distributions, Mr. Forste or his personal holding entities received approximately $3.0 million and $4.7 million, respectively, and Mr. Marchetti or his personal holding entities received approximately $3.0 million and $4.7 million, respectively. BGLH did not make any distributions with respect to its Class C units in the year ended December 31, 2023 or during the three months ended March 31, 2024.
In addition, in lieu of making certain additional cash distributions to BG Cold with respect to a portion of the Class C units (or Founders Equity Share), a portion of such Class C units, valued at the time at $31.0 million,
282
Table of Contents
were reclassified into new Class B units of BGLH. These Class B units were subsequently distributed in-kind by BG Cold to its members. Of those in-kind distributions, Mr. Forste or his personal holding entities received Class B units valued at the time at approximately $12.2 million, and Mr. Marchetti or his personal holding entities received Class B units valued at the time at approximately $12.2 million. No such non-cash consideration or distributions were received in 2023 or 2022 or during the three months ended March 31, 2024.
In connection with this offering, we will redeem our outstanding Series A preferred stock at a price per share equal to $1,000, plus any accrued but unpaid dividends. BGLH is the record holder of 505 shares of Series A preferred stock and will accordingly receive $0.5 million plus any accrued but unpaid dividends, in such redemption.
Transactions with Lineage OP, LLC
Lineage OP is currently a direct subsidiary of, and managed by, our company. Messrs. Forste and Marchetti indirectly own Class B units of Lineage OP entitling them to receive distributions from Lineage OP in accordance with its operating agreement. For the years ended December 31, 2022 and 2021, Lineage OP distributed $6.8 million and $10.4 million, respectively, and for the three months ended March 31, 2024, Lineage OP distributed $4.6 million, in each case, with respect to its Class B units. Of those distributions, Mr. Forste or his personal holding entities received (or were deemed to receive by virtue of tax withholdings made on their behalf) approximately $2.8 million, $4.1 million and $1.8 million, respectively, and Mr. Marchetti or his personal holding entities received (or were deemed to receive by virtue of tax withholdings made on their behalf) approximately $2.8 million, $4.1 million and $1.8 million, respectively. Lineage OP did not make any distributions with respect to its Class B units in the year ended December 31, 2023.
Furthermore, Lineage OP currently makes elective pass-through-entity tax payments for certain owners of Bay Grove that hold equity in Lineage OP, including Mr. Marchetti, and receives reimbursement of these payments from such persons, including through offsets to their share of distributions by Lineage OP. These payments result in meaningful tax efficiencies for Mr. Marchetti and other owners of Bay Grove. For the year ended December 31, 2021, Mr. Marchetti or his personal holding entities directly or indirectly benefited from approximately $0.1 million. Lineage OP does not make these elective payments for other investors in Lineage OP.
In addition, prior to the formation transactions, BG Cold holds all Class C units in Lineage OP, which represent the right to receive the Founders Equity Share at Lineage OP entitling BG Cold to receive a specified percentage of distributions on, and proceeds from redemptions and repurchases of, Class A units held by other investors in Lineage OP. In order for BG Cold to receive the Founders Equity Share with respect to its Class C units in Lineage OP, a Class A unit in Lineage OP must first receive the return of, plus a specified return on, its invested capital. The Class C units are intended to reward Messrs. Forste and Marchetti for value accretion in a legacy investor’s Lineage OP Class A units, which value accretion ultimately occurs only if there was value accretion in Lineage OP above the valuation at which a Lineage OP Class A unit holder purchased its Class A units. The Founders Equity Share in respect of each Lineage OP Class A unit is being reclassified in connection with the formation transactions, along with the Lineage OP Class A units, into Legacy Class A OP Units with A-Piece Sub-Units and C-Piece Sub-Units, which provide for an equivalent interest in favor of BG Cold solely from Legacy Class A OP Units (and not with respect to any other OP units). See “Structure and Formation of Our Company—Formation Transactions.” The Founders Equity Share of BG Cold in respect of Legacy Class A OP Units will continue to accrue until, and will be finally calculated and settled at the time of, each reclassification of Legacy Class A OP Units into OP units (which reclassifications in some cases will also include a repurchase of OP units, as described below), but in each case will be settled not later than the third anniversary of the initial closing of this offering.
In connection with this offering and the formation transactions, Lineage OP, LLC will convert from a Delaware limited liability company to a Maryland limited partnership, change its name to Lineage OP, LP, and remain our operating partnership. As part of the formation transactions, among other things, all operating
283
Table of Contents
partnership units that are not owned by our company—all of which are currently classified as Lineage OP Class A units, Lineage OP Class B units or Lineage OP Class C units—will be reclassified into Legacy OP Units with various subclasses, each of which will have certain terms that differ from OP units in order to continue pre-existing rights of Lineage OP, LLC’s members for a period of up to three years following the initial closing of this offering. This also allows a coordinated settlement process to be conducted for our legacy equity holders as described under the heading “Structure and Formation of Our Company—Formation Transactions” and further detailed below.
After the Lineage OP Class A units, Lineage OP Class B units and Lineage OP Class C units have been reclassified into Legacy OP Units through the formation transactions, these Legacy OP Units will all ultimately be reclassified into OP units over a period of up to three years following the initial closing of this offering, resulting in the eventual elimination of the Legacy OP Unit class altogether. During this up-to-three-year period, our operating partnership will settle all legacy investor equity held through the Legacy OP Unit class. To do this, our operating partnership will first reclassify certain Legacy OP Units into OP units at various times as directed by the LHR acting on behalf of the various Legacy OP Unit holders, in settlement of the corresponding Legacy OP Units. The Legacy OP Unit holders will have made elections as to whether they want a Cash Settlement, pursuant to which we will repurchase OP units held by such investors, or whether they instead desire a Securities Settlement such that they can continue holding the OP units until such time as they individually determine to arrange their own dispositions or pursue their own redemptions under our standard operating partnership redemption provisions. The Cash Settlement option occurs for each OP unit as a one-time event based with respect to that OP unit on the Cash Settlement event that we arrange; there is no ongoing option to cash settle a previously-received OP unit at a later date of an investor’s choosing through a purchase by our company (however, the holders of such OP units would be permitted to avail themselves of our standard operating partnership redemption opportunities, which could result in the receipt of cash or shares at our option). The settlement of all Legacy OP Units is currently intended to be effected through multiple installments of Cash Settlements and Securities Settlements, until all Legacy OP Units have been settled in this manner, at such times and in such amounts (over an up-to-three-year period) as the LHR, acting on behalf of each of the all Legacy OP Unit holders, may determine in its sole discretion, but the LHR could also determine in its sole discretion to effect the settlement of all Legacy OP Units through fewer installments or in a single event at any time. If any Legacy OP Units have not been settled by the third anniversary of the initial closing of this offering, we expect that the LHR would effect a final Securities Settlement at that time. The LHR could also effect a final securities settlement on any earlier date in its sole discretion.
Legacy OP Unit holders will generally be permitted to change their elections regarding Cash Settlement, Securities Settlement or any combination thereof at any time with respect to Legacy OP Units that have not yet been settled, subject to certain administrative limitations established by the LHR. The LHR will in all cases determine the amount available for Cash Settlements and Securities Settlements at any given time, and BGLH, which is an affiliate of the LHR, will have a contractual right pursuant to its registration rights agreement to require us to conduct offerings of shares of our common stock from time to time in order to facilitate Cash Settlements in the amounts and times desired by BGLH, or desired by the LHR (an affiliate of BGLH), acting on behalf of the Legacy OP Unit holders, as applicable. See “—Registration Rights Agreements.” In certain situations where the LHR determines that it must limit the available amount of Securities Settlements relative to the available amount of Cash Settlements in order to further the goal of optimizing post-offering share price performance, the LHR may effect cutbacks of the Securities Settlements to those Legacy OP Unit holders that have elected to receive Securities Settlements. In the event such cutbacks are determined, the impacted Legacy OP Unit holders will continue to hold the same Legacy OP Units they held prior to the cutback, and those securities will remain eligible for proportionate participation in each future settlement event. In the event that such cutback interests are not able to be settled in securities at future interim settlement events, such settlement in securities could be delayed until the final settlement event occurs up to three years after the first closing of this offering. Each Legacy OP Unit holder has had the option to elect whether it wants to settle the Founders Equity Share with respect to any cutback amounts at the time of such cutback (rather than at the time of the actual Securities Settlement applicable to the cutback amounts); except in circumstances where Legacy Class A-4 OP Units are repurchased or topped up at a valuation above their fair market value (as described in “Structure and Formation of Our Company—Formation Transactions—Operating Partnership Conversion and Reclassification of
284
Table of Contents
Units”), the settlement of Founders Equity Share in all other situations occurs within the existing Legacy OP Unit equity and does not dilute any of our investors or any investors in our operating partnership, other than solely our Legacy OP Unit holders.
On the date that is 30 days after the initial closing of this offering, upon instruction from the LHR, we intend to reclassify an aggregate of 984,103 Legacy OP Units held by small holders as an equal number of OP units in full settlement of such small holders’ legacy equity in our operating partnership.
After the third anniversary of the initial closing of this offering, all rights to receive the Founders Equity Share are expected to terminate, and we currently expect that the Legacy OP Unit class will cease to exist at that point. Prior to the formation transactions, on a quarterly basis, BG Cold has also received a quarterly advance distribution against its future Founders Equity Share distributions, and Messrs. Forste and Marchetti have received a portion of such advances; however, the right to those advances will terminate as part of the formation transactions.
For the years ended December 31, 2023, 2022 and 2021, Lineage OP distributed $44.9 million, $41.1 million and $27.7 million, respectively, for the three months ended March 31, 2024, Lineage OP distributed $11.6 million, and immediately prior to the closing of this offering, Lineage OP will distribute $3.0 million in each case, with respect to its Class C units (or Founders Equity Share). All of such amounts were received by BG Cold. Of those distributions, Mr. Forste or his personal holding entities received (or were deemed to receive by virtue of tax withholdings made on their behalf) approximately $19.4 million, $17.7 million, $11.9 million, $4.9 million and $1.3 million, respectively, and Mr. Marchetti or his personal holding entities received (or were deemed to receive by virtue of tax withholdings made on their behalf) approximately $19.4 million, $17.7 million, $11.9 million, $4.9 million and $1.3 million, respectively.
In addition, in lieu of making certain additional cash distributions to BG Cold with respect to a portion of the Class C units (or Founders Equity Share), a portion of such Class C units, valued at the time at $46.5 million, were reclassified into new Class B units of Lineage OP. These Class B units were subsequently distributed in-kind by BG Cold to its members. Of those in-kind distributions, Mr. Forste or his personal holding entities received Class B units valued at the time at approximately $19.3 million, and Mr. Marchetti or his personal holding entities received Class B units valued at the time at approximately $19.3 million. No such non-cash consideration or distributions were received in 2023 or 2022 or during the three months ended March 31, 2024.
For more information regarding the formation transactions, see “Structure and Formation of Our Company—Formation Transactions.”
Transactions with Lineage Holdings
Lineage Holdings is currently a direct subsidiary of, and managed by, Lineage OP. Prior to the formation transactions, an affiliate of Bay Grove holds an equity accrual right (the “equity accrual right”) at Lineage Holdings that provides Bay Grove with an equity interest in Lineage Holdings that increases in amount each quarter. For the years ended December 31, 2023, 2022 and 2021, the accrual amount increased in value by $44.9 million, $39.6 million and $25.3 million, respectively, and for the three months ended March 31, 2024, the accrual amount increased in value by $11.4 million and Lineage Holdings made no distributions with respect to the equity accrual right in any of those periods. Messrs. Forste and Marchetti beneficially own a portion of this equity accrual right at Lineage Holdings. For the years ended December 31, 2023, 2022 and 2021, the beneficial ownership interest of Mr. Forste and his personal holding vehicles in the accrual increased in value by $19.3 million, $17.0 million and $10.9 million, respectively, and for the three months ended March 31, 2024, the beneficial ownership interest of Mr. Forste or his personal holding vehicles in the accrual increased in value by $4.9 million, and the beneficial ownership interest of Mr. Marchetti and his personal holding vehicles in the accrual increased in value by $19.3 million, $17.0 million and $10.9 million, respectively, and for the three months ended March 31, 2024, the beneficial ownership interest of Mr. Marchetti or his personal holding vehicles in the accrual increased in value by $4.9 million.
285
Table of Contents
In connection with this offering and the formation transactions:
• | The equity accrual right will become a fixed amount and will no longer accrue additional future amounts in any future quarters. This fixed amount will increase by $200.0 million, less certain amounts that will instead by allocated to Lineage OP to effect certain offsets. This will result in a $133.4 million net increase in Bay Grove’s direct and indirect equity in Lineage Holdings (taking into account both its direct and indirect interests in Lineage Holdings and a reduction in interests held by Bay Grove’s owners and their affiliates in BGLH resulting from these transactions), which is the net consideration for terminating the equity accrual right and for terminating the operating services agreement. |
• | We will amend the operating agreement of Lineage Holdings to reflect the resulting ownership of Lineage Holdings by Lineage OP and Bay Grove after giving effect to these transactions. See “Structure and Formation of Our Company—Formation Transactions.” |
• | We will amend the operating agreement of Lineage Holdings to reclassify the fixed equity accrual amount held by Bay Grove into 2,447,990 OPEUs. The OPEUs will be exchangeable in the future (after a two-year holding period) on a one-for-one basis for OP units, subject to certain adjustments, and no additional OPEUs will be created in respect of any equity accrual right. OP units issued in exchange for such OPEUs will not be redeemable until after the settlement of all legacy BGLH equity and all Legacy OP Units. |
• | Following the one-time increase in Bay Grove’s profits interest and corresponding reclassification into a fixed number of OPEUs described immediately above, Lineage Holdings will repurchase 986,842 OPEUs from Bay Grove for cash in the amount of $75.0 million. |
• | Lineage Holdings will also have entered into an expense reimbursement and indemnification agreement with Bay Grove, BGLH and the LHR. See “ —Indemnification Agreements—Bay Grove.” |
Lineage Holdings has also used a portion of its funds to reimburse Bay Grove for its expenses. See “Transactions with Bay Grove—Expense Reimbursement.”
Transactions with Bay Grove
Expense Reimbursement
Pursuant to the operating agreement of BGLH, the operating agreement of Lineage OP and the operating services agreement (described below), Bay Grove has received reimbursement of all expenses incurred in the performance of its services to us, BGLH, Lineage OP and/or Lineage Holdings. For the years ended December 31, 2023, 2022 and 2021, Bay Grove was reimbursed for expenses totaling $1.0 million, $1.3 million and $1.0 million, respectively and for the three months ended March 31, 2024, Bay Grove was reimbursed for expenses totaling $0.6 million. Messrs. Forste and Marchetti beneficially own a portion of the equity of Bay Grove. Because of their beneficial ownership of Bay Grove Messrs. Forste and Marchetti indirectly benefitted from such amounts received by Bay Grove. Of these amounts, Mr. Forste or his personal holding entities benefitted by approximately $0.4 million, $0.5 million, $0.4 million and $0.2 million, respectively, and Mr. Marchetti or his personal holding entities benefitted by approximately $0.4 million, $0.5 million, $0.4 million and $0.2 million, respectively.
Lineage Holdings will also have entered into an expense reimbursement and indemnification agreement with Bay Grove, BGLH and the LHR. See “—Indemnification Agreements—Bay Grove.”
Operating Services Agreement
Pursuant to the seventh amended and restated operating services agreement, dated as of August 3, 2020 (the “operating services agreement”), Bay Grove has provided Lineage Holdings with certain operating, consulting, strategic development and financial services, including advice and assistance concerning operational aspects of Lineage Holdings and its subsidiaries. For the years ended December 31, 2023, 2022 and 2021, Bay Grove
286
Table of Contents
received compensation of $10.5 million, $10.5 million and $10.5 million, respectively, for the six months ended June 30, 2024, Bay Grove received compensation of $5.3 million, and immediately prior to the closing of this offering, Bay Grove will receive a final payment of $0.7 million, in each case, pursuant to the services agreement. Messrs. Forste and Marchetti beneficially own a portion of the equity of Bay Grove. Bay Grove applies all such compensation to its operating expenses. Because of their beneficial ownership of Bay Grove they directly or indirectly benefitted from such amounts received by Bay Grove. Of these amounts, Mr. Forste or his personal holding entities directly or indirectly benefitted from approximately $4.5 million, $4.5 million, $4.5 million, $2.3 million and $0.3 million, respectively, and Mr. Marchetti or his personal holding entities directly or indirectly benefitted from approximately $4.5 million, $4.5 million, $4.5 million, $2.3 million and $0.3 million, respectively.
We intend to internalize such operating, consulting, strategic development and financial services that have historically been provided by Bay Grove. Accordingly, in connection with this offering and the internalization of these services, we will have terminated the operating services agreement between Lineage Holdings and Bay Grove in exchange for the consideration described in “Formation Transactions.”
In addition, Lineage Holdings will enter into a transition services agreement with Bay Grove to provide transition services supporting capital deployment and mergers and acquisitions activity for three years following the initial closing of this offering to help us build our full internal capability during that period while we internalize such functions. See “—Transition Services Agreement.”
Aircraft Time Sharing Agreement
We intend to enter into an aircraft time sharing agreement (the “Time Sharing Agreement”) with Bay Grove under which we may lease the aircraft from Bay Grove for certain flights in accordance with applicable federal aviation regulations. For all such use under the Time Sharing Arrangement, we will pay for time sharing costs in accordance with applicable federal aviation regulations. Time sharing costs include, among other items, fuel and oil costs, crew and food and beverage costs, hangar and tie-down costs, landing fees, airport taxes, and similar assessments, and other costs incurred in planning for and operating the applicable flight. The term of the Time Sharing Agreement is one year, which term will be automatically renewed for successive one year terms at the end of each year.
Transition Services Agreement
Upon completion of this offering and the formation transactions, we will enter into a transition services agreement with an affiliate of Bay Grove, pursuant to which Bay Grove will provide us with certain transition services supporting capital deployment and mergers and acquisitions activity for three years following the initial closing of this offering, unless earlier terminated pursuant to the terms of the agreement, to help us build our full internal capability during that period. The transition services agreement may be terminated by mutual written consent of us and Bay Grove or by us for cause (as defined in the transition services agreement). We will pay Bay Grove an annual fee equal to $8.0 million, or $24.0 million in the aggregate for the three-year period, which fee is payable in advance in equal quarterly installments. Messrs. Forste and Marchetti beneficially own a portion of the equity of Bay Grove. Bay Grove currently expects to apply all such compensation to pay operating expenses of Bay Grove and as a result Messrs. Forste and Marchetti are not expected to receive any cash payments or distributions of such amounts; however, because of their beneficial ownership of Bay Grove they are expected to indirectly benefit from such amounts received by Bay Grove. Of these amounts, Mr. Forste or his personal holding entities are expected to indirectly benefit from approximately $3.4 million per year for three years, or $10.3 million in the aggregate, and Mr. Marchetti or his personal holding entities are expected to indirectly benefit from approximately $3.4 million per year for three years, or $10.3 million in the aggregate, respectively.
We have also agreed to reimburse Bay Grove for all its out-of-pocket expenses incurred or accrued in connection with the performance of the services under the transition services agreement. The transition services agreement will automatically terminate three years following the initial closing date of this offering, but is
287
Table of Contents
otherwise not terminable by either party prior to expiration of the term other than for “Cause,” which will be triggered only in the event that either Messrs. Forste or Marchetti is convicted of certain felonies and continues to remain active in Bay Grove’s services to our business.
Partnership Agreement
In connection with the formation transactions, we will enter into the partnership agreement for Lineage OP, LP See “Description of the Partnership Agreement of Lineage OP, LP.”
Pursuant to the partnership agreement, members of our operating partnership will have rights beginning 14 months after the issuance of the OP units to require our operating partnership to redeem all or part of their OP units (excluding any Legacy OP Units) for cash equal to the then-current market value of an equal number of shares of our common stock (determined in accordance with and subject to adjustment under the partnership agreement) or, at our election, to exchange their OP units for shares of our common stock on a one-for-one basis subject to certain adjustments and the restrictions on ownership and transfer of our stock set forth in our charter and described under “Description of Our Capital Stock—Restrictions on Ownership and Transfer.” Except for the one-time special redemption and top-up rights with respect to Legacy Class A-4 OP Units described elsewhere in this prospectus, Legacy OP Units do not have any redemption rights prior to being reclassified as OP units, but once a Legacy OP Unit has been so reclassified (assuming it is not otherwise in the process of a Cash Settlement), it will have the same redemption rights as the other OP units at any time and will not be subject to the 14-month waiting period.
Over the course of the first three years following the initial closing of this offering, all of the Legacy OP Units will ultimately be reclassified into OP units. Reclassification will be on a one-for-one basis, with each Legacy OP Unit becoming a single OP unit upon its reclassification. Following any such reclassification, Legacy OP Unit holders will thereafter hold such OP units for such period of time as they determine or receive cash pursuant to a sale of their OP units to us in connection with the reclassification event (or a combination thereof). These reclassifications, and any related sales to us of the OP units, will occur at such times as directed by the LHR, acting on behalf of the Legacy OP Unit holders. The LHR will be an affiliate of our current majority stockholder, BGLH.
Registration Rights Agreements
We will enter into a registration rights agreement with BGLH, pursuant to which we will grant it and certain of its affiliates with certain “demand” registration rights and “piggyback” registration rights, including rights to demand that we undertake a public offering of shares of our common stock for our own account and use the net proceeds from such offering to purchase or redeem shares of common stock held by individuals designated by BGLH, with respect to 161,924,302 shares of common stock held by BGLH and 22,232,708 shares of common stock issuable upon redemption of 22,232,708 OP units. The registration rights agreement will also provide that we will pay certain expenses relating to such registrations and indemnify the registration rights holders against certain liabilities that may arise under the Securities Act.
We will also enter into one or more registration rights agreements with holders of registrable securities (including Mr. Forste, Mr. Marchetti, Stonepeak and BentallGreenOak), pursuant to which we will grant them with certain resale registration rights with respect to shares of common stock that they may receive upon distributions from BGLH or upon exchange of OP units (including any OP units received in any reclassification of Legacy OP Units). The registration rights agreements will also provide that we will pay certain expenses relating to such registrations and indemnify the registration rights holders against certain liabilities which may arise under the Securities Act.
Stockholders Agreement
In connection with this offering, we intend to enter into a stockholders agreement with BGLH, D1 Capital, Stonepeak, BentallGreenOak, Mr. Forste and Mr. Marchetti. This agreement will require us to nominate to our
288
Table of Contents
board of directors a number of individuals designated by BGLH, Stonepeak, BentallGreenOak, Mr. Forste and Mr. Marchetti, in each case, as described in further detail below.
The stockholders agreement will require us to nominate for election as our directors at any meeting of our stockholders a number of individuals designated by BGLH (each a “BGLH Director”) such that, following the election of any directors and taking into account any director continuing to serve as such without the need for re-election, the number of BGLH Directors serving as directors of our company will be equal to: (1) if BGLH and its affiliates together continue to beneficially own at least 50% of the outstanding shares of common stock, OPEUs held by persons other than the operating partnership and OP units (including OP units issuable upon reclassification of Legacy OP Units) held by persons other than us (collectively, the “total outstanding interests”) as of the record date for such meeting, the lowest whole number that is greater than 50% of the total number of directors comprising our board of directors; (2) if BGLH and its affiliates together continue to beneficially own at least 40% (but less than 50%) of the total outstanding interests as of the record date for such meeting, the lowest whole number that is at least 40% of the total number of directors comprising our board of directors; (3) if BGLH and its affiliates together continue to beneficially own at least 30% (but less than 40%) of the total outstanding interests as of the record date for such meeting, the lowest whole number that is at least 30% of the total number of directors comprising our board of directors; (4) if BGLH and its affiliates together continue to beneficially own at least 20% (but less than 30%) of the total outstanding interests as of the record date for such meeting, the lowest whole number that is at least 20% of the total number of directors comprising our board of directors; and (5) if BGLH and its affiliates together continue to beneficially own at least 5% (but less than 20%) of the total outstanding interests as of the record date for such meeting, the lowest whole number that is at least 10% of the total number of directors comprising our board of directors. BGLH has designated Mr. Forste, Mr. Marchetti, Shellye Archambeau, Joy Falotico, Michael Turner and Lynn Wentworth to serve as BGLH Directors upon completion of this offering.
Following the date that BGLH is no longer entitled to designate at least two BGLH Directors, the stockholders agreement will require us to nominate for election as our directors at any meeting of our stockholders one individual designated by each of Mr. Forste (the “Forste Director”) and Mr. Marchetti (the “Marchetti Director”) if, as of the record date for such meeting, Mr. Forste, together with his affiliates, or Mr. Marchetti, together with his affiliates, as applicable, continue to beneficially own a number of total outstanding interests representing at least 1.76% of the total outstanding interests outstanding as of the initial closing date of this offering. Upon completion of this offering, BGLH will be entitled to designate at least two BGLH Directors; accordingly, neither Mr. Forste nor Mr. Marchetti will be able to designate directors.
The stockholders agreement will also require us to nominate for election as our directors at any meeting of our stockholders a number of individuals designated by Stonepeak (each a “Stonepeak Director”) as follows: (1) two Stonepeak Directors if Stonepeak and its affiliates together continue to own at least 25% of the shares of common stock outstanding as of the record date for such meeting (calculated with respect to its share of any common stock held through BGLH as if no Founders Equity Share was due in respect of any BGLH equity held by Stonepeak and its affiliates); (2) one Stonepeak Director if Stonepeak and its affiliates together continue to own (x) at least 10% (but less than 25%) of the shares of common stock outstanding as of the record date for such meeting (calculated with respect to its share of any common stock held through BGLH as if no Founders Equity Share was due in respect of any BGLH equity held by Stonepeak and its affiliates) or (y) any BGLH equity. If at any time Stonepeak has the right to designate two individuals for election as directors under the stockholders agreement and there are less than two Stonepeak Directors serving on the board of directors, the Stonepeak Director serving on the board of directors will have the power to cast two votes with respect to any matters presented to the board of directors. Stonepeak has designated Luke Taylor and James Wyper to serve as the Stonepeak Directors upon completion of this offering.
In addition, for so long as BentallGreenOak owns (x) at least 10% of the total outstanding interests as of the record date for such meeting (calculated with respect to its share of any common stock held through BGLH as if no Founders Equity Share was due in respect of any BGLH equity held by BGO and its affiliates) or (y) any BGLH equity, the stockholders agreement will require us to nominate for election as our directors at any meeting of our
289
Table of Contents
stockholders one individual designated by BentallGreenOak (the “BentallGreenOak Director”). We have agreed that the BentallGreenOak Director shall not be appointed to serve as (i) the chairperson of our board of directors or (ii) the chairperson of any committee of our board of directors. BentallGreenOak has designated John Carrafiell to serve as the BentallGreenOak Director upon completion of this offering.
For so long as the stockholders agreement remains in effect with respect to each of BGLH, Stonepeak, BentallGreenOak, Mr. Forste or Mr. Marchetti, such investor’s director may not be removed without the consent of such investor. In the case of a vacancy on our board created by the removal or resignation of a BGLH Director, Stonepeak Director, BentallGreenOak Director, Forste Director or Marchetti Director, the stockholders agreement will require us to nominate for election an individual designated by the applicable investor to fill the vacancy. In addition, the stockholders agreement will require that any action with the purpose of, or that would have the effect of, discontinuing our qualification as a domestically controlled qualified investment entity will require the consent of each of Stonepeak, D1 Capital and BentallGreenOak for so long as each such entity is entitled to receive shares of our common stock upon a distribution in kind from BGLH to owners of its equity.
The stockholders agreement will terminate with respect to each of BGLH, Stonepeak, D1 Capital, BentallGreenOak, Mr. Forste and Mr. Marchetti at the earlier to occur of (i) the applicable investor is no longer entitled to nominate a director pursuant to the stockholders agreement (or, with respect to D1 Capital, on the date when D1 Capital ceases to own (x) 10% or more of the total outstanding interests (calculated with respect to its share of any common stock held through BGLH as if no Founders Equity Share was due in respect of any BGLH equity held by D1 Capital and its affiliates) or (y) any BGLH equity) or (ii) the date on which the applicable investor requests that the agreement terminate with respect to itself.
In addition, the stockholders agreement will provide that we, on our own behalf and in our capacity as the general partner of our operating partnership, must use commercially reasonable efforts to (i) structure certain significant exit transactions (including mergers, consolidations and sales of substantially all of our assets or the assets of our operating partnership and its subsidiaries) in a manner that is tax-deferred to Messrs. Marchetti and Forste, their respective estate planning vehicles, family members and controlled affiliates, does not cause such parties to recognize gain for federal income tax purposes, and provides for substantially similar tax protections after such transactions, and (ii) cause our operating partnership or its subsidiaries to continuously maintain sufficient levels of indebtedness that are allocable for federal income tax purposes to Messrs. Marchetti and Forste and their respective personal holding entities to prevent them from recognizing gain as a result of any negative tax capital account or insufficient debt allocation, provided that such amount of debt shall not be required to exceed the amount allocable to the parties immediately following this offering, subject to certain exceptions. The stockholders agreement will further provide that, prior to entering into an agreement to consummate such an exit transaction, the parties will negotiate in good faith on a tax-deferred structure that is reasonably acceptable to Messrs. Marchetti and Forste, their respective estate planning vehicles, family members and controlled affiliates. If the parties are unable to reach agreement after 45 days of negotiation, our recommended tax deferred structure will prevail. If material terms of the proposed transaction are modified or changed, the negotiation period will be extended by 30 days. In connection with the obligation to maintain sufficient liability allocations, if we or our operating partnership believes insufficient liabilities may be allocated to Messrs. Marchetti and Forste and their respective personal holding entities, we shall, and shall cause our subsidiaries to, provide Messrs. Marchetti and Forste, their respective estate planning vehicles, family members and controlled affiliates with an opportunity to guarantee indebtedness. These rights granted to Messrs. Marchetti and Forste, their respective estate planning vehicles, family members and controlled affiliates will last with respect to each as long as such person (or his estate planning vehicles, family members and controlled affiliates) has not disposed of more than 60% of his interest in us or obtained a fair market value adjusted tax basis as a result of the death of Messrs. Marchetti or Forste, respectively.
Put Option Agreement
Rollover equity in the form of BGLH units or Lineage OP units was previously issued to various sellers of assets we acquired as part of the purchase price consideration. Some of those sellers who received rollover equity
290
Table of Contents
in BGLH or Lineage OP were provided with separate classes of equity of BGLH or Lineage OP that in some cases included special one-time redemption features with minimum value guarantees and/or the alternative option to elect cash or equity top-up rights to achieve a certain minimum equity valuation at a specific date (collectively, the “Guarantee Rights”). The obligations in respect of the Guarantee Rights have resided with BGLH and its subsidiaries, where BGLH units were issued (the “BGLH Guarantee Rights”), and with Lineage OP and its subsidiaries, where Lineage OP units were issued.
To ensure that the financial obligations associated with all Guarantee Rights proportionately impact investors at Lineage, our operating partnership and Lineage Holdings, each of those entities has agreed to provide successive special repurchase rights and cash and equity top-up rights to such legacy investors that mirror those given by BGLH to its investors (the “Rollover Holder Put Option”) and those given by Lineage OP to its investors, in each case in connection with the Guarantee Rights (the “Lineage OP Put Option”).
• | Pursuant to the Rollover Holder Put Option, BGLH has the right to (i) distribute (in various installments from September 2024 through December 2025 (the “Rollover Holder Put Exercise Window”)) up to 2,036,738 shares of our common stock to its investors holding BGLH Guarantee Rights, and such investors have the individual right to cause Lineage to purchase any or all of such shares of our common stock distributed to such persons by BGLH for an amount equal to the guaranteed minimum value intrinsic to the BGLH Guarantee Rights (at a guaranteed minimum price or, in some cases, if greater, the then-current fair market value of the shares of our common stock), which amounts differ for different such investors, or (ii) in some cases demand a top-up, through a cash payment or through the issuance of additional shares of our common stock without payment therefor, or any combination thereof, in the amount by which the guaranteed minimum value exceeds the then-current fair market value of the shares of our common stock (if at all) at various specified times during the Rollover Holder Put Exercise Window. |
• | Pursuant to the Lineage OP Put Option, during the Rollover Holder Put Exercise Window: (i) our operating partnership has similar rights to cause us to purchase up to 319,006 Legacy Class A-4 OP units for (A) $34.0 million (less certain distributions received after June 26, 2024) if our share price is less than $100.86, (B) an amount that ranges from $34.0 million to $36.1 million (less certain distributions received after June 26, 2024) if our share price is between $100.86 to $113.25, or, (C) if our share price is $113.25 or higher, the product of such share price (less certain distributions received after June 26, 2024) and the number of Legacy Class A-4 OP units sold back to us; and (ii) our operating partnership has similar cash or equity top-up rights if the guaranteed minimum value of $106.59 (less certain distributions received after June 26, 2024) exceeds the then-current fair market value of such Legacy Class A-4 OP units. |
The effect of the Rollover Holder Put Option and the Lineage OP Put Option is to cause all Guarantee Rights ultimately to be satisfied by Lineage Holdings so that all investors in BGLH, Lineage, our operating partnership and Lineage Holdings are proportionately impacted by the Guarantee Rights based on their direct and indirect ownership interests in Lineage Holdings. This dilution is not solely borne by pre-offering investors; instead it affects all investors.
Indemnification Agreements
Directors and Officers
We intend to enter into indemnification agreements with our directors and executive officers. These agreements will require us to indemnify these individuals to the maximum extent permitted under Maryland law and our charter against liabilities that may arise by reason of their service to us, and to advance expenses incurred as a result of any proceeding against them as to which they could be indemnified upon our receipt of certain affirmations and undertakings. Insofar as indemnification for liabilities arising under the Securities Act may be permitted to directors or executive officers, we have been informed that in the opinion of the SEC, such indemnification is against public policy and is therefore unenforceable.
291
Table of Contents
There is currently no pending material litigation or proceeding involving any of our directors, officers or employees for which indemnification is sought.
Bay Grove
In connection with this offering, Lineage Holdings intends to enter into an expense reimbursement and indemnification agreement with BGLH, the LHR and Bay Grove, pursuant to which Lineage Holdings will agree to (i) advance to or reimburse such entities for all of their expenses in any way related to our company, including expenses incurred in connection with the coordinated settlement process that will occur for up to three years for all legacy investors in both BGLH and our operating partnership and (ii) indemnify such entities to the fullest extent permitted by applicable law against liabilities that may arise in any way related to our company, including liabilities incurred in connection with or as a result of the coordinated settlement process.
Employment Agreements
We employ Scott Lehmkuhl as Director, Information Technology. He is the brother of Greg Lehmkuhl, our Chief Executive Officer. Mr. Scott Lehmkuhl’s compensation is based on his education, experience and the responsibilities of his position. For the years ended December 31, 2023 and 2022, Mr. Scott Lehmkuhl received total compensation of approximately $269,000 and $222,000, respectively. Mr. Scott Lehmkuhl’s 2023 compensation includes an award of LVCP units, which entitle him to a payment equal to $25,000 at the time of full vesting if such units achieve a certain target price specified in the award agreement; however, there is no assurance that such target price will be achieved upon the vesting of such awards in connection with this offering. For the year ended December 31, 2021, Mr. Scott Lehmkuhl was employed by us for less than the full year and therefore received total compensation of less than $120,000.
We employ Jayse Bryan as Senior Manager, Project Management Office. He is the son of Greg Bryan, our Chief Integrated Solutions Officer. Mr. Jayse Bryan’s compensation is based on his education, experience and the responsibilities of his position. For the years ended December 31, 2023, 2022 and 2021, Mr. Jayse Bryan received total compensation of approximately $154,000, $134,000 and $126,000, respectively.
Restrictive Covenants Agreements
Upon completion of this offering and the formation transactions, we will enter into a restrictive covenants agreement with each of Messrs. Forste and Marchetti, pursuant to which Messrs. Forste and Marchetti will agree that for a period ending on the earlier of three years following the completion of this offering or the date on which they cease to own, directly or indirectly, any equity interest in Lineage, Inc., they will not compete with our business.
Amended and Restated Lineage 2024 Incentive Award Plan
Before the completion of this offering, we intend to adopt the 2024 Plan, under which we will grant cash and equity-based incentive awards to eligible service providers in order to attract, motivate and retain the talent for which we compete. An aggregate of 12,500,000 shares of our common stock will be authorized for issuance under awards granted pursuant to the 2024 Plan.
In connection with the completion of this offering, we intend to grant awards of shares of common stock or cash under the 2024 Plan to certain employees, including our executive officers. See “Structure and Formation of Our Company—Benefits to Related Parties” for further details. Each of our executive officers may elect to receive a portion of their award in cash instead of shares of our common stock. Each of Messrs. Smith, McGowan and Bryan and Ms. Matsler elected to receive a cash award of $1,250,000. For information regarding the elections made by our named executive officers, see “Executive Compensation—Equity Awards in Connection with the IPO—Executive and Employee IPO Awards.”
292
Table of Contents
Historic Management Incentive Equity
Prior to this offering, certain of our current and former officers and employees hold LMEP Units through two incentive equity pooling entities, LLH MGMT Profits, LLC and LLH MGMT Profits II, LLC, which each hold corresponding historic accrued management incentive equity interests in Lineage Holdings for the benefit of these officers and employees. As part of the formation transactions, we will have purchased in exchange for 80,950 shares of our common stock the vested awards of LMEP Units valued at less than $3.0 million per individual that are held by of certain of our officers and employees who are not named executive officers. After such purchase, each of LLH MGMT Profits, LLC and LLH MGMT Profits II, LLC will contribute its vested management incentive equity interests in Lineage Holdings to our operating partnership in exchange for 2,204,162 Legacy Class B OP Units. This results in the remaining vested LMEP Units not purchased by us becoming a fixed number of Legacy Class B OP Units prior to such time as the LMEP Units would otherwise be paid pursuant to their rights under the terms of the existing awards. Following the contribution, each of LLH MGMT Profits, LLC and LLH MGMT Profits II, LLC will distribute the Legacy Class B OP Units to its members, including certain of our officers and employees whose LMEP Units are not purchased in exchange for shares of our common stock, in complete liquidation of each such entity. Following such distribution, officers, employees and others to whom such Legacy Class B OP Units are distributed will generally continue to hold such Legacy Class B OP Units subject to settlement over a period of up to three years as part of the same settlement process that applies to all of our legacy investor equity. All outstanding LMEP Units that remain unvested as of the date of such contribution and distribution will automatically terminate at such time and will be replaced with equity-based awards under the 2024 Plan. For additional information on these awards, see “Structure and Formation of Our Company—Benefits to Related Parties.” In addition, all BGLH Restricted Units that remain unvested as of immediately prior to the completion of this offering will automatically vest in full at such time.
Executive Loans
On April 6, 2020, Messrs. Forste and Marchetti each received a loan in the amount of $6.4 million from Lineage OP. Each loan bears interest at a per annum rate equal to 0.99%. On January 22, 2024, Mr. Forste repaid $2.0 million of his loan and Mr. Marchetti repaid $2.2 million of his loan. The balance of each of these loans will be repaid prior to the completion of this offering.
On June 27, 2012, BG Cold Holdings, LLC, an entity beneficially owned directly or indirectly by Messrs. Forste and Marchetti, received a loan in the amount of $2.2 million from Lineage OP. Such loan bore interest at a per annum rate equal to 5.00%. Each of Mr. Forste and Mr. Marchetti benefitted from this loan through their direct or indirect beneficial ownership of BG Cold Holdings, LLC. This loan was repaid in full in 2022.
As of December 31, 2023, 2022 and 2021, the outstanding loan liability attributable to Mr. Forste or his personal holding entities was $6.7 million, $6.6 million and $8.0 million, respectively. As of March 31, 2024, the outstanding loan liability attributable to Mr. Forste or his personal holding entities was $4.7 million. As of December 31, 2023, 2022 and 2021, the outstanding loan liability attributable to Mr. Marchetti or his personal holding entities was $6.7 million, $6.6 million and $8.0 million, respectively. As of March 31, 2024, the outstanding loan liability attributable to Mr. Marchetti or his personal holding entities was $4.5 million.
On each of February 11, 2021, February 18, 2022 and February 10, 2023, Greg Lehmkuhl, our Chief Executive Officer, received loans in an aggregate amount equal to $2.7 million from Lineage Holdings. The loans bear interest at a per annum rate equal to 2.57%, 2.57% and 4.47%, respectively. In February 2022, Lineage Holdings forgave $1.5 million of indebtedness of Mr. Lehmkuhl, including $0.3 million associated with the February 11, 2021 loan. On December 15, 2023, Mr. Lehmkuhl repaid $1.6 million of indebtedness, resulting in the full repayment of the February 2021 loan and partial repayment of the February 2022 loan. On February 12, 2024, Mr. Lehmkuhl repaid the remaining balance of the February 2022 loan and the February 2023 loan in full.
293
Table of Contents
On September 30, 2020, each of Sudarsan Thattai, our Chief Technology and Chief Transformation Officer, and Brian McGowan, our Chief Network Optimization Officer, received a loan in an aggregate amount equal to $2.0 million from Lineage OP. Each loan bore interest at a per annum rate of 5.00%. Each of these loans was repaid in full on December 15, 2023.
On September 30, 2020, Jason Burnett, our former executive vice president and general counsel, received a loan in an aggregate amount equal to $1.0 million from Lineage OP. This loan bore interest at a per annum rate of 5.00%. Mr. Burnett separated from our company in January 2022. Mr. Burnett repaid $359,987 of the loan on April 15, 2022, $377,671 on April 1, 2023 and the remaining $397,321 of principal and accrued interest on April 1, 2024.
On October 14, 2020, Matthew Hardt, our former chief financial officer, received a loan in an aggregate amount equal to $1.5 million from Lineage OP. This loan bore interest at a per annum rate of 5.00%. Mr. Hardt repaid this loan in full on December 13, 2021. Mr. Hardt separated from our company in September 2022.
Unit Redemptions
BGLH
BGLH from time to time offers opportunities to certain of its equity holders, including our executive officers, to redeem their units in BGLH for cash at prices per unit determined by BGLH. Pursuant to the operating agreement of BGLH, the cash used for such redemptions is provided by Lineage Holdings. For the years ended December 31, 2023 and 2022, Lineage Holdings distributed $12.4 million and $2.2 million, respectively to fund such redemptions. During the three months ended March 31, 2024, Lineage Holdings has distributed $19.6 million to fund such redemptions.
During the year ended December 31, 2023, Greg Lehmkuhl, our Chief Executive Officer, Sudarsan Thattai, our Chief Technology and Chief Transformation Officer, and Brian McGowan, our Chief Network Optimization Officer, redeemed units in BGLH for aggregate cash payments of $4.9 million, $2.4 million and $2.3 million respectively. In addition, to date in 2024, Mr. Lehmkuhl and Sean Vanderlezen, our Chief Human Resources Officer, have redeemed units in BGLH for aggregate cash payments of $15.0 million and $1.1 million, respectively. During the year ended December 31, 2022, Matthew Hardt, our former chief financial officer, redeemed units in BGLH for aggregate cash payments of $2.2 million, and we will redeem additional units in BGLH for aggregate cash payments of $2.2 million in connection with this offering. Mr. Hardt separated from our company in September 2022.
Lineage OP
Lineage OP from time to time has offered opportunities for its investors to redeem their units in Lineage OP for cash at prices determined by Lineage OP. Pursuant to the operating agreement of Lineage OP, the cash used for such redemptions can be provided by Lineage Holdings. For the year ended December 31, 2021, Lineage Holdings distributed $70.0 million to fund such redemptions.
During the year ended December 31, 2021, Mr. Forste or his personal holding entities and Mr. Marchetti or his personal holding entities redeemed units in Lineage OP for aggregate cash payments of $30.0 million each.
Lineage Holdings
Lineage Holdings from time to time offers opportunities to certain of our executive officers to redeem their underlying Class C units in Lineage Holdings, which are held through LLH MGMT Profits, LLC and LLH MGMT Profits II, LLC, for cash at prices per unit determined by Lineage Holdings.
294
Table of Contents
For the years ended December 31, 2023 and 2021, Greg Lehmkuhl, our Chief Executive Officer, redeemed underlying Class C units in Lineage Holdings for aggregate cash payments of $6.7 million and $1.4 million, respectively. For the year ended December 31, 2021, Jeff Rivera, our Chief Operating Officer, redeemed underlying Class C units in Lineage Holdings for aggregate cash payments of $2.1 million. For the year ended December 31, 2021, Sudarsan Thattai, our Chief Technology and Chief Transformation Officer, redeemed underlying Class C units in Lineage Holdings for aggregate cash payments of $4.4 million. For the year ended December 31, 2021, Brian McGowan, our Chief Network Optimization Officer, redeemed underlying Class C units in Lineage Holdings for aggregate cash payments of $2.0 million. For the year ended December 31, 2021, Tim Smith, our Chief Commercial Officer, redeemed underlying Class C units in Lineage Holdings for aggregate cash payments of $4.5 million. For the years ended December 31, 2022 and 2021, Matt Hardt, our former chief financial officer, redeemed underlying Class C units in Lineage Holdings for aggregate cash payments of $3.6 million and $6.8 million, respectively. In connection with this offering, we will redeem additional underlying Class C units in Lineage Holdings held by Mr. Hardt for an aggregate cash payment of $1.2 million. Mr. Hardt separated from our company in September 2022. For the years ended December 31, 2023, 2022 and 2021, Jason Burnett, our former executive vice president and general counsel, redeemed underlying Class C units in Lineage Holdings for aggregate cash payments of $1.9 million, $7.6 million and $1.0 million, respectively. Mr. Burnett separated from our company in January 2022.
Rollover Equity Redemptions
BGLH
Certain members of BGLH have special one-time redemption rights to redeem some or all of their Class A units in BGLH for cash at a minimum value as set out in the operating agreement of BGLH. In connection with such redemptions, BG Cold, an entity indirectly controlled by Messrs. Forste and Marchetti, is entitled to receive Class C distributions (or Founders Equity Share) on any redeemed Class A units.
Each time a redemption is made at BGLH, BGLH makes a corresponding redemption of our shares; we make a corresponding redemption of Lineage OP units; and Lineage OP makes a corresponding redemption of its equity in Lineage Holdings.
During the three months ended March 31, 2024, certain members have redeemed Class A units in BGLH in accordance with their special redemption rights for aggregate cash payments of $5.1 million. BGLH distributed $0.3 million with respect to its Class C units (or Founders Equity Share) in connection with these special redemptions of Class A units. All of such amounts were received by BG Cold. The corresponding amount paid or borne by our company, our operating partnership and Lineage Holdings to fund these BGLH redemptions and distributions to date in 2024 was $5.4 million. There were no similar special redemptions of Class A units in BGLH during the years ended December 31, 2023, 2022 or 2021.
Lineage OP
Certain members of Lineage OP have special one-time redemption rights to redeem some or all of their Class A units in Lineage OP for cash at a minimum value as set out in the operating agreement of Lineage OP. In connection with such redemptions, BG Cold, an entity indirectly controlled by Messrs. Forste and Marchetti, is entitled to receive Class C distributions (or Founders Equity Share) on any redeemed Class A units.
Each time a redemption is made at Lineage OP, Lineage OP makes a corresponding redemption of its equity in Lineage Holdings.
During the three months ended March 31, 2024, certain members have redeemed units in Lineage OP in accordance with their special redemption rights for aggregate cash payments of $6.3 million. Lineage OP distributed $0.4 million with respect to its Class C units (or Founders Equity Share) in connection with these
295
Table of Contents
special redemptions of Class A units. All of such amounts were received by BG Cold. The corresponding amount paid or borne by Lineage Holdings to fund these Lineage OP redemptions and distributions to date in 2024 was $6.6 million. There were no similar special redemptions of Class A units in Lineage OP during the years ended December 31, 2023, 2022 or 2021.
Acquisition of Turvo, Inc.
On June 1, 2022, we acquired all the outstanding equity interests of Turvo, Inc. (“Turvo”) for total consideration of $210.0 million, comprised of $154.6 million of cash and the issuance of $55.4 million of equity in BGLH. BGLH contributed the equity interests of Turvo to us for an equal number of shares of our common stock. Prior to our acquisition of Turvo, and in connection with our pre-acquisition investments in Turvo, Mr. Forste and Mr. Thattai had invested in Turvo, and each of Mr. Forste and Mr. Thattai received directly or through his personal holding entities approximately $0.2 million in exchange for his equity interests upon our acquisition of Turvo.
Emergent Cold LatAm Holdings LLC
As of March 31, 2024, Lineage owned 9.0% of the investment interests in Emergent Cold LatAm Holdings LLC (“Emergent Cold LatAm” or “LatAm”) as well as a right to receive an additional portion of certain profits generated by Emergent Cold LatAm, which could represent anywhere from zero to 10% of the additional profits generated on invested capital. In addition, Mr. Forste beneficially owns investment interests representing less than 1.0% of Emergent Cold LatAm and serves as chairman of the board of directors of Emergent Cold LatAm. Certain of our legacy investors, including affiliates of Stonepeak and D1 Capital, also beneficially own investment interests in Emergent Cold LatAm, and certain persons affiliated with Stonepeak and D1 Capital hold seats on the board of directors of Emergent Cold LatAm. Neither we nor Mr. Forste control Emergent Cold LatAm. We have an option to purchase Emergent Cold LatAm through June 23, 2027.
Purchases in Directed Share Program
Certain of our directors, officers and employees, friends and family members of certain of our directors and officers, individuals associated with certain of our customers, vendors, landlords and service providers and certain of our legacy investors, former owners of acquired companies and properties and other industry partners will be able to purchase shares of our common stock in the directed share program. See “Underwriters.” All purchases of common stock in the directed share program will be at the public offering price. Purchases by any related persons participating in the directed share program may individually exceed $120,000.
Statement of Policy Regarding Transactions with Related Persons
Upon completion of this offering, we will adopt a written statement of policy regarding transactions with related persons, which we refer to as our “related person policy.” Our related person policy requires that a “related person” (as defined as in paragraph (a) of Item 404 of Regulation S-K) must promptly disclose to us any “related person transaction” (defined as any transaction that is anticipated would be reportable by us under Item 404(a) of Regulation S-K in which we were or are to be a participant and the amount involved exceeds $120,000 and in which any related person had or will have a direct or indirect material interest) and all material facts with respect thereto. We will then promptly communicate that information to our audit committee. No related person transaction will be executed without the approval or ratification of our audit committee. It is our policy that directors interested in a related person transaction will recuse themselves from any vote on a related person transaction in which they have an interest.
296
Table of Contents
STRUCTURE AND FORMATION OF OUR COMPANY
Formation Transactions
Prior to or simultaneously with the completion of this offering, we will engage in formation transactions, which are designed to facilitate this offering. Through the formation transactions, the following have occurred or will occur prior to or concurrently with the completion of this offering.
Operating Partnership Conversion and Reclassification of Units
• | Lineage OP, LLC will convert from a Delaware limited liability company to a Maryland limited partnership, change its name to Lineage OP, LP and adopt the Agreement of Limited Partnership pursuant to which, among other things: |
(i) | We will become Lineage OP, LP’s sole general partner. |
(ii) | All operating partnership units that are owned by our company—all of which are currently classified as Lineage OP Class A units—will be reclassified into OP units. |
(iii) | All operating partnership units that are not owned by our company—all of which are currently classified as Lineage OP Class A units, Lineage OP Class B units or Lineage OP Class C units—will be reclassified into Legacy OP Units with various subclasses, each of which will have certain terms that differ from OP units in order to continue pre-existing rights of Lineage OP, LLC’s members for a period of up to three years following the initial closing of this offering, as described below. This also allows a coordinated settlement process to be conducted for our legacy equity holders as described below. |
(A) | Legacy Class A OP Units. |
• | Prior to the offering, each Lineage OP Class A unit that is not owned by our company is paired with a corresponding Lineage OP Class C unit interest that is entitled to a share of the profits in respect of that Lineage OP Class A unit. These Lineage OP Class A units are owned by various legacy investors that pre-exist this offering, and the Lineage OP Class C unit interest in respect of each Lineage OP Class A unit is owned by BG Cold in order to provide BG Cold with profit sharing on the success of each Lineage OP Class A unit. We refer to this profit sharing as the Founders Equity Share, and this profit sharing applies solely to legacy equity that pre-exists this offering. |
• | Through the formation transactions, each pre-existing Lineage OP Class A unit that is not owned by our company, and the corresponding pre-existing Lineage OP Class C unit interest that is paired with such Lineage OP Class A unit, will be reclassified together into a single Legacy Class A OP Unit with two legally separate sub-units that comprise such single Legacy Class A OP Unit. The single Legacy Class A OP Unit into which they are reclassified, and its sub-unit components, are new classifications that will be created as part of the formation transactions when Lineage OP, LLC converts into the limited partnership that serves as our operating partnership. |
• | The two sub-units that comprise a single Legacy Class A OP Unit are legally separate interests referred to as the “A-Piece Sub-Unit” and the “C-Piece Sub-Unit.” The A-Piece Sub-Units and the C-Piece Sub-Units each retain the economic characteristics of the former Lineage OP Class A units and Lineage OP Class C units, respectively. The A-Piece Sub-Units and C-Piece Sub-Units will continue a historic calculation applicable solely to our legacy investors that determines how the holders of the A-Piece Sub-Units and the holders of the C-Piece Sub-Units will share in the settlement of Legacy Class A OP Units when they are ultimately reclassified into OP units. This enables BG Cold to continue accruing the Founders Equity Share in order to align the economic interests of our Co-Founders with the performance of our shares and OP units when our legacy investors settle their pre-existing equity and have the option to achieve liquidity. |
297
Table of Contents
• | Each Legacy Class A OP Unit will be designated to one of four sub-class demarcations: Legacy Class A-1, Legacy Class A-2, Legacy Class A-3 or Legacy Class A-4, which provide for different calculations as between the sub-unit holders within a given Legacy Class A OP Unit to determine what share of a Legacy Class A OP Unit belongs to the A-Piece Sub-Unit holder and what share belongs to the C-Piece Sub-Unit holder. |
• | Except as set forth in the following sentence, each Legacy Class A OP Unit regardless of sub-class will be economically equivalent to one OP unit, meaning that one Legacy Class A OP Unit will have the same value and represent the same share of equity in our operating partnership as an OP unit. The Legacy Class A-4 OP Units may be an exception to this because they have a special one-time redemption right that the holders of such units may exercise during a 45-day window beginning on March 1, 2025 at a guaranteed minimum value that may exceed the value of an OP unit. This special redemption right allows the holders of Legacy Class A-4 OP Units to (1) redeem any or all of the Legacy Class A-4 OP Units at a guaranteed minimum price ranging between $106.59 and $113.25 per unit depending on our share price at that time (less certain distributions received after June 26, 2024) or, if greater, the then-current fair market value of the Legacy Class A-4 OP Units to be redeemed or (2) during the same window, receive a one-time true-up paid in cash or through the issuance of new Legacy Class A-4 OP Units or new OP units (or any combination of cash and units) in the amount by which the guaranteed minimum value of $106.59 per unit (less certain distributions received after June 26, 2024) exceeds the then-current fair market value of the Legacy Class A-4 OP Units (if at all). Legacy Class A-4 OP Units can also be reclassified into an equal number of OP units at any time as may be agreed by the holders of Legacy Class A-4 OP Units and the LHR, or under certain other circumstances at the discretion of the LHR acting as representative of such holders. Immediately following the formation transactions, there will be 319,006 outstanding Legacy Class A-4 OP Units. |
• | Each Legacy Class A OP Unit will have the same voting rights and voting power as an OP unit. The LHR will be appointed by each holder of Legacy Class A OP Units to exercise the voting power for all Legacy Class A OP Units until they are reclassified into OP units. |
• | Legacy Class A OP Units can be reclassified into an equal number of OP units at any time at the discretion of the LHR, acting as representative of the holders of Legacy Class A OP Units, and all such units will from time to time between the initial closing of this offering and the third anniversary of the initial closing of this offering be so reclassified. Whenever Legacy Class A OP Units are reclassified into OP units, the holders of A-Piece Sub-Units and the holders of C-Piece Sub-Units will each separately receive their respective shares of the OP units into which the Legacy Class A OP Units are reclassified, according to formulas that fix their respective sharing in such reclassified OP units. The total number of OP units will nevertheless remain constant with the number of Legacy Class A OP Units that have been so reclassified, except as described above for up to 319,006 Legacy Class A-4 OP Units. |
(B) | Legacy Class B OP Units. |
• | Prior to the offering, all Lineage OP Class B units are owned by various legacy investors that pre-exist this offering, and such units do not bear any Founders Equity Share. |
• | Through the formation transactions, each pre-existing Lineage OP Class B unit will be reclassified into a Legacy Class B OP Unit. Legacy Class B OP Units will not be subject to any Founders Equity Share and will not have any separate A-Piece Sub-Units or C-Piece Sub-Units. |
• | The Legacy Class B OP Units retain the economic characteristics of the former Lineage OP Class B units. |
298
Table of Contents
• | Each Legacy Class B OP Unit will be economically equivalent to one OP unit, meaning that one Legacy Class B OP Unit will have the same value and represent the same share of equity in our operating partnership as an OP unit. |
• | Each Legacy Class B OP Unit will have the same voting rights and voting power as an OP unit. The LHR will be appointed by each holder of Legacy Class B OP Units to exercise the voting power for all Legacy Class B OP Units until they are reclassified into OP units. |
• | Legacy Class B OP Units can be reclassified into an equal number of OP units at any time at the discretion of the LHR, acting as representative of the holders of Legacy Class B OP Units, and all such units will from time to time between the initial closing of this offering and the third anniversary of the initial closing of this offering be so reclassified. |
(iv) | The LHR will be appointed by each holder of Legacy OP Units as its representative (A) to administer on its behalf a coordinated settlement process for all legacy equity as described in the next paragraph (clause (v)) below and (B) to exercise the voting rights attributable to Legacy OP Units on various matters for so long as Legacy OP Units exist and have not been reclassified into OP units. |
(v) | BGLH, on its own behalf, and the LHR (an affiliate of BGLH) on behalf of the holders of Legacy OP Units, will administer a coordinated settlement process for the settlement of all legacy BGLH equity and all legacy operating partnership equity in cash, in our shares, in OP units or any combination of the foregoing, as elected by each of our legacy investors, over a period of up to three years following the first closing of our offering. By the end of this up-to-three-year period, BGLH will no longer be our controlling stockholder and the Legacy OP Units will no longer exist. At some point after this coordinated liquidity and settlement period is complete, BGLH intends to dissolve, liquidate and terminate its existence, as all legacy investors will either be direct holders in the company or our operating partnership, or they will have disposed of their shares and OP units. |
Historic Management Incentive Equity
Prior to this offering, certain of our current and former officers and employees hold LMEP Units through two incentive equity pooling entities, LLH MGMT Profits, LLC and LLH MGMT Profits II, LLC, which each hold corresponding historic accrued management incentive equity interests in Lineage Holdings for the benefit of these officers and employees. As part of the formation transactions, we will have purchased in exchange for 80,950 shares of our common stock the vested awards of LMEP Units valued at less than $3.0 million per individual that are held by certain of our officers and employees who are not named executive officers. After such purchase, each of LLH MGMT Profits, LLC and LLH MGMT Profits II, LLC will contribute its vested management incentive equity interests in Lineage Holdings to our operating partnership in exchange for 2,204,162 Legacy Class B OP Units. This results in the vested LMEP Units not purchased by us becoming a fixed number of Legacy Class B OP Units prior to such time as the LMEP Units would otherwise be paid pursuant to their rights under the terms of the existing awards. Following the contribution, each of LLH MGMT Profits, LLC and LLH MGMT Profits II, LLC will distribute the Legacy Class B OP Units to its members, including certain of our officers and employees whose LMEP Units are not purchased in exchange for shares of our common stock, in complete liquidation of each such entity. Following such distribution, officers, employees and others to whom such Legacy Class B OP Units are distributed will continue to hold such Legacy Class B OP Units subject to settlement over a period of up to three years as part of the same settlement process that applies to all of our legacy investor equity. All outstanding LMEP Units that remain unvested as of the date of such contribution and distribution will automatically terminate at such time and will be replaced with equity-based awards under the 2024 Plan. For additional information on these awards, see “—Benefits to Related Parties.” In addition, all BGLH Restricted Units that remain unvested as of immediately prior to the completion of this offering will automatically vest in full at such time.
299
Table of Contents
Internalization of Bay Grove Services
• | We are internalizing certain operating, consulting, strategic development and financial services that have historically been provided by Bay Grove. Prior to this offering, Bay Grove provides operating services to Lineage Holdings pursuant to a perpetual operating services agreement, and Bay Grove also holds a profits interest at Lineage Holdings that entitles Bay Grove to quarterly profits interest equity accruals (the “equity accrual right”). In connection with this internalization, we will have terminated that operating services agreement between Lineage Holdings and Bay Grove and we will have terminated all rights of Bay Grove to accrue additional future profits interests at Lineage Holdings pursuant to the equity accrual right. In exchange for these terminations, Bay Grove will receive a one-time increase in its profit share attributable to the existing profits interest it holds in Lineage Holdings equal to $200.0 million, approximately $14.0 million of which will instead be allocated to our operating partnership in settlement of prior distribution advances made to Bay Grove, its owners and their affiliates (with such amount becoming part of our operating partnership’s equity holdings in Lineage Holdings, and such amount also restoring other distribution rights of Bay Grove, its owners and their affiliates through our operating partnership and BGLH in the same amount) and the remaining approximately $186.0 million of which will be reclassified into 2,447,990 OPEUs held by Bay Grove. In connection with such one-time net increase in Bay Grove’s profits interest and corresponding reclassification of a portion of that amount into a fixed number of OPEUs, there will be a corresponding reduction to the interests in BGLH held by Bay Grove’s owners and their affiliates to effect a true-up for a portion of this increase, the effect of which is that Bay Grove’s net increase in equity (taking into account both its direct interests in Lineage Holdings and the reduction in interests held by Bay Grove’s owners and their affiliates in BGLH) is $133.4 rather than $200.0 million. |
• | Also in connection with the internalization described above, following the one-time net increase in Bay Grove’s profits interest and corresponding reclassification of a portion of that amount into a fixed number of OPEUs described immediately above, Lineage Holdings will repurchase 986,842 OPEUs from Bay Grove for cash in the amount of $75.0 million. |
• | The remaining 1,461,148 OPEUs will be exchangeable in the future (after a two-year initial holding period) on a one-for-one basis for OP units, subject to certain adjustments, and no additional OPEUs will be created in respect of any equity accrual right after the formation transactions have been completed. OP units issued in exchange for such OPEUs will not be redeemable until after the settlement of all legacy BGLH equity and all Legacy OP Units. |
• | We will amend the operating agreement of Lineage Holdings to reflect the resulting ownership of Lineage Holdings by our operating partnership and Bay Grove after giving effect to these transactions. |
• | We will have entered into a transition services agreement with Bay Grove for a period of three years for certain transition services supporting capital deployment and mergers and acquisitions activity to help us build our full internal capability during that period. |
Rollover Put Option
• | Certain sellers of assets we acquired who previously received rollover equity in BGLH or Lineage OP were provided with separate classes of equity of BGLH or Lineage OP that included special one-time redemption features with minimum value guarantees and in some cases the alternative option to elect cash or equity top-up rights to achieve a certain minimum equity valuation at a specific date (collectively, the “Guarantee Rights”). To ensure that the financial obligations associated with all Guarantee Rights proportionately impact investors at Lineage, our operating partnership, and Lineage Holdings, each of those entities has agreed to provide successive special repurchase rights and cash and equity top-up rights to such legacy investors that mirror those given by BGLH to its investors (the “Rollover Holder Put Option”) and those given by Lineage OP to its investors, in each case in connection with the Guarantee Rights (the “Lineage OP Put Option”). For more information, see “Certain Relationships and Related Party Transactions—Put Option Agreement.” |
300
Table of Contents
Contribution of Offering Net Proceeds
• | We will contribute the net proceeds from this offering to our operating partnership and receive 47,000,000 OP units (or 54,050,000 OP units if the underwriters exercise their option to purchase up to an additional 7,050,000 shares of our common stock in full), resulting in a 90.4% ownership interest in the operating partnership (90.7% if the underwriters exercise their option to purchase up to an additional 7,050,000 shares of our common stock in full), with holders of Legacy OP Units and Lineage management holding 8.7% and 0.9% ownership interests in the operating partnership, respectively (8.4% and 0.9% if the underwriters exercise their option to purchase up to an additional 7,050,000 shares of our common stock in full). |
• | In connection with this offering, we will redeem our outstanding Series A preferred stock for $0.6 million in cash plus any accrued but unpaid dividends. |
Consequences of this Offering and the Formation Transactions
Upon completion of this offering and the formation transactions (but prior to the issuance of any new shares of our common stock pursuant to the post-offering transactions outlined below):
• | Purchasers of shares of our common stock in this offering will own 22.4% of the outstanding shares of our common stock. If the underwriters exercise their option to purchase up to an additional 7,050,000 shares of our common stock in full, purchasers of shares of our common stock in this offering will own 24.9% of the outstanding shares of our common stock. |
• | BGLH will own 77.1% of the outstanding shares of our common stock. |
• | Affiliates of Bay Grove will beneficially own 10.1% of the outstanding OP units (or 9.8% if the underwriters exercise their option to purchase up to an additional 7,050,000 shares of our common stock in full) (in each case, including (i) 22,232,708 OP units into which Legacy OP Units, over which the LHR, an affiliate of Bay Grove, has voting and dispositive power, will ultimately be reclassified and (ii) 1,461,148 OP units issuable upon exchange of OPEUs owned by affiliates of Bay Grove). |
• | We will contribute the net proceeds from this offering to our operating partnership in exchange for 47,000,000 OP units (or 54,050,000 OP units if the underwriters exercise their option to purchase up to an additional 7,050,000 shares of our common stock in full), resulting in a 90.4% ownership interest in the operating partnership (90.7% if the underwriters exercise their option to purchase up to an additional 7,050,000 shares of our common stock in full) (in each case, excluding 1,461,148 OP units issuable upon exchange of OPEUs). |
• | As of March 31, 2024, on a pro forma basis, we had approximately $6.1 billion of indebtedness outstanding. |
Post-Offering Transactions
Coordinated Settlement Process for Legacy Pre-Offering Investors
BGLH and Legacy OP Unit Settlements. Following the initial closing of this offering: (1) BGLH intends to wind down its holding of our shares over a period of up to three years, during which it will settle all legacy investor equity held through BGLH; and (2) our operating partnership intends to settle all legacy investor equity held through the Legacy OP Unit class and ultimately eliminate the Legacy OP Unit class altogether. To do this, during this up-to-three-year period:
• | BGLH. BGLH generally expects to distribute our shares in kind to its investors in settlement of their equity interests in BGLH. These investors will have made elections as to whether they want a Cash Settlement or whether they instead want a Securities Settlement. The Cash Settlement option, pursuant to which we will repurchase shares of our common stock from such investors, occurs for each share as a one-time event with respect to that share based on the Cash Settlement event that we arrange; there is no ongoing option to cash settle a previously-received share at a later date of an investor’s choosing through a repurchase by our company. The settlement of all |
301
Table of Contents
legacy investor equity held through BGLH is currently intended to be effected through multiple installments of Cash Settlements and Securities Settlements, until all legacy investor equity held through BGLH has been settled in this manner, at such times and in such amounts (over an up-to-three-year period) as BGLH may determine in its sole discretion, but BGLH could also determine in its sole discretion to effect the settlement of all legacy BGLH equity through fewer installments or in a single event at any time. If any legacy investor equity held through BGLH has not been settled by the third anniversary of the initial closing of this offering, we expect that BGLH would effect a final Securities Settlement at that time. BGLH could also effect a final Securities Settlement on any earlier date in its sole discretion. |
• | Operating Partnership. Our operating partnership will first reclassify certain Legacy OP Units into OP units at various times as directed by the LHR acting on behalf of the various Legacy OP Unit holders, in settlement of the corresponding Legacy OP Units. The Legacy OP Unit holders will have made elections as to whether they want to sell their OP units to us for cash in connection with liquidity that we arrange (also, a “Cash Settlement”), or whether they instead desire to continue holding the OP units (also, a “Securities Settlement”) until such time as they individually determine to arrange their own dispositions or pursue their own redemptions under our standard operating partnership redemption provisions. The Cash Settlement option occurs for each OP unit as a one-time event with respect that that OP unit based on the Cash Settlement event that we arrange; there is no ongoing option to cash settle a previously-received OP unit at a later date of an investor’s choosing through a purchase by our company (however, the holders of such OP units would be permitted to avail themselves of our standard operating partnership redemption opportunities, which could result in the receipt of cash or shares at our option). The settlement of all Legacy OP Units is currently intended to be effected through multiple installments of Cash Settlements and Securities Settlements, until all Legacy OP Units have been settled in this manner, at such times and in such amounts (over an up-to-three-year period) as the LHR, acting on behalf of each of the all Legacy OP Unit holders, may determine in its sole discretion, but the LHR could also determine in its sole discretion to effect the settlement of all Legacy OP Units through fewer installments or in a single event at any time. If any Legacy OP Units have not been settled by the third anniversary of the initial closing of this offering, we expect that the LHR would effect a final Securities Settlement at that time. The LHR could also effect a final Securities Settlement on any earlier date in its sole discretion. |
Settlement Elections. BGLH’s investors and Legacy OP Unit holders will generally be permitted to change their elections regarding Cash Settlement, Securities Settlement or any combination thereof at any time with respect to legacy BGLH equity and Legacy OP Units that have not yet been settled, subject to certain administrative limitations established by BGLH or the LHR, as applicable. BGLH will in all cases determine the amount available for Cash Settlements and Securities Settlements in respect of BGLH equity at any given time, and the LHR will in all cases determine the amount available for Cash Settlements and Securities Settlements in respect of the Legacy OP Units at any given time. BGLH will have a contractual right to require us to conduct offerings of shares of our common stock from time to time in order to facilitate Cash Settlements in the amounts and times desired by BGLH, or desired by the LHR (an affiliate of BGLH), acting on behalf of the Legacy OP Unit holders, as applicable. In certain situations where BGLH or the LHR, as applicable, determines that it must limit the available amount of Securities Settlements relative to the available amount of Cash Settlements in order to further the goal of optimizing post-offering share price performance, BGLH or the LHR, as applicable, may determine to effect cutbacks of the Securities Settlements to those BGLH investors and Legacy OP Unit holders that have elected to receive Securities Settlements. In the event such cutbacks are determined, the impacted BGLH investors and Legacy OP Unit holders will continue to hold the same BGLH units or Legacy OP Units they held prior to the cutback, and those securities will remain eligible for proportionate participation in each future settlement event. In the event that such cutback interests are not able to be settled in securities at future interim settlement events, such settlement in securities could be delayed until the final settlement event occurs up to three years after the first closing of this offering. Each BGLH investor and each Legacy OP Unit holder has had the option to
302
Table of Contents
elect whether it wants to settle the Founders Equity Share with respect to any cutback amounts at the time of such cutback (rather than at the time of the actual Securities Settlement applicable to the cutback amounts); except in circumstances where (a) Guarantee Rights result in repurchases or top-ups of shares held by BGLH at a valuation above their fair market value (as described in “Certain Relationships and Related Party Transactions—Put Option Agreement”) or (b) Legacy Class A-4 OP Units are repurchased or topped up at a valuation above their fair market value (as described in “Structure and Formation of Our Company—Formation Transactions—Operating Partnership Conversion and Reclassification of Units”), the settlement of Founders Equity Share in all other situations occurs either (i) within BGLH’s existing equity and does not dilute any of our investors or any investors in our operating partnership, other than solely our legacy investors who own BGLH equity or (ii) within the existing Legacy OP Unit equity and does not dilute any of our investors or any investors in our operating partnership, other than solely our Legacy OP Unit holders.
After the third anniversary of the initial closing of this offering, all rights to receive the Founders Equity Share are expected to terminate, and we currently expect that (1) BGLH will cease to hold any of our shares at that point and (2) the Legacy OP Unit class will cease to exist at that point.
Settlement of Founders Equity Share. The Founders Equity Share will be settled on a unit-by-unit basis for each BGLH unit and each Legacy Class A OP Unit at the time of the applicable settlement event for that unit. BG Cold has the same options that the legacy BGLH investors and Legacy OP Unit holders have to elect among Cash Settlement, Securities Settlement or a combination of both in respect of its Founders Equity Share settlements for BGLH equity and for Legacy OP Units. In the case of Legacy OP Unit settlements, BG Cold as holder of the Founders Equity Share, or C-Piece Sub-Unit, will receive a portion of the reclassified OP units which portion is calculated pursuant to the applicable formula that pertains to the relevant Legacy Class A OP Units being reclassified. Except in circumstances where (a) Guarantee Rights result in repurchases or top-ups of shares held by BGLH at a valuation above their fair market value (as described in “Certain Relationships and Related Party Transactions—Put Option Agreement”) or (b) Legacy Class A-4 OP Units are repurchased or topped up at a valuation above their fair market value (as described in “Structure and Formation of Our Company—Formation Transactions—Operating Partnership Conversion and Reclassification of Units”), (1) the Founders Equity Share settlements dilute only the legacy BGLH investors and the Legacy OP Unit holders, as these settlements are all made within the existing pool of shares owned by BGLH and the existing one-to-one reclassification that otherwise occurs as between a Legacy OP Unit and an OP unit, and (2) Founder Equity Share settlements do not result in any dilution to investors that have acquired shares or OP units through this offering.
Settlement of Small Holders. On the date that is 30 days following the initial closing of this offering, certain small holders in BGLH and our operating partnership will receive an aggregate of 4,465,640 shares of our common stock or an aggregate of 984,103 OP units, as applicable, in full settlement of their equity interests in BGLH or our operating partnership, as applicable. Small holders will receive shares of our common stock that will be considered “restricted” securities under the meaning of Rule 144 under the Securities Act. Accordingly, small holders will need to hold such shares of common stock for at least six months before being entitled to sell such shares under Rule 144. See “Shares Available for Future Sale—Rule 144.”
303
Table of Contents
The following chart sets forth information about our company, our operating partnership, certain related parties and the ownership interests therein on a pro forma basis after giving effect to the formation transactions. Ownership percentages in our company and our operating partnership are presented based on the assumption that the underwriters’ option to purchase additional shares is not exercised and the other assumptions regarding the number of shares of our common stock and OP units to be outstanding after this offering and the formation transactions described under the heading “The Offering.”
(1) | OP units in our operating partnership are redeemable for cash or, at our option, exchangeable for common shares on a one-for-one basis, subject to certain adjustments, beginning 14 months after the original issuance of such units (other than OP units that were previously classified as Legacy OP Units, which generally have such redemption rights at any time after their reclassification into OP units and are not subject to such 14-month waiting period). |
(2) | Except for the one-time special redemption and top-up rights with respect to 319,006 Legacy Class A-4 OP Units as described under “—Formation Transactions—Operating Partnership Conversion and Reclassification of Units,” each Legacy Class A OP Unit is economically equivalent to one OP unit, meaning that one Legacy Class A OP Unit will have the same value and represent the same share of our operating partnership’s equity as an OP Unit. Legacy Class A OP Units can generally be reclassified into an equal number of OP units at any time at the discretion of the LHR, and they will all ultimately be so reclassified by the third anniversary of the initial closing of this offering. Each Legacy Class A OP Unit will also have the same voting rights and voting power as an OP unit; however, the LHR will have voting and dispositive power over each Legacy Class A OP Unit until it is reclassified into an OP unit. After giving effect to the completion of the formation transactions, our operating partnership will have 11,593,846 Legacy Class A OP Units outstanding. |
304
Table of Contents
(3) | Each Legacy Class B OP Unit is economically equivalent to one OP unit, meaning that one Legacy Class B OP Unit will have the same value and represent the same share of our operating partnership’s equity as an OP Unit. Legacy Class B OP Units can generally be reclassified into an equal number of OP units at any time at the discretion of the LHR, and they will all ultimately be so reclassified by the third anniversary of the initial closing of this offering. Each Legacy Class B OP Unit will also have the same voting rights and voting power as an OP unit; however, the LHR will have voting and dispositive power over each Legacy Class B OP Unit until it is reclassified into an OP unit. After giving effect to the completion of the formation transactions, our operating partnership will have 10,638,862 Legacy Class B OP Units outstanding. |
(4) | OPEUs will be exchangeable at the election of BG Maverick, LLC, an affiliate of Bay Grove, for OP units on a one-for-one basis, subject to adjustment in certain circumstances, at any time beginning two years after the initial closing date of this offering. Holders of OP units issued in exchange for such OPEUs, which will include Messrs. Forste and Marchetti or their affiliates, will not be able to redeem OP units until after the settlement of all legacy BGLH equity and all Legacy OP Units. After giving effect to the completion of the formation transactions, Lineage Holdings will have 1,461,148 OPEUs outstanding. |
Benefits to Related Parties
Upon completion of this offering and the formation transactions, Bay Grove, our directors, executive officers and employees will receive material benefits, including the following:
• | BG Cold will hold a continuing right to receive the Founders Equity Share from our operating partnership through its C-Piece Sub-Units in the Legacy Class A OP Units and similar amounts from BGLH, our majority stockholder, as described in “Certain Relationships and Related Party Transactions—Transactions with BG Lineage Holdings, LLC” and “Certain Relationships and Related Party Transactions—Transactions with Lineage OP, LLC.” However, BG Cold will no longer receive advance distributions against the Founders Equity Share, which were historically received prior to the formation transactions. All such rights to advances will terminate in connection with the formation transactions. See “Certain Relationships and Related Party Transactions—Transactions with BG Lineage Holdings, LLC,” “Certain Relationships and Related Party Transactions—Transactions with Lineage OP, LLC” and “Description of the Partnership Agreement of Lineage OP, LP—Legacy OP Units—Legacy Class A OP Units.” |
• | Affiliates of Bay Grove will continue to hold 71.3% of the Legacy Class B OP Units of our operating partnership. See “Description of the Partnership Agreement of Lineage OP, LP—Legacy OP Units—Legacy Class B OP Units.” |
• | The stockholders agreement will provide that we, on our own behalf and in our capacity as the general partner of our operating partnership, must use commercially reasonable efforts to (i) structure certain significant exit transactions (including mergers, consolidations and sales of substantially all of our assets or the assets of our operating partnership and its subsidiaries) in a manner that is tax-deferred to Messrs. Marchetti and Forste, their respective estate planning vehicles, family members and controlled affiliates, does not cause such parties to recognize gain for federal income tax purposes, and provides for substantially similar tax protections after such transactions, and (ii) cause our operating partnership or its subsidiaries to continuously maintain sufficient levels of indebtedness that are allocable for federal income tax purposes to Messrs. Marchetti and Forste and their respective personal holding entities to prevent them from recognizing gain as a result of any negative tax capital account or insufficient debt allocation, provided that such amount of debt shall not be required to exceed the amount allocable to the parties immediately following this offering, subject to certain exceptions. See “Certain Relationships and Related Party Transactions—Stockholders Agreement.” |
• | Bay Grove will have received a one-time increase in its profit share attributable to the existing profits interest it holds in Lineage Holdings equal to $200.0 million, approximately $14.0 million of which will instead have been allocated to our operating partnership in settlement of prior distribution advances made to Bay Grove, its owners and their affiliates (with such amount becoming part of our operating partnership’s |
305
Table of Contents
equity holdings in Lineage Holdings, and such amount also restoring other distribution rights of Bay Grove, its owners and their affiliates through our operating partnership and BGLH in the same amount) and the remaining approximately $186.0 million of which will have been reclassified into 2,447,990 OPEUs held by Bay Grove. See “—Formation Transactions.” |
• | Affiliates of Bay Grove will have received $75.0 million in cash from Lineage Holdings’ repurchase of 986,842 OPEUs from Bay Grove pursuant to the formation transactions, and affiliates of Bay Grove will continue to hold the remaining OPEUs that have not been repurchased pursuant to the formation transactions. See “—Formation Transactions.” |
• | BGLH will receive $0.5 million in cash, plus any accrued but unpaid dividends, in connection with the redemption of our Series A preferred stock. |
• | We will have entered into a transition services agreement with Bay Grove, pursuant to which (1) Bay Grove will provide us with certain transition services supporting capital deployment and mergers and acquisitions activity for three years following the closing of this offering to help us build our full internal capability during that period, and (2) we will pay Bay Grove an annual fee equal to $8.0 million. See “Certain Relationships and Related Party Transactions—Transactions with Bay Grove—Operating Services Agreement” and “Certain Relationships and Related Party Transactions—Transition Services Agreement.” |
• | We will have entered into a registration rights agreement with BGLH, pursuant to which we will grant it and certain of its affiliates with certain “demand” registration rights and customary “piggyback” registration rights. We will also have entered into one or more registration rights agreements with Mr. Forste and Mr. Marchetti, pursuant to which we will grant them with certain registration rights. See “Certain Relationships and Related Party Transactions—Registration Rights Agreements.” |
• | We, our operating partnership and Lineage Holdings will have entered into an agreement providing successive special repurchase rights and cash and equity top-up rights to certain legacy investors that benefits BGLH by ensuring that all Guarantee Rights will ultimately be satisfied by Lineage Holdings so that all investors in BGLH, our company, our operating partnership and Lineage Holdings are proportionately impacted by the Guarantee Rights based on their direct and indirect ownership interests in Lineage Holdings. This dilution is not solely borne by pre-offering investors; instead it affects all investors. For more information, see “Certain Relationships and Related Party Transactions—Put Option Agreement.” |
• | Lineage Holdings will have entered into an expense reimbursement and indemnification agreement with BGLH, the LHR and Bay Grove, pursuant to which Lineage Holdings will agree to (i) advance to or reimburse such entities for all their expenses in any way related to our company, including expenses incurred in connection with the coordinated settlement process that will occur for up to three years for all legacy investors in both BGLH and our operating partnership and (ii) indemnify such entities to the fullest extent permitted by applicable law against liabilities that may arise in any way related to our company, including liabilities incurred in connection with or as a result of the coordinated settlement process. See “Certain Relationships and Related Party Transactions—Indemnification Agreements—Bay Grove.” |
• | We will have entered into indemnification agreements with each of our directors and executive officers providing for the indemnification by us for certain liabilities and expenses incurred as a result of actions brought, or threatened to be brought, against our directors and executive officers in their capacities as such. |
• | We will have entered into certain agreements with Messrs. Forste and Marchetti, pursuant to which Messrs. Forste and Marchetti will agree that for a period of three years following the completion of this offering (or, if less, such period during which they directly or indirectly own any equity in our company) they will not compete with our business. |
• | We will have purchased in exchange for 80,950 shares of our common stock the vested awards of LMEP Units valued at less than $3.0 million per individual that are held by certain of our current and |
306
Table of Contents
former officers who are not named executive officers and employees. Thereafter, we will have settled the remaining vested LMEP Units for 2,204,162 Legacy Class B OP Units. This results in the vested LMEP Units not purchased by us becoming a fixed number of Legacy Class B OP Units prior to such time as the LMEP Units would otherwise be paid pursuant to the terms of the existing awards. Following the contribution, each of LLH MGMT Profits, LLC and LLH MGMT Profits II, LLC will distribute the Legacy Class B OP Units to its members, including certain of our officers and employees whose LMEP Units are not purchased in exchange for shares of our common stock, in complete liquidation of each such entity. Following such distribution, officers, employees and others to whom such Legacy Class B OP Units are distributed will generally continue to hold such Legacy Class B OP Units subject to settlement over a period of up to three years as part of the same settlement process that applies to all of our legacy investor equity. As discussed in greater detail below, all outstanding LMEP Units that remain unvested as of the date of such contribution and distribution will automatically terminate at such time and will be replaced with equity-based awards under the 2024 Plan. In addition, all BGLH Restricted Units that remain unvested as of immediately prior to the completion of this offering will automatically vest in full at such time. |
• | We will have adopted the 2024 Plan, under which we will grant cash and equity-based incentive awards to eligible service providers in order to attract, motivate and retain the talent for which we compete. |
• | In connection with the completion of this offering, we will grant certain of our executive officers and employees one-time awards in the form of an aggregate of $52.9 million in cash, 184,946 restricted stock units 1,362,248 shares of our common stock. Such awards will be fully vested at the time of grant, in the case of shares of common stock, or subject to time-based vesting, in the case of restricted stock units. |
• | As discussed above regarding holders of LMEP Units with a value less than $3.0 million, we will issue to certain of our employees, other than our executive officers, an aggregate of 80,950 shares of our common stock. Such awards will be fully vested at the time of issuance. |
• | As discussed above, in connection with the completion of this offering, we will grant certain of our executive officers and employees one-time awards covering an aggregate of 346,722 restricted stock units and 720,041 LTIP units in respect of certain vested LMEP Units and/or the cancellation of unvested LMEP Units. Such awards will be subject to time-based vesting. |
• | As part of our annual equity award program, we will grant certain of our executive officers and employees an aggregate of 2,677,622 restricted stock units and/or LTIP units. Such awards will be subject to time- and/or performance-based vesting. |
• | In connection with the completion of this offering, we will grant certain of our non-employee directors an aggregate of 8,226 restricted stock units. Such awards will be subject to time-based vesting. |
• | In connection with the completion of this offering, we will grant certain of our employees one-time awards covering an aggregate of 657,190 restricted stock units in respect of certain vested LVCP Awards and/or the cancellation of unvested LVCP Awards. Such restricted stock units will be subject to time-based vesting. |
See “Executive Compensation—Treatment of LMEP Units and BGLH Restricted Units in Connection with this Offering” and “Executive Compensation—Equity Awards in Connection with the IPO” for further details.
• | Certain LVCP Awards will vest and be settled in an aggregate of $17.9 million of cash and 179,838 shares of our common stock. |
307
Table of Contents
POLICIES WITH RESPECT TO CERTAIN ACTIVITIES
The following is a discussion of certain of our investment, financing and other policies. These policies have been determined by our board of directors and, in general, may be amended or revised from time to time by our board of directors without a vote of our stockholders.
Investment Policies
Investments in Real Estate or Interests in Real Estate
We conduct substantially all of our investment activities through our operating partnership and its subsidiaries. Our objective is to maximize stockholder value by generating attractive risk-adjusted returns through owning, managing and growing a diversified portfolio of commercially desirable properties. For a discussion of our properties and our acquisition and other strategic objectives, see “Business and Properties.”
We expect to pursue our objective primarily through the ownership by our operating partnership of our existing properties and other acquired properties and assets. We seek to invest primarily in industrial real estate in the form of temperature-controlled warehouses. Our future investment and development activities are not currently limited to any geographic area or property type or to a specified percentage of our assets. While we may diversify in terms of property locations, size and market, we do not have any limit on the amount or percentage of our assets that may be invested in any one property or any one geographic area. We intend to engage in future investment activities in a manner that is consistent with the maintenance of our status as a REIT for federal income tax purposes. In addition, we may purchase assets for long-term investment, expand and improve the properties we presently own or other acquired properties, or sell such properties, in whole or in part, when circumstances warrant.
We may also participate with third parties in property ownership, through joint ventures or other types of co-ownership. These types of investments may permit us to own interests in larger assets without unduly reducing our diversification and, therefore, provide us with flexibility in structuring our portfolio. We will not, however, enter into a joint venture or other partnership arrangement to make an investment that would not otherwise meet our investment policies.
Equity investments in acquired properties may be subject to existing mortgage financing and other indebtedness or to new indebtedness that may be incurred in connection with acquiring or refinancing these properties. Debt service on such financing or indebtedness will have a priority over any distributions with respect to our common stock. Investments are also subject to our policy not to be treated as an “investment company” under the Investment Company Act of 1940, as amended, or the 1940 Act.
Securities of or Interests in Persons Primarily Engaged in Real Estate Activities and Other Issuers
Subject to the percentage of ownership limitations and the income and asset tests necessary for REIT qualification, we may invest in securities of other REITs, other entities engaged in real estate activities or securities of other issuers, including for the purpose of exercising control over such entities. We do not intend that our investments in securities will require us to register as an investment company under the 1940 Act, and we would intend to divest such securities before any such registration would be required.
Investments in Other Securities
Other than as described above, we do not intend to invest in any additional securities such as bonds, preferred stocks or common stock.
Dispositions
In order to maximize the performance and manage the risks within our portfolio, we intend to selectively dispose of any of our properties that we determine are not suitable for long-term investment purposes based upon
308
Table of Contents
management’s review of our portfolio. We will ensure that such action would be in our best interest and consistent with our intention to continue to qualify for taxation as a REIT for U.S. federal income tax purposes.
Financings and Leverage Policy
We anticipate using a number of different sources to finance our acquisitions and operations, including cash flows from operations, asset sales, seller financing, issuance of debt securities, private financings (such as additional bank credit facilities, which may or may not be secured by our assets), property-level mortgage debt, common or preferred equity issuances or any combination of these sources, to the extent available to us, or other sources that may become available from time to time. Any debt that we incur may be recourse or non-recourse and may be secured or unsecured. We also may take advantage of joint venture or other partnering opportunities as such opportunities arise in order to acquire properties that would otherwise be unavailable to us. We may use the proceeds of our borrowings to acquire assets, to refinance existing debt or for general corporate purposes.
Although we are not required to maintain any particular leverage ratio, we intend, when appropriate, to employ prudent amounts of leverage and to use debt as a means of providing additional funds for the acquisition of assets, to refinance existing debt or for general corporate purposes. Our charter and bylaws do not limit the amount of debt that we may incur. Our board of directors has not adopted a policy limiting the total amount of debt that we may incur.
Our board of directors will consider a number of factors in evaluating the amount of debt that we may incur. Our board of directors may from time to time modify its views regarding the appropriate amount of debt financing in light of then-current economic conditions, relative costs of debt and equity capital, market values of our properties, general conditions in the market for debt and equity securities, fluctuations in the market price of our common stock, growth and investment opportunities and other factors. Our decision to use leverage in the future to finance our assets will be at our discretion and will not be subject to the approval of our stockholders.
Equity Capital Policies
To the extent that our board of directors determines to obtain additional capital, we may issue debt or equity securities, including senior securities, retain earnings (subject to provisions in the Code requiring distributions of income to maintain REIT qualification) or pursue a combination of these methods.
Existing stockholders will have no preemptive right to common or preferred stock or units issued in any securities offering by us, and any such offering might cause a dilution of a stockholder’s investment in us. Although we have no current plans to do so, we may in the future issue shares of our common stock or units in our operating partnership in connection with acquisitions of property.
We may, under certain circumstances, purchase shares of our common stock or other securities in the open market or in private transactions with our stockholders, provided that those purchases are approved by our board of directors. Our board of directors has no present intention of causing us to repurchase any shares of our common stock or other securities, and any such action would only be taken in conformity with applicable federal and state laws and the applicable requirements for qualification as a REIT.
Code of Conduct
We have adopted a code of conduct that seeks to identify and mitigate conflicts of interest between our employees, directors and officers and our company. However, we cannot assure you that these policies or provisions of law will always be successful in eliminating or minimizing the influence of such conflicts, and if they are not successful, decisions could be made that might fail to reflect fully the interests of stockholders.
309
Table of Contents
Interested Director Transactions
Pursuant to the MGCL, a contract or other transaction between us and a director or between us and any other corporation or other entity in which any of our directors is a director or has a material financial interest is not void or voidable solely because of such common directorship or interest, the presence of such director at the meeting at which the contract or transaction is authorized, approved or ratified or the counting of the director’s vote in favor thereof, if:
• | the fact of the common directorship or interest is disclosed or known to our board of directors or a committee of our board, and our board or such committee authorizes, approves or ratifies the contract or transaction by the affirmative vote of a majority of disinterested directors, even if the disinterested directors constitute less than a quorum; |
• | the fact of the common directorship or interest is disclosed or known to our stockholders entitled to vote thereon, and the contract or transaction is authorized, approved or ratified by a majority of the votes cast by the stockholders entitled to vote other than the votes of shares owned of record or beneficially by the interested director or corporation, firm or other entity; or |
• | the contract or transaction is fair and reasonable to us. |
Upon completion of this offering, we will adopt a policy regarding transactions between us, our operating partnership or any of our subsidiaries, on the one hand, and any related persons on the other hand, which we refer to as our “related person policy.” Our related person policy requires that a “related person” (as defined as in paragraph (a) of Item 404 of Regulation S-K) must promptly disclose to us any “related person transaction” (defined as any transaction that is anticipated to be reportable by us under Item 404(a) of Regulation S-K in which we were or are to be a participant and the amount involved exceeds $120,000 and in which any related person had or will have a direct or indirect material interest) and all material facts with respect thereto. We will then promptly communicate that information to our board of directors. No related person transaction will be executed without the approval or ratification of our board of directors or a duly authorized committee of our board of directors. Such transaction must be approved by the affirmative vote of a majority of the disinterested directors even if less than a quorum. Where appropriate in the judgment of the disinterested directors, our board of directors may obtain a fairness opinion or engage independent counsel to represent the interests of nonaffiliated securityholders, although our board of directors will have no obligation to do so.
Reporting Policies
We intend to make available to our stockholders our annual reports, including our audited consolidated financial statements. After this offering, we will become subject to the information reporting requirements of the Exchange Act. Pursuant to those requirements, we will be required to file annual and periodic reports, proxy statements and other information, including audited consolidated financial statements, with the SEC.
310
Table of Contents
DESCRIPTION OF THE PARTNERSHIP AGREEMENT OF LINEAGE OP, LP
A summary of the material terms and provisions of the Agreement of Limited Partnership of Lineage OP, LP, which we refer to as the “partnership agreement,” is set forth below. This summary is not complete and is subject to and qualified in its entirety by reference to the applicable provisions of Maryland law and the partnership agreement. For more detail, please refer to the partnership agreement itself, a copy of which is filed as an exhibit to the registration statement of which this prospectus is a part. For purposes of this section, references to “we,” “our,” “us,” “our company” and the “general partner” refer to Lineage, Inc., in our capacity as the general partner or our operating partnership.
General
Upon the completion of this offering and the formation transactions, substantially all of our assets will be held by, and substantially all of our operations will be conducted through, our operating partnership, either directly or through its subsidiaries. The provisions of the partnership agreement described below will be in effect from and after the completion of this offering. We are the general partner of our operating partnership and following the completion of this offering and the formation transactions will directly hold a 90.4% partner interest in our operating partnership (90.7% if the underwriters exercise their option to purchase up to an additional 7,050,000 shares of our common stock in full).
Our operating partnership issues common units, which we refer to as OP units. The common units, or OP units, are not listed on any exchange nor are they quoted on any national market system. Our operating partnership has also issued the Legacy OP Units and a class of preferred equity units, is authorized to issue a class of units of partnership interest designated as LTIP units, and may authorize and issue additional classes of units of partnership interest in the future.
Provisions in the partnership agreement may delay or make more difficult unsolicited acquisitions of us or changes in our control. These provisions could discourage third parties from making proposals involving an unsolicited acquisition of us or change of our control, although some stockholders might consider such proposals, if made, desirable. These provisions also make it more difficult for third parties to alter the management structure of our operating partnership without the concurrence of our board of directors. These provisions include, among others:
• | redemption rights of limited partners and certain assignees of common units and other classes of partnership interests; |
• | transfer restrictions on common units and other classes of partnership interests; |
• | a requirement that we may not be removed as the general partner of our operating partnership without our consent; |
• | our ability in some cases to amend the partnership agreement and to cause our operating partnership to issue preferred partnership interests in our operating partnership with terms that we may determine, in either case, without the approval or consent of any limited partner; and |
• | the right of the limited partners to consent to certain transfers of our general partnership interest (whether by sale, disposition, statutory merger or consolidation, liquidation or otherwise). |
Purpose, Business and Management
Our operating partnership was formed for the purpose of conducting any business, enterprise or activity permitted by or under the Maryland Revised Uniform Limited Partnership Act, or the Act. Our operating partnership may enter into any partnership, joint venture, business trust arrangement, limited liability company or other similar arrangement, subject to any consent rights set forth in our partnership agreement.
311
Table of Contents
In general, our board of directors manages the business and affairs of our operating partnership by directing our business and affairs, in our capacity as the sole general partner of our operating partnership. Except as otherwise expressly provided in the partnership agreement and subject to the rights of holders of any class or series of partnership interest, all management powers over the business and affairs of our operating partnership are exclusively vested in us, in our capacity as the sole general partner of our operating partnership. We may not be removed as the general partner of our operating partnership, with or without cause, without our consent, which we may give or withhold in our sole and absolute discretion.
Restrictions on General Partner’s Authority
The partnership agreement prohibits us, in our capacity as general partner, from taking any action that would make it impossible to carry out the ordinary business of our operating partnership or performing any act that would subject a limited partner to liability as a general partner in any jurisdiction or any other liability except as provided under the partnership agreement or under the Act. We generally may not, without the prior consent of the partners of our operating partnership (including us), amend, modify or terminate the partnership agreement, except for certain amendments described below that require the approval of each affected partner. We may not, in our capacity as the general partner of our operating partnership, without the consent of a majority in interest of the limited partners (excluding us and any limited partner 50% or more of whose equity is owned, directly or indirectly, by us):
• | take any action in contravention of an express provision or limitation of the partnership agreement; |
• | transfer all or any portion of our general partnership interest in our operating partnership or admit any person as a successor general partner, subject to the exceptions described in the section entitled “— Restrictions on Transfers by the General Partner”; or |
• | voluntarily withdraw as the general partner. |
Without the consent of each affected limited partner or in connection with a transfer of all of our interests in our partnership in connection with a merger, consolidation or other combination of our assets with another entity, a sale of all or substantially all of our assets not in the ordinary course of our operating partnership’s business, or a reclassification, recapitalization or change in our outstanding stock permitted without the consent of the limited partners as described below in the section entitled “— Restrictions on Transfers by the General Partner,” or a permitted termination transaction, we may not enter into any contract, mortgage, loan or other agreement that expressly prohibits or restricts us or our operating partnership from performing our or its specific obligations in connection with a redemption of units or expressly prohibits or restricts a limited partner from exercising its redemption rights in full. In addition to any approval or consent required by any other provision of the partnership agreement, we may not, without the consent of each affected partner, amend the partnership agreement or take any other action that would:
• | convert a limited partner interest into a general partner interest (other than as a result of our acquisition of that interest); |
• | adversely modify in any material respect the limited liability of a limited partner; |
• | alter the rights of any partner to receive the distributions to which such partner is entitled, or alter the allocations specified in the partnership agreement, except to the extent permitted by the partnership agreement including in connection with the creation or issuance of any new class or series of partnership interest or to effect or facilitate a permitted termination transaction; |
• | alter or modify the redemption rights of holders of common units (except as permitted under the partnership agreement to effect or facilitate a permitted termination transaction); |
• | alter or modify the provisions governing the transfer of our general partnership interest in our operating partnership (except as permitted under the partnership agreement to effect or facilitate a permitted termination transaction); |
312
Table of Contents
• | remove certain provisions of the partnership agreement relating to the requirements for us to qualify as a REIT or permitting us to avoid paying tax under Sections 857 or 4981 of the Code; or |
• | amend the provisions of the partnership agreement requiring the consent of each affected partner before taking any of the actions described above or the related definitions specified in the partnership agreement (except as permitted under the partnership agreement to effect or facilitate a permitted termination transaction or reflect the issuance of additional partnership interests). |
Additional Limited Partners
We may cause our operating partnership to issue additional units in one or more classes or series or other partnership interests and to admit additional limited partners to our operating partnership from time to time, on such terms and conditions and for such capital contributions as we may establish in our sole and absolute discretion, without the approval or consent of any limited partner.
The partnership agreement authorizes our operating partnership to issue common units, LTIP units and preferred units. Our operating partnership may also issue additional partnership interests in one or more additional classes, or one or more series of any of such classes, with such designations, preferences, conversion and other rights, voting powers, restrictions, limitations as to distributions, qualifications and terms and conditions of redemption (including, without limitation, terms that may be senior or otherwise entitled to preference over existing units) as we may determine, in our sole and absolute discretion, without the approval of any limited partner or any other person. Without limiting the generality of the foregoing, we may specify, as to any such class or series of partnership interest, the allocations of items of partnership income, gain, loss, deduction and credit to each such class or series of partnership interest.
Ability to Engage in Other Businesses; Conflicts of Interest
The partnership agreement provides that we may not conduct any business other than in connection with the ownership, acquisition and disposition of partnership interests, the management of the business and affairs of our operating partnership, our operation as a reporting company with a class (or classes) of securities registered under the Exchange Act, our operations as a REIT, the offering, sale, syndication, private placement or public offering of stock, bonds, securities or other interests, financing or refinancing of any type related to our operating partnership or its assets or activities and such activities as are incidental to those activities discussed above. In general, we must contribute any assets or funds that we acquire to our operating partnership whether as capital contributions, loans or otherwise, as appropriate, in exchange for additional partnership interests. We may, however, in our sole and absolute discretion, from time to time hold or acquire assets in our own name or otherwise other than through our operating partnership so long as we take commercially reasonable measures to ensure that the economic benefits and burdens of such property are otherwise vested in our operating partnership.
Distributions
Our operating partnership will distribute such amounts, at such times, as we may in our sole and absolute discretion determine:
• | first, with respect to any partnership interests that are entitled to any preference in distribution, including the preferred units, in accordance with the rights of the holders of such class(es) of partnership interest, and, within each such class, among the holders of such class pro rata in proportion to their respective percentage interests of such class or as otherwise prescribed for that class; and |
• | second, with respect to any partnership interests that are not entitled to any preference in distribution, including the common units and the Legacy OP Units and, except as described below with respect to liquidating distributions and as may be provided in any incentive award plan or any applicable award |
313
Table of Contents
agreement with respect to the LTIP units, in accordance with the rights of the holders of such class(es) of partnership interest, and, within each such class, among the holders of each such class, pro rata in proportion to their respective percentage interests of such class or as otherwise prescribed for that class. |
Exculpation and Indemnification of General Partner
The partnership agreement provides that we are not liable to our operating partnership or any partner for any action or omission taken in our capacity as general partner, for the debts or liabilities of our operating partnership or for the obligations of our operating partnership under the partnership agreement, except for liability for our fraud, willful misconduct or gross negligence, pursuant to any express indemnity we may give to our operating partnership or in connection with a redemption as described in the section entitled “—Redemption Rights of Qualifying Parties.” The partnership agreement also provides that any obligation or liability in our capacity as the general partner of our operating partnership that may arise at any time under the partnership agreement or any other instrument, transaction or undertaking contemplated by the partnership agreement will be satisfied, if at all, out of our assets or the assets of our operating partnership only, and no such obligation or liability will be personally binding upon any of our directors, stockholders, officers, employees or agents.
In addition, the partnership agreement requires our operating partnership to indemnify us, our present or any former directors and officers, officers of our operating partnership, the former managing member of our operating partnership (prior to its conversion into a limited partnership), former managers of our operating partnership, each person serving as a director, manager, officer, employee or other agent of any of our former managing members or former manager, and any other person designated by us against any and all losses, claims, damages, liabilities, expenses (including, without limitation, attorneys’ fees and other legal fees and expenses), judgments, fines, settlements and other amounts arising from any and all claims, demands, actions, suits or proceedings, whether civil, criminal, administrative or investigative, that relate to the operations of our operating partnership, unless (i) an act or omission of the person was material to the matter giving rise to the action and either was committed in bad faith or was the result of active and deliberate dishonesty, (ii) in the case of a criminal proceeding, the person had reasonable cause to believe the act or omission was unlawful or (iii) such person actually received an improper personal benefit in violation or breach of any provision of the partnership agreement. Our operating partnership must also pay or reimburse the reasonable expenses of any such person in advance of a final disposition of the proceeding upon its receipt of a written affirmation of the person’s good faith belief that the standard of conduct necessary for indemnification has been met and a written undertaking by or on behalf of the person to repay any amounts paid or advanced if it is ultimately determined that the person did not meet the standard of conduct for indemnification. Our operating partnership is not required to indemnify or advance funds to any person with respect to any action initiated by the person seeking indemnification without our approval (except for any proceeding brought to enforce such person’s right to indemnification under the partnership agreement) or if the person is found to be liable to our operating partnership on any portion of any claim in the action.
In addition, in exercising our authority under the partnership agreement, we may, but are not required to, take into account the tax consequences to any partner of any action taken (or not taken) by us. Subject to limited exceptions, any action or failure to act on our part that does or does not take into account any tax consequences of a partner will not be considered to violate any duty of loyalty or any other duty owed by us as the general partner.
Dissolution of Our Operating Partnership
We may elect to dissolve our operating partnership without the consent of any limited partner. However, in connection with the acquisition of properties from persons to whom our operating partnership issues common units or other partnership interests as part of the purchase price, in order to preserve such persons’ tax deferral, our operating partnership may contractually agree, in general, not to sell or otherwise transfer the properties for a specified period of time, or in some instances, not to sell or otherwise transfer the properties without compensating the sellers of the properties for their loss of the tax deferral.
314
Table of Contents
Redemption Rights of Qualifying Parties
Beginning 14 months after first acquiring such common units, each limited partner and some assignees of limited partners will have the right, subject to the terms and conditions set forth in the partnership agreement, to require our operating partnership to redeem all or a portion of the common units held by such limited partner or assignee (other than (i) Legacy OP Units, which do not have any redemption rights prior to being reclassified as OP units (except for the one-time special redemption and top-up rights with respect to Legacy Class A-4 OP Units described elsewhere in this prospectus), but once a Legacy OP Unit has been so reclassified (assuming it is not otherwise in the process of a Cash Settlement), it will have redemption rights at any time and will not be subject to such 14-month waiting period, and (ii) OP units issued in exchange for OPEUs, which do not have any redemption, sale or repurchase rights prior to the settlement of all legacy BGLH equity and all legacy operating partnership equity, but once all legacy BGLH equity and all legacy operating partnership equity has been settled, such OP units will have redemption rights at any time and will not be subject to such 14-month waiting period) in exchange for a cash amount per common unit equal to the value of one share of our common stock, determined in accordance with and subject to adjustment under the partnership agreement. Our operating partnership’s obligation to redeem common units does not arise and is not binding against our operating partnership until the eleventh business day after we receive the holder’s notice of redemption (or sixth business day in the case of common units into which Legacy OP Units were reclassified) or, if earlier, the day we notify the holder seeking redemption that we have declined to acquire some or all of the common units tendered for redemption.
Over the course of the first three years following the initial closing of this offering, all of the Legacy OP Units will ultimately be reclassified into OP units. Reclassification will be on a one-for-one basis, with each Legacy OP Unit becoming a single OP unit upon its reclassification. Following any such reclassification, Legacy OP Unit holders will thereafter hold such OP units for such period of time as they determine or receive cash pursuant to a sale of their OP units to us in connection with the reclassification event (or a combination thereof). These reclassifications, and any related sales to us of the OP units, will occur at such times as directed by the LHR, acting on behalf of the Legacy OP Unit holders. The LHR will be an affiliate of our current majority stockholder, BGLH. BGLH will have the right to require us to conduct offerings of shares of our common stock from time to time to fund our purchases of such OP units, but not any OP units that were not previously Legacy OP Units. Each purchase of OP units will increase our percentage ownership interest in our operating partnership and our share of its cash distributions and profits and losses.
On or before the close of business on the tenth business day after a holder of common units gives notice of redemption to us (or fifth business day in the case of common units into which Legacy OP Units were reclassified), we may, in our sole and absolute discretion but subject to the restrictions on the ownership and transfer of our stock set forth in our charter and described in the section entitled “Description of Our Capital Stock—Restrictions on Ownership and Transfer,” elect to acquire some or all of the common units tendered for redemption from the tendering party in exchange for shares of our common stock, based on an exchange ratio of one share of common stock for each common unit, subject to adjustment as provided in the partnership agreement. The partnership agreement does not require us to register, qualify or list any shares of common stock issued in exchange for common units with the SEC, with any state securities commissioner, department or agency, under the Securities Act or the Exchange Act or with any stock exchange.
Transfers of Partnership Interests
Restrictions on Transfers by Limited Partners. Until the expiration of 14 months after the date on which a limited partner acquires a partnership interest (other than OP units that were previously classified as Legacy OP Units, which are not subject to this restriction), the limited partner generally may not directly or indirectly transfer all or any portion of such partnership interest without our consent, which we may give or withhold in our sole and absolute discretion, except for certain permitted transfers to certain affiliates, family members and charities, and certain pledges of partnership interests to lending institutions in connection with bona fide loans. After the expiration of such initial holding period (as applicable), the limited partner will have the right to
315
Table of Contents
transfer all or any portion of its partnership interest without our consent to any person that is an “accredited investor,” within the meaning set forth in Rule 501 promulgated under the Securities Act, upon ten business days prior notice to us, subject to the satisfaction of conditions specified in the partnership agreement, including minimum transfer requirements and our right of first refusal. OP units that were previously classified as Legacy OP Units are subject to certain additional transfer restrictions that do not apply to other OP units.
Restrictions on Transfers by the General Partner. Except as set forth below, we, as general partner, may not voluntarily withdraw as general partner of our operating partnership and may not transfer any of our general partner interests, whether by sale, disposition, statutory merger or consolidation, liquidation or otherwise, other than solely an economic interest as a limited partner, unless:
• | we receive the prior consent of a majority in interest of the limited partners holding common units (excluding us and any limited partner 50% or more of whose equity is owned, directly or indirectly, by us); |
• | the transferee is admitted as a general partner pursuant to the terms of the partnership agreement; |
• | the transferee assumes, by operation of law or express agreement, all of the obligations of the general partner under the partnership agreement with respect to such transferred partnership interest; and |
• | the transferee has executed such instruments as may be necessary to effectuate such admission and to confirm the agreement of such transferee to be bound by all the terms and provisions of the partnership agreement with respect to the partnership interest so acquired and the admission of such transferee as the general partner. |
However, we may transfer all (but not less than all) of our interest in our operating partnership to an affiliate of us without the consent of any limited partner.
Subsidiary REIT Ownership Restrictions. The partnership agreement includes restrictions on ownership and transfer of interests in our operating partnership intended to preserve the REIT qualification of Subsidiary REITs. These restrictions are substantially similar to the restrictions described in “Description of Our Capital Stock—Restrictions on Ownership and Transfer” except that they are with respect to interests in our operating partnership, and there are no restrictions intended to preserve any Subsidiary REIT as a domestically controlled qualified investment entity.
Restrictions on Mergers, Sales, Transfers and Other Significant Transactions of the General Partner
We, as the general partner, may not merge, consolidate or otherwise combine our assets with another entity, or sell all or substantially all of our assets not in the ordinary course of our business, or reclassify, recapitalize or change the terms of the our outstanding common equity interests (other than in connection with a stock split, reverse stock split, stock dividend, change in par value, increase in authorized shares, designation or issuance of new classes of equity securities or any event that does not require the approval of our stockholders), unless:
• | such event has been approved by the consent of a majority in interest of the partners, including us as general partner, and all limited partners holding common units will receive, or will have the right to elect to receive, for each common unit, consideration that is equivalent to the greatest amount of cash, securities or other property received by a holder of one share of our common stock; and, if such event occurs in connection with a purchase, tender or exchange offer, each holder of common units has the right to receive, or elect to receive, the greatest amount of cash, securities or other property that such holder of units would have received had it exercised its right to redemption pursuant to the partnership agreement and received shares of our common stock in exchange for its units immediately before the expiration of the purchase, tender or exchange offer and had accepted the purchase, tender or exchange offer; or |
• | substantially all of the assets of our operating partnership are to be owned by a surviving entity in which the limited partners holding common units will hold a percentage interest based on the relative |
316
Table of Contents
fair market value of the net assets of our operating partnership and the other net assets of such entity, which interest will be on terms that are at least as favorable as the terms of the common units and will include a right to redeem interests in such entity for the consideration described in the preceding bullet, cash on similar terms as those with respect to the common units or, if common equity securities of the person controlling the surviving entity are publicly traded, such common equity securities. |
Legacy OP Units
As of the date of this prospectus we have Legacy OP Units outstanding in two classes: Legacy Class A OP Units and Legacy Class B OP Units. Legacy OP Units represent all of the pre-offering equity in our operating partnership that is owned by persons other than our company. Any additional Legacy OP Units can generally only be issued in connection with the special rights of Legacy Class A-4 OP Units described below or as a result of certain unit adjustments. It is currently anticipated that, by the third anniversary of the first closing of this offering, all Legacy OP Units either will have been reclassified into common units or will have been disposed of, whether through purchases by us or through redemptions.
Legacy Class A OP Units.
• | Each Legacy Class A OP Unit is comprised of two sub-units that are legally separate interests, with one sub-unit being referred to as the “A-Piece Sub-Unit” and the other sub-unit being referred to as the “C-Piece Sub-Unit.” The A-Piece Sub-Units and the C-Piece Sub-units exist to continue a historic calculation applicable solely to our legacy investors that determines how the holders of the A-Piece Sub-Units and the holders of the C-Piece Sub-Units will share in the settlement of Legacy Class A OP Units when they are ultimately reclassified into common units. This enables BG Cold to continue accruing the Founders Equity Share in order to align the economic interests of our Co-Founders with the performance of our shares and common units when our legacy investors settle their pre-existing equity and have the option to achieve liquidity. |
• | Each Legacy Class A OP Unit will be designated to one of four sub-class demarcations: Legacy Class A-1, Legacy Class A-2, Legacy Class A-3 or Legacy Class A-4, which provide for different calculations as between the sub-unit holders within a given Legacy Class A OP Unit to determine what share of a Legacy Class A OP Unit belongs to the A-Piece Sub-Unit holder and what share belongs to the C-Piece Sub-Unit holder. |
• | Except as set forth in the following sentence, each Legacy Class A OP Unit regardless of sub-class will be economically equivalent to one common unit, meaning that one Legacy Class A OP Unit will have the same value and represent the same share of equity in our operating partnership as a common unit. The Legacy Class A-4 OP Units may be an exception to this because they have a special one-time redemption right that the holders of such units may exercise during a 45-day window beginning on March 1, 2025 at a guaranteed minimum value that may exceed the value of a common unit. This special redemption right allows the holders of Legacy Class A-4 OP Units to (1) redeem any or all of the Legacy Class A-4 OP Units at a guaranteed minimum price ranging between $106.59 and $113.25 per unit depending on our share price at that time (less certain distributions received after June 26, 2024) or, if greater, the then-current fair market value of the Legacy Class A-4 OP Units to be redeemed or (2) during the same window, receive a one-time true-up paid in cash or through the issuance of new Legacy Class A-4 OP Units or new common units (or any combination of cash and units) in the amount by which the guaranteed minimum value of $106.59 per unit (less certain distributions received after June 26, 2024) exceeds the then-current fair market value of the Legacy Class A-4 OP Units (if at all). Legacy Class A-4 OP Units can also be reclassified into an equal number of common units at any time as may be agreed by the holders of Legacy Class A-4 OP Units and the LHR, or under certain other circumstances at the discretion of the LHR acting as representative of such holders. Immediately following the formation transactions, there will be 319,006 outstanding Legacy Class A-4 OP Units. |
317
Table of Contents
• | Each Legacy Class A OP Unit will have the same voting rights and voting power as a common unit. The LHR will be appointed by each holder of Legacy Class A OP Units to exercise the voting power for all Legacy Class A OP Units until they are reclassified into common units. |
Legacy Class B OP Units.
• | The Legacy Class B OP Units do not have sub-units or sub-classes. |
• | Each Legacy Class B OP Unit will be economically equivalent to one common unit, meaning that one Legacy Class B OP Unit will have the same value and represent the same share of equity in our operating partnership as a common unit. |
• | Each Legacy Class B OP Unit will have the same voting rights and voting power as a common unit. The LHR will be appointed by each holder of Legacy Class B OP Units to exercise the voting power for all Legacy Class B OP Units until they are reclassified into common units. |
• | Legacy Class B OP Units can be reclassified into an equal number of OP units at any time at the discretion of the LHR, acting as representative of the holders of Legacy Class B OP Units, and such units will from time to time between the initial closing of this offering and the third anniversary of the initial closing of this offering be so reclassified. |
Settlement Process; Reclassifications. All Legacy OP Units are subject to a coordinated settlement process to be conducted for our legacy equity holders by the LHR over a period of up to three years following the first closing of this offering. During this period, any or all Legacy OP Units may be reclassified at any time into an equal number of common units. Over the course of this up-to-three-year period, all of the Legacy OP Units will ultimately be reclassified into common units, resulting in the eventual elimination of the Legacy OP Unit class altogether. Reclassification will be on a one-for-one basis, with each Legacy OP Unit becoming a single common unit upon its reclassification. Following any such reclassification, Legacy OP Unit holders will thereafter hold such common units for such period of time as they determine or receive cash pursuant to a sale of their common units to us in connection with the reclassification event (or a combination thereof). These reclassifications, and any related sales to us of the common units, will occur at such times as directed by the LHR, acting on behalf of the Legacy OP Unit holders. The LHR will be an affiliate of our current majority stockholder, BGLH. See “Certain Relationships and Related Party Transactions—Transactions with Lineage OP, LLC” for additional information on how this settlement process is intended to work.
Redemption. At any time following the reclassification of Legacy OP Units into common units, the holders of such common units that have elected to receive common units pursuant to the settlement process for Legacy OP Units will have the redemption rights described above in “—Redemption Rights of Qualifying Parties”; however the exercise of these redemption rights by the holders of such units may be subject to certain conditions that do not apply to other holders of common units. Holders of Legacy OP Units do not have redemption rights prior to their reclassification as common units (other than as described above with respect to Legacy Class A-4 OP Units).
Distributions. The Legacy OP Units, with respect to distribution and redemption rights and rights upon liquidation, dissolution or winding up of our operating partnership, rank pari passu with the common units. However, the Legacy OP Units have separate distribution provisions for their apportioned share of any distributions. All distributions shall first be apportioned among the common units, the Legacy Class A Units and the Legacy Class B Units based on the percentage interest held by each relative to all common units, Legacy Class A Units, Legacy Class B Units and any other units of our operating partnership that are pari passu with the common units. Amounts initially apportioned to holders of the Legacy Class B Units are required to be distributed pro rata among such holders based on their relative numbers of Legacy Class B Units as a percentage of all Legacy Class B Units. Amounts initially apportioned to the Legacy Class A Units are required to be further apportioned among the various sub-classes of Legacy Class A Units pro rata in proportion to their respective sub-class ratios, then distributed in different shares among the A-Piece Sub-Units and C-Piece Sub-Units within each sub-class based on the sharing formula applicable to that sub-class.
318
Table of Contents
Transfers. Without the prior written consent of the LHR, which approval may be given or withheld by the LHR in its sole discretion, and additionally subject to the standard transfer approval requirements generally applicable to common units, no holder of Legacy OP Units may (i) transfer any or all of its Legacy OP Units or any beneficial interest therein, (ii) engage in, solicit or respond to offerings for any transfer of a partnership interest or beneficial interest therein to a third party, including another partner of our operating partnership, or (iii) hedge, short or pledge its Legacy OP Units or any interest therein. Certain indirect transfers of Legacy OP Units are permitted and certain affiliate transfers are permitted, subject to compliance with specified requirements.
Legacy Holder Representative. Each holder of Legacy OP Units will appoint the LHR as such holder’s representative to act on such holder’s behalf in respect of most matters related to Legacy OP Units. The LHR will not be compensated for providing this service but will be reimbursed for all costs and expenses it incurs, and will be indemnified for acting in such role, in each case with Lineage Holdings bearing all such costs and expenses.
LTIP Units
Our operating partnership is authorized to issue a class of units of partnership interest designated as “LTIP units” that are intended to constitute “profits interests” for U.S. federal income tax purposes. We may cause our operating partnership to issue LTIP units to persons who provide services to or for the benefit of our operating partnership, for such consideration or for no consideration as we may determine to be appropriate, and we may admit such persons as limited partners of our operating partnership, without the approval or consent of any limited partner. Further, we may cause our operating partnership to issue LTIP units in one or more classes or series, with such terms as we may determine, without the approval or consent of any limited partner. LTIP units may be subject to vesting, forfeiture and restrictions on transfer and receipt of distributions pursuant to the terms of any applicable equity-based plan and the terms of any award agreement relating to the issuance of the LTIP units.
Conversion Rights. Vested LTIP units are convertible at the option of each limited partner and some assignees of limited partners (in each case, that hold vested LTIP units) into common units, upon notice to us and our operating partnership, to the extent that the capital account balance of the LTIP unitholder with respect to all of its LTIP units is at least equal to our capital account balance with respect to an equal number of common units. We may cause our operating partnership to convert vested LTIP units eligible for conversion into an equal number of common units at any time, upon at least three days’ notice to the holder of the LTIP units.
If we or our operating partnership is party to a transaction, including a merger, consolidation, sale of all or substantially all of our assets or other business combination, as a result of which common units are exchanged for or converted into the right, or holders of common units are otherwise entitled, to receive cash, securities or other property (or any combination thereof), we must cause our operating partnership to convert any vested LTIP units then eligible for conversion into common units immediately before the transaction, taking into account any special allocations of income that would be made as a result of the transaction. Our operating partnership must use commercially reasonable efforts to cause each limited partner (other than a party to such a transaction or an affiliate of such a party) holding LTIP units that will be converted into common units in such a transaction to be afforded the right to receive the same kind and amount of cash, securities and other property (or any combination thereof) for such common units that each holder of common units receives in the transaction.
Transfer. Unless an applicable equity-based plan or the terms of an award agreement specify additional restrictions on transfer of LTIP units, LTIP units are transferable to the same extent as common units, as described above in the section entitled “—Transfers of Partnership Interests.”
Voting Rights. Except for limited circumstances, limited partners holding LTIP units are entitled to vote together as a class with limited partners holding common units on all matters on which limited partners holding common units are entitled to vote or consent, and may cast one vote for each LTIP unit so held.
Adjustment of LTIP Units. If our operating partnership takes certain actions, including making a distribution of units on all outstanding common units, combining or subdividing the outstanding common units
319
Table of Contents
into a different number of common units or reclassifying the outstanding common units, we must adjust the number of outstanding LTIP units or subdivide or combine outstanding LTIP units to maintain a one-for-one conversion ratio and economic equivalence between common units and LTIP units.
Series A Preferred Units
Our operating partnership is authorized to issue preferred units. As of the date of this prospectus we have issued one class of preferred units of partnership interest designated as “Series A Preferred Units.”
As of the date of this prospectus, there are 630 Series A Preferred Units issued and outstanding, 100% of which are owned by us. In connection with this offering, we will redeem such units concurrent with our redemption of the Series A preferred stock so that there will be no Series A Preferred Units issued and outstanding upon completion of this offering.
Ranking. The Series A Preferred Units, with respect to distribution and redemption rights and rights upon liquidation, dissolution or winding up of our operating partnership, rank senior to the common units and Legacy OP Units and to all other partnership interests and equity securities that may be issued by our operating partnership.
Distributions. The Series A Preferred Units entitle the holders thereof to receive cumulative cash distributions at a rate per annum of 12.0% of the liquidation preference of $1,000 per unit plus all accumulated and unpaid distributions thereon. We generally may not declare or pay, or set apart for payment, any distribution on any unit ranking junior to the Series A Preferred Units as to distributions, including the common units or Legacy OP Units, or redeem, repurchase or otherwise make payments on any such units, unless full, cumulative distributions on all outstanding units of Series A Preferred Units have been declared and paid or set apart for payment for all past distribution periods.
Voting. The general partner will not have any voting or consent rights in respect of its partnership interest represented by the Series A Preferred Units.
Conversion Rights. The Series A Preferred Units are not convertible into units of any other class or series of our operating partnership’s units.
Liquidation Preference. Holders of outstanding units of Series A Preferred Units are entitled to a liquidation preference of $1,000 per unit plus all accrued and unpaid distributions thereon.
Redemption. Our operating partnership is required to redeem Series A Preferred Units from us in connection with any redemption by us of shares of Series A Preferred Stock. We intend to redeem all outstanding Series A Preferred Stock and corresponding units in connection with this offering.
320
Table of Contents
DESCRIPTION OF THE OPERATING AGREEMENT OF LINEAGE LOGISTICS HOLDINGS, LLC
A summary of the material terms and provisions of the Ninth Amended and Restated Operating Agreement of Lineage Logistics Holdings, LLC, which we refer to as the “operating agreement,” is set forth below. This summary is not complete and is subject to and qualified in its entirety by reference to the applicable provisions of Delaware law and the operating agreement. For more detail, please refer to the operating agreement itself, a copy of which is filed as an exhibit to the registration statement of which this prospectus is a part. For purposes of this section, references to “we,” “our,” “us,” and “our company” refer to Lineage, Inc., in our capacity as the general partner of our operating partnership, and “managing member” refers to our operating partnership, in its capacity as managing member of Lineage Holdings.
General
Upon the completion of this offering and the formation transactions, Lineage Holdings will remain a subsidiary of our operating partnership, through which our operating partnership holds its assets and conducts its operations. The provisions of the operating agreement described below will be in effect from and after the completion of this offering. Our operating partnership is the managing member of Lineage Holdings and following the completion of this offering and the formation transactions will directly hold a 99.4% membership interest in Lineage Holdings.
Lineage Holdings issues common units as its primary class of equity. The common units are not listed on any exchange nor are they quoted on any national market system. Lineage Holdings is also authorized to issue a class of units of membership interest designated as OPEUs and may authorize and issue additional classes of units of membership interest.
Provisions in the operating agreement may delay or make more difficult unsolicited acquisitions of us or changes in our control. These provisions could discourage third parties from making proposals involving an unsolicited acquisition of us or change of our control, although some stockholders might consider such proposals, if made, desirable. These provisions also make it more difficult for third parties to alter the management structure of Lineage Holdings without the concurrence of our board of directors. These provisions include, among others:
• | exchange rights of holders of OPEUs; |
• | transfer restrictions on common units and other classes of membership interests; |
• | a requirement that our operating partnership may not be removed as the managing member of Lineage Holdings without our consent; |
• | our ability in some cases to amend the operating agreement and to cause Lineage Holdings to issue preferred membership interests in Lineage Holdings with terms that we may determine, in either case, without the approval or consent of any member; and |
• | the right of the members to consent to certain transfers of our operating partnership’s managing member interest (whether by sale, disposition, statutory merger or consolidation, liquidation or otherwise). |
Purpose, Business and Management
Lineage Holdings was formed for the purpose of conducting any business, enterprise or activity permitted by or under the Delaware Limited Liability Company Act, or the Delaware LLCA. Lineage Holdings may enter into any partnership, joint venture, business trust arrangement, limited liability company or other similar arrangement, subject to any consent rights set forth in the operating agreement.
In general, our board of directors manages the business and affairs of Lineage Holdings by directing our business and affairs, in our capacity as the sole general partner of our operating partnership, and in turn in our
321
Table of Contents
operating partnership’s capacity as the sole managing member of Lineage Holdings. The operating agreement provides that our operating partnership is not liable to Lineage Holdings or any member for any action or omission taken in its capacity as managing member, for the debts or liabilities of Lineage Holdings or for the obligations of Lineage Holdings under the operating agreement, except for liability for our operating partnership’s fraud, willful misconduct or gross negligence, pursuant to any express indemnity our operating partnership may give to Lineage Holdings. In addition, the operating agreement requires Lineage Holdings to indemnify us, our directors and officers, officers of our operating partnership, officers of Lineage Holdings and any other person designated by our operating partnership against any and all losses, claims, damages, liabilities, expenses (including, without limitation, attorneys’ fees and other legal fees and expenses), judgments, fines, settlements and other amounts arising from any and all claims, demands, actions, suits or proceedings, whether civil, criminal, administrative or investigative, that relate to the operations of our operating partnership, unless (i) an act or omission of the person was material to the matter giving rise to the action and either was committed in bad faith or was the result of active and deliberate dishonesty, (ii) in the case of a criminal proceeding, the person had reasonable cause to believe the act or omission was unlawful or (iii) such person actually received an improper personal benefit in violation or breach of any provision of the operating agreement.
Except as otherwise expressly provided in the operating agreement and subject to the rights of holders of any class or series of membership interest, all management powers over the business and affairs of our Lineage Holdings are exclusively vested in our operating partnership, in its capacity as managing member of Lineage Holdings. Our operating partnership may not be removed as the managing member of Lineage Holdings, with or without cause, without our consent, which we may give or withhold in our sole and absolute discretion.
Additional Members
We may cause Lineage Holdings to issue additional units in one or more classes or series or other membership interests and to admit additional members to Lineage Holdings from time to time, on such terms and conditions and for such capital contributions as we may establish in our sole and absolute discretion, without the approval or consent of any member.
The operating agreement authorizes Lineage Holdings to issue common units, OPEUs and preferred units, and Lineage Holdings may issue additional membership interests in one or more additional classes, or one or more series of any of such classes, with such designations, preferences, conversion and other rights, voting powers, restrictions, limitations as to distributions, qualifications and terms and conditions of redemption (including, without limitation, terms that may be senior or otherwise entitled to preference over existing units) as we may determine, in our sole and absolute discretion, without the approval of any member or any other person. Without limiting the generality of the foregoing, we may specify, as to any such class or series of membership interest, the allocations of items of company income, gain, loss, deduction and credit to each such class or series of membership interest.
Ability to Engage in Other Businesses; Conflicts of Interest
The operating agreement provides that our operating partnership may not conduct any business other than in connection with the ownership, acquisition and disposition of membership interests, the management of the business and affairs of Lineage Holdings, our operation as a reporting company with a class (or classes) of securities registered under the Exchange Act, the offering, sale, syndication, private placement or public offering of stock, bonds, securities or other interests, financing or refinancing of any type related to Lineage Holdings or its assets or activities and such activities as are incidental to those activities discussed above. In general, our operating partnership must contribute any assets or funds that it acquires to Lineage Holdings whether as capital contributions, loans or otherwise, as appropriate, in exchange for additional membership interests. We or our operating partnership may, however, in our sole and absolute discretion, from time to time hold or acquire assets in our or our operating partnership’s own name or otherwise other than through Lineage Holdings so long as we take commercially reasonable measures to ensure that the economic benefits and burdens of such property are otherwise vested in Lineage Holdings.
322
Table of Contents
Distributions
Lineage Holdings will distribute such amounts, at such times, as we may in our sole and absolute discretion determine:
• | first, with respect to any membership interests that are entitled to any preference in distribution, in accordance with the rights of the holders of such class(es) of membership interests, and, within each such class, among the holders of such class pro rata in proportion to their respective percentage interests of such class or as otherwise prescribed for that class; and |
• | second, with respect to any membership interests that are not entitled to any preference in distribution, including the common units and the OPEUs, pro rata in proportion to their respective percentage interests based on the total number of common units and OPEUs outstanding (measured for this purpose on a one-for-one basis). |
Exculpation and Indemnification of Managing Member
The operating agreement provides that our operating partnership is not liable to Lineage Holdings or any member for any action or omission taken in its capacity as managing member, for the debts or liabilities of Lineage Holdings or for the obligations of Lineage Holdings under the operating agreement, except for liability for our operating partnership’s fraud, willful misconduct or gross negligence, or pursuant to any express indemnity we may give to Lineage Holdings. The operating agreement also provides that any obligation or liability in our operating partnership’s capacity as the managing member of Lineage Holdings that may arise at any time under the operating agreement or any other instrument, transaction or undertaking contemplated by the operating agreement will be satisfied, if at all, out of our operating partnership’s assets or the assets of Lineage Holdings only, and no such obligation or liability will be personally binding upon any of our directors, stockholders, officers, employees or agents.
In addition, the operating agreement requires Lineage Holdings to indemnify our operating partnership, our operating partnership’s present or any former directors and officers, officers of Lineage Holdings, any former managing member of Lineage Holdings, each person serving as a director, manager, officer, employee or other agent of any of our former managing members or former manager, and any other person designated by us against any and all losses, claims, damages, liabilities, expenses (including, without limitation, attorneys’ fees and other legal fees and expenses), judgments, fines, settlements and other amounts arising from any and all claims, demands, actions, suits or proceedings, whether civil, criminal, administrative or investigative, that relate to the operations of Lineage Holdings, unless (i) an act or omission of the person was material to the matter giving rise to the action and either was committed in bad faith or was the result of active and deliberate dishonesty, (ii) in the case of a criminal proceeding, the person had reasonable cause to believe the act or omission was unlawful or (iii) such person actually received an improper personal benefit in violation or breach of any provision of the operating agreement. Lineage Holdings must also pay or reimburse the reasonable expenses of any such person in advance of a final disposition of the proceeding upon its receipt of a written affirmation of the person’s good faith belief that the standard of conduct necessary for indemnification has been met and a written undertaking by or on behalf of the person to repay any amounts paid or advanced if it is ultimately determined that the person did not meet the standard of conduct for indemnification. Lineage Holdings is not required to indemnify or advance funds to any person with respect to any action initiated by the person seeking indemnification without our approval (except for any proceeding brought to enforce such person’s right to indemnification under the operating agreement) or if the person is found to be liable to Lineage Holdings on any portion of any claim in the action.
In addition, in exercising our authority under the operating agreement, we may, but are not required to, take into account the tax consequences to any member of any action taken (or not taken) by us. Subject to limited exceptions, any action or failure to act on our part that does or does not take into account any tax consequences of a member will not be considered to violate any duty of loyalty or any other duty owed by us as the managing member.
323
Table of Contents
Dissolution of Lineage Holdings
We may elect to dissolve Lineage Holdings without the consent of any member. However, in connection with the acquisition of properties from persons to whom Lineage Holdings issues common units or other membership interests as part of the purchase price, in order to preserve such persons’ tax deferral, our operating partnership may contractually agree, in general, not to sell or otherwise transfer the properties for a specified period of time, or in some instances, not to sell or otherwise transfer the properties without compensating the sellers of the properties for their loss of the tax deferral.
Exchange Rights of Holders of OPEUs
Beginning two years after the initial closing date of this offering, each holder of OPEUs will have the right, subject to the terms and conditions set forth in the operating agreement, to require our operating partnership to exchange all or a portion of the OPEUs held by such holder for OP units, based on an exchange ratio of one OP unit for each OPEU, subject to adjustment as provided in the operating agreement. Holders of OP units issued in exchange for such OPEUs will not be able to redeem OP units until after the settlement of all legacy BGLH equity and all Legacy OP Units. The operating agreement does not require us to register, qualify or list any OP units issued in exchange for OPEUs with the SEC, with any state securities commissioner, department or agency, under the Securities Act or the Exchange Act or with any stock exchange.
Transfers of Membership Interests
Restrictions on Transfers by Members. A member will have the right to transfer all or any portion of its membership interest without our consent to any person that is an “accredited investor,” within the meaning set forth in Rule 501 promulgated under the Securities Act, upon ten business days prior notice to our operating partnership, subject to the satisfaction of conditions specified in the operating agreement, including minimum transfer requirements and our operating partnership’s right of first refusal. These requirements do not apply to certain permitted transfers to certain affiliates, family members and charities, and certain pledges of partnership interests to lending institutions in connection with bona fide loans.
Restrictions on Transfers by the Managing Member. Our operating partnership, as managing member, may not transfer any of its managing member interest, whether by sale, disposition, statutory merger or consolidation, liquidation or otherwise unless:
• | our operating partnership transfers its member interests in a merger, consolidation or other combination of its assets with another entity, a sale of all or substantially all of its assets or a reclassification, recapitalization or change in any outstanding units of its equity securities described below in “—Restrictions on Mergers, Sales, Transfers and Other Significant Transactions of the Managing Member” or our operating partnership receives the prior consent of a majority in interest of the members holding common membership interests (excluding our operating partnership and any member 50% or more of whose equity is owned, directly or indirectly, by our operating partnership); |
• | the transferee is admitted as managing member pursuant to the terms of the operating agreement; |
• | the transferee assumes, by operation of law or express agreement, all of the obligations of the managing member under the operating agreement with respect to such transferred membership interest; and |
• | the transferee has executed such instruments as may be necessary to effectuate such admission and to confirm the agreement of such transferee to be bound by all the terms and provisions of the operating agreement with respect to the membership interest so acquired and the admission of such transferee as the managing member. |
Our operating partnership may also transfer all (but not less than all) of its interests in Lineage Holdings to an affiliate of our operating partnership without the consent of any member, subject to the rights of holders of any class or series of membership interests.
324
Table of Contents
Our operating partnership may not voluntarily withdraw as the managing member of Lineage Holdings without the consent of a majority in interest of the members (excluding our operating partnership and any member 50% or more of whose equity is owned, directly or indirectly, by our operating partnership) other than upon the transfer of our operating partnership’s entire interest in Lineage Holdings and the admission of its successor as the managing member of Lineage Holdings.
Subsidiary REIT Ownership Restrictions. The operating agreement includes restrictions on ownership and transfer of interests in Lineage Holdings intended to preserve the REIT qualification of Subsidiary REITs. These restrictions are substantially similar to the restrictions described in “Description of Our Capital Stock—Restrictions on Ownership and Transfer” except that they are with respect to interests in Lineage Holdings, and there are no restrictions intended to preserve any Subsidiary REIT as a domestically controlled qualified investment entity.
Restrictions on Mergers, Sales, Transfers and Other Significant Transactions of the Managing Member
Our operating partnership, as managing member, may not merge, consolidate or otherwise combine its assets with another entity, or sell all or substantially all of its assets not in the ordinary course of our business, or reclassify, recapitalize or change the terms of its outstanding common equity interests (other than in connection with a stock split, reverse stock split, stock dividend, change in par value, increase in authorized shares, designation or issuance of new classes of equity securities or any event that does not require the approval of our stockholders), unless:
• | such event has been approved by the consent of a majority in interest of the members, including our operating partnership as managing member, and all members holding common units will receive, or will have the right to elect to receive, for each common unit, consideration that is equivalent to the greatest amount of cash, securities or other property received by a holder of one share of our common stock; and, if such event occurs in connection with a purchase, tender or exchange offer, each holder of units has the right to receive, or elect to receive, the greatest amount of cash, securities or other property that such holder of units would have received had such units been exchanged for OP units and received OP units in exchange for its units immediately before the expiration of the purchase, tender or exchange offer and had accepted the purchase, tender or exchange offer; or |
• | substantially all of the assets of Lineage Holdings are to be owned by a surviving entity in which the members holding common units will hold a percentage interest based on the relative fair market value of the net assets of Lineage Holdings and the other net assets of such entity, which interest will be on terms that are at least as favorable as the terms of the common units and will include a right to redeem interests in such entity for the consideration described in the preceding bullet, cash on similar terms as those with respect to the common units or, if common equity securities of the person controlling the surviving entity are publicly traded, such common equity securities. |
Series A Preferred Units
Lineage Holdings is authorized to issue preferred units. As of the date of this prospectus we have issued one class of preferred units of partnership interest designated as “Series A Preferred Units.”
As of the date of this prospectus, there are 630 Series A Preferred Units issued and outstanding, 100% of which are owned by our operating partnership. In connection with this offering, we will redeem such units concurrent with our redemption of the Series A preferred stock so that there will be no Series A Preferred Units issued and outstanding upon completion of this offering.
Ranking. The Series A Preferred Units, with respect to distribution and redemption rights and rights upon liquidation, dissolution or winding up of Lineage Holdings, rank senior to the common units and OPEUs and to all other limited liability company interests and equity securities that may be issued by Lineage Holdings.
325
Table of Contents
Distributions. The Series A Preferred Units entitle the holders thereof to receive cumulative cash distributions at a rate per annum of 12.0% of the liquidation preference of $1,000 per unit plus all accumulated and unpaid distributions thereon. We generally may not declare or pay, or set apart for payment, any distribution on any unit ranking junior to the Series A Preferred Units as to distributions, including the common units or OPEUs, or redeem, repurchase or otherwise make payments on any such units, unless full, cumulative distributions on all outstanding units of Series A Preferred Units have been declared and paid or set apart for payment for all past distribution periods.
Voting. The managing member will not have any voting or consent rights in respect of its partnership interest represented by the Series A Preferred Units.
Conversion Rights. The Series A Preferred Units are not convertible into units of any other class or series of Lineage Holdings’ units.
Liquidation Preference. Holders of outstanding units of Series A Preferred Units are entitled to a liquidation preference of $1,000 per unit plus all accrued and unpaid distributions thereon.
Redemption. Lineage Holdings is required to redeem Series A Preferred Units from us in connection with any redemption by us of shares of Series A Preferred Stock. We intend to redeem all outstanding Series A Preferred Stock and corresponding units in connection with this offering.
326
Table of Contents
The following table sets forth certain information regarding the beneficial ownership of shares of our common stock, including shares of our common stock into which OP units are exchangeable, immediately following the completion of this offering and the formation transactions, and after giving effect to the issuance of 47,000,000 shares of common stock issued in this offering and the share awards to be made in connection with this offering and the formation transactions, for (1) each person who is expected to be the beneficial owner of 5% or more of our outstanding common stock, (2) each of our directors, director nominees and named executive officers and (3) all of our directors, director nominees and executive officers as a group. Each person named in the table has sole voting and investment power with respect to all of the shares of our common stock shown as beneficially owned by such person, except as otherwise set forth in the notes to the table. In addition, the following table does not reflect any shares of common stock that may be purchased in this offering or pursuant to our directed share program described under “Underwriters—Directed Share Program.”
The SEC has defined “beneficial ownership” of a security to mean the possession, directly or indirectly, of voting power and/or investment power over such security. A stockholder is also deemed to be, as of any date, the beneficial owner of all securities that such stockholder has the right to acquire within 60 days after that date through (1) the exercise or vesting of any right to acquire shares of common stock or (2) the exchange of OP units (including those OP units issuable upon conversion of OPEUs and OP units resulting from the reclassification of Legacy OP Units) for shares of our common stock upon redemption of outstanding OP units. Accordingly, RSUs and LTIPs issued in connection with the offering are not included in the table given their vesting conditions. The following table gives effect to the estimated number of shares of common stock that will be withheld by us in settlement of tax withholding obligations for equity awards to be made in connection with this offering. OPEUs have been included in the table even though the right to redeem the OPEUs are subject to a two year holding period following this offering in order to give a complete picture of potential OP units outstanding.
Unless otherwise indicated, the address of each named person is c/o Lineage, Inc., 46500 Humboldt Drive, Novi, Michigan 48377. No shares beneficially owned by any executive officer, director or director nominee have been pledged as security.
Name of Beneficial Owner | Number of Shares Beneficially Owned(1) | Percentage of Common Stock(1) | Number of Shares and OP Units Beneficially Owned(2) | Percentage of Common Stock and OP Units(2) | ||||||||||||
Greater than 5% Stockholders | ||||||||||||||||
BG Lineage Holdings, LLC(3) | 161,924,302 | 77.1 | % | 184,157,010 | 78.8 | % | ||||||||||
Director, Director Nominees and Named Executive Officers | ||||||||||||||||
Adam Forste(4) | 161,924,302 | 77.1 | % | 185,618,158 | 79.4 | % | ||||||||||
Kevin Marchetti(5) | 161,924,302 | 77.1 | % | 185,618,158 | 79.4 | % | ||||||||||
Greg Lehmkuhl | — | — | — | — | ||||||||||||
Rob Crisci | — | — | — | — | ||||||||||||
Jeffrey Rivera | 4,605 | * | 4,605 | * | ||||||||||||
Sudarsan Thattai | — | — | — | — | ||||||||||||
Sean Vanderelzen | 9,211 | * | 9,211 | * | ||||||||||||
Shellye Archambeau | — | — | — | — | ||||||||||||
John Carrafiell | — | — | — | — | ||||||||||||
Joy Falotico | — | — | — | — | ||||||||||||
Luke Taylor | — | — | — | — | ||||||||||||
Michael Turner | — | — | — | — | ||||||||||||
Lynn Wentworth | — | — | — | — | ||||||||||||
James Wyper | — | — | — | — | ||||||||||||
All Directors, Director Nominees and Executive Officers as a Group (19 persons) | 161,938,546 | 77.1 | % | 185,632,402 | 79.4 | % |
* | Represents less than 1.0%. |
(1) | Assumes 210,008,463 shares of our common stock are outstanding immediately following this offering (including 1,084,161 shares of common stock to be awarded in connection with this offering). See “The |
327
Table of Contents
Offering” for additional information on the number of shares of our common stock and OP units to be outstanding after this offering and the formation transactions. Does not include rights to acquire shares of our common stock, such as OP units, Legacy OP Units, RSUs, LTIPs, or OPEUs. For our directors and executive officers (other than Messrs. Forste and Marchetti, who have voting and dispositive control over the shares of common stock held by BGLH), does not include any shares of our common stock that are held by BGLH and may be distributed from time to time by BGLH to such directors and executive officers as members of BGLH, to the extent applicable. |
(2) | Assumes 210,008,463 shares of our common stock (including 1,084,161 shares of common stock to be awarded in connection with this offering) and 23,693,856 OP units (excluding OP units held by us and including (i) 22,232,708 Legacy OP Units and (ii) 1,461,148 OPEUs) are outstanding immediately following this offering. Further assumes that (i) OPEUs have been exchanged for OP units, and Legacy OP Units have been reclassified into OP units, on a one-for-one basis and, in each case, such OP units have been exchanged for common stock on a one-for-one basis and (ii) the OP units have been exchanged for common stock on a one-for-one basis. OPEUs will be exchangeable at Bay Grove’s election for OP units on a one-for-one basis, subject to adjustment in certain circumstances, at any time beginning two years after the initial closing date of this offering. Holders of OP units have the right beginning 14 months after the issuance of the OP units to require our operating partnership to redeem all or part of their OP units (excluding any Legacy OP Units) for cash equal to the then-current market value of an equal number of shares of our common stock or, at our election, to exchange their OP units for shares of our common stock on a one-for-one basis, subject to certain adjustments and the restrictions on ownership and transfer of our common stock set forth in our charter. Legacy OP Units do not have any redemption rights prior to being reclassified as OP units, but once a Legacy OP Unit has been so reclassified (assuming it is not otherwise in the process of a Cash Settlement), it will have the same redemption rights as the other OP units at any time and will not be subject to the 14-month waiting period. Over the course of the first three years following the initial closing of this offering, all of the Legacy OP Units will ultimately be reclassified into OP units. For our directors and executive officers (other than Messrs. Forste and Marchetti, who through BGLH have voting and dispositive control over the Legacy OP Units), does not include any Legacy OP Units, as all Legacy OP Units are subject to the voting and dispositive control of BGLH, through the LHR. See footnote 3. |
(3) | Includes 161,924,302 shares of our common stock held directly by BGLH, and deemed beneficially owned by BG Cold, Adam Forste and Kevin Marchetti. BGLH is managed indirectly, and BG Cold is managed directly, by Bay Grove. Bay Grove is managed by a management committee comprised of Adam Forste and Kevin Marchetti, our Co-Executive Chairmen, who share voting and investment power over these shares. Also includes 22,232,708 shares of our common stock that may be issuable upon reclassification of Legacy OP Units, representing all the outstanding Legacy OP Units. BGLH, through the LHR, has the power to vote and dispose of all Legacy OP Units. Bay Grove, BG Gold and Messrs. Forste and Marchetti each disclaims beneficial ownership of these securities, except to the extent of any pecuniary interest therein. |
(4) | Represents 161,924,302 shares of common stock held directly by BGLH, 22,232,708 Legacy OP Units (representing all outstanding Legacy OP Units), and 1,461,148 OPEUs (representing all outstanding OPEUs) held directly by BG Maverick, LLC. BGLH, through the LHR, has voting and dispositive power over the outstanding Legacy OP Units. Each of BGLH and BG Maverick, LLC is directly or indirectly managed by Bay Grove, which is managed by a management committee comprised of Messrs. Forste and Marchetti, who have shared voting and investment control over these securities, and may be deemed to beneficially own the securities beneficially owned by each of these entities. Mr. Forste disclaims beneficial ownership of the securities beneficially owned by each of these entities, except to the extent of any pecuniary interest therein. See note 3 above. |
(5) | Represents 161,924,302 shares of common stock held directly by BGLH, 22,232,708 Legacy OP Units (representing all outstanding Legacy OP Units), and 1,461,148 OPEUs (representing all outstanding OPEUs) held directly by BG Maverick, LLC. BGLH, through the LHR, has voting and dispositive power over the outstanding Legacy OP Units. Each of BGLH and BG Maverick, LLC is directly or indirectly managed by Bay Grove, which is managed by a management committee comprised of Messrs. Forste and Marchetti, who have shared voting and investment control over these securities, and may be deemed to beneficially own the securities beneficially owned by each of these entities. Mr. Marchetti disclaims beneficial ownership of the securities beneficially owned by each of these entities, except to the extent of any pecuniary interest therein. See note 3 above. |
328
Table of Contents
DESCRIPTION OF OUR CAPITAL STOCK
The following summary of the terms of our stock does not purport to be complete and is subject to and qualified in its entirety by reference to our charter and bylaws, copies of which are filed as exhibits to the registration statement of which this prospectus is a part, and to the Maryland General Corporation Law, or MGCL. See “Where You Can Find More Information.”
General
Our charter authorizes us to issue up to 500,000,000 shares of common stock, $0.01 par value per share (“common stock”), and up to 100,000,000 shares of preferred stock, $0.01 par value per share (“preferred stock”). Our charter authorizes our board of directors, with the approval of a majority of the entire board and without any action on the part of our stockholders, to amend our charter to increase or decrease the aggregate number of shares of stock that we are authorized to issue or the number of authorized shares of any class or series of stock. Upon completion of this offering, 210,008,463 shares of common stock and no shares of our preferred stock will be issued and outstanding. Under Maryland law, a stockholder generally is not liable for a corporation’s debts or obligations solely as a result of the stockholder’s status as a stockholder.
Common Stock
All of the shares of common stock offered by this prospectus will, upon issuance, be duly authorized, fully paid and nonassessable. Subject to the preferential rights, if any, of holders of any other class or series of stock and to the provisions of our charter regarding restrictions on ownership and transfer of our shares of stock, holders of our common stock:
• | have the right to receive ratably any distributions from funds legally available therefor, when, as and if authorized by our board of directors and declared by us; and |
• | are entitled to share ratably in the assets of our company legally available for distribution to the holders of our common stock in the event of our liquidation, dissolution or winding up of our affairs. |
There are generally no redemption, sinking fund, conversion, preemptive or appraisal rights with respect to our common stock.
Subject to the provisions of our charter regarding the restrictions on ownership and transfer of our stock and except as may otherwise be specified in our charter, each outstanding share of common stock entitles the holder to one vote on all matters on which the stockholders are entitled to vote, including the election of directors. There is no cumulative voting in the election of directors. Consequently, the holders of a majority of the outstanding shares of our common stock can elect all of the directors then standing for election, and the holders of the remaining shares will not be able to elect any directors. In uncontested elections, directors are elected by the affirmative vote of a majority of the total votes cast “for” and “against” each director nominee. In contested elections (i.e., where the number of nominees exceeds the number of directors to be elected), directors are elected by a plurality of the votes cast. This means that the holders of a majority of the outstanding shares of our common stock can effectively elect all of the directors then standing for election, and the holders of the remaining shares will not be able to elect any directors.
Under the MGCL, a Maryland corporation generally cannot amend its charter, consolidate, convert, merge, sell all or substantially all of its assets, engage in a statutory share exchange or dissolve unless the action is advised by its board of directors and approved by the affirmative vote of stockholders entitled to cast at least two-thirds of the votes entitled to be cast on the matter. A Maryland corporation may provide in its charter for approval of these matters by a lesser percentage, but not less than a majority of all of the votes entitled to be cast on the matter. As permitted by Maryland law, our charter provides that any of these actions may be approved by the affirmative vote of stockholders entitled to cast a majority of all of the votes entitled to be cast on the matter. Maryland law also
329
Table of Contents
permits a Maryland corporation to transfer all or substantially all of its assets without the approval of its stockholders to an entity owned, directly or indirectly, by the corporation. Because our operating assets may be held by our operating partnership and wholly owned subsidiaries of our operating partnership, these subsidiaries may be able to merge or transfer all or substantially all of their assets without the approval of our stockholders.
Series A Preferred Stock
In order for us to qualify as a REIT under the Code, our stock must be beneficially owned by 100 or more persons during at least 335 days of a taxable year of 12 months (other than the first year for which an election to be a REIT has been made) or during a proportionate part of a shorter taxable year. Accordingly, we previously issued 630 shares of Series A preferred stock to approximately 126 investors. The Series A preferred stock entitles the holders thereof to receive cumulative cash dividends at a rate per annum of 12.0% of the liquidation preference of $1,000 per share plus all accumulated and unpaid dividends thereon. We generally may not declare or pay, or set apart for payment, any dividend or other distribution on any shares of our stock ranking junior to the Series A preferred stock as to dividends, including our common stock, or redeem, repurchase or otherwise make payments on any such shares, unless full, cumulative dividends on all outstanding shares of Series A preferred stock have been declared and paid or set apart for payment for all past dividend periods. The holders of the Series A preferred stock generally have no voting rights except in limited circumstances, including the authorization or issuance of equity securities senior to the Series A preferred stock, certain amendments to the charter related to the rights and preferences or number of shares of Series A preferred stock and any reclassification of the Series A preferred stock. The Series A preferred stock is not convertible into shares of any other class or series of our stock. The Series A preferred stock is senior to all other classes and series of shares of our stock as to dividend and redemption rights and rights upon our liquidation, dissolution and winding up. Holders of outstanding shares of Series A preferred stock are entitled to a liquidation preference of $1,000 per share plus all accrued and unpaid dividends thereon. Upon written notice to each record holder of our Series A preferred stock as to the effective date of redemption, we may redeem the shares of our outstanding Series A preferred stock at our option, in whole or in part, at any time for cash at a redemption price equal to $1,000 per share, for a total of $630,000 for the 630 shares outstanding, plus all accrued and unpaid dividends thereon to and including the date fixed for redemption. Shares of the Series A preferred stock that are redeemed shall no longer be deemed outstanding shares and all rights of the holders of such shares will terminate. We intend to redeem all 630 outstanding shares of our Series A preferred stock in connection with this offering, so that there will be no shares of our preferred stock issued and outstanding upon completion of this offering.
Power to Issue Additional Shares of Common Stock and Preferred Stock
Our board of directors may, without stockholder approval, classify any unissued shares of our preferred stock and reclassify any unissued shares of our common stock or shares of our preferred stock into other classes or series of stock. Prior to the issuance of classified or reclassified shares of any new class or series, our board of directors must set, subject to the provisions of our charter relating to the restrictions on ownership and transfer of our stock, the preferences, conversion and other rights, voting powers, restrictions, limitations as to dividends and other distributions, qualifications and terms or conditions of redemption for each class or series of stock. In addition, our charter authorizes our board of directors, with the approval of a majority of the entire board and without stockholder approval, to amend our charter to increase or decrease the aggregate number of shares of stock, or the number of shares of any class or series of stock, that we are authorized to issue. These actions can be taken without stockholder approval, unless stockholder approval is required by applicable law, the terms of any other class or series of our stock or the rules of any stock exchange on which our securities may be listed or traded. Although our board of directors does not currently intend to do so, it could authorize us to issue a class or series that could, depending upon the terms of the particular class or series, delay, defer or prevent a transaction or a change in control of our company that might involve a premium price for our stockholders or otherwise be in their best interests.
Restrictions on Ownership and Transfer
In order for us to qualify as a REIT under the Code, our stock must be beneficially owned by 100 or more persons during at least 335 days of a taxable year of 12 months (other than the first year for which an election to be a REIT has been made) or during a proportionate part of a shorter taxable year. Also, not more than 50% of
330
Table of Contents
the value of the outstanding shares of our stock may be owned, directly or indirectly, by five or fewer individuals (as defined in the Code to include certain entities) during the last half of a taxable year (other than the first year for which an election to be a REIT has been made). To qualify as a REIT, we must satisfy other requirements as well. See “Federal Income Tax Considerations—Taxation of Our Company.”
Our charter contains certain restrictions on the ownership and transfer of our stock. Subject to the exceptions described below, no person or entity may beneficially own, or be deemed to own by virtue of the applicable constructive ownership provisions of the Code, more than 9.8% (in value or in number of shares, whichever is more restrictive) of our outstanding common stock or 9.8% (in value) of all classes and series of our outstanding stock. We refer to these restrictions, collectively, as the “ownership limits.”
The constructive ownership rules under the Code are complex and may cause stock owned actually or constructively by a group of related individuals and/or entities to be owned constructively by one individual or entity. As a result, the acquisition of less than 9.8% of our outstanding common stock or 9.8% of all classes and series of our outstanding stock, or the acquisition of an interest in an entity that owns our stock could, nevertheless, cause the acquiror or another individual or entity to own our stock in excess of the ownership limits.
Our board of directors may, upon receipt of certain representations and undertakings to the extent required by our board of directors and in its sole and absolute discretion, prospectively or retroactively, exempt a person from the ownership limits or establish a different limit on ownership for a person if (a) our board of directors determines the person’s ownership in excess of the ownership limits will not cause five or fewer individuals (as defined in the Code to include certain entities) to beneficially own more than 49% in value of our outstanding stock (taking into account the then-current ownership limits and any then-existing exemptions from the ownership limits) and (b) our board of directors determines such person does not and will not own, actually or constructively, an interest in a tenant of ours (or a tenant of any entity owned or controlled by us) that would cause us to own, actually or constructively, more than a 9.9% interest (as set forth in Section 856(d)(2)(B) of the Code) in such tenant (or our board of directors determines that revenue derived from such tenant will not affect our ability to qualify as a REIT). As a condition of granting a waiver of the ownership limits or creating an excepted holder limit, our board of directors may, but is not required to, require an opinion of counsel or IRS ruling satisfactory to our board of directors as it may deem necessary or advisable to determine or ensure our status as a REIT.
Our board of directors may, at any time, increase or decrease an ownership limit for one or more persons unless, after giving effect to any increased or decreased ownership limit, five or fewer individuals (as defined in the Code to include certain entities) would beneficially own, in the aggregate, more than 49% in value of the aggregate outstanding shares of our stock, cause us to be “closely held” under Section 856(h) of the Code (without regard to whether the interest is held during the last half of a taxable year) or cause us to otherwise fail to qualify as a REIT. A decreased ownership limit will not apply to any person whose ownership of our stock at the time the ownership limit is decreased exceeds the decreased ownership limit until the person’s ownership of our stock equals or falls below the decreased ownership limit, but any further acquisition of our stock (or increased beneficial ownership or constructive ownership of shares of our stock) by such a person after the decrease in the ownership limit will violate the decreased ownership limit.
In addition to the ownership limits, our charter prohibits:
• | any person from beneficially or constructively owning shares of our stock that could result in our being “closely held” under Section 856(h) of the Code (without regard to whether the stockholder’s interest is held during the last half of a taxable year) or otherwise cause us to fail to qualify as a REIT; |
• | any person from transferring shares of our stock if the transfer would result in shares of our stock being beneficially owned by fewer than 100 persons; and |
• | any person from directly or indirectly acquiring shares of our stock to the extent that such acquisition would result in our failing to qualify as a domestically controlled qualified investment entity during the |
331
Table of Contents
Foreign Ownership Limitation Period; provided, however, that the receipt of shares of our stock by members of BGLH as a result of an in-kind distribution by BGLH shall not be treated as an acquisition of shares for purposes of this charter limitation. |
Any person who acquires, attempts or intends to acquire beneficial or constructive ownership of our stock in a manner that will or may violate any of the foregoing restrictions on transfer and ownership, or any person who would have owned shares of our stock transferred to a charitable trust as described below, must give written notice immediately to us or, in the case of a proposed or attempted transaction, give us at least 15 days prior written notice, and provide us with such other information as we may request in order to determine the effect, if any, of such transfer on our status as a REIT.
Any attempted transfer of shares of our stock that, if effective, would result in our stock being beneficially owned by fewer than 100 persons will be null and void and the intended transferee will acquire no rights in the shares. Any attempted transfer of our stock that, if effective, would result in a violation of the ownership limits, our being “closely held” under Section 856(h) of the Code (without regard to whether the stockholder’s interest is held during the last half of a taxable year), our otherwise failing to qualify as a REIT or any direct or indirect acquisition of shares of our stock that, if effective, would result in our failing to qualify as a domestically controlled qualified investment entity during the Foreign Ownership Limitation Period, will in each case cause the number of shares causing the violation (rounded up to the nearest whole share) to be transferred automatically to one or more trusts for the exclusive benefit of one or more charitable beneficiaries, and the proposed transferee will not acquire any rights in the shares. The automatic transfer will be effective as of the close of business on the business day before the date of the attempted transfer or other event that resulted in the transfer to the trust. If the transfer to the trust as described above does not occur or is not automatically effective, for any reason, to prevent a violation of the applicable restrictions on ownership and transfer of our stock, then the attempted transfer which, if effective, would have resulted in a violation of the restrictions on ownership and transfer of our stock will be null and void, and the intended transferee will acquire no rights in the shares.
Shares of our stock held in the trust will be issued and outstanding shares. The proposed transferee will not benefit economically from ownership of any shares of our stock held in the trust and will have no rights to dividends or other distributions and no rights to vote or other rights attributable to the shares of our stock held in the trust. The proposed transferee will have no claim, cause of action, or any other recourse whatsoever against the purported transferor of such shares of our stock. The trustee of the trust will exercise all voting rights and receive all dividends and other distributions with respect to shares held in the trust for the exclusive benefit of the charitable beneficiary of the trust. Any dividend or other distribution paid before we discover that the shares have been transferred to a trust as described above must be repaid by the recipient to the trustee upon demand by us. Subject to Maryland law, effective as of the date that the shares have been transferred to the trust, the trustee will have the authority to rescind as void any vote cast by a proposed transferee before our discovery that the shares have been transferred to the trust and to recast the vote in accordance with the desires of the trustee (acting for the benefit of the charitable beneficiary). However, if we have already taken irreversible corporate action, then the trustee may not rescind and recast the vote.
Within 20 days of receiving notice from us of a transfer of shares to the trust, the trustee must sell the shares to a person, designated by the trustee, that could own the shares without violating the ownership limits or the other restrictions on ownership and transfer of our stock contained in our charter. After the sale of the shares, the interest of the charitable beneficiary in the shares transferred to the trust will terminate and the trustee must distribute to the proposed transferee an amount equal to the lesser of:
• | the price paid by the proposed transferee for the shares (or, if the proposed transferee did not give value in connection with the event that resulted in the transfer to the trust (e.g., a gift, devise or other such transaction), the market price of the shares on the day of the event that resulted in the transfer of such shares to the trust); and |
• | the price per share received by the trustee (net of any commissions and other expenses) from the sale or other disposition of the shares. |
332
Table of Contents
The trustee may reduce the amount payable to the proposed transferee by the amount of any dividends or other distributions that we paid to the proposed transferee and that is owed by the proposed transferee to the trustee as described above. The trustee must distribute any remaining funds held by the trust with respect to the shares to the charitable beneficiary. If the shares are sold by the proposed transferee before we discover that they have been transferred to the trust, the shares will be deemed to have been sold on behalf of the trust and the proposed transferee must pay to the trustee, upon demand, if any, the amount that the proposed transferee received in excess of the amount that the proposed transferee would have received had the shares been sold by the trustee.
Shares of our stock held in the trust will be deemed to be offered for sale to us, or our designee, at a price per share equal to the lesser of:
• | the price per share in the transaction that resulted in the transfer to the trust (or, if the event that resulted in the shares being transferred to the trust did not involve a purchase of such shares at market price, the market price of the shares on the day of the event causing the shares to be held in the trust); and |
• | the market price on the date we, or our designee, accept the offer. |
We will reduce the amount so payable by the amount of any dividends or other distributions that we paid to the proposed transferee and that is owed by the proposed transferee to the trustee as described above, and we will pay such amount to the trustee for distribution to the charitable beneficiary of the trust. We have the right to accept the offer until the trustee has otherwise sold the shares of our stock held in the trust. Upon a sale to us, the interest of the charitable beneficiary in the shares sold will terminate and the trustee must distribute the net proceeds of the sale to the proposed transferee.
Every owner of at least five percent (or such lower percentage as required by the Code or the regulations promulgated thereunder) of the outstanding shares of any class or series of our stock, within 30 days after the end of each taxable year, must give us written notice stating the person’s name and address, the number of shares of each class and series of our stock that the person beneficially owns and a description of the manner in which the shares are held. Each such owner also must provide us with any additional information that we request in order to determine the effect, if any, of the person’s beneficial ownership on our status as a REIT or as a domestically controlled qualified investment entity and to ensure compliance with the ownership limits. In addition, any person or entity that is a beneficial owner or constructive owner of shares of our stock and any person or entity (including the stockholder of record) who is holding shares of our stock for a beneficial owner or constructive owner must, on request, disclose to us in writing such information as we may request in order to determine our status as a REIT or as a domestically controlled qualified investment entity or to comply, or determine our compliance, with the requirements of any governmental or taxing authority and to ensure compliance with the ownership limits.
Any certificates representing shares of our stock will bear a legend referring to the restrictions described above.
These restrictions on ownership and transfer of our stock will not apply if our board of directors determines that it is no longer in our best interests to attempt to qualify, or to continue to qualify, as a REIT or that compliance with any or all of these restrictions is no longer required in order for us to qualify as a REIT.
These restrictions on ownership and transfer of our stock could delay, defer or prevent a transaction or a change of control of us that might involve a premium price for our common stock or otherwise be in the best interests of our stockholders.
Transfer Agent and Registrar
The transfer agent and registrar for our shares of our common stock will be Computershare Trust Company, N.A.
333
Table of Contents
CERTAIN PROVISIONS OF MARYLAND LAW AND OF OUR CHARTER AND BYLAWS
The following summary of certain provisions of Maryland law and of our charter and bylaws does not purport to be complete and is subject to and qualified in its entirety by reference to Maryland law, including the MGCL, and our charter and bylaws. Copies of our charter and bylaws are filed as exhibits to the registration statement of which this prospectus is a part. See “Where You Can Find More Information.”
Our Board of Directors
Our charter and bylaws provide that the number of our directors may be established only by our board of directors but may not be fewer than the minimum number required under the MGCL, which is one, nor, unless our bylaws are amended, more than fifteen. Our charter and bylaws provide that, at such time as we become eligible to elect to be subject to Title 3, Subtitle 8 of the MGCL and subject to the rights of holders of one or more classes or series of preferred stock, any vacancy on our board of directors may be filled only by a majority of the remaining directors, even if the remaining directors do not constitute a quorum, and any individual elected to fill a vacancy will serve for the remainder of the full term of the directorship in which such vacancy occurred and until his or her successor is duly elected and qualifies.
Pursuant to our charter and bylaws, each member of our board of directors is elected by our stockholders to serve until the next annual meeting of stockholders and until his or her successor is duly elected and qualifies. Holders of our common stock have no right to cumulative voting in the election of directors. In uncontested elections, directors are elected by the affirmative vote of a majority of the total votes cast “for” and “against” each director nominee. In contested elections (i.e., where the number of nominees exceeds the number of directors to be elected), directors are elected by a plurality of the votes cast. This means that the holders of a majority of the outstanding shares of our common stock can effectively elect all of the directors then standing for election, and the holders of the remaining shares will not be able to elect any directors.
Removal of Directors
Our charter provides that, subject to the rights of holders of any class or series of preferred stock, a director may be removed only for “cause,” and then only by the affirmative vote of a majority of the votes entitled to be cast generally in the election of directors. For this purpose, “cause” means, with respect to any particular director, conviction of a felony or a final judgment of a court of competent jurisdiction holding that such director caused demonstrable, material harm to us through bad faith or active and deliberate dishonesty. These provisions, when coupled with the exclusive power of our board of directors to fill vacancies on our board of directors, generally precludes stockholders from removing incumbent directors except for “cause” and filling the vacancies created by such removal with their own nominees.
Business Combinations
Under the MGCL, certain “business combinations” (including a merger, consolidation, statutory share exchange or, in certain circumstances, an asset transfer or issuance or reclassification of equity securities) between a Maryland corporation and an interested stockholder (defined generally as any person who beneficially owns, directly or indirectly, 10% or more of the voting power of the corporation’s outstanding voting stock or an affiliate or associate of the corporation who, at any time during the two-year period immediately prior to the date in question, was the beneficial owner, directly or indirectly, of 10% or more of the voting power of the then-outstanding stock of the corporation) or an affiliate of such an interested stockholder are prohibited for five years after the most recent date on which the interested stockholder becomes an interested stockholder. Thereafter, any such business combination must generally be recommended by the board of directors of the corporation and approved by the affirmative vote of at least:
• | 80% of the votes entitled to be cast by holders of outstanding shares of voting stock of the corporation; and |
334
Table of Contents
• | two-thirds of the votes entitled to be cast by holders of voting stock of the corporation, other than shares of stock held by the interested stockholder with whom (or with whose affiliate) the business combination is to be effected or held by an affiliate or associate of the interested stockholder, |
unless, among other conditions, the corporation’s common stockholders receive a minimum price (as defined in the MGCL) for their shares and the consideration is received in cash or in the same form as previously paid by the interested stockholder for its shares. A person is not an interested stockholder under the statute if the board of directors approved in advance the transaction by which the person otherwise would have become an interested stockholder. A corporation’s board of directors may provide that its approval is subject to compliance, at or after the time of approval, with any terms and conditions determined by the board of directors.
Pursuant to the MGCL, our board of directors has by resolution exempted business combinations between us and any other person, provided that the business combination is first approved by our board of directors (including a majority of our directors who are not affiliates or associates of such person). Consequently, the five-year prohibition and the supermajority vote requirements will not apply to a business combination approved by our board of directors, including a majority of our directors who are not affiliates or associates of the person party to the business combination. As a result, any such persons may be able to enter into business combinations with us that may not be in the best interests of our stockholders, without compliance with the supermajority vote requirements and the other provisions of the statute. We cannot assure you that our board of directors will not amend or repeal this resolution in the future.
Control Share Acquisitions
The MGCL provides that holders of “control shares” of a Maryland corporation acquired in a “control share acquisition” have no voting rights with respect to such shares except to the extent approved by the affirmative vote of at least two-thirds of the votes entitled to be cast on the matter. Shares of stock owned by the acquiror, an officer of the corporation or an employee of the corporation who is also a director of the corporation are excluded from shares of stock entitled to vote on the matter.
“Control shares” are voting shares of stock that, if aggregated with all other such shares of stock owned by the acquiror, or in respect of which the acquiror is able to exercise or direct the exercise of voting power (except solely by virtue of a revocable proxy), would entitle the acquiror to exercise voting power in electing directors within one of the following ranges of voting power:
• | one-tenth or more but less than one-third; |
• | one-third or more but less than a majority; or |
• | a majority or more of all voting power. |
Control shares do not include shares of stock that the acquiring person is then entitled to vote as a result of having previously obtained stockholder approval or shares acquired directly from the corporation. A “control share acquisition” means the acquisition of issued and outstanding control shares, subject to certain exceptions.
A person who has made or proposes to make a control share acquisition, upon satisfaction of certain conditions (including an undertaking to pay expenses and making an “acquiring person statement” as described in the MGCL), may compel the board of directors to call a special meeting of stockholders to be held within 50 days of demand to consider the voting rights of the shares of stock. If no request for a meeting is made, the corporation may itself present the question at any stockholders meeting.
If voting rights are not approved at the meeting or if the acquiring person does not deliver an “acquiring person statement” as required by the statute, then, subject to certain conditions and limitations, the corporation may redeem for fair value any or all of the control shares (except those for which voting rights have previously
335
Table of Contents
been approved). Fair value is determined, without regard to the absence of voting rights for the control shares, as of the date of the last control share acquisition by the acquiror or, if a meeting of stockholders is held at which the voting rights of such shares of stock are considered and not approved, as of the date of such meeting. If voting rights for control shares are approved at a stockholders’ meeting and the acquiror becomes entitled to vote a majority of the shares of stock entitled to vote, all other stockholders may exercise appraisal rights. The fair value of the shares of stock as determined for purposes of such appraisal rights may not be less than the highest price per share paid by the acquiror in the control share acquisition.
The control share acquisition statute does not apply to (i) shares acquired in a merger, consolidation or statutory share exchange if the corporation is a party to the transaction or (ii) acquisitions approved or exempted by the charter or bylaws of the corporation.
Our bylaws contain a provision exempting from the control share acquisition statute any and all acquisitions by any person of shares of our stock. This provision may be amended or eliminated at any time in the future by our board of directors.
Subtitle 8
Subtitle 8 of Title 3 of the MGCL permits a Maryland corporation with a class of equity securities registered under the Exchange Act and at least three independent directors to elect to be subject, by provision in its charter or bylaws or a resolution of its board of directors and notwithstanding any contrary provision in the charter or bylaws, to any or all of five provisions of the MGCL that provide, respectively, for:
• | a classified board; |
• | a two-thirds vote requirement for removing a director; |
• | a requirement that the number of directors be fixed only by vote of the board of directors; |
• | a requirement that a vacancy on the board of directors be filled only by a vote of the remaining directors in office and for the remainder of the full term of the class of directors in which the vacancy occurred and until a successor is elected and qualifies; and |
• | a majority requirement for the calling of a stockholder-requested special meeting of stockholders. |
Our charter provides that, at such time as we become eligible to make a Subtitle 8 election, we elect to be subject to the provisions of Subtitle 8 relating to the filling of vacancies on our board of directors. Through provisions in our charter and bylaws unrelated to Subtitle 8, we will also (i) vest in our board the exclusive power to fix the number of directorships and (ii) require, unless called by our Chairman (or any co-chair of our board of directors if more than one), Chief Executive Officer, President or our board of directors, the written request of stockholders entitled to cast a majority of all the votes entitled to be cast at such meeting to call a special meeting. We have not elected to be subject to any of the other provision of Subtitle 8, including the provisions that would permit us to classify our board of directors without stockholder approval. Moreover, our charter provides that, without the affirmative vote of a majority of the votes cast on the matter by our stockholders entitled to vote generally in the election of directors, we may not elect to be subject to the provision of Subtitle 8 that permits our board of directors to classify itself.
Anti-takeover Effect of Certain Provisions of Maryland Law and of Our Charter and Bylaws
If the applicable exemption in our bylaws is repealed and the applicable resolution of our board of directors is repealed, the control share acquisition provisions and the business combination provisions of the MGCL, respectively, as well as the provisions in our charter and bylaws, as applicable, on removal of directors and the filling of director vacancies under Subtitle 8 and the restrictions on ownership and transfer of shares of stock, together with the advance notice and stockholder-requested special meeting provisions of our bylaws, alone or in combination, could serve to delay, deter or prevent a transaction or a change in our control that might involve a premium price for holders of our common stock or otherwise be in their best interests.
336
Table of Contents
Amendments to Our Charter and Bylaws
Under the MGCL, a Maryland corporation generally cannot amend its charter unless declared advisable by a majority of the board of directors and approved by the affirmative vote of stockholders entitled to cast at least two-thirds of the votes entitled to be cast on the matter unless a lesser percentage, but not less than a majority of all of the votes entitled to be cast on the matter, is set forth in the charter. As permitted by Maryland law, our charter provides that, except for those amendments permitted to be made without stockholder approval under the MGCL or by specific provision in our charter, amendments to our charter must be declared advisable by our board of directors and approved by the affirmative vote of stockholders entitled to cast a majority of all of the votes entitled to be cast on the matter.
Our board of directors has the power to adopt, alter or repeal any provision of our bylaws and to make new bylaws. In addition, the stockholders may alter or repeal any provision of our bylaws and adopt new bylaws with the approval by a majority of the votes entitled to be cast on the matter.
Meetings of Stockholders
Pursuant to our bylaws, an annual meeting of our stockholders for the purpose of the election of directors and the transaction of any business will be held on a date and at the time and place set by our board of directors. In addition, our Chairman (or any co-chair of our board of directors if more than one), Chief Executive Officer, President or our board of directors may call a special meeting of our stockholders. A special meeting of our stockholders to act on any matter that may properly be considered at a meeting of our stockholders must also be called by our secretary upon the written request of stockholders entitled to cast a majority of all the votes entitled to be cast on such matter at the meeting and containing the information required by our bylaws.
Corporate Opportunities
Pursuant to our charter, if any director of ours who is also an officer, employee or agent of BentallGreenOaks, D1 Capital, Oxford Property Group, OMERS Administration Corporation or Stonepeak, or any of their respective affiliates, acquires knowledge of a potential business opportunity, we renounce any potential interest or expectation in, or right to be offered to participate in, such business opportunity unless it is a retained opportunity (as defined in our charter). A retained opportunity includes any business opportunity of which a director nominated by BentallGreenOaks or Stonepeak or who is an officer, employee or agent of D1 Capital or Oxford becomes aware as a direct result of his or her capacity as a director of our company and (a) which our company is financially able to undertake, (b) which our company is not prohibited by contract or applicable law from pursuing or undertaking, (c) which, from its nature, is in the line of our business, (d) which is of practical advantage to us and (e) in which our company has an interest or a reasonable expectancy.
Advance Notice of Director Nominations and New Business
Our bylaws provide that nominations of individuals for election to our board of directors and proposals of other business to be considered by stockholders at any annual meeting of our stockholders may be made only (i) pursuant to our notice of the meeting, (ii) by or at the direction of our board of directors or (iii) by a stockholder present in person or by proxy at the annual meeting who was a stockholder of record at the record date set by the board of directors for the purpose of determining stockholders entitled to vote at the meeting, at the time of giving of notice by the stockholder as provided for in our bylaws and at the time of the meeting (and any postponement or adjustment thereof), who is entitled to vote at the meeting in the election of each individual so nominated or on such other business and who has complied with the advance notice procedures set forth in our bylaws. Stockholders generally must provide notice to our secretary not before the 150th day or after 5:00 p.m., Eastern Time, on the 120th day before the first anniversary of the date of our proxy statement for the preceding year’s annual meeting, provided, that for notice of any nomination or other business to be properly brought before the first annual meeting of our stockholders convened after the closing of this offering of our common
337
Table of Contents
stock or if the date of the annual meeting is advanced or delayed by more than 30 days from the first anniversary of the date of the preceding year’s annual meeting, to be timely, a stockholder’s notice must be delivered not earlier than the 150th day prior to the date of such annual meeting and not later than 5:00 p.m., Eastern Time, on the later of the 120th day prior to the date of such annual meeting, as originally convened, or the tenth day following the day on which public announcement of the date of such meeting is first made.
Only the business specified in our notice of the meeting may be brought before a special meeting of our stockholders. Nominations of individuals for election to our board of directors at a special meeting of stockholders may be made only (i) by or at the direction of our board of directors or (ii) provided that the meeting has been called in accordance with our bylaws for the purpose of electing directors, by a stockholder who is a stockholder of record at the record date set by the board of directors for the purpose of determining stockholders entitled to vote at the meeting, at the time of giving of the notice required by our bylaws and at the time of the meeting (and any postponement or adjustment thereof), who is entitled to vote at the meeting in the election of each individual so nominated and who has complied with the advance notice provisions set forth in our bylaws. Stockholders generally must provide notice to our secretary not before the 120th day before such special meeting and not later than 5:00 p.m., Eastern Time, on the later of the 90th day before the special meeting or the tenth day after public announcement of the date of the special meeting.
No Stockholder Rights Plan
We do not have a stockholder rights plan, and we will not adopt a stockholder rights plan in the future without (a) the approval of our stockholders or (b) seeking ratification from our stockholders within 12 months of the adoption of the plan if the board of directors determines, in the exercise of its duties under applicable law, that it is in our best interests to adopt a rights plan without the delay of seeking prior stockholder approval.
Exclusive Forum
Our bylaws provide that, unless we consent in writing to the selection of an alternative forum, any state court of competent jurisdiction in Maryland, or, if such state courts do not have jurisdiction, the United States District Court located within the State of Maryland will, to the fullest extent permitted by law, be the sole and exclusive forum for (a) any derivative action or proceeding brought on our behalf, (b) any Internal Corporate Claim, as such term is defined in the MGCL, including, without limitation, (i) any action asserting a claim based on an alleged breach of any duty owed by any of our directors, officers or other employees to us or to our stockholders or (ii) any action asserting a claim against us or any of our directors, officers or other employees arising pursuant to any provision of the MGCL or our charter or bylaws, or (c) any other action asserting a claim that is governed by the internal affairs doctrine. These choice of forum provisions will not apply to suits brought to enforce a duty or liability created by the Securities Act, the Exchange Act, or any other claim for which federal courts have exclusive jurisdiction. Furthermore, our bylaws provide that, unless we consent in writing to the selection of an alternative forum, the federal district courts of the United States of America shall, to the fullest extent permitted by law, be the sole and exclusive forum for the resolution of any claim arising under the Securities Act. Although our bylaws will contain the choice of forum provisions described above, it is possible that a court could rule that such provisions are inapplicable for a particular claim or action or that such provisions are unenforceable. For example, under the Securities Act, federal courts have concurrent jurisdiction over all suits brought to enforce any duty or liability created by the Securities Act, and investors cannot waive compliance with the federal securities laws and the rules and regulations thereunder. In addition, the exclusive forum provisions described above do not apply to any actions brought under the Exchange Act.
Although we believe these provisions will benefit us by limiting costly and time-consuming litigation in multiple forums and by providing increased consistency in the application of applicable law, these exclusive forum provisions may limit the ability of our stockholders to bring a claim in a judicial forum that such stockholders find favorable for disputes with us or our directors, officers or employees, which may discourage such lawsuits against us and our directors, officers and other employees.
338
Table of Contents
Limitation of Liability and Indemnification of Directors and Officers
Maryland law permits a Maryland corporation to include in its charter a provision limiting the liability of its directors and officers to the corporation and its stockholders for money damages, except for liability resulting from (a) actual receipt of an improper benefit or profit in money, property or services or (b) active and deliberate dishonesty that is established by a final judgment and that is material to the cause of action. Our charter contains a provision that eliminates the liability of our directors and officers to the maximum extent permitted by Maryland law.
The MGCL requires us (unless our charter provides otherwise, which our charter does not) to indemnify a director or officer who has been successful, on the merits or otherwise, in the defense of any proceeding to which he or she is made or threatened to be made a party by reason of his or her service in that capacity. The MGCL permits us to indemnify our present and former directors and officers, among others, against judgments, penalties, fines, settlements and reasonable expenses actually incurred by them in connection with any proceeding to which they may be made or threatened to be made a party to, or witness in, by reason of their service in those or other capacities unless it is established that:
• | the act or omission of the director or officer was material to the matter giving rise to the proceeding and (i) was committed in bad faith or (ii) was the result of active and deliberate dishonesty; |
• | the director or officer actually received an improper personal benefit in money, property or services; or |
• | in the case of any criminal proceeding, the director or officer had reasonable cause to believe that the act or omission was unlawful. |
Under the MGCL, we may not indemnify a director or officer in a suit by us or in our right in which the director or officer was adjudged liable to us or in a suit in which the director or officer was adjudged liable on the basis that personal benefit was improperly received. A court may order indemnification if it determines that the director or officer is fairly and reasonably entitled to indemnification, even though the director or officer did not meet the prescribed standard of conduct or was adjudged liable on the basis that personal benefit was improperly received. However, indemnification for an adverse judgment in a suit by us or in our right, or for a judgment of liability on the basis that personal benefit was improperly received, is limited to expenses.
In addition, the MGCL permits us to advance reasonable expenses to a director or officer upon our receipt of:
• | a written affirmation by the director or officer of his or her good faith belief that he or she has met the standard of conduct necessary for indemnification by us; and |
• | a written undertaking by or on behalf of the director or officer to repay the amount paid or reimbursed by us if it is ultimately determined that the director or officer did not meet the standard of conduct. |
Our charter requires us, to the maximum extent permitted by Maryland law in effect from time to time, to indemnify and, without requiring a preliminary determination of the ultimate entitlement to indemnification, pay or reimburse reasonable expenses in advance of final disposition of a proceeding to:
• | any present or former director or officer who is made or threatened to be made a party to, or witness in, a proceeding by reason of his or her service in that capacity; or |
• | any individual who, while a director or officer of our company and at our request, serves or has served as a director, officer, partner, trustee, member or manager of another corporation, real estate investment trust, limited liability company, partnership, joint venture, trust, employee benefit plan or any other enterprise and who is made or threatened to be made a party to, or witness in, the proceeding by reason of his or her service in that capacity. |
Our charter also permits us, with the approval of our board of directors, to indemnify and advance expenses to any person who served a predecessor of ours in any of the capacities described above and to any employee or agent of our company or a predecessor of our company.
339
Table of Contents
In addition, our directors and officers may be entitled to indemnification pursuant to the terms of the partnership agreement of our operating partnership. See “Description of the Partnership Agreement of Lineage OP, LP.”
Insofar as the foregoing provisions permit indemnification of directors, officers or persons controlling us for liability arising under the Securities Act, we have been informed that, in the opinion of the SEC, this indemnification is against public policy as expressed in the Securities Act and is therefore unenforceable.
Indemnification Agreements
We intend to enter into indemnification agreements with each of our directors and executive officers as described in “Management—Indemnification.”
REIT Qualification
Our charter provides that our board of directors may revoke or otherwise terminate our REIT election, without approval of our stockholders, if the board of directors determines that it is no longer in our best interests to attempt to, or continue to, qualify as a REIT.
340
Table of Contents
SHARES ELIGIBLE FOR FUTURE SALE
General
Upon the completion of this offering, we expect to have outstanding 210,008,463 shares of our common stock (217,058,463 shares if the underwriters’ option to purchase additional shares is exercised in full). In addition, a total of 23,693,856 shares of our common stock are issuable upon exchange of OP units (including those OP units issuable upon conversion of OPEUs and OP units resulting from the reclassification of Legacy OP Units) that we expect to be outstanding upon completion of this offering and the formation transactions described under the heading “The Offering.”
Of these shares, the 47,000,000 shares of our common stock sold in this offering (54,050,000 shares of our common stock if the underwriters’ option to purchase additional shares is exercised in full) and an aggregate of 1,003,211 shares of common stock (net of shares that will be remitted to our company to satisfy tax withholding obligations) that will be issued under the 2024 Plan or as LVCP Awards in connection with the completion of this offering will be freely transferable without restriction or further registration under the Securities Act, subject to the restrictions on ownership and transfer of our stock set forth in our charter. Approximately 2.7% of the aggregate shares of common stock that will be outstanding immediately upon completion of this offering will be subject to lock-up agreements.
There is currently no public market for our common stock. Trading of our common stock on Nasdaq is expected to commence following the pricing of this offering. No assurance can be given as to (1) the likelihood that an active market for common stock will develop, (2) the liquidity of any such market, (3) the ability of the stockholders to sell their shares or (4) the prices that stockholders may obtain for any of their shares. No prediction can be made as to the effect, if any, that future sales of shares, or the availability of shares for future sale, will have on the market price prevailing from time to time. Sales of substantial amounts of our common stock (including shares of our common stock issued upon the exchange of OP units), or the perception that such sales could occur, may adversely affect prevailing market prices of our common stock. See “Risk Factors—Risks Related to this Offering and Ownership of Shares of Our Common Stock.”
For a description of certain restrictions on ownership and transfer of shares of our common stock held by certain of our stockholders, see “Description of Our Capital Stock—Restrictions on Ownership and Transfer.”
Rule 144
After giving effect to this offering, we expect that 162,005,252 shares of our outstanding common stock will be “restricted” securities under the meaning of Rule 144 under the Securities Act and may not be sold in the absence of registration under the Securities Act unless an exemption from registration is available, including the exemption provided by Rule 144.
In general, under Rule 144 as currently in effect, beginning 90 days after the date of this prospectus, a person who is not deemed to have been an affiliate of ours at any time during the three months preceding a sale and who has beneficially owned shares considered to be restricted securities under Rule 144 for at least six months would be entitled to sell those shares, subject only to the availability of current public information about us. A non-affiliated person who has beneficially owned shares considered to be restricted securities under Rule 144 for at least one year would be entitled to sell those shares without regard to the provisions of Rule 144.
An affiliate of ours who has beneficially owned shares of our common stock for at least six months would be entitled to sell, within any three-month period, a number of shares that does not exceed the greater of:
• | 1% of the shares of our common stock then outstanding, which we expect will equal approximately 2,100,085 shares immediately after this offering (2,170,585 shares if the underwriters exercise in full their option to purchase additional shares); or |
341
Table of Contents
• | the average weekly trading volume of our common stock on Nasdaq during the four calendar weeks preceding the date on which notice of the sale is filed with the SEC; |
provided, in each case, that we are subject to the Exchange Act periodic reporting requirements for at least 90 days before the sale and have filed all required reports during that time period. Such sales by affiliates must also comply with the manner of sale, current public information and notice provisions of Rule 144.
Sales under Rule 144 by our affiliates or persons selling shares on behalf of our affiliates are also subject to manner of sale provisions, notice requirements and the availability of current public information about us.
Rule 701
Generally, an employee, officer, director or qualified consultant of ours who purchased shares of our common stock before the effective date of the registration statement relating to this prospectus, or who holds options as of that date, pursuant to a written compensatory plan or contract may rely on the resale provisions of Rule 701 under the Securities Act. Under Rule 701, these persons who are not our affiliates may generally sell those securities, commencing 90 days after the effective date of the registration statement, without having to comply with the current public information and minimum holding period requirements of Rule 144. These persons who are our affiliates may generally sell those securities under Rule 701, commencing 90 days after the effective date of the registration statement, without having to comply with Rule 144’s minimum holding period restriction.
Lock-up Agreements
In addition to the limits placed on the sale of our common stock by operation of Rule 144, Rule 701 and other provisions of the Securities Act, we, our directors, director nominees and executive officers and entities controlled by our Co-Founders holding substantially all of the shares of our common stock and OP units outstanding immediately prior to this offering have agreed not to sell or otherwise transfer or encumber, or enter into any transaction that transfers, in whole or in part, directly or indirectly, any shares of our common stock or securities convertible or exchangeable into shares of our common stock (including OP units) owned by them at the completion of this offering and the formation transactions or thereafter acquired by them for a period of 180 days after the date of this prospectus, subject to specified exceptions, without the prior consent of the representatives of the underwriters in this offering. See “Underwriters.”
The representatives of the underwriters in this offering have advised us that they have no present intent or arrangement to release any shares subject to a lock-up and will consider the release of any shares subject to a lock-up on a case-by-case basis. Upon a request to release any shares subject to a lock-up, the representatives on behalf of the underwriters in this offering will consider the particular circumstances surrounding the request, including, but not limited to, the length of time before the lock-up expires, the number of shares requested to be released, the reasons for the request, the possible impact on the market for our common stock and whether the holder of our shares requesting the release is an officer, director or other affiliate of ours.
Registration Rights Agreements
We will enter into a registration rights agreement with BGLH, pursuant to which we will grant it and certain of its affiliates with certain “demand” registration rights and customary “piggyback” registration rights with respect to 161,924,302 shares of common stock held by BGLH and 22,232,708 shares of common issuable upon redemption of 22,232,708 OP units. The registration rights agreements will also provide that we will pay certain expenses relating to such registrations and indemnify the registration rights holders against certain liabilities that may arise under the Securities Act.
342
Table of Contents
We will also enter into one or more registration rights agreements with holders of registrable securities (including Mr. Forste and Mr. Marchetti), pursuant to which we will grant them with certain resale registration rights with respect to shares of common stock that they may receive upon distributions from BGLH or upon exchange of OP units. The registration rights agreements will also provide that we will pay certain expenses relating to such registrations and indemnify the registration rights holders against certain liabilities which may arise under the Securities Act.
343
Table of Contents
FEDERAL INCOME TAX CONSIDERATIONS
The following is a general summary of material U.S. federal income tax considerations regarding our election to be taxed as a REIT and this offering of our common stock. For purposes of this discussion, references to “we,” “our” and “us” mean only Lineage, Inc. and do not include any of its subsidiaries, except as otherwise indicated. This summary is for general information only and is not tax advice. The information in this summary is based on:
• | the Code; |
• | current, temporary and proposed Treasury Regulations; |
• | the legislative history of the Code; |
• | administrative interpretations and practices of the IRS; and |
• | court decisions; |
in each case, as of the date of this prospectus. In addition, the administrative interpretations and practices of the IRS include its practices and policies as expressed in private letter rulings that are not binding on the IRS except with respect to the particular taxpayers who requested and received those rulings. The sections of the Code and the corresponding Treasury Regulations that relate to qualification and taxation as a REIT are highly technical and complex. The following discussion sets forth certain material aspects of the sections of the Code that govern the U.S. federal income tax treatment of a REIT and its stockholders. This summary is qualified in its entirety by the applicable Code provisions, Treasury Regulations promulgated under the Code, and administrative and judicial interpretations thereof. Potential tax reforms may result in significant changes to the rules governing U.S. federal income taxation. New legislation, Treasury Regulations, administrative interpretations and practices and/or court decisions may significantly and adversely affect our ability to qualify as a REIT, the U.S. federal income tax consequences of such qualification, or the U.S. federal income tax consequences of an investment in our common stock, including those described in this discussion. Moreover, the law relating to the tax treatment of other entities, or an investment in other entities, could change, making an investment in such other entities more attractive relative to an investment in a REIT. Any such changes could apply retroactively to transactions preceding the date of the change. Except as discussed herein, we have not requested, and do not plan to request, any rulings from the IRS that we qualify as a REIT, and the statements in this prospectus are not binding on the IRS or any court. Thus, we can provide no assurance that the tax considerations contained in this discussion will not be challenged by the IRS or will be sustained by a court if challenged by the IRS. This summary does not discuss any state, local or non-U.S. tax consequences, or any tax consequences arising under any U.S. federal tax laws other than U.S. federal income tax laws, associated with the purchase, ownership or disposition of our common stock, or our election to be taxed as a REIT.
You are urged to consult your tax advisors regarding the tax consequences to you of:
• | the purchase, ownership and disposition of our common stock, including the U.S. federal, state, local, non-U.S. and other tax consequences; |
• | our election to be taxed as a REIT for U.S. federal income tax purposes; and |
• | potential changes in applicable tax laws. |
Taxation of Our Company
General. We have elected to be taxed as a REIT under Sections 856 through 860 of the Code commencing with our taxable year ended December 31, 2020. We believe that we have been organized and have operated in a manner that has allowed us to qualify for taxation as a REIT under the Code commencing with such taxable year, and we intend to continue to be organized and operate in this manner. However, qualification and taxation as a
344
Table of Contents
REIT depend upon our ability to meet the various qualification tests imposed under the Code, including through actual operating results, asset composition, distribution levels and diversity of stock ownership. Accordingly, no assurance can be given that we have been organized and have operated, or will continue to be organized and operate, in a manner so as to qualify or remain qualified as a REIT. See “—Failure to Qualify” for potential tax consequences if we fail to qualify as a REIT.
Latham & Watkins LLP has acted as our tax counsel in connection with this offering of our common stock and our election to be taxed as a REIT. Latham & Watkins LLP will render an opinion to us, as of the date of this prospectus, to the effect that, commencing with our taxable year ended December 31, 2020, we have been organized and have operated in conformity with the requirements for qualification and taxation as a REIT under the Code, and our proposed method of operation will enable us to continue to meet the requirements for qualification and taxation as a REIT under the Code. It must be emphasized that this opinion will be based on various assumptions and representations as to factual matters, including representations made by us in a factual certificate provided by one or more of our officers. In addition, this opinion will be based upon our factual representations set forth in this prospectus. Moreover, our qualification and taxation as a REIT depend upon our ability to meet the various qualification tests imposed under the Code, which are discussed below, including through actual operating results, asset composition, distribution levels and diversity of stock ownership, the results of which have not been and will not be reviewed by Latham & Watkins LLP. Accordingly, no assurance can be given that our actual results of operations for any particular taxable year have satisfied or will satisfy those requirements. Further, the anticipated U.S. federal income tax treatment described herein may be changed, perhaps retroactively, by legislative, administrative or judicial action at any time. Latham & Watkins LLP has no obligation to update its opinion subsequent to the date of such opinion.
Provided we qualify for taxation as a REIT, we generally will not be required to pay U.S. federal corporate income taxes on our REIT taxable income that is currently distributed to our stockholders. This treatment substantially eliminates the “double taxation” that ordinarily results from investment in a C corporation. A C corporation is a corporation that generally is required to pay tax at the corporate level. Double taxation means taxation once at the corporate level when income is earned and once again at the stockholder level when the income is distributed. We will, however, be required to pay U.S. federal income tax as follows:
• | First, we will be required to pay regular U.S. federal corporate income tax on any undistributed REIT taxable income, including undistributed capital gain. |
• | Second, if we have (1) net income from the sale or other disposition of “foreclosure property” held primarily for sale to customers in the ordinary course of business or (2) other nonqualifying income from foreclosure property, we will be required to pay regular U.S. federal corporate income tax on this income. To the extent that income from foreclosure property is otherwise qualifying income for purposes of the 75% gross income test, this tax is not applicable. Subject to certain other requirements, foreclosure property generally is defined as property we acquired through foreclosure or after a default on a loan secured by the property or a lease of the property. |
• | Third, we will be required to pay a 100% tax on any net income from prohibited transactions. Prohibited transactions are, in general, sales or other taxable dispositions of property, other than foreclosure property, held as inventory or primarily for sale to customers in the ordinary course of business. |
• | Fourth, if we fail to satisfy the 75% gross income test or the 95% gross income test, as described below, but have otherwise maintained our qualification as a REIT because certain other requirements are met, we will be required to pay a tax equal to (1) the greater of (A) the amount by which we fail to satisfy the 75% gross income test and (B) the amount by which we fail to satisfy the 95% gross income test, multiplied by (2) a fraction intended to reflect our profitability. |
• | Fifth, if we fail to satisfy any of the asset tests (other than a de minimis failure of the 5% or 10% asset tests), as described below, due to reasonable cause and not due to willful neglect, and we nonetheless |
345
Table of Contents
maintain our REIT qualification because of specified cure provisions, we will be required to pay a tax equal to the greater of $50,000 or the U.S. federal corporate income tax rate multiplied by the net income generated by the nonqualifying assets that caused us to fail such test. |
• | Sixth, if we fail to satisfy any provision of the Code that would result in our failure to qualify as a REIT (other than a violation of the gross income tests or certain violations of the asset tests, as described below) and the violation is due to reasonable cause and not due to willful neglect, we may retain our REIT qualification but we will be required to pay a penalty of $50,000 for each such failure. |
• | Seventh, we will be required to pay a 4% excise tax to the extent we fail to distribute during each calendar year at least the sum of (1) 85% of our ordinary income for the year, (2) 95% of our capital gain net income for the year, and (3) any undistributed taxable income from prior periods. |
• | Eighth, if we acquire any asset from a corporation that is or has been a C corporation in a transaction in which our tax basis in the asset is less than the fair market value of the asset, in each case determined as of the date on which we acquired the asset, and we subsequently recognize gain on the disposition of the asset during the five-year period beginning on the date on which we acquired the asset, then we generally will be required to pay regular U.S. federal corporate income tax on this gain to the extent of the excess of (1) the fair market value of the asset over (2) our adjusted tax basis in the asset, in each case determined as of the date on which we acquired the asset (the so-called sting tax). The results described in the foregoing portion of this paragraph with respect to the recognition of gain assume that the C corporation will refrain from making an election to receive different treatment under applicable Treasury Regulations on its tax return for the year in which we acquire the asset from the C corporation. Treasury Regulations also apply the rules described above to property transferred to us by a partnership, such as BGLH, that directly or indirectly has partners that are C corporations. Under these rules, any gain that would have been allocated directly or indirectly by the transferor partnership to a C corporation partner, if the property had been sold at fair market value on the date of the contribution of the property to us, would be subject to the sting tax. Under applicable Treasury Regulations, any gain from the sale of property we acquired in an exchange under Section 1031 (a like-kind exchange) or Section 1033 (an involuntary conversion) of the Code generally is excluded from the application of this sting tax. |
• | Ninth, our subsidiaries that are C corporations and are not qualified REIT subsidiaries, including our TRS entities described below, generally will be required to pay regular U.S. federal corporate income tax on their earnings. |
• | Tenth, we will be required to pay a 100% tax on any “redetermined rents,” “redetermined deductions,” “excess interest” or “redetermined TRS service income,” as described below under “—Penalty Tax.” In general, redetermined rents are rents from real property that are overstated as a result of services furnished to any of our tenants by a TRS of ours. Redetermined deductions and excess interest generally represent amounts that are deducted by a TRS of ours for amounts paid to us that are in excess of the amounts that would have been deducted based on arm’s length negotiations. Redetermined TRS service income generally represents income of a TRS that is understated as a result of services provided to us or on our behalf. |
• | Eleventh, we may elect to retain and pay income tax on our net capital gain. In that case, a stockholder would include its proportionate share of our undistributed capital gain (to the extent we make a timely designation of such gain to the stockholder) in its income, would be deemed to have paid the tax that we paid on such gain, and would be allowed a credit for its proportionate share of the tax deemed to have been paid, and an adjustment would be made to increase the tax basis of the stockholder in our common stock. |
• | Twelfth, if we fail to comply with the requirement to send annual letters to our stockholders holding at least a certain percentage of our stock, as determined under applicable Treasury Regulations, requesting information regarding the actual ownership of our stock, and the failure is not due to |
346
Table of Contents
reasonable cause or is due to willful neglect, we will be subject to a $25,000 penalty, or if the failure is intentional, a $50,000 penalty. |
We and our subsidiaries may be subject to a variety of taxes other than U.S. federal income tax, including payroll taxes and state and local income, property and other taxes on our assets and operations.
We may own properties in other countries, which may impose taxes on our operations within their jurisdictions. We seek to structure our activities to minimize our non-U.S. tax liability. However, there can be no assurance that we will be able to eliminate our non-U.S. tax liability or reduce it to a specified level. Furthermore, as a REIT, both we and our stockholders will derive little or no benefit from foreign tax credits arising from those non-U.S. taxes.
Requirements for Qualification as a REIT. The Code defines a REIT as a corporation, trust or association:
(1) | that is managed by one or more trustees or directors; |
(2) | that issues transferable shares or transferable certificates to evidence its beneficial ownership; |
(3) | that would be taxable as a domestic corporation, but for Sections 856 through 860 of the Code; |
(4) | that is not a financial institution or an insurance company within the meaning of certain provisions of the Code; |
(5) | that is beneficially owned by 100 or more persons; |
(6) | not more than 50% in value of the outstanding stock of which is owned, actually or constructively, by five or fewer individuals, including certain specified entities, during the last half of each taxable year; and |
(7) | that meets other tests, described below, regarding the nature of its income and assets and the amount of its distributions. |
The Code provides that conditions (1) to (4), inclusive, must be met during the entire taxable year and that condition (5) must be met during at least 335 days of a taxable year of 12 months, or during a proportionate part of a taxable year of less than 12 months. Conditions (5) and (6) do not apply until after the first taxable year for which an election is made to be taxed as a REIT. For purposes of condition (6), the term “individual” includes a supplemental unemployment compensation benefit plan, a private foundation or a portion of a trust permanently set aside or used exclusively for charitable purposes, but generally does not include a qualified pension plan or profit sharing trust.
We believe that we have been organized and have operated in a manner that has allowed us, and will continue to allow us, to satisfy conditions (1) through (7), inclusive, during the relevant time periods. In addition, our charter provides for restrictions regarding ownership and transfer of our shares that are intended to assist us in continuing to satisfy the share ownership requirements described in conditions (5) and (6) above. A description of the share ownership and transfer restrictions relating to our common stock is contained in the discussion in this prospectus under the heading “Description of Our Capital Stock—Restrictions on Ownership and Transfer.” These restrictions, however, do not ensure that we have previously satisfied, and may not ensure that we will, in all cases, be able to continue to satisfy, the share ownership requirements described in conditions (5) and (6) above. If we fail to satisfy these share ownership requirements, then except as provided in the next sentence, our status as a REIT will terminate. If, however, we comply with the rules contained in applicable Treasury Regulations that require us to ascertain the actual ownership of our shares and we do not know, or would not have known through the exercise of reasonable diligence, that we failed to meet the requirement described in condition (6) above, we will be treated as having met this requirement. See “—Failure to Qualify.”
In addition, we may not maintain our status as a REIT unless our taxable year is the calendar year. We have and will continue to have a calendar taxable year.
347
Table of Contents
Ownership of Interests in Partnerships, Limited Liability Companies and Qualified REIT Subsidiaries. In the case of a REIT that is a partner in a partnership (for purposes of this discussion, references to “partnership” include a limited liability company treated as a partnership for U.S. federal income tax purposes, and references to “partner” include a member in such a limited liability company), Treasury Regulations provide that the REIT will be deemed to own its proportionate share of the assets of the partnership based on its interest in partnership capital, subject to special rules relating to the 10% asset test described below. Also, the REIT will be deemed to be entitled to its proportionate share of the income of that entity. The assets and gross income of the partnership retain the same character in the hands of the REIT for purposes of Section 856 of the Code, including satisfying the gross income tests and the asset tests. Thus, our pro rata share of the assets and items of income of our operating partnership, including our operating partnership’s share of these items of any partnership or disregarded entity for U.S. federal income tax purposes in which it owns an interest, is treated as our assets and items of income for purposes of applying the requirements described in this discussion, including the gross income and asset tests described below. A brief summary of the rules governing the U.S. federal income taxation of partnerships is set forth below in “—Tax Aspects of Our Operating Partnership and the Subsidiary Partnerships and Limited Liability Companies.”
We have control of our operating partnership and the subsidiary partnerships and intend to operate them in a manner consistent with the requirements for our qualification as a REIT. If we become a limited partner or non-managing member in any partnership and such entity takes or expects to take actions that could jeopardize our status as a REIT or require us to pay tax, we may be forced to dispose of our interest in such entity. In addition, it is possible that a partnership could take an action which could cause us to fail a gross income or asset test, and that we would not become aware of such action in time to dispose of our interest in the partnership or take other corrective action on a timely basis. In such a case, we could fail to qualify as a REIT unless we were entitled to relief, as described below.
We may from time to time own and operate certain properties through wholly-owned subsidiaries that we intend to be treated as “qualified REIT subsidiaries” under the Code. A corporation (or other entity treated as a corporation for U.S. federal income tax purposes) will qualify as our qualified REIT subsidiary if we own 100% of the corporation’s outstanding stock and do not elect with the subsidiary to treat it as a TRS, as described below. A qualified REIT subsidiary is not treated as a separate corporation, and all assets, liabilities and items of income, gain, loss, deduction and credit of a qualified REIT subsidiary are treated as assets, liabilities and items of income, gain, loss, deduction and credit of the parent REIT for all purposes under the Code, including all REIT qualification tests. Thus, in applying the U.S. federal income tax requirements described in this discussion, any qualified REIT subsidiaries we own are ignored, and all assets, liabilities and items of income, gain, loss, deduction and credit of such corporations are treated as our assets, liabilities and items of income, gain, loss, deduction and credit. A qualified REIT subsidiary is not subject to U.S. federal income tax, and our ownership of the stock of a qualified REIT subsidiary will not violate the restrictions on ownership of securities, as described below under “—Asset Tests.”
Ownership of Interests in TRS Entities. We and our operating partnership own interests in companies that have elected, together with us, to be treated as our TRS entities, and we may acquire securities in additional TRS entities in the future. A TRS is a corporation (or other entity treated as a corporation for U.S. federal income tax purposes) other than a REIT in which a REIT directly or indirectly holds stock, and that has made a joint election with such REIT to be treated as a TRS. If a TRS owns more than 35% of the total voting power or value of the outstanding securities of another corporation, such other corporation will also be treated as a TRS. Other than some activities relating to lodging and health care facilities, a TRS may generally engage in any business, including the provision of customary or non-customary services to tenants of its parent REIT. A TRS is subject to U.S. federal income tax as a regular C corporation. A REIT is not treated as holding the assets of a TRS or as receiving any income that the TRS earns. Rather, the stock issued by the TRS is an asset in the hands of the REIT, and the REIT generally recognizes as income the dividends, if any, that it receives from the TRS. A REIT’s ownership of securities of a TRS is not subject to the 5% or 10% asset test described below. See “—Asset Tests.” Taxpayers are subject to a limitation on their ability to deduct net business interest generally
348
Table of Contents
equal to 30% of adjusted taxable income, subject to certain exceptions. See “—Annual Distribution Requirements.” While not certain, this provision may limit the ability of our TRS entities to deduct interest, which could increase their taxable income.
Ownership of Interests in Subsidiary REITs. We may own and may acquire direct or indirect interests in one or more Subsidiary REITs. A Subsidiary REIT is subject to the various REIT qualification requirements and other limitations described herein that are applicable to us. If a Subsidiary REIT were to fail to qualify as a REIT, then (i) that Subsidiary REIT would become subject to U.S. federal income tax and (ii) the Subsidiary REIT’s failure to qualify could have an adverse effect on our ability to comply with the REIT income and asset tests, and thus could impair our ability to qualify as a REIT unless we could avail ourselves of certain relief provisions.
Income Tests. We must satisfy two gross income requirements annually to maintain our qualification as a REIT. First, in each taxable year we must derive directly or indirectly at least 75% of our gross income (excluding gross income from prohibited transactions, certain hedging transactions and certain foreign currency gains) from investments relating to real property or mortgages on real property, including “rents from real property,” dividends from other REITs and, in certain circumstances, interest, or certain types of temporary investments. Second, in each taxable year we must derive at least 95% of our gross income (excluding gross income from prohibited transactions, certain hedging transactions and certain foreign currency gains) from the real property investments described above or dividends, interest and gain from the sale or disposition of stock or securities, or from any combination of the foregoing. For these purposes, the term “interest” generally does not include any amount received or accrued, directly or indirectly, if the determination of all or some of the amount depends in any way on the income or profits of any person. However, an amount received or accrued generally will not be excluded from the term “interest” solely by reason of being based on a fixed percentage or percentages of receipts or sales.
Rents we receive from a tenant will qualify as “rents from real property” for the purpose of satisfying the gross income requirements for a REIT described above only if all of the following conditions are met:
• | The amount of rent is not based in whole or in part on the income or profits of any person. However, an amount we receive or accrue generally will not be excluded from the term “rents from real property” solely because it is based on a fixed percentage or percentages of receipts or sales or if it is based on the net income of a tenant which derives substantially all of its income with respect to such property from subleasing of substantially all of such property, to the extent that the rents paid by the subtenant would qualify as rents from real property if we earned such amounts directly; |
• | Neither we nor an actual or constructive owner of 10% or more of our capital stock actually or constructively owns 10% or more of the interests in the assets or net profits of a non-corporate tenant, or, if the tenant is a corporation, 10% or more of the total combined voting power of all classes of stock entitled to vote or 10% or more of the total value of all classes of stock of the tenant. Rents we receive from such a tenant that is a TRS of ours, however, will not be excluded from the definition of “rents from real property” as a result of this condition if at least 90% of the space at the property to which the rents relate is leased to third parties, and the rents paid by the TRS are substantially comparable to rents paid by our other tenants for comparable space. Whether rents paid by a TRS are substantially comparable to rents paid by other tenants is determined at the time the lease with the TRS is entered into, extended, or modified, if such modification increases the rents due under such lease. Notwithstanding the foregoing, however, if a lease with a “controlled taxable REIT subsidiary” is modified and such modification results in an increase in the rents payable by such TRS, any such increase will not qualify as “rents from real property.” For purposes of this rule, a “controlled taxable REIT subsidiary” is a TRS in which the parent REIT owns stock possessing more than 50% of the voting power or more than 50% of the total value of the outstanding stock of such TRS; |
• | Rent attributable to personal property, leased in connection with a lease of real property, is not greater than 15% of the total rent received under the lease. If this condition is not met, then the portion of the rent attributable to personal property will not qualify as “rents from real property.” To the extent that |
349
Table of Contents
rent attributable to personal property, leased in connection with a lease of real property, exceeds 15% of the total rent received under the lease, we may transfer a portion of such personal property to a TRS; and |
• | We generally may not operate or manage the property or furnish or render services to our tenants, subject to a 1% de minimis exception and except as provided below. We may, however, perform services that are “usually or customarily rendered” in connection with the rental of space for occupancy only and are not otherwise considered “rendered to the occupant” of the property. Examples of these services include the provision of light, heat, or other utilities, trash removal and general maintenance of common areas. In addition, we may employ an independent contractor from whom we derive no revenue to provide customary services to our tenants, or a TRS (which may be wholly or partially owned by us) to provide both customary and non-customary services to our tenants, without causing the rent we receive from those tenants to fail to qualify as “rents from real property.” |
Substantially all of the rental income that we receive and anticipate receiving in the future is derived from providing space to customers in our operating partnership’s temperature-controlled storage facilities and certain customary services such as freezing and handling (which, in some cases, may be provided through an independent contractor or a TRS). Any management, trucking, and logistics operations and non-customary services will be carried out by subsidiaries that have elected or will elect to be treated as TRS entities. We have received a private letter ruling from the IRS substantially to the effect that, if certain conditions are met, (1) amounts we receive for providing space in temperature-controlled warehouses will constitute rents from real property for purposes of the gross income tests and (2) the provision of certain services, including transportation and other supply-chain services to customers, by a TRS will not cause otherwise qualifying amounts received by us from customers for providing space in temperature-controlled warehouses to be nonqualified for purposes of the gross income tests. Our ability to rely on this ruling will depend on the continuing accuracy of the facts and representations made to the IRS in connection with such ruling.
We generally do not intend, and, as the general partner of our operating partnership, we do not intend to permit our operating partnership, to take actions we believe will cause us to fail to satisfy the rental conditions described above or that would prevent us from being able to rely on the private letter ruling received from the IRS. However, we may intentionally fail to satisfy some of these conditions to the extent we determine, based on the advice of our tax counsel, that the failure will not jeopardize our tax status as a REIT. In addition, with respect to the limitation on the rental of personal property, we generally have not obtained appraisals of the real property and personal property leased to tenants. Accordingly, there can be no assurance that the IRS will not disagree with our determinations of value.
From time to time, we may enter into hedging transactions with respect to one or more of our assets or liabilities. Our hedging activities may include entering into interest rate swaps, caps, and floors, options to purchase these items, and futures and forward contracts. Income from a hedging transaction, including gain from the sale or disposition of such a transaction, that is clearly identified as a hedging transaction as specified in the Code will not constitute gross income under, and thus will be exempt from, the 75% and 95% gross income tests. The term “hedging transaction,” as used above, generally means (A) any transaction we enter into in the normal course of our business primarily to manage risk of (1) interest rate changes or fluctuations with respect to borrowings made or to be made by us to acquire or carry real estate assets, or (2) currency fluctuations with respect to an item of qualifying income under the 75% or 95% gross income test or any property which generates such income and (B) new transactions entered into to hedge the income or loss from prior hedging transactions, where the property or indebtedness which was the subject of the prior hedging transaction was extinguished or disposed of. To the extent that we do not properly identify such transactions as hedges or we hedge with other types of financial instruments, the income from those transactions is not likely to be treated as qualifying income for purposes of the gross income tests. We intend to structure any hedging transactions in a manner that does not jeopardize our status as a REIT.
350
Table of Contents
We have investments in several entities located outside the United States and from time to time may invest in additional entities or properties located outside the United States, through a TRS or otherwise. These acquisitions could cause us to incur foreign currency gains or losses. Any foreign currency gains, to the extent attributable to specified items of qualifying income or gain, or specified qualifying assets, however, generally will not constitute gross income for purposes of the 75% and 95% gross income tests, and therefore will be excluded from these tests.
To the extent our TRS entities pay dividends or interest, our allocable share of such dividend or interest income will qualify under the 95%, but not the 75%, gross income test (except that our allocable share of such interest would also qualify under the 75% gross income test to the extent the interest is paid on a loan that is adequately secured by real property). Under rules applicable to our non-U.S. TRS entities, we may be required to include certain earnings from such non-U.S. TRS entities in our gross income (whether or not such earnings are distributed to us) for purposes of the 75% and 95% gross income tests, and our allocable share of such earnings will qualify under the 95%, but not the 75%, gross income test.
We will monitor the amount of the dividend and other income from our TRS entities and will take actions intended to keep this income, and any other nonqualifying income, within the limitations of the gross income tests. Although we expect these actions will be sufficient to prevent a violation of the gross income tests, we cannot guarantee that such actions will in all cases prevent such a violation.
If we fail to satisfy one or both of the 75% or 95% gross income tests for any taxable year, we may nevertheless qualify as a REIT for the year if we are entitled to relief under certain provisions of the Code. We generally may make use of the relief provisions if:
• | following our identification of the failure to meet the 75% or 95% gross income tests for any taxable year, we file a schedule with the IRS setting forth each item of our gross income for purposes of the 75% or 95% gross income tests for such taxable year in accordance with Treasury Regulations to be issued; and |
• | our failure to meet these tests was due to reasonable cause and not due to willful neglect. |
It is not possible, however, to state whether in all circumstances we would be entitled to the benefit of these relief provisions. For example, if we fail to satisfy the gross income tests because nonqualifying income that we intentionally accrue or receive exceeds the limits on nonqualifying income, the IRS could conclude that our failure to satisfy the tests was not due to reasonable cause. If these relief provisions do not apply to a particular set of circumstances, we will not qualify as a REIT. See “—Failure to Qualify” below. As discussed above in “—General,” even if these relief provisions apply, and we retain our status as a REIT, a tax would be imposed with respect to our nonqualifying income. We may not always be able to comply with the gross income tests for REIT qualification despite periodic monitoring of our income.
Prohibited Transaction Income. Any gain that we realize on the sale of property (other than any foreclosure property) held as inventory or otherwise held primarily for sale to customers in the ordinary course of business, including our share of any such gain realized by our operating partnership, either directly or through its subsidiary partnerships, will be treated as income from a prohibited transaction that is subject to a 100% penalty tax, unless certain safe harbor exceptions apply. This prohibited transaction income may also adversely affect our ability to satisfy the gross income tests for qualification as a REIT. Under existing law, whether property is held as inventory or primarily for sale to customers in the ordinary course of a trade or business is a question of fact that depends on all the facts and circumstances surrounding the particular transaction. As the general partner of our operating partnership, we intend to cause our operating partnership to hold its properties for investment with a view to long-term appreciation, to engage in the business of acquiring, developing and owning its properties and to make occasional sales of the properties as are consistent with our investment objectives. We do not intend, and do not intend to permit our operating partnership or its subsidiary partnerships, to enter into any sales that are prohibited transactions. However, the IRS may successfully contend that some or all of the sales made by our
351
Table of Contents
operating partnership or its subsidiary partnerships are prohibited transactions. We would be required to pay the 100% penalty tax on our allocable share of the gains resulting from any such sales. The 100% penalty tax will not apply to gains from the sale of assets that are held through a TRS, but such income will be subject to regular U.S. federal corporate income tax.
Penalty Tax. Any redetermined rents, redetermined deductions, excess interest or redetermined TRS service income we generate will be subject to a 100% penalty tax. In general, redetermined rents are rents from real property that are overstated as a result of any services furnished to any of our tenants by a TRS of ours, redetermined deductions and excess interest represent any amounts that are deducted by a TRS of ours for amounts paid to us that are in excess of the amounts that would have been deducted based on arm’s length negotiations, and redetermined TRS service income is income of a TRS that is understated as a result of services provided to us or on our behalf. Rents we receive will not constitute redetermined rents if they qualify for certain safe harbor provisions contained in the Code.
We do not believe we have been, and do not expect to be, subject to this penalty tax, although any rental or service arrangements we enter into from time to time may not satisfy the safe-harbor provisions referenced above. These determinations are inherently factual, and the IRS has broad discretion to assert that amounts paid between related parties should be reallocated to clearly reflect their respective incomes. If the IRS successfully made such an assertion, we would be required to pay a 100% penalty tax on any overstated rents paid to us, or any excess deductions or understated income of our TRS entities.
Asset Tests. At the close of each calendar quarter of our taxable year, we must also satisfy certain tests relating to the nature and diversification of our assets. First, at least 75% of the value of our total assets must be represented by real estate assets, cash, cash items and U.S. government securities. For purposes of this test, the term “real estate assets” generally means real property (including interests in real property and interests in mortgages on real property or on both real property and, to a limited extent, personal property), shares (or transferable certificates of beneficial interest) in other REITs, any stock or debt instrument attributable to the investment of the proceeds of a stock offering or a public offering of debt with a term of at least five years (but only for the one-year period beginning on the date the REIT receives such proceeds), debt instruments of publicly offered REITs, and personal property leased in connection with a lease of real property for which the rent attributable to personal property is not greater than 15% of the total rent received under the lease.
Second, not more than 25% of the value of our total assets may be represented by securities (including securities of TRS entities), other than those securities includable in the 75% asset test.
Third, of the investments included in the 25% asset class, and except for certain investments in other REITs, our qualified REIT subsidiaries and TRS entities, the value of any one issuer’s securities may not exceed 5% of the value of our total assets, and we may not own more than 10% of the total vote or value of the outstanding securities of any one issuer. Certain types of securities we may own are disregarded as securities solely for purposes of the 10% value test, including, but not limited to, securities satisfying the “straight debt” safe harbor, securities issued by a partnership that itself would satisfy the 75% income test if it were a REIT, any loan to an individual or an estate, any obligation to pay rents from real property and any security issued by a REIT. In addition, solely for purposes of the 10% value test, the determination of our interest in the assets of a partnership in which we own an interest will be based on our proportionate interest in any securities issued by the partnership, excluding for this purpose certain securities described in the Code. From time to time we may own securities (including debt securities) of issuers that do not qualify as a REIT, a qualified REIT subsidiary or a TRS. We intend that our ownership of any such securities will be structured in a manner that allows us to comply with the asset tests described above.
Fourth, not more than 20% of the value of our total assets may be represented by the securities of one or more TRS entities. We indirectly own interests in one or more companies that have elected, together with us, to be treated as our TRS entities, and we may acquire securities in additional TRS entities in the future. So long as
352
Table of Contents
each of these companies qualifies as a TRS of ours, we will not be subject to the 5% asset test, the 10% voting power limitation or the 10% value limitation with respect to our ownership of the securities of such companies. We hold a portion of our business that could adversely impact our status as a REIT, if conducted directly by the REIT, through one or more TRS entities. We believe that the aggregate value of our TRS entities has not exceeded, and in the future will not exceed, 20% of the aggregate value of our gross assets. We generally do not obtain independent appraisals to support these conclusions. In addition, there can be no assurance that the IRS will not disagree with our determinations of value.
Fifth, not more than 25% of the value of our total assets may be represented by debt instruments of publicly offered REITs to the extent those debt instruments would not be real estate assets but for the inclusion of debt instruments of publicly offered REITs in the meaning of real estate assets, as described above (e.g., a debt instrument issued by a publicly offered REIT that is not secured by a mortgage on real property).
The asset tests must be satisfied at the close of each calendar quarter of our taxable year in which we (directly or through any partnership or qualified REIT subsidiary) acquire securities in the applicable issuer, and also at the close of each calendar quarter in which we increase our ownership of securities of such issuer (including as a result of an increase in our interest in any partnership that owns such securities). For example, our indirect ownership of securities of each issuer will increase as a result of our capital contributions to our operating partnership or as limited partners exercise any redemption/exchange rights. Also, after initially meeting the asset tests at the close of any quarter, we will not lose our status as a REIT for failure to satisfy the asset tests at the end of a later quarter solely by reason of changes in asset values. If we fail to satisfy an asset test because we acquire securities or other property during a quarter (including as a result of an increase in our interest in any partnership), we may cure this failure by disposing of sufficient nonqualifying assets within 30 days after the close of that quarter. We believe that we have maintained, and we intend to maintain, adequate records of the value of our assets to ensure compliance with the asset tests. If we fail to cure any noncompliance with the asset tests within the 30-day cure period, we would cease to qualify as a REIT unless we are eligible for certain relief provisions discussed below.
Certain relief provisions may be available to us if we discover a failure to satisfy the asset tests described above after the 30-day cure period. Under these provisions, we will be deemed to have met the 5% and 10% asset tests if the value of our nonqualifying assets (i) does not exceed the lesser of (a) 1% of the total value of our assets at the end of the applicable quarter or (b) $10,000,000, and (ii) we dispose of the nonqualifying assets or otherwise satisfy such tests within (a) six months after the last day of the quarter in which the failure to satisfy the asset tests is discovered or (b) the period of time prescribed by Treasury Regulations to be issued. For violations of any of the asset tests due to reasonable cause and not due to willful neglect and that are, in the case of the 5% and 10% asset tests, in excess of the de minimis exception described above, we may avoid disqualification as a REIT after the 30-day cure period by taking steps including (i) the disposition of sufficient nonqualifying assets, or the taking of other actions, which allow us to meet the asset tests within (a) six months after the last day of the quarter in which the failure to satisfy the asset tests is discovered or (b) the period of time prescribed by Treasury Regulations to be issued, (ii) paying a tax equal to the greater of (a) $50,000 or (b) the U.S. federal corporate income tax rate multiplied by the net income generated by the nonqualifying assets, and (iii) disclosing certain information to the IRS.
Although we believe we have satisfied the asset tests described above and plan to take steps to ensure that we satisfy such tests for any quarter with respect to which retesting is to occur, there can be no assurance that we will always be successful, or will not require a reduction in our operating partnership’s overall interest in an issuer (including in a TRS). If we fail to cure any noncompliance with the asset tests in a timely manner, and the relief provisions described above are not available, we would cease to qualify as a REIT.
Annual Distribution Requirements. To maintain our qualification as a REIT, we are required to distribute dividends, other than capital gain dividends, to our stockholders each year in an amount at least equal to the sum of:
• | 90% of our REIT taxable income; and |
353
Table of Contents
• | 90% of our after-tax net income, if any, from foreclosure property; minus |
• | the excess of the sum of certain items of non-cash income over 5% of our REIT taxable income. |
For these purposes, our REIT taxable income is computed without regard to the dividends paid deduction and our net capital gain. In addition, for purposes of this test, non-cash income generally means income attributable to leveled stepped rents, original issue discount, cancellation of indebtedness, or a like-kind exchange that is later determined to be taxable.
In addition, our REIT taxable income will be reduced by any taxes we are required to pay on any gain we recognize from the disposition of any asset we acquired from a corporation that is or has been a C corporation in a transaction in which our tax basis in the asset is less than the fair market value of the asset, in each case determined as of the date on which we acquired the asset, within the five-year period following our acquisition of such asset, as described above under “—General.”
Except as provided below, a taxpayer’s deduction for net business interest expense will generally be limited to 30% of its taxable income, as adjusted for certain items of income, gain, deduction or loss. Any business interest deduction that is disallowed due to this limitation may be carried forward to future taxable years, subject to special rules applicable to partnerships. If we or any of our subsidiary partnerships (including our operating partnership) are subject to this interest expense limitation, our REIT taxable income for a taxable year may be increased. Taxpayers that conduct certain real estate businesses may elect not to have this interest expense limitation apply to them, provided that they use an alternative depreciation system to depreciate certain property. We believe that we or any of our subsidiary partnerships that are subject to this interest expense limitation will be eligible to make this election. If such election is made, although we or such subsidiary partnership, as applicable, would not be subject to the interest expense limitation described above, depreciation deductions may be reduced and, as a result, our REIT taxable income for a taxable year may be increased.
We generally must pay, or be treated as paying, the distributions described above in the taxable year to which they relate. At our election, a distribution will be treated as paid in a taxable year if it is declared before we timely file our tax return for such year and paid on or before the first regular dividend payment after such declaration, provided such payment is made during the 12-month period following the close of such year. These distributions are treated as received by our stockholders in the year in which they are paid. This is so even though these distributions relate to the prior year for purposes of the 90% distribution requirement.
In order to be taken into account for purposes of our distribution requirement, except as provided below, the amount distributed must not be preferential—i.e., every stockholder of the class of stock to which a distribution is made must be treated the same as every other stockholder of that class, and no class of stock may be treated other than according to its dividend rights as a class. This preferential dividend limitation will not apply to distributions made by us, provided we qualify as a “publicly offered REIT.” We believe that, upon completion of this offering of our common stock, we will become, and expect we will continue to be, a publicly offered REIT. However, Subsidiary REITs we may own from time to time may not be publicly offered REITs. To the extent that we do not distribute all of our net capital gain, or distribute at least 90%, but less than 100%, of our REIT taxable income, as adjusted, we will be required to pay regular U.S. federal corporate income tax on the undistributed amount. We believe that we have made, and we intend to continue to make, timely distributions sufficient to satisfy these annual distribution requirements and to minimize our corporate tax obligations. In this regard, the partnership agreement of our operating partnership authorizes us, as the general partner of our operating partnership, to take such steps as may be necessary to cause our operating partnership to distribute to its partners an amount sufficient to permit us to meet these distribution requirements and to minimize our corporate tax obligation.
We expect that our REIT taxable income will be less than our cash flow because of depreciation and other non-cash charges included in computing REIT taxable income. Accordingly, we anticipate that we generally will
354
Table of Contents
have sufficient cash or liquid assets to enable us to satisfy the distribution requirements described above. However, from time to time, we may not have sufficient cash or other liquid assets to meet these distribution requirements due to timing differences between the actual receipt of income and actual payment of deductible expenses, and the inclusion of income and deduction of expenses in determining our taxable income. In addition, we may decide to retain our cash, rather than distribute it, in order to repay debt or for other reasons. If these timing differences occur, we may borrow funds to pay dividends or pay dividends in the form of taxable stock distributions in order to meet the distribution requirements, while preserving our cash.
Under some circumstances, we may be able to rectify an inadvertent failure to meet the 90% distribution requirement for a year by paying “deficiency dividends” to our stockholders in a later year, which may be included in our deduction for dividends paid for the earlier year. In that case, we may be able to avoid being taxed on amounts distributed as deficiency dividends, subject to the 4% excise tax described below. However, we will be required to pay interest to the IRS based upon the amount of any deduction claimed for deficiency dividends. While the payment of a deficiency dividend will apply to a prior year for purposes of our REIT distribution requirements, it will be treated as an additional distribution to our stockholders in the year such dividend is paid. In addition, if a dividend we have paid is treated as a preferential dividend, in lieu of treating the dividend as not counting toward satisfying the 90% distribution requirement, the IRS may provide a remedy to cure such failure if the IRS determines that such failure is (or is of a type that is) inadvertent or due to reasonable cause and not due to willful neglect.
Furthermore, we will be required to pay a 4% excise tax to the extent we fail to distribute during each calendar year at least the sum of 85% of our ordinary income for such year, 95% of our capital gain net income for the year and any undistributed taxable income from prior periods. Any ordinary income and net capital gain on which U.S. federal corporate income tax is imposed for any year is treated as an amount distributed during that year for purposes of calculating this excise tax.
For purposes of the 90% distribution requirement and excise tax described above, dividends declared during the last three months of the calendar year, payable to stockholders of record on a specified date during such period and paid during January of the following year, will be treated as paid by us and received by our stockholders on December 31 of the year in which they are declared.
Like-Kind Exchanges. We may dispose of real property that is not held primarily for sale in transactions intended to qualify as like-kind exchanges under the Code. Such like-kind exchanges are intended to result in the deferral of gain for U.S. federal income tax purposes. The failure of any such transaction to qualify as a like-kind exchange could require us to pay U.S. federal income tax, possibly including the 100% prohibited transaction tax, or deficiency dividends, depending on the facts and circumstances surrounding the particular transaction.
Tax Liabilities and Attributes Inherited in Connection with Acquisitions. From time to time, we or our operating partnership may acquire other corporations or entities and, in connection with such acquisitions, we may succeed to the historical tax attributes and liabilities of such entities. For example, if we acquire a C corporation and subsequently dispose of its assets within five years of the acquisition, we could be required to pay the built-in gain tax described above under “—General.” In addition, in order to qualify as a REIT, at the end of any taxable year, we must not have any earnings and profits accumulated in a non-REIT year. As a result, if we acquire a C corporation, we must distribute the corporation’s earnings and profits accumulated prior to the acquisition before the end of the taxable year in which we acquire the corporation. We also could be required to pay the acquired entity’s unpaid taxes even though such liabilities arose prior to the time we acquired the entity.
Moreover, we or one of our subsidiaries may from time to time acquire other REITs through a merger or acquisition. If any such REIT failed to qualify as a REIT for any of its taxable years, such REIT would be liable for (and we or our subsidiary, as applicable, as the surviving corporation in the merger or acquisition, would be obligated to pay) regular U.S. federal corporate income tax on its taxable income for such taxable years. In addition, if such REIT was a C corporation at the time of the merger or acquisition, the tax consequences
355
Table of Contents
described in the preceding paragraph generally would apply. If such REIT failed to qualify as a REIT for any of its taxable years, but qualified as a REIT at the time of such merger or acquisition, and we acquired such REIT’s assets in a transaction in which our tax basis in the assets of such REIT is determined, in whole or in part, by reference to such REIT’s tax basis in such assets, we generally would be subject to tax on the built-in gain on each asset of such REIT as described above if we were to dispose of the asset in a taxable transaction during the five-year period following such REIT’s requalification as a REIT, subject to certain exceptions. Moreover, even if such REIT qualified as a REIT at all relevant times, we would similarly be liable for other unpaid taxes (if any) of such REIT (such as the 100% tax on gains from any sales treated as “prohibited transactions” as described above under “—Prohibited Transaction Income”).
Furthermore, after our acquisition of another corporation or entity, the asset and income tests will apply to all of our assets, including the assets we acquire from such corporation or entity, and to all of our income, including the income derived from the assets we acquire from such corporation or entity. As a result, the nature of the assets that we acquire from such corporation or entity and the income we derive from those assets may have an effect on our tax status as a REIT.
Failure to Qualify. If we discover a violation of a provision of the Code that would result in our failure to qualify as a REIT, certain specified cure provisions may be available to us. Except with respect to violations of the gross income tests and asset tests (for which the cure provisions are described above), and provided the violation is due to reasonable cause and not due to willful neglect, these cure provisions generally impose a $50,000 penalty for each violation in lieu of a loss of REIT status. If we fail to satisfy the requirements for taxation as a REIT in any taxable year, and the relief provisions do not apply, we will be required to pay regular U.S. federal corporate income tax, including any applicable alternative minimum tax, on our taxable income. Distributions to stockholders in any year in which we fail to qualify as a REIT will not be deductible by us. As a result, we anticipate that our failure to qualify as a REIT would reduce the cash available for distribution by us to our stockholders. In addition, if we fail to qualify as a REIT, we will not be required to distribute any amounts to our stockholders and all distributions to stockholders will be taxable as regular corporate dividends to the extent of our current and accumulated earnings and profits. In such event, corporate stockholders may be eligible for the dividends-received deduction. In addition, non-corporate stockholders, including individuals, may be eligible for the preferential tax rates on qualified dividend income. Non-corporate stockholders, including individuals, generally may deduct up to 20% of dividends from a REIT, other than capital gain dividends and dividends treated as qualified dividend income, for taxable years beginning before January 1, 2026 for purposes of determining their U.S. federal income tax (but not for purposes of the 3.8% Medicare tax), subject to certain holding period requirements and other limitations. If we fail to qualify as a REIT, such stockholders may not claim this deduction with respect to dividends paid by us. Unless entitled to relief under specific statutory provisions, we would also be ineligible to elect to be treated as a REIT for the four taxable years following the year for which we lose our qualification. It is not possible to state whether in all circumstances we would be entitled to this statutory relief.
Tax Aspects of Our Operating Partnership and the Subsidiary Partnerships and Limited Liability Companies
General. All of our investments are held indirectly through our operating partnership. In addition, our operating partnership holds certain of its investments indirectly through subsidiary partnerships and limited liability companies that we believe are and will continue to be treated as partnerships or disregarded entities for U.S. federal income tax purposes. In general, entities that are treated as partnerships or disregarded entities for U.S. federal income tax purposes are “pass-through” entities which are not required to pay U.S. federal income tax. Rather, partners of such partnerships are allocated their shares of the items of income, gain, loss, deduction and credit of the partnership, and are potentially required to pay tax on this income, without regard to whether they receive a distribution from the partnership. We will include in our income our share of these partnership items for purposes of the various gross income tests, the computation of our REIT taxable income, and the REIT distribution requirements. Moreover, for purposes of the asset tests, we will include our pro rata share of assets held by our operating partnership, including its share of the assets of its subsidiary partnerships, based on our capital interests in each such entity. See “—Taxation of Our Company—Ownership of Interests in Partnerships,
356
Table of Contents
Limited Liability Companies and Qualified REIT Subsidiaries.” A disregarded entity is not treated as a separate entity for U.S. federal income tax purposes, and all assets, liabilities and items of income, gain, loss, deduction and credit of a disregarded entity are treated as assets, liabilities and items of income, gain, loss, deduction and credit of its parent that is not a disregarded entity (e.g., our operating partnership) for all purposes under the Code, including all REIT qualification tests.
Entity Classification. Our interests in our operating partnership and the subsidiary partnerships and limited liability companies involve special tax considerations, including the possibility that the IRS might challenge the status of these entities as partnerships or disregarded entities for U.S. federal income tax purposes. For example, an entity that would otherwise be treated as a partnership for U.S. federal income tax purposes may nonetheless be taxable as a corporation if it is a “publicly traded partnership” and certain other requirements are met. A partnership would be treated as a publicly traded partnership if its interests are traded on an established securities market or are readily tradable on a secondary market or a substantial equivalent thereof, within the meaning of applicable Treasury Regulations. We do not anticipate that our operating partnership or any subsidiary partnership will be treated as a publicly traded partnership that is taxable as a corporation. However, if any such entity were treated as a corporation, it would be required to pay an entity-level tax on its income. In this situation, the character of our assets and items of gross income would change and could prevent us from satisfying the REIT asset tests and possibly the REIT income tests. See “—Taxation of Our Company—Asset Tests” and “—Income Tests.” This, in turn, could prevent us from qualifying as a REIT. See “—Taxation of Our Company—Failure to Qualify” for a discussion of the effect of our failure to meet these tests. In addition, a change in the tax status of our operating partnership or a subsidiary treated as a partnership or disregarded entity to a corporation might be treated as a taxable event. If so, we might incur a tax liability without any related cash payment. We believe our operating partnership and each of the subsidiary partnerships and limited liability companies are and will continue to be treated as partnerships or disregarded entities for U.S. federal income tax purposes.
Allocations of Items of Income, Gain, Loss and Deduction. A partnership agreement (or, in the case of a limited liability company treated as a partnership for U.S. federal income tax purposes, the limited liability company agreement) generally will determine the allocation of income and loss among partners. These allocations, however, will be disregarded for tax purposes if they do not comply with the provisions of Section 704(b) of the Code and the Treasury Regulations thereunder. Generally, Section 704(b) of the Code and the Treasury Regulations thereunder require that partnership allocations respect the economic arrangement of the partners. If an allocation of partnership income or loss does not comply with the requirements of Section 704(b) of the Code and the Treasury Regulations thereunder, the item subject to the allocation will be reallocated in accordance with the partners’ interests in the partnership. This reallocation will be determined by taking into account all of the facts and circumstances relating to the economic arrangement of the partners with respect to such item. The allocations of taxable income and loss of our operating partnership and any subsidiaries that are treated as partnerships for U.S. federal income tax purposes are intended to comply with the requirements of Section 704(b) of the Code and the Treasury Regulations thereunder.
Tax Allocations With Respect to the Properties. Under Section 704(c) of the Code, items of income, gain, loss and deduction attributable to appreciated or depreciated property that is contributed to a partnership in exchange for an interest in the partnership must be allocated in a manner so that the contributing partner is charged with the unrealized gain or benefits from the unrealized loss associated with the property at the time of the contribution. The amount of the unrealized gain or unrealized loss generally is equal to the difference between the fair market value or book value and the adjusted tax basis of the contributed property at the time of contribution (this difference is referred to as a book-tax difference), as adjusted from time to time. These allocations are solely for U.S. federal income tax purposes and do not affect the book capital accounts or other economic or legal arrangements among the partners.
Our operating partnership may, from time to time, acquire interests in property in exchange for interests in our operating partnership. In that case, the tax basis of these property interests generally will carry over to our
357
Table of Contents
operating partnership, notwithstanding their different book (i.e., fair market) value. The partnership agreement requires that income and loss allocations with respect to these properties be made in a manner consistent with Section 704(c) of the Code. Treasury Regulations issued under Section 704(c) of the Code provide partnerships with a choice of several methods of accounting for book-tax differences. Depending on the method we choose in connection with any particular contribution, the carryover basis of each of the contributed interests in the properties in the hands of our operating partnership (1) could cause us to be allocated lower amounts of depreciation deductions for tax purposes than would be allocated to us if any of the contributed properties were to have a tax basis equal to its respective fair market value at the time of the contribution and (2) could cause us to be allocated taxable gain in the event of a sale of such contributed interests or properties in excess of the economic or book income allocated to us as a result of such sale, with a corresponding benefit to the other partners in our operating partnership. An allocation described above might cause us to recognize taxable income in excess of cash proceeds in the event of a sale or other disposition of property, which might adversely affect our ability to comply with the REIT distribution requirements. See “—Taxation of Our Company—Requirements for Qualification as a REIT” and “—Annual Distribution Requirements.”
Any property acquired by our operating partnership in a taxable transaction will initially have a tax basis equal to its fair market value, and Section 704(c) of the Code generally will not apply.
Partnership Audit Rules. Under current tax law, subject to certain exceptions, any audit adjustment to items of income, gain, loss, deduction, or credit of a partnership (and any partner’s distributive share thereof) is determined, and taxes, interest, or penalties attributable thereto are assessed and collected, at the partnership level. It is possible that these rules could result in partnerships in which we directly or indirectly invest, including our operating partnership, being required to pay additional taxes, interest and penalties as a result of an audit adjustment, and we, as a direct or indirect partner of these partnerships, could be required to bear the economic burden of those taxes, interest, and penalties even though we, as a REIT, may not otherwise have been required to pay additional corporate-level taxes as a result of the related audit adjustment. Investors are urged to consult their tax advisors with respect to these rules and their potential impact on their investment in our common stock.
Material U.S. Federal Income Tax Consequences to Holders of Our Common Stock
The following discussion is a summary of the material U.S. federal income tax consequences to you of purchasing, owning and disposing of our common stock. This discussion is limited to holders who hold our common stock as a “capital asset” within the meaning of Section 1221 of the Code (generally, property held for investment). This discussion does not address all U.S. federal income tax consequences relevant to a holder’s particular circumstances, including the alternative minimum tax. In addition, except where specifically noted, it does not address consequences relevant to holders subject to special rules, including, without limitation:
• | U.S. expatriates and former citizens or long-term residents of the United States; |
• | U.S. holders (as defined below) whose functional currency is not the U.S. dollar; |
• | persons holding our common stock as part of a hedge, straddle or other risk reduction strategy or as part of a conversion transaction or other integrated investment; |
• | banks, insurance companies, and other financial institutions; |
• | REITs or regulated investment companies; |
• | brokers, dealers or traders in securities; |
• | “controlled foreign corporations,” “passive foreign investment companies,” and corporations that accumulate earnings to avoid U.S. federal income tax; |
• | S corporations, partnerships or other entities or arrangements treated as partnerships for U.S. federal income tax purposes (and investors therein); |
• | tax-exempt organizations or governmental organizations; |
358
Table of Contents
• | persons subject to special tax accounting rules as a result of any item of gross income with respect to our common stock being taken into account in an applicable financial statement; |
• | persons deemed to sell our common stock under the constructive sale provisions of the Code; |
• | tax-qualified retirement plans; and |
• | persons who hold or receive our common stock pursuant to the exercise of any employee stock option or otherwise as compensation. |
THIS DISCUSSION IS FOR INFORMATIONAL PURPOSES ONLY AND IS NOT INTENDED AS TAX ADVICE. INVESTORS SHOULD CONSULT THEIR TAX ADVISORS WITH RESPECT TO THE APPLICATION OF THE U.S. FEDERAL INCOME TAX LAWS TO THEIR PARTICULAR SITUATIONS AS WELL AS ANY TAX CONSEQUENCES OF THE PURCHASE, OWNERSHIP AND DISPOSITION OF OUR COMMON STOCK ARISING UNDER OTHER U.S. FEDERAL TAX LAWS (INCLUDING ESTATE AND GIFT TAX LAWS), UNDER THE LAWS OF ANY STATE, LOCAL OR NON-U.S. TAXING JURISDICTION OR UNDER ANY APPLICABLE TAX TREATY.
For purposes of this discussion, a “U.S. holder” is a beneficial owner of our common stock that, for U.S. federal income tax purposes, is or is treated as:
• | an individual who is a citizen or resident of the United States; |
• | a corporation created or organized under the laws of the United States, any state thereof, or the District of Columbia; |
• | an estate, the income of which is subject to U.S. federal income tax regardless of its source; or |
• | a trust that (1) is subject to the primary supervision of a U.S. court and the control of one or more “United States persons” (within the meaning of Section 7701(a)(30) of the Code) or (2) has a valid election in effect to be treated as a United States person for U.S. federal income tax purposes. |
For purposes of this discussion, a “non-U.S. holder” is any beneficial owner of our common stock that is neither a U.S. holder nor an entity treated as a partnership for U.S. federal income tax purposes.
If an entity treated as a partnership for U.S. federal income tax purposes holds our common stock, the tax treatment of a partner in the partnership will depend on the status of the partner, the activities of the partnership and certain determinations made at the partner level. Accordingly, partnerships holding our common stock and the partners in such partnerships should consult their tax advisors regarding the U.S. federal income tax consequences to them.
Taxation of Taxable U.S. Holders of Our Common Stock
Distributions Generally. Distributions out of our current or accumulated earnings and profits will be treated as dividends and, other than with respect to capital gain dividends and certain amounts which have previously been subject to corporate level tax, as discussed below, will be taxable to our taxable U.S. holders as ordinary income when actually or constructively received. See “—Tax Rates” below. As long as we qualify as a REIT, these distributions will not be eligible for the dividends-received deduction in the case of U.S. holders that are corporations or, except to the extent described in “—Tax Rates” below, the preferential rates on qualified dividend income applicable to non-corporate U.S. holders, including individuals. For purposes of determining whether distributions to holders of our capital stock are out of our current or accumulated earnings and profits, our earnings and profits will be allocated first to our outstanding preferred stock, if any, and then to our outstanding common stock.
To the extent that we make distributions on our common stock in excess of our current and accumulated earnings and profits allocable to such stock, these distributions will be treated first as a tax-free return of capital
359
Table of Contents
to a U.S. holder to the extent of the U.S. holder’s adjusted tax basis in such shares of stock. This treatment will reduce the U.S. holder’s adjusted tax basis in such shares of stock by such amount, but not below zero. Distributions in excess of our current and accumulated earnings and profits and in excess of a U.S. holder’s adjusted tax basis in its shares will be taxable as capital gain. Such gain will be taxable as long-term capital gain if the shares have been held for more than one year. Dividends we declare in October, November, or December of any year and which are payable to a holder of record on a specified date in any of these months will be treated as both paid by us and received by the holder on December 31 of that year, provided we actually pay the dividend on or before January 31 of the following year. U.S. holders may not include in their own income tax returns any of our net operating losses or capital losses.
U.S. holders that receive taxable stock distributions, including distributions partially payable in our common stock and partially payable in cash, would be required to include the full amount of the distribution (i.e., the cash and the stock portion) as a dividend (subject to limited exceptions) to the extent of our current and accumulated earnings and profits for U.S. federal income tax purposes, as described above. The amount of any distribution payable in our common stock generally is equal to the amount of cash that could have been received instead of the common stock. Depending on the circumstances of a U.S. holder, the tax on the distribution may exceed the amount of the distribution received in cash, in which case such U.S. holder would have to pay the tax using cash from other sources. If a U.S. holder sells the common stock it received in connection with a taxable stock distribution in order to pay this tax and the proceeds of such sale are less than the amount required to be included in income with respect to the stock portion of the distribution, such U.S. holder could have a capital loss with respect to the stock sale that could not be used to offset such income. A U.S. holder that receives common stock pursuant to such distribution generally has a tax basis in such common stock equal to the amount of cash that could have been received instead of such common stock as described above, and has a holding period in such common stock that begins on the day immediately following the payment date for the distribution.
Capital Gain Dividends. Dividends that we properly designate as capital gain dividends will generally be taxable to our taxable U.S. holders as a gain from the sale or disposition of a capital asset held for more than one year, to the extent that such gain does not exceed our actual net capital gain for the taxable year, and may not exceed our dividends paid for the taxable year, including dividends paid the following year that are treated as paid in the current year. U.S. holders that are corporations may, however, be required to treat up to 20% of certain capital gain dividends as ordinary income. If we properly designate any portion of a dividend as a capital gain dividend, then, except as otherwise required by law, we presently intend to allocate a portion of the total capital gain dividends paid or made available to holders of all classes of our capital stock for the year to the holders of each class of our capital stock in proportion to the amount that our total dividends, as determined for U.S. federal income tax purposes, paid or made available to the holders of each such class of our capital stock for the year bears to the total dividends, as determined for U.S. federal income tax purposes, paid or made available to holders of all classes of our capital stock for the year. In addition, except as otherwise required by law, we will make a similar allocation with respect to any undistributed long-term capital gains which are to be included in our stockholders’ long-term capital gains, based on the allocation of the capital gain amount which would have resulted if those undistributed long-term capital gains had been distributed as “capital gain dividends” by us to our stockholders.
Retention of Net Capital Gains. We may elect to retain, rather than distribute as a capital gain dividend, all or a portion of our net capital gains. If we make this election, we would pay tax on our retained net capital gains. In addition, to the extent we so elect, our earnings and profits (determined for U.S. federal income tax purposes) would be adjusted accordingly, and a U.S. holder generally would:
• | include its pro rata share of our undistributed capital gain in computing its long-term capital gains in its U.S. federal income tax return for its taxable year in which the last day of our taxable year falls, subject to certain limitations as to the amount that is includable; |
• | be deemed to have paid its share of the capital gains tax imposed on us on the designated amounts included in the U.S. holder’s income as long-term capital gain; |
360
Table of Contents
• | receive a credit or refund for the amount of tax deemed paid by it; |
• | increase the adjusted tax basis of its common stock by the difference between the amount of includable gains and the tax deemed to have been paid by it; and |
• | in the case of a U.S. holder that is a corporation, appropriately adjust its earnings and profits for the retained capital gains in accordance with Treasury Regulations to be promulgated by the IRS. |
Passive Activity Losses and Investment Interest Limitations. Distributions we make and gain arising from the sale or exchange of our common stock by a U.S. holder will not be treated as passive activity income. As a result, U.S. holders generally will not be able to apply any “passive losses” against this income or gain. A U.S. holder generally may elect to treat capital gain dividends, capital gains from the disposition of our common stock and income designated as qualified dividend income, as described in “—Tax Rates” below, as investment income for purposes of computing the investment interest limitation, but in such case, the holder will be taxed at ordinary income rates on such amount. Other distributions made by us, to the extent they do not constitute a return of capital, generally will be treated as investment income for purposes of computing the investment interest limitation.
Dispositions of Our Common Stock. If a U.S. holder sells or disposes of shares of our common stock, it will recognize gain or loss for U.S. federal income tax purposes in an amount equal to the difference between the amount of cash and the fair market value of any property received on the sale or other disposition and the holder’s adjusted tax basis in the shares. This gain or loss, except as provided below, will be long-term capital gain or loss if the holder has held such common stock for more than one year. However, if a U.S. holder recognizes a loss upon the sale or other disposition of common stock that it has held for six months or less, after applying certain holding period rules, the loss recognized will be treated as a long-term capital loss to the extent the U.S. holder received distributions from us which were required to be treated as long-term capital gains. The deductibility of capital losses is subject to limitations.
Tax Rates. The maximum tax rate for non-corporate taxpayers for (1) long-term capital gains, including certain “capital gain dividends,” generally is 20% (although depending on the characteristics of the assets which produced these gains and on designations which we may make, certain capital gain dividends may be taxed at a 25% rate) and (2) “qualified dividend income” generally is 20%. In general, dividends payable by REITs are not eligible for the reduced tax rate on qualified dividend income, except to the extent that certain holding period requirements have been met and the REIT’s dividends are attributable to dividends received from taxable corporations (such as its TRS entities) or to income that was subject to tax at the corporate/REIT level (for example, if the REIT distributed taxable income that it retained and paid tax on in the prior taxable year). Capital gain dividends will only be eligible for the rates described above to the extent that they are properly designated by the REIT as “capital gain dividends.” U.S. holders that are corporations may be required to treat up to 20% of some capital gain dividends as ordinary income. In addition, non-corporate U.S. holders, including individuals, generally may deduct up to 20% of dividends from a REIT, other than capital gain dividends and dividends treated as qualified dividend income, for taxable years beginning before January 1, 2026 for purposes of determining their U.S. federal income tax (but not for purposes of the 3.8% Medicare tax), subject to certain holding period requirements and other limitations.
Taxation of Tax-Exempt Holders of Our Common Stock
Dividend income from us and gain arising upon a sale of shares of our common stock generally should not be unrelated business taxable income, or UBTI, to a tax-exempt holder, except as described below. This income or gain will be UBTI, however, to the extent a tax-exempt holder holds its shares as “debt-financed property” within the meaning of the Code. Generally, “debt-financed property” is property the acquisition or holding of which was financed through a borrowing by the tax-exempt holder.
For tax-exempt holders that are social clubs, voluntary employee benefit associations or supplemental unemployment benefit trusts exempt from U.S. federal income taxation under Sections 501(c)(7), (c)(9) or
361
Table of Contents
(c)(17) of the Code, respectively, income from an investment in our shares will constitute UBTI unless the organization is able to properly claim a deduction for amounts set aside or placed in reserve for specific purposes so as to offset the income generated by its investment in our shares. These prospective investors should consult their tax advisors concerning these “set aside” and reserve requirements.
Notwithstanding the above, however, a portion of the dividends paid by a “pension-held REIT” may be treated as UBTI as to certain trusts that hold more than 10%, by value, of the interests in the REIT. A REIT will not be a “pension-held REIT” if it is able to satisfy the “not closely held” requirement without relying on the “look-through” exception with respect to certain trusts or if such REIT is not “predominantly held” by “qualified trusts.” As a result of restrictions on ownership and transfer of our stock contained in our charter, we do not expect to be classified as a “pension-held REIT,” and as a result, the tax treatment described above should be inapplicable to our holders. However, because our common stock will be publicly traded upon completion of this offering of our common stock (and, we anticipate, will continue to be publicly traded), we cannot guarantee that this will always be the case.
Taxation of Non-U.S. Holders of Our Common Stock
The following discussion addresses the rules governing U.S. federal income taxation of the purchase, ownership and disposition of our common stock by non-U.S. holders. These rules are complex, and no attempt is made herein to provide more than a brief summary of such rules. Accordingly, the discussion does not address all aspects of U.S. federal income taxation and does not address other federal, state, local or non-U.S. tax consequences that may be relevant to a non-U.S. holder in light of its particular circumstances. We urge non-U.S. holders to consult their tax advisors to determine the impact of U.S. federal, state, local and non-U.S. income and other tax laws and any applicable tax treaty on the purchase, ownership and disposition of shares of our common stock, including any reporting requirements.
Distributions Generally. Distributions (including any taxable stock distributions) that are neither attributable to gains from sales or exchanges by us of United States real property interests, or USRPIs, nor designated by us as capital gain dividends (except as described below) will be treated as dividends of ordinary income to the extent that they are made out of our current or accumulated earnings and profits. Such distributions ordinarily will be subject to withholding of U.S. federal income tax at a 30% rate or such lower rate as may be specified by an applicable income tax treaty, unless the distributions are treated as effectively connected with the conduct by the non-U.S. holder of a trade or business within the United States (and, if required by an applicable income tax treaty, the non-U.S. holder maintains a permanent establishment in the United States to which such dividends are attributable). Under certain treaties, however, lower withholding rates generally applicable to dividends do not apply to dividends from a REIT. Certain certification and disclosure requirements must be satisfied for a non-U.S. holder to be exempt from withholding under the effectively connected income exemption. Dividends that are treated as effectively connected with a U.S. trade or business generally will not be subject to withholding but will be subject to U.S. federal income tax on a net basis at the regular rates, in the same manner as dividends paid to U.S. holders are subject to U.S. federal income tax. Any such dividends received by a non-U.S. holder that is a corporation may also be subject to an additional branch profits tax at a 30% rate (applicable after deducting U.S. federal income taxes paid on such effectively connected income) or such lower rate as may be specified by an applicable income tax treaty.
Except as otherwise provided below, we expect to withhold U.S. federal income tax at the rate of 30% on any distributions made to a non-U.S. holder unless:
(1) | a lower treaty rate applies and the non-U.S. holder furnishes an IRS Form W-8BEN or W-8BEN-E (or other applicable documentation) evidencing eligibility for that reduced treaty rate; or |
(2) | the non-U.S. holder furnishes an IRS Form W-8ECI (or other applicable documentation) claiming that the distribution is income effectively connected with the non-U.S. holder’s trade or business. |
362
Table of Contents
Distributions in excess of our current and accumulated earnings and profits will not be taxable to a non-U.S. holder to the extent that such distributions do not exceed the adjusted tax basis of the holder’s common stock, but rather will reduce the adjusted tax basis of such stock. To the extent that such distributions exceed the non-U.S. holder’s adjusted tax basis in such common stock, they generally will give rise to gain from the sale or exchange of such stock, the tax treatment of which is described below. However, such excess distributions may be treated as dividend income for certain non-U.S. holders that are “qualified shareholders” (as defined below). For withholding purposes, we expect to treat all distributions as made out of our current or accumulated earnings and profits. However, amounts withheld may be refundable if it is subsequently determined that the distribution was, in fact, in excess of our current and accumulated earnings and profits, provided that certain conditions are met.
Capital Gain Dividends and Distributions Attributable to a Sale or Exchange of United States Real Property Interests. Distributions to a non-U.S. holder that we properly designate as capital gain dividends, other than those arising from the disposition of a USRPI, generally should not be subject to U.S. federal income taxation, unless:
(1) | the investment in our common stock is treated as effectively connected with the conduct by the non-U.S. holder of a trade or business within the United States (and, if required by an applicable income tax treaty, the non-U.S. holder maintains a permanent establishment in the United States to which such dividends are attributable), in which case the non-U.S. holder will be subject to the same treatment as U.S. holders with respect to such gain, except that a non-U.S. holder that is a corporation may also be subject to a branch profits tax of up to 30%, as discussed above; or |
(2) | the non-U.S. holder is a nonresident alien individual who is present in the United States for 183 days or more during the taxable year and certain other conditions are met, in which case the non-U.S. holder will be subject to U.S. federal income tax at a rate of 30% on the non-U.S. holder’s capital gains (or such lower rate specified by an applicable income tax treaty), which may be offset by U.S. source capital losses of such non-U.S. holder (even though the individual is not considered a resident of the United States), provided the non-U.S. holder has timely filed U.S. federal income tax returns with respect to such losses. |
Pursuant to the Foreign Investment in Real Property Tax Act, which is referred to as “FIRPTA,” distributions to a non-U.S. holder that are attributable to gain from sales or exchanges by us of USRPIs, whether or not designated as capital gain dividends, will cause the non-U.S. holder to be treated as recognizing such gain as income effectively connected with a U.S. trade or business. Non-U.S. holders generally would be taxed at the regular rates applicable to U.S. holders, subject to any applicable alternative minimum tax and a special alternative minimum tax in the case of nonresident alien individuals. We also will be required to withhold and to remit to the IRS 21% of any distribution to non-U.S. holders attributable to gain from sales or exchanges by us of USRPIs. Distributions subject to FIRPTA may also be subject to a 30% branch profits tax in the hands of a non-U.S. holder that is a corporation. The amount withheld is creditable against the non-U.S. holder’s U.S. federal income tax liability. However, any distribution with respect to any class of stock that is “regularly traded,” as defined by applicable Treasury Regulations, on an established securities market located in the United States is not subject to FIRPTA, and therefore, not subject to the 21% U.S. withholding tax described above, if the non-U.S. holder did not own more than 10% of such class of stock at any time during the one-year period ending on the date of the distribution. Instead, such distributions generally will be treated as ordinary dividend distributions and subject to withholding in the manner described above with respect to ordinary dividends. In addition, distributions to certain non-U.S. publicly traded shareholders that meet certain record-keeping and other requirements (“qualified shareholders”) are exempt from FIRPTA, except to the extent owners of such qualified shareholders that are not also qualified shareholders own, actually or constructively, more than 10% of our capital stock. Furthermore, distributions to certain “qualified foreign pension funds” or entities all of the interests of which are held by such “qualified foreign pension funds” are exempt from FIRPTA. Non-U.S. holders should consult their tax advisors regarding the application of these rules.
Retention of Net Capital Gains. Although the law is not clear on the matter, it appears that amounts we designate as retained net capital gains in respect of our common stock should be treated with respect to non-U.S.
363
Table of Contents
holders as actual distributions of capital gain dividends. Under this approach, the non-U.S. holders may be able to offset as a credit against their U.S. federal income tax liability their proportionate share of the tax paid by us on such retained net capital gains and to receive from the IRS a refund to the extent their proportionate share of such tax paid by us exceeds their actual U.S. federal income tax liability. If we were to designate any portion of our net capital gain as retained net capital gain, non-U.S. holders should consult their tax advisors regarding the taxation of such retained net capital gain.
Sale of Our Common Stock. Gain realized by a non-U.S. holder upon the sale, exchange or other taxable disposition of our common stock generally will not be subject to U.S. federal income tax unless such stock constitutes a USRPI. In general, stock of a domestic corporation that constitutes a “United States real property holding corporation,” or USRPHC, will constitute a USRPI. We believe that we are a USRPHC. Our common stock will not, however, constitute a USRPI so long as we are a “domestically controlled qualified investment entity.” A “domestically controlled qualified investment entity” includes a REIT in which at all times during a five-year testing period less than 50% in value of its stock is held directly or indirectly by non-United States persons, subject to certain ownership rules. For purposes of determining whether a REIT is a “domestically controlled qualified investment entity,” ownership by non-United States persons generally will be determined by looking through certain pass-through entities and U.S. corporations, including non-public REITs and certain non-public foreign-controlled domestic C corporations, and treating a public qualified investment entity as a non-United States person unless such entity is a “domestically controlled qualified investment entity.” Notwithstanding the foregoing ownership rules, a person who at all applicable times holds less than 5% of a class of a REIT’s stock that is “regularly traded” on an established securities market in the United States is treated as a United States person unless the REIT has actual knowledge that such person is not a United States person or is a foreign-controlled person. We believe, but cannot guarantee, that we are a “domestically controlled qualified investment entity.” Although we believe based on representations from our investors that we are a domestically controlled qualified investment entity, and our charter includes restrictions on ownership and transfer of our stock for the three-year period following our initial public offering that are intended to preserve our status as a domestically controlled qualified investment entity, such restrictions may not prevent all transfers or other events that could result in our failing to qualify as a domestically controlled qualified investment entity, and there can be no assurance that we are, or will continue to be, a domestically controlled qualified investment entity.
Even if we do not qualify as a “domestically controlled qualified investment entity” at the time a non-U.S. holder sells our common stock, gain realized from the sale or other taxable disposition by a non-U.S. holder of such common stock would not be subject to U.S. federal income tax under FIRPTA as a sale of a USRPI if:
(1) | our common stock is “regularly traded,” as defined by applicable Treasury Regulations, on an established securities market such as Nasdaq; and |
(2) | such non-U.S. holder owned, actually and constructively, 10% or less of our common stock throughout the shorter of the five-year period ending on the date of the sale or other taxable disposition or the non-U.S. holder’s holding period. |
In addition, dispositions of our common stock by qualified shareholders are exempt from FIRPTA, except to the extent owners of such qualified shareholders that are not also qualified shareholders own, actually or constructively, more than 10% of our capital stock. Furthermore, dispositions of our common stock by certain “qualified foreign pension funds” or entities all of the interests of which are held by such “qualified foreign pension funds” are exempt from FIRPTA. Non-U.S. holders should consult their tax advisors regarding the application of these rules.
Notwithstanding the foregoing, gain from the sale, exchange or other taxable disposition of our common stock not otherwise subject to FIRPTA will be taxable to a non-U.S. holder if either (a) the investment in our common stock is treated as effectively connected with the conduct by the non-U.S. holder of a trade or business within the United States (and, if required by an applicable income tax treaty, the non-U.S. holder maintains a permanent establishment in the United States to which such gain is attributable), in which case the non-U.S.
364
Table of Contents
holder will be subject to the same treatment as U.S. holders with respect to such gain, except that a non-U.S. holder that is a corporation may also be subject to the 30% branch profits tax (or such lower rate as may be specified by an applicable income tax treaty) on such gain, as adjusted for certain items, or (b) the non-U.S. holder is a nonresident alien individual who is present in the United States for 183 days or more during the taxable year and certain other conditions are met, in which case the non-U.S. holder will be subject to a 30% tax on the non-U.S. holder’s capital gains (or such lower rate specified by an applicable income tax treaty), which may be offset by U.S. source capital losses of the non-U.S. holder (even though the individual is not considered a resident of the United States), provided the non-U.S. holder has timely filed U.S. federal income tax returns with respect to such losses. In addition, even if we are a domestically controlled qualified investment entity, upon disposition of our common stock, a non-U.S. holder may be treated as having gain from the sale or other taxable disposition of a USRPI if the non-U.S. holder (1) disposes of such stock within a 30-day period preceding the ex-dividend date of a distribution, any portion of which, but for the disposition, would have been treated as gain from the sale or exchange of a USRPI and (2) acquires, or enters into a contract or option to acquire, or is deemed to acquire, other shares of that stock during the 61-day period beginning with the first day of the 30-day period described in clause (1), unless our common stock is “regularly traded” and the non-U.S. holder did not own more than 10% of our common stock at any time during the one-year period ending on the date of the distribution described in clause (1).
If gain on the sale, exchange or other taxable disposition of our common stock were subject to taxation under FIRPTA, the non-U.S. holder would be required to file a U.S. federal income tax return and would be subject to regular U.S. federal income tax with respect to such gain in the same manner as a taxable U.S. holder (subject to any applicable alternative minimum tax and a special alternative minimum tax in the case of nonresident alien individuals). In addition, if the sale, exchange or other taxable disposition of our common stock were subject to taxation under FIRPTA, and if shares of our common stock were not “regularly traded” on an established securities market, the purchaser of such common stock generally would be required to withhold and remit to the IRS 15% of the purchase price.
Information Reporting and Backup Withholding
U.S. Holders. A U.S. holder may be subject to information reporting and backup withholding when such holder receives payments on our common stock or proceeds from the sale or other taxable disposition of such stock. Certain U.S. holders are exempt from backup withholding, including corporations and certain tax-exempt organizations. A U.S. holder will be subject to backup withholding if such holder is not otherwise exempt and:
• | the holder fails to furnish the holder’s taxpayer identification number, which for an individual is ordinarily his or her social security number; |
• | the holder furnishes an incorrect taxpayer identification number; |
• | the applicable withholding agent is notified by the IRS that the holder previously failed to properly report payments of interest or dividends; or |
• | the holder fails to certify under penalties of perjury that the holder has furnished a correct taxpayer identification number and that the IRS has not notified the holder that the holder is subject to backup withholding. |
Backup withholding is not an additional tax. Any amounts withheld under the backup withholding rules may be allowed as a refund or a credit against a U.S. holder’s U.S. federal income tax liability, provided the required information is timely furnished to the IRS. U.S. holders should consult their tax advisors regarding their qualification for an exemption from backup withholding and the procedures for obtaining such an exemption.
Non-U.S. Holders. Payments of dividends on our common stock generally will not be subject to backup withholding, provided the applicable withholding agent does not have actual knowledge or reason to know the holder is a United States person and the holder either certifies its non-U.S. status, such as by furnishing a valid
365
Table of Contents
IRS Form W-8BEN, W-8BEN-E or W-8ECI, or otherwise establishes an exemption. However, information returns are required to be filed with the IRS in connection with any distributions on our common stock paid to the non-U.S. holder, regardless of whether such distributions constitute a dividend or whether any tax was actually withheld. In addition, proceeds of the sale or other taxable disposition of such stock within the United States or conducted through certain U.S.-related brokers generally will not be subject to backup withholding or information reporting if the applicable withholding agent receives the certification described above and does not have actual knowledge or reason to know that such holder is a United States person, or the holder otherwise establishes an exemption. Proceeds of a disposition of such stock conducted through a non-U.S. office of a non-U.S. broker generally will not be subject to backup withholding or information reporting.
Copies of information returns that are filed with the IRS may also be made available under the provisions of an applicable treaty or agreement to the tax authorities of the country in which the non-U.S. holder resides or is established.
Backup withholding is not an additional tax. Any amounts withheld under the backup withholding rules may be allowed as a refund or a credit against a non-U.S. holder’s U.S. federal income tax liability, provided the required information is timely furnished to the IRS.
Medicare Contribution Tax on Unearned Income
Certain U.S. holders that are individuals, estates or trusts are required to pay an additional 3.8% tax on, among other things, dividends on stock and capital gains from the sale or other disposition of stock, subject to certain limitations. U.S. holders should consult their tax advisors regarding the effect, if any, of these rules on their ownership and disposition of our common stock.
Additional Withholding Tax on Payments Made to Foreign Accounts
Withholding taxes may be imposed under Sections 1471 to 1474 of the Code (such sections commonly referred to as the Foreign Account Tax Compliance Act, or FATCA) on certain types of payments made to non-U.S. financial institutions and certain other non-U.S. entities. Specifically, a 30% withholding tax may be imposed on dividends on our common stock or (subject to the proposed Treasury Regulations discussed below) gross proceeds from the sale or other disposition of our common stock, in each case paid to a “foreign financial institution” or a “non-financial foreign entity” (each as defined in the Code), unless (1) the foreign financial institution undertakes certain diligence and reporting obligations, (2) the non-financial foreign entity either certifies it does not have any “substantial United States owners” (as defined in the Code) or furnishes identifying information regarding each substantial United States owner, or (3) the foreign financial institution or non-financial foreign entity otherwise qualifies for an exemption from these rules. If the payee is a foreign financial institution and is subject to the diligence and reporting requirements in clause (1) above, it must enter into an agreement with the U.S. Department of the Treasury requiring, among other things, that it undertake to identify accounts held by certain “specified United States persons” or “United States owned foreign entities” (each as defined in the Code), annually report certain information about such accounts, and withhold 30% on certain payments to non-compliant foreign financial institutions and certain other account holders. Foreign financial institutions located in jurisdictions that have an intergovernmental agreement with the United States governing FATCA may be subject to different rules.
Under the applicable Treasury Regulations and administrative guidance, withholding under FATCA generally applies to payments of dividends on our common stock. While withholding under FATCA would have applied also to payments of gross proceeds from the sale or other disposition of stock on or after January 1, 2019, proposed Treasury Regulations eliminate FATCA withholding on payments of gross proceeds entirely. Taxpayers generally may rely on these proposed Treasury Regulations until final Treasury Regulations are issued. Because we may not know the extent to which a distribution is a dividend for U.S. federal income tax purposes at the time it is made, for purposes of these withholding rules we may treat the entire distribution as a dividend.
366
Table of Contents
Prospective investors should consult their tax advisors regarding the potential application of withholding under FATCA to their investment in our common stock.
Other Tax Consequences
State, local and non-U.S. income tax laws may differ substantially from the corresponding U.S. federal income tax laws, and this discussion does not purport to describe any aspect of the tax laws of any state, local or non-U.S. jurisdiction, or any U.S. federal tax other than income tax. You should consult your tax advisors regarding the effect of state, local and non-U.S. tax laws with respect to our tax treatment as a REIT and on an investment in our common stock.
367
Table of Contents
The Employee Retirement Income Security Act of 1974, as amended, or ERISA, and the Code impose certain restrictions on (a) employee benefit plans (as defined in Section 3(3) of ERISA), (b) plans described in Section 4975(e)(1) of the Code, including individual retirement accounts and annuities, (c) any entities whose underlying assets include plan assets by reason of a plan’s investment in such entities (each an “ERISA Plan”) and persons who have certain specified relationships to such ERISA Plans (“Parties-in-Interest” under ERISA and “Disqualified Persons” under the Code). Moreover, based on the reasoning of the United States Supreme Court in John Hancock Life Ins. Co. v. Harris Trust and Sav. Bank, 510 U.S. 86 (1993), an insurance company’s general account may be deemed to include assets of the ERISA Plans investing in the general account (e.g., through the purchase of an annuity contract), and the insurance company might be treated as a Party-in-Interest with respect to a Plan by virtue of such investment. In addition, federal, state, local, church and non-U.S. plans may be subject to provisions under federal, state, local or non-U.S. laws or regulations that are similar to such provisions of the Code or ERISA, or collectively, Similar Laws. ERISA also imposes certain duties on persons who are fiduciaries of ERISA Plans subject to ERISA, and ERISA and the Code prohibit certain transactions between ERISA Plans and Parties-in-Interest or Disqualified Persons, respectively, with respect to such ERISA Plans, absent an exemption. Under ERISA and the Code, any person who exercises any discretionary authority or control over the administration of an ERISA Plan or the management or disposition of the assets of an ERISA Plan, or who renders investment advice for a fee or other compensation to an ERISA Plan, is generally considered to be a fiduciary of the ERISA Plan.
In considering an investment in our common stock by an ERISA Plan or when using the assets of an ERISA plan, a fiduciary should determine whether the investment is in accordance with the documents and instruments governing the plan and the applicable provisions of ERISA, the Code or any Similar Laws relating to a fiduciary’s duties to the plan including, without limitation, the prudence, diversification, delegation of control and prohibited transaction provisions of ERISA, the Code and any other applicable Similar Laws.
Section 406 of ERISA and Section 4975 of the Code prohibit ERISA Plans from engaging in specified transactions involving plan assets with Parties-In-Interest or Disqualified Persons unless an exemption is available and its conditions are met. A Party-in-Interest or Disqualified Person who engages in a non-exempt prohibited transaction may be subject to excise taxes under the Code and other penalties and liabilities under ERISA and may result in the loss of tax-exempt status of an Individual Retirement Account involved in the transaction. In addition, the fiduciary of an ERISA Plan that engages in such a non-exempt prohibited transaction may be subject to personal liabilities under ERISA.
The United States Department of Labor, or the DOL, has issued a regulation (29 C.F.R. § 2510.3-101, as modified by Section 3(42) of ERISA) defining what constitutes the assets of an ERISA Plan in the context of its investments (the “Plan Assets Regulation”). The Plan Assets Regulation provide that, as a general rule, the underlying assets and properties of corporations, partnerships, trusts and certain other entities in which an ERISA Plan purchases an “equity interest” will be deemed for purposes of ERISA to be assets of the investing ERISA Plan unless an exception applies. The Plan Assets Regulation define an “equity interest” as any interest in an entity other than an instrument that is treated as indebtedness under applicable local law and which has no substantial equity features. Our common stock included in this offering should be treated as “equity interests” for purposes of the Plan Assets Regulation.
The Plan Assets Regulation provide exceptions to the look-through rule for equity interests in some types of entities, including any entity which qualifies as either a “real estate operating company” or a “venture capital operating company.” Under the Plan Assets Regulation, a “real estate operating company” is defined generally, as an entity: (i) which on testing dates has at least 50% of its assets, other than short-term investments pending long-term commitment or distribution to investors, valued at cost; (ii) invested in real estate which is managed or developed and with respect to which the entity has the right to substantially participate directly in the management or development activities; and (iii) which, in the ordinary course of its business, is engaged directly in real estate management or development activities.
368
Table of Contents
Under the Plan Assets Regulation, a “venture capital operating company” is defined, generally, as an entity that on testing dates has at least 50% of its assets, other than short-term investments pending long-term commitment or distribution to investors, valued at cost, invested in one or more operating companies with respect to which the entity has management rights, and that, in the ordinary course of its business, actually exercises its management rights with respect to one or more of the operating companies in which it invests.
Another exception under the Plan Assets Regulation applies to “publicly offered securities,” which are defined as securities that are: (i) freely transferable; (ii) part of a class of securities that is widely held; and (iii) either part of a class of securities that is registered under Section 12(b) or 12(g) of the Exchange Act, or sold to an ERISA Plan as part of an offering of securities to the public pursuant to an effective registration statement under the Securities Act, and the class of securities of which this security is a part is registered under the Exchange Act within 120 days, or longer if allowed by the SEC, after the end of the fiscal year of the issuer during which this offering of these securities to the public occurred.
Whether a security is considered “freely transferable” depends on the facts and circumstances of each case. Under the Plan Assets Regulation, if the security is part of an offering in which the minimum investment is $10,000 or less, then any restriction on or prohibition against any transfer or assignment of the security for the purposes of preventing a termination or reclassification of the entity for federal or state tax purposes or which would violate any state or federal statute, regulation, court order, judicial decree, or rule of law will not ordinarily prevent the security from being considered freely transferable. Additionally, limitations or restrictions on the transfer or assignment of a security that are created or imposed by persons other than the issuer of the security or persons acting for or on behalf of the issuer will ordinarily not prevent the security from being considered freely transferable.
A class of securities is considered “widely held” if it is a class of securities that is owned by 100 or more investors independent of the issuer and of one another. A security will not fail to be “widely held” because the number of independent investors falls below 100 subsequent to the initial public offering as a result of events beyond the issuer’s control.
We expect that our common stock will meet the criteria of the publicly offered securities exception to the look-through rule. First, our common stock should be considered to be freely transferable, as the minimum investment will be less than $10,000 and the only restrictions upon transfer of our common stock are those generally permitted under the Plan Assets Regulation, those required under federal tax laws to maintain our status as a REIT, resale restrictions under applicable federal securities laws with respect to securities not purchased pursuant to a registered public offering and those owned by officers, directors and other affiliates, and voluntary restrictions to which a selling shareholder has agreed regarding volume limitations.
Second, we expect (although we cannot confirm) that our common stock will be held by 100 or more investors and that at least 100 or more of these investors will be independent of us and of one another.
Third, our common stock included in this offering will be part of an offering of securities to the public pursuant to an effective registration statement under the Securities Act, and our common stock will be registered under the Exchange Act.
If, however, none of the exceptions under the Plan Assets Regulation were applicable to us and we were deemed to hold plan assets subject to ERISA or Section 4975 of the Code, such plan assets would include an undivided interest in the assets held by us. In such event, such assets and the persons providing services with respect to such assets would be subject to the fiduciary responsibility provisions of Title I of ERISA and the prohibited transaction provisions of ERISA and Section 4975 of the Code.
In addition, if our assets were treated as plan assets: (i) the prudence and other fiduciary responsibility standards of ERISA would apply to certain investments made by us, and (ii) certain of our activities could be
369
Table of Contents
deemed to constitute a transaction prohibited under Title I of ERISA or Section 4975 of the Code (e.g., the extension of credit between an ERISA Plan and a Party in Interest or Disqualified Person). Such transactions may, however, be subject to a statutory or administrative exemptions, such as Prohibited Transaction Class Exemption, or PTCE 84-14, as amended, which exempts certain transactions effected on behalf of an ERISA Plan by a “qualified professional asset manager”.
Whether or not our underlying assets are deemed to include “plan assets” as described above, the acquisition and/or holding of our common stock by an ERISA Plan with respect to which we or an underwriter is considered a Party-In-Interest or a Disqualified Person may constitute or result in a direct or indirect prohibited transaction under Section 406 of ERISA and/or Section 4975 of the Code, unless the investment is acquired and is held in accordance with an applicable statutory, class or individual prohibited transaction exemption. In this regard, the DOL has issued prohibited transaction class exemptions, or PTCEs, that may apply to the acquisition and holding of our common stock. These class exemptions include, without limitation, PTCE 84-14 respecting transactions determined by independent qualified professional asset managers, PTCE 90-1 respecting insurance company pooled separate accounts, PTCE 91-38 respecting bank collective investment funds, PTCE 95-60 respecting life insurance company general accounts and PTCE 96-23 respecting transactions determined by in-house asset managers. In addition, Section 408(b)(17) of ERISA and Section 4975(d)(20) of the Code provide an exemption from certain of the prohibited transaction provision of ERISA and Section 4975 of the Code, provided that neither the issuer of the securities nor any of its affiliates (directly or indirectly) has or exercises any discretionary authority or control or render any investment advice with respect to the assets of any ERISA Plan involved in the transaction and provided further that the ERISA Plan pays no more than adequate consideration in connection with the transaction. There can be no assurance that all of the conditions of any such exemptions will be satisfied.
Neither we, nor any underwriter, nor any of our respective affiliates, agents or employees (the “Transaction Parties”) will act as a fiduciary to any ERISA Plan with respect to the ERISA Plan’s decision to invest in common stock, and none of the Transaction Parties is undertaking to provide impartial investment advice or to give advice in a fiduciary capacity in connection with any ERISA Plan’s acquisition of common stock. Each fiduciary or other person with investment responsibilities over the assets of an ERISA Plan considering an investment in common stock must carefully consider the above factors before making an investment.
In addition, the person making the decision to acquire common stock on behalf of an ERISA Plan (the “Plan Fiduciary”) from a Transaction Party will be deemed to have represented and warranted that (1) none of the Transaction Parties has provided or will provide advice with respect to the acquisition of common stock by the ERISA Plan.
Due to the complexity of these rules and the penalties that may be imposed upon persons involved in non-exempt prohibited transactions, each plan fiduciary should consult with its counsel with respect to the potential applicability of ERISA and the Code to such investment or similar rules that may apply to plans subject to Similar Law. Each plan fiduciary should also determine on its own whether any exceptions or exemptions are necessary and applicable and whether all conditions of any such exceptions or exemptions have been satisfied.
Moreover, each ERISA Plan fiduciary should determine whether, under the general fiduciary standards of investment prudence and diversification, acquiring common stock is appropriate for the ERISA Plan, taking into account the overall investment policy of the ERISA Plan and the composition of the ERISA Plan’s investment portfolio.
The foregoing discussion is general in nature, is not intended to be all-inclusive, and is based on laws in effect on the date of this prospectus. Such discussion should not be construed as legal advice.
370
Table of Contents
Under the terms and subject to the conditions in an underwriting agreement dated the date of this prospectus, the underwriters named below, for whom Morgan Stanley & Co. LLC, Goldman Sachs & Co, LLC, BofA Securities, Inc., J.P. Morgan Securities LLC and Wells Fargo Securities, LLC are acting as representatives, have severally agreed to purchase, and we have agreed to sell to them, severally, the number of shares indicated below:
Name | Number of Shares | |||
Morgan Stanley & Co. LLC | ||||
Goldman Sachs & Co. LLC | ||||
BofA Securities, Inc. | ||||
J.P. Morgan Securities LLC | ||||
Wells Fargo Securities, LLC | ||||
RBC Capital Markets, LLC | ||||
Rabo Securities USA, Inc. | ||||
Scotia Capital (USA) Inc. | ||||
UBS Securities LLC | ||||
Capital One Securities, Inc. | ||||
Truist Securities, Inc. | ||||
Evercore Group L.L.C. | ||||
Robert W. Baird & Co. Incorporated | ||||
KeyBanc Capital Markets Inc. | ||||
Mizuho Securities USA LLC | ||||
PNC Capital Markets LLC | ||||
Deutsche Bank Securities Inc. | ||||
CBRE Capital Advisors, Inc. | ||||
HSBC Securities (USA) Inc. | ||||
Piper Sandler & Co. | ||||
Regions Securities LLC | ||||
Blaylock Van, LLC | ||||
Cabrera Capital Markets LLC | ||||
C.L. King & Associates, Inc. | ||||
Drexel Hamilton, LLC | ||||
Guzman & Company | ||||
Loop Capital Markets LLC | ||||
Roberts & Ryan Investments, Inc. | ||||
R. Seelaus & Co., LLC | ||||
|
| |||
Total: | 47,000,000 | |||
|
|
The underwriters and the representatives are collectively referred to as the “underwriters” and the “representatives,” respectively. The underwriters are offering the shares of common stock subject to their acceptance of the shares from us and subject to prior sale. The underwriting agreement provides that the obligations of the several underwriters to pay for and accept delivery of the shares of common stock offered by this prospectus are subject to the approval of certain legal matters by their counsel and to certain other conditions. The underwriters are obligated to take and pay for all of the shares of common stock offered by this prospectus if any such shares are taken. However, the underwriters are not required to take or pay for the shares covered by the underwriters’ over-allotment option described below.
The underwriters initially propose to offer part of the shares of common stock directly to the public at the offering price listed on the cover page of this prospectus and part to certain dealers at a price that represents a
371
Table of Contents
concession not in excess of $ per share under the public offering price. After the initial offering of the shares of common stock, the offering price and other selling terms may from time to time be varied by the representatives.
We have granted to the underwriters an option, exercisable for 30 days from the date of this prospectus, to purchase up to 7,050,000 additional shares of common stock at the public offering price listed on the cover page of this prospectus, less underwriting discounts and commissions. The underwriters may exercise this option solely for the purpose of covering over-allotments, if any, made in connection with the offering of the shares of common stock offered by this prospectus. To the extent the option is exercised, each underwriter will become obligated, subject to certain conditions, to purchase about the same percentage of the additional shares of common stock as the number listed next to the underwriter’s name in the preceding table bears to the total number of shares of common stock listed next to the names of all underwriters in the preceding table.
The following table shows the per share and total public offering price, underwriting discounts and commissions, and proceeds before expenses to us. These amounts are shown assuming both no exercise and full exercise of the underwriters’ option to purchase up to an additional 7,050,000 shares of common stock to cover over-allotments, if any.
Total | ||||||||||||
Per Share | No Exercise | Full Exercise | ||||||||||
Public offering price | $ | $ | $ | |||||||||
Underwriting discounts and commissions to be paid by us | $ | $ | $ | |||||||||
Proceeds, before expenses, to us | $ | $ | $ |
The estimated offering expenses payable by us, exclusive of the underwriting discounts and commissions, are approximately $36.0 million. We have agreed to reimburse the underwriters for expenses relating to clearance of this offering with the Financial Industry Regulatory Authority up to $30,000. CBRE, which is an affiliate of CBRE Capital Advisors, Inc., prepared for us the market information referenced under “Experts” in this prospectus for a fee of approximately $125,000.
The underwriters have informed us that they do not intend sales to discretionary accounts to exceed 5% of the total number of shares of common stock offered by them.
We expect that our common stock will be approved for listing, subject to notice of issuance, on Nasdaq under the trading symbol “LINE”.
We and all of our directors and officers, holders of all of our outstanding stock and BentallGreenOak, D1 Capital, Oxford and Stonepeak (each a “lock-up signatory”) have agreed that, without the prior written consent of the representatives on behalf of the underwriters, we and they will not, and will not publicly disclose an intention to, during the period ending 180 days after the date of this prospectus (the “restricted period”):
• | offer, pledge, sell, contract to sell, sell any option or contract to purchase, purchase any option or contract to sell, grant any option, right or warrant to purchase, lend or otherwise transfer or dispose of, directly or indirectly, any shares of common stock or any securities convertible into or exercisable or exchangeable for shares of common stock; |
• | enter into any swap or other arrangement that transfers to another, in whole or in part, any of the economic consequences of ownership of the common stock or any securities convertible into or exercisable or exchangeable for common stock; or |
• | file any registration statement with the Securities and Exchange Commission relating to the offering of any shares of common stock or any securities convertible into or exercisable or exchangeable for common stock |
372
Table of Contents
whether any such transaction described above in the first two bullets is to be settled by delivery of common stock or such other securities, in cash or otherwise. In addition, each lock-up signatory agrees that, without the prior written consent of the representatives on behalf of the underwriters, such party will not, during the restricted period, make any demand for, or exercise any right with respect to, the registration of any shares of common stock or any security convertible into or exercisable or exchangeable for common stock.
The restrictions applicable to us described in the immediately preceding paragraph do not apply to:
• | the sale of the shares offered hereby to the underwriters; |
• | common stock or securities convertible into or exercisable or exchangeable for common stock (including OP Units, Legacy Units or OPEUs) issued in the formation transactions; |
• | the issuance by us of shares of common stock upon the exercise of an option or warrant or the conversion of a security outstanding on the date hereof or as a result of the formation transactions; |
• | any common stock or securities convertible into or exercisable or exchangeable for shares of common stock (including OP Units) issued or granted pursuant to any employee benefit plan, qualified stock option plan or other employee compensation plan of the company or our operating partnership; |
• | facilitating the establishment of a trading plan on behalf of our stockholders, officers or directors pursuant to Rule 10b5-1 under the Exchange Act for the transfer of shares of common stock, provided that (i) such plan does not provide for the transfer of common stock during the restricted period and (ii) to the extent a public announcement or filing under the Exchange Act, if any, is required of or voluntarily made by us regarding the establishment of such plan, such announcement or filing shall include a statement to the effect that no transfer of common stock may be made under such plan during the restricted period; |
• | any shares of common stock or securities convertible into or exercisable or exchangeable for shares of common stock (including OP Units and restricted stock units), in the aggregate not to exceed % of the total number of shares of common stock issued and outstanding immediately following the completion of this offering of shares (assuming full conversion, exchange or exercise of all outstanding securities convertible into or exercisable or exchangeable for shares of common stock (including OP Units, OPEUs and restricted stock units)), issued in connection with property acquisitions, mergers or acquisitions, joint ventures, commercial relationships or other strategic transactions, provided, however, that the recipient of such shares of common stock or securities convertible into or exercisable or exchangeable for shares of common stock shall be required to execute a lock-up agreement for the duration of the restricted period; or |
• | the filing of a registration statement or amendment thereto relating to any employee benefit plan, qualified stock option plan or other employee compensation plan of the company and/or our operating partnership. |
In addition, the restrictions applicable to lock-up signatories described above do not apply to:
• | shares acquired by any lock-up signatory in this offering (other than any shares purchased through the directed share program described below) or in open market transactions after the completion of the offering of the shares; provided that no filing under Section 16(a) of the Exchange Act is required or voluntarily made during the restricted period in connection with subsequent sales of the common stock acquired in such open market transactions; |
• | (A) bona fide gifts or charitable contributions; (B) transfers to an immediate family member of a lock-up signatory or any trust or other entity for the direct or indirect benefit of a lock-up signatory or his or her immediate family; (C) transfers to a corporation, partnership, limited liability company or other entity that controls or is controlled by, or is under common control with, a lock-up signatory or members of the lock-up signatory’s immediate family; or (D) transfers by will, other testamentary |
373
Table of Contents
document or intestate succession upon the death of a lock-up signatory or for bona fide estate planning purposes; provided, in each case that the transferee agrees in writing to be bound by the relevant lock-up agreement for the balance of the restricted period, and provided further that, in the case of any transfer described in (B) and (C) above, no filing under Section 16(a) of the Exchange Act is required or voluntarily made, and that, in the case of any transfer described in (A) above, any filing under Section 16(a) of the Exchange Act reporting such transfer shall indicate in the footnotes thereto that such transfer is not for value, that the shares subject to such transfer remain subject to the lock-up and that filing relates to the circumstances described in (A) above; |
• | distributions to limited partners, members or stockholders of the lock-up signatories; provided that the transferee (other than any transferee that is a small holder) agrees in writing to be bound by the relevant lock-up agreement; provided further that any such transfer does not involve a disposition for value and any required filing reporting any such transfer with the SEC pursuant to Section 16 of the Exchange Act shall clearly indicate that such transfer is not for value and that the filing relates to such distribution, and briefly note that such shares remain subject to the applicable lock-up for the balance of the restricted period (except for any transfer to a small holder, in which case the filing will indicate that the shares of common stock are subject to the restrictions of Rule 144); and provided further that no other public filing (other than those that might be required during the restricted period pursuant to Section 13 of the Exchange Act) shall be required or voluntarily made in connection with such transfer; |
• | transfers by operation of law, such as pursuant to an order of a court or regulatory agency, or pursuant to a domestic order or in connection with a divorce settlement; |
• | transfers to us or our subsidiaries pursuant to any redemption or conversion right relating to OP Units, Legacy Class A OP Units, Legacy Class B OP Units or OPEUs; |
• | transfers to us or our subsidiaries pursuant to (A) the exercise on a net issuance basis by the undersigned of any award granted pursuant to our employee benefit plans, or (B) share withholdings to cover applicable taxes in connection with the vesting or settlement of any award granted pursuant to the our employee benefit plans; provided that any filing Section 16(a) of the Exchange Act resulting from such transfer shall indicate that it has been net share settled; |
• | transfers to a bona fide third party pursuant to a merger, consolidation, tender offer or other similar transaction pursuant to an offer made to all holders of our common stock and involving a change of control of us and approved by our board of directors; |
• | for certain lock-up signatories, pledges, hypothecation or other grants of a security interest in common stock or securities convertible into or exercisable or exchangeable for common stock to one or more lending institutions as collateral or security for any loan, advance or extension of credit (provided that at the time of making the loan, advance or extension of credit, such loan, advance or extension of credit does not exceed 33% of the total value of the total collateral so pledged, hypothecated or granted), and any transfer upon foreclosure upon such common stock or securities; provided that the lock-up signatory shall provide the representatives prior written notice informing them of any public filing, report or announcement with respect to such pledge, hypothecation or other grant of a security interest; or |
• | facilitating the establishment of a trading plan on behalf of a stockholder, officer or director of our company pursuant to Rule 10b5-1 under the Exchange Act for the transfer of shares of common stock, provided that (i) such plan does not provide for the transfer of common stock during the restricted period and (ii) to the extent a public announcement or disclosure, or filing under the Exchange Act, regarding the establishment of such plan is required or voluntarily made by or on behalf of the lock-up signatory or by us, such announcement, disclosure or filing shall include a statement to the effect that no transfer of common stock may be made under such plan during the restricted period. |
The representatives, in their sole discretion, may release the common stock and other securities subject to the lock-up agreements described above in whole or in part at any time.
374
Table of Contents
In order to facilitate the offering of the common stock, the underwriters may engage in transactions that stabilize, maintain or otherwise affect the price of the common stock. Specifically, the underwriters may sell more shares than they are obligated to purchase under the underwriting agreement, creating a short position. A short sale is covered if the short position is no greater than the number of shares available for purchase by the underwriters under the over-allotment option. The underwriters can close out a covered short sale by exercising the over-allotment option or purchasing shares in the open market. In determining the source of shares to close out a covered short sale, the underwriters will consider, among other things, the open market price of shares compared to the price available under the over-allotment option. The underwriters may also sell shares in excess of the over-allotment option, creating a naked short position. The underwriters must close out any naked short position by purchasing shares in the open market. A naked short position is more likely to be created if the underwriters are concerned that there may be downward pressure on the price of the common stock in the open market after pricing that could adversely affect investors who purchase in this offering. As an additional means of facilitating this offering, the underwriters may bid for, and purchase, shares of common stock in the open market to stabilize the price of the common stock. These activities may raise or maintain the market price of the common stock above independent market levels or prevent or retard a decline in the market price of the common stock. The underwriters are not required to engage in these activities and may end any of these activities at any time.
KKR Capital Markets LLC, a registered broker-dealer, is acting as our Lead financial advisor and our independent financial advisor as defined under FINRA Rule 5110(j)(9) in connection with this offering. BDT & MSD Partners, Seven Lakes Partners, and Eastdil Secured Advisors, LLC are also acting as our independent financial advisors in connection with this offering, for which they will receive a customary fee.
We and the underwriters have agreed to indemnify each other against certain liabilities, including liabilities under the Securities Act.
A prospectus in electronic format may be made available on websites maintained by one or more underwriters, or selling group members, if any, participating in this offering. The representatives may agree to allocate a number of shares of common stock to underwriters for sale to their online brokerage account holders. Internet distributions will be allocated by the representatives to underwriters that may make Internet distributions on the same basis as other allocations.
The underwriters and their respective affiliates are full service financial institutions engaged in various activities, which may include securities trading, commercial and investment banking, financial advisory, investment management, investment research, principal investment, hedging, financing and brokerage activities. Certain of the underwriters and their respective affiliates have, from time to time, performed, and may in the future perform, various financial advisory and investment banking services for us, for which they received or will receive customary fees and expenses.
Affiliates of Morgan Stanley & Co. LLC, Goldman Sachs & Co. LLC, BofA Securities, Inc., J.P. Morgan Securities LLC, Wells Fargo Securities, LLC, RBC Capital Markets, LLC, Rabo Securities USA, Inc., Scotia Capital (USA) Inc., Capital One Securities, Inc., Truist Securities, Inc., KeyBanc Capital Markets Inc., Mizuho Securities USA LLC, HSBC Securities (USA) Inc. and Regions Securities LLC are lenders under our Revolving Credit Facility and our Term Loan, affiliates of Morgan Stanley & Co. LLC, Goldman Sachs & Co. LLC, BofA Securities, Inc., J.P. Morgan Securities LLC and Wells Fargo Securities, LLC are lenders under our Delayed Draw Term Loan and affiliates of Goldman Sachs & Co. LLC are lenders under our CMBS loans. Accordingly, such underwriters and/or their respective affiliates will receive their pro rata portion of the net proceeds from this offering used to repay amounts outstanding under the Revolving Credit Facility, our Term Loan, our Delayed Draw Term Loan and/or our CMBS loans. In their capacity as lenders, these underwriters and/or their respective affiliates will receive certain financing fees in connection with these loans in addition to the underwriting discount that may result from this offering. Accordingly, more than 5% of the net proceeds of this offering are intended be used to repay amounts owed to these underwriters and/or their respective affiliates. Additionally, certain of the underwriters and/or their respective affiliates are acting as agents and/or arrangers under the Revolving Credit Facility our Delayed Draw Term Loan and/or our Term Loan and will receive customary fees.
375
Table of Contents
In addition, in the ordinary course of their various business activities, the underwriters and their respective affiliates may make or hold a broad array of investments and actively trade debt and equity securities (or related derivative securities) and financial instruments (including bank loans) for their own account and for the accounts of their customers and may at any time hold long and short positions in such securities and instruments. Such investment and securities activities may involve our securities and instruments. The underwriters and their respective affiliates may also make investment recommendations or publish or express independent research views in respect of such securities or instruments and may at any time hold, or recommend to clients that they acquire, long or short positions in such securities and instruments.
Robert W. Baird & Co. Incorporated will pay a referral fee to an affiliate of The Huntington National Bank, one of the lenders under the Revolving Credit Facility, in connection with this offering.
Pricing of Offering
Prior to this offering, there has been no public market for our common stock. The initial public offering price was determined by negotiations between us and the representatives. Among the factors considered in determining the initial public offering price were our future prospects and those of our industry in general, our sales, earnings and certain other financial and operating information in recent periods, and the price-earnings ratios, price-sales ratios, market prices of securities, and certain financial and operating information of companies engaged in activities similar to ours.
Directed Share Program
At our request, the underwriters have reserved six percent of the shares of common stock to be issued by us and offered by this prospectus for sale, at the initial public offering price, to (i) certain of our directors, officers and employees, (ii) friends and family members of certain of our directors and officers, (iii) individuals associated with certain of our customers, vendors, landlords and service providers and (iv) certain of our legacy investors, former owners of acquired companies and properties and other industry partners. If purchased by our directors or officers, these shares will be subject to a 180-day lock-up restriction. The number of shares of common stock available for sale to the general public will be reduced to the extent these individuals purchase such reserved shares. Any reserved shares that are not so purchased will be offered by the underwriters to the general public on the same basis as the other shares offered by this prospectus. Morgan Stanley & Co. LLC will administer our directed share program, except for sales to certain Canadian participants, which will be administered by RBC Capital Markets, LLC as dealer for such participants. We agreed to indemnify Morgan Stanley & Co. LLC and RBC Capital Markets, LLC in connection with the directed share program, including for the failure of any participant to pay for its shares. Other than the underwriting discount described on the front cover of this prospectus, the underwriters will not be entitled to any commission with respect to shares of stock sold pursuant to the directed share program.
Selling Restrictions
European Economic Area
In relation to each Member State of the European Economic Area (each, a “Relevant State”), no shares have been offered or will be offered pursuant to the offering to the public in that Relevant State prior to the publication of a prospectus in relation to the shares which has been approved by the competent authority in that Relevant State or, where appropriate, approved in another Relevant State and notified to the competent authority in that Relevant State, all in accordance with the Prospectus Regulation, except that offers of shares may be made to the public in that Relevant State at any time under the following exemptions under the Prospectus Regulation:
(a) | to any legal entity which is a qualified investor as defined under Article 2 of the Prospectus Regulation; |
(b) | to fewer than 150 natural or legal persons (other than qualified investors as defined under Article 2 of the Prospectus Regulation), subject to obtaining the prior consent of the representatives for any such offer; or |
376
Table of Contents
(c) | in any other circumstances falling within Article 1(4) of the Prospectus Regulation, |
provided that no such offer of shares shall require us or any representative to publish a prospectus pursuant to Article 3 of the Prospectus Regulation or supplement a prospectus pursuant to Article 23 of the Prospectus Regulation.
For the purposes of this provision, the expression an “offer to the public” in relation to the shares in any Relevant State means the communication in any form and by any means of sufficient information on the terms of the offer and any shares to be offered so as to enable an investor to decide to purchase or subscribe for any shares, and the expression “Prospectus Regulation” means Regulation (EU) 2017/1129 (as amended).
United Kingdom
No shares have been offered or will be offered pursuant to the offering to the public in the United Kingdom prior to the publication of a prospectus in relation to the shares which has been approved by the Financial Conduct Authority, except that offers of shares may be made to the public in the United Kingdom at any time under the following exemptions under the UK Prospectus Regulation:
(a) | to any legal entity which is a qualified investor as defined under Article 2 of the UK Prospectus Regulation; |
(b) | to fewer than 150 natural or legal persons (other than qualified investors as defined under Article 2 of the UK Prospectus Regulation), subject to obtaining the prior consent of the representatives for any such offer; or |
(c) | in any other circumstances falling within Section 86 of the Financial Services and Markets Act 2000 (“FSMA”), |
provided that no such offer of shares shall require us or any representative to publish a prospectus pursuant to Section 85 of the FSMA or supplement a prospectus pursuant to Article 23 of the UK Prospectus Regulation.
For the purposes of this provision, the expression an “offer to the public” in relation to the shares in the United Kingdom means the communication in any form and by any means of sufficient information on the terms of the offer and any shares to be offered so as to enable an investor to decide to purchase or subscribe for any shares, and the expression “UK Prospectus Regulation” means Regulation (EU) 2017/1129 as it forms part of domestic law by virtue of the European Union (Withdrawal) Act 2018.
Australia
No placement document, prospectus, product disclosure statement or other disclosure document has been lodged with the Australian Securities and Investments Commission (“ASIC”), in relation to the offering. This prospectus does not constitute a prospectus, product disclosure statement or other disclosure document under the Corporations Act 2001 (the “Corporations Act”), and does not purport to include the information required for a prospectus, product disclosure statement or other disclosure document under the Corporations Act.
Any offer in Australia of the shares may only be made to persons (the “Exempt Investors”) who are “sophisticated investors” (within the meaning of section 708(8) of the Corporations Act), “professional investors” (within the meaning of section 708(11) of the Corporations Act) or otherwise pursuant to one or more exemptions contained in section 708 of the Corporations Act so that it is lawful to offer the shares without disclosure to investors under Chapter 6D of the Corporations Act.
The shares applied for by Exempt Investors in Australia must not be offered for sale in Australia in the period of 12 months after the date of allotment under the offering, except in circumstances where disclosure to
377
Table of Contents
investors under Chapter 6D of the Corporations Act would not be required pursuant to an exemption under section 708 of the Corporations Act or otherwise or where the offer is pursuant to a disclosure document which complies with Chapter 6D of the Corporations Act. Any person acquiring shares must observe such Australian on-sale restrictions.
This prospectus contains general information only and does not take account of the investment objectives, financial situation or particular needs of any particular person. It does not contain any securities recommendations or financial product advice. Before making an investment decision, investors need to consider whether the information in this prospectus is appropriate to their needs, objectives and circumstances, and, if necessary, seek expert advice on those matters.
Brazil
THE OFFER AND SALE OF THE SHARES HAVE NOT BEEN AND WILL NOT BE REGISTERED WITH THE BRAZILIAN SECURITIES COMMISSION (COMISSÃO DE VALORES MOBILIÁRIOS, OR “CVM”) AND, THEREFORE, WILL NOT BE CARRIED OUT BY ANY MEANS THAT WOULD CONSTITUTE A PUBLIC OFFERING IN BRAZIL UNDER CVM RESOLUTION NO 160, DATED 13 JULY 2022, AS AMENDED (“CVM RESOLUTION 160”) OR UNAUTHORIZED DISTRIBUTION UNDER BRAZILIAN LAWS AND REGULATIONS. THE SHARES MAY ONLY BE OFFERED TO BRAZILIAN PROFESSIONAL INVESTORS (AS DEFINED BY APPLICABLE CVM REGULATION), WHO MAY ONLY ACQUIRE THE SHARES THROUGH A NON-BRAZILIAN ACCOUNT, WITH SETTLEMENT OUTSIDE BRAZIL IN NON-BRAZILIAN CURRENCY. THE TRADING OF THESE ON REGULATED SECURITIES MARKETS IN BRAZIL IS PROHIBITED.
Canada
The shares may be sold in Canada only to purchasers purchasing, or deemed to be purchasing, as principal that are accredited investors, as defined in National Instrument 45-106 Prospectus Exemptions or subsection 73.3(1) of the Securities Act (Ontario), and are permitted clients, as defined in National Instrument 31-103 Registration Requirements, Exemptions, and Ongoing Registrant Obligations. Any resale of the shares must be made in accordance with an exemption form, or in a transaction not subject to, the prospectus requirements of applicable securities laws.
Securities legislation in certain provinces or territories of Canada may provide a purchaser with remedies for rescission or damages if this offering memorandum (including any amendment thereto) contains a misrepresentation, provided that the remedies for rescission or damages are exercised by the purchaser within the time limit prescribed by the securities legislation of the purchaser’s province or territory. The purchaser should refer to any applicable provisions of the securities legislation of the purchaser’s province or territory of these rights or consult with a legal advisor.
Pursuant to section 3A.3 of National Instrument 33-105 Underwriting Conflicts (NI 33-105), the underwriters are not required to comply with the disclosure requirements of NI 33-105 regarding underwriter conflicts of interest in connection with this offering.
Hong Kong
The shares may not be offered or sold in Hong Kong by means of any document other than (i) in circumstances which do not constitute an offer to the public within the meaning of the Companies (Winding Up and Miscellaneous Provisions) Ordinance (Cap. 32 of the Laws of Hong Kong) (“Companies (Winding Up and Miscellaneous Provisions) Ordinance”) or which do not constitute an invitation to the public within the meaning of the Securities and Futures Ordinance (Cap. 571 of the Laws of Hong Kong) (“Securities and Futures Ordinance”), or (ii) to “professional investors” as defined in the Securities and Futures Ordinance and any rules
378
Table of Contents
made thereunder, or (iii) in other circumstances which do not result in the document being a “prospectus” as defined in the Companies (Winding Up and Miscellaneous Provisions) Ordinance, and no advertisement, invitation or document relating to the shares may be issued or may be in the possession of any person for the purpose of issue (in each case whether in Hong Kong or elsewhere), which is directed at, or the contents of which are likely to be accessed or read by, the public in Hong Kong (except if permitted to do so under the securities laws of Hong Kong) other than with respect to shares which are or are intended to be disposed of only to persons outside Hong Kong or only to “professional investors” in Hong Kong as defined in the Securities and Futures Ordinance and any rules made thereunder.
Kuwait
Unless all necessary approvals from the Kuwait Capital Markets Authority pursuant to Law No. 7/2010, its Executive Regulations and the various Resolutions and Announcements issued pursuant thereto or in connection therewith have been given in relation to the marketing of and sale of the shares of the shares, these may not be offered for sale, nor sold in the State of Kuwait (“Kuwait”). Neither this prospectus nor any of the information contained herein is intended to lead to the conclusion of any contract of whatsoever nature within Kuwait. With regard to the contents of this document, we recommend that you consult a licensee as per the law and specialized in giving advice about the purchase of shares and other securities before making the subscription decision.
Saudi Arabia
This prospectus may not be distributed in the Kingdom of Saudi Arabia except to such persons as are permitted under the Offers of Securities Regulations as issued by the board of the Saudi Arabian Capital Market Authority (“CMA”) pursuant to resolution number 2-11-2004 dated 4 October 2004 as amended by resolution number 1-28-2008, as amended. The CMA does not make any representation as to the accuracy or completeness of this document and expressly disclaims any liability whatsoever for any loss arising from, or incurred in reliance upon, any part of this prospectus. Prospective purchasers of the shares offered hereby should conduct their own due diligence on the accuracy of the information relating to the shares. If you do not understand the contents of this document, you should consult an authorized financial adviser.
Singapore
The shares which are the subject of this prospectus do not represent units in a collective investment scheme which is authorized or recognized by the Monetary Authority of Singapore (“MAS”) under Section 286 or 287 of the Securities and Futures Act (Chapter 289 of Singapore) (“SFA”) and this prospectus has not been registered as a prospectus with the MAS under the SFA. This prospectus and any other document or material in connection with the offer or sale, or invitation for subscription or purchase, of the shares will not be circulated or distributed, nor will the shares be offered or sold, or be made the subject of an invitation for subscription or purchase, whether directly or indirectly, to persons in Singapore, other than institutional investors as defined in Section 4A of the SFA or relevant regulations thereunder.
Switzerland
The shares may not be publicly offered in Switzerland and will not be listed on the SIX Swiss Exchange (“SIX”) or on any other stock exchange or regulated trading facility in Switzerland. This prospectus does not constitute a prospectus within the meaning of, and has been prepared without regard to the disclosure standards for issuance prospectuses under art. 652a or art. 1156 of the Swiss Code of Obligations or the disclosure standards for listing prospectuses under art. 27 ff. of the SIX Listing Rules or the listing rules of any other stock exchange or regulated trading facility in Switzerland. Neither this prospectus nor any other offering or marketing material relating to the shares or the offering may be publicly distributed or otherwise made publicly available in Switzerland.
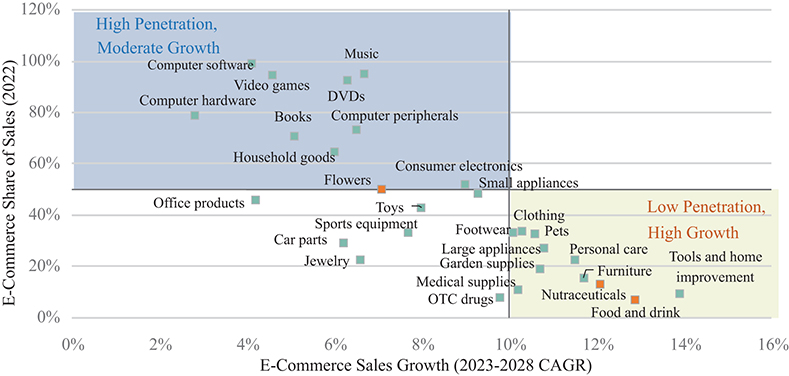
379
Table of Contents
Neither this prospectus nor any other offering or marketing material relating to the offering, us, or the shares have been or will be filed with or approved by any Swiss regulatory authority. In particular, this prospectus will not be filed with, and the offer of shares will not be supervised by, the Swiss Financial Market Supervisory Authority FINMA, and the offer of shares has not been and will not be authorized under the Swiss Federal Act on Collective Investment Schemes (“CISA”). The investor protection afforded to acquirers of interests in collective investment schemes under the CISA does not extend to acquirers of shares.
Qatar
In the State of Qatar, the offer contained herein is made on an exclusive basis to the specifically intended recipient thereof, upon that person’s request and initiative, for personal use only and shall in no way be construed as a general offer for the sale of securities to the public or an attempt to do business as a bank, an investment company or otherwise in the State of Qatar. This prospectus and the underlying shares have not been approved or licensed by the Qatar Central Bank or the Qatar Financial Center Regulatory Authority or any other regulator in the State of Qatar. The information contained in this prospectus shall only be shared with any third parties in Qatar on a need to know basis for the purpose of evaluating the contained offer. Any distribution of this prospectus by the recipient to third parties in Qatar beyond the terms hereof is not permitted and shall be at the liability of such recipient.
United Arab Emirates
The shares have not been, and are not being, publicly offered, sold, promoted or advertised in the United Arab Emirates (including the Dubai International Financial Centre) other than in compliance with the laws of the United Arab Emirates (and the Dubai International Financial Centre) governing the issue, offering and sale of securities. Further, this prospectus does not constitute a public offer of securities in the United Arab Emirates (including the Dubai International Financial Centre) and is not intended to be a public offer. This prospectus has not been approved by or filed with the Central Bank of the United Arab Emirates, the Securities and Commodities Authority or the Dubai Financial Services Authority (the “DFSA”).
Dubai International Financial Centre
This prospectus relates to an “Exempt Offer” in accordance with the Offered Securities Rules of the DFSA. This prospectus is intended for distribution only to persons of a type specified in the Offered Securities Rules of the DFSA. It must not be delivered to, or relied on by, any other person. The DFSA has no responsibility for reviewing or verifying any documents in connection with “Exempt Offers.” The DFSA has not approved this prospectus nor taken steps to verify the information set forth herein and has no responsibility for the prospectus. The shares to which this prospectus relates may be illiquid and/or subject to restrictions on their resale. Prospective purchasers of the shares offered should conduct their own due diligence on the shares. If you do not understand the contents of this prospectus, you should consult an authorized financial advisor.
380
Table of Contents
Certain legal matters, including certain tax matters, will be passed upon for us by Latham & Watkins LLP, Los Angeles, California. Goodwin Procter LLP, Boston, Massachusetts, will act as counsel to the underwriters. Venable LLP, Baltimore, Maryland, will pass upon the validity of the shares of our common stock sold in this offering and certain other matters under Maryland law. Certain Latham & Watkins LLP attorneys and investment funds affiliated with the firm own BGLH units and/or have indicated an interest in purchasing shares of our common stock in this offering representing, in the aggregate, less than 1% of our shares of common stock after the completion of this offering and the formation transactions.
381
Table of Contents
The consolidated financial statements of Lineage, Inc. as of December 31, 2023 and 2022, and for each of the years in the three-year period ended December 31, 2023, have been included herein and in the registration statement in reliance upon the report of KPMG LLP, independent registered public accounting firm, appearing elsewhere herein, and upon authority of said firm as experts in accounting and auditing.
Certain statistical and economic market data included in this prospectus, including information relating to the economic conditions in the cold storage market contained in “Prospectus Summary,” “Industry Overview” and “Business and Properties” is derived from market information prepared for us by CBRE, a nationally recognized real estate services firm, and is included in this prospectus in reliance on CBRE’s authority as an expert in such matters.
An affiliate of CBRE is acting as an underwriter in this offering and has agreed to purchase, and we have agreed to sell to it, shares of common stock at the public offering price set forth on the front cover of this prospectus, less underwriting discounts and commissions of up to an aggregate of $0.9 million (or $1.0 million if the underwriters’ option to purchase additional shares is exercised in full) based on the mid-point of the price range set forth on the front cover of this prospectus. We refer you to “Underwriters” beginning on page 371 of this prospectus for additional information. In addition, affiliates of CBRE have indicated an interest in purchasing shares of common stock in this offering at the initial public offering price representing, in the aggregate, less than 1% of our shares of common stock after the completion of this offering and the formation transactions. Because this indication of interest is not a binding agreement or commitment to purchase, such affiliates of CBRE may determine to purchase more, less or no shares in this offering or the underwriters may determine to sell more, less or no shares to such affiliate of CBRE. The underwriters will receive the same underwriting discounts and commissions on any of our shares of common stock purchased by such affiliates of CBRE as they will from any other shares of common stock sold to the public in this offering.
382
Table of Contents
WHERE YOU CAN FIND MORE INFORMATION
We maintain a web site at www.onelineage.com. Information contained on our web site is not incorporated by reference into this prospectus, and you should not consider information contained on our web site to be part of this prospectus.
We have filed a registration statement on Form S-11, of which this prospectus constitutes a part, with the SEC under the Securities Act with respect to this offering of our common stock. This prospectus does not contain all of the information set forth in the registration statement, which also includes numerous exhibits and schedules. For further information with respect to our company and the shares of common stock offered hereby, reference is made to the registration statement, including the exhibits and schedules thereto. Statements contained in this prospectus as to the contents of any contract or other document are not necessarily complete, and where such document has been filed as an exhibit to the registration statement, each statement is qualified in all respects by reference to the contents of the full document. Our SEC filings, including our registration statement, are available to you, free of charge, on the SEC’s web site, www.sec.gov.
As a result of this offering, we will become subject to the information and periodic reporting requirements of the Exchange Act, and we will file periodic reports and other information with the SEC. These periodic reports and other information will be available for inspection and copying at the SEC’s public reference facilities and through the SEC’s web site referred to above.
383
Table of Contents
LINEAGE, INC. AND SUBSIDIARIES
INDEX TO FINANCIAL STATEMENTS
Page | ||||
Historical Financial Statements of Lineage, Inc. (audited): | ||||
F-2 | ||||
F-4 | ||||
F-5 | ||||
F-6 | ||||
Consolidated Statements of Cash Flows for Years Ended December 31, 2023, 2022, and 2021 | F-9 | |||
F-12 | ||||
F-79 | ||||
Historical Financial Statements of Lineage, Inc. (unaudited): | ||||
Condensed Consolidated Balance Sheets as of March 31, 2024 and December 31, 2023 (Unaudited) | F-85 | |||
F-86 | ||||
F-87 | ||||
F-89 | ||||
Notes to Condensed Consolidated Financial Statements(Unaudited) | F-91 | |||
Unaudited Pro Forma Condensed Consolidated Financial Statements of Lineage, Inc.: | ||||
Unaudited Pro Forma Condensed Consolidated Balance Sheet as of March 31, 2024 | F-128 | |||
F-129 | ||||
F-130 | ||||
Notes to Unaudited Pro Forma Condensed Consolidated FinancialStatements | F-131 |
Table of Contents
KPMG LLP Suite 1900 150 West Jefferson Detroit, MI 48226 |
Report of Independent Registered Public Accounting Firm
To the Stockholders and Board of Directors
Lineage, Inc.:
Opinion on the Consolidated Financial Statements
We have audited the accompanying consolidated balance sheets of Lineage, Inc. and subsidiaries (the Company) as of December 31, 2023 and 2022, the related consolidated statements of operations and comprehensive income (loss), redeemable noncontrolling interests and equity, and cash flows for each of the years in the three-year period ended December 31, 2023, and the related notes and financial statement schedule III—Real Estate and Accumulated Depreciation (collectively, the consolidated financial statements). In our opinion, the consolidated financial statements present fairly, in all material respects, the financial position of the Company as of December 31, 2023 and 2022, and the results of its operations and its cash flows for each of the years in the three-year period ended December 31, 2023, in conformity with U.S. generally accepted accounting principles.
Basis for Opinion
These consolidated financial statements are the responsibility of the Company’s management. Our responsibility is to express an opinion on these consolidated financial statements based on our audits. We are a public accounting firm registered with the Public Company Accounting Oversight Board (United States) (PCAOB) and are required to be independent with respect to the Company in accordance with the U.S. federal securities laws and the applicable rules and regulations of the Securities and Exchange Commission and the PCAOB.
We conducted our audits in accordance with the standards of the PCAOB. Those standards require that we plan and perform the audit to obtain reasonable assurance about whether the consolidated financial statements are free of material misstatement, whether due to error or fraud. Our audits included performing procedures to assess the risks of material misstatement of the consolidated financial statements, whether due to error or fraud, and performing procedures that respond to those risks. Such procedures included examining, on a test basis, evidence regarding the amounts and disclosures in the consolidated financial statements. Our audits also included evaluating the accounting principles used and significant estimates made by management, as well as evaluating the overall presentation of the consolidated financial statements. We believe that our audits provide a reasonable basis for our opinion.
Critical Audit Matter
The critical audit matter communicated below is a matter arising from the current period audit of the consolidated financial statements that was communicated or required to be communicated to the audit committee and that: (1) relates to accounts or disclosures that are material to the consolidated financial statements and (2) involved our especially challenging, subjective, or complex judgments. The communication of a critical audit matter does not alter in any way our opinion on the consolidated financial statements, taken as a whole, and we are not, by communicating the critical audit matter below, providing a separate opinion on the critical audit matter or on the accounts or disclosures to which it relates.
KPMG LLP, a Delaware limited liability partnership and a member firm of KPMG International Limited, a private English company limited by guarantee. |
F-2
Table of Contents
Indicators that real estate assets may not be recoverable
As discussed in Notes 5 and 13 to the consolidated financial statements, the Company had $8,544.4 million of buildings, building improvements and refrigeration equipment, $1,446.3 million of land and land improvements, $723.7 million of net operating lease right-of-use assets, and $1,243.3 million of net finance lease right-of-use assets (collectively, the real estate assets) as of December 31, 2023. The Company evaluates its real estate assets for impairment when events or changes in circumstances indicate that the carrying value of such assets may not be recoverable, or when the assets are held for sale. Upon the occurrence of a triggering event, the Company assesses whether the estimated undiscounted cash flows expected from the use of the asset and the residual value from the ultimate disposal of the asset exceeds the carrying value. If the carrying value exceeds the estimated recoverable amounts, the Company reduces the carrying value to fair value and records an impairment loss in earnings.
We identified the evaluation of indicators that the carrying value of real estate assets may not be recoverable as a critical audit matter. In particular, judgments regarding the future operating cash flows of the real estate assets and the assessment of changes in market conditions on the determination of when impairment indicators exist required a high degree of auditor judgment.
The following are the primary procedures we performed to address this critical audit matter. We evaluated the Company’s assessment by:
• | inquiring of Company officials and inspecting documents such as meeting minutes of the Board of Directors to identify indicators that real estate assets may not be recoverable |
• | observing the property conditions of certain cold storage warehouses and inquiring of general managers regarding events or changes in circumstances that would indicate that the real estate assets may be impaired |
• | comparing a selection of the Company’s historical estimated cash flows by property to actual results to assess the Company’s ability to accurately forecast |
• | observing market conditions and property operating metrics for real estate assets. |
/s/ KPMG LLP
We have served as the Company’s auditor since 2020.
Detroit, Michigan
March 8, 2024
F-3
Table of Contents
LINEAGE, INC. AND SUBSIDIARIES
(dollars in millions, except per share and share amounts)
December 31, | ||||||||
2023 | 2022 | |||||||
Assets | ||||||||
Current assets: | ||||||||
Cash and cash equivalents | $ | 68.2 | $ | 170.6 | ||||
Restricted cash | 2.6 | 31.4 | ||||||
Accounts receivable, net | 912.9 | 935.7 | ||||||
Inventories | 170.6 | 156.8 | ||||||
Prepaid expenses and other current assets | 101.5 | 104.5 | ||||||
|
|
|
| |||||
Total current assets | 1,255.8 | 1,399.0 | ||||||
Non-current assets: | ||||||||
Property, plant, and equipment, net | 10,570.5 | 10,103.9 | ||||||
Finance lease right-of-use assets, net | 1,243.3 | 1,285.6 | ||||||
Operating lease right-of-use assets, net | 723.7 | 677.0 | ||||||
Equity method investments | 112.5 | 83.9 | ||||||
Goodwill | 3,393.9 | 3,304.9 | ||||||
Other intangible assets, net | 1,280.0 | 1,331.4 | ||||||
Other assets | 291.3 | 371.7 | ||||||
|
|
|
| |||||
Total assets | $ | 18,871.0 | $ | 18,557.4 | ||||
|
|
|
| |||||
Liabilities, Redeemable Noncontrolling Interests, and Equity | ||||||||
Current liabilities: | ||||||||
Accounts payable and accrued liabilities | $ | 1,136.6 | $ | 1,082.8 | ||||
Accrued distributions | 109.9 | 10.7 | ||||||
Deferred revenue | 94.4 | 91.8 | ||||||
Current portion of long-term debt, net | 24.3 | 36.4 | ||||||
|
|
|
| |||||
Total current liabilities | 1,365.2 | 1,221.7 | ||||||
Non-current liabilities: | ||||||||
Long-term finance lease obligations | 1,304.5 | 1,323.5 | ||||||
Long-term operating lease obligations | 692.1 | 632.3 | ||||||
Deferred income tax liability | 370.1 | 413.5 | ||||||
Long-term debt, net | 8,958.2 | 8,697.4 | ||||||
Other long-term liabilities | 159.6 | 163.3 | ||||||
|
|
|
| |||||
Total liabilities | 12,849.7 | 12,451.7 | ||||||
Commitments and contingencies (Note 18) | ||||||||
Redeemable noncontrolling interests | 348.9 | 297.8 | ||||||
Stockholders’ equity: | ||||||||
Common stock, $0.01 par value per share – 500,000,000 authorized shares; 162,017,515 and 160,400,437 issued and outstanding at December 31, 2023 and 2022, respectively | 1.6 | 1.6 | ||||||
Additional paid-in capital—common stock | 5,960.7 | 5,915.0 | ||||||
Series A preferred stock, $0.01 par value per share—100,000,000 authorized shares; 630 issued and outstanding shares, with an aggregate liquidation preference of $0.6 at December 31, 2023 and 2022 | 0.6 | 0.6 | ||||||
Retained earnings (accumulated deficit) | (878.6 | ) | (712.8 | ) | ||||
Accumulated other comprehensive income (loss) | (33.8 | ) | (37.4 | ) | ||||
|
|
|
| |||||
Total stockholders’ equity | 5,050.5 | 5,167.0 | ||||||
Noncontrolling interests | 621.9 | 640.9 | ||||||
|
|
|
| |||||
Total equity | 5,672.4 | 5,807.9 | ||||||
|
|
|
| |||||
Total liabilities, redeemable noncontrolling interests, and equity | $ | 18,871.0 | $ | 18,557.4 | ||||
|
|
|
|
See accompanying notes to consolidated financial statements.
F-4
Table of Contents
LINEAGE, INC. AND SUBSIDIARIES
CONSOLIDATED STATEMENTS OF OPERATIONS AND COMPREHENSIVE INCOME (LOSS)
(dollars in millions, except per share amounts)
Year Ended December 31, | ||||||||||||
2023 | 2022 | 2021 | ||||||||||
Net revenues | $ | 5,341.5 | $ | 4,928.3 | $ | 3,702.0 | ||||||
|
|
|
|
|
| |||||||
Cost of operations | 3,589.8 | 3,473.2 | 2,571.4 | |||||||||
General and administrative expense | 501.8 | 398.9 | 289.3 | |||||||||
Depreciation expense | 551.9 | 479.5 | 416.1 | |||||||||
Amortization expense | 207.8 | 197.7 | 187.6 | |||||||||
Acquisition, transaction, and other expense | 60.0 | 66.2 | 123.6 | |||||||||
Restructuring and impairment expense | 31.8 | 15.5 | 26.3 | |||||||||
|
|
|
|
|
| |||||||
Total operating expense | 4,943.1 | 4,631.0 | 3,614.3 | |||||||||
|
|
|
|
|
| |||||||
Income from operations | 398.4 | 297.3 | 87.7 | |||||||||
|
|
|
|
|
| |||||||
Other income (expense): | ||||||||||||
Equity income (loss), net of tax | (2.6 | ) | (0.2 | ) | (0.3 | ) | ||||||
Gain (loss) on foreign currency transactions, net | 3.9 | (23.8 | ) | (34.0 | ) | |||||||
Interest expense, net | (490.4 | ) | (347.0 | ) | (259.6 | ) | ||||||
Gain (loss) on extinguishment of debt | — | 1.4 | (4.1 | ) | ||||||||
Other nonoperating income (expense), net | (19.4 | ) | 2.3 | 4.5 | ||||||||
|
|
|
|
|
| |||||||
Total other income (expense), net | (508.5 | ) | (367.3 | ) | (293.5 | ) | ||||||
|
|
|
|
|
| |||||||
Net income (loss) before income taxes | (110.1 | ) | (70.0 | ) | (205.8 | ) | ||||||
Income tax expense (benefit) | (13.9 | ) | 6.0 | (29.3 | ) | |||||||
|
|
|
|
|
| |||||||
Net income (loss) | (96.2 | ) | (76.0 | ) | (176.5 | ) | ||||||
Less: Net income (loss) attributable to noncontrolling interests | (18.8 | ) | (13.3 | ) | (23.2 | ) | ||||||
|
|
|
|
|
| |||||||
Net income (loss) attributable to Lineage, Inc. | (77.4 | ) | (62.7 | ) | (153.3 | ) | ||||||
|
|
|
|
|
| |||||||
Other comprehensive income (loss), net of tax: | ||||||||||||
Unrealized gain (loss) on foreign currency hedges and interest rate hedges | (86.9 | ) | 171.6 | 38.8 | ||||||||
Foreign currency translation adjustments | 88.5 | (221.5 | ) | (114.6 | ) | |||||||
|
|
|
|
|
| |||||||
Comprehensive income (loss) | (94.6 | ) | (125.9 | ) | (252.3 | ) | ||||||
Less: Comprehensive income (loss) attributable to noncontrolling interests | (20.9 | ) | (16.9 | ) | (32.9 | ) | ||||||
|
|
|
|
|
| |||||||
Comprehensive income (loss) attributable to Lineage, Inc. | $ | (73.7 | ) | $ | (109.0 | ) | $ | (219.4 | ) | |||
|
|
|
|
|
| |||||||
Basic earnings (loss) per share | $ | (0.73 | ) | $ | (0.51 | ) | $ | (1.33 | ) | |||
|
|
|
|
|
| |||||||
Diluted earnings (loss) per share | $ | (0.73 | ) | $ | (0.51 | ) | $ | (1.33 | ) | |||
|
|
|
|
|
| |||||||
Weighted average common shares outstanding (in millions): | ||||||||||||
Basic | 161.9 | 152.0 | 131.0 | |||||||||
Diluted | 161.9 | 152.0 | 131.0 |
See accompanying notes to consolidated financial statements.
F-5
Table of Contents
LINEAGE, INC. AND SUBSIDIARIES
CONSOLIDATED STATEMENTS OF REDEEMABLE NONCONTROLLING INTERESTS AND EQUITY
(dollars in millions, except number of shares and par value amounts)
Common Stock | ||||||||||||||||||||||||||||||||||||||||
Redeemable noncontrolling interests | Number of shares | Par value | Additional paid-in capital | Series A preferred stock | Retained earnings (accumulated deficit) | Accumulated other comprehensive income (loss) | Noncontrolling interests | Total equity | ||||||||||||||||||||||||||||||||
Balance as of December 31, 2020 | $ | 10.4 | 117,405,081 | $ | 1.2 | $ | 3,042.0 | $ | 0.1 | $ | (368.3 | ) | $ | 74.9 | $ | 437.2 | $ | 3,187.1 | ||||||||||||||||||||||
Common stock issuances, net of equity raise costs | — | 30,217,112 | 0.3 | 2,122.3 | — | — | — | — | 2,122.6 | |||||||||||||||||||||||||||||||
Contributions from noncontrolling interests | — | — | — | 169.1 | — | — | — | 114.2 | 283.3 | |||||||||||||||||||||||||||||||
Dividends ($0.82 per common share) and other distributions | — | — | — | — | — | (128.5 | ) | — | (96.4 | ) | (224.9 | ) | ||||||||||||||||||||||||||||
Common & Series A Preferred stock issued in acquisitions | — | 680,562 | — | 54.5 | 0.5 | — | — | — | 55.0 | |||||||||||||||||||||||||||||||
Operating Partnership units issued in acquisitions | 22.2 | — | — | 63.5 | — | — | — | 13.1 | 76.6 | |||||||||||||||||||||||||||||||
Stock-based compensation | — | 80,116 | — | 5.1 | — | — | — | 9.5 | 14.6 | |||||||||||||||||||||||||||||||
Other comprehensive income (loss) | (0.6 | ) | — | — | — | — | — | (66.1 | ) | (9.1 | ) | (75.2 | ) | |||||||||||||||||||||||||||
Expiration of redemption option | (2.0 | ) | — | — | — | — | — | — | 2.0 | 2.0 | ||||||||||||||||||||||||||||||
Noncontrolling interests acquired in business combinations | 308.3 | — | — | — | — | — | — | 6.2 | 6.2 | |||||||||||||||||||||||||||||||
Redemption of Operating Partnership units | — | — | — | (151.5 | ) | — | — | — | (124.4 | ) | (275.9 | ) | ||||||||||||||||||||||||||||
Redemption of units issued as stock compensation | — | — | — | (37.1 | ) | — | — | — | (2.5 | ) | (39.6 | ) | ||||||||||||||||||||||||||||
Accretion of redeemable noncontrolling interests | 23.9 | — | — | (23.9 | ) | — | — | — | — | (23.9 | ) | |||||||||||||||||||||||||||||
Net income (loss) | (1.1 | ) | — | — | — | — | (153.3 | ) | — | (22.1 | ) | (175.4 | ) | |||||||||||||||||||||||||||
Reallocation of noncontrolling interests | — | — | — | (249.0 | ) | — | — | 0.7 | 248.3 | — | ||||||||||||||||||||||||||||||
|
|
|
|
|
|
|
|
|
|
|
|
|
|
|
|
|
| |||||||||||||||||||||||
Balance as of December 31, 2021 | $ | 361.1 | 148,382,871 | $ | 1.5 | $ | 4,995.0 | $ | 0.6 | $ | (650.1 | ) | $ | 9.5 | $ | 576.0 | $ | 4,932.5 | ||||||||||||||||||||||
|
|
|
|
|
|
|
|
|
|
|
|
|
|
|
|
|
|
See accompanying notes to consolidated financial statements.
F-6
Table of Contents
LINEAGE, INC. AND SUBSIDIARIES
CONSOLIDATED STATEMENTS OF REDEEMABLE NONCONTROLLING INTERESTS AND EQUITY
(dollars in millions, except number of shares and par value amounts)
Common Stock | ||||||||||||||||||||||||||||||||||||||
Redeemable noncontrolling interests | Number of shares | Par value | Additional paid-in capital | Series A preferred stock | Retained earnings (accumulated deficit) | Accumulated other comprehensive income (loss) | Noncontrolling interests | Total equity | ||||||||||||||||||||||||||||||
Balance as of December 31, 2021 | $ | 361.1 | 148,382,871 | $ | 1.5 | $ | 4,995.0 | $ | 0.6 | $ | (650.1 | ) | $ | 9.5 | $ | 576.0 | $ | 4,932.5 | ||||||||||||||||||||
Common stock issuances, net of equity raise costs | — | 11,089,938 | 0.1 | 935.3 | — | — | — | — | 935.4 | |||||||||||||||||||||||||||||
Contributions from noncontrolling interests | — | — | — | 11.0 | — | — | — | 6.4 | 17.4 | |||||||||||||||||||||||||||||
Distributions | — | — | — | — | — | — | — | (42.5 | ) | (42.5 | ) | |||||||||||||||||||||||||||
Common stock issued in acquisitions | — | 771,878 | — | 69.5 | — | — | — | — | 69.5 | |||||||||||||||||||||||||||||
Operating Partnership units issued in acquisitions | 7.2 | — | — | 19.1 | — | — | — | 0.3 | 19.4 | |||||||||||||||||||||||||||||
Stock-based compensation | — | 93,425 | — | 8.9 | — | — | — | 7.9 | 16.8 | |||||||||||||||||||||||||||||
Other comprehensive income (loss) | (0.2 | ) | — | — | — | — | — | (46.3 | ) | (3.4 | ) | (49.7 | ) | |||||||||||||||||||||||||
Issuance of REIT subsidiary preferred shares | — | — | — | — | — | — | — | 0.1 | 0.1 | |||||||||||||||||||||||||||||
Preferred dividend/redemption | — | — | — | — | (0.1 | ) | — | — | (0.2 | ) | (0.3 | ) | ||||||||||||||||||||||||||
Common stock issued in exchange for redeemable noncontrolling interests | — | 111,611 | — | 10.0 | — | — | — | — | 10.0 | |||||||||||||||||||||||||||||
Purchase of redeemable noncontrolling interests | (10.1 | ) | — | — | (0.1 | ) | — | — | — | — | (0.1 | ) | ||||||||||||||||||||||||||
Partial redemption of convertible redeemable noncontrolling interests | (77.1 | ) | — | — | 21.4 | — | — | — | — | 21.4 | ||||||||||||||||||||||||||||
Redemption of common stock | — | (49,286 | ) | — | (4.4 | ) | — | — | — | — | (4.4 | ) | ||||||||||||||||||||||||||
Redemption of units issued as stock compensation | — | — | — | (23.4 | ) | — | — | — | (1.3 | ) | (24.7 | ) | ||||||||||||||||||||||||||
Redeemable noncontrolling interest adjustment | (18.2 | ) | — | — | 18.2 | — | — | — | — | 18.2 | ||||||||||||||||||||||||||||
Accretion of redeemable noncontrolling interests | 34.3 | — | — | (34.3 | ) | — | — | — | — | (34.3 | ) | |||||||||||||||||||||||||||
Net income (loss) | 0.8 | — | — | — | 0.1 | (62.7 | ) | — | (14.2 | ) | (76.8 | ) | ||||||||||||||||||||||||||
Reallocation of noncontrolling interests | — | — | — | (111.2 | ) | — | — | (0.6 | ) | 111.8 | — | |||||||||||||||||||||||||||
|
|
|
|
|
|
|
|
|
|
|
|
|
|
|
|
|
| |||||||||||||||||||||
Balance as of December 31, 2022 | $ | 297.8 | 160,400,437 | $ | 1.6 | $ | 5,915.0 | $ | 0.6 | $ | (712.8 | ) | $ | (37.4 | ) | $ | 640.9 | $ | 5,807.9 | |||||||||||||||||||
|
|
|
|
|
|
|
|
|
|
|
|
|
|
|
|
|
|
See accompanying notes to consolidated financial statements.
F-7
Table of Contents
LINEAGE, INC. AND SUBSIDIARIES
CONSOLIDATED STATEMENTS OF REDEEMABLE NONCONTROLLING INTERESTS AND EQUITY
(dollars in millions, except number of shares and par value amounts)
Common Stock | ||||||||||||||||||||||||||||||||||||||||
Redeemable noncontrolling interests | Number of shares | Par value | Additional paid-in capital | Series A preferred stock | Retained earnings (accumulated deficit) | Accumulated other comprehensive income (loss) | Noncontrolling interests | Total equity | ||||||||||||||||||||||||||||||||
Balance as of December 31, 2022 | $ | 297.8 | 160,400,437 | $ | 1.6 | $ | 5,915.0 | $ | 0.6 | $ | (712.8 | ) | $ | (37.4 | ) | $ | 640.9 | $ | 5,807.9 | |||||||||||||||||||||
Common stock issuances, net of equity raise costs | — | 1,581,167 | — | 142.3 | — | — | — | — | 142.3 | |||||||||||||||||||||||||||||||
Contributions from noncontrolling interests | — | — | — | 3.1 | — | — | — | 2.0 | 5.1 | |||||||||||||||||||||||||||||||
Dividends ($0.55 per common share) and other distributions | — | — | — | — | — | (88.4 | ) | — | (57.3 | ) | (145.7 | ) | ||||||||||||||||||||||||||||
Operating Partnership units issued in acquisitions | — | — | — | 4.3 | — | — | — | 2.1 | 6.4 | |||||||||||||||||||||||||||||||
Stock-based compensation | — | 167,148 | — | 14.5 | — | — | — | 10.8 | 25.3 | |||||||||||||||||||||||||||||||
Other comprehensive income (loss) | (0.1 | ) | — | — | — | — | — | 3.7 | (2.0 | ) | 1.7 | |||||||||||||||||||||||||||||
Issuance of REIT subsidiary preferred shares | — | — | — | — | — | — | — | 0.1 | 0.1 | |||||||||||||||||||||||||||||||
Preferred dividend/redemption | — | — | — | — | (0.1 | ) | — | — | — | (0.1 | ) | |||||||||||||||||||||||||||||
Sale of noncontrolling interests | — | — | — | — | — | — | — | (3.7 | ) | (3.7 | ) | |||||||||||||||||||||||||||||
Noncontrolling interests acquired in business combinations | 6.9 | — | — | — | — | — | — | — | — | |||||||||||||||||||||||||||||||
Redemption of common stock | — | (131,237 | ) | — | (12.4 | ) | — | — | — | — | (12.4 | ) | ||||||||||||||||||||||||||||
Redemption of units issued as stock compensation | — | — | — | (12.1 | ) | — | — | — | (0.5 | ) | (12.6 | ) | ||||||||||||||||||||||||||||
Redemption of noncontrolling interest | — | — | — | (0.9 | ) | — | — | — | (0.5 | ) | (1.4 | ) | ||||||||||||||||||||||||||||
Redeemable noncontrolling interest adjustment | 7.8 | — | — | (7.8 | ) | — | — | — | — | (7.8 | ) | |||||||||||||||||||||||||||||
Accretion of redeemable noncontrolling interests | 36.9 | — | — | (36.9 | ) | — | — | — | — | (36.9 | ) | |||||||||||||||||||||||||||||
Net income (loss) | (0.4 | ) | — | — | — | 0.1 | (77.4 | ) | — | (18.5 | ) | (95.8 | ) | |||||||||||||||||||||||||||
Reallocation of noncontrolling interests | — | — | — | (48.4 | ) | — | — | (0.1 | ) | 48.5 | — | |||||||||||||||||||||||||||||
|
|
|
|
|
|
|
|
|
|
|
|
|
|
|
|
|
| |||||||||||||||||||||||
Balance as of December 31, 2023 | $ | 348.9 | 162,017,515 | $ | 1.6 | $ | 5,960.7 | $ | 0.6 | $ | (878.6 | ) | $ | (33.8 | ) | $ | 621.9 | $ | 5,672.4 | |||||||||||||||||||||
|
|
|
|
|
|
|
|
|
|
|
|
|
|
|
|
|
|
See accompanying notes to consolidated financial statements.
F-8
Table of Contents
LINEAGE, INC. AND SUBSIDIARIES
CONSOLIDATED STATEMENTS OF CASH FLOWS
(dollars in millions)
Year Ended December 31, | ||||||||||||
2023 | 2022 | 2021 | ||||||||||
Cash flows from operating activities: | ||||||||||||
Net income (loss) | $ | (96.2 | ) | $ | (76.0 | ) | $ | (176.5 | ) | |||
Adjustments to reconcile net income (loss) to net cash provided by operating activities: | ||||||||||||
Provision for credit losses | 6.2 | 4.6 | 4.7 | |||||||||
Impairment of long-lived and intangible assets | 8.7 | 0.6 | 7.1 | |||||||||
Loss on sale of a subsidiary | 20.9 | — | — | |||||||||
Depreciation and amortization | 759.7 | 677.2 | 603.7 | |||||||||
Amortization of deferred financing costs and above/below market debt | 20.6 | 17.0 | 24.0 | |||||||||
Stock-based compensation | 25.3 | 16.8 | 14.6 | |||||||||
(Gain) loss on foreign currency transactions, net | (3.9 | ) | 23.8 | 34.0 | ||||||||
Deferred income tax | (58.1 | ) | (41.6 | ) | (69.0 | ) | ||||||
Other operating activities | 10.1 | 3.9 | 7.6 | |||||||||
Changes in operating assets and liabilities (excluding effects of acquisitions): | ||||||||||||
Accounts receivable | 42.7 | (155.5 | ) | (102.6 | ) | |||||||
Prepaid expenses, other assets, and other long-term liabilities | (11.5 | ) | (53.6 | ) | (42.8 | ) | ||||||
Inventories | 7.8 | (13.0 | ) | (13.6 | ) | |||||||
Accounts payable and accrued liabilities and deferred revenue | 50.9 | 84.1 | 38.5 | |||||||||
Right-of-use assets and lease liabilities | 11.9 | 12.6 | 0.2 | |||||||||
|
|
|
|
|
| |||||||
Net cash provided by operating activities | 795.1 | 500.9 | 329.9 | |||||||||
|
|
|
|
|
| |||||||
Cash flows from investing activities: | ||||||||||||
Business combinations, net of cash acquired | (269.6 | ) | (1,589.8 | ) | (2,459.5 | ) | ||||||
Real estate purchases | (13.1 | ) | (49.8 | ) | (217.6 | ) | ||||||
Deposits on pending acquisitions | 0.2 | 92.9 | (96.8 | ) | ||||||||
Purchase of property, plant, and equipment | (765.8 | ) | (812.9 | ) | (689.1 | ) | ||||||
Proceeds from sale of assets | 18.8 | 4.0 | 9.4 | |||||||||
Proceeds from the sale of Emergent Cold Peru S.A.C. | — | — | 45.4 | |||||||||
Other investing activity | (35.9 | ) | (13.2 | ) | (5.3 | ) | ||||||
|
|
|
|
|
| |||||||
Net cash used in investing activities | (1,065.4 | ) | (2,368.8 | ) | (3,413.5 | ) | ||||||
|
|
|
|
|
| |||||||
Cash flows from financing activities: | ||||||||||||
Capital contributions, net of equity raise costs | 141.8 | 942.0 | 2,122.6 | |||||||||
Contributions from noncontrolling interests | 3.0 | 2.2 | 236.9 | |||||||||
Distributions to stockholders | — | (122.1 | ) | (148.4 | ) | |||||||
Distributions to noncontrolling interests | (46.5 | ) | (57.6 | ) | (51.0 | ) | ||||||
Redemption of noncontrolling interests | (1.4 | ) | — | (275.9 | ) | |||||||
Partial redemption of convertible redeemable noncontrolling interests | — | (55.7 | ) | — | ||||||||
Deferred financing fees | (0.2 | ) | (8.8 | ) | (15.7 | ) | ||||||
Proceeds from long-term debt | — | 946.2 | 1,705.6 | |||||||||
Repayments of long-term debt and finance leases | (95.5 | ) | (103.0 | ) | (743.1 | ) | ||||||
Payment of deferred and contingent consideration liabilities | (35.6 | ) | (8.2 | ) | (0.7 | ) | ||||||
Borrowings on revolving line of credit | 1,430.7 | 2,465.1 | 2,572.0 | |||||||||
Repayments on revolving line of credit | (1,216.4 | ) | (2,152.0 | ) | (2,335.0 | ) | ||||||
Redemption of units issued as stock compensation | (12.4 | ) | (8.4 | ) | (39.6 | ) | ||||||
Redemption of common stock | (12.4 | ) | — | — | ||||||||
Other financing activity | (18.9 | ) | 0.5 | (0.3 | ) | |||||||
|
|
|
|
|
| |||||||
Net cash provided by financing activities | 136.2 | 1,840.2 | 3,027.4 | |||||||||
Impact of foreign exchange rates on cash, cash equivalents, and restricted cash | 2.9 | (10.4 | ) | (7.0 | ) | |||||||
|
|
|
|
|
| |||||||
Net increase (decrease) in cash, cash equivalents, and restricted cash | (131.2 | ) | (38.1 | ) | (63.2 | ) | ||||||
Cash, cash equivalents, and restricted cash at the beginning of the period | 202.0 | 240.1 | 303.3 | |||||||||
|
|
|
|
|
| |||||||
Cash, cash equivalents, and restricted cash at the end of the period | $ | 70.8 | $ | 202.0 | $ | 240.1 | ||||||
|
|
|
|
|
|
F-9
Table of Contents
LINEAGE, INC. AND SUBSIDIARIES
CONSOLIDATED STATEMENTS OF CASH FLOWS
(dollars in millions)
Year Ended December 31, | ||||||||||||
2023 | 2022 | 2021 | ||||||||||
Supplemental disclosures of cash flow information: | ||||||||||||
Cash paid for taxes | $ | 30.8 | $ | 74.2 | $ | 39.4 | ||||||
Cash paid for interest | $ | 594.1 | $ | 353.7 | $ | 224.6 | ||||||
Noncash activities: | ||||||||||||
Purchases of property, plant, and equipment in Accounts payable and accrued liabilities | $ | 104.4 | $ | 100.3 | $ | 33.7 | ||||||
Accrued distributions to stockholders | $ | 88.4 | $ | — | $ | 122.1 | ||||||
Accrued distributions to noncontrolling interests | $ | 21.4 | $ | 10.7 | $ | 25.6 | ||||||
Noncash distribution to noncontrolling interest | $ | — | $ | — | $ | 47.5 | ||||||
Debt assumed on acquisitions | $ | 2.8 | $ | 35.3 | $ | 23.6 | ||||||
Notes receivable assumed on acquisitions | $ | — | $ | — | $ | (0.8 | ) | |||||
Equity issued in acquisitions | $ | 6.4 | $ | 96.2 | $ | 452.4 | ||||||
Net deferred and contingent consideration on acquisitions | $ | 11.4 | $ | 30.4 | $ | 2.2 | ||||||
Equity issued in exchange for redeemable noncontrolling interests | $ | — | $ | 10.0 | $ | — | ||||||
Redemptions of stock-based compensation not yet paid in cash | $ | — | $ | 7.2 | $ | — | ||||||
Noncash capital contribution | $ | (0.5 | ) | $ | (6.6 | ) | $ | — | ||||
Noncash capital contribution from noncontrolling interests | $ | (2.1 | ) | $ | — | $ | (47.5 | ) |
See accompanying notes to consolidated financial statements.
F-10
Table of Contents
LINEAGE, INC. AND SUBSIDIARIES
Notes to Consolidated Financial Statements
(dollars in millions, except per share or per unit amounts)
Table of Contents for Notes to Consolidated Financial Statements
F-11
Table of Contents
LINEAGE, INC. AND SUBSIDIARIES
Notes to Consolidated Financial Statements
(dollars in millions, except number of shares, per share, or per unit amounts)
(1) | Significant accounting policies and practices |
(a) | Nature of operations |
Lineage, Inc. (formerly Lineage Growth Properties, Inc.) was organized in 2017 under Maryland law by an affiliate of Bay Grove Capital, LLC (“Bay Grove Capital”) and operates as a real estate investment trust (“REIT”) for United States (U.S.) federal income tax purposes. All outstanding common shares of Lineage, Inc. are held by BG Lineage Holdings, LLC, a Delaware limited liability company (formerly BG LLH, LLC) (“BGLH”). Lineage, Inc. is the managing member of Lineage OP, LLC (formerly BG LLH Intermediate, LLC) (“Lineage OP” or the “Operating Partnership”) and owns a controlling financial interest in Lineage OP. Lineage OP holds all direct interests in Lineage Logistics Holdings, LLC (“LLH”) other than the respective interests held by LLH MGMT Profits, LLC (“LLH MGMT”), LLH MGMT Profits II, LLC (“LLH MGMT II”), and BG Maverick, LLC (“BG Maverick”) as described below.
Lineage, Inc. together with its subsidiaries (individually or collectively as the context requires, the “Company”) is a global temperature-controlled warehouse REIT with a modern and strategically located network of temperature-controlled warehouses. The Company offers a broad range of essential warehousing services and integrated solutions for a variety of customers with complex requirements in the food supply chain. The Company’s primary business is temperature-controlled warehousing, and the Company owns and operates the majority of its facilities. The Company provides customers with storage space, as well as handling and other warehousing services. The Company may rent to a customer an entire warehouse, a set amount of reserved space in a warehouse for a set term, or non-exclusive space in a warehouse pursuant to a storage agreement. In addition, the Company operates several critical and value-add temperature-controlled business lines within its integrated solutions business, including, among others, transportation and refrigerated rail car leasing. LLH is the Company’s principal operating subsidiary. Bay Grove Management Company, LLC (“Bay Grove Management”), an affiliate of Bay Grove Capital, provides LLH operating support pursuant to an operating services agreement.
(b) | Basis of presentation and principles of consolidation |
The accompanying consolidated financial statements have been prepared in accordance with accounting principles generally accepted in the United States (“GAAP”). Certain prior period amounts have been reclassified to conform to current period presentation. The accompanying consolidated financial statements include the accounts of Lineage, Inc. consolidated with the accounts of all subsidiaries and affiliates in which the Company holds a controlling financial interest as of the financial statement date. Normally, a controlling financial interest reflects ownership of a majority of the voting interests. The Company consolidates a voting interest entity (“VOE”) in which it has a controlling financial interest and a variable interest entity (“VIE”) if it possesses both the power to direct the activities of the VIE that most significantly affects its economic performance, and (a) is obligated to absorb the losses that could be significant to the VIE or (b) holds the right to receive benefits from the VIE that could be significant to the VIE. As of December 31, 2022, the Company did not have any VIEs. During 2023, the Company invested less than $1.0 million in two special-purpose entities which constitute VIEs in which the Company is the primary beneficiary.
(c) | Use of estimates in preparation of financial statements |
The preparation of the Company’s consolidated financial statements in conformity with GAAP requires the Company to make estimates and assumptions that affect the reported amounts of assets and
F-12
Table of Contents
LINEAGE, INC. AND SUBSIDIARIES
Notes to Consolidated Financial Statements
(dollars in millions, except number of shares, per share, or per unit amounts)
liabilities and the disclosure of contingent assets and liabilities as of the financial statement date and the reported amounts of revenues and expenses during the period. The Company bases its estimates on various factors and information which may include, but are not limited to, history and prior experience, expected future results, new related events, and economic conditions which form the basis for making judgments about the carrying value of assets and liabilities that are not readily apparent from other sources. Actual results may differ from the estimates used in preparing the Company’s consolidated financial statements.
(d) | Cash and cash equivalents |
The Company considers all highly liquid investments with original maturity of three months or less at the time of purchase to be cash equivalents.
The Company maintains its cash balances in financial institutions, which at times may exceed federally insured limits. The Company has not experienced any losses and does not believe it is exposed to any significant credit risk related to cash and cash equivalents.
(e) | Restricted cash |
The Company has classified certain cash balances as restricted cash pursuant to workers’ compensation insurance policies and debt agreements. In June 2023, the Company converted the security for its main workers’ compensation insurance policy to a letter of credit structure. In exchange for issuing a letter of credit, the Company is no longer required to maintain a restricted cash balance under the policy, and $29.4 million of cash became unencumbered.
(f) | Accounts receivable and Notes receivable |
Accounts receivable are recorded at the invoiced amount and are stated net of estimated allowances for uncollectible balances. Notes receivable primarily consists of amounts that are due and payable related to various business transactions. The current portion of the notes receivable is recorded in Accounts receivable, net and the non-current portion is recorded in Other assets on the consolidated balance sheets. The current portion of notes receivable was $6.3 million and $1.6 million as of December 31, 2023 and 2022, respectively. The non-current portion of notes receivable was $20.4 million and $30.9 million as of December 31, 2023 and 2022, respectively.
Allowances for uncollectible balances are reserved based on expected credit losses. Management exercises judgement in establishing these allowances and considers the balance outstanding and payment history. The Company writes off receivables against the allowances after all reasonable collection efforts are exhausted. The Company’s allowance for accounts receivable was $7.1 million and $8.8 million at December 31, 2023 and 2022, respectively.
(g) | Derivatives |
The Company enters into derivative financial instruments, such as interest rate swaps and caps to manage interest rate exposures. The Company’s derivative instruments include instruments that qualify and instruments that do not qualify for cash flow hedge accounting treatment. To qualify for hedge accounting, the hedging relationship, both at inception of the hedge and on an ongoing basis, must be expected to be highly effective at offsetting the variability in hedged cash flows attributable to the hedged risk (e.g., a variable interest rate index).
F-13
Table of Contents
LINEAGE, INC. AND SUBSIDIARIES
Notes to Consolidated Financial Statements
(dollars in millions, except number of shares, per share, or per unit amounts)
Certain of the Company’s foreign operations expose the Company to fluctuations of exchange rates. These fluctuations may impact the value of the Company’s cash receipts and payments in terms of the Company’s functional currency. The Company enters into foreign currency derivative instruments to manage its exposure to fluctuations in exchange rates between the functional currencies of the Company’s subsidiaries and the currencies of the underlying cash flows.
All derivatives are recognized on the consolidated balance sheets at fair value and are generally reported gross, regardless of netting arrangements. For derivatives that qualify for hedge accounting, on the date the derivative contract is entered into, the Company designates the derivative as a hedge of the variability of cash flows attributable to a designated hedged risk (e.g., interest rate or foreign exchange risk).
For derivatives designated as qualifying cash flow hedges, the gain or loss on the derivative and corresponding tax impact is recorded in Accumulated other comprehensive income (loss) and subsequently reclassified into earnings in the same period during which the hedged transaction affects earnings and within the same income statement line item as the earnings effect of the hedged item. Gains and losses on hedge components excluded from the assessment of effectiveness are recognized over the life of the hedge on a systematic and rational basis and are recorded in the same income statement line item as the hedged item.
Derivatives not designated as accounting hedges are not speculative and are used to manage the Company’s exposure to interest rate movements and other identified risks but do not meet the hedge accounting requirements or the Company has not elected to apply hedge accounting. Changes in the fair value of derivatives not designated in hedging relationships are recorded directly in earnings and presented within Interest expense, net and Gain (loss) on foreign currency transactions, net.
The fair value of the interest rate swaps and caps and foreign currency forward contracts are estimated at an amount the Company would receive or pay to terminate the agreement at the balance sheet date, taking into consideration current interest rates, foreign exchange rates, and creditworthiness of the counterparty.
(h) | Inventories |
Inventories consist of manufactured goods and goods acquired for resale, which are stated at the lower of cost (determined on a first in, first out basis) or net realizable value.
(i) | Property, plant, and equipment, net |
The Company records additions to property, plant, and equipment used in operations at cost, which includes asset additions, improvements, and betterments. With respect to constructed assets, all materials, direct labor, and contract services are capitalized.
Normal repairs and maintenance and other costs that do not improve the property, extend the useful life or otherwise do not meet capitalization criteria are expensed as incurred.
The Company capitalizes certain costs related to the development of internal-use software projects. Costs related to preliminary project activities and post-implementation activities are expensed as incurred and certain costs related to the application development stage are capitalized.
The Company depreciates property, plant, and equipment to estimated salvage value primarily using the straight-line method over estimated useful lives.
F-14
Table of Contents
LINEAGE, INC. AND SUBSIDIARIES
Notes to Consolidated Financial Statements
(dollars in millions, except number of shares, per share, or per unit amounts)
The Company evaluates property, plant, and equipment for impairment when events or changes in circumstances indicate that the carrying value of such assets may not be recoverable or when the assets are held for sale. Upon the occurrence of a triggering event, the Company assesses whether the estimated undiscounted cash flows expected from the use of the asset and the residual value from the ultimate disposal of the asset exceed the carrying value. If the carrying value exceeds the estimated recoverable amounts, the Company reduces the carrying value to fair value and records an impairment loss in earnings.
(j) | Goodwill and other intangible assets |
Goodwill is recorded to the extent that the purchase price of an acquisition exceeds the fair value of the identifiable net assets acquired and is tested for impairment on an annual basis. Interim testing is performed more frequently if events or circumstances indicate that it is more-likely-than-not that a reporting unit’s fair value is below its carrying value.
The Company evaluates the carrying value of goodwill each year as of October 1 by performing a qualitative assessment of various factors to determine whether the existence of events or circumstances leads to a determination that it is more-likely-than-not that the fair value of the reporting unit is less than its carrying value. If, after assessing the totality of events or circumstances, or based on management’s judgment, the Company determines it is more likely than not the fair value is less than its carrying amount, a quantitative assessment is performed. The quantitative assessment includes estimation of the fair value of each reporting unit, using a combination of discounted cash flow method and the market approach based on market multiples. The estimated fair value is then compared to the reporting unit’s carrying amount. If the carrying amount is greater than the fair value, an impairment loss is recognized in an amount equal to the excess of carrying value over fair value.
Intangible assets with definite lives and indefinite lives are reviewed for impairment when events or changes in circumstances indicate that the carrying amount may not be recoverable. Indefinite lived intangible assets are tested at least annually. The Company amortizes intangible assets with definite lives in a pattern that reflects the expected consumption of related economic benefits or on a straight-line basis over the estimated economic lives.
(k) | Business combinations |
The Company accounts for its business combinations using the acquisition method of accounting, which requires allocation of the fair value of purchase consideration to the tangible and intangible assets acquired and liabilities assumed at their estimated fair values on the acquisition date. The excess of the fair value of purchase price consideration over the values of these identifiable assets and liabilities is recorded as goodwill.
When determining the fair values of assets acquired and liabilities assumed, management makes significant estimates and assumptions, especially with respect to real estate and intangible assets. Significant estimates used in valuing land and buildings and improvements acquired in a business combination include, but are not limited to, the selection of comparable real estate sales, estimates of indirect costs and entrepreneurial profit, which are added to the replacement cost of the acquired assets in order to estimate their fair market value. Significant estimates used in valuing intangible assets acquired in a business combination include, but are not limited to, revenue growth rates, obsolescence, customer attrition rates, operating costs and margins, capital expenditures, tax rates, long-term growth rates and discount rates. During the measurement period, not to exceed one year from the date of acquisition, the Company may record adjustments to the assets acquired and liabilities assumed, with a
F-15
Table of Contents
LINEAGE, INC. AND SUBSIDIARIES
Notes to Consolidated Financial Statements
(dollars in millions, except number of shares, per share, or per unit amounts)
corresponding offset to goodwill if new information is obtained related to facts and circumstances that existed as of the acquisition date. After the measurement period, any subsequent adjustments are reflected in the consolidated statements of operations and comprehensive income (loss). Refer to Note 4, Business combinations, asset acquisitions, and divestitures for further detail.
(l) | Asset acquisitions |
Asset acquisitions involve the acquisition of an asset, or a group of assets, and may also involve the assumption of liabilities associated with an acquisition that does not meet the GAAP definition of a business. Asset acquisitions are accounted for by the Company using a cost accumulation model. Under the cost accumulation model, the cost of the acquisition, including certain transaction costs, is allocated to the assets acquired on the basis of relative fair values. If the Company previously leased the purchased asset, the difference between the right-of-use (“ROU”) asset and ROU liability at the purchase date adjusts the final amount capitalized.
(m) | Investments in partially owned entities |
The Company accounts for its investments in partially owned entities where the Company does not have a controlling interest but has significant influence using the equity method of accounting, under which the net income of the entity is recognized in income and presented in Equity method investments within the consolidated balance sheets. Allocations of profits and losses are made per the terms of the organizational documents.
The Company has interests in partially owned entities where the Company does not have a controlling interest or significant influence. These investments do not have readily determinable fair values, and the Company has elected the measurement alternative to measure these investments at cost less impairment, adjusted by observable price changes, with any fair value changes recognized in earnings. Refer to Note 12, Fair value measurements, for additional information. As of December 31, 2023 and 2022, the carrying amount of these investments was $29.8 million and $25.8 million, respectively, and is presented in Other assets within the consolidated balance sheets.
(n) | Leases |
The Company determines if an arrangement is or contains a lease at contract inception. For all leases where initial term is greater than 12 months and the Company is the lessee, the Company recognizes as of the lease commencement date a liability and a corresponding ROU asset on the consolidated balance sheets. Leases with terms of 12 months or less (“short-term leases”) are not recognized in the consolidated balance sheets and the lease payments are recognized in the consolidated statements of operations and comprehensive income (loss) on a straight-line basis over the lease term.
Lease liabilities are recognized based on the present value of the remaining future minimum lease payments over the lease term. The Company has lease agreements with lease and non-lease components, which generally relate to taxes and common area maintenance. For all classes of assets, the Company accounts for the lease and non-lease components as a single lease component for both lessee and lessor leases. As most of the Company’s leases do not provide an implicit rate, the Company uses its incremental borrowing rate based upon information available at the commencement date to determine the present value of future minimum lease payments. The corresponding lease ROU assets are recognized at an amount equal to the future minimum lease payments, as adjusted for prepayments, incentives, and initial direct costs. For leases acquired in a business combination, the lease ROU assets are also adjusted for any off-market (favorable or unfavorable) terms.
F-16
Table of Contents
LINEAGE, INC. AND SUBSIDIARIES
Notes to Consolidated Financial Statements
(dollars in millions, except number of shares, per share, or per unit amounts)
The lease term used to calculate the lease liability includes options to extend or terminate the lease when it is reasonably certain that the Company will exercise that option. Variable lease payments are recognized in the period in which those payments are incurred.
For both operating and finance leases, the lease liability is amortized using the effective interest method. In each period, the liability is increased to reflect the interest that is accrued on the related liability, offset by a decrease in the liability resulting from the periodic lease payments. For finance leases, the ROU asset is amortized and recorded within Amortization expense on the consolidated statements of operations and comprehensive income (loss). For operating leases, the ROU asset is amortized and recorded within Cost of operations or General and administrative expense on the consolidated statements of operations and comprehensive income (loss), depending on the nature of the ROU asset.
For all leases where the Company is the lessor, the Company evaluates the contract for classification as a sales-type, direct financing, or operating lease. The Company does not have any material sales-type leases. The Company has lessor arrangements with lease and non-lease components. Where the lease is determined to be the predominant component, the Company combines non-lease components that share the same pattern of transfer as the lease component (e.g., common area maintenance, utilities, storage services) and the combined component is accounted for under Accounting Standards Codification (“ASC”) 842, Leases. Certain contracts may also include non-lease components that are more variable in nature and do not share the same pattern of transfer as the lease component (e.g., handling and other accessorial service), and these non-lease components are accounted for under ASC 606, Revenue from Contracts with Customers. For operating leases, the Company assesses the probability of payment collection at commencement of the lease contract and subsequently recognizes lease income over the lease term on a straight-line basis. Changes in variable payments based on an index or rate are recorded in earnings in the period in which they become effective.
Property, plant, and equipment underlying lessor leases is included in Property, plant, and equipment, net on the accompanying consolidated balance sheets. The gross value and net value of these assets was $1,842.7 million and $1,635.9 million, respectively, as of December 31, 2023. The gross value and net value of these assets was $1,629.3 million and $1,489.3 million, respectively, as of December 31, 2022. Depreciation expense for such assets was $57.1 million, $50.8 million and $39.9 million for the years ended December 31, 2023, 2022, and 2021, respectively.
(o) | Deferred financing costs |
Deferred financing costs consist of loan fees and other financing costs related to the Company’s outstanding indebtedness and credit facility commitments and are amortized to interest expense over the terms of the related debt or commitment on a straight-line basis, which approximates effective interest amortization. If a loan is refinanced or paid before its maturity, any unamortized deferred financing costs will generally be expensed unless specific rules are met that would allow for the carryover of such costs to the refinanced debt.
Deferred financing costs related to the Company’s outstanding debt are included in the Company’s consolidated balance sheets as a contra-liability within Long-term debt, net and deferred financing costs related to the Company’s revolving credit facility are recorded within Other assets (see Note 10, Debt).
(p) | Income tax status |
The Company elected to be taxed as a REIT under Section 856(c) of the Internal Revenue Code, commencing with its taxable year ended December 31, 2020. As a REIT, the Company is generally not
F-17
Table of Contents
LINEAGE, INC. AND SUBSIDIARIES
Notes to Consolidated Financial Statements
(dollars in millions, except number of shares, per share, or per unit amounts)
subject to federal income tax if the Company distributes at least 100% of its REIT taxable income as a dividend to its stockholders each year. If the Company fails to qualify as a REIT in any taxable year and is unable to obtain relief under certain statutory provisions, it will be subject to federal income tax on its taxable income at regular corporate rates and may not be able to qualify as a REIT for the four subsequent taxable years. Even as a REIT, the Company may also be subject to certain state and local income taxes, franchise taxes, or federal income and excise taxes on undistributed taxable income or on recognized built-in gains. The Company is subject to income taxes for certain U.S. subsidiaries which have elected to be taxed as taxable REIT subsidiaries (“TRSs”). Additionally, the Company has non-U.S. subsidiaries that are subject to income taxes in the foreign jurisdictions in which they operate. As such, a provision for income taxes relating to the TRSs and the non-U.S. subsidiaries has been made in the consolidated financial statements, as described below.
Income taxes are accounted for under the asset and liability method. Deferred tax assets and liabilities are recognized for the future tax consequences attributable to differences between the financial statement carrying amounts of existing assets and liabilities and their respective tax bases and operating loss and tax credit carryforwards. Deferred tax assets and liabilities are measured using enacted tax rates expected to apply to taxable income in the years in which those temporary differences are expected to be recovered or settled. The effect on deferred tax assets and liabilities of a change in tax rates is recognized in earnings in the period that includes the enactment date. Deferred tax assets are reduced by a valuation allowance when, in the opinion of management, it is more likely than not some portion or all of the deferred tax asset will not be realized.
The Company evaluates tax positions taken or expected to be taken in the course of preparing the Company’s consolidated financial statements to determine whether the tax positions are “more likely than not” to be sustained by the applicable tax authority. A liability is accrued for tax positions taken on a tax return that are not deemed to meet the “more likely than not” threshold in the year the tax position is taken. Recognized income tax positions are measured at the largest amount that is greater than 50% likely of being realized. The Company has elected an accounting policy to classify interest and penalties, if any, as income tax expense.
Common stock distributions paid by the Company to BGLH are characterized for U.S. federal income tax purposes as ordinary income, qualified dividend, capital gains, non-taxable returns of capital, or a combination thereof. Common stock distributions that exceed the Company’s current and accumulated earnings and profits (calculated for tax purposes) constitute a return of capital rather than a dividend and generally reduce the basis that BGLH has in the common stock. During each year, the Company notifies BGLH of the taxability of the common stock distributions paid during the preceding year. The payment of common stock distributions is dependent upon the Company’s financial condition, operating results, and REIT distribution requirements. The composition of the Company’s distributions per common share for each tax year presented is as follows, where tax year 2023 distributions are based on an estimate:
2023 | 2022 | 2021 | ||||||||||
Ordinary income | 92 | % | 57 | % | — | % | ||||||
Qualified dividend | 8 | % | 5 | % | 100 | % | ||||||
Capital gain distribution | — | % | 21 | % | — | % | ||||||
Return of capital | — | % | 17 | % | — | % | ||||||
|
|
|
|
|
| |||||||
100 | % | 100 | % | 100 | % | |||||||
|
|
|
|
|
|
F-18
Table of Contents
LINEAGE, INC. AND SUBSIDIARIES
Notes to Consolidated Financial Statements
(dollars in millions, except number of shares, per share, or per unit amounts)
(q) | Segment reporting |
The Company’s business is organized into two reportable segments, which are the same as the Company’s operating segments: Global Warehousing and Global Integrated Solutions. These segments are strategic business groups containing differing service offerings, which are managed separately. The accounting polices used in the preparation of the Company’s reportable segments financial information are the same as those described in this Note.
• | Global Warehousing – This segment utilizes the Company’s industrial real estate properties to provide temperature-controlled warehousing services to its customers. Revenues in this segment are generated from storage services and related activities, such as handling, case-picking, order assembly, load consolidation, quality control, re-packaging, and other such value-add services. Cost of operations in this segment primarily consists of labor, power, other facilities costs, and other servicing costs. |
• | Global Integrated Solutions – This segment complements Global Warehousing with specialized cold-chain services. Revenues in this segment are generated primarily from transportation fees, and additionally include redistribution services, multi-vendor less-than-full-truckload consolidation, transportation brokerage, drayage services to and from ports, freight forwarding, rail transportation services, sales of prepared food, and e-commerce fulfillment services. Cost of operations in this segment primarily consists of third-party carrier charges, labor, fuel, and rail and vehicle maintenance. |
The Company’s chief operating decision maker uses revenues and segment net operating income (NOI) to evaluate segment performance. NOI is calculated as a segment’s revenues less its cost of operations. NOI is not a measurement of financial performance under GAAP and may not be comparable to similarly titled measures of other companies.
(r) | Revenue recognition |
The Company has warehousing operations, which includes storage, ancillary services required to prepare and move customers’ pallets into, out of, and around the facilities, managed services, and other contract revenues. The Company receives variable consideration for the services rendered, comprised of per-unit pricing or time and materials pricing. Separate performance obligations arise for storage services, handling, case-picking, order assembly and load consolidation, quality control, re-packaging, government-approved storage and inspection, and other ancillary services. The Company’s performance obligations for these are satisfied over time as customers simultaneously receive and consume the benefits of the services. Some customer contracts contain a promise to provide a minimum commitment of warehousing services during a defined period. When the minimum volume commitment is substantive, the minimum commitment amount is deemed fixed consideration to be included in the transaction price. Any variable consideration related to storage renewals or incremental handling charges above stated minimums are allocated to the period in which services are performed. The Company charges its customers “inbound” and “outbound” product handling fees, which are billed upfront upon receipt of product from customers. Deferred revenue represent billings for storage services invoiced in advance, and the outbound portion of product handling fees related to customer product inventory on hand as of period end, as the Company has not yet fulfilled the promise to provide such storage and outbound product handling services.
The Company provides managed services, included in Global Warehousing, for which the contract compensation arrangement includes reimbursement of operating costs plus a fixed management fee. The Company also charges customers a revenue share fee, which is a form of variable consideration as
F-19
Table of Contents
LINEAGE, INC. AND SUBSIDIARIES
Notes to Consolidated Financial Statements
(dollars in millions, except number of shares, per share, or per unit amounts)
a percentage of gross revenue generated from warehouse management. This revenue share is included in the transaction price, and the Company’s practice is to record the revenue share expected to be earned over the service period using historical data. The Company charges the customer for the fixed management fee and the revenue share on a monthly basis and accepts payment according to approved payment terms. The general warehouse managed services are the only performance obligation in these contracts, and the Company provides the services over the term of the contract. This single performance obligation represents a series of distinct services performed during the contract period, as the services provided are substantially the same and have the same pattern of transfer to the Company’s customers. Managed services revenues are recognized over time as the services are performed. Such fees and related cost reimbursements are presented on a gross basis, as the Company is the principal in the arrangement.
The Company’s revenue also includes warehouse lease revenue earned under operating lease agreements with customers, which is recognized on a straight-line basis over the term of the leases. Variable lease payments are recognized in the period in which those payments are incurred.
The Company provides integrated solutions that include transportation services, which includes full-load transportation, load-to-load consolidation, freight forwarding, and other accessorial services. The Company receives consideration for the services rendered, comprised of per-route pricing by load, pallet, or case. A performance obligation is created when a customer submits a purchase order for the transport of goods and is satisfied upon completion of the delivery. Transportation revenue is recognized proportionally over time as a shipment moves from origin to destination, and related reimbursable costs are recognized as incurred. Payments for billed services are remitted according to approved payment terms. In addition, this revenue includes lease revenue for the Company’s insulated and refrigerated rail cars which is recognized on a straight-line basis over the lease agreement.
The Company has redistribution operations, where it redistributes certain food products under contracts with fixed mark-up fees. The Company receives consideration for the services rendered, comprised of per-pound pricing for the product procured and redistributed and a variable freight rate that represents costs passed on to the customer for amounts incurred to arrange for or transport the product. These operations for redistribution of products are each considered performance obligations to provide such services. A performance obligation is created when a customer submits a purchase order for the purchase of goods. Revenue is recognized at a point in time, when the performance obligation is satisfied, upon delivery of product. Payments for billed services are remitted according to approved payment terms. The customers’ ability to control the pricing, where products can be distributed to, and where products can be purchased from do not suggest that the Company is serving as a principal in the arrangement. The Company’s policy is to report revenue from redistribution operations net of the related cost of sales, as the Company is acting as an agent on behalf of its customers.
The Company generates revenues from the sale of frozen foods, where it procures and sells prepared and frozen food product to certain customers. A performance obligation is created when a customer submits a purchase order for the purchase of goods. Revenue is recognized at a point in time, when the performance obligation is satisfied, upon delivery of product.
The Company provides e-commerce fulfillment services, which is encompassing of storage, packaging, and transportation and delivery to end consumers. A performance obligation is created when a customer submits a purchase order for distribution of their goods to the end consumer. The Company generally does not have ownership of the product being distributed, as such, it is not part of the Company’s inventory balance. E-commerce revenue is recognized at a point in time, when the performance obligation is satisfied, typically upon shipping of product.
F-20
Table of Contents
LINEAGE, INC. AND SUBSIDIARIES
Notes to Consolidated Financial Statements
(dollars in millions, except number of shares, per share, or per unit amounts)
Sales and other consumption taxes the Company collects from customers and remits to government agencies are excluded from revenue.
For the years ended December 31, 2023 and 2022, no individual customer accounted for over 10.0% of total revenue.
The difference in timing of revenue recognition, billings, and cash collections results in accounts receivable, unbilled receivables, and deferred revenue balances. Generally, the customer is billed no less frequently than on a monthly basis. However, the Company may bill and receive advances or deposits from customers, particularly on storage and handling services, before revenue is recognized, resulting in deferred revenue. These assets and liabilities are reported on the consolidated balance sheets at the end of each reporting period in Accounts receivable, net and Deferred revenue.
Refer to Note 3, Revenue for additional information.
(s) | Acquisition, transaction, and other expense |
Acquisition, transaction, and other expense includes costs associated with business transactions, whether consummated or not, such as advisory, legal, accounting, valuation, other professional or consulting fees, integration costs, and costs related to public company readiness efforts. These costs are expensed as incurred. It also includes employee-related expenses associated with acquisitions, such as acquisition-related severance and consulting agreements and the Lineage Equity-Tracking Plan discussed in Note 16, Stock-based compensation.
(t) | Restructuring and impairment expense |
Restructuring and impairment expense includes certain contractual and negotiated severance and separation costs from exited former executives, costs relating to reductions in headcount to achieve operational efficiencies, and costs associated with exiting non-strategic operations. The Company records such costs when there is a substantive plan for employee severance or employees are otherwise entitled to benefits (e.g. in case of one-time terminations) and related costs are probable and estimable. It also includes gains (losses) on dispositions of property, plant, and equipment and impairments of long-lived assets.
(u) | Foreign currency |
The accounts of the Company’s foreign subsidiaries are measured using functional currencies other than the U.S. dollar (“USD”). Revenues and expenses of these subsidiaries are translated into USD at the average exchange rate for the period and assets and liabilities are translated at the exchange rate as of the end of the reporting period. Gains or losses from translating the financial statements of these subsidiaries are included in stockholders’ equity as a component of Accumulated other comprehensive income (loss).
(v) | Accrued distributions |
In order to maintain its qualification as a REIT, Lineage, Inc. must meet certain distribution requirements through a dividend declared to its stockholders. Although not formally declared, when Lineage, Inc. pays its required dividend to its stockholders, Lineage OP also pays a corresponding pro-rata distribution to all its investors. The Company has elected an accounting policy to accrue a distribution payable to the investors in Lineage OP other than Lineage, Inc. (“Non-Company LPs”) at the same time that Lineage, Inc. declares and accrues a dividend to its stockholders. Lineage OP is also
F-21
Table of Contents
LINEAGE, INC. AND SUBSIDIARIES
Notes to Consolidated Financial Statements
(dollars in millions, except number of shares, per share, or per unit amounts)
required by its operating agreement to pay a quarterly distribution to BG Cold, LLC (“BG Cold”, formerly known as BG Cold Promote, LLC).
Refer to Note 17, Related-party balances for additional information.
(w) | Commitments and contingencies |
Liabilities for loss contingencies arising from claims, assessments, litigation, fines, and penalties and other sources are recorded when it is probable that a liability has been incurred and the amount can be reasonably estimated. Legal costs incurred in connection with loss contingencies are expensed as incurred. Refer to Note 18, Commitments and contingencies for additional information.
(x) | Recently issued accounting pronouncements adopted |
Effective January 1, 2023, the Company adopted Accounting Standards Update (“ASU”) 2022-04, Liabilities—Supplier Finance Programs (Subtopic 405-50): Disclosure of Supplier Finance Program Obligations. The amendments in this ASU require that a buyer in a supplier finance program disclose certain key information related to its supplier finance programs, including the key terms of the program, such as payment terms, assets pledged as security, and outstanding balances as of the end of each reporting period. The Company’s obligations under supplier finance programs, as defined by the standard, are currently not material for disclosure.
(y) | Recently issued accounting pronouncements not yet adopted |
In June 2022, the Financial Accounting Standards Board (“FASB”) issued ASU 2022-03, Fair Value Measurement (Topic 820): Fair Value Measurement of Equity Securities Subject to Contractual Sale Restrictions. The amendments in this ASU clarify that a contractual restriction on sale of an equity security is not considered part of the unit of account of the equity security and, therefore, is not considered in measuring fair value. The amendments also clarify that an entity cannot, as a separate unit of account, recognize and measure a contractual sale restriction. The ASU also requires additional disclosures surrounding equity securities subject to contractual sale restrictions. This ASU is effective for fiscal years beginning after December 15, 2023. The Company does not expect this ASU to have a material impact on its consolidated financial statements.
In November 2023, the FASB issued ASU 2023-07, Segment Reporting (Topic 280): Improvements to Reportable Segment Disclosures. The amendments in this ASU require that an entity disclose significant segment expenses that are regularly provided to the chief operating decision maker (“CODM”) and included within each reported measure of segment profit or loss, disclose an amount for other segment items by reportable segment and a description of the amount’s composition, and provide all annual disclosures about a reportable segment’s profit or loss and assets currently required by ASC 280, Segment Reporting, in interim periods. Additionally, the amendments clarify that if the CODM uses multiple measures of a segment’s profit or loss in assessing segment performance and making resource allocation decisions, an entity may disclose these measures. The amendments also require that an entity disclose the title and position of the CODM with an explanation of how the CODM uses the reported measure(s) of segment profit or loss in assessing segment performance and making resource allocation decisions and requires that an entity with a single reportable segment provide all disclosures required by ASC 280. This ASU is effective for fiscal years beginning after December 15, 2023 and interim periods beginning after December 15, 2024. The Company is still evaluating the impact this guidance will have on its consolidated financial statements.
F-22
Table of Contents
LINEAGE, INC. AND SUBSIDIARIES
Notes to Consolidated Financial Statements
(dollars in millions, except number of shares, per share, or per unit amounts)
In December 2023, the FASB issued ASU 2023-09, Income Taxes (Topic 740): Improvements to Income Tax Disclosures. This ASU amends existing income tax disclosure guidance, primarily requiring more detailed disclosure for income taxes paid and the effective tax rate reconciliation. This ASU is effective for fiscal years beginning after December 15, 2024. The Company is still evaluating the impact this guidance will have on its consolidated financial statements.
(2) | Capital structure and noncontrolling interests |
Lineage, Inc. capital structure
(a) | Common Stock |
Lineage, Inc. is authorized to issue up to 500.0 million common shares. As of December 31, 2023, 2022, and 2021, there were 162.0 million, 160.4 million, and 148.4 million common shares issued and outstanding, respectively. BGLH holds all common shares of Lineage, Inc.
During 2023 and 2022, Lineage, Inc. repurchased shares of its common stock as authorized by its Board of Directors. Any repurchased shares are constructively retired and returned to an unissued status. The following table provides the number of shares repurchased, average price paid per share, and total amount paid for share repurchases for the years ended December 31, 2023 and 2022:
2023 | 2022 | |||||||
Total number of shares repurchased | 131,237 | 49,286 | ||||||
Average price paid per share | $ | 94.24 | $ | 90.00 | ||||
Total consideration paid for share repurchases | $ | 12.4 | $ | 4.4 |
(b) | Series A Preferred Stock |
Lineage, Inc. is authorized to issue up to 100.0 million shares of Series A Cumulative Non-Voting Preferred Stock of Lineage, Inc. (“Series A Preferred Stock”). Shares of Series A Preferred Stock have a $1,000 liquidation preference and a cumulative 12.0% per annum dividend preference. The Series A Preferred Stockholders have limited voting rights with respect to matters pertaining to the Series A Preferred Stock and no voting rights on matters submitted to the common stockholders of Lineage, Inc. for a vote. Additionally, the Series A Preferred Stock may be redeemed at Lineage, Inc.’s option for consideration equal to $1,000 per share plus all accrued and unpaid dividends thereon to and including the date fixed for redemption and are not convertible or exchangeable for any other property or securities of Lineage, Inc. As of December 31, 2023, 2022, and 2021, there were 630 shares of Series A Preferred Stock issued and outstanding. Of these, 505 shares were held by BGLH.
Operating Partnership capital structure
The Operating Partnership has three classes of equity: Class A, Class B, and Class C units. A summary of these ownership interests as of December 31, 2023, 2022, and 2021 is as follows:
2023 | 2022 | 2021 | ||||||||||
Class A units owned by Lineage, Inc. | 162,017,515 | 160,400,437 | 148,382,871 | |||||||||
Class A & B units owned by Non-Company LPs | 18,829,959 | 18,718,816 | 18,506,807 | |||||||||
Redeemable Class A units owned by Non-Company LPs | 1,260,182 | 1,260,182 | 941,176 | |||||||||
|
|
|
|
|
| |||||||
Total | 182,107,656 | 180,379,435 | 167,830,854 | |||||||||
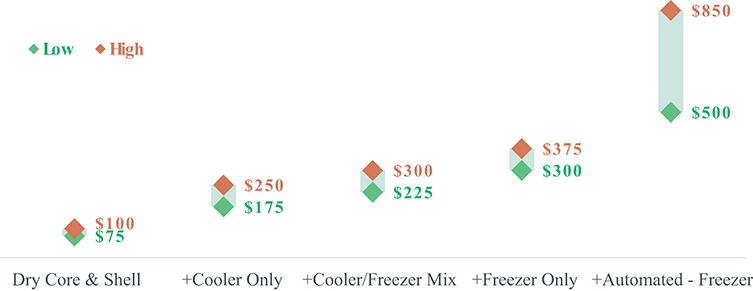
|
|
|
|
|
|
F-23
Table of Contents
LINEAGE, INC. AND SUBSIDIARIES
Notes to Consolidated Financial Statements
(dollars in millions, except number of shares, per share, or per unit amounts)
Class C units are excluded from the above summary because their only claim on the underlying assets of the Operating Partnership is the distribution described below.
Noncontrolling interest in the Operating Partnership relates to the interest in the Operating Partnership owned by Non-Company LPs.
(c) | Noncontrolling Interest in Operating Partnership—Class A, Class B, and Class C |
As of December 31, 2023, 2022, and 2021 Non-Company LPs owned 10.3%, 10.4%, and 11.0% of the outstanding Class A and Class B units of the Operating Partnership, respectively, other than the redeemable Operating Partnership units described below. Class A and Class B units are both voting capital interests in the Operating Partnership and are similar to each other in all material respects except that Class A units held by Non-Company LPs bear a Founders Equity Share (as described below) payable to Class C unit holders, whereas Class B units do not.
BG Cold, an affiliate of Bay Grove Management, holds all outstanding Class C units of the Operating Partnership. Class C units provide BG Cold the right to receive a percentage distribution (“Founders Equity Share”) upon certain distributions made to Non-Company LPs who hold Class A units of the Operating Partnership. Class C units also receive a distribution upon certain repurchases and redemptions of Class A units of the Operating Partnership held by Non-Company LPs. The calculation of the Founders Equity Share borne by Class A units in the Operating Partnership held by Non-Company LPs varies depending on the sub-class of Class A units but generally amounts to a percentage of all value appreciation over certain thresholds. On a quarterly basis, BG Cold also receives an advance distribution (“Advance Distribution”) against its future Founders Equity Share based on a formulaic amount of all capital contributed to the Operating Partnership after August 3, 2020. This Advance Distribution is an advance on the Class C Founders Equity Share to be paid upon the sale, redemption, or liquidation of, or other distributions to, Class A units and would offset subsequent Class C unit Founders Equity Share distributions paid in conjunction with a hypothetical sale, redemption, liquidation, or other distribution.
During the years ended December 31, 2023, 2022, and 2021, BG Cold received a total of $45.7 million, $40.8 million, and $31.1 million in total Advance Distributions, respectively. During the year ended December 31, 2021, BG Cold also received distributions totaling $46.5 million related to redemptions of Class A units of the Operating Partnership. This amount was immediately reinvested back into Class B units of the Operating Partnership by BG Cold’s shareholders, and the reinvestment is included within Contributions from noncontrolling interests in the accompanying consolidated statements of redeemable noncontrolling interests and equity. There were no redemptions of Class A units of the Operating Partnership during the years ended December 31, 2023 or 2022.
The Company accounts for Class A, Class B, and Class C units held by Non-Company LPs and BG Cold based on their relative ownership percentage of the Operating Partnership. Each time the ownership percentage of the Operating Partnership held by Non-Company LPs and BG Cold changes, the Company records an adjustment to Noncontrolling interests with a corresponding adjustment in Additional paid-in capital to appropriately reflect the new ownership percentage and to reflect the Non-Company LPs’ and BG Cold’s share of all capital contributed to the Operating Partnership. All activity related to Class A, Class B, and Class C units is included within Noncontrolling interests in the accompanying consolidated balance sheets and consolidated statements of redeemable noncontrolling interests and equity.
F-24
Table of Contents
LINEAGE, INC. AND SUBSIDIARIES
Notes to Consolidated Financial Statements
(dollars in millions, except number of shares, per share, or per unit amounts)
(d) | Redeemable Noncontrolling Interests – Operating Partnership Units |
Certain Class A units held by Non-Company LPs are redeemable at the greater of a fixed redemption amount or fair value if certain liquidation events do not occur. Under ASC 810, Consolidation, the noncontrolling interest is adjusted each reporting period for income (loss) attributable to the noncontrolling interest based on the relative ownership percentage of these Non-Company LPs. Each reporting period, the Company accretes the changes in the redemption value of the redeemable noncontrolling interest over the period of issuance to the earliest redemption date and records an adjustment if the accreted redemption value is greater than the ASC 810 carrying value. These adjustments, if any, are affected by charges against equity. In accordance with ASC 480, Distinguishing Liabilities From Equity, the Company elected to apply the “Equity Classification — Entire Adjustment Method,” which treats the entire adjustment for the redeemable noncontrolling interests to an amount other than the ASC 810 carrying value as an adjustment to equity using retained earnings (or additional paid-in capital in absence of retained earnings). The Company’s adjustments are recorded to Additional paid-in capital—common stock in the accompanying consolidated balance sheets and consolidated statements of redeemable noncontrolling interests and equity because the Company is in an accumulated deficit position. These adjustments to equity are not a component of net income, however, they are accounted for in the Company’s calculations of earnings (loss) per share (“EPS”) as disclosed in Note 20, Earnings (loss) per share.
In connection with the acquisition of MTC Logistics Holdings, LLC and certain real property (together with its subsidiaries, “MTC Logistics”) described in Note 4, Business combinations, asset acquisitions, and divestitures, the Company entered into an Equity Purchase Agreement with the sellers of MTC Logistics. Under the terms of the agreement, the sellers acquired certain Class A units of the Operating Partnership and the sellers have a one-time right as of March 1, 2025 to put all, or a portion of, the units for cash. These units are accounted for as Redeemable noncontrolling interests in the consolidated balance sheets and consolidated statements of redeemable noncontrolling interests and equity due to the put right held by the sellers. Upon the exercise of the put right, the price to be paid for the redeemable noncontrolling interests is the current fair market value of the redeemable noncontrolling interest, subject to a minimum price (“floor”) equivalent to $34.2 million if the put right is exercised for all the units. In lieu of redemption, the sellers may elect to receive any combination of cash and/or additional Operating Partnership units that equal the excess of $34.2 million over the fair market value of the units as of the election date. Any redemption would also require a distribution of any accrued but unpaid Founders Equity Share through the date of redemption, and the required accretion adjustments related to these units include the impact of the Founders Equity Share. The accrued but unpaid Founders Equity Share related to these units was $0.3 million and $0.3 million as of December 31, 2023 and 2022, respectively.
In connection with the acquisition of Cherry Hill Joliet, LLC, 279 Marquette Drive, LLC, Joliet Cold Storage, LLC, and Bolingbrook Cold Storage, LLC (collectively, “JCS”) described in Note 4, Business combinations, asset acquisitions, and divestitures, the Company entered into an Equity Purchase Agreement with the sellers of JCS. Under the terms of the agreement, the sellers acquired certain Class A units of the Operating Partnership, and the sellers have a one-time right as of February 1, 2024 to put all, or a portion of, the units for cash. Refer to Note 22, Subsequent events, for further information regarding the sellers’ one-time right. These units are accounted for as Redeemable noncontrolling interests in the consolidated balance sheets and consolidated statements of redeemable noncontrolling interests and equity due to the put right held by the sellers. Upon the exercise of the put right, the price to be paid for the redeemable noncontrolling interests is the current fair market value of the redeemable noncontrolling interest, subject to a minimum price (“floor”) equivalent to
F-25
Table of Contents
LINEAGE, INC. AND SUBSIDIARIES
Notes to Consolidated Financial Statements
(dollars in millions, except number of shares, per share, or per unit amounts)
$97.0 million if the put right is exercised for all the units. Any redemption would also require a distribution of any accrued but unpaid Founders Equity Share through the date of redemption, and the required accretion adjustments related to these units include the impact of the Founders Equity Share. The accrued but unpaid Founders Equity Share related to these units was $2.1 million, $2.1 million, and $1.4 million as of December 31, 2023, 2022, and 2021, respectively.
In connection with the 2019 acquisition of Iowa Cold Storage (“Iowa Cold”), the sellers of Iowa Cold were issued units of BGLH totaling $5.6 million. In 2020, these BGLH units were transferred to an equivalent number of Class A units in the Operating Partnership. The sellers had a one-time right as of June 30, 2021 to put a variable amount of these units for $2.0 million in cash. These units were accounted for as Redeemable noncontrolling interests in the consolidated balance sheets due to the put right held by the sellers. As of December 31, 2020, the Company recognized $2.0 million in redeemable noncontrolling interest related to these units to reflect their redemption-date fair value. The put option expired on June 30, 2021 and the shares were not redeemed, resulting in a reclassification of the redeemable noncontrolling interest to noncontrolling interest in the Operating Partnership.
All redeemable noncontrolling interests in the Operating Partnership are included in Redeemable noncontrolling interests in the accompanying consolidated balance sheets and consolidated statements of redeemable noncontrolling interests and equity.
LLH Capital Structure
The Operating Partnership owns all outstanding equity interests of LLH except for those held by LLH MGMT, LLH MGMT II, and BG Maverick, as described below. Certain subsidiaries of LLH have also issued equity interests to third parties. All of these equity interests are accounted for as Noncontrolling interests in the accompanying consolidated balance sheets and consolidated statements of redeemable noncontrolling interests and equity.
(e) | Noncontrolling Interest in Other Consolidated Subsidiaries |
Noncontrolling interests in Other Consolidated Subsidiaries include entities other than the Operating Partnership in which the Company has a controlling interest but which are not wholly owned by the Company. Third parties own the following interests in the below Other Consolidated Subsidiaries at December 31:
2023 | 2022 | 2021 | ||||||||||
Cool Port Oakland Holdings, LLC | 13.3% | 13.3% | 13.6% | |||||||||
Erweda BV | — % | 25.0% | 25.0% | |||||||||
Lineage Jiuheng Logistics (HK) Group Company Ltd., formerly known as PFS YIDA Logistics (HK) Group Co. Ltd. | 40.0% | 40.0% | 40.0% | |||||||||
Kloosterboer BLG Coldstore GmbH | 49.0% | 49.0% | 49.0% | |||||||||
Turvo India Pvt. Ltd. | 1.0% | 1.0% | — % |
Erweda BV was divested in 2023, as described in Note 4, Business combinations, asset acquisitions, and divestitures.
In addition to the third party interests detailed above, Noncontrolling interests in Other Consolidated Subsidiaries also include Series A Preferred shares issued by each of the Company’s REIT subsidiaries to third-party investors. Each REIT subsidiary has issued Series A Preferred shares, which are non-voting shares that have a $1,000 liquidation preference and a cumulative 12% per annum dividend preference. The REIT subsidiary Series A Preferred shares may be redeemed at the Company’s option
F-26
Table of Contents
LINEAGE, INC. AND SUBSIDIARIES
Notes to Consolidated Financial Statements
(dollars in millions, except number of shares, per share, or per unit amounts)
for consideration equal to $1,000 plus all accrued and unpaid dividends thereon to and including the date fixed for redemption and are not convertible or exchangeable for any other property or securities of the Company.
On January 7, 2022, Kenyon Zero Storage, Inc. (“Kenyon”) issued 125 preferred shares in order to become a REIT subsidiary. On June 1, 2022, when Kenyon was merged out of existence, the Company redeemed the then outstanding 125 Kenyon preferred shares for $1,000 per share plus all unpaid dividends and a redemption premium of $100 per unit.
On January 12, 2023, Lineage Logistics CC Holdings, LLC issued 123 preferred shares in order to become a REIT subsidiary. The Company’s REIT subsidiaries had an aggregate amount of 373, 250, and 250 Series A preferred shares held by third parties outstanding as of December 31, 2023, 2022, and 2021 respectively.
All noncontrolling interests in the Other Consolidated Subsidiaries are included within Noncontrolling interests in the accompanying consolidated balance sheets and consolidated statements of redeemable noncontrolling interests and equity.
(f) | Management Profits Interests Class C units |
The Company grants interests in LLH MGMT and LLH MGMT II to certain members of management. LLH MGMT and LLH MGMT II hold all outstanding Class C units in LLH (“Management Profits Interests Class C units”). Management Profits Interests Class C units entitle LLH MGMT and LLH MGMT II, and, by extension, certain members of management, to a formulaic amount of the profits of LLH, generally based on the growth of the Company’s share price over a certain threshold, subject to certain adjustments.
The Company accounts for Management Profits Interests Class C units held by LLH MGMT and LLH MGMT II based on the total value of all Management Profits Interests Class C units in a hypothetical liquidation of the Company. Under this method, the amounts of income and loss attributed to Management Profits Interests Class C units reflect the changes in the amounts LLH MGMT and LLH MGMT II would hypothetically receive at each balance sheet date. This method assumes that the proceeds available for distribution would be equivalent to the equity of the Company, as determined under GAAP. All activity related to Management Profits Interests Class C units is included within Noncontrolling interests in the accompanying consolidated balance sheets and consolidated statements of redeemable noncontrolling interests and equity.
On certain occasions, the Company offers a repurchase opportunity for certain Management Profits Interests Class C units by offering cash settlement to repurchase units at their current fair market value. Certain Management Profits Interests Class C units were redeemed in exchange for a cash total of $12.6 million, $24.7 million, and $39.6 million during the years ended December 31, 2023, 2022, and 2021, respectively. In the accompanying consolidated balance sheets and consolidated statements of redeemable noncontrolling interests and equity, the carrying value of the redeemed units is recorded as a reduction of Noncontrolling interests while the excess of the redemption payments over the carrying value of the redeemed units is recorded as a reduction of Additional paid-in capital—common stock.
(g) | Convertible Redeemable Noncontrolling Interests—Preference Shares |
On October 1, 2021 (“Closing Date”), the Company acquired 100% of the outstanding equity interests in Kloosterboer Group B.V. and its subsidiaries (“Kloosterboer”). Pursuant to the terms of the Sale and Purchase Agreement and the Investment Agreement executed on the Closing Date, the seller (the
F-27
Table of Contents
LINEAGE, INC. AND SUBSIDIARIES
Notes to Consolidated Financial Statements
(dollars in millions, except number of shares, per share, or per unit amounts)
“Co-Investor”) elected to reinvest €200 million in the Company’s newly formed Dutch subsidiary in the form of 2,952,738 non-voting preferred equity instruments with a per share nominal value of €0.007 (the “Preference Shares”) issued on the Closing Date. The Preference Shares accrue a fixed, cumulative, preferential dividend at the rate of 14% per annum until the second anniversary of the Closing Date, and 10% per annum thereafter, compounded annually. Once per year, the Co-Investor has a regular redemption right. Further, the Co-Investor has special redemption rights upon the occurrence of certain events.
The Investment Agreement also provides the holder of the Preference Shares conversion rights upon the occurrence of certain events. The conversion rights are structured to track the economic performance of select Class A units of the Operating Partnership if the Company does not complete an initial public offering and to track the economic performance of common stock of Lineage, Inc. if the Company does complete an initial public offering. To the extent that the Co-Investor has not exercised its right to conversion, all outstanding Preference Shares, including all unpaid, accrued preferential dividends, shall be mandatorily redeemed for cash by the Company upon the fifth anniversary of the Closing Date. The accrued preferential dividend shall only be paid upon a regular redemption of the Preference Shares and shall not be payable if the Co-Investor exercises its conversion or special redemption right.
The Company has applied the guidance under ASC 480-10-S99-3A on the classification and subsequent measurement of Preference Shares. The Preference Shares represent a redeemable noncontrolling interest in the Company and are presented within Redeemable noncontrolling interests in the accompanying consolidated balance sheets and consolidated statements of redeemable noncontrolling interests and equity. The Preference Shares qualify for classification in temporary equity (outside of Stockholders’ equity) because the redemption feature is not solely within the control of the Company. As the Preference Shares are currently redeemable, the Company measures redeemable noncontrolling interests at the greater of (i) the initial carrying amount and dividends or (ii) the maximum redemption value, including accrued dividends payable under the redemption feature as of the balance sheet date. Required redeemable noncontrolling interest adjustments are recorded as an increase or decrease to Redeemable noncontrolling interests, with an offsetting adjustment to Additional paid-in capital—common stock.
In October 2022, the Co-Investor exercised the regular redemption right and the Company redeemed 738,185 Preference Shares for a total of $55.7 million, including $7.2 million of preferential dividends accrued through the redemption date. Commensurate with the percentage of the then-outstanding Preference Shares redeemed, the Company derecognized $77.1 million (or 25%) of the redeemable noncontrolling interest carrying value upon redemption. The difference between the consideration paid to acquire the redeemed Preference Shares and the carrying amount of those Preference Shares is recorded to Additional paid-in capital—common stock in a manner similar to the Company’s treatment of dividends paid on preferred stock.
During years ended December 31, 2023 and 2022, the Company recorded net redeemable noncontrolling interest adjustments of $7.8 million and $18.2 million, respectively, representing the effect of foreign currency on the carrying amount and accrued dividends payable. As of December 31, 2023 and 2022, there were 2,214,553 Preference Shares outstanding. As of December 31, 2021, there were 2,952,738 Preference Shares outstanding. As of December 31, 2023, the ending redeemable noncontrolling interest balance of $220.8 million represents the maximum redemption value of the Preference Shares. As of December 31, 2022, the ending redeemable noncontrolling interest balance of $213.0 million represents the initial carrying value adjusted for redemptions and foreign exchange, as that amount was greater than the maximum redemption value as of the balance sheet date.
F-28
Table of Contents
LINEAGE, INC. AND SUBSIDIARIES
Notes to Consolidated Financial Statements
(dollars in millions, except number of shares, per share, or per unit amounts)
(h) | Redeemable Noncontrolling Interests—Operating Subsidiaries |
In April 2020, the Company acquired a controlling 50.78% ownership in Flexible Automation Innovative Solutions NV (“FAIS”). After five years from the purchase date, and up to fifteen years after the purchase date, the noncontrolling shareholders had the right to sell to the Company its shares at a fixed price in accordance with the purchase agreement.
In October 2022, the Company purchased the remaining noncontrolling shareholders’ interest in FAIS in a transaction that was separate from the put right described above. As consideration for the acquisition of the noncontrolling shareholders’ interest, the Company issued a promissory note to the sellers, which the sellers assigned to BGLH in exchange for the issuance of BGLH equity interests in the amount of $10.0 million. The fair value of the equity issued by BGLH was the price at which equity was issued to third-party investors in arms’ length transactions in connection with other BGLH capital raising activities. The promissory note acquired by BGLH was contributed to the Company on the acquisition date. FAIS is now a wholly owned subsidiary of the Company.
In August 2023, the Company acquired a 75.0% ownership in Ha Noi Steel Pipe Joint Stock Company (“SK Logistics”). On September 30, 2025 or September 30, 2026, the noncontrolling shareholders have the right to sell the remaining 25.0% of SK Logistics to the Company at a formulaic price based on certain financial metrics of SK Logistics in the preceding calendar year. This right expires, if not exercised, on September 30, 2026.
The noncontrolling shareholders’ interests in FAIS represented, and the noncontrolling shareholders’ interests in SK Logistics continue to represent, redeemable noncontrolling interests in the Company and are presented within Redeemable noncontrolling interests in the accompanying consolidated balance sheets and consolidated statements of redeemable noncontrolling interests and equity. Similar to the redeemable Operating Partnership Units described above, the Company accretes the changes in the redemption value of the redeemable noncontrolling interests over the period of issuance to the earliest redemption date and, if necessary, records an adjustment to the redeemable noncontrolling interest. The Company’s adjustments are recorded to Additional paid-in capital—common stock in the accompanying consolidated balance sheets and consolidated statements of redeemable noncontrolling interests and equity.
(i) | Class D Interests in LLH |
BG Maverick holds all outstanding Class D units in LLH. Class D units in LLH are non-voting profits interests. In respect of these interests, BG Maverick is entitled to receive a formulaic annual amount of income and profits that is payable only in a liquidity event. The Company has concluded that the Class D units in LLH held by BG Maverick do not have the substantive risks and rewards of equity ownership of LLH, and therefore do not represent a substantive class of equity in LLH and are not recorded within Noncontrolling interests in the accompanying consolidated balance sheets and consolidated statements of redeemable noncontrolling interests and equity. As the payment of the distribution in respect of Class D units in LLH is contingent upon the occurrence of a liquidity event that is not considered probable to occur, the Company has not recorded a liability for the amounts to be paid, in accordance with ASC 450, Contingencies.
F-29
Table of Contents
LINEAGE, INC. AND SUBSIDIARIES
Notes to Consolidated Financial Statements
(dollars in millions, except number of shares, per share, or per unit amounts)
Below is a summary of all activity for the Company’s redeemable noncontrolling interests during the years ended December 31, 2023, 2022, and 2021, which are discussed in further detail above.
Redeemable Noncontrolling Interests – Operating Partnership Units | Convertible Redeemable Noncontrolling Interests – Preference Shares | Redeemable Noncontrolling Interest – Operating Subsidiaries | Total Redeemable noncontrolling interests | |||||||||||||
Balance as of December 31, 2020 | $ | 2.0 | $ | — | $ | 8.4 | $ | 10.4 | ||||||||
Operating Partnership units issued in acquisitions | 22.2 | — | — | 22.2 | ||||||||||||
Other comprehensive income (loss) | (0.6 | ) | — | — | (0.6 | ) | ||||||||||
Expiration of redemption option | (2.0 | ) | — | — | (2.0 | ) | ||||||||||
Noncontrolling interests acquired in business combinations | — | 308.3 | — | 308.3 | ||||||||||||
Accretion of redeemable noncontrolling interests | 23.9 | — | — | 23.9 | ||||||||||||
Net income (loss) | (1.3 | ) | — | 0.2 | (1.1 | ) | ||||||||||
|
|
|
|
|
|
|
| |||||||||
Balance as of December 31, 2021 | $ | 44.2 | $ | 308.3 | $ | 8.6 | $ | 361.1 | ||||||||
Operating Partnership units issued in acquisitions | 7.2 | — | — | 7.2 | ||||||||||||
Other comprehensive income (loss) | (0.2 | ) | — | — | (0.2 | ) | ||||||||||
Purchase of redeemable noncontrolling interests | — | — | (10.1 | ) | (10.1 | ) | ||||||||||
Partial redemption of convertible redeemable noncontrolling interests | — | (77.1 | ) | — | (77.1 | ) | ||||||||||
Redeemable noncontrolling interest adjustment | — | (18.2 | ) | — | (18.2 | ) | ||||||||||
Accretion of redeemable noncontrolling interests | 34.3 | — | — | 34.3 | ||||||||||||
Net income (loss) | (0.7 | ) | — | 1.5 | 0.8 | |||||||||||
|
|
|
|
|
|
|
| |||||||||
Balance as of December 31, 2022 | $ | 84.8 | $ | 213.0 | $ | — | $ | 297.8 | ||||||||
Other comprehensive income (loss) | (0.1 | ) | — | — | (0.1 | ) | ||||||||||
Noncontrolling interests acquired in business combinations | — | — | 6.9 | 6.9 | ||||||||||||
Redeemable noncontrolling interest adjustment | — | 7.8 | — | 7.8 | ||||||||||||
Accretion of redeemable noncontrolling interests | 36.1 | — | 0.8 | 36.9 | ||||||||||||
Net income (loss) | (0.4 | ) | — | — | (0.4 | ) | ||||||||||
|
|
|
|
|
|
|
| |||||||||
Balance as of December 31, 2023 | $ | 120.4 | $ | 220.8 | $ | 7.7 | $ | 348.9 | ||||||||
|
|
|
|
|
|
|
|
F-30
Table of Contents
LINEAGE, INC. AND SUBSIDIARIES
Notes to Consolidated Financial Statements
(dollars in millions, except number of shares, per share, or per unit amounts)
Below is a summary of all activity for the Company’s noncontrolling interests during the years ended December 31, 2023, 2022, and 2021, which are discussed in further detail above.
Operating Partnership Units – Class A, B, & C | Noncontrolling Interests in Other Consolidated Subsidiaries | Management Profits Interests Class C Units | Total Noncontrolling interests | |||||||||||||
Balance as of December 31, 2020 | $ | 418.4 | $ | 13.9 | $ | 4.9 | $ | 437.2 | ||||||||
Contributions from noncontrolling interests | 114.2 | — | — | 114.2 | ||||||||||||
Dividends and other distributions | (96.4 | ) | — | — | (96.4 | ) | ||||||||||
Stock-based compensation | — | — | 9.5 | 9.5 | ||||||||||||
Operating Partnership units issued in acquisitions | 13.1 | — | — | 13.1 | ||||||||||||
Other comprehensive income (loss) | (9.1 | ) | — | — | (9.1 | ) | ||||||||||
Expiration of redemption option | 2.0 | — | — | 2.0 | ||||||||||||
Noncontrolling interests acquired in business combinations | — | 6.2 | — | 6.2 | ||||||||||||
Redemption of Operating Partnership units | (124.4 | ) | — | — | (124.4 | ) | ||||||||||
Redemption of units issued as stock compensation | — | — | (2.5 | ) | (2.5 | ) | ||||||||||
Net income (loss) | (22.9 | ) | 0.9 | (0.1 | ) | (22.1 | ) | |||||||||
Reallocation of noncontrolling interests | 248.3 | — | — | 248.3 | ||||||||||||
|
|
|
|
|
|
|
| |||||||||
Balance as of December 31, 2021 | $ | 543.2 | $ | 21.0 | $ | 11.8 | $ | 576.0 | ||||||||
Contributions from noncontrolling interests | 6.1 | 0.3 | — | 6.4 | ||||||||||||
Distributions | (40.9 | ) | (1.6 | ) | — | (42.5 | ) | |||||||||
Operating Partnership units issued in acquisitions | 0.3 | — | — | 0.3 | ||||||||||||
Stock-based compensation | — | — | 7.9 | 7.9 | ||||||||||||
Other comprehensive income (loss) | (3.4 | ) | — | — | (3.4 | ) | ||||||||||
Issuance of REIT subsidiary preferred shares | — | 0.1 | — | 0.1 | ||||||||||||
Preferred dividend/redemption | — | (0.2 | ) | — | (0.2 | ) | ||||||||||
Redemption of units issued as stock compensation | — | — | (1.3 | ) | (1.3 | ) | ||||||||||
Net income (loss) | (9.0 | ) | 0.9 | (6.1 | ) | (14.2 | ) | |||||||||
Reallocation of noncontrolling interests | 111.8 | — | — | 111.8 | ||||||||||||
|
|
|
|
|
|
|
| |||||||||
Balance as of December 31, 2022 | $ | 608.1 | $ | 20.5 | $ | 12.3 | $ | 640.9 | ||||||||
|
|
|
|
|
|
|
|
F-31
Table of Contents
LINEAGE, INC. AND SUBSIDIARIES
Notes to Consolidated Financial Statements
(dollars in millions, except number of shares, per share, or per unit amounts)
Operating Partnership Units—Class A, B, & C | Noncontrolling Interests in Other Consolidated Subsidiaries | Management Profit Interests Class C Units | Total Noncontrolling interests | |||||||||||||
Balance as of December 31, 2022 | $ | 608.1 | $ | 20.5 | $ | 12.3 | $ | 640.9 | ||||||||
Contributions from noncontrolling interests | 2.0 | — | — | 2.0 | ||||||||||||
Dividends and other distributions | (56.3 | ) | (1.0 | ) | — | (57.3 | ) | |||||||||
Operating Partnership units issued in acquisitions | 2.1 | — | — | 2.1 | ||||||||||||
Stock-based compensation | — | — | 10.8 | 10.8 | ||||||||||||
Other comprehensive income (loss) | (2.0 | ) | — | — | (2.0 | ) | ||||||||||
Issuance of REIT subsidiary preferred shares | — | 0.1 | — | 0.1 | ||||||||||||
Sale of noncontrolling interests | — | (3.7 | ) | — | (3.7 | ) | ||||||||||
Redemption of units issued as stock compensation | — | — | (0.5 | ) | (0.5 | ) | ||||||||||
Redemption of noncontrolling interest | (0.5 | ) | — | — | (0.5 | ) | ||||||||||
Net income (loss) | (4.2 | ) | (0.3 | ) | (14.0 | ) | (18.5 | ) | ||||||||
Reallocation of noncontrolling interests | 48.5 | — | — | 48.5 | ||||||||||||
|
|
|
|
|
|
|
| |||||||||
Balance as of December 31, 2023 | $ | 597.7 | $ | 15.6 | $ | 8.6 | $ | 621.9 | ||||||||
|
|
|
|
|
|
|
|
(3) | Revenue |
The following table disaggregates the Company’s net revenues by major stream and reportable segment:
Year ended December 31, | ||||||||||||
2023 | 2022 | 2021 | ||||||||||
Warehousing operations | $ | 3,470.8 | $ | 3,075.7 | $ | 2,388.6 | ||||||
Warehouse lease revenues | 259.4 | 243.7 | 173.6 | |||||||||
Managed services | 97.3 | 78.6 | 54.3 | |||||||||
Other | 29.4 | 34.6 | 39.3 | |||||||||
|
|
|
|
|
| |||||||
Total Global Warehousing | 3,856.9 | 3,432.6 | 2,655.8 | |||||||||
Transportation | 859.4 | 935.1 | 581.6 | |||||||||
Food sales | 228.7 | 207.0 | 189.5 | |||||||||
Redistribution revenues | 192.8 | 172.5 | 146.4 | |||||||||
E-commerce and other | 130.2 | 110.8 | 64.7 | |||||||||
Railcar lease revenues | 73.5 | 70.3 | 64.0 | |||||||||
|
|
|
|
|
| |||||||
Total Global Integrated Solutions | 1,484.6 | 1,495.7 | 1,046.2 | |||||||||
|
|
|
|
|
| |||||||
Total net revenues | $ | 5,341.5 | $ | 4,928.3 | $ | 3,702.0 | ||||||
|
|
|
|
|
|
The Company has no material warranties or obligations for allowances, refunds, or other similar obligations. As a practical expedient, the Company does not assess whether a contract has a significant financing component, as the period between the transfer of service to the customer and the receipt of customer payment is less than a year.
F-32
Table of Contents
LINEAGE, INC. AND SUBSIDIARIES
Notes to Consolidated Financial Statements
(dollars in millions, except number of shares, per share, or per unit amounts)
At December 31, 2023, the Company had $844.0 million of remaining unsatisfied performance obligations from contracts with customers subject to a non-cancellable term and within contracts that have an original expected duration exceeding one year. These obligations also do not include variable consideration beyond the non-cancellable term, which, due to the inability to quantify by estimate, is fully constrained. The Company expects to recognize 23% of these remaining performance obligations as revenue in 2024 and the remaining 77% to be recognized over a weighted average period of 8.1 years through 2038.
Accounts receivable balances related to contracts with customers were $804.5 million and $805.3 million at December 31, 2023 and 2022, respectively.
Deferred revenue balances related to contracts with customers were $93.3 million and $89.5 million at December 31, 2023 and 2022, respectively. Substantially all revenue that was included in deferred revenue at the beginning of 2023 and 2022 has been recognized as of December 31, 2023 and 2022, respectively, and represents revenue from the satisfaction of monthly storage and handling services.
The Company receives lease revenues as the lessor for certain buildings and warehouses or identified space within a warehouse. Lease revenues are generally fixed over the duration of the contract, and often lease contracts contain clauses permitting extension or termination. Lease incentives and options for purchase of the leased asset by the lessee are generally not offered.
Future minimum rental revenues under operating leases, including railcar leases and subleases, with original terms in excess of one year to be received from customers for each of the next five years and thereafter are as follows:
Year ending December 31: | ||||
2024 | $ | 232.3 | ||
2025 | 210.3 | |||
2026 | 172.1 | |||
2027 | 146.4 | |||
2028 | 123.8 | |||
2029 and thereafter | 753.8 | |||
|
| |||
Total | $ | 1,638.7 | ||
|
|
(4) | Business combinations, asset acquisitions, and divestitures |
2023 Business Combinations
The following acquisitions took place during the year ended December 31, 2023. The initial accounting for the 2023 business combinations has been completed on a preliminary basis. The primary areas of acquisition accounting that are not yet finalized relate to review and valuation of all acquired income tax assets and liabilities and continuing efforts to validate the working capital acquired from Burris Logistics. The Company’s estimates and assumptions are subject to change during the measurement period, not to exceed one year from the acquisition date, and actual values may materially differ from the preliminary estimates. The Company’s consolidated statements of operations and comprehensive income (loss), redeemable noncontrolling interests and equity, and cash flows for the year ended December 31, 2023 include the results of operations for these businesses since the date of acquisition.
F-33
Table of Contents
LINEAGE, INC. AND SUBSIDIARIES
Notes to Consolidated Financial Statements
(dollars in millions, except number of shares, per share, or per unit amounts)
The following table summarizes the total consideration and the estimated fair value of the assets acquired and liabilities assumed for business combinations made by the Company during 2023.
Burris | NOVA Coldstore Corp. | Other | ||||||||||
Fair value of consideration transferred | ||||||||||||
Cash paid | $ | 147.9 | $ | 79.4 | $ | 39.0 | ||||||
Deferred cash consideration | — | — | 14.4 | |||||||||
Contingent consideration | — | — | 1.9 | |||||||||
Issuance of equity | — | 6.4 | — | |||||||||
|
|
|
|
|
| |||||||
Total | $ | 147.9 | $ | 85.8 | $ | 55.3 | ||||||
Recognized amounts of identifiable assets acquired and liabilities assumed | ||||||||||||
Cash and cash equivalents | — | 1.2 | 1.1 | |||||||||
Accounts receivable, net and prepaid expenses and other current assets | 13.7 | 1.4 | 3.6 | |||||||||
Inventories | 21.8 | — | — | |||||||||
Property, plant, and equipment | 108.2 | 39.9 | 22.8 | |||||||||
Customer relationships (included in other intangible assets) | 10.1 | 21.2 | 18.1 | |||||||||
Tradename (included in other intangible assets) | 0.3 | 0.1 | 0.1 | |||||||||
Operating lease right-of-use assets, deferred income tax assets, and other assets | 4.9 | 0.6 | 1.2 | |||||||||
Accounts payable and accrued liabilities and deferred revenue | (11.1 | ) | (0.2 | ) | (0.6 | ) | ||||||
Operating lease obligations and deferred income tax liabilities | (4.1 | ) | — | (6.9 | ) | |||||||
Long-term debt | — | — | (2.8 | ) | ||||||||
Redeemable noncontrolling interest | — | — | (6.9 | ) | ||||||||
|
|
|
|
|
| |||||||
Total identified net assets | $ | 143.8 | $ | 64.2 | $ | 29.7 | ||||||
Goodwill | $ | 4.1 | $ | 21.6 | $ | 25.6 |
(a) | Burris |
On October 2, 2023, the Company acquired all of the outstanding equity of certain subsidiaries from Burris Logistics, as well as certain facilities and related assets (collectively, “Burris”) through an asset purchase agreement. The Burris assets include eight facilities in Lakeland, Florida; Jacksonville, Florida; McDonough, Georgia; Edmond, Oklahoma; New Castle, Delaware; Waukesha, Wisconsin; and Federalsburg, Maryland. These facilities provide a mix of temperature-controlled warehousing services and e-commerce fulfillment.
The goodwill associated with this acquisition is primarily attributable to the strategic benefits of strengthening the Company’s warehousing network in the Eastern and Midwestern United States and expansion of its existing e-commerce fulfillment business. The goodwill associated with this acquisition is not amortizable for income tax purposes. The goodwill was allocated to the Company’s Global Warehousing and Global Integrated Solutions segments.
(b) | NOVA Coldstore Corp. |
On October 2, 2023, the Company acquired all the outstanding equity interests of Mountain Dog Operating, LLC, Big Dog Operating, LLC, and NOVA Coldstore Corp. (collectively, “NOVA
F-34
Table of Contents
LINEAGE, INC. AND SUBSIDIARIES
Notes to Consolidated Financial Statements
(dollars in millions, except number of shares, per share, or per unit amounts)
Coldstore”). NOVA Coldstore is a provider of temperature-controlled warehousing services through its two facilities in Massachusetts.
In connection with the transaction described above, Lineage OP issued equity interests to the sellers in the amount of $6.4 million as consideration for certain of the equity interests in NOVA Coldstore. The fair value of the equity issued by Lineage OP was the price at which equity was issued to third-party investors in arms’ length transactions in connection with other Lineage OP capital raising activities.
The goodwill associated with this acquisition is primarily attributable to the strategic benefits of strengthening the Company’s warehousing network in the North Eastern United States. The goodwill associated with this acquisition is not amortizable for income tax purposes. The goodwill was attributable to the Company’s Global Warehousing segment.
(c) | Other Business Combinations |
During 2023, the Company completed other business combinations which were not material to the consolidated financial statements. The purpose of these acquisitions was to expand the Company’s growth and strengthening of the Company’s warehousing and end-to-end logistics solution offerings in the respective regions. The goodwill associated with these acquisitions is primarily attributable to the synergies and strategic benefits provided by the expansion of the Company’s offerings in those regions. The goodwill from these acquisitions is not amortizable for income tax purposes. The goodwill was allocated to the Company’s Global Warehousing and Global Integrated Solutions segments.
Pro forma results of operations have not been presented because the effects of 2023 acquisitions, individually and in the aggregate, were not material to the Company’s consolidated results of operations.
2023 Divestitures
In the third quarter of 2023, as part of the Company’s continued focus on increasing profitability, the Company completed the sale of its 75% interest in Erweda BV and its subsidiaries. The cash consideration transferred was immaterial. Erweda BV was included in the Global Integrated Solutions segment and remains a supplier for the Company’s food sales business. During the year ended December 31, 2023, the Company recognized a net loss on sale of Erweda BV of $20.9 million, included in Other nonoperating income (expense), net on the consolidated statements of operations and comprehensive income (loss) and derecognized noncontrolling interests in the amount of $3.7 million.
2023 Real Estate Acquisitions
During the year ended December 31, 2023, the Company acquired one property in Chistchurch, New Zealand, qualifying as an asset acquisition under ASC 805, Business Combinations, for total cash consideration of $13.1 million.
2022 Business Combinations
The following acquisitions took place during the year ended December 31, 2022. All accounting for these acquisitions is final. The consolidated statements of operations and comprehensive income (loss), redeemable noncontrolling interests and equity, and cash flows include the results of operations for these acquired businesses since the date of acquisition for the years ended December 31, 2023 and 2022.
F-35
Table of Contents
LINEAGE, INC. AND SUBSIDIARIES
Notes to Consolidated Financial Statements
(dollars in millions, except number of shares, per share, or per unit amounts)
The following table summarizes the total consideration and the estimated fair value of the assets acquired and liabilities assumed for business combinations made by the Company during 2022.
MTC Logistics | Mandai Link | Turvo | VersaCold | Transportes Fuentes Group | Other | |||||||||||||||||||
Fair value of consideration transferred | ||||||||||||||||||||||||
Cash consideration | $ | 157.7 | $ | 89.2 | $ | 154.6 | $ | 1,077.2 | $ | 75.9 | $ | 155.2 | ||||||||||||
Issuance of equity | 25.7 | — | 55.4 | — | 14.0 | 1.0 | ||||||||||||||||||
Contingent consideration | — | — | — | 22.4 | — | 8.0 | ||||||||||||||||||
Settlement of preexisting relationships | — | — | — | — | — | (0.2 | ) | |||||||||||||||||
|
|
|
|
|
|
|
|
|
|
|
| |||||||||||||
Total | $ | 183.4 | $ | 89.2 | $ | 210.0 | $ | 1,099.6 | $ | 89.9 | $ | 164.0 | ||||||||||||
|
|
|
|
|
|
|
|
|
|
|
| |||||||||||||
Recognized amounts of identifiable assets acquired and liabilities assumed | ||||||||||||||||||||||||
Cash and cash equivalents | $ | 0.2 | $ | 4.6 | $ | 3.7 | $ | 31.7 | $ | 30.5 | $ | 5.0 | ||||||||||||
Accounts receivable, net, inventories, prepaid expenses and other current assets | 5.1 | 7.0 | 4.6 | 29.1 | 54.9 | 20.7 | ||||||||||||||||||
Property, plant, and equipment | 140.2 | 51.1 | 0.3 | 726.8 | 68.8 | 122.4 | ||||||||||||||||||
In-place leases (included in other intangible assets) | — | 2.7 | — | 6.0 | — | 1.2 | ||||||||||||||||||
Customer relationships (included in other intangible assets) | 16.6 | 6.9 | 2.1 | 96.6 | 17.9 | 10.6 | ||||||||||||||||||
Tradename (included in other intangible assets) | 0.2 | 0.1 | 2.4 | 0.9 | — | 0.1 | ||||||||||||||||||
Technology (included in other intangible assets) | — | — | 31.5 | — | — | — | ||||||||||||||||||
Finance and operating lease right-of-use assets, deferred income tax assets, and other assets | 0.1 | 3.6 | 1.8 | 95.2 | 23.5 | 22.1 | ||||||||||||||||||
Accounts payable and accrued liabilities and deferred revenue | (4.7 | ) | (6.7 | ) | (3.3 | ) | (21.7 | ) | (50.1 | ) | (16.2 | ) | ||||||||||||
Finance and operating lease obligations | (0.1 | ) | (3.1 | ) | (1.7 | ) | (68.6 | ) | (22.6 | ) | (22.1 | ) | ||||||||||||
Deferred income tax liabilities | (7.4 | ) | (8.0 | ) | (1.0 | ) | (69.6 | ) | (21.1 | ) | (17.9 | ) | ||||||||||||
Long-term debt and other long-term liabilities | — | — | (0.1 | ) | (3.7 | ) | (41.4 | ) | — | |||||||||||||||
|
|
|
|
|
|
|
|
|
|
|
| |||||||||||||
Total identified net assets | $ | 150.2 | $ | 58.2 | $ | 40.3 | $ | 822.7 | $ | 60.4 | $ | 125.9 | ||||||||||||
|
|
|
|
|
|
|
|
|
|
|
| |||||||||||||
Goodwill | $ | 33.2 | $ | 31.0 | $ | 169.7 | $ | 276.9 | $ | 29.5 | $ | 38.1 |
(a) | MTC Logistics |
On March 1, 2022, the Company acquired all the outstanding equity interests of MTC Logistics, as previously defined, through an asset purchase agreement. MTC Logistics is a provider of warehousing services including cold storage, blast freezing, import/export transportation, and drayage through its four facilities in Maryland, Delaware and Alabama.
In connection with the transaction described above, Lineage OP issued equity interests to the sellers in the amount of $25.7 million as consideration for certain of the equity interests in MTC Logistics. The fair value of the equity issued by Lineage OP was the price at which equity was issued to third-party investors in arms’ length transactions in connection with other Lineage OP capital raising activities.
F-36
Table of Contents
LINEAGE, INC. AND SUBSIDIARIES
Notes to Consolidated Financial Statements
(dollars in millions, except number of shares, per share, or per unit amounts)
The goodwill associated with this acquisition is primarily attributable to the strategic benefits provided by MTC Logistics’ strong presence in key ports along the U.S. East and Gulf coasts. Of the total $33.2 million of goodwill associated with this acquisition, $5.8 million is amortizable for income tax purposes. The goodwill was allocated to the Company’s Global Warehousing and Global Integrated Solutions segments.
(b) | Mandai Link |
On April 29, 2022, the Company acquired all the outstanding equity interests of Mandai Link Logistics Pt. Ltd., through the acquisition of the equity interests of its parent corporation Pin Corporation Pte. Ltd., and its affiliate LinkRich (S) Pte. Ltd. (collectively, “Mandai Link”). Mandai Link is a provider of refrigerated food distribution services, including logistic and cold storage warehousing in Singapore.
The goodwill associated with this acquisition is primarily attributable to the Company’s market entry into Singapore where Mandai Link is a market leader, strengthening the Company’s presence in South East Asia and providing a platform for growth across the region. The goodwill is not amortizable for income tax purposes. The goodwill was allocated to the Company’s Global Warehousing and Global Integrated Solutions segments.
(c) | Turvo |
On June 1, 2022, the Company acquired all the outstanding equity interests of Turvo, Inc. (together with its subsidiaries, “Turvo”). Turvo is a software developer that specializes in providing a real-time, collaborative logistics platform that connects shippers, logistics providers, carriers, and other parties across the supply chain through cloud-based software and mobile applications.
In connection with the transaction described above, BGLH issued equity interests to the sellers in the amount of $55.4 million as consideration for certain of the equity interests in Turvo. The fair value of the equity issued by BGLH was the price at which equity was issued to third-party investors in arms’ length transactions in connection with other BGLH capital raising activities. The equity interests were contributed to the Company on the acquisition date.
The goodwill associated with this acquisition is primarily attributable to the strategic opportunities to both enhance the integration of Turvo’s software into Lineage’s transportation management service offerings provided to existing customers and expand into new and adjacent markets under the Turvo brand name, as well as its assembled workforce. The goodwill is not amortizable for income tax purposes. The goodwill was recorded within the Company’s Global Integrated Solutions segment.
(d) | VersaCold |
On August 2, 2022, the Company acquired all the outstanding equity interests of VersaCold GP Inc., 1309266 BC ULC and VersaCold Acquireco, L.P. and its subsidiaries, including the operating entity VersaCold Logistics Services (collectively “VersaCold”). VersaCold is a leading cold chain solution provider in Canada that operates 24 temperature-controlled facilities across nine provinces. Its strategically-positioned network includes properties in Canada’s most populous metropolitan markets, including Toronto, Calgary, Vancouver, Edmonton, and Montreal.
F-37
Table of Contents
LINEAGE, INC. AND SUBSIDIARIES
Notes to Consolidated Financial Statements
(dollars in millions, except number of shares, per share, or per unit amounts)
VersaCold also runs an inbound and outbound transportation business out of nine terminals across Canada, providing customers an integrated, coast-to-coast logistics solution.
Included in cash consideration transferred is a $46 million liability assumed by the Company to be paid to the Canadian Revenue Agency on behalf of the sellers, which is included in Accounts payable and accrued liabilities on the consolidated balance sheet as of December 31, 2023 and 2022, respectively.
The acquisition includes a contingent consideration arrangement that requires additional cash consideration payment of up to $75.0 million CAD based on earnings before interest, taxes, depreciation, and amortization (“EBITDA”) of VersaCold during the calendar year ended December 31, 2022. The fair value of the contingent consideration recognized on the acquisition date of $22.4 million USD was estimated by applying a Monte Carlo simulation approach. That measure is based on significant Level 3 inputs not observable in the market. Key assumptions include (1) discount rate, (2) credit spread, and (3) forecasted EBITDA.
Based on the actual EBITDA results of VersaCold during the year ended December 31, 2022, the Company recorded $0.3 million in expense to Acquisition, transaction, and other expense within the consolidated statement of operations and comprehensive income (loss) resulting from the remeasurement of the contingent consideration. As of December 31, 2022, the final VersaCold contingent consideration liability was $21.4 million recorded within Accounts payable and accrued liabilities on the consolidated balance sheet. The final payout was made on May 24, 2023.
Upon acquisition, the Company recognized gross deferred tax liabilities in the amount of $69.6 million and gross deferred tax assets in the amount of $17.5 million, primarily resulting from outside basis difference in the partnership interests acquired. Based on the judgment of management, the Company has concluded that it is more likely than not that the deferred tax assets will not be realized and, accordingly, have recorded a full valuation allowance as of the date of acquisition.
The goodwill associated with this acquisition is primarily attributable to the strategic benefits of expansion into key markets across Canada, more efficient cross-border transportation solutions, and an assembled workforce of more than 2,600 employees. The goodwill is not amortizable for income tax purposes. The goodwill was allocated to the Company’s Global Warehousing and Global Integrated Solutions segments.
(e) | Transportes Fuentes Group |
On September 1, 2022, the Company acquired all the outstanding equity interests of Transportes Agustín Fuentes e Hijos, S.L.U. (together with its subsidiary, “Transportes Fuentes Group”). Headquartered in Murcia, Spain, Transportes Fuentes Group operates a fleet of over 500 vehicles and trailers, six logistics centers, a cold storage warehouse in Spain, and value-added services supporting those facilities. Transportes Fuentes Group provides international food transport services covering Belgium, France, Germany, Italy, the Netherlands, Portugal, and the United Kingdom. It is also a founding member of Reefer Terminal, a strategic partnership to create an intermodal transportation platform combining road and rail cold storage transport services.
In connection with the transaction described above, the Company issued a promissory note to the seller, which the seller assigned to BGLH in exchange for the issuance of BGLH equity interests to the seller in the amount of $14.0 million. The fair value of the equity issued by BGLH was the
F-38
Table of Contents
LINEAGE, INC. AND SUBSIDIARIES
Notes to Consolidated Financial Statements
(dollars in millions, except number of shares, per share, or per unit amounts)
price at which equity was issued to third-party investors in arms’ length transactions in connection with other BGLH capital raising activities. The promissory note acquired by BGLH was contributed to the Company on the acquisition date.
The goodwill associated with this acquisition is primarily attributable to the strategic opportunities to expand its operations within Spain and enhance the Company’s end-to-end supply chain services for customers across Europe. The goodwill is not amortizable for income tax purposes. The goodwill was allocated to the Company’s Global Warehousing and Global Integrated Solutions segments.
At acquisition, the Company established a liability of $6.6 million for uncertain tax positions of Transportes Fuentes Group, of which $6.1 million is presented within Other long-term liabilities and $0.5 million is presented within Accounts payable and accrued liabilities on the consolidated balance sheet as of December 31, 2022. The sellers of Transportes Fuentes Group have contractually agreed to indemnify the Company for the outcome of the uncertain tax positions. Accordingly, the Company has recorded a corresponding indemnification asset of $6.6 million to reflect Lineage’s rights to reimbursement if it has to fulfill the tax-related liabilities. The indemnification asset is presented within Accounts receivable, net within the consolidated balance sheet as of December 31, 2022. During 2023, the Company released the uncertain tax positions liability and the related indemnification asset due to the change in its assessment that the position is not more-likely-than-not to be sustained, which was based on recent tax rulings issued by the applicable local authorities.
(f) | Other Business Combinations |
During 2022, the Company completed other business combinations which were not material to the consolidated financial statements. The purpose of these acquisitions was to expand the Company’s growth and strengthening of the Company’s end-to-end logistics solution offerings in the respective regions. The goodwill associated with these acquisitions is primarily attributable to the synergies and strategic benefits provided by the expansion of the Company’s offerings in those regions. The goodwill from these acquisitions is not amortizable for income tax purposes.
Pro forma results of operations have not been presented because the effects of 2022 acquisitions, individually and in the aggregate, were not material to the Company’s consolidated results of operations.
2022 Real Estate Acquisitions
During the year ended December 31, 2022, the Company acquired one property in Logan Township, New Jersey, qualifying as an asset acquisition under ASC 805, Business Combinations, for total cash consideration of $49.8 million.
2021 Business Combinations
The following acquisitions took place during the year ended December 31, 2021. All accounting for these acquisitions is final. The consolidated statements of operations and comprehensive income (loss), redeemable noncontrolling interests and equity, and cash flows include the results of operations for these acquired businesses since the date of acquisition for the years ended December 31, 2023, 2022, and 2021.
F-39
Table of Contents
LINEAGE, INC. AND SUBSIDIARIES
Notes to Consolidated Financial Statements
(dollars in millions, except number of shares, per share, or per unit amounts)
The following table summarizes the total consideration and the estimated fair value of the assets acquired and liabilities assumed for business combinations made by the Company during 2021:
JCS | UTI | Hanson | Kenyon | Kloosterboer | Claus Sørensen | Midwest | Other | |||||||||||||||||||||||||
Fair value of consideration transferred | ||||||||||||||||||||||||||||||||
Cash consideration | $ | 188.6 | $ | 136.7 | $ | 186.8 | $ | 208.5 | $ | 1,160.9 | $ | 265.7 | $ | 120.0 | $ | 297.1 | ||||||||||||||||
Issuance of equity | 64.0 | — | — | 10.7 | — | — | 13.4 | 49.4 | ||||||||||||||||||||||||
Contingent consideration | — | — | — | — | — | — | — | 2.2 | ||||||||||||||||||||||||
Settlement of preexisting relationships | (0.1 | ) | — | — | — | — | — | — | 4.3 | |||||||||||||||||||||||
Convertible redeemable noncontrolling interest—Preference Shares | — | — | — | — | 308.3 | — | — | — | ||||||||||||||||||||||||
|
|
|
|
|
|
|
|
|
|
|
|
|
|
|
| |||||||||||||||||
Total | $ | 252.5 | $ | 136.7 | $ | 186.8 | $ | 219.2 | $ | 1,469.2 | $ | 265.7 | $ | 133.4 | $ | 353.0 | ||||||||||||||||
|
|
|
|
|
|
|
|
|
|
|
|
|
|
|
| |||||||||||||||||
Total identified net assets acquired | $ | 161.0 | $ | 65.0 | $ | 162.9 | $ | 198.3 | $ | 760.5 | $ | 184.0 | $ | 112.7 | $ | 248.5 | ||||||||||||||||
Goodwill | $ | 91.5 | $ | 71.7 | $ | 23.9 | $ | 20.9 | $ | 708.7 | $ | 81.7 | $ | 20.7 | $ | 104.5 |
(a) | Joliet Cold Storage and Bolingbrook Cold Storage |
On February 1, 2021, the Company acquired all the outstanding equity interests of JCS, as previously defined, which provides handling and storage of dry and cold products through its two warehouses in Illinois.
In connection with the transaction described above, Lineage OP issued equity interests to the sellers in the amount of $64.0 million as consideration for certain of the equity interests of JCS. The fair value of the equity issued by Lineage OP was the price at which equity was issued to third-party investors in arms’ length transactions in connection with other Lineage OP capital raising activities.
The goodwill associated with this acquisition is primarily attributable to the strategic benefits of the acquisition, including the expanded presence in Illinois and future growth opportunities associated with the recent expansion at one of the facilities. The goodwill is amortizable for income tax purposes. The goodwill was recorded within the Company’s Global Warehousing segment.
(b) | UTI Holding B.V. |
On May 31, 2021, the Company acquired all the outstanding equity interests of UTI Holding B.V. (together with its subsidiaries, “UTI”), which operates in the Netherlands and Poland. UTI provides global freight forwarding services, specializing in the exporting and importing of full container load cargo, handling both temperature-controlled and other containerized goods.
The goodwill associated with this acquisition is primarily attributable to the strengthening of the Company’s end-to-end supply chain service offerings by advancing the operational synergies for the movement of goods through the Company’s global warehouse network. The goodwill is not amortizable for income tax purposes. The goodwill was recorded within the Company’s Global Integrated Solutions segment.
F-40
Table of Contents
LINEAGE, INC. AND SUBSIDIARIES
Notes to Consolidated Financial Statements
(dollars in millions, except number of shares, per share, or per unit amounts)
(c) | Hanson Cold Storage |
On August 2, 2021, the Company acquired all the outstanding equity interests of Hanson Cold Storage, LLC, Hanson Cold Storage of Indiana, LLC, Hanson Xpress, LLC and Hanson Transportation Management Services, LLC (collectively, “Hanson”). Hanson provides temperature-controlled warehousing and logistics through its seven facilities across Michigan and Indiana.
The acquisition includes a contingent consideration arrangement that requires additional cash consideration of up to $15.0 million to be paid by the Company to the sellers based on EBITDA of Hanson through September 2021. The minimum threshold was not met during the earnout period. The Company determined no value related to the contingent consideration at the acquisition date.
The goodwill associated with this acquisition is primarily attributable to the synergies resulting from Hanson’s integrated business segments in warehousing, transportation, and frozen food consolidation. The goodwill is amortizable for income tax purposes. The goodwill was allocated to the Company’s Global Warehousing and Global Integrated Solutions segments.
(d) | Kenyon Zero Storage |
On September 1, 2021, the Company acquired all the outstanding equity interests of Kenyon, which provides temperature-controlled storage through its twelve facilities located on its three campuses in the state of Washington.
In connection with the transaction described above, BGLH issued equity interests to the sellers in the amount of $10.7 million as consideration for certain of the equity interests of Kenyon. The fair value of the equity issued by BGLH was the price at which equity was issued to third-party investors in arms’ length transactions in connection with other BGLH capital raising activities. The equity interests were contributed to the Company on the acquisition date.
The goodwill associated with this acquisition is primarily due to the expanded presence in the Washington market and the strategic benefits associated with railcar accessibility at the facilities. The goodwill is not amortizable for income tax purposes. The goodwill was recorded within the Company’s Global Warehousing segment.
(e) | Kloosterboer |
On October 1, 2021, the Company acquired all outstanding equity interests of Kloosterboer. Refer to Note 2, Capital structure and noncontrolling interests for further detail. Based in the Netherlands, Kloosterboer provides integrated temperature-controlled storage, logistics, and value-added services. Kloosterboer operates 15 cold storage warehouses and distribution facilities across the Netherlands, France, Germany, and Canada.
The goodwill associated with this acquisition is primarily attributable to the strategic benefits resulting from operational synergies expected from the strengthening of the Company’s existing end-to-end supply chain service offerings in Europe, the addition of the Company’s first cold storage facilities in France and Germany, and a workforce of over 900 employees. The goodwill is not amortizable for income tax purposes. The goodwill was allocated to the Company’s Global Warehousing and Global Integrated Solutions segments.
Lineage Dutch Bidco 5 B.V., the Company’s newly formed Dutch subsidiary and Kloosterboer’s parent, issued Preference Shares, as previously defined, in the amount of €200.0 million
F-41
Table of Contents
LINEAGE, INC. AND SUBSIDIARIES
Notes to Consolidated Financial Statements
(dollars in millions, except number of shares, per share, or per unit amounts)
(equivalent to $231.8 million) in connection with the transaction. The Preference Shares represent a redeemable noncontrolling interest in the Company.
As the Preference Shares include both redemption and equity conversion rights, the final fair value recognized of $308.3 million was estimated by applying the income approach complemented with a Black-Scholes Model related to the Preference Shares conversion option. The subject fair value is based on significant Level 3 inputs not observable in the market. The fixed redemption right, inclusive of cumulative preferential dividends compounded annually for five years, was valued by applying a simplified income approach discounted using a market-based discount rate, which was determined based on the Company’s cost of borrowing as of the acquisitions date, including a credit risk adjustment for comparable unsecured debt instruments in the market. The equity conversion option was valued by applying a Black-Scholes model, with key assumptions including (1) the Company’s expected initial public offering date, (2) expected conversion exercise price, (3) expected volatility, (4) risk-free rate, and (5) expected dividend yield. Refer to Note 2, Capital structure and noncontrolling interests for further details on the post-acquisition date accounting of the Preference Shares as a redeemable noncontrolling interest in the Company.
(f) | Claus Sorenson |
On November 1, 2021, the Company acquired all the outstanding equity interests of LL Cold ApS (formerly Claus Sørensen A/S) (“Claus Sørensen”). Claus Sørensen is a leading Danish temperature-controlled logistical partner with a nationwide infrastructure. Claus Sørensen operates nine cold storage facilities strategically located across eight cities near key food production hubs and fishing ports in Denmark. Claus Sørensen provides cold storage, blast freezing, order picking, bonded and organic warehousing, quality control, and repacking services.
The goodwill associated with this acquisition is primarily attributable to the strategic benefits resulting from operational synergies expected from the strengthening of the Company’s existing presence in the Nordic region and the workforce of the acquired business. The goodwill is not amortizable for income tax purposes. The goodwill was recorded within the Company’s Global Warehousing segment.
(g) | Midwest Refrigeration Services |
On December 1, 2021, the Company, through an asset purchase agreement, acquired four warehouses from Alliance Development Corp., Midwest Refrigerated Milwaukee, Inc., Midwest Refrigerated Madison, LLC (collectively, “Midwest”) in Wisconsin and Minnesota.
In connection with the transaction described above, Lineage OP issued equity interests to the sellers in the amount of $13.4 million as consideration for certain of the asset interests of Midwest. The fair value of the equity issued by Lineage OP was the price at which equity was issued to third-party investors in arms’ length transactions in connection with other Lineage OP capital raising activities.
The goodwill from this acquisition arises from several strategic benefits, including further expansion into automation. The goodwill is amortizable for income tax purposes. The goodwill was recorded within the Company’s Global Warehousing segment.
F-42
Table of Contents
LINEAGE, INC. AND SUBSIDIARIES
Notes to Consolidated Financial Statements
(dollars in millions, except number of shares, per share, or per unit amounts)
(h) | Other Business Combinations |
During 2021, the Company completed other business combinations which were not material to the consolidated financial statements. The purpose of these acquisitions was to expand the Company’s growth in the respective regions and enter the rapidly growing e-commerce industry. The goodwill associated with these acquisitions is primarily attributable to the workforce of the acquired businesses and synergies and strategic benefits provided by the expansion of the Company’s offerings in those regions. $5.8 million of goodwill from these acquisitions is amortizable for income tax purposes.
In connection with these other business combinations, BGLH and Lineage OP issued equity interests to the sellers in the amount of $44.4 million and $5.0 million, respectively, as consideration for certain equity interests. The fair value of the equity issued was the price at which equity was issued to third-party investors in arms’ length transactions in connection with other BGLH or Lineage OP capital raising activities. The equity interests were contributed to the Company on the corresponding acquisition date.
2021 Real Estate Acquisitions
During the year ended December 31, 2021, the Company acquired eight properties qualifying as asset acquisitions under ASC 805 for total cash consideration of $217.6 million and equity consideration of $16.3 million.
Updates Relating to Prior Period Acquisitions
(a) | Flexible Automation Innovative Solutions NV |
On April 15, 2020, the Company acquired 50.78% of the outstanding equity interests of FAIS, as previously defined. FAIS is based in Belgium and specializes in automation commissioning, a key step in the building automation process. The fair value of the consideration transferred for FAIS was $8.0 million, which consisted of $4.7 million of cash and $3.3 million of deferred cash consideration. The deferred cash consideration was payable in five equal annual installments commencing on the first anniversary of the closing date.
After five years from the purchase date, and up to fifteen years after the purchase date, the noncontrolling shareholders have the ability to sell to the Company its shares at a fixed price in accordance with the purchase agreement. In October 2022, the Company acquired the remaining 49.22% noncontrolling shareholders’ interest of FAIS that was not previously acquired in 2020 in exchange for total consideration of $10.0 million. In conjunction with the purchase of the noncontrolling shareholders’ interest, the Company also paid $1.9 million to settle the remaining balance of deferred cash consideration outstanding. See Note 2, Capital structure and noncontrolling interests for further details.
(b) | Southern Cold Storage |
On July 31, 2020, the Company, through an asset purchase agreement, acquired substantially all of the assets of Southern Cold Storage Company, L.L.C., Southern College Storage Company of Alabama, L.L.C., B.R. Distribution Co., Inc., A Freight Solution, LLC, B.R. Distribution Co. and certain real property from Southern Cold Storage Realty, LLC, Mc B.R. Management Company, Inc. and Wooddale Holdings, LLC (collectively, “SCS”) for $31.2 million of cash consideration and $3.0 million of contingently issuable equity. SCS provides transportation, handling, and dry
F-43
Table of Contents
LINEAGE, INC. AND SUBSIDIARIES
Notes to Consolidated Financial Statements
(dollars in millions, except number of shares, per share, or per unit amounts)
and cold storage of products through its two facilities located in Alabama and Louisiana. The purchase agreement contains contingent consideration in the form of equity interests in Lineage OP, which shall be issued if the customer at the Alabama facility does not exercise its purchase option in the agreement in 2022 or 2027. The customer did not exercise the first option in 2022. The fair value of the contingent consideration liability is $2.3 million and $4.3 million as of December 31, 2023 and 2022, respectively.
(c) | Lundsoe Kol & Frys A/S |
On October 26, 2020, the Company acquired all the outstanding equity interests of Lundsoe Kol & Frys A/S (“Lundsoe”) for $20.5 million of cash consideration and $3.8 million of contingent consideration. Lundsoe provides handling, storage, logistics, and value-added services for temperature-sensitive commodities at its five facilities in Denmark. The contingent consideration arrangement requires additional earnout consideration of up to $4.3 million to be paid to the sellers if certain EBITDA targets are met through 2022. Based on actual EBITDA results during the earnout period ending on December 31, 2022, the minimum earnout target was not achieved, and no further consideration is owed to the sellers under the terms of the asset purchase agreement.
Contingent consideration of $4.0 million was recorded in Other long-term liabilities on the consolidated balance sheet as of December 31, 2021. Expenses (gains) recorded within Acquisition, transaction, and other expense in the consolidated statements of operations and comprehensive income (loss) resulting from the remeasurement of the contingent consideration were ($3.8) million and $0.4 million for the years ended December 31, 2022 and 2021, respectively.
(d) | Iowa Cold Storage, LLC |
During the year ended December 31, 2022, the Company transferred total consideration of $13.1 million to settle a contingent consideration arrangement for the 2019 acquisition of substantially all of the assets of Iowa Cold. The consideration transferred included $11.5 million in cash and, at the election of the sellers, $1.6 million of equity interests issued by Lineage OP.
Contingent consideration related to Iowa Cold was $13.1 million as of December 31, 2021, included in Accounts payable and accrued liabilities on the consolidated balance sheet. Expenses recorded to Acquisition, transaction, and other expense within the consolidated statements of operations and comprehensive income (loss) resulting from the remeasurement of the contingent consideration were $6.6 million for the year ended December 31, 2021.
(e) | H&S Coldstores |
During the year ended December 31, 2023, the Company transferred cash consideration of $7.6 million to settle a contingent consideration arrangement for the 2022 acquisition of H&S Coldstores Holding B.V (“H&S Coldstores”). Amounts related to H&S Coldstores contingent consideration on the consolidated balance sheet as of December 31, 2022 were recorded to Accounts payable and accrued liabilities.
F-44
Table of Contents
LINEAGE, INC. AND SUBSIDIARIES
Notes to Consolidated Financial Statements
(dollars in millions, except number of shares, per share, or per unit amounts)
(5) Property, plant, and equipment
Property, plant, and equipment, net consists of the following:
December 31, 2023 | December 31, 2022 | Estimated Useful Life (Years) | ||||||||
Buildings, building improvements, and refrigeration equipment | $ | 8,544.4 | $ | 7,866.2 | 1 — 40 | |||||
Land and land improvements | 1,446.3 | 1,363.4 | 15 — Indefinite | |||||||
Machinery and equipment | 1,316.3 | 1,135.5 | 5 — 20 | |||||||
Railcars | 534.5 | 508.0 | 7 — 50 | |||||||
Furniture, fixtures, and equipment | 563.1 | 328.9 | 1 — 7 | |||||||
|
|
|
| |||||||
Gross property, plant, and equipment | 12,404.6 | 11,202.0 | ||||||||
Less accumulated depreciation | (2,266.2 | ) | (1,751.2 | ) | ||||||
Construction in progress | 432.1 | 653.1 | ||||||||
|
|
|
| |||||||
Property, plant, and equipment, net | $ | 10,570.5 | $ | 10,103.9 | ||||||
|
|
|
|
For the years ended December 31, 2023, 2022, and 2021 the Company recorded impairment charges related to property, plant, and equipment of $1.7 million, $0.6 million, and $7.1 million, respectively, which are included in Restructuring and impairment expense in the Company’s consolidated statements of operations and comprehensive income (loss).
During each of the years ended December 31, 2023, 2022, and 2021 the Company capitalized interest related to construction projects of $13.1 million, $8.6 million, and $6.6 million, respectively.
(6) Goodwill and other intangible assets, net
Changes in the carrying amount of goodwill for each reportable segment for the years ended December 31, 2023 and 2022 are as follows:
Global Warehousing | Global Integrated Solutions | Total | ||||||||||
Balance, December 31, 2021 | $ | 2,394.0 | $ | 433.8 | $ | 2,827.8 | ||||||
Goodwill acquired1 | 372.0 | 206.4 | 578.4 | |||||||||
Foreign currency translation | (88.3 | ) | (13.0 | ) | (101.3 | ) | ||||||
|
|
|
|
|
| |||||||
Balance, December 31, 2022 | 2,677.7 | 627.2 | 3,304.9 | |||||||||
Goodwill acquired1 | 33.8 | 17.5 | 51.3 | |||||||||
Less: Divestiture1 | — | (6.3 | ) | (6.3 | ) | |||||||
Foreign currency translation | 38.0 | 6.0 | 44.0 | |||||||||
|
|
|
|
|
| |||||||
Balance, December 31, 2023 | $ | 2,749.5 | $ | 644.4 | $ | 3,393.9 | ||||||
|
|
|
|
|
|
In the first quarter of 2023, the Company identified a change in its reporting structure, which resulted in a change in its reporting units. The Company reassigned carrying values of goodwill to the new reporting units using the relative fair value allocation approach as of March 31, 2023. The Company tested goodwill for impairment before and after the change, noting no impairment identified. The
1 | See Note 4, Business combinations, asset acquisitions, and divestitures for details. |
F-45
Table of Contents
LINEAGE, INC. AND SUBSIDIARIES
Notes to Consolidated Financial Statements
(dollars in millions, except number of shares, per share, or per unit amounts)
reporting units’ fair values were estimated using a combination of the income approach and the market approach. The goodwill allocation and the tests for impairment of goodwill required the Company to make several estimates, including projected future cash flows, capital requirements, and discount rates, to determine the fair value of the goodwill reporting units. The quantitative analysis showed that the fair value of each reporting unit exceeded its respective carrying value as of March 31, 2023.
The Company performed its annual goodwill impairment test in the fourth quarter of 2023 and 2022, consisting of a qualitative assessment, which considered factors such as market conditions, valuations of recent business combinations of the Company, and internal forecasts. The Company determined that it was not more likely than not that the fair values of its reporting units were less than their respective carrying values. As such, no goodwill impairment has been recorded as of December 31, 2023 and 2022.
The following are the Company’s total other intangible assets as of:
December 31, 2023 | December 31, 2022 | Useful Life (Years) | ||||||||||||||||||||||||||
Gross Carrying Amount | Accumulated Amortization | Net Carrying Amount | Gross Carrying Amount | Accumulated Amortization | Net Carrying Amount | |||||||||||||||||||||||
Customer relationships | $ | 1,506.7 | $ | (343.3 | ) | $ | 1,163.4 | $ | 1,434.9 | $ | (243.7 | ) | $ | 1,191.2 | 2 — 28 | |||||||||||||
In-place leases | 98.1 | (20.5 | ) | 77.6 | 108.9 | (22.3 | ) | 86.6 | 2 — 31 | |||||||||||||||||||
Technology | 31.5 | (5.0 | ) | 26.5 | 31.5 | (1.8 | ) | 29.7 | 10 | |||||||||||||||||||
Trade names | 24.2 | (20.7 | ) | 3.5 | 22.7 | (18.3 | ) | 4.4 | 1 — 15 | |||||||||||||||||||
Other | 19.9 | (10.9 | ) | 9.0 | 19.8 | (7.9 | ) | 11.9 | 4 — 17 | |||||||||||||||||||
|
|
|
|
|
|
|
|
|
|
|
| |||||||||||||||||
Amortizing other intangible assets | 1,680.4 | (400.4 | ) | 1,280.0 | 1,617.8 | (294.0 | ) | 1,323.8 | ||||||||||||||||||||
Trade names – indefinite | — | — | — | 7.6 | — | 7.6 | Indefinite | |||||||||||||||||||||
|
|
|
|
|
|
|
|
|
|
|
| |||||||||||||||||
Other intangible assets | $ | 1,680.4 | $ | (400.4 | ) | $ | 1,280.0 | $ | 1,625.4 | $ | (294.0 | ) | $ | 1,331.4 | ||||||||||||||
|
|
|
|
|
|
|
|
|
|
|
|
During the years ended December 31, 2023 and 2022, the Company derecognized fully-amortized intangible assets and the associated accumulated amortization totaling $13.2 million and $25.0 million, respectively.
During the fourth quarter of 2023, the Company recorded an impairment loss of $7.0 million on its indefinite-lived trade name, included in Restructuring and impairment expense in the consolidated statements of operations and comprehensive income (loss), as the Company no longer plans to utilize this trade name indefinitely. The trade name has been reclassified to definite-lived as of December 31, 2023. To perform the quantitative impairment test, the Company estimated the fair value of the asset using the income approach based on discounted future cash flows.
Intangible assets acquired during the years ended December 31, 2023 and 2022 have weighted-average amortization periods as follows:
December 31, 2023 | December 31, 2022 | |||||||
All acquired intangible assets | 16 Years | 12 Years | ||||||
By asset class: | ||||||||
Customer relationships | 16 Years | 13 Years | ||||||
In-place leases | N/A | 10 Years | ||||||
Trade names | 1 Year | 10 Years | ||||||
Technology | N/A | 10 Years |
F-46
Table of Contents
LINEAGE, INC. AND SUBSIDIARIES
Notes to Consolidated Financial Statements
(dollars in millions, except number of shares, per share, or per unit amounts)
Estimated future amortization to be incurred from other intangible assets for each of the next five years and thereafter is as follows:
Year ending December 31: | ||||
2024 | $ | 113.3 | ||
2025 | 110.4 | |||
2026 | 107.3 | |||
2027 | 104.7 | |||
2028 | 104.3 | |||
2029 and thereafter | 740.0 | |||
|
| |||
Total | $ | 1,280.0 | ||
|
|
(7) | Equity method investments |
The Company’s beneficial ownership in investments accounted for under the equity method is shown below as of December 31:
2023 | 2022 | 2021 | ||||||||||
Carolina Cold Storage, LP (U.S.) | 50.0 | % | 50.0 | % | 50.0 | % | ||||||
Exploitatie Bodegraven v.o.f. (Netherlands) | — | % | 50.0 | % | 50.0 | % | ||||||
Vastgoed Bodegraven v.o.f. (Netherlands) | — | % | 50.0 | % | 50.0 | % | ||||||
Sinotrans PFS Cold Chain Logistics Co., Ltd. (China) | 50.0 | % | 50.0 | % | 50.0 | % | ||||||
Kloosterboer Equity Method Investments: | ||||||||||||
Windpark Kloosterboer B.V. (Netherlands) | 50.0 | % | 50.0 | % | 50.0 | % | ||||||
Windpark Kloosterboer II Beheer B.V. (Netherlands) | 50.0 | % | 50.0 | % | 50.0 | % | ||||||
Flushing Shipping Agencies B.V. (Netherlands) | 50.0 | % | 50.0 | % | 50.0 | % | ||||||
Bayside Port Corporation (Canada) | 36.0 | % | 36.0 | % | 36.0 | % | ||||||
Shanghai United Cold Chain Logistics Co., Ltd. (China) | 30.0 | % | 30.0 | % | 30.0 | % | ||||||
Reefer Terminal A.I.E. (Spain) | 30.0 | % | 30.0 | % | — | % | ||||||
Ndustrial.io. (U.S.) | 27.8 | % | 27.8 | % | 27.8 | % | ||||||
Emergent Cold LatAm Holdings, LLC (Cayman Islands) | 9.0 | % | 9.0 | % | 10.0 | % |
The Company has an investment with a beneficial ownership interest of less than 20% that is accounted for under the equity method, as the Company’s beneficial ownership interest in this entity is similar to a partnership interest.
Changes in the Company’s investments accounted for under the equity method during the years ended December 31, 2023, 2022, and 2021 are as follows:
(a) | Carolina Cold Storage, LP |
On December 1, 2021, the Company purchased a Smithfield, Virginia facility owned by Carolina Cold Storage, LP (“CCSLP”) as well as all assets associated with the facility for a purchase price of $11.2 million, including the extinguishment of a preexisting receivable. The Company also assumed certain liabilities from CCSLP in the transaction. CCSLP recognized a gain on disposal of $5.0 million related to this transaction. Lineage’s portion of this gain was reduced from the recognized cost basis of the assets acquired.
F-47
Table of Contents
LINEAGE, INC. AND SUBSIDIARIES
Notes to Consolidated Financial Statements
(dollars in millions, except number of shares, per share, or per unit amounts)
(b) | Exploitatie Bodegraven v.o.f. and Vastgoed Bodegraven v.o.f. |
On April 1, 2021, a third-party executed a purchase option with respect to a facility owned and operated by Exploitatie Bodegraven v.o.f. and Vastgoed Bodegraven v.o.f. (collectively, “Bodegraven”) for $10.1 million. A portion of this payment was used to repay the outstanding debt of this facility.
On March 15, 2023, the Company dissolved its interest in Bodegraven, terminating the Company’s partnership.
(c) | Ndustrial.io |
In April 2021, the Company participated in Ndustrial.io’s capital raise and contributed $0.3 million out of a total of $6.0 million. As a result of the capital raise, the Company’s equity interest in Ndustrial.io was diluted from 40.1% to 27.8% and the Company recognized a gain on dilution of its investment of $1.3 million in Other nonoperating income (expense), net in the consolidated statements of operations and comprehensive income (loss) for the year ended December 31, 2021.
(d) | Emergent Cold LatAm Holdings, LLC |
The Company acquired a 10.0% interest in Emergent Cold LatAm Holdings, LLC (“LatAm”) in July 2021. Due to additional LatAm capital raising activities that have occurred since, the Company’s ownership percentage was 9.0% as of December 31, 2023 and December 31, 2022. LatAm is organized in the Cayman Islands. The Company has committed to invest up to a total of $108.0 million in LatAm. The Company has contributed a total of $70.4 million, of which the Company invested $31.4 million and $12.2 million during the years ended December 31, 2023 and 2022, respectively. The Company has an option to purchase the remaining equity interests in LatAm during a period beginning on the third anniversary and expiring on the sixth anniversary of its initial investment date.
On August 2, 2021, the Company sold its interests in Emergent Cold US 2 LLC, Emergent LatAm Holdco Ltd, Emergent Cold Peru S.A.C., Emergent UK 3 Ltd., Emergent MX Holdco Ltd., and Emergent MX Holdco 2 Ltd. (collectively, the “Latin American Subsidiaries”) to LatAm. The operations of the Latin American Subsidiaries principally consisted of the operation of a cold storage facility in Peru. The sale of the Latin American Subsidiaries is not considered to be a strategic shift that has had or will have a major effect on the Company’s operations and therefore, it did not meet the criteria of discontinued operations.
The net assets of the Latin American Subsidiaries totaled $47.9 million and were derecognized as of the date of the sale. LatAm paid the Company a total of $45.4 million, and the resulting pre-tax loss on the sale of the Latin American Subsidiaries of $2.5 million is recognized as a component of Other nonoperating income (expense), net in the consolidated statements of operations and comprehensive income (loss) for the year ended December 31, 2021.
F-48
Table of Contents
LINEAGE, INC. AND SUBSIDIARIES
Notes to Consolidated Financial Statements
(dollars in millions, except number of shares, per share, or per unit amounts)
(8) | Prepaid expenses and other current assets |
Prepaid expenses and other current assets consists of the following:
December 31, 2023 | December 31, 2022 | |||||||
Prepaid expenses | $ | 71.8 | $ | 83.2 | ||||
Other current assets | 29.7 | 21.3 | ||||||
|
|
|
| |||||
Total | $ | 101.5 | $ | 104.5 | ||||
|
|
|
|
(9) | Income taxes |
Components of earnings before income taxes
The following table summarizes the components of earnings before income taxes for the years ended December 31:
2023 | 2022 | 2021 | ||||||||||
Domestic | $ | 13.3 | $ | (1.8 | ) | $ | (160.8 | ) | ||||
Foreign | (123.4 | ) | (68.2 | ) | (45.0 | ) | ||||||
|
|
|
|
|
| |||||||
Net income (loss) before income taxes | $ | (110.1 | ) | $ | (70.0 | ) | $ | (205.8 | ) | |||
|
|
|
|
|
|
Summary of current and deferred income taxes
Income tax expense (benefit) for the years ended December 31 is summarized as follows:
2023 | 2022 | 2021 | ||||||||||
Current tax expense (benefit): | ||||||||||||
U.S. – Federal | $ | 18.3 | $ | 16.7 | $ | 16.2 | ||||||
U.S. – State | 8.2 | 3.3 | 13.6 | |||||||||
Foreign | 17.7 | 27.6 | 9.9 | |||||||||
|
|
|
|
|
| |||||||
Subtotal | 44.2 | 47.6 | 39.7 | |||||||||
Deferred tax expense (benefit): | ||||||||||||
U.S. – Federal | (15.4 | ) | (17.7 | ) | (22.2 | ) | ||||||
U.S. – State | (7.7 | ) | (4.4 | ) | (15.3 | ) | ||||||
Foreign | (35.0 | ) | (19.5 | ) | (31.5 | ) | ||||||
|
|
|
|
|
| |||||||
Subtotal | (58.1 | ) | (41.6 | ) | (69.0 | ) | ||||||
|
|
|
|
|
| |||||||
Income tax expense (benefit) | $ | (13.9 | ) | $ | 6.0 | $ | (29.3 | ) | ||||
|
|
|
|
|
|
F-49
Table of Contents
LINEAGE, INC. AND SUBSIDIARIES
Notes to Consolidated Financial Statements
(dollars in millions, except number of shares, per share, or per unit amounts)
Income tax expense (benefit) attributable to net income (loss) before income taxes differs from the amounts computed by applying the U.S. statutory federal income tax rate of 21% to Net income (loss) before income taxes. The reconciliation between these amounts is as follows:
2023 | 2022 | 2021 | ||||||||||
Net income (loss) before income taxes | $ | (110.1 | ) | $ | (70.0 | ) | $ | (205.8 | ) | |||
Income tax expense (benefit): | ||||||||||||
U.S. statutory federal income tax rate | (23.1 | ) | (14.7 | ) | (43.2 | ) | ||||||
Foreign income taxed at rates other than 21% | (8.0 | ) | (5.4 | ) | (3.9 | ) | ||||||
Uncertain tax provisions | (7.8 | ) | — | 5.6 | ||||||||
Valuation allowance movement | (0.3 | ) | 13.4 | 5.7 | ||||||||
Nondeductible expenses | 6.1 | 4.1 | 3.4 | |||||||||
Withholding tax | 0.8 | 1.8 | 0.5 | |||||||||
State and local tax | (0.3 | ) | (0.2 | ) | (4.9 | ) | ||||||
Tax adjustments related to REIT | 9.9 | 0.3 | 19.1 | |||||||||
Other | 8.8 | 6.7 | (11.6 | ) | ||||||||
|
|
|
|
|
| |||||||
Income tax expense (benefit) | $ | (13.9 | ) | $ | 6.0 | $ | (29.3 | ) | ||||
|
|
|
|
|
|
Deferred income taxes
2023 | 2022 | |||||||
Deferred tax assets: | ||||||||
Goodwill | $ | 73.0 | $ | 83.3 | ||||
Lease liabilities | 219.6 | 178.7 | ||||||
Accruals | 29.2 | 33.0 | ||||||
Net operating losses, credits, and other tax attribute carryforwards | 119.5 | 89.1 | ||||||
Other | 20.1 | 18.0 | ||||||
|
|
|
| |||||
Subtotal | 461.4 | 402.1 | ||||||
Valuation allowance | (57.0 | ) | (57.1 | ) | ||||
|
|
|
| |||||
Total | 404.4 | 345.0 | ||||||
Deferred tax liabilities: | ||||||||
Property, plant, and equipment | (318.1 | ) | (289.8 | ) | ||||
Other intangible assets | (182.5 | ) | (219.0 | ) | ||||
Lease assets | (190.1 | ) | (167.5 | ) | ||||
Investments in flow-through entities | (54.6 | ) | (52.8 | ) | ||||
Other | (18.8 | ) | (25.2 | ) | ||||
|
|
|
| |||||
Total | (764.1 | ) | (754.3 | ) | ||||
|
|
|
| |||||
Total net deferred tax assets and liabilities | $ | (359.7 | ) | $ | (409.3 | ) | ||
|
|
|
|
The net deferred tax liability above is presented in the accompanying consolidated balance sheets as follows:
2023 | 2022 | |||||||
Net deferred tax assets included within other assets | $ | 10.4 | $ | 4.2 | ||||
Net deferred tax liabilities included within deferred income tax liability | (370.1 | ) | (413.5 | ) | ||||
|
|
|
| |||||
Total net deferred tax assets and liabilities | $ | (359.7 | ) | $ | (409.3 | ) | ||
|
|
|
|
F-50
Table of Contents
LINEAGE, INC. AND SUBSIDIARIES
Notes to Consolidated Financial Statements
(dollars in millions, except number of shares, per share, or per unit amounts)
As of December 31, 2023, there were operating loss carryforwards of $354.0 million related to U.S., state, and foreign net operating losses, of which $251.1 million do not expire and the remaining expire, if not utilized, from 2024 to 2044. There were also total tax credits of $3.5 million, of which $2.6 million expire, if not utilized, from 2024 to 2034, and the remaining $0.9 million expire, if not utilized, from 2024 to 2042.
In assessing the realizability of deferred tax assets, management considers whether it is more-likely-than-not that some portion of or all the deferred tax assets will not be realized. The ultimate realization of deferred tax assets is dependent upon the generation of future taxable income during the periods in which those temporary differences become deductible. Management considers the scheduled reversal of deferred tax liabilities (including the impact of available carryback and carryforward periods), projected future taxable income, and tax-planning strategies in making this assessment. Based upon the level of historical taxable income and projections for future taxable income over the periods in which the deferred tax assets are deductible, management believes it is more-likely-than-not that the Company will realize the benefits of these deductible differences, net of the existing valuation allowances on December 31, 2023 and 2022. The amount of the deferred tax asset considered realizable, however, could be reduced in the near term if estimates of future taxable income during the carryforward period are reduced.
The valuation allowance for deferred tax assets as of December 31, 2023 and 2022 was $57.0 million and $57.1 million, respectively. The change in valuation allowance was primarily related to certain U.S., Canada, and Australia deferred tax assets that, in the judgment of management, are not more-likely-than-not to be realized.
Uncertain tax positions
The beginning and ending balances of the Company’s uncertain tax positions are reconciled below for the years ended December 31:
2023 | 2022 | 2021 | ||||||||||
Total uncertain tax positions at January 1 | $ | 17.6 | $ | 11.1 | $ | 4.4 | ||||||
Increases related to positions taken in the current year | — | — | 6.5 | |||||||||
Increases related to positions taken in prior years | 0.7 | — | — | |||||||||
Current year acquisitions | — | 6.7 | 0.4 | |||||||||
Current year releases | (10.1 | ) | — | — | ||||||||
Foreign exchange (gain) loss | 0.3 | (0.2 | ) | (0.2 | ) | |||||||
|
|
|
|
|
| |||||||
Total uncertain tax positions at December 31 | $ | 8.5 | $ | 17.6 | $ | 11.1 | ||||||
|
|
|
|
|
|
The Company’s policy regarding interest and penalties related to uncertain tax positions is to record interest and penalties as an element of income tax expense. As of December 31, 2023, the Company had liabilities of $1.6 million of potential interest and penalties associated with uncertain tax positions.
The uncertain tax positions of $8.5 million as of December 31, 2023, if subsequently recognized, will affect the Company’s effective tax rate favorably at the time when such a benefit is recognized.
The Company believes the amount of gross uncertain tax positions that will be settled during the next twelve months cannot be reasonably estimated but will not be significant.
F-51
Table of Contents
LINEAGE, INC. AND SUBSIDIARIES
Notes to Consolidated Financial Statements
(dollars in millions, except number of shares, per share, or per unit amounts)
Other income tax updates
The 2015 through 2023 tax years generally remain subject to examination by U.S. federal, state, and foreign tax authorities.
The Company has analyzed its global cash requirements as of December 31, 2023 and has recorded a $0.6 million deferred tax liability related to foreign income and withholding tax that will be incurred with respect to the undistributed foreign earnings which are not permanently reinvested.
The Organization for Economic Co-operation and Development (“OECD”) has issued Pillar Two Model Rules introducing a new global minimum tax of 15% intended to be effective on January 1, 2024. While the U.S. has not yet adopted the Pillar Two rules, various other governments around the world are enacting legislation. The Company has consolidated revenue of more than €750 million per annum and therefore is in scope of the Pillar Two rules, which entail tax compliance obligations and can potentially lead to additional taxes where the effective tax rate in a jurisdiction is below 15%. The Company is continuing to evaluate the impact of proposed and enacted legislative changes as new guidance becomes available.
(10) | Debt |
Debt consists of the following at December 31:
2023 | 2022 | |||||||
Adjustable Rate Multi-Property Loan (CMBS 4), variable rate, due May 2024 | $ | 2,344.2 | $ | 2,350.0 | ||||
Credit Agreement – Term Loan A, variable rate, due December 2025 | 1,875.0 | 1,875.0 | ||||||
2021 Private Placement Guaranteed Senior Notes, fixed rates, due August 2026-2031 | 1,443.4 | 1,411.3 | ||||||
Adjustable Rate Multi-Property Loan (CMBS 5), variable rate, due November 2024 | 1,297.5 | 1,297.5 | ||||||
Credit Agreement – Revolving Credit Facility, variable rate, due December 2024 | 1,205.3 | 973.1 | ||||||
2022 Private Placement Guaranteed Senior Notes, fixed rates, due August 2027-2032 | 264.9 | 256.2 | ||||||
MetLife Real Estate Lending, LLC – iStar, fixed rate 4.51%, due October 2028 | 228.0 | 228.0 | ||||||
MetLife Real Estate Lending, LLC – Richland, fixed rate 4.00%/4.10%, due January 2026 | 164.9 | 167.0 | ||||||
MetLife Real Estate Lending, LLC – Cool Port Oakland, variable rate, due March 2024 | 76.7 | 79.2 | ||||||
Transportes Fuentes Group Term Loans, various rates, due January 2024 – July 2028 | 28.2 | 40.2 | ||||||
Other debt, various rates and maturities | 80.5 | 97.9 | ||||||
|
|
|
| |||||
Total debt | 9,008.6 | 8,775.4 | ||||||
Less current portion long-term debt | (24.3 | ) | (36.4 | ) | ||||
Less deferred financing costs | (23.3 | ) | (37.5 | ) | ||||
Less below-market debt | (5.9 | ) | (8.0 | ) | ||||
Plus above-market debt | 3.1 | 3.9 | ||||||
|
|
|
| |||||
Total long-term debt, net | $ | 8,958.2 | $ | 8,697.4 | ||||
|
|
|
|
F-52
Table of Contents
LINEAGE, INC. AND SUBSIDIARIES
Notes to Consolidated Financial Statements
(dollars in millions, except number of shares, per share, or per unit amounts)
(a) | Adjustable rate multi-property loan (CMBS 4) |
On May 9, 2019, the Company entered into an adjustable rate multi-property loan agreement (“CMBS 4”) with Column Financial, Inc., Bank of America, N.A., and Morgan Stanley Bank, N.A. in the aggregate amount of $2,350.0 million.
The borrowing bears interest at one-month London Interbank Offered Rate (“LIBOR”) plus a spread of 1.61% and requires monthly interest-only payments, with a balloon repayment of the outstanding loans due upon maturity. The borrowing had an original maturity date of May 9, 2021, which may be extended through three one-year extension options that can be exercised if certain covenants are met. On May 6, 2021, the Company exercised the first extension option for CMBS 4, extending the maturity date to May 9, 2022. On March 14, 2022, the Company exercised the second extension option, extending the maturity date to May 9, 2023. Effective July 9, 2023, the CMBS 4 interest rate transitioned from LIBOR plus a spread of 1.61% to Secured Overnight Financing Rate (“SOFR”) plus a spread of 1.66%. On February 22, 2023, the Company exercised its final extension option, extending the maturity date to May 9, 2024.
(b) | Delayed-draw term loan facility |
On February 15, 2024, the Company entered into an unsecured delayed-draw term loan facility (“DDTL”), of up to $2,400.0 million. The involved parties, in addition to the Company, included a syndicate of banks, financial institutions, and other entities, with notable lending participants being JPMorgan Chase Bank, N.A. (“JPMorgan”) also acting as the administrative agent, and Wells Fargo Securities LLC also acting as a syndication agent. Under this facility, the full commitment is available for borrowing in a single drawing during the period commencing on the closing date and ending on May 10, 2024. The Company intends to use the proceeds from the DDTL to fully pay off the CMBS 4 facility at its scheduled maturity. In addition, the Company has the right to increase the size of the DDTL, up to $500.0 million, which would increase the total aggregate commitment amount to $2,900.0 million.
The DDTL matures one year from closing, on February 14, 2025. The DDTL may be extended through a twelve-month extension option that can be exercised if certain conditions are met and an extension fee of 0.25% is paid.
The agreement permits prepayments of principal, in whole or in part, at any time, without premium or penalty. There are also additional instances outlined that would trigger a mandatory principal prepayments under specified events. The Company is required to prepay 100% of the aggregate net cash proceeds from any issuance or offering of common or preferred equity securities through a Qualified IPO or a generally offered equity raise, any portion of net cash proceeds in excess of $100.0 million for any debt issuances (on a cumulative basis, excluding borrowings or repayments under the Company’s existing Credit Agreement), and any portion of net cash proceeds in excess of $100.0 million on any sale, transfer, or other disposition of any owned or ground-leased real or personal property or equity interests (on a cumulative basis).
On or before December 31, 2024, the Company must repay outstanding DDTL balances in an amount equal to at least 20% of the aggregate principal amount borrowed on the initial funding date.
Term loan borrowings under the DDTL facility will bear interest at a rate per annum equal to Term SOFR plus 0.10% (or “Adjusted Term SOFR”), plus the applicable margin ranging from 1.60% to 2.20% based on the Company’s total leverage ratio. Based on the Company’s existing total leverage
F-53
Table of Contents
LINEAGE, INC. AND SUBSIDIARIES
Notes to Consolidated Financial Statements
(dollars in millions, except number of shares, per share, or per unit amounts)
ratio, the interest rate expected to be in effect for the Company’s prospective DDTL borrowing is Adjusted Term SOFR plus 1.60%. Interest is payable in arrears on a quarterly basis. In addition, the DDTL facility is subject to a commitment fee of 0.20% on the average daily unused amount of the facility commitment.
(c) | Credit Agreement—Revolving Credit Facility and Term Loan A |
On December 22, 2020, the Company entered into a $2,300.0 million revolving credit and term loan agreement (collectively, the “Credit Agreement”) consisting of a $1,300.0 million multi-currency revolving credit facility (the “Revolving Credit Facility”) and a USD-denominated $1,000.0 million term loan (the “Term Loan A”) with various lenders. The Revolving Credit Facility and Term Loan A mature on December 22, 2024 and December 22, 2025, respectively. The Revolving Credit Facility may be extended through two six-month extension options that can be exercised if certain conditions are met.
Effective March 10, 2021, the Company amended the Credit Agreement, increasing availability under the Revolving Credit Facility to $1,800.0 million. The amendment also changed the terms by which the Credit Agreement borrowings are eligible to become unsecured, which primarily includes meeting various financial covenants, receiving an investment grade rating, and issuing pari-passu debt.
Effective August 16, 2021, the Company amended the Credit Agreement, increasing availability under the Revolving Credit Facility to $2,125.0 million and the Term Loan A commitment to $1,175.0 million. The amendment also changed the interest rate for GBP-denominated balances to the Sterling Overnight Index Average (“SONIA”). In conjunction with the Term Loan A upsizing, the Company recognized a loss of $0.2 million on extinguishment of debt.
On August 20, 2021, the Credit Agreement became unsecured in connection with the issuance of the 2021 Private Placement Guaranteed Senior Notes.
Effective June 28, 2022, the Company amended and restated the Credit Agreement, increasing the availability under the Revolving Credit Facility by $500.0 million to a total capacity of $2,625.0 million and increasing the Term Loan A commitment by $700.0 million to a total of $1,875.0 million. The $700.0 million borrowed on the Term Loan A was utilized to pay down amounts outstanding on the Revolving Credit Facility. In addition, the amendment changed the interest reference rate for USD-denominated balances from LIBOR to SOFR. The Company incurred fees and expenses of $7.2 million in connection with the upsizing, all of which was capitalized as deferred financing costs during the year ended December 31, 2022.
Borrowings under the Credit Agreement bear interest based on the Company’s elected borrowing type and borrowing currency. The contractual interest rate is equal to the applicable variable reference rate plus the margin rate. The applicable margin rate is based on the Company’s Total Leverage Ratio and the loan borrowing type. The applicable margin for Term Benchmark and Risk-Free Reference (“RFR”) loans ranges from 1.60% to 2.20% and Alternate Base Rate (“ABR”) loans range from 0.60% to 1.20%. Interest payments on the Revolving Credit Facility and Term Loan A are due quarterly and monthly, respectively.
F-54
Table of Contents
LINEAGE, INC. AND SUBSIDIARIES
Notes to Consolidated Financial Statements
(dollars in millions, except number of shares, per share, or per unit amounts)
The following table provides the details of the Company’s Credit Agreement:
December 31, 2023 | December 31, 2022 | |||||||||||||||||||||
Contractual Interest Rate (1) | Borrowing Currency | Carrying Amount (USD) | Contractual Interest Rate (1) | Borrowing Currency | Carrying Amount (USD) | |||||||||||||||||
Term Loan A | ||||||||||||||||||||||
USD | SOFR+1.60% | 1,875.0 | $ | 1,875.0 | SOFR+1.60% | 1,875.0 | $ | 1,875.0 | ||||||||||||||
Revolving Credit Facility |
| |||||||||||||||||||||
CAD | CDOR+1.60% | 448.0 | 338.1 | CDOR+1.60% | 611.0 | 451.1 | ||||||||||||||||
USD | SOFR+1.60% | 315.0 | 315.0 | SOFR+1.60% | — | — | ||||||||||||||||
AUD | BBSW+1.60% | 349.0 | 237.7 | BBSW+1.60% | 340.0 | 230.9 | ||||||||||||||||
EUR | EURIBOR+1.60% | 175.0 | 193.2 | EURIBOR+1.60% | 180.0 | 192.2 | ||||||||||||||||
DKK | CIBOR+1.60% | 498.0 | 73.7 | CIBOR+1.60% | 507.0 | 72.8 | ||||||||||||||||
NZD | BKBM+1.60% | 62.0 | 39.2 | BKBM+1.60% | 20.0 | 12.7 | ||||||||||||||||
NOK | NIBOR+1.60% | 86.0 | 8.4 | NIBOR+1.60% | 133.0 | 13.4 | ||||||||||||||||
|
|
|
| |||||||||||||||||||
Total Revolving Credit Facility | $ | 1,205.3 | $ | 973.1 | ||||||||||||||||||
|
|
|
|
1 | SOFR = Secured Overnight Financing Rate, CDOR = Canadian Dollar Offered Rate, BBSW = Bank Bill Swap Rate, EURIBOR = Euro Interbank Offered Rate, CIBOR = Copenhagen Interbank Offered Rate, BKBM = Bank Bill Reference Rate, NIBOR = Norwegian Interbank Offered Rate |
The contractual interest rate for the Credit Agreement is subject to a sustainability adjustment which can reduce the contractual rate with the Company’s achievement of certain metrics related to its sustainability initiatives. During the years ended December 31, 2023 and 2022, the contractual interest rate was reduced by 0.01% due to the sustainability adjustment. The commitment fee on the Revolving Credit Facility for any calendar quarter is (a) 0.15% per annum if the daily unused amount of the Revolving Commitment of the applicable Tranche is less than 50% and (b) 0.25% per annum if the daily unused amount of the Revolving Commitment of the applicable Tranche is greater than or equal to 50%. For outstanding borrowings as of December 31, 2023, the commitment fee was 0.15% for the Dollar Tranche, 0.25% for Alternative Currency Tranche One, and 0.25% Alternative Currency Tranche Two. For outstanding borrowings as of December 31, 2022, the commitment fee was 0.25% for the Dollar Tranche, 0.15% for the Alternative Currency Tranche One, and 0.25% for the Alternative Currency Tranche Two.
There were $66.5 million and $38.2 million letters of credit issued on the Company’s Revolving Credit Facility as of December 31, 2023 and 2022, respectively. The Company has the ability to issue up to $75 million as letters of credit, which can be increased to $100 million with consent from the issuing lenders. On August 31, 2023, the Company received consent from the issuing lenders, increasing the maximum letters of credit commitment to $100 million.
Effective February 15, 2024, the Company amended the Credit Agreement, increasing the Company’s borrowing capacity under the existing Revolving Credit Facility to $3,500.0 million. The amendment also resulted in a non-cash pay down of $875.0 million, on the Term Loan A using funds available on the Revolving Credit Facility. After the amendment, the remaining outstanding balance on the Term Loan A is $1,000.0 million. Additionally, the amendment gives the Company the right to increase the size of the existing Term Loan A, add one or more incremental term loans, and/or increase commitments under the the Revolving Credit Facility, up to $500.0 million, which would increase the total aggregate commitment amount of the existing Credit Agreement to $5,000.0 million. Furthermore, the amendment extended the Revolving Credit Facility and Term Loan A maturity dates
F-55
Table of Contents
LINEAGE, INC. AND SUBSIDIARIES
Notes to Consolidated Financial Statements
(dollars in millions, except number of shares, per share, or per unit amounts)
to February 15, 2028 and February 15, 2029, respectively. Under the terms of Credit Agreement, the Revolving Credit Facility may be extended through two six-month extension options that can be exercised if certain conditions are met.
(d) | 2021 Private Placement Guaranteed Senior Notes |
On August 20, 2021, the Company entered into a private placement financing consisting of a series of fixed-rate guaranteed, unsecured senior notes (“2021 Senior Notes”) equivalent to $1,500.0 million. Interest on the notes is due semi-annually in August and February, with the first interest payment due on February 20, 2022. The table below summarizes the terms of the 2021 Senior Notes:
Amount | Denomination | Interest rate | Maturity date | |||||||||
$300.0 | USD | 2.22 | % | 8/20/2026 | ||||||||
€128.0 | EUR | 0.89 | % | 8/20/2026 | ||||||||
£145.0 | GBP | 1.98 | % | 8/20/2026 | ||||||||
$375.0 | USD | 2.52 | % | 8/20/2028 | ||||||||
£130.0 | GBP | 2.13 | % | 8/20/2028 | ||||||||
€251.0 | EUR | 1.26 | % | 8/20/2031 |
The Company incurred fees and expenses of $8.4 million in connection with the issuance, all of which were capitalized as deferred financing costs during the year ended December 31, 2021.
(e) | Adjustable rate multi-property loan (CMBS 5) |
On October 21, 2020, the Company entered into an adjustable rate multi-property loan agreement (“CMBS 5”) between Goldman Sachs Bank USA, Morgan Stanley Bank, N.A., and JPMorgan Chase Bank, N.A. in the aggregate amount of $1,320.0 million.
The borrowing bears interest at one-month LIBOR plus a spread of 1.86% and requires monthly interest-only payments, with a balloon repayment of the outstanding loans due upon maturity. The borrowing has an original maturity date of November 9, 2023, which may be extended to November 9, 2025, through two one-year extension options that can be exercised if certain covenants are met. Effective July 9, 2023, the CMBS 5 interest rate transitioned from LIBOR plus a spread of 1.86% to SOFR plus a spread of 1.97%. On August 15, 2023, the Company exercised its first extension option, extending the current maturity date to November 9, 2024.
(f) | 2022 Private Placement Guaranteed Senior Notes |
On August 15, 2022, the Company entered into a private placement financing consisting of a series of fixed-rate guaranteed, unsecured senior notes (“2022 Senior Notes”) equivalent to $246.2 million. Interest on the notes is due semi-annually in February and August, with the first interest payment due on February 20, 2023. The table below summarizes the terms of the 2022 Senior Notes:
Amount | Denomination | Interest rate | Maturity date | |||||||||
€ 80.0 | EUR | 3.33 | % | 8/20/2027 | ||||||||
€110.0 | EUR | 3.54 | % | 8/20/2029 | ||||||||
€ 50.0 | EUR | 3.74 | % | 8/20/2032 |
F-56
Table of Contents
LINEAGE, INC. AND SUBSIDIARIES
Notes to Consolidated Financial Statements
(dollars in millions, except number of shares, per share, or per unit amounts)
The proceeds were primarily used to pay down the Senior Revolving Credit Facility balance outstanding. The Company incurred fees and expenses of $1.3 million in connection with the issuance, all of which were capitalized as deferred financing costs during the year ended December 31, 2022.
(g) | MetLife Real Estate Lending, LLC—iStar |
On June 27, 2019, the Company assumed a secured promissory note with MetLife Real Estate Lending LLC in the amount of $228.0 million. The secured promissory note bears interest at a fixed rate of 4.51%. The Company is required to make interest-only payments on a monthly basis, with a balloon repayment of the outstanding principal amount of the secured promissory note due on October 10, 2028.
(h) | MetLife Real Estate Lending, LLC —Richland |
On September 26, 2019, the Company assumed a loan with MetLife Real Estate Lending LLC in the amount of $110.0 million. The borrowing bears interest at a fixed rate of 4.00%. The Company was required to make monthly interest-only payments until January 1, 2021, when the Company was required to begin making monthly principal and interest payments. A balloon payment for the remaining outstanding principal is due on January 1, 2026.
On November 25, 2019, the Second Amendment to the loan agreement was entered into, for an additional borrowing of $61.0 million. The Second Amendment portion of the borrowing bears interest at a fixed rate of 4.10%. The Company is required to make interest-only payments through the maturity date of January 1, 2026, at which time a balloon payment of the outstanding principal balance is due.
(i) | MetLife Real Estate Lending LLC—Cool Port Oakland |
On March 25, 2019, the Company entered into a loan agreement with MetLife Real Estate Lending LLC in the amount of $81.3 million.
The borrowing has a variable interest rate of one-month LIBOR plus a spread of 1.65%. The loan requires monthly interest-only payments through March 2021, at which time the Company was required to begin making monthly principal payments. A balloon repayment of the outstanding principal amount was due on March 25, 2024.
On February 12, 2021, the Company amended the MetLife Real Estate Lending, LLC—Cool Port Oakland loan, extending interest-only payments through March 2022, at which time the Company began making monthly principal payments.
On May 19, 2023, the MetLife Real Estate Lending, LLC—Cool Port Oakland loan was amended to change the interest reference rate from one-month LIBOR plus a spread of 1.65% to one-month term SOFR plus a spread of 1.76%.
On February 6, 2024, the Company entered into a new $81.0 million loan agreement with MetLife Real Estate Lending LLC, designed as a refinancing arrangement, with a maturity date of March 5, 2029. This agreement enables the company to settle the outstanding balloon payment of $76.5 million associated with the previous loan due to mature in March 2024. After the repayment, debt issuance fees, and other closing costs, the Company received net cash proceeds of $3.5 million. The loan bears interest at SOFR plus a spread of 1.77% per annum. In addition, the agreement mandates monthly interest-only payments with a balloon repayment of the outstanding principal amount due upon maturity.
F-57
Table of Contents
LINEAGE, INC. AND SUBSIDIARIES
Notes to Consolidated Financial Statements
(dollars in millions, except number of shares, per share, or per unit amounts)
(j) | Transportes Fuentes Group Debt Assumed |
On September 1, 2022, as part of the Transportes Fuentes Group acquisition, the Company assumed euro denominated unsecured term loans with a total outstanding principal balance of €42.7 million (equivalent to $42.8 million on the acquisition date). The loans are with four different bank lenders and primarily bear interest at fixed rates ranging between 0.52% and 1.35%. The loans require monthly principal and interest payments through the remaining maturity dates between January 2024 and July 2028. As part of purchase accounting, the assumed debt instruments were determined to be below-market and a fair value adjustment of $7.5 million was recorded as of the acquisition date.
(k) | Other debt |
At December 31, 2023 and 2022, the Company held other debt instruments totaling $80.5 million and $97.9 million, respectively. Other debt consists primarily of term loan borrowings with various lenders, with various maturities between 2024 and 2044. The borrowings bear interest at fixed rates between 4.30% and 5.84%. The Company is required to make monthly principal and interest payments, with certain loans requiring a balloon repayment of the outstanding principal amount on the loan at maturity.
(l) | Deferred financing costs and gain (loss) on extinguishment of debt |
During the years ended December 31, 2023, 2022 and 2021, the Company recognized amortization of deferred financing costs recorded to Interest expense, net, of $19.0 million, $17.8 million, and $16.7 million, respectively.
At December 31, 2023 and 2022, the amount of unamortized deferred financing costs in Long-term debt, net on the consolidated balance sheets was $23.3 million and $37.5 million, respectively. At December 31, 2023 and 2022, the amount of unamortized deferred financing costs in Other assets on the consolidated balance sheets was $9.1 million and $13.7 million, respectively.
During the years ended December 31, 2022 and 2021 as the result of the payment of the outstanding principal balances on long-term debt, the Company recorded $1.4 million and ($4.1) million to Gain (loss) on extinguishment of debt, respectively.
(m) | Collateral |
The Credit Agreement was secured by equity pledges of the borrowers and guarantors until August 20, 2021, when the facility became unsecured. CMBS 4 and CMBS 5 are secured by certain assets in which the lender has been granted a security interest pursuant to the loan agreements. Unless otherwise noted, all other debt instruments are secured by various other assets specific to the underlying agreements.
F-58
Table of Contents
LINEAGE, INC. AND SUBSIDIARIES
Notes to Consolidated Financial Statements
(dollars in millions, except number of shares, per share, or per unit amounts)
(n) | Future maturities |
Future payments on long-term debt, if contractual extensions are executed, for each of the next five years and thereafter are as follows:
Year ending December 31: | ||||
2024 | $ | 24.3 | ||
2025 | 6,777.0 | |||
2026 | 792.7 | |||
2027 | 91.7 | |||
2028 | 770.5 | |||
2029 and thereafter | 552.4 | |||
|
| |||
Total debt | $ | 9,008.6 | ||
|
|
(11) | Derivative instruments and hedging activities |
(a) | Risk management objective of using derivatives |
The Company is exposed to certain risks arising from both its business operations and economic conditions. The Company principally manages its exposures to a wide variety of business and operational risks through management of its core business activities. The Company manages economic risks, including interest rate, foreign currency, liquidity, and credit risk, primarily by managing the amount, sources, and duration of its assets and liabilities and with the use of derivative financial instruments.
(b) | Cash flow hedges of interest rate and foreign currency risk |
The Company’s objectives in using interest rate derivatives are to manage its exposure to interest rate movements and to mitigate the potential volatility to interest expense. To accomplish this objective, the Company primarily uses interest rate swaps and caps as part of its interest rate risk management strategy. Interest rate swaps involve the receipt of variable amounts from a counterparty in exchange for the Company making fixed-rate payments over the life of the agreements without exchange of the underlying notional amount. Interest rate caps involve the receipt of variable amounts from a counterparty if interest rates rise above the strike rate on the contract in exchange for a premium. The Company’s designated interest rate swaps and caps hedge variable-rate interest payments using a first payments approach. The first payments approach allows an entity to hedge interest payments on a designated principal amount, rather than a specific, named debt issuance. Refer to Note 10, Debt for additional information.
In addition, the Company enters into derivative financial instruments to manage exposures that arise from business activities that result in the receipt or payment of future cash amounts due to changes in foreign currency rates.
F-59
Table of Contents
LINEAGE, INC. AND SUBSIDIARIES
Notes to Consolidated Financial Statements
(dollars in millions, except number of shares, per share, or per unit amounts)
(c) | Designated hedges |
As of December 31, 2023, the Company had the following outstanding interest rate and foreign currency derivatives that were designated as cash flow hedging instruments:
Number of Instruments | Notional | |||||||||||||||
Interest rate derivatives: | ||||||||||||||||
Interest rate swap | 2 | USD | 1,000.0 | |||||||||||||
Interest rate cap | 5 | USD | 2,000.0 | |||||||||||||
|
|
|
| |||||||||||||
Total | 7 | USD | 3,000.0 | |||||||||||||
|
|
|
|
Buy Notional | Sell Notional | |||||||||||||||
Foreign currency derivatives: | ||||||||||||||||
Buy EUR/Sell GBP forward | EUR | 31.8 | GBP | 27.7 | ||||||||||||
Buy USD/Sell GBP forward | USD | 4.9 | GBP | 3.9 |
The table below presents the effect of the Company’s derivatives that are designated as hedging instruments on the accompanying consolidated statements of operations and comprehensive income (loss) for the years ended December 31, 2023, 2022, and 2021.
Derivatives in Cash Flow Hedging Relationships | Amount of Gain (Loss) Recognized in OCI on Derivatives | Location of Gain (Loss) Reclassified from Accumulated OCI into Earnings | Amount of Gain (Loss) Reclassified from Accumulated OCI into Earnings | |||||||||||||||||||||||
2023 | 2022 | 2021 | 2023 | 2022 | 2021 | |||||||||||||||||||||
Included in effectiveness testing: |
| |||||||||||||||||||||||||
Interest rate contracts | $ | 33.6 | $ | 225.6 | $ | 25.2 | Interest expense, net | $ | 119.4 | $ | 37.2 | $ | (3.9 | ) | ||||||||||||
Foreign exchange contracts | (1.0 | ) | 1.7 | (1.8 | ) | Gain (loss) on foreign currency transactions, net | (0.3 | ) | 0.6 | (1.4 | ) | |||||||||||||||
Excluded from effectiveness testing and recognized in earnings based on an amortization approach: |
| |||||||||||||||||||||||||
Interest rate contracts | (5.4 | ) | (8.9 | ) | 13.0 | Interest expense, net | (1.1 | ) | (1.1 | ) | (1.0 | ) | ||||||||||||||
|
|
|
|
|
|
|
|
|
|
|
| |||||||||||||||
Total | $ | 27.2 | $ | 218.4 | $ | 36.4 | $ | 118.0 | $ | 36.7 | $ | (6.3 | ) | |||||||||||||
|
|
|
|
|
|
|
|
|
|
|
|
The estimated net amount of existing gains (losses) that are reported in Accumulated other comprehensive income (loss) as of December 31, 2023 that is expected to be reclassified into earnings within the next 12 months is $82.3 million.
(d) | Non-designated hedges |
As of December 31, 2023, the Company had the following outstanding derivatives that were not designated as hedging instruments:
Number of Instruments | Notional | |||||||||||
Interest Rate Derivatives | ||||||||||||
Interest rate cap | 8 | USD | 3,664.2 |
F-60
Table of Contents
LINEAGE, INC. AND SUBSIDIARIES
Notes to Consolidated Financial Statements
(dollars in millions, except number of shares, per share, or per unit amounts)
The table below presents the effect of the Company’s derivative financial instruments that are not designated as hedging instruments on the consolidated statements of operations and comprehensive income (loss) for the years ended December 31, 2023, 2022, and 2021.
Derivatives Not Designated as Hedging | Location of Gain (Loss) Recognized in | Amount of Gain (Loss) Recognized in Earnings on Derivatives | ||||||||||||
2023 | 2022 | 2021 | ||||||||||||
Interest rate contracts | Interest expense, net | $ | (2.4 | ) | $ | 1.8 | $ | (3.2 | ) | |||||
Foreign exchange contracts | Gain (loss) on foreign currency transactions, net | (0.3 | ) | 4.3 | (17.2 | ) | ||||||||
|
|
|
|
|
| |||||||||
Total | $ | (2.7 | ) | $ | 6.1 | $ | (20.4 | ) | ||||||
|
|
|
|
|
|
The table below presents the fair value of the Company’s derivative financial instruments as well as their classification on the consolidated balance sheets as of December 31:
2023 | 2022 | 2023 | 2022 | |||||||||||||
Derivatives designated as hedging instruments |
| |||||||||||||||
Balance sheet location | | Other assets | | | Other assets | | | Other liabilities | | | Other liabilities | | ||||
Interest rate contracts | $ | 134.9 | $ | 225.7 | $ | — | $ | — | ||||||||
Foreign exchange contracts | — | 0.9 | (0.2 | ) | (0.3 | ) | ||||||||||
|
|
|
|
|
|
|
| |||||||||
Total | $ | 134.9 | $ | 226.6 | $ | (0.2 | ) | $ | (0.3 | ) | ||||||
|
|
|
|
|
|
|
| |||||||||
Derivatives NOT designated as hedging instruments |
| |||||||||||||||
Balance sheet location | | Other assets | | | Other assets | | | Other liabilities | | | Other liabilities | | ||||
Interest rate contracts | $ | 2.6 | $ | 2.7 | $ | — | $ | — | ||||||||
Foreign exchange contracts | 0.3 | 1.3 | (0.3 | ) | (1.3 | ) | ||||||||||
|
|
|
|
|
|
|
| |||||||||
Total | $ | 2.9 | $ | 4.0 | $ | (0.3 | ) | $ | (1.3 | ) | ||||||
|
|
|
|
|
|
|
|
The notional value of the Company’s non-designated foreign currency derivatives is immaterial. Refer to Note 12, Fair value measurements for further information on the valuation of the Company’s derivatives.
(12) | Fair value measurements |
As of December 31, 2023 and 2022, the carrying amount of certain financial instruments, including cash and cash equivalents, restricted cash, accounts receivable, accounts payable, and accrued liabilities, were representative of their fair values due to the short-term maturity of these instruments.
The hierarchy for inputs used in measuring fair value is as follows:
Level 1 – Inputs represent unadjusted quoted prices for identical assets or liabilities exchanged in active markets.
Level 2 – Inputs include directly or indirectly observable inputs (other than Level 1 inputs), such as quoted prices for similar assets or liabilities exchanged in active or inactive markets, quoted prices for identical assets or liabilities exchanged in inactive markets, other inputs that may be considered in fair
F-61
Table of Contents
LINEAGE, INC. AND SUBSIDIARIES
Notes to Consolidated Financial Statements
(dollars in millions, except number of shares, per share, or per unit amounts)
value determinations of these assets or liabilities, such as interest rates and yield curves, volatilities, prepayment speeds, loss severities, credit risks, and default rates, and inputs that are derived principally from or corroborated by observable market data by correlation or other means. Pricing evaluations generally reflect discounted expected future cash flows, which incorporate yield curves for instruments with similar characteristics, such as credit ratings, estimated durations, and yields for other instruments of the issuer or entities in the same industry sector.
Level 3 – Inputs include unobservable inputs used in the measurement of assets and liabilities. Management is required to use its own assumptions regarding unobservable inputs because there is little, if any, market activity in the assets or liabilities and it may be unable to corroborate the related observable inputs. Unobservable inputs require management to make certain projections and assumptions about the information that would be used by market participants in valuing assets or liabilities.
The following table presents the fair value hierarchy levels of the Company’s assets and liabilities measured at fair value:
Fair Value Hierarchy | December 31, 2023 | December 31, 2022 | ||||||||||
Measured at fair value on a recurring basis: | ||||||||||||
Interest rate derivative financial instruments assets | Level 2 | $ | 137.5 | $ | 228.4 | |||||||
Foreign exchange forward contracts assets | Level 2 | $ | 0.3 | $ | 2.2 | |||||||
Foreign exchange forward contracts liabilities | Level 2 | $ | 0.5 | $ | 1.6 | |||||||
Acquisition related contingent consideration | Level 3 | $ | 4.8 | $ | 6.1 | |||||||
Measured at fair value on a non-recurring basis: | ||||||||||||
Long-lived assets written down: | ||||||||||||
Other investments (included in Other assets) | Level 3 | $ | 12.1 | $ | 11.5 | |||||||
Disclosed at fair value: | ||||||||||||
Long-term debt2 | Level 3 | $ | 8,767.5 | $ | 8,493.2 |
As of December 31, 2022, the Company’s Level 3 liabilities exclude $30.4 million of acquisition related contingent consideration for which the liability is determined based on actual financial results, as stipulated by the related purchase agreements. The final payout of the liabilities is subject only to a customary review period between the Company and the sellers. Refer to Note 4, Business combinations, asset acquisitions, and divestitures for further details on the Company’s acquisition related contingent consideration.
The Company is required to measure certain assets and liabilities at estimated fair value from time to time. These fair value measurements typically result from the application of specific accounting pronouncements under GAAP and are considered non-recurring fair value measurements.
In accordance with GAAP, the Company has elected to remeasure investments without readily determinable fair values only when an observable transaction occurs for an identical or similar investment of the same issuer. During the years ended December 31, 2023, 2022, and 2021, the Company recorded non-recurring fair value adjustments related to certain other investments without readily determinable fair values totaling ($0.1) million, $0.7 million, and $4.8 million, respectively, which are included within Other nonoperating income (expense), net in the consolidated statements of operations and comprehensive income (loss).
2 | The carrying value of long-term debt is disclosed in Note 10, Debt. |
F-62
Table of Contents
LINEAGE, INC. AND SUBSIDIARIES
Notes to Consolidated Financial Statements
(dollars in millions, except number of shares, per share, or per unit amounts)
The Company’s long-term debt is reported at the aggregate principal amount less unamortized deferred financing costs and any above or below market adjustments (as required in purchase accounting) on the accompanying consolidated balance sheets. For instruments with no prepayment option, the fair value is estimated utilizing a discounted cash flow model where the contractual cash flows (i.e., coupon and principal repayments) were discounted at a risk-adjusted yield reflective of both the time value of money and the credit risk inherent in each instrument. For instruments that include a prior-to-maturity prepayment option, the fair value is estimated using a Black-Derman-Toy lattice model. The inputs used to estimate the fair value of the Company’s debt instruments are comprised of Level 2 inputs, including risk-free interest rates, credit ratings, and financial metrics for comparable publicly listed companies, and Level 3 inputs, such as risk-adjusted credit spreads based on adjusted yields implied at issuance, and yield volatility (used for instruments with a prepayment option).
(13) | Leases |
The Company leases real estate, most significantly warehouses for use in operations, as well as equipment for use within owned and leased warehouses. The Company also leases vehicles, trailers and other equipment. The Company has not pledged any assets as collateral related to the Company’s existing leases as of December 31, 2023 and 2022.
Right-of-use asset balances as of December 31 are as follows:
2023 | 2022 | |||||||
Finance lease right-of-use assets | $ | 1,608.2 | $ | 1,559.8 | ||||
Less: accumulated amortization | (364.9 | ) | (274.2 | ) | ||||
|
|
|
| |||||
Finance lease right-of-use assets, net | $ | 1,243.3 | $ | 1,285.6 | ||||
|
|
|
| |||||
Operating lease right-of-use assets | $ | 891.6 | $ | 818.5 | ||||
Less: accumulated amortization | (167.9 | ) | (141.5 | ) | ||||
|
|
|
| |||||
Operating lease right-of-use assets, net | $ | 723.7 | $ | 677.0 | ||||
|
|
|
|
Lease liabilities are presented in the following line items in the consolidated balance sheets as of December 31:
2023 | 2022 | |||||||||||||||
Finance Leases | Operating Leases | Finance Leases | Operating Leases | |||||||||||||
Accounts payable and accrued liabilities | $ | 75.9 | $ | 60.3 | $ | 65.5 | $ | 60.5 | ||||||||
Long-term finance lease obligations | 1,304.5 | — | 1,323.5 | — | ||||||||||||
Long-term operating lease obligations | — | 692.1 | — | 632.3 | ||||||||||||
|
|
|
|
|
|
|
| |||||||||
Total lease obligations | $ | 1,380.4 | $ | 752.4 | $ | 1,389.0 | $ | 692.8 | ||||||||
|
|
|
|
|
|
|
|
F-63
Table of Contents
LINEAGE, INC. AND SUBSIDIARIES
Notes to Consolidated Financial Statements
(dollars in millions, except number of shares, per share, or per unit amounts)
Maturities of lease liabilities for each of the next five years and thereafter are as follows:
Year Ending December 31: | Finance Leases | Operating Leases | ||||||
2024 | $ | 156.3 | $ | 98.7 | ||||
2025 | 153.2 | 94.9 | ||||||
2026 | 151.0 | 92.5 | ||||||
2027 | 145.6 | 91.2 | ||||||
2028 | 136.2 | 82.5 | ||||||
2029 and thereafter | 1,691.0 | 781.9 | ||||||
|
|
|
| |||||
Total lease payments | 2,433.3 | 1,241.7 | ||||||
Less imputed interest | (1,052.9 | ) | (489.3 | ) | ||||
|
|
|
| |||||
Total | $ | 1,380.4 | $ | 752.4 | ||||
|
|
|
|
Supplemental consolidated balance sheets information related to leases as of December 31 is as follows:
2023 | 2022 | |||||||
Weighted average remaining lease term (in years): | ||||||||
Finance | 16.5 | 17.4 | ||||||
Operating | 15.9 | 17.2 | ||||||
Weighted average discount rate: | ||||||||
Finance | 6.8 | % | 6.8 | % | ||||
Operating | 6.5 | % | 6.5 | % |
The components of lease expense are as follows for the years ended:
2023 | 2022 | 2021 | ||||||||||
Finance lease cost: | ||||||||||||
Amortization of ROU assets | $ | 93.2 | $ | 88.2 | $ | 91.2 | ||||||
Interest on lease liabilities | 91.3 | 94.3 | 99.7 | |||||||||
Operating lease cost | 114.9 | 102.6 | 92.8 | |||||||||
Variable & short-term lease cost | 28.2 | 23.1 | 8.5 | |||||||||
Sublease income | (8.8 | ) | (17.6 | ) | (13.4 | ) | ||||||
|
|
|
|
|
| |||||||
Total lease cost | $ | 318.8 | $ | 290.6 | $ | 278.8 | ||||||
|
|
|
|
|
|
Supplemental cash flow information related to leases is as follows for the years ended:
2023 | 2022 | 2021 | ||||||||||
Cash paid for amounts included in the measurement of lease liability | ||||||||||||
Operating cash flows from finance leases | $ | 89.9 | $ | 93.7 | $ | 97.6 | ||||||
Finance cash flows from finance leases | 55.3 | 49.5 | 45.8 | |||||||||
Operating cash flows from operating leases | 92.4 | 93.7 | 85.2 | |||||||||
ROU assets obtained in exchange for lease obligations (excluding the effect of acquisitions) | ||||||||||||
Finance leases | $ | 37.4 | $ | 9.5 | $ | 55.1 | ||||||
Operating leases | 89.1 | 6.8 | 8.1 |
F-64
Table of Contents
LINEAGE, INC. AND SUBSIDIARIES
Notes to Consolidated Financial Statements
(dollars in millions, except number of shares, per share, or per unit amounts)
(14) | Failed sale-leaseback financing obligations |
In connection with the Kloosterboer acquisition, the Company assumed two failed sale-leaseback financing obligations. The Company’s outstanding obligations for failed sale-leasebacks of real estate-related long-lived assets as of December 31, 2023 and 2022, are as follows:
Maturity | 2023 | 2022 | ||||||||||
Arras | December 2035 | $ | 23.1 | $ | 24.0 | |||||||
Harnes 2 | June 2037 | 54.2 | 44.3 | |||||||||
|
|
|
| |||||||||
Total sale-leaseback financing obligations | $ | 77.3 | $ | 68.3 | ||||||||
|
|
|
|
Arras
In August 2020, Kloosterboer executed an agreement with a bank consortium to finance its construction of a new cold storage facility on a parcel of land previously owned by Kloosterboer in Arras, France (“Arras”). As part of this arrangement, the bank consortium purchased the land parcel from Kloosterboer and concurrently provided funding to construct the cold storage facility. The agreement stipulates that the bank consortium has legal ownership and title to the land parcel and the facility. The agreement also provides the Company with an option to purchase the leased assets for €1.00 at the end of the lease term, which makes the transaction a “failed sale” because the purchase price is nominal. The associated assets are reflected in the accompanying consolidated balance sheets within Property, plant, and equipment, net with a corresponding failed sale-leaseback financing obligation included within Accounts payable and accrued liabilities and Other long-term liabilities. Upon the acquisition of Kloosterboer, the Company recognized a liability related to Arras. The construction of Arras was substantially complete when Lineage acquired Kloosterboer and was completed in 2021.
The initial term of the Arras financing agreement is 15 years after the original execution of the agreement. Payments are made quarterly and are based on the total funding provided by the bank consortium to finance the construction work. The agreement’s termination date is December 31, 2035 and has an implicit interest rate of 0.15%. The earliest date that the purchase option can be exercised is 7 years after the completion of the Arras facility. Early exercise of the purchase option requires the Company to pay off the remaining balance of the sale-leaseback financing obligation at the time of exercise. The long-lived assets are depreciated on a straight-line basis over their remaining economic useful life.
As of December 31, 2023, the future minimum payments for the Arras sale-leaseback financing obligation are as follows:
Year ending December 31: | ||||
2024 | $ | 1.8 | ||
2025 | 1.8 | |||
2026 | 1.8 | |||
2027 | 1.9 | |||
2028 | 1.9 | |||
2029 and thereafter | 13.9 | |||
|
| |||
Total | $ | 23.1 | ||
|
|
F-65
Table of Contents
LINEAGE, INC. AND SUBSIDIARIES
Notes to Consolidated Financial Statements
(dollars in millions, except number of shares, per share, or per unit amounts)
Harnes 2
Kloosterboer was party to a separate sale-leaseback transaction related to a facility in Harnes, France. As part of this arrangement, a bank consortium agreed to purchase land from a third-party and finance improvements to an existing facility at the location. This agreement was determined to be a finance lease because it provided Kloosterboer with the ability to purchase the land and facility for a nominal price of €1.00 at the end of the lease term. Subsequently, Kloosterboer and the bank consortium amended the agreement and the bank consortium agreed to finance the construction of a second facility at the location, which would then be leased to Kloosterboer after construction completion (“Harnes 2”). This facility was added to the purchase option from the original lease. As Kloosterboer was already deemed to be reasonably certain to exercise the €1.00 purchase option on the land, the lease for Harnes 2 was considered a “failed sale.” The associated assets are reflected in the accompanying consolidated balance sheets within Property, plant, and equipment, net with a corresponding failed sale-leaseback financing obligation included within Accounts payable and accrued liabilities and Other long-term liabilities. Upon the acquisition of Kloosterboer, no asset or liability was recognized for the Harnes 2 financing obligation because the construction had not begun. The construction of the Harnes 2 facility was completed in 2023.
The initial term of the Harnes 2 financing agreement is 15 years after the original execution of the agreement. Payments are made quarterly and are based on the total funding provided by the bank consortium to finance the construction work. The agreement’s termination date is June 2037 and has an implicit interest rate of 0.19%. The earliest date that the purchase option can be exercised is 7 years after the completion of the improvements contemplated in the original finance lease. Early exercise of the purchase option requires the Company to pay off the remaining balance of the sale-leaseback financing obligation at the time of exercise. The long-lived assets are depreciated on a straight-line basis over their remaining economic useful life.
As of December 31, 2023, the future minimum payments for the Harnes 2 sale-leaseback financing obligation are as follows:
Year ending December 31: | ||||
2024 | $ | 3.5 | ||
2025 | 3.6 | |||
2026 | 3.6 | |||
2027 | 3.7 | |||
2028 | 3.8 | |||
2029 and thereafter | 36.0 | |||
|
| |||
Total | $ | 54.2 | ||
|
|
(15) | Employee benefit plans |
(a) | Multi-employer pension plans |
The Company participates in various multi-employer pension plans, which provide defined benefits to the Company’s covered U.S. union employees. A unique characteristic of a multi-employer plan compared to a single employer plan is that all plan assets are available to pay benefits of any plan participant. Separate asset accounts are not maintained for participating employers. This means that assets contributed by one employer may be used to provide benefits to employees of other participating employers. The Company’s funding policy is to contribute monthly the amount specified by the plans’
F-66
Table of Contents
LINEAGE, INC. AND SUBSIDIARIES
Notes to Consolidated Financial Statements
(dollars in millions, except number of shares, per share, or per unit amounts)
trustees. The Company contributed $1.3 million and $1.6 million to these plans during the years ended December 31, 2023 and 2022, respectively. There have been no significant changes that affect comparability of 2023 and 2022 contributions.
The Company’s contributions to these plans represent less than 5.0% of the total contributions made to the plans from all participating employers.
(b) | Salary-savings profit-sharing plans |
Under the Company’s Salary-Savings Profit-Sharing Plan (the “Savings Plan”), Savings Plan participants may contribute a percentage of their annual gross wages to the Savings Plan, and the Company contributes matching amounts based on participant contributions. Total Company cash contributions to the Savings Plan were $37.0 million and $33.9 million during the years ended December 31, 2023 and 2022, respectively.
(c) | Non-Qualified Deferred Compensation Plan |
On November 1, 2022, the Company adopted a non-qualified deferred compensation plan (the “NQDC Plan”). Under the provisions of the NQDC Plan, certain senior management employees are eligible to defer payout of a portion of their annual base salary, annual bonus (if one is paid) and/or future cash payouts of Value Creation Plan units (refer to Note 16, Stock-based compensation). The NQDC Plan was effective for compensation beginning on January 1, 2023.
The Company invests the compensation deferred by NQDC Plan participants into mutual fund investments and records a corresponding liability. The mutual fund investments are included within Other assets and the corresponding liability is included in Other long-term liabilities in the accompanying consolidated balance sheets. As of December 31, 2023, the balance of the mutual fund investments and the corresponding liability was $1.2 million and $1.2 million, respectively. During the year ended December 31, 2023, the Company recorded deferred compensation expense related to the NQDC Plan of $1.2 million. Changes in the fair value of the mutual fund investments and the corresponding change in the associated liability are included within Other nonoperating income (expense), net and General and administrative expense, respectively, in the accompanying consolidated statements of operations and comprehensive income (loss). These changes did not result in any material net impact to the consolidated statements of operations for the year ended December 31, 2023.
(16) | Stock-based compensation |
(a) | BGLH Restricted Class B Units |
Certain members of management and certain non-employee directors were granted interests in BGLH in the form of restricted Class B Units (“BGLH Restricted Units”). The Company fair values these BGLH Restricted Units as of the grant date based on the price of substantially similar units issued to third-party investors in arms’ length transactions in connection with other BGLH capital raising activities. The Company recognizes stock-based compensation expense over the vesting term. The Company accounts for these units as equity-based awards.
Stock-based compensation expense related to BGLH Restricted Units for the years ended December 31, 2023, 2022, and 2021 was $14.5 million, $8.9 million, and $5.1 million, respectively. As of December 31, 2023, there was $8.3 million of unrecognized noncash compensation cost related to unvested BGLH Restricted Units that is expected to be recognized over a weighted-average period of 0.8 years.
F-67
Table of Contents
LINEAGE, INC. AND SUBSIDIARIES
Notes to Consolidated Financial Statements
(dollars in millions, except number of shares, per share, or per unit amounts)
The following represents a summary of these units:
Units | Weighted average grant date fair value (in dollar per unit) | |||||||
Unvested as of December 31, 2020 | 73,914 | $ | 46.00 | |||||
|
|
|
| |||||
Awards granted in 2021 | 82,794 | 68.00 | ||||||
Awards vested in 2021 | (66,881 | ) | 50.84 | |||||
|
|
|
| |||||
Unvested as of December 31, 2021 | 89,827 | $ | 62.68 | |||||
|
|
|
| |||||
Awards granted in 2022 | 113,564 | 80.79 | ||||||
Awards vested in 2022 | (93,426 | ) | 64.94 | |||||
Awards forfeited in 2022 | (3,727 | ) | 80.50 | |||||
|
|
|
| |||||
Unvested as of December 31, 2022 | 106,238 | $ | 79.07 | |||||
|
|
|
| |||||
Awards granted in 2023 | 212,110 | 90.05 | ||||||
Awards vested in 2023 | (167,148 | ) | 83.76 | |||||
|
|
|
| |||||
Unvested as of December 31, 2023 | 151,200 | $ | 89.29 | |||||
|
|
|
|
(b) | Management Profits Interests Class C units |
LLH MGMT and LLH MGMT II interests were issued to members of management in the form of Management Profits Interests Class C units. These management interests generally vest over a three to five year time period, with the number of units vested based partially on meeting certain financial targets of the Company or individual performance metrics. Up to 105,630,252 and 105,505,553 Management Profits Interests Class C units were authorized to be issued as of December 31, 2023 and 2022, respectively.
The Company fair values these interests as of the grant date using the Black-Scholes model which was adjusted for the restriction period through a possible liquidity event. The key inputs in the valuation include a volatility factor (which ranged from 39% to 62%) and a risk free rate (which ranged from 0.23% to 4.68%), with vesting terms of 1.5 years to 2.5 years as time to maturity in the model. The Company recognizes stock-based compensation expense over the vesting term. The Company accounts for these units as equity-based awards. Stock-based compensation related to Management Profits Interests Class C units for each of the years ended December 31, 2023, 2022, and 2021 was $10.8 million, $7.9 million, and $9.5 million, respectively. As of December 31, 2023, there was $11.0 million of unrecognized noncash compensation cost related to unvested Management Profits Interests Class C units to be recognized over a weighted-average period of 1.3 years.
F-68
Table of Contents
LINEAGE, INC. AND SUBSIDIARIES
Notes to Consolidated Financial Statements
(dollars in millions, except number of shares, per share, or per unit amounts)
The following represents a summary of these units:
Units | Weighted average grant date fair value per unit | |||||||
Unvested as of December 31, 2020 | 9,291,749 | $ | 1.09 | |||||
|
|
|
| |||||
Awards granted in 2021 | 2,866,909 | 3.36 | ||||||
Awards vested in 2021 | (5,725,993 | ) | 1.74 | |||||
Awards forfeited in 2021 | (717,007 | ) | 1.76 | |||||
|
|
|
| |||||
Unvested as of December 31, 2021 | 5,715,658 | $ | 1.49 | |||||
|
|
|
| |||||
Awards granted in 2022 | 4,159,807 | 3.55 | ||||||
Awards vested in 2022 | (2,336,898 | ) | 2.93 | |||||
Awards forfeited in 2022 | (910,054 | ) | 2.75 | |||||
|
|
|
| |||||
Unvested as of December 31, 2022 | 6,628,513 | $ | 2.10 | |||||
|
|
|
| |||||
Awards granted in 2023 | 3,164,021 | 3.58 | ||||||
Awards vested in 2023 | (2,823,268 | ) | 3.26 | |||||
Awards forfeited in 2023 | (274,143 | ) | 2.13 | |||||
|
|
|
| |||||
Unvested as of December 31, 2023 | 6,695,123 | $ | 2.31 | |||||
|
|
|
|
As of December 31, 2023 and 2022, there were 21,091,532 and 17,909,147 outstanding Management Profits Interests Class C units that were fully vested, respectively. Fully vested Management Profits Interests Class C units may be redeemed in exchange for cash in connection with a tender redemption offer by Bay Grove Capital. LLH MGMT and LLH MGMT II also have the right to redeem the fully vested Management Profits Interests Class C units if the holder of the units terminates their employment with the Company for any reason.
During 2021, as part of a severance agreement, 1,275,450 units were immediately vested and $8.8 million was expensed to Restructuring and impairment expense in the consolidated statements of operations and comprehensive income (loss). These units were redeemed and will be paid over a six-year period. As these units became immediately vested and are to be settled in cash, the Company has accounted for these units as a liability, presented in Accounts payable and accrued liabilities and Other long-term liabilities on the consolidated balance sheets.
(c) | LLH Value Creation Plan units |
Certain employees have been granted notional units under the LLH Value Creation Plan (the “2015 LVCP”) in the form of appreciation rights that vest over a period of four years and upon the occurrence of a liquidity event. This plan covered awards from 2015 to 2020. A new LLH Value Creation Plan was established in 2021 (the “2021 LVCP”) that generally provides for the grant of similar appreciation rights that may also vest without the occurrence of a liquidity event if the Company achieves the target value as specified in the award agreements.
Upon full vesting, the awards under both the 2015 LVCP and 2021 LVCP entitle the recipient to a payment equal to the excess of the price of the Company’s shares at the time of full vesting, over the benchmark amount specified by the award agreement. In accordance with GAAP, until the full vesting conditions are probable of occurring, no expense is recognized for the awards. The Company believes the vesting requirement for all awards under both the 2015 LVCP and 2021 LVCP are not probable. As
F-69
Table of Contents
LINEAGE, INC. AND SUBSIDIARIES
Notes to Consolidated Financial Statements
(dollars in millions, except number of shares, per share, or per unit amounts)
of December 31, 2023, 2022, and 2021, the cumulative unrecognized stock compensation expense related to the units issued pursuant to the 2015 LVCP and 2021 LVCP was $37.0 million, $36.0 million, and $26.9 million, respectively.
(d) | Lineage Equity-Tracking Plan |
In connection with the Turvo acquisition described in Note 4, Business combinations, asset acquisitions, and divestitures, the Company granted cash-based incentive awards to certain Turvo employees. The awards vest over a period of two to three years. At the discretion of the Company, the value of forfeited awards may be reallocated to other employees who remain with the Company.
Upon vesting, the awards entitle the recipient to a payment equal to the original value of the award adjusted by a percentage equal to the growth in the value of Lineage since the acquisition date. If Lineage’s value drops below the value on the acquisition date, the payment will not drop beneath a floor value equal to the original value of the awards. The Company accounts for these units as liability-based awards.
Stock-based compensation related to these awards for the years ended December 31, 2023 and 2022 was $4.9 million and $2.9 million, respectively. As of December 31, 2023, there was $0.9 million of unrecognized stock-based compensation expense related to unvested awards.
(17) | Related-party balances |
The Company pays Bay Grove Management an operating services fee and reimburses certain expenses pursuant to an operating services agreement between Bay Grove Management and the Company. During the years ended December 31, 2023, 2022, and 2021, the Company recorded $10.7 million, $11.0 million, and $10.5 million of expenses in General and administrative expense for these operating services, respectively. As of December 31, 2023 and 2022, $2.6 million in operating services fees were owed to Bay Grove Management and included in Accounts payable and accrued liabilities in the accompanying consolidated balance sheets.
At December 31, 2023 and 2022, the Company accrued distributions payable in the amount of $109.9 million and $10.7 million, respectively. The distributions were subsequently paid in cash during January 2024 and January 2023, respectively. As of December 31, 2023, distributions payable consisted of $88.5 million payable by Lineage, Inc. to BGLH, $10.0 million payable by the Operating Partnership to Non-Company LPs, and $11.4 million payable by the Operating Partnership to BG Cold in connection with Founders Equity Share. As of December 31, 2022, distributions payable consisted entirely of Founders Equity Share due to BG Cold. See Note 2, Capital structure and noncontrolling interests, for further information.
The Company owns an investment stake in certain suppliers that are accounted for under the equity method of accounting, creating related-party relationships. The Company paid $9.2 million, $5.3 million, and $4.3 million to these suppliers for the years ended December 31, 2023, 2022, and 2021, respectively. Accounts payable and accrued liabilities includes $1.8 million and $0.5 million owed to these suppliers as of December 31, 2023 and 2022, respectively.
At December 31, 2023 and 2022, the Company had receivables due from employees of $1.0 million and $1.6 million, respectively, which were subsequently paid off in February 2024. At December 31, 2023 and 2022, the Company had additional related-party receivables, primarily with minority interest partners and equity method investees, of $6.3 million and $6.1 million, respectively. Related-party
F-70
Table of Contents
LINEAGE, INC. AND SUBSIDIARIES
Notes to Consolidated Financial Statements
(dollars in millions, except number of shares, per share, or per unit amounts)
receivables are included in Accounts receivable, net in the accompanying consolidated balance sheets. At December 31, 2023 and 2022, the Company had additional related-party payables, primarily with minority interest partners, of $2.4 million and $5.7 million, respectively. Related-party payables are included in Accounts payable and accrued liabilities in the accompanying consolidated balance sheets.
The Operating Partnership has issued notes to certain individual BGLH investors and Non-Company LPs in order to fund certain investor transactions. As of December 31, 2023 and 2022, these notes totaled $15.9 million and $25.0 million, respectively. These notes receivable are included in Accounts receivable, net and Other assets in the accompanying consolidated balance sheets.
During the years ended December 31, 2023, 2022, and 2021, the Company donated $5.0 million, $3.5 million, and $3.0 million to the Lineage Foundation for Good (the “Foundation”), respectively, which are recorded in General and administrative expense in the accompanying consolidated statements of operations and comprehensive income (loss). The Foundation was organized as a non-profit entity during 2021, and the Company has influence over the Foundation through board representation.
(18) | Commitments and contingencies |
(a) | Self-insured risks |
The Company is self-insured for workers’ compensation costs, with the Company’s workers’ compensation plan having an individual claim stop-loss deductible of $1.0 million. Self-insurance liabilities are determined by third-party actuaries. The Company has established restricted cash accounts with banks or directly with the insurers or letters of credit that are collateral for its self-insured workers’ compensation obligations. The combined amount included in Accounts payable and accrued liabilities and Other long-term liabilities relating to workers’ compensation liabilities as of December 31, 2023 and 2022 was $40.0 million and $36.3 million, respectively. The liability as of December 31, 2023 and 2022, represents the gross amount excluding amounts receivable from the insurers. The combined amount included in Prepaid expenses and other current assets and Other assets related to the receivables from insurers as of December 31, 2023 and 2022 was $10.9 million and $11.9 million, respectively.
The Company is also self-insured for a portion of employee medical costs. The Company has a medical plan with a retained deductible. Medical self-insurance liabilities are determined by third-party actuaries. The total included in Accounts payable and accrued liabilities relating to medical liabilities as of December 31, 2023 and 2022 was $14.7 million and $11.6 million, respectively.
(b) | Legal and regulatory proceedings |
The Company, from time to time and in the normal course of business, is party to various claims, lawsuits, arbitrations, and regulatory actions (collectively, “Claims”). In particular, as the result of numerous ongoing construction activities, the Company may be a party to construction and/or contractor related liens and claims, including mechanic’s and materialmen’s liens. The Company is also party to various Claims relating to commercial disagreements with customers or suppliers. Additionally, given the Company’s substantial workforce, and, in particular, its warehouse related workforce, the Company is party to various labor and employment related Claims, including, without limitation, Claims related to workers’ compensation, wage and hour, discrimination, and related matters. Finally, given the Company’s business of warehousing refrigerated food products and its utilization of anhydrous ammonia for its refrigeration systems (a known hazardous material), the
F-71
Table of Contents
LINEAGE, INC. AND SUBSIDIARIES
Notes to Consolidated Financial Statements
(dollars in millions, except number of shares, per share, or per unit amounts)
Company is subject to the jurisdiction of various U.S. regulatory agencies, including, without limitation, the Department of Agriculture, Food and Drug Administration, Environmental Protection Agency (“EPA”), Department of Justice, Occupational Safety and Health Administration, and various other agencies in the locations in which the Company operates. Management of the Company believes the ultimate resolution of these matters will not have a material adverse effect on the consolidated financial statements.
(c) | Environmental matters |
The Company is subject to a wide range of environmental laws and regulations in each of the locations in which the Company operates. Compliance with these requirements can involve significant capital and operating costs. Failure to comply with these requirements can result in civil or criminal fines or sanctions, claims for environmental damages, remediation obligations, the revocation of environmental permits, or restrictions on the Company’s operations.
The Company records accruals for environmental matters when it is probable that a liability has been incurred and the amount of the liability can be reasonably estimated based on current law and existing technologies. The Company adjusts these accruals periodically as assessment and remediation efforts progress or as additional technical or legal information become available. The Company has recorded nominal environmental liabilities in Accounts payable and accrued liabilities as of December 31, 2023 and 2022. The Company believes it is in compliance with applicable environmental regulations in all material respects. Under various U.S. federal, state, and local environmental laws, a current or previous owner or operator of real estate may be liable for the entire cost of investigating, removing, and/or remediating hazardous or toxic substances on such property. Such laws often impose liability, whether or not the owner or operator knew of, or was responsible for, the contamination. Even if more than one person may have been responsible for the contamination, each person covered by the environmental laws may be held responsible for the entire clean-up cost. There are no material unrecorded liabilities as of the periods ended December 31, 2023 and 2022. Most of the Company’s warehouses utilize anhydrous ammonia as a refrigerant. Anhydrous ammonia is classified as a hazardous chemical regulated by the EPA and various other agencies in the locations in which the Company operates, and an accident or significant release of anhydrous ammonia from a warehouse could result in injuries, loss of life, and property damage.
(d) | Occupational Safety and Health Act (OSHA) |
The Company’s warehouses located in the U.S. are subject to regulation under OSHA, which requires employers to provide employees with an environment free from hazards, such as exposure to toxic chemicals, excessive noise levels, mechanical dangers, heat or cold stress, and unsanitary conditions. The cost of complying with OSHA and similar laws enacted by states and other jurisdictions in which the Company operates can be substantial, and any failure to comply with these regulations could expose the Company to substantial penalties and/or liabilities to employees who may be injured at the Company’s warehouses. The Company records accruals for OSHA matters when it is probable that a liability has been incurred and the amount of the liability can be reasonably estimated. The Company believes that it is in compliance with all OSHA regulations in all material respects and that no material unrecorded liabilities exist as of December 31, 2023 and 2022.
F-72
Table of Contents
LINEAGE, INC. AND SUBSIDIARIES
Notes to Consolidated Financial Statements
(dollars in millions, except number of shares, per share, or per unit amounts)
(e) | Statesville, North Carolina |
On January 10, 2020, contractors and subcontractors were working on the blast cells at the Company’s freezer warehouse in Statesville, North Carolina when an incident occurred triggering the release of anhydrous ammonia at the facility, resulting in the death of a subcontractor and injury to another subcontractor, as well as damage to customers’ goods. Litigation is ongoing with respect to this incident, and while the Company believes it has a strong defense to any potential claims, the Company could be subject to losses in unknown amounts. The Company believes the ultimate outcome of this matter will not have a material adverse impact on its consolidated financial statements. No material costs have been incurred in relation to this matter.
(f) | Construction Commitments |
As of December 31, 2023, the Company had plans to purchase or construct assets, primarily related to new warehouses and expansions, which require an estimated $348.3 million to complete.
(19) | Accumulated other comprehensive income (loss) |
The Company reports activity in Accumulated other comprehensive income (loss) (“AOCI”) for foreign currency translation adjustments and unrealized gains and losses on interest rate and foreign currency hedges. Activity within AOCI is as follows for the years ended December 31:
2023 | 2022 | 2021 | ||||||||||
Foreign currency translation adjustments: | ||||||||||||
Balance at beginning of period | $ | (227.7 | ) | $ | (26.9 | ) | $ | 75.1 | ||||
Foreign currency translation adjustments | 88.5 | (221.5 | ) | (114.6 | ) | |||||||
Amounts allocated to Noncontrolling interests and Redeemable noncontrolling interests | (9.5 | ) | 27.7 | 14.6 | ||||||||
Reallocation due to change in Noncontrolling interest ownership percentage | (0.4 | ) | (7.0 | ) | (2.0 | ) | ||||||
|
|
|
|
|
| |||||||
Balance at end of period | $ | (149.1 | ) | $ | (227.7 | ) | $ | (26.9 | ) | |||
|
|
|
|
|
| |||||||
Derivatives: | ||||||||||||
Balance at beginning of period | $ | 190.3 | $ | 36.4 | $ | (0.2 | ) | |||||
Unrealized gain (loss) on foreign currency hedges | 27.2 | 218.4 | 36.4 | |||||||||
Net amount reclassified from AOCI to net income (loss) | (118.0 | ) | (36.7 | ) | 6.3 | |||||||
Tax effect | 3.9 | (10.1 | ) | (3.9 | ) | |||||||
Amounts allocated to Noncontrolling interests and Redeemable noncontrolling interests | 11.6 | (24.1 | ) | (4.9 | ) | |||||||
Reallocation due to change in Noncontrolling interest ownership percentage | 0.3 | 6.4 | 2.7 | |||||||||
|
|
|
|
|
| |||||||
Balance at end of period | $ | 115.3 | $ | 190.3 | $ | 36.4 | ||||||
|
|
|
|
|
| |||||||
Accumulated other comprehensive income (loss) | $ | (33.8 | ) | $ | (37.4 | ) | $ | 9.5 | ||||
|
|
|
|
|
|
F-73
Table of Contents
LINEAGE, INC. AND SUBSIDIARIES
Notes to Consolidated Financial Statements
(dollars in millions, except number of shares, per share, or per unit amounts)
(20) | Earnings (loss) per share |
Basic EPS is calculated by dividing net income (loss) attributable to common stockholders of Lineage, Inc. by the weighted average common shares outstanding during the reporting period. Diluted EPS is calculated by dividing net income (loss) attributable to common stockholders of Lineage, Inc. by the weighted average common shares and common share equivalents outstanding during the reporting period. A reconciliation of the basic and diluted EPS for the years ended December 31, is as follows:
2023 | 2022 | 2021 | ||||||||||
Earnings (loss) per share—basic and diluted: | ||||||||||||
Net income (loss) attributable to Lineage, Inc. | $ | (77.4 | ) | $ | (62.7 | ) | $ | (153.3 | ) | |||
Less: Lineage, Inc. Series A preferred share dividend | 0.1 | 0.1 | — | |||||||||
Less: Accretion of redeemable noncontrolling interests | 33.0 | 30.6 | 20.7 | |||||||||
Less: Redeemable noncontrolling interest adjustment | 6.9 | (16.1 | ) | — | ||||||||
Less: REIT subsidiaries’ Series A preferred dividend attributable to Lineage, Inc. | — | 0.1 | — | |||||||||
|
|
|
|
|
| |||||||
Net income (loss) attributable to common shareholders—basic and diluted | $ | (117.4 | ) | $ | (77.4 | ) | $ | (174.0 | ) | |||
Weighted average common shares outstanding (in millions)—basic and diluted | 161.9 | 152.0 | 131.0 | |||||||||
|
|
|
|
|
| |||||||
Net income (loss) per share attributable to common stockholders—basic and diluted | $ | (0.73 | ) | $ | (0.51 | ) | $ | (1.33 | ) | |||
|
|
|
|
|
|
The Company’s potential dilutive securities have been excluded from the computation of diluted net earnings (loss) per share for the years ended December 31, 2023, 2022, and 2021, as they are antidilutive and the effect would be to increase the net earnings (or decrease the net loss) per share. Therefore, the weighted average number of common shares outstanding used to calculate both basic and diluted net earnings (loss) per share attributable to common stockholders is the same. The Company’s potential dilutive common share equivalents that are excluded from the computation of diluted net earnings (loss) per share are as follows:
• | As described in Note 2, Capital structure and noncontrolling interests, as of March 1, 2025 the sellers of MTC Logistics may elect to receive any combination of cash or Operating Partnership units that equal the excess of $34.2M over the fair market value of the units issued to the sellers in the MTC Logistics acquisition. The Operating Partnership Units that could be issued in connection with this hypothetical election represent potential common share equivalents. |
• | As described in Note 2, Capital structure and noncontrolling interests, the holder of the Preference Shares issued by a subsidiary of LLH in connection with the Kloosterboer acquisition has conversion rights to convert the Preference Shares to Operating Partnership units or common stock of Lineage, Inc., depending on whether or not certain events have occurred. The Operating Partnership units or common stock of Lineage, Inc. that could be issued in connection with a hypothetical conversion represent potential common share equivalents. |
F-74
Table of Contents
LINEAGE, INC. AND SUBSIDIARIES
Notes to Consolidated Financial Statements
(dollars in millions, except number of shares, per share, or per unit amounts)
• | As described in Note 4, Business combinations, asset acquisitions, and divestitures, the 2020 SCS acquisition contained contingent consideration in the form of Operating Partnership units. The Operating Partnership is obligated to issue tranches of Operating Partnership units to the sellers of SCS if a customer at the Alabama facility acquired in the SCS acquisition does not exercise their purchase option on the facility in 2022 or 2027. The customer did not exercise the first option in 2022, and the first tranche of Operating Partnership units were issued in 2023. The Operating Partnership units that could be issued in connection with this contingent consideration liability represent potential common share equivalents. |
• | As described in Note 16, Stock-based compensation, certain members of management and certain non-employees have been granted BGLH Restricted Units. BGLH Restricted Units that are unvested as of December 31, 2023, 2022, and 2021 represent potential common share equivalents because upon vesting, Lineage, Inc. will have outstanding common shares issued to BGLH. |
• | As described in Note 16, Stock-based compensation, certain members of management have been granted Management Profits Interests Class C units in LLH MGMT and LLH MGMT II. These Class C Units in LLH MGMT and LLH MGMT II that are unvested as of December 31, 2023, 2022, and 2021 represent potential common share equivalents because upon vesting, they will be able to share in the profits of the Company, as defined in the LLH MGMT and LLH MGMT II operating agreements. |
(21) | Segment information |
(a) | Reportable Segments Information |
The Company’s business is organized into two reportable segments, Global Warehousing and Global Integrated Solutions, as described in Note 1, Significant accounting policies and practices.
The following table presents segment revenues and NOI, with a reconciliation to Net income (loss) before income taxes for the years ended December 31, 2023, 2022, and 2021. All inter-segment transactions are not significant and have been eliminated in consolidation. Asset information by reportable segment is not presented, as the Company does not produce such information internally and the CODM does not use such information to manage the business. Capital expenditures for property, plant, and equipment presented below by segment are inclusive of purchases recorded in Accounts payable and accrued liabilities as of December 31, 2023, 2022, and 2021.
Year Ended December 31, | ||||||||||||
2023 | 2022 | 2021 | ||||||||||
Global Warehousing revenues | $ | 3,856.9 | $ | 3,432.6 | $ | 2,655.8 | ||||||
Global Integrated Solutions revenues | 1,484.6 | 1,495.7 | 1,046.2 | |||||||||
|
|
|
|
|
| |||||||
Total revenues | 5,341.5 | 4,928.3 | 3,702.0 | |||||||||
|
|
|
|
|
| |||||||
Global Warehousing cost of operations | 2,349.1 | 2,211.1 | 1,684.3 | |||||||||
Global Integrated Solutions cost of operations | 1,240.7 | 1,262.1 | 887.1 | |||||||||
|
|
|
|
|
| |||||||
Total cost of operations | 3,589.8 | 3,473.2 | 2,571.4 | |||||||||
|
|
|
|
|
| |||||||
Global Warehousing NOI | 1,507.8 | 1,221.5 | 971.5 | |||||||||
Global Integrated Solutions NOI | 243.9 | 233.6 | 159.1 | |||||||||
|
|
|
|
|
| |||||||
Total NOI | 1,751.7 | 1,455.1 | 1,130.6 | |||||||||
|
|
|
|
|
|
F-75
Table of Contents
LINEAGE, INC. AND SUBSIDIARIES
Notes to Consolidated Financial Statements
(dollars in millions, except number of shares, per share, or per unit amounts)
Year Ended December 31, | ||||||||||||
2023 | 2022 | 2021 | ||||||||||
Reconciling items: | ||||||||||||
General and administrative expense | (501.8 | ) | (398.9 | ) | (289.3 | ) | ||||||
Depreciation expense | (551.9 | ) | (479.5 | ) | (416.1 | ) | ||||||
Amortization expense | (207.8 | ) | (197.7 | ) | (187.6 | ) | ||||||
Acquisition, transaction, and other expense | (60.0 | ) | (66.2 | ) | (123.6 | ) | ||||||
Restructuring and impairment expense | (31.8 | ) | (15.5 | ) | (26.3 | ) | ||||||
Equity income (loss), net of tax | (2.6 | ) | (0.2 | ) | (0.3 | ) | ||||||
Gain (loss) on foreign currency transactions, net | 3.9 | (23.8 | ) | (34.0 | ) | |||||||
Interest expense, net | (490.4 | ) | (347.0 | ) | (259.6 | ) | ||||||
Gain (loss) on extinguishment of debt | — | 1.4 | (4.1 | ) | ||||||||
Other nonoperating income (expense), net | (19.4 | ) | 2.3 | 4.5 | ||||||||
|
|
|
|
|
| |||||||
Net income (loss) before income taxes | $ | (110.1 | ) | $ | (70.0 | ) | $ | (205.8 | ) | |||
|
|
|
|
|
| |||||||
Capital expenditures for property, plant, and equipment: | ||||||||||||
Global Warehousing capital expenditures | $ | 535.7 | $ | 618.0 | $ | 511.5 | ||||||
Global Integrated Solutions capital expenditures | 77.9 | 141.6 | 30.4 | |||||||||
Corporate capital expenditures | 121.1 | 109.6 | 91.2 | |||||||||
|
|
|
|
|
| |||||||
Total capital expenditures for property, plant, and equipment | $ | 734.7 | $ | 869.2 | $ | 633.1 | ||||||
|
|
|
|
|
|
(b) | Geographic Information |
The following table provides geographic information for the Company’s total revenues for the years ended December 31, 2023, 2022, and 2021 and long-lived assets as of December 31, 2023 and 2022. Revenues from external customers are attributed to each country or region based on the location of the facilities in which the revenues originated. The Company’s Goodwill and Other intangible assets, net are excluded from the definition of long-lived assets.
Total Revenues | Long-Lived Assets | |||||||||||||||||||
2023 | 2022 | 2021 | 2023 | 2022 | ||||||||||||||||
North America: | ||||||||||||||||||||
United States | $ | 3,424.0 | $ | 3,306.5 | $ | 2,643.3 | $ | 9,013.7 | $ | 8,608.8 | ||||||||||
Canada | 277.1 | 132.8 | 25.8 | 863.4 | 848.2 | |||||||||||||||
|
|
|
|
|
|
|
|
|
| |||||||||||
Total North America | 3,701.1 | 3,439.3 | 2,669.1 | 9,877.1 | 9,457.0 | |||||||||||||||
|
|
|
|
|
|
|
|
|
| |||||||||||
Europe | 1,202.8 | 1,097.5 | 703.2 | 2,199.8 | 2,016.4 | |||||||||||||||
Asia-Pacific | 433.6 | 387.2 | 323.6 | 864.2 | 1,048.7 | |||||||||||||||
Other foreign | 4.0 | 4.3 | 6.1 | 0.2 | — | |||||||||||||||
|
|
|
|
|
|
|
|
|
| |||||||||||
Total | $ | 5,341.5 | $ | 4,928.3 | $ | 3,702.0 | $ | 12,941.3 | $ | 12,522.1 | ||||||||||
|
|
|
|
|
|
|
|
|
|
F-76
Table of Contents
LINEAGE, INC. AND SUBSIDIARIES
Notes to Consolidated Financial Statements
(dollars in millions, except number of shares, per share, or per unit amounts)
(22) | Subsequent events |
The Company evaluated subsequent events through March 8, 2024, the date the consolidated financial statements were available to be issued. The following are subsequent events or transactions that required recognition or disclosure:
As described in Note 2, Capital structure and noncontrolling interests, the sellers of JCS were issued Class A units of the Operating Partnership that contained a one-time right as of February 1, 2024 to put all, or a portion, of the units for cash. The sellers were issued a total of 941,176 such Class A units. One of the sellers elected to exercise this right for 61,593 of their Class A units. For the remaining outstanding units, there is no longer a redemption right and the associated noncontrolling interests are no longer redeemable.
On February 1, 2024 the Company purchased Entrepot Du Nord Inc. for $59.5 million in cash consideration. The purpose of this acquisition is to continue to expand the Company’s warehousing network in Canada.
In February 2024, the Company entered into an unsecured delayed-draw term loan facility, amended the Credit Agreement, and entered into a new loan agreement with MetLife Real Estate Lending LLC. Refer to Note 10, Debt for details.
(23) | Immaterial correction of previously issued consolidated financial statements |
The Company has identified errors in its audited consolidated financial statements for the years ended December 31, 2022 and 2021. The Company has evaluated these errors and concluded that they were not material to prior periods, individually, or in the aggregate. However, the Company has corrected the relevant prior period consolidated financial statements included herein for these errors for comparative purposes. The Company has also corrected impacted amounts within the accompanying notes to the consolidated financial statements (see Note 9, Income taxes, Note 4, Business combinations, asset acquisitions, and divestitures, Note 6, Goodwill and other intangible assets, net, and Note 19, Accumulated other comprehensive income (loss)).
Description of Misstatements
a. | Property tax accrual – The Company identified that some of its property tax accruals were not appropriately reversed or relieved upon payment of the related liability. As a result, the Company’s liabilities and expenses were overstated as of December 31, 2022 and for the years ended December 31, 2022 and 2021. The correction of these errors resulted in an $8.5 million and an $8.4 million decrease to Cost of operations in 2022 and 2021, respectively, and an $18.0 million cumulative decrease to Accounts payable and accrued liabilities in 2022. Additionally, the correction of errors pertaining to periods prior to 2021 resulted in an increase of $1.1 million to Retained earnings (accumulated deficit) at December 31, 2020, as reflected in the consolidated statements of redeemable noncontrolling interests and equity. |
b. | Deferred tax liability acquired—The Company identified errors in recording deferred tax liabilities acquired as part of business combinations in 2021 and 2020. The correction of these errors resulted in a $14.4 million decrease to Goodwill and Deferred income tax liability in the consolidated balance sheet as of December 31, 2022. |
c. | Income tax provision—The Company determined that certain of its estimates recorded in the 2022 and 2021 current and deferred tax provisions were not correct and were identified as such when |
F-77
Table of Contents
LINEAGE, INC. AND SUBSIDIARIES
Notes to Consolidated Financial Statements
(dollars in millions, except number of shares, per share, or per unit amounts)
reconciling the provision to return. In order to correct this error, the Company recorded a $4.2 million and a $2.2 million decrease to Income tax expense (benefit) in 2022 and 2021, respectively, and a $9.6 million cumulative increase to Deferred income tax liability and a $21.2 million cumulative decrease to Accumulated other comprehensive income (loss) in 2022. There was also a related $21.2 million increase to Unrealized gain (loss) on foreign currency hedges and interest rate hedges in the consolidated statements of operations and comprehensive income (loss) for the year ended December 31, 2022. Additionally, the correction of errors pertaining to periods prior to 2021 resulted in an increase of $5.2 million to Retained earnings (accumulated deficit) at December 31, 2020, as reflected in the consolidated statements of redeemable noncontrolling interests and equity. |
The above corrections resulted in a $0.08 increase to both Basic earnings (loss) per share and Diluted earnings (loss) per share in the consolidated statements of operations and comprehensive income (loss) for both of the years ended December 31, 2022 and 2021.
F-78
Table of Contents
LINEAGE, INC. AND SUBSIDIARIES
SCHEDULE III - REAL ESTATE AND ACCUMULATED DEPRECIATION
December 31, 2023
(dollars in millions, except quantity of buildings)
Schedule III—Schedule of Real Estate and Accumulated Depreciation (“Schedule III”) reflects the cost and associated accumulated depreciation for the real estate facilities that are owned. The gross cost included in Schedule III includes the cost for buildings, building improvements, refrigeration equipment, land, and land improvements. Schedule III does not reflect leased facilities in the company’s real estate portfolio.
Initial costs to Company | Gross amount at which carried as of December 31, 20231, 3, 6 | |||||||||||||||||||||||||||||||||||||||||
Property Description | Number of buildings | Encumbrances | Land | Buildings and improvements | Costs capitalized subsequent to acquisition1, 2 | Land | Buildings and improvements | Total | Accumulated depreciation1, 4, 6 | Date of construction5 | Date acquired | |||||||||||||||||||||||||||||||
UNITED STATES | ||||||||||||||||||||||||||||||||||||||||||
Alabama | 3 | $ | (40.9 | ) | $ | 9.7 | $ | 71.4 | $ | 13.7 | $ | 10.2 | $ | 84.6 | $ | 94.8 | $ | (15.4 | ) | Various | 2014-2022 | |||||||||||||||||||||
Arizona | 1 | (20.1 | ) | 2.5 | 17.8 | 0.6 | 2.6 | 18.3 | 20.9 | (8.8 | ) | 1987 | 2016 | |||||||||||||||||||||||||||||
California - Colton | 1 | (105.9 | ) | 43.7 | 49.8 | 25.8 | 68.5 | 50.8 | 119.3 | (15.9 | ) | 2014 | 2014-2020 | |||||||||||||||||||||||||||||
California - Mira Loma | 1 | (108.8 | ) | 23.7 | 89.6 | 10.2 | 23.9 | 99.6 | 123.5 | (31.2 | ) | Various | 2014 | |||||||||||||||||||||||||||||
California - Oakland | 1 | (76.7 | ) | — | 79.3 | 9.8 | — | 89.1 | 89.1 | (12.7 | ) | 2018 | 2018 | |||||||||||||||||||||||||||||
California - Riverside | 3 | (81.2 | ) | 9.0 | 51.0 | 6.0 | 9.1 | 56.9 | 66.0 | (21.2 | ) | Various | 2012 | |||||||||||||||||||||||||||||
California - Santa Maria | 2 | (41.3 | ) | 7.3 | 39.9 | 15.9 | 7.7 | 55.4 | 63.1 | (14.9 | ) | Various | 2011-2014 | |||||||||||||||||||||||||||||
California - Vernon | 7 | (181.1 | ) | 61.9 | 124.7 | 57.4 | 63.6 | 180.4 | 244.0 | (31.2 | ) | Various | 2017-2019 | |||||||||||||||||||||||||||||
California - All other | 3 | (94.9 | ) | 11.5 | 66.2 | 7.7 | 11.6 | 73.8 | 85.4 | (24.4 | ) | Various | 2012-2021 | |||||||||||||||||||||||||||||
Colorado - Denver | 1 | (85.0 | ) | 3.8 | 44.2 | 24.8 | 8.9 | 63.9 | 72.8 | (20.2 | ) | Various | 2014 | |||||||||||||||||||||||||||||
Colorado - Windsor | 1 | — | 2.7 | 96.3 | — | 2.7 | 96.3 | 99.0 | (1.0 | ) | Various | 2021 | ||||||||||||||||||||||||||||||
Colorado - All other | 1 | (12.0 | ) | 2.0 | 8.8 | 5.1 | 2.0 | 13.9 | 15.9 | (4.2 | ) | Various | 2014 | |||||||||||||||||||||||||||||
Delaware | 2 | — | 3.9 | 20.8 | 0.6 | 3.9 | 21.4 | 25.3 | (2.0 | ) | Various | 2022-2023 | ||||||||||||||||||||||||||||||
Florida - Jacksonville | 2 | (30.4 | ) | 3.7 | 77.4 | 1.9 | 3.7 | 79.3 | 83.0 | (9.2 | ) | Various | 2019-2023 | |||||||||||||||||||||||||||||
Florida - All other | 4 | — | 12.3 | 17.8 | 1.6 | 12.3 | 19.4 | 31.7 | (1.1 | ) | Various | 2021-2023 | ||||||||||||||||||||||||||||||
Georgia - Albany | 9 | (50.6 | ) | 1.8 | 43.4 | 25.5 | 2.1 | 68.6 | 70.7 | (26.4 | ) | Various | 2010 | |||||||||||||||||||||||||||||
Georgia - Atlanta | 2 | (114.8 | ) | 12.0 | 134.2 | 9.6 | 12.0 | 143.8 | 155.8 | (36.6 | ) | Various | 2014-2019 | |||||||||||||||||||||||||||||
Georgia - Port Wentworth | 1 | — | 12.9 | 63.4 | — | 12.9 | 63.4 | 76.3 | (1.3 | ) | 2023 | 2021 | ||||||||||||||||||||||||||||||
Georgia - Savannah | 2 | (38.0 | ) | 9.2 | 108.9 | 26.6 | 11.6 | 133.1 | 144.7 | (12.1 | ) | Various | 2020-2021 | |||||||||||||||||||||||||||||
Georgia - All other | 3 | (34.1 | ) | 14.9 | 73.1 | 8.6 | 15.7 | 80.9 | 96.6 | (9.2 | ) | Various | 2012-2023 | |||||||||||||||||||||||||||||
Idaho | 2 | (64.8 | ) | 3.4 | 48.0 | 2.1 | 3.9 | 49.6 | 53.5 | (7.5 | ) | Various | 2020 | |||||||||||||||||||||||||||||
Illinois - Chicago | 8 | (389.9 | ) | 41.4 | 417.6 | 22.5 | 44.9 | 436.6 | 481.5 | (89.2 | ) | Various | 2013-2020 | |||||||||||||||||||||||||||||
Illinois - Joliet | 1 | — | 9.2 | 86.8 | 4.8 | 9.9 | 90.9 | 100.8 | (11.3 | ) | 2014 | 2021 | ||||||||||||||||||||||||||||||
Illinois - All other | 6 | (99.8 | ) | 20.9 | 101.3 | 3.1 | 21.0 | 104.3 | 125.3 | (19.7 | ) | Various | 2012-2021 | |||||||||||||||||||||||||||||
Indiana | 5 | (23.3 | ) | 6.2 | 81.0 | 11.1 | 10.5 | 87.8 | 98.3 | (10.7 | ) | Various | 2017-2021 | |||||||||||||||||||||||||||||
Iowa | 7 | (111.8 | ) | 9.1 | 102.8 | 34.4 | 12.5 | 133.8 | 146.3 | (41.5 | ) | Various | 2014-2020 | |||||||||||||||||||||||||||||
Kansas - Kansas City | 1 | (93.0 | ) | 6.8 | 81.5 | 31.8 | 9.5 | 110.6 | 120.1 | (32.9 | ) | Various | 2014 | |||||||||||||||||||||||||||||
Kansas - Olathe | 1 | — | 21.7 | 96.2 | — | 21.7 | 96.2 | 117.9 | (7.5 | ) | 2022 | 2020 |
F-79
Table of Contents
LINEAGE, INC. AND SUBSIDIARIES
SCHEDULE III - REAL ESTATE AND ACCUMULATED DEPRECIATION
December 31, 2023
(dollars in millions, except quantity of buildings)
Initial costs to Company | Gross amount at which carried as of December 31, 20231, 3, 6 | |||||||||||||||||||||||||||||||||||||||||
Property Description | Number of buildings | Encumbrances | Land | Buildings and improvements | Costs capitalized subsequent to acquisition1, 2 | Land | Buildings and improvements | Total | Accumulated depreciation1, 4, 6 | Date of construction5 | Date acquired | |||||||||||||||||||||||||||||||
Kansas - All other | 1 | $ | (9.4 | ) | $ | 0.4 | $ | 10.0 | $ | 9.7 | $ | 0.5 | $ | 19.6 | $ | 20.1 | $ | (5.3 | ) | Various | 2014 | |||||||||||||||||||||
Kentucky | 2 | (43.4 | ) | 2.1 | 33.6 | 10.1 | 2.4 | 43.4 | 45.8 | (13.6 | ) | Various | 2014-2017 | |||||||||||||||||||||||||||||
Louisiana | 1 | — | 0.8 | 5.6 | 1.2 | 0.8 | 6.8 | 7.6 | (0.9 | ) | 1998 | 2020 | ||||||||||||||||||||||||||||||
Maryland | 4 | — | 14.6 | 65.9 | 1.7 | 14.7 | 67.5 | 82.2 | (5.5 | ) | Various | 2021-2023 | ||||||||||||||||||||||||||||||
Massachusetts - Boston | 1 | (37.5 | ) | 21.0 | 47.6 | 1.1 | 21.0 | 48.7 | 69.7 | (8.1 | ) | 2009 | 2019 | |||||||||||||||||||||||||||||
Massachusetts - All other | 3 | (20.0 | ) | 2.9 | 36.2 | 36.7 | 4.6 | 71.2 | 75.8 | (3.9 | ) | Various | 2019-2023 | |||||||||||||||||||||||||||||
Michigan | 5 | — | 6.0 | 66.1 | 16.7 | 8.5 | 80.3 | 88.8 | (8.2 | ) | Various | 2017-2021 | ||||||||||||||||||||||||||||||
Minnesota - Luverne | 1 | — | 0.2 | 62.0 | — | 0.2 | 62.0 | 62.2 | (1.0 | ) | 2023 | 2022 | ||||||||||||||||||||||||||||||
Minnesota - All other | 1 | — | 1.5 | 11.0 | — | 1.5 | 11.0 | 12.5 | (1.1 | ) | 2001 | 2021 | ||||||||||||||||||||||||||||||
Mississippi | 1 | (26.3 | ) | 0.8 | 22.6 | 11.8 | 1.3 | 33.9 | 35.2 | (10.6 | ) | Various | 2014 | |||||||||||||||||||||||||||||
Nebraska | 4 | (51.5 | ) | 4.2 | 50.3 | 30.2 | 4.8 | 79.9 | 84.7 | (23.0 | ) | Various | 2014 | |||||||||||||||||||||||||||||
New Jersey - Elizabeth | 2 | (42.1 | ) | 27.0 | 114.1 | 3.6 | 27.0 | 117.7 | 144.7 | (13.0 | ) | Various | 2019-2021 | |||||||||||||||||||||||||||||
New Jersey - All other | 3 | (17.5 | ) | 7.3 | 74.1 | 22.6 | 7.3 | 96.7 | 104.0 | (5.3 | ) | Various | 2019-2022 | |||||||||||||||||||||||||||||
New York | 8 | (87.2 | ) | 9.8 | 108.6 | 14.1 | 10.9 | 121.6 | 132.5 | (22.5 | ) | Various | 2020 | |||||||||||||||||||||||||||||
North Carolina | 3 | (45.6 | ) | 3.1 | 32.7 | 14.8 | 3.2 | 47.4 | 50.6 | (11.2 | ) | Various | 2011-2018 | |||||||||||||||||||||||||||||
North Dakota | 1 | (28.5 | ) | 3.2 | 12.6 | 0.2 | 3.2 | 12.8 | 16.0 | (2.7 | ) | 1999 | 2020 | |||||||||||||||||||||||||||||
Ohio - Columbus | 3 | — | 4.0 | 46.6 | 2.5 | 4.0 | 49.1 | 53.1 | (6.1 | ) | Various | 2020 | ||||||||||||||||||||||||||||||
Ohio - All other | 3 | (57.0 | ) | 7.5 | 47.5 | 4.2 | 7.7 | 51.5 | 59.2 | (10.5 | ) | Various | 2014-2020 | |||||||||||||||||||||||||||||
Oklahoma | 2 | (21.8 | ) | 4.0 | 14.9 | 0.1 | 4.0 | 15.0 | 19.0 | (2.0 | ) | Various | 2020-2023 | |||||||||||||||||||||||||||||
Oregon - Portland | 2 | (81.9 | ) | 9.0 | 62.0 | — | 9.0 | 62.0 | 71.0 | (7.5 | ) | Various | 2020 | |||||||||||||||||||||||||||||
Oregon - Salem | 5 | (139.3 | ) | 12.8 | 119.0 | 4.8 | 12.7 | 123.9 | 136.6 | (20.8 | ) | Various | 2020 | |||||||||||||||||||||||||||||
Oregon - All other | 4 | (22.9 | ) | 9.3 | 45.8 | 3.2 | 9.2 | 49.1 | 58.3 | (9.9 | ) | Various | 2011-2020 | |||||||||||||||||||||||||||||
Pennsylvania - Allentown | 2 | (144.6 | ) | 5.9 | 133.7 | 29.1 | 7.6 | 161.1 | 168.7 | (42.2 | ) | Various | 2014-2021 | |||||||||||||||||||||||||||||
Pennsylvania - All other | 5 | (37.5 | ) | 40.5 | 87.1 | 6.6 | 40.5 | 93.7 | 134.2 | (20.2 | ) | Various | 2016-2021 | |||||||||||||||||||||||||||||
South Carolina - Charleston | 2 | (50.7 | ) | 9.7 | 48.4 | 29.9 | 14.5 | 73.5 | 88.0 | (14.6 | ) | Various | 2014-2021 | |||||||||||||||||||||||||||||
South Carolina - All other | 1 | (13.4 | ) | 0.3 | 12.0 | 2.0 | 0.3 | 14.0 | 14.3 | (2.0 | ) | Various | 2018 | |||||||||||||||||||||||||||||
South Dakota | 1 | — | 6.8 | 45.7 | 33.5 | 6.8 | 79.2 | 86.0 | (6.5 | ) | Various | 2020 | ||||||||||||||||||||||||||||||
Tennessee | 1 | (6.6 | ) | 0.7 | 5.3 | 1.1 | 0.7 | 6.4 | 7.1 | (0.7 | ) | 2005 | 2020 | |||||||||||||||||||||||||||||
Texas - Dallas | 1 | (84.3 | ) | 3.5 | 32.4 | 36.9 | 4.8 | 68.0 | 72.8 | (18.4 | ) | Various | 2014 | |||||||||||||||||||||||||||||
Texas - Fort Worth | 2 | (189.7 | ) | 7.9 | 130.8 | 35.1 | 9.3 | 164.5 | 173.8 | (36.6 | ) | Various | 2014-2020 | |||||||||||||||||||||||||||||
Texas - Houston | 3 | (73.6 | ) | 8.7 | 117.3 | 4.6 | 8.9 | 121.7 | 130.6 | (17.7 | ) | Various | 2019-2020 | |||||||||||||||||||||||||||||
Texas - McAllen | 4 | (73.5 | ) | 6.3 | 63.5 | 14.4 | 6.8 | 77.4 | 84.2 | (23.1 | ) | Various | 2014 | |||||||||||||||||||||||||||||
Texas - All other | 6 | (85.6 | ) | 10.8 | 77.0 | 18.9 | 11.0 | 95.7 | 106.7 | (28.2 | ) | Various | 2011-2020 | |||||||||||||||||||||||||||||
Utah | 2 | (28.1 | ) | 10.0 | 28.7 | 3.3 | 10.2 | 31.8 | 42.0 | (6.2 | ) | Various | 2014-2022 |
F-80
Table of Contents
LINEAGE, INC. AND SUBSIDIARIES
SCHEDULE III - REAL ESTATE AND ACCUMULATED DEPRECIATION
December 31, 2023
(dollars in millions, except quantity of buildings)
Initial costs to Company | Gross amount at which carried as of December 31, 20231, 3, 6 | |||||||||||||||||||||||||||||||||||||||||
Property Description | Number of buildings | Encumbrances | Land | Buildings and improvements | Costs capitalized subsequent to acquisition1, 2 | Land | Buildings and improvements | Total | Accumulated depreciation1, 4, 6 | Date of construction5 | Date acquired | |||||||||||||||||||||||||||||||
Virginia - Chesapeake | 1 | $ | (29.4 | ) | $ | 4.2 | $ | 62.7 | $ | 1.2 | $ | 4.2 | $ | 63.9 | $ | 68.1 | $ | (8.4 | ) | 2008 | 2019 | |||||||||||||||||||||
Virginia - Portsmouth | 1 | — | 6.9 | 59.4 | (1.3 | ) | 15.0 | 50.0 | 65.0 | (3.4 | ) | 2020 | 2019 | |||||||||||||||||||||||||||||
Virginia - All other | 6 | (52.5 | ) | 8.7 | 64.7 | 12.2 | 8.9 | 76.7 | 85.6 | (20.4 | ) | Various | 2011-2023 | |||||||||||||||||||||||||||||
Washington - Grandview | 9 | (29.7 | ) | 7.4 | 62.3 | 0.8 | 7.4 | 63.1 | 70.5 | (7.4 | ) | Various | 2020-2021 | |||||||||||||||||||||||||||||
Washington - Othello | 1 | (66.5 | ) | 2.0 | 35.0 | 22.7 | 3.8 | 55.9 | 59.7 | (16.4 | ) | Various | 2015 | |||||||||||||||||||||||||||||
Washington - Pasco | 2 | — | 4.5 | 102.6 | 0.1 | 4.5 | 102.7 | 107.2 | (7.0 | ) | Various | 2021 | ||||||||||||||||||||||||||||||
Washington - Quincy | 3 | (107.0 | ) | 6.2 | 95.2 | 9.3 | 6.6 | 104.1 | 110.7 | (29.4 | ) | Various | 2015 | |||||||||||||||||||||||||||||
Washington - Richland | 2 | (200.4 | ) | 14.0 | 326.7 | 0.8 | 14.2 | 327.3 | 341.5 | (43.4 | ) | Various | 2019-2020 | |||||||||||||||||||||||||||||
Washington - All other | 12 | (210.3 | ) | 21.4 | 176.9 | 42.7 | 22.2 | 218.8 | 241.0 | (64.1 | ) | Various | 2008-2023 | |||||||||||||||||||||||||||||
Wisconsin - Milwaukee | 2 | — | 3.9 | 47.0 | 1.5 | 3.9 | 48.5 | 52.4 | (4.6 | ) | Various | 2019-2021 | ||||||||||||||||||||||||||||||
Wisconsin - Stevens Point | 1 | (62.9 | ) | 1.2 | 37.1 | 67.2 | 6.5 | 99.0 | 105.5 | (17.2 | ) | Various | 2018 | |||||||||||||||||||||||||||||
Wisconsin - All other | 3 | — | 5.1 | 45.6 | 0.4 | 5.1 | 46.0 | 51.1 | (3.4 | ) | Various | 2021-2023 | ||||||||||||||||||||||||||||||
CANADA | ||||||||||||||||||||||||||||||||||||||||||
Alberta - Calgary | 3 | — | 12.8 | 89.4 | (2.9 | ) | 12.4 | 86.9 | 99.3 | (3.4 | ) | Various | 2022 | |||||||||||||||||||||||||||||
Alberta - All other | 2 | — | 7.6 | 20.1 | (0.7 | ) | 7.4 | 19.6 | 27.0 | (0.9 | ) | Various | 2022-2023 | |||||||||||||||||||||||||||||
British Columbia - Delta | 3 | — | 58.3 | 57.6 | (3.0 | ) | 56.5 | 56.4 | 112.9 | (2.4 | ) | Various | 2022 | |||||||||||||||||||||||||||||
British Columbia - All other | 2 | — | 47.8 | 28.5 | (1.6 | ) | 46.3 | 28.4 | 74.7 | (3.3 | ) | Various | 2022 | |||||||||||||||||||||||||||||
Manitoba | 1 | — | 6.5 | 40.7 | (1.2 | ) | 6.3 | 39.7 | 46.0 | (2.0 | ) | Various | 2022 | |||||||||||||||||||||||||||||
New Brunswick | 1 | — | 0.7 | 9.5 | 4.4 | 0.8 | 13.8 | 14.6 | (1.1 | ) | 2009 | 2021 | ||||||||||||||||||||||||||||||
Newfoundland | 1 | — | 2.5 | 3.7 | — | 2.4 | 3.8 | 6.2 | (0.4 | ) | 1981 | 2022 | ||||||||||||||||||||||||||||||
Nova Scotia | 1 | — | 2.4 | 11.3 | (0.2 | ) | 2.4 | 11.1 | 13.5 | (0.9 | ) | Various | 2022 | |||||||||||||||||||||||||||||
Ontario - Brampton | 1 | — | 24.4 | 59.4 | (2.5 | ) | 23.6 | 57.7 | 81.3 | (2.9 | ) | Various | 2022 | |||||||||||||||||||||||||||||
Ontario - Vaughan | 1 | — | 23.2 | 33.0 | (1.5 | ) | 22.4 | 32.3 | 54.7 | (1.7 | ) | Various | 2022 | |||||||||||||||||||||||||||||
Ontario - All other | 6 | — | 16.9 | 92.5 | 4.6 | 19.2 | 94.8 | 114.0 | (10.6 | ) | Various | 2020-2022 | ||||||||||||||||||||||||||||||
Quebec | 3 | — | 24.1 | 79.6 | (3.2 | ) | 23.2 | 77.3 | 100.5 | (4.9 | ) | Various | 2021-2022 | |||||||||||||||||||||||||||||
EUROPE | ||||||||||||||||||||||||||||||||||||||||||
Belgium | 2 | — | 5.9 | 4.0 | 2.6 | 5.4 | 7.1 | 12.5 | (0.8 | ) | Various | 2021-2022 | ||||||||||||||||||||||||||||||
Denmark | 15 | — | 29.9 | 182.8 | 5.4 | 28.3 | 189.8 | 218.1 | (27.5 | ) | Various | 2020-2021 | ||||||||||||||||||||||||||||||
France | 2 | — | 3.9 | 60.3 | 8.9 | 3.9 | 69.2 | 73.1 | (3.4 | ) | Various | 2021 | ||||||||||||||||||||||||||||||
Italy | 2 | — | 5.7 | 11.6 | (1.1 | ) | 5.5 | 10.7 | 16.2 | (0.8 | ) | Various | 2021 | |||||||||||||||||||||||||||||
Netherlands - Bergen op Zoom | 1 | — | 10.2 | 63.5 | 17.2 | 24.1 | 66.8 | 90.9 | (15.6 | ) | 2006 | 2017 | ||||||||||||||||||||||||||||||
Netherlands - Rotterdam | 4 | — | 4.2 | 149.2 | (2.9 | ) | 4.0 | 146.5 | 150.5 | (9.7 | ) | Various | 2021-2022 | |||||||||||||||||||||||||||||
Netherlands - Velsen | 1 | — | 25.5 | 27.8 | (2.5 | ) | 24.3 | 26.5 | 50.8 | (3.8 | ) | Various | 2021 |
F-81
Table of Contents
LINEAGE, INC. AND SUBSIDIARIES
SCHEDULE III - REAL ESTATE AND ACCUMULATED DEPRECIATION
December 31, 2023
(dollars in millions, except quantity of buildings)
Initial costs to Company | Gross amount at which carried as of December 31, 20231, 3, 6 | |||||||||||||||||||||||||||||||||||||||||||
Property Description | Number of buildings | Encumbrances | Land | Buildings and improvements | Costs capitalized subsequent to acquisition1, 2 | Land | Buildings and improvements | Total | Accumulated depreciation1, 4, 6 | Date of construction5 | Date acquired | |||||||||||||||||||||||||||||||||
Netherlands - Vlissingen | 12 | $ | — | $ | 78.8 | $ | 25.6 | $ | 13.2 | $ | 75.3 | $ | 42.3 | $ | 117.6 | $ | (7.3 | ) | 1982 | 2021 | ||||||||||||||||||||||||
Netherlands - All Other | 12 | — | 56.2 | 115.9 | 7.7 | 57.4 | 122.4 | 179.8 | (15.2 | ) | Various | 2017-2022 | ||||||||||||||||||||||||||||||||
Norway | 3 | — | 10.5 | 43.3 | (5.0 | ) | 9.4 | 39.4 | 48.8 | (3.7 | ) | Various | 2020 | |||||||||||||||||||||||||||||||
Poland | 2 | — | 1.0 | 28.1 | 5.9 | 1.7 | 33.3 | 35.0 | (4.0 | ) | Various | 2020-2021 | ||||||||||||||||||||||||||||||||
Spain | 10 | — | 26.2 | 57.4 | 2.1 | 27.4 | 58.3 | 85.7 | (10.3 | ) | Various | 2021-2022 | ||||||||||||||||||||||||||||||||
United Kingdom - Gloucester | 1 | — | 3.4 | 70.2 | 0.9 | 3.2 | 71.3 | 74.5 | (15.3 | ) | 2010 | 2017 | ||||||||||||||||||||||||||||||||
United Kingdom - Heywood | 1 | — | 4.6 | 32.2 | 19.0 | 4.5 | 51.3 | 55.8 | (8.2 | ) | Various | 2018 | ||||||||||||||||||||||||||||||||
United Kingdom - Peterborough | 1 | — | 7.2 | 16.5 | 46.7 | 7.1 | 63.3 | 70.4 | (3.8 | ) | Various | 2018 | ||||||||||||||||||||||||||||||||
United Kingdom - Wisbech | 1 | — | 3.3 | 60.6 | 1.2 | 3.0 | 62.1 | 65.1 | (13.1 | ) | 2009 | 2017 | ||||||||||||||||||||||||||||||||
United Kingdom - All other | 10 | — | 36.0 | 88.6 | 18.1 | 35.6 | 107.1 | 142.7 | (38.0 | ) | Various | 2017-2018 | ||||||||||||||||||||||||||||||||
ASIA PACIFIC |
| |||||||||||||||||||||||||||||||||||||||||||
Australia - Hemmant | 3 | — | 19.4 | 95.3 | 2.6 | 19.4 | 97.9 | 117.3 | (11.3 | ) | Various | 2019 | ||||||||||||||||||||||||||||||||
Australia - All other | 10 | — | 41.0 | 142.8 | 7.0 | 40.3 | 150.5 | 190.8 | (18.0 | ) | Various | 2019-2021 | ||||||||||||||||||||||||||||||||
New Zealand | 35 | — | 31.8 | 108.7 | 17.6 | 32.6 | 125.5 | 158.1 | (15.7 | ) | Various | 2020-2023 | ||||||||||||||||||||||||||||||||
Singapore | 1 | — | — | 49.6 | 2.6 | — | 52.2 | 52.2 | (4.6 | ) | Various | 2022 | ||||||||||||||||||||||||||||||||
Sri Lanka | 1 | — | — | 7.4 | (3.1 | ) | — | 4.3 | 4.3 | (0.5 | ) | Various | 2020 | |||||||||||||||||||||||||||||||
Vietnam | 5 | — | 0.1 | 43.7 | 4.3 | 0.1 | 48.0 | 48.1 | (8.5 | ) | Various | 2019-2023 | ||||||||||||||||||||||||||||||||
|
|
|
|
|
|
|
|
|
|
|
|
|
|
|
| |||||||||||||||||||||||||||||
Total | $ | (4,176.6 | ) | $ | 1,347.3 | $ | 7,289.5 | $ | 1,084.1 | $ | 1,436.5 | $ | 8,284.4 | $ | 9,720.9 | $ | (1,427.1 | ) | ||||||||||||||||||||||||||
|
|
|
|
|
|
|
|
|
|
|
|
|
|
|
| |||||||||||||||||||||||||||||
Land, buildings, and improvements in the construction in progress balance as of December 31, 2023 |
| |||||||||||||||||||||||||||||||||||||||||||
United States | 267.7 | 267.7 | ||||||||||||||||||||||||||||||||||||||||||
Europe | 20.5 | 20.5 | ||||||||||||||||||||||||||||||||||||||||||
Asia Pacific | 5.7 | 5.7 | ||||||||||||||||||||||||||||||||||||||||||
Canada | 5.3 | 5.3 | ||||||||||||||||||||||||||||||||||||||||||
|
|
|
| |||||||||||||||||||||||||||||||||||||||||
Total in construction in progress | 299.2 | 299.2 | ||||||||||||||||||||||||||||||||||||||||||
|
|
|
|
|
|
|
|
|
|
|
|
|
|
|
| |||||||||||||||||||||||||||||
Total assets | $ | (4,176.6 | ) | $ | 1,347.3 | $ | 7,289.5 | $ | 1,084.1 | $ | 1,436.5 | $ | 8,583.6 | $ | 10,020.1 | $ | (1,427.1 | ) | ||||||||||||||||||||||||||
|
|
|
|
|
|
|
|
|
|
|
|
|
|
|
|
F-82
Table of Contents
LINEAGE, INC. AND SUBSIDIARIES
SCHEDULE III - REAL ESTATE AND ACCUMULATED DEPRECIATION
December 31, 2023
(dollars in millions, except quantity of buildings)
Schedule III—Footnotes
(1) The following table presents a reconciliation of the gross amount of real estate assets, as presented in Schedule III above, to the sum of the historical book value of buildings, building improvements, refrigeration equipment, land, land improvements, and construction in progress, as disclosed in Note 5, Property, plant, and equipment in the accompanying consolidated financial statements as of December 31, 2023:
Reconciliation of total Schedule III assets as of December 31, 2023 | ||||
Gross amount of real estate assets, as disclosed in Note 5: | ||||
Buildings, building improvements and refrigeration equipment | $ | 8,544.4 | ||
Land and land improvements | 1,446.3 | |||
Construction in progress | 432.1 | |||
|
| |||
Total | 10,422.8 | |||
Less: | ||||
Book value of real estate assets in leased facilities | (256.2 | ) | ||
Book value of construction in progress on non-real estate assets | (106.1 | ) | ||
Book value of construction in progress on real estate assets in leased facilities | (26.9 | ) | ||
Book value of other miscellaneous | (13.5 | ) | ||
|
| |||
Total reconciling items | (402.7 | ) | ||
|
| |||
Gross amount of real estate assets, as reported on Schedule III | $ | 10,020.1 | ||
|
| |||
Reconciliation of total Schedule III accumulated depreciation as of December 31, 2023: | ||||
Accumulated depreciation, as disclosed in Note 5: | $ | (2,266.2 | ) | |
Less: | ||||
Accumulated depreciation—non-real estate assets | 781.8 | |||
Accumulated depreciation—real estate assets in leased facilities | 57.3 | |||
|
| |||
Total reconciling items | 839.1 | |||
|
| |||
Accumulated depreciation, as reported on Schedule III | $ | (1,427.1 | ) | |
|
|
(2) | Amount includes the cumulative impact of foreign currency translation and the effect of any asset disposals or impairments. |
(3) | The unaudited aggregate cost for Federal tax purposes at December 31, 2023 of the company real estate assets was approximately $10.6 billion. |
(4) | The life on which depreciation is computed in the consolidated statements of operations and comprehensive income (loss) for the year ended December 31, 2023 ranges from 1 to 40 years. |
(5) | Various for properties with multiple buildings or with multiple construction dates due to expansions. |
(6) | The following table summarizes the Company’s real estate cost and accumulated depreciation activity for the years ended December 31: |
F-83
Table of Contents
LINEAGE, INC. AND SUBSIDIARIES
SCHEDULE III - REAL ESTATE AND ACCUMULATED DEPRECIATION
December 31, 2023
(dollars in millions, except quantity of buildings)
2023 | 2022 | 2021 | ||||||||||
Real estate properties, at cost: | ||||||||||||
Balance at January 1 | $ | 9,380.3 | $ | 8,062.7 | $ | 6,307.3 | ||||||
Capital expenditures | 418.1 | 449.9 | 364.1 | |||||||||
Acquisitions | 180.4 | 1,052.7 | 1,482.9 | |||||||||
Dispositions | (21.6 | ) | (7.0 | ) | (27.7 | ) | ||||||
Impairments | (0.4 | ) | (0.6 | ) | — | |||||||
Impact of foreign exchange rate changes and other | 63.3 | (177.4 | ) | (63.9 | ) | |||||||
|
|
|
|
|
| |||||||
Balance at December 31 | $ | 10,020.1 | $ | 9,380.3 | $ | 8,062.7 | ||||||
|
|
|
|
|
| |||||||
Accumulated depreciation: | ||||||||||||
Balance at January 1 | $ | (1,116.1 | ) | $ | (843.6 | ) | $ | (617.7 | ) | |||
Depreciation Expense | (309.1 | ) | (285.0 | ) | (233.5 | ) | ||||||
Dispositions | 7.3 | 1.7 | 4.8 | |||||||||
Impact of foreign exchange rate changes and other | (9.2 | ) | 10.8 | 2.8 | ||||||||
|
|
|
|
|
| |||||||
Balance at December 31 | $ | (1,427.1 | ) | $ | (1,116.1 | ) | $ | (843.6 | ) | |||
|
|
|
|
|
| |||||||
Total real estate properties, net at December 31 | $ | 8,593.0 | $ | 8,264.2 | $ | 7,219.1 | ||||||
|
|
|
|
|
|
F-84
Table of Contents
LINEAGE, INC. AND SUBSIDIARIES
CONDENSED CONSOLIDATED BALANCE SHEETS
(dollars in millions, except per share and share amounts)
March 31, 2024 | December 31, 2023 | |||||||
(unaudited) | ||||||||
Assets | ||||||||
Current assets: | ||||||||
Cash and cash equivalents | $ | 91.2 | $ | 68.2 | ||||
Restricted cash | 2.4 | 2.6 | ||||||
Accounts receivable, net | 869.4 | 912.9 | ||||||
Inventories | 167.9 | 170.6 | ||||||
Prepaid expenses and other current assets | 129.6 | 101.5 | ||||||
|
|
|
| |||||
Total current assets | 1,260.5 | 1,255.8 | ||||||
Non-current assets: | ||||||||
Property, plant, and equipment, net | 10,480.1 | 10,570.5 | ||||||
Finance lease right-of-use assets, net | 1,216.6 | 1,243.3 | ||||||
Operating lease right-of-use assets, net | 709.3 | 723.7 | ||||||
Equity method investments | 115.0 | 112.5 | ||||||
Goodwill | 3,373.1 | 3,393.9 | ||||||
Other intangible assets, net | 1,247.7 | 1,280.0 | ||||||
Other assets | 332.1 | 291.3 | ||||||
|
|
|
| |||||
Total assets | $ | 18,734.4 | $ | 18,871.0 | ||||
|
|
|
| |||||
Liabilities, Redeemable Noncontrolling Interests, and Equity | ||||||||
Current liabilities: | ||||||||
Accounts payable and accrued liabilities | $ | 1,030.5 | $ | 1,136.6 | ||||
Accrued distributions | 11.4 | 109.9 | ||||||
Deferred revenue | 86.9 | 94.4 | ||||||
Current portion of long-term debt, net | 21.7 | 24.3 | ||||||
|
|
|
| |||||
Total current liabilities | 1,150.5 | 1,365.2 | ||||||
Non-current liabilities: | ||||||||
Long-term finance lease obligations | 1,283.5 | 1,304.5 | ||||||
Long-term operating lease obligations | 676.5 | 692.1 | ||||||
Deferred income tax liability | 356.4 | 370.1 | ||||||
Long-term debt, net | 9,246.0 | 8,958.2 | ||||||
Other long-term liabilities | 158.4 | 159.6 | ||||||
|
|
|
| |||||
Total liabilities | 12,871.3 | 12,849.7 | ||||||
Commitments and contingencies (Note 16) | ||||||||
Redeemable noncontrolling interests | 255.1 | 348.9 | ||||||
Stockholders’ equity: | ||||||||
Common stock, $0.01 par value per share – 500,000,000 authorized shares; 161,762,835 and 162,017,515 issued and outstanding at March 31, 2024 and December 31, 2023, respectively | 1.6 | 1.6 | ||||||
Additional paid-in capital - common stock | 5,990.9 | 5,960.7 | ||||||
Series A preferred stock, $0.01 par value per share – 100,000,000 authorized shares; 630 issued and outstanding shares, with an aggregate liquidation preference of $0.6 at March 31, 2024 and December 31, 2023 | 0.6 | 0.6 | ||||||
Retained earnings (accumulated deficit) | (918.3 | ) | (878.6 | ) | ||||
Accumulated other comprehensive income (loss) | (96.8 | ) | (33.8 | ) | ||||
|
|
|
| |||||
Total stockholders’ equity | 4,978.0 | 5,050.5 | ||||||
Noncontrolling interests | 630.0 | 621.9 | ||||||
|
|
|
| |||||
Total equity | 5,608.0 | 5,672.4 | ||||||
|
|
|
| |||||
Total liabilities, redeemable noncontrolling interests, and equity | $ | 18,734.4 | $ | 18,871.0 | ||||
|
|
|
|
See accompanying notes to condensed consolidated financial statements.
F-85
Table of Contents
LINEAGE, INC. AND SUBSIDIARIES
CONDENSED CONSOLIDATED STATEMENTS OF OPERATIONS AND COMPREHENSIVE INCOME (LOSS)
(dollars in millions, except per share amounts)
Three Months Ended March 31, | ||||||||
2024 | 2023 | |||||||
(unaudited) | ||||||||
Net revenues | $ | 1,328.0 | $ | 1,333.3 | ||||
|
|
|
| |||||
Cost of operations | 883.8 | 890.2 | ||||||
General and administrative expense | 124.1 | 114.9 | ||||||
Depreciation expense | 157.7 | 129.5 | ||||||
Amortization expense | 53.4 | 51.7 | ||||||
Acquisition, transaction, and other expense | 8.6 | 10.8 | ||||||
Restructuring, impairment, and (gain) loss on disposals | (0.4 | ) | 4.2 | |||||
|
|
|
| |||||
Total operating expense | 1,227.2 | 1,201.3 | ||||||
|
|
|
| |||||
Income from operations | 100.8 | 132.0 | ||||||
|
|
|
| |||||
Other income (expense): | ||||||||
Equity income (loss), net of tax | (1.8 | ) | 0.2 | |||||
Gain (loss) on foreign currency transactions, net | (10.7 | ) | (1.3 | ) | ||||
Interest expense, net | (138.8 | ) | (114.7 | ) | ||||
Gain (loss) on extinguishment of debt | (6.5 | ) | — | |||||
Other nonoperating income (expense), net | (0.7 | ) | (0.2 | ) | ||||
|
|
|
| |||||
Total other income (expense), net | (158.5 | ) | (116.0 | ) | ||||
|
|
|
| |||||
Net income (loss) before income taxes | (57.7 | ) | 16.0 | |||||
Income tax expense (benefit) | (9.7 | ) | (2.6 | ) | ||||
|
|
|
| |||||
Net income (loss) | (48.0 | ) | 18.6 | |||||
Less: Net income (loss) attributable to noncontrolling interests | (8.3 | ) | 0.9 | |||||
|
|
|
| |||||
Net income (loss) attributable to Lineage, Inc. | $ | (39.7 | ) | $ | 17.7 | |||
|
|
|
| |||||
Other comprehensive income (loss), net of tax: | ||||||||
Unrealized gain (loss) on foreign currency hedges and interest rate hedges | 3.3 | (39.0 | ) | |||||
Foreign currency translation adjustments | (74.0 | ) | 30.2 | |||||
|
|
|
| |||||
Comprehensive income (loss) | (118.7 | ) | 9.8 | |||||
Less: Comprehensive income (loss) attributable to noncontrolling interests | (16.3 | ) | (0.1 | ) | ||||
|
|
|
| |||||
Comprehensive income (loss) attributable to Lineage, Inc. | $ | (102.4 | ) | $ | 9.9 | |||
|
|
|
| |||||
Basic earnings (loss) per share | $ | (0.28 | ) | $ | 0.04 | |||
|
|
|
| |||||
Diluted earnings (loss) per share | $ | (0.28 | ) | $ | 0.04 | |||
|
|
|
| |||||
Weighted average common shares outstanding (in millions): | ||||||||
Basic | 161.9 | 161.6 | ||||||
Diluted | 161.9 | 164.0 |
See accompanying notes to condensed consolidated financial statements.
F-86
Table of Contents
LINEAGE, INC. AND SUBSIDIARIES
CONDENSED CONSOLIDATED STATEMENTS OF REDEEMABLE NONCONTROLLING INTERESTS AND EQUITY (Unaudited)
(dollars in millions, except number of shares)
Common Stock | ||||||||||||||||||||||||||||||||||||||||
Redeemable noncontrolling interests | Number of shares | Amount at par value | Additional paid-in capital | Series A preferred stock | Retained earnings (accumulated deficit) | Accumulated other comprehensive income (loss) | Noncontrolling interests | Total equity | ||||||||||||||||||||||||||||||||
Balance as of December 31, 2023 | $ | 348.9 | 162,017,515 | $ | 1.6 | $ | 5,960.7 | $ | 0.6 | $ | (878.6 | ) | $ | (33.8 | ) | $ | 621.9 | $ | 5,672.4 | |||||||||||||||||||||
Distributions | (0.4 | ) | — | — | — | — | — | — | (12.3 | ) | (12.3 | ) | ||||||||||||||||||||||||||||
Stock-based compensation | — | — | — | 2.9 | — | — | — | 1.6 | 4.5 | |||||||||||||||||||||||||||||||
Other comprehensive income (loss) | (0.4 | ) | — | — | — | — | — | (62.7 | ) | (7.6 | ) | (70.3 | ) | |||||||||||||||||||||||||||
Redemption of redeemable noncontrolling interests (Note 2) | (6.3 | ) | — | — | — | — | — | — | — | — | ||||||||||||||||||||||||||||||
Redemption of common stock | — | (254,680 | ) | — | (25.0 | ) | — | — | — | — | (25.0 | ) | ||||||||||||||||||||||||||||
Expiration of redemption option (Note 2) | (92.4 | ) | — | — | 64.9 | — | — | — | 27.5 | 92.4 | ||||||||||||||||||||||||||||||
Redeemable noncontrolling interest adjustment | 0.5 | — | — | (0.5 | ) | — | — | — | — | (0.5 | ) | |||||||||||||||||||||||||||||
Accretion of redeemable noncontrolling interests | 5.4 | — | — | (5.4 | ) | — | — | — | — | (5.4 | ) | |||||||||||||||||||||||||||||
Net income (loss) | (0.2 | ) | — | — | — | — | (39.7 | ) | — | (8.1 | ) | (47.8 | ) | |||||||||||||||||||||||||||
Reallocation of noncontrolling interests | — | — | — | (6.7 | ) | — | — | (0.3 | ) | 7.0 | — | |||||||||||||||||||||||||||||
|
|
|
|
|
|
|
|
|
|
|
|
|
|
|
|
|
|
|
| |||||||||||||||||||||
Balance as of March 31, 2024 | $ | 255.1 | 161,762,835 | $ | 1.6 | $ | 5,990.9 | $ | 0.6 | $ | (918.3 | ) | $ | (96.8 | ) | $ | 630.0 | $ | 5,608.0 | |||||||||||||||||||||
|
|
|
|
|
|
|
|
|
|
|
|
|
|
|
|
|
|
|
|
See accompanying notes to condensed consolidated financial statements.
F-87
Table of Contents
LINEAGE, INC. AND SUBSIDIARIES
CONDENSED CONSOLIDATED STATEMENTS OF REDEEMABLE NONCONTROLLING INTERESTS AND EQUITY (Unaudited)
(dollars in millions, except number of shares)
Common Stock | ||||||||||||||||||||||||||||||||||||||||
Redeemable noncontrolling interests | Number of shares | Amount at par value | Additional paid-in capital | Series A preferred stock | Retained earnings (accumulated deficit) | Accumulated other comprehensive income (loss) | Noncontrolling interests | Total equity | ||||||||||||||||||||||||||||||||
Balance as of December 31, 2022 | $ | 297.8 | 160,400,437 | $ | 1.6 | $ | 5,915.0 | $ | 0.6 | $ | (712.8 | ) | $ | (37.4 | ) | $ | 640.9 | $ | 5,807.9 | |||||||||||||||||||||
Common stock issuances, net of equity raise costs | — | 1,558,333 | — | 140.3 | — | — | — | — | 140.3 | |||||||||||||||||||||||||||||||
Contributions from noncontrolling interests | — | — | — | 3.1 | — | — | — | 2.0 | 5.1 | |||||||||||||||||||||||||||||||
Distributions | — | — | — | — | — | — | — | (11.8 | ) | (11.8 | ) | |||||||||||||||||||||||||||||
Stock-based compensation | — | 48,447 | — | 2.5 | — | — | — | 1.8 | 4.3 | |||||||||||||||||||||||||||||||
Other comprehensive income (loss) | (0.1 | ) | — | — | — | — | — | (7.8 | ) | (0.9 | ) | (8.7 | ) | |||||||||||||||||||||||||||
Issuance of REIT subsidiary preferred shares | — | — | — | — | — | — | — | 0.1 | 0.1 | |||||||||||||||||||||||||||||||
Redemption of common stock | — | (37,037 | ) | — | (3.3 | ) | — | — | — | — | (3.3 | ) | ||||||||||||||||||||||||||||
Redemption of units issued as stock compensation | — | — | — | (9.5 | ) | — | — | — | (0.5 | ) | (10.0 | ) | ||||||||||||||||||||||||||||
Redeemable noncontrolling interest adjustment | 4.0 | — | — | (4.0 | ) | — | — | — | — | (4.0 | ) | |||||||||||||||||||||||||||||
Accretion of redeemable noncontrolling interests | 8.9 | — | — | (8.9 | ) | — | — | — | — | (8.9 | ) | |||||||||||||||||||||||||||||
Net income (loss) | 0.1 | — | — | — | — | 17.7 | — | 0.8 | 18.5 | |||||||||||||||||||||||||||||||
Reallocation of noncontrolling interests | — | — | — | (20.6 | ) | — | — | 2.0 | 18.6 | — | ||||||||||||||||||||||||||||||
|
|
|
|
|
|
|
|
|
|
|
|
|
|
|
|
|
|
|
| |||||||||||||||||||||
Balance as of March 31, 2023 | $ | 310.7 | 161,970,180 | $ | 1.6 | $ | 6,014.6 | $ | 0.6 | $ | (695.1 | ) | $ | (43.2 | ) | $ | 651.0 | $ | 5,929.5 | |||||||||||||||||||||
|
|
|
|
|
|
|
|
|
|
|
|
|
|
|
|
|
|
|
|
See accompanying notes to condensed consolidated financial statements.
F-88
Table of Contents
LINEAGE, INC. AND SUBSIDIARIES
CONDENSED CONSOLIDATED STATEMENTS OF CASH FLOWS
(dollars in millions)
Three Months Ended March 31, | ||||||||
2024 | 2023 | |||||||
(unaudited) | ||||||||
Cash flows from operating activities: | ||||||||
Net income (loss) | $ | (48.0 | ) | $ | 18.6 | |||
Adjustments to reconcile net income (loss) to net cash provided by operating activities: | ||||||||
Provision for credit losses | 0.9 | 0.8 | ||||||
Impairment of long-lived and intangible assets | — | 0.3 | ||||||
Depreciation and amortization | 211.1 | 181.2 | ||||||
(Gain) loss on extinguishment of debt, net | 6.5 | — | ||||||
Amortization of deferred financing costs and above/below market debt | 6.0 | 5.5 | ||||||
Stock-based compensation | 4.5 | 4.3 | ||||||
(Gain) loss on foreign currency transactions, net | 10.7 | 1.3 | ||||||
Deferred income tax | (22.9 | ) | (15.0 | ) | ||||
Other operating activities | 3.0 | 0.2 | ||||||
Changes in operating assets and liabilities (excluding effects of acquisitions): | ||||||||
Accounts receivable | 35.8 | 18.2 | ||||||
Prepaid expenses, other assets, and other long-term liabilities | (20.5 | ) | (28.3 | ) | ||||
Inventories | 2.3 | (6.2 | ) | |||||
Accounts payable and accrued liabilities and deferred revenue | (82.6 | ) | (72.6 | ) | ||||
Right-of-use assets and lease liabilities | (1.5 | ) | (0.8 | ) | ||||
|
|
|
| |||||
Net cash provided by operating activities | 105.3 | 107.5 | ||||||
|
|
|
| |||||
Cash flows from investing activities: | ||||||||
Business combinations, net of cash acquired | (58.9 | ) | — | |||||
Real estate purchases | — | (13.1 | ) | |||||
Deposits on pending acquisitions | 1.8 | 1.0 | ||||||
Purchase of property, plant, and equipment | (147.5 | ) | (228.7 | ) | ||||
Proceeds from sale of assets | 1.5 | 3.5 | ||||||
Other investing activity | 0.7 | (15.2 | ) | |||||
|
|
|
| |||||
Net cash used in investing activities | (202.4 | ) | (252.5 | ) | ||||
|
|
|
| |||||
Cash flows from financing activities: | ||||||||
Capital contributions, net of equity raise costs | — | 140.2 | ||||||
Contributions from noncontrolling interests | — | 3.0 | ||||||
Distributions to stockholders | (88.5 | ) | — | |||||
Distributions to noncontrolling interests | (22.5 | ) | (11.0 | ) | ||||
Distributions to redeemable noncontrolling interests | (0.4 | ) | — | |||||
Redemption of redeemable noncontrolling interests | (6.3 | ) | — | |||||
Financing fees | (44.2 | ) | — | |||||
Proceeds from long-term debt | 81.0 | — | ||||||
Repayments of long-term debt and finance leases | (971.8 | ) | (25.3 | ) | ||||
Borrowings on revolving line of credit | 1,837.4 | 262.8 | ||||||
Repayments on revolving line of credit | (631.5 | ) | (202.5 | ) | ||||
Redemption of units issued as stock compensation | — | (9.7 | ) | |||||
Redemption of common stock | (25.0 | ) | (3.3 | ) | ||||
Other financing activity | (7.0 | ) | (8.9 | ) | ||||
|
|
|
| |||||
Net cash provided by financing activities | 121.2 | 145.3 | ||||||
Impact of foreign exchange rates on cash, cash equivalents, and restricted cash | (1.3 | ) | 1.8 | |||||
|
|
|
| |||||
Net increase (decrease) in cash, cash equivalents, and restricted cash | 22.8 | 2.1 | ||||||
Cash, cash equivalents, and restricted cash at the beginning of the period | 70.8 | 202.0 | ||||||
|
|
|
| |||||
Cash, cash equivalents, and restricted cash at the end of the period | $ | 93.6 | $ | 204.1 | ||||
|
|
|
|
F-89
Table of Contents
LINEAGE, INC. AND SUBSIDIARIES
CONDENSED CONSOLIDATED STATEMENTS OF CASH FLOWS
(dollars in millions)
Three Months Ended March 31, | ||||||||
2024 | 2023 | |||||||
(unaudited) | ||||||||
Supplemental disclosures of cash flow information: | ||||||||
Cash paid for taxes | $ | 9.3 | $ | 24.0 | ||||
Cash paid for interest | $ | 160.9 | $ | 145.0 | ||||
Noncash activities: | ||||||||
Purchases of property, plant, and equipment in Accounts payable and accrued liabilities | $ | 73.0 | $ | 70.2 | ||||
Accrued distributions to noncontrolling interests | $ | 11.4 | $ | 11.4 | ||||
Net deferred and contingent consideration on acquisitions | $ | — | $ | 1.1 | ||||
Noncash capital contribution from noncontrolling interests | $ | — | $ | (2.1 | ) |
See accompanying notes to condensed consolidated financial statements.
F-90
Table of Contents
LINEAGE, INC. AND SUBSIDIARIES
Notes to Condensed Consolidated Financial Statements - Unaudited
Table of Contents for Notes to Condensed Consolidated Financial Statements
Note | Page | |||||
Significant accounting policies and practices | F-92 | |||||
Capital structure and noncontrolling interests | F-94 | |||||
Revenue | F-100 | |||||
Business combinations and asset acquisitions | F-100 | |||||
Property, plant, and equipment | F-102 | |||||
Goodwill and other intangible assets, net | F-102 | |||||
Prepaid expenses and other current assets | F-103 | |||||
Income taxes | F-103 | |||||
Debt | F-103 | |||||
Derivative instruments and hedging activities | F-107 | |||||
Interest expense | F-109 | |||||
Fair value measurements | F-110 | |||||
Leases | F-111 | |||||
Stock-based compensation | F-113 | |||||
Related-party balances | F-114 | |||||
Commitments and contingencies | F-115 | |||||
Accumulated other comprehensive income (loss) | F-117 | |||||
Earnings (loss) per share | F-117 | |||||
Segment information | F-119 | |||||
Subsequent events | F-120 |
F-91
Table of Contents
LINEAGE, INC. AND SUBSIDIARIES
Notes to Condensed Consolidated Financial Statements - Unaudited
(1) | Significant accounting policies and practices |
(a) | Basis of presentation and principles of consolidation |
The accompanying unaudited condensed consolidated financial statements have been prepared in conformity with the accounting principals generally accepted in the United States (“GAAP”) for interim financial information. Accordingly, they do not include all of the information and footnotes required by GAAP for complete financial statements. These financial statements include all adjustments, which consist of normal, recurring adjustments and transactions or events discretely impacting the interim periods, considered necessary for a fair statement of the financial position, results of operations, and cash flows of the Company. Certain prior period amounts have been reclassified to conform to current period presentation. The accompanying condensed consolidated financial statements include the accounts of Lineage, Inc. consolidated with the accounts of all subsidiaries and affiliates in which the Company holds a controlling financial interest as of the financial statement date. The operating results for the interim period ended March 31, 2024 are not necessarily indicative of results for the full year and should be read in conjunction with the Company’s consolidated financial statements and notes thereto for the year ended December 31, 2023.
The Company consolidates a voting interest entity (“VOE”) in which it has a controlling financial interest and a variable interest entity (“VIE”) if it possesses both the power to direct the activities of the VIE that most significantly affect its economic performance, and (a) is obligated to absorb the losses that could be significant to the VIE or (b) holds the right to receive benefits from the VIE that could be significant to the VIE. During 2023, the Company invested less than $1.0 million in two special-purpose entities which constituted VIEs in which the Company was the primary beneficiary as of December 31, 2023. During the three months ended March 31, 2024, the Company sold the special-purpose entities for a nominal amount. As of March 31, 2024, the Company did not have any VIEs.
(b) | Use of estimates in preparation of financial statements |
The preparation of the Company’s condensed consolidated financial statements in conformity with GAAP requires the Company to make estimates and assumptions that affect the reported amounts of assets and liabilities and the disclosure of contingent assets and liabilities as of the financial statement date and the reported amounts of revenues and expenses during the period. The Company bases its estimates on various factors and information which may include, but are not limited to, history and prior experience, expected future results, new related events, and economic conditions, which form the basis for making judgments about the carrying value of assets and liabilities that are not readily apparent from other sources. Actual results may differ from the estimates used in preparing the Company’s condensed consolidated financial statements.
(c) | Recently adopted accounting pronouncements |
In June 2022, the Financial Accounting Standards Board (“FASB”) issued ASU 2022-03, Fair Value Measurement (Topic 820): Fair Value Measurement of Equity Securities Subject to Contractual Sale Restrictions. The amendments in this ASU clarify that a contractual restriction on sale of an equity security is not considered part of the unit of account of the equity security and, therefore, is not considered in measuring fair value. The amendments also clarify that an entity cannot, as a separate unit of account, recognize and measure a contractual sale restriction. The ASU also requires additional disclosures surrounding equity securities subject to contractual sale restrictions. The Company adopted this ASU on January 1, 2024. The adoption of the new standard did not have a material impact on the condensed consolidated financial statements.
F-92
Table of Contents
LINEAGE, INC. AND SUBSIDIARIES
Notes to Condensed Consolidated Financial Statements - Unaudited
(d) | Recently issued accounting pronouncements not yet adopted |
In November 2023, the FASB issued ASU 2023-07, Segment Reporting (Topic 280): Improvements to Reportable Segment Disclosures. The amendments in this ASU require that an entity disclose significant segment expenses that are regularly provided to the chief operating decision maker (“CODM”) and included within each reported measure of segment profit or loss, disclose an amount for other segment items by reportable segment and a description of the amount’s composition, and provide all annual disclosures about a reportable segment’s profit or loss and assets currently required by ASC 280, Segment Reporting, in interim periods. The amendments also require that an entity disclose the title and position of the CODM with an explanation of how the CODM uses the reported measure(s) of segment profit or loss in assessing segment performance and making resource allocation decisions. This ASU is effective for fiscal years beginning after December 15, 2023 and interim periods beginning after December 15, 2024. The Company is still evaluating the impact this guidance will have on its consolidated financial statements.
In December 2023, the FASB issued ASU 2023-09, Income Taxes (Topic 740): Improvements to Income Tax Disclosures. This ASU amends existing income tax disclosure guidance, primarily requiring more detailed disclosure for income taxes paid and the effective tax rate reconciliation. This ASU is effective for fiscal years beginning after December 15, 2024. The Company is still evaluating the impact this guidance will have on its consolidated financial statements.
In March 2024, the U.S. Securities and Exchange Commission (“SEC”) adopted new rules that will require registrants to provide certain climate-related information in their registration statements and annual reports. The rules require information about a registrant’s climate-related risks that are reasonably likely to have a material impact on its business, results of operations, or financial condition. The required information about climate-related risks will also include disclosure of a registrant’s greenhouse gas emissions. Additionally, the rules will require registrants to present certain climate-related financial metrics in their audited financial statements. Some portions of the new rules will be effective for annual reporting periods beginning in calendar year 2025 and some in 2026. In April 2024, the SEC voluntarily stayed the implementation of these rules, pending resolution of judicial review. The Company is currently evaluating the impact of the rule changes on its consolidated financial statements.
In March 2024, the FASB issued ASU 2024-01, Compensation — Stock Compensation (Topic 718): Scope Application of Profits Interests and Similar Awards. This ASU clarifies the application of ASC 718, Compensation — Stock Compensation, to profits interests and similar instruments by providing illustrative examples of the proper accounting for such awards. The ASU does not contain changes to the application of the previously existing accounting guidance. This ASU is effective for fiscal years beginning after December 15, 2024. The Company does not expect this ASU to have an effect on the Company’s consolidated financial statements because the Company’s accounting for profits interests and similar instruments conforms to the clarified guidance.
(e) | Accounts receivable and Notes receivable |
Accounts receivable are recorded at the invoiced amount and are stated net of estimated allowances for uncollectible balances. Notes receivable primarily consist of amounts that are due and payable related to various business transactions. The current portion of notes receivable is recorded in Accounts receivable, net and the non-current portion is recorded in Other assets in the condensed consolidated balance sheets. The current portion of notes receivable was $6.0 million and $6.3 million as of March 31, 2024 and December 31, 2023, respectively. The non-current portion of notes receivable was $13.3 million and $20.4 million as of March 31, 2024 and December 31, 2023, respectively.
F-93
Table of Contents
LINEAGE, INC. AND SUBSIDIARIES
Notes to Condensed Consolidated Financial Statements - Unaudited
Allowances for uncollectible balances are reserved based on expected credit losses. Management exercises judgement in establishing these allowances and considers the balance outstanding and payment history. The Company writes off receivables against the allowances after all reasonable collection efforts are exhausted. The Company’s allowance for accounts receivable was $8.0 million and $7.1 million as of March 31, 2024 and December 31, 2023, respectively.
(f) | Investments in partially owned entities |
The Company accounts for its investments in partially owned entities where the Company does not have a controlling interest but has significant influence using the equity method of accounting, under which the net income of the entity is recognized in income and presented in Equity method investments within the condensed consolidated balance sheets. Allocations of profits and losses are made per the terms of the organizational documents. The Company’s ownership percentages in such investments range from 9.0% to 50.0%.
The Company has committed to invest up to a total of $108.0 million in its equity method investment Emergent Cold LatAm Holdings, LLC (“LatAm”). The Company has contributed a total of $75.2 million to date, of which the Company invested $4.8 million and $15.4 million during the three months ended March 31, 2024 and 2023, respectively. The Company has an option to purchase the remaining equity interests in LatAm during a period beginning on the third anniversary and expiring on the sixth anniversary of its initial investment date, which was July 2021.
The Company has interests in partially owned entities where the Company does not have a controlling interest or significant influence. These investments do not have readily determinable fair values, and the Company has elected the measurement alternative to measure these investments at cost less impairment, adjusted by observable price changes, with any fair value changes recognized in earnings. Refer to Note 12, Fair value measurements for additional information. As of March 31, 2024 and December 31, 2023, the carrying amount of these investments was $29.3 million and $29.8 million, respectively, and is presented within Other assets within the condensed consolidated balance sheets.
(2) | Capital structure and noncontrolling interests |
Lineage, Inc. was organized in 2017 under Maryland law by an affiliate of Bay Grove Capital, LLC (“Bay Grove Capital”) and operates as a real estate investment trust (“REIT”) for United States (U.S.) federal income tax purposes. All outstanding common shares of Lineage, Inc. are held by BG Lineage Holdings, LLC, a Delaware limited liability company (“BGLH”). Lineage, Inc. is the managing member of Lineage OP, LLC (“Lineage OP” or the “Operating Partnership”) and owns a controlling financial interest in Lineage OP. Lineage OP holds all direct interests in Lineage Logistics Holdings, LLC (“LLH”) other than certain interests held by LLH MGMT Profits, LLC (“LLH MGMT”), LLH MGMT Profits II, LLC (“LLH MGMT II”), and BG Maverick, LLC (“BG Maverick”).
Lineage, Inc. capital structure
(a) | Common Stock |
As of March 31, 2024 and December 31, 2023, there were 161.8 million and 162.0 million common shares issued and outstanding, respectively.
During the three months ended March 31, 2024 and 2023, Lineage, Inc. repurchased shares of its common stock as authorized by its Board of Directors (“Board”). Any repurchased shares are constructively retired and returned to an unissued status. The following table provides the number of
F-94
Table of Contents
LINEAGE, INC. AND SUBSIDIARIES
Notes to Condensed Consolidated Financial Statements - Unaudited
shares repurchased, average price paid per share, and total amount paid for share repurchases (in millions) for the three months ended March 31:
2024 | 2023 | |||||||
Total number of shares repurchased | 254,680 | 37,037 | ||||||
Average price paid per share | $ | 98.37 | $ | 90.00 | ||||
Total consideration paid for share repurchases | $ | 25.0 | $ | 3.3 |
Operating Partnership capital structure
The Operating Partnership has three classes of equity: Class A, Class B, and Class C units. A summary of these ownership interests as of March 31, 2024 and December 31, 2023 is as follows:
March 31, 2024 | December 31, 2023 | |||||||
Class A units owned by Lineage, Inc. | 161,762,835 | 162,017,515 | ||||||
Class A & B units owned by Non-Company LPs | 19,709,542 | 18,829,959 | ||||||
Redeemable Class A units owned by Non-Company LPs | 319,006 | 1,260,182 | ||||||
|
|
|
| |||||
Total | 181,791,383 | 182,107,656 | ||||||
|
|
|
|
Class C units are excluded from the above summary because their only claim on the underlying assets of the Operating Partnership is the distribution described below.
Noncontrolling interest in the Operating Partnership relates to the interest in the Operating Partnership owned by Non-Company LPs.
(b) | Noncontrolling Interest in Operating Partnership - Class A, Class B, and Class C |
As of March 31, 2024 and December 31, 2023, Non-Company LPs owned 10.8% and 10.3% of the outstanding Class A and Class B units of the Operating Partnership, respectively, other than the redeemable Operating Partnership units described below. Class A and Class B units are both voting capital interests in the Operating Partnership and are similar to each other in all material respects except that Class A units held by Non-Company LPs bear a Founders Equity Share (as described below) payable to Class C unit holders, whereas Class B units do not.
BG Cold, LLC (“BG Cold”), an affiliate of Bay Grove Management, holds all outstanding Class C units of the Operating Partnership. Class C units provide BG Cold the right to receive a percentage distribution (“Founders Equity Share”) upon certain distributions made to Non-Company LPs who hold Class A units of the Operating Partnership. Class C units also receive a distribution upon certain repurchases and redemptions of Class A units of the Operating Partnership held by Non-Company LPs. The calculation of the Founders Equity Share borne by Class A units in the Operating Partnership held by Non-Company LPs varies depending on the sub-class of Class A units but generally amounts to a percentage of all value appreciation over certain thresholds. On a quarterly basis, BG Cold also receives an advance distribution (“Advance Distribution”) against its future Founders Equity Share based on a formulaic amount of all capital contributed to the Operating Partnership after August 3, 2020. This Advance Distribution is an advance on the Class C Founders Equity Share to be paid upon the sale, redemption, or liquidation of, or other distributions to, Class A units and would offset subsequent Class C unit Founders Equity Share distributions paid in conjunction with a hypothetical sale, redemption, liquidation, or other distribution.
F-95
Table of Contents
LINEAGE, INC. AND SUBSIDIARIES
Notes to Condensed Consolidated Financial Statements - Unaudited
BG Cold received a total of $11.4 million in total Advance Distributions both during the three months ended March 31, 2024 and 2023.
(c) | Redeemable Noncontrolling Interests - Operating Partnership Units |
In connection with the acquisition of Cherry Hill Joliet, LLC, 279 Marquette Drive, LLC, Joliet Cold Storage, LLC, and Bolingbrook Cold Storage, LLC (collectively, “JCS”) in 2021, the Company entered into an Equity Purchase Agreement with the sellers of JCS. Under the terms of the agreement, the sellers acquired 941,176 Class A units of the Operating Partnership, and the sellers had a one-time right as of February 1, 2024 to put all, or a portion of, the units for cash. These units were accounted for as Redeemable noncontrolling interests in the condensed consolidated balance sheets and condensed consolidated statements of redeemable noncontrolling interests and equity due to the put right held by the sellers. Upon the exercise of the put right, the price to be paid for the redeemable noncontrolling interests was the current fair market value of the redeemable noncontrolling interest, subject to a minimum price (“floor”) equivalent to $97.0 million if the put right was exercised for all the units. Any redemption also required a distribution of any accrued but unpaid Founders Equity Share through the date of redemption, and the required accretion adjustments related to these units included the impact of the Founders Equity Share.
On February 1, 2024, one of the holders of these units elected to exercise their redemption rights for 61,593 of these units in exchange for total proceeds of $6.3 million. As a result of the partial redemption, BG Cold received a distribution of $0.4 million in respect of Founders Equity Share. The holders waived their redemption rights for their remaining 879,583 units and the units remained outstanding, which resulted in a reclassification of the redeemable noncontrolling interest to noncontrolling interest in the Operating Partnership. The difference between the carrying value of the redeemable noncontrolling interest and the ASC 810 carrying value for the remaining noncontrolling interest was recognized in Additional paid-in capital—common stock in the accompanying condensed consolidated balance sheets and condensed consolidated statements of redeemable noncontrolling interests and equity.
LLH Capital Structure
The Operating Partnership owns all outstanding equity interests of LLH except for those held by LLH MGMT, LLH MGMT II, and BG Maverick. Certain subsidiaries of LLH have also issued equity interests to third parties. All of these equity interests are accounted for as Noncontrolling interests in the condensed consolidated balance sheets and condensed consolidated statements of redeemable noncontrolling interests and equity.
(d) | Noncontrolling Interests in Other Consolidated Subsidiaries |
Noncontrolling interests in Other Consolidated Subsidiaries include entities other than the Operating Partnership in which the Company has a controlling interest but which are not wholly owned by the Company. Third parties own the following interests in the below Other Consolidated Subsidiaries:
March 31, 2024 | December 31, 2023 | |||||||
Cool Port Oakland Holdings, LLC | 13.3 | % | 13.3 | % | ||||
Lineage Jiuheng Logistics (HK) Group Company Ltd. | 40.0 | % | 40.0 | % | ||||
Kloosterboer BLG Coldstore GmbH | 49.0 | % | 49.0 | % | ||||
Turvo India Pvt. Ltd. | 1.0 | % | 1.0 | % |
F-96
Table of Contents
LINEAGE, INC. AND SUBSIDIARIES
Notes to Condensed Consolidated Financial Statements - Unaudited
In addition to the third-party interests detailed above, Noncontrolling interests in Other Consolidated Subsidiaries also include Series A Preferred shares issued by each of the Company’s REIT subsidiaries to third-party investors. Each REIT subsidiary has issued Series A Preferred shares, which are non-voting shares that have a $1,000 liquidation preference and a cumulative 12% per annum dividend preference. The REIT subsidiary Series A Preferred shares may be redeemed at the Company’s option for consideration equal to $1,000 plus all accrued and unpaid dividends thereon to and including the date fixed for redemption and are not convertible or exchangeable for any other property or securities of the Company.
On January 12, 2023, Lineage Logistics CC Holdings, LLC issued 123 preferred shares in order to become a REIT subsidiary. The Company’s REIT subsidiaries had an aggregate amount of 373 Series A preferred shares held by third parties outstanding as of March 31, 2024 and December 31, 2023.
(e) | Management Profits Interests Class C units |
The Company grants interests in LLH MGMT and LLH MGMT II to certain members of management. LLH MGMT and LLH MGMT II hold all outstanding Class C units in LLH (“Management Profits Interests Class C units”). Management Profits Interests Class C units entitle LLH MGMT and LLH MGMT II, and, by extension, certain members of management, to a formulaic amount of the profits of LLH, generally based on the growth of the Company’s share price over a certain threshold, subject to certain adjustments.
On certain occasions, the Company offers a repurchase opportunity for certain Management Profits Interests Class C units by offering cash settlement to repurchase units at their current fair market value. Certain Management Profits Interests Class C units were redeemed in exchange for a cash total of $10.0 million during the three months ended March 31, 2023. No such redemptions occurred during the three months ended March 31, 2024. In the condensed consolidated balance sheets and condensed consolidated statements of redeemable noncontrolling interests and equity, the carrying value of the redeemed units is recorded as a reduction of Noncontrolling interests, while the excess of the redemption payments over the carrying value of the redeemed units is recorded as a reduction of Additional paid-in capital - common stock.
(f) | Convertible Redeemable Noncontrolling Interests - Preference Shares |
During three months ended March 31, 2024 and 2023, the Company recorded net redeemable noncontrolling interest adjustments of $0.5 million and $4.0 million, respectively, representing the effect of foreign currency on the carrying amount and accrued dividends payable. As of March 31, 2024 and December 31, 2023, there were 2,214,553 Preference Shares outstanding. As of March 31, 2024 and December 31, 2023, the ending redeemable noncontrolling interest balance of $221.3 million and $220.8 million, respectively, represents the maximum redemption value of the Preference Shares.
F-97
Table of Contents
LINEAGE, INC. AND SUBSIDIARIES
Notes to Condensed Consolidated Financial Statements - Unaudited
Below is a summary of all activity for the Company’s redeemable noncontrolling interests during the three months ended March 31, 2024 and 2023, which are discussed in further detail above.
(in millions) | Redeemable Non controlling Interests – Operating Partnership Units | Convertible Redeemable Noncontrolling Interests – Preference Shares | Redeemable Noncontrolling Interest – Operating Subsidiaries | Total Redeemable noncontrolling interests | ||||||||||||
Balance as of December 31, 2023 | $ | 120.4 | $ | 220.8 | $ | 7.7 | $ | 348.9 | ||||||||
Distributions | (0.4 | ) | — | — | (0.4 | ) | ||||||||||
Other comprehensive income (loss) | (0.4 | ) | — | — | (0.4 | ) | ||||||||||
Redemption of redeemable noncontrolling interests | (6.3 | ) | — | — | (6.3 | ) | ||||||||||
Expiration of redemption option | (92.4 | ) | — | — | (92.4 | ) | ||||||||||
Redeemable noncontrolling interest adjustment | — | 0.5 | — | 0.5 | ||||||||||||
Accretion of redeemable noncontrolling interests | 4.8 | — | 0.6 | 5.4 | ||||||||||||
Net income (loss) | (0.1 | ) | — | (0.1 | ) | (0.2 | ) | |||||||||
|
|
|
|
|
|
|
| |||||||||
Balance as of March 31, 2024 | $ | 25.6 | $ | 221.3 | $ | 8.2 | $ | 255.1 | ||||||||
|
|
|
|
|
|
|
|
(in millions) | Redeemable Noncontrolling Interests - Operating Partnership Units | Convertible Redeemable Noncontrolling Interests - Preference Shares | Total Redeemable noncontrolling interests | |||||||||
Balance as of December 31, 2022 | $ | 84.8 | $ | 213.0 | $ | 297.8 | ||||||
Other comprehensive income (loss) | (0.1 | ) | — | (0.1 | ) | |||||||
Redeemable noncontrolling interest adjustment | — | 4.0 | 4.0 | |||||||||
Accretion of redeemable noncontrolling interests | 8.9 | — | 8.9 | |||||||||
Net income (loss) | 0.1 | — | 0.1 | |||||||||
|
|
|
|
|
| |||||||
Balance as of March 31, 2023 | $ | 93.7 | $ | 217.0 | $ | 310.7 | ||||||
|
|
|
|
|
|
F-98
Table of Contents
LINEAGE, INC. AND SUBSIDIARIES
Notes to Condensed Consolidated Financial Statements - Unaudited
Below is a summary of all activity for the Company’s noncontrolling interests during the three months ended March 31, 2024 and March 31, 2023, which are discussed in further detail above.
(in millions) | Operating Partnership Units - Class A, B, & C | Noncontrolling Interests in Other Consolidated Subsidiaries | Management Profits Interests Class C Units | Total Noncontrolling interests | ||||||||||||
Balance as of December 31, 2023 | $ | 597.7 | $ | 15.6 | $ | 8.6 | $ | 621.9 | ||||||||
Distributions | (11.3 | ) | (1.0 | ) | — | (12.3 | ) | |||||||||
Stock-based compensation | — | — | 1.6 | 1.6 | ||||||||||||
Other comprehensive income (loss) | (7.6 | ) | — | — | (7.6 | ) | ||||||||||
Expiration of redemption option | 27.5 | — | — | 27.5 | ||||||||||||
Net income (loss) | (4.8 | ) | 0.2 | (3.5 | ) | (8.1 | ) | |||||||||
Reallocation of noncontrolling interests | 7.0 | — | — | 7.0 | ||||||||||||
|
|
|
|
|
|
|
| |||||||||
Balance as of March 31, 2024 | $ | 608.5 | $ | 14.8 | $ | 6.7 | $ | 630.0 | ||||||||
|
|
|
|
|
|
|
|
(in millions) | Operating Partnership Units - Class A, B, & C | Noncontrolling Interests in Other Consolidated Subsidiaries | Management Profits Interests Class C Units | Total Noncontrolling interests | ||||||||||||
Balance as of December 31, 2022 | $ | 608.1 | $ | 20.5 | $ | 12.3 | $ | 640.9 | ||||||||
Contributions from noncontrolling interests | 2.0 | — | — | 2.0 | ||||||||||||
Distributions | (11.8 | ) | — | — | (11.8 | ) | ||||||||||
Stock-based compensation | — | — | 1.8 | 1.8 | ||||||||||||
Other comprehensive income (loss) | (0.9 | ) | — | — | (0.9 | ) | ||||||||||
Issuance of REIT subsidiary preferred shares | — | 0.1 | — | 0.1 | ||||||||||||
Redemption of units issued as stock compensation | — | — | (0.5 | ) | (0.5 | ) | ||||||||||
Net income (loss) | 2.1 | — | (1.3 | ) | 0.8 | |||||||||||
Reallocation of noncontrolling interests | 18.6 | — | — | 18.6 | ||||||||||||
|
|
|
|
|
|
|
| |||||||||
Balance as of March 31, 2023 | $ | 618.1 | $ | 20.6 | $ | 12.3 | $ | 651.0 | ||||||||
|
|
|
|
|
|
|
|
F-99
Table of Contents
LINEAGE, INC. AND SUBSIDIARIES
Notes to Condensed Consolidated Financial Statements - Unaudited
(3) | Revenue |
The following table disaggregates the Company’s net revenues by major stream and reportable segment for the three months ended March 31:
(in millions) | 2024 | 2023 | ||||||
Warehousing operations | $ | 872.2 | $ | 862.8 | ||||
Warehouse lease revenues | 67.1 | 64.0 | ||||||
Managed services | 25.2 | 21.6 | ||||||
Other | 4.1 | 9.2 | ||||||
|
|
|
| |||||
Total Global Warehousing | $ | 968.6 | $ | 957.6 | ||||
Transportation | 204.2 | 228.3 | ||||||
Food sales | 48.5 | 55.0 | ||||||
Redistribution revenues | 48.0 | 44.5 | ||||||
E-commerce and other | 40.1 | 29.9 | ||||||
Railcar lease revenues | 18.6 | 18.0 | ||||||
|
|
|
| |||||
Total Global Integrated Solutions | $ | 359.4 | $ | 375.7 | ||||
|
|
|
| |||||
Total net revenues | $ | 1,328.0 | $ | 1,333.3 | ||||
|
|
|
|
The Company has no material warranties or obligations for allowances, refunds, or other similar obligations. As a practical expedient, the Company does not assess whether a contract has a significant financing component, as the period between the transfer of service to the customer and the receipt of customer payment is less than a year.
As of March 31, 2024, the Company had $1,032.1 million of remaining unsatisfied performance obligations from contracts with customers subject to a non-cancellable term and within contracts that have an original expected duration exceeding one year. These obligations also do not include variable consideration beyond the non-cancellable term, which, due to the inability to quantify by estimate, is fully constrained. The Company expects to recognize 21% of these remaining performance obligations as revenue over the next 12 months and the remaining 79% to be recognized over a weighted average period of 10.0 years through 2043.
Accounts receivable balances related to contracts with customers were $785.8 million and $804.5 million as of March 31, 2024 and December 31, 2023, respectively.
Deferred revenue balances related to contracts with customers were $86.0 million, and $93.3 million as of March 31, 2024 and December 31, 2023, respectively. Substantially all revenue that was included in the deferred revenue balances at the beginning of 2024 has been recognized as of March 31, 2024 and represents revenue from the satisfaction of storage and handling services billed in advance.
(4) | Business combinations and asset acquisitions |
2024 Business Combinations
The following acquisition took place during the three months ended March 31, 2024. The initial accounting for the 2023 and 2024 business combinations has been completed on a preliminary basis. The primary areas of acquisition accounting that are not yet finalized relate to the valuation of all acquired real estate assets, intangible assets, and related income tax assets and liabilities. The Company’s estimates and assumptions are subject to change during the measurement period, not to exceed one year from the acquisition date, and actual values may materially differ from the preliminary
F-100
Table of Contents
LINEAGE, INC. AND SUBSIDIARIES
Notes to Condensed Consolidated Financial Statements - Unaudited
estimates. The Company’s condensed consolidated statements of operations and comprehensive income (loss), redeemable noncontrolling interests and equity, and cash flows for the three months ended March 31, 2024 include the results of operations for this business since the date of acquisition.
The following table summarizes the total consideration and the estimated fair value of the assets acquired and liabilities assumed for the business combination made by the Company during the three months ended March 31, 2024.
(in millions) | Entrepôt du Nord Inc. | |||
Fair value of consideration transferred | ||||
Cash paid | $ | 59.5 | ||
|
| |||
Total | $ | 59.5 | ||
Recognized amounts of identifiable assets acquired and liabilities assumed | ||||
Cash and cash equivalents | 0.8 | |||
Accounts receivable, net and prepaid expenses and other current assets | 1.6 | |||
Property, plant, and equipment | 30.8 | |||
Customer relationships (included in other intangible assets) | 14.8 | |||
Accounts payable and accrued liabilities and deferred revenue | (0.6 | ) | ||
Deferred income tax liabilities | (9.7 | ) | ||
|
| |||
Total identified net assets | $ | 37.7 | ||
Goodwill | $ | 21.8 |
(a) | Entrepôt du Nord |
On February 1, 2024, the Company acquired all of the outstanding equity of Entrepôt du Nord Inc. and 2957-8002 Quebec Inc. (collectively “EDN”) through a share purchase agreement for $59.5 million in cash consideration. EDN owns and operates a warehouse facility near Montreal in Quebec, Canada. EDN is primarily engaged in temperature controlled warehousing services.
The goodwill associated with this acquisition is primarily attributable to the strategic benefits of strengthening the Company’s warehousing network in Canada. The goodwill associated with this acquisition is not amortizable for income tax purposes. The goodwill is attributable to the Company’s Global Warehousing segment.
Updates Relating to Prior Period Acquisitions
(a) | Burris |
During the three months ended March 31, 2024, the Company recorded an adjustment to the total cash consideration paid and related goodwill in the amount of $0.2 million for the acquisition of certain facilities and related assets from Burris Logistics in 2023, resulting from an incremental post-closing true-up payment made to the seller.
F-101
Table of Contents
LINEAGE, INC. AND SUBSIDIARIES
Notes to Condensed Consolidated Financial Statements - Unaudited
(5) | Property, plant, and equipment |
Property, plant, and equipment, net consists of the following:
(in millions) | March 31, 2024 | December 31, 2023 | Estimated Useful Life (Years) | |||||||||
Buildings, building improvements, and refrigeration equipment | $ | 8,583.7 | $ | 8,544.4 | 1 — 40 | |||||||
Land and land improvements | 1,449.2 | 1,446.3 | 15 — Indefinite | |||||||||
Machinery and equipment | 1,262.8 | 1,316.3 | 5 — 20 | |||||||||
Railcars | 537.8 | 534.5 | 7 — 50 | |||||||||
Furniture, fixtures, and equipment | 611.9 | 563.1 | 1 — 7 | |||||||||
|
|
|
| |||||||||
Gross property, plant, and equipment | 12,445.4 | 12,404.6 | ||||||||||
Less accumulated depreciation | (2,383.2 | ) | (2,266.2 | ) | ||||||||
Construction in progress | 417.9 | 432.1 | ||||||||||
|
|
|
| |||||||||
Property, plant, and equipment, net | $ | 10,480.1 | $ | 10,570.5 | ||||||||
|
|
|
|
For the three months ended March 31, 2024, the Company recorded no impairment charges. For the three months ended March 31, 2023, impairment charges of less than $1.0 million were recorded, which are included in Restructuring, impairment, and (gain) loss on disposals in the Company’s condensed consolidated statements of operations and comprehensive income (loss).
(6) | Goodwill and other intangible assets, net |
Changes in the carrying amount of goodwill for each reportable segment for the three months ended March 31, 2024 are as follows:
(in millions) | Global Warehousing | Global Integrated Solutions | Total | |||||||||
Balance, December 31, 2023 | $ | 2,749.5 | $ | 644.4 | $ | 3,393.9 | ||||||
Goodwill acquired1 | 21.8 | — | 21.8 | |||||||||
Measurement period adjustments1 | 0.2 | — | 0.2 | |||||||||
Foreign currency translation | (37.4 | ) | (5.4 | ) | (42.8 | ) | ||||||
|
|
|
|
|
| |||||||
Balance, March 31, 2024 | $ | 2,734.1 | $ | 639.0 | $ | 3,373.1 | ||||||
|
|
|
|
|
|
The following are the Company’s total other intangible assets as of:
March 31, 2024 | December 31, 2023 |
| ||||||||||||||||||||||||||
(in millions) | Gross Carrying Amount | Accumulated Amortization | Net Carrying Amount | Gross Carrying Amount | Accumulated Amortization | Net Carrying Amount | Useful Life (Years) | |||||||||||||||||||||
Customer relationships | $ | 1,500.2 | $ | (364.6 | ) | $ | 1,135.6 | $ | 1,506.7 | $ | (343.3 | ) | $ | 1,163.4 | 5 - 28 | |||||||||||||
In-place leases | 97.2 | (22.0 | ) | 75.2 | 98.1 | (20.5 | ) | 77.6 | 2 - 31 | |||||||||||||||||||
Technology | 31.5 | (5.8 | ) | 25.7 | 31.5 | (5.0 | ) | 26.5 | 10 | |||||||||||||||||||
Trade names | 9.3 | (6.3 | ) | 3.0 | 24.2 | (20.7 | ) | 3.5 | 1 - 15 | |||||||||||||||||||
Other | 19.6 | (11.4 | ) | 8.2 | 19.9 | (10.9 | ) | 9.0 | 4 - 17 | |||||||||||||||||||
|
|
|
|
|
|
|
|
|
|
|
| |||||||||||||||||
Other intangible assets | $ | 1,657.8 | $ | (410.1 | ) | $ | 1,247.7 | $ | 1,680.4 | $ | (400.4 | ) | $ | 1,280.0 | ||||||||||||||
|
|
|
|
|
|
|
|
|
|
|
|
1 | See Note 4, Business combinations and asset acquisitions for details. |
F-102
Table of Contents
LINEAGE, INC. AND SUBSIDIARIES
Notes to Condensed Consolidated Financial Statements - Unaudited
During the three months ended March 31, 2024, the Company derecognized fully-amortized intangible assets and the associated accumulated amortization totaling $15.4 million.
Customer relationships intangible assets acquired during the three months ended March 31, 2024 have a weighted-average amortization period of 15 years.
(7) | Prepaid expenses and other current assets |
Prepaid expenses and other current assets consist of the following:
(in millions) | March 31, 2024 | December 31, 2023 | ||||||
Prepaid expenses | $ | 84.6 | $ | 62.6 | ||||
Other current assets | 28.8 | 29.7 | ||||||
Deferred equity raise costs | 16.2 | 9.2 | ||||||
|
|
|
| |||||
Total | $ | 129.6 | $ | 101.5 | ||||
|
|
|
|
(8) | Income taxes |
The Company’s provision for income taxes is based upon an estimated annual tax rate for the year applied to U.S. federal, U.S. state, and foreign income. Significant discrete items that are not consistent from period to period are recorded to Income tax expense (benefit) in the quarter in which they occur.
The Company’s effective tax rate for the three months ended March 31, 2024 and 2023 was 16.8% and (16.3%), respectively. The annual effective tax rates differ from the U.S. statutory rate primarily due to the Company operating as a real estate investment trust (REIT) for U.S. federal income tax purposes, the differences in tax rates at which foreign income is taxed, and certain nondeductible expenses, income tax credits, and changes in valuation allowance.
(9) | Debt |
Debt consists of the following at:
(in millions) | March 31, 2024 | December 31, 2023 | ||||||
Credit Agreement - Revolving Credit Facility, variable rate, due February 2028 | $ | 2,385.0 | $ | 1,205.3 | ||||
Adjustable Rate Multi-Property Loan (CMBS 4), variable rate, due May 2024 | 2,344.2 | 2,344.2 | ||||||
Private Placement Guaranteed Senior Unsecured Notes, fixed rates, due August 2026-2031 | 1,431.2 | 1,443.4 | ||||||
Adjustable Rate Multi-Property Loan (CMBS 5), variable rate, due November 20241 | 1,297.5 | 1,297.5 | ||||||
Credit Agreement - Term Loan A, variable rate, due February 2029 | 1,000.0 | 1,875.0 | ||||||
Private Placement Guaranteed Senior Unsecured Notes, fixed rates, due August 2027-2032 | 259.0 | 264.9 | ||||||
MetLife Real Estate Lending, LLC, - iStar, fixed rate 4.51%, due October 2028 | 228.0 | 228.0 |
1 | The maturity of CMBS 5 may be extended to November 9, 2025 through a one-year extension option that can be exercised if certain covenants are met. |
F-103
Table of Contents
LINEAGE, INC. AND SUBSIDIARIES
Notes to Condensed Consolidated Financial Statements - Unaudited
(in millions) | March 31, 2024 | December 31, 2023 | ||||||
MetLife Real Estate Lending, LLC - Richland, fixed rate 4.00%/4.10%, due January 2026 | 164.4 | 164.9 | ||||||
MetLife Real Estate Lending, LLC - Cool Port Oakland, variable rate, due March 2029 | 81.0 | — | ||||||
Transportes Fuentes Group Term Loans, various rates, due November 2024—July 2028 | 25.0 | 28.2 | ||||||
MetLife Real Estate Lending, LLC - Cool Port Oakland, variable rate, due March 2024 | — | 76.7 | ||||||
Other debt, various rates and maturities | 76.8 | 80.5 | ||||||
|
|
|
| |||||
Total debt | 9,292.1 | 9,008.6 | ||||||
Less current portion long-term debt | (21.7 | ) | (24.3 | ) | ||||
Less deferred financing costs | (21.9 | ) | (23.3 | ) | ||||
Less below-market debt | (5.4 | ) | (5.9 | ) | ||||
Plus above-market debt | 2.9 | 3.1 | ||||||
|
|
|
| |||||
Total long-term debt, net | $ | 9,246.0 | $ | 8,958.2 | ||||
|
|
|
|
(a) | Credit Agreement—Revolving Credit Facility and Term Loan A |
On December 22, 2020, the Company entered into a revolving credit and term loan agreement (collectively, the “Credit Agreement”) consisting of a multi-currency revolving credit facility (the “Revolving Credit Facility”) and a USD-denominated term loan (the “Term Loan A”) with various lenders. The Revolving Credit Facility and Term Loan A had an original maturity of December 22, 2024 and December 22, 2025, respectively. The Credit Agreement became unsecured with an amendment on August 20, 2021.
Effective February 15, 2024, the Company amended and restated the Credit Agreement, increasing the Company’s borrowing capacity under the existing Revolving Credit Facility from $2,625.0 million to $3,500.0 million. The amendment also resulted in a pay down of $875.0 million on the Term Loan A using funds available on the Revolving Credit Facility. After the amendment, the remaining outstanding balance on the Term Loan A is $1,000.0 million. Additionally, the amendment gives the Company the right to increase the size of the existing Term Loan A, add one or more incremental term loans, and/or increase commitments under the Revolving Credit Facility, up to $500.0 million, which would increase the total aggregate commitment amount of the existing Credit Agreement to $5,000.0 million. The amended maturity dates for the Revolving Credit Facility and Term Loan A are February 15, 2028 and February 15, 2029, respectively. Under the terms of Credit Agreement, the Revolving Credit Facility may be extended through two six-month extension options that can be exercised if certain conditions are met.
During the three months ended March 31, 2024, and in connection with the refinancing of the Credit Agreement, the Company incurred total fees and expenses of $33.9 million, of which $31.1 million was capitalized as deferred financing costs, ($1.7) million was recognized as an immediate Gain (loss) on extinguishment of debt, and $1.1 million was recognized in General and administrative expense as third-party costs related to a debt modification. Of the capitalized $31.1 million in deferred financing costs, $26.4 million related to the Revolving Credit Facility and $4.7 million related to the Term Loan A, which are presented in Other assets and Long-term debt, net, respectively, within the Company’s condensed consolidated balance sheets. In addition, during the three months ended March 31, 2024, the Company recognized an additional ($4.8) million in Gain (loss) on extinguishment of debt related to unamortized deferred financing costs for the portions of the Credit Agreement determined to be extinguished.
F-104
Table of Contents
LINEAGE, INC. AND SUBSIDIARIES
Notes to Condensed Consolidated Financial Statements - Unaudited
The following table provides the details of the Company’s Credit Agreement:
March 31, 2024 | December 31, 2023 | |||||||||||||||||||||
(in millions) | Contractual Interest Rate (1) | Borrowing Currency | Carrying Amount (USD) | Contractual Interest Rate (1) | Borrowing Currency | Carrying Amount (USD) | ||||||||||||||||
Term Loan A | ||||||||||||||||||||||
USD | SOFR+1.60% | 1,000.0 | $ | 1,000.0 | SOFR+1.60% | 1,875.0 | $ | 1,875.0 | ||||||||||||||
Revolving Credit Facility |
| |||||||||||||||||||||
USD | SOFR+1.60% | 1,510.0 | 1,510.0 | SOFR+1.60% | 315.0 | 315.0 | ||||||||||||||||
CAD | CDOR+1.60% | 440.0 | 324.9 | CDOR+1.60% | 448.0 | 338.1 | ||||||||||||||||
AUD | BBSW+1.60% | 355.0 | 231.3 | BBSW+1.60% | 349.0 | 237.7 | ||||||||||||||||
EUR | EURIBOR+1.60% | 187.0 | 201.8 | EURIBOR+1.60% | 175.0 | 193.2 | ||||||||||||||||
DKK | CIBOR+1.60% | 503.0 | 72.8 | CIBOR+1.60% | 498.0 | 73.7 | ||||||||||||||||
NZD | BKBM+1.60% | 62.0 | 37.1 | BKBM+1.60% | 62.0 | 39.2 | ||||||||||||||||
NOK | NIBOR+1.60% | 78.0 | 7.1 | NIBOR+1.60% | 86.0 | 8.4 | ||||||||||||||||
|
|
|
| |||||||||||||||||||
Total Revolving Credit Facility | $ | 2,385.0 | $ | 1,205.3 | ||||||||||||||||||
|
|
|
|
1 | SOFR = Secured Overnight Financing Rate, CDOR = Canadian Dollar Offered Rate, BBSW = Bank Bill Swap Rate, EURIBOR = Euro Interbank Offered Rate, CIBOR = Copenhagen Interbank Offered Rate, NIBOR = Norwegian Interbank Offered Rate, BKBM = Bank Bill Reference Rate |
There were $66.1 million and $66.5 million letters of credit issued on the Company’s Revolving Credit Facility as of March 31, 2024 and December 31, 2023, respectively. Under the Credit Agreement, the Company has the ability to issue up to $100.0 million as letters of credit.
(b) | Delayed-draw term loan facility |
On February 15, 2024, the Company entered into an unsecured delayed-draw term loan facility (“DDTL”) with a borrowing capacity of up to $2,400.0 million. The involved parties, in addition to the Company, included a syndicate of banks, financial institutions, and other entities, with notable participants being JPMorgan Chase Bank, N.A. (“JPMorgan”) also acting as the administrative agent, and Wells Fargo Securities LLC also acting as a syndication agent. Under this facility, the full commitment was available for borrowing in a single drawing during the period commencing on the closing date and ending on May 10, 2024. In addition, the Company has the right to increase the size of the DDTL, up to $500.0 million, which would increase the total aggregate commitment amount to $2,900.0 million.
The DDTL matures one year from closing, on February 14, 2025. The DDTL may be extended through a twelve-month extension option that can be exercised if certain conditions are met and an extension fee of 0.25% is paid.
The agreement permits prepayments of principal, in whole or in part, at any time, without premium or penalty. There are also additional instances outlined that would trigger a mandatory principal prepayment under specified events. The Company is required to prepay 100% of the aggregate net cash proceeds from any issuance or offering of common or preferred equity securities through an underwritten public offering of equity interests in which the equity interests of the Company are listed on a nationally-recognized stock exchange (“Qualified Initial Public Offering”) or a generally offered equity raise, any portion of net cash proceeds in excess of $100.0 million for any debt issuances (on a cumulative basis, excluding borrowings or repayments under the Company’s existing Credit
F-105
Table of Contents
LINEAGE, INC. AND SUBSIDIARIES
Notes to Condensed Consolidated Financial Statements - Unaudited
Agreement), and any portion of net cash proceeds in excess of $100.0 million on any sale, transfer, or other disposition of any owned or ground-leased real or personal property or equity interests (on a cumulative basis).
On or before December 31, 2024, the Company must repay outstanding DDTL balances in an amount equal to at least 20% of the aggregate principal amount borrowed on the initial funding date.
Term loan borrowings under the DDTL facility will bear interest at a rate per annum equal to Term SOFR plus 0.10% (or “Adjusted Term SOFR”), plus the applicable margin ranging from 1.60% to 2.20% based on the Company’s total leverage ratio. Based on the Company’s existing total leverage ratio, the interest rate expected to be in effect for the Company’s prospective DDTL borrowing is Adjusted Term SOFR plus 1.60%. Interest is payable in arrears on a quarterly basis. In addition, the DDTL facility is subject to a commitment fee of 0.20% on the average daily unused amount of the facility commitment.
During the three months ended March 31, 2024, and in connection with the execution of the DDTL, the Company incurred and capitalized fees and expenses of $9.2 million as deferred financing costs. The DDTL capitalized deferred financing costs are presented in Other assets within the condensed consolidated balance sheets.
On April 9, 2024, the Company borrowed the full $2,400.0 million available under the DDTL. The borrowing proceeds were used to pay off the CMBS 4 loan and to partially repay the Revolving Credit Facility. In accordance with the terms of the DDTL agreement, $480.0 million (or 20%) of the total principal balance is to be classified as a current liability, as it represents the portion of the principal amount required to be repaid on or before December 31, 2024.
(c) | Adjustable rate multi-property loan (CMBS 4) |
On May 9, 2019, the Company entered into an adjustable rate multi-property loan agreement (“CMBS 4”) with Column Financial, Inc., Bank of America, N.A., and Morgan Stanley Bank, N.A. in the aggregate amount of $2,350.0 million.
On April 9, 2024, using the proceeds from the DDTL, the Company fully paid the remaining outstanding CMBS 4 principal balance of $2,344.2 million, along with $14.2 million in accrued interest and fees.
(d) | MetLife Real Estate Lending LLC—Cool Port Oakland |
On March 25, 2019, the Company entered into a loan agreement with MetLife Real Estate Lending LLC in the amount of $81.3 million.
On February 6, 2024, the Company entered into a new $81.0 million loan agreement with MetLife Real Estate Lending LLC, designed as a refinancing arrangement, with a maturity date of March 5, 2029. This agreement enabled the company to fully pay the outstanding balloon payment of $76.5 million associated with the previous loan due to mature in March 2024. After the repayment, debt issuance fees, and other closing costs, the Company received net cash proceeds of $3.5 million. The loan bears interest at SOFR plus a spread of 1.77% per annum. In addition, the agreement mandates monthly interest-only payments with a balloon repayment of the outstanding principal amount due upon maturity.
As a result of the financing, the Company capitalized $1.1 million of incurred fees and expenses as deferred financing costs during three months ended March 31, 2024.
F-106
Table of Contents
LINEAGE, INC. AND SUBSIDIARIES
Notes to Condensed Consolidated Financial Statements - Unaudited
(e) | Deferred financing costs and gain (loss) on extinguishment of debt |
During the three months ended March 31, 2024 and 2023 the Company recognized amortization of deferred financing costs recorded to Interest expense, net of $5.6 million and $4.8 million, respectively.
At March 31, 2024 and December 31, 2023, the amount of unamortized deferred financing costs in Long-term debt, net within the condensed consolidated balance sheets was $21.9 million and $23.3 million, respectively. At March 31, 2024 and December 31, 2023, the amount of unamortized deferred financing costs in Other assets within the condensed consolidated balance sheets was $41.5 million and $9.1 million, respectively.
During the three months ended March 31, 2024, as the result of various debt refinancing arrangements, the Company recorded ($6.5) million to Gain (loss) on extinguishment of debt.
(f) | Collateral |
CMBS 4 and CMBS 5 are secured by certain assets in which the lender has been granted a security interest pursuant to the loan agreement. Other than the unsecured loan agreements noted above, all other debt instruments are secured by various other assets specific to the underlying agreement.
(10) | Derivative instruments and hedging activities |
(a) | Risk management objective of using derivatives |
The Company is exposed to certain risks arising from both its business operations and economic conditions. The Company principally manages its exposures to a wide variety of business and operational risks through management of its core business activities. The Company manages economic risks, including interest rate, foreign currency, liquidity, and credit risk, primarily by managing the amount, sources, and duration of its assets and liabilities and with the use of derivative financial instruments.
(b) | Cash flow hedges of interest rate and foreign currency risk |
The Company’s objectives in using interest rate derivatives are to manage its exposure to interest rate movements and to mitigate the potential volatility to interest expense. To accomplish this objective, the Company primarily uses interest rate swaps and caps as part of its interest rate risk management strategy. Interest rate swaps involve the receipt of variable amounts from a counterparty in exchange for the Company making fixed-rate payments over the life of the agreements without exchange of the underlying notional amount. Interest rate caps involve the receipt of variable amounts from a counterparty if interest rates rise above the strike rate on the contract in exchange for a premium. The Company’s designated interest rate swaps and caps hedge variable-rate interest payments using a first payments approach. The first payments approach allows an entity to hedge interest payments on a designated principal amount, rather than a specific, named debt issuance. Refer to Note 9, Debt for additional information.
In addition, the Company enters into derivative financial instruments to manage exposures that arise from business activities that result in the receipt or payment of future cash amounts due to changes in foreign currency rates.
F-107
Table of Contents
LINEAGE, INC. AND SUBSIDIARIES
Notes to Condensed Consolidated Financial Statements - Unaudited
(c) | Designated hedges |
As of March 31, 2024, the Company had the following outstanding interest rate and foreign currency derivatives that were designated as cash flow hedging instruments:
Number of Instruments | Notional (in millions) | |||||||||||
Interest rate derivatives: | ||||||||||||
Interest rate swap | 2 | USD | 1,000.0 | |||||||||
Interest rate cap | 3 | USD | 1,500.0 | |||||||||
|
|
|
|
|
| |||||||
Total | 5 | USD | 2,500.0 | |||||||||
|
|
|
|
|
|
(in millions) | Buy Notional | Sell Notional | ||||||||||||||
Foreign currency derivatives: | ||||||||||||||||
Buy EUR/Sell GBP forward | EUR | 36.0 | GBP | 31.2 | ||||||||||||
Buy USD/Sell GBP forward | USD | 3.9 | GBP | 3.1 |
The table below presents the effect of the Company’s derivatives that are designated as hedging instruments on the accompanying condensed consolidated statements of operations and comprehensive income (loss) for the three months ended March 31, 2024 and 2023 (in millions).
Derivatives in Cash Flow Hedging Relationships | Amount of Gain (Loss) Recognized in OCI on Derivatives | Location of Gain (Loss) Reclassified from Accumulated OCI into Earnings | Amount of Gain (Loss) Reclassified from Accumulated OCI into Earnings | |||||||||||||||
2024 | 2023 | 2024 | 2023 | |||||||||||||||
Included in effectiveness testing: |
| |||||||||||||||||
Interest rate contracts | $ | 32.4 | $ | (15.1 | ) | Interest expense, net | $ | 26.0 | $ | 25.7 | ||||||||
Foreign exchange contracts | (0.5 | ) | (0.4 | ) | Gain (loss) on foreign currency transactions, net | — | (0.2 | ) | ||||||||||
Excluded from effectiveness testing and recognized in earnings based on an amortization approach: | ||||||||||||||||||
Interest rate contracts | (2.9 | ) | (0.3 | ) | Interest expense, net | (0.2 | ) | (0.3 | ) | |||||||||
|
|
|
|
|
|
|
| |||||||||||
Total | $ | 29.0 | $ | (15.8 | ) | $ | 25.8 | $ | 25.2 | |||||||||
|
|
|
|
|
|
|
|
The estimated net amount of existing gains (losses) that are reported in Accumulated other comprehensive income (loss) as of March 31, 2024 that is expected to be reclassified into earnings within the next 12 months is $87.5 million.
(d) | Non-designated hedges |
As of March 31, 2024, the Company had the following outstanding derivatives that were not designated as hedging instruments:
Number of Instruments | Notional (in millions) | |||||||||||
Interest Rate Derivatives | ||||||||||||
Interest rate cap | 8 | USD | 3,664.2 |
F-108
Table of Contents
LINEAGE, INC. AND SUBSIDIARIES
Notes to Condensed Consolidated Financial Statements - Unaudited
The table below presents the effect of the Company’s derivative financial instruments that are not designated as hedging instruments on the condensed consolidated statements of operations and comprehensive income (loss) for the three months ended March 31, 2024 and 2023 (in millions).
Derivatives Not Designated as Hedging Instruments | Location of Gain (Loss) Recognized in Earnings on Derivatives | Amount of Gain (Loss) Recognized in Earnings on Derivatives | ||||||||
2024 | 2023 | |||||||||
Interest rate contracts | Interest expense, net | $ | 0.2 | $ | (0.5 | ) |
The table below presents the fair value of the Company’s derivative financial instruments as well as their classification in the condensed consolidated balance sheets as of:
(in millions) | March 31, 2024 | December 31, 2023 | March 31, 2024 | December 31, 2023 | ||||||||||||
Derivatives designated as hedging instruments |
| |||||||||||||||
Balance sheet location | | Other assets | | | Other assets | | | Other liabilities | | | Other liabilities | | ||||
Interest rate contracts | $ | 138.6 | $ | 134.9 | $ | — | $ | — | ||||||||
Foreign exchange contracts | — | — | (0.5 | ) | (0.2 | ) | ||||||||||
|
|
|
|
|
|
|
| |||||||||
Total | $ | 138.6 | $ | 134.9 | $ | (0.5 | ) | $ | (0.2 | ) | ||||||
|
|
|
|
|
|
|
| |||||||||
Derivatives NOT designated as hedging instruments |
| |||||||||||||||
Balance sheet location | | Other assets | | | Other assets | | | Other liabilities | | | Other liabilities | | ||||
Interest rate contracts | $ | 0.8 | $ | 2.6 | $ | — | $ | — | ||||||||
Foreign exchange contracts | 0.6 | 0.3 | (0.6 | ) | (0.3 | ) | ||||||||||
|
|
|
|
|
|
|
| |||||||||
Total | $ | 1.4 | $ | 2.9 | $ | (0.6 | ) | $ | (0.3 | ) | ||||||
|
|
|
|
|
|
|
|
The notional value of the Company’s non-designated foreign currency derivatives is immaterial. Refer to Note 12, Fair value measurements for further information on the valuation of the Company’s derivatives.
(11) | Interest expense |
Interest expense, net consists of the following for the three months ended March 31:
(in millions) | 2024 | 2023 | ||||||
Interest expense | $ | 137.8 | $ | 115.7 | ||||
(Gain) loss on designated and non-designated hedge instruments | (26.0 | ) | (24.9 | ) | ||||
Finance lease liabilities interest | 22.7 | 23.1 | ||||||
Amortization of deferred financing costs | 5.6 | 4.8 | ||||||
Capitalized interest | (1.8 | ) | (3.8 | ) | ||||
Interest income | (0.7 | ) | (1.7 | ) | ||||
Other financing fees | 1.2 | 1.5 | ||||||
|
|
|
| |||||
Interest expense, net | $ | 138.8 | $ | 114.7 | ||||
|
|
|
|
F-109
Table of Contents
LINEAGE, INC. AND SUBSIDIARIES
Notes to Condensed Consolidated Financial Statements - Unaudited
(12) | Fair value measurements |
As of March 31, 2024 and December 31, 2023, the carrying amount of certain financial instruments, including cash and cash equivalents, restricted cash, accounts receivable, accounts payable, and accrued liabilities, were representative of their fair values due to the short-term maturity of these instruments.
The hierarchy for inputs used in measuring fair value is as follows:
Level 1 – Inputs represent unadjusted quoted prices for identical assets or liabilities exchanged in active markets.
Level 2 – Inputs include directly or indirectly observable inputs (other than Level 1 inputs), such as quoted prices for similar assets or liabilities exchanged in active or inactive markets, quoted prices for identical assets or liabilities exchanged in inactive markets, other inputs that may be considered in fair value determinations of these assets or liabilities, such as interest rates and yield curves, volatilities, prepayment speeds, loss severities, credit risks, and default rates, and inputs that are derived principally from or corroborated by observable market data by correlation or other means. Pricing evaluations generally reflect discounted expected future cash flows, which incorporate yield curves for instruments with similar characteristics, such as credit ratings, estimated durations, and yields for other instruments of the issuer or entities in the same industry sector.
Level 3 – Inputs include unobservable inputs used in the measurement of assets and liabilities. Management is required to use its own assumptions regarding unobservable inputs because there is little, if any, market activity in the assets or liabilities and it may be unable to corroborate the related observable inputs. Unobservable inputs require management to make certain projections and assumptions about the information that would be used by market participants in valuing assets or liabilities.
The following table presents the fair value hierarchy levels of the Company’s assets and liabilities measured at fair value:
(in millions) | Fair Value Hierarchy | March 31, 2024 | December 31, 2023 | |||||||||
Measured at fair value on a recurring basis: | ||||||||||||
Interest rate derivative financial instruments assets | Level 2 | $ | 139.4 | $ | 137.5 | |||||||
Foreign exchange forward contracts assets | Level 2 | $ | 0.6 | $ | 0.3 | |||||||
Foreign exchange forward contracts liabilities | Level 2 | $ | 1.1 | $ | 0.5 | |||||||
Acquisition related contingent consideration | Level 3 | $ | 4.7 | $ | 4.8 | |||||||
Measured at fair value on a non-recurring basis: | ||||||||||||
Other investments (included in Other assets)1 | Level 3 | $ | 14.3 | $ | 12.1 | |||||||
Disclosed at fair value: | ||||||||||||
Long-term debt2 | Level 3 | $ | 9,084.8 | $ | 8,767.5 |
The Company is required to measure certain assets and liabilities at estimated fair value from time to time. These fair value measurements typically result from the application of specific accounting pronouncements under GAAP and are considered non-recurring fair value measurements.
1 | The investments in equity securities carried at fair value are subject to transfer restrictions and generally cannot be sold without consent. |
2 | The carrying value of long-term debt is disclosed in Note 9, Debt. |
F-110
Table of Contents
LINEAGE, INC. AND SUBSIDIARIES
Notes to Condensed Consolidated Financial Statements - Unaudited
In accordance with GAAP, the Company has elected to remeasure investments without readily determinable fair values only when an observable transaction occurs for an identical or similar investment of the same issuer. During the three months ended March 31, 2024, the Company recorded non-recurring fair value adjustments related to certain other investments without readily determinable fair values totaling ($0.9) million, which is included within Other nonoperating income (expense), net in the condensed consolidated statements of operations and comprehensive income (loss). No such transactions were observed during the three months ended March 31, 2023.
The Company’s long-term debt is reported at the aggregate principal amount less unamortized deferred financing costs and any above or below market adjustments (as required in purchase accounting) in the accompanying condensed consolidated balance sheets. For instruments with no prepayment option, the fair value is estimated utilizing a discounted cash flow model where the contractual cash flows (i.e., coupon and principal repayments) were discounted at a risk-adjusted yield reflective of both the time value of money and the credit risk inherent in each instrument. For instruments that include a prior-to-maturity prepayment option, the fair value is estimated using a Black-Derman-Toy lattice model. The inputs used to estimate the fair value of the Company’s debt instruments are comprised of Level 2 inputs, including risk-free interest rates, credit ratings, and financial metrics for comparable publicly listed companies, and Level 3 inputs, such as risk-adjusted credit spreads based on adjusted yields implied at issuance, and yield volatility (used for instruments with a prepayment option).
(13) | Leases |
The Company leases real estate, most significantly warehouses for use in operations, as well as equipment for use within owned and leased warehouses. The Company also leases vehicles, trailers and other equipment. The Company has not pledged any assets as collateral related to the Company’s existing leases as of March 31, 2024 and December 31, 2023.
Right-of-use asset balances are as follows:
(in millions) | March 31, 2024 | December 31, 2023 | ||||||
Finance lease right-of-use assets | $ | 1,596.7 | $ | 1,608.2 | ||||
Less: accumulated amortization | (380.1 | ) | (364.9 | ) | ||||
|
|
|
| |||||
Finance lease right-of-use assets, net | $ | 1,216.6 | $ | 1,243.3 | ||||
|
|
|
| |||||
Operating lease right-of-use assets | $ | 890.9 | $ | 891.6 | ||||
Less: accumulated amortization | (181.6 | ) | (167.9 | ) | ||||
|
|
|
| |||||
Operating lease right-of-use assets, net | $ | 709.3 | $ | 723.7 | ||||
|
|
|
|
Lease liabilities are presented in the following line items in the condensed consolidated balance sheets:
March 31, 2024 | December 31, 2023 | |||||||||||||||
(in millions) | Finance Leases | Operating Leases | Finance Leases | Operating Leases | ||||||||||||
Accounts payable and accrued liabilities | $ | 77.6 | $ | 61.8 | $ | 75.9 | $ | 60.3 | ||||||||
Long-term finance lease obligations | 1,283.5 | — | 1,304.5 | — | ||||||||||||
Long-term operating lease obligations | — | 676.5 | — | 692.1 | ||||||||||||
|
|
|
|
|
|
|
| |||||||||
Total lease obligations | $ | 1,361.1 | $ | 738.3 | $ | 1,380.4 | $ | 752.4 | ||||||||
|
|
|
|
|
|
|
|
F-111
Table of Contents
LINEAGE, INC. AND SUBSIDIARIES
Notes to Condensed Consolidated Financial Statements - Unaudited
Maturities of lease liabilities for each of the next five years and thereafter as of March 31, 2024 are as follows (in millions):
Years Ending December 31: | Finance Leases | Operating Leases | ||||||
2024 (nine months remaining) | $ | 118.3 | $ | 75.1 | ||||
2025 | 153.8 | 95.9 | ||||||
2026 | 151.6 | 93.0 | ||||||
2027 | 146.3 | 91.4 | ||||||
2028 | 137.4 | 82.3 | ||||||
2029 and thereafter | 1,671.5 | 766.9 | ||||||
|
|
|
| |||||
Total lease payments | 2,378.9 | 1,204.6 | ||||||
Less imputed interest | (1,017.8 | ) | (466.3 | ) | ||||
|
|
|
| |||||
Total | $ | 1,361.1 | $ | 738.3 | ||||
|
|
|
|
Supplemental condensed consolidated balance sheet information related to leases as of March 31, 2024 and December 31, 2023 is as follows:
2024 | 2023 | |||||||
Weighted average remaining lease term (in years): | ||||||||
Finance | 16.2 | 16.5 | ||||||
Operating | 15.7 | 15.9 | ||||||
Weighted average discount rate: | ||||||||
Finance | 6.9 | % | 6.8 | % | ||||
Operating | 6.5 | % | 6.5 | % |
The components of lease expense are as follows for the three months ended March 31:
(in millions) | 2024 | 2023 | ||||||
Finance lease cost: | ||||||||
Amortization of ROU assets | $ | 24.3 | $ | 23.3 | ||||
Interest on lease liabilities | 22.7 | 23.1 | ||||||
Operating lease cost | 29.3 | 27.8 | ||||||
Variable & short-term lease cost | 9.3 | 5.6 | ||||||
Sublease income | (4.2 | ) | (2.4 | ) | ||||
|
|
|
| |||||
Total lease cost | $ | 81.4 | $ | 77.4 | ||||
|
|
|
|
Supplemental cash flow information related to leases is as follows for the three months ended March 31:
(in millions) | 2024 | 2023 | ||||||
Cash paid for amounts included in the measurement of lease liability | ||||||||
Operating cash flows from finance leases | $ | 22.0 | $ | 22.0 | ||||
Finance cash flows from finance leases | 13.6 | 10.4 | ||||||
Operating cash flows from operating leases | 22.6 | 23.5 | ||||||
ROU assets obtained in exchange for lease obligations (excluding the effect of acquisitions) | ||||||||
Finance leases | $ | 14.6 | $ | 3.5 | ||||
Operating leases | 4.0 | 18.0 |
F-112
Table of Contents
LINEAGE, INC. AND SUBSIDIARIES
Notes to Condensed Consolidated Financial Statements - Unaudited
(14) | Stock-based compensation |
(a) | BGLH Restricted Class B units |
Certain members of management and certain non-employee directors were granted interests in BGLH in the form of restricted Class B Units (“BGLH Restricted Units”). The Company fair values these BGLH Restricted Units as of the grant date based on the price of substantially similar units issued to third-party investors in arms’ length transactions in connection with other BGLH capital raising activities. The Company recognizes stock-based compensation expense over the vesting term. The Company accounts for these units as equity-based awards.
Stock-based compensation expense related to BGLH Restricted Units for the three months ended March 31, 2024 and 2023 was $2.9 million and $2.5 million, respectively. As of March 31, 2024, there was $8.3 million of unrecognized noncash compensation cost related to unvested BGLH Restricted Units that is expected to be recognized over a weighted-average period of less than one year.
The following represents a summary of these units:
Units | Weighted average grant date fair value per unit | |||||||
Unvested as of December 31, 2023 | 151,200 | $ | 89.29 | |||||
|
|
|
| |||||
Awards granted in 2024 | 31,088 | 96.50 | ||||||
|
|
|
| |||||
Unvested as of March 31, 2024 | 182,288 | $ | 90.52 | |||||
|
|
|
|
(b) | Management Profits Interests Class C units |
LLH MGMT and LLH MGMT II interests were issued to members of management in the form of Management Profits Interests Class C units. These profits interests generally vest over a three to five year time period, with the number of units vested based partially on meeting certain financial targets of the Company or individual performance metrics.
Stock-based compensation related to Management Profits Interests Class C units for each of the three months ended March 31, 2024 and 2023 was $1.6 million and $1.8 million, respectively. As of March 31, 2024, there was $11.5 million of unrecognized noncash compensation cost related to unvested Class C units to be recognized over a weighted-average period of less than one year.
The following represents a summary of these units:
Units | Weighted average grant date fair value per unit | |||||||
Unvested as of December 31, 2023 | 6,695,123 | $ | 2.31 | |||||
|
|
|
| |||||
Awards granted in 2024 | 1,487,235 | 2.93 | ||||||
Awards vested in 2024 | 852,581 | 2.10 | ||||||
|
|
|
| |||||
Unvested as of March 31, 2024 | 7,329,777 | $ | 2.46 | |||||
|
|
|
|
(c) | LLH Value Creation Unit Plan units |
Certain employees have been granted notional units under the LLH Value Creation Unit Plan (the “2015 LVCP”) in the form of appreciation rights that vest over a period of four years and upon the
F-113
Table of Contents
LINEAGE, INC. AND SUBSIDIARIES
Notes to Condensed Consolidated Financial Statements - Unaudited
occurrence of a liquidity event. This plan covered awards from 2015 to 2020. A new LLH Value Creation Unit Plan was established in 2021 (the “2021 LVCP”) that generally provides for the grant of similar appreciation rights that may also vest without the occurrence of a liquidity event if the Company achieves the target value as specified in the award agreements.
Upon full vesting, the awards under both the 2015 LVCP and 2021 LVCP entitle the recipient to a payment equal to the excess of the price of the Company’s shares at the time of full vesting, over the benchmark amount specified by the award agreement. In accordance with GAAP, until the full vesting conditions are probable of occurring, no expense is recognized for the awards. The Company believes the vesting requirement for all awards under both the 2015 LVCP and 2021 LVCP are not probable. As of March 31, 2024 and December 31, 2023, the cumulative unrecognized stock compensation expense related to the units issued pursuant to the 2015 LVCP and 2021 LVCP was $36.4 million and $37.0 million, respectively.
(15) | Related-party balances |
The Company pays Bay Grove Management an operating services fee and reimburses certain expenses pursuant to an operating services agreement between Bay Grove Management and the Company. During the three months ended March 31, 2024 and 2023, the Company recorded $3.2 million and $2.6 million of expenses in General and administrative expense for these operating services, respectively. As of March 31, 2024 and December 31, 2023, $2.6 million in operating services fees were owed to Bay Grove Management and included in Accounts payable and accrued liabilities in the accompanying condensed consolidated balance sheets.
At March 31, 2024 and December 31, 2023, the Company accrued distributions payable in the amount of $11.4 million and $109.9 million, respectively. Distributions payable as of March 31, 2024 were payable by the Operating Partnership to BG Cold in connection with Founders Equity Share, as further described in Note 2, Capital structure and noncontrolling interests. As of December 31, 2023, distributions payable consisted of $88.5 million payable by Lineage, Inc. to BGLH, $10.0 million payable by the Operating Partnership to Non-Company LPs, and $11.4 million payable by the Operating Partnership to BG Cold in connection with Founders Equity Share.
The Company owns an investment stake in suppliers that are accounted for under the equity method of accounting, creating related-party relationships. The Company paid $1.6 million and $3.5 million to these suppliers for the three months ended March 31, 2024 and 2023, respectively. Accounts payable and accrued liabilities includes less than $1.0 million owed to these suppliers as of March 31, 2024 and $1.8 million owed to these suppliers as of December 31, 2023.
As of December 31, 2023, the Company had receivables due from employees of $1.0 million, which were subsequently collected in February 2024. At March 31, 2024 and December 31, 2023, the Company had additional related-party receivables, primarily with minority interest partners and equity method investees, of $6.0 million and $6.3 million, respectively. Related-party receivables are included in Accounts receivable, net in the accompanying condensed consolidated balance sheets. At March 31, 2024 and December 31, 2023, the Company had additional related-party payables, primarily with minority interest partners, of $2.0 million and $2.4 million, respectively. Related-party payables are included in Accounts payable and accrued liabilities in the accompanying condensed consolidated balance sheets.
The Operating Partnership has issued notes to certain individual BGLH investors and Non-Company LPs in order to fund certain investor transactions. As of March 31, 2024 and December 31, 2023, these notes totaled $10.8 million and $15.9 million, respectively. These notes receivable are included in Accounts receivable, net and Other assets in the accompanying condensed consolidated balance sheets.
F-114
Table of Contents
LINEAGE, INC. AND SUBSIDIARIES
Notes to Condensed Consolidated Financial Statements - Unaudited
(16) | Commitments and contingencies |
(a) | Self-insured risks |
The Company is self-insured for workers’ compensation costs, with the Company’s workers’ compensation plan having an individual claim stop-loss deductible of $1.0 million. Self-insurance liabilities are determined by third-party actuaries. The Company has established restricted cash accounts with banks or directly with the insurers or letters of credit that are collateral for its self-insured workers’ compensation obligations. The combined amount included in Accounts payable and accrued liabilities and Other long-term liabilities relating to workers’ compensation liabilities as of March 31, 2024 and December 31, 2023 was $42.2 million and $40.0 million. The liability as of March 31, 2024 and December 31, 2023 represents the gross amount excluding amounts receivable from the insurers. The total included in Prepaid expenses and other current assets and Other assets related to the receivables from insurers as of March 31, 2024 and December 31, 2023 was $11.6 million and $10.9 million, respectively.
The Company is also self-insured for a portion of employee medical costs. The Company has a medical plan with a retained deductible. Medical self-insurance liabilities are determined by third-party actuaries. The total included in Accounts payable and accrued liabilities relating to medical liabilities as of March 31, 2024 and December 31, 2023 was $17.7 million and $14.7 million, respectively.
(b) | Legal and regulatory proceedings |
The Company, from time to time and in the normal course of business, is party to various claims, lawsuits, arbitrations, and regulatory actions (collectively, “Claims”). In particular, as the result of numerous ongoing construction activities, the Company may be a party to construction and/or contractor related liens and claims, including mechanic’s and materialmen’s liens. The Company is also party to various Claims relating to commercial disagreements with customers or suppliers. Additionally, given the Company’s substantial workforce, and, in particular, its warehouse related workforce, the Company is party to various labor and employment related Claims, including, without limitation, Claims related to workers’ compensation, wage and hour, discrimination, and related matters. Finally, given the Company’s business of warehousing refrigerated food products and its utilization of anhydrous ammonia for its refrigeration systems (a known hazardous material), the Company is subject to the jurisdiction of various U.S. regulatory agencies, including, without limitation, the Department of Agriculture, Food and Drug Administration, Environmental Protection Agency (“EPA”), Department of Justice, Occupational Safety and Health Administration, and various other agencies in the locations in which the Company operates. Management of the Company believes the ultimate resolution of these matters will not have a material adverse effect on the condensed consolidated financial statements.
(c) | Environmental matters |
The Company is subject to a wide range of environmental laws and regulations in each of the locations in which the Company operates. Compliance with these requirements can involve significant capital and operating costs. Failure to comply with these requirements can result in civil or criminal fines or sanctions, claims for environmental damages, remediation obligations, the revocation of environmental permits, or restrictions on the Company’s operations.
The Company records accruals for environmental matters when it is probable that a liability has been incurred and the amount of the liability can be reasonably estimated based on current law and existing
F-115
Table of Contents
LINEAGE, INC. AND SUBSIDIARIES
Notes to Condensed Consolidated Financial Statements - Unaudited
technologies. The Company adjusts these accruals periodically as assessment and remediation efforts progress or as additional technical or legal information become available. The Company has recorded nominal environmental liabilities in Accounts payable and accrued liabilities as of March 31, 2024 and December 31, 2023. The Company believes it is in compliance with applicable environmental regulations in all material respects. Under various U.S. federal, state, and local environmental laws, a current or previous owner or operator of real estate may be liable for the entire cost of investigating, removing, and/or remediating hazardous or toxic substances on such property. Such laws often impose liability, whether or not the owner or operator knew of, or was responsible for, the contamination. Even if more than one person may have been responsible for the contamination, each person covered by the environmental laws may be held responsible for the entire clean-up cost. There are no material unrecorded liabilities as of the periods ended March 31, 2024 and December 31, 2023. Most of the Company’s warehouses utilize anhydrous ammonia as a refrigerant. Anhydrous ammonia is classified as a hazardous chemical regulated by the EPA and various other agencies in the locations in which the Company operates, and an accident or significant release of anhydrous ammonia from a warehouse could result in injuries, loss of life, and property damage.
(d) | Occupational Safety and Health Act (OSHA) |
The Company’s warehouses located in the U.S. are subject to regulation under OSHA, which requires employers to provide employees with an environment free from hazards, such as exposure to toxic chemicals, excessive noise levels, mechanical dangers, heat or cold stress, and unsanitary conditions. The cost of complying with OSHA and similar laws enacted by states and other jurisdictions in which the Company operates can be substantial, and any failure to comply with these regulations could expose the Company to substantial penalties and/or liabilities to employees who may be injured at the Company’s warehouses. The Company records accruals for OSHA matters when it is probable that a liability has been incurred and the amount of the liability can be reasonably estimated. The Company believes that it is in compliance with all OSHA regulations in all material respects and that no material unrecorded liabilities exist as of March 31, 2024 and December 31, 2023.
(e) | Statesville, North Carolina |
On January 10, 2020, contractors and subcontractors were working on the blast cells at the Company’s freezer warehouse in Statesville, North Carolina when an incident occurred triggering the release of anhydrous ammonia at the facility, resulting in the death of a subcontractor and injury to another subcontractor, as well as damage to customers’ goods. Litigation is ongoing with respect to this incident, and while the Company believes it has a strong defense to any potential claims, the Company could be subject to losses in unknown amounts. The Company believes the ultimate outcome of this matter will not have a material adverse impact on its condensed consolidated financial statements. No material costs have been incurred in relation to this matter.
F-116
Table of Contents
LINEAGE, INC. AND SUBSIDIARIES
Notes to Condensed Consolidated Financial Statements - Unaudited
(17) | Accumulated other comprehensive income (loss) |
The Company reports activity in Accumulated other comprehensive income (loss) (“AOCI”) for foreign currency translation adjustments and unrealized gains and losses on interest rate and foreign currency hedges. Activity within AOCI is as follows for the three months ended March 31:
(in millions) | 2024 | 2023 | ||||||
Foreign currency translation adjustments: | ||||||||
Balance at beginning of period | $ | (149.1 | ) | $ | (227.7 | ) | ||
Foreign currency translation adjustments | (74.0 | ) | 30.2 | |||||
Amounts allocated to Noncontrolling interests and Redeemable noncontrolling interests | 8.4 | (3.3 | ) | |||||
Reallocation due to change in Noncontrolling interest ownership percentage | 4.7 | 4.2 | ||||||
|
|
|
| |||||
Balance at end of period | $ | (210.0 | ) | $ | (196.6 | ) | ||
|
|
|
| |||||
Derivatives: | ||||||||
Balance at beginning of period | $ | 115.3 | $ | 190.3 | ||||
Unrealized gain (loss) on foreign currency hedges | 29.0 | (15.8 | ) | |||||
Net amount reclassified from AOCI to net income (loss) | (25.8 | ) | (25.2 | ) | ||||
Tax effect | 0.1 | 2.0 | ||||||
Amounts allocated to Noncontrolling interests and Redeemable noncontrolling interests | (0.4 | ) | 4.3 | |||||
Reallocation due to change in Noncontrolling interest ownership percentage | (5.0 | ) | (2.2 | ) | ||||
|
|
|
| |||||
Balance at end of period | $ | 113.2 | $ | 153.4 | ||||
|
|
|
| |||||
|
|
|
| |||||
Accumulated other comprehensive income (loss) | $ | (96.8 | ) | $ | (43.2 | ) | ||
|
|
|
|
(18) | Earnings (loss) per share |
Basic earnings (loss) per share (“EPS”) is calculated by dividing net income (loss) attributable to common stockholders of Lineage, Inc. by the weighted average common shares outstanding during the reporting period. Diluted EPS is calculated by dividing net income (loss) attributable to common stockholders of Lineage, Inc. by the weighted average common shares and common share equivalents outstanding during the reporting period. A reconciliation of the basic and diluted EPS for the three months ended March 31:
2024 | 2023 | |||||||
Numerator for basic and diluted earnings per share (in millions): | ||||||||
Net income (loss) attributable to Lineage, Inc. | $ | (39.7 | ) | $ | 17.7 | |||
Less: Accretion of redeemable noncontrolling interests | 4.8 | 8.0 | ||||||
Less: Redeemable noncontrolling interest adjustment | 0.4 | 3.6 | ||||||
|
|
|
| |||||
Net income (loss) attributable to common stockholders - basic and diluted | $ | (44.9 | ) | $ | 6.1 |
F-117
Table of Contents
LINEAGE, INC. AND SUBSIDIARIES
Notes to Condensed Consolidated Financial Statements - Unaudited
2024 | 2023 | |||||||
Denominator (in millions): | ||||||||
Denominator for basic earnings per share - weighted average shares | 161.9 | 161.6 | ||||||
Effect of dilutive securities: | ||||||||
True-up option held by sellers of MTC Logistics | — | 0.1 | ||||||
Preference Share conversion right | — | 2.2 | ||||||
Unvested BGLH Restricted Units | — | 0.1 | ||||||
|
|
|
| |||||
Denominator for diluted earnings per share - adjusted weighted average shares | 161.9 | 164.0 | ||||||
|
|
|
| |||||
Basic earnings (loss) per share | $ | (0.28 | ) | $ | 0.04 | |||
|
|
|
| |||||
Diluted earnings (loss) per share | $ | (0.28 | ) | $ | 0.04 | |||
|
|
|
|
The Company’s potential dilutive securities have been excluded from the computation of diluted net earnings (loss) per share for the three months ended March 31, 2024, as they are antidilutive and the effect would be to increase the net earnings (or decrease the net loss) per share. Therefore, the weighted average number of common shares outstanding used to calculate both basic and diluted net earnings (loss) per share attributable to common stockholders is the same.
For the three months ended March 31, 2023, because there was net income attributable to common stockholders, certain of the potential dilutive securities were determined to be dilutive, as indicated in the reconciliation above.
The Company’s potential common share equivalents as of March 31, 2024 and 2023 are as follows:
• | As of March 1, 2025 the sellers of MTC Logistics may elect to receive any combination of cash or Operating Partnership units that equal the excess of $34.2 million over the fair market value of the units issued to the sellers in the MTC Logistics acquisition. The Operating Partnership Units that could be issued in connection with this hypothetical election represent potential common share equivalents. |
• | The holder of the Preference Shares issued by a subsidiary of LLH in connection with the Kloosterboer acquisition has conversion rights to convert the Preference Shares to Operating Partnership units or common stock of Lineage, Inc., depending on whether or not certain events have occurred. The Operating Partnership units or common stock of Lineage, Inc. that could be issued in connection with a hypothetical conversion represent potential common share equivalents. |
• | As described in Note 14, Stock-based compensation, certain members of management and certain non-employees have been granted BGLH Restricted Units. BGLH Restricted Units that are unvested as of March 31, 2024 and 2023 represent potential common share equivalents because upon vesting, Lineage, Inc. will have outstanding common shares issued to BGLH. |
• | As described in Note 14, Stock-based compensation, certain members of management have been granted Management Profits Interests Class C units in LLH MGMT and LLH MGMT II. These Class C Units in LLH MGMT and LLH MGMT II that are unvested as of March 31, 2024 and 2023 represent potential common share equivalents because upon vesting, they will be able to share in the profits of the Company, as defined in the LLH MGMT and LLH MGMT II operating agreements. Because the Class C Units do not yet share in distributions, the potential units would not be allocated any undistributed earnings for basic and diluted EPS calculations. |
F-118
Table of Contents
LINEAGE, INC. AND SUBSIDIARIES
Notes to Condensed Consolidated Financial Statements - Unaudited
(19) | Segment information |
Reportable | Segments Information |
The Company’s business is organized into two reportable segments, Global Warehousing and Global Integrated Solutions. The following table presents segment revenues and segment net operating income (NOI), with a reconciliation to Net income (loss) before income taxes for the three months ended March 31, 2024 and 2023. All inter-segment transactions are not significant and have been eliminated in consolidation. Asset information by reportable segment is not presented, as the Company does not produce such information internally and the CODM does not use such information to manage the business. Capital expenditures for property, plant, and equipment presented below by segment are inclusive of purchases recorded in Accounts payable and accrued liabilities as of March 31, 2024 and 2023.
(in millions) | 2024 | 2023 | ||||||
Global Warehousing revenues | $ | 968.6 | $ | 957.6 | ||||
Global Integrated Solutions revenues | 359.4 | 375.7 | ||||||
|
|
|
| |||||
Total net revenues | $ | 1,328.0 | $ | 1,333.3 | ||||
|
|
|
| |||||
Global Warehousing cost of operations | $ | 584.1 | $ | 572.4 | ||||
Global Integrated Solutions cost of operations | 299.7 | 317.8 | ||||||
|
|
|
| |||||
Total cost of operations | $ | 883.8 | $ | 890.2 | ||||
|
|
|
| |||||
Global Warehousing NOI | $ | 384.5 | $ | 385.2 | ||||
Global Integrated Solutions NOI | $ | 59.7 | $ | 57.9 | ||||
|
|
|
| |||||
Total NOI | $ | 444.2 | $ | 443.1 | ||||
|
|
|
| |||||
Reconciling items: | ||||||||
General and administrative expense | (124.1 | ) | (114.9 | ) | ||||
Depreciation expense | (157.7 | ) | (129.5 | ) | ||||
Amortization expense | (53.4 | ) | (51.7 | ) | ||||
Acquisition, transaction, and other expense | (8.6 | ) | (10.8 | ) | ||||
Restructuring, impairment, and gain (loss) on disposals | 0.4 | (4.2 | ) | |||||
Equity income (loss), net of tax | (1.8 | ) | 0.2 | |||||
Gain (loss) on foreign currency transactions, net | (10.7 | ) | (1.3 | ) | ||||
Interest expense, net | (138.8 | ) | (114.7 | ) | ||||
Gain (loss) on extinguishment of debt | (6.5 | ) | — | |||||
Other nonoperating income (expense), net | (0.7 | ) | (0.2 | ) | ||||
|
|
|
| |||||
Net income (loss) before income taxes | $ | (57.7 | ) | $ | 16.0 | |||
|
|
|
| |||||
Capital expenditures for property, plant, and equipment: | ||||||||
Global Warehousing capital expenditures | $ | 84.6 | $ | 146.1 | ||||
Global Integrated Solutions capital expenditures | 7.0 | 23.7 | ||||||
Corporate capital expenditures | 25.2 | 26.5 | ||||||
|
|
|
| |||||
Total capital expenditures for property, plant, and equipment | $ | 116.8 | $ | 196.3 | ||||
|
|
|
|
F-119
Table of Contents
LINEAGE, INC. AND SUBSIDIARIES
Notes to Condensed Consolidated Financial Statements - Unaudited
(20) | Subsequent events |
The Company evaluated subsequent events through May 7, 2024, the date the condensed consolidated financial statements were available to be issued. The following are subsequent events or transactions that required recognition or disclosure:
On April 9, 2024, the Company borrowed $2,400.0 million available under the DDTL and used the proceeds to pay off the CMBS 4 loan and partially pay down the RCF. Refer to Note 9, Debt for details.
On April 21, 2024, a fire occurred at the Company’s warehouse in Kennewick, Washington. No employees or other parties were injured. The Company is assessing the financial impact and evaluating damages caused to the property, plant, and equipment and any customer inventories.
On April 24, 2024, the Board adopted the Lineage 2024 Incentive Award Plan (“Incentive Award Plan”), with the approval of BGLH. The maximum number of shares of common stock which can be issued under the Incentive Award Plan is 1,000,000. The Incentive Award Plan is administered by the Board and provides for the award of stock options, restricted stock awards, dividend equivalent awards, stock payment awards, restricted stock unit awards (“RSUs”), performance share awards, LTIP unit awards, stock appreciation rights, and other incentive awards, each as defined in the Incentive Award Plan, to eligible employees, consultants, and members of the Board. Concurrently with the adoption of the Incentive Award Plan, the Board also approved grants of 32,202 RSUs to certain members of management. The Company will recognize stock-based compensation expense for these RSUs over their vesting terms.
F-120
Table of Contents
LINEAGE, INC. AND SUBSIDIARIES
Unaudited Pro Forma Condensed Consolidated Financial Statements
As used in these unaudited pro forma condensed consolidated financial statements, unless the context otherwise requires, “we,” “us,” and “our company” mean Lineage, Inc. and its consolidated subsidiaries upon consummation of this offering and the formation transactions, in each case, as described below. Upon completion of this offering and the formation transactions, we will hold substantially all of our assets, and will conduct substantially all of our operations, through our operating partnership, Lineage OP, LP. Lineage, Inc. will be the sole general partner of our operating partnership. As used in these unaudited pro forma condensed consolidated financial statements, “our operating partnership” means, prior to its conversion to a Maryland limited partnership in connection with the formation transactions, Lineage OP, LLC, or Lineage OP, a Delaware limited liability company, and after such conversion, Lineage OP, LP, a Maryland limited partnership, through which we will hold substantially all of our assets and conduct our operations.
Offering Transactions
We will sell 47.0 million shares of our common stock in this offering and an additional 7.1 million shares of our common stock if the underwriters exercise their option to purchase additional shares of our common stock in full. We estimate that the net proceeds to us from this offering will be approximately $3,402.0 million, or $3,917.7 million if the underwriters exercise in full their option to purchase additional shares, after deducting underwriting discounts and other estimated expenses, in each case, based on the initial public offering price of $76.00 per share. These unaudited pro forma financial statements assume no exercise by the underwriters of their option to purchase additional shares.
We will contribute the net proceeds from this offering to our operating partnership and receive 47.0 million OP units (or 54.1 million OP units if the underwriters exercise their option to purchase up to an additional shares of our common stock in full), resulting in a 90.4% ownership interest in the operating partnership (90.7% if the underwriters exercise their option to purchase up to an additional shares of our common stock in full), with holders of Legacy OP Units and Lineage management holding 8.7% and 0.9% ownership interests in the operating partnership, respectively (8.4% and 0.9% if the underwriters exercise their option to purchase up to an additional shares of our common stock in full).
We expect our operating partnership to use the net proceeds received from us to repay the delayed-draw term loan (“DDTL”) with an aggregate principal balance of $2.4 billion at the time of this offering. The DDTL proceeds were utilized to repay our ICE4 CMBS loan on April 9, 2024, prior to maturity in May 2024, and to repay a portion of the Revolving Credit Facility. The DDTL permits prepayments of principal, in whole or in part, at any time, without premium or penalty. The DDTL bears interest at an annual floating rate of term SOFR plus 0.10% (“Adjusted SOFR”) plus a spread of between 1.60% and 2.20% based on our total leverage ratio. Based on our existing total leverage ratio, the interest rate expected to be in effect for our DDTL borrowing is Adjusted Term SOFR plus 1.60%. In addition, the DDTL is subject to a commitment fee of 0.20% on the average daily unused amount of the commitment. Our ICE4 CMBS loan bore interest at an annual floating rate of term SOFR plus a margin of 1.66%.
Formation Transactions
Prior to, or simultaneously with the completion of, this offering, we will engage in formation transactions, which are designed to facilitate this offering. Through the formation transactions, the following have occurred or will occur prior to or concurrently with the completion of this offering.
F-121
Table of Contents
Operating Partnership Conversion and Reclassification of Units
Lineage OP, LLC will convert from a Delaware limited liability company to a Maryland limited partnership, change its name to Lineage OP, LP and adopt the Agreement of Limited Partnership pursuant to which, among other things:
• | We will become Lineage OP, LP’s sole general partner. |
• | All operating partnership units that are owned by our company—all of which are currently classified as Lineage OP Class A units—will be reclassified into OP units. |
• | All operating partnership units that are not owned by our company—all of which are comprised of Lineage OP Class A units, Lineage OP Class B units or Lineage OP Class C units—will be reclassified into Legacy OP Units with various subclasses, each of which will retain certain terms that differ from OP units in order to continue pre-existing rights of Lineage OP, LLC’s members for a period of up to three years following the initial closing of this offering. See “Structure and Formation of Our Company—Formation Transactions” for additional information. The Legacy OP Units are classified as a noncontrolling interest on the unaudited pro forma condensed consolidated financial statements, which is consistent with our historical financial statement presentation prior to the reclassification of these units. Therefore, the unaudited pro forma condensed consolidated financial statements do not include adjustments for the Legacy OP Unit reclassifications. |
Incentive Equity
Prior to this offering, certain of our current and former officers and employees hold interests intended to constitute “profits interests” for U.S. federal income tax purposes (“LMEP Units”) that represent historic accrued management incentive equity interests through two incentive equity pooling entities, LLH MGMT Profits, LLC and LLH MGMT Profits II, LLC, which each hold corresponding historic accrued management incentive equity interests in Lineage Holdings for the benefit of these officers and employees. As part of the formation transactions, we will have purchased in exchange for 0.1 million shares of our common stock the vested awards of LMEP Units valued at less than $3.0 million per individual that are held by certain of our officers and employees who are not named executive officers. After such purchase, each of LLH MGMT Profits, LLC and LLH MGMT Profits II, LLC will contribute its vested management incentive equity interests in Lineage Holdings to our operating partnership in exchange for 2.2 million Legacy Class B OP Units. This results in the vested LMEP Units not purchased by us becoming a fixed number of Legacy Class B OP Units prior to such time as the LMEP Units would otherwise be paid pursuant to their rights under the terms of the existing awards. Following the contribution, each of LLH MGMT Profits, LLC and LLH MGMT Profits II, LLC will distribute the Legacy Class B OP Units to its members, including certain of our officers and employees whose LMEP Units are not purchased in exchange for shares of our common stock, in complete liquidation of each such entity. Following such distribution, officers, employees and others to whom Legacy Class B OP Units are distributed will generally continue to hold such Legacy Class B OP Units subject to settlement over a period of up to three years as part of the same settlement process that applies to all of our legacy investor equity. The Legacy Class B OP Units are classified as a noncontrolling interest, a component of total equity, on the unaudited pro forma condensed consolidated financial statements, which is consistent with our historical financial statement presentation of the LMEP Units prior to the reclassification of these units through the formation transactions. As the exchange of the LMEP Units for Legacy Class B OP units did not result in a change in the fair value, vesting conditions or the classification of the awards, the unaudited pro forma condensed consolidated financial statements do not include adjustments for the LMEP Units reclassifications.
All outstanding LMEP Units that remain unvested as of the date of the contribution and distribution described above will terminate automatically at such time and we intend to issue replacement awards under the 2024 Plan outlined below. The replacement awards are expected to have a grant date fair value equal to the higher of the then intrinsic value of the unvested LMEP Units or the target value of the original profits interest attributable to unvested awards. The pro forma condensed consolidated financial statements include adjustments to reflect incremental equity-based compensation expense attributable to the excess of the grant date fair value of the replacement awards
F-122
Table of Contents
over the then-current fair value of the terminated LMEP Units, which shall be recognized ratably over the vesting period of the replacement awards.
We intend to adopt the 2024 Plan, under which we will grant cash and equity-based incentive awards to eligible service providers in order to attract, motivate and retain the talent for which we compete. The 2024 Plan provides that the maximum number of shares that may be issued pursuant to awards granted to our directors, executive officers and employees thereunder is equal to the sum of (i) 12.5 million shares and (ii) an annual increase on the first day of each calendar year beginning on and including January 1, 2025 and ending on and including January 1, 2034 equal to (A) a number of shares equal to 1% of the sum of (I) the aggregate number of shares of our common stock outstanding on the final day of the immediately preceding calendar year, plus (II) the aggregate number of OP units (other than OP units that are held by the company and other than any OP units resulting from the conversion of LTIP units) outstanding on the final day of the immediately preceding calendar year, plus (III) the aggregate number of OPEUs outstanding on the final day of the immediately preceding calendar year, plus (IV) the aggregate number of Legacy OP Units outstanding on the final day of the immediately preceding calendar year or (B) such smaller number of shares as is determined by the Board. Prior to the completion of this offering, we expect to amend the 2024 Plan, including with respect to the number of shares authorized for issuance pursuant to awards under the plan. In addition, our board of directors or compensation committee is expected to approve awards of our common stock or LTIP units of our operating partnership to be granted to our directors, executive officers, and employees under the 2024 Plan upon completion of this offering. The awards will vest based on the applicable recipient’s continued service through the vesting dates and/or the satisfaction of specified performance vesting conditions. In addition to these awards under the 2024 Plan, our compensation committee is expected to approve $70.9 million in cash bonuses to be paid upon the completion of this offering. The majority of these bonuses will not have vesting requirements and will be paid as soon as administratively feasible after the completion of this offering, while the remainder will vest based on the applicable recipient’s continued service through the vesting date. For bonuses that are settled in immediately vested shares of our common stock, we have assumed that we will immediately repurchase 35% of such shares to cover the recipients’ expected tax liabilities, treating such shares as authorized but unissued.
Internalization of Bay Grove Services
We are internalizing certain operating, consulting, strategic development and financial services that have historically been provided by Bay Grove. In connection with this internalization, we will terminate the operating services agreement between our subsidiary Lineage Holdings and Bay Grove, and we will terminate all rights of Bay Grove to accrue additional future profits interests at Lineage Holdings (the “equity accrual right”). In exchange for these terminations, Bay Grove will receive a one-time increase in its profit share attributable to the existing profits interest it holds in Lineage Holdings equal to $200.0 million, approximately $14.0 million of which will instead be allocated to Lineage OP in settlement of prior distribution advances made to Bay Grove, its owners and their affiliates (with such amount becoming part of Lineage OP’s equity holdings in Lineage Holdings, and such amount also restoring other distribution rights of Bay Grove, its owners and their affiliates through Lineage OP and BGLH in the same amount) and the remaining approximately $186.0 million of which will be reclassified into 2.4 million OPEUs held by Bay Grove. The value of the consideration received by Bay Grove in exchange for the termination of the operating services agreement and the equity accrual right will be recognized as acquisition, transaction, and other expense when incurred and has been included as an adjustment in the unaudited pro forma condensed consolidated statement of operations and comprehensive income (loss). In connection with such one-time net increase in Bay Grove’s profits interest, there will be a corresponding reduction to the interests in BGLH held by Bay Grove’s owners and their affiliates to effect a true-up for a portion of this increase (the “Internalization True-up”), the effect of which is that Bay Grove’s net increase in equity (taking into account both its direct interests in Lineage Holdings and the reduction in interests held by Bay Grove’s owners and their affiliates in BGLH) is $133.4 million rather than $200.0 million. As the Internalization True-up occurs at BGLH and not Lineage, the unaudited pro forma condensed consolidated financial statements do not include an adjustment for the Internalization True-up.
Following the one-time net increase in Bay Grove’s profits interest and corresponding reclassification into a fixed number of OPEUs described immediately above, Lineage Holdings will repurchase 1.0 million OPEUs
F-123
Table of Contents
held by Bay Grove for cash in the amount of $75.0 million. The $75.0 million was settled prior to this offering based on borrowings under the Revolving Credit Facility. Once the number of OPEUs has been fixed, the OPEUs will be exchangeable in the future (after a two-year initial holding period) on a one-for-one basis with OP units, subject to certain adjustments, and no additional OPEUs will be created in respect of any equity accrual right. OP units issued in exchange for such OPEUs will not be redeemable until after the settlement of all legacy BGLH equity and all Legacy OP Units.
We will enter into a transition services agreement with an affiliate of Bay Grove, pursuant to which Bay Grove will provide us with certain transition services supporting capital deployment and mergers and acquisitions activity for three years following the initial closing of this offering to help us build our full internal capability during that period. We will pay Bay Grove an annual fee equal to $8.0 million, or $24.0 million in the aggregate for the three-year period, which fee is payable in advance in equal quarterly installments.
Class D Units
Prior to this offering, BG Maverick, an affiliate of Bay Grove, holds all outstanding Class D units in Lineage Holdings representing non-voting profits interests whereby BG Maverick is entitled to receive a formulaic annual amount of income and profits payable only upon the occurrence of a liquidity event. As the Class D units in Lineage Holdings held by BG Maverick do not have the substantive risks and rewards of equity ownership, the Class D units do not represent a substantive class of equity in Lineage Holdings. As payment of the income and profits attributable to Class D units in Lineage Holdings is contingent upon the occurrence of a liquidity event, no compensation expense is recognized prior to this offering. Accordingly, we have not recorded a liability in the historical consolidated balance sheet for the Class D units in Lineage Holdings. The Class D units in Lineage Holdings vested in connection with this offering and were reclassified into a fixed number of OPEUs held by Bay Grove in connection with the Internalization transactions described above. Accordingly, the unaudited pro forma condensed consolidated financial statements include an adjustment to recognize compensation expense and an increase in noncontrolling interests associated with the OPEUs received by Bay Grove.
We will amend the operating agreement of Lineage Holdings to reflect the resulting ownership of Lineage Holdings by Lineage OP and Bay Grove after giving effect to these transactions.
Series A Preferred Stock
We will redeem our outstanding 12.0% Series A Cumulative Non-Voting Preferred Stock, $0.01 par value per share (the “Series A preferred stock”) for $0.6 million in cash plus any accrued but unpaid dividends.
Rollover Holder Put Option
Rollover equity in the form of BGLH units or Lineage OP units was previously issued to various sellers of assets we acquired as part of the purchase price consideration. Some of those sellers who received rollover equity in BGLH or Lineage OP were provided with separate classes of equity of BGLH or Lineage OP that in some cases included special one-time redemption features with minimum value guarantees and/or the alternative option to elect cash or equity top-up rights to achieve a certain minimum equity valuation at a specific date (collectively, the “Guarantee Rights”). The obligations in respect of the Guarantee Rights have resided with BGLH and its subsidiaries, where BGLH units were issued (the “BGLH Guarantee Rights”), and with Lineage OP and its subsidiaries, where Lineage OP units were issued.
To ensure that the financial obligations associated with all Guarantee Rights proportionately impact investors at Lineage, our operating partnership and Lineage Holdings, as was contemplated at the time of the rollover transaction, each of those entities has agreed to provide successive special repurchase rights and cash
F-124
Table of Contents
and equity top-up rights to such legacy investors that mirror those given by BGLH to its investors (the “Rollover Holder Put Option”) and those given by Lineage OP to its investors, in each case in connection with the Guarantee Rights (the “Lineage OP Put Option”).
• | Pursuant to the Rollover Holder Put Option, BGLH has the right to (i) distribute (in various installments from September 2024 through December 2025 (the “Rollover Holder Put Exercise Window”)) up to 2.0 million shares of our common stock to its investors holding BGLH Guarantee Rights, and such investors have the individual right to cause Lineage to purchase any or all of such shares of our common stock distributed to such persons by BGLH for an amount equal to the guaranteed minimum value intrinsic to the BGLH Guarantee Rights (at a guaranteed minimum price or, in some cases, if greater, the then-current fair market value of the shares of our common stock), which amounts differ for different such investors, or (ii) in some cases demand a top-up, through a cash payment or through the issuance of additional shares of our common stock without payment therefor, or any combination thereof, in the amount by which the guaranteed minimum value exceeds the then-current fair market value of the shares of our common stock (if at all) at various specified times during the Rollover Holder Put Exercise Window. |
• | Pursuant to the Lineage OP Put Option, during the Rollover Holder Put Exercise Window: (i) our operating partnership has similar rights to cause us to purchase up to 0.3 million Legacy Class A-4 OP units for (A) $34.0 million (less certain distributions received after June 26, 2024) if our share price is less than $100.86, (B) an amount that ranges from $34.0 million to $36.1 million (less certain distributions received after June 26, 2024) if our share price is between $100.86 to $113.25, or, (C) if our share price is $113.25 or higher, the product of such share price (less certain distributions received after June 26, 2024) and the number of Legacy Class A-4 OP units sold back to us; and (ii) our operating partnership has similar cash or equity top-up rights if the guaranteed minimum value of $106.59 (less certain distributions received after June 26, 2024) exceeds the then-current fair market value of such Legacy Class A-4 OP units. |
The effect of the Rollover Holder Put Option and the Lineage OP Put Option is to cause all Guarantee Rights ultimately to be satisfied by Lineage Holdings so that all investors in BGLH, Lineage, our operating partnership and Lineage Holdings are proportionately impacted by the Guarantee Rights based on their direct and indirect ownership interests in Lineage Holdings. The Rollover Holder Put Option represents a written put option on shares of our common stock, which we expect to be accounted for as a separate, freestanding financial instrument from the shares of common stock underlying the option (the “Rollover Holder Put Option Liability”). Accordingly, the unaudited pro forma condensed consolidated financial statements include an adjustment to recognize the Rollover Holder Put Option Liability at fair value with a corresponding reduction in Retained earnings (accumulated deficit) attributable to BGLH. Subsequently, the Rollover Holder Put Option Liability will be remeasured to fair value at each reporting date, with changes in fair value recognized through earnings.
2024 and 2023 Net Investment Activity
Since January 1, 2024, we completed the acquisition of a temperature-controlled warehousing facility for a purchase price of approximately $59.5 million (our “2024 Acquisition”). For the year ended December 31, 2023, we completed the acquisition of certain temperature-controlled warehousing facilities and companies for an aggregate purchase price of $289.0 million (our “2023 Acquisitions”). Based on quantitative and qualitative considerations, such acquisitions during the periods stated above were not material to us individually or in the aggregate and, therefore, the unaudited pro forma condensed consolidated financial statements do not include adjustments for such acquisitions.
In addition, for the year ended December 31, 2023, we completed a disposition within our global integrated solutions segment for an immaterial sales price. Such disposition was not considered discontinued operations as the transaction did not represent a strategic shift that had a major effect on our operations and financial results. Therefore, the unaudited pro forma condensed consolidated financial statements do not include adjustments for such disposition.
F-125
Table of Contents
The below table provides the relative contribution to our revenue and cost of operations from our 2024 Acquisition for the period from the acquisition date through March 31, 2024 and from our 2023 Acquisitions for the three months ended March 31, 2024 (dollar amounts in millions).
Acquisition date | February 1, 2024 | May 1, 2023 | August 1, 2023 | October 2, 2023 | October 2, 2023 | October 2, 2023 | Total | |||||||||||||||||||||
Global Warehousing | ||||||||||||||||||||||||||||
Number of warehouses | 1 | — | 2 | 6 | 2 | — | 11 | |||||||||||||||||||||
Revenue | $ | 2.1 | $ | — | $ | 0.8 | $ | 8.4 | $ | 2.7 | $ | — | $ | 14.0 | ||||||||||||||
Cost of operations | $ | (0.7 | ) | $ | — | $ | (0.5 | ) | $ | (6.0 | ) | $ | (1.7 | ) | $ | — | $ | (8.9 | ) | |||||||||
Global Integrated Solutions | ||||||||||||||||||||||||||||
Number of warehouses | — | — | — | 2 | — | — | 2 | |||||||||||||||||||||
Revenue | $ | — | $ | 0.3 | $ | — | $ | 11.4 | $ | — | $ | 5.2 | $ | 16.9 | ||||||||||||||
Cost of operations | $ | — | $ | (0.2 | ) | $ | — | $ | (8.3 | ) | $ | — | $ | (3.4 | ) | $ | (11.9 | ) |
The below table provides the relative contribution to our revenue and cost of operations from our 2023 Acquisitions for the period from the respective acquisition dates through December 31, 2023 (dollar amounts in millions).
Acquisition date | May 1, 2023 | August 1, 2023 | October 2, 2023 | October 2, 2023 | October 2, 2023 | Total | ||||||||||||||||||
Global Warehousing | ||||||||||||||||||||||||
Number of warehouses | — | 2 | 6 | 2 | — | 10 | ||||||||||||||||||
Revenue | $ | — | $ | 1.8 | $ | 7.9 | $ | 2.6 | $ | — | $ | 12.3 | ||||||||||||
Cost of operations | $ | — | $ | (1.0 | ) | $ | (5.3 | ) | $ | (1.4 | ) | $ | — | $ | (7.7 | ) | ||||||||
Global Integrated Solutions | ||||||||||||||||||||||||
Number of warehouses | — | — | 2 | — | — | 2 | ||||||||||||||||||
Revenue | $ | 1.2 | $ | — | $ | 9.2 | $ | — | $ | 4.2 | $ | 14.6 | ||||||||||||
Cost of operations | $ | (0.7 | ) | $ | — | $ | (7.3 | ) | $ | — | $ | (3.4 | ) | $ | (11.4 | ) |
Other Transactions
Kloosterboer
On October 1, 2021, we acquired 100% of the outstanding equity interests in Kloosterboer Group B.V. and its subsidiaries. Pursuant to the terms of the sale and purchase agreement and the investment agreement (collectively, the “Kloosterboer Investment Agreement”), the seller (the “Kloosterboer Co-Investor”) elected to reinvest €200 million in a newly formed Dutch subsidiary of ours in the form of 2,952,738 non-voting convertible preferred equity instruments with a per share nominal value of €0.007 (the “preference shares”) issued on the closing date. On October 13, 2022, Kloosterboer Co-Investor redeemed 738,185 of the preference shares. The preference shares accrue a fixed, cumulative, preferential dividend at the rate of 10% per annum from January 1, 2024, compounding annually. Once per year, the Kloosterboer Co-Investor has a regular redemption right. We have applied the guidance under ASC 480-10-S99-3A on the classification and subsequent measurement of the preference shares. The preference shares are recognized as a redeemable noncontrolling interest in our company and are presented within redeemable noncontrolling interests in the historical consolidated balance sheets and consolidated statements of redeemable noncontrolling interests and equity.
As required under the terms of the Kloosterboer Investment Agreement, we have provided notice to the Kloosterboer Co-Investor of our plans to complete this offering. The Kloosterboer Co-Investor has not exercised its right to convert the preference shares into a security that tracks economic performance of an equivalent number of Class A-20 units of Lineage OP (which will become Legacy Class A-3 OP Units of our operating partnership). As the Kloosterboer Co-Investor has not exercised this conversion option, all outstanding
F-126
Table of Contents
preference shares, including all unpaid, accrued preferential dividends, shall be mandatorily redeemed for cash or a variable number of shares of our common stock on October 1, 2026. To the extent the Kloosterboer Co-Investor elects to receive shares of our common stock, the number of variable shares would be based on the volume weighted average price of our common stock on the business day immediately prior to the redemption date. As a result, upon completion of this offering, the preference shares are considered mandatorily redeemable and will be recognized as a liability. Accordingly, the unaudited pro forma condensed consolidated financial statements include an adjustment to reclassify the preference shares from redeemable noncontrolling interests to other long-term liabilities at fair value. The difference between the estimated fair value of the liability and the previous carrying value of the preference shares is recorded to retained earnings (accumulated deficit) in a manner similar to our treatment of dividends paid on preferred stock. In addition, the unaudited pro forma condensed consolidated statements of operations and comprehensive income (loss) include adjustments to reflect the effective interest expense accrued during the period, as if the fair value of the preference shares became a mandatorily redeemable liability on January 1, 2023.
Amendment of Revolving Credit and Term Loan Agreement
Effective February 15, 2024, we amended and restated the Revolving Credit and Term Loan Agreement, increasing our borrowing capacity under the existing Revolving Credit Facility to $3.5 billion. The amendment also resulted in a pay down of $875.0 million on the Term Loan using funds available on the Revolving Credit Facility. After the amendment, the remaining outstanding balance on the Term Loan is $1.0 billion. Additionally, the amendment gives us the right to increase the size of the existing Term Loan, add one or more incremental term loans and/or increase commitments under the Revolving Credit Facility up to $500.0 million (subject to satisfying certain conditions and obtaining such commitments), which would increase the total aggregate commitment amount of the existing Credit Agreement to $5.0 billion. Furthermore, the amendment extended the Revolving Credit Facility and Term Loan maturity dates to February 15, 2028 and February 15, 2029, respectively. Under the terms of Revolving Credit and Term Loan Agreement, the Revolving Credit Facility may be extended through two six-month extension options that can be exercised if certain conditions are met. The historical consolidated balance sheets as of March 31, 2024 reflect the impacts of the Revolving Credit and Term Loan Agreement amendment. The unaudited pro forma condensed consolidated statements of operations and comprehensive income (loss) include adjustments to reflect the changes in interest expense and deferred financing fees associated with this amendment.
Historic Equity-Based Awards
Certain current and former employees have been granted notional units under certain preexisting value creation unit plans (collectively the “LVCP Plans”). The awards under the LVCP Plans entitle the recipient to a payment equal to the excess of the per unit value of Lineage Holdings at the time of full vesting, over the benchmark amount specified by the award agreement. Prior to this offering, no expense was recognized as the liquidity event vesting conditions were not considered probable of occurring. As the liquidity event vesting conditions under the LVCP Plans were satisfied at the time of this offering, the unaudited pro forma condensed consolidated financial statements include an adjustment to recognize the associated compensation expense and a corresponding liability. This liability will be immediately settled upon the completion of this offering by paying cash or issuing shares of our common stock to the holders of vested LVCP awards.
Certain members of management and certain non-employee directors were granted interests in BGLH in the form of restricted Class B Units (“BGLH Restricted Units”). Although BGLH Restricted Units have time-vesting conditions, we expect that all outstanding BGLH Restricted Units will immediately vest upon the completion of this offering. For those certain BGLH Restricted Units with contingent accelerated vesting, because the liquidity event vesting conditions were satisfied at the time of this offering, the unaudited pro forma condensed consolidated financial statements include an adjustment to recognize the associated acceleration of compensation expense.
F-127
Table of Contents
LINEAGE, INC. AND SUBSIDIARIES
UNAUDITED PRO FORMA CONDENSED CONSOLIDATED BALANCE SHEET
AS OF MARCH 31, 2024
(dollars in millions, except per share and share amounts)
Historical | Offering Transactions Adjustments | Formation Transactions Adjustments | Other Pro Forma Adjustments | Pro Forma | ||||||||||||||||||||||
Assets | ||||||||||||||||||||||||||
Current assets: | ||||||||||||||||||||||||||
Cash and cash equivalents | $ | 91.2 | $ | 92.3 | 3(A) 3(B) | $ | (74.4 | ) | 3(C) 3(D) | $ | (17.9 | ) | 3(D) | $ | 91.2 | |||||||||||
Restricted cash | 2.4 | — | — | — | 2.4 | |||||||||||||||||||||
Accounts receivable, net | 869.4 | (0.5 | ) | 3(B) | 8.2 | 3(D) | — | 877.1 | ||||||||||||||||||
Inventories | 167.9 | — | — | — | 167.9 | |||||||||||||||||||||
Prepaid expenses and other current assets | 129.6 | (16.2 | ) | 3(A) | — | — | 113.4 | |||||||||||||||||||
|
|
|
|
|
|
|
|
|
| |||||||||||||||||
Total current assets | 1,260.5 | 75.6 | (66.2 | ) | (17.9 | ) | 1,252.0 | |||||||||||||||||||
Non-current assets: | ||||||||||||||||||||||||||
Property, plant, and equipment, net | 10,480.1 | — | — | — | 10,480.1 | |||||||||||||||||||||
Finance lease right-of-use assets, net | 1,216.6 | — | — | — | 1,216.6 | |||||||||||||||||||||
Operating lease right-of-use assets, net | 709.3 | — | — | — | 709.3 | |||||||||||||||||||||
Equity method investments | 115.0 | — | — | — | 115.0 | |||||||||||||||||||||
Goodwill | 3,373.1 | — | — | — | 3,373.1 | |||||||||||||||||||||
Other intangible assets, net | 1,247.7 | — | — | — | 1,247.7 | |||||||||||||||||||||
Other assets | 332.1 | (9.2 | ) | 3(B) | — | — | 322.9 | |||||||||||||||||||
|
|
|
|
|
|
|
|
|
| |||||||||||||||||
Total assets | $ | 18,734.4 | $ | 64.4 | $ | (66.2 | ) | $ | (17.9 | ) | $ | 18,716.7 | ||||||||||||||
|
|
|
|
|
|
|
|
|
| |||||||||||||||||
Liabilities, Redeemable Noncontrolling Interests, and Equity | ||||||||||||||||||||||||||
Current liabilities: | ||||||||||||||||||||||||||
Accounts payable and accrued liabilities | $ | 1,030.5 | $ | (8.5 | ) | 3(B) | $ | 21.8 | 3(D) 3(F) | $ | (5.6 | ) | 3(D) | $ | 1,038.2 | |||||||||||
Accrued distributions | 11.4 | — | — | — | 11.4 | |||||||||||||||||||||
Deferred revenue | 86.9 | — | — | — | 86.9 | |||||||||||||||||||||
Current portion of long-term debt, net | 21.7 | — | — | — | 21.7 | |||||||||||||||||||||
|
|
|
|
|
|
|
|
|
| |||||||||||||||||
Total current liabilities | 1,150.5 | (8.5 | ) | 21.8 | (5.6 | ) | 1,158.2 | |||||||||||||||||||
Non-current liabilities: | ||||||||||||||||||||||||||
Long-term finance lease obligations | 1,283.5 | — | — | — | 1,283.5 | |||||||||||||||||||||
Long-term operating lease obligations | 676.5 | — | — | — | 676.5 | |||||||||||||||||||||
Deferred income tax liability | 356.4 | — | (3.5 | ) | 3(D) | — | 352.9 | |||||||||||||||||||
Long-term debt, net | 9,246.0 | (3,313.3 | ) | 3(B) | 75.0 | 3(C) | — | 6,007.7 | ||||||||||||||||||
Other long-term liabilities | 158.4 | — | 78.6 | 3(F) | 246.6 | 3(G) | 483.6 | |||||||||||||||||||
|
|
|
|
|
|
|
|
|
| |||||||||||||||||
Total liabilities | 12,871.3 | (3,321.8 | ) | 171.9 | 241.0 | 9,962.4 | ||||||||||||||||||||
Commitments and contingencies | ||||||||||||||||||||||||||
Redeemable noncontrolling interests | 255.1 | — | — | (221.3 | ) | 3(G) | 33.8 | |||||||||||||||||||
Stockholders’ equity: | ||||||||||||||||||||||||||
Common stock, $0.01 par value per share | 1.6 | 0.5 | 3(A) | — | — | 2.1 | ||||||||||||||||||||
Additional paid-in capital - common stock | 5,990.9 | 3,401.5 | 3(A) | 115.4 | 3(C) 3(D) 3(E) | 21.9 | 3(D) | 9,529.7 | ||||||||||||||||||
Series A preferred stock, $0.01 par value per share | 0.6 | — | (0.6 | ) | 3(C) | — | — | |||||||||||||||||||
Retained earnings (accumulated deficit) | (918.3 | ) | (13.8 | ) | 3(B) | (609.5 | ) | 3(C) 3(D) 3(E) 3(F) | (59.5 | ) | 3(D) 3(G) | (1,601.1 | ) | |||||||||||||
Accumulated other comprehensive income (loss) | (96.8 | ) | — | (1.4 | ) | 3(E) | — | (98.2 | ) | |||||||||||||||||
|
|
|
|
|
|
|
|
|
| |||||||||||||||||
Total stockholders’ equity | 4,978.0 | 3,388.2 | (496.1 | ) | (37.6 | ) | 7,832.5 | |||||||||||||||||||
Noncontrolling interests | 630.0 | — | 258.0 | 3(E) | — | 888.0 | ||||||||||||||||||||
|
|
|
|
|
|
|
|
|
| |||||||||||||||||
Total equity | 5,608.0 | 3,388.2 | (238.1 | ) | (37.6 | ) | 8,720.5 | |||||||||||||||||||
|
|
|
|
|
|
|
|
|
| |||||||||||||||||
Total liabilities, redeemable noncontrolling interests, and equity | $ | 18,734.4 | $ | 66.4 | $ | (66.2 | ) | $ | (17.9 | ) | $ | 18,716.7 | ||||||||||||||
|
|
|
|
|
|
|
|
|
|
F-128
Table of Contents
LINEAGE, INC. AND SUBSIDIARIES
UNAUDITED PRO FORMA CONDENSED CONSOLIDATED STATEMENT OF OPERATIONS AND
COMPREHENSIVE INCOME (LOSS)
FOR THE THREE MONTHS ENDED MARCH 31, 2024
(dollars in millions, except per share amounts)
Historical | Offering Transactions Adjustments | Formation Transactions Adjustments | Other Pro Forma Adjustments | Pro Forma | ||||||||||||||||||||||||||||||||
Net revenues | $ | 1,328.0 | $ | — | $ | — | $ | — | $ | 1,328.0 | ||||||||||||||||||||||||||
|
|
|
|
|
|
|
|
|
| |||||||||||||||||||||||||||
Cost of operations | 883.8 | — | 0.8 | 4(C) | — | 884.6 | ||||||||||||||||||||||||||||||
General and administrative expense | 124.1 | (1.1 | ) | 4(B) | 21.8 | | 4(C) 4(D) |
| — | 144.8 | ||||||||||||||||||||||||||
Depreciation expense | 157.7 | — | — | — | 157.7 | |||||||||||||||||||||||||||||||
Amortization expense | 53.4 | — | — | — | 53.4 | |||||||||||||||||||||||||||||||
Acquisition, transaction, and other expense | 8.6 | — | — | — | 8.6 | |||||||||||||||||||||||||||||||
Restructuring, impairment, and (gain) loss on disposals | (0.4 | ) | — | — | — | (0.4) | ||||||||||||||||||||||||||||||
|
|
|
|
|
|
|
|
|
| |||||||||||||||||||||||||||
Total operating expense | 1,227.2 | (1.1 | ) | 22.6 | — | 1,248.7 | ||||||||||||||||||||||||||||||
|
|
|
|
|
|
|
|
|
| |||||||||||||||||||||||||||
Income from operations | 100.8 | 1.1 | (22.6 | ) | — | 79.3 | ||||||||||||||||||||||||||||||
|
|
|
|
|
|
|
|
|
| |||||||||||||||||||||||||||
Other income (expense): | ||||||||||||||||||||||||||||||||||||
Equity income (loss), net of tax | (1.8 | ) | — | — | — | (1.8) | ||||||||||||||||||||||||||||||
Gain (loss) on foreign currency transactions, net | (10.7 | ) | — | — | — | (10.7) | ||||||||||||||||||||||||||||||
Interest expense, net | (138.8 | ) | 60.1 | | 4(A) 4(B) |
| — | (3.9 | ) | 4(E) | (82.6) | |||||||||||||||||||||||||
Gain (loss) on extinguishment of debt | (6.5 | ) | 6.5 | | 4(A) 4(B) |
| — | — | — | |||||||||||||||||||||||||||
Other nonoperating income (expense), net | (0.7 | ) | — | — | — | (0.7) | ||||||||||||||||||||||||||||||
|
|
|
|
|
|
|
|
|
| |||||||||||||||||||||||||||
Total other income (expense), net | (158.5 | ) | 66.6 | — | (3.9 | ) | (95.8) | |||||||||||||||||||||||||||||
|
|
|
|
|
|
|
|
|
| |||||||||||||||||||||||||||
Net income (loss) before income taxes | (57.7 | ) | 67.7 | (22.6 | ) | (3.9 | ) | (16.5) | ||||||||||||||||||||||||||||
Income tax expense (benefit) | (9.7 | ) | — | (1.4 | ) | 4(C) | (1.0 | ) | 4(E) | (12.1) | ||||||||||||||||||||||||||
|
|
|
|
|
|
|
|
|
| |||||||||||||||||||||||||||
Net income (loss) | (48.0 | ) | 67.7 | (21.2 | ) | (2.9 | ) | (4.4) | ||||||||||||||||||||||||||||
Less: Net income (loss) attributable to noncontrolling interests | (8.3 | ) | — | 8.0 | 4(F) | — | (0.3) | |||||||||||||||||||||||||||||
|
|
|
|
|
|
|
|
|
| |||||||||||||||||||||||||||
Net income (loss) attributable to Lineage, Inc. | $ | (39.7 | ) | $ | 67.7 | $ | (29.2 | ) | $ | (2.9 | ) | $ | (4.1) | |||||||||||||||||||||||
|
|
|
|
|
|
|
|
|
| |||||||||||||||||||||||||||
Other comprehensive income (loss), net of tax: | ||||||||||||||||||||||||||||||||||||
Unrealized gain (loss) on foreign currency hedges and interest rate hedges | 3.3 | — | — | — | 3.3 | |||||||||||||||||||||||||||||||
Foreign currency translation adjustments | (74.0 | ) | — | — | — | (74.0) | ||||||||||||||||||||||||||||||
|
|
|
|
|
|
|
|
|
| |||||||||||||||||||||||||||
Comprehensive income (loss) | (118.7 | ) | 67.7 | (21.2 | ) | (2.9 | ) | (75.1) | ||||||||||||||||||||||||||||
Less: Comprehensive income (loss) attributable to noncontrolling interests | (16.3 | ) | — | 8.8 | 4(F) | — | (7.5) | |||||||||||||||||||||||||||||
|
|
|
|
|
|
|
|
|
| |||||||||||||||||||||||||||
Comprehensive income (loss) attributable to Lineage, Inc. | $ | (102.4 | ) | $ | 67.7 | $ | (30.0 | ) | $ | (2.9 | ) | $ | (67.6) | |||||||||||||||||||||||
|
|
|
|
|
|
|
|
|
| |||||||||||||||||||||||||||
Basic earnings (loss) per share | $ | (0.28 | ) | $ | (0.04 | ) | 4(G) | |||||||||||||||||||||||||||||
|
|
|
| |||||||||||||||||||||||||||||||||
Diluted earnings (loss) per share | $ | (0.28 | ) | $ | (0.04 | ) | 4(G) | |||||||||||||||||||||||||||||
|
|
|
| |||||||||||||||||||||||||||||||||
Weighted average common shares outstanding (in millions): | ||||||||||||||||||||||||||||||||||||
Basic | 161.9 | 210.8 | 4(G) | |||||||||||||||||||||||||||||||||
Diluted | 161.9 | 210.8 | 4(G) |
F-129
Table of Contents
LINEAGE, INC. AND SUBSIDIARIES
UNAUDITED PRO FORMA CONDENSED CONSOLIDATED STATEMENT OF OPERATIONS AND COMPREHENSIVE INCOME (LOSS)
FOR THE YEAR ENDED DECEMBER 31, 2023
(dollars in millions, except per share amounts)
Historical | Offering Transactions Adjustments | Formation Transactions Adjustments | Other Pro Forma Adjustments | Pro Forma | ||||||||||||||||||||||||||||||||
Net revenues | $ | 5,341.5 | $ | — | $ | — | $ | — | $ | 5,341.5 | ||||||||||||||||||||||||||
|
|
|
|
|
|
|
|
|
| |||||||||||||||||||||||||||
Cost of operations | 3,589.8 | — | 3.2 | 5(B) | — | 3,593.0 | ||||||||||||||||||||||||||||||
General and administrative expense | 501.8 | 1.1 | 5(A) | 82.3 | | 5(B) 5(D) |
| 8.3 | 5(F) | 593.5 | ||||||||||||||||||||||||||
Depreciation expense | 551.9 | — | — | — | 551.9 | |||||||||||||||||||||||||||||||
Amortization expense | 207.8 | — | — | — | 207.8 | |||||||||||||||||||||||||||||||
Acquisition, transaction, and other expense | 60.0 | — | 555.7 | 5(E) | 25.9 | 5(E) | 641.6 | |||||||||||||||||||||||||||||
Restructuring and impairment expense | 31.8 | — | — | — | 31.8 | |||||||||||||||||||||||||||||||
|
|
|
|
|
|
|
|
|
| |||||||||||||||||||||||||||
Total operating expense | 4,943.1 | 1.1 | 641.2 | 34.2 | 5,619.6 | |||||||||||||||||||||||||||||||
|
|
|
|
|
|
|
|
|
| |||||||||||||||||||||||||||
Income (loss) from operations | 398.4 | (1.1 | ) | (641.2 | ) | (34.2 | ) | (278.1 | ) | |||||||||||||||||||||||||||
|
|
|
|
|
|
|
|
|
| |||||||||||||||||||||||||||
Other income (expense): | ||||||||||||||||||||||||||||||||||||
Equity income (loss), net of tax | (2.6 | ) | — | — | — | (2.6 | ) | |||||||||||||||||||||||||||||
Gain (loss) on foreign currency transactions, net | 3.9 | — | — | — | 3.9 | |||||||||||||||||||||||||||||||
Interest expense, net | (490.4 | ) | 226.9 | 5(A) | — | (13.9 | ) | 5(F) | (277.4 | ) | ||||||||||||||||||||||||||
Gain (loss) on extinguishment of debt | — | (8.4 | ) | 5(A) | — | — | (8.4 | ) | ||||||||||||||||||||||||||||
Other nonoperating income (expense), net | (19.4 | ) | — | — | — | (19.4 | ) | |||||||||||||||||||||||||||||
|
|
|
|
|
|
|
|
|
| |||||||||||||||||||||||||||
Total other income (expense), net | (508.5 | ) | 218.5 | — | (13.9 | ) | (303.9 | ) | ||||||||||||||||||||||||||||
|
|
|
|
|
|
|
|
|
| |||||||||||||||||||||||||||
Net income (loss) before income taxes | (110.1 | ) | 217.4 | (641.2 | ) | (48.1 | ) | (582.0 | ) | |||||||||||||||||||||||||||
Income tax expense (benefit) | (13.9 | ) | — | (27.9 | ) | 5(B) | (3.6 | ) | 5(F) | (45.4 | ) | |||||||||||||||||||||||||
|
|
|
|
|
|
|
|
|
| |||||||||||||||||||||||||||
Net income (loss) | (96.2 | ) | 217.4 | (613.3 | ) | (44.5 | ) | (536.6 | ) | |||||||||||||||||||||||||||
Less: Net income (loss) attributable to noncontrolling interests | (18.8 | ) | — | (35.8 | ) | 5(C) | — | (54.6 | ) | |||||||||||||||||||||||||||
|
|
|
|
|
|
|
|
|
| |||||||||||||||||||||||||||
Net income (loss) attributable to Lineage, Inc. | $ | (77.4 | ) | $ | 217.4 | $ | (577.5 | ) | $ | (44.5 | ) | $ | (482.0 | ) | ||||||||||||||||||||||
|
|
|
|
|
|
|
|
|
| |||||||||||||||||||||||||||
Other comprehensive income (loss), net of tax: | ||||||||||||||||||||||||||||||||||||
Unrealized gain (loss) on foreign currency hedges and interest rate hedges | (86.9 | ) | — | — | — | (86.9 | ) | |||||||||||||||||||||||||||||
Foreign currency translation adjustments | 88.5 | — | — | — | 88.5 | |||||||||||||||||||||||||||||||
|
|
|
|
|
|
|
|
|
| |||||||||||||||||||||||||||
Comprehensive income (loss) | (94.6 | ) | 217.4 | (613.3 | ) | (44.5 | ) | (535.0 | ) | |||||||||||||||||||||||||||
Less: Comprehensive income (loss) attributable to noncontrolling interests | (20.9 | ) | — | (33.5 | ) | 5(C) | — | (54.4 | ) | |||||||||||||||||||||||||||
|
|
|
|
|
|
|
|
|
| |||||||||||||||||||||||||||
Comprehensive income (loss) attributable to Lineage, Inc. | $ | (73.7 | ) | $ | 217.4 | $ | (579.8 | ) | $ | (44.5 | ) | $ | (480.6 | ) | ||||||||||||||||||||||
|
|
|
|
|
|
|
|
|
| |||||||||||||||||||||||||||
Basic earnings (loss) per share | $ | (0.73 | ) | $ | (2.45 | ) | 5(G) | |||||||||||||||||||||||||||||
|
|
|
| |||||||||||||||||||||||||||||||||
Diluted earnings (loss) per share | $ | (0.73 | ) | $ | (2.45 | ) | 5(G) | |||||||||||||||||||||||||||||
|
|
|
| |||||||||||||||||||||||||||||||||
Weighted average common shares outstanding (in millions): | ||||||||||||||||||||||||||||||||||||
Basic | 161.9 | 210.2 | 5(G) | |||||||||||||||||||||||||||||||||
Diluted | 161.9 | 210.2 | 5(G) |
F-130
Table of Contents
NOTES TO UNAUDITED PRO FORMA CONDENSED CONSOLIDATED FINANCIAL STATEMENTS
1. | Basis of Presentation |
The unaudited pro forma condensed consolidated financial statements have been prepared in accordance with Article 11 of Regulation S-X, as amended. The unaudited pro forma condensed consolidated financial statements as of and for the three months ended March 31, 2024 are presented as if (i) this offering and related use of proceeds, (ii) the formation transactions and (iii) certain other adjustments had all occurred on March 31, 2024 for the unaudited pro forma condensed consolidated balance sheet and (i) this offering and related use of proceeds, (ii) the formation transactions and (iii) certain other adjustments had all occurred on January 1, 2023 for the unaudited pro forma condensed consolidated statement of operations and comprehensive income (loss). The unaudited pro forma condensed consolidated statement of operations and comprehensive income (loss) for the year ended December 31, 2023 is presented as if (i) this offering and related use of proceeds, (ii) the formation transactions and (iii) certain other adjustments had all occurred on January 1, 2023.
The unaudited pro forma condensed consolidated financial statements should be read in conjunction with our historical financial statements, including the notes thereto, and other financial information and analysis, including the section captioned “Management’s Discussion and Analysis of Financial Condition and Results of Operations” presented elsewhere in this prospectus. The unaudited pro forma condensed consolidated financial statements (i) are based on available information and assumptions that we deem reasonable; (ii) are presented for informational purposes only; (iii) do not purport to represent our financial position or results of operations or cash flows that would actually have occurred assuming completion of this offering and related use of proceeds, the formation transactions and other adjustments described above had all occurred on March 31, 2024 for the unaudited pro forma condensed consolidated balance sheet or this offering and related use of proceeds, the formation transactions or other adjustments described above had all occurred on January 1, 2023 for the unaudited pro forma condensed consolidated statements of operations and comprehensive income (loss); and (iv) do not purport to be indicative of our future results of operations or our financial position.
2. | Significant Accounting Policies |
The accounting policies used in the preparation of the unaudited pro forma condensed consolidated financial statements are those set out in our audited financial statements as of and for the year ended December 31, 2023.
3. | Adjustments to the Unaudited Pro Forma Condensed Consolidated Balance Sheet |
The adjustments to the unaudited pro forma condensed consolidated balance sheet as of March 31, 2024 are as follows:
(A) | Reflects the sale of 47.0 million shares of common stock in this offering at a public offering price of $76.00 per share (based on the mid-point of the price range set forth on the front cover of this prospectus), net of underwriting discounts and other estimated offering expenses payable by us (in thousands). |
Gross proceeds from this offering | $ | 3,572,000 | ||
Underwriting discounts | (133,950 | ) | ||
|
| |||
Proceeds before offering expenses payable by us | 3,438,050 | |||
|
| |||
Offering expenses payable by us(1) | (36,050 | ) | ||
|
| |||
Net proceeds from this offering | $ | 3,402,000 | ||
|
|
(1) | Includes offering costs of $16.2 million in prepaid and other current assets on our historical condensed consolidated balance sheet as of March 31, 2024. |
(B) | In April 2024, we received $2.4 billion from the DDTL. We incurred financing fees and expenses of $9.2 million in connection with obtaining the DDTL. The DDTL proceeds were utilized to repay our entire ICE4 CMBS loan on April 9, 2024, prior to maturity in May 2024, and a portion of the Revolving Credit Facility. Because the unaudited pro forma condensed consolidated balance sheet as of March 31, 2024 is |
F-131
Table of Contents
presented as if this offering occurred on March 31, 2024, this adjustment reflects the use of the net proceeds from this offering to repay our ICE4 CMBS loan, assumes that the DDTL loan proceeds were not received, and removes the deferred financing costs associated with the DDTL. |
This adjustment eliminates accrued interest expense of $10.0 million, net of other adjustments, associated with the ICE4 CMBS loan from accounts payable and accrued liabilities in connection with the repayment of the loan. This adjustment assumes settlement of the designated interest rate caps related to the ICE4 CMBS loan, which is reflected through a write-off of $0.5 million in related receivables recorded in our historical condensed consolidated balance sheet as of March 31, 2024, and a net cash inflow of $1.3 million, as we assumed that repayment of our ICE4 CMBS loan took place on January 1, 2023. Deferred financing costs related to the ICE4 CMBS loan are included in long-term debt, net. This adjustment reflects the elimination of $0.4 million in unamortized deferred financing costs from long-term debt, net, expensed in connection with the repayment of our ICE4 CMBS loan. The remainder of changes in long-term debt, net represent the repayment of a portion of the Revolving Credit Facility with the remaining net proceeds from this offering.
(C) | Reflects (i) the redemption of our outstanding Series A preferred stock for $0.6 million in cash plus any accrued but unpaid dividends and (ii) the repurchase of a portion of the Bay Grove OPEUs held by Bay Grove for cash in the amount of $75.0 million that was paid prior to this offering and was funded by borrowings under the Revolving Credit Facility. |
(D) | Reflects (i) $34.7 million in cash and $104.4 million in fully-vested shares of our common stock granted to our executive officers and employees as one-time awards in connection with the completion of this offering, (ii) $6.1 million in fully-vested shares of our common stock issued to certain of our employees, former employees and others in settlement of certain outstanding vested LMEP Units and $165.3 million in Legacy OP Units issued to certain of our employees in settlement of certain outstanding vested LMEP Units, (iii) $12.3 million in cash and $13.5 million in fully-vested shares of our common stock issued to our employees, other than executive officers, in connection with the vesting and immediate settlement of LVCP Awards, and (iv) $8.3 million recognized for the accelerated vesting of outstanding unvested BGLH Restricted Units. This adjustment also includes the estimated effect of income tax related to these awards, calculated using a blended tax rate. |
(E) | Reflects the recognition of (i) noncontrolling interests associated with the OPEUs received by Bay Grove associated with the vesting of the Class D units in Lineage Holdings and the termination of the operating services agreement between Lineage Holdings and Bay Grove and (ii) a reallocation between noncontrolling interests and additional paid-in capital to align the ending ownership percentages. |
(F) | Reflects the recognition of the Rollover Holder Put Option Liability at fair value with a corresponding reduction in retained earnings (accumulated deficit) attributable to BGLH. The current portion of this adjustment is presented as an adjustment to accounts payable and accrued liabilities whereas the non-current portion is presented as an adjustment to other long-term liabilities. |
(G) | Reflects the reclassification of the Kloosterboer preference shares from redeemable noncontrolling interests to other long-term liabilities at fair value. The difference between the estimated fair value of the liability and the previous carrying value of the preference shares is recorded to retained earnings (accumulated deficit) in a manner similar to our treatment of dividends paid on preferred stock. |
4. | Adjustments to the Unaudited Pro Forma Condensed Consolidated Statement of Operations and Comprehensive Income (Loss) |
The adjustments to the unaudited pro forma condensed consolidated statement of operations and comprehensive income (loss) for the three months ended March 31, 2024 are as follows:
(A) | Reflects (i) a $43.4 million reduction in interest expense related to the repayment of our ICE4 CMBS loan prior to maturity in April 2024 as described in Note 3(B), including the elimination of deferred financing costs that were amortized over the term of the loan and included in interest expense, net, (ii) a $16.2 million reduction in interest expense related to the repayment of a portion of the Revolving Credit Facility, (iii) a $0.5 million loan, and (iv) a $1.1 million reduction of general and administrative expenses |
F-132
Table of Contents
for fees incurred in relation to the Revolving Credit and Term Loan Agreement refinancing, as we have assumed that expense was incurred as of January 1, 2023. |
(B) | Reflects the removal of $6.5 million of loss on extinguishment of debt, as we have assumed that this offering and the formation transactions occurred as of January 1, 2023 for the purposes of the unaudited pro forma condensed consolidated statements of operations and comprehensive income (loss), and any related loss on debt extinguishment is reflected in the unaudited pro forma condensed consolidated statement of operations and comprehensive income (loss) for the year ended December 31, 2023. |
(C) | Reflects (i) $5.4 million in equity-based compensation expense associated with grants of restricted stock units that are subject to time-based vesting to certain of our employees as replacement for certain vested and unvested LVCP awards, (ii) $7.8 million in equity-based compensation expense associated with grants of restricted stock units or LTIP units that are subject to time-based vesting to certain of our executive officers and employees as replacement for certain vested and unvested LMEP Units, and (iii) $11.3 million in equity-based compensation expense associated with grants of restricted stock units and LTIP units that are subject to time- and/or performance-based vesting to certain of our executive directors and employees as part of our annual equity award program. This adjustment also includes the estimated effect of income tax related to these awards, calculated using a blended tax rate. |
(D) | Reflects the elimination of $2.5 million in operating services fees for the three months ended March 31, 2024 incurred under the operating services agreement that will be terminated in connection with the internalization, partially offset by $2.0 million in transition services fees for the three months ended March 31, 2024 that would have been incurred under the transition services agreement that will be entered into in connection with the internalization. |
(E) | Reflects $3.9 million of effective interest expense accrued for the three months ended March 31, 2024 related to the Kloosterboer preference shares. Such expense is calculated using an effective interest method assuming that the fair value of the preference shares became a mandatorily redeemable liability on January 1, 2023. This adjustment also includes the estimated impact of income tax on the interest expense, calculated using the statutory rate. |
(F) | Reflects the change in net income (loss) attributable to noncontrolling interests and comprehensive net income (loss) attributable to noncontrolling interests resulting from the issuance of OP units to us in exchange for the contribution of the net proceeds from this offering. |
(G) | Represents the pro forma basic and diluted earnings (loss) per share calculated using the historical weighted average shares our common stock outstanding after giving effect to the shares issued in this offering and completion of the formation transactions. |
5. | Adjustments to the Unaudited Pro Forma Condensed Consolidated Statement of Operations and Comprehensive Income (Loss) |
The adjustments to the unaudited pro forma condensed consolidated statement of operations and comprehensive income (loss) for the year ended December 31, 2023 are as follows:
(A) | Reflects (i) a $163.9 million reduction in interest expense related to the repayment of our ICE4 CMBS loan prior to maturity in April 2024, as described in Note 3(B), including the elimination of deferred financing costs that were amortized over the term of the loan and included interest expense, net, (ii) a $60.3 million reduction in interest expense related to the repayment of a portion of the Revolving Credit Facility, (iii) $1.1 million of incremental general and administrative expenses for fees incurred in relation to the Revolving Credit and Term Loan Agreement refinancing, and (iv) $8.4 million of loss on extinguishment of debt associated with the write-off of unamortized deferred financing costs related to the ICE4 CMBS loan. This adjustment also reflects a $2.7 million adjustment to interest expense, net for removal of interest rate caps related to the ICE4 CMBS loan. |
(B) | Reflects (i) $21.8 million in equity-based compensation expense associated with grants of restricted stock units that are subject to time-based vesting to certain of our employees as replacement for certain vested |
F-133
Table of Contents
and unvested LVCP awards, (ii) $31.3 million in equity-based compensation expense associated with grants of restricted stock units that are subject to time-based vesting to certain of our executive directors and employees as replacement for certain vested and unvested LMEP Units, (iii) $45.2 million in equity-based compensation expense associated with grants of restricted stock units and LTIP units that are subject to time- and/or performance-based vesting to certain of our executive directors and employees as part of our annual equity award program, (iv) $0.6 million in equity-based compensation expense associated with grants of restricted stock units that are subject to time-based vesting to certain of our non-employee directors upon completion of this offering, and (v) $8.3 million in expense associated with the accelerated vesting of the outstanding unvested BGLH Restricted Units. This adjustment also includes the estimated effect of income tax related to these awards, calculated using a blended tax rate. |
(C) | Reflects the change in net income (loss) attributable to noncontrolling interests and comprehensive net income (loss) attributable to noncontrolling interests resulting from the issuance of OP units to us in exchange for the contribution of the net proceeds from this offering. |
(D) | Reflects the elimination of $10.5 million in operating services fees for the year ended December 31, 2023 incurred under the operating services agreement that will be terminated in connection with the internalization, partially offset by $8.0 million in transition services fees for the year ended December 31, 2023 that would have been incurred under the transition services agreement that will be entered into in connection with the internalization. |
(E) | Reflects the recognition of additional acquisition, transaction, and other expense for the year ended December 31, 2023 associated with the following nonrecurring expenses: (i) $200.0 million consideration received by Bay Grove in exchange for the termination of operating services agreement and the equity accrual right, (ii) recognition of $25.8 million in additional expense associated with the vesting of certain of the LVCP Awards that were immediately paid in cash or fully-vested shares of our common stock, (iii) $184.4 million associated with the vesting of the Class D units in Lineage Holdings, (iv) recognition of expense for one-time awards of $34.7 million to be paid in cash and $104.4 million to be paid in fully-vested shares of our common stock issued to certain of our executive officers and employees in connection with the completion of this offering and (v) recognition of expense in the amount of $18.2 million for cash awards subject to time-based vesting requirements and $14.2 million for restricted stock units subject to time-based vesting requirements granted to certain of our employees in connection as one-time awards in connection with the completion of this offering. |
(F) | Reflects $13.9 million of effective interest accrued for the year ended December 31, 2023 related to the Kloosterboer preference shares. Such expense is calculated using an effective interest method assuming that the fair value of the preference shares became a mandatorily redeemable liability on January 1, 2023. This adjustment also includes the estimated impact of income tax on the interest expense, calculated using the statutory rate. |
(G) | Represents the pro forma basic and diluted earnings (loss) per share calculated using the historical weighted average shares of our common stock outstanding after giving effect to the shares issued in this offering and the completion of the formation transactions. |
F-134
Table of Contents
Table of Contents
Table of Contents
PART II
INFORMATION NOT REQUIRED IN PROSPECTUS
Item 31. Other Expenses of Issuance and Distribution.
The following table itemizes the expenses incurred by us in connection with the issuance and registration of the securities being registered hereunder. All amounts shown are estimates except for the SEC registration fee and the Financial Industry Regulatory Authority, Inc., or FINRA, filing fee and the Nasdaq Global Select Market listing fee.
SEC registration fee | $ | 654,178 | ||
FINRA filing fee | 225,500 | |||
Stock exchange listing fee | 320,000 | |||
Legal fees and expenses | 24,000,000 | |||
Printing and engraving expenses | 1,620,000 | |||
Transfer agent’s fees and expenses | 10,000 | |||
Accounting fees and expenses | 3,735,000 | |||
Miscellaneous | 5,446,000 | |||
|
| |||
Total | $ | 36,013,678 | ||
|
|
Item 32. Sales to Special Parties.
None.
Item 33. Recent Sales of Unregistered Securities.
The following table sets forth all unregistered sales of securities made by us during the last three years:
Date | Securities Issued | Purchaser | Consideration | Exemption from Registration | ||||
July 19, 2021 | 14,705.40 shares of common stock | BGLH | Non-cash equity contribution by rollover sellers in Kenyon transaction with an aggregate value equal to $999,967.20 | Section 4(a)(2) | ||||
September 1, 2021 | 505 shares of Series A preferred stock and 129,363.06 shares of common stock | BGLH (common stock); approximately 126 preferred stockholders (Series A preferred stock) | 3,741.70 shares of Class A voting common stock and Class B non-voting common stock of Kenyon Zero Storage, Inc., a Washington corporation | Section 4(a)(2) | ||||
September 23, 2021 | 5,882,352.94 shares of common stock | BGLH | $400,000,000.00 | Section 4(a)(2) | ||||
September 24, 2021 | 6,187,610.01 shares of common stock | BGLH | $420,757,480.42 | Section 4(a)(2) | ||||
September 24, 2021 | 58,825.00 shares of common stock | BGLH | $4,000,100.00 | Section 4(a)(2) | ||||
September 24, 2021 | 114,649.68 shares of common stock | BGLH | $9,000,000.00 | Section 4(a)(2) |
Table of Contents
Date | Securities Issued | Purchaser | Consideration | Exemption from Registration | ||||
September 24, 2021 | 3,307,359.25 shares of common stock | BGLH | $266,242,419.58 | Section 4(a)(2) | ||||
November 2, 2021 | 551,199.34 shares of common stock | BGLH | Non-cash equity contribution by rollover sellers in Perishable Shipping Solutions transaction with an aggregate value equal to $44,371,546.72 | Section 4(a)(2) | ||||
December 8, 2021 | 2,528,433.85 shares of common stock | BGLH | $203,500,000.00 and non-cash contribution in an amount equal to $38,925.00 (representing foreign exchange loss on cash contribution) | Section 4(a)(2) | ||||
December 9, 2021 | 475,580.06 shares of common stock | BGLH | $38,284,194.98 | Section 4(a)(2) | ||||
December 28, 2021 | 16,058.30 shares of common stock | BGLH | $1,292,693.52 | Section 4(a)(2) | ||||
December 29, 2021 | 557,983.59 shares of common stock | BGLH | $44,917,678.78 | Section 4(a)(2) | ||||
December 29, 2021 | 408,891.15 shares of common stock | BGLH | $32,915,737.50 | Section 4(a)(2) | ||||
February 18, 2022 | 37,267.08 shares of restricted common stock subject to vesting requirements | BGLH | Provision of services and compliance with vesting requirements by BGLH management personnel | Section 4(a)(2) | ||||
March 4, 2022 | 52,173.92 shares of restricted common stock subject to vesting requirements | BGLH | Provision of services and compliance with vesting requirements by BGLH management personnel | Section 4(a)(2) | ||||
April 25, 2022 | 1,114,271.07 shares of common stock | BGLH | $89,698,821.48 | Section 4(a)(2) | ||||
May 25, 2022 | 17,848.01 shares of restricted common stock subject to vesting requirements | BGLH | Provision of services and compliance with vesting requirements by BGLH management personnel | Section 4(a)(2) | ||||
June 1, 2022 | 615,458.79 shares of common stock | BGLH | A number of shares of Turvo, Inc., a Delaware corporation, with an aggregate value equal to $54,991,291.05 and a cash payment of $400,000.00 | Section 4(a)(2) |
Table of Contents
Date | Securities Issued | Purchaser | Consideration | Exemption from Registration | ||||
June 24, 2022 | 3,726,708.07 shares of common stock | BGLH | $300,000,000.00 | Section 4(a)(2) | ||||
July 22, 2022 | 482,483.23 shares of common stock | BGLH | $38,839,900.00 | Section 4(a)(2) | ||||
August 30, 2022 | 1,666.67 shares of restricted common stock subject to vesting requirements | BGLH | Provision of services and compliance with vesting requirements by BGLH management personnel | Section 4(a)(2) | ||||
September 1, 2022 | 1,057,361.11 shares of common stock | BGLH | $95,162,500.00 | Section 4(a)(2) | ||||
September 1, 2022 | 156,418.89 shares of common stock | BGLH | A promissory note originally issued to BG Lineage Holdings, LLC by Lineage Spain Holdings I, S.L.U, a Spanish limited liability company in the form of “sociedad de responsabilidad limitada”, with a principal amount equal to €14,000,000.00 | Section 4(a)(2) | ||||
September 7, 2022 | 9,316.77 shares of common stock | BGLH | $750,000.00 | Section 4(a)(2) | ||||
October 3, 2022 | 111,611.10 shares of common stock | BGLH | $10,044,999.12 | Section 4(a)(2) | ||||
October 20, 2022 | 211,180.12 shares of common stock | BGLH | $17,000,000.00 | Section 4(a)(2) | ||||
December 1, 2022 | 1,666.67 shares of restricted common stock subject to vesting requirements | BGLH | Provision of services and compliance with vesting requirements by BGLH management personnel | Section 4(a)(2) | ||||
December 7, 2022 | 4,409,555.96 shares of common stock | BGLH | $396,860,036.34 | Section 4(a)(2) | ||||
December 7, 2022 | 19,657.02 shares of common stock | BGLH | $1,582,390.38 | Section 4(a)(2) | ||||
December 16, 2022 | 46,404.40 shares of common stock | BGLH | $4,176,396.25 | Section 4(a)(2) | ||||
December 20, 2022 | 13,000.00 shares of common stock | BGLH | $1,170,000.00 | Section 4(a)(2) | ||||
January 9, 2023 | 56,666.67 shares of restricted common stock subject to vesting requirements | BGLH | Provision of services and compliance with vesting requirements by BGLH management personnel | Section 4(a)(2) |
Table of Contents
Date | Securities Issued | Purchaser | Consideration | Exemption from Registration | ||||
January 20, 2023 | 1,113,888.89 shares of common stock | BGLH | $100,250,000.00 | Section 4(a)(2) | ||||
January 25, 2023 | 444,444.44 shares of common stock | BGLH | $40,000,000.00 | Section 4(a)(2) | ||||
February 10, 2023 | 33,333.33 shares of restricted common stock subject to vesting requirements | BGLH | Provision of services and compliance with vesting requirements by BGLH management personnel | Section 4(a)(2) | ||||
April 10, 2023 | 7,777.79 shares of restricted common stock subject to vesting requirements | BGLH | Provision of services and compliance with vesting requirements by BGLH management personnel | Section 4(a)(2) | ||||
April 19, 2023 | 111,111.00 shares of restricted common stock subject to vesting requirements | BGLH | Provision of services and compliance with vesting requirements by BGLH management personnel | Section 4(a)(2) | ||||
May 9, 2023 | 17,833.39 shares of restricted common stock subject to vesting requirements | BGLH | $1,605,005.00 | Section 4(a)(2) | ||||
May 26, 2023 | 2,222.22 shares of restricted common stock subject to vesting requirements | BGLH | Provision of services and compliance with vesting requirements by BGLH management personnel | Section 4(a)(2) | ||||
August 30, 2023 | 1,666.67 shares of restricted common stock subject to vesting requirements | BGLH | Provision of services and compliance with vesting requirements by BGLH management personnel | Section 4(a)(2) | ||||
September 1, 2023 | 2,777.80 shares of restricted common stock subject to vesting requirements | BGLH | Provision of services and compliance with vesting requirements by BGLH management personnel | Section 4(a)(2) | ||||
December 29, 2023 | 1,554.4 shares of common stock | BGLH | Provisions of services and compliance with vesting requirements by BGLH management personnel | Section 4(a)(2) |
Table of Contents
Date | Securities Issued | Purchaser | Consideration | Exemption from Registration | ||||
February 21, 2024 | 31,088.1 shares of common stock | BGLH | Provision of services and compliance with vesting requirements by BGLH management personnel | Section 4(a)(2) | ||||
April 24, 2024 | 32,202 shares of common stock underlying restricted stock units | Employees of the Company | Provision of services | Section 4(a)(2) or Rule 701 promulgated under Section 3(b) of the Securities Act | ||||
June 15, 2024 | 11,650.34 shares of common stock | BGLH | Provisions of services | Section 4(a)(2) | ||||
June 30, 2024 | 2,590.67 shares of common stock | BGLH | Provision of services | Section 4(a)(2) |
Item 34. Indemnification of Directors and Officers.
Maryland law permits a Maryland corporation to include in its charter a provision limiting the liability of its directors and officers to the corporation and its stockholders for money damages, except for liability resulting from (a) actual receipt of an improper benefit or profit in money, property or services or (b) active and deliberate dishonesty that is established by a final judgment and that is material to the cause of action. The charter of Lineage, Inc., a Maryland corporation (the “company,” “we,” “us” and “our”), contains a provision that eliminates the liability of our directors and officers to the maximum extent permitted by Maryland law.
The Maryland General Corporation Law (the “MGCL”) requires us (unless our charter provides otherwise, which our charter does not) to indemnify a director or officer who has been successful, on the merits or otherwise, in the defense of any proceeding to which he or she is made or threatened to be made a party by reason of his or her service in that capacity. The MGCL permits us to indemnify our present and former directors and officers, among others, against judgments, penalties, fines, settlements and reasonable expenses actually incurred by them in connection with any proceeding to which they may be made or threatened to be made a party to, or witness in, by reason of their service in those or other capacities unless it is established that:
• | the act or omission of the director or officer was material to the matter giving rise to the proceeding and (i) was committed in bad faith or (ii) was the result of active and deliberate dishonesty; |
• | the director or officer actually received an improper personal benefit in money, property or services; or |
• | in the case of any criminal proceeding, the director or officer had reasonable cause to believe that the act or omission was unlawful. |
Under the MGCL, we may not indemnify a director or officer in a suit by us or in our right in which the director or officer was adjudged liable to us or in a suit in which the director or officer was adjudged liable on the basis that personal benefit was improperly received. A court may order indemnification if it determines that the director or officer is fairly and reasonably entitled to indemnification, even though the director or officer did not meet the prescribed standard of conduct or was adjudged liable on the basis that personal benefit was improperly received. However, indemnification for an adverse judgment in a suit by us or in our right, or for a judgment of liability on the basis that personal benefit was improperly received, is limited to expenses.
In addition, the MGCL permits us to advance reasonable expenses to a director or officer upon our receipt of:
• | a written affirmation by the director or officer of his or her good faith belief that he or she has met the standard of conduct necessary for indemnification by us; and |
Table of Contents
• | a written undertaking by or on behalf of the director or officer to repay the amount paid or reimbursed by us if it is ultimately determined that the director or officer did not meet the standard of conduct. |
Our charter requires us, to the maximum extent permitted by Maryland law in effect from time to time, to indemnify and, without requiring a preliminary determination of the ultimate entitlement to indemnification, pay or reimburse reasonable expenses in advance of final disposition of a proceeding to:
• | any present or former director or officer who is made or threatened to be made a party to, or witness in, a proceeding by reason of his or her service in that capacity; or |
• | any individual who, while a director or officer of our company and at our request, serves or has served as a director, officer, partner, trustee, member or manager of another corporation, real estate investment trust, limited liability company, partnership, joint venture, trust, employee benefit plan or any other enterprise and who is made or threatened to be made a party to, or witness in, the proceeding by reason of his or her service in that capacity. |
Our charter also permits us, with the approval of our board of directors, to indemnify and advance expenses to any person who served a predecessor of ours in any of the capacities described above and to any employee or agent of our company or a predecessor of our company.
We intend to enter into indemnification agreements with each of our directors and executive officers that provide for indemnification to the maximum extent permitted by Maryland law.
In addition, our directors and officers may be entitled to indemnification pursuant to the terms of the partnership agreement of Lineage OP, LP, our operating partnership.
Item 35. Treatment of Proceeds from Stock Being Registered.
The consideration to be received by us from the securities registered hereunder will be credited to the appropriate capital account.
Item 36. Financial Statements and Exhibits.
(A) Financial Statements: see Index to Financial Statements.
(B) Exhibits: The following exhibits are filed as part of, or incorporated by reference into, this registration statement on Form S-11:
Table of Contents
Table of Contents
* | Previously filed. |
† | Indicates management contract or compensatory plan. |
Item 37. Undertakings.
The undersigned registrant hereby undertakes that:
(1) | For purposes of determining any liability under the Securities Act of 1933, the information omitted from the form of prospectus filed as part of this registration statement in reliance upon Rule 430A and contained in a form of prospectus filed by the registrant pursuant to Rule 424(b)(1) or (4) or 497(h) under the Securities Act shall be deemed to be part of this registration statement as of the time it was declared effective. |
(2) | For the purpose of determining any liability under the Securities Act of 1933, each post-effective amendment that contains a form of prospectus shall be deemed to be a new registration statement relating to the securities offered therein, and the offering of such securities at that time shall be deemed to be the initial bona fide offering thereof. |
Insofar as indemnification for liabilities arising under the Securities Act of 1933 may be permitted to directors, officers and controlling persons of the registrant pursuant to the foregoing provisions, or otherwise, the registrant has been advised that in the opinion of the Securities and Exchange Commission such indemnification is against public policy as expressed in the Act and is, therefore, unenforceable. In the event that a claim for
Table of Contents
indemnification against such liabilities (other than the payment by the registrant of expenses incurred or paid by a director, officer or controlling person of the registrant in the successful defense of any action, suit or proceeding) is asserted by such director, officer or controlling person in connection with the securities being registered, the registrant will, unless in the opinion of its counsel the matter has been settled by controlling precedent, submit to a court of appropriate jurisdiction the question whether such indemnification by it is against public policy as expressed in the Act and will be governed by the final adjudication of such issue.
Table of Contents
SIGNATURES
Pursuant to the requirements of the Securities Act of 1933, as amended, the registrant certifies that it has reasonable grounds to believe that it meets all of the requirements for filing on Form S-11 and has duly caused this registration statement to be signed on its behalf by the undersigned, thereunto duly authorized, in the City of Novi, Michigan, on this 22nd day of July, 2024.
LINEAGE, INC. | ||
By: | /s/ Greg Lehmkuhl | |
Greg Lehmkuhl | ||
Chief Executive Officer |
Pursuant to the requirements of the Securities Act of 1933, this registration statement has been signed by the following persons in the capacities and on the dates indicated.
Signature | Title | Date | ||
/s/ Greg Lehmkuhl Greg Lehmkuhl | President and Chief Executive Officer (Principal Executive Officer) | July 22, 2024 | ||
* Robert Crisci | Chief Financial Officer (Principal Financial Officer) | July 22, 2024 | ||
* Abigail Fleming | Chief Accounting Officer (Principal Accounting Officer) | July 22, 2024 | ||
* Adam Forste | Co-Executive Chairman | July 22, 2024 | ||
* Kevin Marchetti | Co-Executive Chairman | July 22, 2024 |
*By: | /s/ Greg Lehmkuhl | |
Greg Lehmkuhl | ||
Attorney-in-fact |