users. Our ability to expand within our customer base has been demonstrated by our subscription net retention rate, which was 114% for the quarter ended December 31, 2020 and 116% for the quarter ended June 30, 2021.
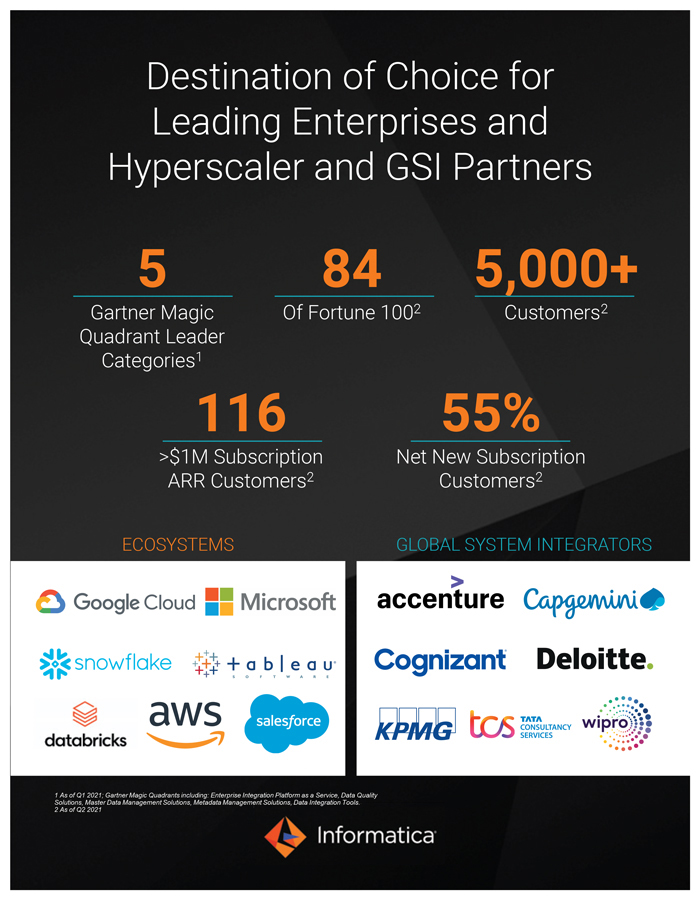
We are a strategic partner to our customers in their modernization and digital transformation initiatives, which we believe is reflected by the number of customers that spend more than $1 million in subscription ARR with us, which has increased from 27 to 66 to 104 to 116 as of December 31, 2018, 2019, 2020 and June 30, 2021, respectively. Customers matter to us. We have an overall customer rating of 4.5 out of 5 in the 2021 Gartner’s Peer Insights ‘Voice of Customer’: Data Integration Tools report.
We go to market through a combination of our global direct sales team and a network of strategic partners. Our strategic partners, including cloud hyperscalers, cloud data platforms, global system integrators and value-added resellers, help extend our sales presence and accelerate the adoption of our platform. We collaborate with cloud hyperscalers and cloud data platforms to help our shared customers accelerate their migration to the cloud and modernize their data and analytics strategies.
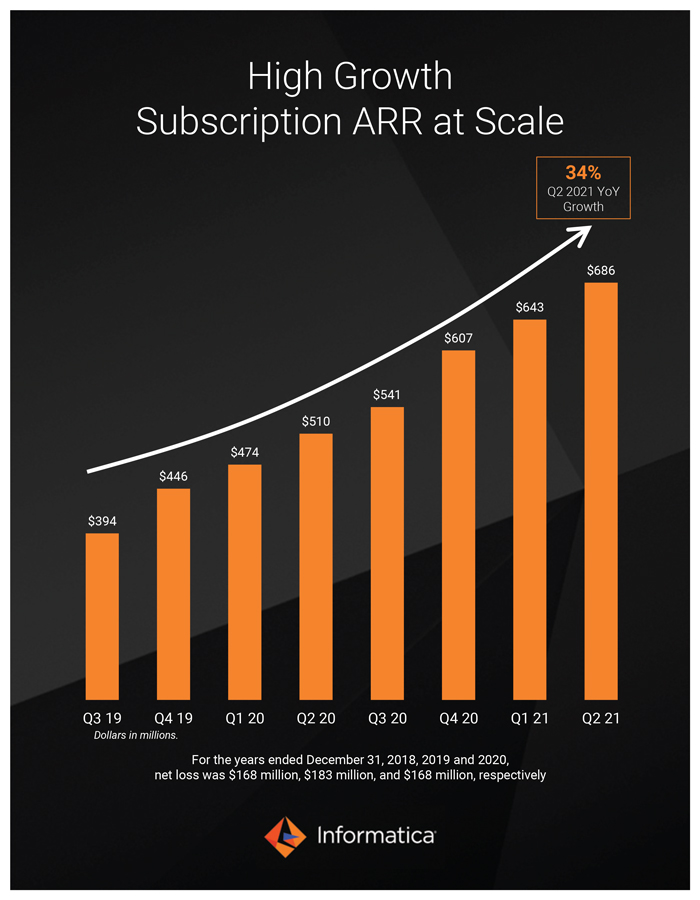
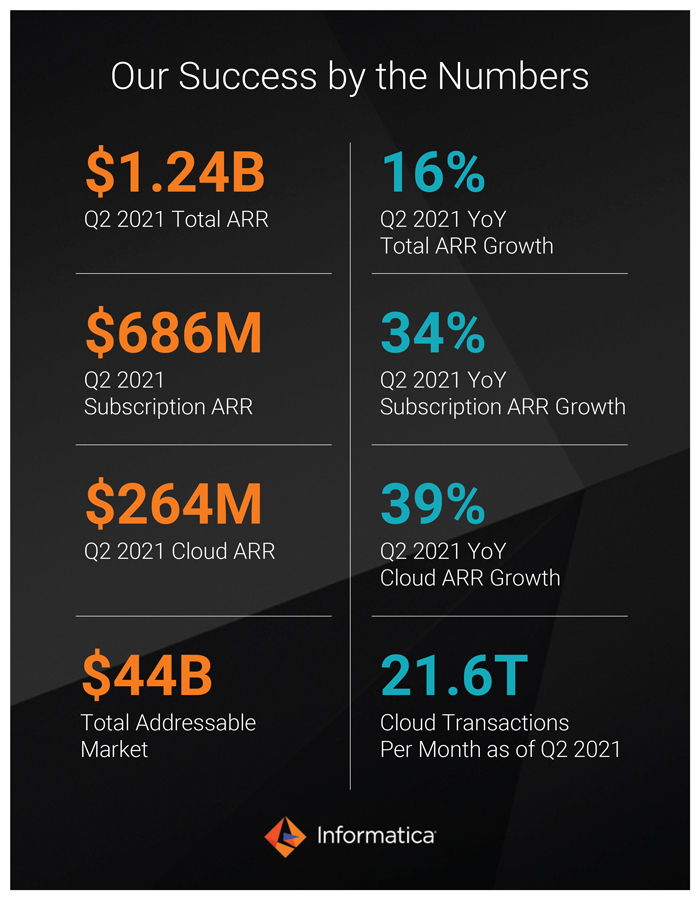
For the years ended December 31, 2018, 2019 and 2020, revenue was $1,228 million, $1,307 million, and $1,323 million, respectively, representing year-over-year growth of 6% and 1%. For the six months ended June 30, 2020 and 2021, revenue was $619 million and $676 million, respectively, representing year-over-year growth of 9%. Total ARR, which consists of subscription ARR plus maintenance ARR, was $906 million, $1,021 million and $1,160 million at December 31, 2018, 2019 and 2020, respectively, representing year-over-year growth of 13% at December 31, 2019 and 14% at December 31, 2020. Total ARR was $1,070 million and $1,240 million as of June 30, 2020 and 2021, respectively, representing year-over-year growth of 16% at June 30, 2021. Subscription ARR was $310 million, $446 million, $607 million, $510 million, and $686 million as of December 31, 2018, 2019 and 2020 and June 30, 2020 and 2021, respectively, representing year-over-year growth in subscription ARR of 44% at December 31, 2019, 36% at December 31, 2020, and 34% at June 30, 2021. Maintenance ARR was $596 million, $575 million, and $553 million, $560 million and $554 million as of December 31, 2018, 2019 and 2020 and June 30, 2020 and 2021, respectively.
For the years ended December 31, 2018, 2019 and 2020, net loss was $168 million, $183 million, and $168 million, respectively, and Adjusted EBITDA was $337 million, $335 million, and $400 million, respectively. For the six months ended June 30, 2020 and 2021, net loss was $103 million and $36 million, respectively, and Adjusted EBITDA was $168 million and $175 million, respectively. See the section titled “Management’s Discussion and Analysis of Financial Condition and Results of Operations—Non-GAAP Financial Measure” for a description of Adjusted EBITDA and a reconciliation of Adjusted EBITDA to net income (loss), the most directly comparable financial measure calculated in accordance with generally accepted accounting principles in the United States (GAAP).
Industry Overview: The Data-Driven Digital Enterprise
Challenges Facing Data-Driven Digital Enterprises
Businesses face a number of challenges in their drive to become data-driven digital enterprises. These include:
| | • | | Data volumes are exploding, which leads to massive complexity. The rise of cloud computing, low cost data storage and the proliferation of applications that generate and access data, combined with the increasing volume of data from mobile, social and IoT, creates opportunities to generate greater business insights and pursue new market opportunities, but is overwhelming for organizations to manage, aggregate and normalize. |