Press release dated February 13, 2025

Informatica Reports Fourth Quarter and Full-Year 2024 Financial Results
•Cloud Subscription Annual Recurring Revenue (ARR) in the fourth quarter and full-year 2024 increased 34% year-over-year to $827 million
•Total ARR in the fourth quarter and full-year 2024 increased 6% year-over-year to $1.73 billion
•GAAP Total Revenues in the full-year 2024 increased 3% year-over-year to $1.64 billion
•Guides to $1.0 billion in Cloud Subscription ARR for the full-year 2025
REDWOOD CITY, CA, February 13, 2025 - Informatica (NYSE: INFA), an enterprise cloud data management leader, today announced financial results for its fourth quarter and full-year 2024, ended December 31, 2024.
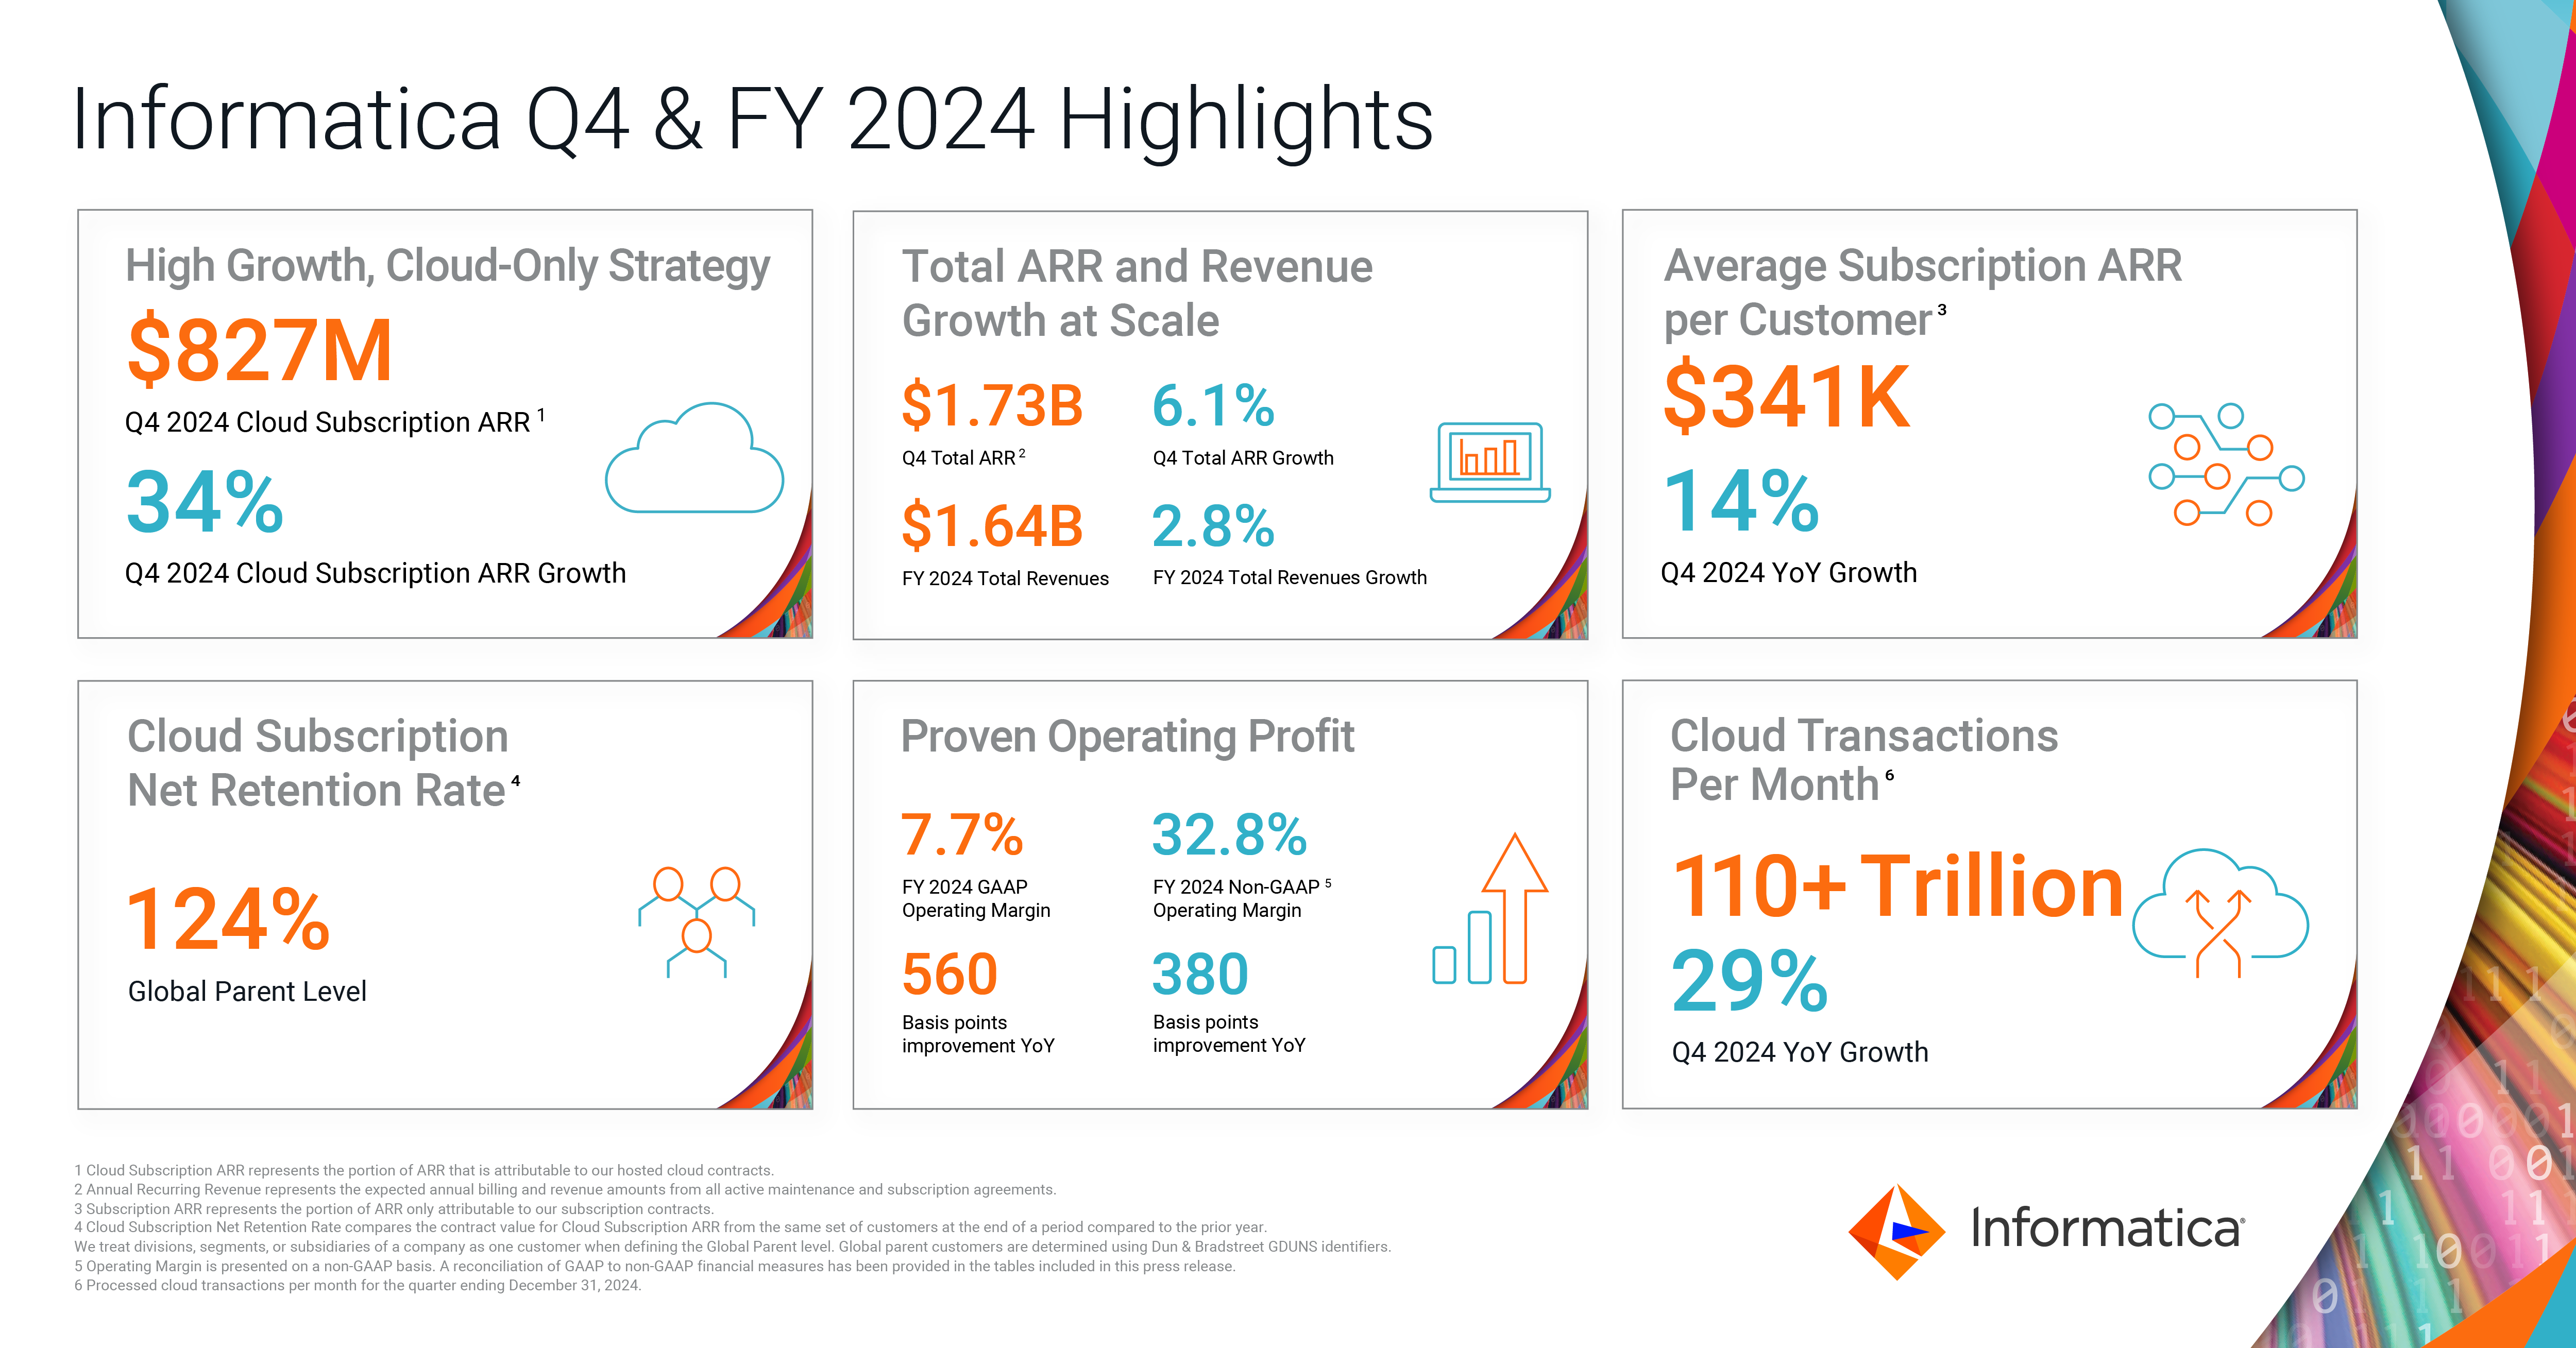
"The power of our cloud-only, consumption-driven strategy was evident throughout 2024, as highlighted by 34% growth in Cloud Subscription ARR, a Cloud Subscription Net Revenue Retention of 124% and 32.8% Non-GAAP Operating Margin,” said Amit Walia, Chief Executive Officer at Informatica. “Although we encountered unexpected headwinds in the fourth quarter, we're entering 2025 with strong fundamentals and clear line of sight to reaching $1 billion in Cloud Subscription ARR by the end of the year."
Fourth Quarter 2024 Financial Highlights:
•GAAP Total Revenues decreased 3.8% year-over-year to $428.3 million. Fourth quarter total revenues included a positive impact of approximately $1.3 million from foreign currency exchange rates (FX) year-over-year. Adjusted for FX, total revenues decreased 4.1% year-over-year. This result was below the midpoint of our guidance by $29.7 million, due primarily by four factors. First, the Company recognized lower upfront self-managed subscription license revenue due to lower renewal rates of self-managed subscriptions. Second, the lower average duration of those self-managed subscription renewals further reduced up-front recognized revenue. Both factors drove
lower revenue as the Company recognizes self-managed subscription license revenue upfront at a point-in-time in accordance with ASC 606 accounting standards. These two factors contributed to an approximately $46.0 million year-over-year reduction in upfront self-managed subscription license revenue recognition in the fourth quarter. Third, as a direct result of our strategy to shift more of our customers’ implementation and support work to our professional service partners, the Company observed a further decline in professional services. Fourth, due to the recent strengthening of the U.S. dollar, the Company experienced FX-related revenue headwinds compared to our forecast.
•GAAP Subscription Revenues decreased 2% year-over-year to $297.4 million. GAAP Cloud Subscription Revenue increased 33% year-over-year to $186.8 million and represented 63% of subscription revenues.
•Total ARR increased 6% year-over-year to $1.73 billion. Fourth quarter total ARR included a negative impact of approximately $2.0 million from FX year-over-year.
•Subscription ARR increased 13% year-over-year to $1.27 billion. Fourth quarter subscription ARR included a negative impact of approximately $1.5 million from FX year-over-year.
•Cloud Subscription ARR increased 34% year-over-year to $827.3 million. Fourth quarter cloud subscription ARR included a negative impact of approximately $0.7 million from FX year-over-year. This result was below the midpoint of our guidance by $8.7 million, due primarily by two factors. First, cloud renewal rates were lower than forecast. Second, net new bookings were lower than forecast due primarily to a higher-than-expected contribution to bookings from on-premises maintenance and self-managed migrations to the cloud.
•GAAP Operating Income was $63.4 million and Non-GAAP Operating Income was $162.3 million. GAAP Operating Margin increased 650 basis points to 14.8% and Non-GAAP Operating Margin increased 150 basis points to 37.9% compared to the prior year period.
•GAAP Operating Cash Flow of $146.9 million.
•Adjusted Unlevered Free Cash Flow (after-tax) of $180.9 million. Cash paid for interest of $32.5 million. This was higher than the midpoint of our guidance by $24 million.
Full-Year 2024 Financial Highlights:
•GAAP Total Revenues increased 2.8% year-over-year to $1.64 billion. Full-year total revenues included a positive impact of approximately $0.2 million from FX year-over-year. Adjusted for FX, total revenues increased 2.8% year-over-year.
•GAAP Subscription Revenues increased 9% year-over-year to $1.1 billion. GAAP Cloud Subscription Revenue increased 35% year-over-year to $675.5 million and represented 61% of subscription revenues.
•Total ARR increased 6% year-over-year to $1.73 billion. Full-year total ARR included a negative impact of approximately $3.8 million from FX year-over-year. This result was below the midpoint of our guidance by $19.0 million, primarily due to three factors. First, renewal rates were lower than forecast. Second, net new cloud bookings were lower than forecast, primarily due to a higher-than-expected contribution to bookings from on-premises maintenance and self-managed migrations to the cloud. Third, Maintenance and Self-Managed ARR that was terminated after completing a cloud migration was higher than forecast.
•Subscription ARR increased 13% year-over-year to $1.27 billion. Full-year subscription ARR included a negative impact of approximately $2.9 million from FX year-over-year.
•Cloud Subscription ARR increased 34% year-over-year to $827.3 million. Full-year cloud subscription ARR included a negative impact of approximately $1.9 million from FX year-over-year.
•GAAP Operating Income was $127.0 million and Non-GAAP Operating Income was $537.5 million. GAAP Operating Margin increased 560 basis points to 7.7% and Non-GAAP Operating Margin increased 380 basis points to 32.8% compared to the prior year period.
•GAAP Operating Cash Flow of $409.9 million.
•Adjusted Unlevered Free Cash Flow (after-tax) of $579.1 million. Cash paid for interest of $144.4 million.
The Company has included a new eight-quarter table in this press release titled “Disaggregation of Revenues” to help better understand the timing of the components of total revenue, including revenue recognized ratably over time and revenue recognized at a point in time per ASC 606 accounting standards.
A reconciliation of GAAP to non-GAAP financial measures has been provided in the tables included in this press release. An explanation of these measures is also included below under the heading “Non-GAAP Financial Measures.”
Fourth Quarter 2024 Business Highlights:
•Processed 110.7 trillion cloud transactions per month for the quarter ended December 31, 2024, as compared to 86.0 trillion cloud transactions per month in the same quarter last year, an increase of 29% year-over-year.
•Reported 284 customers that spend more than $1 million in subscription ARR at the end of December 31, 2024, an increase of 18% year-over-year.
•Reported 2,110 customers that spend more than $100,000 in subscription ARR at the end of December 31, 2024, an increase of 6% year-over-year.
•Achieved a Cloud Subscription Net Retention Rate (NRR) of 124% at the global parent level as of December 31, 2024.
•Reported 2,468 Cloud Subscription ARR customers at the end of December 31, 2024, an increase of 8% year-over-year.
Product Innovation:
•Announced the availability of GenAI blueprints for AWS, Databricks, Google Cloud, Microsoft Azure, Oracle Cloud and Snowflake ecosystems. These blueprints include standard reference architectures, prebuilt, ecosystem-specific “recipes” and GenAI model-as-a-service and vector database connectors to minimize GenAI development complexity and accelerate implementation.
•Expanded partnership with Databricks: announced support for Databricks AI functions in Informatica’s Native SQL ELT, enabling customers to use GenAI capabilities, including sentiment analysis, similarity matching, and translation from SQL with 50+ out-of-the-box transformations and support for 250+ native Databricks SQL functions.
•Expanded partnership with Google Cloud: announced the general availability of Informatica’s Cloud Data Governance and Catalog on Google Cloud and Google Cloud marketplace in North America, EMEA and Saudi Arabia markets.
•Announced the expansion of CLAIRE® GPT, Informatica’s enterprise GenAI powered data management assistant, to Europe, Asia Pacific and Canada, following the launch in North America.
Industry Recognition:
•Recognized as a Leader in the 2025 Gartner® Magic Quadrant™ for Data and Analytics (D&A) Governance Platforms report. Informatica is positioned furthest on the Completeness of Vision axis and highest on the Ability to Execute axis.
•Recognized as a Leader in the 2024 Gartner® Magic Quadrant™ for Data Integration Tools report. This marks our 19th consecutive time of being named a Leader, where Informatica is once again positioned furthest on the Completeness of Vision axis and highest on the Ability to Execute axis.
•Achieved the Highest Rating for Products and Technology categories in the 2024 Gartner® Vendor Rating.
•Recognized as a Leader in the IDC MarketScape: Worldwide Data Intelligence Platform Software 2024 Vendor Assessment.
•Recognized as a Leader in the IDC MarketScape: Worldwide Product Information Management Applications for Commerce 2024–2025 Vendor Assessment.
•Recognized as a Champion in Bloor Research Data Governance 2024 Market Update.
•Achieved the Highest Ranking in the 2024 Information Services Group (ISG) DataOps Buyers Guide.
•Recognized as a Leader in the 2024 Information Services Group (ISG) Data Products Buyers Guide.
Secondary Offering:
•In November 2024, Permira and Canada Pension Plan Investment Board completed an underwritten secondary offering of 16 million shares of Informatica Class A common stock. Informatica did not receive any proceeds from the sale.
Share Repurchase:
•During the fourth quarter, the Company spent $103.2 million to repurchase 3.8 million shares of its Class A common stock at an average price of $26.66 through open market purchases. From January 1, 2025, through February 12, 2025, the Company spent $27.1 million to repurchase 1.1 million shares of its Class A common stock at an average price of $25.36 through open market purchases. In total, the Company reduced its total outstanding share count as of February 12, 2025, by 1.6% as a result of these repurchases.
•On February 10, 2025, the Company’s Board of Directors approved an additional $400.0 million stock repurchase authorization. This brings the total stock repurchase authorization to $800.0 million. The Company has $669.8 million available under its $800.0 million stock repurchase program.
•The Company expects to repurchase approximately $100 million of its Class A common stock in the first quarter 2025 through open market purchases. The actual amount repurchased will depend on a variety of factors, including stock price, trading volume, and general business and market conditions. A committee of the Board will determine the timing, amount and terms of any repurchase.
Upcoming Events:
•On February 26, 2025, the Company is scheduled to host investor meetings at the Wolfe Research Technology, Media & Telecom Conference.
•On February 27, 2025, the Company is scheduled to host investor meetings at the Susquehanna 14th Annual Technology Conference.
•On March 3, 2025, the Company is scheduled to participate in a fireside chat discussion at the Morgan Stanley Technology, Media & Telecom Conference at 3:20 p.m. Pacific Time. A live webcast and replay will be available on the Company's Investor Relations website.
•On March 11, 2025, the Company is scheduled to participate in a fireside chat discussion at the Cantor Fitzgerald Global Technology Conference at 1:40 p.m. Eastern Time. A live webcast and replay will be available on the Company's Investor Relations website.
First Quarter and Full-Year 2025 Financial Outlook
The Company provides the financial guidance below based on current market conditions and expectations and it is subject to various important cautionary factors described below. Guidance includes the impact from expected foreign exchange headwinds versus the prior year comparable periods.
Based on information available as of February 13, 2025, guidance for the first quarter 2025 is as follows:
First Quarter 2025 Ending March 31, 2025:
•GAAP Total Revenues are expected to be in the range of $380 million to $400 million, representing approximately 0.4% year-over-year growth at the midpoint of the range or approximately 2.1% year-over-year growth on a constant currency basis.
•Total ARR is expected to be in the range of $1.673 billion to $1.697 billion, representing approximately 3.0% year-over-year growth at the midpoint of the range or approximately 3.0% year-over-year growth on a constant currency basis.
•Cloud Subscription ARR is expected to be in the range of $840 million to $852 million, representing approximately 29.6% year-over-year growth at the midpoint of the range or approximately 29.7% year-over-year growth on a constant currency basis.
•Non-GAAP Operating Income is expected to be in the range of $98 million to $112 million, representing approximately -3.9% year-over-year decrease at the midpoint of the range.
Based on information available as of February 13, 2025, guidance for the full-year 2025 is as follows:
Full-Year 2025 Ending December 31, 2025:
•GAAP Total Revenues are expected to be in the range of $1.670 billion to $1.720 billion, representing approximately 3.4% year-over-year growth at the midpoint of the range or approximately 4.6% year-over-year growth on a constant currency basis.
•Total ARR is expected to be in the range of $1.755 billion to $1.795 billion, representing approximately 2.9% year-over-year growth at the midpoint of the range or approximately 3.2% year-over-year growth on a constant currency basis.
•Cloud Subscription ARR is expected to be in the range of $1.019 billion to $1.051 billion, representing approximately 25.1% year-over-year growth at the midpoint of the range or approximately 25.3% year-over-year growth on a constant currency basis.
•Non-GAAP Operating Income is expected to be in the range of $546.0 million to $566.0 million, representing approximately 3.5% year-over-year growth at the midpoint of the range.
•Adjusted Unlevered Free Cash Flow (after-tax) is expected to be in the range of $540.0 million to $580.0 million, representing approximately -3.3% year-over-year decrease at the midpoint of the range.
The Company’s forecast is based upon market-based forward FX rates as of the date of the forecast. On a constant currency basis using FX rates experienced in 2024, the FX impact to fiscal 2025 guidance of expected forward FX rates is as follows:
| Q1 2025 | Full-Year 2025 | ||||||||||
| Total Revenues | ~$6.7m negative impact y/y | ~$20.0m negative impact y/y | |||||||||
| Total ARR | ~$1.3m negative impact y/y | ~$5.0m negative impact y/y | |||||||||
| Cloud Subscription ARR | ~$0.6m negative impact y/y | ~$2.0m negative impact y/y | |||||||||
In addition to the above guidance, the Company is also providing first quarter and full-year 2025 cash paid for interest estimates for modeling purposes. For the first quarter 2025, we estimate cash paid for interest to be approximately $30 million. For the full-year 2025, we estimate cash paid for interest to be approximately $118 million, using forward rates based on 1-month SOFR and a credit spread of 225 basis points.
In addition to the above guidance, the Company is also providing a first quarter and full-year 2025 weighted-average number of basic and diluted share estimates for modeling purposes. For the first quarter 2025, we expect basic weighted-average shares outstanding to be approximately 304.4 million shares and diluted weighted-average shares outstanding to be approximately 312.0 million shares. For the full-year 2025, we expect basic weighted-average shares outstanding to be approximately 308.6 million shares and diluted weighted-average shares outstanding to be approximately 316.4 million shares. These share count forecasts do not include the impact of any share buybacks the Company may pursue in the future.
Reconciliation of Non-GAAP Operating Income and Adjusted Unlevered Free Cash Flow after-tax guidance to the most directly comparable GAAP measures is not available without unreasonable effort, as certain items cannot be reasonably predicted because of their high variability, complexity, and low visibility. In particular, the measures and effects of our stock-based compensation expense specific to our equity compensation awards and employer payroll tax-related items on employee stock transactions are directly impacted by the timing of employee stock transactions and unpredictable fluctuations in our stock price, which we expect to have a significant impact on our future GAAP financial results.
Webcast and Conference Call
A conference call to discuss Informatica’s fourth quarter and full-year 2024 financial results and financial outlook for the first quarter and full-year 2025 is scheduled for 2:00 p.m. Pacific Time today. To participate, please dial 1-833-470-1428 from the U.S. or 1-404-975-4839 from international locations. The conference passcode is 968255. A live webcast of the conference call will be available
on the Investor Relations section of Informatica’s website at investors.informatica.com where presentation materials will also be posted prior to the conference call. A replay will be available online approximately two hours following the live call for a period of 30 days.
Forward-Looking Statements
This press release and the related conference call and webcast contain forward-looking statements within the meaning of Section 27A of the Securities Act of 1933, as amended, and Section 21E of the Securities Exchange Act of 1934, as amended. These statements may relate to, but are not limited to, expectations of future operating results or financial performance, including our GAAP and non-GAAP guidance for the first quarter and 2025 fiscal year, the effect of foreign currency exchange rates, the effect of macroeconomic conditions, management’s plans, priorities, initiatives, and strategies, our efforts to reduce operating expenses and adjust cash flows in light of current business needs and priorities, our expected costs related to restructuring and related charges, including the timing of such charges, the impact of the restructuring and related charges on our business, results of operations and financial condition, plans regarding the distribution of Class A common stock by certain of our stockholders, plans regarding our stock repurchase authorization, management's estimates and expectations regarding growth of our business, the potential benefits realized by customers by the use of artificial intelligence and machine learning in our products and the potential benefits realized by customers from our cloud modernization programs, market, and partnerships. Forward-looking statements are inherently subject to risks and uncertainties, some of which cannot be predicted or quantified. In some cases, you can identify forward-looking statements because they contain words such as “anticipate,” “believe,” “contemplate,” “continue,” “could,” “estimate,” “expect,” “intend,” “may,” “plan,” “potential,” “predict,” “project,” “should,” “target,” “toward,” “will,” or “would,” or the negative of these words or other similar terms or expressions. You should not put undue reliance on any forward-looking statements. Forward-looking statements should not be read as a guarantee of future performance or results and will not necessarily be accurate indications of the times at, or by, which such performance or results will be achieved, if at all.
Forward-looking statements are based on information available at the time those statements are made and are based on current expectations, estimates, forecasts, and projections as well as the beliefs and assumptions of management as of that time with respect to future events. These statements are subject to risks and uncertainties, many of which involve factors or circumstances that are beyond our control, that could cause actual performance or results to differ materially from those expressed in or suggested by the forward-looking statements. In light of these risks and uncertainties, the forward-looking events and circumstances discussed in this press release and the related conference call and webcast may not occur and actual results could differ materially from those anticipated or implied in the forward-looking statements. These risks, uncertainties, assumptions, and other factors include, but are not limited to, those related to our business and financial performance, the effects of adverse global macroeconomic conditions and geopolitical uncertainty, our ability to attract and retain customers, our ability to develop new products and services and enhance existing products and services, our ability to respond rapidly to emerging technology trends, our ability to execute on our business strategy, including our strategy related to the Informatica IDMC platform and key partnerships, our ability to increase and predict customer consumption of our platform, our ability to compete effectively, and our ability to manage growth.
Further information on these and additional risks, uncertainties, and other factors that could cause actual outcomes and results to differ materially from those included in or contemplated by the forward-looking statements contained in this press release and the related conference call and webcast are included under the caption “Risk Factors” and elsewhere in our Annual Report on Form 10-K that was filed for the fiscal year ended December 31, 2023, and other filings and reports we make with the Securities and Exchange Commission from time to time, including our Annual Report on Form 10-K that will be filed for the fiscal year ended December 31, 2024. All forward-looking statements contained herein are based on information available to us as of the date hereof and we do not assume any obligation to update these statements as a result of new information or future events.
Non-GAAP Financial Measures and Key Business Metrics
We review several operating and financial metrics, including the following unaudited non-GAAP financial measures and key business metrics to evaluate our business, measure our performance, identify trends affecting our business, formulate business plans, and make strategic decisions:
Non-GAAP Financial Measures
In addition to our results determined in accordance with U.S. generally accepted accounting principles (GAAP), we believe the following non-GAAP measures are useful in evaluating our operating performance. We use the following non-GAAP financial measures to evaluate our ongoing operations and for internal planning and forecasting purposes. We believe that these non-GAAP financial measures, when taken collectively, may be helpful to investors because they provide consistency and comparability with past financial performance. However, non-GAAP financial measures are presented for supplemental informational purposes only, have limitations as an analytical tool, and should not be considered in isolation or as a substitute for financial information presented in accordance with GAAP. In addition, other companies, including companies in our industry, may calculate similarly titled non-GAAP measures differently or may use other measures to evaluate their performance, all of which could reduce the usefulness of our non-GAAP financial measures as tools for comparison. A reconciliation is provided below for our non-GAAP financial measures to the most directly comparable financial measures stated in accordance with GAAP. Investors are encouraged to review the related GAAP financial measures and the reconciliation of these non-GAAP financial measures to their most directly comparable GAAP financial measures, and not to rely on any single financial measure to evaluate our business. Starting the second quarter of fiscal year 2024, we adjusted certain of our non-GAAP metrics for employer payroll tax expense related to equity incentive plans, as the amount of employer payroll tax expense is dependent on our stock price and other factors that are beyond our control and does not correlate to the operation of our business. The stock-based compensation related employer tax-related expense for comparative periods were immaterial and are not reflected in the prior period balances.
Non-GAAP Income from Operations and Operating Margin and Non-GAAP Net Income exclude the effect of stock-based compensation expense-related charges, including employer payroll tax-related items on employee stock transactions starting Q2 2024, amortization of acquired intangibles, expenses associated with acquisitions, debt refinancing costs, sponsor-related costs and expenses associated with restructuring efforts, and are adjusted for income tax effects. We believe the presentation of operating results that exclude these non-cash or non-recurring items provides useful supplemental information to investors and facilitates the analysis of our operating results and comparison of operating results across reporting periods.
Adjusted EBITDA represents GAAP net income (loss) as adjusted for income tax benefit (expense), interest income, interest expense, debt refinancing costs, other income (expense) net, stock-based compensation-related charges, including employer payroll tax-related items on employee stock transactions starting Q2 2024, amortization of intangibles, expenses associated with restructuring efforts, expenses associated with acquisitions, sponsor-related costs and depreciation. We believe adjusted EBITDA is an important metric for understanding our business to assess our relative profitability adjusted for balance sheet debt levels.
Adjusted Unlevered Free Cash Flow (after-tax) represents operating cash flow less purchases of property and equipment and is adjusted for interest payments, equity compensation payments, sponsor-related costs, expenses associated with acquisitions and restructuring costs (including payments for impaired leases). We believe this measure provides useful supplemental information to investors because it is an indicator of our liquidity over the long term needed to maintain and grow our core business operations. We also provide actual and forecast cash interest expense to aid in the calculation of adjusted free cash flow (after-tax).
Key Business Metrics
Annual Recurring Revenue ("ARR") represents the expected annual billing amounts from all active maintenance and subscription agreements. ARR is calculated based on the contract Monthly Recurring Revenue (MRR) multiplied by 12. MRR is calculated based on the accounting adjusted total contract value divided by the number of months of the agreement based on the start and end dates of each contracted line item. The aggregate ARR calculated at the end of each reported period represents the value of all contracts that are active as of the end of the period, including those contracts that have expired but are still under negotiation for renewal. We typically allow for a grace period of up to 6 months past the original contract expiration quarter during which we engage in the renewal process before we report the contract as lost/inactive. This grace-period ARR amount has been less than 2% of the reported ARR in each period presented. If there is an actual cancellation of an ARR contract, we remove that ARR value at that time. We believe ARR is an important metric for understanding our business since it tracks the annualized cash value collected over a 12-month period for all of our recurring contracts, irrespective of whether it is a maintenance contract on a perpetual license, a ratable cloud contract, or a self-managed term-based subscription license. ARR should be viewed independently of total revenue and deferred revenue related to our software and services contracts and is not intended to be combined with or to replace either of those items.
Cloud Subscription Annual Recurring Revenue ("Cloud Subscription ARR") represents the portion of ARR that is attributable to our hosted cloud contracts. We believe that Cloud Subscription ARR is a helpful metric for understanding our business since it represents the approximate annualized cash value collected over a 12-month period for all of our recurring Cloud contracts. Cloud Subscription ARR is a subset of our overall Subscription ARR, and by providing this breakdown of Cloud Subscription ARR, it provides visibility on the size and growth rate of our Cloud Subscription ARR within our overall Subscription ARR. Cloud Subscription ARR should be viewed independently of subscription revenue and deferred revenue related to our subscription contracts and is not intended to be combined with or to replace either of those items.
Subscription Annual Recurring Revenue ("Subscription ARR") represents the portion of ARR only attributable to our subscription contracts. Subscription ARR includes Cloud Subscription ARR and self-managed Subscription Annual Recurring Revenue. We believe that Subscription ARR is a helpful metric for understanding our business since it represents the approximate annualized cash value collected over a 12-month period for all of our recurring subscription contracts. Subscription ARR excludes maintenance contracts on our perpetual licenses. Subscription ARR should be viewed independently of subscription revenue and deferred revenue related to our subscription contracts and is not intended to be combined with or to replace either of those items.
Maintenance Annual Recurring Revenue ("Maintenance ARR") represents the portion of ARR only attributable to our maintenance contracts. We believe that Maintenance ARR is a helpful metric for understanding our business since it represents the approximate annualized cash value collected over a 12-month period for all our maintenance contracts. Maintenance ARR includes maintenance contracts supporting our perpetual licenses. Maintenance ARR should be viewed independently of maintenance revenue and deferred revenue related to our maintenance contracts and is not intended to be combined with or to replace either of those items. As we continue to shift our focus from perpetual to cloud, we expect Maintenance ARR will decrease in future quarters.
Cloud Subscription Net Retention Rate ("Cloud Subscription NRR") compares the contract value for Cloud Subscription ARR from the same set of customers at the end of a period compared to the prior year. We treat divisions, segments or subsidiaries inside companies as separate customers when defining the End-user level. We treat divisions, segments, or subsidiaries of a company as one customer when defining the Global Parent level. Global Parent customers are determined using Dun & Bradstreet GDUNS identifiers. To calculate our Cloud Subscription NRR for a particular period, we first establish the Cloud Subscription ARR value at the end of the prior year period. We subsequently measure the Cloud Subscription ARR value at the end of the current period from the same cohort of customers. Cloud Subscription NRR is then calculated by dividing the aggregate Cloud Subscription ARR in the current period by the prior year period. An increase in the Cloud Subscription NRR occurs as a result of price increases on existing contracts, higher consumption of existing products, and sales of additional new subscription products to existing customers exceeding losses from subscription
contracts due to price decreases, usage decreases and cancellations. We believe Cloud Subscription NRR is an important metric for understanding our business since it measures the rate at which we are able to sell additional products into our cloud subscription customer base.
Subscription Net Retention Rate ("Subscription NRR") compares the contract value for Subscription ARR from the same set of customers at the end of a period compared to the prior year. We treat divisions, segments, or subsidiaries inside companies as separate customers when defining the End-user level. To calculate our Subscription NRR for a particular period, we first establish the Subscription ARR value at the end of the prior-year period. We subsequently measure the Subscription ARR value at the end of the current period from the same cohort of customers. The net retention rate is then calculated by dividing the aggregate Subscription ARR in the current period by the prior-year period. An increase in the Subscription NRR occurs as a result of price increases on existing contracts, higher consumption of existing products, and sales of additional new subscription products to existing customers exceeding losses from subscription contracts due to price decreases, usage decreases and cancellations. Our Cloud Subscription NRR continues to outpace total Subscription NRR as self-managed subscription customers are moving to cloud offerings which is net neutral to Subscription NRR but will be additive to Cloud Subscription NRR for the same cohort of customers.
Revenue Disaggregation
Revenue recognized over time:
•Cloud subscription revenue(i) represents revenues from cloud subscription offerings, which deliver applications and infrastructure technologies via cloud-based deployment models for which we develop functionality, provide unspecified updates and enhancements, host, manage, upgrade, and support, and that customers access by entering into a subscription agreement with us for a stated period.
•Self-managed subscription support and other revenue(i) represents revenues generated primarily through the sale of license support contracts sold together with the self-managed subscription license purchased by the customer. Self-managed subscription license support contracts provide customers with rights to unspecified software product upgrades, maintenance releases and patches released during the term of the support period and include internet access to technical content, as well as internet and telephone access to technical support personnel.
•Maintenance revenue(ii) represents revenues from fees for ongoing support and product updates mainly for our previously sold perpetual licenses.
Revenue recognized at a point in time:
•Self-managed subscription license revenue(i)(iii) represents revenues from customers and partners for the license rights to our on-premise self-managed software during a subscription term. When customers enter into a new subscription contract or renew an existing contract, this revenue is recognized upon the later of when the software license is made available to the customer or the subscription term commences.
Revenue recognized as services are provided:
•Professional services revenue(ii) represents revenues from non-recurring fees associated with implementation, education, and consulting services related to our software products.
(i) Included in Subscription revenue on the consolidated statements of operations.
(ii) Included in Maintenance and Professional services revenue on the consolidated statements of operations.
(iii) The Company previously presented Perpetual license revenues separately. Because revenues for perpetual licenses are not material for current or past periods due to our transition to a cloud-only, consumption-driven strategy, the Company has combined these amounts into Self-managed subscription license recognized at a point in time and retrospectively adjusted past periods for comparative purposes.
Gartner Disclaimer: Gartner does not endorse any vendor, product or service depicted in its research publications, and does not advise technology users to select only those vendors with the highest ratings or other designation. Gartner research publications consist of the opinions of Gartner’s
research organization and should not be construed as statements of fact. Gartner disclaims all warranties, expressed or implied, with respect to this research, including any warranties of merchantability or fitness for a particular purpose. Gartner and Magic Quadrant are a registered trademark of Gartner, Inc. and/or its affiliates in the U.S. and internationally and are used herein with permission. All rights reserved.
About Informatica
Informatica (NYSE: INFA), a leader in enterprise AI-powered cloud data management, brings data and AI to life by empowering businesses to realize the transformative power of their most critical assets. We have created a new category of software, the Informatica Intelligent Data Management Cloud™ (IDMC). IDMC is an end-to-end data management platform, powered by CLAIRE AI, that connects, manages and unifies data across any multi-cloud or hybrid system, democratizing data and enabling enterprises to modernize and advance their business strategies. Customers in approximately 100 countries, including more than 80 of the Fortune 100, rely on Informatica to drive data-led digital transformation. Informatica. Where data and AI come to life.
Contacts:
Investor Relations:
Victoria Hyde-Dunn
vhydedunn@informatica.com
Public Relations:
prteam@informatica.com
INFORMATICA INC.
CONSOLIDATED STATEMENTS OF OPERATIONS
(in thousands, except per share data)
(Unaudited)
| Three Months Ended December 31, | Twelve Months Ended December 31, | ||||||||||||||||||||||
| 2024 | 2023 | 2024 | 2023 | ||||||||||||||||||||
| Revenues: | |||||||||||||||||||||||
| Subscription revenue | $ | 297,449 | $ | 302,428 | $ | 1,101,687 | $ | 1,006,791 | |||||||||||||||
| Maintenance and professional services | 130,856 | 142,750 | 538,331 | 588,369 | |||||||||||||||||||
| Total revenues | 428,305 | 445,178 | 1,640,018 | 1,595,160 | |||||||||||||||||||
| Cost of revenues: | |||||||||||||||||||||||
| Subscription costs | 50,677 | 44,018 | 193,655 | 158,016 | |||||||||||||||||||
| Maintenance and professional services | 28,369 | 39,957 | 128,642 | 168,513 | |||||||||||||||||||
| Amortization of acquired technology | 888 | 2,990 | 3,896 | 11,766 | |||||||||||||||||||
| Total cost of revenues | 79,934 | 86,965 | 326,193 | 338,295 | |||||||||||||||||||
| Gross profit | 348,371 | 358,213 | 1,313,825 | 1,256,865 | |||||||||||||||||||
| Operating expenses: | |||||||||||||||||||||||
| Research and development | 75,953 | 79,464 | 315,157 | 335,072 | |||||||||||||||||||
| Sales and marketing | 133,707 | 135,218 | 552,110 | 528,253 | |||||||||||||||||||
| General and administrative | 41,041 | 40,681 | 185,156 | 162,708 | |||||||||||||||||||
| Amortization of intangible assets | 28,547 | 34,394 | 121,849 | 137,514 | |||||||||||||||||||
| Restructuring | 5,697 | 31,624 | 12,505 | 59,755 | |||||||||||||||||||
| Total operating expenses | 284,945 | 321,381 | 1,186,777 | 1,223,302 | |||||||||||||||||||
| Income from operations | 63,426 | 36,832 | 127,048 | 33,563 | |||||||||||||||||||
| Interest income | 14,436 | 11,736 | 56,437 | 39,686 | |||||||||||||||||||
| Interest expense | (32,289) | (39,552) | (146,064) | (151,396) | |||||||||||||||||||
| Other income (expense), net | 22,569 | (7,705) | 15,744 | 975 | |||||||||||||||||||
| Income (loss) before income taxes | 68,142 | 1,311 | 53,165 | (77,172) | |||||||||||||||||||
| Income tax expense (benefit) | 58,388 | (62,950) | 43,234 | 48,111 | |||||||||||||||||||
| Net income (loss) | $ | 9,754 | $ | 64,261 | $ | 9,931 | $ | (125,283) | |||||||||||||||
| Net income (loss) per share attributable to Class A and Class B-1 common stockholders - basic | $ | 0.03 | $ | 0.22 | $ | 0.03 | $ | (0.43) | |||||||||||||||
| Net income (loss) per share attributable to Class A and Class B-1 common stockholders - diluted | $ | 0.03 | $ | 0.21 | $ | 0.03 | $ | (0.43) | |||||||||||||||
Weighted-average shares used in computing net income (loss) per share - basic | 305,268 | 292,851 | 301,778 | 288,581 | |||||||||||||||||||
Weighted-average shares used in computing net income (loss) per share - diluted | 313,851 | 304,826 | 313,491 | 288,581 | |||||||||||||||||||
INFORMATICA INC.
CONSOLIDATED BALANCE SHEETS
(in thousands, except par value data)
(Unaudited)
| December 31, | December 31, | ||||||||||
| 2024 | 2023 | ||||||||||
| Assets | |||||||||||
| Current assets: | |||||||||||
| Cash and cash equivalents | $ | 912,460 | $ | 732,443 | |||||||
| Short-term investments | 319,951 | 259,828 | |||||||||
| Accounts receivable, net of allowances of $6,618 and $4,414, respectively | 509,826 | 500,068 | |||||||||
| Contract assets, net | 60,343 | 79,864 | |||||||||
| Prepaid expenses and other current assets | 184,939 | 180,383 | |||||||||
| Total current assets | 1,987,519 | 1,752,586 | |||||||||
| Property and equipment, net | 138,999 | 149,266 | |||||||||
| Operating lease right-of-use-assets | 48,438 | 57,799 | |||||||||
| Goodwill | 2,326,831 | 2,361,643 | |||||||||
| Customer relationships intangible asset, net | 550,404 | 669,781 | |||||||||
| Other intangible assets, net | 5,681 | 17,393 | |||||||||
| Deferred tax assets | 18,267 | 15,237 | |||||||||
| Other assets | 203,393 | 178,377 | |||||||||
| Total assets | $ | 5,279,532 | $ | 5,202,082 | |||||||
| Liabilities and Stockholders’ Equity | |||||||||||
| Current liabilities: | |||||||||||
| Accounts payable | $ | 27,155 | $ | 18,050 | |||||||
| Accrued liabilities | 57,696 | 61,194 | |||||||||
| Accrued compensation and related expenses | 148,248 | 167,427 | |||||||||
| Current operating lease liabilities | 13,686 | 16,411 | |||||||||
| Current portion of long-term debt | 18,750 | 18,750 | |||||||||
| Income taxes payable | 5,815 | 4,305 | |||||||||
| Deferred revenue | 819,367 | 767,244 | |||||||||
| Total current liabilities | 1,090,717 | 1,053,381 | |||||||||
| Long-term operating lease liabilities | 37,771 | 46,003 | |||||||||
| Long-term deferred revenue | 13,910 | 19,482 | |||||||||
| Long-term debt, net | 1,790,401 | 1,805,960 | |||||||||
| Deferred tax liabilities | 7,828 | 22,425 | |||||||||
| Long-term income taxes payable | 24,276 | 37,679 | |||||||||
| Other liabilities | 7,315 | 4,554 | |||||||||
| Total liabilities | 2,972,218 | 2,989,484 | |||||||||
| Stockholders’ equity: | |||||||||||
| Class A common stock; $0.01 par value per share; 2,000,000 and 2,000,000 shares authorized as of December 31, 2024 and December 31, 2023, respectively; Total of 259,485 and 250,874 shares issued and outstanding as of December 31, 2024 and December 31, 2023, respectively | 2,596 | 2,510 | |||||||||
Class B-1 common stock; $0.01 par value per share; 200,000 and 200,000 shares authorized as of December 31, 2024 and December 31, 2023, respectively ; Total of 44,050 shares issued and outstanding as of December 31, 2024 and December 31, 2023, respectively | 440 | 440 | |||||||||
Class B-2 common stock; $0.00001 par value per share, 200,000 and 200,000 shares authorized as of December 31, 2024 and December 31, 2023, respectively ; Total of 44,050 shares issued and outstanding as of December 31, 2024 and December 31, 2023, respectively | — | — | |||||||||
| Additional paid-in-capital | 3,670,371 | 3,540,502 | |||||||||
| Accumulated other comprehensive loss | (67,383) | (22,370) | |||||||||
| Accumulated deficit | (1,298,710) | (1,308,484) | |||||||||
| Total stockholders’ equity | 2,307,314 | 2,212,598 | |||||||||
| Total liabilities and stockholders’ equity | $ | 5,279,532 | $ | 5,202,082 | |||||||
INFORMATICA INC.
CONSOLIDATED STATEMENTS OF CASH FLOWS
(in thousands)
(unaudited)
| Three Months Ended December 31, | Twelve Months Ended December 31, | |||||||||||||||||||||||||
| 2024 | 2023 | 2024 | 2023 | |||||||||||||||||||||||
| Operating activities: | ||||||||||||||||||||||||||
| Net income (loss) | $ | 9,754 | $ | 64,261 | $ | 9,931 | $ | (125,283) | ||||||||||||||||||
| Adjustments to reconcile net income (loss) to net cash provided by operating activities: | ||||||||||||||||||||||||||
| Depreciation and amortization | 3,567 | 4,839 | 13,544 | 17,513 | ||||||||||||||||||||||
| Non-cash operating lease costs | 3,615 | 3,525 | 14,542 | 16,325 | ||||||||||||||||||||||
| Stock-based compensation | 61,688 | 56,041 | 257,288 | 218,099 | ||||||||||||||||||||||
| Deferred income taxes | (17,770) | (3,365) | (17,603) | 991 | ||||||||||||||||||||||
| Amortization of intangible assets and acquired technology | 29,435 | 37,384 | 125,745 | 149,280 | ||||||||||||||||||||||
| Amortization of debt issuance costs | 956 | 883 | 3,679 | 3,457 | ||||||||||||||||||||||
| Amortization of investment discount, net of premium | (982) | (1,446) | (5,052) | (4,422) | ||||||||||||||||||||||
| Debt refinancing costs | — | — | 1,366 | — | ||||||||||||||||||||||
| Changes in operating assets and liabilities: | ||||||||||||||||||||||||||
| Accounts receivable | (238,027) | (220,851) | (19,460) | (38,301) | ||||||||||||||||||||||
| Prepaid expenses and other assets | (1,136) | (24,003) | 7,337 | 1,891 | ||||||||||||||||||||||
| Accounts payable and accrued liabilities | 63,972 | 87,309 | (31,511) | (20,758) | ||||||||||||||||||||||
| Income taxes payable | 50,109 | (67,792) | (7,800) | (35,218) | ||||||||||||||||||||||
| Deferred revenue | 181,677 | 164,257 | 57,844 | 82,773 | ||||||||||||||||||||||
| Net cash provided by operating activities | 146,858 | 101,042 | 409,850 | 266,347 | ||||||||||||||||||||||
| Investing activities: | ||||||||||||||||||||||||||
| Purchases of property and equipment | (1,607) | (1,624) | (3,944) | (6,543) | ||||||||||||||||||||||
| Purchases of investments | (129,943) | (73,400) | (523,876) | (328,473) | ||||||||||||||||||||||
| Maturities of investments | 104,800 | 72,100 | 455,232 | 252,107 | ||||||||||||||||||||||
| Sales of investments | — | — | — | 39,510 | ||||||||||||||||||||||
| Business acquisitions, net of cash acquired | — | — | — | (12,476) | ||||||||||||||||||||||
| Other | — | — | 1,878 | — | ||||||||||||||||||||||
| Net cash used in investing activities | (26,750) | (2,924) | (70,710) | (55,875) | ||||||||||||||||||||||
| Financing activities: | ||||||||||||||||||||||||||
| Payment of debt | (4,686) | (4,688) | (20,721) | (18,752) | ||||||||||||||||||||||
| Payment of debt refinancing costs | — | — | (1,349) | — | ||||||||||||||||||||||
| Proceeds from issuance of debt | — | — | 1,971 | — | ||||||||||||||||||||||
| Proceeds from issuance of common stock under employee stock purchase plan | — | — | 25,267 | 28,229 | ||||||||||||||||||||||
| Payments for dividends related to Class B-2 shares | — | — | (12) | (12) | ||||||||||||||||||||||
| Payments for share repurchases | (101,854) | — | (101,854) | — | ||||||||||||||||||||||
| Payments for taxes related to net share settlement of equity awards | (23,026) | (18,624) | (121,845) | (44,876) | ||||||||||||||||||||||
| Proceeds from issuance of shares under equity plans | 9,223 | 37,087 | 72,329 | 56,779 | ||||||||||||||||||||||
| Net cash (used in) / provided by financing activities | (120,343) | 13,775 | (146,214) | 21,368 | ||||||||||||||||||||||
| Effect of foreign exchange rate changes on cash and cash equivalents | (19,878) | 8,443 | (12,909) | 2,724 | ||||||||||||||||||||||
| Net increase in cash and cash equivalents | (20,113) | 120,336 | 180,017 | 234,564 | ||||||||||||||||||||||
| Cash and cash equivalents at beginning of period | 932,573 | 612,107 | 732,443 | 497,879 | ||||||||||||||||||||||
| Cash and cash equivalents at end of period | $ | 912,460 | $ | 732,443 | $ | 912,460 | $ | 732,443 | ||||||||||||||||||
| Supplemental disclosures: | ||||||||||||||||||||||||||
| Cash paid for interest | $ | 32,470 | $ | 38,251 | $ | 144,362 | $ | 147,340 | ||||||||||||||||||
| Cash paid for income taxes, net of refunds | $ | 26,049 | $ | 8,232 | $ | 68,637 | $ | 82,342 | ||||||||||||||||||
INFORMATICA INC.
NON-GAAP FINANCIAL MEASURES AND KEY BUSINESS METRICS
(in thousands, except per share data)
(unaudited)
RECONCILIATIONS OF GAAP TO NON-GAAP
Reconciliation of GAAP net income (loss) to Non-GAAP net income
| Three Months Ended December 31, | Twelve Months Ended December 31, | ||||||||||||||||||||||
| 2024 | 2023 | 2024 | 2023 | ||||||||||||||||||||
| (in thousands) | (in thousands) | ||||||||||||||||||||||
| GAAP net income (loss) | $ | 9,754 | $ | 64,261 | $ | 9,931 | $ | (125,283) | |||||||||||||||
Stock-based compensation-related charges(1) | 63,010 | 56,041 | 263,088 | 218,099 | |||||||||||||||||||
| Amortization of intangibles | 29,435 | 37,384 | 125,745 | 149,280 | |||||||||||||||||||
| Restructuring | 5,697 | 31,624 | 12,505 | 59,755 | |||||||||||||||||||
| Debt refinancing costs | — | — | 1,366 | — | |||||||||||||||||||
| Acquisition-related costs | — | — | 7,569 | 1,584 | |||||||||||||||||||
| Sponsor-related costs | 730 | — | 1,503 | — | |||||||||||||||||||
| Income tax effect | 19,975 | (92,013) | (63,702) | (32,744) | |||||||||||||||||||
| Non-GAAP net income | $ | 128,601 | $ | 97,297 | $ | 358,005 | $ | 270,691 | |||||||||||||||
| Net income (loss) per share: | |||||||||||||||||||||||
| Net income (loss) per share—basic | $ | 0.03 | $ | 0.22 | $ | 0.03 | $ | (0.43) | |||||||||||||||
| Net income (loss) per share—diluted | $ | 0.03 | $ | 0.21 | $ | 0.03 | $ | (0.43) | |||||||||||||||
| Non-GAAP net income per share—basic | $ | 0.42 | $ | 0.33 | $ | 1.19 | $ | 0.94 | |||||||||||||||
| Non-GAAP net income per share—diluted | $ | 0.41 | $ | 0.32 | $ | 1.14 | $ | 0.92 | |||||||||||||||
| Share count (in thousands): | |||||||||||||||||||||||
| Weighted-average shares used in computing Net income (loss) per share—basic | 305,268 | 292,851 | 301,778 | 288,581 | |||||||||||||||||||
| Weighted-average shares used in computing Net income (loss) per share—diluted | 313,851 | 304,826 | 313,491 | 288,581 | |||||||||||||||||||
| Weighted-average shares used in computing Non-GAAP net income per share—basic | 305,268 | 292,851 | 301,778 | 288,581 | |||||||||||||||||||
| Weighted-average shares used in computing Non-GAAP net income per share—diluted | 313,851 | 304,826 | 313,491 | 295,279 | |||||||||||||||||||
(1) Beginning with the second quarter of 2024, the Company adjusted for employer payroll tax-related items on employee stock transactions in certain non-GAAP metrics. The stock-based compensation related employer tax-related expense for comparative periods were immaterial and are not reflected in the balances above.
Reconciliation of GAAP income (loss) from operations to Non-GAAP income from operations
| Three Months Ended December 31, | Twelve Months Ended December 31, | ||||||||||||||||||||||
| 2024 | 2023 | 2024 | 2023 | ||||||||||||||||||||
| (in thousands) | (in thousands) | ||||||||||||||||||||||
| GAAP income from operations | $ | 63,426 | $ | 36,832 | $ | 127,048 | $ | 33,563 | |||||||||||||||
| Stock-based compensation-related charges | 63,010 | 56,041 | 263,088 | 218,099 | |||||||||||||||||||
| Amortization of intangibles | 29,435 | 37,384 | 125,745 | 149,280 | |||||||||||||||||||
| Restructuring | 5,697 | 31,624 | 12,505 | 59,755 | |||||||||||||||||||
| Acquisition-related costs | — | — | 7,569 | 1,584 | |||||||||||||||||||
| Sponsor-related costs | 730 | — | 1,503 | — | |||||||||||||||||||
| Non-GAAP income from operations | $ | 162,298 | $ | 161,881 | $ | 537,458 | $ | 462,281 | |||||||||||||||
| GAAP operating margin (% of total revenue) | 14.8 | % | 8.3 | % | 7.7 | % | 2.1 | % | |||||||||||||||
| Non-GAAP operating margin (% of total revenue) | 37.9 | % | 36.4 | % | 32.8 | % | 29.0 | % | |||||||||||||||
INFORMATICA INC.
NON-GAAP FINANCIAL MEASURES AND KEY BUSINESS METRICS
Adjusted EBITDA Reconciliation
| Three Months Ended December 31, | Twelve Months Ended December 31, | ||||||||||||||||||||||
| 2024 | 2023 | 2024 | 2023 | ||||||||||||||||||||
| (in thousands) | (in thousands) | ||||||||||||||||||||||
| GAAP net income (loss) | $ | 9,754 | $ | 64,261 | $ | 9,931 | $ | (125,283) | |||||||||||||||
| Income tax expense (benefit) | 58,388 | (62,950) | 43,234 | 48,111 | |||||||||||||||||||
| Interest income | (14,436) | (11,736) | (56,437) | (39,686) | |||||||||||||||||||
| Interest expense | 32,289 | 39,552 | 146,064 | 151,396 | |||||||||||||||||||
| Debt refinancing costs | — | — | 1,366 | — | |||||||||||||||||||
| Other expense (income), net | (22,569) | 7,705 | (17,110) | (975) | |||||||||||||||||||
| Stock-based compensation-related charges | 63,010 | 56,041 | 263,088 | 218,099 | |||||||||||||||||||
| Amortization of intangibles | 29,435 | 37,384 | 125,745 | 149,280 | |||||||||||||||||||
| Restructuring | 5,697 | 31,624 | 12,505 | 59,755 | |||||||||||||||||||
| Acquisition-related costs | — | — | 7,569 | 1,584 | |||||||||||||||||||
| Sponsor-related costs | 730 | — | 1,503 | — | |||||||||||||||||||
| Depreciation | 3,572 | 4,543 | 13,388 | 17,083 | |||||||||||||||||||
| Adjusted EBITDA | $ | 165,870 | $ | 166,424 | $ | 550,846 | $ | 479,364 | |||||||||||||||
Adjusted Unlevered Free Cash Flows
| Three Months Ended December 31, | Twelve Months Ended December 31, | ||||||||||||||||||||||
| 2024 | 2023 | 2024 | 2023 | ||||||||||||||||||||
| (in thousands, except percentages) | (in thousands, except percentages) | ||||||||||||||||||||||
| Total GAAP Revenue | $ | 428,305 | $ | 445,178 | $ | 1,640,018 | $ | 1,595,160 | |||||||||||||||
| Net cash provided by operating activities | $ | 146,858 | $ | 101,042 | $ | 409,850 | $ | 266,347 | |||||||||||||||
| Less: Purchases of property, plant, and equipment | (1,607) | (1,624) | (3,944) | (6,543) | |||||||||||||||||||
| Add: Equity compensation payments | — | 257 | — | 425 | |||||||||||||||||||
| Add: Restructuring costs | 1,833 | 16,829 | 19,992 | 43,593 | |||||||||||||||||||
| Add: Acquisition-related costs | 531 | — | 7,510 | — | |||||||||||||||||||
| Add: Sponsor-related costs | 805 | — | 1,304 | — | |||||||||||||||||||
Adjusted Free Cash Flows (after-tax)(1) | $ | 148,420 | $ | 116,504 | $ | 434,712 | $ | 303,822 | |||||||||||||||
| Add: Cash paid for interest | 32,470 | 38,251 | 144,362 | 147,340 | |||||||||||||||||||
Adjusted Unlevered Free Cash Flows (after-tax)(1) | $ | 180,890 | $ | 154,755 | $ | 579,074 | $ | 451,162 | |||||||||||||||
Adjusted Free Cash Flows (after-tax) margin(1) | 35 | % | 26 | % | 27 | % | 19 | % | |||||||||||||||
Adjusted Unlevered Free Cash Flows (after-tax) margin(1) | 42 | % | 35 | % | 35 | % | 28 | % | |||||||||||||||
(1) Includes cash tax payments of $26.0 million and $8.2 million for the three months ended December 31, 2024 and 2023, respectively, and cash tax payments of $68.6 million and $82.3 million for the year ended December 31, 2024 and 2023, respectively.
Key Business Metrics
The following are our key business metrics as of December 31, 2024 and 2023.
| December 31, | |||||||||||
| 2024 | 2023 | ||||||||||
| (in thousands, except percentages) | |||||||||||
| Cloud Subscription Annual Recurring Revenue | $ | 827,307 | $ | 616,792 | |||||||
| Self-managed Subscription Annual Recurring Revenue | 447,135 | 515,874 | |||||||||
| Subscription Annual Recurring Revenue | 1,274,442 | 1,132,666 | |||||||||
| Maintenance Annual Recurring Revenue on Perpetual Licenses | 451,015 | 493,579 | |||||||||
| Total Annual Recurring Revenue | $ | 1,725,457 | $ | 1,626,245 | |||||||
| Subscription Net Retention Rate (End-user level) | 104 | % | 106 | % | |||||||
| Cloud Subscription Net Retention Rate (End-user level) | 117 | % | 119 | % | |||||||
| Cloud Subscription Net Retention Rate (Global Parent level) | 124 | % | 125 | % | |||||||
INFORMATICA INC.
SUPPLEMENTAL INFORMATION
Additional Business Metrics
| December 31, | |||||||||||
| 2024 | 2023 | ||||||||||
| Maintenance Renewal Rate | 92 | % | 95 | % | |||||||
| Subscription Renewal Rate | 90 | % | 92 | % | |||||||
| Total Cloud Subscription Annual Recurring Revenue customers | 2,468 | 2,288 | |||||||||
Customers that spend more than $1 million in Subscription Annual Recurring Revenue (1) | 284 | 240 | |||||||||
Customers that spend more than $100,000 in Subscription Annual Recurring Revenue (2) | 2,110 | 1,988 | |||||||||
Cloud transactions processed per month in trillions (3) | 110.7 | 86.0 | |||||||||
(1) Total number of customers that spend more than $1 million in Subscription Annual Recurring Revenue.
(2) Total number of customers that spend more than $100,000 in Subscription Annual Recurring Revenue.
(3) Total number of cloud transactions processed on our platform per month in trillions, which measures data processed.
Disaggregation of Revenues
| Three Months Ended | ||||||||||||||||||||||||||||||||||||||||||||||||||||||||||||||
| December 31, 2024 | September 30, 2024 | June 30, 2024 | March 31, 2024 | December 31, 2023 | September 30, 2023 | June 30, 2023 | March 31, 2023 | |||||||||||||||||||||||||||||||||||||||||||||||||||||||
| (in thousands) | ||||||||||||||||||||||||||||||||||||||||||||||||||||||||||||||
| Revenues: | ||||||||||||||||||||||||||||||||||||||||||||||||||||||||||||||
Cloud subscription(i) | $ | 186,808 | $ | 175,809 | $ | 161,422 | $ | 151,438 | $ | 140,319 | $ | 128,581 | $ | 119,244 | $ | 111,778 | ||||||||||||||||||||||||||||||||||||||||||||||
Self-managed subscription support and other(i) | 44,800 | 46,627 | 48,908 | 48,591 | 50,910 | 51,542 | 51,467 | 51,595 | ||||||||||||||||||||||||||||||||||||||||||||||||||||||
Maintenance(ii) | 110,888 | 115,309 | 116,482 | 117,678 | 121,475 | 124,267 | 124,851 | 125,375 | ||||||||||||||||||||||||||||||||||||||||||||||||||||||
| Total revenue recognized over time | 342,496 | 337,745 | 326,812 | 317,707 | 312,704 | 304,390 | 295,562 | 288,748 | ||||||||||||||||||||||||||||||||||||||||||||||||||||||
Self-managed subscription license recognized at a point in time(i)(iii) | 65,841 | 65,498 | 53,976 | 51,969 | 111,199 | 81,910 | 56,891 | 51,355 | ||||||||||||||||||||||||||||||||||||||||||||||||||||||
| Total subscription and maintenance revenue | 408,337 | 403,243 | 380,788 | 369,676 | 423,903 | 386,300 | 352,453 | 340,103 | ||||||||||||||||||||||||||||||||||||||||||||||||||||||
Professional services(ii) | 19,968 | 19,238 | 19,837 | 18,931 | 21,275 | 22,263 | 23,535 | 25,328 | ||||||||||||||||||||||||||||||||||||||||||||||||||||||
| Total revenues | $ | 428,305 | $ | 422,481 | $ | 400,625 | $ | 388,607 | $ | 445,178 | $ | 408,563 | $ | 375,988 | $ | 365,431 | ||||||||||||||||||||||||||||||||||||||||||||||
(i) Included in Subscription revenue on the consolidated statements of operations.
(ii) Included in Maintenance and Professional services revenue on the consolidated statements of operations.
(iii) The Company previously presented Perpetual license revenue separately. Because revenue for perpetual licenses are not material for current or past periods due to our transition to a cloud-only, consumption-driven strategy, the Company has combined these amounts into Self-managed subscription license recognized at a point in time and retrospectively adjusted past periods for comparative purposes.
Revenue recognized over time refers to ratable recognition over the contractual term. Revenue recognized at a point in time refers to recognition upon the later of when the software license is made available or the contractual term commences. Professional services are recognized as services are provided.
Net Debt Reconciliation
| December 31, | |||||||||||
| 2024 | 2023 | ||||||||||
| (in millions) | |||||||||||
| Dollar Term Loan | $ | 1,823 | $ | 1,842 | |||||||
| Less: Cash, cash equivalents, and short-term investments | (1,232) | (992) | |||||||||
| Total net debt | $ | 591 | $ | 850 | |||||||