PROPRIETARY AND CONFIDENTIAL ©2023 ENFUSION. ALL RIGHTS RESERVED. Enfusion 4Q 2022 Shareholder Letter March 2023 |
PROPRIETARY AND CONFIDENTIAL ©2023 ENFUSION. ALL RIGHTS RESERVED. Disclaimer Forward-Looking Statements Statements we make in this presentation may include statements which are not historical facts and are considered forward-looking within the meaning of Section 27A of the Securities Act of 1933 (Securities Act) and Section 21E of the Securities Exchange Act of 1934 (Exchange Act), including expectations regarding future financial performance. These forward-looking statements are usually identified by the use of words such as “anticipates,” “believes,” “estimates,” “expects,” “intends,” “may,” “plans,” “projects,” “seeks,” “should,” “could,” “will,” and variations of such words or similar expressions. We intend these forward-looking statements to be covered by the safe harbor provisions for forward-looking statements contained in Section 27A of the Securities Act and Section 21E of the Exchange Act and are making this statement for purposes of complying with those safe harbor provisions. These forward-looking statements reflect our current views about our plans, intentions, expectations, strategies and prospects, which are based on the information currently available to us and on assumptions we have made. Although we believe that our plans, intentions, expectations, strategies and prospects as reflected in or suggested by those forward-looking statements are reasonable, we can give no assurance that the plans, intentions, expectations or strategies will be attained or achieved. Furthermore, actual results may differ materially from those described in the forward-looking statements and will be affected by a variety of risks and factors that are beyond our control, such as those set forth in our Annual Report on Form 10-K for the fiscal year ended December 31, 2021 that was filed with the SEC on March 30, 2022 and our subsequent Quarterly Reports on Form 10-Q. We assume no obligation to update publicly any forward-looking statements, whether as a result of new information, future events or otherwise. 2 |
PROPRIETARY AND CONFIDENTIAL ©2023 ENFUSION. ALL RIGHTS RESERVED. 3 Dear Shareholders, Enfusion ended 2022 – its first full calendar year after the IPO - on a high note. During volatile market conditions, the resiliency of our business tends to shine and accentuate the value we provide to our clients. Investment managers have been reimagining their technology infrastructure without a clear solution. Many have selected Enfusion’s software and services as a strategic solution to transform their legacy systems with our robust, contiguous cloud native end to end software platform. 4Q22 Highlights: This quarter’s performance demonstrates our focus on delivering best-in class “software-and-a-service” offerings. Two key areas I’m particularly proud of: • We delivered robust financial results despite a challenging macro environment. Our fourth quarter top line outperformance was driven by strength in new sales across all products and services. These revenue results, coupled with our ongoing expense discipline, translated into significant YoY adjusted EBITDA margin expansion. We also delivered a second consecutive quarter of positive adjusted free cash flow driven by healthy margin and cash conversion. • Our fourth quarter client wins demonstrate the regional and operational diversification of our addressable market. During the quarter, we signed a multi-billion-dollar Tokyo-based alternative investment manager that was looking to modernize its inefficient, on-prem legacy stack. We also partnered with a newly formed spin-out from one of the Middle-East’s largest global hedge funds seeking a robust cloud-native platform. Further, we’re particularly proud that a North Carolina-based university endowment selected Enfusion to replace its outdated legacy infrastructure, allowing them to support all asset classes and reduce total cost of ownership. Entering 2023, we expect to build on our momentum and further advance Enfusion’s leadership position as the premier provider of end-to-end cloud-native investment management solution. Our capital allocation strategy remain sharply focused on technology, product and client services in order to provide innovative solutions and further enhance the scope and quality of our client services experience. We believe our investments in these categories will further our competitive advantage by accelerating innovation, bringing new products capabilities to market and providing an unparalleled client experience. I want to express my gratitude to my colleagues for their hard work, dedication to our clients and passion for our brand. Our results this quarter speak to the strength of our talent and commitment of our team to serving our clients every day. Sincerely, Oleg Movchan Chief Executive Officer |
PROPRIETARY AND CONFIDENTIAL ©2023 ENFUSION. ALL RIGHTS RESERVED. To help solve investment managers’ evolving business and operational challenges through next generation technology Our mission 4 |
PROPRIETARY AND CONFIDENTIAL ©2023 ENFUSION. ALL RIGHTS RESERVED. …empowering teams to operate in concert CFO COO CIO Portfolio Manager Analysts Traders Compliance Officer Investor Relations Middle Office Back Office We simplify and unify the investment management lifecycle We manage complex workflows… Fills Orders Reconciliations Allocated Trades Reporting Statements 5 |
6 Serving clients across the investment management industry Alternative Investment Managers Hedge Funds Private Equity Private Credit Family Offices Institutional Investment Managers Wealth Managers Traditional Asset Managers Mutual Funds Sovereign Wealth Funds |
PROPRIETARY AND CONFIDENTIAL ©2023 ENFUSION. ALL RIGHTS RESERVED. Purpose-built end-to-end solution 7 Portfolio Management System Order Execution Management System Technology-Powered Services Accounting / General Ledger Analytics • Live details of portfolio positions • Real-time Investment Book of Record (“IBOR”) Reporting & Analytics Visual Analytics Investment Decision Order Generation Order/Trade Routing • Electronically communicate and manage trade orders • Systemically enforce trading regulations and internal guidelines • Expert teams empowered by technology • Front-, middle- and back-office time consuming, administrative tasks • Double-entry ledger that automates the posting of general ledger journal entries directly from PMS • Complete, real-time Accounting Book of Record (“ABOR”) • Connected in real-time with our PMS and OEMS • Comprehensive client data insights to analyze portfolios through time horizons and automate customized visualized reports Mission critical systems integrated with a suite of technology-powered services One single dataset and source of truth |
PROPRIETARY AND CONFIDENTIAL ©2023 ENFUSION. ALL RIGHTS RESERVED. Robust growth in Underlying industry Addressing a large and growing market $11.5bn $5.7bn $2.0bn $19bn+ Software & IT services from Investment Management Internal IT spend IT hardware spend Source: IDC’s Worldwide Capital Markets IT Spending Guide (2023); PwC Asset and Wealth Management Revolution (2020) 40% in global AUM 2015-2020 8% of alternatives AUM projected 6% of total AUM projected $145 trillion in global AUM by 2025 total growth annual growth annual growth 2022 ARR: $164.7mm 8 |
PROPRIETARY AND CONFIDENTIAL ©2023 ENFUSION. ALL RIGHTS RESERVED. 9 Client-centric approach Why we win One end-to-end solution, one single dataset and source of truth Rapid pace of delivery and evolution Open, flexible and tailored Unique ability to lead with a single solution – and then adjust to a client’s growing complexity, scale with its size, evolve with its operational workflows, and continuously adapt to customer business dynamics Cloud-native, multi-tenant SaaS Drive efficiencies and lower total cost of ownership |
PROPRIETARY AND CONFIDENTIAL ©2023 ENFUSION. ALL RIGHTS RESERVED. Q4 2022 key financial highlights $40.5 27.2% YoY Growth Adjusted Free Cash Flow Z00 Total Revenue Z00 Adjusted EBITDA Z00 53.4% FCF Conversion $3.6 $27.2 67.2% Highly attractive SaaS model with combination of scale, growth and profitability $ in millions Gross Profit Z00 16.7% Adjusted EBITDA Margin $6.8 10 (1) See appendix for definition and non-GAAP reconciliations. (1) (1) $27.5 68.0% Adjusted Gross Margin Adjusted Gross Profit Z00 (1) Net Income Z00 1.9% $0.8 Net income Margin Operating Cash Flow Z00 18.6% OCF Margin $7.5 |
PROPRIETARY AND CONFIDENTIAL ©2023 ENFUSION. ALL RIGHTS RESERVED. $3.2 $1.8 $5.3 $5.4 $6.8 $2.6 $0.8 4Q21 1Q22 2Q22 3Q22 4Q22 Adjusted EBITDA Net Income Strong growth trends with expanding profitability Operating Cash Flow and Adjusted Free Cash Flow $ in millions $31.9 $34.1 $36.5 $39.2 $40.5 4Q21 1Q22 2Q22 3Q22 4Q22 Revenue Gross Profit and Adjusted Gross Profit 40.6% 40.2% 38.2% 34.8% 27.2% 68.1% 67.8% 70.3% 69.4% 67.2% NM NM NM 6.6% 1.9% NM NM 7.9% 20.0% 18.6% 11 See appendix for non-GAAP reconciliations. Net Income and Adjusted EBITDA Operating Cash Flow Margin and Adjusted Free Cash Flow Conversion YoY Growth Gross Margin and Adjusted Gross Margin Net Income Margin and Adjusted EBITDA Margin (1) (1) (1) (1) $22.1 $23.5 $26.0 $27.6 $27.5 $21.7 $23.2 $25.7 $27.2 $27.2 4Q21 1Q22 2Q22 3Q22 4Q22 Adjusted Gross Profit Gross Profit $(293.9) $(12.5) 69.3% 68.9% 71.2% 70.5% 68.0% 10.0% 5.4% 14.5% 13.9% 16.7% NM NM NM 87.6% 53.4% $(4.1) Gross Margin Adjusted Gross Margin Net Income Margin Adjusted EBITDA Margin Operating Cash Flow Margin Free Cash Flow Conversion ($3.1) ($9.4) ($1.4) $4.8 $3.6 ($5.8) ($4.1) $2.9 $7.8 $7.5 4Q21 1Q22 2Q22 3Q22 4Q22 Adjusted FCF Operating CF 4Q21 1Q22 2Q22 3Q22 4Q22 4Q21 1Q22 2Q22 3Q22 4Q22 4Q21 1Q22 2Q22 3Q22 4Q22 4Q21 1Q22 2Q22 3Q22 4Q22 |
PROPRIETARY AND CONFIDENTIAL ©2023 ENFUSION. ALL RIGHTS RESERVED. $127.1 $137.6 $148.7 $158.7 $164.7 4Q21 1Q22 2Q22 3Q22 4Q22 115.0% 115.8% 121.9% 116.6% 115.4% 4Q21 1Q22 2Q22 3Q22 4Q22 Organic, sticky expansion at scale 12 Net Dollar Retention Rate(1) Avg Contract Value 734 756 793 810 819 4Q21 1Q22 2Q22 3Q22 4Q22 $184 $190 $195 $201 $207 4Q21 1Q22 2Q22 3Q22 4Q22 36% 37% 38% 33% 30% 67% 74% 60% 63% 51% 7% 9% 12% 10% 13% $ in millions (1) Net Dollar Retention Rate excludes involuntary churn. ARR Clients YoY Growth % Conversions YoY Growth 4Q21 1Q22 2Q22 3Q22 4Q22 4Q21 1Q22 2Q22 3Q22 4Q22 4Q21 1Q22 2Q22 3Q22 4Q22 |
PROPRIETARY AND CONFIDENTIAL ©2023 ENFUSION. ALL RIGHTS RESERVED. Financial outlook 13 2023E Revenue $185 $190 million ̶ Adjusted EBITDA $32 ̶ $34 million *Adjusted EBITDA guidance excludes stock-based compensation of $12 million for the full year 2023. These statements are forward-looking and actual results may differ materially. Refer to the “Forward-Looking Statements” safe harbor section below for information on the factors that could cause our actual results to differ materially from these forward-looking statements. Enfusion has not reconciled its estimates for Adjusted EBITDA to net income under U.S. generally accepted accounting principles (GAAP) due to the uncertainty and potential variability of expenses that may be incurred in the future. Accordingly, a reconciliation is not available without unreasonable effort. |
PROPRIETARY AND CONFIDENTIAL ©2023 ENFUSION. ALL RIGHTS RESERVED. Appendix |
PROPRIETARY AND CONFIDENTIAL ©2023 ENFUSION. ALL RIGHTS RESERVED. 15 ENFUSION, INC. CONSOLIDATED BALANCE SHEETS (dollars in thousands, except shares and unit amounts and par value) (Unaudited) ASSETS Current Assets: Cash and cash equivalents $ 62,545 $ 64,365 Accounts receivable, net 25,855 18,223 Prepaid expenses 6,105 6,030 Other current assets 2,303 1,060 Total current assets 96,808 89,678 Property and equipment, net 15,759 13,051 Right of use asset 6,732 — Other assets 4,484 3,356 Total assets $ 123,783 $ 106,085 LIABILITIES AND STOCKHOLDERS' EQUITY Current liabilities: Accounts payable $ 1,685 $ 2,528 Accrued expenses and other current liabilities 11,665 5,578 Lease liability - short term 4,030 — Total current liabilities 17,380 8,106 Lease liability 2,959 — Other liabilities — 538 Total liabilities 20,339 8,644 Stockholders' Equity: Class A common stock, $0.001 par value; 1,000,000,000 shares authorized, 70,859,711 and 65,583,289 shares issued and outstanding as of December 31, 2022 and December 31, 2021, respectively 71 66 Class B common stock, $0.001 par value; 150,000,000 shares authorized, 43,198,768 and 47,470,972 shares issued and outstanding as of December 31, 2022 and December 31, 2021, respectively 43 47 Additional paid-in capital 244,260 226,717 Accumulated deficit (178,863) (171,209) Accumulated other comprehensive loss (504) (325) Total stockholders’ equity attributable to Enfusion, Inc. 65,007 55,296 Non-controlling interests 42,145 38,437 Total stockholders' equity 97,441 103,444 Total liabilities and stockholders' equity $ 123,783 $ 106,085 December 31, 2022 2021 |
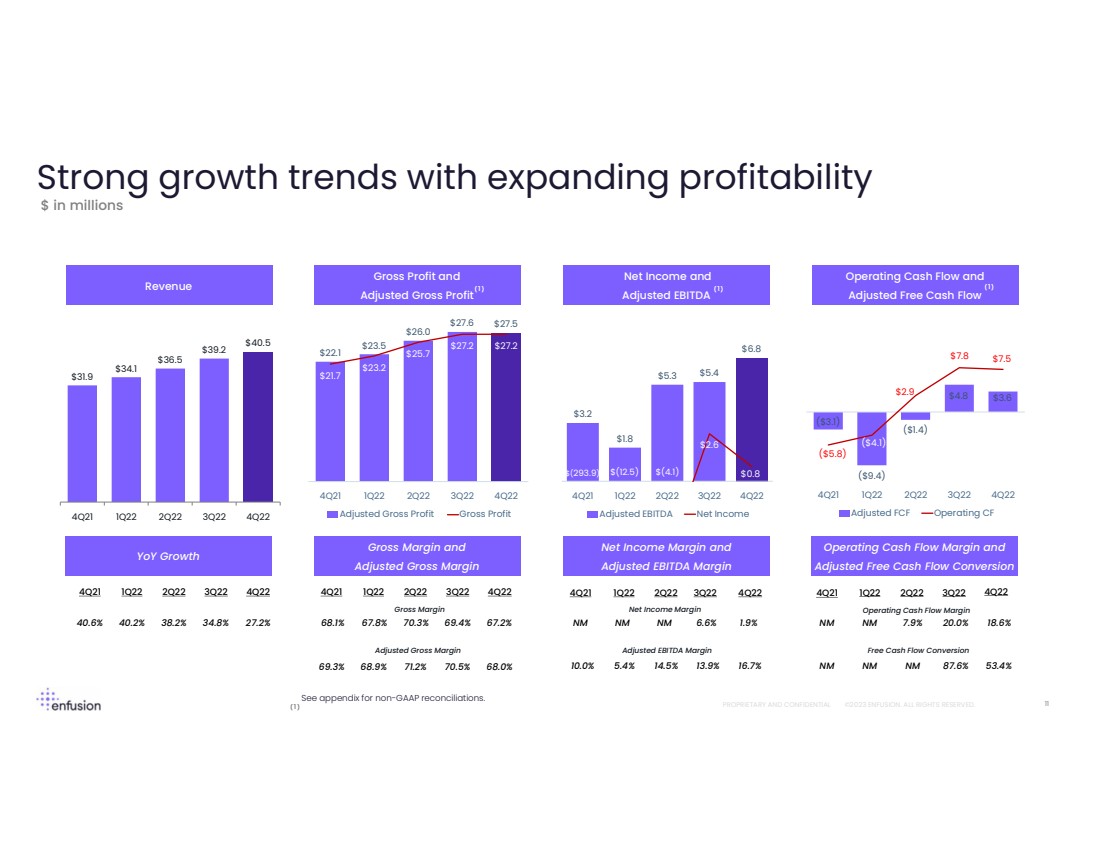
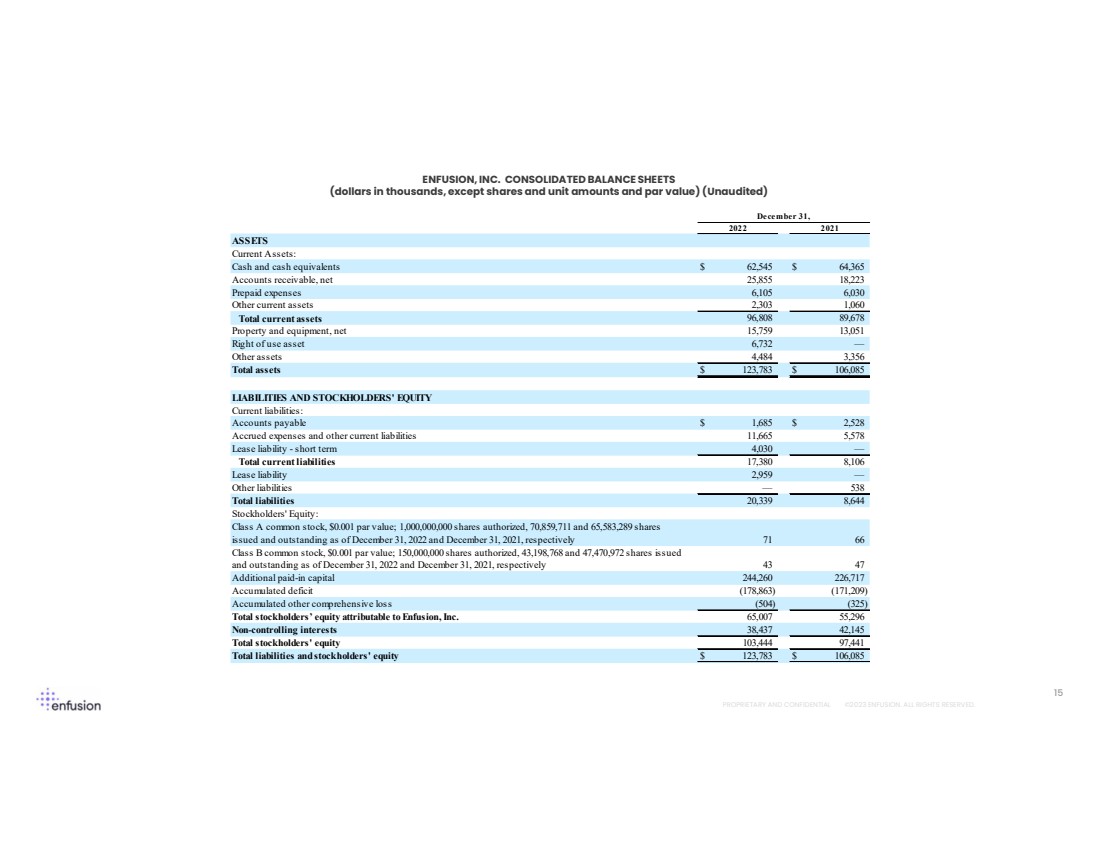
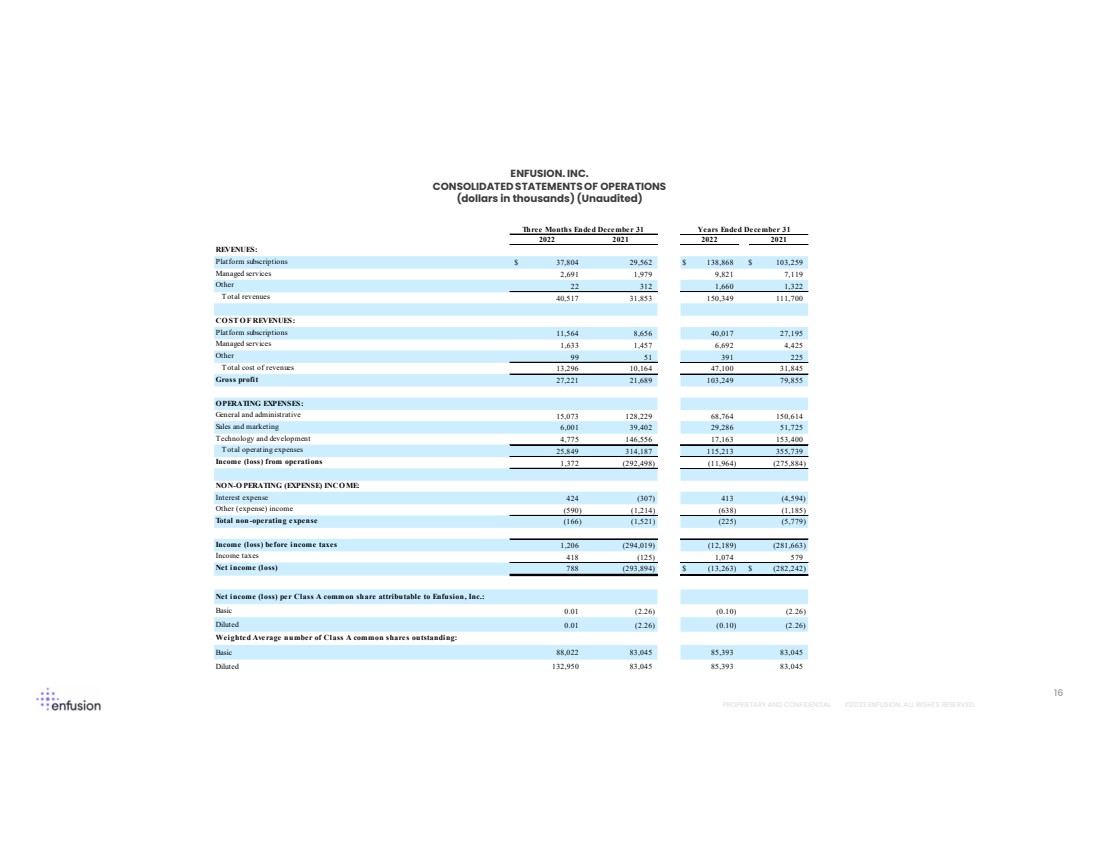
PROPRIETARY AND CONFIDENTIAL ©2023 ENFUSION. ALL RIGHTS RESERVED. 16 ENFUSION. INC. CONSOLIDATED STATEMENTS OF OPERATIONS (dollars in thousands) (Unaudited) 2022 2021 REVENUES: Plat form subscriptions $ 29,562 37,804 $ 138,868 $ 103,259 Managed services 1,979 2,691 9,821 7,119 Other 312 22 1,660 1,322 T otal revenues 31,853 40,517 150,349 111,700 CO ST O F REVENUES: Plat form subscriptions 8,656 11,564 40,017 27,195 Managed services 1,457 1,633 6,692 4,425 Other 51 99 391 225 T otal cost of revenues 10,164 13,296 47,100 31,845 Gross profi t 21,689 27,221 103,249 79,855 OPERATING EXPENSES : General and administrative 128,229 15,073 68,764 150,614 Sales and marketing 39,402 6,001 29,286 51,725 Technology and development 146,556 4,775 17,163 153,400 T otal operating expenses 314,187 25,849 115,213 355,739 Income (loss) from operations (292,498) 1,372 (11,964) (275,884) NON-O PERATING (EXPENSE) INCOME: Interest expense (307) 424 413 (4,594) Other (expense) income (1,214) (590) (638) (1,185) Total non -operating e xpense (1,521) (166) (225) (5,779) Income (loss) be fore income taxes (294,019) 1,206 (12,189) (281,663) Income taxes (125) 418 1,074 579 Ne t income (loss) (293,894) 788 $ (13,263) $ (282,242) Ne t income (loss) per Class A common share attributable to Enfu sion, Inc.: Basic (2.26) 0.01 (0.10) (2.26) Diluted (2.26) 0.01 (0.10) (2.26) Weighted Average number of Class A common share s ou tstanding: Basic 83,045 88,022 85,393 83,045 Diluted 83,045 132,950 85,393 83,045 Years Ended December 31 2022 2021 Three Months Ended December 31 |
PROPRIETARY AND CONFIDENTIAL ©2023 ENFUSION. ALL RIGHTS RESERVED. 17 ENFUSION. INC. CONSOLIDATED STATEMENTS OF CASH FLOWS (dollars in thousands) (Unaudited) Cash flows from operating activities: Net (loss) income $ (13,263) $ (282,242) Adjustments to reconcile net (loss) income to net cash provided by operating activities: Non-cash operating lease expense 257 — Depreciation and amortization 6,344 3,975 Provision for bad debts 1,399 1,450 Amortization of debt-related costs 26 222 Stock-based compensation expense 24,993 289,803 Loss on extinguishment of debt — 1,215 Net foreign currency losses — — Change in operating assets and liabilities: Accounts receivable (9,031) (7,493) Prepaid expenses and other current assets (1,767) (6,477) Accounts payable (843) 2,044 Accrued expenses and other liabilities 6,041 (2,815) Net cash provided by (used in) operating activities 14,156 (318) Cash flows from investing activities: Purchases of property and equipment (7,931) (8,014) Net cash used in investing activities (7,931) (8,014) Cash flows from financing activities: Repayment of term loan — (100,000) Payment of Member distributions — (3,283) Issuance of Class A common stock in the IPO, net of issuance costs — 260,545 Purchases of common units from Pre-IPO common unit holders — (87,846) Payment of withholding taxes on stock-based compensation (7,959) (10,567) Net cash (used in) provided by financing activities (7,959) 58,849 Effect of exchange rate changes on cash (86) (90) Net (decrease) increase in cash and cash equivalents (1,820) 50,427 Cash and cash equivalents, beginning of period 64,365 13,938 Cash and cash equivalents, end of period $ 62,545 $ 64,365 2022 2021 |
PROPRIETARY AND CONFIDENTIAL ©2023 ENFUSION. ALL RIGHTS RESERVED. Reconciliations To Non-GAAP Financial Measures 18 The following table reconciles net income to Adjusted EBITDA: The following table reconciles gross profit to adjusted gross profit: ($ in thousands) December 31, 2021 March 30, 2022 June 30, 2022 September 30, 2022 December 31, 2022 GAAP Gross profit $ 23,158 21,689 25,693 27,177 27,221 Add back stock based compensation expense 377 354 341 406 321 Adjusted Gross profit 22,066 23,512 26,034 27,583 27,542 Adjusted Gross Margin 69.3% 68.9% 71.2% 70.5% 68.0% Three Months Ended ($ in thousands) December 31, 2021 March 30, 2022 June 30, 2022 September 30, 2022 December 31, 2022 Net income (loss) $ (12,524) (293,894) (4,125) 2,598 788 Interest expense 307 6 1 4 (424) Income taxes (125) 150 219 287 418 Depreciation and amortization 1,316 1,340 1,615 1,699 1,690 EBITDA (292,396) (11,028) (2,290) 4,588 2,472 Adjustments: Stock-based compensation expense 289,803 12,432 7,523 833 4,205 Loss on debt extinguishment 1,215 — Tax payment on stock-based compensation 4,570 434 50 14 87 Adjusted EBITDA 3,192 1,838 5,283 5,435 6,764 Adjusted EBITDA margin 10.0% 5.4% 14.5% 13.9% 16.7% Three Months Ended |
PROPRIETARY AND CONFIDENTIAL ©2023 ENFUSION. ALL RIGHTS RESERVED. Reconciliations of Non-GAAP Financial Measures 19 The following table reconciles operating cash flow to unlevered free cash flow and adjusted free cash flow: The Company’s stock compensation expense was recognized in the following captions within the consolidated statements of operations: ($ in thousands) Three Months Ended December 31, 2022 Year Ended December 31, 2022 Cost of revenues $ 321 $ 1,421 General and administrative 2,096 14,130 Sales and marketing 936 5,875 Technology and development 852 3,567 Total stock compensation expense $ 4,205 $ 24,993 ($ in thousands) December 31, 2021 March 31, 2022 June 30, 2022 September 30, 2022 December 31, 2022 Net Cash provided by (used in) operating activities (5,812) $ (4,097) 2,890 7,842 7,521 Purchase of property and equipment (1,641) (3,171) (2,092) (922) (1,746) Unlevered Free Cashflow (7,453) (7,268) 798 6,920 5,775 Adjustments Less bonus timing and non-recurring expenses 4,389 (2,160) (2,160) (2,160) (2,160) Adjusted Free Cash Flow (3,064) (9,428) (1,362) 4,760 3,615 Three Months Ended |
PROPRIETARY AND CONFIDENTIAL ©2023 ENFUSION. ALL RIGHTS RESERVED. 20 Definitions Non-GAAP Financial Measures In addition to financial measures prepared in accordance with GAAP, this presentation and the accompanying tables include Adjusted EBITDA, Adjusted EBITDA Margin, Adjusted Gross Profit, Adjusted Gross Margin, Unlevered Free Cash Flow, and Adjusted Free Cash Flow, which are non-GAAP financial measures. The presentation of these non-GAAP financial measures is not intended to be considered in isolation or as a substitute for, or superior to, financial information prepared and presented in accordance with GAAP. Adjusted EBITDA, Adjusted EBITDA Margin, Adjusted Gross Profit, Adjusted Gross Margin, Unlevered Free Cash Flow , and Adjusted Free Cash Flow are supplemental measures of our operating performance and liquidity that are neither required by, nor presented in accordance with, U.S. GAAP, and our calculations thereof may not be comparable to similarly titled measures reported by other companies. These measures are presented because they are the primary measures used by management to evaluate our financial performance and liquidity, and for forecasting purposes. This non-GAAP financial information is useful to investors because it eliminates certain items that affect period-over-period comparability and provides consistency with past financial performance or liquidity and additional information about underlying results and trends by excluding certain items that may not be indicative of our business, results of operations or outlook. Additionally, we believe that these and similar measures are often used by securities analysts, investors and other interested parties as a means of evaluating a company’s operating performance. Adjusted EBITDA, Adjusted EBITDA Margin, Adjusted Gross Profit, Adjusted Gross Margin, Unlevered Free Cash Flow, and Adjusted Free Cash Flow are non-GAAP financial measures, are not measurements of our financial performance or liquidity under U.S. GAAP and should not be considered as alternatives to net income, income from operations, gross profit, gross margin, or any other performance measures determined in accordance with U.S. GAAP. These non-GAAP financial measures have limitations as analytical tools and you should not consider them in isolation or as substitutes for analysis of our results as reported under GAAP, but rather as supplemental information to our business results. In addition, these non-GAAP financial measures may not be comparable to similarly titled measures of other companies due to potential differences in methods of calculation and items or events being adjusted. Furthermore, other companies may use different measures to evaluate their performance, all of which could reduce the usefulness of these non-GAAP financial measures as tools for comparison. Adjusted EBITDA and Adjusted EBITDA Margin Adjusted EBITDA represents earnings before interest, taxes, depreciation and amortization, adjusted to exclude certain items of a non-recurring or unusual nature, including payments to repurchase management incentive awards from our Change in Control Bonus Plan, initial public offering costs, and stock-based compensation expense. Adjusted EBITDA Margin represents Adjusted EBITDA divided by total net revenues. Unlevered Free Cash Flow Unlevered Free Cash Flow represents net cash provided from operating activities less purchases of property and equipment and other assets, plus cash interest expense. However, given our non-discretionary expenditures, Unlevered Free Cash Flow does not represent residual cash flow available for discretionary expenditures. Adjusted Free Cash Flow Adjusted Free Cash Flow represents Unlevered Free Cash Flow adjusted to exclude certain annual employee bonuses that are amortized on a quarterly basis as well as certain items of a non-recurring or unusual nature. Adjusted Gross Profit and Adjusted Gross Margin Adjusted Gross Profit represents gross profit, excluding the impact of stock-based compensation. Adjusted Gross Margin represents Adjusted Gross Profit divided by total net revenues. |
PROPRIETARY AND CONFIDENTIAL ©2023 ENFUSION. ALL RIGHTS RESERVED. 21 Definitions Continued Key Metrics: In connection with the management of our business, we identify, measure and assess a variety of key metrics. The key metrics we use in managing our business are set forth below. Annual Recurring Revenue We calculate Annual Recurring Revenue, or ARR, by annualizing platform subscriptions and managed services revenues recognized in the last month of the measurement period. We believe ARR provides important information about our future revenue potential, our ability to acquire new clients and our ability to maintain and expand our relationship with existing clients. ARR is included in a set of metrics we calculate monthly to review with management as well as periodically with our board of directors. Net Dollar Retention Rate We calculate Net Dollar Retention Rate as of a period end by starting with the ARR for all clients as of twelve months prior to such period end, or Prior Period ARR. We then calculate the ARR from those same clients as of the current period end, or Current Period ARR. Current Period ARR includes expansion within existing clients inclusive of contraction and voluntary attrition, but excludes involuntary cancellations. We define involuntary cancellations as accounts that were cancelled due to the client no longer being in business. We identify involuntary cancellations to be excluded from our Net Dollar Retention Rate calculation based on representations made by the client at the time of cancellation. Our Net Dollar Retention Rate is equal to the Current Period ARR divided by the Prior Period ARR. We believe Net Dollar Retention Rate is an important metric because, in addition to providing a measure of retention, it indicates our ability to grow revenues within existing client accounts. Average Contract Value We calculate Average Contract Value, or ACV, by dividing ARR by the number of clients that are billed at the end of the measurement period. We believe ACV is an important metric because it provides important information about the growth of our clients' accounts. Investors should not place undue reliance on ARR or Net Dollar Retention Rate or Average Contract Value as an indicator of future or expected results. Our presentation of these metrics may differ from similarly titled metrics presented by other companies and therefore comparability may be limited. |