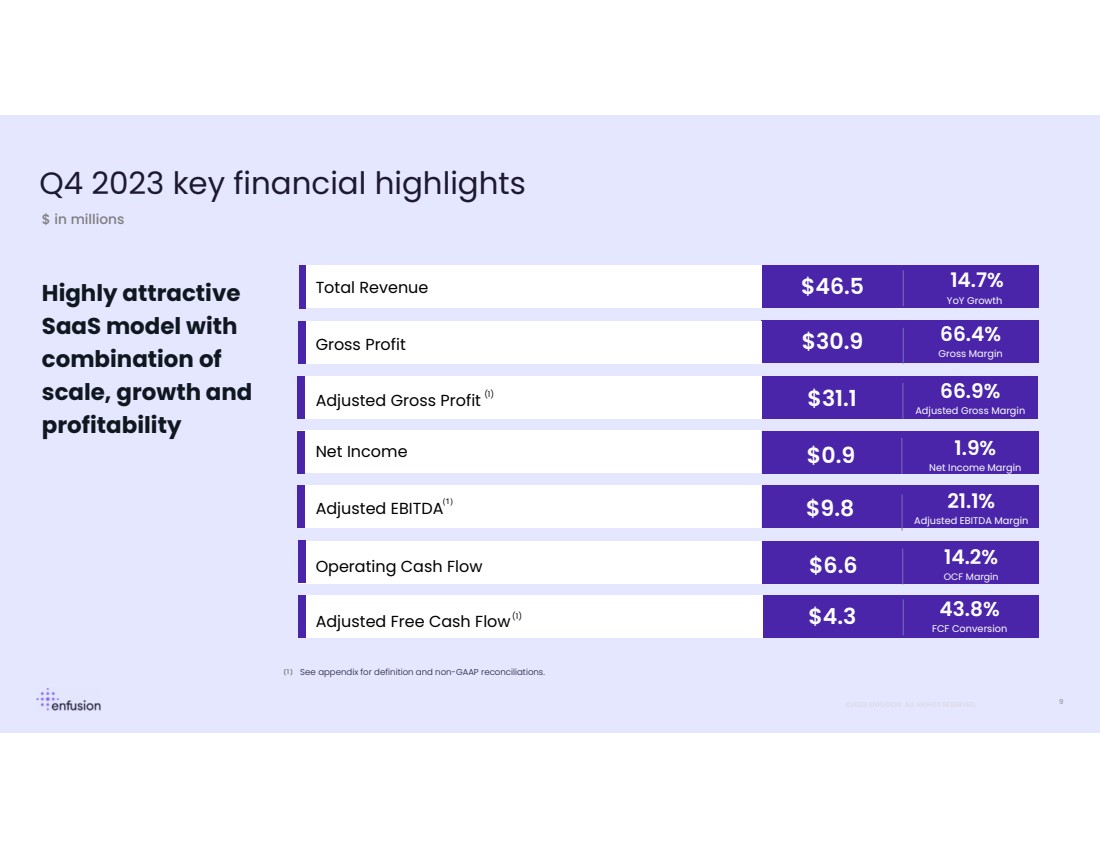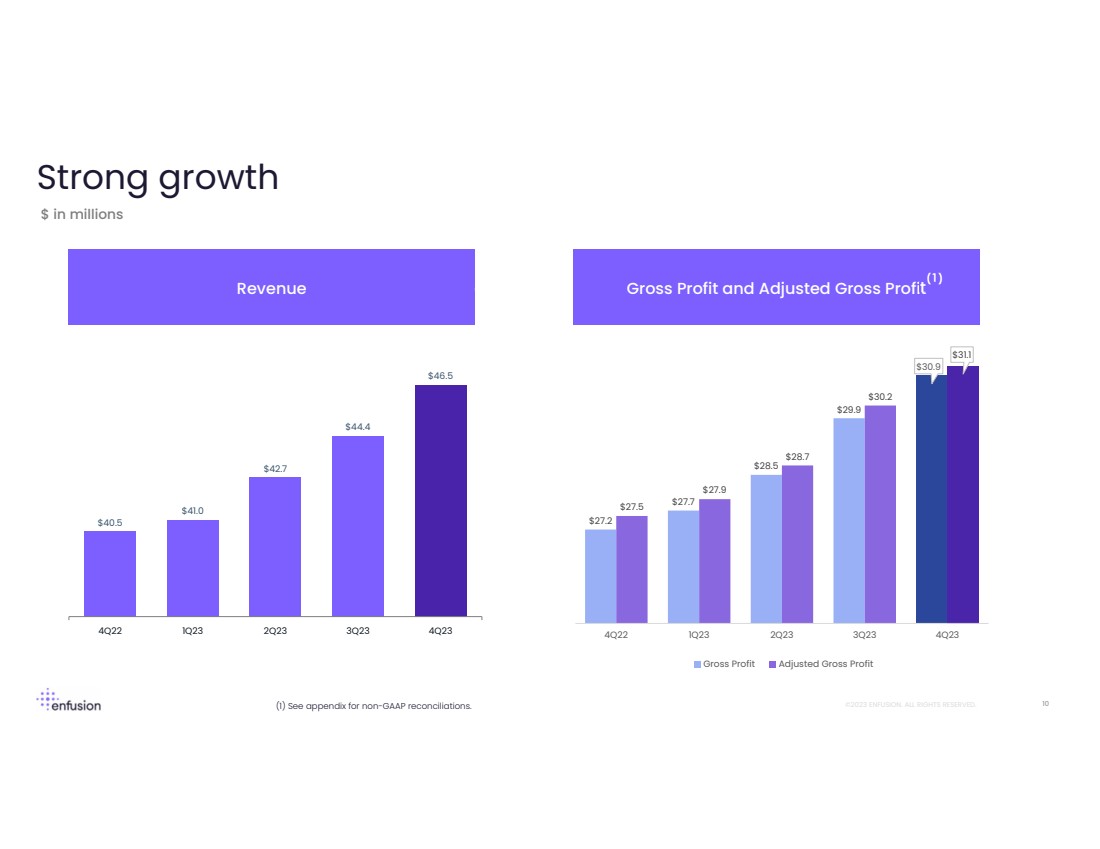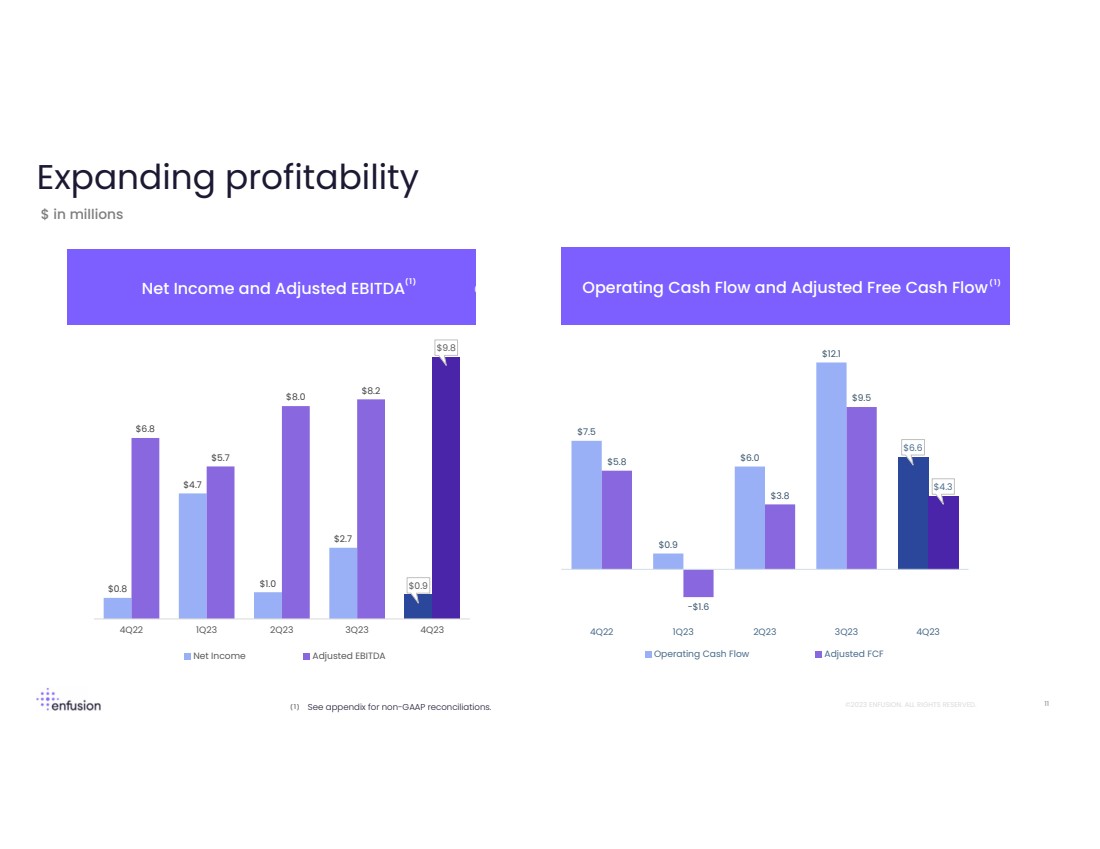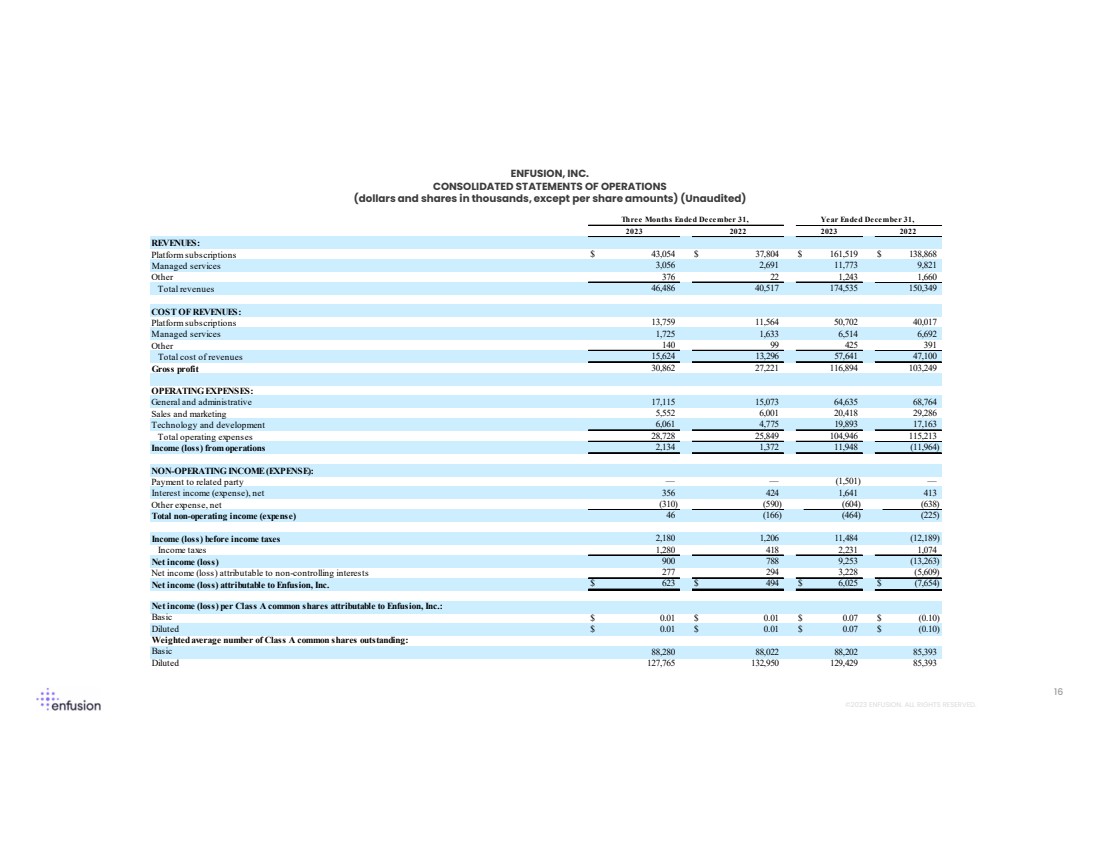
| PROPRIETARY AND CONFIDENTIAL ©2023 ENFUSION. ALL RIGHTS RESERVED. 16 ENFUSION, INC. CONSOLIDATED STATEMENTS OF OPERATIONS (dollars and shares in thousands, except per share amounts) (Unaudited) REVENUES: Platformsubscriptions $ 43,054 $ 37,804 $ 161,519 $ 138,868 Managed services 3,056 2,691 11,773 9,821 Other 376 22 1,243 1,660 Total revenues 46,486 40,517 174,535 150,349 COST OF REVENUES: Platformsubscriptions 13,759 11,564 50,702 40,017 Managed services 1,725 1,633 6,514 6,692 Other 140 99 425 391 Total cost of revenues 15,624 13,296 57,641 47,100 Gross profit 30,862 27,221 116,894 103,249 OPERATINGEXPENSES: General and administrative 17,115 15,073 64,635 68,764 Sales and marketing 5,552 6,001 20,418 29,286 Technology and development 6,061 4,775 19,893 17,163 Total operating expenses 28,728 25,849 104,946 115,213 Income (loss) from operations 2,134 1,372 11,948 (11,964) NON-OPERATINGINCOME(EXPENSE): Payment to related party — — (1,501) — Interest income (expense), net 356 424 1,641 413 Other expense, net (310) (590) (604) (638) Total non-operating income (expense) 46 (166) (464) (225) Income (loss) before income taxes 2,180 1,206 11,484 (12,189) Income taxes 1,280 418 2,231 1,074 Net income (loss) 900 788 9,253 (13,263) Net income (loss) attributable to non-controlling interests 277 294 3,228 (5,609) Net income (loss) attributable to Enfusion, Inc. $ 623 $ 494 $ 6,025 $ (7,654) Net income (loss) per Class A common shares attributable to Enfusion, Inc.: Basic $ 0.01 $ 0.01 $ 0.07 $ (0.10) Diluted $ 0.01 $ 0.01 $ 0.07 $ (0.10) Weightedaverage number of Class A common shares outstanding: Basic 88,280 88,022 88,202 85,393 Diluted 127,765 132,950 129,429 85,393 Three Months Ended December 31, Year Ended December 31, 2023 2022 2023 2022 |