UNITED STATES
SECURITIES AND EXCHANGE COMMISSION
Washington, D.C. 20549
Form 6-K |
Report Of Foreign Private Issuer
Pursuant To Rule 13a-16 Or 15d-16 Of
The Securities Exchange Act Of 1934
For the month of March 2022
Commission File Number: 001-41035
CI&T Inc
(Exact Name of Registrant as Specified in its Charter)
N/A
(Translation of registrant’s name into English)
R. Dr. Ricardo Benetton Martins, 1,000
Pólis de Tecnologia-Prédio 23B,
Campinas-State of São Paulo
13086-902 - Brazil
+55 19 21024500
(Address of principal executive office))
Indicate by check mark whether the registrant files or will file annual reports under cover of Form 20-F or Form 40-F:
Form 20-F ____X____ Form 40-F ________
Indicate by check mark if the registrant is submitting the Form 6-K in paper as permitted by Regulation S-T Rule 101(b)(1):
Yes ________ No ____X____
Indicate by check mark if the registrant is submitting the Form 6-K in paper as permitted by Regulation S-T Rule 101(b)(7):
Yes ________ No ____X____
CI&T Inc
TABLE OF CONTENTS

CI&T Reports Strong Fourth Quarter 2021 and Full Year Financial Results
New York - March 09, 2022 /Business Wire/ - CI&T (NYSE: CINT, “Company”), a global digital specialist, today announces its unaudited results for the fourth quarter of 2021 (4Q21) and audited results for the year ended December 31, 2021 (2021), in accordance with International Standards on Auditing (ISAs). 4Q21 and 2021 financial results are presented in accordance with International Financial Reporting Standards (IFRS). For comparison purposes, we refer to the results for the fourth quarter of 2020 (4Q20) and for the year ended December 31, 2020 (2020).
4Q21 Operating and Financial Highlights
● Net revenue reached R$456.8 million, a 72% growth compared to 4Q20.
● Net revenue growth in constant currency was 69% over 4Q20.
● Net profit was R$43.8 million, 49% higher than 4Q20.
● Adjusted EBITDA was R$101.8 million, with an adjusted EBITDA margin of 22.3%.
● Adjusted net profit totaled R$47.7 million, 62% higher than the same quarter of 2020.
2021 Operating and Financial Highlights
● Net revenue was R$1,444.4 million in 2021, up 51.0% year-over-year.
● Pro forma net revenue of R$1,617.4 million, 39.4% higher than in 2020.
● Pro forma net profit for the year was R$129.0 million, up 13% compared to 2020.
● Pro forma adjusted EBITDA was R$380.5 million, with an adjusted EBITDA margin of 23.5%.
● Pro forma adjusted net profit totaled R$160.1 million, equivalent to a pro forma adjusted net margin of 9.9%
● CI&T generated R$214.4 million in cash from operating activities, 37% higher compared to the amount of R$156.9 million recorded in 2020, and 66% cash-conversion from adjusted EBITDA.
● CI&T ended the year with 5,564 employees, a net addition of 2,345 employees in 2021.
● The number of clients with annual revenue above R$1 million grew from 58 in 2020 to 94 in 2021, a net addition of 36 new clients, and the net revenue retention rate (NRR) was 128% in 2021.
A word from our CEO
We are delighted to end 2021 with robust results, outperforming our growth guidance for the quarter and year in our first year-end as a public Company. Our net revenue grew 51% in 2021 year over year, with a solid adjusted EBITDA margin of 22.4%. This growth was boosted by higher demand from existing clients, the addition of new clients to our portfolio combined with our selective M&A strategy. We added 36 new clients with annual revenue above R$1 million, totaling 94 in 2021. Our top 10 client concentration reduced from 67% of our net revenue in 2020 to 54% in 2021. We are also providing strong growth guidance for 2022. What a great year, and I'm very proud of what we've done as CI&Ters, as a team.
It is worth looking back to understand how we will move forward: founded in 1995, CI&T has 27 years of consecutive growth and profitability. From 2006, the emblematic year we launched CI&T in the USA, to 2016, we had an organic CAGR of 30% in revenue. From 2016 on, we introduced three new growth forces: [1] a domain-driven Digital Strategy as a core component of our offering; [2] our Growth Unit business architecture, fostering a scalable entrepreneur organizational model; and [3] a programmatic approach for M&A as an enduring new capability focused on a flow of selective and strategic acquisitions. As a result of those moves, we are accelerating our annual growth pace: 41% in 2020, 51% in 2021, and guiding at least 56% in 2022. To operate at this new pace, we are constantly increasing our investments in hiring, training, and leadership development while keeping solid margins and cash conversion rates.
Now let's move our eyes forward. And yes, there are clouds in the sky: the global economy is yet to recover from a devastating pandemic, and we have a new set of geopolitical threads on the table. In parallel, "software continues to eat the world", enabling unprecedented and radical changes in society, values, and consumer behaviors. Digital is the answer to reconnect companies to a new breed of consumers. The result is a secular demand for digital services in the corporate world and an extraordinary opportunity for a decade of high growth for CI&T.
As CEO, my primary mission is to harmonize the interlinked needs of our stakeholders: we will increase our transformational impact through digital for our clients. And we will continue to do that by fostering meaningful and fast carriers in a psychologically safe environment where people can fulfill their personal purpose and ambitions. Our talent density enables a long-term value creation journey for our shareholders by way of high growth and profitability. And for our communities is about solving complex human problems, fostering diversity and inclusion, and ESG in a broader perspective, concretely contributing to making a better world. It's the equation of building a company that makes sense through the lens of the future and not the past.
With these foundations, we are confident we are on the right track. Here is my special gratitude to all CI&Ters that provide this incredible environment of joy and accomplishment at CI&T. A warm thank you to all our clients, partners, investors, and stakeholders that believe in our audacious ambitions as a company.
Through hardships to the stars!
And stay safe.
Cesar Gon
Comments on the 4Q21 and 2021 financial performances
Net Revenue
Revenue (in BRL thousand) | 4Q21 | 4Q20 | Var. 4Q21 x 4Q20 | 2021 | 2020 | Var. 2021 x 2020 |
Net Revenue | 456,794 | 265,367 | 72.1% | 1,444,380 | 956,519 | 51.0% |
In 4Q21, net revenue was R$456.8 million, an increase of 72.1% compared to 4Q20, of which 40% was organic growth. Net revenue in constant currency grew 69% in the comparable period. This performance was attributed to our expansion of current contracts, combined with the addition in the quarter of 19 new clients with revenue above R$1.0 million in the last twelve months, from 75 to 94 clients.
In 2021, CI&T’s net revenue was R$1,444.4 million, an increase of 51.0% year-over-year. Net revenue growth in constant currency was 47.0% and the net revenue retention rate was 128% in 2021, demonstrating the recurrency and resilience of our business.
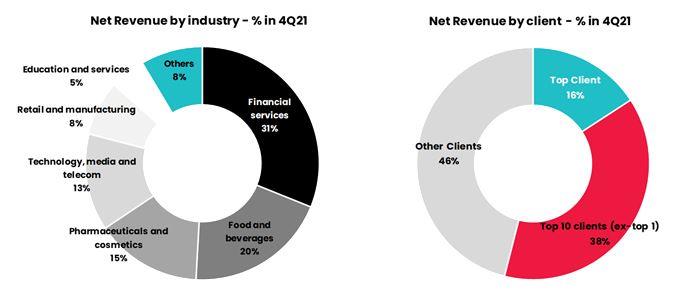
We reduced our top one and top 10 client concentration from 21% and 72% in 4Q20, respectively, to 16% and 54% in 4Q21, and we diversified our revenue breakdown by industry verticals. While all segments presented significant growth, Technology, Media and Telecom (TMT) and Retail and Manufacturing were the verticals that grew faster in terms of revenue from 4Q21 compared to 4Q20.
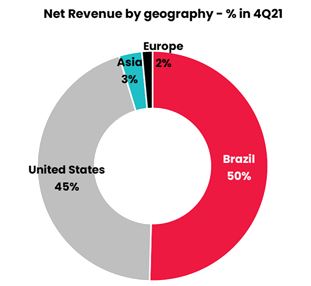
In terms of geography, Brazil and the U.S. continue to be our most relevant markets. The U.S. operation recorded the fastest growth rate of 50% organically in 4Q21 compared to 4Q20.
Cost of Services Provided
Gross Profit (in BRL thousand) | 4Q21 | 4Q20 | Var. 4Q21 x 4Q20 | 2021 | 2020 | Var. 2021 x 2020 |
Net Revenue | 456,794 | 265,367 | 72.1% | 1,444,380 | 956,519 | 51.0% |
Cost of Services | (294,746) | (166,294) | 77.2% | (935,732) | (600,866) | 55.7% |
Gross Profit | 162,048 | 99,073 | 63.6% | 508,648 | 355,653 | 43.0% |
Adjustments |
|
|
|
|
|
|
Depreciation and amortization (cost of services provided) | 8,764 | 5,995 | 46.2% | 31,884 | 24,085 | 32.4% |
Stock Options | 1,582 | 76 | 1981.6% | 1,930 | 139 | 1288.5% |
Adjusted Gross Profit | 172,394 | 105,144 | 64.0% | 542,462 | 379,877 | 42.8% |
Adjusted Gross Profit Margin | 37.7% | 39.6% | -1.9p.p | 37.6% | 39.7% | -2.2p.p |
In 4Q21, the cost of services provided totaled R$294.7 million, an increase of 77.2% compared to 4Q20, and the gross profit was R$162.0 million. Eliminating the depreciation and amortization and stock option expenses, the adjusted gross profit in 4Q21 was R$172.4 million, with an adjusted gross profit margin of 37.7%.
In 2021, the cost of services provided was R$935.7 million, an increase of 55.7% compared to 2020, and the gross profit reached R$508.6 million. Adjusted gross profit totaled R$542.5 million, with an adjusted gross profit margin of 37.6%, compared to 39.7% in 2020. The decline in gross profit margins is explained mainly by employee promotions and compensation adjustments that were postponed during the first year of the pandemic, aligned with current market conditions and our continuous investments in our people to foster a higher pace of growth.
SG&A and Other Expenses
SG&A expenses (in BRL thousand) | 4Q21 | 4Q20 | Var. 4Q21 x 4Q20 | 2021 | 2020 | Var. 2021 x 2020 |
Selling | (27,752) | (25,815) | 7.5% | (89,654) | (65,093) | 37.7% |
General and administrative | (58,685) | (22,861) | 156.7% | (151,681) | (81,161) | 86.9% |
SG&A expenses | (86,437) | (48,676) | 77.6% | (241,335) | (146,254) | 65.0% |
Other income (expenses) net(1) | 1,716 | (538) | - | (22,210) | (959) | 2216.0% |
Impairment loss on trade receivables and contract assets | 1,533 | (191) | - | (497) | (196) | 153.6% |
SG&A and other operating expenses | (83,188) | (49,405) | 68.4% | (264,042) | (147,409) | 79.1% |
(1)Include Research and technological innovation expenses
Selling, General and Administrative (SG&A) expenses grew 77.6% in 4Q21 compared to 4Q20, mainly due to (i) an increase in people expenses, associated with new hires and the strengthening of the Human Resources, Finance, Administrative and Legal teams, (ii) IPO, M&A and accounting advisory services and related expenses and (iii) higher depreciation and amortization expenses due to the recognition of intangible assets related to the acquisition of Dextra. These incremental expenses are mainly related to M&A activities and to the IPO, which occurred in November 2021. In 2021, SG&A expenses grew 65.0% in relation to 2020, due to the same reasons explained above.
Other net expenses in 2021 totaled R$22.2 million, due to the impairment of intangible assets in the amount of R$21.9 million recorded in 3Q21, a non-cash and one-off effect that are not related to Dextra core ongoing services and shall not impact CI&T nor Dextra operations going forward.
EBITDA and Adjusted EBITDA
Ebitda (in BRL thousand) | 4Q21 | 4Q20 | Var. 4Q21 x 4Q20 | 2021 | 2020 | Var. 2021 x 2020 |
Net profit for the period | 43,828 | 29,401 | 49.1% | 125,957 | 127,654 | -1.3% |
(+) Net financial expense | 8,130 | 1,417 | 473.7% | 34,232 | 15,453 | 121.5% |
(+) Income tax expense | 26,902 | 18,850 | 42.7% | 84,417 | 65,137 | 29.6% |
(+)Depreciation and amortizationnet | 18,251 | 7,429 | 145.7% | 48,354 | 29,882 | 61.8% |
| EBITDA | 97,111 | 57,097 | 70.1% | 292,960 | 238,126 | 23.0% |
| EBITDA Margin | 21.3% | 21.5% | -0.3p.p | 20.3% | 24.9% | -4.6p.p |
| Adjustments | ||||||
| Stock Options | 1,838 | 201 | 814.4% | 2,531 | 934 | 171.0% |
Consulting expenses (1) | 3,821 | 108 | 3438.0% | 9,177 | 428 | 2044.2% |
| Government grants | (1,063) | (253) | 320.2% | (2,481) | (1,571) | 57.9% |
| Impairment | 77 | 0 | 0.0% | 21,895 | 0 | - |
| Adjusted EBITDA | 101,784 | 57,153 | 78.1% | 324,082 | 237,917 | 36.2% |
| Adjusted EBITDA Margin | 22.3% | 21.5% | 0.7p.p | 22.4% | 24.9% | -2.4p.p |
(1)Include R$18 thousand from indemnity expenses in 4Q20 and 2020
In 4Q21, EBITDA was R$97.1 million, 70.1% higher than 4Q20. Adjusted EBITDA in the quarter was R$101.8 million, an increase of 78.1% compared to 4Q20. Adjusted EBITDA margin was 22.3% in 4Q21, slightly above the adjusted EBITDA margin of 21.5% reported in 4Q20.
The reported EBITDA in 2021 was R$293.0 million, an increase of 23% in relation to 2020. Adjusted EBITDA was R$324.1 million, 36.2% higher than in 2020. Adjusted EBITDA margin was 22.4% in 2021, below the level of 24.9% reported in 2020 when the result benefited from lower costs and expenses during the first year of the pandemic.
Net Financial Expenses
Net financial expenses was R$8.1 million in 4Q21, compared to R$1.4 million in 4Q20, mainly due to new debt in the amount of R$650 million incurred by the Company in July to finance the Dextra acquisition, which will mature in 2026. In 2021, net financial expenses totaled R$34.2 million, an increase in relation to the R$15.4 million expense in 2020. Interest on loans increased from R$10.3 million in 2020 to R$R$29.7 million in 2021 due to the increase in the gross debt position, as explained above, combined with the increase in interest rates (CDI) during the year. Income from financial investments grew from R$2.6 million in 2020 to R$4.3 million in 2021.
Depreciation and Amortization
Depreciation and amortization expenses totaled R$18.3 million in 4Q21, an increase of R$10.8 million compared to 4Q20. In 2021, depreciation and amortization expenses reached R$48.3 million, compared to R$29.9 million in 2020, mainly due to the recognition of intangible assets related to the acquisition of Dextra in 2021 in the amount of R$148.5 million from customer relationships, non-compete agreement and brands.
In addition, the Company recognized R$595.7 million in goodwill from the acquisition of Dextra, which is expected to be deductible for tax purposes, considering the merger of Dextra and CI&T that occurred on December 2021.
Net Profit and Adjusted Net Profit
Net Profit (in BRL thousand) | 4Q21 | 4Q20 | Var. 4Q21 x 4Q20 | 2021 | 2020 | Var. 2021 x 2020 |
Net profit(loss) for the period | 43,828 | 29,401 | 49.1% | 125,957 | 127,654 | -1.3% |
Adjustments |
|
|
|
|
|
|
Consulting expenses (1) | 3,821 | 108 | 3438.0% | 9,177 | 428 | 2044.2% |
Impairment | 77 | 0 | 0.0% | 21,895 | 0 | - |
Adjusted Net Profit | 47,726 | 29,509 | 61.7% | 157,029 | 128,082 | 22.6% |
Adjusted Net Profit Margin | 10.4% | 11.1% | -0.7p.p | 10.9% | 13.4% | -2.5p.p |
(1)Include R$18 thousand from indemnity expenses in 4Q20 and 2020
In 4Q21, net profit was R$43.8 million, 49.1% higher than 4Q20. Adjusted net profit reached R$47.7 million, an increase of 61.7% compared to 4Q20. The adjusted net profit margin reduced slightly from 11.1% in 4Q20 to 10.4% in 4Q21, mainly due to higher depreciation and amortization and financial expenses, as explained above.
In 2021, net profit totaled R$125.9 million, 1.3% lower than in 2020. The adjusted net profit was R$157.0 million, 22.6% higher than in 2020. The adjusted net profit margin was 10.9% in 2021, a reduction of the level observed in 2020, explained mainly by the increase in the cost of service provided and higher expenses with depreciation and amortization and financial expenses.
Cash Flow from Operations
In 2021, CI&T generated R$214.4 million in cash from operating activities, 37% higher compared to the amount of R$156.9 million recorded in 2020. Deducting payment for income tax and interest on loans, borrowings and leasing, net cash from operating activities was R$132.4 million, an increase of R$31.4 million in relation to 2020.
Investments on acquisition of property, plant and equipment and intangible assets represented R$29.9 million in 2021 and R$21.4 million in 2020, and are mainly related to IT equipments for the growing number of employees.
Indebtedness
CI&T ended December 31, 2021 with a financial net cash position of R$145.8 million, composed of a gross debt position of R$788.7 million and R$934.5 million in cash, cash equivalents and financial investments, including the net proceeds of our IPO. Lease liabilities amounted to R$81.9 million at the end of the quarter. Currently, 34% of the total debt is USD denominated and 66% is denominated in Brazilian Reais, which is linked to the Brazilian interest rate, CDI.
Business Outlook
We expect our net revenue in the first quarter of 2022 to be at least R$485.0 million, a 64% growth compared to our net revenue of R$ 296.3 million in the first quarter of 2021.
For the full year of 2022, we expect our net revenue to be at least R$2,250 million or USD433 million, a 56% growth compared to our net revenue of R$1,444 million in 2021. In addition, we estimate our adjusted EBITDA to be at least 20% for the full year of 2022. This guidance for 2022 assumes an average exchange rate of 5.20 Brazilian Reais to the U.S. dollar for the full year.
These expectations are forward-looking statements and actual results may differ materially. See "Cautionary Statement on Forward-Looking Statements" below
Pro forma financial highlights, including the Dextra acquisition as if the acquisition had occurred on January 1, 2021
● Pro forma net revenue of R$1,617.4 million, 39.4% higher than in 2020.
● Pro forma net profit for the year was R$129.0 million
● Pro forma adjusted EBITDA was R$380.5 million, with an adjusted EBITDA margin of 23.5%.
● Pro forma adjusted net profit totaled R$160.1 million, equivalent to an adjusted net margin of 9.9%
Pro Forma Income Statement (in BRL thousand) | 2021 | 2020 | Var. 2021 x 2020 |
Net Revenue | 1,617,339 | 1,160,555 | 39.4% |
Costs of services provided | (1,038,939) | (717,701) | 44.8% |
Gross Profit | 578,400 | 442,854 | 30.6% |
SG&A | (277,293) | (210,678) | 31.6% |
Other income (expenses) net (1) | (23,499) | (1,047) | - |
Operating profit before financial income | 277,608 | 231,129 | 20.1% |
Net finance expense | (64,654) | (58,825) | 9.9% |
Profit before Income tax | 212,954 | 172,304 | 23.6% |
Income tax expense | (83,910) | (57,702) | 45.4% |
Net profit for the year | 129,044 | 114,602 | 12.6% |
(1) includes impairment loss on trade receivables and contract assets
Pro Forma Non-IFRS Financial Measures
Please refer to page the appendix for non-IFRS financial adjustments.
Pro Forma (in BRL thousand) | 2021 | 2020 | Var. 2021 x 2020 |
Adjusted Gross Profit | 617,334 | 471,584 | 30.9% |
EBITDA | 349,387 | 295,716 | 18.1% |
Adjusted EBITDA | 380,509 | 296,767 | 28.2% |
Adjusted EBITDA Margin | 23.5% | 25.6% | -2.0 |
Adjusted Net Profit | 160,116 | 116,290 | 37.7% |
Adjusted Net Profit Margin | 9.9% | 10.0% | -0.1 |
The unaudited pro forma condensed statements of profit or loss for the year ended December 31, 2021 is based on (a) the audited consolidated statements of profit or loss of CI&T Inc for the year ended December 31, 2021; and (b) the unaudited financial information of Dextra Tecnologia for the period from January 1, 2021 to August 9, 2021 and gives effect on a pro forma basis to the Dextra Acquisition as if it had been consummated on January 1, 2021.
The transaction accounting adjustments totaled a negative effect of R$28.8 million in the pro forma net income in 2021, and it relates to (a) amortization expense of intangible assets (customer relationship, brand and non-compete agreement), (b) estimated interest expenses on the new debt to finance the Dextra acquisition, and (c) expected income taxes based on the pro forma adjustments. Please refer to the table Pro Forma- Statement of profit and loss (Unaudited) below.
Conference Call and Webcast Information
Cesar Gon, Bruno Guicardi, Stanley Rodrigues and Eduardo Galvão will host a video conference call to discuss the 4Q21 and 2021 financial and operating results on March 10 at 8:00 a.m. Eastern Time / 10:00 a.m. BRT. The earnings call can be accessed at the Company’s Investor Relations website at https://investors.ciandt.com or at the following link:
http://investors.ciandt.com/investors-info/events-and-presentations/CIT-4Q21-Earnings-Call.
About CI&T
CI&T is a global digital specialist, a partner in end-to-end digital transformation for 100+ Large Enterprises & Fast Growth Clients. As digital natives, we bring a 27-year track record of accelerating business impact through complete and scalable digital solutions. With a global presence in 8 countries with a nearshore delivery model, CI&T is the Employer of Choice for more than 5,500 professionals in strategy, data science, design, and engineering, unlocking top-line growth, improving customer experience, and driving operational efficiency.
Basis of accounting and functional currency
CI&T maintains its books and records in Brazilian reais, the presentation currency for its audited consolidated financial statements, and the functional currency of our operations in Brazil. CI&T prepares its audited consolidated financial statements in accordance with IFRS, as issued by the IASB.
Non-IFRS Financial Measures
We regularly monitor certain financial and operating metrics to evaluate our business, measure our performance, identify trends affecting our business, formulate financial projections and make strategic decisions. These non-IFRS financial measures include Adjusted Gross Profit, Adjusted Gross Profit Margin, EBITDA, EBITDA Margin, Adjusted EBITDA, Adjusted EBITDA Margin, Adjusted Net Profit for the period, Adjusted Net Profit Margin for the period, Net Revenue at Constant Currency and Net Revenue Increase at Constant Currency, and should be considered in addition to results prepared in accordance with IFRS, but not as substitutes for IFRS results. In addition, our calculation of these non-IFRS financial measures may be different from the calculation used by other companies, and therefore comparability may be limited. These non-IFRS financial measures are provided as additional information to enhance investors’ overall understanding of the historical and current financial performance of our operations. Please refer to the previous pages for reconciliations and explanation of the reconciliation itens for Non-IFRS measures and see appendix below "Reconciliation of Non-IFRS measures Pro Forma, including the Dextra acquisition as if the acquisition had occurred on January 1, 2021" for reconciliations of our Non-IFRS measures to the nearest IFRS measure.
We monitor our net revenue at constant currency and net revenue increase at constant currency. As the impact of foreign currency exchange rates is highly volatile and difficult to predict, we believe Net Revenue at Constant Currency and Net Revenue Increase at Constant Currency allow us to better understand the underlying business trends and performance of our ongoing operations on a period-over-period basis by eliminating the effect of fluctuations in the exchange rates we use in the translation of our Net revenue in foreign currencies into Brazilian reais. We calculate Net Revenue at Constant Currency and Net Revenue Increase at Constant Currency by translating Net revenue from entities reporting in foreign currencies into Brazilian reais using the comparable foreign currency exchange rates from the prior period.
CI&T is not providing a quantitative reconciliation of forward-looking Non-IFRS Adjusted EBITDA to the most directly comparable IFRS measure because it is unable to predict with reasonable certainty the ultimate outcome of certain significant items without unreasonable effort. These items include, but are not limited to, stock-based compensation expense, acquisition-related charges, the tax effect of non-IFRS adjustments and other items. These items are uncertain, depend on various factors, and could have a material impact on IFRS reported results for the guidance period.
In calculating Adjusted Gross Profit, we exclude cost components that are not related to the direct management of our services. For the periods herein, the adjustments applied were: (i) depreciation and amortization related to costs of services provided; and (ii) stock options compensation plan expenses.
In calculating Adjusted EBITDA, we exclude components that are not related to the direct management of our services. For the periods herein, the adjustments were: (i) consulting expenses related to corporate reorganization and initial public offering expenses, as well as mergers and acquisitions activity; (ii) government grants related to tax reimbursement in the Chinese subsidiary; (iii) stock options compensation plan expenses; and (iv) the impairment related to the discontinuation of certain investments made by Dextra on certain in progress intangible assets related to digital platforms following the closing of the Dextra acquisition. CI&T does not expect a continuing impact in its operations related to this impairment.
In calculating Adjusted Net Profit, we exclude cost components that are not related to the direct management of our services. For the periods herein, the adjustments applied were: (i) consulting expenses related to corporate reorganization and initial public offering costs, as well as mergers and acquisitions activity; and (ii) the impairment related to the discontinuation of certain investments made by Dextra on certain in progress intangible assets related to digital platforms following the closing of the Dextra acquisition. CI&T does not expect a continuing impact in its operations related to this impairment. Net Revenue Retention Rate is calculated by dividing Net revenue, less Net revenue generated from new clients in a given year, over Net revenue from the previous year. Cash conversion rate is calculated by dividing cash generated from operating activities over adjusted EBITDA.
Cautionary Statement on Forward-Looking Statements
This press release includes "forward-looking statements" within the meaning of the "safe harbor" provisions of the United States Private Securities Litigation Reform Act of 1995. All statements other than statements of historical fact are statements that could be deemed forward-looking statements, which include but are not limited to: the statements under "Business outlook," including expectations relating to revenues and other financial or business metrics; statements regarding relationships with clients; and any other statements of expectation or belief. The words “believe,” “will,” “may,” “may have,” “would,” “estimate,” “continues,” “anticipates,” “intends,” “plans,” “expects,” “budget,” "scheduled,” “forecasts” and similar words are intended to identify estimates and forward-looking statements, but the absence of these words does not mean that a statement is not forward-looking. Forward-looking statements represent our management's beliefs and assumptions only as of the date of this press release. You should read this press release with the understanding that our actual future results may be materially different from what we expect. These statements are subject to known and unknown risks, uncertainties, and other factors that may cause our actual results, levels of activity, performance, or achievements to differ materially from results expressed or implied in this press release. Such risk factors include, but are not limited to, those related to: the current and future impact of the COVID-19 pandemic on our business and industry; the effects of competition on our business; uncertainty regarding the demand for and market utilization of our services; the ability to maintain or acquire new client relationships; general business and economic conditions; our ability to successfully integrate Dextra; and our ability to successfully execute our growth strategy and strategic plans. Additional information concerning these and other risks and uncertainties are contained in the "Risk Factors" section of CI&T's registration statement on Form F-1. Additional information will be made available in our annual reports on Form 20-F, and other filings and reports that CI&T may file from time to time with the SEC. Except as required by law, CI&T assumes no obligation and does not intend to update these forward-looking statements or to update the reasons actual results could differ materially from those anticipated in these forward-looking statements, even if new information becomes available in the future.
Contacts
Investor Relations Contact:
Eduardo Galvão
egalvao@ciandt.com
Media Relations Contact:
Zella Panossian
ciandt@illumepr.com
Consolidated Statement of profit and loss, including Dextra as of August 10, 2021
(in BRL thousand)
| Three months ended December 31, |
| Full year ended December 31, | ||||||||
| 2021 |
| 2020 |
| 2021 |
| 2020 | ||||
Net Revenue | 456,794 |
| 265,367 |
| 1,444,380 |
| 956,519 | ||||
Costs of services provided | (294,746 | ) | (166,294 | ) |
| (935,732 | ) | (600,866 | ) | ||
Gross Profit | 162,048 |
| 99,073 |
| 508,648 |
| 355,653 | ||||
Selling expenses | (27,752 | ) | (25,815 | ) |
| (89,654) |
| (65,093 | ) | ||
General and administrative expenses | (58,685 | ) | (22,861 | ) |
| (151,681 | ) | (81,161 | ) | ||
Research and technological innovation expenses | - |
| (810 | ) |
| (4 | ) | (3,462 | ) | ||
Impairment loss on trade receivables and contract assets | 1,533 |
| (191 | ) |
| (497 | ) | (196 | ) | ||
Other income (expenses) net | 1,716 |
| 272 |
| (22,206 | ) | 2,503 | ||||
Operating profit before financial income and tax | 78,860 |
| 49,668 |
| 244,606 |
| 208,244 | ||||
Finance income | 26,395 |
| 14,957 |
| 69,816 |
| 47,808 | ||||
Finance cost | (34,525 | ) | (16,374 | ) |
| (104,048 | ) | (63,261 | ) | ||
Net finance expense | (8,130 | ) | (1,417 | ) |
| (34,232 | ) | (15,453 | ) | ||
Profit before Income tax | 70,730 |
| 48,251 |
| 210,374 |
| 192,791 | ||||
Income tax expense |
|
|
|
|
|
|
| ||||
Current | (32,008 | ) | (24,434 | ) |
| (95,375 | ) | (66,912 | ) | ||
Deferred | 5,106 |
| 5,584 |
| 10,958 |
| 1,775 | ||||
Net profit for the year | 43,828 |
| 29,401 |
| 125,957 |
| 127,654 | ||||
Income attributable to: |
|
|
|
|
|
|
| ||||
Controlling shareholders | - |
| - |
| 125,957 |
| 127,654 | ||||
Non-controlling interests | - |
| - |
| - |
| - | ||||
Earnings per share |
|
|
|
|
|
|
| ||||
Earnings per share – basic (in R$) | - |
| - |
| 1.03 |
| 1.06 | ||||
Earnings per share – diluted (in R$) | - |
| - |
| 1.01 |
| 1.04 | ||||
Consolidated statements of financial position
(in BRL thousand)
Assets | December 31, 2021 |
| December 31, 2020 |
| Liabilities and equity | December 31, 2021 |
| December 31, 2020 |
Cash and cash equivalents | 135,727 |
| 162,827 |
| Suppliers and other payables | 33,566 |
| 15,312 |
Financial Investments | 798,786 |
| - |
| Loans and borrowings | 164,403 |
| 75,377 |
Trade receivables | 340,519 |
| 196,256 |
| Lease liabilities | 21,214 |
| 14,569 |
Contract assets | 134,388 |
| 50,625 |
| Salaries and welfare charges | 234,173 |
| 141,794 |
Recoverable taxes | 7,785 |
| 1,016 |
| Accounts payable for business combination | 48,923 |
| - |
Tax assets | 2,810 |
| 2,117 |
| Derivatives | 535 |
| 5,392 |
Derivatives | 896 |
| 8,837 |
| Tax liabilities | 13,345 |
| 6,078 |
Other assets | 29,994 |
| 12,874 |
| Other taxes payable | 5,423 |
| 3,279 |
Total current assets | 1,450,905 |
| 434,552 |
| Dividends and interest on equity payable | - |
| 30,677 |
|
|
|
|
| Contract liability | 13,722 |
| 9,987 |
|
|
|
|
| Indemnity | - |
| 628 |
Recoverable taxes | 3,046 |
| 3,099 |
| Other liabilities | 13,669 |
| 7,899 |
Deferred tax | 31,989 |
| 15,152 |
| Total current liabilities | 548,973 |
| 310,992 |
Judicial deposits | 3,079 |
| 3,083 |
|
|
|
|
|
Other assets | 2,974 |
| 2,494 |
| Loans and borrowings | 624,306 |
| 13,853 |
Property, plant and equipment | 57,721 |
| 38,771 |
| Lease liabilities | 60,674 |
| 60,659 |
Intangible assets | 738,803 |
| 18,166 |
| Provisions | 633 |
| 161 |
Right-of-use assets | 73,827 |
| 69,765 |
| Accounts payable for business combination | 36,803 |
| - |
Total non-current assets | 911,439 |
| 150,530 |
| Other liabilities | 1,660 |
| 957 |
|
|
|
|
|
|
|
|
|
|
|
|
|
| Total non-current liabilities | 724,076 |
| 75,630 |
|
|
|
|
|
|
|
|
|
|
|
|
|
| Equity |
|
|
|
|
|
|
|
| Share capital | 36 |
| 68,968 |
|
|
|
|
| Share premium | 915,947 |
| - |
|
|
|
|
| Capital reserves | 10,105 |
| 6,764 |
|
|
|
|
| Profit reserves | 125,957 |
| 109,308 |
|
|
|
|
| Other comprehensive income | 37,250 |
| 13,420 |
|
|
|
|
| Total equity | 1,089,295 |
| 198,460 |
Total assets | 2,362,344 |
| 585,082 |
| Total equity and liabilities | 2,362,344 |
| 585,082 |
Cash Flow Statement
(in BRL thousand)
| December 31, 2021 |
| December 31, 2020 | ||
Cash flow from operating activities |
|
|
| ||
Net profit for the year | 125,957 |
| 127,654 | ||
Adjustments for: |
|
|
| ||
Depreciation and amortization | 48,354 |
| 29,882 | ||
Gain/loss on the sale of property, plant and equipment and intangible assets | 1,237 |
| 689 | ||
Interest, monetary variation and exchange rate changes | 45,627 |
| 7,789 | ||
Interest on accounts payable for business combinations | 3,091 |
| - | ||
Interest on lease | 6,369 |
| 5,023 | ||
Unrealized loss (gain) on financial instruments | 3,084 |
| (2,512 | ) | |
Income tax expenses | 84,417 |
| 65,137 | ||
Impairment losses on trade receivables | 280 |
| 414 | ||
Provision for (reversal of) impairment losses on trade receivables and contract assets | 217 |
| (218 | ) | |
Write-off of intangible assets | 21,894 |
| - | ||
Provision for labor risks | 472 |
| (12 | ) | |
Provision for indemnity | - |
| (18 | ) | |
Share-based plan | 2,531 |
| 942 | ||
Exchange rate changes on indemnity | - |
| (4,324 | ) | |
Others | 98 |
| 469 | ||
Variation in operating assets and liabilities |
|
|
| ||
Trade receivables | (102,300 | ) |
| (47,848 | ) |
Contract assets | (52,876 | ) |
| (8,339 | ) |
Other taxes recoverable | (13,806 | ) |
| 461 | |
Tax assets | (91 | ) |
| 507 | |
Judicial deposits | 4 |
| - | ||
Suppliers | 12,215 |
| 6,746 | ||
Salaries and welfare charges | 63,083 |
| 49,086 | ||
Tax liabilities | (17,364 | ) |
| (12,275 | ) |
Other taxes payable | 1,698 |
| (407 | ) | |
Contract liabilities | 1,922 |
| (7,138 | ) | |
Payment of share-based indemnity | (628 | ) |
| (43,354 | ) |
Other receivables and payables, net | (21,054 | ) |
| (11,435 | ) |
Cash generated from operating activities | 214,431 |
| 156,919 | ||
Income tax paid | (64,150 | ) |
| (47,044 | ) |
Interest paid on loans and borrowings | (12,149 | ) |
| (3,880 | ) |
Interest paid on lease | (5,753 | ) |
| (5,023 | ) |
Net cash from operating activities | 132,379 |
| 100,972 | ||
Cash flows from investment activities: |
|
|
| ||
Acquisition of property, plant and equipment and intangible assets | (29,907 | ) |
| (21,391 | ) |
Financial investment application | (784,915 | ) |
| - | |
Acquisition of subsidiary net of cash acquired | (692,722 | ) |
| - | |
Net cash used in investment activities | (1,507,544 | ) |
| (21,391 | ) |
Cash flow from financing activities: |
|
|
| ||
Share-based plan contributions | 1,282 |
| - | ||
Issuance of common shares at initial public offering | 915,947 |
| - | ||
Transaction cost of offering | (55,874 | ) |
| - | |
Dividends paid | (126,045 | ) |
| (30,977 | ) |
Interest on equity, paid | (6,288 | ) |
| (4,276 | ) |
Payment of lease liabilities | (17,656 | ) |
| (15,500 | ) |
Proceeds from loans and borrowings | 740,596 |
| 144,269 | ||
Payment of loans and borrowings | (75,196 | ) |
| (88,107 | ) |
Net cash from financing activities | 1,376,766 |
| 5,409 | ||
Net increase in cash and cash equivalents | 1,601 |
| 84,990 | ||
Cash and cash equivalents as of January 1st | 162,827 |
| 79,500 | ||
Exchange variation effect on cash and cash equivalents | (20,949 | ) |
| (1,663 | ) |
Cash reduction due to spin-off effect | (7,752 | ) |
| - | |
Cash and cash equivalents as of December 31, 2021 | 135,727 |
| 162,827 |
Pro Forma- Statement of profit and loss (Unaudited )
(in BRL thousand)
| CI&T | Dextra | Transaction Accounting Adjustments | CI&T Pro forma 2021 | |||||||
Net revenue | 1,444,380 | 172,959 | - | 1,617,339 | |||||||
Costs of services provided | (935,732 | ) | (103,207 | ) | - | (1,038,939 | ) | ||||
Gross profit | 508,648 | 69,752 | - | 578,400 | |||||||
Selling expenses | (89,654 | ) | (1,021 | ) | - | (90,675 | ) | ||||
General and administrative expenses | (151,681 | ) | (20,010 | ) | (14,927 | ) | (186,618 | ) | |||
Research and technological innovation expenses | (4 | ) | - | - | (4 | ) | |||||
Impairment loss on trade receivables and contract assets | (497 | ) | 92 | - | (405 | ) | |||||
Other income (expenses) net | (22,206 | ) | (884 | ) | - | (23,090 | ) | ||||
Operating profit before financial income and tax | 244,606 | 47,929 | (14,927 | ) | 277,608 | ||||||
Finance income | 69,816 | 224 | - | 70,040 | |||||||
Finance cost | (104,048 | ) | (1,852 | ) | (28,794 | ) | (134,694 | ) | |||
Net finance costs | (34,232 | ) | (1,628 | ) | (28,794 | ) | (64,654 | ) | |||
Profit before Income tax | 210,374 | 46,301 | (43,721 | ) | 212,954 | ||||||
Income tax | (84,417 | ) | (14,358 | ) | 14,865 | (83,910 | ) | ||||
Current | (95,375 | ) | (12,740 | ) | 14,865 | (93,250 | ) | ||||
Deferred | 10,958 | (1,618 | ) | - | 9,341 | ||||||
Net profit for the period | 125,957 | 31,943 | (28,856 | ) | 129,044 | ||||||
Income attributable to: |
|
|
|
| |||||||
Controlling shareholders | 125,957 | 31,943 | (28,856 | ) | 129,044 | ||||||
Net profit for the period | 125,957 | 31,943 | (28,856 | ) | 129,044 | ||||||
Earnings per share |
|
|
|
| |||||||
Earnings per share – basic (in R$) | 1.030 |
|
| 1.060 | |||||||
Earnings per share – diluted (in R$) | 1.010 |
|
| 1.030 |
APPENDIX
Reconciliation of Non-IFRS measures - Pro Forma, including the Dextra acquisition as if the acquisition had occurred on January 1, 2021 (Unaudited)
(in BRL thousand)
| 2021 |
| 2020 | ||
Pro forma Net Revenue | 1,617,339 |
| 1,160,555 | ||
Pro forma Cost | (1,038,939 | ) |
| (717,701 | ) |
Pro forma Gross Profit | 578,400 |
| 442,854 | ||
Pro forma Selling, general, and administrative | (277,297 | ) |
| (210,678 | ) |
Pro forma Impairment loss on trade receivables and contract assets | (405 | ) |
| (258 | ) |
Pro forma Other income (expenses) net | (23,090 | ) |
| (789 | ) |
Pro forma Operating profit before financial income | 277,608 |
| 231,129 | ||
Pro forma Net finance expense | (64,654 | ) |
| (58,825 | ) |
Pro forma Profit before Income tax | 212,954 |
| 172,304 | ||
Pro forma Income Tax | (83,910 | ) |
| (57,702 | ) |
Pro forma Net profit for the period | 129,044 |
| 114,602 | ||
Reconciliation of Pro forma Adjusted Gross Profit |
|
|
| ||
Pro forma Gross Profit | 578,400 |
| 442,854 | ||
Adjustments |
|
|
| ||
Depreciation and amortization (cost of services provided) | 37,004 |
| 28,591 | ||
Stock Options | 1,930 |
| 139 | ||
Adjusted Pro forma Gross Profit | 617,335 |
| 471,584 | ||
Adjusted Pro forma Gross Profit Margin | 38.0 | % |
| 40.6 | % |
Reconciliation of Pro forma EBITDA |
|
|
| ||
Pro forma Net profit for the period | 129,044 |
| 114,602 | ||
Adjustments |
|
|
| ||
Net finance expense | 64,654 |
| 58,825 | ||
Income tax expense | 83,910 |
| 57,702 | ||
Depreciation and amortization | 71,779 |
| 64,587 | ||
Pro forma EBITDA | 349,387 |
| 295,716 | ||
Pro forma EBITDA Margin | 21.6 | % |
| 25.5 | % |
Reconciliation of Adjusted Pro forma EBITDA |
|
|
| ||
Pro forma Net profit for the period | 129,044 |
| 114,602 | ||
Adjustments |
|
|
| ||
Net finance expense | 64,654 |
| 58,825 | ||
Income tax expense | 83,910 |
| 57,702 | ||
Depreciation and amortization | 71,779 |
| 64,587 | ||
Stock Options | 2,531 |
| 934 | ||
Consultant Expenses | 9,177 |
| 1,706 | ||
Government grants | (2,481 | ) |
| (1,571 | ) |
Impairment | 21,895 |
| 0 | ||
Indemnity | 0 |
| (18 | ) | |
Adjusted Pro forma EBITDA | 380,508 |
| 296,767 | ||
Adjusted Pro forma EBITDA Margin | 23.5 | % |
| 25.6 | % |
Reconciliation of Adjusted Pro forma Net Income |
|
|
| ||
Pro forma Net profit for the period | 129,044 |
| 114,602 | ||
Adjustments |
|
|
| ||
Business Consultant Cost | 9,177 |
| 1,706 | ||
Impairment | 21,895 |
| 0 | ||
Indemnity | 0 |
| (18) | ||
Adjusted Pro forma Net profit for the period | 160,116 |
| 116,290 | ||
Adjusted Pro forma Net profit Margin for the period | 9.9 | % |
| 10.0 | % |
NET REVENUE AT CONSTANT CURRENCY | Three months ended December 31, |
| Full year ended December 31, | ||||
| 2021 |
| 2020 |
| 2021 |
| 2020 |
Net Revenue at Constant Currency | 448,375 |
| 265,292 |
| 1,408,679 |
| 958,142 |
 |
KPMG Auditores Independentes Ltda.
Av. Coronel Silva Teles, 977, 10º andar, Conjuntos 111 e 112 - Cambuí
Edifício Dahruj Tower
13024-001 - Campinas/SP - Brasil
Caixa Postal 737 - CEP: 13012-970 - Campinas/SP - Brasil
Telefone +55 (19) 3198-6000
kpmg.com.br
To the Management, Those Charged with Governance and Shareholders of
CI&T Inc.
Opinion
We have audited the consolidated financial statements of CI&T Inc. (“the Company”), which comprise the consolidated statement of financial position as at December 31, 2021, the consolidated statements of profit or loss, other comprehensive income, changes in equity and cash flows for the year then ended, and notes, comprising significant accounting policies and other explanatory information.
In our opinion, the accompanying consolidated financial statements present fairly, in all material respects, the consolidated financial position of the Company as at December 31, 2021, and its consolidated financial performance and its consolidated cash flows for the year then ended in accordance with International Financial Reporting Standards (IFRS) as issued by the International Accounting Standards Board (IASB).
Basis for Opinion
We conducted our audit in accordance with International Standards on Auditing (ISAs). Our responsibilities under those standards are further described in the Auditors’ Responsibilities for the Audit of the Consolidated Financial Statements section of our report. We are independent of the Company in accordance with the relevant ethical requirements included in the Accountant Professional Code of Ethics (“Código de Ética Profissional do Contador”) and in the professional standards issued by the Brazilian Federal Accounting Council (“Conselho Federal de Contabilidade”) and we have fulfilled our other ethical responsibilities in accordance with these requirements. We believe that the audit evidence we have obtained is sufficient and appropriate to provide a basis for our opinion.
Key Audit Matters
Key audit matters are those matters that, in our professional judgment, were of most significance in our audit of the consolidated financial statements of the current year. These matters were addressed in the context of our audit of the consolidated financial statements as a whole, and in forming our opinion thereon, and we do not provide a separate opinion on these matters.
Assessment of the initial fair value measurement of intangible assets acquired through the business combination of Dextra | |
Note nº 9 to the consolidated financial statements | |
Key audit matters | How the matter was addressed in our audit |
During the fiscal year 2021, the Company acquired control of Dextra Investimentos S.A. and its subsidiaries (“Dextra”). The acquisitions were completed in 2021, after approval by regulatory bodies and compliance with legal formalities. The acquisition is considered a business combination.
The fair value of the acquired intangible assets was determined based on the estimated future cash flows to be generated from the acquired assets. The definition of useful life for the identified assets used to estimate the fair value of the acquired intangible assets involved a high degree of judgment and effort due to the significant measurement of methodology and uncertainty in the assumptions. Due to the relevance and high degree of judgment involved in the fair value measurement of intangible assets acquired, we consider this matter to be significant for our audit work. | We analyzed the acquisition was considered a business combination agreement and with the technical support of our specialists in corporate finance, we evaluated the reasonableness and consistency of the methodology used to measure the fair value attributed to the acquired assets, identified intangibles, as well as the assumption of useful life estimates used in the projection of cash flows compared with reference market values. The assessment of the disclosures made by the Company in the consolidated financial statements was also part of our procedures. Based on the evidence obtained through the procedures described above, we believe that the fair value measurement of intangible assets acquired, recognition and disclosure of the business combination is reasonable in the context of the financial statements taken as a whole. |
Responsibilities of Management and Those Charged with Governance for the Consolidated Financial Statements
Management is responsible for the preparation and fair presentation of the consolidated financial statements in accordance with IFRS as issued by the IASB, and for such internal control as management determines is necessary to enable the preparation of consolidated financial statements that are free from material misstatement, whether due to fraud or error.
In preparing the consolidated financial statements, management is responsible for assessing the Company’s ability to continue as a going concern, disclosing, as applicable, matters related to going concern and using the going concern basis of accounting unless management either intends to liquidate the Company or to cease operations, or has no realistic alternative but to do so.
Those charged with governance are responsible for overseeing the Company’s financial reporting process.
Auditors’ Responsibilities for the Audit of the Consolidated Financial Statements
Our objectives are to obtain reasonable assurance about whether the consolidated financial statements as a whole are free from material misstatement, whether due to fraud or error, and to issue an auditors’ report that includes our opinion. Reasonable assurance is a high level of assurance, but is not a guarantee that an audit conducted in accordance with ISAs will always detect a material misstatement when it exists. Misstatements can arise from fraud or error and are considered material if, individually or in the aggregate, they could reasonably be expected to influence the economic decisions of users taken on the basis of these consolidated financial statements.
As part of an audit in accordance with ISAs, we exercise professional judgment and maintain professional skepticism throughout the audit. We also:
- Identify and assess the risks of material misstatement of the consolidated financial statements, whether due to fraud or error, design and perform audit procedures responsive to those risks, and obtain audit evidence that is sufficient and appropriate to provide a basis for our opinion. The risk of not detecting a material misstatement resulting from fraud is higher than for one resulting from error, as fraud may involve collusion, forgery, intentional omissions, misrepresentations, or the override of internal control.
- Obtain an understanding of internal control relevant to the audit in order to design audit procedures that are appropriate in the circumstances, but not for the purpose of expressing an opinion on the effectiveness of the Company’s internal control.
- Evaluate the appropriateness of accounting policies used and the reasonableness of accounting estimates and related disclosures made by management.
- Conclude on the appropriateness of management’s use of the going concern basis of accounting and, based on the audit evidence obtained, whether a material uncertainty exists related to events or conditions that may cast significant doubt on the Company’s ability to continue as a going concern. If we conclude that a material uncertainty exists, we are required to draw attention in our auditors’ report to the related disclosures in the consolidated financial statements or, if such disclosures are inadequate, to modify our opinion. Our conclusions are based on the audit evidence obtained up to the date of our auditors’ report. However, future events or conditions may cause the Company to cease to continue as a going concern.
- Evaluate the overall presentation, structure and content of the consolidated financial statements, including the disclosures, and whether the consolidated financial statements represent the underlying transactions and events in a manner that achieves fair presentation.
- Obtain sufficient appropriate audit evidence regarding the financial information of the entities or business activities within the Company to express an opinion on the consolidated financial statements. We are responsible for the direction, supervision and performance of the group audit. We remain solely responsible for our audit opinion.
We communicate with those charged with governance regarding, among other matters, the planned scope and timing of the audit and significant audit findings, including any significant deficiencies in internal control that we identify during our audit.
We also provide those charged with governance with a statement that we have complied with relevant ethical requirements regarding independence, and communicate with them all relationships and other matters that may reasonably be thought to bear on our independence, and where applicable, actions taken to eliminate threats or safeguards applied.
From the matters communicated with those charged with governance, we determine those matters that were of most significance in the audit of the consolidated financial statements of the current period and are therefore the key audit matters. We describe these matters in our auditors’ report unless law or regulation precludes public disclosure about the matter or when, in extremely rare circumstances, we determine that a matter should not be communicated in our report because the adverse consequences of doing so would reasonably be expected to outweigh the public interest benefits of such communication.
Campinas, Brazil
March 9, 2022
KPMG Auditores Independentes
CRC 2SP014428/O-6
Marcio José dos Santos
CRC Accountant 1SP252906/O-0
Consolidated statement of financial position as of December 31, 2021 and 2020
(In thousands of Brazilian Reais - R$)
Assets | Note | December 31, 2021 |
| December 31, 2020 |
| Liabilities and equity | Note | December 31, 2021 |
| December 31, 2020 | |||||||
Cash and cash equivalents | 10.1 | 135,727 |
| 162,827 |
| Suppliers and other payables |
| 33,566 |
| 15,312 | |||||||
Financial investments | 10.2 | 798,786 |
| - |
| Loans and borrowings | 16 | 164,403 |
| 75,377 | |||||||
Trade receivables | 11 | 340,519 |
| 196,256 |
| Lease liabilities | 15.b | 21,214 |
| 14,569 | |||||||
Contract assets | 23 | 134,388 |
| 50,625 |
| Salaries and welfare charges | 17 | 234,173 |
| 141,794 | |||||||
Recoverable taxes |
| 7,785 |
| 1,016 |
| Accounts payable for business combination | 18 | 48,923 |
| - | |||||||
Tax assets |
| 2,810 |
| 2,117 |
| Derivatives | 28.1 | 535 |
| 5,392 | |||||||
Derivatives | 28.1 | 896 |
| 8,837 |
| Tax liabilities |
| 13,345 |
| 6,078 | |||||||
Other assets | 12 | 29,994 |
| 12,874 |
| Other taxes payable |
| 5,423 |
| 3,279 | |||||||
|
|
|
|
|
| Dividends and interest on equity payable | 22 | - |
| 30,677 | |||||||
Total current assets |
| 1,450,905 |
| 434,552 |
| Contract liability |
| 13,722 |
| 9,987 | |||||||
|
|
|
|
|
| Indemnity | 21.c | - |
| 628 | |||||||
|
|
| Other liabilities |
| 13,669 |
| 7,899 | ||||||||||
Recoverable taxes | 3,046 |
| 3,099 |
| Total current liabilities |
| 548,973 |
| 310,992 | ||||||||
Deferred tax | 26 | 31,989 |
| 15,152 |
|
|
|
|
|
| |||||||
Judicial deposits | 19 | 3,079 |
| 3,083 |
|
|
|
|
|
| |||||||
Other assets | 12 | 2,974 |
| 2,494 |
| Loans and borrowings | 16 | 624,306 |
| 13,853 | |||||||
Property, plant and equipment | 13 | 57,721 |
| 38,771 |
| Lease liabilities | 15.b | 60,674 |
| 60,659 | |||||||
Intangible assets | 14 | 738,803 |
| 18,166 |
| Provisions | 19 | 633 |
| 161 | |||||||
Right-of-use assets | 15.a | 73,827 |
| 69,765 |
| Accounts payable for business combination | 18 | 36,803 |
| - | |||||||
Total non-current assets |
| 911,439 |
| 150,530 |
| Other liabilities |
| 1,660 |
| 957 | |||||||
|
|
|
|
|
| Total non-current liabilities |
| 724,076 |
| 75,630 | |||||||
|
|
|
|
|
|
|
|
|
|
| |||||||
|
|
|
|
|
| Equity | 22 |
|
|
| |||||||
|
|
|
|
|
| Share capital |
| 36 |
| 68,968 | |||||||
|
|
|
|
|
| Share premium |
| 915,947 |
| - | |||||||
|
|
|
|
|
| Capital reserves |
| 10,105 |
| 6,764 | |||||||
|
|
|
|
|
| Profit reserves |
| 125,957 |
| 109,308 | |||||||
|
|
|
|
|
| Other comprehensive income |
| 37,250 |
| 13,420 | |||||||
|
|
|
|
|
| Total equity |
| 1,089,295 |
| 198,460 | |||||||
|
|
|
|
|
|
|
|
|
|
| |||||||
Total assets | 2,362,344 |
| 585,082 |
| Total equity and liabilities | 2,362,344 |
| 585,082 |
The accompanying notes are an integral part of these consolidated financial statements
CI&T Inc.
For the years ended on December 31, 2021 and 2020
(In thousands of Brazilian Reais – R$)
| Note | December 31, 2021 |
| December 31, 2020 | ||||
Net revenue | 23 | 1,444,380 |
| 956,519 | ||||
Costs of services provided | 24 | (935,732 | ) |
| (600,866 | ) | ||
Gross profit |
| 508,648 |
| 355,653 | ||||
Selling expenses | 24 | (89,654 | ) |
| (65,093 | ) | ||
General and administrative expenses | 24 | (151,681 | ) |
| (81,161 | ) | ||
Research and technological innovation expenses | 24 | (4 | ) |
| (3,462 | ) | ||
Impairment loss on trade receivables and contract assets | 24 | (497 | ) |
| (196 | ) | ||
Other income (expenses) net | 24 | (22,206 | ) |
| 2,503 | |||
|
| (264,042 | ) |
| (147,409 | ) | ||
Operating profit before financial income and tax |
| 244,606 |
| 208,244 | ||||
Finance income | 25 | 69,816 |
| 47,808 | ||||
Finance cost | 25 | (104,048 | ) |
| (63,261 | ) | ||
Net finance costs |
| (34,232 | ) |
| (15,453 | ) | ||
Profit before income tax |
| 210,374 |
| 192,791 | ||||
Income tax expense |
|
|
|
| ||||
Current | 26 | (95,375 | ) |
| (66,912 | ) | ||
Deferred | 26 | 10,958 |
| 1,775 | ||||
Net profit for the year |
| 125,957 |
| 127,654 | ||||
Income attributable to: |
|
|
|
| ||||
Controlling shareholders |
| 125,957 |
| 127,654 | ||||
Net profit for the year |
| 125,957 |
| 127,654 | ||||
Earnings per share |
|
|
|
| ||||
Earnings per share – basic (in R$) | 27 | 1.03 |
| 1.06 | ||||
Earnings per share – diluted (in R$) | 27 | 1.01 |
| 1.04 |
The accompanying notes are an integral part of these consolidated financial statements.
24 |
Table of Contents
CI&T Inc.
Consolidated statement of other comprehensive income
For the years ended on December 31, 2021 and 2020
(In thousands of Brazilian Reais – R$)
| Note | December 31, 2021 |
| December 31, 2020 | ||||
Net profit for the year |
| 125,957 |
| 127,654 | ||||
Other comprehensive income (OCI): |
|
|
|
| ||||
Items that are or may be reclassified subsequently to profit or loss |
|
|
|
| ||||
Exchange variation in foreign investments | 22.d | 23,830 |
| 9,620 | ||||
Total comprehensive income for the year |
| 149,787 |
| 137,274 | ||||
Total comprehensive income attributed to |
|
|
|
| ||||
Owners of the Company |
| 149,787 |
| 137,274 | ||||
Total comprehensive income for the year |
| 149,787 |
| 137,274 |
The accompanying notes are an integral part of these consolidated financial statements.
CI&T Inc.
Consolidated statement of changes in equity
For the years ended on December 31, 2021 and 2020
(In thousands of Brazilian Reais – R$)
|
|
|
|
|
|
|
| Profit reserves |
|
|
|
|
|
|
| |||||||||||
| Notes | Share capital |
| Share premium |
| Capital reserve |
| Legal reserve |
| Retained earnings reserve |
| Retained earnings |
| Other comprehensive income |
| Total equity |
| |||||||||
Balance as of January 1, 2020 |
| 68,968 |
| - |
| 4,112 |
| 8,846 |
| 23,979 |
| - |
| 3,800 |
| 109,705 |
| |||||||||
Net profit for the year |
| - |
| - |
| - |
| - |
| - |
| 127,654 |
| - |
| 127,654 |
| |||||||||
Additional dividends related to 2019 approved at Extraordinary general meeting (EGM) held as of July 30, 2020 | 22.e | - |
| - |
| - |
| - |
| (16,263 | ) |
| - |
| - |
| (16,263 | ) |
| |||||||
Other comprehensive income for the year | 22.d | - |
| - |
| - |
| - |
| - |
| - |
| 9,620 |
| 9,620 |
| |||||||||
Share-based compensation | 21.e | - |
| - |
| 2,652 |
| - |
| - |
| - |
| - |
| 2,652 |
| |||||||||
Tax effect on the compensation of the share-based plan | 26 | - |
| - |
| - |
| - |
| 45 |
| - |
| - |
| 45 |
| |||||||||
Interest on shareholders´ equity | 22.e | - |
| - |
| - |
| - |
| - |
| (4,276 | ) |
| - |
| (4,276 | ) |
| |||||||
Legal reserve |
| - |
| - |
| - |
| 4,947 |
| - |
| (4,947 | ) |
| - |
| - |
| ||||||||
Minimum mandatory dividends |
| - |
| - |
| - |
| - |
| - |
| (30,677 | ) |
| - |
| (30,677 | ) |
| |||||||
Constitution of retained earnings reserve |
| - |
| - |
| - |
| - |
| 87,754 |
| (87,754 | ) |
| - |
| - |
| ||||||||
Balances as of December 31, 2020 |
| 68,968 |
| - |
| 6,764 |
| 13,793 |
| 95,515 |
| - |
| 13,420 |
| 198,460 |
| |||||||||
Net profit for the year |
| - |
| - |
| - |
| - |
| - |
| 125,957 |
| - |
| 125,957 |
| |||||||||
Spin-off of the CI&T IOT | 1.a/22.a. | (9,426 | ) |
| - |
| 597 |
| - |
| - |
| - |
| - |
| (8,829 | ) |
| |||||||
Merger of Hoshin investment | 1.a | - |
| - |
| 108 |
| - |
| - |
| - |
| - |
| 108 |
| |||||||||
Additional dividends of 2020 | 22.e | - |
| - |
| - |
| - |
| (95,368 | ) |
| - |
| - |
| (95,368 | ) |
| |||||||
Shares exercised of executive officers | 21.d | 28,697 |
| - |
| (28,697 | ) |
| - |
| - |
| - |
| - |
| - |
| ||||||||
Share-based compensation | 21.e | - |
| - |
| 2,498 |
| - |
| - |
| - |
| - |
| 2,498 |
| |||||||||
Tax effect on the compensation of the share-based plan | 26 | - |
| - |
| - |
| - |
| (147 | ) |
| - |
| - |
| (147 | ) |
| |||||||
Interest on shareholders’ equity | 22.e | - |
| - |
| - |
| - |
| (6,288 | ) |
| - |
| - |
| (6,288 | ) |
| |||||||
Other comprehensive income for the year | 22.d | - |
| - |
| - |
| - |
| - |
| - |
| 23,830 |
| 23,830 |
| |||||||||
Corporate restructuring |
| (88,206 | ) |
| - |
| 95,711 |
| (13,793 | ) |
| 6,288 |
| - |
| - |
| - |
| |||||||
Shareholders’ contribution and distributions to shareholders |
|
|
|
|
|
|
|
|
|
|
|
|
|
|
|
|
| |||||||||
Capital contribution | 22.a | 3 |
| - |
| - |
| - |
| - |
| - |
| - |
| 3 |
| |||||||||
Initial public offering proceeds, gross | 22.b | - |
| 915,947 |
| - |
| - |
| - |
| - |
| - |
| 915,947 |
| |||||||||
Initial public offering costs, net of taxes | 22.c | - |
| - |
| (66,876 | ) |
| - |
| - |
| - |
| - |
| (66,876 | ) |
| |||||||
Constitution of retained earnings reserve |
| - |
| - |
| - |
| - |
| 125,957 |
| (125,957 | ) |
| - |
| - |
| ||||||||
Balances as of December 31, 2021 |
| 36 |
| 915,947 |
| 10,105 |
| - |
| 125,957 |
| - |
| 37,250 |
| 1,089,295 |
| |||||||||
The accompanying notes are an integral part of these consolidated financial statements.
CI&T Inc.
Consolidated statement of cash flows
For the years ended on December 31, 2021 and 2020
(In thousands of Brazilian Reais – R$)
| Notes | December 31, 2021 |
| December 31, 2020 | |||
Cash flow from operating activities |
|
|
|
| |||
Net profit for the year |
| 125,957 |
| 127,654 | |||
Adjustments for: |
|
|
|
| |||
Depreciation and amortization | 13, 14 | 48,354 |
| 29,882 | |||
Loss on the sale of property, plant and equipment and intangible assets | 13, 14 | 1,237 |
| 689 | |||
Interest, monetary variation and exchange rate changes | 16 | 45,627 |
| 7,789 | |||
Interest on accounts payable for business combinations |
| 3,091 |
| - | |||
Interest on lease | 16 | 6,369 |
| 5,023 | |||
Unrealized loss (gain) on financial instruments |
| 3,084 |
| (2,512 | ) | ||
Income tax expenses | 26 | 84,417 |
| 65,137 | |||
Impairment losses on trade receivables | 11 | 280 |
| 414 | |||
Provision for (reversal of) impairment losses on contract assets | 23 | 217 |
| (218 | ) | ||
Write-off of intangible assets | 14 | 21,894 |
| - | |||
Provision for labor risks |
| 472 |
| (12 | ) | ||
Provision for indemnity |
| - |
| (18 | ) | ||
Share-based plan | 21.e | 2,531 |
| 942 | |||
Exchange rate changes on indemnity |
| - |
| (4,324 | ) | ||
Others |
| 98 |
| 469 | |||
Variation in operating assets and liabilities |
|
|
|
| |||
Trade receivables | 11 | (102,300 | ) |
| (47,848 | ) | |
Contract assets | 23 | (52,876 | ) |
| (8,339 | ) | |
Other taxes recoverable |
| (13,806 | ) |
| 461 | ||
Tax assets |
| (91 | ) |
| 507 | ||
Judicial deposits | 19 | 4 |
| - | |||
Suppliers |
| 12,215 |
| 6,746 | |||
Salaries and welfare charges | 17 | 63,083 |
| 49,086 | |||
Tax liabilities |
| (17,364 | ) |
| (12,275 | ) | |
Other taxes payable |
| 1,698 |
| (407 | ) | ||
Contract liabilities |
| 1,922 |
| (7,138 | ) | ||
Payment of share-based indemnity | 21 | (628 | ) |
| (43,354 | ) | |
Other receivables and payables, net |
| (21,054 | ) |
| (11,435 | ) | |
Cash generated from operating activities |
| 214,431 |
| 156,919 | |||
Income tax paid | 26 | (64,150 | ) |
| (47,044 | ) | |
Interest paid on loans and borrowings | 16 | (12,149 | ) |
| (3,880 | ) | |
Interest paid on lease | 16 | (5,753 | ) |
| (5,023 | ) | |
Net cash from operating activities |
| 132,379 |
| 100,972 | |||
Cash flows from investment activities |
|
|
|
| |||
Acquisition of property, plant and equipment and intangible assets | 13, 14 | (29,907 | ) |
| (21,391 | ) | |
Financial investment application |
| (784,915 | ) |
| - | ||
Acquisition of subsidiary net of cash acquired | 9, 9.c | (692,722 | ) |
| - | ||
Net cash used in investment activities |
| (1,507,544 | ) |
| (21,391 | ) | |
Cash flow from financing activities |
|
|
|
| |||
Share-based plan contributions | 21 | 1,282 |
| - | |||
Issuance of common shares at initial public offering | 1 | 915,947 |
| - | |||
Transaction cost of offering | 1 | (55,874 | ) |
| - | ||
Dividends paid | 22.e | (126,045 | ) |
| (30,977 | ) | |
Interest on equity, paid | 22.e | (6,288 | ) |
| (4,276 | ) | |
Payment of lease liabilities | 15.b | (17,656 | ) |
| (15,500 | ) | |
Proceeds from loans and borrowings | 16 | 740,596 |
| 144,269 | |||
Payment of loans and borrowings | 16 | (75,196 | ) |
| (88,107 | ) | |
Net cash from financing activities |
| 1,376,766 |
| 5,409 | |||
Net increase in cash and cash equivalents |
| 1,601 |
| 84,990 | |||
Cash and cash equivalents as of January 1st |
| 162,827 |
| 79,500 | |||
Exchange variation effect on cash and cash equivalents |
| (20,949 | ) |
| (1,663 | ) | |
Cash reduction due to spin-off effect | 1 | (7,752 | ) |
| - | ||
Cash and cash equivalents as of December 31, 2021 |
| 135,727 |
| 162,827 |
The accompanying notes are an integral part of these consolidated financial statements.
CI&T Inc.
Consolidated financial statements
December 31, 2021
(Amounts in thousands of Brazilian Reais – R$, unless otherwise stated)
1 Operational context
CI&T Inc (“CI&T” or “Company”), previously named CI&T Cayman, is a publicly held company incorporated in the Cayman Islands on June 2021, headquartered at Rua Dr. Ricardo Benetton Martins, 1000, Pólis de Tecnologia, in the City of Campinas, State of São Paulo, Brazil. As a holding company, it is mainly engaged in the investment, as a partner or shareholder, in other companies, consortia or joint ventures in Brazil and other countries where most of the Company’s operations are located. The Company’s subsidiaries are mainly engaged in the development of customizable software through implementation of software solutions, including Machine Learning, Artificial Intelligence (AI), Analytics, Cloud and Mobility technologies.
These consolidated financial statements comprise the Company and its subsidiaries (collectively referred to as the “Group”).
Unless otherwise indicated or if the context otherwise requires, all references in these consolidated financial statements to “CI&T Brazil” refer to CI&T Software S.A., one of the Company’s subsidiaries.
On November 10, 2021 the Company completed its initial public offering (“IPO”) and CI&T Inc offered 15,000,000 Class A common shares, of which 11,111,111 were offered by CI&T Inc and 3,888,889 were offered by certain selling shareholders. The IPO price per Class A common share was US$15.00. On November 15, 2021, the IPO was concluded with the total offering of US$225,000, of which the Group received net proceeds of R$ 860,993 (US$156,667), after deducting the underwriting discounts and commissions. The Company incurred incremental costs directly attributable to the public offering in the amount of R$ 66,876, net of taxes. The Group Class A common shares are traded on the New York Stock Exchange, or NYSE, under the symbol “CINT”.
- Corporate restructuring
- Mergers in 2021 – in connection with CI&T Brazil
On April 30, 2021, the Extraordinary Shareholders’ Meeting of CI&T Brazil approved the reverse merger of Hoshin Empreendimentos S.A. (“Hoshin”) into CI&T Brazil. The purpose of this merger is to simplify the corporate structure of Hoshin and CI&T Brazil, and to reduce the operational, administrative, and financial expenses of both. The transaction was recorded at book value in the amount of R$108.
- Spin-off in 2021 – in connection with CI&T Brazil
The Extraordinary Shareholders’ Meeting of CI&T Brazil, held on April 30, 2021 approved the partial spin-off of the interest in subsidiary CI&T IOT Comércio de Hardware e Software Ltda. (“CI&T IOT”). The valuation of the spin-off portion was carried out at book value based on the statement of financial position of CI&T IOT as of March 31, 2021.
- Reorganization transactions in 2021 – in connection with CI&T Inc
CI&T Inc. was incorporated as an exempted, limited liability company in Cayman Islands to become the holding entity of CI&T Software S.A. (CI&T Brazil) in connection with the initial public offering. Prior to the IPO, CI&T Inc had not begun operations, had nominal assets and liabilities, and no material contingent liabilities or commitments. As a holding company, it is mainly engaged in the investment in other companies, consortia or joint ventures, as a partner or shareholder, in Brazil and other countries where most of the Company’s operations are located.
CI&T Inc.
Consolidated financial statements
December 31, 2021
On October 04, 2021, CI&T established, as a sole member, the subsidiary CI&T Delaware LLC (“CI&T Delaware”). The main office is located at 251 Little Falls Drive, Wilmington, Delaware, 19808. On November 8, 2021, all CI&T Brazil’s shares were contributed to CI&T Delaware and, subsequently the CI&T Delaware’s shares were transferred to CI&T Inc. Until this corporate reorganization, CI&T Brazil, an operating company, was the ultimate holding of the Group, and it consolidated the results of all companies until that date.
The Group accounted for the restructuring as a business combination of entities under common control, and the pre-combination carrying amounts of CI&T Brazil are included in the CI&T’s consolidated financial statements with no fair value uplift. Thus, these consolidated financial statements reflect:
| (i) | The historical operating results and financial position of CI&T Brazil prior the restructuring; | |
| (ii) | The consolidated results of the Group following the restructuring; | |
| (iii) | The assets and liabilities of CI&T Brazil and its then subsidiaries at their historical cost; | |
| (iv) | The number of ordinary shares issued by CI&T, as a result of the restructuring is reflected retroactively to January 1, 2020, for purposes of calculating earnings per share; | |
| (v) | CI&T Brazil shares were contributed in CI&T Delaware at its book value as at November 8, 2021; | |
| (vi) | As the remaining equity reserves of CI&T Brazil are no longer applicable to CI&T, they were added to the initial capital reserve balance (see note 22.c). |
CI&T Inc.
Consolidated financial statements
December 31, 2021
2 List of direct and indirect subsidiaries
Information on the Company’s direct and indirect subsidiaries is presented below:
|
|
| December 31,2021 |
| December 31,2020 | ||
Subsidiaries | Country of Origin |
| Direct | Indirect |
| Direct | Indirect |
CI&T Delaware LLC (a) | United States |
| 100% | - |
| - | - |
CI&T Software S.A. | Brazil |
| - | 100% |
| - | - |
CI&T, Inc. (“CI&T US”) | United States |
| - | 100% |
| 100% | - |
CI&T Software Inc. (“CI&T Canada”) | Canada |
| - | 100% |
| - | 100% |
CI&T UK Limited. (“CI&T UK”) | United Kingdom |
| - | 100% |
| - | 100% |
CI&T Argentina S/A | Argentina |
| - | 100% |
| - | 100% |
|
|
|
|
|
|
|
|
CI&T Japan, Inc. | Japan |
| - | 100% |
| 100% | - |
CI&T China Inc. | China |
| - | 100% |
| - | 100% |
|
|
|
|
|
|
|
|
CI&T IOT (b) | Brazil |
| - | - |
| 100% | - |
CI&T Portugal Unipessoal Lda. (c) | Portugal |
| - | 100% |
| 100% | - |
CI&T Australia PTY Ltd. (d) | Australia |
| - | 100% |
| 100% | - |
Dextra Inc. (e) | United States |
| - | 100% |
| - | - |
CINQ Inc. (e) | United States |
| - | 100% |
| - | - |
| (a) | Refers to note 1.a.iii. |
| (b) | In July 2019, the subsidiary CI&T IOT Comércio de Hardware e Software Ltda. started its operations. The subsidiary’s main activity is the sale of technology devices and software on environment management platforms for efficient use of spaces. In April 2021, the partial spin-off on the CI&T IOT investment was approved with transfer of its net equity to the CI&T Brazil’s shareholders. |
| (c) | In June 2020, the subsidiary CI&T Portugal Unipessoal LDA (“CI&T Portugal”) started operations in the city of Lisbon to meet the strategy of global expansion and strengthen the presence in the European market, acting with the same corporate purpose as the Group. |
| (d) | In October 2020, the subsidiary CI&T Australia PTY LTD was incorporated in the city of Brisbane, acting with the same corporate purpose as the Group. |
| (e) | In August 2021, the CI&T Brazil completed the acquisition of 100% of the shareholding control of Dextra Investimentos S.A. and its subsidiaries (see note 9). |
CI&T Inc.
Consolidated financial statements
December 31, 2021
3 Basis of accounting
These consolidated financial statements were prepared in accordance with the International Financial Reporting Standards (IFRS) as issued by the International Accounting Standards Board (IASB).
The issuance of these consolidated financial statements was authorized by the Company’s Management and Audit Committee on March 09, 2022.
4 Functional and presentation currency
These consolidated financial statements are presented in Brazilian Reais (“R$”), which is the Company's functional currency. All balances are rounded to the nearest thousands, except when otherwise indicated.
The main exchange rates used in the preparation of the Company's financial statements are Brazilian Reais, US dollar, Yen, Euro and Australian dollar, as the Company’s subsidiaries have the following functional currencies: CI&T Brazil has the local currency, the Brazilian Reais, as its functional currency; CI&T Inc (USA) has the local currency, the US dollar, as its functional currency; CI&T Japan Inc has the local currency, Yen, as its functional currency; CI&T Portugal has the local currency, Euro, as its functional currency; and CI&T Australia has the local currency, Australian dollar, as its functional currency.
5 Use of judgments and estimates
In preparing these consolidated financial statements, Management has made judgments and estimates that affect the application of the Company's accounting policies and the reported amounts of assets, liabilities, income and expenses. Actual results may differ from these estimates.
Estimates and underlying assumptions are reviewed on an ongoing basis. The revisions to estimates are recognized prospectively.
a. Judgments
Information about judgments made in the application of accounting policies that have significant effects on the amounts recognized in the financial statements are included in the following notes:
- Note – 7 - lease term: whether the Group is reasonably certain to exercise extension options;
- Note – 23 - revenue recognition: whether service revenue is recognized over time or at point in time.
b. Assumptions and estimation uncertainties
Information about assumptions and estimation uncertainties that have a significant risk of resulting in a material adjustment to the carrying amounts of assets and liabilities in the next fiscal year is included in the following note:
- Note 9 – acquisition of subsidiary: fair value of the consideration transferred, fair value of the assets acquired, and liabilities assumed.
CI&T Inc.
Consolidated financial statements
December 31, 2021
c. Measurement of fair values
Several of the Company’s accounting policies and disclosures require the measurement of fair values for both financial and non-financial assets and liabilities.
The Group has established a control framework with respect to the measurement of fair value that includes the review of significant fair value measurements, significant unobservable data and valuation adjustments. If third-party information, such as broker quotes or pricing services, is used to measure fair values, the valuation team assesses the evidence obtained from third parties to support the conclusion that such valuations meet the requirements of the accounting standards, including the level in the fair value hierarchy in which the valuations should be classified.
When measuring the fair value of an asset or a liability, the Group uses observable market data as much as possible. Fair values are classified at different levels in a hierarchy based on the information (inputs) used in the valuation techniques as follows:
| • | Level 1: Quoted prices (not adjusted) in active markets for identical assets or liabilities. | |
| • | Level 2: Inputs, except for quoted prices, included in Level 1, which are observable for the asset or liability, either directly (prices) or indirectly (derived from prices). | |
| • | Level 3: Inputs for the asset or liability, which are not based on observable market data (unobservable inputs). |
Additional information on the assumptions used to measure fair values is included in the following notes:
| • | Note 9 – business combination - acquisition of subsidiary; | |
| • | Note 21 – share-based payment transactions and the compensation for the cancellation of the share based plan; and | |
| • | Note 28 – financial instruments. |
CI&T Inc.
Consolidated financial statements
December 31, 2021
6 Basis of measurement
The consolidated financial statements were prepared based on historical cost, except for derivative financial instruments, and liabilities for the cancellation of the share-based plan, which are measured at fair value at each reporting date.
7 Significant accounting policies
The Company applied the accounting policies described below in a consistent manner to all the years presented in the consolidated financial statements.
- Basis of consolidation
- Business combination
The Group accounts for business combinations using the acquisition method when the acquired set of activities and assets meets the definition of a business and control is transferred to the Group. In determining whether a particular set of activities and assets is a business, the Group assesses whether the set of assets and activities acquired includes, at a minimum, an input and substantive process and whether the acquired set has the ability to produce outputs.
The consideration transferred in the acquisition is measured at fair value, as are the identifiable net assets acquired. Any goodwill that may arise is tested annually for impairment. Any gains on a bargain purchase are recognized in profit or loss immediately. Transaction costs are expensed as incurred, except if related to the issue of debt or equity securities.
The consideration transferred does not include amounts related to the settlement of pre-existing relationships. Such amounts are generally recognized in profit or loss.
Any contingent consideration is measured at fair value at the date of acquisition. If an obligation to pay contingent consideration that meets the definition of a financial instrument is classified as equity, then it is not remeasured, and settlement is accounted for within equity. Otherwise, other contingent consideration is remeasured at fair value at each reporting date and subsequent changes in the fair value of the contingent consideration are recognized in profit or loss.
- Subsidiaries
The Company controls an entity when it is exposed to, or has rights to, variable returns from its involvement with the entity and has the ability to affect those returns through its power to direct the activities of the entity. The financial statements of subsidiaries are included in the consolidated financial statements from the date in which control commences until the date in which control ceases.
- Transactions eliminated by consolidation
Intra-group balances and transactions, and any unrealized income or expenses (except for foreign currency translation gain or losses) arising from intra-group transactions, are eliminated. Unrealized losses arising are eliminated in the same way as unrealized gain, but only to the extent that there is no evidence of impairment.
- Foreign currency
- Transactions in foreign currency
Transactions in foreign currency are translated into the respective functional currencies of the Company and its subsidiaries by the exchange rates at the dates of each such transaction.
CI&T Inc.
Consolidated financial statements
December 31, 2021
Monetary assets and liabilities denominated in foreign currencies on the reporting date are translated to the functional currency at the exchange rate on that date. Non-monetary assets and liabilities that are measured at fair value in foreign currency are retranslated to the functional currency at the exchange rate on the date in which the fair value was determined. Non-monetary items that are measured based on historical cost in foreign currency are translated at the exchange rate on the transaction date. Foreign currency differences are generally recognized in profit or loss and presented within finance costs.
However, foreign currency differences resulting from the translation of investments abroad are recognized in other comprehensive income.
- Foreign operations
Assets and liabilities from foreign operations, including goodwill and fair value adjustments resulting from acquisitions, are translated into Reais at the exchange rates prevailing at the reporting date. Income and expenses from operations abroad are translated into Brazilian reais at the exchange rates that represent the average monthly rates for the respective period.
Foreign currency differences are recognized in other comprehensive income.
- Revenue from contracts with customers
Information on the Group's accounting policies related to contracts with customers is provided in note 23.
- Employee benefits
- Short-term employee benefits
Short-term employee benefits are expensed as the related service is provided. These liabilities are recognized at the amount of the expected payment if the Company has a present legal obligation to pay this amount due to service provided by the employee and the obligation can be estimated reliably.
- Share-based payment arrangements
The grant-date fair value of equity-settled share-based payment arrangements granted to employees is generally recognized as personnel expense, with a corresponding increase in equity, during the period in which employees unconditionally acquire the right to the awards. Amounts recognized as expenses are adjusted to reflect the number of awards for which there is an expectation that service and performance conditions will be met in such a way that the final amounts recognized as expenses are based on the number of awards that actually meet the service and performance conditions on the vesting date.
The Group recognizes each expense according to the services rendered for each subsidiary where the employee participating in the plan works, with the counterpart at:
(a) increase in equity if the services rendered are received in a transaction with a share-based payment settled in equity instruments;
(b) or, if the services rendered are acquired in a transaction with a share-based payment settled in cash (or other assets), a liability must be recognized.
The fair value of the amount payable to employees related to the rights on the valuation of shares, which are settled in cash, is recognized as an expense with a corresponding increase in liabilities during the period in which employees unconditionally acquire their right to payment. The liability is remeasured at each reporting date and on the settlement date, based on the fair value of the rights on the valuation of the shares. Any changes in the fair value of the liability are recognized in the profit or loss.
CI&T Inc.
Consolidated financial statements
December 31, 2021
When the granting of an equity instrument is canceled or settled during the vesting period, the entity must account for the cancellation or settlement as an acceleration of the vesting period and, therefore, must immediately recognize the amount that would be recognized as services received over the remaining vesting period.
In cases where the stock option plan is cancelled, any payments made to employees at the time of the cancellation must be accounted for as a repurchase of an equity instrument, that is, in a reduction account of shareholders' equity, except if the payment exceeds the fair value of the equity instruments granted, measured on the repurchase date. Any surplus must be recognized as an expense for the period. However, if the share-based payment arrangement present liabilities components, the entity must remeasurement the fair value of the corresponding liability on the date of cancellation or settlement. Any payment made to settle these liability components should be accounted for as an extinguishment of the liability.
- Financial income and financial expenses
The Group's financial income and financial expenses include:
| • | Interest income; | |
| • | Interest expense; | |
| • | The net gains or loss on financial assets measured at fair value through profit or loss; | |
| • | The foreign currency gains or losses on financial assets and financial liabilities. |
Interest income or expense is recognized using the effective interest method. The Company classifies dividends and interest on equity paid as cash flows used in financing activities.
The 'effective interest rate' is the rate that exactly discounts estimated future cash payments or receipts though the expected life of the financial instrument to:
| • | the gross carrying amount of the financial asset; or | |
| • | at the amortized cost of the financial liability. |
In calculating interest income or expense, the effective interest rate is applied to the gross carrying amount of the asset (when the asset is not impaired) or the amortized cost of the liability. However, for financial assets that have become credit-impaired after the initial recognition, interest income is calculated by applying the effective interest rate to the amortized cost of the financial asset. If the asset is no longer credit-impaired, then the calculation of interest income reverts to the gross basis.
- Income tax
Income tax expenses comprises current and deferred income and social security contribution taxes. It is recognized in profit or loss except to the extent that it relates to a business combination, or items recognized directly in equity or in other comprehensive income.
CI&T Inc.
Consolidated financial statements
December 31, 2021
The Company has determined that interest and penalties related to income taxes, including uncertain tax treatments, do not meet the definition of income taxes, and therefore accounted for them under IAS 37 - Provisions, Contingent Liabilities and Contingent Assets.
- Current tax
Current tax comprises the expected tax payable or receivable on the taxable profit or loss for the year and any adjustment to taxes payable or receivable in respect of prior years. The amount of current tax payable or receivable is the best estimate of the tax amount expected to be paid or received that reflects uncertainty related to income tax, if any. It is measured using tax rates enacted at the reporting date.
Current tax assets and liabilities are offset only if certain criteria are met.
- Deferred taxes
Deferred tax is recognized in respect of temporary differences between the carrying amounts of assets and liabilities for financial reporting purposes and the amounts used for taxation purposes. Deferred tax is not recognized for:
| • | Temporary differences on the initial recognition of assets and liabilities in a transaction that is not a business combination and that affects neither accounting nor taxable profit or loss; and | |
| • | Temporary differences related to investments in subsidiaries to the extent that the Company can control the timing of the reversal of the temporary difference, and it is probable that the temporary difference will not be reversed in the foreseeable future. |
Deferred tax assets are recognized in respect of tax losses and unused deductible temporary differences to the extent that it is probable that future taxable profits will be available against which they can be used. Future taxable profits are determined based on the reversal of relevant taxable temporary differences. If the amount of taxable temporary differences is insufficient to recognize a deferred tax asset in full, then future taxable profits, adjusted for reversals of existing temporary differences, are considered, based on the business plans for each individual subsidiary.
Deferred tax assets are reviewed at each reporting date and are reduced to the extent that they are no longer probable.
Deferred tax assets and liabilities are measured based on the rates that are expected to be applied to temporary differences when they are reversed, based on the rates that were enacted up to the reporting date.
The measurement of deferred tax reflects the tax consequences that would follow from the way the Company expects, at the reporting date, to recover or settle the carrying amount of its assets and liabilities.
Deferred tax assets and liabilities are offset only if certain criteria are met.
CI&T Inc.
Consolidated financial statements
December 31, 2021
- Property, plant and equipment
- Recognition and measurement
Property, plant and equipment items are measured at the historical cost of acquisition or construction, deducted from accumulated depreciation and any impairment losses.
Any gain or loss on the disposal of an item of property, plant and equipment is recognized in profit or loss.
- Subsequent expenditure
Subsequent expenditure is capitalized only if it is probable that the future economic benefits associated with the expenditure will flow to the Company.
- Depreciation
Depreciation is calculated to write-off the cost of items of property, plant and equipment, less their estimated residual values using the straight-line method based on the estimated useful lives and is recognized in profit and loss. Land is not depreciated.
The estimated useful lives of property, plant and equipment for current and comparative years are as follows:
IT equipment | 2 to 5 years |
Furniture and fixtures | 7-10 years |
Vehicles | 5 years |
Leasehold improvements | 1 to 8 years |
Depreciation methods, useful lives and residual values are reviewed at each reporting date and adjusted if appropriate.
- Intangible assets and goodwill
- Recognition and measurement
Goodwill
Goodwill arising from the acquisition of subsidiaries is measured at cost less accumulated impairment losses.
Brands and Customer relationship
Brands and customer relationship acquired through business combinations are recognized at their fair value at the acquisition date and depreciated over their expected benefit period.
Software
Software licenses are capitalized based on the costs incurred to acquire the software and prepare them to be ready for use and depreciated over their expected benefit period.
Costs associated with software maintenance are recognized as expenses as incurred. Development costs directly attributable to the design and testing of identifiable and unique software products, controlled by the Company, are recognized as intangible assets.
Directly attributable costs, which are capitalized as a part of the software product, include the costs of employee allocated to software development and an appropriate portion of the applicable indirect expenses.
Other development costs that do not meet these criteria for capitalization are recognized as expenses as they are incurred. Development costs previously recognized as expenses are not recognized as assets in subsequent periods.
CI&T Inc.
Consolidated financial statements
December 31, 2021
Non-compete agreement
Non-compete agreements acquired through business combinations are recognized at their fair value at the acquisition date and are amortized over the term of the agreements.
Software in progress
Software in progress is capitalized only if the expenditure can be measured reliably, the product or progress is technically and commercial feasible, future economic benefits are probable, and the Company intends to and has sufficient intention and resources to complete development and use or sell the asset. Otherwise, it is recognized in profit and loss as incurred. Subsequent to initial recognition, intangible in progress is measured at cost less any accumulated impairment losses.
- Subsequent expenditure
Subsequent expenditure is capitalized only when it increases the future economic benefits embodied in the specific asset to which it relates. All other expenditure, including trademarks and patents, are recognized in profit or loss as incurred.
- Amortization
Amortization is calculated using the straight-line method based on the estimated useful lives of the items, net of their estimated residual values. Amortization is generally recognized in profit or loss. Goodwill is not amortized.
The estimated useful lives are as follows:
Network software | 5 years |
Internally developed software | 3 years |
Customer relationship | 6 – 8 years |
Non-compete agreement | 5 years |
Brands | 1 - 2 years |
Amortization methods, useful lives and residual values are reviewed at each reporting date and adjusted, if appropriate.
- Financial instruments
- Recognition and initial measurement
Trade receivables are initially recognized on the date they were originated. All other financial assets and liabilities are initially recognized when the Company becomes a party to the contractual provisions of the instrument.
A financial asset (unless it is a trade receivable without a significant financing component) or financial liability is initially measured at fair value plus, for an item not measured at fair value through profit or loss (“FVTPL”), transaction costs that are directly attributable to its acquisition or issue. Trade receivables without a significant financing component are initially measured at the transaction price.
- Classification and subsequent measurement
Financial assets
Upon initial recognition, a financial asset is classified as measured at: amortized cost; FVOCI — debt investment; FVOCI — equity investment; or FVTPL — fair value through profit or loss.
CI&T Inc.
Consolidated financial statements
December 31, 2021
Financial assets are not reclassified subsequent to their initial recognition unless the Company changes its business model for managing financial assets, in which case all affected financial assets are reclassified on the first day of the presentation period following the change in business model.
A financial asset is measured at amortized cost if it meets both of the following conditions and is not designated as measured at FVTPL:
| • | It is maintained within a business model aimed at maintaining financial assets to receive contractual cash flows; and | |
| • | It is contractual terms give rise on specific dates to cash flows that are related to the payment of principal and interest on the outstanding principal value. |
All financial assets not classified as measured at amortized cost, as described above, are classified as at FVTPL. This includes all derivative financial assets. Upon initial recognition, the Group may irrevocably designate a financial asset that otherwise meets the requirements to be measured at amortized cost or fair value through other comprehensive income (“FVOCI”) as at FVTPL if doing so eliminates or significantly reduces an accounting mismatch that would otherwise arise.
Financial asset – Business model assessment
The Company carries out an assessment of the objective of the business model in which a financial asset is held in the portfolio because it better reflects the way the business is managed, and the information is provided to Management. Information considered includes:
| • | The stated policies and objectives set for the portfolio and the operation of those policies in practice. They include whether the Management strategy focuses on achieving contractual interest income, maintaining a particular interest rate profile, matching the duration of financial assets with the duration of related liabilities or expected cash outflows, or realizing cash flows through the sale of assets; | |
| • | How the portfolio's performance is assessed and reported to the Group's Management; | |
| • | The risks that affect the performance of the business model (and the financial assets held according to that business model) and how those risks are managed; | |
| • | How the managers of the business are compensated – e.g., whether compensation is based on the fair value of assets managed or on the contractual cash flows earned; and | |
| • | The frequency, volume and timing of sales of financial assets in prior periods, the reasons for such sales and expectations about future sales. |
Transfers of financial assets to third parties in transactions that do not qualify for derecognition are not considered sales, in a manner consistent with the continuous recognition of the assets of the Company and its subsidiaries.
Financial assets held for trading or managed and whose performance is evaluated on a fair value basis are measured at fair value through profit or loss.
CI&T Inc.
Consolidated financial statements
December 31, 2021
Financial asset – assessment whether contractual cash flows are solely principal and interest payments
For the purposes of this assessment 'principal' is defined as the fair value of the financial asset upon initial recognition. Interest' is defined as consideration for the time value of money and the credit risk associated with the principal amount outstanding over a given period of time and for the other basic lending risks and costs (e.g. liquidity risk and administrative costs), as well as a profit margin.
The Group considers the contractual terms of the instrument to assess whether contractual cash flows are solely payments of principal and interest. This includes assessing whether the financial asset contains a contractual term that could change the timing or value of the contractual cash flows such that it would not meet this condition. In making this assessment, the Group considers:
| • | Contingent events that change the amount or timing of cash flows; | |
| • | Terms that can adjust the contractual rate, including variable rates features; | |
| • | Prepayment and extension features; and | |
| • | Terms that limit the Group's access to cash flows from specific assets (e.g., based on the performance of an asset). |
The prepayment feature is consistent with the principal and interest payment criteria if the prepayment amount mostly represents unpaid principal and interest on the outstanding principal amount – which may include reasonable additional compensation for early termination of the contract. In addition, for a financial asset acquired for a value less than or greater than the nominal value of the contract, the permission or requirement for prepayment for an amount that represents the nominal value of the contract plus contractual interest (which also may include reasonable additional compensation for early termination of the contract) accumulated (but not paid) is treated as consistent with this criterion if the fair value of the prepayment is insignificant at initial recognition.
Financial assets - Subsequent measurement and profit and loss
- Financial assets at FVTPL
These assets are subsequently measured at fair value. The net gain, including interest, is recognized in profit or loss.
- Financial assets at amortized cost
These assets are subsequently measured at amortized cost using the effective interest method. The amortized cost is reduced by impairment losses. Interest income, foreign exchange gains and losses and impairment are recognized in profit or loss. Any gains or losses on derecognition are recognized in the profit or loss.
Financial liabilities – classification, subsequent measurement and profit and loss
Financial liabilities were classified as measured at amortized cost or FVTPL. A financial liability is classified as measured at fair value through profit or loss if it is a derivative or is designated as such upon initial recognition. Financial liabilities measured at FVTPL are measured at fair value and net income, including interest, is recognized in profit or loss. Other financial liabilities are subsequently measured at amortized cost using the effective interest method. Interest expense, foreign exchange gains and losses are recognized in profit or loss. Any gains or losses on derecognition are also recognized in profit or loss.
CI&T Inc.
Consolidated financial statements
December 31, 2021
- Derecognition
Financial assets
The Group derecognizes a financial asset when the contractual rights to the cash flows of the asset expire, or when the Group transfers the contractual rights to receive the contractual cash flows on a financial asset in a transaction in which substantially all the risks and rewards of ownership of the financial asset are transferred, or in which the Group neither transfers nor substantially maintains all the risks and rewards of ownership of the financial asset nor retains control over the financial asset.
Financial liabilities
The Group derecognizes a financial liabilities when their contractual obligations are discharged, cancelled or expire. The Group also derecognizes a financial liabilities when their terms are modified and the cash flows of the modified liabilities are substantially different, in which case a new financial liability based on the modified terms is recognized at fair value. Upon derecognition of a financial liability, the difference between the carrying amount extinguished and the consideration paid (including any non-cash assets transferred or liabilities assumed) is recognized in profit or loss.
- Offsetting
The financial assets or liabilities are compensated, and the net value presented in the statement of financial position when, and only when, the Group currently has a legally enforceable right to offset the amounts and intends to settle them on a net basis or to dispose of the asset and settle the liabilities simultaneously.
- Derivative financial instruments
The Group holds derivative financial instruments to manage its exposures to the risks of changes in foreign currency and interest rates.
Derivatives are initially measured at fair value. After initial recognition, derivatives are measured at fair value and changes in fair value are recorded in profit or loss.
- Equity
Share capital
On December 31, 2021, the Company´s share capital is R$ 36, represented by 132,197,896 common shares. Those common shares are represented by 15,000,000 Class A common shares and 117,197,896 Class B common shares (note 22.a). Incremental costs directly attributable to the issue of common shares are recognized as a deduction from equity.
Share premium
The share premium refers to the difference between the subscription price that the shareholders paid for the shares and their nominal value.
Capital reserve
The breakdown of capital reserves is arising from the corporate restructuring occurred in 2021 (note 1.a), share-based compensation (note 21.d) and the share issuance costs (note 21.c).
CI&T Inc.
Consolidated financial statements
December 31, 2021
- Impairment
Non-derivative financial assets
Financial instruments and contract assets
The Group recognizes provisions for expected credit losses on:
| • | Financial assets measured at amortized cost | |
| • | Contract assets |
Loss allowances for trade receivables and contract assets are always measured at an amount equal to lifetime expected credit losses.
Management considers a financial asset to be in default when:
| • | It is unlikely that the creditor will fully pay its credit obligations to the Group, without resorting to actions such as the realization of the guarantee (if any); or | |
| • | The financial asset is more than 360 days overdue; | |
| • | Lifetime credit losses are the expected credit losses that result from all possible default events over the expected life of the financial instrument. |
The maximum period considered in the expected credit loss estimate is the maximum contractual period over which the Group is exposed to credit risk.
Measurement of expected credit losses
The Group considers evidence of impairment of assets measured at amortized cost at the collective level. The assets are assessed collectively for any loss of value that could have occurred but had not yet been identified.
Assets are assessed collectively for impairment based on the grouping of assets with similar risk characteristics.
In assessing the impairment as a whole, the Group uses historical trends in the probability of default, the recovery period and the loss amounts incurred, adjusted to reflect the Management’s judgment on the assumptions if the current economic and credit conditions are such that actual losses are probable to be higher or lower than those suggested by historical trends.
A loss by reduction to the recoverable amount is calculated as the difference between the recorded amount and the present value of estimated future cash flows, discounted by the original effective interest rate of the asset. Losses are recognized in profit or loss and deducted from the gross carrying amount of the assets.
The allowance for loss on financial assets measured at amortized cost is deducted from the gross carrying amount of the assets.
Write-off
The gross carrying amount of a financial asset is written off when the Group has no reasonable expectation of recovering the financial asset in whole or in part. With respect to customers, the Group assesses the time and value of the write-off based on whether there is reasonable expectation of recovery. The Group does not expect any significant recovery of the amount written off. However, written off financial assets may still be subject to credit for the fulfillment of the Group’s procedures for recovering the amounts due.
CI&T Inc.
Consolidated financial statements
December 31, 2021
Non-financial assets
At each reporting date, the Group reviews the carrying amounts of its non-financial assets (other than contract assets and deferred tax assets) to determine whether there is any indication of impairment. If any such indication exists, then the asset’s recoverable amount is estimated. Goodwill is tested annually for impairment.
For impairment testing, assets are grouped together into the smallest group of assets that generates cash inflows from continuing use that are largely independent of the cash inflows of other assets or cash-generating units (CGUs). Goodwill arising from a business combination is allocated to CGUs or groups of CGUs that are expected to benefit from the synergies of the combination.
The recoverable amount of an asset or CGU is the greater of its value in use and its fair value less costs of disposal. Value in use is based on estimated future cash flows, discounted to their present value using a pre-tax discount rate that reflects current market evaluations of the time value of money and the risks specific to the asset or CGU.
An impairment loss is recognized if the carrying amount of the asset or CGU exceeds its recoverable amount.
Impairment losses are recognized in profit or loss. They are allocated first to reduce the carrying amount of any goodwill allocated to the CGU, and then to reduce the carrying amounts of the other assets in the CGU on a pro rata basis.
Impairment losses relating to goodwill are not reversed. For other assets, impairment losses are reversed only to the extent that the asset’s carrying amount does not exceed the carrying amount that would have been determined, net of depreciation or amortization if no impairment losses had been recognized.
- Provisions
Disputes and litigations
The provision for disputes and litigation is recognized when it is probable that the Group will be required to make future payments as a result of past events. Such payments include, but are not limited to, the various claims, processes and actions initiated by both third parties and the Company, relating to labor disputes, complaints from tax authorities and other judicial matters.
Provision for indemnity of the stock options plan
The provision for the indemnity of the stock options plan was recognized upon the cancellation of all programs and agreements entered into in the Group’s Stock Option Plan. Payments to the beneficiaries of the plan grant to the Company full discharge on any right related to the Plan.
- Leases
At inception of a contract, the Group assesses whether a contract is, or contains, a lease. A contract is or contains a lease if the contract transfers the right to control the use of an identified asset for a period of time in exchange for consideration.
CI&T Inc.
Consolidated financial statements
December 31, 2021
At the commencement or upon the modification of a contract that contains a lease component, the Group allocates the consideration in the contract to each lease component of the lease based on individual prices. However, for property leases, the Group elected to not separate the non-lease components and account for the lease and non-lease components as a single component.
The Group recognizes a right-of-use asset and a lease liability at lease commencement. The right-to-use asset is initially measured at cost, which comprises the initial measurement amount of the lease liability, adjusted for any lease payments made at or before the commencement date, less any leasing incentives received.
The right-of-use asset is subsequently depreciated using the straight-line method from the commencement date to the end of the lease term unless the lease transfers ownership of the underlying asset to the Group by the end of the lease term or the cost of the right-of-use asset reflects that the Group will exercise a purchase option. In this case, the right of use will be depreciated over the useful life of the underlying asset, which is determined in same basis as that of property, plant and equipment. In addition, the right-of-use asset is periodically reduced by impairment losses, if any, and adjusted for certain remeasurements of lease liabilities.
The lease liability is initially measured at the present value of the lease payments that are not paid at the commencement date, discounted using the interest rate implicit in the lease or, if this rate cannot be readily determined, the Group’s incremental borrowing rate. Generally, the Group uses its incremental borrowing rate as a discount rate.
The Group determines its incremental borrowing rate by obtaining interest rates from various external sources of financing and making some adjustments to reflect the terms of the contract and the type of leased asset.
Lease payments included in the measurement of the lease liability comprise the following:
| • | Fixed payments, including in-substance fixed payments; and | |
| • | Amounts expected to be payable under a residual value guarantee. |
Regarding the option to extend office leases, the Group applies a 5-year additional to determine ROU amounts, except when there is no certain probability of continuity of activities in such locations. Renewal clauses generally use an inflation update index (IGPM or IPCA) that is updated annually.
For the periods disclosed, the Group does not have lease agreements with variable payments.
The lease liability is measured at amortized cost using the effective interest method. It is remeasured when there is a change in future lease payments resulting from a change in index or rate, if there is a change in the Group’s estimate of the amounts expected to be payable under a residual value guarantee, if the Group changes its assessment of whether it will exercise a purchase, extension or termination option or if there is a revised in-substance fixed lease payment.
When the lease liability is remeasured in this way, a corresponding adjustment to the carrying amount of the right-of-use asset is made or is accounted for in the profit or loss if the carrying amount of the right-of-use asset has been reduced to zero.
CI&T Inc.
Consolidated financial statements
December 31, 2021
The right-of-use asset is amortized using the straight-line method from the commencement date to the end of the lease term.
Short-term leases and leases of low-value assets
The Group has chosen not to recognize right-of-use assets and liabilities for leases of low value assets and short-term leases. The Group recognizes lease payments associated with these leases as expenses on a straight-line basis over the lease term.
- Fair value measurement
‘Fair value’ is the price that would be received to sell an asset or paid to transfer a liability in an orderly transaction between market participants on the measurement date of the principal or, in its absence, the most advantageous market to which the Group has access at that date. The fair value of a liability reflects its non-performance risk.
A number of the Group’s accounting policies and disclosures require the measurement of fair values, for both financial and non-financial assets and liabilities (see note 5).
When one is available, the Group measures the fair value of an instrument using the quoted price in an active market for that instrument. A market is regarded as ‘active’ if transactions for the asset or liability take place with sufficient frequency and volume to provide pricing information on an ongoing basis.
If there is no quoted price in an active market, the Group uses valuation techniques that maximize the use of relevant observable data and minimize the use of unobservable inputs. The chosen valuation technique incorporates all the factors that market participants would consider in pricing a transaction.
- Segment reporting
In reviewing the operational performance of the Group and allocating resources, the chief operating decision maker (“CODM”), is the Board of Directors (“BoD”), in charge for the operational decisions of resource allocation and performance evaluation.
The CODM considers the whole Group as a single operating and reportable segment, monitoring operations, making decisions on fund allocation and evaluating performance based on a single operating segment. The CODM reviews relevant financial data on a consolidated basis for all subsidiaries. Disaggregated information is only reviewed at the revenue level (Note 23), with no corresponding detail at any level of margin or profitability.
See note 23 for a breakdown of Net Revenue and selected assets by geographic location.
8 Changes in significant accounting policies
The Group has initially adopted Interest Rate Benchmark Reform Phase 2 – Amendments to IFRS9, IAS 39, IFRS 7, IFRS 4 and IFRS 16 beginning January 1, 2021.
The Group applied the Phase 2 amendments retrospectively. However, in accordance with the exceptions permitted in the Phase 2 amendments, since the Group had no transactions for which the benchmark rate had been replaced with an alternative benchmark rate as of December 31, 2020, there is no impact on opening equity balances as a result of retrospective application.
CI&T Inc.
Consolidated financial statements
December 31, 2021
Specific policies applicable beginning January 1, 2021 for interest rate benchmark reform
The Phase 2 amendments provide practical relief from certain requirements in IFRS Standards. These reliefs relate to modifications of financial instruments and hedging relationships triggered by a replacement of a benchmark interest rate in a contract with a new alternative benchmark rate.
If the basis for determining the contractual cash flows of a financial asset or financial liability measured at amortized cost changes as a result of interest rate benchmark reform, then the Group updates the effective interest rate of the financial asset or financial liability to reflect the changes required by the reform. Changes in the basis for determining the contractual cash flows are required by interest rate benchmark reform if the following conditions are met:
| • | the change is necessary as a direct consequence of the reform; and | |
| • | the new basis for determining the contractual cash flows is economically equivalent to the previous basis – i.e. the basis immediately before the change. |
If changes are made to a financial asset or financial liability, in addition to changes to the basis for determining the contractual cash flows required under interest rate benchmark reform, then the Group first updates the effective interest rate of the financial asset or financial liability to reflect the change required under interest rate benchmark reform. Subsequently, the Group applies the accounting policies to implement the modifications set out above to the additional changes.
Amendments also provide for an exception to use a revised discount rate that reflects the change in interest rates when remeasuring a lease liability because of a lease modification that is required by an interest rate benchmark reform.
Finally, the Phase 2 amendments provide for a series of temporary exceptions from certain hedge accounting requirements when a change required by interest rate benchmark reform occurs to a hedged item and/or hedging instrument that permits the hedge relationship to be continued without interruption. The Group does not apply hedge accounting.
9 Business combination
On June 26, 2021, the CI&T Brazil entered into a purchase agreement to acquire 100% of the shareholding control of Dextra Investimentos S.A. (“Dextra Holding”) and its subsidiaries (“Dextra Group”). On July 22, 2021, the transaction was approved by the Administrative Council for Economic Defense (CADE). All conditions precedent were met on August 10, 2021, the date on which the closing term of the acquisition was formalized and the CI&T Brazil obtained the shareholding control of the Dextra Group. Dextra Group is primarily involved in customized software development.
Control of the Dextra Group will enable the Company to increase the available talent pool. The acquisition is also expected to increase the Company’s customer relationship in Brazil.
The total consideration of acquisition in the purchase agreement was R$800,000. The Company paid R$ 650,000 on August 10, 2021 and R$ 50,938 on December 02, 2021. The remaining balance will be paid on the first anniversary of the closing date, subject to the application of any purchase price adjustments (note 18). The Management revised the purchase price on the closing date based on the Agreement, and reduced the price based in the amount of R$ 16,427, thus the total of consideration transferred was R$ 783,573. This reduction is subject to review by the seller.
The amount of R$30,000 related to a portion of the remaining balance payable was retained for any materialized contingencies, which will be paid on the fifth anniversary of the closing date.
CI&T Inc.
Consolidated financial statements
December 31, 2021
For the year ended on December 31, 2021, Dextra Holding contributed R$172,959 in revenue to the Group’s results and a profit of R$ 31,943 for the period. If the acquisition had occurred on January 1, 2021, Management estimates that consolidated revenue would have totaled R$ 1,617,339, and consolidated profit for the year ended on December 31, 2021 would have totaled R$ 129,044. In determining these amounts, Management has assumed that the fair value adjustments, on the acquisition date, would have been the same if the acquisition had occurred on January 1, 2021.
a) Consideration transferred
The following table summarizes the fair value of each major class of consideration transferred on the acquisition date:
Cash | 700,938 |
Accounts payable for business combination (note 18) | 82,635 |
Accounts payable | 45,726 |
Retained amount | 30,000 |
Other | 6,909 |
Total consideration transferred | 783,573 |
b) Acquisition-related cost
The Company incurred acquisition-related costs of R$2,109 on legal fees and due diligence costs. These costs have been recognized in “administrative expenses”.
CI&T Inc.
Consolidated financial statements
December 31, 2021
c) Identifiable assets acquired and liabilities assumed
The following table summarizes the recognized amounts of assets acquired and liabilities assumed on the acquisition date:
Assets | Fair value |
Current |
|
Cash and cash equivalents | 8,216 |
Trade receivables (a) | 56,313 |
Recoverable taxes | 1,668 |
Other assets | 2,386 |
Current assets | 68,583 |
Non-current |
|
Recoverable taxes | 3,932 |
Property, plant and equipment (note 13) | 9,149 |
Intangible assets (i) (note 14) | 148,523 |
Right-of-use assets (note 15) | 5,414 |
Non-current assets | 167,018 |
Total assets | 235,601 |
Liabilities | Fair value |
Current |
|
Suppliers | 5,627 |
Lease liabilities (note 15) | 3,105 |
Salaries and welfare charges | 23,436 |
Tax liabilities | 10,569 |
Contract liabilities | 1,933 |
Other liabilities | 26 |
Current liabilities | 44,696 |
Non-current |
|
Other liabilities | 18 |
Lease liabilities (note 15) | 3,035 |
Non-current liabilities | 3,053 |
Total liabilities | 47,749 |
Total identifiable net assets acquired | 187,852 |
| (a) | Gross contractual amount receivable is R$56,854 and R$541 is not expected to be collected. |
(i) According to the purchase price on August 10, 2021: |
|
| Fair value |
Network software (note 14) | 191 |
Internally developed software (note 14) | 22,613 |
Customer relationship (note 14) | 88,961 |
Non-compete agreement (note 14) | 16,257 |
Brands (note 14) | 20,501 |
Total intangible assets at fair value (note 14) | 148,523 |
CI&T Inc.
Consolidated financial statements
December 31, 2021
Measurement of fair values
The following fair values have been determined on the assumptions:
| • | The fair value estimate for brands was calculated based on the “Relief from Royalty or Savings of Royalties” method, which estimates the asset's value based on hypothetical royalty payments that would be saved by the asset holder compared to what would be paid for licensing the asset owned by third parties, considering its useful life. The useful life for brands is 1.4 year. | |
| • | The fair value estimate for non-compete agreement was calculated based on the “With and Without” method. Its useful life is 5 years. | |
| • | The fair value estimate for customer relationship was calculated based on the multi-period excess earnings. Its useful life is 7.4 years. |
d) Goodwill
Goodwill arising from the acquisition has been recognized as follows:
| Note | Goodwill | ||
Consideration transferred | 9.a | 783,573 | ||
Fair value of identifiable net assets | 9.c | (187,852 | ) | |
Goodwill (note 14) |
| 595,721 |
Goodwill is attributable mainly to the skills and technical talent of Dextra’s work force and the synergies expected to be achieved from integrating the Company. The recognized goodwill is expected to be deductible for tax purposes during the merger, which was occurred on December 31, 2021.
CI&T Inc.
Consolidated financial statements
December 31, 2021
10 Cash and cash equivalents and financial investments
10.1 Cash and cash equivalents
. | December 31, 2021 | December 31, 2020 | |
Cash and cash equivalents | 69,720 | 59,640 | |
Short-term financial investments | 66,007 | 103,187 | |
Total | 135,727 | 162,827 |
Short-term financial investments are represented by fixed income securities, with interest rate ranging from 100% to 103% on December 31, 2021 (97% to 101% as of December 31, 2020) of the changes of Interbank Deposit Certificate (CDI) variation which (i) Management expects to use for short-term commitments; (ii) present daily liquidity; and (iii) are readily convertible into a known amount of cash, subject to an insignificant risk of change in value.
10.2 Financial investments
. | December 31, 2021 | December 31, 2020 | |
Financial investments | 798,786 | - |
At December 31, 2021, the balance of R$ 798,786 (US$ 143,139) is fully allocated in a USD interest-bearing account, bearing interest of 0,05% p.a., and such account presents immediate liquidity and is readily convertible into a known amount of cash, subject to an insignificant risk of changes in value in USD . The Company holds USD amount for short-term commitments in USD, therefore, such amount may be subject to a significant exchange rate once translated to Brazilian Reais.
11 Trade receivables
The balances of trade receivables are presented, as follows:
| December 31, 2021 | December 31, 2020 | |||
Trade receivables - Domestic market | 100,581 | 32,275 | |||
Trade receivables - Foreign market | 240,997 | 164,673 | |||
(-) Expected credit losses | (1,059 | ) | (692 | ) | |
Trade receivables, net | 340,519 | 196,256 |
CI&T Inc.
Consolidated financial statements
December 31, 2021
The balances of trade receivables by maturity date are as follows:
| December 31, 2021 | December 31, 2020 | |
Not due | 319,450 | 167,939 | |
Overdue: |
|
| |
from 1 to 60 days (i) | 20,020 | 28,012 | |
61 to 360 days | 1,564 | 939 | |
Over 360 days | 544 | 58 | |
Total | 341,578 | 196,948 |
| (i) | As of December 31, 2021, the balance of trade receivables overdue from 1 to 60 days of R$20,020 (R$28,012 as of December 31, 2020), refers to a series of individual clients. The Group considers these extensions and delays as expected in its credit risk analysis. |
The movement of impairment loss on trade receivables is as follows:
Balance as of January 1, 2020 | (246 | ) |
Provision | (1,751 | ) |
Reversal | 1,337 | |
Exchange variation | (32 | ) |
Balance as of December 31, 2020 | (692 | ) |
Provision | (3,106 | ) |
Reversal | 2,826 | |
Exchange variation | (87 | ) |
Balance as of December 31, 2021 | (1,059 | ) |
12 Other assets
| December 31, 2021 | December 31, 2020 | |
Prepaid expenses (a) | 29,743 | 13,221 | |
Rental security deposits | 2,471 | 1,402 | |
Suppliers’ advances | 162 | 673 | |
Other | 592 | 72 | |
Total | 32,968 | 15,368 | |
Current | 29,994 | 12,874 | |
Non-current | 2,974 | 2,494 | |
Total | 32,968 | 15,368 |
| (a) | Prepaid expenses are mostly comprised of prepaid insurance, mainly related to directors and officers liability insurance, consulting, software support prepayments. |
CI&T Inc.
Consolidated financial statements
December 31, 2021
13 Property, plant and equipment
. | December 31, 2021 | December 31, 2020 | |
IT equipment | 35,230 | 15,407 | |
Furniture and fixtures | 6,283 | 6,364 | |
Vehicles | - | 27 | |
Hardware devices | - | 291 | |
Leasehold improvements (a) | 16,051 | 16,460 | |
Property, plant and equipment in progress | 157 | 222 | |
Total | 57,721 | 38,771 |
(a) Improvements are depreciated on a straight-line basis based over the duration of the lease agreement.
The changes in the balances are as follows:
. | IT equipment | Furniture and fixtures | Vehicles | Leasehold improvements | In progress | Hardware devices | Total | |||||||||||||
Cost: |
|
|
|
|
|
|
| |||||||||||||
Balance as of January 1, 2020 | 24,013 | 11,903 | 295 | 22,345 | 14 | - | 58,570 | |||||||||||||
Exchange rate changes | 1,285 | 760 | 69 | 1,155 | - | - | 3,269 | |||||||||||||
Additions | 11,315 | 1,365 | - | 461 | 5,998 | 487 | 19,626 | |||||||||||||
Disposals | (1,761 | ) | (1,091 | ) | (278 | ) | (1,352 | ) | (103 | ) | - | (4,585 | ) | |||||||
Transfers | - | 4 | - | 5,683 | (5,687 | ) | - | - | ||||||||||||
Balance as of December 31, 2020 | 34,852 | 12,941 | 86 | 28,292 | 222 | 487 | 76,880 | |||||||||||||
Exchange rate changes | 386 | 176 | - | 375 | 37 | - | 974 | |||||||||||||
Spin-off | (128 | ) | (4 | ) | - | - | (313 | ) | (625 | ) | (1,070 | ) | ||||||||
Addition due to business combination (note 9) | 7,379 | 1,018 | - | 752 | - | - | 9,149 | |||||||||||||
Additions | 22,527 | 301 | - | 1,052 | 1,724 | 138 | 25,742 | |||||||||||||
Disposals | (1,376 | ) | (563 | ) | (86 | ) | (909 | ) | (160 | ) | - | (3,094 | ) | |||||||
Transfers | - | - | - | 1,353 | (1,353 | ) | - | - | ||||||||||||
Balance as of December 31, 2021 | 63,640 | 13,869 | - | 30,915 | 157 | - | 108,581 | |||||||||||||
Depreciation: |
|
|
|
|
|
|
| |||||||||||||
Balance as of January 1, 2020 | (15,092 | ) | (5,680 | ) | (109 | ) | (9,761 | ) | - | - | (30,642 | ) | ||||||||
Exchange rate changes | (565 | ) | (207 | ) | (28 | ) | (154 | ) | - | - | (954 | ) | ||||||||
Additions | (5,386 | ) | (1,616 | ) | (50 | ) | (3,245 | ) | - | (196 | ) | (10,493 | ) | |||||||
Disposals | 1,598 | 926 | 128 | 1,328 | - | - | 3,980 | |||||||||||||
Balance as of December 31, 2020 | (19,445 | ) | (6,577 | ) | (59 | ) | (11,832 | ) | - | (196 | ) | (38,109 | ) | |||||||
Exchange rate changes | (214 | ) | (42 | ) | - | 57 | - | - | (199 | ) | ||||||||||
Spin-off | 10 | 2 | - | - | - | 280 | 292 | |||||||||||||
Additions | (9,625 | ) | (1,451 | ) | (5 | ) | (3,908 | ) | - | (84 | ) | (15,073 | ) | |||||||
Disposals | 864 | 482 | 64 | 819 | - | - | 2,229 | |||||||||||||
Balance as of December 31, 2021 | (28,410 | ) | (7,586 | ) | - | (14,864 | ) | - | - | (50,860 | ) | |||||||||
Balance as of: |
|
|
|
|
|
|
| |||||||||||||
December 31, 2020 | 15,407 | 6,364 | 27 | 16,460 | 222 | 291 | 38,771 | |||||||||||||
December 31, 2021 | 35,230 | 6,283 | - | 16,051 | 157 | - | 57,721 |
The Group does not have property, plant or equipment pledged as collateral.
CI&T Inc.
Consolidated financial statements
December 31, 2021
14 Intangible assets
. | December 31, 2021 | December 31, 2020 | |
Network software | 2,399 | 1,096 | |
Internally developed software (i) | 3,911 | 2,385 | |
Software in progress | 391 | 115 | |
Customer relationship (ii) | 84,195 | - | |
Non-compete agreement (ii) | 13,897 | - | |
Brands (ii) | 14,541 | - | |
Subtotal | 119,334 | 3,596 | |
Goodwill (iii) | 619,469 | 14,570 | |
Total | 738,803 | 18,166 |
| (i) | Refers to internal expenses with software development to be sold by the Group and also for internal use. |
| (ii) | Refers to customer relationship, non-compete agreement and brads arising from acquisition of Dextra Technologies S.A., on August 10, 2021 (note 9.c). |
| (iii) | Refers to goodwill arising from: a) acquisition of Dextra Technologies S.A., on August 10, 2021, in the amount of R$595,721 (note 9.d); b) acquisition of Comrade Inc. in 2017, in the amount of R$19,644 (R$10,969 as of December 31, 2020), which was merged in 2018, into the subsidiary CI&T Inc; c) acquisition of CI&T IN Software Ltda., which was merged into the Company in 2014 in the amount of R$2,871; and d) acquisition of CI&T Japan Inc. in 2015 in the amount of R$1,233 (R$730 as of December 31, 2020). |
The change in the balances of intangible assets as follows:
| Network software | Internally developed software | Software in progress | Customer relationship | Non-compete agreement | Brands | Goodwill | Total | |||||||||||||||
Cost: |
|
|
|
|
|
|
|
| |||||||||||||||
Balance as of January 1, 2020 | 9,229 | 11,444 | 445 | - | - | - | 14,570 | 35,688 | |||||||||||||||
Exchange rate changes | 331 | - | - | - | - | - | - | 331 | |||||||||||||||
Additions | 188 | 646 | 931 | - | - | - | - | 1,765 | |||||||||||||||
Disposals | (16 | ) | - | - | - | - | - | - | (16 | ) | |||||||||||||
Transfers | - | 1,261 | (1,261 | ) | - | - | - | - | - | ||||||||||||||
Balance as of December 31, 2020 | 9,732 | 13,351 | 115 | - | - | - | 14,570 | 37,768 | |||||||||||||||
Additions due to business combination (note 9) | 191 | 22,613 | - | 88,961 | 16,257 | 20,501 | 595,721 | 744,244 | |||||||||||||||
Exchange rate changes | 38 | - | - | - | - | - | 9,178 | 9,216 | |||||||||||||||
Additions | 1,999 | 1,428 | 738 | - | - | - | - | 4,165 | |||||||||||||||
Impairment loss (a) | - | (20,723 | ) | - | - | (2,795 | ) | - | - | (23,518 | ) | ||||||||||||
Write-off | (18 | ) | - | (550 | ) | - | - | - | - | (568 | ) | ||||||||||||
Transfers | - | (88 | ) | 88 | - | - | - | - | - | ||||||||||||||
Balance as of December 31, 2021 | 11,942 | 16,581 | 391 | 88,961 | 13,462 | 20,501 | 619,469 | 771,307 | |||||||||||||||
Amortization: |
|
|
|
|
|
|
|
| |||||||||||||||
Balance as of January 1, 2020 | (7,657 | ) | (9,486 | ) | - | - | - | - | - | (17,143 | ) | ||||||||||||
Exchange rate changes | (298 | ) | - | - | - | - | - | - | (298 | ) | |||||||||||||
Additions | (697 | ) | (1,480 | ) | - | - | - | - | - | (2,177 | ) | ||||||||||||
Disposals | 16 | - | - | - | - | - | - | 16 | |||||||||||||||
Balance as of December 31, 2020 | (8,636 | ) | (10,966 | ) | - | - | - | - | - | (19,602 | ) | ||||||||||||
Exchange rate changes | (32 | ) | - | - | - | - | - | - | (32 | ) | |||||||||||||
Additions | (893 | ) | (1,708 | ) | - | (4,766 | ) | (1,189 | ) | (5,960 | ) | - | (14,516 | ) | |||||||||
Impairment loss (a) | - | - | - | - | 1,624 | - | - | 1,624 | |||||||||||||||
Write-off | 18 | 4 | - | - | - | - | - | 22 | |||||||||||||||
Balance as of December 31, 2021 | (9,543 | ) | (12,670 | ) | - | (4,766 | ) | 435 | (5,960 | ) | - | (32,504 | ) | ||||||||||
Balance at: |
|
|
|
|
|
|
|
| |||||||||||||||
December 31, 2020 | 1,096 | 2,385 | 115 | - | - | - | 14,570 | 18,166 | |||||||||||||||
December 31, 2021 | 2,399 | 3,911 | 391 | 84,195 | 13,897 | 14,541 | 619,469 | 738,803 |
CI&T Inc.
Consolidated financial statements
December 31, 2021
| (a) | After the consummation of the Dextra Group acquisition, the Company decided to discontinue the investment in the intangible assets, acquired in the business combination and initially recognized as internally developed software, in the amount of R$20,723, due to growth strategies in the digital transformation market, with the purpose more directed to the development of customized and on demand software for customers. The residual amount with respect to a non-compete agreement, in the amount of R$1,171, was also recognized as impairment. The total amount of impairment loss of intangible assets was recognized in the caption “Other income (expenses), net” (note 24.1), in the amount of R$21,895, as of December 31, 2021. |
Impairment test – Goodwill
The recoverable amount of the CGU was based on the value in use, determined through the discounted future cash flows to be generated by the continuous use of the CGU.
The discounted cash flow methodology was used to determine the value in use of the CGU, calculated based on the capitalization of free cash flows discounted at a weighted-average cost of capital (WACC) that corresponds to the discount rate, considering the weighted average cost of the different financing forms present in the company’s capital structure.
The values attributed to the main assumptions, as detailed below, represent the assessment of future management trends in relevant sectors and were based on historical data from internal and external sources.
| December 31, 2021 | December 31, 2020 | |
Discount rate - before tax | 19.06% | 12.54% | |
Discount rate - after tax | 12.94% | 12.38% | |
Budgeted EBITDA growth rate (average for the next five years) | 22% | 20% | |
Terminal value growth rate: | 3.5% | 3.5% |
The financial projections of the business unit in Brazil were prepared in Brazilian reais, in nominal values for the next five years.
The discount rate was estimated after tax based on the historical weighted average cost of capital rate at which the CGU operates.
Cash flow projections were prepared for five years and a growth rate in perpetuity after this period was considered. The rate of growth in perpetuity was determined as the lower value between the inflation of the countries where the Company operates and the estimated annual compound rate of long-term growth of EBITDA, which Management believes to be consistent with the market.
The key estimates used were as follows:
| • | Revenue growths are projected considering the average growth levels experienced over the past years and the growth for the next five years between 28% and 43%, considered effective tax rates on the base date of assessment. |
| • | The scenario with the extinction of the Brazilian payroll tax exemption benefits directly impacted personnel costs, reducing gross margin. |
| • | The variation in EBITDA follows revenues, costs, and expenses. The EBITDA margin of Net revenue was maintained at 22% over the projected period. |
Management’s impairment test for 2021 and 2020 indicated that value in use is substantially higher than the carrying amount of the goodwill. Management therefore believes that no reasonably possible change in any of the above key assumptions would cause the carrying amount of goodwill to materially exceed its recoverable amount.
The Company did not recognize any impairment loss for the years ended December 31, 2021 and 2020.
CI&T Inc.
Consolidated financial statements
December 31, 2021
15 Leases
- Right-of-use assets
December 31, 2021 | December 31, 2020 | ||
Properties | 69,441 | 66,459 | |
Vehicles | 4,173 | 2,809 | |
IT equipment | 213 | 497 | |
Total | 73,827 | 69,765 |
Some of the Group’s leases have the option of an extension that can be exercised for an indefinite period, and in these cases the Group has already considered in the measurement of the lease amounts the extensions that are reasonably certain to be exercised.
The Group applies the short-term lease recognition exemption to its short-term leases of properties (those leases that have a lease term of 12 months or less). It also applies the lease of low-value assets recognition exemption to leases that are considered of low value. Lease payments on short-term leases and leases of low-value assets are recognized as expenses on a straight-line basis. The remained rental expenses for the year totaled R$5,922 as of December 31, 2021 (R$4,669 as of December 31, 2020).
The changes to balances of the right-of-use are:
| Properties | Vehicles | IT equipment | Total | |||||||
Cost: |
|
|
|
| |||||||
Balance as of January 1, 2020 | 84,324 | 3,213 | 851 | 88,388 | |||||||
Foreign currency difference | 8,370 | 10 | - | 8,380 | |||||||
Additions | 14,305 | 2,503 | - | 16,808 | |||||||
Derecognition of right-of-use assets | (18,450 | ) | (718 | ) | - | (19,168 | ) | ||||
Balance on December 31, 2020 | 88,549 | 5,008 | 851 | 94,408 | |||||||
Additions due to business combination (note 9.c) | 5,414 | - | - | 5,414 | |||||||
Foreign currency difference | 2,744 | 3 | - | 2,747 | |||||||
Additions | 11,815 | 3,724 | - | 15,539 | |||||||
Derecognition of right-of-use assets | (2,200 | ) | (2,363 | ) | - | (4,563 | ) | ||||
Remeasurement of right-of-use assets | 1,318 | - | - | 1,318 | |||||||
Balance on December 31, 2021 | 107,640 | 6,372 | 851 | 114,863 | |||||||
Depreciation: |
|
|
|
| |||||||
Initial amount on January 1, 2020 | (13,434 | ) | (985 | ) | (71 | ) | (14,490 | ) | |||
Foreign currency difference | (979 | ) | (9 | ) | - | (988 | ) | ||||
Depreciation | (15,320 | ) | (1,609 | ) | (283 | ) | (17,212 | ) | |||
Derecognition of right-of-use assets | 7,643 | 404 | - | 8,047 | |||||||
Balance on December 31, 2020 | (22,090 | ) | (2,199 | ) | (354 | ) | (24,643 | ) | |||
Foreign currency difference | (856 | ) | (1 | ) | - | (857 | ) | ||||
Depreciation | (16,535 | ) | (1,944 | ) | (284 | ) | (18,763 | ) | |||
Derecognition of right-of-use assets | 1,657 | 1,945 | - | 3,602 | |||||||
Remeasurement of right-of-use assets | (376 | ) | - | - | (376 | ) | |||||
Balance on December 31, 2021 | (38,200 | ) | (2,199 | ) | (638 | ) | (41,037 | ) | |||
Net balance at: |
|
|
|
| |||||||
December 31, 2020 | 66,459 | 2,809 | 497 | 69,765 | |||||||
December 31, 2021 | 69,441 | 4,173 | 213 | 73,827 |
CI&T Inc.
Consolidated financial statements
December 31, 2021
- Lease liabilities
. | Average discount rate (per year) | December 31, 2021 | December 31, 2020 | ||
Properties | 10.88% (2020: 7.56%) | 77,366 | 71,765 | ||
Vehicles | 14.54% (2020: 12.69%) | 4,285 | 2,940 | ||
IT equipment | 7.70% (2020: 7.70%) | 237 | 523 | ||
Total |
| 81,888 | 75,228 | ||
Current |
| 21,214 | 14,569 | ||
Non-current |
| 60,674 | 60,659 | ||
Total |
| 81,888 | 75,228 |
The change in lease liabilities is disclosed in the reconciliation of change in liabilities to cash flows in note 16.
16 Loans and borrowings
Loans and borrowings operations can be summarized as follows:
| Currency | Average interest rate per year (%) | Year of maturity | December 31, 2021 | December 31, 2020 | |||||
Itaú (i) | USD | 4.82% p.a. | 2022 | 2,349 | 5,936 | |||||
Santander Bank S/A (iv) | BRL | 12.87% p.a. | 2021 | - | 33 | |||||
Bradesco (i) | BRL | CDI + 3.57% / CDI + 1.10% | 2021 / 2023 | 11,684 | 52,081 | |||||
Banco do Brasil (ii) | USD | 3.05% | 2021 | - | 20,748 | |||||
HSBC - CI&T Inc. (iii) | USD | Prime rate + 1% | 2021 | - | 10,432 | |||||
Citibank - CI&T Inc. (iii) | USD | Libor 3 months rate + 1.90% | 2022 | 11,164 | - | |||||
Banco do Brasil (ii) | USD | 2.37% p.a. | 2022 | 56,551 | - | |||||
Citibank (ii) | USD | 2.28% p.a. / 2.30% p.a. | 2022 | 28,328 | - | |||||
Santander Bank S/A (v) | BRL | CDI + 1.60% p.a. | 2026 | 204,047 | - | |||||
Bradesco (i) | BRL | CDI + 1.75% | 2026 | 306,417 | - | |||||
Citibank (ii) | USD | Libor 3 months rate + 2.07% | 2026 | 168,169 | - | |||||
Total |
|
|
| 788,709 | 89,230 |
| (i) | Export credit note - NCE: Refers to financing to export software development services. |
| (ii) | Advance on Foreign Exchange Contract (ACC). |
| (iii) | Refers to Revolving Credit Facility. |
| (iv) | Refers to Leasing contracts. |
| (v) | Refers to Law 4131 - Foreign currency loans granted by the banks abroad to a Brazilian company. |
These balances were included as current and non-current borrowings in the consolidated statement of financial position as follows:
CI&T Inc.
Consolidated financial statements
December 31, 2021
| December 31, 2021 | December 31, 2020 | ||
Current | 164,403 | 75,377 | ||
Non-current | 624,306 | 13,853 | ||
Total | 788,709 | 89,230 |
The principal balances of long-term loans and borrowings as of December 31, 2021, mature as follows:
Maturity | Coluna2 | |
2023 | 112,031 | |
2024 | 143,197 | |
2025 | 196,925 | |
2026 | 172,153 | |
Non-current liabilities | 624,306 |
The reconciliation of change in liabilities to cash flows arising from financing activities is shown below:
| Liabilities | Leases | Share premium and | Total | ||||
| Loans and borrowings | Leases (note 15.b) | Reserves |
| ||||
Balance as of December 31, 2020 | 89,230 | 75,228 | 116,072 | 280,530 | ||||
Changes in cash flow from financing activities |
|
|
|
| ||||
Proceeds from loans and borrowings | 740,596 | - | - | 740,596 | ||||
Loans, borrowings and lease liabilities payments | (75,196 | ) | (17,656 | ) | - | (92,852 | ) | |
Issuance of common shares at initial public offering | - | - | 915,947 | 915,947 | ||||
Transaction cost of offering | - | - | (66,876 | ) | (66,876 | ) | ||
Share-based plan contributions | - | - | 1,282 | 1,282 | ||||
Interest on equity paid | - | - | (6,288 | ) | (6,288 | ) | ||
Dividends paid (note 22) | - | - | (126,045 | ) | (126,045 | ) | ||
Total changes in cash flow from financing activities | 665,400 | (17,656 | ) | 718,020 | 1,365,764 | |||
Exchange rate changes | 601 | 2,054 | - | 2,655 | ||||
Other changes - liabilities |
|
|
|
| ||||
Additions due to business combination (note 9.c) | - | 6,139 | - | 6,139 | ||||
New leases | - | 15,504 | - | 15,504 | ||||
Remeasurement | - | 1,351 | - | 1,351 | ||||
Interest expenses | 23,366 | 6,369 | - | 29,735 | ||||
Interest paid | (12,149 | ) | (5,753 | ) | - | (17,902 | ) | |
Other borrowing/lease costs | 22,261 | (213 | ) | - | 22,048 | |||
Lease write-offs | - | (1,135 | ) | - | (1,135 | ) | ||
Total other changes - liabilities | 33,478 | 22,262 | - | 55,740 | ||||
Total other changes - equity | - | - | 217,950 | 217,950 | ||||
Balance as of December 31, 2021 | 788,709 | 81,888 | 1,052,042 | 1,922,639 |
CI&T Inc.
Consolidated financial statements
December 31, 2021
| Liabilities | Leases | Net Equity | Total | ||||
| Loans and financing | Leases (Note 15.b) | Reserves |
| ||||
Balance as of January 1, 2020 | 27,849 | 77,393 | 36,937 | 142,179 | ||||
Financing cash flow variations |
|
|
|
| ||||
Proceeds from loans and borrowings | 144,269 | - | - | 144,269 | ||||
Loan and borrowings payments, and lease payments | (88,107 | ) | (15,500 | ) | - | (103,607 | ) | |
Interest on own capital | - | - | (4,276 | ) | (4,276 | ) | ||
Dividends paid | - | - | (30,977 | ) | (30,977 | ) | ||
Total changes in financing cash flows | 56,162 | (15,500 | ) | (35,253 | ) | 5,409 | ||
Effect of changes in exchange rates | 1,310 | 7,657 | - | 8,967 | ||||
Other changes - related to liabilities |
|
|
|
| ||||
New leases | - | 16,715 | - | 16,715 | ||||
Interest expense | 5,281 | 5,023 | - | 10,304 | ||||
Interest paid | (3,880 | ) | (5,023) | - | (8,903) | |||
Other costs | 2,508 | - | - | 2,508 | ||||
Lease write-offs | - | (11,037 | ) | - | (11,037 | ) | ||
Total other changes related to liabilities | 3,909 | 5,678 | - | 9,587 | ||||
Total other changes related to equity | - | - | 114,388 | 114,388 | ||||
Balance as of December 31, 2020 | 89,230 | 75,228 | 116,072 | 280,530 |
Loans and borrowings covenants
The loans and borrowings described above are subject to covenants, which establish the early maturity of debts. Early maturity of the loans could be caused by:
| — | Disposal, merger, incorporation, spin-off, or any other corporate reorganization process that implies a change in the shareholding control, except for the prior consent from the creditor, and if it does not affect the liquidity capacity of this instrument. During 2021, due to corporate reorganization as mentioned in the note 1.a, the Company obtained the necessary waivers from financial creditors. |
| — | Failure to send the annual financial statements within 180 days of the fiscal year-end. |
| — | Public notice of default before a relevant notary office, in the amount of R$500, unless it has been proved to the creditor that the public note was issued due to a third-party mistake or bad faith, the public note of default was canceled, or the payment of the relevant debt was deposited in court within 30 days from such public notice default. |
The Group has complied with these covenants as of December 31, 2021 and December 31,2020.
CI&T Inc.
Consolidated financial statements
December 31, 2021
17 Salaries and welfare charges
| December 31, 2021 | December 31, 2020 | |
Salaries | 31,342 | 15,258 | |
Accrued vacation and charges | 83,750 | 50,064 | |
Bonus | 72,810 | 52,312 | |
Withholding income tax | 20,604 | 10,604 | |
Payroll charges (social contributions) | 18,124 | 5,929 | |
Others | 7,543 | 4,173 | |
Total | 234,173 | 141,794 |
The table below shows the movement of the bonus accrual:
2021 | ||||||||||
| Balance as of January 1, 2021 | Addition | Payment | Effect of movements in exchange rates | Balance as of December 31, 2021 | |||||
Bonus | 52,312 | 65,603 | (50,402 | ) | 5,297 | 72,810 | ||||
|
|
|
|
|
| |||||
2020 | ||||||||||
| Balance as of | Addition | Payment | Effect of movements in exchange rates | Balance as of December 31, 2020 | |||||
Bonus | 26,016 | 51,916 | (28,667 | ) | 3,047 | 52,312 | ||||
18 Accounts payable for business combination
| December 31, 2021 |
Remaining acquisition cost | 48,817 |
Retained amount | 30,000 |
Other | 6,909 |
Total | 85,726 |
Current | 48,923 |
Non-current | 36,803 |
Total | 85,726 |
The table below shows the movement of the accounts payable for business combination:
|
| 2021 |
|
| ||||
| Balance as of August 10, 2021 (Note 2) | Monetary adjustment | Payment | Balance as of December 31, 2021 | ||||
Accounts payable for business combination (note 9) | 133,573 | 3,091 | (50,938 | ) | 85,726 |
The subsidiary to CI&T Brazil paid R$ 50,938 on December 2, 2021 upon anticipation of part of the remaining balance due to the Company completing its Initial Public Offering in 2021.
19 Provisions
The Group is involved in tax and labor lawsuits that were considered probable losses and are provisioned according to the table below:
CI&T Inc.
Consolidated financial statements
December 31, 2021
| Balance as of January 1, 2020 | Provisions | Reversal | Balance as of December 31, 2020 | Provisions | Balance as of December 31, 2021 | ||||||
Tax | 10 | 1 | - | 11 | 120 | 131 | ||||||
Labor | 163 | 12 | (25) | 150 | 352 | 502 | ||||||
Total Provisions | 173 | 13 | (25) | 161 | 472 | 633 |
The main labor lawsuits referred to above refer to the compliance with minimum quota of employees with disabilities and lack of control over working hours.
As of December 31, 2021, the Group’s judicial deposits totaled R$3,079 (R$3,083 as of December 31, 2020), recognized in the statement of financial position, in non-current assets. Of this amount, R$2,933 (R$2,932 as of December 31, 2020) refer to tax lawsuits, R$142 (R$151 as of December 31, 2020) refer to labor lawsuits and R$4 refers to civil lawsuits.
Additionally, the Group is a party to civil, labor and tax lawsuits, whose likelihood of loss is regarded as possible, for which no provision was recorded, in the amount of R$4,292 as of December 31, 2021 (R$215 as of December 31, 2020) of which R$ 4,093 related to lawsuits assumed in the business combination with Dextra Group.
The significant lawsuits assessed as possible loss refer to:
| (i) | The labor infraction notices that addresses the hiring of employees with disabilities. The Group filed an administrative defense, but the notice was maintained. In February 2019, the Group appealed at administrative level and is awaiting the review. | |
| (ii) | Tax lawsuits related to non-contribution tax credits referring to payroll in the period from January 1 to December 31, 2011. | |
| (iii) | Civil lawsuit regarding an employee claiming alleged breach of employment contract by Dextra, therefore, requiring receipt of double amounts (undue refund). | |
20 Employee benefits
The Group provides its employees with benefits that include medical care, dental care and life insurance during their employment. These benefits are paid by the Group and according to the category of health plans elected, with a consideration paid by the employee.
CI&T Inc.
Consolidated financial statements
December 31, 2021
Additionally, the Group offers its employees the option to adhere to a private pension plan to which voluntary contributions are made. For CI&T Brazil, the contributions are made exclusively by the participants; for CI&T US, CI&T UK and CI&T Canada the companies contribute with the same amount as the participants up to 4% of the employee salary. In both scenarios there is no consideration to be paid by the subsidiaries, as there are no post-employment obligations. The nature of the plan allows employees to suspend or discontinue their contributions at any time and allows the Management to transfer the portfolio to another administrator.
The Group does not have additional post-employment obligations and none other long-term benefits, such as time-of-service leave, lifetime health plan and other time-service benefits.
21 Stock option plan
a. Plan in force
On March 30, 2020, the Board of Directors approved the 1st and 2nd stock option programs and, on February 26, 2021, approved the 3rd and 4th stock option programs, through which selected executives were granted options that confer the right to exercise the stock purchase, subject to certain conditions under the “Stock Option Plan”, with the option to settle in equity and cash.
On October 29, 2021, in connection with a restructuring pursuant to which the Company became the holding company of the CI&T Group for the purpose of an initial public offering (see note 1.a), the Board of Directors approved the migration of the plan from the subsidiary CI&T Brazil to the Company. The Company recognized to the rights of each participant accrued under the corresponding plan and related programs and shall assume all obligations of CI&T Software under such plan.
The options already granted become options granted under the CI&T Cayman Plan, provided that each option shall confer the right to acquire one class A common share issued by Company.
Considering that the number of shares forming Company’s capital stock is approximately 68.14 times the number of shares forming the subsidiary CI&T Brazil, the number of granted options and the exercise price were adjusted in the same proportion.
According to the above restructuring, the Company remeasured the fair value of the stock options granted, both of the Company and of the subsidiary CI&T Brazil on the date of the plan migration. The remeasurement to fair value of the stock options granted was immaterial.
Stock option program (equity settled)
The following are the general conditions of the Group’s stock option plan:
CI&T Inc.
Consolidated financial statements
December 31, 2021
Characteristics of the plans: | 1st and 2nd Program |
| Equity-settled | 4th Program |
|
|
| 3rd Program |
| ||
Grant date | 01/04/2020 |
| 01/04/2021 | 01/04/2021 |
|
Exercise Period: | 6.8 years | (i) | 5.8 years | 5.8 years | (i) |
Exercise | - | (i) | - | - | (i) |
Limit date | 01/01/2027 | (i) | 01/01/2027 | 01/01/2027 | (i) |
|
|
|
|
|
|
Activity of stock option number |
|
|
|
|
|
(+) Total number of granted options | 3,940,478 |
| 666,616 | 187,820 |
|
(-) Canceled options | 78,360 |
| - | 19,900 |
|
(=) Number of options not exercised | 3,862,118 | (ii) | 666,616 | 167,920 | (ii) |
(=) Number of outstanding options on 12/31/2021 | 3,862,118 |
| 666,616 | 167,920 |
|
(=) Number of exercisable options on 12/31/2021 | 1,244,994 |
| - | - |
|
|
|
|
|
|
|
Inputs used in the measurement |
|
|
|
|
|
Exercise price (in reais) | 9.58 | (ii) | 19.84 | 19.84 | (ii) |
Share price on the grant date (in reais) | 21.68 | (v) | 21.68 | 21.68 | (v) |
Volatility (% p.a.) | 24.19% | (iv) | 27.73% | 27.73% | (iv) |
Interest rate (% p.a.) | 1.53% |
| 2.66% | 2.66% |
|
Option value (in reais) | 0.37 | (iii) | 0.06 | 0.06 | (iii) |
Remaining average term (expected lifetime) | 3.7 years | (vi) | 4.3 years | 4.3 years | |
|
|
|
|
|
|
Effects on income for the year: |
|
|
|
|
|
Total expense attributed to the granting of options (R$) | 1,846 |
| 1,275 | 298 |
|
Expenses incurred until December 31, 2020 (R$) | 142 |
| - | - |
|
Expenses incurred until December 31, 2021 (R$) | 668 |
| 251 | 48 |
|
Expenses to incur | 1,036 |
| 1,024 | 250 |
|
CI&T Inc.
Consolidated financial statements
December 31, 2021
| (i) | Conditional upon the grace period and assuming the possibility of anticipated vesting in face of a liquidity event. |
| (ii) | Price established was based on valuation at the time the options are granted. |
| (iii) | Fair value based on the Black-Scholes method. |
| (iv) | The expected volatility was estimated based on the historical volatility of the comparable Companies share price. |
| (v) | The share price was determined based on valuation prepared by the Group on the date of plan migration. |
| (vi) | Average calculated considering that, according to the definition of the plan, 25% of the options can be exercised before the vesting period. |
The Board of Directors is entitled to select the participants of the program, at its sole discretion, among the Management, executives, employees and service providers of the Company and its subsidiaries. Additionally, the Board of Directors defines the terms of each program, when the option granted to the participants will become eligible for exercise (“vesting period”), including the possibility of anticipating the vesting period.
The fair value of the stock options granted is estimated on the grant date, based on the Black-Scholes model, which considers the terms and conditions for granting the shares.
On October 29, 2021, as a result of the corporate reorganization, the exercise price of the options changed from R$ 653.21 to R$ 9.58 for the 1st and 2nd programs and changed from R$ 1,352.00 to R$ 19.84 for the 3rd and 4th programs, to be updated according to the official national price index (IPCA / IBGE). The participants must pay the exercise price in cash and the program does not provide for alternatives for paying cash back to participants.
In the year ended on December 31, 2021, the Group recognized in the statement of profit or loss an amount of R$ 967 (R$ 142 as of December 31, 2020), see details in item “e”.
b. Stock option program (settled in cash)
Due to the corporate reorganization as described in item “a”, the stock option program settled in cash was also migrated from the subsidiary CI&T Brazil to the Company. The number of granted options was proportionally adjusted by the equivalent of the Company's shares.
The amount to be settled in cash is based on the increase of the Group’s share price between the grant date and the exercise date.
| Payable in cash |
| Payable in cash |
|
Granting date | 04/2020 |
| 10/2021 |
|
Exercise Period: | 6.8 years | (i) | 5.2 years | (i) |
Exercise Date | - | (i) | - | (i) |
Limit date for exercising the options | 01/01/2027 | (i) | 01/01/2027 | (i) |
Total number of options granted | 69,774 |
| 12,130 |
|
Liabilities carrying amount as of December 31, 2021 | 1,307 |
| 52 |
|
(i) Conditional upon the grace period and assuming the possibility of anticipated vesting in face of a liquidity event.
CI&T Inc.
Consolidated financial statements
December 31, 2021
c. Canceled plans
On August 31, 2013, the Group approved the stock option plan, through which the executive officers elected by the Board of Directors were granted the possibility of acquisition of the Company’s shares, subject to certain conditions (“Stock Option Plan”).
The Extraordinary Shareholders’ Meeting (“EGM”), held on November 13, 2019, approved the cancellation of all programs and contracts of the Group’s Stock Option Plan, approved at the Company’s Extraordinary Shareholders’ Meeting of May 31, 2013, so that all options to purchase the shares issued by the Group granted to beneficiaries, exercisable or not, were canceled, with no effect for all legal purposes. On November 13, 2019, the Group unilaterally canceled the share-based payment plan, according to the EGM held on that date.
On December 19, 2019, at the Board of Directors’ meeting, the Group and the beneficiaries of the extinguished plan approved the Transaction and Settlement Agreement and Other Covenants, which includes the indemnities to be paid in the amount of R$44,000, granting full discharge to the Group of any right related to the Plan.
In 2020, the agreements were ratified and paid, in the total amount of R$43,354. The remaining amount, of R$628, was approved and paid in July 2021.
d. Shares granted to executive officers
In August 2017, the Company granted to the former controlling shareholders of the subsidiary Comrade, Inc. (later merged into CI&T, Inc.) the right to receive 16,530 shares. Comrade’s shareholders became executives of the Group, and the granting of the shares is conditioned to continuing employment in the Group for a period of four years from the acquisition date of Comrade. The fair value of the shares was estimated on the acquisition date of the subsidiary, using the “Black-Scholes” pricing model, in the amount of R$5,120.
As of December 31, 2021, the impact on profit or loss totaled R$246 (R$751 as of December 31, 2020), see details below in item “e” – expenses recognized in profit or loss.
On October 8, 2021, the executive officers exercised the options through the issuance of 16,530 new common shares, with no par value, at the total issuance price of R$28,697, subscribed by McMillian Family Trust. The subscribed shares were paid through the transfer of 15,896 shares issued by the subsidiary CI&T Inc to the subsidiary CI&T Brazil.
e. Expenses recognized in profit or loss
| December 31, 2021 | December 31, 2020 | ||
Plan in force: |
|
| ||
Equity settled | 967 | 142 | ||
Cash settled | 1,318 | 41 | ||
Shares granted to executives’ officers | 246 | 751 | ||
Expenses recognized in profit or loss (note 24) | 2,531 | 934 | ||
Other effects in shareholders’ equity | 1,282 | 1,751 | ||
Total | 3,813 | 2,685 | ||
(-) Effect of cash settled | (1,318 | ) | (41 | ) |
Effect of movements in exchange rates | 3 | 8 | ||
Total shareholders’ equity | 2,498 | 2,652 |
CI&T Inc.
Consolidated financial statements
December 31, 2021
22 Equity
a. Share capital
| December 31, 2021 | December 31, 2020 | |
Number of ordinary nominative shares | 132,197,896 | 121,086,781 | |
Par value (i) | 0.00027 | 0.56958 | |
Share capital | 36 | 68,968 |
| (i) | In November 2021 the Group’s shareholders approved a capital stock share split with a 1:68.14 share split ratio. As a result of the share split, the Group’s historical financial statements have been revised to reflect the number of shares and per share data as if the share split had been in effect for all periods presented. |
As at December 31, 2021, after all the corporate restructuring for purposes of the registration of the Company’s common shares in connection with the IPO (see note 1.a), the Company’s share capital is R$ 36 represented by 132,197,896 common shares. Those common shares are represented by 15,000,000 Class A common shares and 117,197,896 Class B common shares. As at December 31, 2020 the CI&T Brazil’s share capital consists of 121,086,781 common shares, in the total amount of R$ 68,968.
The holders of the Class A common shares and Class B common shares have identical rights, except that (i) the holders of Class B common shares are entitled to ten votes per share, whereas holders of Class A common shares are entitled to one vote per share, (ii) Class B common shares have certain conversion rights and (iii) the holders of Class B common shares are entitled to maintain a proportional ownership interest in the event that additional Class A common shares are issued, however that such rights to purchase additional Class B common shares may only be exercised with Class B Shareholder Consent.
b. Share premium
The share premium refers to the difference between the subscription price (US$ 15.00 per share) that the shareholders paid for the shares and their nominal value (US$ 0.00005 per share), as a total amount of R$ 915,947 (US$ 166,666).
c. Capital reserve
Corporate Restructuring
As described in note 1.a above, CI&T completed its corporate restructuring in November 2021. CI&T Brazil ceased to be ultimate parent company, and CI&T (non-operating holding company) became the ultimate parent company. This transaction occurred through the transfer of the shares of its shareholders from CI&T Brazil to CI&T Delaware and, subsequently, to CI&T, which result in the capital increase of 121,086,781 shares at par value of R$ 0.00027 per share, in the amount of R$ 33, and the remaining amount of R$ 88,206 was recorded as capital reserve.
Share-based compensation
CI&T Inc.
Consolidated financial statements
December 31, 2021
The Group a share-based compensation plans that are accounted as Capital reserve per a total amount of R$ 2,498 (see note 21).
Share issuance costs
The Company incurred incremental costs directly attributable to the public offering in the amount of R$ 66,876, net of taxes, recorded in the Capital reserve.
d. Earnings reserves
| December 31, 2021 | December 31, 2020 | |
Retained earnings reserve | 125,957 | 95,515 |
The application of earnings reserves will be decided at the Annual and Extraordinary Shareholders’ Meeting.
e. Dividends and interest on shareholders’ equity
The dividends and interest on shareholder´s equity mentioned below occurred before the corporate reorganization. As of December 31, 2021, the Company had no dividends liability.
On April 30, 2021, the Shareholders’ Meeting and Extraordinary Shareholders’ Meeting of CI&T Brazil approved:
- the payment for interest on equity up to the annual limit of R$ 6,288;
- the distribution of additional dividends on profit for the year ended 2020 in the amount of R$ 40,363. As of June 28, 2021, the Company paid the amount of R$ 71,040 related to the profit for the year ended 2020. Dividends declared and paid totaled R$ 17.60 per common share of the subsidiary in 2020.
Additionally, on October 8, 2021, the Extraordinary Shareholders’ Meeting of CI&T Brazil approved the distribution of additional dividends on profit for the year ended 2020, in the amount of R$ 55,005, equivalent to R$ 31.24 per common share of the subsidiary in 2020.
f. Other comprehensive income
Accumulated translation adjustments include all foreign currency translation differences on investments abroad.
23 Net revenue
The Group generates revenue primarily through the provision of services described in the table below, which is summarized by nature:
| December 31, 2021 | December 31, 2020 | |
Software development revenue | 1,394,583 | 891,012 | |
Software maintenance revenue | 30,026 | 31,133 | |
Revenue from software license agent | 1,637 | 2,413 | |
Consulting revenue | 15,922 | 28,601 | |
Other revenue | 2,212 | 3,360 | |
Total net revenue | 1,444,380 | 956,519 |
CI&T Inc.
Consolidated financial statements
December 31, 2021
The following table sets forth the net revenue by industry vertical for the periods indicated:
. | December 31, 2021 | December 31, 2020 | |
By Industry Vertical |
|
| |
Financial services | 487,177 | 324,118 | |
Food and beverages | 340,709 | 244,590 | |
Pharmaceuticals and cosmetics | 206,375 | 134,763 | |
Technology, media, and telecom | 169,311 | 81,961 | |
Retail and manufacturing | 93,871 | 83,046 | |
Education and services | 64,336 | 41,323 | |
Others | 82,600 | 46,718 | |
Total net revenue | 1,444,380 | 956,519 |
Performance obligations and revenue recognition policies
The revenue is measure based on the consideration specified in the contract with the client. The Group recognizes revenue when it transfers control over the product or service to the customer.
The table below provides information on the nature and timing of performance obligations in contracts with customers, including the revenue recognition policies listed in the main types of services:
Type of service | Nature and timing of performance obligations | Revenue recognition in accordance with IFRS 15 |
Services provision: | The Group has determined that the customer controls all work in progress as the services are provided. This is because, according to these contracts, services are provided according to the client’s specifications and, if a contract is terminated by the client, the Group will be entitled to reimbursement of the costs incurred to date, including a reasonable margin. Invoices are issued in accordance with contractual terms and are usually paid on average in 70 days. Unbilled amounts are presented as contract assets. | The associated revenue and costs are recognized over time. The progress of the performance obligation is measured based on the hours incurred. |
Software License Agency | The Group acts as an agent in software license agreements between the developer and the customer. Invoices (related to agency fees) are issued in accordance with the contractual terms and are generally paid on average within 45 days. | Revenue related to fees as agent is recognized when contracts are entered into. |
Contract assets
Contract assets relate mainly to the Group’s rights to consideration for services performed, for which control has been transferred to the client, but not invoiced on the reporting date. Contract assets are transferred to receivables when the Group issues an invoice to the client.
CI&T Inc.
Consolidated financial statements
December 31, 2021
The balances from contract assets are shown and segregated in the statement of financial position as follows:
. | December 31, 2021 | December 30, 2020 | ||
Local market | 80,107 | 35,364 | ||
Foreign market | 55,194 | 15,936 | ||
(-) Expected credit losses from contract assets | (913 | ) | (675 | ) |
Total | 134,388 | 50,625 |
The movement of expected credit losses of contract assets, is as follows:
Balance as of January 1, 2020 | (805) |
Reversal | 218 |
Effect of movements in exchange rates | (88) |
Balance as of December 31, 2020 | (675) |
(Provision) | (217) |
Effect of movements in exchange rates | (21) |
Balance as of December 31, 2021 | (913) |
24 Expenses by nature
Information on the nature of expenses recognized in the consolidated statement of profit or loss is presented below:
. | December 31, 2021 | December 31, 2020 | ||
Employee expenses | (1,010,989 | ) | (628,699 | ) |
Third-party services and other inputs | (65,023 | ) | (55,660 | ) |
Short-term leases | (5,922 | ) | (4,669 | ) |
Travel expenses | (4,156 | ) | (8,656 | ) |
Depreciation and amortization (a) | (48,354 | ) | (29,882 | ) |
Stock options (b) (note 21) | (2,531 | ) | (934 | ) |
Consulting (c) | (9,177 | ) | (446 | ) |
Expected credit loss | (497) | (196 | ) | |
Impairment of intangible assets (note 14) | (21,895 | ) | - | |
Surplus of indemnity | - | 18 | ||
Other costs and expenses | (31,230 | ) | (19,151 | ) |
Total | (1,199,774 | ) | (748,275 | ) |
|
|
| ||
Disclosed as: |
|
| ||
Costs of services provided | (935,732 | ) | (600,866 | ) |
Selling expenses | (89,654 | ) | (65,093 | ) |
General and administrative expenses | (151,681 | ) | (81,161 | ) |
Research and technological innovation expenses | (4 | ) | (3,462 | ) |
Impairment loss on trade receivables and contract assets | (497 | ) | (196 | ) |
Other income (expenses) net | (22,206 | ) | 2,503 | |
Total | (1,199,774 | ) | (748,275 | ) |
CI&T Inc.
Consolidated financial statements
December 31, 2021
| (a) | Depreciation and amortization in the total amount of R$48,354 (R$29,882 as of December 31, 2020) include R$31,884 (R$24,085 as of December 31, 2020) classified as cost of services and R$16,470 (R$5,797 as of December 31, 2020) as expenses. |
| (b) | Stock options in the total amount of R$2,531 (R$934 as of December 31,2020) include R$1,930 (R$139 as of December 31, 2020) classified as cost of services and R$601 (R$795 as of December 31, 2020) as expenses. |
| (c) | Consulting expenses in the total amount of R$9,177 (R$446 as of December 31, 2020) include R$6,957 (R$446 as of December 31, 2020) for acquisitions and R$2,220 referring to costs directly attributable to secondary public share offerings. |
24.1 Other income (expenses), net
. | December 31, 2021 | December 31, 2020 | ||
Costs attributable to secondary offer | (2,220 | ) | - | |
Impairment of intangible assets (note 14) | (21,895 | ) | - | |
Government grant | 2,481 | 1,571 | ||
Other | (572 | ) | 932 | |
| (22,206 | ) | 2,503 |
25 Net finance costs
. | December 31, 2021 | December 31, 2020 | |||
Finance income: |
|
| |||
Income from financial investments | 4,321 | 2,626 | |||
Foreign-exchange gain | 46,302 | 28,135 | |||
Gains on derivatives | 18,585 | 16,652 | |||
Interest received | 99 | 170 | |||
Other finance income | 599 | 225 | |||
| 69,816 | 47,808 | |||
Finance costs: |
|
| |||
Exchange variation loss | (49,237 | ) | (20,080 | ) | |
Loss on derivatives | (18,112 | ) | (31,575 | ) | |
Interest and charges on loans and leases (note 16) | (29,729 | ) | (10,304 | ) | |
Bank guarantee expenses | (17 | ) | (17 | ) | |
Commissions and brokerage | (2,598 | ) | - | ||
Negative monetary variation | (3,092 | ) | - | ||
Other finance costs | (1,263 | ) | (1,285 | ) | |
| (104,048 | ) | (63,261 | ) | |
Net finance costs | (34,232 | ) | (15,453 | ) |
CI&T Inc.
Consolidated financial statements
December 31, 2021
26 Income tax and social contribution
Income tax and social security contribution recognized in profit or loss for the year are shown as follows:
. | December 31, 2021 | December 31, 2020 | |||
Current income tax and social security contribution | (95,375 | ) | (66,912 | ) | |
Deferred income tax | 10,958 | 1,775 | |||
Income tax and social contributions | (84,417 | ) | (65,137 | ) |
The reconciliation of the effective rate with the average nominal rate is shown as follows:
. | December 31, 2021 | December 31, 2020 | |||
Profit before income tax and social contribution | 210,374 | 192,791 | |||
Combined income tax and social contribution rate | 34% | 34% | |||
Tax using the Company’s domestic tax rate | (71,527 | ) | (65,549 | ) | |
Interest on own capital | 2,138 | 1,469 | |||
Expected income tax expense and interest on own capital | (69,389 | ) | (64,080 | ) | |
Tax incentives | - | 219 | |||
Impairment loss (intangible) | (6,864 | ) | - | ||
Other permanent exclusions (additions) | (8,164 | ) | (1,276 | ) | |
Income Tax and Social Contribution Expenses | (84,417 | ) | (65,137 | ) | |
Current | (95,375 | ) | (66,912 | ) | |
Deferred | 10,958 | 1,775 | |||
| (84,417 | ) | (65,137 | ) | |
Effective rate | 40% | 34% |
Amounts recognized directly in shareholders' equity
. | December 31, 2021 | December 31, 2020 | |||
Stock option plan compensation | (147 | ) | 45 | ||
Total | (147 | ) | 45 | ||
|
|
| |||
Current | - | 8,698 | |||
Deferred | (147 | ) | (8,653 | ) | |
Total taxes recognized in equity | (147 | ) | 45 |
CI&T Inc.
Consolidated financial statements
December 31, 2021
Deferred tax
The composition and changes in the deferred income tax and social contribution are described below:
December 31, 2021 | |||||||||||||||||||||||
. | Net balance on January 1st | Recognition in equity | Recognition in profit or loss | Other | Exchange variation effect | Net amount | Deferred tax asset | Deferred tax liabilities | |||||||||||||||
Provisions | 2,038 | - | (437 | ) | - | 76 | 1,677 | 1,739 | (62 | ) | |||||||||||||
Salaries and welfare charges | 18,447 | - | 6,354 | - | 968 | 25,768 | 25,768 | - | |||||||||||||||
Lease | 2,168 | - | (41 | ) | - | (5 | ) | 2,122 | 2,122 | - | |||||||||||||
Other items | (8,629 | ) |
| 2,630 | 6,913 | (307 | ) | 607 | 2,440 | (1,833 | ) | ||||||||||||
Indemnity on stock options plan | 214 | (147 | ) | (67 | ) | - | - | - | - | - | |||||||||||||
Tax loss carry amount | 915 | - | 2,519 | (1,619 | ) | - | 1,815 | 3,228 | (1,413 | ) | |||||||||||||
Net tax liability (assets) | 15,152 | (147 | ) | 10,958 | 5,294 | 732 | 31,989 | 35,297 | (3,308 | ) | |||||||||||||
December 31, 2020 | |||||||||||||||||||||||
. | Net balance on January 1st | Recognition in equity | Recognition in profit or loss | Other | Exchange variation effect | Net amount | Deferred tax asset | Deferred tax liabilities | |||||||||||||||
Provisions | 1,597 | - | 107 | - | 334 | 2,038 | 2,075 | (37 | ) | ||||||||||||||
Salaries and welfare charges | 10,122 | - | 7,236 | - | 1,090 | 18,447 | 18,447 | - | |||||||||||||||
Lease | 1,583 | - | 486 | - | 98 | 2,168 | 2,168 | - | |||||||||||||||
Other items | (2,435 | ) | - | (1,119 | ) | (4,956 | ) | (119 | ) | (8,629 | ) | 66 | (8,695 | ) | |||||||||
Indemnity on stock options plan | 13,304 | (8,653 | ) | (4,757 | ) | - | 321 | 214 | 214 | - | |||||||||||||
Tax loss carry amount | 806 | - | (178 | ) | - | 286 | 915 | 914 | - | ||||||||||||||
Net tax liability (assets) | 24,977 | (8,653 | ) | 1,775 | (4,956 | ) | 2,010 | 15,152 | 23,884 | (8,732 | ) | ||||||||||||
27 Earnings per share
Basic and diluted earnings per share
The calculation of basic earnings per share was based on the net income attributed to holders of common shares and the weighted average number of outstanding common shares. The calculation of diluted earnings per share was based on the net income attributed to holders of common shares and the weighted average number of outstanding common shares, after adjustments for all potential diluted common shares.
| December 31, 2021 | December 31, 2020 | |||
Numerator |
|
| |||
Profit attributable to holders of common shares | 125,957 | 127,654 | |||
Denominator |
|
| |||
Weighted average number of basic shares held by shareholders | 121,777,128 | 119,960,383 | |||
Earnings per share – basic | 1.03 | 1.06 | |||
|
|
| |||
Numerator |
|
| |||
Profit attributable to holders of common shares | 125,957 | 127,654 | |||
Denominator |
|
| |||
Weighted average number of diluted shares held by shareholders | 125,155,798 | 123,287,891 | |||
Net earnings per share – diluted | 1.01 | 1.04 |
CI&T Inc.
Consolidated financial statements
December 31, 2021
Weighted average number of common shares
| December 31, 2021 | December 31, 2020 | |||
Weighted average common shares (basic) | 121,777,128 | 119,960,383 | |||
Effect of stock options when exercised | 3,378,670 | 3,327,508 | |||
Weighted average number of common shares | 125,155,798 | 123,287,891 |
28 Financial instruments and risk management
28.1 Financial instrument categories
The Group maintains operations with derivative and non-derivative financial instruments. These instruments are managed to assure liquidity and profitability. The control policy consists of monitoring the terms contracted against the terms and condition current in the market. The Company does not make investments of a speculative nature in derivatives or any other risk assets.
The estimated fair value of the Group's financial instruments considered the following methods and assumptions:
| • | Cash and cash equivalents: recognized at cost plus income earned up to the closing date of the financial statements, which approximate their fair value. |
| • | Trade receivables: arise directly from the Group's operations, classified at amortized cost, are recorded at their original values, adjusted based on the exchange rate changes, when applicable, and subject to a provision for losses. Their carrying amount is a reasonable approximation of fair value. |
| • | Loans and borrowings: classified as financial liabilities measured at amortized cost and are recorded at their contractual values. The contractual flow of loans and borrowings is adjusted to the future value of the liabilities considering the interest until maturity. |
| • | Derivative financial instruments: The Group used derivative financial instruments to manage the interest rate risk exposure. This risk arises from the possibility of the Group incurring losses because of interest rate fluctuations that increase finance costs related to loans. In April, 2021, the Group has decided to not engage in new derivative agreements to manage the foreign exchange risk exposure. Existing contracts were maintained. NDFs — non-deliverable forwards are used for operations with derivative instruments, for the discounted cash flow model for fair value calculation, with future dollar and interest assumptions obtained at B3 — Brasil, Bolsa, Balcão. |
Black and Scholes fair value statistical model is used for transactions with currency option (dollar), with future dollar and interest assumption obtained at B3.
The financial instruments were valued by calculating the present value through the use of market curves that impact the specific instrument on the calculation dates. For this, future curves of USD Libor 3M, exchange coupon, and currency quotation are used. For interest rate swaps, the present value of the asset position and the liability position, both are estimated by discounting cash flows at the interest rate of the currency in which the swap is denominated. The difference between the present value of the asset and the liability position of the swap generates its fair value.
CI&T Inc.
Consolidated financial statements
December 31, 2021
The following table shows the carrying amounts and fair values of financial assets and financial liabilities, segregated by category:
| December 31, 2021 | |||||||
| Amortized cost | Assets/liabilities measured at FVTPL | Total | |||||
Financial assets |
|
|
| |||||
Cash and cash equivalents | 135,727 | - | 135,727 | |||||
Financial investments | 798,786 | - | 798,786 | |||||
Trade receivables | 340,519 | - | 340,519 | |||||
Contract assets | 134,388 | - | 134,388 | |||||
Derivatives | - | 896 | 896 | |||||
Other assets | 32,949 | - | 32,949 | |||||
| 1,442,369 | 896 | 1,443,265 | |||||
|
|
|
| |||||
Financial liabilities |
|
|
| |||||
Suppliers and other payables | 33,566 | - | 33,566 | |||||
Loans and borrowings | 788,709 | - | 788,709 | |||||
Lease liabilities | 81,888 | - | 81,888 | |||||
Accounts payable for business combination | 85,726 | - | 85,726 | |||||
Derivatives | - | 535 | 535 | |||||
Contract liabilities | 13,722 | - | 13,722 | |||||
Other liabilities | 15,329 | - | 15,329 | |||||
| 1,018,940 | 535 | 1,019,475 | |||||
| December 31, 2020 | |||||||
| Amortized cost | Assets/liabilities measured at FVTPL | Total | |||||
Financial assets |
|
|
| |||||
Cash and cash equivalents | 162,827 | - | 162,827 | |||||
Trade receivables | 196,256 | - | 196,256 | |||||
Contract assets | 50,625 | - | 50,625 | |||||
Derivatives |
| 8,837 | 8,837 | |||||
Other assets | 15,368 | - | 15,368 | |||||
| 425,076 | 8,837 | 433,913 | |||||
|
|
|
| |||||
Financial liabilities |
|
|
| |||||
Suppliers and other payables | 15,312 | - | 15,312 | |||||
Loans and borrowings | 89,230 | - | 89,230 | |||||
Lease liabilities | 75,228 | - | 75,228 | |||||
Derivatives | - | 5,392 | 5,392 | |||||
Contract liabilities | 9,987 | - | 9,987 | |||||
Other liabilities | 8,856 | - | 8,856 | |||||
| 198,613 | 5,392 | 204,005 | |||||
28.2 Financial risk management
The Group’s operations are subject to the following risk factors:
a. Market risks
The Group is exposed to market risks resulting from the normal course of its activities, such as inflation, interest rates and exchange rate changes.
CI&T Inc.
Consolidated financial statements
December 31, 2021
Thus, the Group's operating results may be affected by changes in national economic policy, especially regarding short and long-term interest rates, inflation targets and exchange rate policy. Exposures to market risk are measured by sensitivity analysis.
a.1 Foreign currency – Exchange rate changes
Foreign currency risk is inherent to the Group’s business model. The Group’s revenue is mainly denominated in foreign currency and, therefore, is exposed to exchange rate changes. The Group’s expenses, on the other hand, are mainly denominated in the Group’s functional currency (Brazilian Reais) and, therefore, are not exposed to exchange rate changes. The Group is exposed to exchange rate risk on its Financial Investments, suppliers and other payables, trade receivables, loans and borrowings, lease liabilities and derivatives.
| December, 2021 |
| December, 2020 | ||||||||
| USD | Other |
| USD | Other | ||||||
Financial investments | 798,786 | - |
| - | - | ||||||
Suppliers and other payables | (8,763 | ) | (722 | ) | (3,057 | ) | (540 | ) | |||
Trade receivables | 233,724 | 7,273 |
| 160,411 | 3,855 | ||||||
Loans and borrowings | (266,561 | ) | - |
| (37,116 | ) | - | ||||
Lease liabilities | (32,159 | ) | (962 | ) | (30,307 | ) | - | ||||
Derivatives | 361 | - |
| (1,321 | ) | - | |||||
Net exposure | 725,388 | 5,589 |
| 88,610 | 3,315 | ||||||
The Group is exposed to exchange rate risk in other currencies. As it is immaterial, the Group did not carry out the sensitivity analysis.
a.2 Exchange rate risk
The Group is exposed to foreign currency risk to the extent that there is a mismatch between the currencies in which sales, purchases, receivables, and borrowings are denominated and the respective functional currencies of the Company and its subsidiaries.
a.3 Interest rate risk
Derives from the possibility of the Group incurring gains or losses resulting from changes in interest rates applicable to its financial assets and liabilities. The Group may also enter into derivative contracts in order to mitigate this risk.
Sensitivity analysis of non-derivative financial instruments
Exchange rate fluctuation and changes in interest rates may positively or adversely affect the financial statements, due to an increase or decrease in the balances of trade receivables and investments in foreign currency and the variation in the balances of financial investments and loans and borrowings.
The Group mitigates its risks relating to non-derivative financial assets and liabilities substantially, through the contracting of derivative financial instruments. Accordingly, the Group identified the main risk factors that may generate losses for its operations with derivative financial instruments and this sensitivity analysis is based on three scenarios that may impact the Group’s future results and cash flows, as described below:
(i) Probable scenario: The Group’s projections, based on internal and external data, considered: (i) the interest rate index in order to analyze the sensitivity of the index in short-term investments, whose average was 10.67% for CDI and loans and borrowings, whose average was 0.27% for Libor (only applicable for some loans and borrowings); (ii) the exchange rate of R$5.30 USD, related to the closing rate projected by the Company, for the purposes of analyzing the foreign exchange exposure. Based on these factors, variations in the adverse and remote scenarios were calculated.
(ii) Adverse scenario: The adverse scenario rate is half the difference between the probable rate and the remote rate.
(iii) Remote scenario: the highest projection expected by the Company for the next 12 months.
CI&T Inc.
Consolidated financial statements
December 31, 2021
For each scenario, the gross finance income or finance costs were calculated, excluding taxes and the maturity flow of each agreement. The base date considered was December 31, 2021, projecting the indexes for one year and verifying their sensitivity in each scenario.
Sensitivity analysis for interest rate risk
| Risk | Exposure in R$ | Probable scenario (i) | Adverse Scenario (ii) | Remote Scenario (iii) | |||||||||
Short-term financial investments | Interest rate increase - CDI | 66,007 | 10.67% | 11.39% | 12.11% | |||||||||
|
|
| 7,043 | 7,518 | 7,993 | |||||||||
Loans and borrowings | Interest rate increase - CDI | (609,374) | 10.67% | 11.39% | 12.11% | |||||||||
|
|
| (65,020 | ) | (69,408 | ) | (73,795 | ) | ||||||
Loans and borrowings | Interest rate increase - Libor | (179,333) | 0.27% | 0.54% | 0.81% | |||||||||
|
|
| (484 | ) | (968 | ) | (1,452 | ) | ||||||
Effect on earnings (reduction) |
|
| (8,367 | ) | (12,763 | ) | (17,160 | ) |
Sensitivity analysis for exchange rate risk
| Risk | Probable scenario (i) | Adverse Scenario (ii) | Remote Scenario (iii) | ||||||||
Net exchange variation on transactions |
|
|
|
| ||||||||
Exchange variation in the year | Foreign currency appreciation - USD | 5.30 | 5.50 | 5.70 | ||||||||
Effect on earnings (increase) |
| (5,718 | ) | (5,933 | ) | (6,378 | ) | |||||
|
| 303 | 88 | (357 | ) |
As of December 31, 2021, the Group held agreements for financial derivatives (NDFs), with the purpose of reducing exchange rate risk.
b. Credit risk
Credit risk refers to the risk that a counterparty will not comply with its contractual obligations, causing the Group to incur financial losses. Credit risk is the risk of a counterparty in a business transaction not complying with an obligation provided by a financial instrument or an agreement with a client, which would cause financial loss. To mitigate these risks, the Group analyses the financial and equity condition of its counterparties, as well as the definition of credit limits and permanent monitoring of outstanding positions.
The Group applies the simplified standard approach to commercial financial assets, where the provision for losses is analyzed over the remaining life of the asset.
CI&T Inc.
Consolidated financial statements
December 31, 2021
In addition, the Group is exposed to credit risk with respect to financial guarantees granted to banks.
The Group held cash and cash equivalents of R$ 135,727 on December 31, 2021 (2020: R$ 162,827) and financial investments of R$ 798,786 at December 31, 2021. The cash and cash equivalents and financial investments are held with bank and financial institution counterparties, which are rated BB- to A+, based on Standard & Poor’s ratings.
The carrying amount of financial assets represents the maximum credit exposure. The maximum credit risk exposure on the date of the financial statements is:
| December 31, 2021 | December 31, 2020 | |||
Hedge financial instruments (current and non-current) | 896 | 8,837 | |||
Cash and cash equivalents | 135,727 | 162,827 | |||
Financial investments | 798,786 | - | |||
Trade receivables | 340,519 | 196,256 | |||
Contract assets | 134,388 | 50,625 | |||
Other receivables (current and non-current) | 32,949 | 15,368 |
At 31 December 2021, the exposure to credit risk for trade receivables, contract assets and other receivables by geographic region was as follows:
| December 31, 2021 | December 31, 2020 | |||
NAE (North America and Europe) | 297,430 | 180,522 | |||
North America | 287,992 | 179,943 | |||
Europe | 9,438 | 579 | |||
LATAM (Latin America) | 202,528 | 75,577 | |||
APJ (Asia, Pacific and Japan) | 7,917 | 6,150 | |||
Total | 507,875 | 262,249 |
c. Liquidity risk
The Group monitors liquidity risk by managing its cash resources and financial investments.
Liquidity risk is also managed by the Group through its cash flow projection, which aims to ensure the availability of funds to meet the Group’s both operational and financial obligations.
The Group also maintains approved credit lines with financial institutions, and other indebtedness such as working capital agreements in order to adequate levels of liquidity in the short, medium and long terms.
The maturities of the long-term installments of the loans are described in note 16.
CI&T Inc.
Consolidated financial statements
December 31, 2021
The following are the remaining contractual maturities of financial liabilities on the reporting date. The amounts are gross and undiscounted, including contractual interest payments and excluding the impact of netting agreements:
| 2021 | ||||||||||||||||
| Carrying amount | Cash contractual cash flow | 6 months or less | 6- 12 months | 1-2 years | 2-5 Years | |||||||||||
Non-derivative financial liabilities |
|
|
|
|
|
| |||||||||||
Trade payables | 33,566 | 33,566 | 33,566 | - | - | - | |||||||||||
Loans and borrowings | 788,709 | 974,942 | 136,161 | 88,045 | 171,022 | 579,714 | |||||||||||
Lease liabilities | 81,888 | 87,662 | 12,435 | 12,251 | 22,284 | 40,682 | |||||||||||
Accounts payable for business combination | 85,726 | 85,726 | 1,064 | 47,860 | 12,179 | 24,623 | |||||||||||
Contract liabilities | 13,722 | 13,722 | 13,722 | - | - | - | |||||||||||
Other payables (current and non-current) | 15,329 | 15,329 | 15,329 | - | - | - | |||||||||||
Derivatives | 535 | 535 | 535 | - | - | - | |||||||||||
| 1,019,475 | 1,211,482 | 212,812 | 148,156 | 205,485 | 645,029 | |||||||||||
| 2020 | ||||||||||||||||
| Carrying amount | Contractual cash flow | 6 months or less | 6-12 months | 1-2 years | 2-6 years | |||||||||||
Non-derivative financial liabilities |
|
|
|
|
|
| |||||||||||
Trade payables | 15,312 | 15,312 | 15,312 | - | - | - | |||||||||||
Loans and borrowings | 89,230 | 111,779 | 78,898 | 7,313 | 23,901 | 1,667 | |||||||||||
Lease liabilities | 75,228 | 93,242 | 11,393 | 10,470 | 19,053 | 52,326 | |||||||||||
Contract liabilities | 9,987 | 9,987 | 9,987 | - | - | - | |||||||||||
Other payables (current and non-current) | 8,856 | 8,856 | 8,856 | - | - | - | |||||||||||
Derivatives | 5,392 | 5,392 | 1,920 | 3,472 | - | - | |||||||||||
| 204,005 | 244,568 | 126,366 | 21,255 | 42,954 | 53,993 | |||||||||||
Financing Lines
Guaranteed unsecured account, reviewed annually, and paid upon request:
| December 30, 2021 | December 31, 2020 | |||
Used | - | - | |||
Not used | - | 2,200 | |||
| - | 2,200 |
Bank credit lines
| December 30, 2021 | December 31, 2020 | |||
Used | 11,161 | 89,197 | |||
Not used | 47,434 | 61,521 | |||
| 58,595 | 150,718 |
CI&T Inc.
Consolidated financial statements
December 31, 2021
The Group has credit lines credit lines for working capital with the banks HSBC and Citibank, in the amount of US$10,500 or R$58,595, at the exchange rate of 5.5805, the commercial selling rate for U.S. dollars as of December 31, 2021, as reported by the Brazilian Central Bank, partially used (note 16).
28.3 Derivative financial instruments
The Group holds derivative financial instruments to hedge its foreign currency and interest rate risk exposures. As of December 31, 2021, the Group entered into purchase and sale agreement for derivative financial instruments (NDFs) in the amount of R$(17).
Fair value estimated for derivative financial instruments contracted by the Group was determined according to information available in the market, mainly through financial institutions and specific methodologies of assessment. However, considerable judgment is necessary to understand market data in order to produce the fair value estimate for each operation. Consequently, the estimates do not necessarily indicate the amounts that will be effectively realized at settlement.
As of December 31, 2021, the Group had the following agreements for financial derivatives (NDFs):
| 2021 | |||||||||||||||
Maturity | Nominal value (USD) | Contracted rate | Amount in R$ | Market rate | Fair value | |||||||||||
February 25, 2022 | (560 | ) | 5.6220 | (3,148 | ) | 5.3459 | (17 | ) | ||||||||
Total |
|
|
|
| (17 | ) | ||||||||||
| 2020 | |||||||||||||||
Maturity | Nominal value (USD) | Contracted rate | Amount in R$ | Market rate | Fair value | |||||||||||
June 15, 2021 | (3,100 | ) | 5.4928 | (17,064 | ) | 5.4763 | 968 | |||||||||
April 15, 2021 | (800 | ) | 5.6345 | (4,508 | ) | 5.1909 | 353 | |||||||||
Total |
|
|
|
| 1,321 | |||||||||||
The Group also uses options in order to protect exports against the risk of exchange variation. The Group may enter into zero-cost collar strategies, which consists of the purchase of a put option and the sale of a call option, contracted with the same counterparty and with a net zero premium.
The composition of the balances involving options to buy and sell currencies is as follows:
| 2021 | ||||||||||||||
Maturity | Nominal value (USD) | Contracted rate | Amount in R$ | Market rate | Fair value | ||||||||||
01/21/2021 - 01/17/2022 | 875 | Put option | 4,900 | 5.8257 | (349 | ) | |||||||||
02/25/2021 - 02/25/2022 | 490 | Put option | 2,909 | 5.6490 | (170 | ) | |||||||||
|
|
|
|
| (519 | ) | |||||||||
|
|
|
|
|
| ||||||||||
01/21/2021 - 01/17/2022 | 875 | Call option | (4,900 | ) | 5.5563 | 298 | |||||||||
02/25/2021 - 02/25/2022 | 490 | Call option | (2,909 | ) | 5.4690 | 196 | |||||||||
|
|
|
|
| 494 | ||||||||||
|
|
|
|
| (25 | ) | |||||||||
CI&T Inc.
Consolidated financial statements
December 31, 2021
| 2020 | ||||||||||||||
Maturity | Nominal value (USD) | Contracted rate | Amount in R$ | Market rate | Fair value | ||||||||||
15/01 - 15/06/2021 | 1,800 | Call option | 587 | 5.6770 | (12 | ) | |||||||||
31/05 - 15/12/2021 | 2,800 | Call option | 786 | 5.5656 | (569 | ) | |||||||||
15/04 - 30/11/2021 | 6,900 | Call option | 2,161 | 5.5116 | (1,277 | ) | |||||||||
|
|
|
|
| (1,858 | ) | |||||||||
|
|
|
|
|
| ||||||||||
15/01 - 15/06/2021 | 1,800 | Put option | (587 | ) | 5.4800 | 512 | |||||||||
31/05 - 15/12/2021 | 2,800 | Put option | (786 | ) | 5.2425 | 862 | |||||||||
15/04 - 30/11/2021 | 6,900 | Put option | (2,161 | ) | 5.3388 | 2,608 | |||||||||
|
|
|
|
| 3,982 | ||||||||||
|
|
|
|
| 2,124 | ||||||||||
During 2021, the Group entered into an interest rate swap transaction with the purpose of hedging the exposure to variable interest rate related to the Export Credit Note – NCE with Citibank.
The interest rate profile of the Group’s interest-bearing financial instruments, as reported to the Group’s Management, is as follows:
| 2021 | ||||||||||||||
Maturity | Notional (USD) | Amount in R$ | Floating rate receivable | Fixed rate payable | Fair value | ||||||||||
07/16/2026 | 30,000 | 152,100 | 3-month LIBOR | 3.07% | 403 | ||||||||||
|
|
|
|
| 403 | ||||||||||
28.4 Classification of financial instruments by type of measurement of fair value
The Group has financial instruments measured at fair value, which are qualified as defined below:
Level 1 - Quoted prices (unadjusted) in active markets for identical assets or liabilities that the group may have access to on the measurement date;
Level 2 - Observable information for the asset or liability, directly or indirectly, except for quoted prices included in Level 1; and
Level 3 - Unobservable data for the asset or liability.
| Carrying amount | Fair value | ||||||||||
| December 31, 2021 | December 31, 2020 | December 31, 2021 | December 31, 2020 | ||||||||
Level 2 |
|
|
|
| ||||||||
Derivatives: |
|
|
|
| ||||||||
Non-Deliverable Forward - NDF | (17 | ) | 1,321 | (17 | ) | 1,321 | ||||||
Call and put option term | 403 | 2,124 | 403 | 2,124 | ||||||||
Interest rate swap | (25 | ) | - | (25 | ) | - | ||||||
| 361 | 3,445 | 361 | 3,445 | ||||||||
Non-derivatives |
|
|
|
| ||||||||
Lease liabilities | (81,888 | ) | (75,228 | ) | (87,662 | ) | (93,242 | ) | ||||
Loans and borrowings | (788,709 | ) | (89,230 | ) | (974,942 | ) | (111,779 | ) | ||||
| (870,597 | ) | (164,458 | ) | (1,062,604 | ) | (205,021 | ) | ||||
| (870,236 | ) | (161,013 | ) | (1,062,243 | ) | (201,576 | ) | ||||
CI&T Inc.
Consolidated financial statements
December 31, 2021
Cash and cash equivalents, financial investments, trade receivables, accounts payable for business combination and suppliers and other payables were not included in the table above. The Group understands that these financial instruments have no classification, as the carrying amount of these items is a reasonable approximation of fair value.
29 Related parties
Transactions with key management personnel
The Group paid R$11,096 as of December 31, 2021 (R$9,519 as of December 31, 2020) as direct compensation to key management personnel. These amounts correspond to the executive board compensation, related social charges and short-term benefits and are recorded under line “General and administrative expenses”.
In 2020, the amount of R$43,354 was paid to the key management personnel, due to the cancellation of the Group's stock option plan as disclosed in note 21.c. The remaining amount, of R$628, was approved and paid in July 2021.
The executive officers also participate in the Group's stock option program (see note 21). For the year ended on December 31, 2021, R$99 (R$22 in 2020) were recognized in the statement of profit or loss.
The Group has no additional post-employment obligation, as well as no other long-term benefits, such as premium leave and other severance benefits. The Group also does not offer other benefits in connection with the dismissal of its Senior Management’s members, in addition to those defined by the Brazilian labor legislation in force.
30 Operating segments
Operating segments are defined based on business activities that reflect how CODM - Chief Operating Decision Maker reviews financial information for decision.
The Group's CODM is the Group's Board of Director. The CODM is in charge of the operational decisions of resource allocation and performance evaluation. The CODM considers the whole Group as a single operating and reportable segment, monitoring operations, making decisions on fund allocation and evaluating performance based on a single operating segment.
The CODM reviews relevant financial data on a consolidated basis for all subsidiaries. CODM makes decisions and regularly evaluates the performance of Group’s services as a whole in a single operational and reportable segment.
The table below summarizes net revenues by geographic region:
| December 31, 2021 | December 31, 2020 | |||
NAE (North America and Europe) | 699,878 | 471,763 | |||
North America | 684,558 | 451,999 | |||
Europe | 15,320 | 19,764 | |||
LATAM (Latin America) | 694,334 | 435,987 | |||
APJ (Asia, Pacific and Japan) | 50,168 | 48,769 | |||
Total (Note 23) | 1,444,380 | 956,519 |
CI&T Inc.
Consolidated financial statements
December 31, 2021
Net revenues by geographic area were determined based on the country where the sale was made. The net revenue from a single customer represents 20% of the Company’s total net revenues as of December 31, 2021 (20% as of December 31, 2020).
Revenue by client concentration
The following table sets forth net revenue contributed by the top client, and top ten clients for the periods indicated:
. | December 31, 2021 | December 31, 2020 | |||
Top client | 283,311 | 190,599 | |||
Top 10 clients | 913,890 | 644,722 |
Geographic information of the Group's non-current assets
The table below summarizes non-current assets, except deferred taxes, based on assets geographic location:
. | December 31, 2021 | December 31, 2020 | |||
Brazil | 837,362 | 97,887 | |||
Abroad: |
|
| |||
United States of America | 38,417 | 36,010 | |||
Japan | 176 | 398 | |||
China | 2,239 | 776 | |||
Canada | 284 | 196 | |||
Portugal | 387 | - | |||
Other countries | 82 | 111 | |||
Total | 878,947 | 135,378 |
31 Subsequent events
Business combination – Somo acquisition
On January 14, 2022, the Company signed a Sale and Purchase Agreement (“Agreement”) to acquire Somo Global Ltd ("Somo"), a digital product agency headquartered in the UK, to accelerate its growth in EMEA (Europe, Midle East and Africa).
On January 27, 2022, the Company announced the completion of the Somo’s acquisition. According to the Agreement signed, the purchase price for the acquisition was R$ 341 million (US$63 million) paid in cash and 225,649 Class A common shares that were issued in connection with the transaction. The final purchase price is subject to adjustments, such as changes in working capital and net debt position. The Agreement also contemplates an earn-out clause of up to R$ 70 million (US$13 million) based on future performance.
With this acquisition, CI&T will accelerate its growth in EMEA. With offices in the UK, USA and Colombia, Somo delivers digital ambitions at pace and scale across several verticals including automotive, financial services, utilities and telecom.
Set forth below are (1) our unaudited pro forma condensed statements of profit or loss for the year ended December 31, 2021 and (2) our unaudited pro forma condensed statements of profit or loss for the year ended December 31, 2020.
The unaudited pro forma condensed statements of profit or loss for the year ended December 31, 2021 is based on (a) the audited consolidated statements of profit or loss of CI&T Brazil for the year ended December 31, 2021; and (b) the unaudited financial information of Dextra Tecnologia for the period from January 1, 2021 to August 9, 2021 and gives effect on a pro forma basis to the Dextra Acquisition as if it had been consummated on January 1, 2021.
The unaudited pro forma condensed statements of profit or loss for the year December 31, 2020 is based on (a) the audited consolidated statements of profit or loss of CI&T Brazil for the year ended December 31, 2020; and (b) the audited combined carve-out statements of profit or loss of Dextra Tecnologia for the year ended December 31, 2020 and gives effect on a pro forma basis to the Dextra Acquisition as if it had been consummated on January 1, 2020.
The unaudited pro forma condensed financial information included herein was prepared using the acquisition method of accounting in accordance with IFRS 3 – Business Combination (IFRS 3) and considering the amendments of Article 11 of Regulation S-X which became effective on January 1, 2021. The unaudited pro forma condensed financial information included herein are not necessarily indicative of statements of profit or loss would have been if the Dextra Acquisition had been completed as of the dates indicated, nor do they purport to project the future or operating results of the combined company. The actual results of operations may differ significantly from the pro forma amounts reflected herein due to a variety of factors. The pro forma financial information is presented for illustrative purposes only and does not reflect the costs of any integration activities or cost savings or synergies that may be achieved as a result of the Dextra Acquisition.
The following unaudited pro forma condensed financial information gives pro forma effect to the Dextra Acquisition to be accounted for under the acquisition method of accounting in accordance with the IFRS 3, in which CI&T Brazil is treated as the acquirer for financial reporting purposes and shall record assets acquired and liabilities assumed at their respective acquisition date fair values. The excess of the total consideration transferred over the estimated fair values of the net assets acquired, if applicable, is recorded as goodwill.
CI&T Brazil Unaudited pro forma condensed statements of profit or loss for the year ended December 31, 2021 (In thousands of Brazilian Reais - R$, except earnings per share)
| Actual CI&T Brazil (1) | Dextra Tecnologia (2) | Transaction Accounting Adjustments | Note | Total CI&T Brazil Pro Forma | ||||||||
Net revenue | 1,444,380 | 172,959 | - |
| 1,617,339 | ||||||||
Costs of services provided | (935,732 | ) | (103,207 | ) | - |
| (1,038,939 | ) | |||||
Gross profit | 508,648 | 69,752 | - |
| 578,400 | ||||||||
Selling expenses | (89,654 | ) | (1,021 | ) | - |
| (90,675 | ) | |||||
General and administrative expenses | (151,681 | ) | (20,010 | ) | (14,927 | ) | 2.3 (a) | (186,618 | ) | ||||
Research and technological innovation expenses | (4 | ) | - | - |
| (4 | ) | ||||||
Impairment loss on trade receivables and contract assets | (497 | ) | 92 | - |
| (405 | ) | ||||||
Other income (expenses) net | (22,206 | ) | (884 | ) | - |
| (23,090 | ) | |||||
Operating profit before financial income | 244,606 | 47,929 | (14,927 | ) |
| 277,608 | |||||||
Finance income | 69,816 | 224 | - |
| 70,040 | ||||||||
Finance cost | (104,048 | ) | (1,852 | ) | (28,794 | ) | 2.3 (b) | (134,694 | ) | ||||
Net finance costs | (34,232 | ) | (1,628 | ) | (28,794 | ) |
| (64,654 | ) | ||||
Profit before Income tax | 210,374 | 46,301 | (43,721 | ) |
| 212,954 | |||||||
Income tax | (84,417 | ) | (14,358 | ) | 14,865 | 2.3(c) | (83,910 | ) | |||||
Net profit for the period | 125,957 | 31,943 | (28,856 | ) |
| 129,044 | |||||||
Earnings per share – basic (in R$) | 1.030 |
|
| 2.3(e) | 1.060 | ||||||||
Earnings per share – diluted (in R$) | 1.010 |
|
| 2.3(e) | 1.030 |
| (1) | Represents the historical audited consolidated statement of profit or loss for the year ended December 31, 2021. | |
| (2) | Represents the historical unaudited statement of profit or loss for the period from January 1, 2021 to August 9, 2021. |
The accompanying notes are an integral part of the unaudited pro forma condensed financial information.
CI&T Brazil Unaudited pro forma condensed statements of profit or loss for the year ended December 31, 2020 (In thousands of Brazilian Reais - R$, except earnings per share)
| Actual CI&T Brazil | Actual Dextra Tecnologia | Transaction Accounting Adjustments | Note | Total CI&T Brazil Pro Forma | ||||||||
Net revenue | 956,519 | 204,036 | - |
| 1,160,555 | ||||||||
Costs of services provided | (600,866 | ) | (116,835 | ) | - |
| (717,701 | ) | |||||
Gross profit | 355,653 | 87,201 | - |
| 442,854 | ||||||||
Selling expenses | (65,093 | ) | (1,504 | ) | - |
| (66,597 | ) | |||||
General and administrative expenses | (81,161 | ) | (34,033 | ) | (28,887 | ) | 2.3 (a)/(d) | (144,081 | ) | ||||
Research and technological innovation expenses | (3,462 | ) | (43 | ) | - |
| (3,505 | ) | |||||
Impairment loss on trade receivables and contract assets | (196 | ) | (62 | ) | - |
| (258 | ) | |||||
Other income (expenses) net | 2,503 | 213 | - |
| 2,716 | ||||||||
Operating profit before financial income | 208,244 | 51,772 | (28,887 | ) |
| 231,129 | |||||||
Finance income | 47,808 | 1,367 | - |
| 49,175 | ||||||||
Finance cost | (63,261 | ) | (2,102 | ) | (42,637 | ) | 2.3 (b) | (108,000 | ) | ||||
Net finance costs | (15,453 | ) | (735 | ) | (42,637 | ) |
| (58,825 | ) | ||||
Profit before Income tax | 192,791 | 51,037 | (71,523 | ) |
| 172,304 | |||||||
Income tax | (65,137 | ) | (16,883 | ) | 24,318 | 2.3(c) | (57,702 | ) | |||||
Net profit for the period | 127,654 | 34,154 | (47,206 | ) |
| 114,602 | |||||||
Earnings per share – basic (in R$) | 1.060 |
|
| 2.3(e) | 0.960 | ||||||||
Earnings per share – diluted (in R$) | 1.040 |
|
| 2.3(e) | 0.930 |
The accompanying notes are an integral part of the unaudited pro forma condensed financial information.
1. Basis of Presentation of the Unaudited Pro Forma Condensed Financial Information
The unaudited pro forma condensed statements of profit or loss for the year ended December 31, 2021 is based on the audited consolidated statements of profit or loss of CI&T Brazil for the year ended December 31, 2021, and the unaudited financial information of Dextra Tecnologia for the period from January 1, 2021 to August 9, 2021 and gives effect on a pro forma basis to the Dextra Acquisition as if it had been consummated on January 1, 2021.
The unaudited pro forma condensed statements of profit or loss as of December 31, 2020 is based on the audited consolidated statements of profit or loss of CI&T Brazil for the year ended December 31, 2020, which is included in this prospectus, and on the audited combined carve-out statements of profit or loss of Dextra Tecnologia for the year ended December 31, 2020 and gives effect on a pro forma basis to the Dextra Acquisition as if it had been consummated on January 1, 2020.
The unaudited pro forma condensed financial information was prepared using the acquisition method of accounting in accordance with IFRS 3 – Business Combinations. IFRS 3 requires, among other things, that assets acquired, and liabilities assumed shall be recognized at their fair values as of their respective acquisition dates. The excess of the consideration transferred over the estimated fair values of the net assets acquired, if applicable, will be recorded as goodwill. Fair value measurements can be highly subjective, and it is possible that other professionals, applying reasonable judgment to the same facts and circumstances, could develop and support a range of alternative estimated amounts.
Acquisition costs related to the Dextra Acquisition (i.e., advisory, legal, valuation, and other professional fees) are not included as a component of the consideration transferred but are accounted for as expenses in the periods in which the costs are incurred. The unaudited pro forma condensed financial information does not reflect any cost savings, operating synergies or revenue enhancements that CI&T Brazil may achieve as a result of the Dextra Acquisition or the costs to integrate our operations. All these transaction costs related to the Dextra Acquisition have been recognized as expenses in statements of profit or loss, and additional pro forma adjustments were recognized related to additional transaction costs expected to be incurred by management.
2. Pro Forma Assumptions
The pro forma information presented, including allocation of the consideration transferred, is based on the estimates of the fair value of the assets acquired and liabilities assumed, available information as of this date and management assumptions.
2.1 Consideration Transferred/Expected to be Transferred
On June 26, 2021, CI&T Brazil entered into a share purchase agreement (the “Share Purchase Agreement”) with Prime Sistemas Fundo de Investimentos em Participações Multiestratégia Investimento no Exterior (the “Seller”), as seller, Prime Sistemas de Atendimento ao Consumidor Ltda., as guarantor, and certain other intervening parties, for the purchase of the entire share capital of Dextra Holdings and its subsidiaries for R$ 800,000 thousand, subject to certain purchase price adjustments for debt, cash and working capital amounts, which is currently in discussion with the acquiree. The Dextra Acquisition received regulatory approval from the Brazilian antitrust authority (Conselho Administrativo de Defesa Econômica, or “CADE”) on July 22, 2021 and closed on August 10, 2021. CI&T Brazil has assumed Dextra’s control on August 10, 2021.
At closing, CI&T Brazil paid the Seller R$650,000 thousand. The balance of R$103,573 thousand (the “Account payable for business combination”), shall become due on the first anniversary of the closing date and the balance of R$ 30,000, less amounts withheld to cover future indemnity payments, shall become due in five installments starting on the second anniversary of the closing date, subject to any purchase price adjustments as set forth in the Share Purchase Agreement, including adjustments based on the Brazilian Interbank Deposit Rate (“CDI”). In addition, as our initial public offering closed, as of November 10, 2021 the account payable for business combination in the amount of R$50,000 thousand plus the adjustment of R$ 938 based on CDI, was paid on December 2, 2021.
2.2 Fair value of assets and liabilities
We performed a valuation analysis of the fair value of Dextra Tecnologia assets acquired and liabilities assumed as of August 10, 2021.
The fair value of assets acquired, and liabilities assumed is based upon the available information as of this date and management assumptions.
The following table summarizes the fair value of assets acquired and the liabilities assumed as of August 10, 2021:
| In thousands of Brazilian reais | |
Cash consideration | 650,000 | |
Account payable for business combination | 133,573 | |
Total consideration | 783,573 | |
Fair value of net assets acquired, and liabilities assumed, for which book value approximates to fair value (other than intangible assets) | 41,670 | |
Fair value of intangible assets |
| |
(-) Customer relationship | 88,961 | |
(-) Non-compete agreement | 15,086 | |
(-) Brand | 20,501 | |
(-) Intangible in progress | 21,634 | |
(-) Total intangible fair value | 146,182 | |
Goodwill | 595,721 |
2.3 Pro Forma Adjustments
A description of the pro forma adjustments is presented below:
(a) Intangible Assets
The adjustment on intangible assets is comprised of the following:
|
|
|
| Estimated pro forma amortization expense (straight-line method) |
| |||||||||
| Valuation Methodology | Estimated fair value (in thousands of Brazilian reais) | Estimated useful life (Years) | Seven months and eight days ended (in thousands of Brazilian reais) August 9, 2021 | Year ended December 31, 2020 (in thousands of Brazilian reais) | Allocation of pro forma amortization expense in the pro forma statements of income line item | ||||||||
Customer relationship | MPEEM (Multi-Period Excess Earnings) | 88,961 | 7.4 | 7,279 | 12,022 | Administrative expenses | ||||||||
Brand | Relief from Royalty | 20,501 | 1.4 | 8,866 | 14,644 | Administrative expenses | ||||||||
Non-compete agreement (NCA) | With and Without | 15,086 | 5 | 1,827 | 3,017 | Administrative expenses | ||||||||
Total |
| 124,548 |
| 17,972 | 29,683 |
| ||||||||
Intangible assets recorded in Dextra Tecnologia’s on August 9, 2021 |
| (56,495 | ) |
| (3,045 | ) | (5,348 | ) | Administrative expenses | |||||
Total pro forma impact |
| 68,053 |
| 14,927 | 24,335 |
| ||||||||
The MPEEM methodology (Multi Period Excess Earnings Method) is mostly used to measure the value of primary assets or the most important assets of a company. According to that method, in determining fair values, the cash flows attributable to all other assets are subtracted through a contributory asset charge (CAC). The MPEEM method assumes that the fair value of an intangible asset is the same as the present value of the cash flows attributable to that asset, less the contribution of other assets, both tangible and intangible.
The “With and Without” methodology was based on the effects that an engagement of vendors in competition would have on the Company’s revenues and cash flows.
The “Relief from Royalty” methodology estimates the value of the asset based on the hypothetical royalty payments that would be saved by the asset holder compared to what would be paid for the licensing of said asset owned by third parties, considering its useful life (or for the duration of a license agreement).
The following are the significant underlying assumptions used in determining the fair value estimate:
| Customer relationship | Non-competition agreement | Brand | ||
Revenue | Revenue projections were based on the business plan revenue growth rate and estimated attrition. | Not applicable. | Not applicable. | ||
Attrition rate | The estimated attrition rate is 15.4% and it was based on a churn rate. | Not applicable. | The estimated attrition rate is 5.1% and it was based on a royalty approach. | ||
Useful Life | Useful life for the intangible asset is 7.4 years. | Useful life for the intangible asset is 5 years. | Useful life for the intangible asset is 1.4 years. | ||
Tax Amortization Benefit (TAB) | TAB was calculated according to the Target’s projected effective tax rate of 34% and an amortization period equivalent to asset’s remaining useful life. | TAB was calculated according to the Target’s projected effective tax rate of 34% and an amortization period equivalent to asset’s remaining useful life. | TAB was calculated according to the Target’s projected effective tax rate of 34% and an amortization period equivalent to asset’s remaining useful life. | ||
Discount rate | The discount rate was equivalent to company’s WACC plus spread, resulting in an after-tax rate of 12.36%. | The discount rate was equivalent to company’s WACC plus spread, resulting in an after-tax rate of 12.36%. | The discount rate was equivalent to company’s WACC plus spread, resulting in an after-tax rate of 12.36%. |
(b) Debt issuance
The Company entered into loan agreements in Brazil in the amount of R$652,100 thousand aiming to raise funding for the acquisition of Dextra Holdings. Those loans mature in July 2026, and are indexed to fixed and variable rates as follows:
Amount (in thousands of Brazilian reais) | Payment flow | Index factor | ||
300,000 | Quarterly | 1.75% + 100% CDI | ||
200,000 | Quarterly | 1.60% + 100% CDI | ||
152,100 | Annually | 2.07% + 100% Libor |
The table below presents pro forma adjustment related to debt issuance and interest expenses for each of the periods presented:
| For the year ended December 31, 2021 | |||||
| Actual CI&T Brazil | Transaction Accounting Adjustments | Total CI&T Brazil Pro Forma | ||
Interest expense* | 23,422 | 28,794 | 52,216 | ||
| For the year ended December 31, 2020 | |||||
Interest expense* | 10,304 | 42,637 | 52,941 | ||
| * | Represents the net increase to interest expense resulting from estimated interest on the new debt to finance the acquisition of Dextra Holdings. |
(c) Income Taxes
Income taxes on pro forma adjustments were calculated using the statutory income tax rate in Brazil (34%), depending on where pro forma adjustments are reasonably expected to occur. The effective tax rate applicable to us could be significantly different (either higher or lower) depending on post-acquisition activities, including repatriation decisions, cash needs and the actual geographical mix of income.
The current tax law allows the deductibility of the fair value of net assets acquired when a non-substantive action is taken after acquisition by the Company and therefore the tax and accounting basis of the net assets acquired are the same as of the acquisition date. In this regard, CI&T Brazil considers that actions to complete the merger of the acquiree are non-substantive so that the Company expects to be entitled to the deductibility of the amortization of intangible assets acquired and, therefore, no deferred income taxes were recorded for intangible assets identified at the acquisition date.
(d) Transactions cost
For the year ended December 31, 2021 the amount incurred by CI&T Brazil was R$ 2,774 thousand. In addition, CI&T Brazil did not expect to incur in any additional future transaction costs.
| Actual CI&T Brazil (1) | Dextra Tecnologia (2) | Transaction Accounting Adjustments | Total CI&T Brazil Pro Forma | ||||
| For the year ended December 31, 2021 | |||||||
General and administrative expenses | 151,681 | 20,010 | - | 171,691 | ||||
| For the year ended December 31, 2020 | |||||||
General and administrative expenses | 81,161 | 34,033 | 4,552 | 119,746 | ||||
| (1) | Represents the historical audited consolidated statement of profit or loss for the year ended December 31, 2021. | |
| (2) | Represents the historical unaudited statement of profit or loss for the period from January 1, 2021 to August 9, 2021 |
(e) Earnings/(loss) per share
Basic loss per share is calculated by dividing the net loss attributable to the owners of the Company by the weighted average of outstanding common shares. Diluted loss per share is calculated by adjusting the weighted average of outstanding common shares, assuming that all potential common shares that would cause dilution are converted.
i. Basic and diluted earnings per share - CI&T Brazil
| Year ended December 31, 2021 | Year ended December 31, 2020 | ||||||
| Basic | Diluted | Basic | Diluted | ||||
Profit attributable to holders of ordinary shares | 125,957 | 125,957 | 127,654 | 127,654 | ||||
Weighted average number of basic shares held by shareholders | 121,777,128 | 125,155,798 | 119,960,383 | 123,287,891 | ||||
Pro Forma earnings per share (in reais) | 1.03 | 1.01 | 1.06 | 1.04 | ||||
ii. Pro Forma Basic and diluted earnings per share
| Year ended December 31, 2021 | Year ended December 31, 2020 | ||||||
| Basic | Diluted | Basic | Diluted | ||||
Profit attributable to holders of ordinary shares | 129,044 | 129,044 | 111,268 | 111,268 | ||||
Weighted average number of basic shares held by shareholders | 121,777,128 | 125,155,798 | 119,960,383 | 123,287,891 | ||||
Pro Forma earnings per share (in reais) | 1.06 | 1.03 | 0.96 | 0.93 | ||||
SIGNATURES
Pursuant to the requirements of the Securities Exchange Act of 1934, the registrant has duly caused this report to be signed on its behalf by the undersigned, thereunto duly authorized.
Date: March 9, 2022
| CI&T Inc | |||
| By: | /s/ Stanley Rodrigues | ||
| Name: Stanley Rodrigues | |||
| Title: Chief Financial Officer | |||
(4Q21 and 2021 FY Earnings Release, Unaudited condensed consolidated interim financial information for the three month periods ended December 31, 2021 and 2020 and Unaudited Pro Forma Condensed Financial Information for December 31, 2021 and 2020).