0001868995 cint:RemoteScenarioMember cint:InterestRateIncreaseLiborRiskMember cint:LoansAndBorrowingsMember 2021-01-01 2021-12-31
As filed with the Securities and Exchange Commission on April 22, 2022
UNITED STATES SECURITIES AND EXCHANGE COMMISSION
Washington, D.C. 20549
Form 20-F
(Mark One)
☐ REGISTRATION STATEMENT PURSUANT TO SECTION 12(b) OR (g) OF THE SECURITIES EXCHANGE ACT OF 1934
OR
☒ ANNUAL REPORT PURSUANT TO SECTION 13 OR 15(d) OF THE SECURITIES EXCHANGE ACT OF 1934
For the fiscal year ended December 31, 2021
OR
☐ TRANSITION REPORT PURSUANT TO SECTION 13 OR 15(d) OF THE SECURITIES EXCHANGE ACT OF 1934
For the transition period from to .
OR
☐ SHELL COMPANY REPORT PURSUANT TO SECTION 13 OR 15(d) OF THE SECURITIES EXCHANGE ACT OF 1934
Date of event requiring this shell company report
Commission file number: 001-41035
CI&T Inc
(Exact Name of Registrant as specified in its charter)
| The Cayman Islands | |
| (Jurisdiction of incorporation or organization) | |
R. Dr. Ricardo Benetton Martins,
1,000 Pólis de Tecnologia - Prédio 23B,
Campinas – State of São Paulo
13086-902- Brazil
+55 19 21024500
(Address of principal executive offices)
Stanley Rodrigues, Chief Financial Officer
+55 19 21024500
R. Dr. Ricardo Benetton Martins,
1,000 Pólis de Tecnologia - Prédio 23B
Campinas - State of São Paulo
13086-902- Brazil
(Name, Telephone, E-mail and/or Facsimile number and Address of Company Contact Person)
Securities registered or to be registered pursuant to Section 12(b) of the Act:
| | Name of Each Exchange on Which Registered |
Class A common shares, par value US$0.00005 per share | CINT | New York Stock Exchange |
Securities registered or to be registered pursuant to Section 12(g) of the Act: None
Securities for which there is a reporting obligation pursuant to Section 15(d) of the Act: None
The number of outstanding shares of each class of stock of CI&T Inc as of December 31, 2021 was:
15,000,000 Class A common shares, each with par value of US$0.00005
117,197,896 Class B common shares, each with par value of US$0.00005
Indicate by check mark if the registrant is a well-known seasoned issuer, as defined in Rule 405 of the Securities Act.
Yes ☐ No ☒
If this report is an annual or transition report, indicate by check mark if the registrant is not required to file reports pursuant to Section 13 or 15(d) of the Securities Exchange Act of 1934.
Yes ☐ No ☒
Indicate by check mark whether the registrant (1) has filed all reports required to be filed by Section 13 or 15(d) of the Securities Exchange Act of 1934 during the preceding 12 months (or for such shorter period that the registrant was required to file such reports) and (2) has been subject to such filing requirements for the past 90 days.
Yes ☒ No ☐
Indicate by check mark whether the registrant has submitted electronically every Interactive Data File required to be submitted pursuant to Rule 405 of Regulation S-T (§232.405 of this chapter) during the preceding 12 months (or for such shorter period that the registrant was required to submit such files).
Yes ☒ No ☐
Indicate by check mark whether the registrant is a large accelerated filer, an accelerated filer, a non-accelerated filer or an emerging growth company. See definition of “accelerated filer,” “large accelerated filer” and “emerging growth company” in Rule 12b-2 of the Exchange Act. (Check one):
Large Accelerated Filer ☐ Accelerated Filer ☐ Non-accelerated Filer ☒ Emerging growth company ☒
If an emerging growth company that prepares its financial statements in accordance with U.S. GAAP, indicate by check mark if the registrant has elected not to use the extended transition period for complying with any new or revised financial accounting standards† provided pursuant to Section 13(a) of the Exchange Act. ☐
Indicate by check mark whether the registrant has filed a report on and attestation to its management’s assessment of the effectiveness of its internal control over financial reporting under Section 404(b) of the Sarbanes-Oxley Act (15 U.S.C. 7262(b)) by the registered public accounting firm that prepared or issued its audit report. ☐
Indicate by check mark which basis of accounting the registrant has used to prepare the financial statements included in this filing:
| International Financial Reporting Standards as issued by the International Accounting Standards Board ☒ | Other ☐ |
If “Other” has been checked in response to the previous question, indicate by check mark which financial statement item the registrant has elected to follow.
Item 17 ☐ Item 18 ☐
If this is an annual report, indicate by check mark whether the registrant is a shell company (as defined in Rule 12b-2 of the Exchange Act).
Yes ☐ No ☒
PRESENTATION OF FINANCIAL AND OTHER INFORMATION
Unless otherwise indicated or the context otherwise requires, all references in this report to “CI&T” or the “Company,” “we,” “our,” “ours,” “us” or similar terms refer to CI&T Inc, together with its subsidiaries.
The term “Brazil” refers to the Federative Republic of Brazil and the phrase “Brazilian government” refers to the federal government of Brazil. “Central Bank” refers to the Brazilian Central Bank (Banco Central do Brasil). References in the report to “real,” “reais” or “R$” refer to the Brazilian real, the official currency of Brazil and references to “U.S. dollar,” “U.S. dollars” or “US$” refer to U.S. dollars, the official currency of the United States.
All references to “IFRS” are to International Financial Reporting Standards, as issued by the IASB.
Financial Statements
We are a Cayman Islands exempted company, incorporated with an indefinite term and limited liability on June 7, 2021 for purposes of carrying out our initial public offering. Until the contribution of shares of CI&T Software S.A., or CI&T Brazil, to us prior to the consummation of the initial public offering, we had not commenced operations and had only nominal assets and liabilities and no material contingent liabilities or commitments. On October 4, 2021, we established, as a sole member, our subsidiary CI&T Delaware LLC, or CI&T Delaware. On November 8, 2021, all CI&T Brazil’s shares were contributed to CI&T Delaware and, subsequently the CI&T Delaware’s shares were transferred to CI&T Inc. Until this corporate reorganization, CI&T Brazil, an operating company, was the ultimate holding of our group, and it consolidated the results of all companies until that date. We accounted for the restructuring as a business combination of entities under common control, and the pre-combination carrying amounts of CI&T Brazil are included in the CI&T’s consolidated financial statements with no fair value uplift. Thus, our consolidated financial statements reflect:
(i) The historical operating results and financial position of CI&T Brazil prior to the restructuring;
(ii) Our consolidated results following the restructuring;
(iii) The assets and liabilities of CI&T Brazil and its then subsidiaries at their historical cost;
(iv) The number of ordinary shares issued by CI&T, as a result of the restructuring is reflected retroactively to January 1, 2020, for purposes of calculating earnings per share;
(v) CI&T Brazil shares were contributed in CI&T Delaware at its book value as at November 8, 2021;
(vi) As the remaining equity reserves of CI&T Brazil are no longer applicable, they were added to our initial capital reserve balance.
We maintain our books and records in Brazilian reais, the functional currency of our operations in Brazil and the presentation currency for our financial statements. Our annual consolidated financial statements were prepared in accordance with IFRS, as issued by the IASB. Unless otherwise noted, the financial information presented herein has been derived from our audited consolidated financial statements as of December 31, 2021 and 2020 and for the three years ended December 31, 2021, 2020 and 2019, together with the accompanying notes thereto. All references herein to “our financial statements” and “our audited consolidated financial statements” are to our consolidated financial statements included elsewhere in this annual report.
This financial information should be read in conjunction with “Item 5. Operating and Financial Review and Prospects” and our consolidated financial statements, including the notes thereto, included elsewhere in this annual report.
Financial Information in U.S. dollars
Solely for the convenience of the reader, we have translated some of the real amounts included in this report from reais into U.S. dollars. You should not construe these translations as representations by us that the amounts actually represent these U.S. dollar amounts or could be converted into U.S. dollars at the rates indicated. Unless otherwise indicated, we have translated real amounts into U.S. dollars using a rate of R$5.5805 to US$1.00, the commercial selling rate for U.S. dollars as of December 31, 2021, as reported by the Brazilian Central Bank.
Special Note Regarding Non-IFRS Financial Measures
This report presents our Adjusted Gross Profit, Adjusted Gross Profit Margin, Adjusted EBITDA, Adjusted EBITDA Margin, Adjusted Net Profit, Adjusted Net Profit Margin, Net Revenue at Constant Currency and Net Revenue Increase at Constant Currency, which are non-IFRS financial measures used by management in the evaluation of our performance. A non-IFRS financial measure is generally defined as one that purports to measure financial performance but excludes or includes amounts that would not be so adjusted in the most comparable IFRS measure.
We calculate Adjusted Gross Profit as Gross Profit, adjusted to exclude costs and expenses which are not under the responsibility of the project managers (depreciation and amortization costs and stock options payments). We calculate Adjusted Gross Profit Margin by dividing Adjusted Gross Profit by the Net Revenue of the same period.
We calculate Adjusted EBITDA as Net Profit, adjusted to include net finance costs, income tax expense, depreciation and amortization and further adjusted to exclude (i) stock option and indemnity payments related to the cancellation of the share-based compensation plan, (ii) consulting expenses, related to corporate reorganization, our IPO and mergers and acquisitions, (iii) government grants for tax reimbursements in the China subsidiary and (iv) impairment of Dextra intangible asset. We calculate Adjusted EBITDA Margin by dividing Adjusted EBITDA by the Net Revenue of the same period.
We calculate Adjusted Net Profit as Net Profit, adjusted to exclude (i) consulting expenses, related to the corporate reorganization, our IPO and mergers and acquisitions, and (ii) impairment of Dextra intangible assets. We calculate Adjusted Net Profit Margin by dividing it by Net Revenue for the same period.
We calculate Net Revenue at Constant Currency by translating revenue from entities reporting in foreign currencies into Brazilian reais using the comparable foreign currency exchange rates from the prior period. For example, the average rates in effect for the fiscal year ended December 31, 2020 were used to convert revenue for the fiscal year ended December 31, 2021, rather than the actual exchange rates in effect during the respective period.
We present Adjusted Gross Profit, Adjusted Gross Profit Margin, Adjusted EBITDA, Adjusted EBITDA Margin, Adjusted Net Profit, Adjusted Net Profit Margin, Net Revenue at Constant Currency and Net Revenue Increase at Constant Currency because management uses them in evaluating our performance and we believe these measures provide investors with a supplemental measure of the financial performance of our core operations that facilitates period-to-period comparisons on a consistent basis.
The non-IFRS financial measures described in this report are not a substitute for the IFRS measures of earnings. Additionally, our calculations of Adjusted Gross Profit, Adjusted EBITDA and Adjusted Net Profit may be different from the calculations used by other companies, including our competitors, and therefore, our measures may not be comparable to those of other companies. For a reconciliation of Adjusted Gross Profit, Adjusted Gross Profit Margin, Adjusted EBITDA, Adjusted EBITDA Margin, Adjusted Net Profit, Adjusted Net Profit Margin, Net Revenue at Constant Currency and Net Revenue Increase at Constant Currency, each to its most directly comparable IFRS measure, see “Item 5. Operating and Financial Review and Prospects — Non-IFRS Measures.”
Market Share and Other Information
This report contains data related to economic conditions in the market in which we operate. The information contained in this report concerning economic conditions is based on publicly available information from third-party sources that we believe to be reasonable. Market data and certain industry forecast data used in this report were obtained from internal reports and studies, where appropriate, as well as estimates, market research, publicly available information (including information available from the United States Securities and Exchange Commission (“SEC”) website) and industry publications, including industry research reports we commissioned from International Data Corporation (“IDC”).
Industry publications, governmental publications and other market sources generally state that the information they include has been obtained from sources believed to be reliable, but that the accuracy and completeness of such information is not guaranteed. While we are not aware of any misstatements regarding the market and industry data presented herein, our estimates involve risks and uncertainties and are subject to change based on various factors, including those discussed in the section entitled “Risk Factors.”
Except as disclosed in this report, none of the publications, reports or other published industry sources referred to in this report were commissioned by us or prepared at our request. Except as disclosed in this report, we have not sought or obtained the consent of any of these sources to include such market data in this report.
Rounding
We have made rounding adjustments to some of the figures included in this report for ease of presentation. Accordingly, numerical figures shown as totals in some tables may not be an arithmetic aggregation of the figures that preceded them.
FORWARD-LOOKING STATEMENTS
This annual report includes statements that constitute estimates and forward-looking statements within the meaning of Section 27A of the Securities Act of 1933, as amended, or Securities Act, and Section 21E of the Securities Exchange Act, as amended, or Exchange Act. The words “believe,” “will,” “may,” “may have,” “would,” “estimate,” “continues,” “anticipates,” “intends,” “plans,” “expects,” “budget,” “scheduled,” “forecasts” and similar words are intended to identify estimates and forward-looking statements. Estimates and forward-looking statements refer only to the date when they were made, and we do not undertake any obligation to update or revise any estimate or forward-looking statement due to new information, future events or otherwise, except as required by law. Estimates and forward-looking statements involve risks and uncertainties and do not guarantee future performance, as actual results or developments may be substantially different from the expectations described in the forward-looking statements.
Forward-looking statement include, but are not limited to, statements about:
| ● | the impact of the ongoing war in Ukraine and economic sanctions imposed by Western economies over Russia, and their impact on global economy, which are highly uncertain and are difficult to predict; |
| ● | our ability to retain existing clients and attract new clients, including our ability to increase revenue from existing clients and diversify our revenue concentration; |
| ●
| our ability to maintain favorable pricing, productivity levels and utilization rates; |
| ● | our ability to adapt to technological change and innovate solutions for our clients; |
| ● | our ability to effectively manage our international operations, including our exposure to foreign currency exchange rate fluctuations; |
| ● | the effects of increased competition as well as innovations by new and existing competitors in our market; |
| ● | our ability to sustain our revenue growth rate in the future; |
| ●
| our ability to successfully identify acquisition targets, consummate acquisitions and successfully integrate acquired businesses and personnel, such as relating to our recent acquisitions of Dextra Investimentos S.A. and Somo Global Ltd.; |
| ● | our expectations of future operating results of financial performance; |
| ● | our ability to attract and retain highly-skilled IT professionals at cost-effective rates; |
| ●
| our ability to retain continued services of our senior development team or other key employees, |
| ● | our plans for growth and future operations, including our ability to manage our growth; |
● global economic conditions;
● uncertainty concerning the current economic, political, and social environment in Latin America, specifically in Brazil, and
● the impact of new strains of coronaviruses and the COVID-19 pandemic and measures taken in response thereto.
Forward-looking statements are not guarantees of future performance and involve risks and uncertainties. Actual results and developments may be substantially different from the expectations described in the forward-looking statements for a number of reasons, many of which are not under our control, among them the activities of our competition, the future global economic situation, exchange rates, and operational and financial risks. The unexpected occurrence of one or more of the abovementioned events may significantly change the results of our operations on which we have based our estimates and forward-looking statements.
In light of the risks and uncertainties described above, the events referred to in the estimates and forward-looking statements included in this report may or may not occur, and our business performance and results of operation may differ materially from those expressed in our estimates and forward-looking statements, due to factors that include but are not limited to those mentioned above.
These forward-looking statements are made as of the date of this annual report, and we assume no obligation to update them or revise them to reflect new events or circumstances. There can be no assurance that the forward-looking statements will prove to be accurate, as actual results and future events could differ materially from those anticipated in such statements.
ITEM 1. IDENTITY OF DIRECTORS, SENIOR MANAGEMENT AND ADVISERS
| A. | Directors and senior management |
| Not applicable. |
|
|
| B. | |
| Not applicable. |
|
|
| C. | |
| Not applicable. |
ITEM 2. OFFER STATISTICS AND EXPECTED TIMETABLE
| A. | Offer statistics |
| Not applicable. |
|
|
| B. | Method and expected timetable |
| Not applicable. |
ITEM 3. KEY INFORMATION
Summary of Risk Factors
An investment in our Class A common shares is subject to a number of risks, including risks relating to our business and industry, risks relating to Brazil and risks relating to our Class A common shares. The following list summarizes some, but not all, of these risks. Please read the information in the section entitled “Risk Factors” for a more thorough description of these and other risks.
Certain Risks Relating to Our Business and Industry
| ● | If any of our largest clients terminates, decreases the scope of, or fails to renew its business relationship or contract with us, our revenues, business and results of operations may be adversely affected. |
| ● | Our clients may terminate engagements before completion or choose not to enter into new engagements with us. |
| ●
| Geopolitical tensions and the outbreak of military hostilities, including the ongoing military conflict between Russia and Ukraine, and the economic sanctions imposed as a result of these conflicts may materially adversely affect us. |
| ● | The extent to which the COVID-19 pandemic and measures taken in response thereto impact our business, financial condition, results of operations and prospects will depend on future developments, which are highly uncertain and are difficult to predict. |
| ● | Degradation of the quality of the solutions we offer could diminish demand for our services or cause disruptions in our clients’ businesses, adversely affecting our ability to attract and retain clients, harming our business, results of operations and corporate reputation and subjecting us to liability. |
| ● | Our contracts could be unprofitable. |
| ● | Our business depends on a strong brand and corporate reputation. |
| ●
| We face intense competition. |
| ● | We must attract and retain highly-skilled IT professionals. Increases in our current levels of attrition may increase our operating costs and adversely affect our future business prospects. |
Certain Risks Relating to Our Growth Strategy
| ● | We may not be able to sustain our revenue growth rate in the future. |
| ● | We are focused on growing our client base internationally and may not be successful. |
| ●
| Potential future acquisitions could prove difficult to integrate, disrupt our business, dilute shareholder value and strain our resources. |
| ● | If we do not continue to innovate and remain at the forefront of emerging technologies and related market trends, we may lose clients and not remain competitive. |
Certain Risks Relating to Our Organizational Structure
| ● | Material weaknesses in our internal control over financial reporting have been identified and, if we fail to implement and maintain effective internal controls over financial reporting, we may be unable to accurately report our results of operations, meet our reporting obligations or prevent fraud. As we are an emerging growth company, our independent registered public accounting firm has not yet conducted an audit of our internal control over financial reporting in accordance with the provisions of the Sarbanes-Oxley Act of 2002. |
| ● | Requirements associated with being a public company in the United States will require significant company resources and management attention. |
| ●
| We are dependent on members of our senior management team and other key employees. |
| ● | We are exposed to fluctuations in foreign currency exchange rates and enter into derivatives transactions to manage our exposure to exchange rate risk.
|
| ● | Our holding company structure makes us dependent on the operations of our subsidiaries. |
Certain Compliance, Tax, Legal and Regulatory Risks
| ● | Changes in laws and regulations related to the internet or changes in the internet infrastructure itself may diminish the demand for our services, and could have a negative impact on our business. |
| ● | We and our clients may be subject to new and evolving privacy and data protection-related laws and regulations that impose obligations in connection with the collection, storage, use, processing, disclosure, protection, transmission, retention and disposal of personal, sensitive, regulated or confidential data. |
| ●
| Changes in tax laws, tax incentives, benefits or differing interpretations of tax laws may adversely affect our results of operations. |
Certain Risks Relating to Brazil
| ● | Exchange rate instability may have adverse effects on the Brazilian economy, us and the price of our Class A common shares. |
| ● | The Brazilian federal government has exercised, and continues to exercise, significant influence over the Brazilian economy. This involvement as well as Brazil’s political and economic conditions could harm us and the price of our Class A common shares. |
| ●
| Risks related to the global economy may affect the perception of risks in other countries, particularly in the United States, Europe and emerging markets, adversely affecting the Brazilian economy and the market price of securities of issuers with principal operations in Brazil, including our Class A common shares. |
Certain Risks Relating to Our Class A Common Shares
| ● | An active trading market for our Class A common shares may not be sustainable. If an active trading market is not maintained, investors may not be able to resell their shares and our ability to raise capital in the future may be impaired. |
| ● | The dual class structure of our common stock has the effect of concentrating voting control with the Class B Shareholders; this will limit or preclude your ability to influence corporate matters. |
| ●
| Class A common shares eligible for future sale may cause the market price of our Class A common shares to drop significantly. |
| ● | We are a Cayman Islands exempted company with limited liability. The rights of our shareholders, including with respect to fiduciary duties and corporate opportunities, may be different from the rights of shareholders of companies incorporated under and governed by the laws of U.S. jurisdictions.
|
Certain Risks Relating to Our Business and Industry
If any of our largest clients terminates, decreases the scope of, or fails to renew its business relationship or contract with us, our revenues, business and results of operations may be adversely affected.
We generate a significant portion of our revenues from our ten largest clients. During the year ended December 31, 2021, our largest client based on revenues, accounted for 20% of our Net revenue, and our ten largest clients together accounted for 63% of our Net revenue. During the year ended December 31, 2020, our largest client based on revenues, accounted for 20% of our Net revenue, and our ten largest clients together accounted for 67% of our Net revenue.
Our ability to maintain close relationships with these and other major clients is essential to the growth and profitability of our business. The volume of work we perform for each client may vary from year to year, and as a result, a major client in one year may not provide the same level of revenues for us in any subsequent year. The technology services we provide to our clients, and the revenues associated with those services, may decline or vary as the type and quantity of technology services we provide changes over time. In addition, our reliance on any individual client for a significant portion of our revenues may give that client a certain degree of pricing leverage against us when negotiating contracts and terms of service.
Our clients may terminate engagements before completion or choose not to enter into new engagements with us.
A substantial part of our revenue is for software development and maintenance services and is typically generated from clients who also contributed to our revenue during the prior year. We constantly seek to obtain new engagements, as well as maintain relationships with existing clients, when our current engagements are successfully completed or are terminated. Notwithstanding our efforts, our contracts provide that our clients can terminate many of our master services agreements and work orders with or without cause, and, in the case of termination without cause, subject only to 30, 60 or 90 days’ prior notice.
Our clients may terminate or reduce their use of our services for any number of reasons, including if they are not satisfied with our services, the value proposition of our services or our ability to meet their needs and expectations. Even if we successfully deliver on contracted services and maintain close relationships with our clients, a number of factors outside of our control could cause the loss of or reduction in business or revenue from our existing clients. These factors include, among other things:
| ● | the business or financial condition of that client or the economy generally; |
| ● | a change in strategic priorities by our clients, resulting in a reduced level of spending on technology services; |
| ●
| changes in the personnel at our clients who are responsible for procurement of information technology (“IT”), services or with whom we primarily interact; |
| ● | a demand for price reductions by our clients;
|
| ● | mergers, acquisitions or significant corporate restructurings involving one of our clients; and |
| ● | a decision by that client to move work in-house or to one or several of our competitors. |
The ability of our clients to terminate their engagement with us at any time makes our future revenue uncertain. We may not be able to replace any client that chooses to terminate or not renew its contract with us, which could materially adversely affect our revenue and thus our results of operations. Furthermore, terminations in engagements may make it difficult to plan our project resource requirements. If a significant number of clients cease using or reduce their usage of our services, we may be required to spend significantly more on sales and marketing than we currently plan to spend in order to maintain or increase revenue from clients. Such additional sales and marketing expenditures could adversely affect our business, results of operations and financial condition.
In addition, while the restrictions imposed by the COVID-19 pandemic have prompted a shift to digital products and services that benefited our business in 2021 and 2020, there can be no assurance that once the COVID-19 pandemic is sufficiently controlled, this shift will continue and that we will continue to benefit from our clients’ increased spending on digital transformation efforts in response to the COVID-19 pandemic.
Geopolitical tensions and the outbreak of military hostilities, including the ongoing military conflict between Russia and Ukraine, and the economic sanctions imposed as a result of these conflicts may materially adversely affect us
Our business is subject to risks and uncertainties related to our global operations. U.S. and global markets are experiencing volatility and disruption following the escalation of geopolitical tensions and the military conflict between Russia and Ukraine. Although the length and impact of the ongoing military conflict involving Russia and Ukraine and the economic sanctions imposed by the United States, the European Union and other countries are highly unpredictable, the conflict and resulting sanctions may significantly affect prices, disrupt supply chains, cause turmoil in the global financial system and lead to market disruptions, including significant volatility in credit and capital markets. These factors could materially affect our business and financial condition, along with our operating and development costs, and may impact the demand for our services and our ability to execute our growth plans. The war in Ukraine may also increase geopolitical tensions, with further effect on the world economy. Further escalation of the conflict in Ukraine or in other locations, and the related imposition of sanctions or other trade barriers, could disrupt the global markets in ways that cannot yet be anticipated and we cannot predict the impact on our business, financial position or results of operations.
The extent to which the COVID-19 pandemic and measures taken in response thereto impact our business, financial condition, results of operations and prospects will depend on future developments, which are highly uncertain and are difficult to predict.
The global impact of the COVID-19 outbreak and measures taken to reduce the spread of the virus have had an adverse effect on the global macroeconomic environment, and have significantly increased economic uncertainty and reduced economic activity. Governmental authorities around the world, including in Brazil, have taken measures to try to contain the spread of COVID-19, including by implementing travel bans and restrictions, quarantines, shelter-in-place or total lock-down orders and business limitations and shutdowns, but there can be no assurance that such steps will be effective or achieve their desired results in a timely fashion or at all. If the contagion does not subside or is not effectively addressed through vaccination efforts, or if new variants of COVID-19 emerge which prolong the spread of the virus, restrictions will likely remain in place, which may further suppress social and economic activity.
We have taken numerous actions to protect our employees and our business following the spread of COVID-19 (such as reinforcing our “work from anywhere” model and adopting other measures to manage the risks posed by COVID-19, including restricting employee travel, developing social distancing plans for our employees and canceling physical participation in meetings, events and conferences). We may take further actions if and when required by government authorities or as we determine are in the best interests of our employees, clients and business partners. There is no certainty that such measures will be sufficient to mitigate the risks posed by COVID-19. In addition, our management team has spent, and will likely continue to spend, significant time, attention, and resources monitoring the COVID-19 pandemic and associated global economic uncertainty and seeking to manage its effects on our business and workforce.
As of this time, the COVID-19 outbreak has not severely impacted the industry verticals to which we provided a significant portion of our services in the past two fiscal years (financial services, food and beverage, pharmaceuticals and cosmetics). In fact, our most significant clients, which are large enterprises that have been resilient in light of the effects of the COVID-19 pandemic, have in certain circumstances accelerated their demand for the implementation of digital transformation solutions over the next few years. As a result, the extent to which the COVID-19 outbreak impacts our business, financial condition, results of operations and prospects in the longer term will depend on future developments, which are highly uncertain and are difficult to predict, including, but not limited to, the duration, spread and severity of the outbreak, the actions taken to contain COVID-19 or treat its impact, how quickly and to what extent normal economic and operating conditions broadly resume, and the extent of the impact of these and other factors on our employees, suppliers, partners and clients. In addition, while the restrictions imposed by the COVID-19 pandemic have prompted a shift to digital products and services that benefited our business in 2021 and 2020, there can be no assurance that once the COVID-19 pandemic is sufficiently controlled, this shift will continue and that we will continue to benefit from our client’s increased spending on digital transformation efforts in response to the COVID-19 pandemic.
The continuation of the COVID-19 pandemic and related restrictions could limit our clients’ ability to continue to operate, obtain inventory, generate sales, invest in digital solutions or make timely payments to us. It could disrupt or delay the ability of employees to work because they become sick or are required to care for those who become sick, or for dependents for whom external care is not available. It could cause delays or disruptions in services provided by key suppliers and vendors, make us and our service providers more vulnerable to security breaches, denial of service attacks or other hacking or phishing attacks, or have other unpredictable effects.
To the extent there is a sustained general economic downturn and our solutions are perceived by clients and potential clients as costly, or too difficult to deploy or migrate to, our revenue may be disproportionately affected. Our revenue may also be disproportionately affected by delays or reductions in general information technology spending. Competitors may also respond to market conditions by lowering prices and attempting to lure away our clients. We cannot predict the timing, strength, or duration of any economic slowdown, instability, or recovery, generally or within any particular industry.
Once the COVID-19 pandemic is sufficiently controlled, we may also generally experience decreases or decreased growth rates in sales of digital transformation solutions to clients, as our prospective and existing clients may be less dependent on digital solutions, which would negatively affect our business, financial condition and operating results.
Degradation of the quality of the solutions we offer could diminish demand for our services or cause disruptions in our clients’ businesses, adversely affecting our ability to attract and retain clients, harming our business, results of operations and corporate reputation and subjecting us to liability.
Our clients expect a consistent level of quality in the provision of our solutions and services. Our clients use our products for important aspects of their businesses, and any errors, defects, security vulnerabilities, service interruptions or disruptions to our products and any other performance problems with our products could disrupt and cause damage to our clients’ businesses. Although we regularly update our products, they may contain undetected errors, failures, vulnerabilities and error, fault or flaw in our computer program or a hardware system (bugs) when first introduced or released. Real or perceived errors, failures or bugs in our products could result in negative publicity, loss of, or delay in, market acceptance of our solutions, loss of competitive position, lower client retention or claims by clients for losses sustained by them. In such events, we may be required, or may choose, for client relations or other reasons, to expend additional resources in order to help correct the problem, which may result in increased costs to us. Any failure to maintain the high quality of our products and services, or a market perception that we do not maintain a high quality service, could erode client trust and adversely affect our reputation, business, results of operations and financial condition.
Any defects or errors or failure to meet clients’ expectations in the performance of our contracts could result in claims for substantial damages against us. Our contracts generally limit our liability for damages that arise from negligent acts, error, mistakes or omissions in rendering services to our clients. However, there can be no assurance that these contractual provisions will be enforceable or adequate or will otherwise protect us from liability for damages in the event we are subject to any client claims. In addition, certain liabilities, such as claims of third parties for intellectual property infringement, breaches of data protection and security requirements, or breach of confidentiality obligations, for which we may be required to indemnify our clients, could be substantial. The successful assertion of one or more large claims against us in amounts greater than those covered by our current insurance policies could materially adversely affect our business, financial condition and results of operations. Even if such assertions against us are unsuccessful, a claim brought against us by any of our clients would likely be time-consuming and costly to defend and could seriously damage our reputation and brand, making it harder for us to sell our solutions and services. A client could also share information about bad experiences on social media or other publicly available sources, which could result in damage to our reputation and loss of future revenue. In addition, a failure or inability to meet a contractual requirement could seriously damage our corporate reputation and limit our ability to attract new business.
In certain instances, we guarantee to clients that we will complete a project by a scheduled date or that we will maintain certain service levels. We are generally not subject to monetary penalties for failing to complete projects by the scheduled date, but may suffer reputational harm and loss of future business if we do not meet our contractual commitments. In addition, if the project experiences a performance problem, we may not be able to recover the additional costs we will incur, which could exceed revenue realized from a project.
Our contracts could be unprofitable.
Most of the services performed by our employees are usually charged at monthly rates that are agreed at the time at which we enter into the contracts. The rates and other pricing terms negotiated with our clients are highly dependent on our internal forecasts of our operating costs and predictions of increases in those costs influenced by marketplace factors, as well as the proposed scope of work. Typically, we do not have the ability to increase the rates established at the outset of a client service agreement, other than on an annual basis and often subject to caps. Independent of our right to increase our rates on an annual basis, client expectations regarding the anticipated cost of our services may limit our practical ability to increase our rates for ongoing work.
In addition a small proportion of the contracts are priced by project, which is highly dependent on our assumptions and forecasts about the costs we expect to incur to complete the related services, which are based on limited data and could turn out to be inaccurate. Any failure by us to accurately estimate the resources, including the skills and seniority of our employees, required to complete a fixed-price contract on time and on budget, or any unexpected increase in cost of our employees assigned to a client account, office space or materials could expose us to risks associated with cost overruns and could have a material adverse effect on our business, financial condition, results of operations and prospects. In addition, any unexpected changes in economic conditions that affect any of the foregoing assumptions and predictions could render contracts that would have been favorable to us when signed, subsequently unfavorable.
Our business depends on a strong brand and corporate reputation.
Since many of our specific client engagements involve highly tailored solutions, our corporate reputation is a significant factor in our clients’ and prospective clients’ determination of whether to engage us. We believe the CI&T brand name and our reputation are important corporate assets that help distinguish our services from those of our competitors and also contribute to our efforts to recruit and retain talented IT professionals. Successfully maintaining our brand will depend largely on the effectiveness of our marketing efforts, our ability to provide reliable and useful solutions to meet the needs of our clients at competitive prices, our ability to maintain our clients’ trust, our ability to continue to develop new functionalities and solutions, and our ability to successfully differentiate our solutions and services from competitive products and services. Additionally, our business partners’ performance may affect our brand and reputation if clients do not have a positive experience. Our efforts to build and maintain our brand have involved and will continue to involve significant expense and we anticipate that these expenditures will increase as our market becomes more competitive and as we expand into new markets. Brand promotion activities may not generate client awareness or yield increased revenue. Even if they do, any increased revenue may not offset the expenses we incurred in building our brand. We strive to establish and maintain our brand in part by obtaining, maintaining and protecting our trademark rights. However, if our trademark rights are not adequately obtained, maintained or protected, we may not be able to build name recognition in our markets of interest and our competitive position may be harmed. If we fail to successfully promote, protect and maintain our brand, we may fail to attract enough new clients or retain our existing clients to realize a sufficient return on our brand-building efforts, and our business could suffer.
Furthermore, our corporate reputation is susceptible to damage by actions or statements made by current or former employees or clients, competitors, vendors, and adversaries in legal proceedings, as well as members of the investment community and the media. There is a risk that negative information about our company, even if based on false rumors or misunderstandings, could adversely affect our business. In particular, damage to our reputation could be difficult and time-consuming to repair, could make potential or existing clients reluctant to select us for new engagements, resulting in a loss of business, and could adversely affect our employee recruitment and retention efforts. Damage to our reputation could also reduce the value and effectiveness of our CI&T brand name and could reduce investor confidence in us and our business, financial condition, results of operations and prospects may be materially adversely affected.
We face intense competition.
The market for technology and IT solutions and services is intensely competitive, highly fragmented and subject to rapid change and evolving industry standards and we expect competition to intensify. We believe that the principal competitive factors that we face are the ability to innovate; technical expertise and industry knowledge; end-to-end solution offerings; location of operation; price; reputation and track record for high-quality and on-time delivery of work; effective employee recruiting; training and retention; responsiveness to clients’ business needs; scale; and financial stability.
Our primary competitors include digital transformation and software engineering service providers, such as Endava plc, Globant S.A. and EPAM Systems, INC. Other competitors include traditional IT services companies, such as Accenture PLC, Capgemini SE, Cognizant Technology Solutions Corporation and Tata Consultancy Services Limited. To a lesser extent, other competitors include digital agencies and consulting companies, such as Ideo, McKinsey & Company, The Omnicom Group, Sapient Corporation and WPP plc. Many of our competitors have, and our potential competitors could have, substantial competitive advantages such as substantially greater financial, technical and marketing resources, greater name recognition, longer operating histories, greater client support resources, lower labor and development costs, and larger and more mature intellectual property portfolios. As a result, they may be able to compete more aggressively on pricing or devote greater resources to the development and promotion of technology and IT services. If successful, their development efforts could render our services less desirable to clients, resulting in the loss of clients or a reduction in the fees we could generate from our offerings. In addition, there are relatively few barriers to entry into our markets and we have faced, and expect to continue to face, competition from new market entrants. Further, there is a risk that our clients may elect to increase their internal resources to satisfy their services needs as opposed to relying on third-party service providers, such as us. The technology services industry may also undergo consolidation, which may result in increased competition in our target markets from larger firms that may have substantially greater financial, marketing or technical resources, may be able to respond more quickly to new technologies or processes and changes in client demands, and may be able to devote greater resources to the development, promotion and sale of their services than we can. Increased competition could also result in price reductions, reduced operating margins and loss of our market share.
Moreover, as we expand the scope and reach of our solutions, we may face additional competition. If one or more of our competitors were to merge or partner with other competitors, the change in the competitive landscape could also adversely affect our ability to compete effectively.
We cannot assure you that we will be able to compete successfully with existing or new competitors or that competitive pressures will not materially adversely affect our business, financial condition, results of operations and prospects.
We must attract and retain highly-skilled IT professionals. We may face a market shortage of personnel and increases in our current levels of attrition may increase our operating costs and adversely affect our future business prospects.
In order to sustain our growth, we must attract and retain a large number of highly-skilled and talented IT professionals. Our business is people-driven and, accordingly, our success depends upon our ability to attract, develop, motivate, retain and effectively utilize highly-skilled IT professionals in our delivery. We believe that there is significant competition for technology professionals in the geographic regions in which we operate and that such competition is likely to continue for the foreseeable future. Increased hiring by technology companies and increasing worldwide competition for skilled technology professionals may lead to a shortage in the availability of suitable qualified personnel. Our ability to properly staff projects, maintain and renew existing engagements and win new business depends, in large part, on our ability to recruit, train and retain IT professionals.
In addition, the technology industry generally experiences a significant rate of turnover of its workforce. There is a limited pool of individuals who have the skills and training needed to help us grow our company. We compete for such talented individuals not only with other companies in our industry but also with companies in other industries, such as software services, engineering services, financial services and technology generally, among others. High attrition rates of IT personnel would increase our hiring and training costs and could have an adverse effect on our ability to complete existing contracts in a timely manner, meet client objectives and expand our business. Failure to hire, train and retain IT professionals in sufficient numbers could have a material adverse effect on our business, financial condition, results of operations and prospects.
Potential clients may be reluctant to switch to a new provider of digital solutions.
As we expand our offerings into new solutions, our potential clients may be concerned about disadvantages associated with switching providers, such as a loss of accustomed functionality, increased costs and business disruption. For prospective clients, switching from one vendor of solutions similar to those provided by us (or from an internally developed system) to a new vendor may be a significant undertaking. As a result, certain potential clients may resist changing vendors. There can be no assurance that our investments to overcome potential clients’ reluctance to change vendors will be successful, which may adversely affect our business, financial condition, results of operations and prospects.
We must maintain adequate resource utilization rates and productivity levels.
Our profitability and the cost of providing our services are affected by our utilization rates of our employees in the locations in which we operate. If we are not able to maintain appropriate utilization rates for our employees involved in delivery of our services, our profit margin and our profitability may suffer. Our utilization rates are affected by a number of factors, including:
| ● | our ability to promptly transition our employees from completed projects to new assignments and to hire and integrate new employees; |
| ● | our ability to forecast demand for our services and thereby maintain an appropriate number of employees in each of the locations in which we operate; |
| ●
| our ability to deploy employees with appropriate skills and seniority to projects; |
| ● | our ability to manage the attrition of our employees; and |
| ● | our need to devote time and resources to training, professional development and other activities that cannot be billed to our clients. |
Our revenue could also suffer if we misjudge demand patterns and do not recruit sufficient personnel to satisfy our future demand. Employee shortages could prevent us from completing our contractual commitments in a timely manner and cause us to lose contracts or clients. Further, to the extent that we lack sufficient personnel with lower levels of seniority and daily or hourly rates, we may be required to deploy more senior employees with higher rates on projects without the ability to pass such higher rates along to our clients, which could adversely affect our profit margin and profitability.
Our profitability could suffer if we are not able to maintain favorable pricing.
Our profitability and operating results are dependent on the rates we are able to charge for our services.
Our rates are affected by a number of factors, including:
● our clients’ perception of our ability to add value through our services;
● our competitors’ pricing policies;
● bid practices of clients and their use of third-party advisors;
● the ability of large clients to exert pricing pressure;
● employee wage levels and increases in compensation costs;
● employee utilization levels;
● our ability to charge premium prices when justified by market demand or the type of service; and
● general economic conditions, including inflation rates.
Pricing pressures and increased competition generally could result in reduced revenue, reduced margins, increased losses or the failure of our solutions to achieve or maintain widespread market acceptance. If we are not able to maintain favorable pricing for our services, our profitability could suffer, and our business, financial condition, results of operations and prospects may be materially adversely affected.
We have experienced, and may in the future experience, a long selling cycle with respect to certain projects that require significant investment of human resources and time by both our clients and us.
The length of our selling cycle for clients, from initial evaluation to contract execution, is generally 1 to 12 months for large enterprise clients and 1 to 6 months for small and mid-market clients, but can vary substantially. The timing of our sales with our clients is difficult to predict because of the length and unpredictability of the selling cycle for these clients. Mid-market and large enterprise clients, particularly those in highly regulated industries and those requiring highly customized solutions, may have an even further lengthy selling cycle for the evaluation and implementation of our products and services. If these clients maintain work-from-home arrangements for a significant period of time as a result of the COVID-19 pandemic or otherwise, it may cause a lengthening of these selling cycles.
Before committing to use our services, potential clients may require us to expend substantial time and resources educating them on the value of our services and our ability to meet their requirements. Therefore, our selling cycle is subject to many risks and delays over which we have little or no control, including our clients’ decision to choose alternatives to our services (such as other technology and IT service providers or in-house resources) and the timing of our clients’ budget cycles, approval and integration processes. If our sales cycle unexpectedly lengthens for one or more projects, it would negatively affect the timing of our revenue and hinder our revenue growth. For certain clients, we may begin work and incur costs prior to executing the contract. A delay in our ability to obtain a signed agreement or other persuasive evidence of an arrangement, or to complete certain contract requirements in a particular quarter, could reduce our revenue in that quarter or render us entirely unable to collect payment for work already performed.
Implementing our services also involves a significant commitment of resources over an extended period of time from both our clients and us. Our clients may experience delays in obtaining internal approvals or delays associated with technology, thereby further delaying the implementation process. Our current and future clients may not be willing or able to invest the time and resources necessary to implement our services, and we may fail to close sales with potential clients to which we have devoted significant time and resources. Any significant failure to generate revenue or delays in recognizing revenue after incurring costs related to our sales or services process could materially adversely affect our business.
Our cash flows and results of operations may be adversely affected if we are unable to collect on billed and unbilled receivables from clients.
Our business depends on our ability to successfully receive payment from our clients of the amounts they owe us for work performed. We evaluate the financial condition of our clients, usually bill and collect on relatively short cycles and maintain provisions for expected losses against receivables. Actual losses on client balances could differ from those that we currently anticipate and, as a result, we may need to adjust our provisions. We may not accurately assess the creditworthiness of our clients. Macroeconomic conditions, such as a potential credit crisis in the global financial system, could also result in financial difficulties for our clients, including limited access to the credit markets, insolvency or bankruptcy. Such conditions could cause clients to delay payment, request modifications of their payment terms, or default on their payment obligations to us, all of which could increase our receivables balance and our provision for doubtful debts. Timely collection of fees for client services also depends on our ability to complete our contractual commitments on schedule and subsequently bill for and collect our contractual service fees. If we are unable to meet our contractual obligations, we might experience delays in the collection of or be unable to collect our client balances, which would adversely affect our results of operations and could adversely affect our cash flows. In addition, if we experience an increase in the time required to complete our services, bill and collect for our services, our cash flows could be adversely affected, which in turn could adversely affect our ability to make necessary investments and, therefore, our results of operations.
If we fail to offer high-quality client support, our business and reputation could suffer.
Our clients rely on our personnel for support related to their solutions. High-quality support is important for the renewal and expansion of our agreements with existing clients. The importance of high-quality support will increase as we expand our business and pursue new clients, particularly mid-market and large enterprise clients. If we do not help our clients quickly resolve issues and provide effective ongoing support, our ability to sell new solutions to existing and new clients could suffer and our reputation with existing or potential clients could be harmed.
Our revenue is dependent on a limited number of industry verticals, and any decrease in demand for technology services in these sectors or our failure to effectively penetrate new sectors could adversely affect our revenue, business, financial condition, results of operations and prospects.
Historically, we have focused on developing industry expertise and deep client relationships in a limited number of industry verticals. As a result, a substantial portion of our revenue has been generated by clients operating in the financial services, food and beverages and pharmaceutical and cosmetics industry vertical. Net revenue from the financial services, food and beverages and pharmaceutical and cosmetics industry vertical represented 34%, 24% and 14% of total Net revenue for the year ended December 31, 2021 respectively, and 34%, 26% and 14% of total Net revenue for the fiscal year ended December 31, 2020, respectively. Our business growth largely depends on continued demand for our services from clients in these sectors, and any slowdown or reversal of the trend to spend on technology services in these sectors could result in a decrease in the demand for our services and materially adversely affect our revenue, business, financial condition, results of operations and prospects.
Other developments in the industries in which we operate may also lead to a decline in the demand for our services, and we may not be able to successfully anticipate and prepare for any such changes. For example, consolidation or acquisitions, particularly involving our clients, may adversely affect our business. Our clients and potential clients may experience rapid changes in their prospects, substantial price competition and pressure on their profitability. This, in turn, may result in increasing pressure on us from clients and potential clients to lower our prices, which could adversely affect our revenue, business, financial condition, results of operations and prospects.
If we are unable to comply with our contractual security obligations or are required to indemnify our clients for data breaches or any significant failure related to their equipment or systems, we may face reputational damage and lose clients and revenue.
The services we provide are often critical to our clients’ businesses. Certain of our client contracts require us to comply with security obligations, which could include maintaining network security and backup data, ensuring our network is virus-free, maintaining business continuity planning procedures, and verifying the integrity of employees that work with our clients by conducting background checks. Any failure in a client’s or third-party service provider’s system, whether or not a result of or related to the services we provide, or breach of security relating to the services we provide to the client could damage our reputation or result in a claim for substantial damages against us. Our liability for breaches of data security requirements or breaches or incidents affecting our clients’ equipment or systems, for which we may be required to indemnify our clients, may be extensive and could result in reputational damage or a loss of clients and revenue.
Breaches of, or significant disruptions to, our information technology systems and solutions and those of our third-party service providers and subprocessors and unauthorized access to or misuse of the information and data we collect, transmit, use, store and otherwise process may cause us to lose current or future clients and our reputation and business may be harmed.
We have access to or are required to collect, transmit, use, store and otherwise process confidential client and consumer data. We also use third-party service providers (including cloud infrastructure and data center providers) and subprocessors to help us deliver services to clients and their end-consumers. These service providers and subprocessors may also collect, transmit, use, store and otherwise process personal information, credit card information and/or other confidential information of our employees, clients and our clients’ end-consumers. Despite our efforts with respect to security measures, this information, and the information technology systems that are used to store and otherwise process such information, including those information technology systems of our service providers and subprocessors, may be vulnerable to cyberattacks and other security threats or disruptions, including unauthorized access or intrusion, breaches, damage or other interruptions, including as a result of third-party action, criminal conduct, physical or electronic break-ins, telecommunications or network failures or interruptions, malicious or inadvertent acts of employee or contractors, nation state malfeasance, computer viruses, malware, denial-of-service attacks, phishing, hackers, system error, software bugs or defects, fraud, process failure or otherwise. While we strive to maintain reasonable preventative and data security controls, it is not possible to prevent all security threats to our systems and data and those of our third-party service providers, over which we exert less control. In addition, cybersecurity threats and techniques used to obtain unauthorized access, disable or degrade service or sabotage systems continue to increase, evolve in nature and become more sophisticated. Further, as a result of the COVID-19 pandemic, we may face increased security risks due to our increased reliance on internet technology and the number of our employees who are working remotely, which may create additional opportunities for cybercriminals to exploit vulnerabilities. If any person circumvents our network security, accidentally exposes our data or code, or misappropriates data or code that belongs to us, our clients or our clients’ end users, or cause our systems to malfunction, we could face numerous risks, including risk related to breach of contract, diversion of management resources, increased costs relating to mitigation and remediation of such problems, regulatory actions, penalties and fines, litigation and future costs related to information security.
We may incorporate third-party open source software in our solutions, and any defects or security vulnerabilities in the open source software or our failure to comply with the terms of the underlying open source software licenses could adversely impact our clients, negatively affect our business, subject us to litigation, and create potential liability.
Certain of our solutions and software that is delivered to our clients incorporate software components that are licensed to us by third parties under various “open source” licenses, including the GNU General Public License, the GNU Lesser General Public License, the BSD License, the Apache License and others, and we may also rely on licensed software for the provision of our services. Despite our efforts to comply with such licenses, we or our clients may be subject to claims from third parties that our use or our clients’ use of certain open source software infringes the claimants’ intellectual property rights. We are generally required to indemnify our clients against such claims. In addition, use of open source software may entail greater risks than use of third-party commercial software, as open source licensors generally do not provide warranties or other contractual protections regarding infringement claims or the quality of the code. To the extent that our solutions and software depend upon the successful operation of open source software, any undetected errors or defects in this open source software could prevent the deployment or impair the functionality of our solutions and software, delay the introduction of new solutions, result in a failure of our software, and injure our reputation. For example, undetected errors or defects in open source software could render it vulnerable to breaches or security attacks, and, in conjunction, make our systems more vulnerable to data breaches.
Certain open source licenses require that users who distribute or convey the open source software subject to such licenses make available the source code of any modifications or derivative works based on such open source software. Although we monitor our use of open source software in an effort both to comply with the terms of the applicable open source licenses and to avoid subjecting our solutions and software to restrictions we do not intend, the terms of many open source licenses have not been interpreted by courts in relevant jurisdictions, and therefore the potential impact of such licenses on our business is not fully known or predictable. There is a risk that these licenses could be construed in a way that could impose unanticipated conditions or restrictions on our ability to market certain of our software solutions or our clients’ ability to use the software that we develop for them and operate their businesses as they intend. The terms of certain open source licenses may require us or our clients to release the source code of the software we develop for our clients that is combined with or linked to open source software, and to make such software available under the applicable open source licenses. In the event that portions of our solutions or client deliverables are determined to be subject to an open source license, we or our clients could be required to publicly release the affected portions of source code, pay damages for breach of contract, re- engineer all, or a portion of, the applicable software, discontinue sales of one or more of our solutions in the event re-engineering cannot be accomplished on a timely basis or take other remedial action that may divert resources away from our development efforts. Disclosing could allow our competitors or our clients’ competitors to create similar products with lower development effort and time and ultimately could result in a loss of sales for us or our clients. Any of these events could create liability for us to our clients, increase our costs and damage our reputation, which could have a material adverse effect on our revenue, business, financial condition, results of operations and prospects.
We may not receive sufficient intellectual property rights from our employees and independent contractors to comply with our obligations to our clients and we may not be able to prevent unauthorized use of our intellectual property. We may also be subject to claims by third parties asserting that we, companies we have acquired, our employees or our independent contractors have misappropriated their intellectual property, or claiming ownership of what we regard as our own intellectual property.
Our client contracts generally require, and our clients typically expect, that we will assign to them all intellectual property rights associated with the deliverables that we create in connection with our engagements. In order to assign these rights to our clients, we must ensure that our employees and independent contractors validly assign to us all intellectual property rights that they have in such deliverables. Our employment and independent contractor agreements include terms regarding the assignment of inventions. These agreements provide that the employee or independent contractor assign to us all of the intellectual property rights of the employee and/or independent contractor to such deliverables, but there can be no assurance that we will be able to enforce our rights under such agreements. Given that we operate in a variety of jurisdictions with different and evolving legal regimes, we face increased uncertainty regarding whether such agreements will be found to be valid and enforceable by competent courts and whether we will be able to avail ourselves of the remedies provided for by applicable law, see “Risk Factors — Certain Compliance, Tax, Legal and Regulatory Risks — Our business, financial condition and results of operations may be adversely affected by the various conflicting and/or onerous legal and regulatory requirements imposed on us by the countries where we operate.”
Our success also depends in part on certain methodologies, practices, tools and technical expertise we utilize in designing, developing, implementing, protecting, enforcing and maintaining our proprietary and intellectual property rights. In order to protect our proprietary and intellectual property rights, we rely upon a combination of technical measures, license agreements, nondisclosure and other contractual arrangements as well as trade secret, copyright, trademark laws and other similar laws. We consider trade secrets and confidential know-how to be important to our business. However, trade secrets and confidential know-how are difficult to maintain as confidential. We attempt to protect this type of information and our proprietary and intellectual property rights generally by requiring our employees, consultants, contractors and advisors to enter into confidentiality agreements with us. We also seek to preserve the integrity and confidentiality of our technology, data, trade secrets and know-how by maintaining physical security of our premises and physical and electronic security of our information technology systems. Despite our efforts to protect our confidential information, intellectual property, and technology, unauthorized third parties may gain access to our confidential proprietary information, develop and market solutions similar to ours, or use trademarks similar to ours, any of which could materially harm our business and results of operations. Moreover, policing our intellectual property rights is expensive, time consuming and unpredictable. If a competitor lawfully obtained or independently developed any of our trade secrets, we would have no right to prevent such competitor from using that technology or information to compete with us, which could harm our competitive position. Further, if the steps taken to maintain our trade secrets are deemed inadequate, we may have insufficient recourse against third parties for misappropriating the trade secret. To the extent that we seek to enforce our rights, we could be subject to defenses, counterclaims, claims that our intellectual property rights are invalid, unenforceable, or licensed to the party against whom we are pursuing a claim. If we are not successful in defending or enforcing such claims in litigation, we could lose valuable intellectual property rights or we may be subject to damages that could, in turn, harm our results of operations. Even if we are successful in defending or enforcing our claims, litigation could result in substantial costs and diversion of resources and could negatively affect our business, reputation, results of operations and financial condition. If we are unable to protect our technology and to adequately maintain and protect our intellectual property rights, we may find ourselves at a competitive disadvantage to others who need not incur the additional expense, time and effort required to create the innovative solutions that have enabled us to be successful to date.
We may be subject to claims by third parties asserting that we, our clients, companies we have acquired, our employees or our independent contractors have infringed, misappropriated or violated their intellectual property, or claiming ownership of what we regard as our own intellectual property.
We may be subject to claims by third parties that we, our clients, companies we have acquired, our employees, or our independent contractors have misappropriated their intellectual property. For example, many of our employees were previously employed at our competitors or potential competitors. Some of these employees executed proprietary rights, non-disclosure and non-competition agreements in connection with such previous employment. Although we try to ensure that our employees do not use the proprietary information of others in their work for us, we may be subject to claims that we or these employees have used or disclosed confidential information or intellectual property, including trade secrets or other proprietary information, of any such employee’s former employer. Litigation may be necessary to defend against these claims. In addition, we are subject to additional risks related to intellectual property infringement as a result of our recent acquisitions and any future acquisitions we may complete. For instance, the developers of the technology that we have acquired or may acquire may not have appropriately created, maintained, protected or enforced their intellectual property rights in such technology. Indemnification and other rights we have under acquisition documents may be limited in term and scope and may therefore provide us with little or no protection from these risks.
Further, we have in the past, and may in the future be subject to legal proceedings and claims in the ordinary course of our business, including claims of alleged infringement, violation or misappropriation of intellectual property rights of third parties by us or our clients in connection with their use of our solutions or the software we develop for them.
Although we take steps to avoid infringement, misappropriation or violation by us or our clients of the intellectual property rights of third-parties, any such claims, whether or not meritorious, could result in costly litigation and divert the efforts of our management and personnel. Should we be found liable for infringement or misappropriation, we may lose valuable intellectual property rights or personnel or we may be required to enter into royalty arrangements (including licensing agreements, which may not be available on reasonable terms, or at all) or to pay damages or result in us being unable to use certain intellectual property. Any of these events could seriously harm our business, results of operations and financial condition.
If our current insurance coverage is or becomes insufficient to protect against losses incurred, our business, financial condition, results of operations and prospects may be adversely affected.
We provide technology services that are critical to our clients’ businesses. If we were to default in the provision of any contractually agreed- upon services, our clients could suffer significant damages and make claims against us for those damages. Our insurance coverage is very limited, for instance, CI&T Brazil’s errors and omissions liability coverage for all of the services it provides is limited to R$5.2 million, subject to lower sub-limits in certain cases. Our insurance policies, including our errors and omissions insurance, may be inadequate or insufficient to compensate us for the potentially significant losses that may result from claims arising from breaches of our contracts, disruptions in our services, failures or disruptions to our infrastructure, catastrophic events and disasters or otherwise. Additionally, we do not carry cyber insurance, which may expose us to certain potential losses for damages in an amount exceeding our resources. Further, such insurance may not be available to us in the future on economically reasonable terms, or at all. To the extent client damages are deemed recoverable against us in amounts substantially in excess of our insurance coverage, or if our claims for insurance coverage are denied by our insurance carriers for any reason, including reasons beyond our control, there could be a material adverse effect on our revenue, business, financial condition, results of operations and prospects.
We are subject to costs and risks associated with increased or changing laws and regulations affecting our business, including those relating to the sale of consumer products. Specifically, developments in data protection and privacy laws could subject us to fines and reputational harm, which could in turn harm our business, financial condition or results or operations.
We operate in a complex regulatory and legal environment that exposes us to compliance and litigation risks that could materially affect our results of operations. These laws may change, sometimes significantly, as a result of political, economic or social events. Some of the federal, state or local laws and regulations in Brazil that affect us include: those relating to consumer products, product liability or consumer protection; those relating to the manner in which we advertise, market or sell products; labor and employment laws, including wage and hour laws; tax laws or interpretations thereof; bank secrecy laws, data protection and privacy laws and regulations; and securities and exchange laws and regulations. For instance, laws and regulations regarding privacy and the collection, storage, use, retention, processing, transfer, transmission, disclosure and protection of personal, sensitive or other regulated data are developing and evolving to take into account the changes in cultural and consumer attitudes towards the protection of personal data. See “Certain Compliance, Tax, Legal and Regulatory Risks” for further information related to our obligations to comply with increased or changing laws and regulations affecting our business. There can be no guarantee that we will have sufficient financial resources to comply with any new regulations or successfully compete in the context of a shifting regulatory environment.
Internet regulation in Brazil is recent and still limited and several legal issues related to the internet are uncertain.
In 2014, Brazil enacted a law, which we refer to as the Brazilian Civil Rights Framework for the Internet (Marco Civil da Internet), setting forth principles, guarantees, rights and duties for the use of the Internet in Brazil, including provisions about internet service provider liability, internet user privacy and internet neutrality. In May 2016, further regulations were passed in connection with the referred law. The administrative penalties imposed by the Brazilian Civil Rights Framework for the Internet include notification, fines (up to 10% of the revenues in Brazil of the relevant entity’s economic group in the preceding fiscal year) and suspension or prohibition from engaging in data processing activities. The Brazilian Civil Rights Framework for the Internet also determines joint and several liabilities between foreign parent companies and the local Brazilian subsidiary for the payment of fines that may be imposed for breach of its provisions. Administrative penalties may be applied cumulatively. Daily fines may be imposed in judicial proceedings, as a way to compel compliance with a Brazilian court order. If for any reason a company fails to comply with the court order, the fine can reach significant amounts. We may be subject to liability under these laws and regulations should we fail to adequately comply with the Brazilian Civil Rights Framework.
However, unlike in the United States, little case law exists around the Brazilian Civil Rights Framework for the internet and existing jurisprudence has not been consistent. Legal uncertainty arising from the limited guidance provided by current laws in force allows for different judges or courts to decide very similar claims in different ways and establish contradictory jurisprudence. This legal uncertainty allows for rulings against us and could set adverse precedents, which individually or in the aggregate could seriously harm our business, results of operations and financial condition. In addition, legal uncertainty may harm our clients’ perception and use of our service.
Unfavorable developments and economic, political, social and other risks in the countries where we operate may materially adversely affect us.
We may be materially and adversely affected by unfavorable economic developments in any country where we have operations. Activities outside of Brazil accounted for 52% of our Net revenue for the year ended December 31, 2021 and 54% of our Net revenue for the fiscal year ended December 31, 2020. A significant deterioration in economic conditions in any of the markets that are most significant for our operations, including economic slowdowns or recessions, inflationary pressures and/or disruptions in the credit and capital markets, could lead to decreased consumer spending and decreased consumer confidence generally, thereby reducing demand for our services. Unfavorable economic conditions may also negatively impact our clients, suppliers and financial counterparties, who may face cash flow problems, increased defaults or other financial problems. In addition, volatility in the credit and capital markets caused by unfavorable economic developments and uncertainties may result in the unavailability of financing or an increase in its cost. Our business may also be affected by other economic developments, such as fluctuations in exchange rates, the imposition of any import, investment or foreign exchange restrictions, including tariffs and import quotas, or any restrictions on the repatriation of earnings and capital. Any of these developments could materially adversely affect our business, financial condition, results of operations and prospects.
Our operations are also subject to a variety of other risks and uncertainties related to their global operations, including political, social or other adverse developments. Political and/or social unrest, possible health problems, natural disasters, disease outbreaks or pandemics (such as the COVID-19 pandemic), politically motivated violence, and terrorist threats and/or actions may also occur in countries where we operate. Any of these developments could materially adversely affect our business, financial condition and performance.
Many of the risks above occur more frequently and with more strength in emerging markets, such as in Latin America. In general, emerging markets are also exposed to relatively higher risks of liquidity constraints, inflation, devaluation, price volatility, currency translation, corruption, crime and law enforcement, asset expropriation and sovereign default, as well as additional legal and regulatory risks and uncertainties.
Developments in emerging markets may affect our ability to import or export products and services and repatriate funds, as well as impact levels of consumer demand and, therefore, our profitability levels. Any of these factors could affect us disproportionately or differently than our competitors, depending on our specific exposure to any particular emerging market, and could materially adversely affect our business, financial condition, results of operations and prospects.
Certain Risks Relating to Our Growth Strategy
We may not be able to sustain our revenue growth rate in the future.
We have experienced rapid revenue growth in recent periods. Our Net revenue increased by 51% and 41% in the year ended December 31, 2021 and 2020 respectively, compared to the prior year. We may not be able to sustain revenue growth consistent with our recent history or at all. You should not consider our revenue growth in recent periods as indicative of our future performance. We believe our ability to attract new clients and our revenue growth depends on a number of factors, including:
| ● | our current or potential clients’ spending levels;
|
| ● | competitive factors affecting the digital transformation market, including the introduction of competing services, discount pricing and other strategies that may be implemented by our competitors; |
| ● | our ability to execute our growth strategy and operating plans; |
| ● | our clients’ level of satisfaction with our solutions; |
| ● | changes in our relationships with third parties, including our business partners, app developers, theme designers, referral sources and payment processors;
|
| ● | the timeliness and success of our solutions;
|
| ● | the frequency and severity of any system outages; |
| ● | technological change; |
| ● | our ability to adequately obtain, maintain, protect and enforce our intellectual property and proprietary rights; |
| ● | concerns relating to actual or perceived breaches of our IT systems or the data contained therein; |
| ● | the continued willingness of the end-consumers of our clients to use the internet for commerce; and |
| ●
| our focus on long-term value over short-term results, through strategic decisions that may not maximize our short-term revenue or profitability if we believe that the decisions are consistent with our mission and will improve our financial performance over the long term. |
As we grow our business, our revenue growth may decline in future periods due to a number of factors, which may include slowing demand for our services, increasing competition, decreasing growth of our overall market, our inability to engage and retain a sufficient number of IT professionals or otherwise scale our business, prevailing wages in the markets in which we operate or our failure, for any reason, to capitalize on growth opportunities.
Moreover, as we introduce new services or enter into new markets, we may face new market, technological and operational risks and challenges with which we are unfamiliar, and it may require substantial management efforts and skills to mitigate these risks and challenges. We expect to continue to spend substantial financial and other resources on, among other things:
| ● | investments in our IT team, improvements in security and data protection, the development of new products, features and functionality and enhancements to our solutions; |
| ● | sales and marketing, including the continued expansion of our direct sales and marketing programs, especially for businesses outside of Brazil; |
| ● | expansion of our operations and infrastructure, both domestically and internationally; and |
| ● | general administration, including legal, accounting and other expenses related to being a public company. |
These investments may not result in increased revenue or the growth of our business. Accordingly, we may not be able to generate sufficient revenue to offset our expected cost increases and achieve and sustain profitability.
As a result of any of these problems associated with expansion, our business, financial condition and results of operations could be materially adversely affected.
We are focused on growing our client base internationally and may not be successful.
We are focused on geographic expansion, particularly in North America and Europe. In the year ended December 31, 2021, 48% of our Net revenue came from clients in North America and Europe, a decrease of 1 percentage point when compared to the year ended December 31, 2020. In fiscal year 2020, 49% of our Net revenue came from clients in North America and Europe, an increase of three percentage points when compared to fiscal year 2019. We have made significant investments to expand in North America and Europe, however, our ability to add new clients depends on a number of factors, including market perception of our services, our ability to successfully add nearshore delivery center capacity and pricing, competition and overall economic conditions. In addition, in January 2022, we completed the acquisition of Somo Global Ltd. to accelerate our growth in the EMEA region. If we are unable to retain existing clients and attract new clients in North America, Europe and elsewhere, we may be unable to grow our revenue and our business and results of operations could be adversely affected.
Potential future acquisitions could prove difficult to integrate, disrupt our business, dilute shareholder value and strain our resources.
We may continue to expand our operations through strategically targeted acquisitions of additional businesses. For example, in 2021 we acquired Dextra Investimentos S.A. in Brazil and in January 2022 we acquired Somo Global Ltd to expand our operations in EMEA. In the future, we may acquire additional businesses that we believe could complement or expand our business. The success of an acquisition or investment will depend on our ability to make accurate assumptions regarding the valuation, operations, growth potential, integration and other factors related to that business. We cannot assure you that any of these acquisitions will produce the results that we expect at the time we enter into or complete a given transaction. Future acquisitions may increase our level of indebtedness and negatively affect our liquidity.
Integrating the operations of acquired businesses successfully or otherwise realizing any of the anticipated benefits of acquisitions, including anticipated cost savings and additional revenue opportunities, involves a number of potential challenges. The failure to meet these integration challenges could seriously harm our financial condition and results of operations. Realizing the benefits of acquisitions depends in part on the integration of operations and personnel. These integration activities are complex and time- consuming, and we may encounter unexpected difficulties or incur unexpected costs, including:
| ● | our inability to achieve the operating synergies anticipated in the acquisitions; |
| ● | diversion of management attention from ongoing business concerns to integration matters; |
| ●
| consolidating and rationalizing information technology platforms and administrative infrastructures; |
| ● | complexities associated with managing the geographic separation of the combined businesses and consolidating multiple physical locations; |
| ● | retaining IT professionals and other key employees; |
| ● | integrating personnel from different corporate cultures while maintaining focus on providing consistent, high quality service;
|
| ● | demonstrating to our clients and to clients of acquired businesses that the acquisition will not result in adverse changes in client service standards or business focus; |
| ● | possible cash flow interruption or loss of revenue as a result of transitional matters; and |
| ●
| inability to generate sufficient revenue to offset acquisition costs. |
Further, there can be no assurance that we had or will have full access to all necessary information to assess any assets acquired or will acquire and identify and mitigate the risks, liabilities and contingencies in connection with the due diligence performed. We may discover liabilities or deficiencies associated with the assets or companies we acquire or ineffective or inadequate controls, procedures or policies at an acquired business that were not identified in advance, any of which could result in significant unanticipated costs and adversely impact our business. Also, in the context of our acquisitions, we may face contingent liabilities in connection with, among others things, (i) judicial and/or administrative proceedings of the business we acquire, including civil, regulatory, tax, labor, social security, environmental and intellectual property proceedings, and (ii) financial, reputational and technical issues, including with respect to accounting practices, financial statement disclosures and internal controls, as well as other regulatory matters, all of which may not be sufficiently indemnifiable under the relevant acquisition agreement and may impact our financial reporting obligations and the preparation of our audited consolidated financial statements, resulting in delays to such preparation.
In particular, to the extent that prior owners of any acquired businesses or properties failed to comply with or otherwise violated applicable laws or regulations, or failed to fulfill their contractual obligations to clients, we, as the successor owner, may be financially responsible for these violations and failures and may suffer financial or reputational harm or otherwise be adversely affected. Similarly, our acquisition targets may not have as robust internal controls over financial reporting as would be expected of a public company. Acquisitions also frequently result in the recording of goodwill and other intangible assets which are subject to potential impairment in the future that could harm our financial results. We may also become subject to new regulations as a result of an acquisition, including if we acquire a business serving clients in a regulated industry or acquire a business with clients or operations in a country in which we do not already operate. In addition, if we finance acquisitions by issuing convertible debt or equity securities, our existing shareholders may be diluted, which could affect the market price of our Class A common shares. As a result, if we fail to properly evaluate acquisitions or investments, we may not achieve the anticipated benefits of any such acquisitions, and we may incur costs in excess of what we anticipate. Acquisitions frequently involve anticipated benefits related to the integration of operations of the acquired business. The failure to successfully integrate the operations or to otherwise realize any of the anticipated benefits of the acquisition could seriously harm our results of operations.
If we do not continue to innovate and remain at the forefront of emerging technologies and related market trends, we may lose clients and not remain competitive.
Our success depends on delivering innovative solutions that leverage emerging technologies and emerging market trends to generate business impact, which may include revenue growth, cost reduction, expansions into new lines of business and other initiatives. Technological advances and innovation are constant in the technology services industry. As a result, we must continue to invest significant resources to stay abreast of technology developments so that we may continue to deliver solutions that our clients will wish to purchase. We cannot guarantee that product enhancements and new solutions will perform as well as or better than our existing offerings. Product enhancements and new solutions that we develop may not be introduced in a timely or cost-effective manner, may contain errors or defects, may have interoperability difficulties or may not achieve the broad market acceptance necessary to generate significant revenue.
In addition, we need to understand our clients’ behavior and needs in order to prepare for the next shift in the relationship between businesses and their end-consumers so that we are well positioned to propose and develop new solutions to support this change in consumer trends and behavior. We cannot guarantee that we will always be able to offer the products and services sought by our clients. We are subject to potential changes to consumer habits as well as to demand for products and services by our clients (and the end- consumers of our clients). This requires us to adapt to their preferences on an ongoing basis. Accordingly, we may not be able to anticipate or respond adequately to changes in consumer habits, and we cannot guarantee that we will be efficient and effective in adapting to meet those habits.
If we are unable to anticipate technology developments, enhance our existing solutions or develop and introduce new solutions to keep pace with such changes and meet changing client needs, we may lose clients and our revenue and results of operations could suffer. Our results of operation would also suffer if our employees are not responsive to the needs of our clients, not able to help clients in driving innovation and not able to help our clients in effectively bringing innovative ideas to market. Our competitors may be able to offer engineering, design and innovation services that are, or that are perceived to be, substantially similar or better than those we offer. This may force us to reduce our daily rates and to expend significant resources in order to remain competitive, which we may be unable to do profitably or at all. Because many of our clients and potential clients regularly contract with other IT service providers, these competitive pressures may be more acute than in other industries.
We may need additional capital, and a failure by us to raise additional capital on terms favorable to us, or at all, could limit our ability to grow our business and develop or enhance our service offerings to respond to market demand or competitive challenges.
We believe that our current cash balances, cash flow from operations, credit facilities and the proceeds from our initial public offering should be sufficient to meet our anticipated cash needs for at least the next 12 months. We may, however, require additional cash resources due to changed business conditions or other future developments, including any investments or acquisitions we may decide to pursue. If these resources are insufficient to satisfy our cash requirements, we may seek to sell additional equity or debt securities or seek credit agreement financing. The sale of additional equity securities could result in dilution to our shareholders. The incurrence of indebtedness would result in increased debt service obligations and could require us to agree to operating and financing covenants that would restrict our operations. Our ability to obtain additional capital on acceptable terms is subject to a variety of uncertainties, including investors’ perception of, and demand for, companies of our segment, conditions in the capital markets in which we may seek to raise funds, our future results of operations and financial condition, and general economic and political conditions. Financing may not be available in amounts or on terms acceptable to us, or at all, and could limit our ability to grow our business and develop or enhance our service offerings to respond to market demand or competitive challenges.
Certain Risks Relating to Our Organizational Structure
Material weaknesses in our internal control over financial reporting have been identified and, if we fail to implement and maintain effective internal controls over financial reporting, we may be unable to accurately report our results of operations, meet our reporting obligations or prevent fraud. As we are an emerging growth company, our independent registered public accounting firm has not yet conducted an audit of our internal control over financial reporting in accordance with the provisions of the Sarbanes-Oxley Act of 2002.
Prior to our initial public offering, we were a private company with limited accounting personnel and other resources to address our internal control over financial reporting and procedures. Our management has not completed an assessment of the effectiveness of our internal control over financial reporting and our independent registered public accounting firm has not conducted an audit of our internal control over financial reporting in accordance with the provisions of the Sarbanes-Oxley Act of 2002. As a public company, we are subject to the Sarbanes-Oxley Act of 2002, which requires, among other things, that we report annually on the effectiveness of our internal control over financial reporting.
In connection with the audit of our consolidated financial statements for the year ended December 31, 2021, we have identified material weaknesses in our internal control over financial reporting. A material weakness is a deficiency, or combination of control deficiencies, in internal control over financial reporting, such that there is a reasonable possibility that a material misstatement of the annual or interim consolidated financial statements will not be prevented or detected on a timely basis. The material weaknesses identified relate to: (i) ineffective design and implementation of general information technology controls (GITCs) in user access over information technology systems that support our financial reporting processes, as well as the completeness and accuracy of reports used by us, which resulted in business process controls that are dependent on the affected GITCs also being considered ineffective because they could have been adversely impacted; and (ii) ineffective design and implementation of formal controls within the financial reporting review of manual journal entries.
These material weaknesses did not result in a misstatement to our consolidated financial statements for the year ended December 31, 2021.
We have adopted a remediation plan with respect to the material weaknesses identified above. For more information, see “Item 15. Controls and Procedures — D. Changes in internal control over financial reporting.” However, we cannot assure you that our efforts will be effective or prevent any future material weakness or significant deficiency in our internal controls over financial reporting.
In light of the control deficiencies and the resulting material weaknesses that were previously identified as a result of the limited procedures performed, it is possible that, had we and our registered public accounting firm performed an assessment or audit, respectively, of our internal control over financial reporting in accordance with the provisions of the Sarbanes-Oxley Act of 2002, additional material weaknesses may have been identified.
Under Section 404 of the Sarbanes-Oxley Act of 2002, our management is not required to assess or report on the effectiveness of our internal control over financial reporting in our annual report on Form 20-F for the fiscal year ending December 31, 2021. We are only required to provide such a report for the fiscal year ending December 31, 2022. At that time, our management may conclude that our internal control over financial reporting is not effective. In addition, until we cease to be an “emerging growth company” as such term is defined in the JOBS Act, which may not be until after five full fiscal years following the date of the initial public offering, our independent registered public accounting firm is not required to attest to and report on the effectiveness of our internal control over financial reporting. Even if our management concludes that our internal control over financial reporting is effective, our independent registered public accounting firm, after conducting its own independent testing, may disagree with our assessment or may issue a report that is qualified if is not satisfied with our internal controls or the level at which our controls are documented, designed, operated or reviewed, or if it interprets the relevant requirements differently from us. In addition, as a public company, our reporting obligations place a significant strain on our management, operational and financial resources and systems for the foreseeable future. We may be unable to timely complete our evaluation testing and any required remediation.
During the course of documenting and testing our internal control procedures, in order to satisfy the requirements of Section 404 of the Sarbanes-Oxley Act of 2002, we may identify other weaknesses and deficiencies in our internal control over financial reporting. In addition, if we fail to maintain the adequacy of our internal control over financial reporting, as these standards are modified, supplemented or amended from time to time, we may not be able to conclude on an ongoing basis that we have effective internal control over financial reporting in accordance with Section 404 of the Sarbanes-Oxley Act of 2002. If we fail to achieve and maintain an effective internal control environment, we could suffer material misstatements in our financial statements, fail to meet our reporting obligations or fail to prevent fraud, which would likely cause investors to lose confidence in our reported financial information. This could, in turn, limit our access to capital markets, harm our results of operations, and lead to a decline in the trading price of our Class A common shares. Additionally, ineffective internal control over financial reporting could expose us to increased risk of fraud or misuse of corporate assets and subject us to potential delisting from the NYSE, regulatory investigations and civil or criminal sanctions.
Requirements associated with being a public company in the United States will require significant company resources and management attention.
We are subject to certain reporting requirements of the Exchange Act, and the other rules and regulations of the SEC and the NYSE. We are also subject to various other regulatory requirements, including the Sarbanes-Oxley Act of 2002, or the Sarbanes-Oxley Act. These rules and regulations increase our legal, accounting and financial compliance costs and make some activities more time-consuming and costly. For example, these rules and regulations make it more difficult and more expensive for us to obtain director and officer liability insurance, and we may be required to accept reduced policy limits and coverage or incur substantial costs to maintain the same or similar coverage. New rules and regulations relating to information disclosure (including cybersecurity risk), financial reporting and controls and corporate governance, which could be adopted by the SEC, the NYSE or other regulatory bodies or exchange entities from time to time, could result in a significant increase in legal, accounting and other compliance costs and make certain corporate activities more time-consuming and costly, which could materially affect our business, financial condition and results of operations. These rules and regulations may also make it more difficult for us to attract and retain qualified persons to serve on our board of directors or as executive officers.
These new obligations may also require substantial attention from our senior management and could divert their attention away from the day-to-day management of our business. Given that most of the individuals who now constitute our management team have limited experience managing an U.S. publicly traded company and complying with the increasingly complex laws pertaining to public companies, initially, these new obligations could demand even greater attention. These cost increases and the diversion of management’s attention could materially and adversely affect our business, financial condition and operation results.
We are dependent on members of our senior management team and other key employees.
Our future success heavily depends upon the continued services of our senior management team, particularly, our Chief Executive Officer, and other key employees. We currently do not maintain key person life insurance for any of the members of our senior management team or other key employees. Our entitlement to receive notice of an executive offer or senior executive terminating their respective employment varies across offices and positions and for some positions, no notice is required. We seek to incentivize retention by granting our senior executives stock options with vesting periods that range from 5 to 7 years and we are consistently assessing the market to align our executive compensation packages. However, if one or more of our senior executives or key employees are unable or unwilling to continue in their present positions (including any limitation on the performance of their duties or short-term or long-term absences as a result of the COVID-19 pandemic), it could disrupt our business operations, and we may not be able to replace them easily, on a timely basis or at all. The loss of the services of one or more of our senior management or other key employees for any reason could adversely affect our business, financial condition and operating results and require significant amounts of time, training and resources to find suitable replacements and integrate them within our business, and could affect our corporate culture. In addition, if the perceived value of our stock awards declines, it may adversely affect our ability to recruit and retain highly skilled employees.
In addition, competition for senior executives and key employees in our industry is intense, and we may be unable to retain our senior executives and key employees or attract and retain new senior executives and key employees in the future, in which case our business may be severely disrupted. Our senior executives have non-compete clauses in their employment contracts with us, however, if any of our senior executives or key personnel joins a competitor or forms a competing company, we may lose clients, suppliers, know-how and key IT professionals and staff members to them. Also, if any of our business development managers, who generally keep a close relationship with our clients, joins a competitor or forms a competing company, we may lose clients, and our revenues may be materially adversely affected. Additionally, there could be unauthorized disclosure or use of our technical knowledge, practices or procedures by such personnel. If any dispute arises between our senior executives or key personnel and us, any non-competition, non- solicitation and non-disclosure agreements we have with our senior executives or key personnel might not provide effective protection to us.
If we fail to attract new personnel or fail to retain and motivate our current personnel, it could adversely affect our business and future growth prospects.
We are exposed to fluctuations in foreign currency exchange rates and enter into derivatives transactions to manage our exposure to exchange rate risk.
We hold certain funds in non-Brazilian real currencies, and will continue to do so in the future, and our offshore operating subsidiaries generate revenue in non-Brazilian real currencies. Accordingly, our financial results are affected by the translation of these non-real currencies into reais. In addition, to the extent that we need to convert future financing proceeds into Brazilian reais for our operations, any appreciation of the Brazilian real against the relevant foreign currencies would materially reduce the Brazilian real amounts we would receive from the conversion, and any depreciation of the Brazilian real against the relevant foreign currencies could increase the amounts in Brazilian reais that we are require to convert into the relevant foreign currencies in order to service such relevant foreign currency financings. No assurance can be given that fluctuations in foreign exchange rates will not have a significant impact on our business, financial condition, results of operations and prospects. We may also have foreign exchange risk on any of our other assets and liabilities denominated in currencies, or with pricing linked to currencies, other than our functional currency, including certain contract assets. Fluctuations in the Brazilian real versus any of these foreign currencies may have a material adverse effect on our financial position and results of operations, for example as a result of overall market declines and increased market volatility due to the COVID-19 pandemic.
We enter into derivatives transactions to manage our exposure to exchange rate risk. While such derivatives transactions are designed to protect us against increases or decreases in exchange rates, they may not be effective. If we have entered into derivatives transactions to protect against, for example, decreases in the value of the real and the real instead increases in value, we may incur financial losses. Such losses could materially and adversely affect us.
Our holding company structure makes us dependent on the operations of our subsidiaries.
We are a Cayman Islands exempted company with limited liability. As a holding company, our corporate purpose is to invest, as a partner or shareholder, in other companies, consortia or joint ventures in Brazil, where most of our operations are located, in the United States, where a significant amount of our revenues come from, and other countries such as United Kingdom, Portugal, Canada, China, Japan and Australia. Accordingly, our material assets are our direct and indirect equity interests in our subsidiaries, and we are therefore dependent upon the results of operations and, in turn, the payments, dividends and distributions from our subsidiaries for funds to pay our holding company’s operating and other expenses and to pay future cash dividends or distributions, if any, to holders of our Class A common shares, and we may have tax costs in connection with any dividend or distribution. In addition, the payments, dividends and distributions from our subsidiaries to us for funds to pay future cash dividends or distributions, if any, to holders of our Class A common shares, could be restricted under financing arrangements that we or our subsidiaries may enter into in the future and we and such subsidiaries may be required to obtain the approval of lenders to make such payments to us in the event they are in default of their repayment obligations. Furthermore, we may be adversely affected if the Brazilian government, or the governments of any of the jurisdictions in which our subsidiaries are located, impose legal restrictions on dividend distributions by our existing subsidiaries. Exchange rate fluctuations will also affect the U.S. dollar value of any distributions our subsidiaries make with respect to our equity interests in those subsidiaries.
For further information, see “— Risks Relating to Brazil — Exchange rate instability may have adverse effects on the Brazilian economy, us and the price of our Class A common shares,” “— Risks Relating to Brazil — The Brazilian federal government has exercised, and continues to exercise, significant influence over the Brazilian economy. This involvement as well as Brazil’s political and economic conditions could harm us and the price of our Class A common shares” and “Dividends and Dividend Policy.”
Certain Compliance, Tax, Legal and Regulatory Risks
Changes in laws and regulations related to the internet or changes in the internet infrastructure itself may diminish the demand for our services, and could have a negative impact on our business.
The future success of our business depends upon the continued use of the internet as a primary medium for commerce, communication and business applications. Federal, state or foreign government bodies or agencies have in the past adopted, and may in the future adopt, laws or regulations affecting the use of the internet as a commercial medium. Legislators and regulators may make legal and regulatory changes or apply existing laws in ways that require us to incur substantial costs, expose us to unanticipated civil or criminal liability, or cause us to change our business practices. Changes in these laws or regulations could impact internet neutrality, tariffs, content, copyright protection, distribution, electronic contracts and other communications, consumer protection, and data privacy, and adversely affect the demand for our services or require us to modify our solutions in order to comply with these changes. In addition, government agencies or private organizations may begin to impose taxes, fees, or other charges for accessing the internet or commerce conducted via the internet. These laws or charges could limit the growth of internet-related commerce or communications generally, resulting in reductions in the demand for technology services such as ours. Also, such laws and regulations are often inconsistent and may be subject to amendment or re-interpretation, which may cause us to incur significant costs and expend significant effort to ensure compliance. These laws and regulations and resulting increased compliance and operational costs could materially harm our business, results of operations and financial condition.
In addition, the use of the internet as a business tool could be adversely affected due to delays in the development or adoption of new standards and protocols to handle increased demands of internet activity, security, reliability, cost, ease of use, accessibility, and quality of service. The performance of the internet and its acceptance as a business tool have been adversely affected by “ransomware,” “viruses,” “worms,” “malware,” “phishing attacks,” “data breaches” and similar malicious programs, behavior, and events, and the internet has experienced a variety of outages and other delays as a result of damage to portions of its infrastructure. If the use of the internet is adversely affected by these or any other issues, demand for our services and solutions could suffer, and our business, financial condition, results of operations and prospects may be materially adversely affected.
We and our clients may be subject to new and evolving privacy and data protection-related laws and regulations that impose obligations in connection with the collection, storage, use, processing, disclosure, protection, transmission, retention and disposal of personal, sensitive, regulated or confidential data.
The privacy and security of personal, sensitive, regulated or confidential data is a major focus in our industry and we and our clients that use our products are subject to federal, state, local and foreign privacy and data protection-related laws and regulations that impose obligations in connection with the collection, storage, use, processing, disclosure, protection, transmission, retention and disposal of personal, sensitive, regulated or confidential data. Laws and regulations governing data privacy, data protection and information security are constantly evolving and there has been an increasing focus on privacy and data protection issues with the potential to affect our business. The nature of our business exposes us to risks related to possible shortcomings in data protection and information security laws and regulations. Any perceived or actual unauthorized disclosure of personally identifiable information, whether through breach of our network by an unauthorized party, employee theft, misuse or error or otherwise, including the data protection of our clients, the end-consumers of our clients and employees or third parties, could harm our reputation, impair our ability to attract and retain our clients, or subject us to claims or litigation arising from damages suffered by individuals.
For additional information about applicable laws and regulations relating to data privacy, see “Business Overview — Regulatory Overview — Data protection and privacy.” We also may be bound by contractual obligations relating to our collection, use and disclosure of personal, financial and other data.
While we strive to comply with all applicable privacy, data protection and information security laws and regulations, as well as our contractual obligations, posted privacy policies and applicable industry standards, such laws, regulations, obligations and standards continue to evolve and are becoming increasingly complex, and sometimes conflict among the various jurisdictions and countries in which we operate, which makes compliance challenging and expensive. For example, we continue to see jurisdictions imposing data localization laws, which require personal information, or certain subcategories of personal information to be stored in the jurisdiction of origin. These regulations may inhibit our ability to expand into those markets or prohibit us from continuing to offer services in those markets without significant additional costs. In addition, any failure or perceived failure by us, or any third parties with whom we do business, to comply with laws, regulations, policies, industry standards or contractual or other legal obligations relating to privacy, data protection or information security may result in governmental investigations, inquiries, enforcement actions and prosecutions, private litigation, fines and penalties, adverse publicity or potential loss of business.
We expect that there will continue to be new proposed laws, rules of self-regulatory bodies, regulations and industry standards concerning privacy, data protection and information security in Brazil and other jurisdictions, and we cannot yet determine the impact such future laws, rules, regulations and standards may have on our business. Moreover, existing Brazilian and foreign privacy and data protection-related laws and regulations are evolving and subject to potentially differing interpretations, and various legislative and regulatory bodies may expand current or enact new laws and regulations regarding privacy and data protection-related matters. Additionally, our clients may be subject to differing privacy laws, rules and legislation, which may mean that they require us to be bound by varying contractual requirements application to certain other jurisdictions. Because global laws, regulations and industry standards concerning privacy and data security have continued to develop and evolve rapidly, compliance with such new laws or to changes to existing laws may impact our business and practices, require us to expend significant resources to adapt to these changes, or to stop offering our solutions in certain countries. These developments could adversely affect our business, results of operations and financial condition.
Changes in tax laws, tax incentives, benefits or differing interpretations of tax laws may adversely affect our results of operations.
We conduct business globally and file income tax returns in multiple jurisdictions. Our consolidated effective income tax rate could be materially adversely affected by several factors, including: changing tax laws, regulations and treaties, or the interpretation thereof; tax policy initiatives and reforms; the practices of tax authorities in jurisdictions in which we operate; the resolution of issues arising from tax audits or examinations and any related interest or penalties. Such changes may include (but are not limited to) the taxation of operating income, investment income, dividends received or (in the specific context of withholding tax) dividends paid.
In addition, our financial condition and results of operations may decline if certain tax incentives are not retained or renewed. For a discussion of certain key tax benefits, see “Taxation.” The Brazilian Federal Government also recently announced and presented to Congress (i) the Bill of Law No. 3,887/2020, focused on several changes on the taxes currently levied on revenues; and (ii) the Bill of Law No. 2,337/2021, the so called “second phase” of the envisaged Brazilian Tax Reform Plan, focused on income taxation, which includes several topics such as the taxation of dividends, adjustments in corporate taxation basis and rates of Brazilian entities, changes in the taxation of income and gains in connection with investments in the Brazilian capital markets, such as financial assets and investment funds, among others. While such legislation has not been enacted, and it is not possible to determine at this time, what changes to tax laws and regulations will come into effect (if any), any such change may have an adverse effect on our results and operations.
Our business, financial condition and results of operations may be adversely affected by the various conflicting and/or onerous legal and regulatory requirements imposed on us by the countries where we operate.
Since we maintain operations and provide services to clients throughout the world, we are subject to numerous, and sometimes conflicting, legal requirements on matters as diverse as import/export controls, content requirements, trade restrictions, tariffs, taxation, sanctions, government affairs, anti-bribery, whistle blowing, internal and disclosure control obligations, data protection and privacy and labor relations and work visa policies. Our failure to comply with these regulations in the conduct of our business could result in fines, penalties, criminal sanctions against us or our officers, disgorgement of profits, prohibitions on doing business and adverse impact on our reputation. Our failure to comply with these regulations in connection with the performance of our obligations to our clients could also result in liability for monetary damages, fines and/or criminal prosecution, unfavorable publicity, restrictions on our ability to process information and allegations by our clients that we have not performed our contractual obligations. Due to the varying degree of development of the legal systems of the countries in which we operate, local laws might be insufficient to defend us and preserve our rights.
We are also subject to risks relating to compliance with a variety of Brazilian national and local laws including multiple tax regimes, labor laws, employee health safety and wages and benefits laws.
In addition, we may, from time to time, be subject to litigation or administrative actions resulting from claims against us by current or former employees individually or as part of class actions, including claims of wrongful terminations, discrimination, misclassification or other violations of labor law or other alleged conduct. We may also, from time to time, be subject to litigation resulting from claims against us by third parties, including claims of breach of non-compete and confidentiality provisions of our employees’ former employment agreements with such third parties. Our failure to comply with applicable regulatory requirements could have a material adverse effect on our business, financial condition, results of operations and prospects.
As we expand into new industries and regions, we will likely need to comply with new requirements to compete effectively. The uncertainty and changes in the requirements of multiple jurisdictions may increase the cost of compliance, delay or reduce demand for our services, restrict our ability to offer services in certain locations, impact our clients’ ability to deploy our solutions in certain jurisdictions, or subject us to sanctions by national data protection regulators, all of which could harm our business, financial condition and results of operations. Additionally, although we endeavor to have our products and platform comply with applicable laws and regulations, these and other obligations may be modified, they may be interpreted and applied in an inconsistent manner from one jurisdiction to another, and they may conflict with one another, other regulatory requirements, contractual commitments or our internal practices.
We are subject to anti-corruption, anti-bribery, anti-money laundering and sanctions laws and regulations.
We operate in jurisdictions that have a high risk of corruption and we are subject to anti-corruption, anti-bribery anti-money laundering and sanctions laws and regulations, including the Brazilian Federal Law No. 12,846/2013, or the Clean Company Act, the United States Foreign Corrupt Practices Act of 1977, as amended, or the FCPA, and the Bribery Act 2010 of the United Kingdom, or the Bribery Act. Each of the Clean Company Act, the FCPA and the Bribery Act prohibit us and our employees and intermediaries from authorizing, promising, offering, or providing, directly or indirectly, improper or prohibited payments, or anything else of value, to government officials or other persons to obtain or retain business or gain some other business advantage, and impose liability against companies who engage in bribery of government officials, either directly or through intermediaries. We cannot assure that our compliance program, which is designed to manage the risks of doing business in light of these new and existing legal and regulatory requirements, will prevent violations of these laws and regulations. Violations of the anti-corruption, anti-bribery, anti-money laundering and sanctions laws and regulations could result in criminal liability, administrative and civil lawsuits, significant fines and penalties, forfeiture of significant assets, as well as reputational harm.
Regulators may increase enforcement of these obligations, which may require us to adjust our compliance and anti-money laundering programs, including the procedures we use to verify the identity of our clients and to monitor our transactions and transactions made through our platform. Regulators regularly reexamine the transaction volume thresholds at which we must obtain and keep applicable records, verify identities of clients, and report any change in such thresholds to the applicable regulatory authorities, which could result in increased costs in order to comply with these legal and regulatory requirements. Costs associated with fines or enforcement actions, changes in compliance requirements, or limitations on our ability to grow could harm our business, and any new requirements or changes to existing requirements could impose significant costs, result in delays to planned product improvements, make it more difficult for new clients to join our network and reduce the attractiveness of our products and services.
We may be subject to the Economic Substance Regime in the Cayman Islands.
On December 27, 2018, the Cayman Islands published The International Tax Co-operation (Economic Substance) Act (As Revised) and The International Tax Co-operation (Economic Substance) (Prescribed Dates) Regulations (As Revised) (together, the “Initial Act”). The Initial Act was amended by several amendment regulations, which were subsequently consolidated into the International Tax Co-operation (Economic Substance) Act (As Revised) (the “Economic Substance Act”). The Economic Substance Act is supplemented by the issuance of related Guidance on Economic Substance for Geographically Mobile Activities, version 3.0 of which was issued on July 13, 2020. The Issuer may be subject to the Economic Substance Act. Given the Economic Substance Act was only recently enacted, and our business activities and operations may change from time to time, it is difficult to predict what impact the adoption of the Economic Substance Act could have on us and our subsidiaries. For example, compliance with any applicable obligations may create significant additional costs that may be borne by us or otherwise affect our management and operation. We will continue to consider the implications of the Economic Substance Act on our business activities and operations and reserve the right to adopt such arrangements as we deem necessary or desirable to comply with any applicable requirements.
Our operations may be adversely affected by a failure to timely obtain or renew any licenses required to operate our occupied properties.
The operation of the properties we occupy or may come to occupy are subject to certain license and certification requirements under applicable law, including operation and use licenses (alvará de licença de uso e funcionamento) from the municipalities in which we operate and certificates of inspection from applicable local fire departments. Our operations may be adversely affected by a failure to timely obtain or renew any licenses required to operate our occupied properties. We have not yet obtained licenses for all of our occupied properties, and we cannot assure that we will be able to obtain the licenses for which we have applied in a timely manner, as applicable. In addition, we cannot assure you that we will obtain such licenses in a timely manner for the opening of new properties.
If we are unable to renew or obtain such licenses, we may be subject to certain penalties, which include the imposition of fines and/or the suspension or termination of our operations at the respective property. The imposition of such penalties, or, in extreme scenarios, the sealing off of the premises by relevant public authorities pending compliance with all the requirements demanded by the municipalities and fire departments, may adversely affect our operations and our ability to generate revenues at the relevant location.
We may be subject to various legal proceedings which could adversely affect our business, financial condition or results of operations.
We may be involved in various legal proceedings, investigations and similar matters from time to time arising from tax, civil and labor claims, among others. Such matters can be time-consuming, divert management’s attention and resources and cause us to incur significant expenses. Any insurance or indemnities that we may have may not cover all claims that may be asserted against us, and any claims asserted against us, regardless of merit or eventual outcome, may harm our reputation. If we are unsuccessful in our defense in these legal proceedings, we may be forced to pay damages or fines, enter into consent decrees or change our business practices, any of which could adversely affect our business, financial condition or results of operations.
Certain Risks Relating to Brazil
Exchange rate instability may have adverse effects on the Brazilian economy, us and the price of our Class A common shares.
The Brazilian currency has been historically volatile and has been devalued frequently over the past three decades. Throughout this period, the Brazilian government has implemented various economic plans and used various exchange rate policies, including sudden devaluations, periodic mini-devaluations (during which the frequency of adjustments has ranged from daily to monthly), exchange controls, dual exchange rate markets and a floating exchange rate system. Although long-term depreciation of the real is generally linked to the rate of inflation in Brazil, depreciation of the real occurring over shorter periods of time has resulted in significant variations in the exchange rate between the real, the U.S. dollar and other currencies. The real/U.S. dollar exchange rate reported by the Central Bank was R$4.031 per U.S.$1.00 on December 31, 2019, which reflected a 4.0% depreciation in the real against the U.S. dollar during 2019. The real/U.S. dollar exchange rate reported by the Central Bank was R$5.197 per U.S.$1.00 on December 31, 2020, which reflected a 28.9% depreciation in the real against the U.S. dollar during 2020. The real/U.S. dollar exchange rate reported by the Central Bank was R$5.580 per U.S.$1.00 on December 31, 2021, which reflected a 7.4% depreciation in the real against the U.S. dollar during 2021. There can be no assurance that the real will not again depreciate against the U.S. dollar or other currencies in the future.
A devaluation of the real relative to the U.S. dollar could create inflationary pressures in Brazil and cause the Brazilian government to, among other measures, increase interest rates. Any depreciation of the real may generally restrict access to the international capital markets. It would also reduce the U.S. dollar value of our results of operations. Restrictive macroeconomic policies could reduce the stability of the Brazilian economy and harm our results of operations and profitability. In addition, domestic and international reactions to restrictive economic policies could have a negative impact on the Brazilian economy. These policies and any reactions to them may harm us by curtailing access to foreign financial markets and prompting further government intervention. A devaluation of the real relative to the U.S. dollar may also, as in the context of the current economic slowdown, decrease consumer spending, increase deflationary pressures and reduce economic growth.
On the other hand, an appreciation of the real relative to the U.S. dollar and other foreign currencies may deteriorate the Brazilian foreign exchange current accounts. Depending on the circumstances, either depreciation or appreciation of the real relative to the U.S. dollar and other foreign currencies could restrict the growth of the Brazilian economy, as well as our business, results of operations and profitability.
The Brazilian federal government has exercised, and continues to exercise, significant influence over the Brazilian economy. This involvement as well as Brazil’s political and economic conditions could harm us and the price of our Class A common shares.
The Brazilian federal government frequently exercises significant influence over the Brazilian economy and occasionally makes significant changes in policy and regulations. The Brazilian government’s actions to control inflation and other policies and regulations have often involved, among other measures, increases or decreases in interest rates, changes in fiscal policies, wage and price controls, foreign exchange rate controls, blocking access to bank accounts, currency devaluations, capital controls and import and export restrictions. We have no control over and cannot predict what measures or policies the Brazilian government may take in the future. We and the market price of our securities may be harmed by changes in Brazilian government policies, as well as general economic factors, including, without limitation:
● expansion and contraction of the Brazilian economy, measured by the gross domestic product growth rates, including by virtue of the COVID-19 pandemic;
● growth or downturn of the Brazilian economy;
● interest rates and monetary policies;
● exchange rates and currency fluctuations;
● inflation;
● liquidity of the domestic capital and lending markets;
● import and export controls;
● exchange controls and restrictions on remittances abroad and payments of dividends;
● modifications to laws and regulations according to political, social and economic interests;
● fiscal policy and changes in tax laws;
● economic, political and social instability, including general strikes and mass demonstrations;
● the regulatory framework governing the education industry;
● labor and social security regulations;
● energy and water shortages and rationing;
● commodity prices; and
● other political, diplomatic, social and economic developments in or affecting Brazil.
Uncertainty about the implementation of changes by the Federal Government generates instability in the Brazilian economy, as well as greater volatility in the domestic capital market and in the securities of issuing companies. This scenario is further aggravated when analyzed together with the impacts of the COVID-19 pandemic, which may adversely affect our business, operations, results and share price.
In addition, the Brazilian economy has been affected by recent political events that have also affected investor and public confidence, thereby adversely affecting Brazil’s economic performance. The Brazilian markets have seen an increase in volatility due to the uncertainties resulting from investigations in progress conducted by the Brazilian Federal Police and by the Brazilian Federal Prosecutor’s Office. These investigations have affected the country’s economic and political environment. In addition, public disagreements between the Brazilian president and members of the Brazilian Supreme Court bring uncertainty around an already unstable political environment in Brazil. These uncertainties are exacerbated in 2022, given the national elections scheduled for the second half of the year.
Furthermore, the federal government’s difficulty in having a majority in the National Congress could result in a deadlock, political unrest and massive demonstrations and/or strikes, which may adversely affect our business, financial condition and results of operations. Uncertainties regarding the current government’s implementation of changes in monetary, fiscal and social security policies, as well as the relevant legislation, may contribute to economic instability. These uncertainties and new measures may increase the volatility of the Brazilian securities market.
The president of Brazil has the power to establish policies and perform governmental acts related to the conduction of the Brazilian economy and, consequently, affect the operations and financial performance of companies, including ourselves. We cannot predict which policies the President will adopt, much less whether such policies or changes in current policies could have an adverse effect on us or on the Brazilian economy. Any lack of decision by the Brazilian government to implement changes in certain policies or regulations may contribute to economic uncertainty for investors with respect to Brazil and increase market volatility.
These uncertainties, the recession with a slow recovery period in Brazil and other future developments in the Brazilian economy may adversely affect our business and, consequently, our results of operations, and may also adversely affect the trading price of our shares.
Risks related to the global economy may affect the perception of risks in other countries, particularly in the United States, Europe and emerging markets, adversely affecting the Brazilian economy and the market price of securities of issuers with principal operations in Brazil, including our Class A common shares.
The market value of securities of an issuer with principal operations in Brazil is affected to varying degrees by economic and market conditions in other countries, including the United States, European countries and other Latin American and emerging market countries. Although economic conditions in the United States and European countries may differ significantly from economic conditions in Brazil, investors’ reactions to developments in these countries may adversely affect the market value of securities of issuers with principal operations in Brazil, including our common shares. Moreover, crises or significant developments in other countries and capital markets may diminish investors’ interest in securities of issuers with principal operations in Brazil, including our Class A common shares, and their trading price, limiting or preventing our access to capital markets and to funds to finance our operations on acceptable terms.
Economic, health, political, environmental or any other type of crisis that can impact the Brazilian economy can affect the purchasing power of the population, which can adversely affect us.
Economic, health, political, environmental or any other type of crisis that can impact the Brazilian economy can affect the purchasing power of the Brazilian population, which — in turn — can adversely affect us. Our performance depends on the overall health and growth of the Brazilian economy. Brazilian GDP growth has fluctuated over the past few years, with contractions of 3.5% and 3.3% in 2015 and 2016, respectively, followed by growth of 1.3% in 2017, 1.8% in 2018, 1.1% for the year ended December 31, 2019, a contraction of 4.1% for the year ended December 31, 2020 and a growth of 4.6% for the year ended December 31, 2021. Growth is limited by inadequate infrastructure, including potential energy shortages and deficient transportation, logistics and telecommunication sectors, general strikes, the lack of a qualified labor force, and the lack of private and public investments in these areas, which limit productivity and efficiency. Any of these factors could lead to labor market volatility and generally impact income, purchasing power and consumption levels, which could limit growth and ultimately have a material adverse effect on us.
The financial crisis that originated in the United States in the third quarter of 2008, for example, caused the dollar to rise against the real. This lead to a restriction of credit in the domestic market, increased unemployment rates, increased defaults, and, consequently, a reduction in consumption in Brazil. Similarly, the political-economic crisis experienced in Brazil between 2013-2016 had a relevant impact on unemployment rates, decreased the purchasing power of the population and, consequently, decreased the consumption in the country.
Recently, the world has been affected by the COVID-19 pandemic which has caused global negative economic impacts. As a result of the pandemic, we believe that the purchasing power of the Brazilian population will decrease, which could cause a significant reduction in consumption and adversely affect us.
Inflation and certain measures by the Brazilian government to curb inflation have historically harmed the Brazilian economy and Brazilian capital markets, and high levels of inflation in the future would harm our business and the price of our Class A common shares.
In the past, prior to 1994, Brazil experienced extremely high rates of inflation. Inflation and some of the measures taken by the Brazilian government in an attempt to curb inflation have had significant negative effects on the Brazilian economy generally. Inflation policies adopted to curb inflationary pressures and uncertainties regarding possible future governmental intervention have contributed to economic uncertainty and heightened volatility in the Brazilian capital markets.
According to the National Consumer Price Index (Índice Nacional de Preços ao Consumidor Amplo, “IPCA”), which is published by the Brazilian Institute for Geography and Statistics (Instituto Brasileiro de Geografia e Estatística, or IBGE), Brazilian inflation rates were 10.06%, 4.52%, 4.31%, and 3.75%, as of December 31, 2021, 2020, 2019 and 2018, respectively. Brazil may experience high levels of inflation in the future and inflationary pressures may lead to the Brazilian government’s intervening in the economy and introducing policies that could harm our business and the price of our Class A common shares. In the past, the Brazilian government’s interventions included the maintenance of a restrictive monetary policy with high interest rates that restricted credit availability and reduced economic growth, causing volatility in interest rates. For example, the official interest rate in Brazil oscillated from 14.25% as of December 31, 2015 to 6.50% as of December 31, 2018, as established by the Monetary Policy Committee (Comitê de Política Monetária do Banco Central do Brasil - COPOM). As of August 5, 2020, the SELIC rate target was set at 2.0% p.a. On March 17, 2021, the SELIC rate target was raised to 2.75% p.a. with further increases on May 5, 2021 (3.50% p.a.), June 16, 2021 (4.25% p.a.), August 4, 2021 (5.25% p.a.), September 22, 2021(6.25% p.a), October 27, 2021 (7.75% p.a), December 8, 2021 (9.25% p.a), February 2, 2022 (10.75% p.a) and March 16, 2022 (11.75% p.a).
Conversely, more lenient government and Central Bank policies and interest rate decreases have triggered and may continue to trigger increases in inflation, and, consequently, growth volatility and the need for sudden and significant interest rate increases, which could negatively affect us and increase our indebtedness.
In addition, our employees’ salaries are adjusted annually according to inflation indexes and based on labor union negotiations. Therefore, an increase in inflation may increase our costs and expenses and reduce our profitability metrics.
Any further downgrading of Brazil’s credit rating could reduce the trading price of our Class A common shares.
Credit ratings affect the perception of risk of investors. Rating agencies regularly review Brazil’s sovereign credit ratings based on a number of factors, including macroeconomic trends, tax and budgetary conditions, indebtedness metrics and the prospect of changes in any of these factors.
Rating agencies started to review Brazil’s sovereign ratings in September 2015. Subsequently, Brazil lost its investment grade, according to the credit rating reviewed by the three main credit rating agencies. After an initial downgrade in September 2015, Standard & Poor’s downgraded again from BB-plus to BB and, in January 2018, downgraded Brazil’s sovereign credit rating from BB to BB-minus, in addition to changing the outlook from negative to stable. In December 2015, Moody’s placed Brazil’s Baa3 issuer and bond rating under review for a downgrade and subsequently downgraded Brazil’s ratings to below investment grade, or Ba2, with a negative outlook. In April 2018, Moody’s maintained Brazil’s Ba2 rating and changed the outlook from negative to stable. In December 2015, Fitch downgraded Brazil’s sovereign credit rating to BB- plus, with a negative outlook, and made a further downgrade in May 2016 to BB with a negative outlook, which was maintained in 2017. In February 2018, Fitch further downgraded Brazil’s sovereign credit rating to BB-minus, with a stable outlook, which was maintained in 2020.
As of the date of this annual report, Brazil’s sovereign credit ratings were BB- stable, Ba2 stable and BB-negative by Standard & Poor’s and Moody’s and Fitch, respectively. We cannot assure you that rating agencies will maintain Brazil’s sovereign credit ratings and any downgrades may adversely affect us.
Certain Risks Relating to Our Class A Common Shares
An active trading market for our Class A common shares may not be sustainable. If an active trading market is not maintained, investors may not be able to resell their shares and our ability to raise capital in the future may be impaired.
Although our Class A common shares are listed and being traded on the NYSE, an active trading market for our shares may not be maintained. If an active market for our Class A common shares is not maintained, it may be difficult for you to sell shares without depressing the market price for the shares or at all. An inactive trading market may also impair our ability to raise capital to continue to fund operations by selling shares and may impair our ability to acquire other companies or technologies by using our shares as consideration. In addition to the risks described above, the market price of our Class A common shares may be influenced by many factors, some of which are beyond our control, including:
| ● | actual or forecast fluctuations in revenue or in other operating and financial results; |
| ● | variations between our actual operating results and the expectations of securities analysts, investors and the financial community; |
| ● | action by securities analysts who begin or continue to cover us, changes in the financial estimates of any securities analysts who follow our company or our failure to meet these estimates or investors’ expectations; |
| ● | announcements by us or by our competitors of significant products or features, technical innovations, acquisitions, strategic partnerships, joint ventures or capital commitments; |
| ● | negative media coverage or publicity affecting us, whether true or not; |
●
| changes in the operating performance and stock market valuations of digital transformation companies in general, including our competitors; |
●
| fluctuations in the price and volume of the stock market in general, including as a result of trends in the economy as a whole; |
●
| threats of lawsuits and actions brought against us or decided against us; |
| ● | developments in the legislation or regulatory action, including interim or final decisions by judicial or regulatory bodies; |
●
| changes in accounting standards, policies, guidelines, interpretations or principles; |
| ● | any significant changes in our board of directors or management; |
●
| any security incidents or public reports of security incidents related to us or our sector; |
●
| statements, comments or opinions from public officials that our offerings are or may be illegal, regardless of interim or final decisions of judicial or regulatory bodies; and |
●
| other events or factors, including those resulting from war, terrorist incidents, natural disasters or responses to such events. |
In addition, price and volume fluctuations in the stock markets have affected and continue to affect the stock prices of many technology companies. Often, their stock prices fluctuate in ways that are unrelated or disproportionate to the operating performance of companies. In some instances, shareholders have filed a class action lawsuit after periods of market volatility. If we are involved in litigation regarding securities, this could subject us to substantial costs, divert resources and management attention from our business and seriously undermine our business. In addition, the occurrence of any of the factors listed above, along with others, may cause our share price to drop significantly and there is no guarantee that our share price will recover.
The dual class structure of our common stock has the effect of concentrating voting control with our Class B Shareholders and certain of our Class B Shareholders will have the right to appoint members to our board of directors; this will limit or preclude your ability to influence corporate matters.
Each Class A common share entitles its holder to one vote per share, and each Class B common share entitles its holder to ten votes per share, so long as the total number of the issued and outstanding Class B common shares is at least 10% of the total number of shares outstanding. Due to the ten-to-one voting ratio between our Class B and Class A common shares, the beneficial owners of our Class B common shares (currently comprised of the Class B Shareholders) are expected to collectively continue to control a majority of the combined voting power of our common shares so long as the total number of the issued and outstanding Class B common shares is at least 10% of the total number of shares outstanding. In addition, in connection with the initial public offering, we entered into a shareholders’ agreement with our founder shareholders and the investment vehicles of Advent International (“Advent Managed Fund LLCs”) pursuant to which our founder shareholders and the Advent Managed Fund LLCs will have the right to appoint directors to our board. See “Principal and Selling Shareholders — Shareholders’ Agreement.”
In addition, our Articles of Association provide that Class B common shares may only be issued pursuant to (1) a share split, subdivision of shares or similar transaction or where a dividend or other distribution is paid by the issue of shares or rights to acquire shares or following capitalization of profits, (2) subject to the Class B Shareholder Consent, a merger, consolidation, or other business combination involving the issuance of Class B common shares as full or partial consideration, or (3) an issuance of Class A common shares, whereby holders of the Class B common shares are entitled to purchase a number of Class B common shares that would allow them to maintain their proportional ownership interests in CI&T (following an offer by us to each holder of Class B common shares to issue to such holder, upon the same economic terms and at the same price, such number of Class B common shares as would ensure such holder may maintain a proportional ownership interest in CI&T pursuant to our Articles of Association), provided that such rights to purchase additional Class B common shares may only be exercised with Class B Shareholder Consent.
Future transfers by holders of Class B common shares will generally result in those shares converting to Class A common shares, subject to limited exceptions, such as certain transfers effected to permitted transferees or for estate planning or charitable purposes. The conversion of Class B common shares to Class A common shares will have the effect, over time, of increasing the relative voting power of those holders of Class B common shares who retain their shares in the long term.
In light of the above provisions relating to the issuance of additional Class B common shares, the fact that future transfers by holders of Class B common shares will generally result in those shares converting to Class A common shares, subject to limited exceptions as provided in the Articles of Association; as well as the ten-to-one voting ratio of our Class B common shares and Class A common shares, holders of our Class B common shares will in many situations continue to maintain control of all matters requiring shareholder approval. This concentrated control will limit or preclude your ability to influence corporate matters for the foreseeable future. For a description of our dual class structure, see “Additional Information — B. Memorandum and Articles of Association — Description of Share Capital — Voting Rights.”
Class A common shares eligible for future sale may cause the market price of our Class A common shares to drop significantly.
The market price of our Class A common shares may decline as a result of sales of a large number of our Class A common shares in the market (including Class A common shares issuable upon conversion of Class B common shares) or the perception that these sales may occur. These sales, or the possibility that these sales may occur, also might make it more difficult for us to sell equity securities in the future at a time and at a price that we deem appropriate.
As of the date of this annual report, we have 15,654,144 Class A common shares and 117,197,896 Class B common shares outstanding. Our shareholders or entities controlled by them or their permitted transferees will, subject to the lock-up agreements described below, be able to sell their shares in the public market from time to time without registering them, subject to certain limitations on the timing, amount and method of those sales imposed by regulations promulgated by the SEC. If any of our shareholders, the affiliated entities controlled by them or their respective permitted transferees were to sell a large number of their Class A common shares, the market price of our Class A common shares may decline significantly. In addition, the perception in the public markets that sales by them might occur may also cause the trading price of our Class A common shares to decline.
We have agreed with the underwriters in our initial public offering, subject to certain exceptions, not to offer, sell or dispose of any shares in our share capital or securities convertible into or exchangeable or exercisable for any shares in our share capital during the 180-day period following the date of our initial public offering. Our directors, executive officers and substantially all of our pre-IPO equity holders have agreed to similar lock-up provisions for up to 180 days following the date of the initial public offering, subject to potential early release. The terms of the lock-up agreements will expire on 35% of each shareholder’s Class A common shares or securities convertible into or exchangeable for Class A common shares (including our Class B commons shares) subject to the lock-up agreement (provided, that if the shareholder is a member of our board of directors (excluding affiliated funds) or management team, then such amount is 15%) if certain conditions are met and will become available for sale prior to the opening of trading on the first full trading day following the date on which such conditions are satisfied. In addition, the company lock-up is subject to exceptions including the right for our company to issue new shares if we carry out an acquisition or enter into a merger, joint venture or strategic participation. Notwithstanding the above, Goldman Sachs & Co. LLC and Citigroup Global Markets, Inc., may, as representatives of the underwriters and in their sole discretion and without notice, release all or any portion of the shares from the restrictions in any of the lock-up agreements described above.
All remaining Class A common shares or securities convertible into or exchangeable for Class A common shares (including our Class B commons shares) subject to the lock-up agreement and not released on the early lock-up expiration date will be released prior to the opening of trading on the first full trading day following the period of 180 days after the date of our initial public offering.
Sales of a substantial number of our Class A common shares upon expiration of the lock-up agreements, the perception that such sales may occur, or early release of these lock-up periods, could cause our market price to fall or make it more difficult for you to sell your Class A common shares at a time and price that you deem appropriate.
We are a Cayman Islands exempted company with limited liability. The rights of our shareholders, including with respect to fiduciary duties and corporate opportunities, may be different from the rights of shareholders of companies incorporated under and governed by the laws of U.S. jurisdictions.
We are a Cayman Islands exempted company with limited liability. Our corporate affairs are governed by our Articles of Association, the Companies Act and by the laws of the Cayman Islands. The rights of shareholders and the responsibilities of members of our board of directors may be different from the rights of shareholders and responsibilities of directors in companies governed by the laws of U.S. jurisdictions.
In particular, as a matter of Cayman Islands law, directors and officers owe the following fiduciary duties: (i) duty to act in good faith in what the director or officer believes to be in the best interests of the company as a whole; (ii) duty to exercise powers for the purposes for which those powers were conferred and not for a collateral purpose; (iii) directors should not improperly fetter the exercise of future discretion; (iv) duty to exercise powers fairly as between different sections of shareholders; (v) duty to exercise independent judgment; and (vi) duty not to put themselves in a position in which there is a conflict between their duty to the company and their personal interests. With respect to the duty of directors to avoid conflicts of interest, our Articles of Association vary from the applicable provision of Cayman Islands law mentioned above by providing that a director must disclose the nature and extent of his or her interest in any contract or arrangement, and following such disclosure and subject to any separate requirement under applicable law or the listing rules of the NYSE, and unless disqualified by the chairman of the relevant meeting, such director may vote in respect of any transaction or arrangement in which he or she is interested and may be counted in the quorum at the meeting. In addition to the above, under Cayman Islands law, directors also owe a duty of care that is not fiduciary in nature. This duty has been defined as a requirement to act as a reasonably diligent person having both the general knowledge, skill and experience that may reasonably be expected of a person carrying out the same functions as are carried out by that director in relation to the company and the general knowledge, skill and experience that director has. As set out above, directors have a duty not to put themselves in a position of conflict and this includes a duty not to engage in self-dealing, or to otherwise benefit as a result of their position. However, in some instances what would otherwise be a breach of this duty can be forgiven and/or authorized in advance by the shareholders provided that there is full disclosure by the directors. This can be done by way of permission granted in the memorandum and articles of association or alternatively by shareholder approval at general meetings, and our Articles of Association provide for such permission in relation to conflicts of interest as noted above. Accordingly, as a result of multiple business affiliations, our officers and directors may have similar legal obligations relating to presenting business opportunities meeting the above-listed criteria to multiple entities. In addition, conflicts of interest may arise when our board evaluates a particular business opportunity with respect to the above- listed criteria. We cannot assure you that any of the above mentioned conflicts will be resolved in our favor. Furthermore, each of our officers and directors has pre-existing fiduciary obligations to other businesses of which they are officers or directors. Conversely, under Delaware corporate law, a director has a fiduciary duty to the corporation and its stockholders (made up of two components) and the director’s duties prohibit self-dealing by a director and mandate that the best interest of the corporation and its shareholders take precedence over any interest possessed by a director, officer or controlling shareholder and not shared by the shareholders generally. See “Description of Share Capital — Principal Differences between Cayman Islands and U.S. Corporate Law.”
We may lose our foreign private issuer status, which would then require us to comply with the Exchange Act’s domestic reporting regime and cause us to incur significant legal, accounting and other expenses.
In order to maintain our current status as a foreign private issuer, either (a) more than 50% of our Class A common shares must be either directly or indirectly owned of record by non-residents of the United States or (b) (i) a majority of our executive officers or directors may not be U.S. citizens or residents, (ii) more than 50% of our assets cannot be located in the United States and (iii) our business must be administered principally outside the United States. If we lose this status, we would be required to comply with the Exchange Act reporting and other requirements applicable to U.S. domestic issuers, which are more detailed and extensive than the requirements for foreign private issuers. We may also be required to make changes in our corporate governance practices in accordance with various SEC and NYSE rules. The regulatory and compliance costs to us under U.S. securities laws if we are required to comply with the reporting requirements applicable to a U.S. domestic issuer may be significantly higher than the costs we will incur as a foreign private issuer. As a foreign private issuer, we are permitted to, and we will, rely on exemptions from certain NYSE corporate governance standards applicable to U.S. issuers, including the requirement that a majority of an issuer’s directors consist of independent directors. This may afford less protection to holders of our Class A common shares.
The NYSE equity rules require listed companies to have, among other things, a majority of independent members in their board, and to have independent director oversight of executive compensation, nomination of directors and corporate governance matters. As a foreign private issuer, however, we are permitted to, and we will, follow home country practice in lieu of the above requirements. See “Additional Information — B. Memorandum and Articles of Association — Description of Share Capital — Principal Differences between Cayman Islands and U.S. Corporate Law.”
Our Articles of Association contain anti-takeover provisions that may discourage a third-party from acquiring us and adversely affect the rights of holders of our Class A common shares.
Our Articles of Association contain certain provisions that could limit the ability of others to acquire control of us, including a provision that grants authority to our board of directors to establish and issue from time to time one or more series of preferred shares without action by our shareholders and to determine, with respect to any series of preferred shares, the terms and rights of that series. In addition, our capital structure concentrates ownership of voting rights in the hands of the holders of Class B common shares. These provisions could have the effect of depriving our shareholders of the opportunity to sell their shares at a premium over the prevailing market price by discouraging third parties from seeking to obtain our control in a tender offer or similar transactions.
We do not anticipate paying any cash dividends in the foreseeable future.
We currently intend to retain our future earnings, if any, for the foreseeable future, to fund the operation of our business and future growth. We do not intend to pay any dividends to holders of our Class A common shares. As a result, capital appreciation in the price of our Class A common shares, if any, will be your only source of gain on an investment in our Class A common shares.
Holders of our Class B common shares have preemptive rights to acquire shares that we may sell in the future, which preemptive rights are only exercisable with Class B Shareholder Consent, which may impair our ability to raise funds.
Under our Memorandum and Articles of Association, the Class B Shareholders are entitled to preemptive rights to purchase additional common shares in the event that there is an increase in our share capital and additional common shares are issued (which may only be exercised with Class B Shareholder Consent), upon the same economic terms and at the same price, in order to maintain their proportional ownership interests. The exercise by holders of our Class B common shares of their preemptive rights may impair our ability to raise funds, or adversely affect the terms on which we are able to raise funds, as we may not be able to offer to new investors the quantity of our shares that they may desire to purchase. For more information see “Additional Information — B. Memorandum and Articles of Association — Description of Share Capital — Preemptive or Similar Rights.”
If securities or industry analysts do not publish research, or publish inaccurate or unfavorable research, about our business, the price of our Class A common shares and our trading volume could decline.
The trading market for our Class A common shares will depend in part on the research and reports that securities or industry analysts publish about us or our business. Securities and industry analysts do not currently, and may never, publish research on our company. If no or too few securities or industry analysts commence coverage of our company, the trading price for our Class A common shares would likely be negatively affected. In the event securities or industry analysts initiate coverage, if one or more of the analysts who cover us downgrade our Class A common shares or publish inaccurate or unfavorable research about our business, the price of our Class A common shares would likely decline. If one or more of these analysts cease coverage of our company or fail to publish reports on us regularly, demand for our Class A common shares could decrease, which might cause the price of our Class A common shares and trading volume to decline. Our dual class capital structure means our shares will not be included in certain indices. We cannot predict the impact this may have on our share price.
In 2017, FTSE Russell, S&P Dow Jones and MSCI announced changes to their eligibility criteria for inclusion of shares of public companies on certain indices to exclude companies with multiple classes of common shares from being added to such indices. FTSE Russell announced plans to require new constituents of its indices to have at least five percent of their voting rights in the hands of public stockholders, whereas S&P Dow Jones announced that companies with multiple share classes, such as ours, will not be eligible for inclusion in the S&P 500, S&P MidCap 400 and S&P SmallCap 600, which together make up the S&P Composite 1500. MSCI also opened public consultations on their treatment of no-vote and multi-class structures and has temporarily barred new multi-class listings from its ACWI Investable Market Index and U.S. Investable Market 2500 Index. We cannot assure you that other stock indices will not take a similar approach to FTSE Russell, S&P Dow Jones and MSCI in the future. Under the announced policies, our dual class capital structure would make us ineligible for inclusion in any of these indices and, as a result, mutual funds, exchange-traded funds and other investment vehicles that attempt to passively track these indices will not invest in our shares. These policies are new and it is unclear what effect, if any, they will have on the valuations of publicly traded companies excluded from the indices, but it is possible that they may depress these valuations compared to those of other similar companies that are included. Exclusion from indices could make our Class A common shares less attractive to investors and, as a result, the market price of our Class A common shares could be adversely affected.
As a foreign private issuer and an “emerging growth company” (as defined in the JOBS Act), we have different disclosure and other requirements than U.S. domestic registrants and non-emerging growth companies.
As a foreign private issuer and emerging growth company, we are subject to different disclosure and other requirements than domestic U.S. registrants and non-emerging growth companies. For example, as a foreign private issuer, in the United States, we are not subject to the same disclosure requirements as a domestic U.S. registrant under the Exchange Act, including the requirements to prepare and issue quarterly reports on Form 10-Q or to file current reports on Form 8-K upon the occurrence of specified significant events, the proxy rules applicable to domestic U.S. registrants under Section 14 of the Exchange Act or the insider reporting and short-swing profit rules applicable to domestic U.S. registrants under Section 16 of the Exchange Act. In addition, we intend to rely on exemptions from certain U.S. rules which will permit us to follow Cayman Islands legal requirements rather than certain of the requirements that are applicable to U.S. domestic registrants. Such Cayman Islands legal requirements may differ significantly from those that are applicable to U.S. domestic registrants (for example, as noted below) and accordingly, shareholders may be afforded less protection than they otherwise would have had if we were a U.S. domestic registrant.
We follow Cayman Islands laws and regulations that are applicable to Cayman Islands companies. However, Cayman Islands laws and regulations applicable to Cayman Islands companies do not contain any provisions comparable to the U.S. proxy rules, the U.S. rules relating to the filing of reports on Form 10-Q or 8-K or the U.S. rules relating to liability for insiders who profit from trades made in a short period of time, as referred to above. Furthermore, foreign private issuers are required to file their annual report on Form 20-F within 120 days after the end of each fiscal year, while U.S. domestic issuers that are accelerated filers are required to file their annual report on Form 10-K within 75 days after the end of each fiscal year. Foreign private issuers are also exempt from Regulation Fair Disclosure, aimed at preventing issuers from making selective disclosures of material information, although we will be subject to Cayman Islands laws and regulations having substantially the same effect as Regulation Fair Disclosure. As a result of the above, even though we are required to file reports on Form 6-K disclosing the limited information which we have made or are required to make public pursuant to Cayman Islands law, or are required to distribute to shareholders generally, and that is material to us, you may not receive information of the same type or amount that is required to be disclosed to shareholders of a U.S. company.
Our shareholders may face difficulties in protecting their interests because we are a Cayman Islands exempted company.
Our corporate affairs are governed by our Articles of Association, by the Companies Act (As Revised) of the Cayman Islands and the common law of the Cayman Islands. The rights of our shareholders and the fiduciary responsibilities of our directors under the laws of the Cayman Islands are not as clearly established as they would be under statutes or judicial precedent in some jurisdictions in the United States. Therefore, you may have more difficulty protecting your interests than would shareholders of a corporation incorporated in a jurisdiction in the United States, due to the comparatively less prescriptive nature of Cayman Islands law in this area.
While Cayman Islands law allows a dissenting shareholder to express the shareholder’s view that a court sanctioned reorganization of a Cayman Islands company would not provide fair value for the shareholder’s shares, Cayman Islands statutory law does not specifically provide for shareholder appraisal rights in connection with a merger or consolidation of a company. This may make it more difficult for you to assess the value of any consideration you may receive in a merger or consolidation or to require that the acquirer gives you additional consideration if you believe the consideration offered is insufficient. However, Cayman Islands statutory law provides a mechanism for a dissenting shareholder in a merger or consolidation that does not take place by way of a scheme of arrangement to apply to the Grand Court of the Cayman Islands for a determination of the fair value of the dissenter’s shares if it is not possible for the company and the dissenter to agree on a fair price within the time limits prescribed.
Shareholders of Cayman Islands exempted companies (such as us) have no general rights under Cayman Islands law to inspect corporate records and accounts or to obtain copies of lists of shareholders. Our directors have discretion under our Articles of Association to determine whether or not, and under what conditions, our corporate records may be inspected by our shareholders, but are not obliged to make them available to our shareholders. This may make it more difficult for you to obtain information needed to establish any facts necessary for a shareholder motion or to solicit proxies from other shareholders in connection with a proxy contest.
United States civil liabilities and certain judgments obtained against us by our shareholders may not be enforceable.
We are a Cayman Islands exempted company and substantially all of our assets are located outside of the United States. In addition, the majority of our directors and officers are nationals and residents of countries other than the United States. A substantial portion of the assets of these persons is located outside of the United States. As a result, it may be difficult to effect service of process within the United States upon these persons. It may also be difficult to enforce in U.S. courts judgments obtained in U.S. courts based on the civil liability provisions of the U.S. federal securities laws against us and our officers and directors who are not resident in the United States and the substantial majority of whose assets are located outside of the United States.
Further, it is unclear if original actions predicated on civil liabilities based solely upon U.S. federal securities laws are enforceable in courts outside the United States, including in the Cayman Islands and Brazil. Courts of the Cayman Islands may not, in an original action in the Cayman Islands, recognize or enforce judgments of U.S. courts predicated upon the civil liability provisions of the securities laws of the United States or any state of the United States on the grounds that such provisions are penal in nature. Although there is no statutory enforcement in the Cayman Islands of judgments obtained in the United States, courts of the Cayman Islands will recognize and enforce a foreign judgment of a court of competent jurisdiction if such judgment is final, for a liquidated sum, provided it is not in respect of taxes or a fine or penalty, is not inconsistent with a Cayman Islands’ judgment in respect of the same matters, and was not obtained in a manner which is contrary to the public policy of the Cayman Islands. In addition, a Cayman Islands court may stay proceedings if concurrent proceedings are being brought elsewhere.
Judgments of Brazilian courts to enforce our obligations with respect to our Class A common shares may be payable only in reais, and the applicable exchange rate in force at the time may not offer non-Brazilian investors full compensation for any claim arising from our obligations.
Most of our assets are located in Brazil. If proceedings are brought in the courts of Brazil seeking to enforce our obligations in respect of our Class A common shares, we may not be required to discharge our obligations in a currency other than the real. Under Brazilian exchange control laws, an obligation in Brazil to pay amounts denominated in a currency other than the real may only be satisfied in Brazilian currency at the exchange rate, as determined by the Central Bank, in effect on the date (1) of actual payment, (2) on which such judgment is rendered, or (3) on which collection or enforcement proceedings are started against us, and such amounts are then adjusted to reflect exchange rate variations through the effective payment date. The then-prevailing exchange rate may not afford non-Brazilian investors with full compensation for any claim arising out of or related to our obligations under the Class A common shares.
ITEM 4. INFORMATION ON THE COMPANY
- History and Development of the Company
CI&T Software S.A. was founded in 1995 in Brazil and began working with research and development (R&D) companies for software development before expanding to provide technical services to “nearshore” customers. Over the course of more than 26 years of operations, we have demonstrated a strong track record of revenue growth and have grown to provide services to a client list consisting of over 100 large enterprises and fast growing companies from several industries across the globe.
During this period, we evolved from a niche R&D internet software company operating in Brazil to a global end-to-end digital transformation specialist impacting some of the world’s leading brands by combining digital strategy with customer-centric design and best-in-class software engineering. From our initial operations mainly in the Brazilian market, we began to work with large companies and later expanded our business to include development centers located in Brazil and China, in order to accommodate our clients worldwide. As of December 31, 2021, our clients are located mainly in the United States and Brazil, which accounted for 47.4% and 48.1% of our Net revenue for the year ended December 31, 2021, respectively.
In 2019, funds managed by Advent International (“Advent”), one of the largest and most experienced global private equity firm and asset manager, raised funds with investors which, made a strategic minority investment in CI&T through Advent-Managed Vehicles, while our founders, Cesar Nivaldo Gon, Bruno Guiçardi Neto and Fernando Matt Borges Martins, remain majority shareholders of the business. This strategic and financial partnership has enabled us to accelerate our global growth strategy, which is focused on increasing market share and brand awareness, attracting new talent, strengthening capabilities and expanding geographically. With its deep sector expertise, global platform, and operational resources, Advent has helped us build on our strong momentum.
Despite the effects of the COVID-19 pandemic, we successfully expanded our operations in 2020, opening “nearshore” service hubs in Europe (London and Lisbon) and Canada (Toronto) during the first quarter of 2020 and in 2021 we expanded our China delivery center with a new office in Chengdu. As global development centers, these “nearshore” hubs are focused on expanding our technology integration services to support our digital marketing engagements with our clients. We expect that these “nearshore” hubs will allow us to increase our delivery capacity of solutions to major international brands that operate in the key markets of North America and Europe and enable us to energize innovation and digital transformation worldwide. In 2020, we also continued our global expansion with a new push into Australia. Our expansion into these countries offers our international clients more coverage around the world and provides us with the ability to target new ones.
On June 26, 2021, CI&T Brazil entered into a share purchase agreement (the “Share Purchase Agreement”) with Prime Sistemas Fundo de Investimentos em Participações Multiestratégia Investimento no Exterior (the “Seller”), as seller, Prime Sistemas de Atendimento ao Consumidor Ltda., as guarantor, and certain other intervening parties, for the purchase of the entire share capital of Dextra Investimentos S.A. (“Dextra Holdings”) and its subsidiaries for R$800,000 thousand, subject to certain purchase price adjustments for debt, cash and working capital amounts. The transaction received regulatory approval from the Brazilian antitrust authority (Conselho Administrativo de Defesa Econômica - CADE) on July 22, 2021 and closed on August 10, 2021 (the “Dextra Acquisition”). Since the closing of the acquisition, we have held the entire share capital of Dextra Holdings and its direct and indirect subsidiaries Dextra Tecnologia S.A. (“Dextra Tecnologia”), Dextra, Inc (“Dextra U.S.”), Cinq Technologies Ltda. (“Cinq”), and Cinq Technologies LLC (“Cinq U.S.” and, together with Dextra Holdings, Dextra Tecnologia, Dextra U.S. and Cinq, the “Dextra Group”). At closing, CI&T Brazil paid the Seller R$650,000 thousand and on December 02, 2021, we paid an additional R$50,938 thousand. A remaining balance of the purchase price will be due on the first anniversary of the closing date. We currently estimate that after the applicable withholdings and price adjustments of R$16,427, the total consideration paid to the Seller will reach R$783,573 thousand.
On November 10, 2021, our Class A common shares began trading on the NYSE under the symbol “CINT” in connection with our initial public offering.
On January 14, 2022, we entered into a share purchase agreement to acquire Somo Global Ltd to accelerate our growth in EMEA, the second-largest market for digital services. The purchase price for the acquisition was £46.7 million (US$63 million, R$341 million) paid in cash, and 225,649 Class A common shares were issued in connection with the transaction to certain eligible holders of Somo Global Ltd shares. The agreement also contemplates an earn-out clause of up to £9.8 million (US$13 million, R$70 million) based on future performance. The transaction closed on January 27, 2022 (the “Somo Acquisition”).
- Business Overview
CI&T is a provider of strategy, design and software engineering services to enable digital transformation for some of the world’s largest enterprises and fast growing companies. As companies race to provide their end-customers with a digital-first experience, our highly talented multidisciplinary teams of strategists, designers and engineers bring a 27-year track record of accelerating business innovations through our end-to-end scalable digital solutions. Through our collaborative approach, we are deeply embedded within our clients’ organizations helping drive digital transformation in their day-to-day business operations and strategic thinking. We do this at scale with a global presence of over 5,500 professionals spread across eight countries. As a result, many blue-chip companies and fast-growing companies across geographies and industry verticals trust CI&T as their partner for digital transformation.
In recent years, many new emerging technologies and market trends, such as mobility, cloud computing, artificial intelligence and hyper-connectivity, have revolutionized and continue to alter how end-users interact with their brands, forcing businesses to redefine engagement models and customer experiences. As companies across industries seek to transform their businesses, they require specialized engineering and creative talent to rapidly design customized, innovative solutions. Many companies and traditional IT outsourcing vendors today often lack the know-how and talent to implement these transformational changes at speed and scale. We believe this dynamic creates an attractive opportunity for a digital native company like ours to help companies rapidly adapt while meeting the demands of their end-customers.
According to the International Data Corporation (“IDC”), the digital transformation services market is massive. While this market encompasses a number of distinct technology solutions, we focus on application development and deployment, consulting, technology outsourcing, and support of IT systems to enable enterprise-wide digital change. IDC forecasts that the total global digital transformation services market is expected to reach an aggregate of US$958 billion in annual spending by 2024, a substantial portion of which directly relates to the services that we offer.
Born in the digital space, CI&T has been at the forefront of innovation delivering business impact by transforming ideas into reality. Our end-to-end offering starts by addressing our clients’ challenges and identifying opportunities where digital technologies can create value (Strategy), then iterating with multidisciplinary teams to create viable solutions (Design) and finally, implementing these digital products and platforms at speed and scale (Engineering). We believe this approach uniquely positions us to capitalize on the massive scale and continuous growth within the digital transformation services market.
We serve our clients by organizing our delivery operations into autonomous units called Growth Units.
Our Growth Units are industry agnostic and multidisciplinary, incorporating talent from across the organization to provide clients with holistic solutions. Growth Units are empowered to focus on the needs of clients and leverage CI&T’s centralized shared services platform for branding, human capital strategy and corporate learning support. Four to eight multidisciplinary senior leaders comprise an executive leadership team and work together to lead each Growth Unit. This structure enables our executives to actively manage their teams while staying very close to our clients. Within each Growth Unit, there are multiple teams of approximately 10 people dedicated to a specific client or project which typically include a project manager, designers, architects, data scientists, and developers, among others (the “Squads”). Using Dunbar’s number as a guide, when a Growth Unit reaches a size of approximately 400 people, we split it into smaller units to ensure our organization stays flat, agile and collaborative. Our Growth Units are further supported by our PowerHouses, specialized teams with very deep digital competencies that help our clients remain up to date with the latest emerging trends and technologies regardless of their sector. By empowering smaller teams, we have found that our employees remain more engaged and entrepreneurial while we continue to expand our global reach and scale.
Our approach has enabled us to attract numerous blue-chip companies, such as Johnson & Johnson, AB InBev, Nestlé, Google, Itaú Unibanco, Coca-Cola, LifeScan and Telefônica among many others. While focused on expanding our business in North America and Europe, we believe our deep roots in Latin America, especially in Brazil, benefit our growth strategy given the region’s massive size and heightened demand for digital transformation services. Our end-to-end solutions and collaborative approach allow us to establish deeply embedded, long-term relationships with our clients that in some instances date back over 14 years. We actively help our clients innovate through these trusted relationships while increasing our share of revenues, as demonstrated by our Net Revenue Retention Rate, which is calculated by dividing Net revenue, less Net revenue generated from new clients in a given year, over Net revenue from the previous year. Over the last five years, our Net Revenue Retention Rate was 120% on average.
From 2017 to 2021, our Net revenue increased at a compound annual growth rate (CAGR) of 34%. We generated Net revenue of R$1,444,380 thousand during 2021 compared to R$956,519 thousand during 2020, representing a year-over-year increase of 51%. On a constant currency basis, we generated Net revenue of R$1,408,679 thousand during 2021, compared to R$958,142 thousand during 2020, representing a year-over-year increase of 47%. In addition to strong net revenue growth, our team remains lean and efficient. Per billable employee,1 our Net revenue for the year ended 2021 and 2020 was R$365 thousand and R$383 thousand, respectively. Our Net profit for the fiscal year ended 2021 was R$125,957 thousand, compared to R$127,654 thousand during 2020, representing a Net profit margin of 9% and 13% for 2021 and 2020 respectively. We generated Adjusted EBITDA of R$324,081 thousand in 2021, which represents a 22.4% Adjusted EBITDA Margin, compared to R$237,917 thousand and a 24.9% Adjusted EBITDA Margin for 2020.
INDUSTRY AND MARKET OPPORTUNITY
The rapid expansion of technology, driven by the ubiquity of mobile applications and other connected devices, has increased the prevalence of connected consumers. Empowered by these technologies, consumers are more sophisticated than ever and are increasingly demanding seamless digital experiences. Meanwhile, companies across industries with new, tech-centric business models that embrace these trends challenge traditional enterprises. To meet rising consumer expectations and compete against these emerging digital-first companies, traditional enterprises invest in digital transformation to digitize their legacy applications and processes and increase the efficiency of customer interactions.
This paradigm shift in business models was underway before the outbreak of the pandemic caused by the SARS-CoV-2 coronavirus disease (“COVID-19”); however, the pandemic has accelerated the adoption of digital technology to support remote working environments and remote customer engagement. Despite significant budget pressures and cost containment measures, according to IDC, overall investments in digital resiliency increased steadily throughout 2020 and continue to increase as businesses prioritize or accelerate the adoption of cloud computing, collaboration, and digital transformation projects. Furthermore, according to IDC, 65% of global GDP is expected to be digitized by 2022, driving US$7 trillion of direct digital transformation investments from 2020 to 2023.
Companies have recognized this changing customer demand and competitive landscape; however, to maximize investment, companies must adopt digital technologies for specific products and customer experiences and also embed digital strategies into their operating model to create new value and efficiencies that differentiate them from competitors. According to IDC, 500 million new logical applications are expected to be created between 2018 and 2023, which is equal to the number built over the past 40 years and demonstrates the breadth of market opportunity for digital transformation services. Companies are beginning to appreciate that this digital journey is not simply a matter of a single process or application, but is the product of iterative development across an organization. Most companies, however, do not have the resources or expertise to develop and execute a digital transformation plan. According to IDC, 73% of organizations are still 12 to 24 months away from developing a plan to operationalize their enterprise digital strategies.
1 We define “billable employees” as those employees accounted for within costs of services provided, which are employees directly involved with the delivery of our strategy, design, and software development services to customers, and which constitute the primary part of our workforce responsible for revenue generation. For the year ended December 31, 2021 and 2020, we had 3,957 and 2,498 billable employees, respectively.
Confronted with these challenges, some enterprises have turned to large IT outsourcers for support. Most of these providers, however, have an embedded cost-first approach, laden with a legacy strategy and are unable to deliver digital-first multidisciplinary teams and a holistic digital transformation strategy to clients. These limitations have supported the emergence of a new class of digital pure-play providers, such as CI&T.
The CI&T Way: Our Delivery & Growth Model
The CI&T Way is concentrated in three pillars: impact, people and learning. This approach informs how we deliver end-to-end digital transformation solutions to our clients in order to enable them to grow and expand their businesses. We attribute a great part of our success to our proprietary methodology based on three main pillars, all of which have Environmental, Social and Corporate Governance (“ESG”) principles as a foundation:
| ● | Impact. Combines a results-focused strategy with client-centric design and technical mastery to deliver end-to-end solutions in short 90-day cycles aimed at improving operating and financial results. |
| ● | People. Our employees represent our culture which allows us to unlock people’s potential and keep them always evolving. Trust is a foundation of our people’s culture that has important cornerstones such as: Human First, Power of Choice, Continuous Learning & Developing, Collective Intelligence and Diversity and Inclusion & Respect. We unlock our team’s potential by promoting from within and investing in individualized development plans for each one of our employees while creating an environment of diversity and trust. We have built a lean operation that helps us attract, keep, engage, and motivate talent. We believe this makes us an attractive company for employees and creates an environment that fosters long and rewarding careers, as evidenced by our strong levels of employee engagement and retention. We are currently recognized as one of the top employers in our sector by the Glassdoor “Overall rating” and “Recommend to a Friend” indicators, and over the last 14 consecutive years we have been certified as a “Great Place to Work” in Brazil by the GPTW Institute. |
| ● | Learning. We manage the business and our people through an Adhocracy model, a decentralized decision-making process that promotes entrepreneurship and autonomy, enabling us to adapt and learn very quickly. We believe that the combination of Adhocracy and an attitude of being an “always learning” organization makes us unique. Our growth and delivery model is focused on bringing together multidisciplinary teams that gain a comprehensive view of the client’s challenges and strategic objectives. By leveraging our PowerHouses’ deep domain capabilities and vertical expertise, we support our clients through a multi-year digital transformation journey. As a form of recognition, our Adhocracy managerial approach was featured in a case study at the London Business School in 2020. |
Our Growth Units structure, which is mapped in the graph below, allows us to expand with accountability while keeping a sense of ownership and belonging across our organization. This structure is also complementary to our inorganic growth strategy through which we seek to expand by acquiring companies whose businesses are strategically aligned with our growth plans, as this structure enables a quick and efficient integration of an acquired company into our growth model.
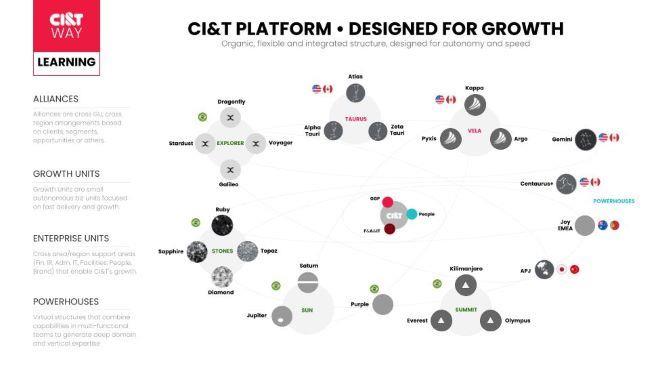
Our Growth Units are further supported by our PowerHouses, specialized teams with very deep digital competencies that help our clients remain up to date with the latest emerging trends and technologies regardless of their sector. By empowering smaller teams, we have found that our employees remain more engaged and entrepreneurial while we continue to expand our global reach and scale.
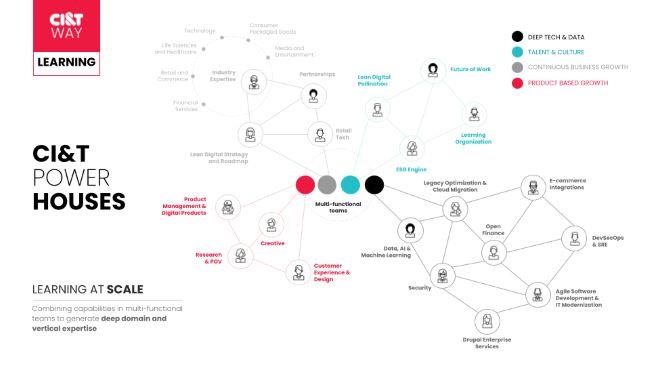
Through the use of our Squads, Growth Units and PowerHouses, we believe that we can bring together everything that our clients need in terms of digital competencies as we aim to assemble teams that:
| [1] | are fluent in the relevant industry verticals; |
| [2] | have deep expertise on the lifecycle of digital products; |
| [3] | master a wide range of technologies and full-stack digital practices; |
| [4] | are well versed in the leadership and culture of agile organizations, in order to deliver success to our clients; and |
| [5] | foster physical presence, shoulder-to-shoulder engagement between our clients, executives and local teams to perform critical engineering tasks and complement this on the ground service delivery with nearshore teams in compatible time zones. |
Our proximity to clients deepens our relationships while providing an extensive understanding of their business models and digital transformation needs. Such closeness allows us to seamlessly integrate with our clients’ teams, foster collaboration, and expedite delivery solutions.
Our Solutions and Services
In a vast and very fragmented market, we are among the category of companies, which we refer to as digital native specialists, which can deliver end-to-end digital solutions. As a digital native specialist, we provide an end-to-end digital offering focused on business impact, helping our clients by combining three significant competencies:
| [1] | Digital Strategy. |
| ● | Roadmapping: We first work closely with our client teams to understand business challenges and align on opportunities to improve the client business. We define the parameters that guide our strategy and the priorities for the engagement, and pursue solutions that promote the most business impact. Together, we develop a co-designed strategy that identifies the business problem, provides an assessment of the organization’s people, processes and technology and maps out a digital initiative roadmap. This planning also encompasses developing skills, team structure, processes, and technologies to implement the prioritized digital solutions.
|
| ● | Digital Transformation: We work shoulder-to-shoulder with our clients’ teams to constantly improve and change how they work. We leverage our expertise in digital services, processes, and practices to evolve our clients’ business model, operating model, and culture so they can adapt faster to change.
|
| [2] | Customer-Centric Design. |
| ● | Customer Experience: We help our clients identify issues with their customers’ experiences and run interviews, collect surveys, and use different data sources to map the customer experience. These maps have all the information (e.g., channels, influencers, opportunities, and others) that we can analyze and apply to base our decisions on fueling growth and improving customer satisfaction. |
●
| Digital Products and Platform: We apply cutting edge user interface and user experience design practices coupled with customer-centric product management and multi-disciplinary teams working on short cycles to build apps and digital services that work together seamlessly to deliver digital solutions. |
●
| Data, AI and Machine-Learning: We foster a data-driven approach to increase our clients’ confidence and preparedness to make decisions. We utilize data engineering, artificial intelligence, digital analytics, and business intelligence to deeply understand the consumers and have more agility in delivering valuable experiences. |
| [3] | Top-of-the-Line Software Engineering. |
| ● | Agile Software Development and IT Modernization: We combine our agile methodologies with Lean Principles, DevOps, and best-in-class software engineering, in order to structure teams to deliver value to the final customers quickly and at scale. |
Our services are highly customized and provide end-to-end solutions that we create by first understanding our clients’ businesses and the desired outcomes for their end-customers through our consulting services. This involves our teams of strategists, data scientists, value-stream managers, solutions architects and designers working closely with clients to build and test solutions that include digital products such as mobile applications, eCommerce experiences, data/AI platforms and digital journeys designed to reach target customers. CI&T works to deliver quarterly impact that can ultimately scale and digitally transform a business.
While most of our revenue is generated from the software development and software maintenance services we provide, consulting services are an important part of our revenue generation and play a crucial role in how we engage with clients to identify business needs and develop customized software development solutions to enable digital transformation. This process focuses on quickly identifying and prioritizing digital initiatives that will create the most impact and value for our clients and their end-customers, which we typically aim to deliver in 90-day cycles to promote quarterly impact. The majority of our strategy, design, and software architecture services is delivered by onsite teams that seamlessly integrate within our clients’ environments, while the majority of software coding and testing work is delivered by nearshore teams located in compatible time zones.
In the United States, our teams focus on strategy definition, design, and in a few instances, software engineering. As a result, for most of our United States based clients, we leverage our onsite Strategy and Design teams, and complement them with our nearshore Engineering teams in Brazil. We maintain the same operations, services and engagement model between Brazil and the United States, with differences in pricing due to the location of our employees and clients.
People Platform
For sustainable growth and strengthening of our talented employees, we rely on the platform strategy to accelerate entrepreneurship, ensure corporate governance, global culture and sustainable talent growth. These processes have been refined for more than two decades. The result is a very attractive company for talent acquisition and high-levels of retention and engagement.
The platform is divided in two strategies:
| [1] | Strategies in a Journey |
| ● | Attracting: We aim to attract outsiders to work with us. |
| ● | Belonging: We foster a community of belonging at CI&T. |
●
| Learning: We are continuously learning and adapting in order to face new challenges and opportunities. |
| [2] | Horizontal strategy |
| ● | Center of Culture, Leadership and Emotional Safety: Leadership empowerment initiative driven by the CI&T culture and an emotionally safe environment. |
| ● | People Lab: The People Lab uses technology to support the People’s strategy at CI&T.
|
| ● | People Operations: A sustainable people operation that enables safe decision-making and focuses on a positive and collaborative experience. |
Sales and Marketing
Our strategy for expanding engagements with current clients and attracting new clients is based on a concept we call “Land & Expand,” which combines pursuing business opportunities with existing clients, landing new businesses through Account Based Marketing actions and traditional marketing, leveraging our strong partnership program with companies such as Google, and turning to our Advisory Growth Boards to provide us with opportunities and introduce us to potential clients. Over 100 CI&T executives are dedicated to this process, in addition to regular client interactions for engagements. Under this strategy, we pursue the following:
| ● | Land new client relationships. We believe there are significant untapped opportunities to win new large enterprises and other fast-growing companies across different industries globally. With an ABM (Account Based Marketing) approach, we gather creativity, intelligence and data in an engine that transforms leads into new clients by identifying the ICP. Our ABM approach further allows us to understand the ICP’s needs and objectives allowing us to customize the strategic sales pitch that suits their specific needs. In addition to large enterprises, we also work with smaller, fast-growing companies that require a different set of services that allow us to test new offerings and develop new capabilities, or what we call our “muscle builder” strategy for learning and constantly evolving our offerings. We prioritize our efforts to develop business in different regions including North America & Europe, Latin America - Brazil, and Asia Pacific and Japan. |
| ● | Expand existing client relationships. We have a successful track record of leveraging our existing client relationships to add new capabilities and/or help solve new challenges as shown by our five-year average Net Revenue Retention Rate of 120%. As part of our strong culture, we take it upon ourselves to always deliver for our clients and we believe that, as a result, they end up becoming our biggest advocates and promoters over time. |
●
| Partner relationships. As digital transformation trends take hold across industries, we actively develop new strategic channels and connections that provide us with significant new and ongoing business within our partners’ ecosystems (Google, Acquia, Microsoft, VTex, Bain & Company etc.). In addition, our close ties with our main shareholder, Advent, has also opened doors to many new opportunities that we are capitalizing on. |
●
| Advisory Growth Boards. We have established advisory boards, called Growth Boards, comprising seasoned senior executives from different industries and specialties that generate business opportunities to support our go-to-market strategy. Many Growth Board members are former CI&T clients who deeply understand our differentiators and introduce us to and help us target new clients who can benefit from our digital expertise. We have Growth Boards in North America, Europe, and Asia that actively help us onboard new business opportunities. |
Clients
Over 100 large enterprises and fast-growing companies trust CI&T as one of their go-to partners for digital transformation. Our clients are primarily blue-chip enterprises based in the United States and Brazil operating in the financial services, food and beverage, and pharmaceuticals and cosmetics verticals. We are also focused on growing our client base in other industry verticals, including education, agribusiness, commodities traders, mining and heavy industries. Today, some of our Top 10 clients have been with us for over 14 years.
Our approach has enabled us to attract numerous blue-chip companies, such as Johnson & Johnson, AB InBev, Nestlé, Google, Itaú Unibanco, Coca-Cola, LifeScan and Telefônica among many others. While focused on expanding our business in North America and Europe, we believe our deep roots in Latin America, especially in Brazil, benefit our growth strategy given the region’s massive size and heightened demand for digital transformation services. Our end-to-end solutions and collaborative approach allow us to establish deeply embedded, long-term relationships with our clients that in some instances date back over 14 years. We actively help our clients innovate throughout these trusted relationships while increasing our share of revenues, as demonstrated by our five-year average Net Revenue Retention Rate of 120%.
Client Concentration
The following table represent the breakdown of our Net revenue based on client concentration:
| Year ended December 31, |
|---|
| 2021 |
| 2021 |
| 2020 |
|---|
| (in thousands of US$)* |
| (in thousands of Brazilian reais, except for percentages) |
|---|
Client Concentration |
|
|
|
|
|
|
|
|
|
Top Client | 50,768 |
| 283,311 |
| 20% |
| 190,599 |
| 20% |
Top Ten Clients | 163,765 |
| 913,890 |
| 63% |
| 644,722 |
| 67% |
Total Net revenue | 258,826 |
| 1,444,380 |
| |
| 956,519 |
| |
* For convenience purposes only, amounts in reais for the year ended December 31, 2021 have been translated to U.S. dollars using an exchange rate of R$5.5805 to US$1.00, the commercial selling rate for U.S. dollars as of December 31, 2021, as reported by the Brazilian Central Bank. These translations should not be considered representations that any such amounts have been, could have been or could be converted at that or any other exchange rate.
We typically enter into a master services agreement with our clients, which provides a framework for services that is then supplemented by statements of work, which specify the particulars of each individual engagement, including the services to be performed, pricing terms, and performance criteria.
We are focused on expanding our relationship with all clients and have a track record of executing this strategy as indicated by an increasing number of multi-million reais accounts based on annual Net revenue per client in recent years. The table below shows the number of clients that generated greater than R$10 million, R$5 million and R$1 million of Net revenue for the periods indicated.
| Year ended December 31, |
| 2021 |
| 2020 |
| 2019 |
R$10 million+ | 25 |
| 20 |
| 15 |
R$5 million + | 43 |
| 32 |
| 28 |
R$1 million + | 94 |
| 58 |
| 53 |
Clients by Industry Vertical
The following table sets forth a breakdown of Net revenue by industry vertical by and as a percentage of our total Net revenue for the years indicated:
| Year ended December 31, |
| 2021 |
| 2021 |
| 2020 |
| (in thousands of US$)* |
| (in thousands of Brazilian reais, except for percentages) |
By Industry Vertical | |
| |
| |
| |
| |
Financial Services | 87,300 |
| 487,177 |
| 34% |
| 324,118 |
| 34% |
Food and Beverages | 61,053 |
| 340,709 |
| 24% |
| 244,590 |
| 26% |
Pharmaceuticals and Cosmetics | 36,981 |
| 206,375 |
| 14% |
| 134,763 |
| 14% |
Technology, Media and Telecom | 30,340 |
| 169,311 |
| 12% |
| 81,961 |
| 9% |
Retail and Manufacturing | 16,821 |
| 93,871 |
| 7% |
| 83,046 |
| 9% |
Education and Services | 11,529 |
| 64,336 |
| 5% |
| 41,323 |
| 4% |
Others | 14,802 |
| 82,600 |
| 6% |
| 46,718 |
| 5% |
Total Net revenue | 258,826 |
| 1,444,380 |
| 100% |
| 956,519 |
| 100% |
* For convenience purposes only, amounts in reais for the period ended December 31, 2021 have been translated to U.S. dollars using an exchange rate of R$5.5805 to US$1.00, the commercial selling rate for U.S. dollars as of December 31, 2021, as reported by the Brazilian Central Bank. These translations should not be considered representations that any such amounts have been, could have been or could be converted at that or any other exchange rate.
Competition
We believe that our early-stage approach, focusing on preparing companies for the future and helping build emerging businesses instead of merely tackling operational issues, distinguishes us and places CI&T in a competitive position to develop potential business and opportunities with clients instead of responding to specific demands or projects. We focus our business development efforts on nurturing relationships in order to build trust instead of working with the procurement teams.
Given the large market, there are numerous players; however, only a few are digital native specialists like CI&T. Our primary competitors include Globant S.A., EPAM Systems, Inc. and Endava plc. We also compete with traditional IT providers such as Accenture PLC, Capgemini SE, Cognizant Technology Solutions Corporation; and digital agencies and consulting firms including Ideo and McKinsey & Company.
Corporate and Social Responsibility
Since 2009 we have been improving and evolving our environmental, social and governance (ESG) efforts as a foundational part of our business. ESG-driven business resonates with our purpose and we believe it increases our attractiveness for people, customers and the communities of which we are a part.
CI&T has been a signatory of the UN Global Compact since July 2021, which is an initiative with a special focus on reducing inequality and creating economic development through business. In December 31, 2021, we reached 40% of representative in our teams by the following groups: women, people of color, people from the LGBTQIAP+ community and people with disabilities.
We also have made progress towards our gender diversity goals and have increased the representation of women across our teams from 22% in 2018 to 29% in 2021. In addition, we have been increasing the percentage of women in our top leadership from 20% in 2018 to 24% in 2021. These indicators do not include Dextra, since it was acquired in August 2021, and the self-declaration process occurred in the first half of 2021.
To oversee these initiatives, we have committees with regular meetings ranging from CI&T’s board of directors to the regional action groups consisting of employees that voluntarily engage with these actions.
Intellectual Property
We currently do not depend on any patent or registrations for our services or the products we develop for our customers, which are highly customized towards our clients’ needs. Based on our contractual arrangements with our clients, our clients usually own the intellectual property in the software solutions we deliver.
As a result, most of the intellectual property matters we manage are related to our trademarks and tradenames. We have registered or are in the process of registering certain trademarks and tradenames with the agency responsible for registering trademarks in Brazil (INPI — Instituto Nacional Propriedade Intelectual). These include “CI&T” and “Lean Digital Transformation.”
Regulatory Overview
Data protection and privacy
The customer data that our platform uses collects, stores, transmits, and processes to run our business is an integral part of our business model. As a result, our compliance with federal, state and foreign laws and regulations dealing with the use, collection, storage, transmission, disclosure, disposal and other processing of personal data is core to the operation of our business. Regulators around the world have adopted or proposed requirements regarding the collection, use, transfer, security, storage, destruction, and other processing of personal data. The applicability of these laws and regulations to us, and their scope and interpretation, are constantly evolving, often uncertain, and may conflict between jurisdictions, and we anticipate the number of data privacy laws and the scope of individual data privacy and protection rights will increase, and as a result, the associated compliance burdens and costs could increase in the future. It may be costly to implement security or other measures designed to comply with these laws and regulations, as well as any new or updated laws or regulations. Any actual or perceived failure to safeguard data adequately, destroy data securely, or otherwise comply with the requirements of these laws and regulations, may subject us to litigation, regulatory investigations or enforcement actions under federal, state or foreign data security, unfair practices or consumer protection laws and contractual penalties, and result in monetary damages, damage to our reputation or adversely affect our ability to retain customers or attract new customers.
A number of the jurisdictions in which we operate have adopted or are considering adopting data protection and privacy laws and regulations, including, among others, Brazil, the United States, the European Union and the United Kingdom.
Brazil
In September 2020, Brazilian Federal Law No. 13,709/2018, the Brazilian General Data Protection Law (Lei Geral de Proteção de Dados Pessoais), or LGPD, came into effect to regulate the processing of personal data in Brazil. The LGPD establishes general principles, obligations and detailed rules to be observed by individuals or public or private companies in operations involving processing of personal data in Brazil, including the collection, use, processing and storage of personal data, which affects all economic sectors, including the relationship between customers and suppliers of goods and services, employees and employers and other relationships in which personal data is processed, whether in a digital or physical environment. The LGPD provides for, among others, the rights of holders of personal data, the legal bases applicable to the processing of personal data, the requisites to obtain consent, the obligations and requisites related to security incidents and leakages and transfers of data, either Brazilian or international, as well as the creation of the National Authority for Data Protection (Autoridade Nacional de Proteção de Dados), or ANPD, responsible for the inspection, promotion, disclosure, regulation, establishment of guidelines and application of the law.
In case of noncompliance with the LGPD, we are subject to administrative sanctions applicable by the ANPD since August 1, 2021 onwards, on an isolated or cumulative basis, that can range from a warning, obligation to disclose incidents, temporary blocking and/or elimination of personal data related to the infraction, a simple fine of up to 2.0% of our revenue, or revenue of the company or group of companies in Brazil for the last fiscal year, excluding taxes, up to the global amount of R$50,000 thousand per violation, a daily fine, up to the aforesaid global limit, suspension of the operation of the database related to the infraction for a maximum period of six months, which can be extended for an equal period, up to the regularization of the processing by the controlling shareholder, suspension of activities related to processing of personal data related to the infraction for a period of six months, which can be extended for an equal period, and partial or total prohibition to exercise activities related to data processing.
The imposition of the administrative sanctions of the LGPD does not prevent the imposition of administrative sanctions set forth by other laws that address issues related to data privacy and protection, such as the Brazilian Code of Consumer Defense and the Brazilian Civil Rights Framework for the Internet. These administrative sanctions can be applied by other public authorities, such as the Attorney General’s Office and consumer protection agencies. We can also be subject to civil liabilities for violation of these laws.
In addition to the administrative sanctions due to the noncompliance with the obligations established by the LGPD, we can be held liable for individual or collective material damages, and non-material damages caused to holders of personal data, including when caused by service providers, including SaaS partners, that serve as processors of personal data on our behalf.
European Union and the United Kingdom
The General Data Protection Regulation 2016/679, or the GDPR, became effective in May 2018, and is applicable to companies processing personal data of individuals in the European Union, or the EU, and the European Economic Area, or the EEA. The GDPR is wide-ranging in scope and implements stringent requirements in relation to the collection, use, retention, protection, disclosure, transfer and other processing of personal data relating to EU individuals, with substantial monetary penalties for violations. Personal data as defined under the GDPR includes any type of information that can identify a living individual, including name, identification number, email address, location, internet protocol addresses, and cookie identifiers. Among other requirements, the GDPR mandates more stringent administrative requirements for controllers and processors of personal data, including, for example, notice of and a lawful basis for data processing activities, data protection impact assessments, a right to “erasure” of personal data, and data breach reporting. If we do not comply with our obligations under the GDPR, we could be exposed to significant fines of up to €20 million or up to 4.0% of the total worldwide annual turnover of the preceding financial year, whichever is higher. The GDPR also provides that EU member states may enact their own additional laws and regulations in relation to certain data processing activities. Recent legal developments in the EU have also created complexity and uncertainty regarding transfers of personal information from the EU to “third countries,” especially the United States. For example, last year, the Court of Justice of the European Union, or CJEU, invalidated the EU-U.S. Privacy Shield Framework, a mechanism for the transfer of personal information from the EU to the United States, and made clear that reliance on Standard Contractual Clauses, an alternative mechanism for the transfer of personal information outside of the EU alone may not be sufficient in all circumstances.
Further, the United Kingdom’s withdrawal from the European Union and ongoing developments in the United Kingdom have created uncertainty regarding data protection regulation in the United Kingdom. Following the United Kingdom’s withdrawal from the EU on January 31, 2020, pursuant to the transitional arrangements agreed to between the United Kingdom and European Union, the GDPR continued to have effect in law in the United Kingdom, and continued to do so until December 31, 2020 as if the United Kingdom remained a member state of the EU for such purposes. Following December 31, 2020, and the expiry of those transitional arrangements, the data protection obligations of the GDPR continue to apply to United Kingdom-related processing of personal data in substantially unvaried form by virtue of section 3 of the European Union (Withdrawal) Act 2018, as amended, which, together with the amended UK Data Protection Act of 2018, retains the GDPR in UK national law. However, going forward, there may be increasing scope for divergence in application, interpretation and enforcement of the data protection law as between the United Kingdom and the EEA, and the relationship between the United Kingdom and the EEA in relation to certain aspects of data protection law remains uncertain.
United States
In the United States, various laws and regulations apply to the security, collection, storage, use, disclosure and other processing of certain types of data. For example, California adopted the California Consumer Privacy Act, or CCPA, which became effective in January 2020. The CCPA establishes a privacy framework for covered businesses, including an expansive definition of personal information and data privacy rights for California residents. Among other requirements, the CCPA mandates new disclosure to California consumers and allows California consumers to request a copy of the personal information collected about them, request deletion of their personal information and request to opt out of certain sales of personal information. The CCPA includes a framework with potentially severe statutory damages and private rights of action. Further, in November 2020, California voters passed the California Privacy Rights Act, or CPRA, which expands the CCPA with additional data privacy compliance requirements and establishes a regulatory agency dedicated to enforcing those requirements. In addition, other states, such as Virginia, have also adopted or are considering adopting similar data privacy laws and all 50 states have adopted laws requiring notice to consumers of a security breach involving their personal information.
Anti-corruption and sanctions
We are subject to anti-corruption, anti-bribery, anti-money laundering and sanction laws and regulations, including the Brazilian Federal Law No. 12,846/2013, or the Clean Company Act, the United States Foreign Corrupt Practices Act of 1977, as amended, or the FCPA, and the Proceeds of Crime Act, as amended. The Clean Company Act, the FCPA and the Proceeds of Crime Act prohibit corporations and individuals from engaging in improper activities to obtain or retain business or to influence a person working in an official capacity. These laws and regulations prohibit, among other things, providing, directly or indirectly, anything of value to any foreign government official, or any political party or official thereof, or candidate for political influence to improperly influence such a person. Similar laws exist in other countries, such as the UK, that restrict improper payments to persons in the public or private sector. Many countries have laws prohibiting these types of payments within the respective country. Historically, technology companies have been the target of FCPA and other anti-corruption investigations and penalties.
If any person in the Cayman Islands knows or suspects, or has reasonable grounds for knowing or suspecting that another person is engaged in criminal conduct or money laundering, or is involved with terrorism or terrorist financing and property, and the information for that knowledge or suspicion came to their attention in the course of business in the regulated sector, or other trade, profession, business or employment, the person will be required to report such knowledge or suspicion to (i) the Financial Reporting Authority of the Cayman Islands (the “FRA”), pursuant to the Proceeds of Crime Act (as revised) of the Cayman Islands, if the disclosure relates to criminal conduct or money laundering, or (ii) a police officer of the rank of constable or higher, or the FRA, pursuant to the Terrorism Act (As Revised) of the Cayman Islands, if the disclosure relates to involvement with terrorism or terrorist financing and property.
On October 29th, 2021, our Board of Directors adopted the CI&T Anti-corruption Policy, which is applicable to CI&T Inc and all of its subsidiaries.
In addition, we are subject to U.S. and foreign laws and regulations that restrict our activities in certain countries and with certain persons. These include the economic sanctions regulations administered by the U.S. Treasury Department’s Office of Foreign Assets Control and the export control laws administered by the U.S. Commerce Department’s Bureau of Industry.
Taxation
We benefit from certain tax incentives in Brazil. For example, Brazilian Law No. 12.546/2011, enacted as part of the Brazilian Federal Government’s program called “Plano Brasil Maior,” currently grants tax benefits regarding social security contributions levied on the company’s payroll. This tax benefit authorizes us to calculate and collect social security contributions based on 4.5% of our gross revenues, instead of 20% of salaries on our payroll, reducing our social security burden. This program is currently expected to expire in December 2023, and thereafter, we will be required to calculate and collect social security contributions based on our payroll, which will increase our tax burden and reduce our margins. Although there are ongoing discussions within the Brazilian Congress to renew the “Plano Brasil Maior” program as part of a broader tax reform, there can be no assurance that we will continue to be able to benefit from such program.
Another example is the benefits provided by Brazilian Law No. 11,196/2005, which currently grants tax benefits to companies that invest in research and development, provided that some requirements are met, which reduces our annual corporate income tax expense. If the taxes applicable to our business increase or any tax benefits are revoked and we cannot alter our cost structure to pass our tax increases on to clients, our financial condition, results of operations and cash flows could be adversely affected. Our activities are also subject to a Municipal Tax on Services (Imposto Sobre Serviços, or “ISS”). Any increases in ISS rates could also harm our profitability. Furthermore, Brazilian governmental authorities at the federal, state and local levels are considering changes in tax laws in order to cover budgetary shortfalls resulting from the recent economic downturn in Brazil and also in order to simplify the tax system. If these proposals are enacted they may harm our profitability by increasing our tax liabilities, increasing our tax compliance costs, or otherwise affecting our financial condition, results of operations and cash flows. Tax rules in Brazil, particularly at the local level, can change sometimes at short notice given the dynamics allowed by the tax legislation system based on a combination of voting, sanction and veto powers from the many legislators. Additionally, the Brazilian tax system is quite complex and requires substantial compliance costs, time and effort from companies operating in Brazil. Despite the fact that the company applies all the proper efforts to manage its tax obligations, we may not always be timely aware of all such changes that affect our business and we may therefore fail to pay the applicable taxes or otherwise comply with tax regulations, which may result in additional tax assessments and penalties for our company.
At the municipal level, the Brazilian government enacted Supplementary Law No. 157/16, which imposed changes regarding the ISS collection applied to the rendering of part of our services. These changes created new obligations, as ISS will now be due in the municipality in which the acquirer of our services is located rather than in the municipality in which the service provider’s facilities are located. This obligation took force in January 2018, but has been delayed by Direct Unconstitutionality Action No. 5835, or ADI, filed by taxpayers. The ADI challenges the constitutionality of Supplementary Law No. 157/16 before the Supreme Court, arguing that the new legislation would adversely affect companies’ activities due to the increase of costs and bureaucracy related to the ISS payment to several municipalities and the compliance with tax reporting obligations connected therewith. As a result, the Supreme Court granted an injunction to suspend the enforcement of Supplementary Law No. 157/16. In June 2020, the ADI was included in the judgment agenda of the Supreme Court but, as of the date of this annual report, a final decision on this matter is currently pending.
We are also subject to tax laws and regulations that may be interpreted differently by tax authorities and us. The application of indirect taxes, such as sales and use tax, value-added tax, or VAT, provincial taxes, goods and services tax, business tax and gross receipt tax, to businesses such as ours is complex and continues to evolve. We are required to use significant judgment in order to evaluate applicable tax obligations. In many cases, the ultimate tax determination is uncertain because it is not clear how existing statutes apply to our business. One or more states or municipalities, the federal government or other countries may seek to challenge the taxation or procedures applied to our transactions, which could impose the charge of taxes or additional reporting, record-keeping or indirect tax collection obligations on businesses like ours. New taxes could also require us to incur substantial costs to capture data and collect and remit taxes.
- Organizational Structure
Corporate Events
We are a Cayman Islands exempted company, incorporated with an indefinite term and limited liability on June 7, 2021 for purposes of carrying out our initial public offering.
Prior to the consummation of our initial public offering, existing shareholders of CI&T Brazil contributed all of their shares in CI&T Brazil to our wholly-owned subsidiary CI&T Delaware LLC (“CI&T Delaware”), and subsequently contributed their shares of CI&T Delaware to us (the “Contribution”). In return for this Contribution, we issued 121,086,785 new Class B common shares to the existing shareholders of CI&T Brazil in a one to 68.14 exchange for the shares of CI&T Brazil indirectly contributed to us. As a result, CI&T Brazil is our indirect wholly-owned subsidiary as of the consummation of the Contribution. After accounting for the Contribution and the new 11,111,111 Class A common shares that were issued and sold by us in our initial public offering and the 3,888,889 Class A Common shares sold by the selling shareholders, including through the exercise of the over-allotment option, we had a total of 132,197,896 common shares issued and outstanding immediately following the offering, of which, 117,197,896 were Class B common shares beneficially owned by our pre-IPO shareholders, and 15,000,000 were Class A common shares beneficially owned by investors purchasing in the IPO and as of December 31, 2021. As of the date of this annual report, we had a total of 132,852,040 common shares issued and outstanding, of which 117,197,896 were Class B common shares and 15,654,144 were Class A common shares, including 225,649 Class A common shares that were issued as part of the payment for the Somo acquisition in January 2022 and 428,495 Class A common shares issued in the first quarter of 2022 in connection with our stock option plan.
Organizational Chart
A simplified organizational chart showing our corporate structure as of March 31, 2022 is shown below:
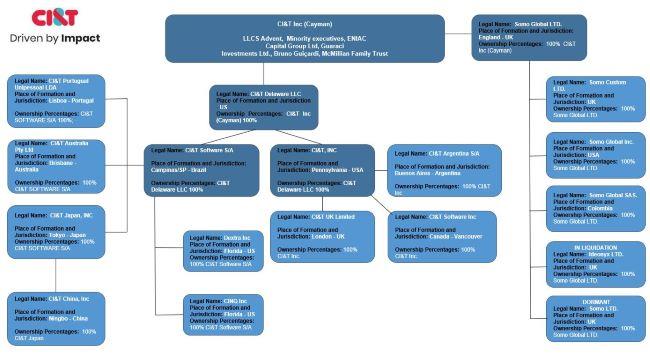
Corporate Information
Our principal executive office is located at R. Dr. Ricardo Benetton Martins, 1.000, Pólis de Tecnologia — Prédio 23B, Zip Code 13086-902, Campinas — São Paulo State — Brazil. Our telephone number at this address is +55 19 21024500.
Investors should contact us for any inquiries through the address and telephone number of our principal executive office. Our principal website is https://ciandt.com/us/en-us. The information contained in, or accessible through, our website is not incorporated into this report.
- Property, Plant and Equipment
Our corporate headquarters are located at Campinas, São Paulo — Brazil, where we lease approximately 16,700 square meters of office space. We provide services from delivery centers located in Brazil, China, Japan, Portugal and the U.S., as well as provide services by staff working remotely from Canada, Australia and the UK. We rent all of our facilities. We believe that our current facilities are suitable and adequate to meet our current and foreseeable future needs.
ITEM 4A. UNRESOLVED STAFF COMMENTS
Not applicable.
ITEM 5. OPERATING AND FINANCIAL REVIEW AND PROSPECTS
You should read the following discussion and analysis of our financial condition and results of operations in conjunction with our financial statements and the related notes included elsewhere in this report, as well as the information presented under “Presentation of Financial and Other Information”. The following discussion contains forward-looking statements that involve risks, uncertainties and assumptions. Our actual results and the timing of selected events could differ materially from those anticipated in these forward-looking statements as a result of various factors, including those set forth under “Cautionary Statement Regarding Forward-Looking Statements”, “Risk Factors” and elsewhere in this report.
- Operating Results.
Factors Affecting Our Results of Operations
We believe that the trends affecting our performance for historical periods and future periods include the following key factors:
| ● | High global demand for digital transformation services: Demand for digital transformation services has increased in recent periods. Many of our key clients which had previously invested in digital transformation projects, accelerated their investment in initiatives to digitize legacy applications and processes and increase the efficiency of their customer interactions as the COVID-19 pandemic led to an accelerated adoption of digital technology to support remote working environments and remote customer engagement. The rate at which such demand continues to grow and is sustained will be a key driver of our growth. |
| ● | Ability to recruit and retain talent: Our ability to attract and retain highly-skilled IT professionals is key. In order to sustain our growth, we must attract and retain a large number of highly-skilled and talented IT professionals. Our business is people-driven and, accordingly, our success depends upon our ability to attract, develop, motivate, retain and effectively utilize highly-skilled IT professionals in our delivery. We believe that there is significant competition for technology professionals in the geographic regions in which we operate and that such competition is likely to continue for the foreseeable future. Increased hiring by technology companies and increasing worldwide competition for skilled technology professionals may lead to a shortage in the availability of suitably qualified personnel. |
In addition, other significant factors affecting our performance and results of our operations include:
| ● | The impact of macroeconomic uncertainty and global geopolitical tensions, including associated with the war in Ukraine and related economic sanctions imposed over Russia as a result of the ongoing conflict; |
| ● | The impact of COVID-19 on the global macroeconomic environment (including how long and how deeply it will generate economic uncertainty and reduced economic activity); |
●
| Economic growth rates in the industries and countries in which our clients operate, as well as their impact on our client’s expenditures on digital services; |
●
| Economic, health, political, social and environmental policies and development in the countries we operate, particularly in Brazil and in the United States, where most of our employees are based; |
| ● | Wage rates and operating costs in the countries where we operate, particularly in Brazil and the United States, where most of our employees are based; |
●
| Changes in foreign exchange rates, particularly fluctuations in exchange rates between the U.S. dollar and the Brazilian real, Euro, Yen and Yuan; |
| ● | Our ability to retain existing clients, as well as to increase our revenue from existing clients pursuant to the expansion of services provided to them; |
●
| Our ability to attract new clients; |
●
| Our ability to maintain favorable pricing; |
●
| Our ability to expand and deepen the quality, range and diversity of our portfolio of service offerings while maintaining excellent quality standards; |
●
| Our ability to maintain adequate resource utilization rates and productivity levels; |
●
| Our ability to maintain and strengthen a strong brand and corporate reputation; |
| ● | Our ability to continuously innovate, and continuously remain at the forefront of emerging technologies and related market trends; and |
| ● | Our ability to identify, integrate and effectively manage future acquisitions. |
Please refer to “Risk Factors” for additional information on factors that may affect our results of operations.
Components of Results of Operations
The following is a summary of the principal components comprising consolidated statements of profit or loss.
Net revenue
In accordance with our strategy, we analyze revenue results by industry vertical, geography, and client concentration.
Net revenue by Industry Vertical
We provide technology services to enterprises in a range of industry verticals including financial services, food and beverage, pharmaceutical and cosmetics, technology, media and telecom, retail and manufacturing, education and services, among others.
Net revenue by Geography
We present our Net revenue by geographic market based on the location where the sale was made. Our Net revenue is derived from three main geographic regions: North America and Europe (primarily from the United States and the United Kingdom), Latin America (primarily from Brazil), and Asia, Pacific and Japan (“APJ”), (mainly from Japan, Australia and China).
Net revenue by Client Concentration
We present our Net revenue by client concentration by aggregating the Net revenue from our top client and top ten clients by amount and as a percentage of our Net revenue for the periods indicated.
Cost of services provided
Our cost of services provided includes employee expenses and non-reimbursable project-related costs. Within employee expenses, we have salaries, benefits, payroll taxes, and training and development costs. The non-reimbursable project-related costs includes: short-term lease agreements and depreciation of machinery and equipment, as well as the amortization of software and intangible assets.
Operating expenses net
Our operating expenses, net include (i) selling expenses, (ii) general and administrative expenses, (iii) research and technological innovation expenses, (iv) impairment loss on trade receivables and contract assets, and (v) other income (expenses) net. Selling expenses are composed primarily of sales and marketing expenses. General and administrative expenses include expenses for personnel that provide services that are not allocated into specific projects, real property short term lease agreements and additional expenses related to the maintenance of such real property, depreciation of machinery and equipment related to such real property, as well as the amortization of software and intangible assets.
Net finance costs
Our finance income consists of income from financial investments, foreign-exchange gains, gains on derivatives, interest received, and other finance income. Our finance costs are mainly related to interest and charges on loans and leases, exchange variation losses, loss on derivatives, commissions and brokerage, negative monetary variation and other finance costs.
Income taxes
Income tax expenses consists primarily of income taxes, current and deferred, in certain foreign jurisdictions in which we conduct business. The current and deferred income taxes are calculated on the basis of the tax laws enacted at the end of the reporting period in the countries in which we operate and generate taxable income. In our subsidiary in Brazil, the tax rate is 34%; in our subsidiaries in the United States, the federal tax rate is 21%; in our subsidiary in Canada, the tax rate is 26.5%; in our subsidiary in Japan, the tax rate is 23.2%; in our subsidiary in China, the tax rate is 15%; in our subsidiary in Australia, the tax rate is 26%; in our subsidiary in the United Kingdom, the tax rate is 19%; and in our subsidiary in Portugal, the tax rate is 21%.
Consolidated Results of Operations
Year ended December 31, 2021 compared to the year ended December 31, 2020
| Year ended December 31, | |
| 2021 | 2021 | 2020 | Var.% |
| (in thousands of US$)* | (in thousands of Brazilian reais) | |
Net revenue | 258,826 | 1,444,380 | 956,519 | 51% |
Costs of services provided | (167,679) | (935,732) | (600,866) | 56% |
Gross Profit | 91,147 | 508,648 | 355,653 | 43% |
Selling, general, administrative and other expenses (1) | (47,226) | (263,545) | (147,213) | 79% |
Impairment loss on trade receivables and contract assets | (89) | (497) | (196) | 154% |
Operating profit before financial income | 43,832 | 244,606 | 208,244 | 17% |
Finance income | 12,511 | 69,816 | 47,808 | 46% |
Finance costs | (18,645) | (104,048) | (63,261) | 64% |
Net finance costs | (6,134) | (34,232) | (15,453) | 122% |
Profit before income tax | 37,698 | 210,374 | 192,791 | 9% |
Income tax expense (2) | (15,127) | (84,417) | (65,137) | 30% |
Net profit for the year | 22,571 | 125,957 | 127,654 | (1)% |
| * | For convenience purposes only, amounts in reais for the year ended December 31, 2021 have been translated to U.S. dollars using an exchange rate of R$5.5805 to US$1.00, the commercial selling rate for U.S. dollars as of December 31, 2021, as reported by the Brazilian Central Bank. These translations should not be considered representations that any such amounts have been, could have been or could be converted at that or any other exchange rate.
|
| (1) | Includes for the years ended December 31, 2021 and 2020, respectively, selling expenses of R$89,654 thousand and R$65,093 thousand, general and administrative expenses of R$151,681 thousand and R$81,161 thousand, research and technological innovation expenses of R$4 thousand and R$3,462 thousand, and other income (expenses) net of (R$22,206) thousand and R$2,503 thousand. |
| (2) | Includes for the years ended December 31, 2021 and 2020, respectively, current income tax and social contribution expenses of R$95,375 thousand and R$66,912 thousand and deferred income tax benefit of R$10,958 thousand and R$1,775 thousand. |
Net revenue
Net revenue in 2021 was R$1,444,380 thousand, representing an increase of 51%, compared to net revenue of R$956,519 thousand in 2020. The increase was mainly due to (i) the expansion of the relationship with our current clients, demonstrated by our Net Revenue Retention rate of 128%, (ii) the addition of 36 new clients with revenue above R$1.0 million each in 2021, reaching 94 clients in 2021, compared to 58 in 2020, and (iii) the acquisition of Dextra in 2021, which contributed to R$107 million of net revenue in 2021. Net revenue growth in constant currency was 47%.
Net revenue by industry vertical
The following table sets forth a breakdown of net revenue by industry vertical by and as a percentage of our total Net revenue for the years indicated:
| Year ended December 31, |
| 2021 |
| 2021 |
| 2020 |
| (in thousands of US$)* |
| (in thousands of Brazilian reais, except for percentages) |
By Industry Vertical | |
| |
| |
| |
| |
Financial Services | 87,300 |
| 487,177 |
| 34% |
| 324,118 |
| 34% |
Food and Beverage | 61,053 |
| 340,709 |
| 24% |
| 244,590 |
| 26% |
Pharmaceuticals and Cosmetics | 36,981 |
| 206,375 |
| 14% |
| 134,763 |
| 14% |
Technology, Media and Telecom | 30,340 |
| 169,311 |
| 12% |
| 81,961 |
| 9% |
Retail and Manufacturing | 16,821 |
| 93,871 |
| 7% |
| 83,046 |
| 9% |
Education and Services | 11,529 |
| 64,336 |
| 5% |
| 41,323 |
| 4% |
Others | 14,802 |
| 82,600 |
| 6% |
| 46,718 |
| 5% |
Total Net revenue | 258,826 |
| 1,444,380 |
| 100% |
| 956,519 |
| 100% |
| * | For convenience purposes only, amounts in reais for the year ended December 31, 2021 have been translated to U.S. dollars using an exchange rate of R$5.5805 to US$1.0000, the commercial selling rate for U.S. dollars as of December 31, 2021, as reported by the Brazilian Central Bank. These translations should not be considered representations that any such amounts have been, could have been or could be converted at that or any other exchange rate. |
Net revenue by geography
The following table sets forth a breakdown of Net revenue by geographic region by and as a percentage of our total Net revenue for the years indicated:
| Year ended December 31, |
| 2021 |
| 2021 |
| 2020 |
| (in thousands of US$)* |
| (in thousands of Brazilian reais, except for percentages) |
By Geography | |
| |
| |
| |
| |
North America & Europe | |
| |
| |
| |
| |
North America | 122,670 |
| 684,558 |
| 47% |
| 451,999 |
| 47% |
Europe | 2,745 |
| 15,320 |
| 1% |
| 19,764 |
| 2% |
Subtotal North America & Europe | 125,415 |
| 699,878 |
| 48% |
| 471,763 |
| 49% |
Latam (Latin America) | 124,421 |
| 694,334 |
| 48% |
| 435,987 |
| 46% |
APJ (Asia, Pacific and Japan) | 8,990 |
| 50,168 |
| 3% |
| 48,768 |
| 5% |
Total Net revenue | 258,826 |
| 1,444,380 |
| 100% |
| 956,519 |
| 100% |
| * | For convenience purposes only, amounts in reais for the year ended December 31, 2021 have been translated to U.S. dollars using an exchange rate of R$5.5805 to US$1.00, the commercial selling rate for U.S. dollars as of December 31, 2021, as reported by the Brazilian Central Bank. These translations should not be considered representations that any such amounts have been, could have been or could be converted at that or any other exchange rate. |
Net revenue by client concentration
The following table sets forth the Net revenue derived from our Top Client and Top Ten Clients by Net revenue and as a percentage of our total Net revenue for the periods indicated:
| Year ended December 31, |
|---|
| 2021 |
| 2021 |
| 2020 |
|---|
| (in thousands of US$) |
| (in thousands of Brazilian reais, except for percentages) |
|---|
Client Concentration | |
| |
| |
| |
| |
Top Client | 50,768 |
| 283,311 |
| 20% |
| 190,599 |
| 20% |
Top Ten Clients (including Top Client) | 163,765 |
| 913,890 |
| 63% |
| 644,722 |
| 67% |
Total Net revenue | 214,533 |
| 1,444,380 |
| |
| 956,519 |
| |
| * | For convenience purposes only, amounts in reais for the year ended December 31, 2021 have been translated to U.S. dollars using an exchange rate of R$5.5805 to US$1.00, the commercial selling rate for U.S. dollars as of December 31, 2021, as reported by the Brazilian Central Bank. These translations should not be considered representations that any such amounts have been, could have been or could be converted at that or any other exchange rate. |
We generate a significant portion of our Net revenue from our ten largest clients. We reduced the share of net revenue from our top ten clients to 63% in 2021 compared to 67% in 2020, mainly as a result of the addition of 36 new clients with revenue above R$1.0 million each and the acquisition of Dextra in 2021, that contributed to dilute the revenue share from our top ten clients.
Costs of services provided
Costs of services provided for 2021 amounted to R$935,732 thousand, an increase of R$334,866 thousand, or 56%, from R$600,866 thousand in 2020.
The most significant increase in costs of services provided was associated with employee expenses, which increased by R$327,306 thousand, or 61%, to R$861,225 thousand in 2021 from R$533,919 thousand in 2020, due to new hires during 2021 to foster our net revenue growth (headcount increased by 73% in 2021 compared to 2020), and employee promotions and compensation adjustments that had been postponed in 2020, as a result of market uncertainties in the first year of the pandemic.
Other factors that contributed to the increase in our costs of services provided are (i) depreciation and amortization related to the cost of services provided, which increased by R$7,799 thousand in 2021, and (ii) increase in third-party services and other inputs related to costs of services provided, which increased by R$2,481 thousand in 2021. These were partially offset by a reduction of R$5,386 thousand in travel expenses related to costs of services provided in 2021 (full year of pandemic) compared to 2020 (nine months of pandemic), caused by the travel restrictions since March 2020, due to the outbreak of the COVID-19 pandemic.
Gross profit
As a result of the foregoing, gross profit for 2021 was R$508,648 thousand, an increase of 43% from R$355,653 thousand for 2020.
Operating expenses, net
Operating expenses increased by R$116,633 thousand, or 79%, to R$264,042 thousand in 2021, from R$147,409 thousand in 2020, due to the increase in selling expenses, general and administrative expenses and other income (expenses) net.
Selling expenses increased by R$24,561 thousand, or 38%, to R$89,654 thousand in 2021, from R$65,093 thousand in 2020. This increase was mostly driven by an increase in employee expenses of R$22,436 thousand or 55%, to R$63,490 thousand in 2021, from R$41,054 thousand in 2020 due to new hires and promotions. An increase in other expenses of R$5,711 thousand in 2021, as a result of additional expenses with software licenses and permits, sponsorships, sales commissions, training, and commercial discounts, has also contributed to the increase of operating expenses in 2021. These impacts were partially compensated by a decrease in third-party services and other inputs of R$4,594 thousand in 2021, due to a decrease in advertising, publicity and consulting expenses.
General and administrative expenses increased by R$70,520 thousand, or 87%, to R$151,681 thousand in 2021, from R$81,161 thousand in 2020. This increase was driven by (i) an increase in employee expenses of R$35,291 thousand due to new hires and promotions for back-office teams, including to support the acquisition of Dextra; (ii) an increase in third-party services of R$11,816 thousand related to additional expenses with business licenses and permits, accounting and audit services, and consulting expenses; (iii) an increase in other expenses of R$6,736 thousand or 125%, to R$12,126 thousand in 2021, from R$5,391 thousand in 2020, related to additional expenses with trainings, software licenses and permits, ergonomic kit for new employees and D&O insurance; (iv) an increase in M&A consulting expenses of R$6,511 thousand and (v) an increase in depreciation and amortization of R$10,118 thousand, in 2020 explained by the recognition of intangible assets related to the Dextra acquisition.
Research and technological innovation expenses decreased by R$3,458 thousand, to R$4 thousand in 2021, from R$3,462 thousand in 2020, as we strategically decided to discontinue investments in products not related to our core business (which are related to our former subsidiary CI&T IOT, renamed Neowrk Sistemas Inteligentes S/A in September 2021).
Other income (expenses) net decreased to an expense of R$22,206 thousand in 2021 from an income of R$2,503 thousand in 2020. Such a decrease is mainly explained by a recognition of impairments of intangible assets related to the Dextra acquisition in the amount of R$21,895 thousand in the second half of 2021, in connection with (i) the discontinuation of the investment in intangible assets initially recognized as internally developed software, in the amount of R$20,723 thousand, and (ii) a non-compete agreement, in the amount of R$1,171 thousand.
Operating profit before financial income
As a result of the foregoing, operating profit before financial income for 2021 was R$244,606 thousand, an increase of 17% from R$208,244 thousand for 2020.
Net finance costs
In 2021, net finance costs increased by R$18,779 thousand, or 121%, to R$34,232 thousand in 2021, from R$15,453 thousand in 2020. This was mainly due to an increase of R$19,425 thousand in interest on loans and leases, associated with the increase in our loans and borrowings mainly to finance the Dextra acquisition, combined with the increase in interest rates (CDI) in 2021.
Profit before income tax
As a result of the foregoing, profit before income tax was R$210,374 thousand in 2021, an increase of 9 %, compared to R$192,791 thousand in 2020.
Income tax expense
Income tax expense was R$84,417 thousand in 2021, an increase of 30 %, compared to R$65,137 thousand in 2020. This increase was primarily attributable to the fact that the impairment on intangible assets and amortization expenses detailed above are non-deductible for tax purposes in CI&T Brazil. See note 26 to the audited consolidated financial statements for a reconciliation of the effective rate with the average nominal rate.
Net profit for the year
As a result of the foregoing, our net profit for 2021 was R$125,957 thousand, a decrease of 1%, from R$127,654 thousand for 2020.
Year ended December 31, 2020 compared to the year ended December 31, 2019
The following table sets forth our consolidated statements of profit or loss data for the years ended December 31, 2020 and 2019:
Consolidated Statements of Profit or Loss Data
| Year ended December 31, |
| |
| 2020 |
| 2019 |
| Var.% |
| (in thousands of Brazilian reais) |
| |
Net revenue | 956,519 |
| 677,133 |
| 41% |
Costs of services provided | (600,866) |
| (448,979) |
| 34% |
Gross Profit | 355,653 |
| 228,154 |
| 56% |
Selling, general, administrative and other expenses (1) | (147,213) |
| (135,364) |
| 9% |
Impairment loss on trade receivables and contract assets | (196) |
| (1,091) |
| -82% |
Operating profit before financial income | 208,244 |
| 91,699 |
| 127% |
Finance income | 47,808 |
| 23,944 |
| 100% |
Finance costs | (63,261) |
| (29,855) |
| 112% |
Net finance costs | (15,453) |
| (5,911) |
| 161% |
Profit before income tax | 192,791 |
| 85,788 |
| 125% |
Income tax expense (2) | (65,137) |
| (29,219) |
| 123% |
Net profit for the year | 127,654 |
| 56,569 |
| 126% |
| (1) | Includes for the years ended December 31, 2020 and 2019, respectively, selling expenses of R$65,093 thousand and R$44,802 thousand, general and administrative expenses of R$81,161 thousand and R$81,197 thousand, research and technological innovation expenses of R$3,462 thousand and R$12,093 thousand, and other income (expenses) net of R$2,503 thousand and R$2,728 thousand. |
| (2) | Includes for the years ended December 31, 2020 and 2019, respectively, current income tax and social contribution expense of R$66,912 thousand and R$39,457 thousand and deferred income tax benefit of R$1,775 thousand and R$10,238 thousand. |
Net revenue
Net revenue in 2020 was R$956,519 thousand, representing an increase of R$279,386 thousand, or 41%, when compared to net revenue of R$677,133 thousand in 2019. The increase was due to an increase in demand for our digital transformation services in the United States (where our Net revenue increased R$167,678 thousand, or 59%, to R$451,999 thousand in 2020 from R$284,321 thousand in 2019) and in Brazil (where our Net revenue increased R$103,325 thousand or 31%, to R$435,987 thousand in 2020, going from R$332,662 thousand in 2019). For more information on our Net revenue increase per region, please see the detailed breakdown in “— Revenue by Geography” below.
Net revenue by Industry Vertical
The following table sets forth a breakdown of Net revenue by industry vertical by and as a percentage of our total Net revenue for the periods indicated:
| Year ended December 31, |
|---|
| 2020 |
| 2019 |
|---|
| (in thousands of Brazilian reais, except for percentages) |
|---|
By Industry Vertical | |
| |
| |
| |
Financial Services | 324,117 |
| 34% |
| 231,813 |
| 34% |
Food and Beverages | 244,590 |
| 26% |
| 116,911 |
| 17% |
Pharmaceuticals and Cosmetics | 134,763 |
| 14% |
| 85,410 |
| 13% |
Retail and Manufacturing | 83,046 |
| 9% |
| 65,130 |
| 10% |
Technology, Media and Telecom | 81,961 |
| 9% |
| 92,131 |
| 14% |
Education and Services | 41,323 |
| 4% |
| 21,042 |
| 3% |
Others | 46,719 |
| 5% |
| 64,714 |
| 10% |
Total Net revenue | 956,519 |
| 100% |
| 677,133 |
| 100% |
The variation of Net revenue by industry vertical reflected an increase in percentage of Net revenue from the food and beverages vertical, given increased digital transformation investments in that industry which were propelled by initiatives in response to the COVID-19 pandemic. We had a decline in revenue from the technology, media and telecom vertical as a consequence of the impacts of the COVID-19 pandemic on our clients in the media segment.
Net revenue by Geography
The following table sets forth a breakdown of Net revenue by geographic market by and as a percentage of our total Net revenue for the periods indicated:
| Year ended December 31, |
| 2020 |
| 2019
|
| (in thousands of Brazilian reais, except for percentages) |
By Geography | |
| |
| |
| |
North America & Europe | |
| |
| |
| |
North America | 451,999 |
| 47% |
| 284,321 |
| 42% |
Europe | 19,764 |
| 2% |
| 25,044 |
| 4% |
Subtotal North America & Europe | 471,763 |
| 49% |
| 309,365 |
| 46% |
Latam (Latin America) | 435,987 |
| 46% |
| 332,662 |
| 49% |
Asia, Pacific and Japan | 48,769 |
| 5% |
| 35,106 |
| 5% |
Total Net revenue | 956,519 |
| 100% |
| 677,133 |
| 100% |
The variation of Net revenue by geography is explained by (i) increased demand for digital services in 2020 when compared to 2019, mostly in the U.S. and Brazil, and (ii) positive exchange rate effect derived from our U.S. dollar-denominated contracts.
Net revenue by Client Concentration
We generate a significant portion of our Net revenue from our ten largest clients.
The increase in revenue from our Top Client in 2020 resulted from strategic programs gaining traction during the year, bringing us the opportunity to allocate more teams to expedite the delivery of services as we increased the scope of our engagement and entered into additional statements of work.
The following table sets forth the Net revenue derived from our Top Client and Top Ten Clients by Net revenue and as a percentage of our total Net revenue for the periods indicated:
| Year ended December 31, |
|---|
| 2020 |
| 2019 |
|---|
| (in thousands of Brazilian reais, except for percentages) |
|---|
Client Concentration | |
| |
| |
| |
Top Client | 190,599 |
| 20% |
| 97,248 |
| 14% |
Top Ten Clients | 644,722 |
| 67% |
| 417,547 |
| 62% |
Total Net revenue | 956,519 |
| |
| 677,133 |
| |
Costs of services provided
Costs of services provided for 2020 amounted to R$600,866 thousand, an increase of R$151,887 thousand, or 34%, from R$448,979 thousand in 2019.
The most significant increase of costs of services provided was associated with employee expenses, which increased by R$157,953 thousand, or 34%, to R$533,997 thousand in 2020, from R$376,044 thousand in 2019, due to new hires and promotions necessary to answer the growing demand for our services as our growth strategy depends on the hiring and retention of talent.
Depreciation and amortization related to cost of services provided increased by R$4,558 thousand, or 23%, to R$24,085 thousand in 2020 from R$19,527 thousand in 2019. This was due to an increased amortization of right-of-use assets due to the opening of a new office in Brazil, as well as an increased depreciation also related to the remodeling of offices (leasehold improvements jumped to R$16,460 thousand in 2020 from R$12,584 thousand in 2019) combined with the depreciation of recently acquired equipment for new employees (expenses related to IT equipment increased by R$6,486 thousand in the period, to R$15,407 thousand in 2020 from R$8,921 thousand in 2019).
We also had an increase in third-party services and other inputs related to costs of services provided due to higher expenditures with business consultants, which increased by R$2,603 thousand, or 151%, to R$4,330 thousand in 2020 from R$1,727 thousand in 2019. This increase was driven by our need to respond to increased demand from our clients in the short term, which we addressed by hiring third-party consultants.
These increases were partially offset by a reduction in travel expenses related to costs of services provided by R$14,531 thousand, or 66%, to R$7,517 thousand in 2020 from R$22,049 thousand in 2019, caused by the travel restrictions and the implementation of remote work policies due to the outbreak of the COVID-19 pandemic.
Gross profit
As a result of the foregoing, Gross profit for 2020 was R$355,653 thousand, an increase of R$127,499 thousand, or 56%, from R$228,154 thousand for 2019.
Operating expenses, net
Operating expenses increased by R$10,954 thousand, or 8%, to R$147,409 thousand in 2020, from R$136,455 thousand in 2019, due to the increase in selling and administrative expenses, which were partially compensated by decreases in research and technological innovation expenses and impairment loss on trade receivables and contract assets, as per following detailed explanations.
Selling, general and administrative expenses increased by R$20,255 thousand, or 16%, to R$146,254 thousand in 2020, from R$125,199 thousand in 2019. This increase was driven by (i) an increase in employee expenses of R$20,844 thousand or 29%, to R$92,816 thousand in 2020, from R$71,972 thousand in 2019, due to new hires and promotions for back-office and sales teams; (ii) an increase in advertising and publicity expenses of R$7,963 thousand or 668%, to R$9,155 thousand in 2020, from R$1,192 thousand in 2019, related to a global marketing campaign launched in the second half of 2020; and (iii) an increase in other third-party services of R$3,978 thousand or 43%, to R$13,176 thousand in 2020, from R$9,198 thousand in 2019, related to additional expenses with recruiting services, business licenses and permits, and business consultant in the second half of 2020. This increase was partially offset by a decrease of R$14,909 thousand in other expenses related to indemnities paid, to R$18 thousand provision reversal in 2020, from R$14,891 thousand of expenses in 2019 related to the indemnification payments related to the cancellation of former share-based compensation plans.
Research and technological innovation expenses decreased by R$8,631 thousand, or 71%, to R$3,462 thousand in 2020, from R$12,063 thousand in 2019, as we strategically decided to discontinue investments in products not related to CI&T’s main business (such products are related to our former subsidiary CI&T IOT, renamed Neowrk Sistemas Inteligentes S/A in September 2021).
Operating profit before financial income
As a result of the foregoing, operating profit before financial income for 2020 was R$208,244 thousand, an increase of R$116,545 thousand, or 127%, from R$91,699 thousand for 2019.
Net finance costs
In 2020, net finance costs increased by R$9,542 thousand, or 161%, to R$15,453 thousand in 2020, from R$5,911 thousand in 2019. This was due to the appreciation of the U.S. dollar against Brazilian reais in 2020.
Our finance income increased by R$23,864 thousand, or 100%, to R$47,808 thousand in 2020 from R$23,944 thousand in 2019. The increase is due to foreign exchange gains related to the appreciation of the U.S. dollar against Brazilian reais in 2020 (a R$15,646 thousand increase) and gains on our foreign exchange derivatives (a net R$7,877 thousand increase).
Our finance cost increased by R$33,406 thousand, or 112%, to R$63,261 thousand in 2020 from R$29,855 thousand in 2019. The increases are explained by foreign exchange losses related to the appreciation of the U.S. dollar against Brazilian reais in 2020 (R$8,826 thousand increase) and losses on our foreign exchange derivatives (a net R$22,773 thousand increase).
Profit before income tax
As a result of the foregoing, profit before income tax for 2020 was R$192,791 thousand, an increase of R$107,003 thousand, or 125%, from R$85,788 thousand for 2019.
Income tax expense
Income tax expense for 2020 was R$65,137 thousand, an increase of R$35,918 thousand, or 123%, from R$29,219 thousand for 2019. This increase was primarily attributable to the increase in profit before income tax to R$192,791 thousand in 2020 given our increases in Net revenue. See note 22 to the audited consolidated financial statements for a reconciliation of income tax expense to the tax expense based on the Company’s domestic tax rate.
Net profit for the year
As a result of the foregoing, our Net profit for 2020 was R$127,654 thousand, an increase of R$71,085 thousand, or 126%, from R$56,569 thousand for 2019.
Other metrics, including IFRS and Non-IFRS Financial Measures
| Year ended December 31, |
| 2021 |
| 2021 |
| 2020 |
| (in thousands of US$)* |
| (in thousands of Brazilian reais) |
Other data: | |
| |
| |
Gross profit margin | 35.2% |
| 35.2% |
| 37.2% |
Adjusted Gross Profit | 97,207 |
| 542,463 |
| 379,877 |
Adjusted Gross Profit Margin | 37.6% |
| 37.6% |
| 39.7% |
Adjusted EBITDA | 58,074 |
| 324,081 |
| 237,917 |
Adjusted EBITDA Margin | 22.4% |
| 22.4% |
| 24.9% |
Adjusted Net Profit | 28,139 |
| 157,029 |
| 128,082 |
Adjusted Net Profit Margin | 10.9% |
| 10.9% |
| 13.4% |
| * | For convenience purposes only, amounts in reais for the year ended December 31, 2021 have been translated to U.S. dollars using an exchange rate of R$5.5805 to US$1.00, the commercial selling rate for U.S. dollars as of December 31, 2021, as reported by the Brazilian Central Bank. These translations should not be considered representations that any such amounts have been, could have been or could be converted at that or any other exchange rate. |
Non-IFRS Measures
We regularly monitor a number of financial and operating metrics to evaluate our business, measure our performance, identify trends affecting our business, formulate financial projections and make strategic decisions. These non-IFRS financial measures include Adjusted Gross Profit, Adjusted Gross Profit Margin, Adjusted EBITDA, Adjusted EBITDA Margin, Adjusted Net Profit for the period, Adjusted Net Profit Margin for the period, Net Revenue at Constant Currency and should be considered in addition to results prepared in accordance with IFRS, but not as substitutes for IFRS results. In addition, our calculation of these non-IFRS financial measures may be different from the calculation used by other companies, and therefore comparability may be limited. These non-IFRS financial measures are provided as additional information to enhance investors’ overall understanding of the historical and current financial performance of our operations.
Adjusted Gross Profit and Adjusted Gross Profit Margin
We use Adjusted Gross Profit as the main key performance indicator (“KPI”) for monitoring the operational performance of our projects. In calculating Adjusted Gross Profit, we exclude cost components that are not tied to the direct management of our projects (i.e., costs and expenses derived from decisions that are done by centralized administration, and not by project managers), as well as depreciation and amortization. These adjustments are applied in order to allow us to evaluate the profitability of a project or customer reflecting only the outcome under the direct management of the project managers, and to assist us and our project managers in evaluating risks and opportunities associated with potential contract renewals or renegotiations with customers for existing and future projects.
To calculate Adjusted Gross Profit, we adjust the Gross profit to:
| ● | Exclude depreciation and amortization costs; and |
●
| Exclude stock option compensation expense. |
Based on Adjusted Gross Profit, we are able to verify if we are allocating resources optimally, and how much of the revenue generated from our projects is converted into Gross profit.
In addition, we also monitor Adjusted Gross Profit Margin, which is Adjusted Gross Profit divided by Net revenue. Adjusted Gross Profit Margin is a useful metric of our profitability and allows us to have a view on minimum profitability, on a percentage point basis, that we expect to derive from different projects and clients.
Adjusted EBITDA and Adjusted EBITDA Margin
We also regularly monitor Adjusted Earnings Before Interest, Taxes, Depreciation and Amortization (“Adjusted EBITDA”) and Adjusted EBITDA Margin.
For the year ended December 31, 2021 the adjustments applied to Net Income in calculating Adjusted EBITDA were:
| ● | Addition of net finance costs, income tax expense, depreciation and amortization; |
●
| Stock option and indemnity payments related to the cancellation of the share-based compensation plan (for additional information, see note 24.b to our audited consolidated financial statements); |
| ● | Consulting expenses, related to corporate reorganization, our IPO and mergers and acquisitions (for additional information, see note 24.c to our audited consolidated financial statements); |
| ● | Government grants for tax reimbursements in our subsidiary in China (for additional information, see note 24.1 to our audited consolidated financial statements); and |
| ● | Impairment of Dextra intangible asset (for additional information, see note 24.1 to our audited consolidated financial statements). |
We make these adjustments to isolate our operating results in a given period, in order to verify whether we are being efficient in generating operating profits, or how much of our Net profit is being consumed by operating costs, and how much is reverting to operating profitability.
In addition, we also monitor Adjusted EBITDA Margin, which is Adjusted EBITDA, respectively, divided by Net revenue for the same period. Adjusted EBITDA Margin allows us to compare and track operating profitability for different periods and regions.
Adjusted Net Profit for the period and Adjusted Net Profit Margin for the period
We regularly monitor our Adjusted Net Profit for the period and Adjusted Net Profit Margin for the period. We calculate Adjusted Net Profit for the period by excluding certain impacts on Net profit for the period. For the year ended December 31, 2021 and 2020, the adjustments applied to Net profit for the period in calculating Adjusted Net Profit were the exclusion of indemnity payments related to the cancellation of a share-based compensation plan (see note 24 b to our audited consolidated financial statements), consulting expenses mainly related to legal fees and to the corporate reorganization (see note 24.c to our audited consolidated financial statements), as well as the impairment of intangible assets related to the Dextra acquisition, initially recognized as internally developed software (see notes 14 and 24.1 to our audited consolidated financial statements).
In addition, we also monitor Adjusted Net Profit Margin for the period, which is Adjusted Net Profit for the period divided by Net revenue. Adjusted Net Profit Margin for the period is a useful metric since it allows us to have a view on profit creation efficiency regardless of changes in the scale of Net profit for different periods.
Net Revenue at Constant Currency and Net Revenue Increase at Constant Currency
We monitor our Net Revenue at Constant Currency and Net Revenue Increase at Constant Currency. As the impact of foreign currency exchange rates is highly volatile and difficult to predict, we believe Net Revenue at Constant Currency and Net Revenue Increase at Constant Currency allow us to better understand the underlying business trends and performance of our ongoing operations on a period-over-period basis by eliminating the effect of fluctuations in the exchange rates we use in the translation of our Net revenue in foreign currencies into Brazilian reais. We calculate Net Revenue at Constant Currency and Net Revenue Increase at Constant Currency by translating Net revenue from entities reporting in foreign currencies into Brazilian reais using the comparable foreign currency exchange rates from the prior period. The average rates in effect for the fiscal year ended December 31, 2019 were used to convert Net revenue for the fiscal year ended December 31, 2020.The average rates in effect for the year ended December, 2020 were used to convert Net revenue for the year ended December 31, 2021. Net Revenue at Constant Currency and Net Revenue Increase at Constant Currency are not measures calculated in accordance with IFRS. While we believe that Net Revenue at Constant Currency and Net Revenue Increase at Constant Currency provide useful information to investors in understanding and evaluating our results of operations in the same manner as our management, our use of Net Revenue at Constant Currency and Net Revenue Increase at Constant Currency has limitations as an analytical tool, and you should not consider it in isolation or as a substitute for analysis of our financial results as reported under IFRS. Further, other companies, including companies in our industry, may report the impact of fluctuations in foreign currency exchange rates differently, which may reduce the value of our Net Revenue at Constant Currency and Net Revenue Increase at Constant Currency as a comparative measure.
| | Year ended December 31, |
| Net revenue increase %(2) | 2021 | 2020 |
| | (in thousands of Brazilian reais) |
Net revenue (as reported) | 51% | 1,444,380 | 956,519 |
Net Revenue at Constant Currency)(1) | 47% | 1,408,679 | 958,142 |
| (1) | We calculate Net Revenue at Constant Currency and Net Revenue Increase at Constant Currency by translating Net revenue from entities reporting in foreign currencies into Brazilian reais using the comparable foreign currency exchange rates from the prior period rather than the actual exchange rates in effect during the respective period. The annual average rates in effect for the fiscal year ended December 31, 2020 that were used to calculate Net Revenue at Constant Currency for the fiscal year ended December 31, 2021 and 2020 were 5.178 Brazilian reais to U.S. dollars, 3.569 Brazilian reais to Australian dollars, 3.848 Brazilian reais to Canadian dollars, 0.749 Brazilian reais to renminbi, 5.899 Brazilian reais to euros, 6.618 Brazilian reais to British pounds and 0.048 Brazilian reais to Japanese yen. |
| (2) | Net revenue increase is the percentage increase in Net revenue or Net Revenue at Constant Currency, as applicable from one period to the following comparable period, as measured using Net revenue (as reported) or Net Revenue at Constant Currency, as applicable. |
| | Year ended December 31, |
| Net revenue increase %(2) | 2020 | 2019 |
| | (in thousands of Brazilian reais) |
Net revenue (as reported) | 41% | 956,519 | 677,133 |
Net Revenue at Constant Currency)(1) | 24% | 835,937 | 676,172 |
| (1) | We calculate Net Revenue at Constant Currency and Net Revenue Increase at Constant Currency by translating Net revenue from entities reporting in foreign currencies into Brazilian reais using the comparable foreign currency exchange rates from the prior period rather than the actual exchange rates in effect during the respective period. The annual average rates in effect for the fiscal year ended December 31, 2019 that were used to calculate Net Revenue at Constant Currency for the fiscal year ended December 31, 2020 and 2019 were 3.946 Brazilian reais to U.S. dollars, 2.745 Brazilian reais to Australian dollars, 2.9746 Brazilian reais to Canadian dollars, 0.5709 Brazilian reais to renminbi, 4.459 Brazilian reais to euros, 5.0362 Brazilian reais to British pounds and 0.0362 Brazilian reais to Japanese yen. |
| (2) | Net revenue increase is the percentage increase in Net revenue or Net Revenue at Constant Currency, as applicable from one period to the following comparable period, as measured using Net revenue (as reported) or Net Revenue at Constant Currency, as applicable. |
The following table presents a reconciliation of Adjusted Gross Profit, Adjusted EBITDA, and Adjusted Net Profit for the period, as well as their respective margins, to the most comparable IFRS measure for each such metric:
| Year ended December 31, |
|---|
| 2021 | 2021 | 2020 |
| (in thousands of US$) | (in thousands of Brazilian reais) |
|---|
Net revenue | 258,826 | 1,444,380 | 956,519 |
Reconciliation of Adjusted Gross Profit | | | |
Gross Profit | 91,147 | 508,648 | 355,653 |
Adjustments | | | |
Depreciation and amortization (cost of services provided) | 5,714 | 31,884 | 24,085 |
Stock Options | 346 | 1,930 | 139 |
Adjusted Gross Profit | 97,207 | 542,462 | 379,877 |
Adjusted Gross Profit Margin | 37.6% | 37.6% | 39.7% |
Reconciliation of Adjusted EBITDA | | | |
Net profit for the period | 22,571 | 125,957 | 127,654 |
Adjustments | | | |
Net finance costs | 6,134 | 34,232 | 15,453 |
Income tax expense | 15,127 | 84,417 | 65,137 |
Depreciation and amortization | 8,665 | 48,354 | 29,882 |
Stock Options | 453 | 2,531 | 934 |
Indemnity | 0 | 0 | (18) |
Consulting expenses | 1,645 | 9,177 | 446 |
Government grants | (445) | (2,481) | (1,571) |
Impairment of intangible assets | 3,923 | 21,895 | 0 |
Adjusted EBITDA | 58,074 | 324,081 | 237,917 |
Adjusted EBITDA Margin | 22.4% | 22.4% | 24.9% |
Reconciliation of Adjusted Net Profit | | | |
Net profit for the period | 22,571 | 125,957 | 127,654 |
Adjustments | | | |
Indemnity | 0 | 0 | (18) |
Consulting expenses | 1,645 | 9,177 | 446 |
Impairment of intangible assets | 3,923 | 21,895 | 0 |
Adjusted Net profit for the period | 28,139 | 157,029 | 128,082 |
Adjusted Net profit Margin for the period | 10.9% | 10.9% | 13.4% |
| * | For convenience purposes only, amounts in reais for the year ended December 31, 2021 have been translated to U.S. dollars using an exchange rate of R$5.5805 to US$1.00, the commercial selling rate for U.S. dollars as of December 31, 2021, as reported by the Brazilian Central Bank. These translations should not be considered representations that any such amounts have been, could have been or could be converted at that or any other exchange rate. |
- Liquidity and Capital Resources
As of December 31, 2021, we had R$135,727 thousand in cash and cash equivalents and R$798,786 thousand in financial investments.
In the ordinary course of business, our principal funding requirements are for working capital requirements, capital expenditures and investments, servicing our indebtedness and distributions to our shareholders. We typically meet these requirements through operational cash flow and borrowings from private banks. As a result of such borrowings, we may be subject to restrictions and covenants in the agreements governing these transactions that may place limitations on us. See “Indebtedness” below. Our financing strategy is to fund our necessary capital expenditures and to preserve our liquidity while meeting our debt payment obligations.
We believe that our cash and cash equivalents (in the amount of R$135,727 thousand as of December 31, 2021), and financial investments (in the amount of R$798,786 thousand as of December 31, 2021) will be adequate to meet our capital expenditure requirements and liquidity needs in 2022. In January 2022, we paid R$341 million in cash for the acquisition of Somo Global.
We have R$164,403 thousand in loans and borrowings maturing in 2022. For the long-term, we have non-current loans and borrowings of R$624,306 thousand, of which R$112,031 thousand matures in 2023, and R$512,275 thousand matures until 2026. We believe that our cash generated from operations, new borrowings in the financial and capital markets or additional equity issuance will be adequate to meet our capital expenditure requirements and liquidity needs for the next twelve months.
As of December 31, 2021, 87 % of our cash and cash equivalents are held in U.S. dollars and Brazilian reais, with the remaining 13 % held in Australian dollars, euros, pounds, Canadian dollars, Chinese Yuan and Japanese yen based on the relevant subsidiary. Additionally, as of December 31, 2021, we had R$798,786 thousand (US$143,139 thousand) in financial investment, fully allocated in a U.S. dollars interest-bearing account, presenting immediate liquidity and is readily convertible into a known amount of cash, subject to an insignificant risk of changes in value in U.S. dollars, in order to fulfill our short-term commitments in U.S. dollars.
We aim to maintain adequate liquidity levels at each of our subsidiaries, based on the cash generated from operating activities and borrowings from private banks. However, our liquidity assumptions may prove to be incorrect, and we could exhaust our available financial resources sooner than we currently expect. We may seek to raise additional funds at any time through equity, equity-linked or debt financing arrangements. Our future capital requirements and the adequacy of available funds will depend on many factors, including those described in the section of this report captioned “Risk Factors.” We may not be able to secure additional financing to meet our operating requirements on acceptable terms, or at all.
We have an efficient cash flow control system that allows us to maintain cash available in sufficient amounts to meet our obligations as they become due, and we also have an investment policy to direct our available resources to the available options in the market. Our investment policy is designed to minimize the credit risk of our counterparties.
In 2021, CI&T Brazil declared and paid dividends in the amount of R$71,040 thousand (US$12,730 thousand), based on profits from 2020. In addition, on October 8, 2021, the shareholders of CI&T Brazil approved an extraordinary dividend payment of R$55,005 thousand (US10,997 thousand) based on profits from the previous fiscal year, which was paid to the existing shareholders of CI&T Brazil on October 18, 2021 from the profit reserve account.
The following table shows the generation and use of cash for the years ended December 31, 2021, 2020 and 2019:
Cash Flow Data:
| Year ended December 31, |
| 2021 |
| 2021 |
| 2020 |
| 2019 |
| (in thousands of US$)* |
| (in thousands of Brazilian reais) |
Cash flow from operating activities | 23,722 |
| 132,379 |
| 100,972 |
| 91,357 |
Net cash used in investing activities | (270,145) |
| (1,507,544) |
| (21,391) |
| (16,551) |
Net cash from (used in) financing activities | 246,710 |
| 1,376,766 |
| 5,409 |
| (69,666) |
Exchange variation effect on cash and cash equivalents | (3,754) |
| (20,949) |
| (1,663) |
| (1,464) |
Cash reduction due to spin-off effect | (1,389) |
| (7,752) |
| - |
| (1,255) |
Cash and cash equivalents as of January 1st | 29,178 |
| 162,827 |
| 79,500 |
| 77,079 |
Net increase (decrease) in Cash and cash equivalents at end of period | (4,856) |
| (27,100) |
| 83,327 |
| 2,421 |
| * | For convenience purposes only, amounts in reais for the year ended December 31, 2021 have been translated to U.S. dollars using an exchange rate of R$5.5805 to US$1.00, the commercial selling rate for U.S. dollars as of December 31, 2021, as reported by the Brazilian Central Bank. These translations should not be considered representations that any such amounts have been, could have been or could be converted at that or any other exchange rate. |
Net cash (used in) from operating activities
Net cash from operating activities was R$132,379 thousand for 2021 compared to net cash from operating activities of R$100,972 thousand for 2020. This increase is mainly attributed to our revenue increase during 2021, partially offset by higher costs of services provided and expenses, as detailed above, combined with an increase in trade receivables and contract assets in 2021, associated with the increase in net revenue.
Net cash provided by operating activities was R$100,972 thousand for 2020, as compared to net cash provided by operating activities of R$91,357 thousand for 2019. This increase is mainly attributed to our revenue increase during 2020. This increase was offset by a R$43,354 thousand decrease related to the payment of share-based indemnity for the cancellation of stock option plans in 2019 paid in 2020 and higher income taxes paid.
Net cash used in investing activities
Net cash used in investing activities was R$1,507,544 thousand for 2021, as compared to net cash used in investing activities of R$21,391 thousand for 2020. This increase is mainly due to (i) a R$784,915 thousand investment of the net proceeds from our IPO; and (ii) a R$692,722 thousand payment we made for the acquisition of Dextra Group, according to the purchase agreement (see note 9 to the audited consolidated financial statements). Investments in acquisition of property and equipment and intangible assets totaled R$29,907 thousand in 2021 and R$21,391 thousand in 2020.
Net cash used in investing activities was R$21,391 thousand for 2020, as compared to net cash used in investing activities of R$16,551 thousand for 2019. This increase of R$4,840 thousand is mainly due to (i) a R$1,498 thousand increase of investments in property, plant and equipment for the creation of our “Global Tech” base located in Campinas (Brazil) in 2020 and “Primas Bay” in 2019 in order to expand our services in Latin America; and (ii) a redemption of financial investments of R$4,838 thousand in 2019, which did not occur in 2020. These were partially offset by an escrow account payment of R$1,496 thousand in 2019, which did not occur in 2020.
Net cash from (used in) financing activities
Net cash from financing activities was R$1,376,766 thousand for 2021, as compared to net cash from financing activities of R$5,409 thousand in 2020. This increase is mainly attributable to: (i) the net proceeds from our IPO in the amount of R$860,073 thousand, the proceeds from loans and borrowings in the amount of R$740.596 thousand, partially offset by (ii the payment of dividends in the amount of R$126,045 thousand; and (iii) the payment of loans and borrowings in a total amount of R$75,196 in 2021.
Net cash from financing activities was R$5,409 thousand for 2020, as compared to net cash used in financing activities of R$69,666 thousand in 2019. This variance is due to an increase of R$136,090 thousand in proceeds from loans and borrowings in 2020. In 2020, we generated R$144,269 thousand in proceeds from loans and borrowings to support the uncertainty of the impact on cash caused by the COVID-19 pandemic, while we paid R$30,977 thousand in dividends, R$88,107 thousand in loans and borrowings and R$15,500 thousand in lease liabilities. In 2019, we paid R$40,059 thousand in dividends, R$24,161 thousand in loans and borrowings and R$10,949 thousand in lease liabilities, while we generated R$8,179 thousand in proceeds from loans and borrowings.
Cash reduction due to spin-off effect
Cash reduction due to spin-off effects for the year ended December 31, 2021 relates to the spin-off on April 30, 2021 of our former subsidiary CI&T IOT (renamed Neowrk Sistemas Inteligentes S/A in September 2021) which held a total cash amount of R$7,752 thousand as of April 30, 2021. For the year ended December 31, 2019, cash reduction due to spin-off effects relates to the spin-off on April 30, 2019 of our former subsidiary Sensedia S.A. (“Sensedia”) which held a total cash amount of R$1,255 thousand as of April 30, 2019.
Indebtedness
As of December 31, 2021, our total outstanding consolidated indebtedness (non-current and current loans and borrowings) was R$788,709 thousand, consisting of R$164,403 thousand of short-term indebtedness, including the current portion of long-term indebtedness, and R$624,306 thousand of long-term indebtedness. The increase of R$699,479 thousand in total outstanding consolidated indebtedness from December 31, 2020 is mainly related to the financing of the Dextra acquisition in the amount of R$678,633 thousand.
As of December 31, 2021, the debt listed below was outstanding. We seek to obtain financing at the most favorable rate available to us and to maintain a balanced debt profile combining fixed and variable rate debt:
| ● | Export Credit Notes (NCE) issued to Banco Bradesco in the total principal amount of R$11,684 thousand bearing interest at the CDI rate + 1.10% and CDI rate + 3.57% due in February 2023 and July 2026, respectively. |
| ● | an Export Credit Note (NCE) issued to Banco Itaú in the principal amount of R$2,349 thousand bearing interest at rate 4.82% due in July 2022; |
| ● | a Revolving Credit Facility with Citibank entered into by our U.S. subsidiary CI&T Inc, from which we have drawn an amount of R$11,164 thousand, bearing interest at the three-month Libor rate + 1.90%; |
| ● | an Advance of Foreign Exchange Agreement (ACC) with Banco do Brasil in the amount of R$56,551 thousand, bearing fixed interest at 2.37% due in June 2022; |
| ● | Advance of Foreign Exchange Agreements (ACC) with Citibank in the total amount of R$28,328 thousand, bearing fixed interest at 2.30% due in March 2022 and 2.28% due in June 2022. |
| ● | an Export Credit Note (NCE) issued to Banco Bradesco in the principal amount of R$306,417 thousand bearing interest at the CDI rate + 1.75% due in July 2026; |
| ● | a Law 4,131 Loan issued to Banco Santander in the principal amount of R$204,047 thousand bearing interest at the CDI rate + 1.60% due in July 2026; and |
| ● | an Export Credit Note (NCE) issued to Banco Citibank in the principal amount of R$168,169 thousand bearing interest at the three-month Libor rate + 2.07% due in July 2026. |
Certain of our debt instruments described above include covenants and events of default triggers, including acceleration events in the event of a change of control. The most relevant are the restrictions related to a change of shareholder control without prior consent of the creditor and the requirement to maintain a net debt to EBITDA ratio below or equal to 3:00 to 1:00. The net debt/EBITDA ratio is calculated using only our financial debt and we are also able to exclude expenses related to mergers and acquisitions (M&A) and IPO events incurred during a given fiscal year. As of December 31, 2021, we were in compliance with all such financial covenants.
Capital Expenditures
In the year ended December 31, 2021, we made investments in property and equipment and intangible assets of R$29,907 thousand. In 2020 and 2019, we made investments in property and equipment and intangible assets of R$21,391 thousand and R$19,893 thousand, respectively. These capital expenditures are mainly related to new IT equipment and software investments.
The increase in the acquisition of fixed assets is related to IT equipment (laptops, monitors and smartphones) for new employees and inventory renovation, new firewall equipment to support the company growth, and to constructions and improvements in progress. For intangibles, the primary additions were related to network software renovation to support the company growth, corporate systems for management to support the new compliance and regulatory policies and corporate database upgrades to comply with information security, regulatory and privacy data policies.
The following table sets forth our capital expenditures for the fiscal years 2021, 2020 and 2019:
| Year ended December 31, |
| 2021 |
| 2021 |
| 2020 |
| 2019 |
| (in thousands of US$)* |
| (in thousands of Brazilian reais) |
Fixed assets acquisitions | 4,613 |
| 25,742 |
| 19,626 |
| 17,783 |
Intangible assets acquisitions | 746 |
| 4,165 |
| 1,765 |
| 2,110 |
Total Capital Expenditures | 5,359 |
| 29,907 |
| 21,391 |
| 19,893 |
| * | For convenience purposes only, amounts in reais for the year ended December 31, 2021 have been translated to U.S. dollars using an exchange rate of R$5.5805 to US$1.00, the commercial selling rate for U.S. dollars as of December 31, 2021, as reported by the Brazilian Central Bank. These translations should not be considered representations that any such amounts have been, could have been or could be converted at that or any other exchange rate. |
We expect to increase our capital expenditures, mainly related to IT equipment, as we hire new people to support the growth in our business and operations.
Our future capital requirements will depend on several factors, including our growth rate, the expansion of our research and development efforts, employee headcount, marketing and sales activities, the introduction of new features to our existing products and the continued market acceptance of our products.
- Research and Development, Patents and Licenses, etc.
See “Item 4. Business Overview — Intellectual Property.”
- Trend Information
See “Item 5. Operating and Financial Review and Prospects — Factors Affecting Results of Operations.”
- Critical Accounting Policies and Estimates
Our audited consolidated financial statements are prepared in conformity with IFRS as issued by the IASB. In preparing our audited consolidated financial statements, we make assumptions, judgments and estimates that can have a significant impact on amounts reported in our audited consolidated financial statements. We base our assumptions, judgments and estimates on historical experience and various other factors that we believe to be reasonable under the circumstances. Actual results could differ materially from these estimates under different assumptions or conditions.
We regularly reevaluate our assumptions, judgments, and estimates. Estimates and underlying assumptions are reviewed on an ongoing basis. The revisions to estimates are recognized prospectively.
Judgments
Information about judgments made in the application of accounting policies that have significant effects on the amounts recognized in our audited consolidated financial statements are as follow:
| ● | Lease term: whether the Group is reasonably certain to exercise extension options (see note 7 to our audited consolidated financial statements); |
| ● | Revenue recognition: whether service revenue is recognized over time or at point in time (see note 23 to our audited consolidated financial statements). |
Assumptions and estimation uncertainties
Information about assumptions and estimation uncertainties that have a significant risk of resulting in a material adjustment to carrying amounts of assets and liabilities in the next fiscal year is as follow:
| ● | acquisition of subsidiary: fair value of the consideration transferred, fair value of the assets acquired and liabilities (see note 9 to our audited consolidated financial information). |
Measurement of fair values
Several of our accounting policies and disclosures require the measurement of fair values for both financial and non-financial assets and liabilities.
We have established a control framework with respect to the measurement of fair value that includes the review of significant fair value measurements, including significant unobservable data and valuation adjustments. If third-party information, such as broker quotes or pricing services, is used to measure fair values, the valuation team assesses the evidence obtained from third parties to support the conclusion that such valuations meet the requirements of the accounting standards, including the level in the fair value hierarchy in which the valuations should be classified.
When measuring the fair value of an asset or a liability, we use observable market data as much as possible. Fair values are classified at different levels in a hierarchy based on the information (inputs) used in the valuation techniques as follows:
| ● | Level 1: Quoted prices (not adjusted) in active markets for identical assets or liabilities. |
| ● | Level 2: Inputs, except for quoted prices, included in Level 1, which are observable for the asset or liability, either directly (prices) or indirectly (derived from prices). |
●
| Level 3: Inputs for the asset or liability, which are not based on observable market data (unobservable inputs). |
Additional information on the assumptions used to measure fair values is included in the following notes to our audited consolidated financial statements:
| ● | Note 9 – business combination - acquisition of subsidiary; |
| ● | Note 21 – share-based payment transactions and the compensation for the cancellation of the share based plan; and |
●
| Note 28 – financial instruments. |
ITEM 6. Directors, Senior Management and Employees
- Directors and Senior Management
Our Articles of Association provide that, unless otherwise determined by a special resolution of shareholders, the board of directors will be composed of four to eleven directors, with the number being determined by a majority of the directors then in office. There are no provisions relating to retirement of directors upon reaching any age limit.
Our Articles of Association provide that directors shall be elected by an ordinary resolution of shareholders, which requires the affirmative vote of a simple majority of the votes cast on the resolution by the shareholders entitled to vote who are present, in person or by proxy, at the meeting. Each director shall be appointed and elected for annual terms or such other terms as the resolution appointing him or her may determine or until his or her death, resignation or removal.
Any vacancies on the board of directors that arise other than upon the removal of a director by resolution passed at a general meeting can be filled by the remaining directors (notwithstanding that they may constitute less than a quorum). Any such appointment shall be as an interim director to fill such vacancy until the next annual general meeting of shareholders. Our board of directors is composed of seven members.
The following table presents the names of the members of our board of directors:
Name |
| Age |
| Position |
Fernando Matt Borges Martins |
| 49 |
| Director |
Brenno Raiko de Souza |
| 37 |
| Chairman |
Cesar Nivaldo Gon |
| 50 |
| Director |
Patrice Philippe Nogueira Baptista Etlin |
| 58 |
| Director |
Silvio Romero de Lemos Meira |
| 67 |
| Independent Director |
Maria Helena dos Santos Fernandes de Santana |
| 62 |
| Independent Director |
Eduardo Campozana Gouveia |
| 57 |
| Independent Director |
The following is a brief summary of the business experience of our directors. Unless otherwise indicated, the current business address for our directors is Rua Dr. Ricardo Benetton Martins — SP 340 — KM 118.5, No. 1,000, Building 23-B Parque II do Polo de Alta Tecnologia Campinas — CIATEC 13086-902, Campinas — SP, Brasil.
Fernando Matt Borges Martins. Mr. Martins is a member of our board of directors and one of the founders of CI&T. Mr. Martins was CI&T Brazil’s CFO from 2002 until 2014. He is an experienced executive in the information technology industry and was the Chairperson of CI&T Brazil from June 2014 to May 2021, as well as a member of CI&T Brazil’s finance committee, HR committee and ESG committee. Mr. Martins also serves as director of Sensedia, CFO of Neowrk and is an angel investor in tech and non-tech start- ups and actively contributes to the entrepreneurship ecosystem in Brazil. Mr. Martins holds a master’s degree in Economics and Finance from Fundação Getúlio Vargas — EAESP, Brazil and degrees in business administration and computer engineering from Fundação Getúlio Vargas — CEAG, Brazil and the State University of Campinas (UNICAMP).
Brenno Raiko de Souza. Mr. Raiko is the Chairman of our board of directors. Mr. Raiko is a Managing Director of Advent, which he joined in 2011, and is based in Advent’s São Paulo office and is responsible for investments in the technology sector in Latin America. Mr. Raiko has worked on 12 investments while at Advent, including CI&T, Easynvest, EBANX, Nubank, YDUQS, Fortbras Group, Grupo Biotoscana, Sophos Solutions and Terminal de Contêineres de Paranaguá (TCP). Previously, he was an associate at Kearney in São Paulo and New York for four years. His consultancy experience includes M&A strategy, commercial due diligence, and corporate strategy and operations for a broad range of industries. Mr. Raiko holds a BS in Economics from Fundação Getulio Vargas in Rio de Janeiro and earned an MBA from Harvard Business School, with a Fundação Estudar merit-based scholarship.
Cesar Nivaldo Gon. Mr. Gon is a member of our board of directors and our global CEO. Mr. Gon has been leading CI&T since he co-founded it in 1995. Mr. Gon is an entrepreneur in the technology and digital space. He taught himself computer programming by the age of 11, and at 13 sold the code of a chess game to a tech magazine. At the age of 23, he founded CI&T. Under his leadership as CEO, the company has grown and expanded globally. He is also an active investor in venture funds and startups, a columnist for MIT Sloan Management Review and board member at Lean Enterprise Institute, Raia Drogasil and Sensedia. In 2019, he was awarded EY Entrepreneur Of The Year™ in Brazil. Mr. Gon is a computer engineer, with a master’s degree in Computer Science from UNICAMP.
Eduardo Campozana Gouveia. Mr. Gouveia is an independent member of our board of directors, an investor and board member at start-ups such as Allya, PinPeople, Hands, AsaaS and VEE, and a board member at large companies such as Mapfre Seguradora, CI&T, Quero-Quero, Raymundo da Fonte and Baterias Moura. Mr. Gouveia was the CEO of Cielo, a payment solutions, technology and retail services company, until August 2018. Before taking over Cielo in early 2017, he was the CEO of Alelo, a voucher Company. He also founded and was the CEO of Livelo, a customer loyalty company of Banco do Brasil and Bradesco. Mr. Gouveia was also the first CEO of Multiplus Fidelidade. Prior to that, Mr. Gouveia was Vice President of Sales and Marketing at Cielo between 2006 and 2010. He held the positions of Vice President of Marketing (Walmart Brasil), Chief Marketing Officer (Bompreço) and General Officer (HiperCard). He started his career in the IT department of Banco Banorte then served in the bank’s product, marketing and sales departments. Mr. Gouveia holds a bachelor’s degree in Computer Science from the Universidade Federal do Pernambuco (UFPE), a specialization degree in Finance from IBMEC and an MBA in Marketing from the Fundação Getúlio Vargas (FGV).
Patrice Philippe Nogueira Baptista Etlin. Mr. Etlin is a member of our board of directors and also managing partner at Advent. Mr. Etlin joined Advent in 1997 and started the firm’s investment activities in Brazil. As one of Advent’s global managing partners and member of its executive committee, he helps oversee the firm’s strategic direction and investment activities, with a particular focus on Latin America. Mr. Etlin has 27 years of private equity experience and has led, co-led or participated in over 30 investments in the region. Before joining Advent, from 1994 to 1997, he was a partner at International Venture Partners in São Paulo, where he was responsible for the overall operation of a media and communications fund focused on Brazil. Previously, he was a general representative for Brazil at Matra Marconi Space for five years. He received an undergraduate degree in electronic engineering from the University of São Paulo, a master’s degree in industrial engineering from École Centrale de Paris and an MBA from INSEAD. He also served for six years as Chairman of the Latin American Private Equity & Venture Capital Association (LAVCA) and was a board member of the Associação Brasileira de Private Equity e Venture Capital (ABVCAP) from 2000 to 2017.
Silvio Romero de Lemos Meira. Mr. Meira is an independent member of our board of directors, and a special teacher at the Recife Center for Advanced Studies and Systems (CESAR), where he was also chief scientist until 2014, and “emeritus” professor at the Centre of Informatics of the Federal University of Pernambuco. He is a founder of The Digital Strategy Company and of Porto Digital where he also chairs the board of directors. Mr. Meira is a member of the boards of Magazine Luiza, MRV Engenharia and TEMPEST. He is part of the innovation committees of BBCE, Anima and Ypê. Mr. Meira works in strategy, digital transformation, software engineering, innovation, new business and education. He served as a fellow and faculty associate at the Berkman Klein Center for Internet and Society at Harvard University from 2012 to 2015 and as associate professor law at FGV in Rio de Janeiro from 2014 to 2017.
Maria Helena dos Santos Fernandes de Santana. Ms. Santana is an independent member of our board of directors and chair of our audit committee of CI&T Inc, since August 2021. She is a non-executive director and chair of the nomination, compensation and governance committee of Oi S.A., a non-executive director of Itaú Unibanco Holding S.A. and a non-executive director and member of the audit committee of Fortbras S.A. Ms. Santana has, since 2013, acted as non-executive director for companies as XP Inc, Bolsas y Mercados Españoles – BME, Companhia Brasileira de Distribuicao S.A. – CBD, Totvs S.A. and CPFL Energia S.A. In addition, she served as executive chairperson of the Brazilian Securities and Exchange Commission – CVM from July 2007 to July 2012 and as a commissioner from 2006 to 2007. She was chair of the executive committee of IOSCO - International Organization of Securities Commissions from 2011 to 2012. Among other roles, she served as a member of the board of trustees of the International Financial Reporting Standards Foundation from 2014 to 2019 and worked for the São Paulo Stock Exchange for 12 years, acting as head of listings and issuer relations from 2000 to June 2006. She is a member of the Latin-American Corporate Governance Roundtable of the Organization for Economic Co-operation and Development. She holds a bachelor’s degree in economics from the Faculdade de Economia e Administração da Universidade de São Paulo – USP in Brazil.
Executive Officers
Our executive officers are responsible for the management and representation of our company. We have a strong centralized management team led by Cesar Nivaldo Gon, our CEO, with broad experience in the technology/IT services industry.
The following table lists our executive officers
Name |
| Age |
| Position |
Cesar Nivaldo Gon |
| 50 |
| Chief Executive Officer |
Stanley Rodrigues |
| 51 |
| Chief Financial Officer |
Bruno Guiçardi Neto |
| 50 |
| Director of Operations |
The following is a brief summary of the business experience of our executive officers. Unless otherwise indicated, the current business address for our executive officers is Rua Dr. Ricardo Benetton Martins — SP 340 — KM 118.5, No. 1,000, Building 23-B Parque II do Polo de Alta Tecnologia Campinas — CIATEC 13086-902, Campinas — SP, Brasil.
Cesar Nivaldo Gon, Chief Executive Officer. See “Board of Directors” above.
Stanley Rodrigues, Chief Financial Officer. Mr. Rodrigues is our CFO and has been the CFO of CI&T Brazil since 2014. He has 27 years of work experience in the information technology industry in both private and public companies, with extensive experience in mergers & acquisitions transactions. He was previously the CFO of Sonda IT in Brazil and Mexico and controller of Atos Origin. He holds a degree in Civil Engineering from UNICAMP and an MBA from Fundação Instituto de Administração — Universidade de São Paulo.
Bruno Guiçardi Neto, Director of Operations. Mr. Guiçardi is a co-founder of CI&T and president of the North America and Europe operations. With over 30 years of experience, he has been a global pioneer in applying agile and lean methodologies to the digital space. He has a proven track record of delivering revenue growth and customer engagement to CI&T clients competing globally in an environment of fast-paced change and continuous innovation. He has a strong digital products and professional services background and is responsible for the senior leadership of many award-winning large-scale programs and business transformation initiatives. Mr. Guiçardi has a degree in computer engineering from UNICAMP.
Family Relationships
There are no family relationships among our directors and officers named herein.
- Compensation
Compensation of Directors and Executive Officers
Under Cayman Islands law, we are not required to disclose compensation paid to our executive officers or management on an individual basis and we have not otherwise publicly disclosed this information elsewhere.
For the year ended December 31, 2021, the aggregate compensation expense for the members of our board of directors and executive officers for services in all capacities was R$11,096 thousand, which includes both benefits paid in kind and compensation. See note 29 to our audited consolidated financial statements included elsewhere in this report.
Employment Agreements
Certain of our executive officers have entered into employment agreements with us, certain of which provide for notice of termination periods and include restrictive covenants, including with respect to confidentiality, non-compete and exclusivity and severance obligations. None of our directors have entered into service agreements with us.
Long-Term Incentive Plan
Our current stock option plan comprises four separate stock option programs under which we have granted eligible executives, employees and directors options that settle in equity, subject to, among others, vesting criteria as determined by the board.
As of December 31, 2021, we have awarded a total of 4,696,654 options under our stock option plans. For further information about vesting periods and exercise price, see note 21.a to our audited consolidated financial statements.
In the first quarter of 2022, we issued 654,144 Class A common shares upon the exercise of options under the existing stock option plan. Further issuances of Class A common shares upon the exercise of options will have a dilutive effect on existing shareholders.
Directors’ and Officers’ Insurance
We have civil liability insurance coverage for acts carried out by our directors and executive officers in the course of their duties.
- Board Practices
Committees
Audit Committee
Our audit committee, which consists of Fernando Matt Borges Martins, Eduardo Campozana Gouveia and Maria Helena dos Santos Fernandes de Santana, assists our board of directors in overseeing our accounting and financial reporting processes and the audits of our financial statements. In addition, the audit committee is directly responsible for the appointment, compensation, retention and oversight of the work of our independent registered public accounting firm. Maria Helena dos Santos Fernandes de Santana serves as a Chairperson of the committee. The audit committee consists exclusively of members of our board of directors who are financially literate, and Fernando Matt Borges Martins is considered an “audit committee financial expert” as defined by the SEC. Our board of directors has determined that Eduardo Campozana Gouveia and Maria Helena dos Santos Fernandes de Santana satisfy the “independence” requirements set forth in Rule 10A-3 under the Exchange Act. We rely on the phase-in schedule for compliance with the audit committee independence requirements as set forth in NYSE Rule 303.A.00.
The audit committee is governed by a charter that complies with applicable SEC and NYSE rules. The audit committee is responsible for, among other things:
| ● | the appointment, compensation, retention and oversight of any auditor or accounting firm engaged for the purpose of preparing or issuing an audit report or performing other audit, review or attest services; |
| ● | pre-approving the audit services and non-audit services to be provided by our independent auditor before the auditor is engaged to render such services; |
| ● | reviewing and discussing with the independent auditor its responsibilities under generally accepted auditing standards, the planned scope and timing of the independent auditor’s annual audit plan(s) and significant findings from the audit; |
| ● | obtaining and reviewing a report from the independent auditor describing all relationships between the independent auditor and the Company consistent with the applicable PCAOB requirements regarding the independent auditor’s communications with the audit committee concerning independence; |
| ● | confirming and evaluating the rotation of the audit partners on the audit engagement team as required by law; |
| ● | reviewing with management and the independent auditor, in separate meetings whenever the Audit Committee deems appropriate, any analyses or other written communications prepared by the management and/or the independent auditor setting forth significant financial reporting issues and judgments made in connection with the preparation of the financial statements, including analyses of the effects of alternative IFRS methods on the financial statements; and other critical accounting policies and practices of the Company; |
| ● | reviewing, in conjunction with our Chief Executive Officer and Chief Financial Officer our disclosure controls and procedures and internal control over financial reporting; |
| ● | establishing procedures for the receipt, retention and treatment of complaints received by the Company regarding accounting, internal accounting controls or auditing matters, and the confidential, anonymous submission by our employees of concerns regarding questionable accounting or auditing matters; and |
| ● | approving or ratifying any related person transaction (as defined in our related person transaction policy) in accordance with our related person transaction policy. |
The audit committee meets as often as it determines to be appropriate to carry out its responsibilities, but in any event meets at least 4 times per year.Nominating Committee
Our nominating committee, which consist of Fernando Matt Borges Martins, Eduardo Campozana Gouveia and Brenno Raiko de Souza, assists our board of directors in nominating candidates for election to the board of directors and overseeing the human resources policies and practices adopted by the Company and its subsidiaries, as appropriate. Fernando Matt Borges Martins serves as Chairman of the committee. As a foreign private issuer, our nominating committee is not required to satisfy the “independence” requirements as set forth in NYSE Rule 303.A.00. The nominating committee is governed by a charter that complies with otherwise applicable SEC and NYSE rules. The nominating committee is responsible for, among other things:
| ● | identifying, evaluating and recommending individuals qualified to become directors for nomination for election to the Board and appointments to committees of the board or other senior management positions; |
| ● | managing and developing compensation, benefits and incentive policies; and |
| ● | monitoring KPIs and performance targets of directors and others in senior management positions.
|
Code of Ethics
We have adopted a code of ethics applicable to our personnel and our subsidiaries’ personnel, including board members, directors, officers, employees, interns and all people acting on our behalf or on behalf of our corporate group. Our code of ethics is also applicable to relevant third parties involved in our activities, such as suppliers, consultants and other service providers. Our code of ethics describes our mission, vision and values and provides the relevant conduct standards that must be followed by our personnel and our subsidiaries’ personnel. It regulates our interactions with our suppliers, clients, suppliers and governmental entities and agents. Our code of ethics also provides fundamental rules of conduct related to conflict of interest situations, the protection of our confidential information and assets and our compliance with applicable laws and relevant information on whistleblowing procedures.
In addition there are other policies that are under development and will be adopted by us such as a conflicts of interest policy, an insider trading policy, disclosure controls and procedures, an anti-corruption policy, and a public officials, succession planning and politically exposed person policy.
Other Corporate Governance Matters Foreign Private Issuer Exemption
The Sarbanes-Oxley Act of 2002, as well as related rules subsequently implemented by the SEC, requires foreign private issuers, including our company, to comply with various corporate governance practices. In addition, rules provide that foreign private issuers may follow home country practice in lieu of corporate governance standards, subject to certain exceptions and except to the extent that such exemptions would be contrary to U.S. federal securities laws. We intend to take all actions necessary for us to maintain compliance as a foreign private issuer under the applicable corporate governance requirements of the Sarbanes-Oxley Act of 2002, the rules adopted by the SEC and the NYSE listing standards.
- Employees
Our People
Since our incorporation, we have considered our employees our greatest asset, making sure that we have a healthy and humane environment, and that we offer an opportunity for people to grow professionally along with us. From 2020 through 2021, our employee attrition rate based on voluntary employee departures was 15.6% (excluding employee departures with less than a six month tenure). Our employees’ salaries are adjusted annually according to inflation indexes and based on labor union negotiations.
As we continue to experience revenue growth and expand our operations, we continue to actively hire employees across our organization. As of the periods shown below, we had the following employees, broken out by geography:
| As of December 31, |
| 2021 |
| 2020 |
| 2019 |
North America & Europe | |
| |
| |
United States | 130 |
| 110 |
| 102 |
Canada | 28 |
| 13 |
| 1 |
United Kingdom | 13 |
| 9 |
| 7 |
Portugal | 39 |
| 13 |
| 0 |
Latin America | |
| |
| |
Brazil | 5,139 |
| 2,910 |
| 2,090 |
Asia Pacific and Japan | |
| |
| |
Japan | 24 |
| 30 |
| 28 |
China | 188 |
| 132 |
| 122 |
Australia | 3 |
| 2 |
| 0 |
Total | 5,564 |
| 3,219 |
| 2,350 |
|
|
*Brazil numbers as of December 31, 2021, including 1,159 employees from the Dextra Group, which was acquired on August 10, 2021.
|
- Share Ownership
The shares and any outstanding shares beneficially owned by our directors and officers and/or entities affiliated with these individuals are disclosed in the section entitled “Major Shareholders.”
ITEM 7. MAJOR SHAREHOLDERS AND RELATED PARTY TRANSACTIONS
- Major Shareholders
The following table and accompanying footnotes present information relating to the beneficial ownership of our Class A common shares and Class B common shares by: (a) each person, or group of affiliated persons, known by us to own beneficially 5% or more of our outstanding shares; and (b) our executive officers and directors, as a group, as of the date of this annual report, unless otherwise noted. Percentages in the table below are based on 15,654,144 outstanding Class A common shares and 117,197,896 outstanding Class B common shares.
| Class A | Class B | % of Total
Voting Power(1) |
Shareholders | Shares | % of Class A | Shares | % of Class B | |
5% Shareholders | | | |
| |
Cesar Nivaldo Gon (2) | - | - | 23,303,273 | 19.9% | 19.6% |
Fernando Matt Borges Martins (3) | - | - | 22,722,913 | 19.4% | 19.1% |
Bruno Guiçardi Neto (4) | - | - | 15,298,381 | 13.0% | 12.9% |
Advent Managed Fund LLCs (5) | - | - | 49,081,192 | 41.9% | 41.3% |
WCM Investment Management (6) | 2,735,629 | 17.5% | - | - | 0.2% |
Capital World Investors (7) | 1,533,562 | 9.8% | - | - | 0.1% |
Grandeur Peak Global Advisors (8) | 1,448,230 | 9.3% | - | - | 0.1% |
GIC Private Limited (9) | 1,386,772 | 8.9% | - | - | 0.1% |
Alger Associates (10) | 2,082,415 | 13.3% | - | - | 0.2% |
FMR LLC (11) | 997,556 | 6.4% | - | - | 0.1% |
Other Officers and Directors (12) | 71,519 | 0.5% | 166,122 | 0.1% | 0.1% |
| (1) | Percentage of total voting power represents voting power with respect to all of our Class A common shares and Class B common shares, as a single class. Holders of our Class B common shares are entitled to 10 votes per share, whereas holders of our Class A common shares are entitled to one vote per share. For more information about the voting rights of our Class A common shares and Class B common shares, see “Additional Information — B. Memorandum and Articles of Association — Description of Share Capital.” Includes 225,649 Class A common shares that were issued as part of the payment for the Somo acquisition in January 2022 and 428,495 Class A common shares issued in the first quarter of 2022 in connection with our stock option plan. |
| (2) | Mr. Cesar Nivaldo Gon, our Chief Executive Officer and member of our board of directors, beneficially owns Class B common shares in us indirectly through his ownership of interests in ENIAC Capital Group Ltd., an entity incorporated under the laws of the British Virgin Islands with registered office at Craigmuir Chambers, Road Town, Tortola, VG 1110, British Virgin Islands. |
| (3) | Mr. Fernando Matt Borges Martins, a member of our board of directors, beneficially owns Class B common shares in us indirectly through his ownership of interests in Guaraci Investments Ltd., an entity incorporated under the laws of the British Virgin Islands with registered office at Craigmuir Chambers, Road Town, Tortola, VG 1110, British Virgin Islands. |
| (4) | Mr. Bruno Guiçardi Neto, our Director of Operations, owns 8,998,381 Class B common shares directly and beneficially owns 6,300,000 Class B common shares through The Ferreira Guiçardi Family Trust, an entity incorporated under the laws of the State of Delaware with registered office at 200 Bellevue Parkway, Suite 250, Wilmington, DE 19809, United States of America. |
| (5) | Includes 16,360,375 Class B common shares owned by AI Calypso Brown LLC (“Calypso Brown”), 16,360,375 Class B common shares owned by AI Iapetus Grey LLC (“Iapetus Grey”) and 16,360,442 Class B common shares owned by AI Titan Black LLC (“Titan Black”). The managing members and beneficial owners of each of Calypso Brown, Iapetus Grey and Titan Black are the following funds (the “Advent LAPEF VI Funds”): Advent Latin American Private Equity Fund VI Limited Partnership, Advent Latin American Private Equity Fund VI-A Limited Partnership (of which Advent LAPEF VI Feeder Limited Partnership is a limited partner), Advent Latin American Private Equity Fund VI-B Limited Partnership, Advent Latin American Private Equity Fund VI-C Limited Partnership, Advent Latin American Private Equity Fund VI-D Limited Partnership, Advent Latin American Private Equity Fund VI-E Limited Partnership, Advent Latin American Private Equity Fund VI-F Limited Partnership, Advent Latin American Private Equity Fund VI-G Limited Partnership, Advent Latin American Private Equity Fund VI-H Limited Partnership, Advent Partners LAPEF VI Limited Partnership and Advent Partners LAPEF VI-A Limited Partnership. The Advent LAPEF VI Funds have direct or indirect ownership interests in Calypso Brown, Iapetus Grey and Titan Black, but none of the Advent LAPEF VI Funds has voting or dispositive power over any shares. LAPEF VI GP Limited Partnership (“LAPEF VI GP LP”) is the general partner of the Advent LAPEF VI Funds, and Advent International LAPEF VI, LLC (“Advent LAPEF VI GP LLC”) is the general partner of LAPEF VI GP LP. Advent International Corporation (“Advent”) is the sole member and manager of Advent LAPEF VI GP LLC and may be deemed to have voting and dispositive power over the shares held by the Advent Managed Fund LLCs. Voting and investment decisions by the Advent Managed Fund LLCs are made by a number of individuals currently comprised of John L. Maldonado, David M. McKenna and David M. Mussafer. The address of each of the entities and individuals named in this footnote is c/o Advent International Corporation, Prudential Tower, 800 Boylston St., Suite 3300, Boston, MA 02199. |
| (6) | As reported by WCM Investment Management, LLC in its Schedule 13G/A, filed with SEC on February 10, 2022. |
| (7) | As reported by Capital World Investors in its Schedule 13G/A filed with SEC on April 11, 2022. |
| (8) | As reported by Grandeur Peak Global Advisors in its Schedule 13G filed with SEC on February 11, 2022. |
| (9) | As reported by GIC Private Limited in its Schedule 13G filed with SEC on February 08, 2022. |
(10)
| As reported by Alger Associates in its Schedule 13G/A filed with SEC on April 08, 2022. |
| (11) | As reported by FMR LLC in its Schedule 13G/A filed with SEC on March 10, 2022. |
| (12) | Shares held by Stanley Rodrigues, our chief financial officer. Mr. Rodrigues also holds 70,591 options. Disclosure regarding the equity interest held by Cesar Nivaldo Gon, Fernando Matt Borges Martins and Bruno Guiçardi Neto is above. Maria Helena dos Santos Fernandes de Santana, Silvio Romero de Lemos Meira and Eduardo Campozana Gouveia, members of our board of directors, hold 19,761, 31,344 and 31,344 options, respectively. |
The holders of our Class A common shares and Class B common shares have identical rights, except that the Class B Shareholders as holders of Class B common shares (i) are entitled to ten votes per share, whereas holders of our Class A common shares are entitled to one vote per share, (ii) have certain conversion rights and (iii) are entitled to maintain a proportional ownership interest by purchasing additional Class B common shares in the event that additional Class A common shares are issued, save that such rights to purchase additional Class B common shares may only be exercised with Class B Shareholder Consent. For more information see “Additional Information — B. Memorandum and Articles of Association — Description of Share Capital — Preemptive or Similar Rights” and “Description of Share Capital — Conversion.” Each Class B common share is convertible into one Class A common share.
- Related Party Transactions
We enter into intercompany commercial transactions with related parties regarding software development, support, and consultancy services, as well as intercompany financial transactions. All outstanding balances with these related parties are priced on an arm’s length basis and are to be settled in cash within three to four months of the reporting date.
Related party transactions policy
Prior to the consummation of our initial public offering, we entered into a conflicts of interest policy which includes a related party transactions policy. In October 2021, our board of directors approved our related person transaction policy.
Transactions with management
In 2019, CI&T Brazil canceled its 2nd Stock Option Plan and in 2020 paid indemnities to satisfy in full and discharge any claims on the 2nd Stock Option Plan, in an amount equal to R$43,354 thousand.
Shareholders’ Agreements
In connection with our initial public offering, we entered into a shareholders’ agreement (the “Shareholders’ Agreement”) with Cesar Nivaldo Gon, Bruno Guiçardi Neto, Fernando Matt Borges Martins (the “Founders”), entities controlled by the Founders and the Advent Managed Fund LLCs. The Shareholders’ Agreement provides that, so long as the agreement is in force, the Founders will have the right to appoint a majority of our board of directors. The Shareholders’ Agreement also provides that, so long as the Advent Managed Fund LLCs hold shares representing at least 20% of the voting rights of the Company, the Advent Managed Fund LLCs will have the right to appoint two directors; and for so long as the Advent Managed Fund LLCs hold shares representing at least 10% of the voting rights of the company, the Advent Managed Fund LLCs will have the right to appoint one director. The Shareholders’ Agreement shall terminate at such time as either the Founders hold shares representing less than 30% of the voting rights of the Company or the Advent Managed fund LLCs hold shares representing less than 10% of the voting rights of the Company.
Registration Rights Agreement
In connection with the initial public offering, we entered into a registration rights agreement whereby we grant certain registration rights to the Advent Managed Fund LLCs, ENIAC Capital Group Ltd. (the investment vehicle of Mr. Cesar Nivaldo Gon), Bruno Guiçardi Neto, and Guaraci Investments Ltd. (the investment vehicle of Mr. Fernando Matt Borges Martins), including the right, under certain circumstances and subject to certain restrictions, to require us to register under the Securities Act our common shares held by them. In addition, we have committed to file as promptly as possible, after receiving a request from the Advent Managed Fund LLCs, ENIAC Capital Group Ltd., Bruno Guiçardi Neto, and Guaraci Investments Ltd., a shelf registration statement registering secondary sales of our common shares held by the Advent Managed Fund LLCs, ENIAC Capital Group Ltd., Bruno Guiçardi Neto, and Guaraci Investments Ltd. The Advent Managed Fund LLCs, ENIAC Capital Group Ltd., Bruno Guiçardi Neto, and Guaraci Investments Ltd. also have the ability to exercise certain piggyback registration rights in respect of common shares held by them in connection with registered offerings requested by other holders of registration rights or initiated by us.
Indemnification Agreements
We entered into indemnification agreements with our directors and executive officers. The indemnification agreements and our amended and restated memorandum and articles of association require us to indemnify our directors and executive officers to the fullest extent permitted by law.
CI&T IOT
In connection with the spin-off of Neowrk Sistemas Inteligentes S/A. (formerly known as CI&T IOT Comércio de Hardware e Software Ltda. and herein referred to as “CI&T IOT”) from CI&T Brazil, on July 22, 2021, the companies entered into a partnership agreement governing the terms of their cooperation for a period of 18 months, beginning from May 1, 2021. Pursuant to the terms of this agreement, CI&T Brazil is required to rent space inside its building to CI&T IOT in the amount of R$15,097,66 per month, referring to the square footage occupied by CI&T IOT according to the CI&T’s contract with the property owner, and CI&T IOT is required to offer CI&T Brazil certain workplace management and monitoring services through CI&T IOT’s software application Free Room in the amount of R$12,370 per month, which was determined based on market value for this type of rental. The partnership agreement does not restrict in any way the Company’s ability to operate in any market or industry.
One of our directors, Fernando Matt Borges Martins, is the CFO and a director of Neowrk.
- Interests of Experts and Counsel
Not applicable.
ITEM 8. FINANCIAL INFORMATION
- Consolidated Statements and Other Financial Information
We have included the Consolidated Financial Statements as part of this annual report. See “Item 18. Financial Statements.”
Legal Proceedings
From time to time we may become involved in legal proceedings or be subject to claims arising in the ordinary course of our business. We are not presently a party to any legal proceedings that, if determined adversely to us, would individually or taken together have a material adverse effect on our business, operating results, financial condition or cash flows. Regardless of the outcome, litigation can have an adverse impact on us because of defense and settlement costs, diversion of management time and resources and other factors. For additional information, see note 19 to our audited consolidated financial statements included elsewhere in this report.
Dividends and Dividend Policy
We have not adopted a dividend policy with respect to future distributions of dividends. The amount of any distributions will depend on many factors such as our results of operations, financial condition, cash requirements, prospects and other factors deemed relevant by our board of directors and, where applicable, our shareholders. We currently intend to retain all available funds and any future earnings, if any, to fund the development and expansion of our business and we do not anticipate paying any cash dividends in the foreseeable future.
Certain Cayman Islands Legal Requirements Related to Dividends
Under the Companies Act and our Articles of Association, a Cayman Islands company may pay a dividend out of either its profit or share premium account, but a dividend may not be paid if this would result in the company being unable to pay its debts as they fall due in the ordinary course of business. According to our Articles of Association, dividends can be declared and paid out of funds lawfully available to us, which include the share premium account. Dividends, if any, would be paid in proportion to the number of common shares a shareholder holds. For further information, see “Taxation — Cayman Islands Tax Considerations.”
CI&T Inc has not declared or paid any dividends to its shareholders since its incorporation in the Cayman Islands on June 7, 2021.
Certain Brazilian Legal Requirements Related to Dividends
Our ability to pay dividends is directly related to positive and distributable net results from our Brazilian subsidiary. See “Risk Factors — Certain Risks Relating to Our Business and Industry — We depend on dividend distributions by our subsidiaries, and we may be adversely affected if the performance of our subsidiaries is not positive.” Our Brazilian subsidiary is required under its by-laws and Federal Law No. 6,404 dated December 15, 1976, as amended, to distribute a mandatory minimum dividend to shareholders each year, which cannot be lower than 25% of its adjusted net income for the prior year, calculated under Article 202 of the Brazilian Corporate Law, unless such distribution is suspended by a decision of such subsidiary’s shareholders at its annual shareholders’ meeting based on a report by its board of directors that such distribution would be incompatible with its financial condition at that time. In addition, if, for any legal reasons due to new laws or bilateral agreements between countries, our Brazilian subsidiary is unable to pay dividends to Cayman Islands companies, or if a Cayman Islands company becomes incapable of receiving them, we may not be able to make any dividend payments in the future.
For the years ended December 31, 2021, 2020 and 2019, CI&T Brazil declared and paid dividends to its shareholders in the amount of R$126,045 thousand (US$22,587 thousand), R$30,977 thousand (US$5,551 thousand), and R$40,059 (US$7,178 thousand), respectively based on profits from the previous fiscal year.
- Significant Changes
None.
ITEM 9. THE OFFER AND LISTING
| A. | Offering and Listing Details |
| Our Class A common shares began trading on the NYSE under the symbol “CINT” in connection with our IPO on November 10, 2021. |
|
|
| B. | Plan of Distribution |
| Not applicable. |
|
|
| C. | |
| Our Class A common shares began trading on the NYSE under the symbol “CINT” in connection with our IPO on November 10, 2021. |
|
|
| D. | Selling Shareholders |
| Not applicable. |
|
|
| E. | |
| Not applicable. |
|
|
| F. | Expenses of the Issue |
| Not applicable. |
ITEM 10. ADDITIONAL INFORMATION.
- Share Capital
Not applicable.
- Memorandum and Articles of Association
We were incorporated on June 7, 2021, as a Cayman Islands exempted company with limited liability duly registered with the Cayman Islands Registrar of Companies. Our corporate purposes are unrestricted, and we have the authority to carry out any object not prohibited by the Companies Act (As Revised) of the Cayman Islands (the “Companies Act”) or any other law as provided by Section 7(4) of the Companies Act.
Our affairs are governed principally by: (1) CI&T’s Articles (the “Articles”); (2) the Companies Act; and (3) the common law of the Cayman Islands. As provided in the Articles, subject to Cayman Islands law, we have full capacity to carry on or undertake any business or activity, do any act or enter into any transaction, and, for such purposes, full rights, powers and privileges. Our registered office is c/o Maples Corporate Services Limited, P.O. Box 309, Ugland House, Grand Cayman, KY1-1104, Cayman Islands.
Our Articles of Association authorize the issuance of up to 1,000,000,000 shares of a nominal or par value of US$0.00005 each, which at the date of this annual report comprise 500,000,000 Class A common shares and 250,000,000 Class B common shares (which may be converted into Class A common shares in the manner contemplated in our Articles of Association), and 250,000,000 shares of such class or classes (howsoever designated) and having the rights that our board of directors may determine. As of the date of this annual report, we have 15,654,144 Class A common shares and 117,197,896 Class B common shares of our authorized share capital issued and outstanding.
The following is a summary of the material provisions of our authorized share capital and the Articles.
Share Capital
The Articles authorize two classes of common shares: Class A common shares, which are entitled to one vote per share, and Class B common shares, which are entitled to ten votes per share and to maintain a proportional ownership interest in the event that additional Class A common shares are issued (save that the right to maintain a proportional ownership interest may only be exercised with Class B Shareholder Consent). Any holder of Class B common shares may convert his or her shares at any time into Class A common shares on a share-for-share basis. The rights of the two classes of common shares are otherwise identical, except as described below. See “— Anti-Takeover Provisions in the Articles — Two Classes of Shares.”
As of the date of this annual report, CI&T’s total authorized share capital was US$50,000, divided into shares with par value of US$0.00005 each, of which:
| ● | 500,000,000 shares are designated as Class A common shares; |
| ●
| 250,000,000 shares are designated as Class B common shares; |
| ● | 250,000,000 are yet undesignated and may be issued as common shares or shares with preferred, deferred or other special rights or restrictions. |
As of the date of this annual report we have a total issued share capital of R$36 thousand (US$7 thousand) divided into 132,852,040 common shares. Those common shares are divided into 15,654,144 Class A common shares, including 225,649 Class A common shares that were issued as part of the payment for the Somo acquisition in January 2022 and 428,495 Class A common shares issued in the first quarter of 2022 in connection with our stock option plan, and 117,197,896 Class B common shares.
Treasury Stock
As of the date of this annual report, we have no shares in treasury.
Issuance of Shares
Except as expressly provided in the Articles, our board of directors has general and unconditional authority to allot, grant options over, offer or otherwise deal with or dispose of any unissued shares in the company’s capital without the approval of our shareholders (whether forming part of the original or any increased share capital), either at a premium or at par, with or without preferred, deferred or other special rights or restrictions, whether in regard to dividend, voting, return of capital or otherwise and to such persons, on such terms and conditions, and at such times as the directors may decide, but so that no share shall be issued at a discount, except in accordance with the provisions of the Companies Act. In accordance with our Articles, we shall not issue bearer shares. We shall not issue any class of shares with dividend rights, conversion rights, redemption rights and/or liquidation preference superior to the rights of the Class B common shares, or shares having more than one vote per share, without the Class B Shareholder Consent.
The Articles provide that additional Class B common shares may only be issued pursuant to (1) a share split, subdivision of shares or similar transaction or where a dividend or other distribution is paid by the issue of shares or rights to acquire shares or following capitalization of profits, (2) subject to the Class B Shareholder Consent, a merger, consolidation, or other business combination involving the issuance of Class B common shares as full or partial consideration, or (3) an issuance of Class A common shares, whereby holders of the Class B common shares would be entitled to purchase a number of Class B common shares that would allow them to maintain their proportional ownership and voting interests in CI&T (following an offer by CI&T to each holder of Class B common shares to issue to such holder, upon the same economic terms and at the same price, such number of Class B common shares as would ensure such holder may maintain a proportional ownership interest in CI&T pursuant to the Articles), save that such rights to purchase additional Class B common shares may only be exercised with Class B Shareholder Consent. In light of: (a) the above provisions; (b) the fact that future transfers by holders of Class B common shares will generally result in those shares converting to Class A common shares, subject to limited exceptions as provided in the Articles; and (c) the ten-to-one voting ratio between our Class B common shares and Class A common shares, holders of our Class B common shares will in many situations continue to maintain control of all matters requiring shareholder approval. This concentration of ownership and voting power will limit or preclude your ability to influence corporate matters for the foreseeable future. For more information see “— Preemptive or Similar Rights.”
The Articles also provide that the issuance of non-voting common shares requires the affirmative vote of a majority of the then-outstanding Class A common shares.
Fiscal Year
Our fiscal year begins on January 1 of each year and ends on December 31 of the same year.
Voting Rights
The holders of the Class A common shares and Class B common shares have identical rights, except that (1) the holders of Class B common shares are entitled to ten votes per share, whereas holders of Class A common shares are entitled to one vote per share, (2) Class B common shares have certain conversion rights and (3) the holders of Class B common shares are entitled to maintain a proportional ownership interest in the event that additional Class A common shares are issued, save that such rights to purchase additional Class B common shares may only be exercised with Class B Shareholder Consent. For more information see “— Preemptive or Similar Rights” and “— Conversion.” The holders of Class A common shares and Class B common shares vote together as a single class on all matters (including the election of directors) submitted to a vote of shareholders, except as provided below and as otherwise required by law.
The Articles provide as follows regarding the respective rights of holders of Class A common shares and Class B common shares:
| [1] | Class consents from the holders of Class A common shares or Class B common shares, as applicable, shall be required for any variation to the rights attached to their respective class of shares, however, the Directors may treat any two or more classes of shares as forming one class if they consider that all such classes would be affected in the same way by the proposal; |
| [2] | the rights conferred on holders of Class A common shares shall not be deemed to be varied by the creation or issue of further Class B common shares and vice versa; and |
| [3]
| the rights attached to the Class A common shares and the Class B common shares shall not be deemed to be varied by the creation or issue of shares with preferred or other rights, including, without limitation, shares with enhanced or weighted voting rights.
|
As set forth in the Articles, the holders of Class A common shares and Class B common shares, respectively, do not have the right to vote separately if the number of authorized shares of such class is increased or decreased. Rather, the number of authorized Class A common shares and Class B common shares may be increased or decreased (but not below the number of shares of such class then outstanding) by the affirmative vote of the holders of a majority of the voting power of the issued and outstanding Class A common shares and Class B common shares, voting together in a general meeting.
Preemptive or Similar Rights
The Class A common shares are not entitled to any preemptive rights, including upon transfer of such shares, and conversion, redemption or sinking fund provisions.
The Class B common shares are not subject to conversion (except as described below under “—Conversion”), redemption or sinking fund provisions. The holders of Class B common shares are not entitled to preemptive rights upon conversion, and so long as their Class B common shares have not been converted into Class A common shares, the holders of Class B common shares are entitled to preemptive rights (which may only be exercised with Class B Shareholder Consent) in order to maintain their proportional ownership and voting interest as determined immediately prior to such issuance in the event that additional Class A common shares are issued. As such, except for certain exceptions, including the issuance of Class A common shares other than for cash and the issuance of Class A common shares under a management incentive plan, if CI&T issues Class A common shares, it must first make an offer to each holder of Class B common shares to issue to such holder on the same economic terms such number of Class B common shares as would ensure such holder may maintain a proportional ownership and voting interest in CI&T equivalent to such holder’s ownership and voting interest immediately prior to such issuance and each such holder may only exercise their preemptive rights and accept such offer with Class B Shareholder Consent.
Conversion
The outstanding Class B common shares are convertible at any time as follows: (1) at the option of the holder, a Class B common share may be converted at any time into one Class A common share or (2) upon the election of the holders of a majority of the then outstanding Class B common shares, all outstanding Class B common shares may be converted into a like number of Class A common shares. In addition, each Class B common share will convert automatically into one Class A common share upon any transfer, whether or not for value, except for certain transfers described in the Articles, including transfers to the holder’s heirs, successors and affiliates, a trust established for the benefit of the holder or its affiliate, a partnership, corporation or other entity exclusively owned or controlled by the holder or its affiliate and certain transfers to organizations that are exempt from taxation under Section 501(c)(3) of the Internal Revenue Code of 1986, as amended. Furthermore, each Class B common share will convert automatically into one Class A common share and no Class B common shares will be issued thereafter if, at any time, the total number of the issued and outstanding Class B common shares is less than 10% of the total number of shares outstanding.
No class of CI&T’s common shares may be subdivided or combined unless the other class of common shares is concurrently subdivided or combined in the same proportion and in the same manner.
Equal Status
Except as expressly provided in the Articles, Class A common shares and Class B common shares have the same rights and privileges and rank equally, share proportionally and are identical in all respects as to all matters. In the event of any merger, consolidation, scheme, arrangement or other business combination requiring the approval of our shareholders entitled to vote thereon (whether or not CI&T is the surviving entity), the holders of Class A common shares shall have the right to receive, or the right to elect to receive, the same form of consideration as the holders of Class B common shares, and the holders of Class A common shares shall have the right to receive, or the right to elect to receive, at least the same amount of consideration on a per share basis as the holders of Class B common shares. In the event of any (1) tender or exchange offer to acquire any Class A common shares or Class B common shares by any third-party pursuant to an agreement to which CI&T is a party, or (2) any tender or exchange offer by CI&T to acquire any Class A common shares or Class B common shares, the holders of Class A common shares shall have the right to receive, or the right to elect to receive, the same form of consideration as the holders of Class B common shares, and the holders of Class A common shares shall have the right to receive, or the right to elect to receive, at least the same amount of consideration on a per share basis as the holders of Class B common shares.
Record Dates
For the purpose of determining shareholders entitled to notice of, or to vote at any general meeting of shareholders or any adjournment thereof, or shareholders entitled to receive dividend or other distribution payments, or in order to make a determination of shareholders for any other purpose, our board of directors may set a record date.
General Meetings of Shareholders
As a condition of admission to a shareholders’ meeting, a shareholder must be duly registered as a shareholder of CI&T at the applicable record date for that meeting and, in order to vote, all calls or installments then payable by such shareholder to CI&T in respect of the shares that such shareholder holds must have been paid.
Subject to any special rights or restrictions as to voting then attached to any shares, at any general meeting every shareholder who is present in person or by proxy (or, in the case of a shareholder being a corporation, by its duly authorized representative not being himself or herself a shareholder entitled to vote) shall have one vote per Class A common share and ten votes per Class B common share.
As a Cayman Islands exempted company, we are not obliged by the Companies Act to call annual general meetings; however, the Articles provide that in each year the company will hold an annual general meeting of shareholders, at a time determined by the board of directors, provided that our board of directors has the discretion whether or not to hold an annual general meeting in 2022. For the annual general meeting of shareholders, the agenda will include, among other things, the presentation of the annual accounts and the report of the existing directors and the election of new directors. In addition, the agenda for an annual general meeting of shareholders will only include such items as have been included therein by the board of directors.
Also, we may, but are not required to (unless required by the laws of the Cayman Islands), hold other extraordinary general meetings during the year. General meetings of shareholders are generally expected to take place in São Paulo, Brazil, but may be held elsewhere if the directors so decide.
The Companies Act provides shareholders a limited right to request a general meeting and does not provide shareholders with any right to put any proposal before a general meeting in default of a company’s articles of association. However, these rights may be provided in a company’s articles of association. Our Articles provide that upon the requisition of one or more shareholders representing not less than one-third of the voting rights entitled to vote at general meetings, the board will convene an extraordinary general meeting and put the resolutions so requisitioned to a vote at such meeting. The Articles provide no other right to put any proposals before annual general meetings or extraordinary general meetings.
Subject to regulatory requirements, the annual general meeting and any extraordinary general meetings must be called by not less than fourteen (14) clear days’ notice prior to the relevant shareholders meeting and convened by a notice, as discussed below. Alternatively, upon the prior consent of all holders entitled to receive notice, with regards to the annual general meeting, and the holders of 95% in par value of the shares entitled to attend and vote at an extraordinary general meeting, that meeting may be convened by a shorter notice and in a manner deemed appropriate by those holders.
We will give notice of each general meeting of shareholders by publication on our website and in any other manner that it may be required to follow in order to comply with Cayman Islands law and NYSE and SEC requirements. The holders of registered shares may be given notice of a shareholders’ meeting by means of letters sent to the addresses of those shareholders as registered in our shareholders’ register, or, subject to certain statutory requirements, by electronic means.
Holders whose shares are registered in the name of DTC or its nominee, which we expect will be the case for all holders of Class A common shares, will not be a shareholder or member of the company and must rely on the procedures of DTC regarding notice of shareholders’ meetings and the exercise of rights of a holder of the Class A common shares.
The quorum required to hold a general meeting consists of any one or more persons holding or representing by proxy not less than one third of the aggregate voting power of all shares in issue and entitled to vote upon the business to be transacted.
A resolution put to a vote at a general meeting shall be decided on a poll. An ordinary resolution to be passed by the shareholders at a general meeting requires the affirmative vote of a simple majority of the votes cast by, or on behalf of, the shareholders entitled to vote, present in person or by proxy and voting at the meeting. A special resolution requires the affirmative vote on a poll of no less than two-thirds of the votes cast by the shareholders entitled to vote who are present in person or by proxy at a general meeting. Both ordinary resolutions and special resolutions may also be passed by a unanimous written resolution signed by all the shareholders of our Company, as permitted by the Companies Act and the Articles.
Pursuant to the Articles, general meetings of shareholders are to be chaired by the chairman of our board of directors or in his absence the vice-chairman of the board of directors. If both the chairman and vice-chairman of our board of directors are absent, the directors present at the meeting shall appoint one of them to be chairman of the general meeting. If neither the chairman nor another director is present at the general meeting within 15 minutes after the time appointed for holding the meeting, the shareholders present in person or by proxy and entitled to vote may elect any one of the shareholders to be chairman. The order of business at each meeting shall be determined by the chairman of the meeting, and he or she shall have the right and authority to prescribe such rules, regulations and procedures and to do all such acts and things as are necessary or desirable for the proper conduct of the meeting, including, without limitation, the establishment of procedures for the maintenance of order and safety, limitations on the time allotted to questions or comments on the affairs of the Company, restrictions on entry to such meeting after the time prescribed for the commencement thereof, and the opening and closing of the polls.
Liquidation Rights
If CI&T is voluntarily wound up, the liquidator, after taking into account and giving effect to the rights of preferred and secured creditors and to any agreement between CI&T and any creditors that the claims of such creditors shall be subordinated or otherwise deferred to the claims of any other creditors and to any contractual rights of set-off or netting of claims between CI&T and any person or persons (including without limitation any bilateral or any multi-lateral set-off or netting arrangements between the CI&T and any person or persons) and subject to any agreement between CI&T and any person or persons to waive or limit the same, shall apply CI&T’s property in satisfaction of its liabilities pari passu and subject thereto shall distribute the property amongst the shareholders according to their rights and interests in CI&T.
Changes to Capital
Pursuant to the Articles, we may from time to time by ordinary resolution:
| ● | increase our share capital by such sum, to be divided into shares of such amount, as the resolution shall prescribe; |
| ●
| consolidate and divide all or any of our share capital into shares of a larger amount than our existing shares; |
| ● | convert all or any of our paid-up shares into stock and reconvert that stock into paid up shares of any denomination;
|
| ● | subdivide our existing shares or any of them into shares of a smaller amount, provided that in the subdivision the proportion between the amount paid and the amount, if any, unpaid on each reduced share shall be the same as it was in the case of the share from which the reduced share is derived; or |
| ● | cancel any shares which, at the date of the passing of the resolution, have not been taken or agreed to be taken by any person and diminish the amount of our share capital by the amount of the shares so canceled. |
Our shareholders may by special resolution, subject to confirmation by the Grand Court of the Cayman Islands on an application by the Company for an order confirming such reduction, reduce our share capital or any capital redemption reserve in any manner permitted by law.
In addition, subject to the provisions of the Companies Act and the Articles, we may:
| ● | issue shares on terms that they are to be redeemed or are liable to be redeemed; |
| ●
| purchase our own shares (including any redeemable shares); and |
| ● | make a payment in respect of the redemption or purchase of our own shares in any manner authorized by the Companies Act, including out of our own capital.
|
Transfer of Shares
Subject to any applicable restrictions set forth in the Articles, any of our shareholders may transfer all or any of his or her common shares by an instrument of transfer in the usual or common form or in the form prescribed by the New York Stock Exchange or “NYSE” or any other form approved by our board of directors.
The Class A common shares sold in our initial public offering are traded on the NYSE in book-entry form and may be transferred in accordance with our Articles and NYSE’s rules and regulations.
However, our board of directors may, in its absolute discretion, decline to register any transfer of any common share which is either not fully paid up to a person of whom it does not approve or is issued under any share incentive scheme for employees which contains a transfer restriction that is still applicable to such common share. The board of directors may also decline to register any transfer of any common share unless:
| ● | a fee of such maximum sum as the NYSE may determine to be payable or such lesser sum as the board of directors may from time to time require is paid to us in respect thereof; |
| ●
| the instrument of transfer is lodged with us, accompanied by the certificate (if any) for the common shares to which it relates and such other evidence as our board of directors may reasonably require to show the right of the transferor to make the transfer; |
| ● | the instrument of transfer is in respect of only one class of shares;
|
| ● | the instrument of transfer is properly stamped, if required; |
| ● | the common shares transferred are free of any lien in our favor; and |
| ● | in the case of a transfer to joint holders, the transfer is not to more than four joint holders. |
If the directors refuse to register a transfer they are required, within two months after the date on which the instrument of transfer was lodged, to send to the transferee notice of such refusal.
Share Repurchase
The Companies Act and the Articles permit us to purchase our own shares, subject to certain restrictions. The board of directors may only exercise this power on behalf of CI&T, subject to the Companies Act, the Articles and to any applicable requirements imposed from time to time by the SEC, the NYSE, or by any recognized stock exchange on which our securities are listed.
Dividends and Capitalization of Profits
We have not adopted a dividend policy with respect to payments of any future dividends by us. Subject to the Companies Act, our shareholders may, by resolution passed by a simple majority of the voting rights entitled to vote at a general meeting, declare dividends (including interim dividends) to be paid to shareholders but no dividend shall be declared in excess of the amount recommended by the board of directors. The board of directors may also declare dividends. Dividends may be declared and paid out of funds lawfully available to us. Except as otherwise provided by the rights attached to shares and the Articles, all dividends shall be paid in proportion to the number of Class A common shares or Class B common shares a shareholder holds at the date the dividend is declared (or such other date as may be set as a record date); but, (1) if any share is issued on terms providing that it shall rank for dividend as from a particular date, that share shall rank for dividend accordingly and (2) where we have shares in issue which are not fully paid up (as to par value) we may pay dividends in proportion to the amounts paid up on each share.
The holders of Class A common shares and Class B common shares are entitled to share equally in any dividends that may be declared in respect of our common shares from time to time. In the event that a dividend is paid in the form of Class A common shares or Class B common shares, or rights to acquire Class A common shares or Class B common shares, (1) the holders of Class A common shares shall receive Class A common shares, or rights to acquire Class A common shares, as the case may be and (2) the holders of Class B common shares shall receive Class B common shares, or rights to acquire Class B common shares, as the case may be.
Appointment, Disqualification and Removal of Directors
We are managed by our board of directors. The Articles provide that, unless otherwise determined by a special resolution of shareholders, the board of directors will be composed of four to eleven directors, with the number being determined by a majority of the directors then in office. There are no provisions relating to retirement of directors upon reaching any age limit. The Articles also provide that, while our shares are admitted to trading on the NYSE, and so long as we are relying on foreign private issuer status, the board of directors must comply with the residency and citizenship requirements of the U.S. securities laws applicable to foreign private issuers.
The Articles provide that directors shall be elected by an ordinary resolution of our shareholders, which requires the affirmative vote of a simple majority of the votes cast on the resolution by the shareholders entitled to vote who are present, in person or by proxy, at the meeting. Each director shall be appointed and elected for annual terms or such other terms as the resolution appointing him or her may determine or until his or her death, resignation or removal.
The Articles also provide that we may enter into agreements with one or more shareholders granting them the right to appoint and remove one or more directors on such terms as our board of directors may determine from time to time. In this regard, in connection with the offering, we entered into the Shareholders’ Agreement with the Founders, entities controlled by the Founders and the Advent Managed Fund LLCs. The Shareholders’ Agreement provided that, so long as the agreement is in force, the Founders will have the right to appoint a majority of our board of directors. The Shareholders’ Agreement also provided that, so long as the Advent Managed Fund LLCs hold shares representing at least 20% of the voting rights of the Company, the Advent Managed Fund LLCs will have the right to appoint two directors; and for so long as the Advent Management Fund LLCs hold shares representing at least 10% of the voting rights of the company, it will have the right to appoint one director.
As of the date of this annual report, the directors are those listed in “Management — Board of Directors.” Maria Helena dos Santos Fernandes de Santana, Silvio Romero de Lemos Meira and Eduardo Campozana Gouveia are “independent” as that term is defined under the applicable rules and regulations of the SEC and the listing standards of the NYSE applicable to foreign private issuers.
Any vacancies on the board of directors that arise other than upon the removal of a director by resolution passed at a general meeting can be filled by the remaining directors (notwithstanding that they may constitute less than a quorum). Any such appointment shall be as an interim director to fill such vacancy until the next annual general meeting of shareholders.
Additions to the existing board (within the limits set pursuant to the Articles) may be made by ordinary resolution of the shareholders.
Grounds for Removing a Director
A director may be removed with or without cause by ordinary resolution. The notice of general meeting must contain a statement of the intention to remove the director and must be served on the director not less than ten calendar days before the meeting. The director is entitled to attend the meeting and be heard on the motion for his removal.
The office of a director will be vacated automatically if he or she (1) becomes prohibited by law from being a director, (2) becomes bankrupt or makes an arrangement or composition with his creditors, (3) dies or is, in the opinion of all his co-directors, incapable by reason of mental disorder of discharging his duties as director, (4) resigns his office by notice to us or (5) has for more than six months been absent without permission of the directors from meetings of the board of directors held during that period, and the remaining directors resolve that his or her office be vacated.
Proceedings of the Board of Directors
The Articles provide that our business is to be managed and conducted by the board of directors. The quorum necessary for the board meeting shall be a simple majority of the directors then in office (subject to there being a minimum of two directors present) and business at any meeting shall be decided by a majority of votes. In the case of an equality of votes, the chairman shall have a casting vote.
Subject to the provisions of our Articles, the board of directors may regulate its proceedings as they determine is appropriate. Board meetings shall be held at least once a quarter and shall take place either in Campinas, Brazil or at such other place as the directors may determine.
Subject to the provisions of the Articles, to any directions given by ordinary resolution of the shareholders and the listing rules of the NYSE, our board of directors may from time to time at its discretion exercise all powers of CI&T, including, subject to the Companies Act, the power to issue debentures, bonds and other securities of the company, whether outright or as collateral security for any debt, liability or obligation of our company or of any third party.
Inspection of Books and Records
Holders of our shares have no general right under Cayman Islands law to inspect or obtain copies of the list of shareholders or corporate records of the Company. However, the board of directors may determine from time to time whether and to what extent our accounting records and books shall be open to inspection by shareholders who are not members of the board of directors. Notwithstanding the above, the Articles provide shareholders with the right to receive annual financial statements. Such right to receive annual financial statements may be satisfied by publishing the same on our website or filing such annual reports as we are required to file with the SEC.
Register of Shareholders
The Class A common shares are held through DTC, and DTC or Cede & Co., as nominee for DTC, and recorded in the shareholders’ register as the holder of our Class A common shares.
Under Cayman Islands law, CI&T must keep a register of shareholders that includes:
| ● | the names and addresses of the shareholders, a statement of the shares held by each member, and of the amount paid or agreed to be considered as paid, on the shares of each member; |
| ●
| the date on which the name of any person was entered on the register as a member; and |
| ● | the date on which any person ceased to be a member. |
Under Cayman Islands law, the register of shareholders of CI&T is prima facie evidence of the matters set out therein (i.e., the register of shareholders will raise a presumption of fact on the matters referred to above unless rebutted) and a shareholder registered in the register of shareholders is deemed as a matter of Cayman Islands law to have prima facie legal title to the shares as set against his or her name in the register of shareholders.
If the name of any person is incorrectly entered in or omitted from the register of shareholders, or if there is any default or unnecessary delay in entering on the register the fact of any person having ceased to be a shareholder of CI&T, the person or member aggrieved (or any shareholder of CI&T, or CI&T itself) may apply to the Cayman Islands Grand Court for an order that the register be rectified, and the Court may either refuse such application or it may, if satisfied of the justice of the case, make an order for the rectification of the register.
Exempted Company
We are an exempted company with limited liability under the Companies Act. The Companies Act distinguishes between ordinary resident companies and exempted companies. Any company that is registered in the Cayman Islands but conducts business mainly outside of the Cayman Islands may apply to be registered as an exempted company. The requirements for an exempted company are essentially the same as for an ordinary company except for the exemptions and privileges listed below:
| ● | an exempted company does not have to file an annual return of its shareholders with the Registrar of Companies; |
| ●
| an exempted company’s register of shareholders is not open to inspection; |
| ● | an exempted company does not have to hold an annual general meeting; |
| ● | an exempted company may obtain an undertaking against the imposition of any future taxation (such undertakings are usually given for 20 years in the first instance); |
| ● | an exempted company may register by way of continuation in another jurisdiction and be deregistered in the Cayman Islands; |
| ● | an exempted company may register as a limited duration company; and |
| ● | an exempted company may register as a segregated portfolio company. |
“Limited liability” means that the liability of each shareholder is limited to the amount unpaid by the shareholder on the shares of the company (except in exceptional circumstances, such as involving fraud, the establishment of an agency relationship or an illegal or improper purpose or other circumstances in which a court may be prepared to pierce or lift the corporate veil).
We are subject to reporting and other informational requirements of the Exchange Act, as applicable to foreign private issuers. Except as otherwise disclosed in this annual report, we currently intend to comply with the NYSE rules in lieu of following home country practice.
Anti-Takeover Provisions in the Articles
Some provisions of the Articles may discourage, delay or prevent a change in control or management that shareholders may consider favorable. In particular, the capital structure of CI&T concentrates ownership of voting rights in the hands of the holders of Class B common shares. These provisions, which are summarized below, are expected to discourage coercive takeover practices and inadequate takeover bids.
These provisions are also designed to encourage persons seeking to acquire control of CI&T to first negotiate with the board of directors. However, these provisions could also have the effect of discouraging others from attempting hostile takeovers and, consequently, they may also inhibit temporary fluctuations in the market price of the Class A common shares that often result from actual or rumored hostile takeover attempts. These provisions may also have the effect of preventing changes in our management. It is possible that these provisions could make it more difficult to accomplish transactions that shareholders may otherwise deem to be in their best interests.
Two Classes of Common Shares
Our Class B common shares are entitled to ten votes per share, while the Class A common shares are entitled to one vote per share. The holders of all of our Class B common shares will together have the ability to elect all directors and to determine the outcome of most matters submitted for a vote of shareholders. This concentrated voting control could discourage others from initiating any potential merger, takeover, or other change of control transaction that other shareholders may view as beneficial.
So long as the holders of Class B common shares have the ability to determine the outcome of most matters submitted to a vote of shareholders as well as our overall management and direction, third parties may be deterred in their willingness to make an unsolicited merger, takeover, or other change of control proposal, or to engage in a proxy contest for the election of directors. As a result, the fact that we have two classes of common shares may have the effect of depriving you as a holder of Class A common shares of an opportunity to sell your Class A common shares at a premium over prevailing market prices and make it more difficult to replace our directors and management.
Preferred Shares
Our board of directors is given wide powers to issue one or more classes or series of shares with preferred rights. Such preferences may include, for example, dividend rights, conversion rights, redemption privileges, enhanced voting powers and liquidation preferences.
We shall not issue any class of shares with dividend rights, conversion rights, redemption rights and/or liquidation preference superior to the rights of the Class B common shares, or shares having more than one vote per share, without the Class B Shareholder Consent.
Despite the anti-takeover provisions described above, under Cayman Islands law, our board of directors may only exercise the rights and powers granted to them under the Articles, for what they believe in good faith to be in our best interests.
Protection of Non-Controlling Shareholders
The Grand Court of the Cayman Islands may, on the application of shareholders holding not less than one fifth of our shares in issue, appoint an inspector to examine the Company’s affairs and report thereon in a manner as the Grand Court shall direct.
Subject to the provisions of the Companies Act, any shareholder may petition the Grand Court of the Cayman Islands which may make a winding up order, if the court is of the opinion that this winding up is just and equitable.
Notwithstanding the U.S. securities laws and regulations that are applicable to us, general corporate claims against CI&T by its shareholders must, as a general rule, be based on the general laws of contract or tort applicable in the Cayman Islands or their individual rights as shareholders as established by our Articles.
The Cayman Islands courts ordinarily would be expected to follow English case law precedents, which permit a minority shareholder to commence a representative action against us, or derivative actions in CI&T’s name, to challenge (1) an act which is ultra vires or illegal, (2) an act which constitutes a fraud against the minority and the wrongdoers themselves control CI&T and (3) an irregularity in the passing of a resolution that requires a qualified (or special) majority.
Registration Rights and Restricted Shares
Certain of our shareholders entered into a registration rights agreement. We and our executive officers and directors who hold shares after completion of our public offering have agreed to lock-up agreements that restrict us and them, subject to specified exceptions, from selling or otherwise disposing of any shares for a period of 180 days after the date of our initial public offering. In addition, these lock-up agreements are subject to the exceptions described in “Class A Common Shares Eligible for Future Sale,” including our right to issue new shares if we carry out an acquisition or enter into a merger, joint venture or strategic participation.
Principal Differences between Cayman Islands and U.S. Corporate Law
The Companies Act was modeled originally after similar laws in England and Wales but does not follow subsequent statutory enactments in England and Wales. In addition, the Companies Act differs from laws applicable to U.S. corporations and their shareholders. Set forth below is a summary of the significant differences between the provisions of the Companies Act applicable to us and the laws applicable to companies incorporated in the United States and their shareholders.
Mergers and Similar Arrangements
The Companies Act permits mergers and consolidations between Cayman Islands companies and between Cayman Islands companies and non-Cayman Islands companies.
For these purposes, (a) “merger” means the merging of two or more constituent companies and the vesting of their undertaking, property and liabilities in one of such companies as the surviving company and (b) a “consolidation” means the combination of two or more constituent companies into a consolidated company and the vesting of the undertaking, property and liabilities of such companies in the consolidated company. In order to effect such a merger or consolidation, the directors of each constituent company must approve a written plan of merger or consolidation, which must then be authorized by (a) a special resolution of the shareholders of each constituent company; and (b) such other authorization, if any, as may be specified in such constituent company’s articles of association. The plan must be approved by the directors of each constituent company and filed with the Registrar of Companies together with a declaration as to: (1) the solvency of the consolidated or surviving company, (2) the merger or consolidation is bona fide and not intended to defraud unsecured creditors of the constituent companies, (3) no petition or other similar proceeding has been filed and remains outstanding and no order or resolution to wind up the company in any jurisdiction, (4) no receiver, trustee, administrator or similar person has been appointed in any jurisdiction and is acting in respect of the constituent company, its affairs or property, (5) no scheme, order, compromise or similar arrangement has been entered into or made in any jurisdiction with creditors, (6) a list of the assets and liabilities of each constituent company, (7) the non-surviving constituent company has retired from any fiduciary office held or will do so (8) that the constituent company has complied with any requirements under the regulatory laws, where relevant, and (9) an undertaking that a copy of the certificate of merger or consolidation will be given to the members and creditors of each constituent company and published in the Cayman Islands Gazette.
Dissenting shareholders have the right to be paid the fair value of their shares (which, if not agreed between the parties, may be determined by the Cayman Islands’ court) if they follow the required procedures, subject to certain exceptions. Court approval is not required for a merger or consolidation which is effected in compliance with these statutory procedures.
In addition, there are statutory provisions that facilitate the reconstruction and amalgamation of companies, provided that the arrangement in question is approved by a majority in number of each class of shareholders and creditors with whom the arrangement is to be made, and who must in addition represent three-fourths in value of each such class of shareholders or creditors, as the case may be, that are present and voting either in person or by proxy at a meeting, or meetings convened for that purpose. The convening of the meetings and subsequently the arrangement must be sanctioned by the Grand Court of the Cayman Islands. While a dissenting shareholder would have the right to express to the court the view that the transaction should not be approved, the court can be expected to approve the arrangement if it satisfies itself that:
| ● | CI&T is not proposing to act illegally or ultra vires and the statutory provisions as to majority vote have been complied with; |
| ●
| the shareholders have been fairly represented at the meeting in question; |
| ● | the arrangement is such that may be reasonably approved by an intelligent and honest man of that class acting in respect of his interest; and |
| ●
| the arrangement is not one that would more properly be sanctioned under some other provision of the Companies Act or that would amount to a “fraud on the minority.” |
When a takeover offer is made and accepted by holders of 90.0% in value of the shares affected within four months, the offeror may, within a two-month period, require the holders of the remaining shares to transfer such shares on the terms of the offer. An objection may be made to the Grand Court of the Cayman Islands but is unlikely to succeed unless there is evidence of fraud, bad faith or collusion.
If the arrangement and reconstruction are thus approved, any dissenting shareholders would have no rights comparable to appraisal rights, which might otherwise ordinarily be available to dissenting shareholders of U.S. corporations and allow such dissenting shareholders to receive payment in cash for the judicially determined value of their shares.
Shareholders’ Suits
Class actions are not recognized in the Cayman Islands, but groups of shareholders with identical interests may bring representative proceedings, which are similar. However, a class action suit could nonetheless be brought in a U.S. court pursuant to an alleged violation of U.S. securities laws and regulations.
In principle, CI&T itself would normally be the proper plaintiff and as a general rule, whilst a derivative action may be initiated by a minority shareholder on behalf of CI&T in a Cayman Islands court, such shareholder will not be able to continue those proceedings without the permission of a Grand Court judge, who will only allow the action to continue if the shareholder can demonstrate that CI&T has a good case against the defendant, and that it is proper for the shareholder to continue the action rather than the Company’s board of directors. Examples of circumstances in which derivative actions would be permitted to continue are where:
| ● | a company is acting or proposing to act illegally or beyond the scope of its authority; |
| ●
| the act complained of, although not beyond the scope of its authority, could be effected duly if authorized by more than a simple majority vote that has not been obtained; and |
| ● | those who control the company are perpetrating a “fraud on the minority.”
|
Borrowing Powers
Our directors may exercise all of our powers to borrow money and to mortgage or charge its undertaking, property and assets (present and future) and uncalled capital or any part thereof and to issue debentures, debenture stock, mortgages, bonds and other such securities whether outright or as security for any debt, liability or obligation of us or of any third party. Such powers may be varied by a special resolution of shareholders (requiring a two-thirds majority vote of those shareholders attending and voting at a quorate meeting).
Indemnification of Directors and Executive Officers and Limitation of Liability
The Companies Act does not limit the extent to which a company’s articles of association may provide for indemnification of directors and officers, except to the extent that it may be held by the Cayman Islands courts to be contrary to public policy, such as to provide indemnification against civil fraud or the consequences of committing a crime. Our Articles provide that we shall indemnify and hold harmless our directors and officers against all actions, proceedings, costs, charges, expenses, losses, damages, liabilities, judgments, fines, settlements and other amounts incurred or sustained by such directors or officers, other than by reason of such person’s dishonesty, willful default or fraud, in or about the conduct of our company’s business or affairs (including as a result of any mistake of judgment) or in the execution or discharge of his duties, powers, authorities or discretions, including without prejudice to the generality of the foregoing, any costs, expenses, losses or liabilities incurred by such director or officer in defending (whether successfully or otherwise) any civil, criminal or other proceedings concerning us or our affairs in any court whether in the Cayman Islands or elsewhere. This standard of conduct is generally the same as permitted under the Delaware General Corporation Law for a Delaware corporation.
Insofar as indemnification for liabilities arising under the Securities Act may be permitted to our directors, officers or persons controlling the Company under the foregoing provisions, we have been informed that, in the opinion of the SEC, this indemnification is against public policy as expressed in the Securities Act and is therefore unenforceable.
Directors’ Fiduciary Duties
As a matter of Cayman Islands law, a director of a Cayman Islands company is in the position of a fiduciary with respect to the company. Accordingly, directors owe fiduciary duties to their companies to act bona fide in what they consider to be the best interests of the company, to exercise their powers for the purposes for which they are conferred and not to place themselves in a position where there is a conflict between their personal interests and their duty to the company. Accordingly, a director owes a company a duty not to make a profit based on his or her position as director (unless the company permits him or her to do so) and a duty not to put himself or herself in a position where the interests of the company conflict with his or her personal interest or his or her duty to a third party. However, this obligation may be varied by the company’s articles of association, which may permit a director to vote on a matter in which he has a personal interest provided that he has disclosed that nature of his interest to the board of directors. Our Articles provides that a director must disclose the nature and extent of his or her interest in any contract or arrangement, and following such disclosure and subject to any separate requirement under applicable law or the listing rules of the NYSE, and unless disqualified by the chairman of the relevant meeting, such director may vote in respect of any transaction or arrangement in which he or she is interested and may be counted in the quorum at the meeting.
A director of a Cayman Islands company also owes to the company duties to exercise independent judgment in carrying out his functions and to exercise reasonable skill, care and diligence, which has both objective and subjective elements. Recent Cayman Islands case law confirmed that directors must exercise the care, skill and diligence that would be exercised by a reasonably diligent person having the general knowledge, skill and experience reasonably to be expected of a person acting as a director. Additionally, a director must exercise the knowledge, skill and experience which he or she actually possesses.
A general notice may be given to the board of directors to the effect that (1) the director is a member or officer of a specified company or firm and is to be regarded as interested in any contract or arrangement which may after the date of the notice be made with that company or firm; or (2) he or she is to be regarded as interested in any contract or arrangement which may after the date of the notice to the board of directors be made with a specified person who is connected with him or her, will be deemed sufficient declaration of interest. This notice shall specify the nature of the interest in question. Following the disclosure being made pursuant to our Articles and subject to any separate requirement under applicable law or the listing rules of the NYSE, and unless disqualified by the chairman of the relevant meeting, a director may vote in respect of any transaction or arrangement in which he or she is interested and may be counted in the quorum at the meeting.
In comparison, under Delaware corporate law, a director of a Delaware corporation has a fiduciary duty to the corporation and its shareholders. This duty has two components: the duty of care and the duty of loyalty. The duty of care requires that a director act in good faith, with the care that an ordinarily prudent person would exercise under similar circumstances. Under this duty, a director must inform himself or herself of, and disclose to shareholders, all material information reasonably available regarding a significant transaction. The duty of loyalty requires that a director act in a manner he or she reasonably believes to be in the best interests of the corporation. He or she must not use his or her corporate position for personal gain or advantage. This duty prohibits self-dealing by a director and mandates that the best interest of the corporation and its shareholders take precedence over any interest possessed by a director, officer or controlling shareholder and not shared by the shareholders generally. In general, actions of a director are presumed to have been made on an informed basis, in good faith and in the honest belief that the action taken was in the best interests of the corporation. However, this presumption may be rebutted by evidence of a breach of one of the fiduciary duties. Should such evidence be presented concerning a transaction by a director, a director must prove the procedural fairness of the transaction, and that the transaction was of fair value to the corporation.
Shareholder Proposals
Under the Delaware General Corporation Law, a shareholder has the right to put any proposal before the annual meeting of shareholders, provided it complies with the notice provisions in the governing documents. The Delaware General Corporation Law does not provide shareholders an express right to put any proposal before the annual meeting of shareholders, but Delaware corporations generally afford shareholders an opportunity to make proposals and nominations provided that they comply with the notice provisions in the certificate of incorporation or bylaws. A special meeting may be called by the board of directors or any other person authorized to do so in the governing documents, but shareholders may be precluded from calling special meetings.
The Companies Act provides shareholders with only limited rights to requisition a general meeting and does not provide shareholders with any right to put any proposal before a general meeting. However, these rights may be provided in a company’s articles of association. Our Articles provide that upon the requisition of one or more shareholders representing not less than one-third of the voting rights entitled to vote at general meetings, the board will convene an extraordinary general meeting and put the resolutions so requisitioned to a vote at such meeting. The Articles provide no other right to put any proposals before annual general meetings or extraordinary general meetings.
Furthermore, as a matter of Cayman Islands law and in contrast to the position under Delaware corporate law, controlling shareholders of Cayman Islands companies do not owe fiduciary duties to those companies, other than the limited duty that applies to all shareholders to exercise their votes to amend a company’s articles of association in good faith in the interests of the company. The absence of this minority shareholder protection might impact the ability of minority shareholders to protect their interests.
Cumulative Voting
Under the Delaware General Corporation Law, cumulative voting for elections of directors is not permitted unless the corporation’s certificate of incorporation specifically provides for it. Cumulative voting potentially facilitates the representation of minority shareholders on a board of directors since it permits the minority shareholder to cast all the votes to which the shareholder is entitled on a single director, which increases the shareholder’s voting power with respect to electing such director. As permitted under Cayman Islands law, our Articles do not provide for cumulative voting. As a result, our shareholders are not afforded any less protections or rights on this issue than shareholders of a Delaware corporation.
Removal of Directors
The office of a director shall be vacated automatically if, among other things, he or she (1) becomes prohibited by law from being a director, (2) becomes bankrupt or makes an arrangement or composition with his creditors, (3) dies or is, in the opinion of all his co-directors, incapable by reason of mental disorder of discharging his duties as director, (4) resigns his office by notice to us or (5) has for more than six months been absent without permission of the directors from meetings of the board of directors held during that period, and the remaining directors resolve that his/her office be vacated.
Transaction with Interested Shareholders
The Delaware General Corporation Law provides that; unless the corporation has specifically elected not to be governed by this statute, it is prohibited from engaging in certain business combinations with an “interested shareholder” for three years following the date that this person becomes an interested shareholder.
An interested shareholder generally is a person or a group who or which owns or owned 15% or more of the target’s outstanding voting shares or who or which is an affiliate or associate of the corporation and owned 15% or more of the corporation’s outstanding voting shares within the past three years. This has the effect of limiting the ability of a potential acquirer to make a two-tiered bid for the target in which all shareholders would not be treated equally. The statute does not apply if, among other things, prior to the date on which the shareholder becomes an interested shareholder, the board of directors approves either the business combination or the transaction which resulted in the person becoming an interested shareholder. This encourages any potential acquirer of a Delaware corporation to negotiate the terms of any acquisition transaction with the target’s board of directors.
Cayman Islands law has no comparable statute. As a result, we cannot avail ourselves of the types of protections afforded by the Delaware business combination statute. However, although Cayman Islands law does not regulate transactions between a company and its significant shareholders, it does provide that the board of directors owe duties to ensure that these transactions are entered into bona fide in the best interests of the company and for a proper corporate purpose and, as noted above, a transaction may be subject to challenge if it has the effect of constituting a fraud on the minority shareholders.
Dissolution; Winding Up
Under the Delaware General Corporation Law, unless the board of directors approves the proposal to dissolve, dissolution must be approved by shareholders holding 100% of the total voting power of the corporation. If the dissolution is initiated by the board of directors, it may be approved by a simple majority of the corporation’s outstanding shares. Delaware law allows a Delaware corporation to include in its certificate of incorporation a supermajority voting requirement in connection with dissolutions initiated by the board. Under Cayman Islands law, a company may be wound up by either an order of the courts of the Cayman Islands or by a special resolution of its members or, if the company resolves by ordinary resolution that it be wound up because it is unable to pay its debts as they fall due. The court has authority to order winding up in a number of specified circumstances including where it is, in the opinion of the court, just and equitable to do so.
Under the Companies Act, we may be dissolved, liquidated or wound up by a special resolution of shareholders (requiring a two-thirds majority vote of those shareholders attending and voting at a quorate meeting). Our Articles also give our board of directors the authority to petition the Cayman Islands Court to wind up CI&T.
Variation of Rights of Shares
Under the Delaware General Corporation Law, a corporation may vary the rights of a class of shares with the approval of a majority of the outstanding shares of that class, unless the certificate of incorporation provides otherwise. Under our Articles, if the share capital is divided into more than one class of shares, the rights attached to any class may only be varied with the written consent of the holders of two-thirds of the shares of that class or the sanction of a special resolution passed at a separate meeting of the holders of the shares of that class or, in the case of Class B common shares, a Class B Shareholder Consent.
Also, except with respect to share capital (as described above), alterations to our Articles may only be made by special resolution of shareholders (requiring a two-thirds majority vote of those shareholders attending and voting at a quorate meeting).
Amendment of Governing Documents
Under the Delaware General Corporation Law, a corporation’s certificate of incorporation may be amended only if adopted and declared advisable by the board of directors and approved by a majority of the outstanding shares entitled to vote, and the bylaws may be amended with the approval of a majority of the outstanding shares entitled to vote and may, if so provided in the certificate of incorporation, also be amended by the board of directors. Under Cayman Islands law, our Articles generally (and save for certain amendments to share capital described in this section) may only be amended by special resolution of shareholders (requiring a two-thirds majority vote of those shareholders attending and voting at a quorate meeting).
Rights of Non-Resident or Foreign Shareholders
There are no limitations imposed by our Articles on the rights of non-resident or foreign shareholders to hold or exercise voting rights on our shares. In addition, there are no provisions in the Articles governing the ownership threshold above which shareholder ownership must be disclosed.
Handling of Mail
Mail addressed to us and received at our registered office will be forwarded unopened to the forwarding address, which will be supplied by us. None of us, our directors, officers, advisors or service providers (including the organization which provides registered office services in the Cayman Islands) will bear any responsibility for any delay howsoever caused in mail reaching the forwarding address.
- Material Contracts
Except as otherwise described in this annual report on Form 20-F, we have not entered into any material contracts other than in the ordinary course of business. See “Information on the Company — History and Development of the Company” for information on the contracts related to the Dextra Acquisition and the Somo Acquisition.
- Exchange Controls
Not applicable.
- Taxation
The following summary contains a description of certain Cayman Islands and U.S. federal income tax consequences of the acquisition, ownership and disposition of our Class A common shares. It does not purport to be a comprehensive description of all the tax considerations that may be relevant to a decision to purchase the Class A common shares, is not applicable to all categories of investors, some of which may be subject to special rules, and does not address all of the Cayman Islands and U.S. federal income tax considerations applicable to any particular holder. The summary is based upon the tax laws of the Cayman Islands and regulations thereunder and upon the tax laws of the United States and regulations thereunder as of the date hereof, which are subject to change.
Prospective purchasers of our Class A common shares should consult their own tax advisors about the particular Cayman Islands and U.S. federal, state, local and other tax consequences to them of the acquisition, ownership and disposition of our Class A common shares, including any other tax consequences under the laws of their country of citizenship, residence or domicile.
Cayman Islands Tax Considerations
Cayman Islands Taxation
The following is a discussion on certain Cayman Islands income tax consequences of an investment in Class A common shares. The discussion is a general summary of present law, which is subject to prospective and retroactive change. It is not intended as tax advice, does not consider any investor’s particular circumstances, and does not consider tax consequences other than those arising under Cayman Islands law.
Under Existing Cayman Islands Laws:
Payments of dividends and capital in respect of the Class A common shares will not be subject to taxation in the Cayman Islands and no withholding will be required on the payment of interest and principal or a dividend or capital to any holder of Class A common shares, as the case may be, nor will gains derived from the disposal of Class A common shares be subject to Cayman Islands income or corporation tax. The Cayman Islands currently have no income, corporation or capital gains tax and no estate duty, inheritance tax or gift tax.
No stamp duty is payable in respect of the issue of our Class A common shares or on an instrument of transfer in respect of a Class A common share.
We have been incorporated under the laws of the Cayman Islands as an exempted company with limited liability and, as such, have applied for and obtained an undertaking from the Governor in Cabinet of the Cayman Islands in the following form:
The Tax Concessions Law Undertaking As To Tax Concessions
In accordance with the Tax Concessions Law the following undertaking is hereby given to the Issuer. “the Company”:
| [1]
| That no Law which is hereafter enacted in the Islands imposing any tax to be levied on profits, income, gains or appreciations shall apply to the Company or its operations; and |
| [2] | In addition, that no tax to be levied on profits, income, gains or appreciations or which is in the nature of estate duty or inheritance tax shall be payable |
| (i) | on or in respect of the shares debentures or other obligations of the Company; or |
| (ii)
| by way of the withholding in whole or in part of any relevant payment as defined in the Tax Concessions Law. |
These concessions shall be for a period of TWENTY years from the 9th day of June, 2021.
United States Federal Income Tax Considerations
The following is a summary of material U.S. federal income tax considerations that are likely to be relevant to the purchase, ownership and disposition of our Class A common shares by a U.S. Holder (as defined below).
This summary is based on provisions of the Internal Revenue Code of 1986, as amended (the “Code”), and regulations, rulings and judicial interpretations thereof, in force as of the date hereof. Those authorities may be changed at any time, perhaps retroactively, so as to result in U.S. federal income tax consequences different from those summarized below.
This summary is not a comprehensive discussion of all of the tax considerations that may be relevant to a particular investor’s decision to purchase, hold, or dispose of Class A common shares. In particular, this summary is directed only to U.S. Holders that hold Class A common shares as capital assets and does not address particular tax consequences that may be applicable to U.S. Holders who may be subject to special tax rules, such as banks, brokers or dealers in securities or currencies, traders in securities electing to mark to market, financial institutions, life insurance companies, tax-exempt entities, regulated investment companies, entities or arrangements that are treated as partnerships for U.S. federal income tax purposes (or partners therein), holders that own or are treated as owning 10% or more of our stock by vote or value, persons holding Class A common shares as part of a hedging or conversion transaction or a straddle, former U.S. citizens and residents, nonresident alien individual present in the United States for a period or periods aggregating 183 days or more during the taxable year, or persons whose functional currency is not the U.S. dollar. Moreover, this summary does not address state, local or foreign taxes, the U.S. federal estate and gift taxes, or the Medicare contribution tax applicable to net investment income of certain non-corporate U.S. Holders, or alternative minimum tax consequences of acquiring, holding or disposing of Class A common shares.
For purposes of this summary, a “U.S. Holder” is a beneficial owner of Class A common shares that is a citizen or resident of the United States or a U.S. domestic corporation or that otherwise is subject to U.S. federal income taxation on a net income basis in respect of such Class A common shares.
You should consult your own tax advisors about the consequences of the acquisition, ownership, and disposition of Class A common shares, including the relevance to your particular situation of the considerations discussed below and any consequences arising under foreign, state, local or other tax laws.
Taxation of Dividends
Subject to the discussion below under “— Passive Foreign Investment Company Status,” the gross amount of any distribution of cash or property with respect to our shares (including any amount withheld in respect of Brazilian taxes) that is paid out of our current or accumulated earnings and profits (as determined for U.S. federal income tax purposes) will generally be includible in your taxable income as ordinary dividend income on the day on which you receive the dividend and will not be eligible for the dividends-received deduction allowed to corporations under the Code.
We do not expect to maintain calculations of our earnings and profits in accordance with U.S. federal income tax principles. U.S. Holders therefore should expect that distributions generally will be treated as dividends for U.S. federal income tax purposes.
If you are a U.S. Holder, dividends paid in a currency other than U.S. dollars generally will be includible in your income in a U.S. dollar amount calculated by reference to the exchange rate in effect on the day you receive the dividends. Any gain or loss on a subsequent sale, conversion or other disposition of such non-U.S. currency by such U.S. Holder generally will be treated as ordinary income or loss and generally will be income or loss from sources within the United States.
Subject to certain exceptions for short-term positions, the U.S. dollar amount of dividends received by an individual with respect to the shares will be subject to taxation at a preferential rate if the dividends are “qualified dividends.” Dividends paid on the shares will be treated as qualified dividends if:
| ● | the shares are readily tradable on an established securities market in the United States or we are eligible for the benefits of a comprehensive tax treaty with the United States that the U.S. Treasury determines is satisfactory for purposes of this provision and that includes an exchange of information program; and |
| ●
| we were not, in the year prior to the year in which the dividend was paid, and are not, in the year in which the dividend is paid, a PFIC. |
Our Class A common shares are listed on the New York Stock Exchange, and will qualify as readily tradable on an established securities market in the United States so long as they are listed. Based on our audited consolidated financial statements and relevant market and shareholder data, we believe that we were not treated as a PFIC for U.S. federal income tax purposes with respect to our prior taxable year. In addition, based on our audited consolidated financial statements and our current expectations regarding the value and nature of our assets, the sources and nature of our income, and relevant market and shareholder data, we do not anticipate becoming a PFIC for our current taxable year or in the foreseeable future. Holders should consult their own tax advisors regarding the availability of the reduced dividend tax rate in light of their own particular circumstances.
Dividend distributions with respect to our Class A common shares generally will be treated as “passive category” income from sources outside the United States for purposes of determining a U.S. Holder’s U.S. foreign tax credit limitation.
U.S. Holders that receive distributions of additional Class A common shares or rights to subscribe for Class A common shares as part of a pro rata distribution to all our shareholders generally will not be subject to U.S. federal income tax in respect of the distributions, unless the U.S. Holder has the right to receive cash or property, in which case the U.S. Holder will be treated as if it received cash equal to the fair market value of the distribution.
Taxation of Dispositions of Shares
Subject to the discussion below under “—Passive Foreign Investment Company Status,” upon a sale, exchange or other taxable disposition of Class A common shares, U.S. Holders will realize gain or loss for U.S. federal income tax purposes in an amount equal to the difference between the amount realized on the disposition and the U.S. Holder’s adjusted tax basis in the Class A common shares. Such gain or loss will be capital gain or loss, and will generally be long-term capital gain or loss if the Class A common shares have been held for more than one year. Long-term capital gain realized by a U.S. Holder that is an individual generally is subject to taxation at a preferential rate. The deductibility of capital losses is subject to limitations.
Gain, if any, realized by a U.S. Holder on the sale or other disposition of Class A common shares generally will be treated as U.S. source income for U.S. foreign tax credit purposes.
Passive Foreign Investment Company Status
Special U.S. tax rules apply to companies that are considered to be PFICs. We will be classified as a PFIC in a particular taxable year if, taking into account our proportionate share of the income and assets of our subsidiaries under applicable “look-through” rules, either
| ● | 75 percent or more of our gross income for the taxable year is passive income; or |
| ●
| 50 percent or more of the value of our assets (generally determined on the basis of a quarterly average) is attributable to assets that produce, or are held for the production of, passive income. |
For this purpose, passive income generally includes dividends, interest, gains from certain commodities transactions, rents, royalties and the excess of gains over losses from the disposition of assets that produce passive income.
Based on our audited financial statements and our current expectations regarding the value and nature of our assets, the sources and nature of our income, and relevant market and shareholder data, we do not believe that we were a PFIC in 2021, and we do not anticipate becoming a PFIC for our current taxable year or in the reasonably foreseeable future. However, the determination whether we are a PFIC must be made annually after the close of each taxable year and based on the facts and circumstances at that time, such as the valuation of our assets, including goodwill and other intangible assets, which may depend on the value of our Class A common shares at the time and can be expected to vary over time. The determination of our PFIC status also depends on whether and how fast we deploy significant amounts of cash and other liquid assets. Accordingly, we cannot be certain that we will not be a PFIC in the current year or in future years.
If we are classified as a PFIC, and you do not make a mark-to-market election, you will be subject to a special tax at ordinary income tax rates on “excess distributions,” including certain distributions by us and gain that you recognize on the sale of your Class A common shares. The amount of income tax on any excess distributions will be increased by an interest charge to compensate for tax deferral, calculated as if the excess distributions were earned ratably over the period you hold your Class A common shares. Classification as a PFIC may also have other adverse tax consequences, including, in the case of individuals, the denial of a step-up in the basis of your Class A common shares at death.
If you are a U.S. Holder that owns an equity interest in a PFIC, you generally must annually file IRS Form 8621, and may be required to file other IRS forms. A failure to file one or more of these forms as required may toll the running of the statute of limitations in respect of each of your taxable years for which such form is required to be filed. As a result, the taxable years with respect to which you fail to file the form may remain open to assessment by the IRS indefinitely, until the form is filed.
You should consult your own tax advisor regarding the U.S. federal income tax considerations discussed above and the desirability of making a mark-to-market election.
Foreign Financial Asset Reporting.
Certain U.S. Holders that own “specified foreign financial assets” with an aggregate value in excess of U.S.$50,000 on the last day of the taxable year or U.S.$75,000 at any time during the taxable year are generally required to file an information statement along with their tax returns, currently on IRS Form 8938, with respect to such assets. “Specified foreign financial assets” include any financial accounts held at a non-U.S. financial institution, as well as securities issued by a non-U.S. issuer that are not held in accounts maintained by financial institutions. The understatement of income attributable to “specified foreign financial assets” in excess of U.S.$5,000 extends the statute of limitations with respect to the tax return to six years after the return was filed. U.S. Holders who fail to report the required information could be subject to substantial penalties. Prospective investors are encouraged to consult with their own tax advisors regarding the possible application of these rules, including the application of the rules to their particular circumstances.
Backup Withholding and Information Reporting
Dividends paid on, and proceeds from the sale or other disposition of, the Class A common shares to a U.S. Holder generally may be subject to the information reporting requirements of the Code and may be subject to backup withholding unless the U.S. Holder provides an accurate taxpayer identification number and makes any other required certification or otherwise establishes an exemption. Backup withholding is not an additional tax. The amount of any backup withholding from a payment to a U.S. Holder will be allowed as a refund or credit against the U.S. Holder’s U.S. federal income tax liability, provided the required information is furnished to the U.S. Internal Revenue Service in a timely manner.
A holder that is not a U.S. Holder may be required to comply with certification and identification procedures in order to establish its exemption from information reporting and backup withholding.
We are subject to the informational requirements of the Exchange Act applicable to foreign private issuers. Accordingly, we are required to file reports and other information with the SEC, including annual reports on Form 20-F within four months from the end of each of our fiscal years, and reports on Form 6-K. You can read our SEC filings over the Internet at the SEC’s website at www.sec.gov. You may also read and copy any document we file with the SEC at its public reference room at 100 F. Street, N.E., Washington, D.C. 20549. You may obtain copies of these documents upon the payment of the fees prescribed by the SEC. Please call the SEC at 1-800-SEC-0330 for further information about the public reference room.
| I. | Subsidiary Information |
| See note 2 to our audited consolidated financial statements for a description of the Company’s subsidiaries.
|
ITEM 11. QUANTITATIVE AND QUALITATIVE DISCLOSURES ABOUT MARKET RISK
Our exposure to market risks results from operational activities and political and economic changes, consisting of credit, interest rate, currency, price and liquidity risk, as well as from operations with derivative financial instruments.
Credit Risk
Credit risk is the risk of a counterparty in a business transaction not complying with an obligation provided by a financial instrument or an agreement with a customer, which would cause financial losses. To mitigate these risks, we have adopted as a practice an analysis of the financial and equity condition of our counterparties, as well as the definition of credit limits and permanent monitoring of outstanding positions.
Our trade receivable from clients derive directly from transactions recorded at their original value, subject to exchange rate variation, when applicable, and to a provision for losses. In 2021, our trade receivables increased by 74% when compared to 2020, following the increase in revenue and the exchange rate variation in foreign currency.
Foreign Currency — Exchange rate risk
Foreign currency risk is intrinsic to our business model. Our revenue is mostly in foreign currency and thus is exposed to exchange rate variation. Our expenses, on the other hand, are mostly in our functional currency (Brazilian reais) and, as a consequence, are not as exposed to exchange rate risks (when compared to our revenue). Our audited consolidated financial statements have a presentation currency in Brazilian reais, and we aim to mitigate our exchange rate exposure through financial derivatives in order to minimize the volatility of our functional currency, therefore we are exposed to exchange rate risk on our financial investments, trade payables, trade receivables, loans and borrowing and derivatives.
| Year ended December 31, |
| 2021 |
| 2020 |
| USD (thousands) |
| Other(1) (thousands) |
| USD (thousands) |
| Other(1) (thousands) |
Financial investments | 798,786 |
| - |
| - |
| - |
Suppliers and other payables | (8,763) |
| (722) |
| (3,057) |
| (540) |
Trade Receivables | 233,724 |
| 7,273 |
| 160,411 |
| 3,855 |
Loans and borrowing | (266,561) |
| - |
| (37,116) |
| - |
Lease liabilities | (32,159) |
| (962) |
| (30,307) |
| - |
Derivatives | 361 |
| - |
| (1,321) |
| - |
Net exposure | 725,388 |
| 5,589 |
| 88,610 |
| 3,315 |
| (1) | Includes amounts in Australian dollars, Canadian dollars and Japanese yen. |
Interest Rate Risk
Interest rate risk exists due to the possibility of incurring gains or losses resulting from fluctuations in interest rates on our financial assets and liabilities. To minimize the influence of interest rate variation, we adopt diversification policies. For our funding operations, we rotate between fixed and variable rates, using the CDI, and periodically renegotiating contracts when investments are referenced to the CDI rate. To mitigate interest rate risks in financial assets and liabilities, we contract financial derivatives.
Exchange rate fluctuations and interest rate variations can positively or adversely affect our results. To control these variations, we have identified the main risks that can generate changes to our audited consolidated financial statements and we have used three scenarios to analyze the impacts on our results and future cash flows based on a probable, adverse and remote scenario, as described below:
| (i) | Probable scenario: This reflects management’s expectation and projections based on internal and external data, considering: (i) the interest rate index in order to analyze the sensitivity of index in short-term investments, whose average was 10.67% for CDI and loans and borrowings, whose average was 0.27% for Libor (only applicable for some loans and borrowings); and, (ii) the exchange rate of R$5.30 for U.S. dollar, related to the closing rate project by us, for the purposes of analyzing the foreign exchange exposure. Based on these factors, variations in the adverse and remote scenarios were calculated. |
| (ii) | Adverse Scenario: The adverse scenario rate is half the difference between the probable rate and the remote rate. |
| (iii) | Remote Scenario: The highest projection expected by us for the next 12 months. |
For each scenario, the gross finance income or costs were calculated, excluding taxes and the maturity flow of each agreement. The base date considered was December 31, 2021, projecting the indexes for one year and verifying their sensitivity in each scenario.
Sensitivity analysis for exchange rate risk
| Risk |
| Probable Scenario (i) |
| Adverse Scenario (ii) |
| Remote Scenario (iii) |
Net exchange variation on transactions | Foreign currency appreciation - USD |
| 5.30 |
| 5.50 |
| 5.70 |
Exchange variation in the year | |
| (5,718) |
| (5,933) |
| (6,378) |
Effects on earnings (increase) | |
| 303 |
| 88 |
| (357) |
Sensitivity analysis for interest rate risk
| Risk |
| Exposure (in thousands of R$) |
| Probable Scenario (i) |
| Adverse Scenario (ii) |
| Remote Scenario (iii) |
Short-term financial investments | Interest rate increase - CDI |
| 66,007 |
| 10.67% |
| 11.39% |
| 12.11% |
| |
| |
| 7,043 |
| 7,518 |
| 7,993 |
Loans and borrowings | Interest rate increase - CDI |
| (609,374) |
| 10.67% |
| 11.39% |
| 12.11% |
| |
| |
| (65,020) |
| (69,408) |
| (73,795) |
Loans and borrowings | Interest rate increase - Libor |
| (179,333) |
| 0.27% |
| 0.54% |
| 0.81% |
| |
| |
| (484) |
| (968) |
| (1,452) |
Effect on earnings (reduction) | |
| |
| (8,367) |
| (12,763) |
| (17,160) |
Liquidity Risk
Liquidity risk is related to maintaining cash and meeting our obligations through cash generation. We monitor our liquidity risk through the management of our cash resources and financial investments. We also manage our liquidity risk through our cash flow projections, which aims to ensure the availability of funds to meet our both operational and financial obligations.
We also maintain approved credit lines with financial institutions, and other indebtedness such as working capital agreements in order to adequate levels of liquidity in the short, medium and long terms.
The maturity of the long-term installments of the loans and borrowings are described in note 16 to our audited consolidated financial statements.
| |
| |
| Year Ended December 31, 2021 |
|---|
|
|
|
|
| R$ (thousands) |
|---|
| Carrying amount |
| Cash contractual cash flow |
| 6 months (or less) |
| 6-12 months |
| 1-2 years |
| 2-5 years |
|---|
Non-derivative financial liabilities | |
| |
| |
| |
| |
| |
Trade payables | 33,566 |
| 33,566 |
| 33,566 |
| - |
| - |
| - |
Loans and borrowings | 788,709 |
| 974,942 |
| 136,161 |
| 88,045 |
| 171,022 |
| 579,714 |
Lease Liabilities | 81,888 |
| 87,662 |
| 12,435 |
| 12,251 |
| 22,284 |
| 40,682 |
Accounts payable for business combination | 85,726 |
| 85,726 |
| 1,064 |
| 47,860 |
| 12,179 |
| 24,623 |
Contract liabilities | 13,722 |
| 13,722 |
| 13,722 |
| - |
| - |
| - |
Other payables (current and no-current) | 15,329 |
| 15,329 |
| 15,329 |
| - |
| - |
| - |
Derivatives | 535 |
| 535 |
| 535 |
| - |
| - |
| - |
| 1,019,475 |
| 1,211,482 |
| 212,812 |
| 148,156 |
| 205,485 |
| 645,029 |
| |
| |
| Year Ended December 31, 2020 |
| |
| |
| R$ (thousands) |
| Carrying amount |
| Cash contractual cash flow |
| 6 months (or less) |
| 6-12 months |
| 1-2 years |
| 2-5 years |
Non-derivative financial liabilities | |
| |
| |
| |
| |
| |
Trade payables | 15,312 |
| 15,312 |
| 15,312 |
| - |
| - |
| - |
Loans and borrowings | 89,230 |
| 111,779 |
| 78,898 |
| 7,313 |
| 23,901 |
| 1,667 |
Lease Liabilities | 75,228 |
| 93,242 |
| 11,393 |
| 10,470 |
| 19,053 |
| 52,326 |
Contract liabilities | 9,987 |
| 9,987 |
| 9,987 |
| - |
| - |
| - |
Other payables (current and no-current) | 8,856 |
| 8,856 |
| 8,856 |
| - |
| - |
| - |
Derivatives | 5,392 |
| 5,392 |
| 1,920 |
| 3,472 |
| - |
| - |
| 204,005 |
| 244,568 |
| 126,366 |
| 21,255 |
| 42,954 |
| 53,993 |
Derivative financial instruments risk
We use derivative financial instruments only to hedge against risks identified in our operations, and not for speculative purposes.
We have entered into derivative financial instruments to hedge our foreign currency and interest rate risk exposures. As of December 31, 2021, we entered into a purchase and sale agreement for derivative financial instruments (NDFs) in the amount of R$(17). Fair value estimated for derivative financial instruments contracted by us was determined according to information available in the market, mainly through financial institutions and specific methodologies of assessment. However, considerable judgment is necessary to understand market data in order to produce the fair value estimated for each operation. Consequently, the estimates do not necessarily indicate the amounts that will be effectively realized at settlement.
We also use options in order to protect our exports against the risk of exchange variation, we may enter into zero-cost collar strategies, which consist of the purchase of a put option and the sale of a call option, contracted with the same counterparty and with a net zero premium.
During the 2021, we entered into an interest rate swap transaction with the purpose of hedging the exposure to variable interest rate related to the Export Credit Note - NCE with Citibank.
We have financial instruments measured at fair value, which are qualified as defined below:
Level 1 — Quoted prices (unadjusted) in active markets for identical assets or liabilities that we may have access to on the measurement date;
Level 2 — Observable information for the asset or liability, directly or indirectly, except quoted prices included in Level 1; and
Level 3 — Unobservable data for the asset or liability.
Fair Value Valuation | |
| Year ended December 31, 2021 |
| Carrying amount |
| Fair Value |
| R$ (thousands) |
Level 2 | |
| |
Derivatives | |
| |
Non-Deliverable Forward – NDF | (17) |
| (17) |
Call and put option term | 403 |
| 403 |
Interest rate swap | (25) |
| (25) |
| 361 |
| 361 |
Non-derivatives | |
| |
Lease liabilities | (81,888) |
| (87,662) |
Loans and borrowings | (788,709) |
| (974,972) |
| (870,597) |
| (1,062,604) |
| (870,236) |
| (1,062,243) |
Fair Value Valuation | |
| |
| Year ended December 31, 2020 |
| Carrying amount |
| Fair Value |
| R$ (thousands) |
Level 2 | |
| |
Derivatives | |
| |
Non-Deliverable Forward – NDF | 1,321 |
| 1,321 |
Call and put option term | 2,124 |
| 2,124 |
Interest rate swap | - |
| - |
| 3,445 |
| 3,445 |
Non-derivatives | |
| |
Lease liabilities | (75,228) |
| (93,242) |
Loans and borrowings | (89,230) |
| (111,779) |
| (164,458 |
| (205,021) |
| (161,013) |
| (201,576) |
ITEM 12. DESCRIPTION OF SECURITIES OTHER THAN EQUITY SECURITIES
| A. | Debt Securities |
| Not applicable. |
|
|
| B. | Warrants and Rights |
| Not applicable. |
|
|
| C. | Other Securities |
| Not applicable. |
|
|
| D. | American Depositary Shares |
| Not applicable. |
|
|
PART II
ITEM 13. DEFAULTS, DIVIDEND ARREARAGES AND DELINQUENCIES
None.
ITEM 14. MATERIAL MODIFICATIONS TO THE RIGHTS OF SECURITY HOLDERS AND USE OF PROCEEDS
None.
ITEM 15. CONTROLS AND PROCEDURES
- Disclosure Controls and Procedures
We have evaluated, with the participation of our Chief Executive Officer and Chief Financial Officer, the effectiveness of our disclosure controls and procedures as of December 31, 2021. There are inherent limitations to the effectiveness of any system of disclosure controls and procedures, including the possibility of human error and the circumvention or overriding of the controls and procedures. Accordingly, even effective disclosure controls and procedures can only provide reasonable assurance of achieving their control objectives. Based upon our evaluation, our management concluded that our disclosure controls and procedures as of December 31, 2021 were ineffective in view of the material weaknesses in internal control over financial reporting as described in Item 3D of this annual report under the caption “Material weaknesses in our internal control over financial reporting have been identified and, if we fail to implement and maintain effective internal controls over financial reporting, we may be unable to accurately report our results of operations, meet our reporting obligations or prevent fraud. As we are an emerging growth company, our independent registered public accounting firm has not yet conducted an audit of our internal control over financial reporting in accordance with the provisions of the Sarbanes-Oxley Act of 2002.”
- Management’s Annual Report on Internal Control Over Financial Reporting
This annual report does not include a report of management’s assessment regarding internal control over financial reporting due to a transition period established by rules of the SEC for newly public companies.
- Attestation Report of the Registered Public Accounting Firm
This annual report does not include an attestation report by our independent registered public accounting firm due to a transition period established by rules of the SEC for newly public companies.
- Changes in Internal Control Over Financial Reporting
In connection with the audit of our consolidated financial statements for the year ended December 31, 2021, we have identified material weaknesses in our internal control over financial reporting. These material weaknesses identified relate to: (i) ineffective design and implementation of general information technology controls (GITCs) in user access over information technology systems that support our financial reporting processes, as well as the completeness and accuracy of reports used by us, which resulted in business process controls that are dependent on the affected GITCs also being considered ineffective because they could have been adversely impacted; and (ii) ineffective design and implementation of formal controls within the financial reporting review of manual journal entries.
We have been implementing several measures to remediate these material weaknesses to improve our internal control over financial reporting, including:
| (i) | With respect to GITCs, implementation of access management processes and related tools, including an access grant policy with related internal controls for access approval and quarterly access control review in our enterprise resource planning (ERP). We also reviewed and removed current generic user accounts in our systems and created an approval control for new users and another control that requires registration of all generic accounts, purposes and responsibilities. A privileged access management (PAM) tool was also implemented to manage administrative accounts that allows traceability to monitor privileged access to the server. In addition, we carried out training with the teams involved in the new processes and controls designed, communicated the new policies in a corporate manner, continuously monitored the effectiveness of controls and made improvements when identified. We will implement additional measures so that these controls become effective, such as structuring new training and creating fault-detecting controls. |
| (ii) | With respect to formal controls within the financial reporting review of manual journal entries, we implemented a new preventive control based on automation in the ERP. The approval will be carried out in the system ensuring the flow of approval, authority and timeliness. The access grant policy was created, showing the limits of approval authority and access restrictions for launches and approval. These limits of authority and restrictions were also parameterized in the ERP. These controls were implemented in February 2022, and its effectiveness will be monitored throughout 2022. |
There can be no assurance that the measures we have taken to date, and actions we may take in the future, will be sufficient to remediate the control deficiencies that led to these material weaknesses in our internal control over financial reporting or that they will prevent or avoid potential future material weaknesses.
In connection with the audit of our consolidated financial statements for the year ended December 31, 2020, we had previously identified a deficiency that we considered to be a material weakness: ineffective design and implementation of GITCs, in program change-management over information technology systems that support our financial reporting processes. During 2021, we implemented improvements, including the implementation of segregation of access for transporting changes to the production environment and the segregation between development and production environments, the creation of a Change Management Policy and the creation of access control to development and production environments. Our remediation efforts have improved our internal control environment with respect to this deficiency, which we no longer consider to be a material weakness.
ITEM 16. RESERVED
- Audit Committee Financial Expert
The audit committee, which currently consists of Fernando Matt Borges Martins, Eduardo Campozana Gouveia and Maria Helena dos Santos Fernandes de Santana, assists our board of directors in overseeing our accounting and financial reporting processes and the audits of our financial statements. In addition, the audit committee is directly responsible for the appointment, compensation, retention and oversight of the work of our independent registered public accounting firm. Maria Helena dos Santos Fernandes de Santana serves as Chairman of the audit committee. The audit committee consists exclusively of members of our board of directors who are financially literate, and Fernando Matt Borges Martins qualifies as “audit committee financial expert” as defined in Item 16A of Form 20-F. Our board of directors has determined that Eduardo Campozana Gouveia and Maria Helena dos Santos Fernandes de Santana satisfy the “independence” requirements set forth in Rule 10A-3 under the Exchange Act. For more information, see “Directors, Senior Management and Employees — C. Board Practices — Board Committees — Audit Committee.”
- Code of Ethics
We have adopted a code of ethics applicable to our personnel and our subsidiaries’ personnel, including board members, directors, officers, employees, interns and all people acting on our behalf or on behalf of our corporate group. Our code of ethics is also applicable to relevant third parties involved in our activities, such as suppliers, consultants and other service providers. Our code of ethics describes our mission, vision and values and provides the relevant conduct standards that must be followed by our personnel and our subsidiaries’ personnel. It regulates our interactions with our suppliers, clients, and governmental entities and agents. Our code of ethics also provides fundamental rules of conduct related to conflict of interest situations, the protection of our confidential information and assets and our compliance with applicable laws and relevant information on whistleblowing procedures. We have also posted a copy of our code of ethics on our website at https://s28.q4cdn.com/106679464/files/doc_downloads/governance/Code_of_Ethics_and_Conduct.pdf. The information contained in, or accessible through, our website is not incorporated by reference in this report.
- Principal Accountant Fees and Services
The following table sets forth the aggregate fees by categories specified below in connection with certain professional services rendered by KPMG Auditores Independentes Ltda. (“KPMG”), our principal accountants, for the periods indicated.
| Year ended December 31, |
| 2021 |
| 2020 |
| (US$ thousand) |
Audit fees | 354 |
| 85 |
Audit-related fees | 693 |
| - |
Total fees | 1,047 |
| 85 |
“Audit Fees” are the aggregate fees billed by KPMG for the audit of our consolidated annual financial statements, reviews of interim financial statements and attestation services that are provided in connection with statutory and regulatory filings or engagements.
“Audit-Related Fees” are fees charged by KPMG for assurance and related services that are reasonably related to the performance of the audit or review of our financial statements and are not reported under “Audit Fees.” This category comprises fees for review of registration statements and comfort letters for the Company, agreed upon procedure engagements and other attestation services subject to regulatory requirements. It also ould includes, among others: accounting consultations and audits in connection with acquisitions, internal control reviews, attest services that are not required by statue or regulation and consultation concerning financial accounting and reporting standards.
We have established policies and procedures that require any engagement of our independent auditor for audit or non-audit services to be submitted to and pre-approved by the audit committee. In addition, our audit committee may delegate its authority to pre-approve services to one or more members of the audit committee, provided that such designees present any such approvals to the full audit committee at the next audit committee meeting following such pre-approval.
- Exemptions from the listing standards for audit committees
We are relying on the exemption under Rule 10A-3(b)(1)(iv)(A)(2) of the Exchange Act, which provides that a minority of the members of the listed issuer’s audit committee may be exempt from the independence requirements of paragraph (b)(1)(ii) of Rule 10A-3 for one year from the date of effectiveness of the registration statement covering an initial public offering of securities listed by the issuer. Our audit committee currently comprises three directors of whom two are independent directors.
We do not believe that our reliance on the temporary exemption permitted by Rule 10A-3(b)(1)(iv)(A)(2) materially adversely affects the ability of our audit committee to act independently or to satisfy the requirements of Rule 10A-3 under the Exchange Act. Our audit committee will consist solely of independent directors within one year of our initial public offering.
- Purchases of Equity Securities by the Issuer and Affiliated Purchasers
Not applicable.
- Change in registrant’s certifying accountant
Not applicable.
- Corporate governance
Cayman Islands law restricts transactions between a company and its directors unless there are provisions in the articles of association which provide a mechanism to alleviate possible conflicts of interest. Additionally, Cayman Islands law imposes on directors’ duties of care and skill and fiduciary duties to the companies which they serve. Under our Articles, a director must disclose the nature and extent of his interest in any contract or arrangement, and following such disclosure and subject to any separate requirement under applicable law or the listing rules of the NYSE, and unless disqualified by the chairman of the relevant meeting, the interested director may vote in respect of any transaction or arrangement in which he or she is interested. The interested director shall be counted in the quorum at such meeting and the resolution may be passed by a majority of the directors present at the meeting.
Subject to the foregoing and the Articles, our directors may exercise all of our powers to vote for compensation to themselves or any member of their body in the absence of an independent quorum. The Articles provide that, in the event a compensation committee is established, it shall be made up of such number of independent directors as is required from time to time by the NYSE rules (or as otherwise may be required by law). We currently have no intention to establish a compensation committee.
As a foreign private issuer, we are permitted to follow home country practice in lieu of certain Stock Exchange corporate governance rules, subject to certain requirements. We currently rely, and will continue to rely, on the foreign private issuer exemption with respect to the following rules:
| ● | NYSE Rule 303A.01, which requires that independent directors comprise a majority of a company’s board of directors. As allowed by the laws of the Cayman Islands, independent directors do not comprise a majority of our board of directors. |
●
| NYSE Rule 303A.04, which requires that a company have a nomination/corporate governance committee comprised solely of “independent directors.” Although we currently have a nominating committee, we are not required by the laws of the Cayman Islands, nor do we intend to have such committee comply with NYSE Rule 303A.04. |
| ● | NYSE Rule 303A.05, which requires that a company have a compensation committee comprised solely of independent directors. Although our nominating committee also serves a compensation committee function, we are not required by the laws of the Cayman Islands, nor do we intend to have such committee comply with NYSE Rule 303A.04. |
- Mine Safety Disclosure
Not applicable.
- Disclosure Regarding Foreign Jurisdictions That Prevent Inspections
Not applicable.
PART III
ITEM 17. FINANCIAL STATEMENTS
Not applicable.
ITEM 18. FINANCIAL STATEMENTS
See our consolidated financial statements beginning at page F-1.
ITEM 19. EXHIBITS
The following documents are filed or incorporated by reference as part of this registration statement
| † | Incorporated by reference |
| ** | Certain schedules have been omitted pursuant to Item 601(b)(2) of Regulation S-K. A copy of any omitted schedule will be furnished supplementally to the SEC upon request. |
SIGNATURES
The registrant hereby certifies that it meets all of the requirements for filing on Form 20-F and that it has duly caused and authorized the undersigned to sign this annual report on its behalf.
| CI&T Inc
|
|
|
|
|
|
| By: | /s/ Cesar Nivaldo Gon |
|
|
| Name: Cesar Nivaldo Gon |
|
|
| Title: Chief Executive Officer |
|
|
|
|
|
| By: | /s/ Stanley Rodrigues |
|
|
| Name: Stanley Rodrigues |
|
|
| Title: Chief Financial Officer |
|
Date: April 22, 2022
CI&T
Inc
Consolidated financial statements
December 31, 2021
Index to Financial Statements
Auditor Name: KPMG Auditores Independentes Ltda.
Auditor Location: Campinas, Brazil
Auditor Firm ID: 1124
To the Stockholders and Board of Directors
CI&T, Inc.:
Opinion on the Consolidated Financial Statements
We have audited the accompanying consolidated statement of financial position of CI&T, Inc. and subsidiaries (the Company) as of December 31, 2021 and 2020, the related consolidated statements of profit or loss, other comprehensive income, changes in equity, and cash flows for each of the years in the three-year period ended December 31, 2021,and the related notes (collectively, the consolidated financial statements). In our opinion, the consolidated financial statements present fairly, in all material respects, the financial position of the Company as of December 31, 2021 and 2020, and the results of its operations and its cash flows for for each of the years in the three year period ended December 31, 2021, in conformity with International Financial Reporting Standards as issued by the International Accounting Standards Board.
Basis for Opinion
These consolidated financial statements are the responsibility of the Company’s management. Our responsibility is to express an opinion on these consolidated financial statements based on our audits. We are a public accounting firm registered with the Public Company Accounting Oversight Board (United States) (PCAOB) and are required to be independent with respect to the Company in accordance with the U.S. federal securities laws and the applicable rules and regulations of the Securities and Exchange Commission and the PCAOB.
We conducted our audits in accordance with the standards of the PCAOB. Those standards require that we plan and perform the audit to obtain reasonable assurance about whether the consolidated financial statements are free of material misstatement, whether due to error or fraud. Our audits included performing procedures to assess the risks of material misstatement of the consolidated financial statements, whether due to error or fraud, and performing procedures that respond to those risks. Such procedures included examining, on a test basis, evidence regarding the amounts and disclosures in the consolidated financial statements. Our audits also included evaluating the accounting principles used and significant estimates made by management, as well as evaluating the overall presentation of the consolidated financial statements. We believe that our audits provide a reasonable basis for our opinion.
By:
| /s/ KPMG Auditores Independentes Ltda. |
|
| KPMG Auditores Independentes Ltda. |
|
We have served as the Company’s auditor since 2018.
Campinas, Brazil
April 22, 2022
CI&T Inc.
(In thousands of Brazilian Reais - R$)
2
Assets | Note |
| December 31, 2021 |
| December 31, 2020 |
| Liabilities and equity | Note |
| December 31, 2021 |
|
| December 31, 2020 |
|
|
|
|
|
|
|
|
|
|
|
|
|
|
|
|
Cash and cash equivalents | 10.1 |
| 135,727 |
| 162,827 |
| Suppliers and other payables | 16 |
| 33,566 |
|
| 15,312 |
|
Financial investments | 10.2 |
| 798,786 |
| - |
| Loans and borrowings | 15.b |
| 164,403 |
|
| 75,377 |
|
Trade receivables | 11 |
| 340,519 |
| 196,256 |
| Lease liabilities | 17 |
| 21,214 |
|
| 14,569 |
|
Contract assets | 23 |
| 134,388 |
| 50,625 |
| Salaries and welfare charges | 18 |
| 234,173 |
|
| 141,794 |
|
Recoverable taxes |
|
| 7,785 |
| 1,016 |
| Accounts payable for business combination | 28.1 |
| 48,923 |
|
| - |
|
Tax assets |
|
| 2,810 |
| 2,117 |
| Derivatives |
|
| 535 |
|
| 5,392 |
|
Derivatives | 28.1 |
| 896 |
| 8,837 |
| Tax liabilities |
|
| 13,345 |
|
| 6,078 |
|
Other assets | 12 |
| 29,994 |
| 12,874 |
| Other taxes payable |
|
| 5,423 |
|
| 3,279 |
|
Total current assets |
|
| 1,450,905 |
| 434,552 |
| Dividends and interest on equity payable | 22 |
| - |
|
| 30,677 |
|
|
|
|
|
|
|
| Contract liability |
|
| 13,722 |
|
| 9,987 |
|
|
|
|
|
|
|
| Indemnity | 21.c |
| - |
|
| 628 |
|
|
|
|
|
|
|
| Other liabilities |
|
| 13,669 |
|
| 7,899 |
|
Recoverable taxes |
|
| 3,046 |
| 3,099 |
|
|
|
| |
|
|
|
|
Deferred tax | 26 |
| 31,989 |
| 15,152 |
| Total current liabilities |
|
| 548,973
|
|
| 310,992 |
|
Judicial deposits | 19 |
| 3,079 |
| 3,083 |
|
|
|
|
|
|
|
|
|
Other assets | 12 |
| 2,974 |
| 2,494 |
|
|
|
|
|
|
|
|
|
Property, plant and equipment | 13 |
| 57,721 |
| 38,771 |
| Loans and borrowings | 16 |
| 624,306 |
|
| 13,853 |
|
Intangible assets | 14 |
| 738,803 |
| 18,166 |
| Lease liabilities | 15.b |
| 60,674 |
|
| 60,659 |
|
Right-of-use assets | 15.a |
| 73,827 |
| 69,765 |
| Provisions | 19 |
| 633 |
|
| 161 |
|
Total non-current assets |
|
| 911,439 |
| 150,530 |
| Accounts payable for business combination | 18 |
| 36,803 |
|
| - |
|
|
|
|
|
|
|
| Other liabilities |
|
| 1,660 |
|
| 957 |
|
|
|
|
|
|
|
| Total non-current liabilities |
|
| 724,076 |
|
| 75,630 |
|
|
|
|
|
|
|
|
|
|
|
|
|
|
|
|
|
|
|
|
|
|
| Equity | 22 |
|
|
|
|
|
|
|
|
|
|
|
|
| Share capital |
|
| 36 |
|
| 68,968 |
|
|
|
|
|
|
|
| Share premium |
|
| 915,947 |
|
| - |
|
|
|
|
|
|
|
| Capital reserves |
|
| 10,105 |
|
| 6,764 |
|
|
|
|
|
|
|
| Profit reserves |
|
| 125,957 |
|
| 109,308 |
|
|
|
|
|
|
|
| Other comprehensive income |
|
| 37,250 |
|
| 13,420 |
|
|
|
|
|
|
|
| Total equity |
|
| 1,089,295 |
|
| 198,460 |
|
|
|
|
|
|
|
|
|
|
|
|
|
|
|
|
Total assets |
|
| 2,362,344 |
| 585,082 |
| Total equity and liabilities |
|
| 2,362,344 |
|
| 585,082 |
|
The accompanying notes are an integral part of these consolidated financial statements
CI&T Inc.
For the years ended on December 31, 2021, 2020 and 2019
(In thousands of Brazilian Reais – R$)
| Note |
| December 31, 2021 |
| | December 31, 2020 |
|
| December 31, 2019 |
|
|
Net revenue | 23 |
| 1,444,380 |
| | 956,519 |
|
| 677,133 |
|
|
Costs of services provided | 24 |
| (935,732 | ) | | (600,866 | ) |
| (448,979 | ) |
|
Gross profit |
|
| 508,648 |
| | 355,653 |
|
| 228,154 |
|
|
Selling expenses | 24 |
| (89,654 | ) | | (65,093 | ) |
| (44,802 | ) |
|
General and administrative expenses | 24 |
| (151,681 | ) | | (81,161 | ) |
| (81,197 | ) |
|
Research and technological innovation expenses | 24 |
| (4 | ) | | (3,462 | ) |
| (12,093 | ) |
|
Impairment loss on trade receivables and contract assets | 24 |
| (497 | ) | | (196 | ) |
| (1,091 | ) |
|
Other income (expenses) net | 24 |
| (22,206 | ) | | 2,503 |
|
| 2,728 |
|
|
Operating expenses net |
|
| (264,042 | ) | | (147,409 | ) |
| (136,455 | ) |
|
Operating profit before financial income and tax |
|
| 244,606 |
| | 208,244 |
|
| 91,699 |
|
|
Finance income | 25 |
| 69,816 |
| | 47,808 |
|
| 23,944 |
|
|
Finance cost | 25 |
| (104,048 | ) | | (63,261 | ) |
| (29,855 | ) |
|
Net finance costs |
|
| (34,232 | ) | | (15,453 | ) |
| (5,911 | ) |
|
Profit before income tax |
|
| 210,374 |
| | 192,791 |
|
| 85,788 |
|
|
Income tax expense |
|
| |
| | |
|
|
|
|
|
Current | 26 |
| (95,375 | ) | | (66,912 | ) |
| (39,457 | ) |
|
Deferred | 26 |
| 10,958 |
| | 1,775 |
|
| 10,238 |
|
|
Net profit for the year |
|
| 125,957 |
| | 127,654 |
|
| 56,569 |
|
|
Income attributable to: |
|
| |
| | |
|
|
|
|
|
Controlling shareholders |
|
| 125,957 |
| | 127,654 |
|
| 56,534 |
|
|
| Non-controlling interest |
|
| - |
|
| - |
|
| 35 |
|
|
Net profit for the year |
|
| 125,957 |
| | 127,654 |
|
| 56,569 |
|
|
Earnings per share |
|
| |
| | |
|
|
|
|
|
Earnings per share – basic (in R$) | 27 |
| 1.03 |
| | 1.06 |
|
| 0.46 |
|
|
Earnings per share – diluted (in R$) | 27 |
| 1.01 |
| | 1.04 |
|
| 0.46 |
|
|
The accompanying notes are an integral part of these consolidated financial statements.
CI&T Inc.
For the years ended on December 31, 2021, 2020 and 2019
(In thousands of Brazilian Reais – R$)
| Note |
| December 31, 2021 |
| | December 31, 2020 |
|
| December 31, 2019 |
|
|
Net profit for the year | |
| 125,957 |
| | 127,654 |
|
| 56,569 |
|
|
Other comprehensive income (OCI): | |
| |
| | |
|
|
|
|
|
Items that are or may be reclassified subsequently to profit or loss | |
| |
| | |
|
|
|
|
|
Exchange variation in foreign investments | 22.d |
| 23,830 |
| | 9,620 |
|
| 1,185 |
|
|
Total comprehensive income for the year | |
| 149,787 |
| | 137,274 |
|
| 57,754 |
|
|
Total comprehensive income attributed to | |
| |
| | |
|
|
|
|
|
Owners of the Company | |
| 149,787 |
| | 137,274 |
|
| 57,719 |
|
|
| Non-controlling interest |
|
| - |
|
| - |
|
| 35 |
|
|
Total comprehensive income for the year | |
| 149,787 |
| | 137,274 |
|
| 57,754 |
|
|
The accompanying notes are an integral part of these consolidated financial statements.
CI&T Inc.
For the years ended on December 31, 2021, 2020 and 2019
(In thousands of Brazilian Reais – R$)
| |
| |
|
|
|
|
| |
| Profit reserves |
| |
|
| |
| | |
|
|
|
|
|
|
|
| Notes |
| Share capital |
|
| Share premium |
|
| Capital reserve |
|
| Legal reserve |
|
| Retained earnings reserve |
|
| Stock redemption reserve |
|
| Retained earnings |
|
| Other comprehensive income |
| | Total equity |
|
| Non-controlling interests |
|
| Total equity |
|
| Balance as of January 1, 2019 |
|
| 30,098 |
|
| - |
|
| 3,931 |
|
| 6,020 |
|
| 26,859 |
|
| 48,520 |
|
| - |
|
| 2,615 |
|
| 118,043 |
|
| 2,527 |
|
| 120,570 |
|
| Capital increase – Stock redemption reserve | 22.a |
| 43,500 |
|
| - |
|
| - |
|
| - |
|
| - |
|
| (43,500 | ) |
| - |
|
| - |
|
| - |
|
| - |
|
| - |
|
| Net profit for the year |
|
| - |
|
| - |
|
| - |
|
| - |
|
| - |
|
| - |
|
| 56,534 |
|
| - |
|
| 56,534 |
|
| 35 |
|
| 56,569 |
|
| Spin-off of the Sensedia S.A. investment | 22.a |
| (4,630 | ) |
| - |
|
| 213 |
|
| - |
|
| (567 | ) |
| - |
|
| - |
|
| 5 |
|
| (4,979 | ) |
| (2,562 | ) |
| (7,541 | ) |
| Additional dividends | 22.e |
| - |
|
| - |
|
| - |
|
| - |
|
| (26,567 | ) |
| - |
|
| - |
|
| - |
|
| (26,567 | ) |
| - |
|
| (26,567 | ) |
| Other comprehensive income for the year | 22.d |
| - |
|
| - |
|
| - |
|
| - |
|
| - |
|
| - |
|
| - |
|
| 1,180 |
|
| 1,180 |
|
| - |
|
| 1,180 |
|
| Share-based payment | 21.e
|
| - |
|
| - |
|
| 3,170 |
|
| - |
|
| - |
|
| - |
|
| - |
|
| - |
|
| 3,170 |
|
| - |
|
| 3,170 |
|
| Share-based plan cancellation | 21.e |
| - |
|
| - |
|
| (3,202 | ) |
| - |
|
| (26,004 | ) |
| - |
|
| - |
|
| - |
|
| (29,206 | ) |
| - |
|
| (29,206 | ) |
| Tax effect on the cancellation of the share-based plan | 21.e |
| - |
|
| - |
|
| - |
|
| - |
|
| 6,244 |
|
| - |
|
| - |
|
| - |
|
| 6,244 |
|
| - |
|
| 6,244 |
|
| Transfer of stock redemption reserve | 22.g |
| - |
|
| - |
|
| - |
|
| - |
|
| 5,020 |
|
| (5,020 | ) |
| - |
|
| - |
|
| - |
|
| - |
|
| - |
|
| Legal reserve |
|
| - |
|
| - |
|
| - |
|
| 2,826 |
|
| - |
|
| - |
|
| (2,826 | ) |
| - |
|
| - |
|
| - |
|
| - |
|
| Dividends |
|
| - |
|
| - |
|
| - |
|
| - |
|
| - |
|
| - |
|
| (14,714 | ) |
| - |
|
| (14,714 | ) |
| - |
|
| (14,714 | ) |
| Constitution of retained earnings reserve |
|
| - |
|
| - |
|
| - |
|
| - |
|
| 38,994 |
|
| - |
|
| (38,994 | ) |
| - |
|
| - |
|
| - |
|
| - |
|
Balance as of January 1, 2020 | |
| 68,968 |
|
| - |
|
| 4,112 |
|
| 8,846 |
|
| 23,979 |
|
| - |
|
| - |
|
| 3,800 |
| | 109,705 |
|
| - |
|
| 109,705 |
|
Net profit for the year | |
| - |
|
| - |
|
| - |
|
| - |
|
| - |
|
| - |
|
| 127,654 |
|
| - |
| | 127,654 |
|
| - |
|
| 127,654 |
|
Additional dividends related to 2019 approved at Extraordinary general meeting (EGM) held as of July 30, 2020 | 22.e |
| - |
|
| - |
|
| - |
|
| - |
|
| (16,263 | ) |
| - |
|
| - |
|
| - |
| | (16,263 | ) |
| - |
|
| (16,263 | ) |
Other comprehensive income for the year | 22.d |
| - |
|
| - |
|
| - |
|
| - |
|
| - |
|
| - |
|
| - |
|
| 9,620 |
| | 9,620 |
|
| - |
|
| 9,620 |
|
Share-based compensation | 21.e |
| - |
|
| - |
|
| 2,652 |
|
| - |
|
| - |
|
|
|
|
| - |
|
| - |
| | 2,652 |
|
| - |
|
| 2,652 |
|
Tax effect on the compensation of the share-based plan | 26 |
| - |
|
| - |
|
| - |
|
| - |
|
| 45 |
|
|
|
|
| - |
|
| - |
| | 45 |
|
| - |
|
| 45 |
|
Interest on shareholders´ equity | 22.e |
| - |
|
| - |
|
| - |
|
| - |
|
| - |
|
|
|
|
| (4,276 | ) |
| - |
| | (4,276 | ) |
| - |
|
| (4,276 | ) |
| Legal reserve |
|
| - |
|
| - |
|
| - |
|
| 4,947 |
|
| - |
|
|
|
|
| (4,947 | ) |
| - |
|
| - |
|
| - |
|
| - |
|
Minimum mandatory dividends | |
| - |
|
| - |
|
| - |
|
| - |
|
| - |
|
|
|
|
| (30,677 | ) |
| - |
| | (30,677 | ) |
| - |
|
| (30,677 | ) |
| Constitution of retained earnings reserve |
|
| - |
|
| - |
|
| - |
|
| - |
|
| 87,754 |
|
|
|
|
| (87,754 | ) |
| - |
|
| - |
|
| - |
|
| - |
|
Balances as of December 31, 2020 | |
| 68,968 |
|
| - |
|
| 6,764 |
|
| 13,793 |
|
| 95,515 |
|
| - |
|
| - |
|
| 13,420 |
| | 198,460 |
|
| - |
|
| 198,460 |
|
Net profit for the year |
|
| - |
|
| - |
|
| - |
|
| - |
|
| - |
|
| - |
|
| 125,957 |
|
| - |
| | 125,957 |
|
| - |
|
| 125,957 |
|
| Spin-off of the CI&T IOT | 1.a/22.a. |
| (9,426 | ) |
| - |
|
| 597 |
|
| - |
|
| - |
|
| - |
|
| - |
|
| - |
|
| (8,829 | ) |
| - |
|
| (8,829 | ) |
| Merger of Hoshin investment | 1.a |
| - |
|
| - |
|
| 108 |
|
| - |
|
| - |
|
| - |
|
| - |
|
| - |
|
| 108 |
|
| - |
|
| 108 |
|
| Additional dividends of 2020 | 22.e |
| - |
|
| - |
|
| - |
|
| - |
|
| (95,368 | ) |
| - |
|
| - |
|
| - |
|
| (95,368 | ) |
| - |
|
| (95,368 | ) |
| Shares exercised of executive officers | 21.d |
| 28,697 |
|
| - |
|
| (28,697 | ) |
| - |
|
| - |
|
| - |
|
| - |
|
| - |
|
| - |
|
| - |
|
| - |
|
Share-based compensation | 22.e |
| - |
|
| - |
|
| 2,498 |
|
| - |
|
| - |
|
| - |
|
| - |
|
| - |
| | 2,498 |
|
| - |
|
| 2,498 |
|
| Tax effect on the compensation of the share-based plan | 26 |
| - |
|
| - |
|
| - |
|
| - |
|
| (147 | ) |
| - |
|
| - |
|
| - |
|
| (147 | ) |
| - |
|
| (147 | ) |
| Interest on shareholders’ equity | 22.e |
| - |
|
| - |
|
| - |
|
| - |
|
| (6,288 | ) |
| - |
|
| - |
|
| - |
|
| (6,288 | ) |
| - |
|
| (6,288 | ) |
Other comprehensive income for the year | 22.d |
| - |
|
| - |
|
| - |
|
| - |
|
| - |
|
| - |
|
| - |
|
| 23,830 |
| | 23,830 |
|
| - |
|
| 23,830 |
|
| Corporate restructuring |
|
| (88,206 | ) |
| - |
|
| 95,711 |
|
| (13,793 | ) |
| 6,288 |
|
|
|
|
| - |
|
| - |
|
| - |
|
| - |
|
| - |
|
Shareholders' contribution and distributions to shareholders | |
| |
|
|
|
|
| |
|
| |
|
|
|
|
|
|
|
| |
|
| |
| | |
|
|
|
|
|
|
|
Capital contribution | 22.a |
| 3 |
|
| - |
|
| - |
|
| - |
|
| - |
|
| - |
|
| - |
|
| - |
| | 3 |
|
| - |
|
| 3 |
|
Initial public offering proceeds, gross | 22.b |
| - |
|
| 915,947 |
|
| - |
|
| - |
|
| - |
|
| - |
|
| - |
|
| - |
| | 915,947 |
|
| - |
|
| 915,947 |
|
Initial public offering cost, net of taxes | 22.c |
| - |
|
| - |
|
| (66,876 | ) |
| - |
|
| - |
|
| - |
|
| - |
|
| - |
| | (66,876 | ) |
| - |
|
| (66,876 | ) |
| Constitution of retained earnings reserve |
|
| - |
|
| - |
|
| - |
|
| - |
|
| 125,957 |
|
| - |
|
| (125957 | ) |
| - |
|
| - |
|
| - |
|
| - |
|
Balances as of December 31, 2021 | |
| 36 |
|
| 915,947 |
|
| 10,105 |
|
| - |
|
| 125,957 |
|
| - |
|
| - |
|
| 37,250 |
| | 1,089,295 |
|
| - |
|
| 1,089,295 |
|
The accompanying notes are an integral part of these consolidated financial statements.
CI&T Inc.
For the years ended on December 31, 2021, 2020 and 2019
(In thousands of Brazilian Reais – R$)
| Note |
| December 31, 2021 |
| | December 31, 2020 |
|
| December 31, 2019 |
|
Cash flow from operating activities | |
| |
| | |
|
|
|
|
Net profit for the year | |
| 125,957 |
| | 127,654 |
|
| 56,569 |
|
Adjustments for: | |
| |
| | |
|
|
|
|
Depreciation and amortization | 13, 14 |
| 48,354 |
| | 29,882 |
|
| 25,577 |
|
Loss on the sale of property, plant and equipment and intangible assets | 13, 14 |
| 1,237 |
| | 689 |
|
| 567 |
|
Interest, monetary variation and exchange rate changes | 16 |
| 45,627 |
| | 7,789 |
|
| 2,971 |
|
| Interest on accounts payable for business combinations |
|
| 3,091 |
|
| - |
|
| - |
|
Interest on lease | 16 |
| 6,369 |
| | 5,023 |
|
| 6,135 |
|
Unrealized loss (gain) on financial instruments | |
| 3,084 |
| | (2,512 | ) |
| (919 | ) |
Income tax expenses | 26 |
| 84,417 |
| | 65,137 |
|
| 29,219 |
|
Impairment losses on trade receivables | 11 |
| 280 |
| | 414 |
|
| 52 |
|
Provision for (reversal of) impairment losses on contract assets | 23 |
| 217 |
| | (218 | ) |
| 1,039 |
|
Write-off of intangible assets | 14 |
| 21,894 |
| | - |
|
| - |
|
Provision for labor risks | |
| 472 |
| | (12 | ) |
| 23 |
|
Provision for indemnity | |
| - |
| | (18 | ) |
| 14,891 |
|
Share-based plan | 21 |
| 2,531 |
| | 942 |
|
| 3,170 |
|
Exchange rate changes on indemnity | |
| - |
| | (4,324 | ) |
| - |
|
Others | |
| 98 |
| | 469 |
|
| 205 |
|
Variation in operating assets and liabilities | |
| |
| | |
|
|
|
|
Trade receivables | 11 |
| (102,300 | ) | | (47,848 | ) |
| (32,673 | ) |
Contract assets | 23 |
| (52,876 | ) | | (8,339 | ) |
| (4,253 | ) |
Other taxes recoverable | |
| (13,806 | ) | | 461 |
|
| 20 |
|
Tax assets | |
| (91 | ) | | 507 |
|
| 789 |
|
Judicial deposits | 19 |
| 4 |
| | - |
|
| (105 | ) |
Suppliers | |
| 12,215 |
| | 6,746 |
|
| 1,697 |
|
Salaries and welfare charges | 17 |
| 63,083 |
| | 49,086 |
|
| 16,825 |
|
Tax liabilities | |
| (17,364 | ) | | (12,275 | ) |
| (11,398 | ) |
Other taxes payable | |
| 1,698 |
| | (407 | ) |
| (346 | ) |
Contract liabilities | |
| 1,922 |
| | (7,138 | ) |
| 8,595 |
|
Payment of share-based indemnity | 21 |
| (628 | ) | | (43,354 | ) |
| - |
|
Other receivables and payables, net | |
| (21,054 | ) | | (11,435 | ) |
| 5,833 |
|
Cash generated from operating activities | |
| 214,431 |
| | 156,919 |
|
| 124,483 |
|
Income tax paid | 26 |
| (64,150 | ) | | (47,044 | ) |
| (25,085 | ) |
Interest paid on loans and borrowings | 16 |
| (12,149 | ) | | (3,880 | ) |
| (1,912 | ) |
Interest paid on lease | 16 |
| (5,753 | ) | | (5,023 | ) |
| (6,129 | ) |
Net cash from operating activities | |
| 132,379 |
| | 100,972 |
|
| 91,357 |
|
CI&T Inc.
Consolidated statement of cash flows
For the years ended on December 31, 2021 and 2020
(In thousands of Brazilian Reais – R$)
Cash flows from investment activities | |
| |
| | |
|
|
|
|
Acquisition of property, plant and equipment and intangible assets | 13, 14 |
| (29,907 | ) | | (21,391 | ) |
| (19,893 | ) |
| Escrow payment |
|
| - |
|
| - |
|
| (1,496 | ) |
| Redemption of financial investments |
|
| - |
|
| - |
|
| 4,838 |
|
| Financial investments |
|
| (784,915 | ) |
| - |
|
| - |
|
Acquisition of subsidiary net of cash acquired | 9, 9.c |
| (692,722 | ) | | - |
|
| - |
|
Net cash used in investment activities | |
| (1,507,544 | ) | | (21,391 | ) |
| (16,551 | ) |
Cash flow from financing activities | |
| |
| | |
|
|
|
|
Share-based plan contributions | 21 |
| 1,282 |
| | - |
|
| - |
|
| Issuance of common shares at initial public offering | 1 |
| 915,947 |
|
| - |
|
| - |
|
| Transaction cost of offering | 1 |
| (55,874 | ) |
| - |
|
| - |
|
Dividends paid | 22.e |
| (126,045 | ) | | (30,977 | ) |
| (40,059 | ) |
Interest on equity, paid | 22.e |
| (6,288 | ) | | (4,276 | ) |
| (2,676 | ) |
Payment of lease liabilities | 15.b |
| (17,656 | )
| | (15,500 | ) |
| (10,949 | ) |
Proceeds from loans and borrowings | 16 |
| 740,596 |
| | 144,269 |
|
| 8,179 |
|
Payment of loans and borrowings | 16 |
| (75,196 | )
| | (88,107 | ) |
| (24,161 | ) |
Net cash from financing activities | |
| 1,376,766 |
| | 5,409 |
|
| (69,666 | ) |
Net increase in cash and cash equivalents | |
| 1,601 |
| | 84,990 |
|
| 5,140 |
|
Cash and cash equivalents as of January 1st | |
| 162,827 |
| | 79,500 |
|
| 77,079 |
|
Exchange variation effect on cash and cash equivalents | |
| (20,949 | ) | | (1,663 | ) |
| (1,464 | ) |
Cash reduction due to spin-off effect | 1 |
| (7,752 | ) | | - |
|
| (1,255 | ) |
Cash and cash equivalents as of December 31 | |
| 135,727 |
| | 162,827 |
|
| 79,500 |
|
The accompanying notes are an integral part of these consolidated financial statements.
CI&T Inc.
Consolidated financial statements
December 31, 2021
(Amounts in thousands of Brazilian Reais – R$, unless otherwise stated)
1 Operational context
CI&T Inc (“CI&T” or “Company”), previously named CI&T Cayman, is a publicly held company incorporated in the Cayman Islands on June 2021, headquartered at Rua Dr. Ricardo Benetton Martins, 1000, Pólis de Tecnologia, in the City of Campinas, State of São Paulo, Brazil. As a holding company, it is mainly engaged in the investment, as a partner or shareholder, in other companies, consortia or joint ventures in Brazil and other countries where most of the Company’s operations are located. The Company’s subsidiaries are mainly engaged in the development of customizable software through implementation of software solutions, including Machine Learning, Artificial Intelligence (AI), Analytics, Cloud and Mobility technologies.
These consolidated financial statements comprise the Company and its subsidiaries (collectively referred to as the “Group”).
Unless otherwise indicated or if the context otherwise requires, all references in these consolidated financial statements to “CI&T Brazil” refer to CI&T Software S.A., one of the Company’s subsidiaries.
On November 10, 2021 the Company completed its initial public offering (“IPO”) and CI&T Inc offered 15,000,000 Class A common shares, of which 11,111,111 were offered by CI&T Inc and 3,888,889 were offered by certain selling shareholders. The IPO price per Class A common share was US$15.00. On November 15, 2021, the IPO was concluded with the total offering of US$225,000, of which the Group received net proceeds of R$ 860,993 (US$156,667), after deducting the underwriting discounts and commissions. The Company incurred incremental costs directly attributable to the public offering in the amount of R$ 66,876, net of taxes. The Group Class A common shares are traded on the New York Stock Exchange, or NYSE, under the symbol “CINT”.
- Corporate restructuring
i. Mergers in 2021 - in connection with CI&T Brazil
On April 30, 2021, the Extraordinary Shareholders’ Meeting of CI&T Brazil approved the reverse merger of Hoshin Empreendimentos S.A. (“Hoshin”) into CI&T Brazil. The purpose of this merger is to simplify the corporate structure of Hoshin and CI&T Brazil, and to reduce the operational, administrative, and financial expenses of both. The transaction was recorded at book value in the amount of R$108.
ii. Spin-off in 2021 - in connection with CI&T Brazil
The Extraordinary Shareholders’ Meeting of CI&T Brazil, held on April 30, 2021 approved the partial spin-off of the interest in subsidiary CI&T IOT Comércio de Hardware e Software Ltda. (“CI&T IOT”). The valuation of the spin-off portion was carried out at book value based on the statement of financial position of CI&T IOT as of March 31, 2021.
CI&T Inc.
Consolidated financial statements
December 31, 2021
iii. Reorganization transactions in 2021 – in connection with CI&T Inc
CI&T Inc. was incorporated as an exempted, limited liability company in Cayman Islands to become the holding entity of CI&T Software S.A. (CI&T Brazil) in connection with the initial public offering. Prior to the IPO, CI&T Inc had not begun operations, had nominal assets and liabilities, and no material contingent liabilities or commitments. As a holding company, it is mainly engaged in the investment in other companies, consortia or joint ventures, as a partner or shareholder, in Brazil and other countries where most of the Company's operations are located.
On October 04, 2021, CI&T established, as a sole member, the subsidiary CI&T Delaware LLC (“CI&T Delaware”). The main office is located at 251 Little Falls Drive, Wilmington, Delaware, 19808.
On November 8, 2021, all CI&T Brazil’s shares were contributed to CI&T Delaware and, subsequently the CI&T Delaware’s shares were transferred to CI&T Inc.
Until this corporate reorganization, CI&T Brazil, an operating company, was the ultimate holding of the Group, and it consolidated the results of all companies until that date.
The Group accounted for the restructuring as a business combination of entities under common control, and the pre-combination carrying amounts of CI&T Brazil are included in the CI&T’s consolidated financial statements with no fair value uplift. Thus, these consolidated financial statements reflect:
| (i) | The historical operating results and financial position of CI&T Brazil prior the restructuring; |
| (ii) | The consolidated results of the Group following the restructuring; |
| (iii) | The assets and liabilities of CI&T Brazil and its then subsidiaries at their historical cost; |
(iv)
| The number of ordinary shares issued by CI&T, as a result of the restructuring is reflected retroactively to January 1, 2020, for purposes of calculating earnings per share; |
| (v) | CI&T Brazil shares were contributed in CI&T Delaware at its book value as at November 8, 2021; |
| (vi) | As the remaining equity reserves of CI&T Brazil are no longer applicable to CI&T, they were added to the initial capital reserve balance (see note 22.c). |
iv. Spin-off in 2019
The Extraordinary General Meeting, held on July 31, 2019, approved the partial spin-off of the investment in the subsidiary Sensedia S.A. (related to 64.38% of the total subsidiary’s share capital) with transfer of its net equity to the Company’s shareholders. The valuation of the spin-off portion was carried out at book value based on the statement of financial position of Sensedia S.A. The value of the spin-off portion was R$ 4,630.
CI&T Inc.
Consolidated financial statements
December 31, 2021
2 List of direct and indirect subsidiaries
Information on the Company's direct and indirect subsidiaries is presented below:
|
| | | December 31, 2021 | | December 31, 2020 |
| December 31, 2019
|
|
Subsidiaries |
| Country of Origin | | Direct |
| Indirect | | Direct |
| Indirect |
| Direct |
| Indirect |
|
CI&T Delaware LLC (a) |
| United States | | 100% |
| - | | - |
| - |
| - |
| - |
|
CI&T Software S.A. |
| Brazil | | - |
| 100% | | - |
| - |
| - |
| - |
|
CI&T, Inc. ("CI&T US") |
| United States | | - |
| 100% | | 100% |
| - |
| 100% |
| - |
|
CI&T Software Inc. ("CI&T Canada") |
| Canada | | - |
| 100% | | - |
| 100% |
| - |
| 100% |
|
CI&T UK Limited. ("CI&T UK") |
| United Kingdom | | - |
| 100% | | - |
| 100% |
| - |
| 100% |
|
CI&T Argentina. S/A |
| Argentina | | - |
| 100% | | - |
| 100% |
| - |
| 100% |
|
|
|
|
|
|
|
|
|
|
|
|
|
|
|
|
|
CI&T Japan, Inc. |
| Japan | | - |
| 100% | | 100% |
| - |
| 100% |
| - |
|
CI&T China Inc. |
| China | | - |
| 100% | | - |
| 100% |
| - |
| 100%
|
|
|
|
|
|
|
|
|
|
|
|
|
|
|
|
|
|
CI&T IOT (b) |
| Brazil | | - |
| - | | 100% |
| - |
| 100%
|
| - |
|
CI&T Portugal Unipessoal Lda. (c) |
| Portugal | | - |
| 100% | | 100% |
| - |
| - |
| - |
|
CI&T Australia PTY Ltd. (d) |
| Australia | | - |
| 100% | | 100% |
| - |
| - |
| - |
|
Dextra Inc.(e) |
| United States | | - |
| 100% | | - |
| - |
| - |
| - |
|
CINQ Inc.(e) |
| United States | | - |
| 100% | | - |
| - |
| - |
| - |
|
| (a) | Refers to note 1.a.iii. |
| (b) | In July 2019, the subsidiary CI&T IOT Comércio de Hardware e Software Ltda. started its operations. The subsidiary’s main activity is the sale of technology devices and software on environment management platforms for efficient use of spaces. In April 2021, the partial spin-off on the CI&T IOT investment was approved with transfer of its net equity to the CI&T Brazil’s shareholders. |
| (c) | In June 2020, the subsidiary CI&T Portugal Unipessoal LDA ("CI&T Portugal") started operations in the city of Lisbon to meet the strategy of global expansion and strengthen the presence in the European market, acting with the same corporate purpose as the Group. |
| (d) | In October 2020, the subsidiary CI&T Australia PTY LTD was incorporated in the city of Brisbane, acting with the same corporate purpose as the Group. |
| (e) | In August 2021, the CI&T Brazil completed the acquisition of 100% of the shareholding control of Dextra Investimentos S.A. and its subsidiaries (see note 9). |
3 Basis of accounting
These consolidated financial statements were prepared in accordance with the International Financial Reporting Standards (IFRS) as issued by the International Accounting Standards Board (IASB).
The issuance of these consolidated financial statements was authorized by the Company’s Management and Audit Committee on April 22, 2022.
CI&T Inc.
Consolidated financial statements
December 31, 2021
4 Functional and presentation currency
These consolidated financial statements are presented in Brazilian Reais (“R$”), which is the Company's functional currency. All balances are rounded to the nearest thousands, except when otherwise indicated.
The main exchange rates used in the preparation of the Company's financial statements are Brazilian Reais, US dollar, Yen, Euro and Australian dollar, as the Company’s subsidiaries have the following functional currencies: CI&T Brazil has the local currency, the Brazilian Reais, as its functional currency; CI&T Inc (USA) has the local currency, the US dollar, as its functional currency; CI&T Japan Inc has the local currency, Yen, as its functional currency; CI&T Portugal has the local currency, Euro, as its functional currency; and CI&T Australia has the local currency, Australian dollar, as its functional currency.
5 Use of judgments and estimates
In preparing these consolidated financial statements, Management has made judgments and estimates that affect the application of the Company's accounting policies and the reported amounts of assets, liabilities, income and expenses. Actual results may differ from these estimates.
Estimates and underlying assumptions are reviewed on an ongoing basis. The revisions to estimates are recognized prospectively.
a. Judgments
Information about judgments made in the application of accounting policies that have significant effects on the amounts recognized in the financial statements are included in the following notes:
| • | Note 7 - lease term: whether the Group is reasonably certain to exercise extension options; |
| •
| Note 23 - revenue recognition: whether service revenue is recognized over time or at point in time. |
b. Assumptions and estimation uncertainties
Information about assumptions and estimation uncertainties that have a significant risk of resulting in a material adjustment to the carrying amounts of assets and liabilities in the next fiscal year is included in the following note:
| • | Note 9 – acquisition of subsidiary: fair value of the consideration transferred, fair value of the assets acquired, and liabilities assumed. |
Measurement of fair values
Several of the Company's accounting policies and disclosures require the measurement of fair values for both financial and non-financial assets and liabilities.
The Group has established a control framework with respect to the measurement of fair value that includes the review of significant fair value measurements, significant unobservable data and valuation adjustments. If third-party information, such as broker quotes or pricing services, is used to measure fair values, the valuation team assesses the evidence obtained from third parties to support the conclusion that such valuations meet the requirements of the accounting standards, including the level in the fair value hierarchy in which the valuations should be classified.
When measuring the fair value of an asset or a liability, the Group uses observable market data as much as possible. Fair values are classified at different levels in a hierarchy based on the information (inputs) used in the valuation techniques as follows:
| • | Level 1: Quoted prices (not adjusted) in active markets for identical assets or liabilities. |
| •
| Level 2: Inputs, except for quoted prices, included in Level 1, which are observable for the asset or liability, either directly (prices) or indirectly (derived from prices). |
| • | Level 3: Inputs for the asset or liability, which are not based on observable market data (unobservable inputs). |
CI&T Inc.
Consolidated financial statements
December 31, 2021
Additional information on the assumptions used to measure fair values is included in the following notes:
| • | Note 9 – business combination - acquisition of subsidiary; |
| • | Note 21 – share-based payment transactions and the compensation for the cancellation of the share based plan; and |
| • | Note 28 – financial instruments. |
6 Basis of measurement
The consolidated financial statements were prepared based on historical cost, except for derivative financial instruments, and liabilities for the cancellation of the share-based plan, which are measured at fair value at each reporting date.
7 Significant accounting policies
The Company applied the accounting policies described below in a consistent manner to all the years presented in the consolidated financial statements.
a. Basis of consolidation
i. Business combination
The Group accounts for business combinations using the acquisition method when the acquired set of activities and assets meets the definition of a business and control is transferred to the Group. In determining whether a particular set of activities and assets is a business, the Group assesses whether the set of assets and activities acquired includes, at a minimum, an input and substantive process and whether the acquired set has the ability to produce outputs.
The consideration transferred in the acquisition is measured at fair value, as are the identifiable net assets acquired. Any goodwill that may arise is tested annually for impairment. Any gains on a bargain purchase are recognized in profit or loss immediately. Transaction costs are expensed as incurred, except if related to the issue of debt or equity securities.
The consideration transferred does not include amounts related to the settlement of pre-existing relationships. Such amounts are generally recognized in profit or loss.
Any contingent consideration is measured at fair value at the date of acquisition. If an obligation to pay contingent consideration that meets the definition of a financial instrument is classified as equity, then it is not remeasured, and settlement is accounted for within equity. Otherwise, other contingent consideration is remeasured at fair value at each reporting date and subsequent changes in the fair value of the contingent consideration are recognized in profit or loss.
ii. Subsidiaries
The Company controls an entity when it is exposed to, or has rights to, variable returns from its involvement with the entity and has the ability to affect those returns through its power to direct the activities of the entity. The financial statements of subsidiaries are included in the consolidated financial statements from the date in which control commences until the date in which control ceases.
iii. Non-controlling interests (“NCI”)
NCI are measured initially at their proportionate share of the acquiree’s identifiable net assets at the date of acquisition. Changes in the Company’s interest in a subsidiary that do not result in loss of control are accounted for as equity transactions.
According to note 1.a. (iv) a with the partial spin-off of the subsidiary Sensedia S.A. in 2019, the Company no longer has non-controlling interest.
CI&T Inc.
Consolidated financial statements
December 31, 2021
iv. Transactions eliminated by consolidation
Intra-group balances and transactions, and any unrealized income or expenses (except for foreign currency translation gain or losses) arising from intra-group transactions, are eliminated. Unrealized losses arising are eliminated in the same way as unrealized gain, but only to the extent that there is no evidence of impairment.
b. Foreign currency
i. Transactions in foreign currency
Transactions in foreign currency are translated into the respective functional currencies of the Company and its subsidiaries by the exchange rates at the dates of each such transaction.
Monetary assets and liabilities denominated in foreign currencies on the reporting date are translated to the functional currency at the exchange rate on that date. Non-monetary assets and liabilities that are measured at fair value in foreign currency are retranslated to the functional currency at the exchange rate on the date in which the fair value was determined. Non-monetary items that are measured based on historical cost in foreign currency are translated at the exchange rate on the transaction date. Foreign currency differences are generally recognized in profit or loss and presented within finance costs.
However, foreign currency differences resulting from the translation of investments abroad are recognized in other comprehensive income.
ii. Foreign operations
Assets and liabilities from foreign operations, including goodwill and fair value adjustments resulting from acquisitions, are translated into Reais at the exchange rates prevailing at the reporting date. Income and expenses from operations abroad are translated into Brazilian reais at the exchange rates that represent the average monthly rates for the respective period.
Foreign currency differences are recognized in other comprehensive income.
c. Revenue from contracts with customers
Information on the Group's accounting policies related to contracts with customers is provided in note 23.
d. Employee benefits
i. Short-term employee benefits
Short-term employee benefits are expensed as the related service is provided. These liabilities are recognized at the amount of the expected payment if the Company has a present legal obligation to pay this amount due to service provided by the employee and the obligation can be estimated reliably.
ii. Share-based payment arrangements
The grant-date fair value of equity-settled share-based payment arrangements granted to employees is generally recognized as personnel expense, with a corresponding increase in equity, during the period in which employees unconditionally acquire the right to the awards. Amounts recognized as expenses are adjusted to reflect the number of awards for which there is an expectation that service and performance conditions will be met in such a way that the final amounts recognized as expenses are based on the number of awards that actually meet the service and performance conditions on the vesting date.
The Group recognizes each expense according to the services rendered for each subsidiary where the employee participating in the plan works, with the counterpart at:
(a) increase in equity if the services rendered are received in a transaction with a share-based payment settled in equity instruments;
(b) or, if the services rendered are acquired in a transaction with a share-based payment settled in cash (or other assets), a liability must be recognized
CI&T Inc.
Consolidated financial statements
December 31, 2021
The fair value of the amount payable to employees related to the rights on the valuation of shares, which are settled in cash, is recognized as an expense with a corresponding increase in liabilities during the period in which employees unconditionally acquire their right to payment. The liability is remeasured at each reporting date and on the settlement date, based on the fair value of the rights on the valuation of the shares. Any changes in the fair value of the liability are recognized in the profit or loss.
When the granting of an equity instrument is canceled or settled during the vesting period, the entity must account for the cancellation or settlement as an acceleration of the vesting period and, therefore, must immediately recognize the amount that would be recognized as services received over the remaining vesting period.
In cases where the stock option plan is cancelled, any payments made to employees at the time of the cancellation must be accounted for as a repurchase of an equity instrument, that is, in a reduction account of shareholders' equity, except if the payment exceeds the fair value of the equity instruments granted, measured on the repurchase date. Any surplus must be recognized as an expense for the period. However, if the share-based payment arrangement present liabilities components, the entity must remeasurement the fair value of the corresponding liability on the date of cancellation or settlement. Any payment made to settle these liability components should be accounted for as an extinguishment of the liability.
e. Financial income and financial expenses
The Group's financial income and financial expenses include:
| • | Interest income; |
| • | Interest expense; |
| •
| The net gains or loss on financial assets measured at fair value through profit or loss; |
| •
| The foreign currency gains or losses on financial assets and financial liabilities. |
Interest income or expense is recognized using the effective interest method. The Company classifies dividends and interest on equity paid as cash flows used in financing activities.
The 'effective interest rate' is the rate that exactly discounts estimated future cash payments or receipts though the expected life of the financial instrument to:
| • | the gross carrying amount of the financial asset; or |
| • | at the amortized cost of the financial liability. |
In calculating interest income or expense, the effective interest rate is applied to the gross carrying amount of the asset (when the asset is not impaired) or the amortized cost of the liability. However, for financial assets that have become credit-impaired after the initial recognition, interest income is calculated by applying the effective interest rate to the amortized cost of the financial asset. If the asset is no longer credit-impaired, then the calculation of interest income reverts to the gross basis.
f. Income tax
Income tax expenses comprises current and deferred income and social security contribution taxes. It is recognized in profit or loss except to the extent that it relates to a business combination, or items recognized directly in equity or in other comprehensive income.
The Company has determined that interest and penalties related to income taxes, including uncertain tax treatments, do not meet the definition of income taxes, and therefore accounted for them under IAS 37 Provisions, Contingent Liabilities and Contingent Assets.
CI&T Inc.
Consolidated financial statements
December 31, 2021
i. Current tax
Current tax comprises the expected tax payable or receivable on the taxable profit or loss for the year and any adjustment to taxes payable or receivable in respect of prior years. The amount of current tax payable or receivable is the best estimate of the tax amount expected to be paid or received that reflects uncertainty related to income tax, if any. It is measured using tax rates enacted at the reporting date.
Current tax assets and liabilities are offset only if certain criteria are met.
ii. Deferred taxes
Deferred tax is recognized in respect of temporary differences between the carrying amounts of assets and liabilities for financial reporting purposes and the amounts used for taxation purposes. Deferred tax is not recognized for:
| (i) | Temporary differences on the initial recognition of assets and liabilities in a transaction that is not a business combination and that affects neither accounting nor taxable profit or loss; and |
| (ii) | Temporary differences related to investments in subsidiaries to the extent that the Company can control the timing of the reversal of the temporary difference, and it is probable that the temporary difference will not be reversed in the foreseeable future. |
Deferred tax assets are recognized in respect of tax losses and unused deductible temporary differences to the extent that it is probable that future taxable profits will be available against which they can be used. Future taxable profits are determined based on the reversal of relevant taxable temporary differences. If the amount of taxable temporary differences is insufficient to recognize a deferred tax asset in full, then future taxable profits, adjusted for reversals of existing temporary differences, are considered, based on the business plans for each individual subsidiary.
Deferred tax assets are reviewed at each reporting date and are reduced to the extent that they are no longer probable.
Deferred tax assets and liabilities are measured based on the rates that are expected to be applied to temporary differences when they are reversed, based on the rates that were enacted up to the reporting date.
The measurement of deferred tax reflects the tax consequences that would follow from the way the Company expects, at the reporting date, to recover or settle the carrying amount of its assets and liabilities.
Deferred tax assets and liabilities are offset only if certain criteria are met.
CI&T Inc.
Consolidated financial statements
December 31, 2021
g. Property, plant and equipment
i. Recognition and measurement
Property, plant and equipment items are measured at the historical cost of acquisition or construction, deducted from accumulated depreciation and any impairment losses.
Any gain or loss on the disposal of an item of property, plant and equipment is recognized in profit or loss.
ii. Subsequent expenditure
Subsequent expenditure is capitalized only if it is probable that the future economic benefits associated with the expenditure will flow to the Company.
iii. Depreciation
Depreciation is calculated to write-off the cost of items of property, plant and equipment, less their estimated residual values using the straight-line method based on the estimated useful lives and is recognized in profit and loss. Land is not depreciated.
The estimated useful lives of property, plant and equipment for current and comparative years are as follows:
IT equipment | 2 to 5 years |
Furniture and fixtures | 7-10 years |
Vehicles | 5 years |
Leasehold improvements | 1 to 8 years |
Depreciation methods, useful lives and residual values are reviewed at each reporting date and adjusted if appropriate.
h. Intangible assets and goodwill
i. Recognition and measurement
Goodwill
Goodwill arising from the acquisition of subsidiaries is measured at cost less accumulated impairment losses.
Brands and Customer relationship
Brands and customer relationship acquired through business combinations are recognized at their fair value at the acquisition date and depreciated over their expected benefit period.
Software
Software licenses are capitalized based on the costs incurred to acquire the software and prepare them to be ready for use and depreciated over their expected benefit period.
Costs associated with software maintenance are recognized as expenses as incurred. Development costs directly attributable to the design and testing of identifiable and unique software products, controlled by the Company, are recognized as intangible assets.
Directly attributable costs, which are capitalized as a part of the software product, include the costs of employee allocated to software development and an appropriate portion of the applicable indirect expenses.
Other development costs that do not meet these criteria for capitalization are recognized as expenses as they are incurred. Development costs previously recognized as expenses are not recognized as assets in subsequent periods.
CI&T Inc.
Consolidated financial statements
December 31, 2021
Non-compete agreement
Non-compete agreements acquired through business combinations are recognized at their fair value at the acquisition date and are amortized over the term of the agreements.
Software in progress
Software in progress is capitalized only if the expenditure can be measured reliably, the product or progress is technically and commercial feasible, future economic benefits are probable, and the Company intends to and has sufficient intention and resources to complete development and use or sell the asset. Otherwise, it is recognized in profit and loss as incurred. Subsequent to initial recognition, intangible in progress is measured at cost less any accumulated impairment losses.
ii. Subsequent expenditure
Subsequent expenditure is capitalized only when it increases the future economic benefits embodied in the specific asset to which it relates. All other expenditure, including trademarks and patents, are recognized in profit or loss as incurred.
iii. Amortization
Amortization is calculated using the straight-line method based on the estimated useful lives of the items, net of their estimated residual values. Amortization is generally recognized in profit or loss. Goodwill is not amortized.
The estimated useful lives are as follows:
Network software | 5 years |
Internally developed software | 3 years |
| Customer relationship | 6 - 8 years |
| Non-compete agreement | 5 years |
| Brands | 1 - 2 years |
Amortization methods, useful lives and residual values are reviewed at each reporting date and adjusted, if appropriate.
i) Financial instruments
i. Recognition and initial measurement
Trade receivables are initially recognized on the date they were originated. All other financial assets and liabilities are initially recognized when the Company becomes a party to the contractual provisions of the instrument.
A financial asset (unless it is a trade receivable without a significant financing component) or financial liability is initially measured at fair value plus, for an item not measured at fair value through profit or loss (“FVTPL”), transaction costs that are directly attributable to its acquisition or issue. Trade receivables without a significant financing component are initially measured at the transaction price.
ii. classification and subsequent measurement
Financial assets
Upon initial recognition, a financial asset is classified as measured at: amortized cost; FVOCI — debt investment; FVOCI — equity investment; or FVTPL — fair value through profit or loss.
Financial assets are not reclassified subsequent to their initial recognition unless the Company changes its business model for managing financial assets, in which case all affected financial assets are reclassified on the first day of the presentation period following the change in business model.
CI&T Inc.
Consolidated financial statements
December 31, 2021
A financial asset is measured at amortized cost if it meets both of the following conditions and is not designated as measured at FVTPL:
| i. | It is maintained within a business model aimed at maintaining financial assets to receive contractual cash flows; and |
| ii. | It is contractual terms give rise on specific dates to cash flows that are related to the payment of principal and interest on the outstanding principal value. |
All financial assets not classified as measured at amortized cost, as described above, are classified as at FVTPL. This includes all derivative financial assets. Upon initial recognition, the Group may irrevocably designate a financial asset that otherwise meets the requirements to be measured at amortized cost or fair value through other comprehensive income (“FVOCI”) as at FVTPL if doing so eliminates or significantly reduces an accounting mismatch that would otherwise arise.
Financial asset - Business model assessment
The Company carries out an assessment of the objective of the business model in which a financial asset is held in the portfolio because it better reflects the way the business is managed, and the information is provided to Management. Information considered includes:
| i. | The stated policies and objectives set for the portfolio and the operation of those policies in practice. They include whether the Management strategy focuses on achieving contractual interest income, maintaining a particular interest rate profile, matching the duration of financial assets with the duration of related liabilities or expected cash outflows, or realizing cash flows through the sale of assets; |
| ii. | How the portfolio's performance is assessed and reported to the Group's Management; |
| iii. | The risks that affect the performance of the business model (and the financial assets held according to that business model) and how those risks are managed; |
| iv.
| How the managers of the business are compensated – e.g., whether compensation is based on the fair value of assets managed or on the contractual cash flows earned; and |
| v.
| The frequency, volume and timing of sales of financial assets in prior periods, the reasons for such sales and expectations about future sales. |
Transfers of financial assets to third parties in transactions that do not qualify for derecognition are not considered sales, in a manner consistent with the continuous recognition of the assets of the Company and its subsidiaries.
Financial assets held for trading or managed and whose performance is evaluated on a fair value basis are measured at fair value through profit or loss.
Financial asset – assessment whether contractual cash flows are solely principal and interest payments
For the purposes of this assessment 'principal' is defined as the fair value of the financial asset upon initial recognition. Interest' is defined as consideration for the time value of money and the credit risk associated with the principal amount outstanding over a given period of time and for the other basic lending risks and costs (e.g. liquidity risk and administrative costs), as well as a profit margin.
The Group considers the contractual terms of the instrument to assess whether contractual cash flows are solely payments of principal and interest. This includes assessing whether the financial asset contains a contractual term that could change the timing or value of the contractual cash flows such that it would not meet this condition. In making this assessment, the Group considers:
CI&T Inc.
Consolidated financial statements
December 31, 2021
| • | Contingent events that change the amount or timing of cash flows; |
| • | Terms that can adjust the contractual rate, including variable rates features; |
| •
| Prepayment and extension features; and |
| •
| Terms that limit the Group's access to cash flows from specific assets (e.g., based on the performance of an asset). |
The prepayment feature is consistent with the principal and interest payment criteria if the prepayment amount mostly represents unpaid principal and interest on the outstanding principal amount – which may include reasonable additional compensation for early termination of the contract. In addition, for a financial asset acquired for a value less than or greater than the nominal value of the contract, the permission or requirement for prepayment for an amount that represents the nominal value of the contract plus contractual interest (which also may include reasonable additional compensation for early termination of the contract) accumulated (but not paid) is treated as consistent with this criterion if the fair value of the prepayment is insignificant at initial recognition.
Financial assets - Subsequent measurement and profit and loss
| • | Financial assets at FVTPL |
These assets are subsequently measured at fair value. The net gain, including interest, is recognized in profit or loss.
| • | Financial assets at amortized cost |
These assets are subsequently measured at amortized cost using the effective interest method. The amortized cost is reduced by impairment losses. Interest income, foreign exchange gains and losses and impairment are recognized in profit or loss. Any gains or losses on derecognition are recognized in the profit or loss.
Financial liabilities - classification, subsequent measurement and profit and loss
Financial liabilities were classified as measured at amortized cost or FVTPL. A financial liability is classified as measured at fair value through profit or loss if it is a derivative or is designated as such upon initial recognition. Financial liabilities measured at FVTPL are measured at fair value and net income, including interest, is recognized in profit or loss. Other financial liabilities are subsequently measured at amortized cost using the effective interest method. Interest expense, foreign exchange gains and losses are recognized in profit or loss. Any gains or losses on derecognition are also recognized in profit or loss.
iii. Derecognition
Financial assets
The Group derecognizes a financial asset when the contractual rights to the cash flows of the asset expire, or when the Group transfers the contractual rights to receive the contractual cash flows on a financial asset in a transaction in which substantially all the risks and rewards of ownership of the financial asset are transferred, or in which the Group neither transfers nor substantially maintains all the risks and rewards of ownership of the financial asset nor retains control over the financial asset.
CI&T Inc.
Consolidated financial statements
December 31, 2021
Financial liabilities
The Group derecognizes a financial liabilities when their contractual obligations are discharged, cancelled or expire. The Group also derecognizes a financial liabilities when their terms are modified and the cash flows of the modified liabilities are substantially different, in which case a new financial liability based on the modified terms is recognized at fair value. Upon derecognition of a financial liability, the difference between the carrying amount extinguished and the consideration paid (including any non-cash assets transferred or liabilities assumed) is recognized in profit or loss.
iv. Offsetting
The financial assets or liabilities are compensated, and the net value presented in the statement of financial position when, and only when, the Group currently has a legally enforceable right to offset the amounts and intends to settle them on a net basis or to dispose of the asset and settle the liabilities simultaneously.
v. Derivative financial instruments
The Group holds derivative financial instruments to manage its exposures to the risks of changes in foreign currency and interest rates.
Derivatives are initially measured at fair value. After initial recognition, derivatives are measured at fair value and changes in fair value are recorded in profit or loss.
j. Equity
Share capital
On December 31, 2021, the Company´s share capital is R$ 36, represented by 132,197,896 common shares. Those common shares are represented by 15,000,000 Class A common shares and 117,197,896 Class B common shares (note 22.a). Incremental costs directly attributable to the issue of common shares are recognized as a deduction from equity.
Share premium
The share premium refers to the difference between the subscription price that the shareholders paid for the shares and their nominal value.
Capital reserve
The breakdown of capital reserves is arising from the corporate restructuring occurred in 2021 (note 1.a), share-based compensation (note 21.d) and the share issuance costs (note 21.c).
k. impairment
Non-derivative financial assets
Financial instruments and contract assets
The Group recognizes provisions for expected credit losses on:
| • | Financial assets measured at amortized cost |
| • | Contract assets |
Loss allowances for trade receivables and contract assets are always measured at an amount equal to lifetime expected credit losses.
CI&T Inc.
Consolidated financial statements
December 31, 2021
Management considers a financial asset to be in default when:
| • | It is unlikely that the creditor will fully pay its credit obligations to the Group, without resorting to actions such as the realization of the guarantee (if any); or |
| • | The financial asset is more than 360 days overdue; |
| • | Lifetime credit losses are the expected credit losses that result from all possible default events over the expected life of the financial instrument. |
The maximum period considered in the expected credit loss estimate is the maximum contractual period over which the Group is exposed to credit risk.
Measurement of expected credit losses
The Group considers evidence of impairment of assets measured at amortized cost at the collective level. The assets are assessed collectively for any loss of value that could have occurred but had not yet been identified.
Assets are assessed collectively for impairment based on the grouping of assets with similar risk characteristics.
In assessing the impairment as a whole, the Group uses historical trends in the probability of default, the recovery period and the loss amounts incurred, adjusted to reflect the Management’s judgment on the assumptions if the current economic and credit conditions are such that actual losses are probable to be higher or lower than those suggested by historical trends.
A loss by reduction to the recoverable amount is calculated as the difference between the recorded amount and the present value of estimated future cash flows, discounted by the original effective interest rate of the asset. Losses are recognized in profit or loss and deducted from the gross carrying amount of the assets.
The allowance for loss on financial assets measured at amortized cost is deducted from the gross carrying amount of the assets.
Write-off
The gross carrying amount of a financial asset is written off when the Group has no reasonable expectation of recovering the financial asset in whole or in part. With respect to customers, the Group assesses the time and value of the write-off based on whether there is reasonable expectation of recovery. The Group does not expect any significant recovery of the amount written off. However, written off financial assets may still be subject to credit for the fulfillment of the Group’s procedures for recovering the amounts due.
CI&T Inc.
Consolidated financial statements
December 31, 2021
Non-financial assets
At each reporting date, the Group reviews the carrying amounts of its non-financial assets (other than contract assets and deferred tax assets) to determine whether there is any indication of impairment. If any such indication exists, then the asset’s recoverable amount is estimated. Goodwill is tested annually for impairment.
For impairment testing, assets are grouped together into the smallest group of assets that generates cash inflows from continuing use that are largely independent of the cash inflows of other assets or cash-generating units (CGUs). Goodwill arising from a business combination is allocated to CGUs or groups of CGUs that are expected to benefit from the synergies of the combination.
The recoverable amount of an asset or CGU is the greater of its value in use and its fair value less costs of disposal. Value in use is based on estimated future cash flows, discounted to their present value using a pre-tax discount rate that reflects current market evaluations of the time value of money and the risks specific to the asset or CGU.
An impairment loss is recognized if the carrying amount of the asset or CGU exceeds its recoverable amount.
Impairment losses are recognized in profit or loss. They are allocated first to reduce the carrying amount of any goodwill allocated to the CGU, and then to reduce the carrying amounts of the other assets in the CGU on a pro rata basis.
Impairment losses relating to goodwill are not reversed. For other assets, impairment losses are reversed only to the extent that the asset’s carrying amount does not exceed the carrying amount that would have been determined, net of depreciation or amortization if no impairment losses had been recognized.
l. Provisions
Disputes and litigations
The provision for disputes and litigation is recognized when it is probable that the Group will be required to make future payments as a result of past events. Such payments include, but are not limited to, the various claims, processes and actions initiated by both third parties and the Company, relating to labor disputes, complaints from tax authorities and other judicial matters.
Provision for indemnity of the stock options plan
The provision for the indemnity of the stock options plan was recognized upon the cancellation of all programs and agreements entered into in the Group’s Stock Option Plan. Payments to the beneficiaries of the plan grant to the Company full discharge on any right related to the Plan.
m. Leases
At inception of a contract, the Group assesses whether a contract is, or contains, a lease. A contract is or contains a lease if the contract transfers the right to control the use of an identified asset for a period of time in exchange for consideration.
CI&T Inc.
Consolidated financial statements
December 31, 2021
At the commencement or upon the modification of a contract that contains a lease component, the Group allocates the consideration in the contract to each lease component of the lease based on individual prices. However, for property leases, the Group elected to not separate the non-lease components and account for the lease and non-lease components as a single component.
The Group recognizes a right-of-use asset and a lease liability at lease commencement. The right-to-use asset is initially measured at cost, which comprises the initial measurement amount of the lease liability, adjusted for any lease payments made at or before the commencement date, less any leasing incentives received.
The right-of-use asset is subsequently depreciated using the straight-line method from the commencement date to the end of the lease term unless the lease transfers ownership of the underlying asset to the Group by the end of the lease term or the cost of the right-of-use asset reflects that the Group will exercise a purchase option. In this case, the right of use will be depreciated over the useful life of the underlying asset, which is determined in same basis as that of property, plant and equipment. In addition, the right-of-use asset is periodically reduced by impairment losses, if any, and adjusted for certain remeasurements of lease liabilities.
The lease liability is initially measured at the present value of the lease payments that are not paid at the commencement date, discounted using the interest rate implicit in the lease or, if this rate cannot be readily determined, the Group’s incremental borrowing rate. Generally, the Group uses its incremental borrowing rate as a discount rate.
The Group determines its incremental borrowing rate by obtaining interest rates from various external sources of financing and making some adjustments to reflect the terms of the contract and the type of leased asset.
Lease payments included in the measurement of the lease liability comprise the following:
| • | Fixed payments, including in-substance fixed payments; and |
| • | Amounts expected to be payable under a residual value guarantee. |
Regarding the option to extend office leases, the Group applies a 5-year additional to determine ROU amounts, except when there is no certain probability of continuity of activities in such locations. Renewal clauses generally use an inflation update index (IGPM or IPCA) that is updated annually.
For the periods disclosed, the Group does not have lease agreements with variable payments.
The lease liability is measured at amortized cost using the effective interest method. It is remeasured when there is a change in future lease payments resulting from a change in index or rate, if there is a change in the Group’s estimate of the amounts expected to be payable under a residual value guarantee, if the Group changes its assessment of whether it will exercise a purchase, extension or termination option or if there is a revised in-substance fixed lease payment.
When the lease liability is remeasured in this way, a corresponding adjustment to the carrying amount of the right-of-use asset is made or is accounted for in the profit or loss if the carrying amount of the right-of-use asset has been reduced to zero.
The right-of-use asset is amortized using the straight-line method from the commencement date to the end of the lease term.
Short-term leases and leases of low-value assets
The Group has chosen not to recognize right-of-use assets and liabilities for leases of low value assets and short-term leases. The Group recognizes lease payments associated with these leases as expenses on a straight-line basis over the lease term.
CI&T Inc.
Consolidated financial statements
December 31, 2021
n. Fair value measurement
‘Fair value’ is the price that would be received to sell an asset or paid to transfer a liability in an orderly transaction between market participants on the measurement date of the principal or, in its absence, the most advantageous market to which the Group has access at that date. The fair value of a liability reflects its non-performance risk.
A number of the Group’s accounting policies and disclosures require the measurement of fair values, for both financial and non-financial assets and liabilities (see note 5).
When one is available, the Group measures the fair value of an instrument using the quoted price in an active market for that instrument. A market is regarded as ‘active’ if transactions for the asset or liability take place with sufficient frequency and volume to provide pricing information on an ongoing basis.
If there is no quoted price in an active market, the Group uses valuation techniques that maximize the use of relevant observable data and minimize the use of unobservable inputs. The chosen valuation technique incorporates all the factors that market participants would consider in pricing a transaction.
o. Segment reporting
In reviewing the operational performance of the Group and allocating resources, the chief operating decision maker (“CODM”), is the Board of Directors (“BoD”), in charge for the operational decisions of resource allocation and performance evaluation.
The CODM considers the whole Group as a single operating and reportable segment, monitoring operations, making decisions on fund allocation and evaluating performance based on a single operating segment. The CODM reviews relevant financial data on a consolidated basis for all subsidiaries. Disaggregated information is only reviewed at the revenue level (Note 23), with no corresponding detail at any level of margin or profitability.
See note 23 for a breakdown of Net Revenue and selected assets by geographic location.
8 Changes in significant accounting policies
The Group has initially adopted Interest Rate Benchmark Reform Phase 2 – Amendments to IFRS9, IAS 39, IFRS 7, IFRS 4 and IFRS 16 beginning January 1, 2021.
The Group applied the Phase 2 amendments retrospectively. However, in accordance with the exceptions permitted in the Phase 2 amendments, since the Group had no transactions for which the benchmark rate had been replaced with an alternative benchmark rate as of December 31, 2020, there is no impact on opening equity balances as a result of retrospective application.
Specific policies applicable beginning January 1, 2021 for interest rate benchmark reform
The Phase 2 amendments provide practical relief from certain requirements in IFRS Standards. These reliefs relate to modifications of financial instruments and hedging relationships triggered by a replacement of a benchmark interest rate in a contract with a new alternative benchmark rate.
CI&T Inc.
Consolidated financial statements
December 31, 2021
If the basis for determining the contractual cash flows of a financial asset or financial liability measured at amortized cost changes as a result of interest rate benchmark reform, then the Group updates the effective interest rate of the financial asset or financial liability to reflect the changes required by the reform. Changes in the basis for determining the contractual cash flows are required by interest rate benchmark reform if the following conditions are met:
| • | the change is necessary as a direct consequence of the reform; and |
| • | the new basis for determining the contractual cash flows is economically equivalent to the previous basis – i.e. the basis immediately before the change. |
If changes are made to a financial asset or financial liability, in addition to changes to the basis for determining the contractual cash flows required under interest rate benchmark reform, then the Group first updates the effective interest rate of the financial asset or financial liability to reflect the change required under interest rate benchmark reform. Subsequently, the Group applies the accounting policies to implement the modifications set out above to the additional changes.
Amendments also provide for an exception to use a revised discount rate that reflects the change in interest rates when remeasuring a lease liability because of a lease modification that is required by an interest rate benchmark reform.
Finally, the Phase 2 amendments provide for a series of temporary exceptions from certain hedge accounting requirements when a change required by interest rate benchmark reform occurs to a hedged item and/or hedging instrument that permits the hedge relationship to be continued without interruption. The Group does not apply hedge accounting.
9 Business combination
On June 26, 2021, the CI&T Brazil entered into a purchase agreement to acquire 100% of the shareholding control of Dextra Investimentos S.A. (“Dextra Holding”) and its subsidiaries (“Dextra Group”). On July 22, 2021, the transaction was approved by the Administrative Council for Economic Defense (CADE). All conditions precedent were met on August 10, 2021, the date on which the closing term of the acquisition was formalized and the CI&T Brazil obtained the shareholding control of the Dextra Group. Dextra Group is primarily involved in customized software development.
Control of the Dextra Group will enable the Company to increase the available talent pool. The acquisition is also expected to increase the Company’s customer relationship in Brazil.
The total consideration of acquisition in the purchase agreement was R$800,000. The Company paid R$ 650,000 on August 10, 2021 and R$ 50,938 on December 02, 2021. The remaining balance will be paid on the first anniversary of the closing date, subject to the application of any purchase price adjustments (note 18). The Management revised the purchase price on the closing date based on the Agreement, and reduced the price based in the amount of R$ 16,427, thus the total of consideration transferred was R$ 783,573. This reduction is subject to review by the seller.
The amount of R$30,000 related to a portion of the remaining balance payable was retained for any materialized contingencies, which will be paid on the fifth anniversary of the closing date.
For the year ended on December 31, 2021, Dextra Holding contributed R$172,959 in revenue to the Group’s results and a profit of R$ 31,943 for the period. If the acquisition had occurred on January 1, 2021, Management estimates that consolidated revenue would have totaled R$ 1,617,339, and consolidated profit for the year ended on December 31, 2021 would have totaled R$ 129,044. In determining these amounts, Management has assumed that the fair value adjustments, on the acquisition date, would have been the same if the acquisition had occurred on January 1, 2021.
CI&T Inc.
Consolidated financial statements
December 31, 2021
a) Consideration transferred
The following table summarizes the fair value of each major class of consideration transferred on the acquisition date.
Cash |
| 700,938 |
|
Accounts payable for business combination (note 18) |
| 82,635 |
|
Accounts payable |
| 45,726 |
|
Retained amount |
| 30,000 |
|
Other |
| 6,909 |
|
Total consideration transferred |
| 783,573 |
|
b) Acquisition-related cost
The Company incurred acquisition-related costs of R$2,109 on legal fees and due diligence costs. These costs have been recognized in “administrative expenses”.
c) Identifiable assets acquired and liabilities assumed
The following table summarizes the recognized amounts of assets acquired and liabilities assumed on the acquisition date:
| |
|
| Assets | Fair value |
|
Current | |
|
Cash and cash equivalents | 8,216 |
|
Trade receivables (a) | 56,313 |
|
Recoverable taxes | 1,668 |
|
Other assets | 2,386 |
|
Current assets | 68,583 |
|
Non-current |
|
|
Recoverable taxes | 3,932 |
|
Property, plant and equipment (note 13) | 9,149 |
|
Intangible assets (i) (note 14) | 148,523 |
|
Right-of-use assets (note 15) | 5,414 |
|
Non-current assets | 167,018 |
|
Total assets | 235,601 |
|
| |
|
Liabilities | Fair value |
|
Current |
|
|
Suppliers | 5,627 |
|
Lease liabilities (note 15) | 3,105 |
|
Salaries and welfare charges | 23,436 |
|
Tax liabilities | 10,569 |
|
Contract liabilities | 1,933 |
|
Other liabilities | 26 |
|
Current liabilities | 44,696 |
|
Non-current | |
|
Other liabilities | 18 |
|
Lease liabilities (note 15) | 3,035 |
|
Non-current liabilities | 3,053 |
|
Total liabilities | 47,749 |
|
Total identifiable net assets acquired | 187,852 |
|
CI&T Inc.
Consolidated financial statements
December 31, 2021
(i) According to the purchase price on August 10, 2021: | | | |
|
| Fair value |
|
Network software (note 14) | 191 |
|
Internally developed software (note 14) | 22,613 |
|
Customer relationship (note 14) | 88,961 |
|
Non-compete agreement (note 14) | 16,257 |
|
Brands (note 14) | 20,501 |
|
Total intangible assets at fair value (note 14) | 148,523 |
|
Measurement of fair values
The following fair values have been determined on the assumptions:
• | The fair value estimate for brands was calculated based on the “Relief from Royalty or Savings of Royalties” method, which estimates the asset's value based on hypothetical royalty payments that would be saved by the asset holder compared to what would be paid for licensing the asset owned by third parties, considering its useful life. The useful life for brands is 1.4 year. |
•
| The fair value estimate for non-compete agreement was calculated based on the “With and Without” method. Its useful life is 5 years. |
• | The fair value estimate for customer relationship was calculated based on the multi-period excess earnings. Its useful life is 7.4 years. |
d) Goodwill
Goodwill arising from the acquisition has been recognized as follows:
| Note | Goodwill |
|
Consideration transferred | 9.a | 783,573 |
|
Fair value of identifiable net assets | 9.c | (187,852 | ) |
Goodwill (note 14) | | 595,721 |
|
Goodwill is attributable mainly to the skills and technical talent of Dextra’s work force and the synergies expected to be achieved from integrating the Company. The recognized goodwill is expected to be deductible for tax purposes during the merger, which was occurred on December 31, 2021.
CI&T Inc.
Consolidated financial statements
December 31, 2021
10 Cash and cash equivalents and financial investments
10.1 Cash and cash equivalents
. | December 31, 2021 |
|
| December 31, 2020 |
|
Cash and cash equivalents | 69,720 |
|
| 59,640 |
|
Short-term financial investments | 66,007 |
|
| 103,187 |
|
Total | 135,727 |
|
| 162,827 |
|
Short-term financial investments are represented by fixed income securities, with interest rate ranging from 100% to 103% on December 31, 2021 (97% to 101% as of December 31, 2020) of the changes of Interbank Deposit Certificate (CDI) variation which (i) Management expects to use for short-term commitments; (ii) present daily liquidity; and (iii) are readily convertible into a known amount of cash, subject to an insignificant risk of change in value.
10.2 Financial investments
. | December 31, 2021 |
|
| December 31, 2020 |
|
Financial investments | 798,786 |
|
| - | |
At December 31, 2021, the balance of R$ 798,786 (US$ 143,139) is fully allocated in a USD interest-bearing account, bearing interest of 0,05% p.a., and such account presents immediate liquidity and is readily convertible into a known amount of cash, subject to an insignificant risk of changes in value in USD . The Company holds USD amount for short-term commitments in USD, therefore, such amount may be subject to a significant exchange rate once translated to Brazilian Reais.
11 Trade receivables
The balances of trade receivables are presented, as follows:
| December 31, 2021 |
|
| December 31, 2020 |
|
Trade receivables - Brazil market | 100,581 |
|
| 32,275 |
|
Trade receivables - Other markets | 240,997 |
|
| 164,673 |
|
(-) Expected credit losses | (1,059 | ) |
| (692 | ) |
Trade receivables, net | 340,519 |
|
| 196,256 |
|
The balances of trade receivables by maturity date are as follows:
| December 31, 2021 |
|
| December 31, 2020 |
|
Not due | 319,450 |
|
| 167,939 |
|
Overdue: | |
|
| |
|
from 1 to 60 days (1) | 20,020 |
|
| 28,012 |
|
61 to 360 days | 1,564 |
|
| 939 |
|
Over 360 days | 544 |
|
| 58 |
|
Total | 341,578 |
|
| 196,948 | |
| (i) | As of December 31, 2021, the balance of trade receivables overdue from 1 to 60 days of R$20,020 (R$28,012 as of December 31, 2020), refers to a series of individual clients. The Group considers these extensions and delays as expected in its credit risk analysis. |
CI&T Inc.
Consolidated financial statements
December 31, 2021
The movement of impairment loss on trade receivables is as follows:
|
|
|
| Balance as of January 1, 2019 | (352 | ) |
| Provision | (430 | ) |
| Reversal | 378 |
|
| Partial investment spin-off | 160 |
|
Exchange variation
| (2 | ) |
| |
|
Balance as of December 31, 2019 | (246 | ) |
Provision | (1,751 | ) |
Reversal | 1,337 |
|
Exchange variation | (32 | ) |
|
|
|
Balance as of December 31, 2020 | (692 | ) |
Provision | (3,106 | ) |
Reversal | 2,826 |
|
Exchange variation | (87 | ) |
|
|
|
Balance as of December 31, 2021 | (1,059 | ) |
12 Other assets
| December 31, 2021 |
|
| December 31, 2020 |
|
Prepaid expenses (a) | 29,743 |
|
| 13,221 |
|
Rental security deposits | 2,471 |
|
| 1,402 |
|
Suppliers’ advances | 162 |
|
| 673 |
|
Other | 592 |
|
| 72 |
|
Total | 32,968 |
|
| 15,368 |
|
|
|
|
|
|
|
Current | 29,994 |
|
| 12,874 |
|
Non-current | 2,974 |
|
| 2,494 |
|
Total | 32,968 |
|
| 15,368 |
|
| (a) | Prepaid expenses are mostly comprised of prepaid insurance, mainly related to directors and officers liability insurance, consulting, software support prepayments. |
13 Property, plant and equipment
. | December 31, 2021 |
|
| December 31, 2020 |
|
IT equipment | 35,230 |
|
| 15,407 |
|
Furniture and fixtures | 6,283 |
|
| 6,364 |
|
Vehicles | - |
|
| 27 |
|
Hardware devices | - |
|
| 291 |
|
Leasehold improvements (a) | 16,051 |
|
| 16,460 |
|
Property, plant and equipment in progress | 157 |
|
| 222 |
|
| Total | 57,721 |
|
| 38,771 |
|
| (a) | Improvements are depreciated on a straight-line basis based over the duration of the lease agreement. |
CI&T Inc.
Consolidated financial statements
December 31, 2021
The changes in the balances are as follows:
. | IT equipment |
|
| Furniture and fixtures |
|
| Vehicles |
|
| Leasehold improvements |
|
| In progress |
|
| Hardware devices |
|
| Total |
|
Cost: | |
|
| |
|
| |
|
| |
|
| |
|
| |
|
| |
|
Balance as of January 1, 2020 | 24,013 |
|
| 11,903 |
|
| 295 |
|
| 22,345 |
|
| 14 |
|
| - |
|
| 58,570 |
|
Exchange rate changes | 1,285 |
|
| 760 |
|
| 69 |
|
| 1,155 |
|
| - |
|
| - |
|
| 3,269 |
|
Additions | 11,315 |
|
| 1,365 |
|
| - |
|
| 461 |
|
| 5,998 |
|
| 487 |
|
| 19,626 |
|
Disposals | (1,761 | ) |
| (1,091 | ) |
| (278 | ) |
| (1,352 | ) |
| (103 | ) |
| - |
|
| (4,585 | ) |
Transfers | - |
|
| 4 |
|
| - |
|
| 5,683 |
|
| (5,687 | ) |
| - |
|
| - |
|
Balance as of December 31, 2020 | 34,852 |
|
| 12,941 |
|
| 86 |
|
| 28,292 |
|
| 222 |
|
| 487 |
|
| 76,880 |
|
Exchange rate changes | 386 |
|
| 176 |
|
| - |
|
| 375 |
|
| 37 |
|
| - |
|
| 974 |
|
Spin-off | (128 | ) |
| (4 | ) |
| - |
|
| - |
|
| (313 | ) |
| (625 | ) |
| (1,070 | ) |
Addition due to business combination (note 9) | 7,379 |
|
| 1,018 |
|
| - |
|
| 752 |
|
| - |
|
| - |
|
| 9,149 |
|
Additions | 22,527 |
|
| 301 |
|
| - |
|
| 1,052 |
|
| 1,724 |
|
| 138 |
|
| 25,742 |
|
Disposals | (1,376 | ) |
| (563 | ) |
| (86 | ) |
| (909 | ) |
| (160 | ) |
| - |
|
| (3,094 | ) |
Transfers | - |
|
| - |
|
| - |
|
| 1,353 |
|
| (1,353 | ) |
| - |
|
| - |
|
Balance as of December 31, 2021 | 63,640 |
|
| 13,869 |
|
| - |
|
| 30,915 |
|
| 157 |
|
| - |
|
| 108,581 |
|
|
|
|
|
|
|
|
|
|
|
|
|
|
|
|
|
|
|
|
|
|
Depreciation: | |
|
| |
|
| |
|
| |
|
| |
|
| |
|
| |
|
| Balance as of January 1, 2019 | (15,151 | ) |
| (5,340 | ) |
| (159 | ) |
| (7,194 | ) |
| - |
|
| - |
|
| (27,844 | ) |
| Effect of movements in exchange rates | (48 | ) |
| (22 | ) |
| (5 | ) |
| (21 | ) |
| - |
|
| - |
|
| (96 | ) |
Investment spin-off
| 575 |
|
| 80 |
|
| - |
|
| 361 |
|
| - |
|
| - |
|
| 1,016 |
|
Depreciation
| (3,850 | ) |
| (1,486 | ) |
| (78 | ) |
| (2,928 | ) |
| - |
|
| - |
|
| (8,342 | ) |
| Disposals | 3,382 |
|
| 1,088 |
|
| 133 |
|
| 21 |
|
| - |
|
| - |
|
| 4,624 |
|
Balance as of December 31, 2019 | (15,092 | ) |
| (5,680 | ) |
| (109 | ) |
| (9,761 | ) |
| - |
|
| - |
|
| (30,642 | ) |
Exchange rate changes | (565 | ) |
| (207 | ) |
| (28 | ) |
| (154 | ) |
| - |
|
| - |
|
| (954 | ) |
Additions | (5,386 | ) |
| (1,616 | ) |
| (50 | ) |
| (3,245 | ) |
| - |
|
| (196 | ) |
| (10,493 | ) |
Disposals | 1,598 |
|
| 926 |
|
| 128 |
|
| 1,328 |
|
| - |
|
| - |
|
| 3,980 |
|
Balance as of December 31, 2020 | (19,445 | ) |
| (6,577 | ) |
| (59 | ) |
| (11,832 | ) |
| - |
|
| (196 | ) |
| (38,109 | ) |
Exchange rate changes | (214 | ) |
| (42 | ) |
| - |
|
| 57 |
|
| - |
|
| - |
|
| (199 | ) |
Spin-off | 10 |
|
| 2 |
|
| - |
|
| - |
|
| - |
|
| 280 |
|
| 292 |
|
Additions | (9,625 | ) |
| (1,451 | ) |
| (5 | ) |
| (3,908 | ) |
| - |
|
| (84 | ) |
| (15,073 | ) |
Disposals | 864 |
|
| 482 |
|
| 64 |
|
| 819 |
|
| - |
|
| - |
|
| 2,229 |
|
Balance as of December 31, 2021 | (28,410 | ) |
| (7,586 | ) |
| - |
|
| (14,864 | ) |
| - |
|
| - |
|
| (50,860 | ) |
Balance as of: | |
|
| |
|
| |
|
| |
|
| |
|
| |
|
| |
|
December 31, 2020 | 15,407 |
|
| 6,364 |
|
| 27 |
|
| 16,460 |
|
| 222 |
|
| 291 |
|
| 38,771 |
|
December 31, 2021 | 35,230 |
|
| 6,283 |
|
| - |
|
| 16,051 |
|
| 157 |
|
| - |
|
| 57,721 | |
The Group does not have property, plant or equipment pledged as collateral.
CI&T Inc.
Consolidated financial statements
December 31, 2021
14 Intangible assets
. | December 31, 2021 |
|
| December 31, 2020 |
|
Network software | 2,399 |
|
| 1,096 |
|
Internally developed software (i) | 3,911 |
|
| 2,385 |
|
Software in progress | 391 |
|
| 115 |
|
Customer relationship (ii) | 84,195 |
|
| - |
|
Non-compete agreement (ii) | 13,897 |
|
| - |
|
Brands (ii) | 14,541 |
|
| - |
|
Subtotal | 119,334 |
|
| 3,596 |
|
Goodwill (iii) | 619,469 |
|
| 14,570 |
|
Total | 738,803 |
|
| 18,166 |
|
| (i) | Refers to internal expenses with software development to be sold by the Group and also for internal use. |
| (ii) | Refers to customer relationship, non-compete agreement and brads arising from acquisition of Dextra Technologies S.A., on August 10, 2021 (note 9.c). |
| (iii) | Refers to goodwill arising from: a) acquisition of Dextra Technologies S.A., on August 10, 2021, in the amount of R$595,721 (note 9.d); b) acquisition of Comrade Inc. in 2017, in the amount of R$19,644 (R$10,969 as of December 31, 2020), which was merged in 2018, into the subsidiary CI&T Inc; c) acquisition of CI&T IN Software Ltda., which was merged into the Company in 2014 in the amount of R$2,871; and d) acquisition of CI&T Japan Inc. in 2015 in the amount of R$1,233 (R$730 as of December 31, 2020). |
CI&T Inc.
Consolidated financial statements
December 31, 2021
The change in the balances of intangible assets as follows:
| Network software |
|
| Internally developed software |
|
| Software in progress |
|
| Customer relationship |
|
| Non-compete agreement |
|
| Brands |
|
| Goodwill |
|
| Total |
|
Cost: | |
|
| |
|
| |
|
| |
|
| |
|
| |
|
| |
|
| |
|
Balance as of January 1, 2020 | 9,229 |
|
| 11,444 |
|
| 445 |
|
| - |
|
| - |
|
| - |
|
| 14,570 |
|
| 35,688 |
|
Exchange rate changes | 331 |
|
| - |
|
| - |
|
| - |
|
| - |
|
| - |
|
| - |
|
| 331 |
|
Additions | 188 |
|
| 646 |
|
| 931 |
|
| - |
|
| - |
|
| - |
|
| - |
|
| 1,765 |
|
Disposals | (16 | ) |
| - |
|
| - |
|
| - |
|
| - |
|
| - |
|
| - |
|
| (16 | ) |
Transfers | - |
|
| 1,261 |
|
| (1,261 | ) |
| - |
|
| - |
|
| - |
|
| - |
|
| - |
|
Balance as of December 31, 2020 | 9,732 |
|
| 13,351 |
|
| 115 |
|
| - |
|
| - |
|
| - |
|
| 14,570 |
|
| 37,768 |
|
Additions due to business combination (note 9) | 191 |
|
| 22,613 |
|
| - |
|
| 88,961 |
|
| 16,257 |
|
| 20,501 |
|
| 595,721 |
|
| 744,244 |
|
Exchange rate changes | 38 |
|
| - |
|
| - |
|
| - |
|
| - |
|
| - |
|
| 9,178 |
|
| 9,216 |
|
Additions | 1,999 |
|
| 1,428 |
|
| 738 |
|
| - |
|
| - |
|
| - |
|
| - |
|
| 4,165 |
|
| Impairment loss (a) | - |
|
| (20,723 | ) |
| - |
|
| - |
|
| (2,795 | ) |
| - |
|
| - |
|
| (23,518 | ) |
Write-off | (18 | ) |
| - |
|
| (550 | ) |
| - |
|
| - |
|
| - |
|
| - |
|
| (568 | ) |
Transfers | - |
|
| (88 | ) |
| 88 |
|
| - |
|
| - |
|
| - |
|
| - |
|
| - |
|
Balance as of December 31, 2021 | 11,942 |
|
| 16,581 |
|
| 391 |
|
| 88,961 |
|
| 13,462 |
|
| 20,501 |
|
| 619,469 |
|
| 771,307 |
|
Amortization: |
|
|
|
|
|
|
|
|
|
|
|
|
|
|
|
|
|
|
|
|
|
|
|
| Balance as of January 1, 2019 | (6,786 | ) |
| (7,583 | ) |
| - |
|
| - |
|
| - |
|
| - |
|
| - |
|
| (14,369 | ) |
| Effect of movements in exchange rates | (165 | ) |
| - |
|
| - |
|
| - |
|
| - |
|
| - |
|
| - |
|
| (165 | ) |
| Investment spin-off | 37 |
|
| - |
|
| - |
|
| - |
|
| - |
|
| - |
|
| - |
|
| 37 |
|
| Amortization | (874 | ) |
| (1,903 | ) |
| - |
|
| - |
|
| - |
|
| - |
|
| - |
|
| (2,777 | ) |
Disposals
| 131 |
|
| - |
|
| - |
|
| - |
|
| - |
|
| - |
|
| - |
|
| 131 |
|
Balance as of December 31, 2019 | (7,657 | ) |
| (9,486 | ) |
| - |
|
| - |
|
| - |
|
| - |
|
| - |
|
| (17,143 | ) |
Exchange rate changes | (298 | ) |
| - |
|
| - |
|
| - |
|
| - |
|
| - |
|
| - |
|
| (298 | ) |
Additions | (697 | ) |
| (1,480 | ) |
| - |
|
| - |
|
| - |
|
| - |
|
| - |
|
| (2,177 | ) |
Disposals | 16 |
|
| - |
|
| - |
|
| - |
|
| - |
|
| - |
|
| - |
|
| 16 |
|
Balance as of December 31, 2020 | (8,636 | ) |
| (10,966 | ) |
| - |
|
| - |
|
| - |
|
| - |
|
| - |
|
| (19,602 | ) |
Exchange rate changes | (32 | ) |
| - |
|
| - |
|
| - |
|
| - |
|
| - |
|
| - |
|
| (32 | ) |
Additions | (893 | ) |
| (1,708 | ) |
| - |
|
| (4,766 | ) |
| (1,189 | ) |
| (5,960 | ) |
| - |
|
| (14,516 | ) |
| Impairment loss (a) | - |
|
| - |
|
| - |
|
| - |
|
| 1,624 |
|
| - |
|
| - |
|
| 1,624 |
|
Write-off | 18 |
|
| 4 |
|
| - |
|
| - |
|
|
|
|
| - |
|
| - |
|
| 22 |
|
Balance as of December 31, 2021 | (9,543 | ) |
| (12,670 | ) |
| - |
|
| (4,766 | ) |
| 435 |
|
| (5,960 | ) |
| - |
|
| (32,504 | ) |
Balance at: | |
|
| |
|
| |
|
| |
|
| |
|
| |
|
| |
|
| |
|
December 31, 2020 | 1,096 |
|
| 2,385 |
|
| 115 |
|
| - |
|
| - |
|
| - |
|
| 14,570 |
|
| 18,166 |
|
December 31, 2021 | 2,399 |
|
| 3,911 |
|
| 391 |
|
| 84,195 |
|
| 13,897 |
|
| 14,541 |
|
| 619,469 |
|
| 738,803 | |
| (a) | After the consummation of the Dextra Group acquisition, the Company decided to discontinue the investment in the intangible assets, acquired in the business combination and initially recognized as internally developed software, in the amount of R$20,723, due to growth strategies in the digital transformation market, with the purpose more directed to the development of customized and on demand software for customers. The residual amount with respect to a non-compete agreement, in the amount of R$1,171, was also recognized as impairment. The total amount of impairment loss of intangible assets was recognized in the caption “Other income (expenses), net” (note 24.1), in the amount of R$21,895, as of December 31, 2021. |
CI&T Inc.
Consolidated financial statements
December 31, 2021
Impairment test – Goodwill
The recoverable amount of the CGU was based on the value in use, determined through the discounted future cash flows to be generated by the continuous use of the CGU.
The discounted cash flow methodology was used to determine the value in use of the CGU, calculated based on the capitalization of free cash flows discounted at a weighted-average cost of capital (WACC) that corresponds to the discount rate, considering the weighted average cost of the different financing forms present in the company’s capital structure.
The values attributed to the main assumptions, as detailed below, represent the assessment of future management trends in relevant sectors and were based on historical data from internal and external sources.
. | December 31, 2021 |
|
| December 31, 2020 |
|
Discount rate - before tax | 19.06 | % |
| 12.54 | % |
Discount rate - after tax | 12.94 | % |
| 12.38 | %
|
Budgeted EBITDA growth rate (average for the next five years) | 22 | % |
| 20 | % |
Terminal value growth rate | 3.5 | % |
| 3.5 | % |
The financial projections of the business unit in Brazil were prepared in Brazilian reais, in nominal values for the next five years.
The discount rate was estimated after tax based on the historical weighted average cost of capital rate at which the CGU operates.
Cash flow projections were prepared for five years and a growth rate in perpetuity after this period was considered. The rate of growth in perpetuity was determined as the lower value between the inflation of the countries where the Company operates and the estimated annual compound rate of long-term growth of EBITDA, which Management believes to be consistent with the market.
The key estimates used were as follows:
| • | Revenue growths are projected considering the average growth levels experienced over the past years and the growth for the next five years between 28% and 43%, considered effective tax rates on the base date of assessment. |
| • | The scenario with the extinction of the Brazilian payroll tax exemption benefits directly impacted personnel costs, reducing gross margin. |
•
| The variation in EBITDA follows revenues, costs, and expenses. The EBITDA margin of Net revenue was maintained at 22% over the projected period. |
Management’s impairment test for 2021 and 2020 indicated that value in use is substantially higher than the carrying amount of the goodwill. Management therefore believes that no reasonably possible change in any of the above key assumptions would cause the carrying amount of goodwill to materially exceed its recoverable amount.
The Company did not recognize any impairment loss for the years ended December 31, 2021, 2020 and 2019.
15 Leases
- Right-of-use assets
. | December 31, 2021 |
|
| December 31, 2020 |
|
Properties | 69,441 |
|
| 66,459 |
|
Vehicles | 4,173 |
|
| 2,809 |
|
IT equipment | 213 |
|
| 497 |
|
Total | 73,827 |
|
| 69,765 |
|
CI&T Inc.
Consolidated financial statements
December 31, 2021
Some of the Group’s leases have the option of an extension that can be exercised for an indefinite period, and in these cases the Group has already considered in the measurement of the lease amounts the extensions that are reasonably certain to be exercised.
The Group applies the short-term lease recognition exemption to its short-term leases of properties (those leases that have a lease term of 12 months or less). It also applies the lease of low-value assets recognition exemption to leases that are considered of low value. Lease payments on short-term leases and leases of low-value assets are recognized as expenses on a straight-line basis. The remained rental expenses for the year totaled R$5,922 as of December 31, 2021 (R$4,669 as of December 31, 2020).
The changes to balances of the right-of-use are:
| Properties |
|
| Vehicles |
|
| IT equipment |
|
| Total |
|
Cost: | |
|
| |
|
| |
|
| |
|
Balance as of January 1, 2020 | 84,324 |
|
| 3,213 |
|
| 851 |
|
| 88,388 |
|
Foreign currency difference | 8,370 |
|
| 10 |
|
| - |
|
| 8,380 |
|
Additions | 14,305 |
|
| 2,503 |
|
| - |
|
| 16,808 |
|
Derecognition of right-of-use assets | (18,450 | ) |
| (718 | ) |
| - |
|
| (19,168 | ) |
Balance on December 31, 2020 | 88,549 |
|
| 5,008 |
|
| 851 |
|
| 94,408 |
|
Additions due to business combination (note 9.c) | 5,414 |
|
| - |
|
| - |
|
| 5,414 |
|
Foreign currency difference | 2,744 |
|
| 3 |
|
| - |
|
| 2,747 |
|
Additions | 11,815 |
|
| 3,724 |
|
| - |
|
| 15,539 |
|
Derecognition of right-of-use assets | (2,200 | ) |
| (2,363 | ) |
| - |
|
| (4,563 | ) |
Remeasurement of right-of-use assets | 1,318 |
|
| - |
|
| - |
|
| 1,318 |
|
Balance on December 31, 2021 | 107,640 |
|
| 6,372 |
|
| 851 |
|
| 114,863 |
|
|
|
|
|
|
|
|
|
|
|
|
|
Depreciation: | |
|
| |
|
| |
|
| |
|
| Balance at January 1, 2019 | - |
|
| - |
|
| - |
|
| - |
|
| Foreign currency difference | (32 | ) |
| - |
|
| - |
|
| (32 | ) |
Depreciation
| (13,402 | ) |
| (985 | ) |
| (71 | ) |
| (14,458 | ) |
Balance on December 31, 2019 | (13,434 | ) |
| (985 | ) |
| (71 | ) |
| (14,490 | ) |
Foreign currency difference | (979 | ) |
| (9 | ) |
| - |
|
| (988 | ) |
Depreciation | (15,320 | ) |
| (1,609 | ) |
| (283 | ) |
| (17,212 | ) |
Derecognition of right-of-use assets | 7,643 |
|
| 404 |
|
| - |
|
| 8,047 |
|
Balance on December 31, 2020 | (22,090 | ) |
| (2,199 | ) |
| (354 | ) |
| (24,643 | ) |
Foreign currency difference | (856 | ) |
| (1 | ) |
| - |
|
| (857 | ) |
Depreciation | (16,535 | ) |
| (1,944 | ) |
| (284 | ) |
| (18,763 | ) |
Derecognition of right-of-use assets | 1,657 |
|
| 1,945 |
|
| - |
|
| 3,602 |
|
Remeasurement of right-of-use assets | (376 | ) |
| - |
|
| - |
|
| (376 | ) |
Balance on December 31, 2021 | (38,200 | ) |
| (2,199 | ) |
| (638 | ) |
| (41,037 | ) |
|
|
|
|
|
|
|
|
|
|
|
|
Net balance at: | |
|
| |
|
| |
|
| |
|
December 31, 2020 | 66,459 |
|
| 2,809 |
|
| 497 |
|
| 69,765 |
|
December 31, 2021 | 69,441 |
|
| 4,173 |
|
| 213 |
|
| 73,827 | |
CI&T Inc.
Consolidated financial statements
December 31, 2021
- Lease liabilities
. | Average discount rate (per year) |
| December 31, 2021 |
|
| December 31, 2020 |
|
Properties | 10.88% (2020: 7.56%) |
| 77,366 |
|
| 71,765 |
|
Vehicles | 14.54% (2020: 12.69%) |
| 4,285 |
|
| 2,940 |
|
IT equipment | 7.70% (2020: 7.70%) |
| 237 |
|
| 523 |
|
Total | |
| 81,888 |
|
| 75,228 |
|
Current | |
| 21,214 |
|
| 14,569 |
|
Non-current | |
| 60,674 |
|
| 60,659 |
|
Total | |
| 81,888 |
|
| 75,228 |
|
The change in lease liabilities is disclosed in the reconciliation of change in liabilities to cash flows in note 16.
16 Loans and borrowings
Loans and borrowings operations can be summarized as follows:
| Currency |
| Average interest rate per year (%) |
| Year of maturity |
| December 31, 2021 |
|
| December 31, 2020 |
|
Itaú (i) | USD |
| 4.82% p.a. |
| 2022 |
| 2,349 |
|
| 5,936 |
|
Santander Bank S/A (iv) | BRL |
| 12.87% p.a. |
| 2021 |
| - |
|
| 33 |
|
Bradesco (i) | BRL |
| CDI + 3.57% / CDI + 1.10% |
| 2021 / 2023 |
| 11,684 |
|
| 52,081 |
|
Banco do Brasil (ii) | USD |
| 3.05% |
| 2021 |
| - |
|
| 20,748 |
|
HSBC - CI&T Inc. (iii) | USD |
| Prime rate + 1% |
| 2021 |
| - |
|
| 10,432 |
|
Citibank - CI&T Inc. (iii) | USD |
| Libor 3 months rate + 1.90% |
| 2022 |
| 11,164 |
|
| - |
|
Banco do Brasil (ii) | USD |
| 2.37% p.a. |
| 2022 |
| 56,551 |
|
| - |
|
Citibank (ii) | USD |
| 2.28% p.a. / 2.30% p.a. |
| 2022 |
| 28,328 |
|
| - |
|
Santander Bank S/A (v) | BRL |
| p.a. |
| 2026 |
| 204,047 |
|
| - |
|
Bradesco (i) | BRL |
| CDI + 1.75% |
| 2026 |
| 306,417 |
|
| - |
|
Citibank (ii) | USD |
| Libor 3 months rate + 2.07% |
| 2026 |
| 168,169 |
|
| - |
|
Total | |
| |
| |
| 788,709 |
|
| 89,230 |
|
| (i) | Export credit note - NCE: Refers to financing to export software development services. |
| (ii) | Advance on Foreign Exchange Contract (ACC). |
| (iii) | Refers to Revolving Credit Facility. |
| (vi) | Refers to Leasing contracts. |
(v)
| Refers to Law 4131 - Foreign currency loans granted by the banks abroad to a Brazilian company. |
These balances were included as current and non-current borrowings in the consolidated statement of financial position as follows:
| December 31, 2021 |
|
| December 31, 2020 |
|
Current | 164,403 |
|
| 75,377 |
|
Non-current | 624,306 |
|
| 13,853 |
|
Total | 788,709 |
|
| 89,230 |
|
CI&T Inc.
Consolidated financial statements
December 31, 2021
The principal balances of long-term loans and borrowings as of December 31, 2021, mature as follows:
Maturity |
|
|
2023 | 112,031 |
|
2024 | 143,197 |
|
2025 | 196,925 |
|
2026 | 172,153 |
|
Non-current liabilities | 624,306 |
|
The reconciliation of change in liabilities to cash flows arising from financing activities is shown below:
| Liabilities |
|
| Leases |
|
| Share premium |
|
| Total |
|
| Loans and borrowings |
|
| Leases (note 15.b) |
|
| and Reserves |
|
| |
|
Balance as of January 1, 2021 | 89,230 |
|
| 75,228 |
|
| 116,072 |
|
| 280,530 |
|
Changes in cash flow from financing activities | |
|
| |
|
| |
|
| |
|
Proceeds from loans and borrowings | 740,596 |
|
| - |
|
| - |
|
| 740,596 |
|
Loans, borrowings and lease liabilities payments | (75,196 | ) |
| (17,656 | ) |
| - |
|
| (92,852 | ) |
| Issuance of common shares at initial public offering | - |
|
| - |
|
| 915,947 |
|
| 915,947 |
|
| Transaction cost of offering | - |
|
| - |
|
| (66,876 | ) |
| (66,876 | ) |
Share-based plan contributions | - |
|
| - |
|
| 1,282 |
|
| 1,282 |
|
Interest on equity paid | - |
|
| - |
|
| (6,288 | ) |
| (6,288 | ) |
Dividends paid (note 22) | - |
|
| - |
|
| (126,045 | )
|
| (126,045 | ) |
Total changes in cash flow from financing activities | 665,400 |
|
| (17,656 | ) |
| 718,020 |
|
| 1,365,764 |
|
Exchange rate changes | 601 |
|
| 2,054 |
|
| - |
|
| 2,655 |
|
Other changes - liabilities | |
|
| |
|
| |
|
| |
|
Additions due to business combination (note 9.c) | - |
|
| 6,139 |
|
| - |
|
| 6,139 |
|
New leases | - |
|
| 15,504 |
|
| - |
|
| 15,504 |
|
Remeasurement | - |
|
| 1,351 |
|
| |
|
| 1,351 |
|
Interest expenses | 23,366 |
|
| 6,369 |
|
| - |
|
| 29,735 |
|
Interest paid | (12,149 | ) |
| (5,753 | ) |
| - |
|
| (17,902 | ) |
Other borrowing/lease costs | 22,261 |
|
| (213 | ) |
| - |
|
| 22,048 |
|
Lease write-offs | - |
|
| (1,135 | ) |
| - |
|
| (1,135 | ) |
Total other changes - liabilities | 33,478 |
|
| 22,262 |
|
| - |
|
| 55,740 |
|
Total other changes - equity | - |
|
| - |
|
| 217,950 |
|
| 217,950 |
|
Balance as of December 31, 2021 | 788,709 |
|
| 81,888 |
|
| 1,052,042 |
|
| 1,922,639 |
|
CI&T Inc.
Consolidated financial statements
December 31, 2021
| Liabilities |
|
| Leases |
|
| Net Equity |
|
| Total |
|
| Loans and financing |
|
| Leases (Note 15.b) |
|
| Reserves |
|
| |
|
Balance as of January 1, 2020 | 27,849 |
|
| 77,393 |
|
| 36,937 |
|
| 142,179 |
|
Financing cash flow variations | |
|
| |
|
| |
|
| |
|
Proceeds from loans and borrowings | 144,269 |
|
| - |
|
| - |
|
| 144,269 |
|
Loan and borrowings payments, and lease payments | (88,107 | ) |
| (15,500 | ) |
| - |
|
| (103,607 | ) |
Interest on own capital | - |
|
| - |
|
| (4,276 | ) |
| (4,276 | ) |
Dividends paid | - |
|
| - |
|
| (30,977 | ) |
| (30,977 | ) |
Total changes in financing cash flows | 56,162 |
|
| (15,500 | ) |
| (35,253 | ) |
| 5,409 |
|
Effect of changes in exchange rates | 1,310 |
|
| 7,657 |
|
| - |
|
| 8,967 |
|
Other changes - related to liabilities | |
|
| |
|
| |
|
| |
|
New leases | - |
|
| 16,715 |
|
| - |
|
| 16,715 |
|
Interest expense | 5,281 |
|
| 5,023 |
|
| - |
|
| 10,304 |
|
Interest paid | (3,880 | ) |
| (5,023 | ) |
| - |
|
| (8,903 | ) |
Other costs | 2,508 |
|
| - |
|
| - |
|
| 2,508 |
|
Lease write-offs | - |
|
| (11,037 | ) |
| - |
|
| (11,037 | ) |
Total other changes related to liabilities | 3,909 |
|
| 5,678 |
|
| - |
|
| 9,587 |
|
Total other changes related to equity | - |
|
| - |
|
| 114,388 |
|
| 114,388 |
|
Balance as of December 31, 2020 | 89,230 |
|
| 75,228 |
|
| 116,072 |
|
| 280,530 |
|
| Liabilities | | | Leases | | | Net Equity | | | Total | |
| Loans and financing | | | Leases (Note 15.b) | | | Reserves | | | | |
Balance as of January 1, 2019 | 42,288 | | | 81,893 | | | 85,330 | | | 209,511 | |
Financing cash flow variations | | | | | | | | | | | |
Loans and borrowings | 8,179 | | | - | | | - | | | 8,179 | |
Loan and borrowings payments, and lease payments | (24,161 | ) | | (10,949 | ) | | - | | | (35,110 | ) |
Interest on own capital | - | | | - | | | (2,676 | ) | | (2,676 | ) |
Dividends paid | - | | | - | | | (40,059 | ) | | (40,059 | ) |
Total changes in financing cash flows | (15,982 | ) | | (10,949 | ) | | (42,735 | ) | | (69,666 | ) |
Effect of changes in exchange rates | 484 | | | (53 | ) | | - | | | 431 | |
Other changes - related to liabilities | | | | | | | | | | | |
Capital increase (Note 18.a) | - | | | - | | | (43,500 | ) | | (43,500 | ) |
Partial spin-off (Note 1.a) | - | | | - | | | 213 | | | 213 | |
New leases | - | | | 6,496 | | | - | | | 6,496 | |
Interest expense | 1,928 | | | 6,135 | | | - | | | 8,063 | |
Interest paid�� | (1,912 | ) | | (6,129 | ) | | - | | | (8,041 | ) |
Other borrowing costs | 1,043 | | | - | | | - | | | 1,043 | |
Total other changes related to liabilities | 1,059 | | | 6,502 | | | (43,287 | ) | | (35,726 | ) |
Total other changes related to equity | - | | | - | | | 37,629 | | | 37,629 | |
Balance as of December 31, 2019 | 27,849 | | | 77,393 | | | 36,937 | | | 142,179 | |
CI&T Inc.
Consolidated financial statements
December 31, 2021
Loans and borrowings covenants
The loans and borrowings described above are subject to covenants, which establish the early maturity of debts. Early maturity of the loans could be caused by:
| — | Disposal, merger, incorporation, spin-off, or any other corporate reorganization process that implies a change in the shareholding control, except for the prior consent from the creditor, and if it does not affect the liquidity capacity of this instrument. During 2021, due to corporate reorganization as mentioned in the note 1.a, the Company obtained the necessary waivers from financial creditors. |
| — | Failure to send the annual financial statements within 180 days of the fiscal year-end. |
| — | Public notice of default before a relevant notary office, in the amount of R$500, unless it has been proved to the creditor that the public note was issued due to a third-party mistake or bad faith, the public note of default was canceled, or the payment of the relevant debt was deposited in court within 30 days from such public notice default |
The Group has complied with these covenants as of December 31, 2021 and December 31,2020.
17 Salaries and welfare charges
| December 31, 2021 |
|
| December 31, 2020 |
|
| December 31, 2019 |
|
|
| Salaries | 31,342 |
|
| 15,258 |
|
| 10,311 |
|
|
Accrued vacation and charges | 83,750 |
|
| 50,064 |
|
| 33,983 |
|
|
Bonus | 72,810 |
|
| 52,312 |
|
| 26,015 |
|
|
Withholding income tax | 20,604 |
|
| 10,604 |
|
| 7,519 |
|
|
Payroll charges (social contributions) | 18,124 |
|
| 5,929 |
|
| 4,051 |
|
|
Others | 7,543 |
|
| 7,627 |
|
| 6,029 |
|
|
Total | 234,173 |
|
| 141,794 |
|
| 87,908 |
|
|
CI&T Inc.
Consolidated financial statements
December 31, 2021
The table below shows the movement of the bonus accrual:
2021 |
|
| Balance as of January 1, 2021 |
|
| Addition |
|
| Payment |
|
| Effect of movements in exchange rates |
|
| Balance as of December 31, 2021 |
|
Bonus | 52,312 |
|
| 65,603 |
|
| (50,402 | ) |
| 5,297 |
|
| 72,810 |
|
2020 |
|
| Balance as of January 1, 2020 |
|
| Addition |
|
| Payment |
|
| Effect of movements in exchange rates |
|
| Balance as of December 31, 2020 |
|
Bonus | 26,015 |
|
| 51,916 |
|
| (28,667 | ) |
| 3,048 |
|
| 52,312 |
|
2019 | |
| Balance as of January 1, 2019 | | | Addition | | | Payment | | | Effect of movements in exchange rates | | | Balance as of December 31, 2019 | |
Bonus | 20,466 | | | 26,033 | | | (21,024 | ) | | 540 | | | 26,015 | |
18 Accounts payable for business combination
| December 31, 2021 |
|
Remaining acquisition cost | 48,817 |
|
Retained amount | 30,000 |
|
Other | 6,909 |
|
Total | 85,726 |
|
Current | 48,923 |
|
Non-current | 36,803 |
|
Total | 85,726 |
|
The table below shows the movement of the accounts payable for business combination:
| 2021 |
|
| Balance as of August 10, 2021 (Note 2) |
|
| Monetary adjustment |
|
| Payment |
|
| Balance as of December 31, 2021 |
|
Accounts payable for business combination (note 9) | 133,573 |
|
| 3,091 |
|
| (50,938 | ) |
| 85,726 |
|
The subsidiary to CI&T Brazil paid R$ 50,938 on December 2, 2021 upon anticipation of part of the remaining balance due to the Company completing its Initial Public Offering in 2021.
CI&T Inc.
Consolidated financial statements
December 31, 2021
19 Provisions
The Group is involved in tax and labor lawsuits that were considered probable losses and are provisioned according to the table below:
| Balance as of January 1, 2020 |
|
| Provisions |
|
| Reversal |
|
| Balance as of December 31, 2020 |
|
| Provisions |
|
| Balance as of December 31, 2021 |
|
Tax | 10 |
|
| 1 |
|
| - |
|
| 11 |
|
| 120 |
|
| 131 |
|
Labor | 163 |
|
| 12 |
|
| (25 | ) |
| 150 |
|
| 352 |
|
| 502 |
|
Total Provisions | 173 |
|
| 13 |
|
| (25 | ) |
| 161 |
|
| 472 |
|
| 633 |
|
The main labor lawsuits referred to above refer to the compliance with minimum quota of employees with disabilities and lack of control over working hours.
As of December 31, 2021, the Group’s judicial deposits totaled R$3,079 (R$3,083 as of December 31, 2020), recognized in the statement of financial position, in non-current assets. Of this amount, R$2,933 (R$2,932 as of December 31, 2020) refer to tax lawsuits, R$142 (R$151 as of December 31, 2020) refer to labor lawsuits and R$4 refers to civil lawsuits.
Additionally, the Group is a party to civil, labor and tax lawsuits, whose likelihood of loss is regarded as possible, for which 0 provision was recorded, in the amount of R$4,292 as of December 31, 2021 (R$215 as of December 31, 2020) of which R$ 4,093 related to lawsuits assumed in the business combination with Dextra Group.
The significant lawsuits assessed as possible loss refer to:
| (i) |
| The labor infraction notices that addresses the hiring of employees with disabilities. The Group filed an administrative defense, but the notice was maintained. In February 2019, the Group appealed at administrative level and is awaiting the review. |
| (ii) |
| Tax lawsuits related to non-contribution tax credits referring to payroll in the period from January 1 to December 31, 2011. |
| (iii) |
| Civil lawsuit regarding an employee claiming alleged breach of employment contract by Dextra, therefore, requiring receipt of double amounts (undue refund). |
20 Employee benefits
The Group provides its employees with benefits that include medical care, dental care and life insurance during their employment. These benefits are paid by the Group and according to the category of health plans elected, with a consideration paid by the employee.
Additionally, the Group offers its employees the option to adhere to a private pension plan to which voluntary contributions are made. For CI&T Brazil, the contributions are made exclusively by the participants; for CI&T US, CI&T UK and CI&T Canada the companies contribute with the same amount as the participants up to 4% of the employee salary. In both scenarios there is 0 consideration to be paid by the subsidiaries, as there are 0 post-employment obligations. The nature of the plan allows employees to suspend or discontinue their contributions at any time and allows the Management to transfer the portfolio to another administrator.
The Group does not have additional post-employment obligations and NaN other long-term benefits, such as time-of-service leave, lifetime health plan and other time-service benefits.
CI&T Inc.
Consolidated financial statements
December 31, 2021
21 Stock option plan
a. Plan in force
On March 30, 2020, the Board of Directors approved the 1st and 2nd stock option programs and, on February 26, 2021, approved the 3rd and 4th stock option programs, through which selected executives were granted options that confer the right to exercise the stock purchase, subject to certain conditions under the “Stock Option Plan”, with the option to settle in equity and cash.
On October 29, 2021, in connection with a restructuring pursuant to which the Company became the holding company of the CI&T Group for the purpose of an initial public offering (see note 1.a), the Board of Directors approved the migration of the plan from the subsidiary CI&T Brazil to the Company. The Company recognized to the rights of each participant accrued under the corresponding plan and related programs and shall assume all obligations of CI&T Software under such plan.
The options already granted become options granted under the CI&T Cayman Plan, provided that each option shall confer the right to acquire 1 class A common share issued by Company.
Considering that the number of shares forming Company’s capital stock is approximately 68.14 times the number of shares forming the subsidiary CI&T Brazil, the number of granted options and the exercise price were adjusted in the same proportion.
According to the above restructuring, the Company remeasured the fair value of the stock options granted, both of the Company and of the subsidiary CI&T Brazil on the date of the plan migration. The remeasurement to fair value of the stock options granted was immaterial.
Stock option program (equity settled)
The following are the general conditions of the Group’s stock option plan:
Characteristics of the plans: |
|
|
| Equity-settled |
|
|
|
| 1st and 2nd Program | |
| 3rd Program |
| 4th Program | |
Grant date | 01/04/2020 | |
| 01/04/2021 |
| 01/04/2021 | |
Exercise Period: | 6.8 years | (i) |
| 5.8 years |
| 5.8 years | (i) |
Exercise | 0 - | (i) |
| 0 - |
| 0 - | (i) |
Limit date | 01/01/2027 | (i) |
| 01/01/2027 |
| 01/01/2027 | (i)
|
| | |
| |
| | |
Activity of stock option number | | |
| |
| | |
(+) Total number of granted options | 3,940,478 | |
| 666,616 |
| 187,820 | |
(-) Canceled options | 78,360 | |
| |
| 19,900 | |
(=) Number of options not exercised | 3,862,118 | (ii) |
| 666,616 |
| 167,920 | (ii) |
(=) Number of outstanding options on 12/31/2021 | 3,862,118 | |
| 666,616 |
| 167,920 | |
(=) Number of exercisable options on 12/31/2021 | 1,244,994 | |
| - |
| - | |
| | |
| |
| | |
Inputs used in the measurement | | |
| |
| | |
Exercise price (in reais) | 9.58 | (ii) |
| 19.84 |
| 19.84 | (ii) |
Share price on the grant date (in reais) | 21.68 | (v) |
| 21.68 |
| 21.68 | (v) |
Volatility (% p.a.) | 24.19% | (iv) |
| 27.73% |
| 27.73% | (iv) |
Interest rate (% p.a.) | 1.53% | |
| 2.66% |
| 2.66% | |
Option value (in reais) | 0.48 | (iii) |
| 1.81 |
| 1.85 | (iii) |
Remaining average term (expected lifetime) | 3.7 years | (vi) |
| 4.3 years |
| 4.3 years | |
| | |
| |
| | |
Effects on income for the year: | | |
| |
| | |
Total expense attributed to the granting of options (R$) | 1,846 | |
| 1,275 |
| 298 | |
Expenses incurred until December 31, 2020 (R$) | 142 | |
| - |
| - | |
Expenses incurred until December 31, 2021 (R$) | 668 | |
| 251 |
| 48 | |
Expenses to incur | 1,036 | |
| 1,024 |
| 250 | |
CI&T Inc.
Consolidated financial statements
December 31, 2021
| (i) | Conditional upon the grace period and assuming the possibility of anticipated vesting in face of a liquidity event. |
(ii)
| Price established was based on valuation at the time the options are granted. |
| (ii) | Fair value based on the Black-Scholes method. |
(iv)
| The expected volatility was estimated based on the historical volatility of the comparable Companies share price. |
| (v) | The share price was determined based on valuation prepared by the Group on the date of plan migration |
| (vi) | Average calculated considering that, according to the definition of the plan, 25% of the options can be exercised before the vesting period. |
The Board of Directors is entitled to select the participants of the program, at its sole discretion, among the Management, executives, employees and service providers of the Company and its subsidiaries. Additionally, the Board of Directors defines the terms of each program, when the option granted to the participants will become eligible for exercise (“vesting period”), including the possibility of anticipating the vesting period.
The fair value of the stock options granted is estimated on the grant date, based on the Black-Scholes model, which considers the terms and conditions for granting the shares.
On October 29, 2021, as a result of the corporate reorganization, the exercise price of the options changed from R$653.21 to R$9.58 for the 1st and 2nd programs and changed from R$1,352.00 to R$19.84 for the 3rd and 4th programs, to be updated according to the official national price index (IPCA / IBGE). The participants must pay the exercise price in cash and the program does not provide for alternatives for paying cash back to participants.
In the year ended on December 31, 2021, the Group recognized in the statement of profit or loss an amount of R$967 (R$142 as of December 31, 2020), see details in item “e”.
b. Stock option program (settled in cash)
Due to the corporate reorganization as described in item “a”, the stock option program settled in cash was also migrated from the subsidiary CI&T Brazil to the Company. The number of granted options was proportionally adjusted by the equivalent of the Company's shares.
The amount to be settled in cash is based on the increase of the Group’s share price between the grant date and the exercise date.
| Payable in cash | | | |
Granting date | 04/2020 | | 10/2021 | |
Exercise Period: | 6.8 years | (i) | 5.2 years | (i) |
Exercise Date | 0 - | (i) | 0 - | (i) |
Limit date for exercising the options | 01/01/2027 | (i) | 01/01/2027 | (i) |
Total number of options granted | 69,774 | | 12,130 | |
Liabilities carrying amount as of December 31, 2021 | 1,307 | | 52 | |
| (i) | Conditional upon the grace period and assuming the possibility of anticipated vesting in face of a liquidity event. |
CI&T Inc.
Consolidated financial statements
December 31, 2021
c. Canceled plans
On August 31, 2013, the Group approved the stock option plan, through which the executive officers elected by the Board of Directors were granted the possibility of acquisition of the Company’s shares, subject to certain conditions (“Stock Option Plan”).
The Extraordinary Shareholders’ Meeting (“EGM”), held on November 13, 2019, approved the cancellation of all programs and contracts of the Group’s Stock Option Plan, approved at the Company’s Extraordinary Shareholders’ Meeting of May 31, 2013, so that all options to purchase the shares issued by the Group granted to beneficiaries, exercisable or not, were canceled, with no effect for all legal purposes. On November 13, 2019, the Group unilaterally canceled the share-based payment plan, according to the EGM held on that date.
On December 19, 2019, at the Board of Directors’ meeting, the Group and the beneficiaries of the extinguished plan approved the Transaction and Settlement Agreement and Other Covenants, which includes the indemnities to be paid in the amount of R$44,000, granting full discharge to the Group of any right related to the Plan.
In 2020, the agreements were ratified and paid, in the total amount of R$43,354. The remaining amount, of R$628, was approved and paid in July 2021.
d. Shares granted to executive officers
In August, 2017 the Company granted to the former controlling shareholders of the subsidiary Comrade, Inc. (later merged into CI&T, Inc.) the right to receive 16,530 shares. Comrade’s shareholders became executives of the Group, and the granting of the shares is conditioned to continuing employment in the Group for a period of four years from the acquisition date of Comrade. The fair value of the shares was estimated on the acquisition date of the subsidiary, using the “Black-Scholes” pricing model, in the amount of R$5,120.
As of December 31, 2021, the impact on profit or loss totaled R$246 (R$751 as of December 31, 2020), see details below in item “e” – expenses recognized in profit or loss.
On October 8, 2021, the executive officers exercised the options through the issuance of 16,530 new common shares, with 0 par value, at the total issuance price of R$28,697, subscribed by McMillian Family Trust. The subscribed shares were paid through the transfer of 15,896 shares issued by the subsidiary CI&T Inc to the subsidiary CI&T Brazil.
e. Expenses recognized in profit or loss
| December 31, 2021 | |
| December 31, 2020 |
|
| December 31, 2019 |
|
Plan in force: | | |
| |
|
|
|
|
Equity settled | 967 | |
| 142 |
|
| - |
|
Cash settled | 1,318 | |
| 41 |
|
| - |
|
| Canceled plan | - |
|
| - |
|
| 1,677 |
|
Shares granted to executives’ officers | 246 | |
| 751 |
|
| 1,522 |
|
Expenses recognized in profit or loss (note 24) | 2,531 | |
| 934 |
|
| 3,199 |
|
Other effects in shareholders’ equity | 1,282 | |
| 1,751 |
|
| - |
|
Total | 3,813 | |
| 2,685 |
|
| 3,199 |
|
(-) Effect of cash settled | (1,318 | ) |
| (41 | ) |
| - |
|
Effect of movements in exchange rates | 3 | |
| 8 |
|
| (29 | ) |
Total shareholders’ equity | 2,498 | |
| 2,652 |
|
| 3,170 |
|
CI&T Inc.
Consolidated financial statements
December 31, 2021
22 Equity
a. Share capital
| December 31, 2021 |
|
| December 31, 2020 |
|
| Number of ordinary nominative shares | 132,197,896
|
|
| 121,086,781 |
|
| Par value (i) | 0.00027 |
|
| 0.56958 |
|
Share capital | 36 |
|
| 68,968 |
|
(i) In November 2021 the Group’s shareholders approved a capital stock share split with a 1:68.14 share split ratio. As a result of the share split, the Group’s historical financial statements have been revised to reflect the number of shares and per share data as if the share split had been in effect for all periods presented.
As at December 31, 2021, after all the corporate restructuring for purposes of the registration of the Company’s common shares in connection with the IPO (see note 1.a), the Company’s share capital is R$ 36 represented by 132,197,896 common shares. Those common shares are represented by 15,000,000 Class A common shares and 117,197,896 Class B common shares. As at December 31, 2020 the CI&T Brazil’s share capital consists of 121,086,781 common shares, in the total amount of R$ 68,968.
The holders of the Class A common shares and Class B common shares have identical rights, except that (i) the holders of Class B common shares are entitled to 10 votes per share, whereas holders of Class A common shares are entitled to 1 vote per share, (ii) Class B common shares have certain conversion rights and (iii) the holders of Class B common shares are entitled to maintain a proportional ownership interest in the event that additional Class A common shares are issued, however that such rights to purchase additional Class B common shares may only be exercised with Class B Shareholder Consent.
At the Annual and Extraordinary General Meeting held on May 31, 2019 and Extraordinary General Meeting held on July 31, 2019, the shareholders approved the capitalization of the share redemption reserve in the amount of R$ 43,500.
Before capitalization the share capital was 30,098. Therefore, the Company’s share capital increased to R$ 73,598 without the issuance of new shares.
The “Extraordinary Shareholders’ Meeting” of July 31, 2019, also approved the partial spin-off of the subsidiary Sensedia SA, in the amount of R$ 4,630, according to note 1.a, which resulted in a decrease in share capital from R$ 73,598 to R$ 68,968, through the cancellation of 59,546 ordinary shares.
b. Share premium
The share premium refers to the difference between the subscription price (US$15.00 per share) that the shareholders paid for the shares and their nominal value (US$0.00005 per share), as a total amount of R$915,947 (US$166,666).
c. Capital reserve
Corporate Restructuring
As described in note 1.a above, CI&T completed its corporate restructuring in November 2021. CI&T Brazil ceased to be ultimate parent company, and CI&T (non-operating holding company) became the ultimate parent company. This transaction occurred through the transfer of the shares of its shareholders from CI&T Brazil to CI&T Delaware and, subsequently, to CI&T, which result in the capital increase of 121,086,781 shares at par value of R$ 0.00027 per share, in the amount of R$ 33, and the remaining amount of R$ 88,206 was recorded as capital reserve.
Share-based compensation
The Group a share-based compensation plans that are accounted as Capital reserve per a total amount of R$ 2,498 (see note 21).
CI&T Inc.
Consolidated financial statements
December 31, 2021
Share issuance costs
The Company incurred incremental costs directly attributable to the public offering in the amount of R$ 66,876, net of taxes, recorded in the Capital reserve.
d. Earnings reserves
| December 31, 2021 |
|
| December 31, 2020 |
|
| December 31, 2019 |
|
Retained earnings reserve | 125,957 |
|
| 95,515 | |
| 23,979 |
|
The application of earnings reserves will be decided at the Annual and Extraordinary Shareholders’ Meeting.
e. Dividends and interest on shareholders’ equity
The dividends and interest on shareholder´s equity mentioned below occurred before the corporate reorganization. As of December 31, 2021, the Company had 0 dividends liability.
On April 30, 2021, the Shareholders’ Meeting and Extraordinary Shareholders’ Meeting of CI&T Brazil approved:
| | • | the payment for interest on equity up to the annual limit of R$6,288; |
| | •
| the distribution of additional dividends on profit for the year ended 2020 in the amount of R$40,363. As of June 28, 2021, the Company paid the amount of R$71,040 related to the profit for the year ended 2020. Dividends declared and paid totaled R$17.60 per common share of the subsidiary in 2020. |
Additionally, on October 8, 2021, the Extraordinary Shareholders’ Meeting of CI&T Brazil approved the distribution of additional dividends on profit for the year ended 2020, in the amount of R$55,005, equivalent to R$ 31.24 per common share of the subsidiary in 2020.
In May 31, 2019 the Extraordinary General Meeting approved the additional distribution of dividends, relating to the profits for the year 2018, in the amount of R$ 11,119 and the distribution of dividends from the retained earnings, in the amount of R$ 15,448, totaling a distribution of R $ 26,567.
f. Other comprehensive income
Accumulated translation adjustments include all foreign currency translation differences on investments abroad.
g. Stock redemption reserve
According to the Annual and Extraordinary Shareholders’ Meeting held on May 31, 2019 and on July 31, 2019, the shareholders approved the capitalization of the share redemption reserve in the amount of R$ 43,500.
CI&T Inc.
Consolidated financial statements
December 31, 2021
23 Net revenue
The Group generates revenue primarily through the provision of services described in the table below, which is summarized by nature:
| December 31, 2021 |
|
| December 31, 2020 |
|
| December 31, 2019 |
|
Software development revenue | 1,394,583 |
|
| 891,012 |
|
| 597,457 |
|
Software maintenance revenue | 30,026 |
|
| 31,133 |
|
| 37,634 |
|
Revenue from software license agent | 1,637 |
|
| 2,413 |
|
| 7,005 |
|
Consulting revenue | 15,922 |
|
| 28,601 |
|
| 25,942 |
|
Other revenue | 2,212 |
|
| 3,360 |
|
| 9,095 |
|
Total net revenue | 1,444,380 |
|
| 956,519 |
|
| 677,133 |
|
The following table sets forth the net revenue by industry vertical for the periods indicated:
. | December 31, 2021 |
|
| December 31, 2020 |
|
| December 31, 2019 |
|
By Industry Vertical | |
|
| |
|
|
|
|
Financial services | 487,177 |
|
| 324,118 |
|
| 231,813 |
|
Food and beverages | 340,709 |
|
| 244,590 |
|
| 116,911 |
|
Pharmaceuticals and cosmetics | 206,375 |
|
| 134,763 |
|
| 85,410 |
|
Technology, media, and telecom | 169,311 |
|
| 81,961 |
|
| 92,113 |
|
Retail and manufacturing | 93,871 |
|
| 83,046 |
|
| 65,130 |
|
Education and services | 64,336 |
|
| 41,323 |
|
| 21,042 |
|
Others | 82,600 |
|
| 46,718 |
|
| 64,714 |
|
Total net revenue | 1,444,380 |
|
| 956,519 |
|
| 677,133 |
|
Performance obligations and revenue recognition policies
The revenue is measure based on the consideration specified in the contract with the client. The Group recognizes revenue when it transfers control over the product or service to the customer.
The table below provides information on the nature and timing of performance obligations in contracts with customers, including the revenue recognition policies listed in the main types of services:
CI&T Inc.
Consolidated financial statements
December 31, 2021
| Type of service | Nature and timing of performance obligations | Revenue recognition in accordance with IFRS 15 |
Services provision:
- software development;
- software maintenance;
- consultancy. | The Group has determined that the customer controls all work in progress as the services are provided. This is because, according to these contracts, services are provided according to the client’s specifications and, if a contract is terminated by the client, the Group will be entitled to reimbursement of the costs incurred to date, including a reasonable margin. Invoices are issued in accordance with contractual terms and are usually paid on average in 70 days. Unbilled amounts are presented as contract assets. | The associated revenue and costs are recognized over time. The progress of the performance obligation is measured based on the hours incurred. |
| Software License Agency | The Group acts as an agent in software license agreements between the developer and the customer. Invoices (related to agency fees) are issued in accordance with the contractual terms and are generally paid on average within 45 days. | Revenue related to fees as agent is recognized when contracts are entered into. |
Contract assets
Contract assets relate mainly to the Group’s rights to consideration for services performed, for which control has been transferred to the client, but not invoiced on the reporting date. Contract assets are transferred to receivables when the Group issues an invoice to the client.
The balances from contract assets are shown and segregated in the statement of financial position as follows:
. | December 31, 2021 |
|
| December 31, 2020 |
|
Local market | 80,107 |
|
| 35,364 |
|
Foreign market | 55,194 |
|
| 15,936 |
|
(-) Expected credit losses from contract assets | (913 | ) |
| (675 | ) |
Total | 134,388 |
|
| 50,625 |
|
The movement of expected credit losses of contract assets, is as follows:
Balance as of January 1, 2020 | (805 | ) |
Reversal | 218 |
|
Effect of movements in exchange rates | (88 | ) |
Balance as of December 31, 2020 | (675 | ) |
(Provision) | (217 | ) |
Effect of movements in exchange rates | (21 | ) |
Balance as of December 31, 2021 | (913 | ) |
CI&T Inc.
Consolidated financial statements
December 31, 2021
24 Expenses by nature
Information on the nature of expenses recognized in the consolidated statement of profit or loss is presented below:
. | December 31, 2021 |
|
| December 31, 2020 |
|
| December 31, 2019 |
|
Employee expenses | (1,010,989 | ) |
| (628,699 | ) |
| (453,872 | ) |
Third-party services and other inputs | (65,023 | ) |
| (55,660 | ) |
| (36,179 | ) |
Short-term leases | (5,922 | ) |
| (4,669 | ) |
| (4,165 | ) |
Travel expenses | (4,156 | ) |
| (8,656 | ) |
| (25,891 | ) |
Depreciation and amortization (a) | (48,354 | ) |
| (29,882 | ) |
| (25,577 | ) |
Stock options (b) (note 21) | (2,531 | ) |
| (934 | ) |
| (3,199 | ) |
Consulting (c) | (9,177 | ) |
| (446 | ) |
| (858 | ) |
Expected credit loss | (497 | ) |
| (196 | ) |
| (1,091 | ) |
Impairment of intangible assets (note 14) | (21,895 | ) |
| - |
|
| - |
|
Surplus of indemnity | - |
|
| 18 |
|
| (14,891 | ) |
Other costs and expenses | (31,230 | ) |
| (19,151 | ) |
| (19,701 | ) |
Total | (1,199,774 | ) |
| (748,275 | ) |
| (585,434 | ) |
Disclosed as: | |
|
| |
|
|
|
|
Costs of services provided | (935,732 | ) |
| (600,866 | ) |
| (448,979 | ) |
Selling expenses | (89,654 | ) |
| (65,093 | ) |
| (44,802 | ) |
General and administrative expenses | (151,681 | ) |
| (81,161 | ) |
| (81,197 | ) |
Research and technological innovation expenses | (4 | ) |
| (3,462 | ) |
| (12,093 | ) |
Impairment loss on trade receivables and contract assets | (497 | ) |
| (196 | ) |
| (1,091 | ) |
Other income (expenses) net | (22,206 | ) |
| 2,503 |
|
| 2,728 |
|
Total | (1,199,774 | ) |
| (748,275 | ) |
| (585,434 | ) |
(a) Depreciation and amortization in the total amount of R$48,354 (R$29,882 as of December 31, 2020 and R$25,577 as of December 31, 2019) include R$31,884 (R$24,085 as of December 31, 2020 and R$19,527 as of December 31, 2019) classified as cost of services and R$16,470 (R$5,797 as of December 31, 2020 and R$6,050 as of December 31, 2019) as expenses.
(b) Stock options in the total amount of R$2,531 (R$934 as of December 31,2020 and R$3,199 as of December 31, 2019) include R$1,930 (R$139 as of December 31, 2020 and R$626 as of December 31, 2019) classified as cost of services and R$601 (R$795 as of December 31, 2020 and R$2,573 as of December 31, 2019) as expenses.
(c) Consulting expenses in the total amount of R$9,177 (R$446 as of December 31, 2020 and R$858 as of December 31, 2019) include R$6,957 (R$446 as of December 31, 2020 and R$858 as of December 31, 2019) for acquisitions and R$2,220 referring to costs directly attributable to secondary public share offerings.
CI&T Inc.
Consolidated financial statements
December 31, 2021
24.1 Other income (expenses), net
. | December 31, 2021 |
|
| December 31, 2020 |
|
| December 31, 2019 |
|
Costs attributable to secondary offer | (2,220 | ) |
| - |
|
| - |
|
Impairment of intangible assets (note 14) | (21,895 | ) |
| - |
|
| - |
|
Government grant | 2,481 |
|
| 1,571 |
|
| 3 |
|
Other | (572 | ) |
| 932 |
|
| 2,725 |
|
Total | (22,206 | ) |
| 2,503 |
|
| 2,728 |
|
25 Net finance costs
. | December 31, 2021 |
|
| December 31, 2020 |
|
| December 31, 2019 |
|
Finance income: | |
|
| |
|
|
|
|
Income from financial investments | 4,321 |
|
| 2,626 |
|
| 2,372 |
|
Foreign-exchange gain | 46,302 |
|
| 28,135 |
|
| 12,489
|
|
Gains on derivatives | 18,585 |
|
| 16,652 |
|
| 8,775 |
|
Interest received | 99 |
|
| 170 |
|
| 43 |
|
Other finance income | 509 |
|
| 225 |
|
| 265 |
|
| 69,816 |
|
| 47,808 |
|
| 23,944 |
|
Finance costs: | |
|
| |
|
|
|
|
Exchange variation loss | (49,237 | ) |
| (20,080 | ) |
| (11,254 | ) |
Loss on derivatives | (18,112 | ) |
| (31,575 | ) |
| (8,802 | ) |
Interest and charges on loans and leases (note 16) | (29,729 | ) |
| (10,304 | ) |
| (8,063 | ) |
Bank guarantee expenses | (17 | ) |
| (17 | ) |
| (263 | ) |
| Commissions and brokerage | (2,598 | ) |
| - |
|
| - |
|
Negative monetary variation | (3,092 | ) |
| - |
|
| - |
|
Other finance costs | (1,263 | ) |
| (1,285 | ) |
| (1,473 | ) |
| (104,048 | ) |
| (63,261 | ) |
| (29,855 | ) |
Net finance costs | (34,232 | ) |
| (15,453 | ) |
| (5,911 | ) |
CI&T Inc.
Consolidated financial statements
December 31, 2021
26 Income tax and social contribution
Income tax and social security contribution recognized in profit or loss for the year are shown as follows:
. | December 31, 2021 |
|
| December 31, 2020 |
|
| December 31, 2019 |
|
Current income tax and social security contribution | (95,375 | ) |
| (66,912 | ) |
| (39,457 | ) |
Deferred income tax | 10,958 |
|
| 1,775 |
|
| 10,238 |
|
Income tax and social contributions | (84,417 | ) |
| (65,137 | ) |
| (29,219 | ) |
The reconciliation of the effective rate with the average nominal rate is shown as follows:
. | December 31, 2021 |
|
| December 31, 2020 |
|
| December 31, 2019 |
|
Profit before income tax and social contribution | 210,374 |
|
| 192,791 |
|
| 85,788 |
|
Combined income tax and social contribution rate | 34 | % |
| 34 | % |
| 34 | % |
Tax using the Company’s domestic tax rate | (71,527 | ) |
| (65,549 | ) |
| (29,168 | ) |
Interest on own capital | 2,138 |
|
| 1,469 |
|
| - |
|
Expected income tax expense and interest on own capital | (69,389 | ) |
| (64,080 | ) |
| (29,168 | ) |
Tax incentives | - |
|
| 219 |
|
| 346 |
|
| Impairment loss (intangible) | (6,864 | ) |
| - |
|
| - |
|
Other permanent exclusions (additions) | (8,164 | ) |
| (1,276 | ) |
| (397 | ) |
Income Tax and Social Contribution Expenses | (84,417 | ) |
| (65,137 | ) |
| (29,219 | ) |
Current | (95,375 | ) |
| (66,912 | ) |
| (39,457 | ) |
Deferred | 10,958 |
|
| 1,775 |
|
| 10,238 |
|
| (84,417 | ) |
| (65,137 | ) |
| (29,219 | ) |
| |
|
| |
|
|
|
|
Effective rate | 40 | % |
| 34 | % |
| 34 | % |
Amounts recognized directly in shareholders' equity
. | December 31, 2021 |
|
| December 31, 2020 |
|
| December 31, 2019 |
|
| Cancellation of the stock option plan | - |
|
| - |
|
| 6,244 |
|
Stock option plan compensation | (147 | ) |
| 45 |
|
| - |
|
Total | (147 | ) |
| 45 |
|
| 6,244 |
|
Current | - |
|
| 8,698 |
|
| (2,556 | ) |
Deferred | (147 | ) |
| (8,653 | ) |
| 8,800 |
|
Total taxes recognized in equity | (147 | ) |
| 45 | |
| 6,244 |
|
CI&T Inc.
Consolidated financial statements
December 31, 2021
Deferred tax
The composition and changes in the deferred income tax and social contribution are described below:
December 31, 2021 |
|
. | Net balance on January 1st |
|
| Recognition in equity |
|
| Recognition in profit or loss |
|
| Other |
|
| Exchange variation effect |
|
| Net amount |
|
| Deferred tax asset |
|
| Deferred tax liabilities |
|
Provisions | 2,038 |
|
| - |
|
| (437 | ) |
| - |
|
| 76 |
|
| 1,677 |
|
| 1,739 |
|
| (62 | ) |
Salaries and welfare charges | 18,447 |
|
| - |
|
| 6,354 |
|
| - |
|
| 968 |
|
| 25,768 |
|
| 25,768 |
|
| - |
|
Lease | 2,168 |
|
| - |
|
| (41 | ) |
| - |
|
| (5 | ) |
| 2,122 |
|
| 2,122 |
|
| - |
|
Other items | (8,629 | ) |
| - |
|
| 2,630 |
|
| 6,913 |
|
| (307 | ) |
| 607 |
|
| 2,440 |
|
| (1,833 | ) |
Indemnity on stock options plan | 214 |
|
| (147 | ) |
| (67 | ) |
| - |
|
| - |
|
| - |
|
| - |
|
| - |
|
Tax loss carry amount | 914 |
|
| - |
|
| 2,519 |
|
| (1,618 | ) |
| - |
|
| 1,815 |
|
| 3,228 |
|
| (1,413 | ) |
Net tax liability (assets) | 15,152 |
|
| (147 | ) |
| 10,958 |
|
| 5,294 |
|
| 732 |
|
| 31,989 |
|
| 35,297 |
|
| (3,308 | ) |
December 31, 2020 |
|
. | Net balance on January 1st |
|
| Recognition in equity |
|
| Recognition in profit or loss |
|
| Other |
|
| Exchange variation effect |
|
| Net amount |
|
| Deferred tax asset |
|
| Deferred tax liabilities |
|
Provisions | 1,597 |
|
| - |
|
| 107 |
|
| - |
|
| 334 |
|
| 2,038 |
|
| 2,075 |
|
| (37 | ) |
Salaries and welfare charges | 10,122 |
|
| - |
|
| 7,236 |
|
| - |
|
| 1,090 |
|
| 18,447 |
|
| 18,447 |
|
| - |
|
Lease | 1,583 |
|
| - |
|
| 486 |
|
| - |
|
| 98 |
|
| 2,168 |
|
| 2,168 |
|
| - |
|
Other items | (2,435 | ) |
| - |
|
| (1,119 | ) |
| (4,956 | ) |
| (119 | ) |
| (8,629 | ) |
| 66 |
|
| (8,695 | ) |
Indemnity on stock options plan | 13,304 |
|
| (8,653 | ) |
| (4,757 | ) |
| - |
|
| 321 |
|
| 214 |
|
| 214 |
|
| - |
|
Tax loss carry amount | 806 |
|
| - |
|
| (178 | ) |
| - |
|
| 286 |
|
| 914 |
|
| 914 |
|
| - |
|
Net tax liability (assets) | 24,977 |
|
| (8,653 | ) |
| 1,775 |
|
| (4,956 | ) |
| 2,010 |
|
| 15,152 |
|
| 23,884 |
|
| (8,732 | ) |
December 31, 2019 |
|
. | Net balance on January 1st |
|
| Recognition in equity |
|
| Recognition in profit or loss |
|
| Other |
|
| Exchange variation effect |
|
| Net amount |
|
| Deferred tax asset |
|
| Deferred tax liabilities |
|
Provisions | 1,653 |
|
| - |
|
| 350 |
|
| - |
|
| (406 | ) |
| 1,597 |
|
| 1,597 |
|
| - |
|
Salaries and welfare charges | 6,643 |
|
| - |
|
| 3,447 |
|
| - |
|
| 32 |
|
| 10,122 |
|
| 10,122 |
|
| - |
|
Lease | - |
|
| - |
|
| 1,589 |
|
| - |
|
| (7 | ) |
| 1,583 |
|
| 1,583 |
|
| - |
|
Other items | (1,335 | ) |
| - |
|
| (493 | ) |
| (611 | ) |
| 4 |
|
| (2,435 | ) |
| 261 |
|
| (2,696 | ) |
Indemnity on stock options plan | - |
|
| 8,800 |
|
| 4,527 |
|
| - |
|
| (23 | ) |
| 13,304 |
|
| 13,304 |
|
| - |
|
Tax loss carry amount | - |
|
| - |
|
| 818 |
|
| - |
|
| (11 | ) |
| 806 |
|
| 806 |
|
| - |
|
Net tax liability (assets) | 6,961 |
|
| 8,800 |
|
| 10,238 |
|
| (611 | ) |
| (411 | ) |
| 24,977 |
|
| 27,673 |
|
| (2,696 | ) |
CI&T Inc.
Consolidated financial statements
December 31, 2021
27 Earnings per share
Basic and diluted earnings per share
The calculation of basic earnings per share was based on the net income attributed to holders of common shares and the weighted average number of outstanding common shares. The calculation of diluted earnings per share was based on the net income attributed to holders of common shares and the weighted average number of outstanding common shares, after adjustments for all potential diluted common shares.
| December 31, 2021 |
|
| December 31, 2020 |
|
| December 31, 2019 |
|
Numerator | |
|
| |
|
|
|
|
Profit attributable to holders of common shares | 125,957 |
|
| 127,654 |
|
| 56,534 |
|
Denominator | |
|
| |
|
|
|
|
Weighted average number of basic shares held by shareholders | 121,777,128 |
|
| 119,960,383 |
|
| 122,312,323 |
|
Earnings per share – basic | 1.03 |
|
| 1.06 |
|
| 0.46 |
|
| |
|
| |
|
|
|
|
Numerator | |
|
| |
|
|
|
|
Profit attributable to holders of common shares | 125,957 |
|
| 127,654 |
|
| 56,534 |
|
Denominator | |
|
| |
|
|
|
|
Weighted average number of diluted shares held by shareholders | 125,155,798 |
|
| 123,287,891 |
|
| 122,375,414 |
|
Net earnings per share – diluted | 1.01 |
|
| 1.04 |
|
| 0.46 |
|
Weighted average number of common shares
| December 31, 2021 |
|
| December 31, 2020 |
|
| December 31, 2019 |
|
Weighted average common shares (basic) | 121,777,128 |
|
| 119,960,383 |
|
| 122,312,323 |
|
Effect of stock options when exercised | 3,378,670 |
|
| 3,327,508 |
|
| 63,091 |
|
Weighted average number of common shares | 125,155,798 |
|
| 123,287,891 |
|
| 122,375,414 |
|
CI&T Inc.
Consolidated financial statements
December 31, 2021
28 Financial instruments and risk management
28.1 Financial instrument categories
The Group maintains operations with derivative and non-derivative financial instruments. These instruments are managed to assure liquidity and profitability. The control policy consists of monitoring the terms contracted against the terms and condition current in the market. The Company does not make investments of a speculative nature in derivatives or any other risk assets.
The estimated fair value of the Group's financial instruments considered the following methods and assumptions:
| • | Cash and cash equivalents: recognized at cost plus income earned up to the closing date of the financial statements, which approximate their fair value. |
| • | Trade receivables: arise directly from the Group's operations, classified at amortized cost, are recorded at their original values, adjusted based on the exchange rate changes, when applicable, and subject to a provision for losses. Their carrying amount is a reasonable approximation of fair value. |
| • | Loans and borrowings: classified as financial liabilities measured at amortized cost and are recorded at their contractual values. The contractual flow of loans and borrowings is adjusted to the future value of the liabilities considering the interest until maturity. |
| • | Derivative financial instruments: The Group used derivative financial instruments to manage the interest rate risk exposure. This risk arises from the possibility of the Group incurring losses because of interest rate fluctuations that increase finance costs related to loans. In April, 2021, the Group has decided to not engage in new derivative agreements to manage the foreign exchange risk exposure. Existing contracts were maintained. NDFs — non-deliverable forwards are used for operations with derivative instruments, for the discounted cash flow model for fair value calculation, with future dollar and interest assumptions obtained at B3 — Brasil, Bolsa, Balcão. |
Black and Scholes fair value statistical model is used for transactions with currency option (dollar), with future dollar and interest assumption obtained at B3.
The financial instruments were valued by calculating the present value through the use of market curves that impact the specific instrument on the calculation dates. For this, future curves of USD Libor 3M, exchange coupon, and currency quotation are used. For interest rate swaps, the present value of the asset position and the liability position, both are estimated by discounting cash flows at the interest rate of the currency in which the swap is denominated. The difference between the present value of the asset and the liability position of the swap generates its fair value.
CI&T Inc.
Consolidated financial statements
December 31, 2021
The following table shows the carrying amounts and fair values of financial assets and financial liabilities, segregated by category:
| December 31, 2021 |
|
| Amortized cost |
|
| Assets/liabilities measured at FVTPL |
|
| Total |
|
Financial assets | |
|
| |
|
| |
|
Cash and cash equivalents | 135,727 |
|
| - |
|
| 135,727 |
|
| Financial investments | 798,786 |
|
| - |
|
| 798,786 |
|
Trade receivables | 340,519 |
|
| - |
|
| 340,519 |
|
Contract assets | 134,388 |
|
| - |
|
| 134,388 |
|
Derivatives | - |
|
| 896 |
|
| 896 |
|
Other assets | 32,949 |
|
| - |
|
| 32,949 |
|
| 1,442,369 |
|
| 896 |
|
| 1,443,265 |
|
| |
|
| |
|
| |
|
Financial liabilities | |
|
| |
|
| |
|
Suppliers and other payables | 33,566 |
|
| - |
|
| 33,566 |
|
Loans and borrowings | 788,709 |
|
| - |
|
| 788,709 |
|
Lease liabilities | 81,888 |
|
| - |
|
| 81,888 |
|
Accounts payable for business combination | 85,726 |
|
| - |
|
| 85,726 |
|
Derivatives | - |
|
| 535 |
|
| 535 |
|
Contract liabilities | 13,722 |
|
| - |
|
| 13,722 |
|
Other liabilities | 15,329 |
|
| - |
|
| 15,329 |
|
| 1,018,940 |
|
| 535 |
|
| 1,019,475 |
|
| December 31, 2020
|
|
| Amortized cost |
|
| Assets/liabilities measured at FVTPL |
|
| Total |
|
Financial assets | |
|
| |
|
| |
|
Cash and cash equivalents | 162,827 |
|
| - |
|
| 162,827 |
|
Trade receivables | 196,256 |
|
| - |
|
| 196,256 |
|
Contract assets | 50,625 |
|
| - |
|
| 50,625 |
|
Derivatives | -
|
|
| 8,837 |
|
| 8,837 |
|
Other assets | 15,368 |
|
| - |
|
| 15,368 |
|
| 425,076 |
|
| 8,837 |
|
| 433,913 |
|
| |
|
| |
|
| |
|
Financial liabilities | |
|
| |
|
| |
|
Suppliers and other payables | 15,312 |
|
| - |
|
| 15,312 |
|
Loans and borrowings | 89,230 |
|
| - |
|
| 89,230 |
|
Lease liabilities | 75,228 |
|
| - |
|
| 75,228 |
|
Derivatives | - |
|
| 5,392 |
|
| 5,392 |
|
Contract liabilities | 9,987 |
|
| - |
|
| 9,987 |
|
Other liabilities | 8,856 |
|
| - |
|
| 8,856 |
|
| 198,613 |
|
| 5,392 |
|
| 204,005 |
|
CI&T Inc.
Consolidated financial statements
December 31, 2021
28.2 Financial risk management
The Group’s operations are subject to the following risk factors:
a. Market risks
The Group is exposed to market risks resulting from the normal course of its activities, such as inflation, interest rates and exchange rate changes.
Thus, the Group's operating results may be affected by changes in national economic policy, especially regarding short and long-term interest rates, inflation targets and exchange rate policy. Exposures to market risk are measured by sensitivity analysis.
a.1 Foreign currency – Exchange rate changes
Foreign currency risk is inherent to the Group’s business model. The Group’s revenue is mainly denominated in foreign currency and, therefore, is exposed to exchange rate changes. The Group’s expenses, on the other hand, are mainly denominated in the Group’s functional currency (Brazilian Reais) and, therefore, are not exposed to exchange rate changes. The Group is exposed to exchange rate risk on its Financial Investments, suppliers and other payables, trade receivables, loans and borrowings, lease liabilities and derivatives.
| December, 2021 |
|
| December, 2020 |
|
| USD |
|
| Other |
|
| USD |
|
| Other |
|
| Financial investments | 798,786 |
|
| - |
|
| - |
|
| - |
|
Suppliers and other payables | (8,763 | ) |
| (722 | ) |
| (3,057 | ) |
| (540 | ) |
Trade receivables | 233,724 |
|
| 7,273 |
|
| 160,411 |
|
| 3,855 |
|
Loans and borrowings | (266,561 | ) |
| - |
|
| (37,116 | ) |
| - |
|
| Lease liabilities | (32,159 | ) |
| (962 | ) |
| (30,307 | ) |
| - |
|
Derivatives | 361 |
|
| - |
|
| (1,321 | ) |
| - |
|
Net exposure | 725,388 |
|
| 5,589 |
|
| 88,610 |
|
| 3,315 |
|
The Group is exposed to exchange rate risk in other currencies. As it is immaterial, the Group did not carry out the sensitivity analysis.
a.2 Exchange rate risk
The Group is exposed to foreign currency risk to the extent that there is a mismatch between the currencies in which sales, purchases, receivables, and borrowings are denominated and the respective functional currencies of the Company and its subsidiaries.
a.3 Interest rate risk
Derives from the possibility of the Group incurring gains or losses resulting from changes in interest rates applicable to its financial assets and liabilities. The Group may also enter into derivative contracts in order to mitigate this risk.
Sensitivity analysis of non-derivative financial instruments
Exchange rate fluctuation and changes in interest rates may positively or adversely affect the financial statements, due to an increase or decrease in the balances of trade receivables and investments in foreign currency and the variation in the balances of financial investments and loans and borrowings.
CI&T Inc.
Consolidated financial statements
December 31, 2021
The Group mitigates its risks relating to non-derivative financial assets and liabilities substantially, through the contracting of derivative financial instruments. Accordingly, the Group identified the main risk factors that may generate losses for its operations with derivative financial instruments and this sensitivity analysis is based on three scenarios that may impact the Group’s future results and cash flows, as described below:
| (i) | Probable scenario: The Group's projections, based on internal and external data, considered: (i) the interest rate index in order to analyze the sensitivity of the index in short-term investments, whose average was 10.67% for CDI and loans and borrowings, whose average was 0.27% for Libor (only applicable for some loans and borrowings); (ii) the exchange rate of R$5.30 USD, related to the closing rate projected by the Company, for the purposes of analyzing the foreign exchange exposure. Based on these factors, variations in the adverse and remote scenarios were calculated. |
(ii)
| Adverse scenario: The adverse scenario rate is half the difference between the probable rate and the remote rate. |
| (iii) | Remote scenario: the highest projection expected by the Company for the next 12 months. |
For each scenario, the gross finance income or finance costs were calculated, excluding taxes and the maturity flow of each agreement. The base date considered was December 31, 2021, projecting the indexes for one year and verifying their sensitivity in each scenario.
Sensitivity analysis for interest rate risk
|
| Risk |
| Exposure in R$ |
| Probable scenario (i) |
|
| Adverse Scenario (ii) |
|
| Remote Scenario (iii) |
|
Short-term financial investments |
| Interest rate increase - CDI |
| 66,007 |
| 10.67 | % |
| 11.39 | % |
| 12.11 | % |
|
|
|
|
|
| 7,043 |
|
| 7,518 |
|
| 7,993 |
|
|
|
|
|
|
|
|
|
|
|
|
|
|
|
Loans and borrowings |
| Interest rate increase - CDI |
| (609,374 | ) | 10.67 | % |
| 11.39 | % |
| 12.11 | % |
|
| |
| |
| (65,020 | ) |
| (69,408 | ) |
| (73,795 | ) |
|
| |
| |
| |
|
| |
|
| |
|
Loans and borrowings |
| Interest rate increase - Libor |
| (179,333 | ) | 0.27 | % |
| 0.54 | % |
| 0.81 | % |
|
| |
| |
| (484 | ) |
| (968 | ) |
| (1,452 | ) |
Effect on earnings (reduction) |
| |
| |
| (8,367 | ) |
| (12,763 | ) |
| (17,160 | ) |
Sensitivity analysis for exchange rate risk
|
| Risk |
| Probable scenario (i) |
|
| Adverse Scenario (ii) |
|
| Remote Scenario (iii) |
|
Net exchange variation on transactions |
| |
| |
|
| |
|
| |
|
Exchange variation in the year |
| Foreign currency appreciation - USD |
| 5.30 |
|
| 5.50 |
|
| 5.70 |
|
|
| |
| |
|
| |
|
| |
|
Effect on earnings (increase) |
| |
| (5,718 | ) |
| (5,933 | ) |
| (6,378 | ) |
|
| |
| 303 |
|
| 88 |
|
| (357 | ) |
As of December 31, 2021, the Group held agreements for financial derivatives (NDFs), with the purpose of reducing exchange rate risk.
CI&T Inc.
Consolidated financial statements
December 31, 2021
b. Credit risk
Credit risk refers to the risk that a counterparty will not comply with its contractual obligations, causing the Group to incur financial losses. Credit risk is the risk of a counterparty in a business transaction not complying with an obligation provided by a financial instrument or an agreement with a client, which would cause financial loss. To mitigate these risks, the Group analyses the financial and equity condition of its counterparties, as well as the definition of credit limits and permanent monitoring of outstanding positions.
The Group applies the simplified standard approach to commercial financial assets, where the provision for losses is analyzed over the remaining life of the asset.
In addition, the Group is exposed to credit risk with respect to financial guarantees granted to banks.
The Group held cash and cash equivalents of R$ 135,727 on December 31, 2021 (2020: R$ 162,827) and financial investments of R$ 798,786 at December 31, 2021. The cash and cash equivalents and financial investments are held with bank and financial institution counterparties, which are rated BB- to A+, based on Standard & Poor’s ratings.
The carrying amount of financial assets represents the maximum credit exposure. The maximum credit risk exposure on the date of the financial statements is:
| December 31, 2021 |
|
| December 31, 2020 |
|
Hedge financial instruments (current and non-current) | 896 |
|
| 8,837 |
|
Cash and cash equivalents | 135,727 |
|
| 162,827 |
|
| Financial investments | 798,786 |
|
| - |
|
Trade receivables | 340,519 |
|
| 196,256 |
|
Contract assets | 134,388 |
|
| 50,625 |
|
Other receivables (current and non-current) | 32,949 |
|
| 15,368 |
|
At 31 December 2021, the exposure to credit risk for trade receivables, contract assets and other receivables by geographic region was as follows:
| December 31, 2021 |
|
| December 31, 2020 |
|
NAE (North America and Europe) | 297,430 |
|
| 180,522 |
|
North America | 287,992 |
|
| 179,943 |
|
Europe | 9,438 |
|
| 579 |
|
| LATAM (Latin America) | 202,528 |
|
| 75,577 |
|
| APJ (Asia, Pacific and Japan) | 7,917 |
|
| 6,150 |
|
| Total | 507,875 |
|
| 262,249 |
|
c. Liquidity risk
The Group monitors liquidity risk by managing its cash resources and financial investments.
Liquidity risk is also managed by the Group through its cash flow projection, which aims to ensure the availability of funds to meet the Group’s both operational and financial obligations.
The Group also maintains approved credit lines with financial institutions, and other indebtedness such as working capital agreements in order to adequate levels of liquidity in the short, medium and long terms.
CI&T Inc.
Consolidated financial statements
December 31, 2021
The maturities of the long-term installments of the loans are described in note 16.
The following are the remaining contractual maturities of financial liabilities on the reporting date. The amounts are gross and undiscounted, including contractual interest payments and excluding the impact of netting agreements:
| 2021 |
|
| Carrying amount |
|
| Cash contractual cash flow |
|
| 6 months or less |
|
| 6- 12 months |
|
| 1-2 years |
|
| 2-5 Years |
|
Non-derivative financial liabilities | |
|
| |
|
| |
|
| |
|
| |
|
| |
|
Trade payables | 33,566 |
|
| 33,566 |
|
| 33,566 |
|
| - |
|
| - |
|
| - |
|
Loans and borrowings | 788,709 |
|
| 974,942 |
|
| 136,161 |
|
| 88,045 |
|
| 171,022 |
|
| 579,714 |
|
Lease liabilities | 81,888 |
|
| 87,662 |
|
| 12,435 |
|
| 12,251 |
|
| 22,284 |
|
| 40,682 |
|
Accounts payable for business combination | 85,726 |
|
| 85,726 |
|
| 1,064 |
|
| 47,860 |
|
| 12,179 |
|
| 24,623 |
|
Contract liabilities | 13,722 |
|
| 13,722 |
|
| 13,722 |
|
| - |
|
| - |
|
| - |
|
Other payables (current and non-current) | 15,329 |
|
| 15,329 |
|
| 15,329 |
|
| - |
|
| - |
|
| - |
|
| Derivatives | 535
|
|
| 535 |
|
| 535 |
|
|
|
|
|
|
|
|
|
|
| 1,019,475 |
|
| 1,211,482 |
|
| 212,812 |
|
| 148,156 |
|
| 205,485 |
|
| 645,029 |
|
| 2020 |
|
| Carrying amount |
|
| Contractual cash flow |
|
| 6 months or less |
|
| 6-12 months |
|
| 1-2 years |
|
| 2-6 years |
|
Non-derivative financial liabilities | |
|
| |
|
| |
|
| |
|
| |
|
| |
|
Trade payables | 15,312 |
|
| 15,312 |
|
| 15,312 |
|
| - |
|
| - |
|
| - |
|
Loans and borrowings | 89,230 |
|
| 111,779 |
|
| 78,898 |
|
| 7,313 |
|
| 23,901 |
|
| 1,667 |
|
Lease liabilities | 75,228 |
|
| 93,242 |
|
| 11,393 |
|
| 10,470 |
|
| 19,053 |
|
| 52,326 |
|
Contract liabilities | 9,987 |
|
| 9,987 |
|
| 9,987 |
|
| - |
|
| - |
|
| - |
|
Other payables (current and non-current) | 8,856 |
|
| 8,856 |
|
| 8,856 |
|
| - |
|
| - |
|
| - |
|
| Derivatives | 5,392 |
|
| 5,392 |
|
| 1,920 |
|
| 3,472 |
|
|
|
|
|
|
|
| 204,005 |
|
| 244,568 |
|
| 126,366 |
|
| 21,255 |
|
| 42,954 |
|
| 53,993 | |
Financing Lines
Guaranteed unsecured account, reviewed annually, and paid upon request:
| December 30, 2021 |
|
| December 31, 2020 |
|
Used | - |
|
| - |
|
Not used | - |
|
| 2,200 |
|
| - |
|
| 2,200 |
|
CI&T Inc.
Consolidated financial statements
December 31, 2021
Bank credit lines
| December 30, 2021 |
|
| December 31, 2020 |
|
Used | 11,161 |
|
| 89,197 |
|
Not used | 47,434 |
|
| 61,521 |
|
| 58,595 |
|
| 150,718 |
|
The Group has credit lines for working capital with the banks HSBC and Citibank, in the amount of US$10,500 or R$58,595, at the exchange rate of 5.5805, the commercial selling rate for U.S. dollars as of December 31, 2021, as reported by the Brazilian Central Bank, partially used (note 16).
28.3 Derivative financial instruments
The Group holds derivative financial instruments to hedge its foreign currency and interest rate risk exposures. As of December 31, 2021, the Group entered into purchase and sale agreement for derivative financial instruments (NDFs) in the amount of R$(17).
Fair value estimated for derivative financial instruments contracted by the Group was determined according to information available in the market, mainly through financial institutions and specific methodologies of assessment. However, considerable judgment is necessary to understand market data in order to produce the fair value estimate for each operation. Consequently, the estimates do not necessarily indicate the amounts that will be effectively realized at settlement.
As of December 31, 2021, the Group had the following agreements for financial derivatives (NDFs):
|
| 2021 |
|
Maturity |
| Nominal value (USD) |
| Contracted rate |
| Amount in R$ |
| Market rate |
| Fair value |
|
February 25, 2022 |
| (560 | ) | 5.6220 |
| (3,148 | ) | 5.3459 |
| (17 | ) |
Total |
| |
| |
| |
| |
| (17 | ) |
|
| 2020 |
|
Maturity |
| Nominal value (USD) |
| Contracted rate |
| Amount in R$ |
| Market rate |
| Fair value |
|
June 15, 2021 |
| (3,100 | ) | 5.4928 |
| (17,064 | ) | 5.4763 |
| 968 |
|
April 15, 2021 |
| (800 | ) | 5.6345 |
| (4,508 | ) | 5.1909 |
| 353 |
|
Total |
| |
| |
| |
| |
| 1,321 |
|
The Group also uses options in order to protect exports against the risk of exchange variation. The Group may enter into zero-cost collar strategies, which consists of the purchase of a put option and the sale of a call option, contracted with the same counterparty and with a net 0 premium.
The composition of the balances involving options to buy and sell currencies is as follows:
CI&T Inc.
Consolidated financial statements
December 31, 2021
|
| 2021 |
|
Maturity |
| Nominal value (USD) |
| Contracted rate |
| Amount in R$ |
| Market rate |
| Fair value |
|
01/21/2021 - 01/17/2022 |
| 875 |
| Put option |
| 4,900 |
| 5.8257 |
| (349 | ) |
02/25/2021 - 02/25/2022 |
| 490 |
| Put option |
| 2,909 |
| 5.6490 |
| (170) |
|
|
| |
| |
| |
| |
| (519 | ) |
|
| |
| |
| |
| |
| |
|
01/21/2021 - 01/17/2022 |
| 875 |
| Call option |
| (4,900 | )
| 5.5563 |
| 298 |
|
02/25/2021 - 02/25/2022 |
| 490 |
| Call option |
| (2,909 | )
| 5.4690 |
| 196 |
|
|
| |
| |
| |
| |
| 494 |
|
|
| |
| |
| |
| |
| (25 | ) |
|
| 2020 |
|
Maturity |
| Nominal value (USD) |
| Contracted rate |
| Amount in R$ |
| Market rate |
| Fair value |
|
15/01 - 15/06/2021 |
| 1,800 |
| Call option |
| 587 |
| 5.6770 |
| (12 | )
|
31/05 - 15/12/2021 |
| 2,800 |
| Call option |
| 786 |
| 5.5656 |
| (569 | )
|
15/04 - 30/11/2021 |
| 6,900 |
| Call option |
| 2,161 |
| 5.5116 |
| (1,277 | )
|
|
| |
| |
| |
| |
| (1,858 | ) |
|
| |
| |
| |
| |
| |
|
15/01 - 15/06/2021 |
| 1,800 |
| Put option |
| (587 | )
| 5.4800 |
| 512 |
|
31/05 - 15/12/2021 |
| 2,800 |
| Put option |
| (786 | )
| 5.2425 |
| 862 |
|
15/04 - 30/11/2021 |
| 6,900 |
| Put option |
| (2,161 | )
| 5.3388 |
| 2,608 |
|
|
| |
| |
| |
| |
| 3,982 |
|
|
| |
| |
| |
| |
| 2,124 |
|
During 2021, the Group entered into an interest rate swap transaction with the purpose of hedging the exposure to variable interest rate related to the Export Credit Note – NCE with Citibank.
The interest rate profile of the Group’s interest-bearing financial instruments, as reported to the Group’s Management, is as follows:
|
| 2021 |
|
Maturity |
| Notional (USD) |
| Amount in R$ |
| Floating rate receivable |
| Fixed rate payable |
| Fair value |
|
07/16/2026 |
| 30,000 |
| 152,100 |
| 3-month LIBOR |
| 3,07% |
| 403 |
|
|
| |
| |
| |
| |
| 403 | |
28.4 Classification of financial instruments by type of measurement of fair value
The Group has financial instruments measured at fair value, which are qualified as defined below:
Level 1 - Quoted prices (unadjusted) in active markets for identical assets or liabilities that the group may have access to on the measurement date;
Level 2 - Observable information for the asset or liability, directly or indirectly, except for quoted prices included in Level 1; and
CI&T Inc.
Consolidated financial statements
December 31, 2021
Level 3 - Unobservable data for the asset or liability.
|
| Carrying amount |
|
| Fair value
|
|
|
| December 31, 2021 |
|
| December 31, 2020 |
|
| December 31, 2021 |
|
| December 31, 2020 |
|
Level 2 |
| |
|
| |
|
| |
|
| |
|
Derivatives: |
| |
|
| |
|
| |
|
| |
|
Non-Deliverable Forward - NDF |
| (17 | ) |
| 1,321 |
|
| (17 | ) |
| 1,321 |
|
Call and put option term |
| 403 |
|
| 2,124 |
|
| 403 |
|
| 2,124 |
|
Interest rate swap |
| (25 | ) |
| - |
|
| (25 | ) |
| - |
|
|
| 361 |
|
| 3,445 |
|
| 361 |
|
| 3,445 |
|
| Non-derivatives |
|
|
|
|
|
|
|
|
|
|
|
|
| Lease liabilities |
| (81,888 | ) |
| (75,228 | ) |
| (87,662 | ) |
| (93,242 | ) |
| Loans and borrowings |
| (788,709 | ) |
| (89,230 | ) |
| (974,942 | ) |
| (111,779 | ) |
|
| (870,597 | ) |
| (164,458 | ) |
| (1,062,604 | ) |
| (205,021 | ) |
|
| (870,236 | ) |
| (161,013 | ) |
| (1,062,243 | ) |
| (201,576 | ) |
Cash and cash equivalents, financial investments, trade receivables, accounts payable for business combination and suppliers and other payables were not included in the table above. The Group understands that these financial instruments have no classification, as the carrying amount of these items is a reasonable approximation of fair value.
29 Related parties
Transactions with key management personnel
The Group paid R$11,096 as of December 31, 2021 (R$9,519 as of December 31, 2020) as direct compensation to key management personnel. These amounts correspond to the executive board compensation, related social charges and short-term benefits and are recorded under line “General and administrative expenses”.
In 2020, the amount of R$43,354 was paid to the key management personnel, due to the cancellation of the Group's stock option plan as disclosed in note 21.c. The remaining amount, of R$628, was approved and paid in July 2021.
The executive officers also participate in the Group's stock option program (see note 21). For the year ended on December 31, 2021, R$99 (R$22 in 2020) were recognized in the statement of profit or loss.
The Group has 0 additional post-employment obligation, as well as 0 other long-term benefits, such as premium leave and other severance benefits. The Group also does not offer other benefits in connection with the dismissal of its Senior Management’s members, in addition to those defined by the Brazilian labor legislation in force.
30 Operating segments
Operating segments are defined based on business activities that reflect how CODM - Chief Operating Decision Maker reviews financial information for decision.
The Group's CODM is the Group's Board of Director. The CODM is in charge of the operational decisions of resource allocation and performance evaluation. The CODM considers the whole Group as a single operating and reportable segment, monitoring operations, making decisions on fund allocation and evaluating performance based on a single operating segment.
The CODM reviews relevant financial data on a consolidated basis for all subsidiaries. CODM makes decisions and regularly evaluates the performance of Group’s services as a whole in a single operational and reportable segment.
CI&T Inc.
Consolidated financial statements
December 31, 2021
The table below summarizes net revenues by geographic region:
. | December 31, 2021 |
|
| December 31, 2020 |
|
| December 31, 2019 |
|
NAE (North America and Europe) | 699,878 |
|
| 471,763 |
|
| 309,365 |
|
North America | 684,558 |
|
| 451,999 |
|
| 284,321 |
|
Europe | 15,320 |
|
| 19,764 |
|
| 25,044 |
|
LATAM (Latin America) | 694,334 |
|
| 435,987 |
|
| 332,692 |
|
APJ (Asia, Pacific and Japan) | 50,168 |
|
| 48,769 |
|
| 35,106 |
|
Total (Note 23) | 1,444,380 |
|
| 956,519 |
|
| 677,133 |
|
Net revenues by geographic area were determined based on the country where the sale was made. The net revenue from a single customer represents 20% of the Company's total net revenues as of December 31, 2021 (20% as of December 31, 2020 and 8% as of December 31, 2019).
Revenue by client concentration
The following table sets forth net revenue contributed by the top client, and top ten clients for the periods indicated:
. | December 31, 2021 |
|
| December 31, 2020 |
|
| December 31, 2019 |
|
Top client | 283,311 |
|
| 190,599 |
|
| 97,248 |
|
Top 10 clients | 913,890 |
|
| 644,722 |
|
| 417,547 |
|
Geographic information of the Group's non-current assets
The table below summarizes non-current assets, except deferred taxes, based on assets geographic location:
. | December 31, 2021 |
|
| December 31, 2020 |
|
| December 31, 2019 |
|
Brazil | 837,362 |
|
| 97,887 |
|
| 93,016 |
|
Abroad: | |
|
| |
|
|
|
|
United States of America | 38,417 |
|
| 36,010 |
|
| 32,612 |
|
Japan | 176 |
|
| 398 |
|
| 1,055 |
|
China | 2,239 |
|
| 776 |
|
| 545 |
|
Canada | 284 |
|
| 196 |
|
| - |
|
Portugal | 387 |
|
| - |
|
| - |
|
Other countries | 82 |
|
| 111 |
|
| 2 |
|
Total | 878,947 |
|
| 135,378 |
|
| 127,230 |
|
CI&T Inc.
Consolidated financial statements
December 31, 2021
31 Subsequent events
Business combination – Somo acquisition
On January 14, 2022, the Company signed a Sale and Purchase Agreement (“Agreement”) to acquire Somo Global Ltd ("Somo"), a digital product agency headquartered in the United Kingdom (“UK”), to accelerate its growth in EMEA (Europe, Midle East and Africa).
On January 27, 2022, the Company announced the completion of the Somo’s acquisition. According to the Agreement signed, the purchase price for the acquisition was R$ 341 million (US$63 million) paid in cash and 225,649 Class A common shares that were issued in connection with the transaction. The final purchase price is subject to adjustments, such as changes in working capital and net debt position. The Agreement also contemplates an earn-out clause of up to R$ 70 million (US$13 million) based on future performance.
With this acquisition, CI&T will accelerate its growth in EMEA. With offices in the UK, USA and Colombia, Somo delivers digital ambitions at pace and scale across several verticals including automotive, financial services, utilities and telecom.