Irvine, California 92618
Fund | Cost of $10,000 Investment | Costs paid as a percentage of a $10,000 investment |
CGGR | $ 46 | 0.39 % |
1 year | Since inception 1 | |
Capital Group Growth ETF (at net asset value) 2 | 35.55 % | 12.40 % |
Capital Group Growth ETF (at market price) 2 | 35.55 | 12.46 |
S&P 500 Index 3 | 28.19 | 11.18 |
Fund net assets (in millions) | $ 5,728 |
Total number of portfolio holdings | 105 |
Total advisory fees paid (in millions) | $ 14 |
Portfolio turnover rate | 22 % |
ITEM 2 - Code of Ethics
The Registrant has adopted a Code of Ethics, as of the end of the period covered by this report, applicable to the registrant's principal executive officer, principal financial officer and principal accounting officer, or persons performing similar functions. A copy of the code of ethics is available without charge at capitalgroup.com.
ITEM 3 - Audit Committee Financial Expert
The Registrant's board has determined that Leslie Stone Heisz, a member of the Registrant's audit committee, is an "audit committee financial expert" and "independent," as such terms are defined in this Item. This designation will not increase the designee's duties, obligations or liability as compared to his or her duties, obligations and liability as a member of the audit committee and of the board, nor will it reduce the responsibility of the other audit committee members. There may be other individuals who, through education or experience, would qualify as "audit committee financial experts" if the board had designated them as such. Most importantly, the board believes each member of the audit committee contributes significantly to the effective oversight of the Registrant's financial statements and condition.
ITEM 4 - Principal Accountant Fees and Services
Registrant1 | (a) Audit Fees | (b) Audit-Related Fees | (c) Tax Fees | (d) All Other Fees |
May 31, 2024 | 16,000 | None | None | None |
May 31, 2023 | 11,000 | None | None | None |
Advisor and Affiliates2 |
|
|
|
|
May 31, 2024 | Not Applicable | None | None | None |
May 31, 2023 | Not Applicable | None | None | None |
Registrant, Advisor and Affiliates3 | (g) Aggregate |
non-audit fees | |
May 31, 2024 | None |
May 31, 2023 | None |
1The audit fees represents fees billed for professional services rendered for the audit and review of the Registrant's annual financial statements. The audit-related fees represents fees billed for assurance and related services that are reasonably related to the performance of the audit or review of the Registrant's financial statements, but not reported under "audit fees". The tax fees consist of professional services relating to the preparation of the Registrant’s tax returns. The other fees represents fees, if any, billed for other products and services rendered by the principal accountant to the Registrant other than those reported under the "audit fees", "audit-related fees", and "tax fees".
2This includes only fees for non-audit services billed to the adviser and affiliates for engagements that relate directly to the operations and financial reporting of the Registrant and were subject to the pre-approval policies described below. The audit-related fees consist of assurance and related services relating to the examination of the Registrant’s transfer agent, principal underwriter and investment adviser conducted in accordance with Statement on Standards for Attestation Engagements Number 18 issued by the American Institute of Certified Public Accountants. The tax fees consist of consulting services relating to the Registrant’s investments. The other fees consist of subscription services related to an accounting research tool.
3Aggregate non-audit fees paid to the Registrant’s auditors, including fees for all services billed to the Registrant, adviser and affiliates that provide ongoing services to the Registrant. The non-audit services represented by these amounts were brought to the attention of the committee and considered to be compatible with maintaining the auditors’ independence.
(e1)(e2)(h) All audit and permissible non-audit services that the Registrant’s audit committee considers compatible with maintaining the independent registered public accounting firm’s independence are required to be pre-approved by the committee. The pre-approval requirement will extend to all non-audit services provided to the Registrant, the investment adviser, and any entity controlling, controlled by, or under common control with the investment adviser that provides ongoing services to the Registrant, if the engagement relates directly to the operations and financial reporting of the Registrant. The committee will not delegate its responsibility to pre-approve these services to the investment adviser. The committee may delegate to one or more committee members the authority to review and pre-approve audit and permissible non-audit services. Actions taken under any such delegation will be reported to the full committee at its next meeting. The pre-approval requirement is waived with respect to non-audit services if certain conditions are met. The pre- approval requirement was not waived for any of the non-audit services listed above provided to the Registrant, adviser and affiliates.
(f)Not applicable.
(i)Not applicable.
(j)Not applicable.

ITEM 5 - Audit Committee of Listed Registrants
(a) The following individuals are members of the registrant's separately designated standing audit committee established in accordance with Section 3(a)(58)(A) of the Securities Exchange Act of 1934 (15 U.S.C. 78c(a)(58)(A)):
Vanessa C. L. Chang
Jennifer C. Feikin
Pablo R. Gonzalez Guajardo
Leslie Stone Heisz
William D. Jones
(b) Not applicable
ITEM 6 - Investments
The schedule of investments is included as part of the material filed under Item 7 of this Form.
ITEM 7 - Financial Statements and Financial Highlights for Open-End Management Investment Companies
N-CSR Items 7-11
Common stocks 97.55% | Shares | Value (000) | ||
Information technology 24.14% | ||||
Microsoft Corp. | 494,819 | $205,414 | ||
Broadcom, Inc. | 116,879 | 155,279 | ||
Apple, Inc. | 299,324 | 57,545 | ||
NVIDIA Corp. | 49,401 | 54,160 | ||
Accenture PLC, Class A | 84,155 | 23,756 | ||
Texas Instruments, Inc. | 112,116 | 21,864 | ||
Applied Materials, Inc. | 94,558 | 20,337 | ||
Taiwan Semiconductor Manufacturing Co., Ltd. | 771,000 | 19,540 | ||
Salesforce, Inc. | 78,339 | 18,366 | ||
Micron Technology, Inc. | 122,935 | 15,367 | ||
Seagate Technology Holdings PLC | 133,935 | 12,488 | ||
SK hynix, Inc. | 79,942 | 10,924 | ||
Analog Devices, Inc. | 41,630 | 9,762 | ||
ASML Holding NV | 9,811 | 9,270 | ||
KLA Corp. | 12,140 | 9,221 | ||
ServiceNow, Inc.1 | 13,036 | 8,564 | ||
NICE, Ltd. (ADR)1 | 21,447 | 3,937 | ||
Intel Corp. | 9,486 | 293 | ||
656,087 | ||||
Industrials 16.39% | ||||
General Electric Co. | 393,464 | 64,977 | ||
RTX Corp. | 450,871 | 48,608 | ||
Carrier Global Corp. | 482,800 | 30,508 | ||
Airbus SE, non-registered shares | 167,121 | 28,270 | ||
TransDigm Group, Inc. | 17,284 | 23,216 | ||
General Dynamics Corp. | 74,517 | 22,338 | ||
Automatic Data Processing, Inc. | 83,457 | 20,440 | ||
Boeing Co.1 | 113,634 | 20,183 | ||
Northrop Grumman Corp. | 43,974 | 19,822 | ||
Safran SA | 80,469 | 18,694 | ||
Waste Connections, Inc. | 107,419 | 17,651 | ||
GFL Environmental, Inc., subordinate voting shares | 518,711 | 16,324 | ||
Woodward, Inc. | 80,357 | 14,987 | ||
ITT, Inc. | 85,173 | 11,318 | ||
United Rentals, Inc. | 16,730 | 11,199 | ||
TFI International, Inc. | 83,166 | 11,001 | ||
Lincoln Electric Holdings, Inc. | 55,445 | 10,887 | ||
Union Pacific Corp. | 40,078 | 9,331 | ||
Old Dominion Freight Line, Inc. | 48,695 | 8,534 | ||
GE Vernova, Inc.1 | 48,479 | 8,527 | ||
United Airlines Holdings, Inc.1 | 157,985 | 8,372 | ||
Equifax, Inc. | 32,268 | 7,467 | ||
Delta Air Lines, Inc. | 126,900 | 6,474 | ||
Waste Management, Inc. | 30,508 | 6,429 | ||
445,557 | ||||
Health care 12.45% | ||||
Abbott Laboratories | 548,357 | 56,037 | ||
UnitedHealth Group, Inc. | 104,860 | 51,945 | ||
AbbVie, Inc. | 258,825 | 41,733 | ||
Eli Lilly and Co. | 50,066 | 41,071 | ||
Danaher Corp. | 105,471 | 27,085 | ||
GE HealthCare Technologies, Inc.1 | 314,556 | 24,535 | ||
Thermo Fisher Scientific, Inc. | 41,939 | 23,821 | ||
Novo Nordisk AS, Class B | 142,089 | 19,167 | ||
Vertex Pharmaceuticals, Inc.1 | 37,845 | 17,232 | ||
Takeda Pharmaceutical Co., Ltd. | 329,200 | 8,735 | ||
Regeneron Pharmaceuticals, Inc.1 | 8,706 | 8,533 | ||
Bristol-Myers Squibb Co. | 179,025 | 7,356 | ||
Amgen, Inc. | 18,627 | 5,697 | ||
Johnson & Johnson | 37,163 | 5,451 | ||
338,398 |
Capital Group Equity Exchange-Traded Funds | 1 |
Common stocks (continued) | Shares | Value (000) | ||
Financials 11.19% | ||||
Mastercard, Inc., Class A | 129,039 | $57,689 | ||
JPMorgan Chase & Co. | 266,035 | 53,907 | ||
Visa, Inc., Class A | 89,634 | 24,422 | ||
Arthur J. Gallagher & Co. | 89,776 | 22,743 | ||
Marsh & McLennan Companies, Inc. | 109,268 | 22,682 | ||
BlackRock, Inc. | 23,833 | 18,400 | ||
Wells Fargo & Co. | 283,651 | 16,996 | ||
KKR & Co., Inc. | 155,855 | 16,028 | ||
Capital One Financial Corp. | 108,743 | 14,966 | ||
PNC Financial Services Group, Inc. | 53,984 | 8,497 | ||
State Street Corp. | 109,291 | 8,261 | ||
Global Payments, Inc. | 77,749 | 7,919 | ||
Morgan Stanley | 78,192 | 7,650 | ||
Aon PLC, Class A | 25,528 | 7,190 | ||
Corpay, Inc.1 | 23,579 | 6,311 | ||
Chubb, Ltd. | 22,223 | 6,018 | ||
Webster Financial Corp. | 103,587 | 4,581 | ||
304,260 | ||||
Communication services 10.44% | ||||
Alphabet, Inc., Class A1 | 456,007 | 78,661 | ||
Alphabet, Inc., Class C1 | 353,857 | 61,557 | ||
Meta Platforms, Inc., Class A | 217,081 | 101,340 | ||
Netflix, Inc.1 | 29,290 | 18,793 | ||
Comcast Corp., Class A | 370,159 | 14,818 | ||
Charter Communications, Inc., Class A1 | 29,832 | 8,565 | ||
283,734 | ||||
Consumer discretionary 8.33% | ||||
Amazon.com, Inc.1 | 468,558 | 82,672 | ||
Hilton Worldwide Holdings, Inc. | 99,271 | 19,914 | ||
Royal Caribbean Cruises, Ltd.1 | 124,292 | 18,356 | ||
InterContinental Hotels Group PLC | 139,259 | 14,019 | ||
Restaurant Brands International, Inc. | 203,898 | 13,983 | ||
Churchill Downs, Inc. | 101,262 | 13,113 | ||
Home Depot, Inc. | 39,121 | 13,101 | ||
Tesla, Inc.1 | 65,625 | 11,687 | ||
Marriott International, Inc., Class A | 44,747 | 10,344 | ||
Wyndham Hotels & Resorts, Inc. | 141,622 | 10,021 | ||
Burlington Stores, Inc.1 | 40,600 | 9,746 | ||
Chipotle Mexican Grill, Inc.1 | 3,053 | 9,554 | ||
226,510 | ||||
Consumer staples 4.33% | ||||
Philip Morris International, Inc. | 528,306 | 53,560 | ||
British American Tobacco PLC | 898,969 | 27,664 | ||
Molson Coors Beverage Co., Class B, restricted voting shares | 187,440 | 10,274 | ||
Dollar Tree Stores, Inc.1 | 86,035 | 10,148 | ||
Constellation Brands, Inc., Class A | 33,402 | 8,358 | ||
Anheuser-Busch InBev SA/NV | 123,645 | 7,730 | ||
117,734 | ||||
Utilities 3.25% | ||||
Constellation Energy Corp. | 94,480 | 20,526 | ||
PG&E Corp. | 1,053,940 | 19,540 | ||
Edison International | 225,118 | 17,300 | ||
Sempra | 139,786 | 10,768 | ||
CenterPoint Energy, Inc. | 265,935 | 8,114 | ||
Engie SA | 370,194 | 6,240 | ||
AES Corp. | 266,151 | 5,746 | ||
88,234 |
2 | Capital Group Equity Exchange-Traded Funds |
Common stocks (continued) | Shares | Value (000) | ||
Energy 2.98% | ||||
Chevron Corp. | 182,112 | $29,557 | ||
Canadian Natural Resources, Ltd. (CAD denominated) | 314,393 | 24,151 | ||
ConocoPhillips | 173,645 | 20,226 | ||
TC Energy Corp. | 183,732 | 7,085 | ||
81,019 | ||||
Materials 2.51% | ||||
Linde PLC | 44,135 | 19,222 | ||
Celanese Corp. | 99,129 | 15,071 | ||
Freeport-McMoRan, Inc. | 221,034 | 11,655 | ||
Corteva, Inc. | 170,466 | 9,536 | ||
LyondellBasell Industries NV | 73,017 | 7,259 | ||
Vale SA (ADR), ordinary nominative shares | 456,519 | 5,501 | ||
68,244 | ||||
Real estate 1.54% | ||||
VICI Properties, Inc. REIT | 714,482 | 20,512 | ||
Equinix, Inc. REIT | 17,510 | 13,360 | ||
Welltower, Inc. REIT | 76,648 | 7,946 | ||
41,818 | ||||
Total common stocks (cost: $2,203,669,000) | 2,651,595 | |||
Short-term securities 2.02% | ||||
Money market investments 2.02% | ||||
Capital Group Central Cash Fund 5.36%2,3 | 549,496 | 54,961 | ||
Total short-term securities (cost: $54,949,000) | 54,961 | |||
Total investment securities 99.57% (cost: $2,258,618,000) | 2,706,556 | |||
Other assets less liabilities 0.43% | 11,765 | |||
Net assets 100.00% | $2,718,321 |
Value at 6/1/2023 (000) | Additions (000) | Reductions (000) | Net realized gain (loss) (000) | Net unrealized appreciation (depreciation) (000) | Value at 5/31/2024 (000) | Dividend or interest income (000) | |
Short-term securities 2.02% | |||||||
Money market investments 2.02% | |||||||
Capital Group Central Cash Fund 5.36% 2 | $44,001 | $283,525 | $272,585 | $10 | $10 | $54,961 | $2,506 |
1 | Security did not produce income during the last 12 months. |
2 | Rate represents the seven-day yield at 5/31/2024. |
3 | Part of the same "group of investment companies" as the fund as defined under the Investment Company Act of 1940, as amended. |
Key to abbreviation(s) |
ADR = American Depositary Receipts |
CAD = Canadian dollars |
REIT = Real Estate Investment Trust |
Capital Group Equity Exchange-Traded Funds | 3 |
Common stocks 96.08% | Shares | Value (000) | ||
Industrials 18.94% | ||||
RTX Corp. | 75,626 | $8,153 | ||
Broadridge Financial Solutions, Inc. | 28,046 | 5,631 | ||
Airbus SE, non-registered shares | 30,497 | 5,159 | ||
Carrier Global Corp. | 79,220 | 5,006 | ||
BAE Systems PLC | 244,033 | 4,329 | ||
FedEx Corp. | 16,625 | 4,222 | ||
RELX PLC | 91,692 | 3,991 | ||
Canadian National Railway Co. (CAD denominated) | 28,848 | 3,672 | ||
Hitachi, Ltd. | 34,500 | 3,542 | ||
Ryanair Holdings PLC (ADR) | 28,084 | 3,416 | ||
Trinity Industries, Inc. | 107,877 | 3,393 | ||
Paychex, Inc. | 28,214 | 3,390 | ||
ITOCHU Corp. | 69,000 | 3,251 | ||
Northrop Grumman Corp. | 6,524 | 2,941 | ||
Mitsubishi Corp. | 133,000 | 2,794 | ||
UL Solutions, Inc., Class A1 | 63,062 | 2,432 | ||
Norfolk Southern Corp. | 10,304 | 2,316 | ||
67,638 | ||||
Financials 15.29% | ||||
CME Group, Inc., Class A | 32,736 | 6,645 | ||
Banca Generali SpA | 132,726 | 5,547 | ||
Morgan Stanley | 55,982 | 5,477 | ||
DBS Group Holdings, Ltd. | 174,670 | 4,653 | ||
London Stock Exchange Group PLC | 36,102 | 4,215 | ||
Kaspi.kz JSC (ADR) | 32,667 | 4,129 | ||
UniCredit SpA | 87,772 | 3,465 | ||
Webster Financial Corp. | 74,318 | 3,286 | ||
JPMorgan Chase & Co. | 16,096 | 3,262 | ||
Truist Financial Corp. | 84,345 | 3,184 | ||
AIA Group, Ltd. | 390,600 | 3,019 | ||
KB Financial Group, Inc. (ADR) | 50,371 | 2,898 | ||
East West Bancorp, Inc. | 32,881 | 2,440 | ||
Euronext NV | 24,541 | 2,406 | ||
54,626 | ||||
Consumer staples 11.68% | ||||
Philip Morris International, Inc. | 78,454 | 7,953 | ||
Nestlé SA | 51,640 | 5,469 | ||
Danone SA | 63,715 | 4,087 | ||
Carlsberg A/S, Class B | 29,258 | 3,954 | ||
Imperial Brands PLC | 159,168 | 3,937 | ||
Anheuser-Busch InBev SA/NV | 56,011 | 3,502 | ||
Dollar General Corp. | 25,448 | 3,484 | ||
General Mills, Inc. | 49,747 | 3,420 | ||
British American Tobacco PLC | 103,965 | 3,199 | ||
Constellation Brands, Inc., Class A | 10,890 | 2,725 | ||
41,730 | ||||
Information technology 11.45% | ||||
Taiwan Semiconductor Manufacturing Co., Ltd. (ADR) | 80,470 | 12,154 | ||
Broadcom, Inc. | 8,768 | 11,649 | ||
SAP SE | 34,785 | 6,264 | ||
KLA Corp. | 7,441 | 5,652 | ||
Texas Instruments, Inc. | 16,785 | 3,273 | ||
Fujitsu, Ltd. | 132,900 | 1,917 | ||
40,909 | ||||
Health care 8.31% | ||||
Eli Lilly and Co. | 6,641 | 5,448 | ||
UnitedHealth Group, Inc. | 10,445 | 5,174 | ||
Abbott Laboratories | 39,818 | 4,069 | ||
Merck & Co., Inc. | 28,026 | 3,518 | ||
Amgen, Inc. | 9,929 | 3,037 |
4 | Capital Group Equity Exchange-Traded Funds |
Common stocks (continued) | Shares | Value (000) | ||
Health care (continued) | ||||
AstraZeneca PLC | 18,799 | $2,920 | ||
AbbVie, Inc. | 17,413 | 2,808 | ||
Bristol-Myers Squibb Co. | 65,939 | 2,709 | ||
29,683 | ||||
Utilities 7.40% | ||||
CenterPoint Energy, Inc. | 289,295 | 8,826 | ||
Engie SA | 311,929 | 5,258 | ||
Iberdrola, SA, non-registered shares | 378,305 | 4,967 | ||
Edison International | 53,402 | 4,104 | ||
AES Corp. | 152,065 | 3,283 | ||
26,438 | ||||
Real estate 7.24% | ||||
VICI Properties, Inc. REIT | 244,229 | 7,012 | ||
Rexford Industrial Realty, Inc. REIT | 130,216 | 5,907 | ||
Equinix, Inc. REIT | 4,064 | 3,101 | ||
Welltower, Inc. REIT | 27,396 | 2,840 | ||
Link REIT | 624,500 | 2,619 | ||
CK Asset Holdings, Ltd. | 575,500 | 2,270 | ||
Longfor Group Holdings, Ltd. | 1,336,500 | 2,102 | ||
25,851 | ||||
Consumer discretionary 6.56% | ||||
Tractor Supply Co. | 21,418 | 6,110 | ||
Industria de Diseño Textil, SA | 109,194 | 5,161 | ||
LVMH Moët Hennessy-Louis Vuitton SE | 5,132 | 4,092 | ||
Bridgestone Corp. | 68,300 | 2,971 | ||
Galaxy Entertainment Group, Ltd. | 542,000 | 2,599 | ||
YUM! Brands, Inc. | 18,027 | 2,478 | ||
23,411 | ||||
Energy 5.60% | ||||
BP PLC | 1,264,891 | 7,868 | ||
TotalEnergies SE | 67,075 | 4,877 | ||
TC Energy Corp. (CAD denominated) | 124,797 | 4,813 | ||
Equitrans Midstream Corp. | 171,379 | 2,447 | ||
20,005 | ||||
Communication services 2.01% | ||||
Koninklijke KPN NV | 1,172,544 | 4,382 | ||
América Móvil, SAB de CV, Class B (ADR) | 151,110 | 2,801 | ||
7,183 | ||||
Materials 1.60% | ||||
Vale SA (ADR), ordinary nominative shares | 262,434 | 3,162 | ||
Dow, Inc. | 44,185 | 2,547 | ||
5,709 | ||||
Total common stocks (cost: $321,550,000) | 343,183 | |||
Short-term securities 3.70% | ||||
Money market investments 3.70% | ||||
Capital Group Central Cash Fund 5.36%2,3 | 132,265 | 13,229 | ||
Total short-term securities (cost: $13,227,000) | 13,229 | |||
Total investment securities 99.78% (cost: $334,777,000) | 356,412 | |||
Other assets less liabilities 0.22% | 796 | |||
Net assets 100.00% | $357,208 |
Capital Group Equity Exchange-Traded Funds | 5 |
Value at 9/26/20234 (000) | Additions (000) | Reductions (000) | Net realized gain (loss) (000) | Net unrealized appreciation (depreciation) (000) | Value at 5/31/2024 (000) | Dividend or interest income (000) | |
Short-term securities 3.70% | |||||||
Money market investments 3.70% | |||||||
Capital Group Central Cash Fund 5.36% 2 | $— | $42,751 | $29,523 | $(1 ) | $2 | $13,229 | $208 |
1 | Security did not produce income during the last 12 months. |
2 | Rate represents the seven-day yield at 5/31/2024. |
3 | Part of the same "group of investment companies" as the fund as defined under the Investment Company Act of 1940, as amended. |
4 | Commencement of operations. |
Key to abbreviation(s) |
ADR = American Depositary Receipts |
CAD = Canadian dollars |
REIT = Real Estate Investment Trust |
6 | Capital Group Equity Exchange-Traded Funds |
Common stocks 96.82% | Shares | Value (000) | ||
Industrials 22.66% | ||||
RTX Corp. | 4,331,777 | $467,009 | ||
General Electric Co. | 2,400,365 | 396,396 | ||
Carrier Global Corp. | 4,993,710 | 315,552 | ||
General Dynamics Corp. | 636,675 | 190,856 | ||
United Rentals, Inc. | 244,114 | 163,412 | ||
Union Pacific Corp. | 654,908 | 152,476 | ||
Illinois Tool Works, Inc. | 400,745 | 97,281 | ||
GE Vernova, Inc.1 | 281,507 | 49,517 | ||
TFI International, Inc. | 275,209 | 36,405 | ||
1,868,904 | ||||
Information technology 18.47% | ||||
Broadcom, Inc. | 396,876 | 527,270 | ||
Microsoft Corp. | 1,011,245 | 419,798 | ||
Apple, Inc. | 1,419,803 | 272,957 | ||
Texas Instruments, Inc. | 1,061,202 | 206,945 | ||
Intel Corp. | 1,638,358 | 50,543 | ||
Micron Technology, Inc. | 364,851 | 45,607 | ||
1,523,120 | ||||
Health care 12.81% | ||||
UnitedHealth Group, Inc. | 352,350 | 174,544 | ||
GE HealthCare Technologies, Inc.1 | 2,230,624 | 173,989 | ||
Abbott Laboratories | 1,560,253 | 159,442 | ||
AbbVie, Inc. | 954,789 | 153,950 | ||
Amgen, Inc. | 438,767 | 134,197 | ||
Gilead Sciences, Inc. | 1,648,859 | 105,972 | ||
Danaher Corp. | 321,177 | 82,478 | ||
Medtronic PLC | 876,745 | 71,341 | ||
1,055,913 | ||||
Financials 9.88% | ||||
American International Group, Inc. | 3,208,158 | 252,867 | ||
Capital One Financial Corp. | 1,265,638 | 174,190 | ||
JPMorgan Chase & Co. | 810,591 | 164,250 | ||
ING Groep NV | 6,794,346 | 120,638 | ||
First Citizens BancShares, Inc., Class A | 60,749 | 103,178 | ||
815,123 | ||||
Consumer discretionary 7.10% | ||||
Royal Caribbean Cruises, Ltd.1 | 1,104,590 | 163,126 | ||
McDonald’s Corp. | 391,743 | 101,418 | ||
D.R. Horton, Inc. | 623,637 | 92,174 | ||
TopBuild Corp.1 | 206,242 | 86,199 | ||
Hasbro, Inc. | 1,316,611 | 78,707 | ||
Amazon.com, Inc.1 | 359,827 | 63,488 | ||
585,112 | ||||
Consumer staples 6.94% | ||||
Philip Morris International, Inc. | 3,042,304 | 308,429 | ||
British American Tobacco PLC | 6,396,944 | 196,854 | ||
Coca-Cola Co. | 1,063,394 | 66,919 | ||
572,202 | ||||
Materials 5.43% | ||||
Linde PLC | 435,265 | 189,567 | ||
Celanese Corp. | 859,365 | 130,658 | ||
Freeport-McMoRan, Inc. | 1,408,848 | 74,288 | ||
Albemarle Corp. | 431,972 | 52,955 | ||
447,468 |
Capital Group Equity Exchange-Traded Funds | 7 |
Common stocks (continued) | Shares | Value (000) | ||
Communication services 5.19% | ||||
Meta Platforms, Inc., Class A | 659,817 | $308,022 | ||
Alphabet, Inc., Class A1 | 697,257 | 120,277 | ||
428,299 | ||||
Energy 4.40% | ||||
Canadian Natural Resources, Ltd. | 1,499,085 | 115,175 | ||
TC Energy Corp. (CAD denominated) | 2,815,837 | 108,588 | ||
EOG Resources, Inc. | 607,417 | 75,654 | ||
Exxon Mobil Corp. | 542,686 | 63,635 | ||
363,052 | ||||
Utilities 3.36% | ||||
NextEra Energy, Inc. | 1,624,045 | 129,956 | ||
PG&E Corp. | 4,331,807 | 80,312 | ||
Edison International | 864,699 | 66,452 | ||
276,720 | ||||
Real estate 0.58% | ||||
Prologis, Inc. REIT | 432,905 | 47,832 | ||
Total common stocks (cost: $6,791,955,000) | 7,983,745 | |||
Short-term securities 2.75% | ||||
Money market investments 2.75% | ||||
Capital Group Central Cash Fund 5.36%2,3 | 2,265,437 | 226,589 | ||
Total short-term securities (cost: $226,540,000) | 226,589 | |||
Total investment securities 99.57% (cost: $7,018,495,000) | 8,210,334 | |||
Other assets less liabilities 0.43% | 35,290 | |||
Net assets 100.00% | $8,245,624 |
Value at 6/1/2023 (000) | Additions (000) | Reductions (000) | Net realized gain (loss) (000) | Net unrealized appreciation (depreciation) (000) | Value at 5/31/2024 (000) | Dividend or interest income (000) | |
Short-term securities 2.75% | |||||||
Money market investments 2.75% | |||||||
Capital Group Central Cash Fund 5.36% 2 | $87,922 | $1,335,126 | $1,196,465 | $(38 ) | $44 | $226,589 | $9,003 |
1 | Security did not produce income during the last 12 months. |
2 | Rate represents the seven-day yield at 5/31/2024. |
3 | Part of the same "group of investment companies" as the fund as defined under the Investment Company Act of 1940, as amended. |
Key to abbreviation(s) |
CAD = Canadian dollars |
REIT = Real Estate Investment Trust |
8 | Capital Group Equity Exchange-Traded Funds |
Common stocks 96.29% | Shares | Value (000) | ||
Information technology 26.58% | ||||
Microsoft Corp. | 511,603 | $212,382 | ||
ASML Holding NV | 171,814 | 162,340 | ||
Taiwan Semiconductor Manufacturing Co., Ltd. (ADR) | 1,074,058 | 162,226 | ||
NVIDIA Corp. | 122,364 | 134,151 | ||
Broadcom, Inc. | 45,958 | 61,057 | ||
Synopsys, Inc.1 | 93,207 | 52,270 | ||
Keyence Corp. | 95,700 | 43,017 | ||
Capgemini SE | 202,069 | 40,694 | ||
Apple, Inc. | 173,449 | 33,346 | ||
Salesforce, Inc. | 104,552 | 24,511 | ||
Arista Networks, Inc.1 | 78,986 | 23,510 | ||
Shopify, Inc., Class A, subordinate voting shares1 | 106,654 | 6,309 | ||
955,813 | ||||
Health care 16.02% | ||||
Novo Nordisk AS, Class B | 953,090 | 128,566 | ||
Eli Lilly and Co. | 97,400 | 79,901 | ||
Thermo Fisher Scientific, Inc. | 120,035 | 68,178 | ||
AstraZeneca PLC | 344,164 | 53,459 | ||
UnitedHealth Group, Inc. | 107,594 | 53,299 | ||
Vertex Pharmaceuticals, Inc.1 | 111,667 | 50,846 | ||
Regeneron Pharmaceuticals, Inc.1 | 48,969 | 47,997 | ||
Centene Corp.1 | 359,041 | 25,704 | ||
Pfizer, Inc. | 856,502 | 24,547 | ||
Cigna Group (The) | 67,794 | 23,363 | ||
Sanofi | 207,924 | 20,251 | ||
576,111 | ||||
Industrials 14.26% | ||||
Safran SA | 455,591 | 105,838 | ||
ASSA ABLOY AB, Class B | 1,649,560 | 48,152 | ||
Caterpillar, Inc. | 132,560 | 44,874 | ||
Schneider Electric SE | 174,841 | 43,150 | ||
Airbus SE, non-registered shares | 226,615 | 38,334 | ||
TransDigm Group, Inc. | 28,263 | 37,964 | ||
Copart, Inc.1 | 615,586 | 32,663 | ||
Comfort Systems USA, Inc. | 75,960 | 24,865 | ||
Johnson Controls International PLC | 334,787 | 24,074 | ||
Ryanair Holdings PLC (ADR) | 189,600 | 23,063 | ||
Carrier Global Corp. | 315,046 | 19,908 | ||
Daikin Industries, Ltd. | 125,100 | 18,252 | ||
GT Capital Holdings, Inc. | 1,519,100 | 15,627 | ||
Boeing Co.1 | 71,269 | 12,658 | ||
Techtronic Industries Co., Ltd. | 958,000 | 11,723 | ||
Alliance Global Group, Inc. | 73,711,100 | 11,676 | ||
512,821 | ||||
Consumer discretionary 14.02% | ||||
LVMH Moët Hennessy-Louis Vuitton SE | 118,154 | 94,216 | ||
Chipotle Mexican Grill, Inc.1 | 25,098 | 78,545 | ||
Renault SA | 941,410 | 54,731 | ||
Prosus NV, Class N | 1,149,302 | 41,627 | ||
MGM China Holdings, Ltd. | 20,683,788 | 36,763 | ||
Booking Holdings, Inc. | 9,433 | 35,622 | ||
Amazon.com, Inc.1 | 186,583 | 32,921 | ||
Evolution AB | 231,239 | 24,785 | ||
InterContinental Hotels Group PLC | 239,691 | 24,129 | ||
MercadoLibre, Inc.1 | 13,077 | 22,565 | ||
Home Depot, Inc. | 65,032 | 21,777 | ||
Trip.com Group, Ltd. (ADR)1 | 392,191 | 20,202 | ||
lululemon athletica, Inc.1 | 51,653 | 16,115 | ||
503,998 |
Capital Group Equity Exchange-Traded Funds | 9 |
Common stocks (continued) | Shares | Value (000) | ||
Financials 10.30% | ||||
AXA SA | 1,480,553 | $53,094 | ||
Fiserv, Inc.1 | 330,110 | 49,437 | ||
3i Group PLC | 1,021,002 | 37,248 | ||
Aon PLC, Class A | 114,566 | 32,266 | ||
Blackstone, Inc. | 244,128 | 29,417 | ||
Tradeweb Markets, Inc., Class A | 254,445 | 27,737 | ||
Citigroup, Inc. | 410,884 | 25,602 | ||
Société Générale | 761,237 | 22,624 | ||
London Stock Exchange Group PLC | 188,951 | 22,059 | ||
Prudential PLC | 2,272,164 | 21,628 | ||
Axis Bank, Ltd. | 1,332,111 | 18,547 | ||
HDFC Bank, Ltd. | 920,508 | 16,890 | ||
AIA Group, Ltd. | 1,769,600 | 13,679 | ||
370,228 | ||||
Communication services 4.80% | ||||
Alphabet, Inc., Class A1 | 573,841 | 98,988 | ||
Meta Platforms, Inc., Class A | 114,713 | 53,551 | ||
Publicis Groupe SA | 181,311 | 20,224 | ||
172,763 | ||||
Consumer staples 4.13% | ||||
Nestlé SA | 344,414 | 36,474 | ||
Monster Beverage Corp.1 | 544,698 | 28,281 | ||
Keurig Dr Pepper, Inc. | 717,910 | 24,588 | ||
Dollar Tree Stores, Inc.1 | 175,988 | 20,758 | ||
Philip Morris International, Inc. | 184,538 | 18,709 | ||
British American Tobacco PLC | 584,898 | 17,999 | ||
Walgreens Boots Alliance, Inc. | 113,577 | 1,842 | ||
148,651 | ||||
Energy 3.43% | ||||
Canadian Natural Resources, Ltd. (CAD denominated) | 969,614 | 74,485 | ||
Reliance Industries, Ltd. | 885,191 | 30,338 | ||
EOG Resources, Inc. | 147,701 | 18,396 | ||
Gazprom PJSC1,2 | 36,932 | — 3 | ||
123,219 | ||||
Materials 2.75% | ||||
Linde PLC | 141,011 | 61,413 | ||
First Quantum Minerals, Ltd. | 1,737,040 | 22,316 | ||
Shin-Etsu Chemical Co., Ltd. | 405,200 | 15,086 | ||
98,815 | ||||
Total common stocks (cost: $2,905,085,000) | 3,462,419 | |||
Preferred securities 1.12% | ||||
Information technology 1.12% | ||||
Samsung Electronics Co., Ltd., nonvoting preferred shares | 925,268 | 40,297 | ||
Total preferred securities (cost: $40,563,000) | 40,297 | |||
Short-term securities 2.52% | ||||
Money market investments 1.78% | ||||
Capital Group Central Cash Fund 5.36%4,5 | 641,817 | 64,195 |
10 | Capital Group Equity Exchange-Traded Funds |
Weighted average yield at acquisition | Principal amount (000) | Value (000) | ||
Commercial paper 0.74% | ||||
Oesterreichische Kontrollbank AG 6/14/2024 | 5.013 % | 9,050 | $9,031 | |
Sanofi 6/10/20246 | 2.703 | 17,500 | 17,474 | |
26,505 | ||||
Total short-term securities (cost: $90,689,000) | 90,700 | |||
Total investment securities 99.93% (cost: $3,036,337,000) | 3,593,416 | |||
Other assets less liabilities 0.07% | 2,675 | |||
Net assets 100.00% | $3,596,091 |
Value at 6/1/2023 (000) | Additions (000) | Reductions (000) | Net realized gain (loss) (000) | Net unrealized appreciation (depreciation) (000) | Value at 5/31/2024 (000) | Dividend or interest income (000) | |
Short-term securities 1.78% | |||||||
Money market investments 1.78% | |||||||
Capital Group Central Cash Fund 5.36% 4 | $45,328 | $835,741 | $816,899 | $9 | $16 | $64,195 | $4,836 |
1 | Security did not produce income during the last 12 months. |
2 | Value determined using significant unobservable inputs. |
3 | Amount less than one thousand. |
4 | Rate represents the seven-day yield at 5/31/2024. |
5 | Part of the same "group of investment companies" as the fund as defined under the Investment Company Act of 1940, as amended. |
6 | Acquired in a transaction exempt from registration under Rule 144A or, for commercial paper, Section 4(a)(2) of the Securities Act of 1933. May be resold in the U.S. in transactions exempt from registration, normally to qualified institutional buyers. The total value of all such securities was $17,474,000, which represented 0.49% of the net assets of the fund. |
Key to abbreviation(s) |
ADR = American Depositary Receipts |
CAD = Canadian dollars |
Capital Group Equity Exchange-Traded Funds | 11 |
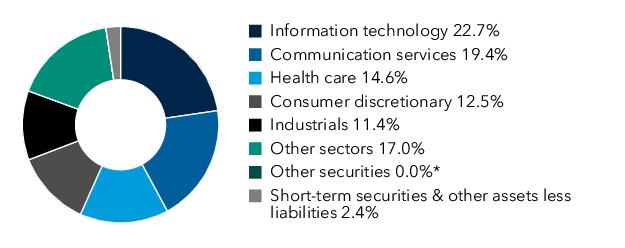
Common stocks 97.61% | Shares | Value (000) | ||
Information technology 22.72% | ||||
Microsoft Corp. | 791,466 | $328,561 | ||
Broadcom, Inc. | 123,899 | 164,606 | ||
NVIDIA Corp. | 138,579 | 151,928 | ||
Apple, Inc. | 486,372 | 93,505 | ||
Salesforce, Inc. | 337,790 | 79,192 | ||
Shopify, Inc., Class A, subordinate voting shares1 | 1,070,008 | 63,291 | ||
ASML Holding NV (ADR) | 35,682 | 34,267 | ||
ASML Holding NV | 30,341 | 28,668 | ||
MicroStrategy, Inc., Class A1 | 37,530 | 57,214 | ||
Taiwan Semiconductor Manufacturing Co., Ltd. (ADR) | 355,080 | 53,631 | ||
Synopsys, Inc.1 | 80,669 | 45,239 | ||
Cloudflare, Inc., Class A1 | 590,771 | 39,989 | ||
Micron Technology, Inc. | 297,622 | 37,203 | ||
Applied Materials, Inc. | 149,866 | 32,233 | ||
Motorola Solutions, Inc. | 83,301 | 30,397 | ||
Constellation Software, Inc. | 7,330 | 20,389 | ||
Dell Technologies, Inc., Class C | 126,687 | 17,681 | ||
DocuSign, Inc.1 | 238,498 | 13,055 | ||
Trimble, Inc.1 | 192,465 | 10,717 | ||
1,301,766 | ||||
Communication services 19.45% | ||||
Meta Platforms, Inc., Class A | 1,022,186 | 477,187 | ||
Netflix, Inc.1 | 422,566 | 271,127 | ||
Alphabet, Inc., Class C1 | 892,665 | 155,288 | ||
Alphabet, Inc., Class A1 | 641,054 | 110,582 | ||
Charter Communications, Inc., Class A1 | 170,417 | 48,930 | ||
Snap, Inc., Class A, nonvoting shares1 | 2,109,120 | 31,679 | ||
Frontier Communications Parent, Inc.1 | 727,165 | 19,386 | ||
1,114,179 | ||||
Health care 14.57% | ||||
Regeneron Pharmaceuticals, Inc.1 | 138,726 | 135,974 | ||
Intuitive Surgical, Inc.1 | 307,827 | 123,783 | ||
Eli Lilly and Co. | 117,094 | 96,057 | ||
UnitedHealth Group, Inc. | 192,193 | 95,207 | ||
Vertex Pharmaceuticals, Inc.1 | 195,653 | 89,089 | ||
Thermo Fisher Scientific, Inc. | 102,288 | 58,097 | ||
Alnylam Pharmaceuticals, Inc.1 | 227,339 | 33,744 | ||
HCA Healthcare, Inc. | 89,889 | 30,540 | ||
Moderna, Inc.1 | 180,994 | 25,801 | ||
Novo Nordisk AS, Class B | 160,397 | 21,636 | ||
Danaher Corp. | 83,612 | 21,472 | ||
Abbott Laboratories | 204,124 | 20,859 | ||
Centene Corp.1 | 262,294 | 18,778 | ||
DexCom, Inc.1 | 147,159 | 17,478 | ||
Mettler-Toledo International, Inc.1 | 11,904 | 16,714 | ||
Sarepta Therapeutics, Inc.1 | 114,286 | 14,841 | ||
Molina Healthcare, Inc.1 | 45,971 | 14,461 | ||
834,531 | ||||
Consumer discretionary 12.51% | ||||
Tesla, Inc.1 | 1,052,476 | 187,425 | ||
Amazon.com, Inc.1 | 533,799 | 94,183 | ||
Royal Caribbean Cruises, Ltd.1 | 360,131 | 53,184 | ||
DoorDash, Inc., Class A1 | 452,380 | 49,812 | ||
Home Depot, Inc. | 131,508 | 44,038 | ||
Airbnb, Inc., Class A1 | 251,446 | 36,442 | ||
Tractor Supply Co. | 122,994 | 35,089 | ||
Chipotle Mexican Grill, Inc.1 | 10,852 | 33,961 | ||
D.R. Horton, Inc. | 190,012 | 28,084 | ||
Amadeus IT Group SA, Class A, non-registered shares | 377,803 | 26,785 | ||
Hermès International | 11,339 | 26,772 | ||
Aramark | 658,537 | 21,172 |
12 | Capital Group Equity Exchange-Traded Funds |
Common stocks (continued) | Shares | Value (000) | ||
Consumer discretionary (continued) | ||||
Floor & Decor Holdings, Inc., Class A1 | 171,652 | $20,059 | ||
Evolution AB | 170,740 | 18,301 | ||
Norwegian Cruise Line Holdings, Ltd.1 | 1,061,506 | 17,621 | ||
NIKE, Inc., Class B | 142,311 | 13,527 | ||
Helen of Troy, Ltd.1 | 94,236 | 10,072 | ||
716,527 | ||||
Industrials 11.38% | ||||
TransDigm Group, Inc. | 75,319 | 101,171 | ||
General Electric Co. | 466,018 | 76,958 | ||
Uber Technologies, Inc.1 | 903,452 | 58,327 | ||
Carrier Global Corp. | 883,608 | 55,835 | ||
Caterpillar, Inc. | 127,914 | 43,302 | ||
Jacobs Solutions, Inc. | 274,565 | 38,258 | ||
Ingersoll-Rand, Inc. | 382,991 | 35,637 | ||
Ryanair Holdings PLC (ADR) | 261,828 | 31,849 | ||
United Rentals, Inc. | 44,883 | 30,045 | ||
Equifax, Inc. | 126,251 | 29,213 | ||
Quanta Services, Inc. | 103,312 | 28,508 | ||
Airbus SE, non-registered shares | 157,634 | 26,665 | ||
MTU Aero Engines AG | 92,372 | 22,902 | ||
United Airlines Holdings, Inc.1 | 393,846 | 20,870 | ||
Old Dominion Freight Line, Inc. | 105,526 | 18,493 | ||
Genpact, Ltd. | 534,116 | 17,658 | ||
Dayforce, Inc.1 | 325,708 | 16,110 | ||
651,801 | ||||
Financials 7.34% | ||||
Visa, Inc., Class A | 478,629 | 130,407 | ||
Bank of America Corp. | 1,545,527 | 61,806 | ||
Mastercard, Inc., Class A | 113,561 | 50,770 | ||
Fiserv, Inc.1 | 336,424 | 50,383 | ||
KKR & Co., Inc. | 395,750 | 40,699 | ||
Apollo Asset Management, Inc. | 263,180 | 30,571 | ||
Toast, Inc., Class A1 | 825,181 | 19,994 | ||
Block, Inc., Class A1 | 294,781 | 18,889 | ||
Blackstone, Inc. | 140,977 | 16,988 | ||
420,507 | ||||
Energy 3.97% | ||||
Halliburton Co. | 1,761,787 | 64,657 | ||
Canadian Natural Resources, Ltd. (CAD denominated) | 629,887 | 48,387 | ||
Schlumberger NV | 845,709 | 38,810 | ||
EOG Resources, Inc. | 259,654 | 32,340 | ||
Tourmaline Oil Corp. | 448,231 | 22,235 | ||
Cenovus Energy, Inc. | 1,022,747 | 21,319 | ||
227,748 | ||||
Consumer staples 3.15% | ||||
Performance Food Group Co.1 | 578,275 | 40,248 | ||
Costco Wholesale Corp. | 45,048 | 36,484 | ||
Dollar Tree Stores, Inc.1 | 293,911 | 34,667 | ||
Target Corp. | 175,287 | 27,373 | ||
Dollar General Corp. | 159,881 | 21,889 | ||
Kroger Co. | 374,143 | 19,594 | ||
180,255 | ||||
Materials 1.33% | ||||
Wheaton Precious Metals Corp. | 522,403 | 28,789 | ||
ATI, Inc.1 | 390,050 | 23,926 | ||
Grupo México, SAB de CV, Series B | 3,778,297 | 23,356 | ||
76,071 |
Capital Group Equity Exchange-Traded Funds | 13 |
Common stocks (continued) | Shares | Value (000) | ||
Utilities 1.19% | ||||
Constellation Energy Corp. | 166,996 | $36,280 | ||
PG&E Corp. | 1,722,448 | 31,934 | ||
68,214 | ||||
Total common stocks (cost: $4,503,390,000) | 5,591,599 | |||
Rights & warrants 0.00% | ||||
Information technology 0.00% | ||||
Constellation Software, Inc., warrants, expire 3/31/20402 | 4,185 | — 3 | ||
Short-term securities 1.99% | ||||
Money market investments 1.99% | ||||
Capital Group Central Cash Fund 5.36%4,5 | 1,139,878 | 114,011 | ||
Total short-term securities (cost: $113,992,000) | 114,011 | |||
Total investment securities 99.60% (cost: $4,617,382,000) | 5,705,610 | |||
Other assets less liabilities 0.40% | 22,678 | |||
Net assets 100.00% | $5,728,288 |
Value at 6/1/2023 (000) | Additions (000) | Reductions (000) | Net realized gain (loss) (000) | Net unrealized appreciation (depreciation) (000) | Value at 5/31/2024 (000) | Dividend or interest income (000) | |
Short-term securities 1.99% | |||||||
Money market investments 1.99% | |||||||
Capital Group Central Cash Fund 5.36% 4 | $40,029 | $711,106 | $637,136 | $(5 ) | $17 | $114,011 | $3,239 |
1 | Security did not produce income during the last 12 months. |
2 | Value determined using significant unobservable inputs. |
3 | Amount less than one thousand. |
4 | Rate represents the seven-day yield at 5/31/2024. |
5 | Part of the same "group of investment companies" as the fund as defined under the Investment Company Act of 1940, as amended. |
Key to abbreviation(s) |
ADR = American Depositary Receipts |
CAD = Canadian dollars |
14 | Capital Group Equity Exchange-Traded Funds |
Common stocks 95.50% | Shares | Value (000) | ||
Industrials 23.24% | ||||
Safran SA | 20,764 | $4,824 | ||
ABB, Ltd. | 50,012 | 2,738 | ||
Airbus SE, non-registered shares | 15,095 | 2,553 | ||
Epiroc AB, Class A | 122,344 | 2,542 | ||
ITOCHU Corp. | 50,300 | 2,370 | ||
Canadian National Railway Co. | 18,603 | 2,369 | ||
SMC Corp. | 4,300 | 2,155 | ||
Mitsubishi Corp. | 97,400 | 2,046 | ||
RELX PLC | 46,388 | 2,019 | ||
Daikin Industries, Ltd. | 12,000 | 1,751 | ||
Hitachi, Ltd. | 16,200 | 1,663 | ||
Rolls-Royce Holdings PLC1 | 262,927 | 1,519 | ||
Recruit Holdings Co., Ltd. | 25,400 | 1,284 | ||
BAE Systems PLC | 71,731 | 1,272 | ||
TFI International, Inc. (CAD denominated) | 8,944 | 1,183 | ||
Marubeni Corp. | 52,100 | 1,014 | ||
33,302 | ||||
Information technology 16.97% | ||||
ASML Holding NV | 4,545 | 4,294 | ||
SAP SE | 22,405 | 4,035 | ||
Taiwan Semiconductor Manufacturing Co., Ltd. (ADR) | 18,701 | 2,825 | ||
Keyence Corp. | 5,400 | 2,427 | ||
Capgemini SE | 8,590 | 1,730 | ||
Tokyo Electron, Ltd. | 7,800 | 1,668 | ||
STMicroelectronics NV | 38,994 | 1,602 | ||
Hamamatsu Photonics KK | 49,600 | 1,458 | ||
Nomura Research Institute, Ltd. | 53,800 | 1,438 | ||
Halma PLC | 49,232 | 1,396 | ||
TDK Corp. | 22,200 | 1,108 | ||
OBIC Co., Ltd. | 2,600 | 337 | ||
24,318 | ||||
Health care 13.06% | ||||
Novo Nordisk AS, Class B | 46,286 | 6,243 | ||
AstraZeneca PLC | 24,837 | 3,858 | ||
EssilorLuxottica SA | 12,569 | 2,800 | ||
Daiichi Sankyo Co., Ltd. | 62,300 | 2,210 | ||
Genmab AS1 | 6,125 | 1,726 | ||
Straumann Holding AG | 8,705 | 1,129 | ||
Innovent Biologics, Inc.1 | 164,000 | 738 | ||
18,704 | ||||
Financials 11.55% | ||||
London Stock Exchange Group PLC | 28,092 | 3,280 | ||
DBS Group Holdings, Ltd. | 79,100 | 2,107 | ||
Skandinaviska Enskilda Banken AB, Class A | 129,136 | 1,830 | ||
AIA Group, Ltd. | 205,200 | 1,586 | ||
DNB Bank ASA | 79,510 | 1,555 | ||
Euronext NV | 14,710 | 1,442 | ||
Hong Kong Exchanges and Clearing, Ltd. | 41,100 | 1,381 | ||
NatWest Group PLC | 303,195 | 1,217 | ||
Deutsche Bank AG | 69,964 | 1,156 | ||
Partners Group Holding AG | 744 | 994 | ||
16,548 | ||||
Consumer staples 9.07% | ||||
L’Oréal SA, non-registered shares | 6,180 | 3,032 | ||
Nestlé SA | 25,943 | 2,747 | ||
Anheuser-Busch InBev SA/NV | 31,413 | 1,964 | ||
Imperial Brands PLC | 67,623 | 1,673 |
Capital Group Equity Exchange-Traded Funds | 15 |
Common stocks (continued) | Shares | Value (000) | ||
Consumer staples (continued) | ||||
Danone SA | 23,006 | $1,476 | ||
British American Tobacco PLC | 35,947 | 1,106 | ||
Uni-Charm Corp. | 30,900 | 992 | ||
12,990 | ||||
Consumer discretionary 8.67% | ||||
Amadeus IT Group SA, Class A, non-registered shares | 35,361 | 2,507 | ||
LVMH Moët Hennessy-Louis Vuitton SE | 2,950 | 2,352 | ||
Industria de Diseño Textil, SA | 43,213 | 2,043 | ||
MercadoLibre, Inc.1 | 987 | 1,703 | ||
Hermès International | 593 | 1,400 | ||
Ferrari NV | 2,563 | 1,050 | ||
Bridgestone Corp. | 24,100 | 1,048 | ||
Kering SA | 924 | 318 | ||
12,421 | ||||
Materials 5.77% | ||||
Sika AG | 8,934 | 2,702 | ||
Givaudan SA | 458 | 2,150 | ||
Air Liquide SA | 10,079 | 1,974 | ||
Shin-Etsu Chemical Co., Ltd. | 38,700 | 1,441 | ||
8,267 | ||||
Energy 3.91% | ||||
TotalEnergies SE | 56,999 | 4,144 | ||
BP PLC | 234,241 | 1,457 | ||
5,601 | ||||
Communication services 1.86% | ||||
Tencent Holdings, Ltd. | 37,600 | 1,730 | ||
Nippon Telegraph and Telephone Corp. | 946,500 | 929 | ||
2,659 | ||||
Utilities 1.40% | ||||
Engie SA | 119,147 | 2,008 | ||
Total common stocks (cost: $126,243,000) | 136,818 | |||
Short-term securities 4.21% | ||||
Money market investments 4.21% | ||||
Capital Group Central Cash Fund 5.36%2,3 | 60,317 | 6,033 | ||
Total short-term securities (cost: $6,032,000) | 6,033 | |||
Total investment securities 99.71% (cost: $132,275,000) | 142,851 | |||
Other assets less liabilities 0.29% | 415 | |||
Net assets 100.00% | $143,266 |
Value at 9/26/20234 (000) | Additions (000) | Reductions (000) | Net realized gain (loss) (000) | Net unrealized appreciation (depreciation) (000) | Value at 5/31/2024 (000) | Dividend or interest income (000) | |
Short-term securities 4.21% | |||||||
Money market investments 4.21% | |||||||
Capital Group Central Cash Fund 5.36% 2 | $— | $23,851 | $17,820 | $1 | $1 | $6,033 | $163 |
16 | Capital Group Equity Exchange-Traded Funds |
1 | Security did not produce income during the last 12 months. |
2 | Rate represents the seven-day yield at 5/31/2024. |
3 | Part of the same "group of investment companies" as the fund as defined under the Investment Company Act of 1940, as amended. |
4 | Commencement of operations. |
Key to abbreviation(s) |
ADR = American Depositary Receipts |
CAD = Canadian dollars |
Capital Group Equity Exchange-Traded Funds | 17 |
Common stocks 97.78% | Shares | Value (000) | ||
Industrials 16.36% | ||||
Airbus SE, non-registered shares | 522,226 | $88,339 | ||
Recruit Holdings Co., Ltd. | 1,435,700 | 72,559 | ||
Safran SA | 232,355 | 53,978 | ||
Siemens AG | 254,093 | 48,595 | ||
Techtronic Industries Co., Ltd. | 3,133,000 | 38,339 | ||
Melrose Industries PLC | 4,252,803 | 33,371 | ||
Ashtead Group PLC | 403,176 | 29,222 | ||
MTU Aero Engines AG | 98,968 | 24,538 | ||
Daikin Industries, Ltd. | 123,900 | 18,077 | ||
International Container Terminal Services, Inc. | 2,567,260 | 14,986 | ||
422,004 | ||||
Health care 13.47% | ||||
Novo Nordisk AS, Class B | 1,015,686 | 137,010 | ||
Daiichi Sankyo Co., Ltd. | 3,408,700 | 120,902 | ||
UCB SA | 150,394 | 20,994 | ||
Sanofi | 210,324 | 20,484 | ||
AstraZeneca PLC | 131,349 | 20,403 | ||
Eurofins Scientific SE, non-registered shares | 276,669 | 16,619 | ||
Grifols, SA, Class A, non-registered shares1 | 1,093,831 | 11,071 | ||
347,483 | ||||
Materials 13.29% | ||||
Glencore PLC | 14,573,405 | 89,276 | ||
Fortescue, Ltd. | 4,779,667 | 78,677 | ||
First Quantum Minerals, Ltd. | 5,169,412 | 66,412 | ||
Ivanhoe Mines, Ltd., Class A1 | 2,911,173 | 42,035 | ||
Shin-Etsu Chemical Co., Ltd. | 777,900 | 28,961 | ||
Rio Tinto PLC | 320,088 | 22,335 | ||
DSM-Firmenich AG | 132,643 | 15,206 | ||
342,902 | ||||
Consumer discretionary 13.09% | ||||
MercadoLibre, Inc.1 | 39,996 | 69,016 | ||
adidas AG | 175,867 | 44,176 | ||
LVMH Moët Hennessy-Louis Vuitton SE | 41,571 | 33,149 | ||
Evolution AB | 300,394 | 32,198 | ||
Maruti Suzuki India, Ltd. | 202,973 | 30,151 | ||
Ferrari NV | 69,705 | 28,544 | ||
Flutter Entertainment PLC1 | 145,996 | 28,044 | ||
Sony Group Corp. | 301,800 | 24,746 | ||
Compagnie Financière Richemont SA, Class A | 114,961 | 18,352 | ||
Entain PLC | 1,843,267 | 15,859 | ||
Meituan, Class B1 | 1,000,400 | 13,445 | ||
337,680 | ||||
Information technology 12.65% | ||||
Taiwan Semiconductor Manufacturing Co., Ltd. | 2,316,000 | 58,697 | ||
SAP SE | 294,683 | 53,065 | ||
SK hynix, Inc. | 334,164 | 45,664 | ||
Shopify, Inc., Class A, subordinate voting shares1 | 729,691 | 43,161 | ||
Samsung Electronics Co., Ltd. | 581,696 | 30,880 | ||
ASML Holding NV | 27,132 | 25,636 | ||
Constellation Software, Inc. | 6,638 | 18,464 | ||
Renesas Electronics Corp. | 925,500 | 17,278 | ||
NICE, Ltd. (ADR)1 | 93,332 | 17,133 | ||
NXP Semiconductors NV | 59,629 | 16,225 | ||
326,203 |
18 | Capital Group Equity Exchange-Traded Funds |
Common stocks (continued) | Shares | Value (000) | ||
Financials 10.21% | ||||
NU Holdings, Ltd. / Cayman Islands, Class A1 | 4,754,137 | $56,479 | ||
Aegon, Ltd. | 5,423,824 | 34,981 | ||
Kotak Mahindra Bank, Ltd. | 1,703,930 | 34,303 | ||
Banco Bilbao Vizcaya Argentaria, SA | 3,045,195 | 32,844 | ||
ING Groep NV | 1,619,112 | 28,749 | ||
NatWest Group PLC | 5,979,005 | 23,999 | ||
AIA Group, Ltd. | 3,007,200 | 23,245 | ||
Axis Bank, Ltd. | 1,084,229 | 15,095 | ||
Jio Financial Services, Ltd.1 | 3,288,456 | 13,566 | ||
263,261 | ||||
Energy 7.47% | ||||
Reliance Industries, Ltd. | 2,542,178 | 87,128 | ||
Canadian Natural Resources, Ltd. (CAD denominated) | 603,499 | 46,360 | ||
Cenovus Energy, Inc. | 1,827,797 | 38,099 | ||
TotalEnergies SE | 290,140 | 21,096 | ||
192,683 | ||||
Consumer staples 4.99% | ||||
Danone SA | 456,407 | 29,278 | ||
JBS SA | 4,559,305 | 25,042 | ||
Ajinomoto Co., Inc. | 556,000 | 19,816 | ||
Seven & i Holdings Co., Ltd. | 1,512,800 | 19,508 | ||
Kweichow Moutai Co., Ltd., Class A | 85,000 | 19,343 | ||
Treasury Wine Estates, Ltd. | 2,070,652 | 15,609 | ||
128,596 | ||||
Communication services 4.93% | ||||
Bharti Airtel, Ltd. | 3,391,964 | 55,783 | ||
Tencent Holdings, Ltd. | 695,800 | 32,012 | ||
Universal Music Group NV | 878,793 | 27,252 | ||
NetEase, Inc. | 685,400 | 12,060 | ||
127,107 | ||||
Utilities 0.85% | ||||
ENN Energy Holdings, Ltd. | 2,379,700 | 21,818 | ||
Real estate 0.47% | ||||
ESR Group, Ltd. | 8,672,800 | 12,199 | ||
Total common stocks (cost: $2,141,578,000) | 2,521,936 | |||
Short-term securities 1.47% | ||||
Money market investments 1.47% | ||||
Capital Group Central Cash Fund 5.36%2,3 | 380,259 | 38,033 | ||
Total short-term securities (cost: $38,025,000) | 38,033 | |||
Total investment securities 99.25% (cost: $2,179,603,000) | 2,559,969 | |||
Other assets less liabilities 0.75% | 19,279 | |||
Net assets 100.00% | $2,579,248 |
Capital Group Equity Exchange-Traded Funds | 19 |
Value at 6/1/2023 (000) | Additions (000) | Reductions (000) | Net realized gain (loss) (000) | Net unrealized appreciation (depreciation) (000) | Value at 5/31/2024 (000) | Dividend or interest income (000) | |
Short-term securities 1.47% | |||||||
Money market investments 1.47% | |||||||
Capital Group Central Cash Fund 5.36% 2 | $33,090 | $552,573 | $547,660 | $27 | $3 | $38,033 | $3,140 |
1 | Security did not produce income during the last 12 months. |
2 | Rate represents the seven-day yield at 5/31/2024. |
3 | Part of the same "group of investment companies" as the fund as defined under the Investment Company Act of 1940, as amended. |
Key to abbreviation(s) |
ADR = American Depositary Receipts |
CAD = Canadian dollars |
20 | Capital Group Equity Exchange-Traded Funds |
Core Equity ETF | Dividend Growers ETF | Dividend Value ETF | Global Growth Equity ETF | Growth ETF | |
Assets: | |||||
Investment securities, at value: | |||||
Unaffiliated issuers | $2,651,595 | $343,183 | $7,983,745 | $3,529,221 | $5,591,599 |
Affiliated issuers | 54,961 | 13,229 | 226,589 | 64,195 | 114,011 |
Cash | 48 | 49 | 50 | 50 | 7 |
Cash denominated in currencies other than U.S. dollars | 162 | 1 | 1 | 2,104 | — * |
Receivables for: | |||||
Sales of investments | 10,117 | — | 83,101 | — | 232,364 |
Sales of fund’s shares | 17,476 | — | 148,352 | — | 36,622 |
Dividends and interest | 1,960 | 882 | 5,358 | 2,453 | 2,300 |
2,736,319 | 357,344 | 8,447,196 | 3,598,023 | 5,976,903 | |
Liabilities: | |||||
Payables for: | |||||
Purchases of investments | 6,650 | — | 116,044 | 54 | 27,048 |
Repurchases of fund’s shares | 10,611 | — | 83,354 | — | 219,729 |
Investment advisory services | 737 | 136 | 2,174 | 1,394 | 1,838 |
Non-U.S. taxes | — | — | — | 484 | — |
17,998 | 136 | 201,572 | 1,932 | 248,615 | |
Net assets at May 31, 2024 | $2,718,321 | $357,208 | $8,245,624 | $3,596,091 | $5,728,288 |
Net assets consist of: | |||||
Capital paid in on shares of beneficial interest | $2,326,879 | $336,761 | $7,225,090 | $3,169,732 | $4,847,425 |
Total distributable earnings (accumulated loss) | 391,442 | 20,447 | 1,020,534 | 426,359 | 880,863 |
Net assets at May 31, 2024 | $2,718,321 | $357,208 | $8,245,624 | $3,596,091 | $5,728,288 |
Shares of beneficial interest issued and outstanding (no stated par value) — unlimited shares authorized | |||||
Net assets | $2,718,321 | $357,208 | $8,245,624 | $3,596,091 | $5,728,288 |
Shares outstanding | 87,104 | 12,444 | 251,244 | 123,924 | 181,444 |
Net asset value per share | $31.21 | $28.71 | $32.82 | $29.02 | $31.57 |
Investment securities, at cost: | |||||
Unaffiliated issuers | $2,203,669 | $321,550 | $6,791,955 | $2,972,157 | $4,503,390 |
Affiliated issuers | 54,949 | 13,227 | 226,540 | 64,180 | 113,992 |
Cash denominated in currencies other than U.S. dollars, at cost | 161 | 1 | 1 | 2,096 | — * |
Capital Group Equity Exchange-Traded Funds | 21 |
International Equity ETF | International Focus Equity ETF | |
Assets: | ||
Investment securities, at value: | ||
Unaffiliated issuers | $136,818 | $2,521,936 |
Affiliated issuers | 6,033 | 38,033 |
Cash | 49 | 49 |
Cash denominated in currencies other than U.S. dollars | 92 | 992 |
Receivables for: | ||
Sales of investments | — | 21,845 |
Sales of fund’s shares | — | 35,294 |
Dividends and interest | 337 | 2,084 |
143,329 | 2,620,233 | |
Liabilities: | ||
Payables for: | ||
Purchases of investments | — | 12,867 |
Repurchases of fund’s shares | — | 21,813 |
Investment advisory services | 63 | 1,159 |
Non-U.S. taxes | — | 5,146 |
63 | 40,985 | |
Net assets at May 31, 2024 | $143,266 | $2,579,248 |
Net assets consist of: | ||
Capital paid in on shares of beneficial interest | $132,975 | $2,351,442 |
Total distributable earnings (accumulated loss) | 10,291 | 227,806 |
Net assets at May 31, 2024 | $143,266 | $2,579,248 |
Shares of beneficial interest issued and outstanding (no stated par value) — unlimited shares authorized | ||
Net assets | $143,266 | $2,579,248 |
Shares outstanding | 4,924 | 99,324 |
Net asset value per share | $29.10 | $25.97 |
Investment securities, at cost: | ||
Unaffiliated issuers | $126,243 | $2,141,578 |
Affiliated issuers | 6,032 | 38,025 |
Cash denominated in currencies other than U.S. dollars, at cost | 92 | 990 |
* | Amount less than one thousand. |
22 | Capital Group Equity Exchange-Traded Funds |
Core Equity ETF | Dividend Growers ETF* | Dividend Value ETF | Global Growth Equity ETF | Growth ETF | |
Investment income: | |||||
Income (net of non-U.S. taxes†): | |||||
Dividends: | |||||
Unaffiliated issuers | $25,584 | $4,731 | $102,955 | $32,870 | $27,082 |
Affiliated issuers | 2,506 | 208 | 9,003 | 4,836 | 3,239 |
28,090 | 4,939 | 111,958 | 37,706 | 30,321 | |
Fees and expenses: | |||||
Investment advisory services | 5,555 | 553 | 15,934 | 11,399 | 14,289 |
Net investment income | 22,535 | 4,386 | 96,024 | 26,307 | 16,032 |
Net realized gain (loss) and unrealized appreciation (depreciation): | |||||
Net realized gain (loss)† on: | |||||
Investments in: | |||||
Unaffiliated issuers | (38,824 ) | (4,001 ) | (154,095 ) | (88,808 ) | (120,761 ) |
Affiliated issuers | 10 | (1 ) | (38 ) | 9 | (5 ) |
In-kind redemptions | 77,422 | 2,639 | 372,709 | 252,300 | 327,125 |
Currency transactions | (44 ) | (16 ) | 69 | (77 ) | 19 |
38,564 | (1,379 ) | 218,645 | 163,424 | 206,378 | |
Net unrealized appreciation (depreciation)† on: | |||||
Investments in: | |||||
Unaffiliated issuers | 380,335 | 21,633 | 1,034,009 | 398,124 | 851,441 |
Affiliated issuers | 10 | 2 | 44 | 16 | 17 |
Currency translations | (1 ) | (3 ) | (22 ) | 2 | (4 ) |
380,344 | 21,632 | 1,034,031 | 398,142 | 851,454 | |
Net realized gain (loss) and unrealized appreciation (depreciation) | 418,908 | 20,253 | 1,252,676 | 561,566 | 1,057,832 |
Net increase (decrease) in net assets resulting from operations | $441,443 | $24,639 | $1,348,700 | $587,873 | $1,073,864 |
Capital Group Equity Exchange-Traded Funds | 23 |
International Equity ETF* | International Focus Equity ETF | |
Investment income: | ||
Income (net of non-U.S. taxes†): | ||
Dividends: | ||
Unaffiliated issuers | $1,600 | $29,951 |
Affiliated issuers | 163 | 3,140 |
1,763 | 33,091 | |
Fees and expenses: | ||
Investment advisory services | 288 | 9,918 |
Net investment income | 1,475 | 23,173 |
Net realized gain (loss) and unrealized appreciation (depreciation): | ||
Net realized gain (loss)† on: | ||
Investments in: | ||
Unaffiliated issuers | (1,661 ) | (110,995 ) |
Affiliated issuers | 1 | 27 |
In-kind redemptions | 711 | 105,799 |
Currency transactions | — | (409 ) |
(949 ) | (5,578 ) | |
Net unrealized appreciation (depreciation)† on: | ||
Investments in: | ||
Unaffiliated issuers | 10,575 | 291,502 |
Affiliated issuers | 1 | 3 |
Currency translations | (4 ) | 1 |
10,572 | 291,506 | |
Net realized gain (loss) and unrealized appreciation (depreciation) | 9,623 | 285,928 |
Net increase (decrease) in net assets resulting from operations | $11,098 | $309,101 |
* | For the period September 26, 2023, commencement of operations, through May 31, 2024. |
† | Additional information related to non-U.S. taxes is included in the notes to financial statements. |
24 | Capital Group Equity Exchange-Traded Funds |
Core Equity ETF | Dividend Growers ETF | Dividend Value ETF | ||||
Year ended | Year ended | Period ended | Year ended | Year ended | ||
May 31, 2024 | May 31, 2023 | May 31, 2024* | May 31, 2024 | May 31, 2023 | ||
Operations: | ||||||
Net investment income | $22,535 | $8,637 | $4,386 | $96,024 | $25,897 | |
Net realized gain (loss) | 38,564 | (19,479 ) | (1,379 ) | 218,645 | (24,394 ) | |
Net unrealized appreciation (depreciation) | 380,344 | 69,078 | 21,632 | 1,034,031 | 160,997 | |
Net increase (decrease) in net assets resulting from operations | 441,443 | 58,236 | 24,639 | 1,348,700 | 162,500 | |
Distributions paid to shareholders | (19,401 ) | (6,470 ) | (1,553 ) | (76,658 ) | (19,113 ) | |
Net capital share transactions | 1,403,364 | 676,898 | 334,122 | 4,781,929 | 1,747,392 | |
Total increase (decrease) in net assets | 1,825,406 | 728,664 | 357,208 | 6,053,971 | 1,890,779 | |
Net assets: | ||||||
Beginning of period | 892,915 | 164,251 | — | 2,191,653 | 300,874 | |
End of period | $2,718,321 | $892,915 | $357,208 | $8,245,624 | $2,191,653 |
Global Growth Equity ETF | Growth ETF | International Equity ETF | ||||
Year ended | Year ended | Year ended | Year ended | Period ended | ||
May 31, 2024 | May 31, 2023 | May 31, 2024 | May 31, 2023 | May 31, 2024* | ||
Operations: | ||||||
Net investment income | $26,307 | $11,234 | $16,032 | $7,045 | $1,475 | |
Net realized gain (loss) | 163,424 | (38,597 ) | 206,378 | (73,536 ) | (949 ) | |
Net unrealized appreciation (depreciation) | 398,142 | 162,966 | 851,454 | 250,331 | 10,572 | |
Net increase (decrease) in net assets resulting from operations | 587,873 | 135,603 | 1,073,864 | 183,840 | 11,098 | |
Distributions paid to shareholders | (16,124 ) | (4,483 ) | (13,239 ) | (3,264 ) | (95 ) | |
Net capital share transactions | 1,402,331 | 1,270,648 | 2,603,543 | 1,598,275 | 132,263 | |
Total increase (decrease) in net assets | 1,974,080 | 1,401,768 | 3,664,168 | 1,778,851 | 143,266 | |
Net assets: | ||||||
Beginning of period | 1,622,011 | 220,243 | 2,064,120 | 285,269 | — | |
End of period | $3,596,091 | $1,622,011 | $5,728,288 | $2,064,120 | $143,266 |
Capital Group Equity Exchange-Traded Funds | 25 |
International Focus Equity ETF | ||
Year ended | Year ended | |
May 31, 2024 | May 31, 2023 | |
Operations: | ||
Net investment income | $23,173 | $13,135 |
Net realized gain (loss) | (5,578 ) | (38,563 ) |
Net unrealized appreciation (depreciation) | 291,506 | 83,988 |
Net increase (decrease) in net assets resulting from operations | 309,101 | 58,560 |
Distributions paid to shareholders | (16,300 ) | (5,962 ) |
Net capital share transactions | 988,517 | 1,057,236 |
Total increase (decrease) in net assets | 1,281,318 | 1,109,834 |
Net assets: | ||
Beginning of period | 1,297,930 | 188,096 |
End of period | $2,579,248 | $1,297,930 |
* | For the period September 26, 2023, commencement of operations, through May 31, 2024. |
26 | Capital Group Equity Exchange-Traded Funds |
Capital Group Equity Exchange-Traded Funds | 27 |
Fixed-income class | Examples of standard inputs |
All | Benchmark yields, transactions, bids, offers, quotations from dealers and trading systems, new issues, spreads and other relationships observed in the markets among comparable securities; and proprietary pricing models such as yield measures calculated using factors such as cash flows, financial or collateral performance and other reference data (collectively referred to as “standard inputs”) |
Corporate bonds, notes & loans; convertible securities | Standard inputs and underlying equity of the issuer |
Bonds & notes of governments & government agencies | Standard inputs and interest rate volatilities |
Mortgage-backed; asset-backed obligations | Standard inputs and cash flows, prepayment information, default rates, delinquency and loss assumptions, collateral characteristics, credit enhancements and specific deal information |
28 | Capital Group Equity Exchange-Traded Funds |
Investment securities | ||||
Level 1 | Level 2 | Level 3 | Total | |
Assets: | ||||
Common stocks: | ||||
Information technology | $955,813 | $— | $— | $955,813 |
Health care | 576,111 | — | — | 576,111 |
Industrials | 512,821 | — | — | 512,821 |
Consumer discretionary | 503,998 | — | — | 503,998 |
Financials | 370,228 | — | — | 370,228 |
Communication services | 172,763 | — | — | 172,763 |
Consumer staples | 148,651 | — | — | 148,651 |
Energy | 123,219 | — | — * | 123,219 |
Materials | 98,815 | — | — | 98,815 |
Preferred securities | 40,297 | — | — | 40,297 |
Short-term securities | 64,195 | 26,505 | — | 90,700 |
Total | $3,566,911 | $26,505 | $— * | $3,593,416 |
* | Amount less than one thousand. |
Investment securities | ||||
Level 1 | Level 2 | Level 3 | Total | |
Assets: | ||||
Common stocks: | ||||
Information technology | $1,301,766 | $— | $— | $1,301,766 |
Communication services | 1,114,179 | — | — | 1,114,179 |
Health care | 834,531 | — | — | 834,531 |
Consumer discretionary | 716,527 | — | — | 716,527 |
Industrials | 651,801 | — | — | 651,801 |
Financials | 420,507 | — | — | 420,507 |
Energy | 227,748 | — | — | 227,748 |
Consumer staples | 180,255 | — | — | 180,255 |
Materials | 76,071 | — | — | 76,071 |
Utilities | 68,214 | — | — | 68,214 |
Rights & warrants | — | — | — * | — * |
Short-term securities | 114,011 | — | — | 114,011 |
Total | $5,705,610 | $— | $— * | $5,705,610 |
* | Amount less than one thousand. |
Capital Group Equity Exchange-Traded Funds | 29 |
30 | Capital Group Equity Exchange-Traded Funds |
Capital Group Equity Exchange-Traded Funds | 31 |
32 | Capital Group Equity Exchange-Traded Funds |
Core Equity ETF | Dividend Growers ETF | Dividend Value ETF | Global Growth Equity ETF | Growth ETF | |
Undistributed ordinary income | $5,472 | $2,818 | $26,709 | $10,569 | $743 |
Capital loss carryforward* | (59,969 ) | (3,940 ) | (193,041 ) | (128,789 ) | (199,903 ) |
Gross unrealized appreciation on investments | 466,610 | 26,605 | 1,232,687 | 603,320 | 1,130,802 |
Gross unrealized depreciation on investments | (20,673 ) | (5,033 ) | (45,817 ) | (58,248 ) | (50,777 ) |
Net unrealized appreciation (depreciation) on investments | 445,937 | 21,572 | 1,186,870 | 545,072 | 1,080,025 |
Cost of investments | 2,260,619 | 334,840 | 7,023,464 | 3,048,344 | 4,625,585 |
Reclassification from total accumulated loss to capital paid in on shares of beneficial interest | 77,201 | 2,639 | 372,394 | 262,827 | 332,621 |
International Equity ETF | International Focus Equity ETF | |
Undistributed ordinary income | $1,379 | $13,512 |
Capital loss carryforward* | (1,639 ) | (151,829 ) |
Gross unrealized appreciation on investments | 12,524 | 406,918 |
Gross unrealized depreciation on investments | (1,969 ) | (35,604 ) |
Net unrealized appreciation (depreciation) on investments | 10,555 | 371,314 |
Cost of investments | 132,296 | 2,188,655 |
Reclassification from total accumulated loss to capital paid in on shares of beneficial interest | 712 | 105,717 |
* | Each fund’s capital loss carryforward will be used to offset any capital gains realized by the fund in future years. Funds with a capital loss carryforward will not make distributions from capital gains while a capital loss carryforward remains. |
Year ended May 31, 2024 | Year ended May 31, 2023 | |||||
Fund | Ordinary income | Long-term capital gains | Total distributions paid | Ordinary income | Long-term capital gains | Total distributions paid |
Core Equity ETF | $19,401 | $— | $19,401 | $6,470 | $— | $6,470 |
Dividend Growers ETF | 1,553 * | — | 1,553 * | |||
Dividend Value ETF | 76,658 | — | 76,658 | 19,113 | — | 19,113 |
Global Growth Equity ETF | 16,124 | — | 16,124 | 4,483 | — | 4,483 |
Growth ETF | 13,239 | — | 13,239 | 3,264 | — | 3,264 |
International Equity ETF | 95 * | — | 95 * | |||
International Focus Equity ETF | 16,300 | — | 16,300 | 5,962 | — | 5,962 |
* | For the period September 26, 2023, commencement of operations, through May 31, 2024. |
Capital Group Equity Exchange-Traded Funds | 33 |
Fund | Annual rate |
Core Equity ETF | 0.33 % |
Dividend Growers ETF | 0.47 |
Dividend Value ETF | 0.33 |
Global Growth Equity ETF | 0.47 |
Growth ETF | 0.39 |
International Equity ETF | 0.54 |
International Focus Equity ETF | 0.54 |
Fund | Purchases | Sales | Net realized loss |
Core Equity ETF | $14,353 | $5,788 | $(1,473 ) |
Dividend Value ETF | 169,704 | 50,208 | (3,873 ) |
Global Growth Equity ETF | 34,966 | 12,569 | (449 ) |
Growth ETF | 123,375 | 51,188 | (21,440 ) |
International Focus Equity ETF | 15,993 | 2,104 | (38 ) |
34 | Capital Group Equity Exchange-Traded Funds |
Sales | Reinvestments of distributions | Repurchases | Net increase (decrease) | |||||
Amount | Shares | Amount | Shares | Amount | Shares | Amount | Shares | |
Year ended May 31, 2024 | ||||||||
$1,633,019 | 58,400 | $— | — | $(229,655 ) | (8,000 ) | $1,403,364 | 50,400 | |
Year ended May 31, 2023 | ||||||||
$698,131 | 30,700 | $— | — | $(21,233 ) | (920 ) | $676,898 | 29,780 |
Sales | Reinvestments of distributions | Repurchases | Net increase (decrease) | |||||
Amount | Shares | Amount | Shares | Amount | Shares | Amount | Shares | |
For the period September 26, 2023*, through May 31, 2024 | ||||||||
$349,622 | 13,004 | $— | — | $(15,500 ) | (560 ) | $334,122 | 12,444 |
Sales | Reinvestments of distributions | Repurchases | Net increase (decrease) | |||||
Amount | Shares | Amount | Shares | Amount | Shares | Amount | Shares | |
Year ended May 31, 2024 | ||||||||
$5,931,039 | 203,560 | $— | — | $(1,149,110 ) | (38,620 ) | $4,781,929 | 164,940 | |
Year ended May 31, 2023 | ||||||||
$1,822,959 | 77,100 | $— | — | $(75,567 ) | (3,040 ) | $1,747,392 | 74,060 |
Capital Group Equity Exchange-Traded Funds | 35 |
Sales | Reinvestments of distributions | Repurchases | Net increase (decrease) | |||||
Amount | Shares | Amount | Shares | Amount | Shares | Amount | Shares | |
Year ended May 31, 2024 | ||||||||
$2,247,291 | 86,560 | $— | — | $(844,960 ) | (32,480 ) | $1,402,331 | 54,080 | |
Year ended May 31, 2023 | ||||||||
$1,296,939 | 60,840 | $— | — | $(26,291 ) | (1,160 ) | $1,270,648 | 59,680 |
Sales | Reinvestments of distributions | Repurchases | Net increase (decrease) | |||||
Amount | Shares | Amount | Shares | Amount | Shares | Amount | Shares | |
Year ended May 31, 2024 | ||||||||
$3,487,718 | 123,180 | $— | — | $(884,175 ) | (29,980 ) | $2,603,543 | 93,200 | |
Year ended May 31, 2023 | ||||||||
$1,640,870 | 77,320 | $— | — | $(42,595 ) | (1,880 ) | $1,598,275 | 75,440 |
Sales | Reinvestments of distributions | Repurchases | Net increase (decrease) | |||||
Amount | Shares | Amount | Shares | Amount | Shares | Amount | Shares | |
For the period September 26, 2023*, through May 31, 2024 | ||||||||
$136,858 | 5,084 | $— | — | $(4,595 ) | (160 ) | $132,263 | 4,924 |
Sales | Reinvestments of distributions | Repurchases | Net increase (decrease) | |||||
Amount | Shares | Amount | Shares | Amount | Shares | Amount | Shares | |
Year ended May 31, 2024 | ||||||||
$1,336,817 | 55,800 | $— | — | $(348,300 ) | (14,280 ) | $988,517 | 41,520 | |
Year ended May 31, 2023 | ||||||||
$1,117,811 | 52,320 | $— | — | $(60,575 ) | (2,760 ) | $1,057,236 | 49,560 |
* | Commencement of operations. |
36 | Capital Group Equity Exchange-Traded Funds |
Fund | Purchases | Sales |
Core Equity ETF | $677,889 | $369,214 |
Dividend Growers ETF | 62,845 | 34,666 |
Dividend Value ETF | 2,593,702 | 1,194,491 |
Global Growth Equity ETF | 1,690,057 | 732,077 |
Growth ETF | 1,731,980 | 798,792 |
International Equity ETF | 30,916 | 17,265 |
International Focus Equity ETF | 1,237,648 | 641,248 |
Fund | In-kind creations | In-kind redemptions |
Core Equity ETF | $1,307,109 | $230,433 |
Dividend Growers ETF | 309,826 | 15,090 |
Dividend Value ETF | 4,351,408 | 1,137,564 |
Global Growth Equity ETF | 1,250,974 | 841,487 |
Growth ETF | 2,466,681 | 886,002 |
International Equity ETF | 117,666 | 4,125 |
International Focus Equity ETF | 719,010 | 348,386 |
Fund | Non-U.S. taxes paid on dividend income | Non-U.S. taxes paid on realized gains | Non-U.S. taxes provided on unrealized appreciation |
Core Equity ETF | $474 | $— | $— |
Dividend Growers ETF | 301 | — | — |
Dividend Value ETF | 1,721 | — | — |
Global Growth Equity ETF | 3,321 | 152 | 484 |
Growth ETF | 928 | — | — |
International Equity ETF | 206 | — | — |
International Focus Equity ETF | 2,893 | 1,663 | 5,146 |
Capital Group Equity Exchange-Traded Funds | 37 |
Income (loss) from investment operations1 | Dividends and distributions | |||||||||||
Year ended | Net asset value, beginning of year | Net investment income (loss) | Net gains (losses) on securities (both realized and unrealized) | Total from investment operations | Dividends (from net investment income) | Distributions (from capital gains) | Total dividends and distributions | Net asset value, end of year | Total return | Net assets, end of year (in millions) | Ratio of expenses to average net assets2 | Ratio of net income (loss) to average net assets |
Core Equity ETF | ||||||||||||
5/31/2024 | $24.33 | $.38 | $6.84 | $7.22 | $(.34 ) | $— | $(.34 ) | $31.21 | 29.90 % | $2,718 | .33 % | 1.34 % |
5/31/2023 | 23.72 | .39 | .52 | .91 | (.30 ) | — | (.30 ) | 24.33 | 3.96 | 893 | .33 | 1.70 |
5/31/20223,4 | 24.63 | .08 | (.96 ) | (.88 ) | (.03 ) | — | (.03 ) | 23.72 | (3.59 )5 | 164 | .09 5 | .34 5 |
Dividend Growers ETF | ||||||||||||
5/31/20243,6 | $24.76 | $.68 | $3.49 | $4.17 | $(.22 ) | $— | $(.22 ) | $28.71 | 16.86 %5 | $357 | .47 %7 | 3.73 %7 |
Dividend Value ETF | ||||||||||||
5/31/2024 | $25.39 | $.59 | $7.34 | $7.93 | $(.50 ) | $— | $(.50 ) | $32.82 | 31.48 % | $8,246 | .33 % | 1.99 % |
5/31/2023 | 24.57 | .52 | .68 | 1.20 | (.38 ) | — | (.38 ) | 25.39 | 5.12 | 2,192 | .33 | 2.16 |
5/31/20223,4 | 24.71 | .10 | (.21 ) | (.11 ) | (.03 ) | — | (.03 ) | 24.57 | (.46 )5 | 301 | .09 5 | .41 5 |
Global Growth Equity ETF | ||||||||||||
5/31/2024 | $23.22 | $.28 | $5.72 | $6.00 | $(.20 ) | $— | $(.20 ) | $29.02 | 25.97 % | $3,596 | .47 % | 1.08 % |
5/31/2023 | 21.67 | .28 | 1.39 | 1.67 | (.12 ) | — | (.12 ) | 23.22 | 7.80 | 1,622 | .47 | 1.27 |
5/31/20223,4 | 24.47 | .08 | (2.88 ) | (2.80 ) | — | — | — | 21.67 | (11.44 )5 | 220 | .13 5 | .38 5 |
Growth ETF | ||||||||||||
5/31/2024 | $23.39 | $.12 | $8.17 | $8.29 | $(.11 ) | $— | $(.11 ) | $31.57 | 35.55 % | $5,728 | .39 % | .44 % |
5/31/2023 | 22.28 | .13 | 1.05 | 1.18 | (.07 ) | — | (.07 ) | 23.39 | 5.33 | 2,064 | .39 | .62 |
5/31/20223,4 | 24.40 | .03 | (2.15 ) | (2.12 ) | — | — | — | 22.28 | (8.69 )5 | 285 | .10 5 | .13 5 |
International Equity ETF | ||||||||||||
5/31/20243,6 | $24.82 | $.51 | $3.82 | $4.33 | $(.05 ) | $— | $(.05 ) | $29.10 | 17.47 %5 | $143 | .54 %7 | 2.77 %7 |
International Focus Equity ETF | ||||||||||||
5/31/2024 | $22.45 | $.30 | $3.46 | $3.76 | $(.24 ) | $— | $(.24 ) | $25.97 | 16.85 % | $2,579 | .54 % | 1.26 % |
5/31/2023 | 22.82 | .38 | (.55 ) | (.17 ) | (.20 ) | — | (.20 ) | 22.45 | (.68 ) | 1,298 | .54 | 1.74 |
5/31/20223,4 | 24.51 | .24 | (1.93 ) | (1.69 ) | — | — | — | 22.82 | (6.90 )5 | 188 | .14 5 | 1.07 5 |
Portfolio turnover rate8 | Year ended May 31, 2024 | Year ended May 31, 2023 | Period ended May 31, 20223,4,5 |
Core Equity ETF | 22 % | 34 % | 8 % |
Dividend Growers ETF | 20 3,5,6 | ||
Dividend Value ETF | 25 | 30 | 3 |
Global Growth Equity ETF | 31 | 39 | 17 |
Growth ETF | 22 | 33 | 9 |
International Equity ETF | 23 3,5,6 | ||
International Focus Equity ETF | 36 | 43 | 21 |
1 | Based on average shares outstanding. |
2 | Ratios do not include expenses of any Central Funds. Each fund indirectly bears its proportionate share of the expenses of any Central Funds. |
3 | Based on operations for a period that is less than a full year. |
4 | For the period February 22, 2022, commencement of operations, through May 31, 2022. |
5 | Not annualized. |
6 | For the period September 26, 2023, commencement of operations, through May 31, 2024. |
7 | Annualized. |
8 | Rates do not include each fund’s portfolio activity with respect to any Central Funds. |
38 | Capital Group Equity Exchange-Traded Funds |
Fund | Statement of operations | Statement of changes in net assets | Financial highlights |
Capital Group Growth ETF | For the year ended May 31, 2024. | For each of the two years in the period ended May 31, 2024. | For each of the two years in the period ended May 31, 2024 and the period from February 22, 2022 (commencement of operations) through May 31, 2022. |
Capital Group Global Growth Equity ETF | |||
Capital Group International Focus Equity ETF | |||
Capital Group Core Equity ETF | |||
Capital Group Dividend Value ETF | |||
Capital Group Dividend Growers ETF | For the period September 26, 2023 (commencement of operations) through May 31, 2024. | ||
Capital Group International Equity ETF |
Capital Group Equity Exchange-Traded Funds | 39 |
Capital Group Core Equity ETF | Capital Group Dividend Growers ETF | Capital Group Dividend Value ETF | Capital Group Global Growth Equity ETF | Capital Group Growth ETF | Capital Group International Equity ETF | Capital Group International Focus Equity ETF | |
Foreign taxes (per share) | — | — | — | $0.02 | — | $0.03 | $0.04 |
Foreign source income (per share) | — | — | — | $0.21 | — | $0.37 | $0.33 |
Qualified dividend income | 100 % | 100 % | 100 % | 100 % | 100 % | 100 % | 100 % |
Section 163(j) interest dividends | — % | $99,781 | — % | — % | — % | $125,034 | $2,017,292 |
Corporate dividends received deduction | 100 % | $1,453,500 | 100 % | 100 % | 100 % | — % | — % |
U.S. government income that may be exempt from state taxation | $889,504 | $73,934 | $3,195,011 | $1,716,358 | $1,149,513 | $57,975 | $1,114,358 |
40 | Capital Group Equity Exchange-Traded Funds |
Capital Group Equity Exchange-Traded Funds | 41 |
ITEM 8 - Changes in and Disagreements with Accountants for Open-End Management Investment Companies
Not applicable, insofar as the Registrant did not have any changes in or disagreements with accountants.
ITEM 9 - Proxy Disclosures for Open-End Management Investment Companies
Not applicable, insofar as the Registrant did not have any proxy disclosures.
ITEM 10 - Remuneration Paid to Directors, Officers, and Others of Open-End Management Investment Companies
The information is included as part of the material filed under Item 7 of this Form.
ITEM 11 - Statement Regarding Basis for Approval of Investment Advisory Contract
Not applicable.
ITEM 12 - Disclosure of Proxy Voting Policies and Procedures for Closed-End Management Investment Companies
Not applicable to this Registrant, insofar as the Registrant is not a closed-end management investment company.
ITEM 13 - Portfolio Managers of Closed-End Management Investment Companies
Not applicable to this Registrant, insofar as the Registrant is not a closed-end management investment company.
ITEM 14 - Purchases of Equity Securities by Closed-End Management Investment Company and Affiliated Purchasers
Not applicable to this Registrant, insofar as the Registrant is not a closed-end management investment company.
ITEM 15 - Submission of Matters to a Vote of Security Holders
There have been no material changes to the procedures by which shareholders may recommend nominees to the Registrant’s board of trustees since the Registrant last submitted a proxy statement to its shareholders. The procedures are as follows. The Registrant has a nominating and governance committee comprised solely of persons who are not considered ‘‘interested persons’’ of the Registrant within the meaning of the Investment Company Act of 1940, as amended. The committee periodically reviews such issues as the board’s composition, responsibilities, committees, compensation and other relevant issues, and recommends any appropriate changes to the full board of trustees. While the committee normally is able to identify from its own resources an ample number of qualified candidates, it will consider shareholder suggestions of persons to be considered as nominees to fill future vacancies on the board. Such suggestions must be sent in writing to the nominating and governance committee of the Registrant, c/o the Registrant’s Secretary, and must be accompanied by complete biographical and occupational data on the prospective nominee, along with a written consent of the prospective nominee for consideration of his or her name by the nominating and governance committee.
ITEM 16 - Controls and Procedures
(a) The Registrant’s Principal Executive Officer and Principal Financial Officer have concluded, based on their evaluation of the Registrant’s disclosure controls and procedures (as such term is defined in Rule 30a-3 under the Investment Company Act of 1940), that such controls and procedures are adequate and reasonably designed to achieve the purposes described in paragraph (c) of such rule.
(b) There were no changes in the Registrant’s internal controls over financial reporting (as defined in Rule 30a-3(d) under the Investment Company Act of 1940) that occurred during the Registrant’s semi-annual period covered by this report that has materially affected, or is reasonably likely to materially affect, the Registrant’s internal control over financial reporting.
ITEM 17 - Disclosure of Securities Lending Activities for Closed-End Management Investment Companies
Not applicable to this Registrant, insofar as the Registrant is not a closed-end management investment company.
ITEM 18 - Recovery of Erroneously Awarded Compensation
Not applicable.
SIGNATURES
Pursuant to the requirements of the Securities Exchange Act of 1934 and the Investment Company Act of 1940, the Registrant has duly caused this report to be signed on its behalf by the undersigned, thereunto duly authorized.
Capital Group Growth ETF
By /s/ Michael W. Stockton
Michael W. Stockton,
Executive Vice President and Principal Executive Officer
Date: July 31, 2024
Pursuant to the requirements of the Securities Exchange Act of 1934 and the Investment Company Act of 1940, this report has been signed below by the following persons on behalf of the Registrant and in the capacities and on the dates indicated.
By /s/ Michael W. Stockton
Michael W. Stockton,
Executive Vice President and Principal Executive Officer
Date: July 31, 2024
By /s/ Troy S. Tanner
Troy S. Tanner, Treasurer and
Principal Financial Officer
Date: July 31, 2024