UNITED STATES
SECURITIES AND EXCHANGE COMMISSION
Washington, D.C. 20549
FORM
N-CSR
CERTIFIED SHAREHOLDER REPORT OF REGISTERED MANAGEMENT INVESTMENT COMPANIES
Investment Company Act file number
811-23738
Capital Group Fixed Income ETF Trust
(Exact name of registrant as specified in charter)
6455 Irvine Center Drive
Irvine, California 92618
Irvine, California 92618
(Address of principal executive offices)
Troy S. Tanner
6455 Irvine Center Drive
Irvine, California 92618
Irvine, California 92618
(Name and address of agent for service)
Registrant's telephone number, including area code:
(949) 975-5000
Date of fiscal year end:
December 31
Date of reporting period:
June 30, 2024
ITEM 1 - Reports to Stockholders

SEMI-ANNUAL SHAREHOLDER REPORT
Capital Group Core Bond ETF
CGCB
for the six months ended June 30, 2024Stock Exchange:
NYSE Arca, Inc.
This semi-annual shareholder report contains important information about Capital Group Core Bond ETF for the period from January 1, 2024 to June 30, 2024. You can find additional information about the fund at
capitalgroup.com/ETF-literature
. You can also request this information by contacting us at (800) 421-4225.What were the fund costs for the last six months?
(based on a hypothetical $10,000 investment)| Fund | Cost of $10,000 Investment | Costs paid as a percentage of a $10,000 investment |
| CGCB | $ 13 | 0.27%* |
*Annualized
Key fund statistics
| Fund net assets (in thousands) | $658,261 |
| Total number of portfolio holdings | 369 |
| Portfolio turnover rate including mortgage dollar roll transactions | 264% |
| Portfolio turnover rate excluding mortgage dollar roll transactions | 56 % |
Portfolio holdings by asset type
(percent of net assets)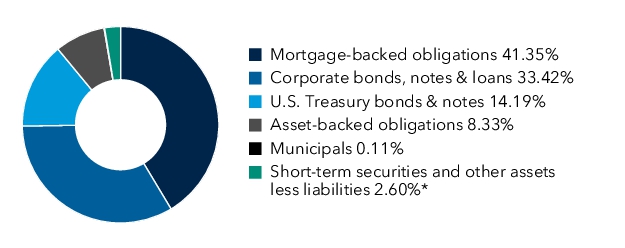
*Includes derivatives.
Availability of additional information

Scan the QR code to view additional information about the fund, including its prospectus, financial information, holdings and information on proxy voting. Or refer to the web address included at the beginning of this report.
Important information
To reduce fund expenses, only one copy of most shareholder documents will be mailed to shareholders with multiple accounts at the same address (householding). If you would prefer that your documents not be householded, please contact Capital Group at
(800) 421-4225
, or contact your financial intermediary. Your instructions will typically be effective within 30 days of receipt by Capital Group or your financial intermediary.Lit. No. ETMXSRX-312-0824 © 2024 Capital Group. All rights reserved.
SEMI-ANNUAL SHAREHOLDER REPORT
Capital Group Core Plus Income ETF
CGCP
for the six months ended June 30, 2024Stock Exchange:
NYSE Arca, Inc.
This semi-annual shareholder report contains important information about Capital Group Core Plus Income ETF for the period from January 1, 2024 to June 30, 2024. You can find additional information about the fund at
capitalgroup.com/ETF-literature
. You can also request this information by contacting us at (800) 421-4225.What were the fund costs for the last six months?
(based on a hypothetical $10,000 investment)| Fund | Cost of $10,000 Investment | Costs paid as a percentage of a $10,000 investment |
| CGCP | $ 17 | 0.34%* |
*Annualized
Key fund statistics
| Fund net assets (in millions) | $2,522 |
| Total number of portfolio holdings | 986 |
| Portfolio turnover rate including mortgage dollar roll transactions | 276% |
| Portfolio turnover rate excluding mortgage dollar roll transactions | 54% |
Portfolio holdings by asset type
(percent of net assets)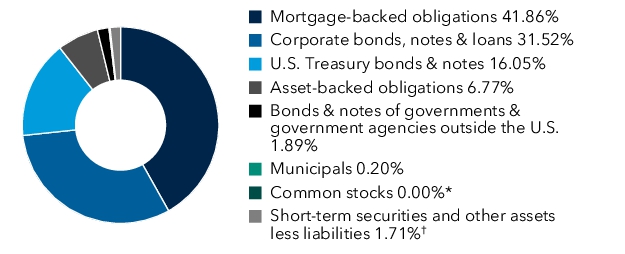
*
Less than 0.01%.†
Includes derivatives.Availability of additional information
Scan the QR code to view additional information about the fund, including its prospectus, financial information, holdings and information on proxy voting. Or refer to the web address included at the beginning of this report.
Important information
To reduce fund expenses, only one copy of most shareholder documents will be mailed to shareholders with multiple accounts at the same address (householding). If you would prefer that your documents not be householded, please contact Capital Group at
(800) 421-4225
, or contact your financial intermediary. Your instructions will typically be effective within 30 days of receipt by Capital Group or your financial intermediary.Lit. No. ETMXSRX-306-0824 © 2024 Capital Group. All rights reserved.
SEMI-ANNUAL SHAREHOLDER REPORT
Capital Group International Bond ETF (USD-Hedged)
CGIB
for the six months ended June 30, 2024Stock Exchange:
NYSE Arca, Inc.
This semi-annual shareholder report contains important information about Capital Group International Bond ETF (USD-Hedged) for the period from June 25, 2024, commencement of operations, to June 30, 2024. You can find additional information about the fund at
capitalgroup.com/ETF-literature
. You can also request this information by contacting us at (800) 421-4225.What were the fund costs for the last six months?
(based on a hypothetical $10,000 investment)| Fund | Cost of $10,000 Investment | Costs paid as a percentage of a $10,000 investment |
| CGIB | $ 0 1,2 | 0.45% 3 |
1
Amount less than $1.2
Based on operations for the period from June 25, 2024 to June 30, 2024. Expenses for the full 6 months would be higher.3
Annualized.Key fund statistics
| Fund net assets (in thousands) | $49,325 |
| Total number of portfolio holdings | 137 |
| Portfolio turnover rate | 70% |
Portfolio holdings by asset type
(percent of net assets)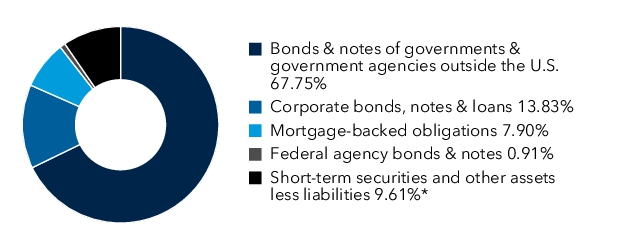
*Includes derivatives.
Availability of additional information
Scan the QR code to view additional information about the fund, including its prospectus, financial information, holdings and information on proxy voting. Or refer to the web address included at the beginning of this report.
Important information
To reduce fund expenses, only one copy of most shareholder documents will be mailed to shareholders with multiple accounts at the same address (householding). If you would prefer that your documents not be householded, please contact Capital Group at
(800) 421-4225
, or contact your financial intermediary. Your instructions will typically be effective within 30 days of receipt by Capital Group or your financial intermediary.Lit. No. ETMXSRX-321-0824 © 2024 Capital Group. All rights reserved.
SEMI-ANNUAL SHAREHOLDER REPORT
Capital Group Municipal Income ETF
CGMU
for the six months ended June 30, 2024Stock Exchange:
NYSE Arca, Inc.
This semi-annual shareholder report contains important information about Capital Group Municipal Income ETF for the period from January 1, 2024 to June 30, 2024. You can find additional information about the fund at
capitalgroup.com/ETF-literature
. You can also request this information by contacting us at (800) 421-4225.What were the fund costs for the last six months?
(based on a hypothetical $10,000 investment)| Fund | Cost of $10,000 Investment | Costs paid as a percentage of a $10,000 investment |
| CGMU | $ 13 | 0.27%* |
*Annualized
Key fund statistics
| Fund net assets (in thousands) | $789,525 |
| Total number of portfolio holdings | 796 |
| Portfolio turnover rate | 8 % |
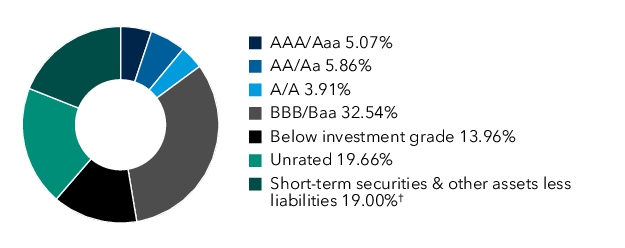
Portfolio quality summary
*
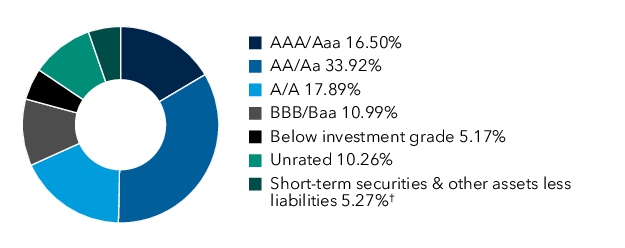
*
Bond ratings, which typically range from AAA/Aaa (highest) to D (lowest), are assigned by credit rating agencies such as Standard & Poor’s, Moody’s and/or Fitch as an indication of an issuer’s creditworthiness. In assigning a credit rating to a security, the fund looks specifically to the ratings assigned to the issuer of the security by Standard & Poor’s, Moody’s and/or Fitch. If agency ratings differ, the security will be considered to have received the highest of those ratings, consistent with the fund’s investment policies.†
Includes derivatives.Availability of additional info
rma
tionScan the QR code to view additional information about the fund, including its prospectus, financial information, holdings and information on proxy voting. Or refer to the web address included at the beginning of this report.
Important information
To reduce fund expenses, only one copy of most shareholder documents will be mailed to shareholders with multiple accounts at the same address (householding). If you would prefer that your documents not be householded, please contact Capital Group at
(800) 421-4225
,or
contact your financial intermediary. Your instructions will typically be effective within 30 days of receipt by Capital Group or your financial intermediary.Lit. No. ETMXSRX-309-0824 © 2024 Capital Group. All rights reserved.
SEMI-ANNUAL SHAREHOLDER REPORT
Capital Group Municipal High-Income ETF
CGHM
for the six months ended June 30, 2024Stock Exchange:
NYSE Arca, Inc.
This semi-annual shareholder report contains important information about Capital Group Municipal High-Income ETF for the period from June 25, 2024, commencement of operations, to June 30, 2024. You can find additional information about the fund at
capitalgroup.com/ETF-literature
. You can also request this information by contacting us at (800) 421-4225.What were the fund costs for the last six months?
(based on a hypothetical $10,000 investment)| Fund | Cost of $10,000 Investment | Costs paid as a percentage of a $10,000 investment |
| CGHM | $ 0 1,2 | 0.34% 3 |
1
Amount less than $1.2
Based on operations for the period from June 25, 2024 to June 30, 2024. Expenses for the full 6 months would be higher.3
Annualized.Key fund statistics
| Fund net assets (in thousands) | $20,045 |
| Total number of portfolio holdings | 55 |
| Portfolio turnover rate | 3 % |
Portfolio quality summary
*
*
Bond ratings, which typically range from AAA/Aaa (highest) to D (lowest), are assigned by credit rating agencies such as Standard & Poor’s, Moody’s and/or Fitch as an indication of an issuer’s creditworthiness. In assigning a credit rating to a security, the fund looks specifically to the ratings assigned to the issuer of the security by Standard & Poor’s, Moody’s and/or Fitch. If agency ratings differ, the security will be considered to have received the highest of those ratings, consistent with the fund’s investment policies.†
Includes derivatives.Availability of additional information
Scan the QR code to view additional information about the fund, including its prospectus, financial information, holdings and information on proxy voting. Or refer to the web address included at the beginning of this report.
Important information
To reduce fund expenses, only one copy of most shareholder documents will be mailed to shareholders with multiple accounts at the same address (householding). If you would prefer that your doc
um
ents not be householded, please contact Capital Group at(800) 421-4225
, or contact your financial intermediary. Your instructions will typically be effective within 30 days of receipt by Capital Group or your financial intermediary.Lit. No. ETMXSRX-322-0824 © 2024 Capital Group. All rights reserved.
SEMI
-ANNUAL SHAREHOLDER REPORTCapital Group Short Duration Income ETF
CGSD
for the six months ended June 30, 2024Stock Exchange:
NYSE Arca, Inc.
This semi-annual shareholder report contains important information about Capital Group Short Duration Income ETF for the period from January 1, 2024 to June 30, 2024. You can find additional information about the fund at
capitalgroup.com/ETF-literature
. You can also request this information by contacting us at (800) 421-4225.What were the fund costs for the last six months?
(based on a hypothetical $10,000
investment)| Fund | Cost of $10,000 Investment | Costs paid as a percentage of a $10,000 investment |
| CGSD | $13 | 0.25 % * |
*Annualized
Key fund statistics
| Fund net assets (in thousands) | $556,991 |
| Total number of portfolio holdings | 624 |
| Portfolio turnover rate including mortgage dollar roll transactions | 109% |
| Portfolio turnover rate excluding mortgage dollar roll transactions | 26 % |
Portfolio holdings by asset type
(percent of net assets)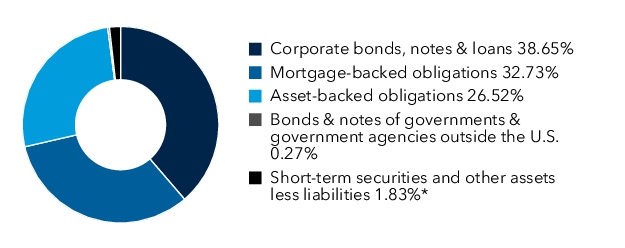
*Includes derivatives.
Availability of additional information
Scan the QR code to view additional information about the fund, including its prospectus, financial information, holdings and information on proxy voting. Or refer to the web address included at the beginning of this report.
Important information
To reduce fund expenses, only one copy of most shareholder documents will be mailed to shareholders with multiple accounts at the same address (householding). If you would prefer that your documents not be householded, please contact Capital Group at
(800) 421-4225
, or contact your financial intermediary. Your instructions will typically be effective within 30 days of receipt by Capital Group or your financial intermediary.Lit. No. ETMXSRX-307-0824 © 2024 Capital Group. All rights reserved.
SEMI-ANNUAL SHAREHOLDER REPORT
Capital Group Short Duration Municipal Income ETF
CGSM
forthe
six
months ended June 30, 2024Stock Exchange:
NYSE Arca, Inc.
This semi-annual shareholder report contains important information about Capital Group Short Duration Municipal Income ETF for the period from January 1, 2024 to June 30, 2024. You can find additional information about the fund at
capitalgroup.com/ETF-literature
. You can also request this information by contacting us at (800) 421-4225.What were the fund costs for the last six months?
(based on a hypothetical $10,000 investment)| Fund | Cost of $10,000 Investment | Costs paid as a percentage of a $10,000 investment |
| CGSM | $13 | 0.25 % * |
*Annualized
Key fund statistics
| Fund net assets (in thousands) | $53,992 |
| Total number of portfolio holdings | 129 |
| Portfolio turnover rate | 21% |
Portfolio quality summary
*
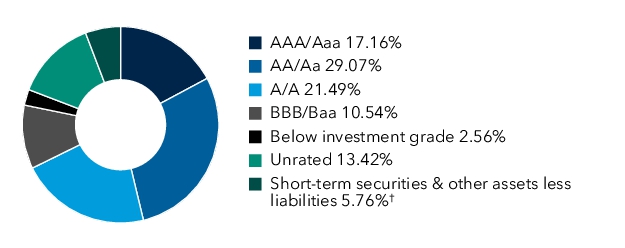
*
Bond ratings, which typically range from AAA/Aaa (highest) to D (lowest), are assigned by credit rating agencies such as Standard & Poor’s, Moody’s and/or Fitch as an indication of an issuer’s creditworthiness. In assigning a credit rating to a security, the fund looks specifically to the ratings assigned to the issuer of the security by Standard & Poor’s, Moody’s and/or Fitch. If agency ratings differ, the security will be considered to have received the highest of those ratings, consistent with the fund’s investment policies.†
Includes derivatives.Availability of
additional
informationScan the QR code to view additional information about the fund, including its prospectus, financial information, holdings and information on proxy voting. Or refer to the web address included at the beginning of this report.
Important information
To reduce fund
expenses
, only one copy of most shareholder documents will be mailed to shareholders with multiple accounts at the same address (householding). If youwould
prefer that your documents not be householded, please contact Capital Group at(800) 421-4225
, or contact your financial intermediary. Your instructions will typically be effective within 30 days of receipt by Capital Group or your financial intermediary.Lit. No. ETMXSRX-313-0824 © 2024 Capital Group. All rights reserved.
SEMI-ANNUAL SHAREHOLDER REPORT
Capital Group Ultra Short Income ETF
CGUI
for the six months ended June 30, 2024Stock Exchange:
NYSE Arca, Inc.
This semi-annual shareholder report contains important information about Capital Group Ultra Short Income ETF for the period from June 25, 2024, commencement of operations, to June 30, 2024. You can find additional information about the fund at
capitalgroup.com/ETF-literature
. You can also request this information by contacting us at (800) 421-4225.What were the fund costs for the last six months?
(based on a hypothetical $10,000 investment)| Fund | Cost of $10,000 Investment | Costs paid as a percentage of a $10,000 investment |
| CGUI | $ 01,2 | 0.18 % 3 |
1
Amount less than $1.2
Based on operations for the period from June 25, 2024 to June 30, 2024. Expenses for the full 6 months would be higher.3
Annualized.Key fund statistics
| Fund net assets (in thousands) | $30,025 |
| Total number of portfolio holdings | 170 |
| Portfolio turnover rate | 1 % |
Portfolio holdings by asset type
(percent of net assets)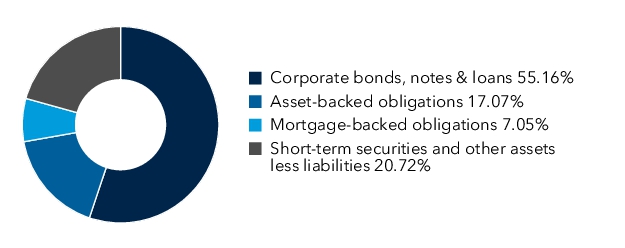
Availability of additional information
Scan the QR code to view additional information about the fund, including its prospectus, financial information, holdings and information on proxy voting. Or refer to the web address included at the beginning of this report.
Important information
To reduce fund
expenses
, only one copy of most shareholder documents will be mailed to shareholders with multiple accounts at the same address (householding). If you would prefer that your documents not be householded, please contact Capital Group at(800) 421-4225
, or contact your financial intermediary. Your instructions will typically be effective within 30 days of receipt by Capital Group or your financial intermediary.Lit. No. ETMXSRX-320-0824 © 2024 Capital Group. All rights reserved.
SEMI-ANNUAL SHAREHOLDER REPORT
Capital Group U.S. Multi-Sector Income ETF
CGMS
for the six months ended June 30, 2024Stock
Exchange
:NYSE Arca, Inc.
This semi-annual shareholder report contains important information about Capital Group U.S. Multi-Sector Income ETF for the period from January 1, 2024 to June 30, 2024. You can find additional information about the fund at
capitalgroup.com/ETF-literature
. You can also request this information by contacting us at (800) 421-4225.What were the fund costs for the last six months?
(based on a hypothetical $10,000 investment)| Fund | Cost of $10,000 Investment | Costs paid as a percentage of a $10,000 investment |
| CGMS | $20 | 0.39 % * |
*Annualized
Key fund statistics
| Fund net assets (in millions) | $896 |
| Total number of portfolio holdings | 1,018 |
| Portfolio turnover rate | 23% |
Portfolio holdings by asset type
(percent of net assets)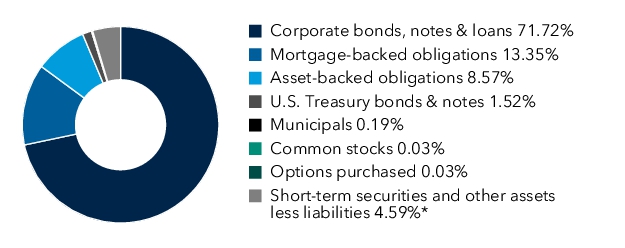
*Includes derivatives.
Availability
of
additional informationScan the QR code to view additional information about the fund, including its prospectus, financial information, holdings and information on proxy voting. Or refer to the web address included at the beginning of this report.
Important information
To reduce fund expenses, only one copy of most shareholder documents will be mailed to shareholders with multiple accounts at the same address (householding). If you would prefer that your documents not be householded, please contact Capital Group at
(800) 421-4225
, or contact your financial intermediary. Your instructions will typically be effective within 30 days of receipt by Capital Group or your financial intermediary.Lit. No. ETMXSRX-308-0824 © 2024 Capital Group. All rights reserved.
ITEM 2 - Code of Ethics
Not applicable for filing of semi-annual reports to shareholders.
ITEM 3 - Audit Committee Financial Expert
Not applicable for filing of semi-annual reports to shareholders.
ITEM 4 - Principal Accountant Fees and Services
Not applicable for filing of semi-annual reports to shareholders.
ITEM 5 - Audit Committee of Listed Registrants
Not applicable for filing of semi-annual reports to shareholders.
ITEM 6 - Investments
The schedule of investments is included as part of the material filed under Item 7 of this Form.
ITEM 7 - Financial Statements and Financial Highlights for Open-End Management Investment Companies

Capital Group Fixed Income ETF Trust
Financial Statements and Other Information
N-CSR Items 7-11
N-CSR Items 7-11
for the six months ended June 30, 2024
Lit. No. ETGEFP2-350-0824 © 2024 Capital Group. All rights reserved.
Capital Group Core Bond ETFunaudited
Investment portfolio June 30, 2024
Bonds, notes & other debt instruments 97.40% | Principal amount (000) | Value (000) | ||
Mortgage-backed obligations 41.35% | ||||
Federal agency mortgage-backed obligations 30.63% | ||||
Fannie Mae Pool #BQ7006 2.00% 1/1/2052 | USD2,778 | $2,180 | ||
Fannie Mae Pool #MA4562 2.00% 3/1/20521 | 641 | 503 | ||
Fannie Mae Pool #FS1598 2.00% 4/1/2052 | 1,971 | 1,544 | ||
Fannie Mae Pool #MA4577 2.00% 4/1/2052 | 1,200 | 941 | ||
Fannie Mae Pool #MA4623 2.50% 6/1/20521 | 1,150 | 942 | ||
Fannie Mae Pool #MA4743 2.50% 8/1/20521 | 1,752 | 1,433 | ||
Fannie Mae Pool #MA4768 2.50% 9/1/20521 | 2,278 | 1,864 | ||
Fannie Mae Pool #FS4191 5.50% 3/1/20531 | 272 | 268 | ||
Fannie Mae Pool #BY0943 4.00% 4/1/20531 | 855 | 783 | ||
Fannie Mae Pool #MA5027 4.00% 5/1/2053 | 249 | 228 | ||
Fannie Mae Pool #MA5177 4.00% 10/1/2053 | 991 | 907 | ||
Fannie Mae Pool #MA5163 4.50% 10/1/20531 | 1,005 | 947 | ||
Fannie Mae Pool #MA5207 4.00% 11/1/2053 | 37 | 34 | ||
Fannie Mae Pool #CB7862 6.00% 1/1/20541 | 479 | 482 | ||
Fannie Mae Pool #MA5274 7.00% 2/1/2054 | 325 | 335 | ||
Fannie Mae Pool #MA5341 4.00% 4/1/2054 | 562 | 514 | ||
Fannie Mae Pool #DB3607 4.00% 5/1/2054 | 250 | 229 | ||
Fannie Mae Pool #CB8755 6.00% 6/1/2054 | 813 | 819 | ||
Fannie Mae Pool #BF0765 3.50% 9/1/2063 | 12,908 | 11,249 | ||
Freddie Mac Pool #QD1841 2.00% 11/1/2051 | 3,553 | 2,788 | ||
Freddie Mac Pool #SD8199 2.00% 3/1/2052 | 2,747 | 2,154 | ||
Freddie Mac Pool #QD8010 2.00% 3/1/2052 | 1,001 | 786 | ||
Freddie Mac Pool #SD8204 2.00% 4/1/20521 | 3,089 | 2,423 | ||
Freddie Mac Pool #QE0312 2.00% 4/1/2052 | 1,003 | 787 | ||
Freddie Mac Pool #SD8225 3.00% 7/1/2052 | 3,487 | 2,971 | ||
Freddie Mac Pool #SD3117 4.00% 7/1/2052 | 2,234 | 2,049 | ||
Freddie Mac Pool #SD8234 2.50% 8/1/20521 | 162 | 132 | ||
Freddie Mac Pool #SD8237 4.00% 8/1/20521 | 816 | 747 | ||
Freddie Mac Pool #SD8242 3.00% 9/1/20521 | 2,620 | 2,231 | ||
Freddie Mac Pool #SD8324 5.50% 5/1/20531 | 1,066 | 1,052 | ||
Freddie Mac Pool #SD8388 3.50% 10/1/20531 | 1,008 | 893 | ||
Freddie Mac Pool #SD8379 4.00% 10/1/2053 | 986 | 903 | ||
Freddie Mac Pool #SD4977 5.00% 11/1/2053 | 5,755 | 5,565 | ||
Freddie Mac Pool #SD8408 5.50% 3/1/20541 | 1,274 | 1,257 | ||
Freddie Mac Seasoned Loan Structured Transaction Trust, Series 20-3, Class AC, 2.00% 11/25/20301 | 263 | 228 | ||
Freddie Mac Seasoned Loan Structured Transaction Trust, Series 21-1, Class AC, 2.25% 5/26/20311 | 262 | 230 | ||
Freddie Mac Seasoned Loan Structured Transaction Trust, Series 21-2, Class AD, 2.00% 7/25/20311 | 282 | 245 | ||
Freddie Mac Seasoned Loan Structured Transaction Trust, Series 20-2, Class AC, 2.00% 9/27/20601 | 268 | 233 | ||
Uniform Mortgage-Backed Security 2.00% 7/1/20541 | 21,655 | 16,940 | ||
Uniform Mortgage-Backed Security 2.50% 7/1/20541 | 26,662 | 21,774 | ||
Uniform Mortgage-Backed Security 3.00% 7/1/20541 | 13,070 | 11,120 | ||
Uniform Mortgage-Backed Security 3.50% 7/1/20541 | 2,551 | 2,258 | ||
Uniform Mortgage-Backed Security 4.00% 7/1/20541 | 7,970 | 7,293 | ||
Uniform Mortgage-Backed Security 4.50% 7/1/20541 | 20,269 | 19,111 | ||
Uniform Mortgage-Backed Security 5.00% 7/1/20541 | 15,280 | 14,769 | ||
Uniform Mortgage-Backed Security 5.50% 7/1/20541 | 6,202 | 6,117 | ||
Uniform Mortgage-Backed Security 6.00% 7/1/20541 | 23,810 | 23,880 | ||
Uniform Mortgage-Backed Security 6.50% 7/1/20541 | 24,038 | 24,468 | ||
201,606 | ||||
Collateralized mortgage-backed obligations (privately originated) 6.93% | ||||
BRAVO Residential Funding Trust, Series 2024-RPL1, Class A1, 3.25% 10/25/20631,2,3 | 5,000 | 4,522 | ||
Cascade Funding Mortgage Trust, Series 2023-HB12, Class M1, 4.25% 4/25/20331,2,3 | 500 | 476 | ||
Cascade Funding Mortgage Trust, Series 2024-HB13, Class M1, 3.00% 5/25/20341,2,3 | 2,100 | 1,904 | ||
Cascade Funding Mortgage Trust, Series 2024-HB13, Class A, 3.00% 5/25/20341,2,3 | 1,064 | 1,021 | ||
Connecticut Avenue Securities Trust, Series 2022-R07, Class 1M1, (30-day Average USD-SOFR + 2.95%) 8.285% 6/25/20421,2,3 | 105 | 108 | ||
1 | Capital Group Fixed Income ETF Trust |
Capital Group Core Bond ETF (continued)
Bonds, notes & other debt instruments (continued) | Principal amount (000) | Value (000) | ||
Mortgage-backed obligations (continued) | ||||
Collateralized mortgage-backed obligations (privately originated) (continued) | ||||
Connecticut Avenue Securities Trust, Series 2023-R01, Class 1M1, (30-day Average USD-SOFR + 2.40%) 7.735% 12/25/20421,2,3 | USD282 | $290 | ||
Connecticut Avenue Securities Trust, Series 2023-R04, Class 1M1, (30-day Average USD-SOFR + 2.30%) 7.635% 5/25/20431,2,3 | 411 | 422 | ||
Connecticut Avenue Securities Trust, Series 2024-R01, Class 1M1, (30-day Average USD-SOFR + 1.05%) 6.385% 1/25/20441,2,3 | 139 | 139 | ||
Connecticut Avenue Securities Trust, Series 2024-R02, Class 1M1, (30-day Average USD-SOFR + 1.10%) 6.435% 2/25/20441,2,3 | 168 | 168 | ||
Connecticut Avenue Securities Trust, Series 2024-R04, Class 1A1, (30-day Average USD-SOFR + 1.00%) 6.324% 5/25/20441,2,3 | 280 | 280 | ||
Connecticut Avenue Securities Trust, Series 2024-R04, Class 1M1, (30-day Average USD-SOFR + 1.10%) 6.424% 5/25/20441,2,3 | 386 | 387 | ||
Freddie Mac Structured Agency Credit Risk Debt Notes, Series 2024-DNA1, Class A1, (30-day Average USD-SOFR + 1.35%) 6.685% 2/25/20441,2,3 | 482 | 486 | ||
Freddie Mac Structured Agency Credit Risk Debt Notes, Series 2024-DNA2, Class M1, (30-day Average USD-SOFR + 1.20%) 6.535% 5/25/20441,2,3 | 1,828 | 1,832 | ||
Freddie Mac Structured Agency Credit Risk Debt Notes, Series 2024-DNA2, Class A1, (30-day Average USD-SOFR + 1.25%) 6.585% 5/25/20441,2,3 | 1,624 | 1,631 | ||
GCAT Trust, Series 2024-NQM1, Class A1, 6.007% 1/25/2059 (7.007% on 1/1/2028)1,2,4 | 244 | 245 | ||
GCAT Trust, Series 2024-NQM2, Class A1, 6.085% 6/25/2059 (7.359% on 5/1/2028)1,2,4 | 466 | 467 | ||
GS Mortgage-Backed Securities Trust, Series 2024-RPL2, Class A1, 3.75% 7/25/2061 (4.75% on 2/1/2028)1,2,4 | 744 | 705 | ||
JP Morgan Mortgage Trust, Series 2016-3, Class B2, 3.29% 10/25/20461,2,3 | 309 | 289 | ||
JP Morgan Mortgage Trust, Series 2017-1, Class B2, 3.449% 1/25/20471,2,3 | 437 | 384 | ||
JP Morgan Mortgage Trust, Series 2019-6, Class B3, 4.272% 12/25/20491,2,3 | 1,127 | 1,018 | ||
Legacy Mortgage Asset Trust, Series 2020-GS4, Class A1, 6.25% 2/25/2060 (7.25% on 5/28/2024)1,2,4 | 1,086 | 1,090 | ||
Legacy Mortgage Asset Trust, Series 2020-GS3, Class A1, 7.25% 5/25/2060 (7.25% on 4/25/2024)1,2,4 | 1,508 | 1,530 | ||
Legacy Mortgage Asset Trust, Series 2021-GS4, Class A1, 1.65% 11/25/2060 (4.65% on 8/25/2024)1,2,4 | 1,953 | 1,906 | ||
Legacy Mortgage Asset Trust, Series 2021-GS1, Class A1, 4.892% 10/25/20661,2,4 | 2,393 | 2,354 | ||
Legacy Mortgage Asset Trust, Series 2021-GS5, Class A1, 2.25% 7/25/2067 (5.25% on 11/25/2024)1,2,4 | 343 | 334 | ||
Morgan Stanley Residential Mortgage Loan Trust, Series 2024-NQM2, Class A1, 6.386% 5/25/2069 (7.386% on 5/1/2028)1,2,4 | 2,956 | 2,987 | ||
New York Mortgage Trust, Series 2024-CP1, Class A1, 3.75% 2/25/20681,2,3 | 150 | 138 | ||
Ocwen Loan Investment Trust, Series 2024-HB1, Class A, 3.00% 2/25/20371,2 | 1,123 | 1,075 | ||
Onslow Bay Financial Mortgage Loan Trust, Series 2024-HYB1, Class A1, 3.564% 3/25/20531,2,3 | 295 | 286 | ||
Onslow Bay Financial, LLC, Series 2024-NQM5, Class A1, 5.988% 3/25/2028 (6.988% on 3/1/2028)1,2,4 | 401 | 401 | ||
Onslow Bay Financial, LLC, Series 2024-HYB2, Class A1, 3.601% 4/25/20531,2,3 | 650 | 624 | ||
Onslow Bay Financial, LLC, Series 2022-NQM6, Class A1, 4.70% 7/25/2062 (5.70% on 6/1/2026)1,2,4 | 1,968 | 1,921 | ||
Onslow Bay Financial, LLC, Series 2024-NQM1, Class A1, 5.928% 11/25/2063 (6.928% on 12/1/2027)1,2,4 | 323 | 323 | ||
Onslow Bay Financial, LLC, Series 2024-NQM4, Class A1, 6.067% 1/25/2064 (7.067% on 2/1/2028)1,2,4 | 391 | 391 | ||
Onslow Bay Financial, LLC, Series 2024-NQM7, Class A1, 6.243% 3/25/2064 (7.243% on 4/1/2028)1,2,4 | 554 | 557 | ||
Onslow Bay Financial, LLC, Series 2024-NQM8, Class A1, 6.233% 5/25/20641,2,4 | 4,226 | 4,249 | ||
Progress Residential Trust, Series 2021-SFR6, Class A, 1.524% 7/17/20381,2 | 391 | 362 | ||
Progress Residential Trust, Series 2024-SFR1, Class A, 3.35% 2/17/20411,2 | 154 | 142 | ||
Progress Residential Trust, Series 2024-SFR1, Class D, 3.75% 2/17/20411,2 | 300 | 271 | ||
Progress Residential Trust, Series 2024-SFR2, Class A, 3.30% 4/17/20411,2 | 546 | 500 | ||
Progress Residential Trust, Series 2024-SFR2, Class B, 3.40% 4/17/20411,2,3 | 313 | 282 | ||
Progress Residential Trust, Series 2024-SFR3, Class A, 3.097% 6/17/2041 (3.00% on 7/1/2024)1,2 | 1,968 | 1,773 | ||
Capital Group Fixed Income ETF Trust | 2 |
Capital Group Core Bond ETF (continued)
Bonds, notes & other debt instruments (continued) | Principal amount (000) | Value (000) | ||
Mortgage-backed obligations (continued) | ||||
Collateralized mortgage-backed obligations (privately originated) (continued) | ||||
Tricon Residential, Series 2024-SFR2, Class B, 5.70% 6/17/20281,2 | USD3,246 | $3,223 | ||
Verus Securitization Trust, Series 2024-3, Class A1, 6.338% 4/25/2069 (7.338% on 4/1/2028)1,2,4 | 1,075 | 1,081 | ||
Verus Securitization Trust, Series 2024-4, Class A1, 6.218% 6/25/2069 (7.218% on 5/1/2028)1,2,4 | 1,005 | 1,010 | ||
45,584 | ||||
Commercial mortgage-backed securities 3.79% | ||||
AMSR Trust, Series 2023-SFR2, Class A, 3.95% 6/17/20401,2 | 160 | 152 | ||
ARES Commercial Mortgage Trust., Series 24-IND, Class A, (1-month USD CME Term SOFR + 1.69%) 7.012% 7/15/20411,2,3 | 447 | 447 | ||
Bank Commercial Mortgage Trust, Series 2019-BN19, Class A3, 3.183% 8/15/20611 | 35 | 31 | ||
Benchmark Mortgage Trust, Series 2018-B2, Class A5, 3.882% 2/15/20511,3 | 38 | 36 | ||
Benchmark Mortgage Trust, Series 2021-B25, Class A5, 2.577% 4/15/20541 | 250 | 204 | ||
Benchmark Mortgage Trust, Series 2024-V7, Class A3, 6.228% 5/15/20561,3 | 4,348 | 4,495 | ||
Benchmark Mortgage Trust, Series 2024-V5, Class AM, 6.417% 1/10/20571 | 118 | 121 | ||
BLP Commercial Mortgage Trust, Series 2024-IND2, Class A, (1-month USD CME Term SOFR + 1.342%) 6.671% 3/15/20411,2,3 | 314 | 312 | ||
BMP Trust, Series 2024-MF23, Class A, (1-month USD CME Term SOFR + 1.372%) 6.701% 6/15/20411,2,3 | 1,996 | 1,986 | ||
BX Trust, Series 2024-KING, Class A, (1-month USD CME Term SOFR + 1.541%) 6.87% 5/15/20341,2,3 | 664 | 665 | ||
BX Trust, Series 2021-VOLT, Class A, (1-month USD CME Term SOFR + 0.814%) 6.143% 9/15/20361,2,3 | 2,000 | 1,976 | ||
BX Trust, Series 2022-AHP, Class A, (1-month USD CME Term SOFR + 0.99%) 6.319% 2/15/20391,2,3 | 1,500 | 1,484 | ||
Citigroup Commercial Mortgage Trust, Series 2016-GC37, Class A4, 3.314% 4/10/20491 | 280 | 269 | ||
CSAIL Commercial Mortgage Trust, Series 2017-CX9, Class A4, 3.176% 9/15/20501 | 325 | 310 | ||
ELM Trust 2024, Series 2024-ELM, Class D15, 6.674% 6/10/20291,2,3 | 210 | 210 | ||
ELM Trust 2024, Series 2024-ELM, Class A15, 5.801% 6/10/20391,2,3 | 1,736 | 1,739 | ||
ELM Trust 2024, Series 2024-ELM, Class A10, 5.801% 6/10/20391,2,3 | 1,577 | 1,580 | ||
ELM Trust 2024, Series 2024-ELM, Class B10, 5.995% 6/10/20391,2,3 | 1,057 | 1,059 | ||
ELM Trust 2024, Series 2024-ELM, Class B15, 5.995% 6/10/20391,2,3 | 949 | 951 | ||
ELM Trust 2024, Series 2024-ELM, Class C15, 6.189% 6/10/20391,2,3 | 661 | 663 | ||
ELM Trust 2024, Series 2024-ELM, Class C10, 6.189% 6/10/20391,2,3 | 595 | 596 | ||
ELM Trust 2024, Series 2024-ELM, Class D10, 6.626% 6/10/20391,2,3 | 234 | 234 | ||
FS Commercial Trust, Series 2023-4SZN, Class A, 7.066% 11/10/20391,2 | 121 | 125 | ||
Great Wolf Trust, Series 2024-WLF2, Class A, (1-month USD CME Term SOFR + 1.691%) 7.02% 5/15/20411,2,3 | 1,446 | 1,448 | ||
GS Mortgage Securities Trust., Series 2024-70P, Class A, 5.487% 3/6/20291,2,3 | 479 | 469 | ||
Hilton USA Trust, Series 2024-ORL, Class A, (1-month USD CME Term SOFR + 1.541%) 6.87% 5/15/20371,2,3 | 1,500 | 1,502 | ||
HTL Commercial Mortgage Trust, Series 2024-T53, Class A, 6.072% 5/10/20391,2,3 | 177 | 177 | ||
HTL Commercial Mortgage Trust, Series 2024-T53, Class B, 6.774% 5/10/20391,2,3 | 594 | 595 | ||
HTL Commercial Mortgage Trust, Series 2024-T53, Class C, 7.324% 5/10/20391,2,3 | 189 | 190 | ||
MSWF Commercial Mortgage Trust, Series 2023-2, Class AS, 6.491% 12/15/20561,3 | 83 | 88 | ||
SDR Commercial Mortgage Trust, Series 2024-DSNY, Class A, (1-month USD CME Term SOFR + 1.392%) 6.72% 5/15/20391,2,3 | 354 | 353 | ||
SFO Commerical Mortgage Trust, Series 2021-555, Class A, (1-month USD CME Term SOFR + 1.264%) 6.593% 5/15/2038 (1-month USD CME Term SOFR + 1.514% on 5/15/2026)1,2,4 | 250 | 237 | ||
Wells Fargo Commercial Mortgage Trust, Series 2017-C40, Class AS, 3.854% 10/15/20501,3 | 300 | 276 | ||
24,980 | ||||
Total mortgage-backed obligations | 272,170 | |||
3 | Capital Group Fixed Income ETF Trust |
Capital Group Core Bond ETF (continued)
Bonds, notes & other debt instruments (continued) | Principal amount (000) | Value (000) | ||
Corporate bonds, notes & loans 33.42% | ||||
Financials 16.94% | ||||
AIB Group PLC 6.608% 9/13/2029 (USD-SOFR + 2.33% on 9/13/2028)2,4 | USD1,549 | $1,600 | ||
Aon North America, Inc. 5.125% 3/1/2027 | 3,085 | 3,081 | ||
Bank of America Corp. 2.551% 2/4/2028 (USD-SOFR + 1.05% on 2/4/2027)4 | 6,419 | 5,993 | ||
Bank of America Corp. 3.974% 2/7/2030 (3-month USD CME Term SOFR + 1.472% on 2/7/2029)4 | 3,808 | 3,607 | ||
Bank of New York Mellon Corp. 4.975% 3/14/2030 (USD-SOFR + 1.085% on 3/14/2029)4 | 509 | 506 | ||
Bank of Nova Scotia (The) 5.25% 6/12/2028 | 700 | 704 | ||
Blackstone Holdings Finance Co., LLC 6.20% 4/22/20332 | 287 | 302 | ||
BNP Paribas SA 2.591% 1/20/2028 (USD-SOFR + 1.228% on 1/20/2027)2,4 | 2,503 | 2,328 | ||
BNP Paribas SA 5.497% 5/20/2030 (USD-SOFR + 1.59% on 5/20/2029)2,4 | 1,260 | 1,255 | ||
BPCE SA 2.045% 10/19/2027 (USD-SOFR + 1.087% on 10/19/2026)2,4 | 3,025 | 2,778 | ||
BPCE SA 5.716% 1/18/2030 (1-year UST Yield Curve Rate T Note Constant Maturity + 1.959% on 1/18/2029)2,4 | 2,183 | 2,179 | ||
BPCE SA 5.936% 5/30/2035 (USD-SOFR + 1.85% on 5/30/2034)2,4 | 1,150 | 1,146 | ||
CaixaBank, SA 6.208% 1/18/2029 (USD-SOFR + 2.70% on 1/18/2028)2,4 | 3,353 | 3,408 | ||
Charles Schwab Corp. (The) 5.643% 5/19/2029 (USD-SOFR + 2.21% on 5/19/2028)4 | 1,545 | 1,566 | ||
Charles Schwab Corp. (The) 6.196% 11/17/2029 (USD-SOFR + 1.878% on 11/17/2028)4 | 547 | 569 | ||
Citigroup, Inc. 4.412% 3/31/2031 (USD-SOFR + 3.914% on 3/31/2030)4 | 2,726 | 2,599 | ||
Citizens Financial Group, Inc. 5.841% 1/23/2030 (USD-SOFR + 2.01% on 1/23/2029)4 | 208 | 207 | ||
Danske Bank AS 4.298% 4/1/2028 (1-year UST Yield Curve Rate T Note Constant Maturity + 1.75% on 4/1/2027)2,4 | 2,324 | 2,251 | ||
Deutsche Bank AG 2.311% 11/16/2027 (USD-SOFR + 1.219% on 11/16/2026)4 | 1,939 | 1,791 | ||
Deutsche Bank AG 6.819% 11/20/2029 (USD-SOFR + 2.51% on 11/20/2028)4 | 2,557 | 2,660 | ||
DNB Bank ASA 1.535% 5/25/2027 (5-year UST Yield Curve Rate T Note Constant Maturity + 0.72% on 5/25/2026)2,4 | 3,060 | 2,838 | ||
Fifth Third Bancorp 6.339% 7/27/2029 (USD-SOFR + 2.34% on 7/27/2028)4 | 2,779 | 2,849 | ||
Five Corners Funding Trust III 5.791% 2/15/20332 | 886 | 902 | ||
Goldman Sachs Group, Inc. 5.727% 4/25/2030 (USD-SOFR + 1.265% on 4/25/2029)4 | 3,421 | 3,483 | ||
HSBC Holdings PLC 4.583% 6/19/2029 (3-month USD CME Term SOFR + 1.796% on 6/19/2028)4 | 3,733 | 3,609 | ||
JPMorgan Chase & Co. 6.07% 10/22/2027 (USD-SOFR + 1.33% on 10/22/2026)4 | 1,482 | 1,508 | ||
JPMorgan Chase & Co. 5.04% 1/23/2028 (USD-SOFR + 1.19% on 1/23/2027)4 | 1,816 | 1,807 | ||
JPMorgan Chase & Co. 4.203% 7/23/2029 (3-month USD CME Term SOFR + 1.522% on 7/23/2028)4 | 4,308 | 4,147 | ||
KBC Groep NV 5.796% 1/19/2029 (1-year UST Yield Curve Rate T Note Constant Maturity + 2.10% on 1/19/2028)2,4 | 3,443 | 3,469 | ||
Lloyds Banking Group PLC 5.871% 3/6/2029 (1-year UST Yield Curve Rate T Note Constant Maturity + 1.70% on 3/6/2028)4 | 2,498 | 2,534 | ||
Metropolitan Life Global Funding I 4.85% 1/8/20292 | 1,823 | 1,808 | ||
Metropolitan Life Global Funding I 5.15% 3/28/20332 | 1,679 | 1,659 | ||
Mitsubishi UFJ Financial Group, Inc. 5.422% 2/22/2029 (1-year UST Yield Curve Rate T Note Constant Maturity + 1.38% on 2/22/2028)4 | 1,290 | 1,298 | ||
Mizuho Financial Group, Inc. 1.234% 5/22/2027 (1-year UST Yield Curve Rate T Note Constant Maturity + 0.67% on 5/22/2026)4 | 2,232 | 2,064 | ||
Mizuho Financial Group, Inc. 5.376% 5/26/2030 (1-year UST Yield Curve Rate T Note Constant Maturity + 1.12% on 5/26/2029)4 | 776 | 776 | ||
Morgan Stanley 5.123% 2/1/2029 (USD-SOFR + 1.73% on 2/1/2028)4 | 5,897 | 5,875 | ||
NatWest Group PLC 5.076% 1/27/2030 (3-month USD-LIBOR + 1.905% on 1/27/2029)4 | 4,204 | 4,132 | ||
New York Life Global Funding 4.55% 1/28/20332 | 285 | 271 | ||
PNC Financial Services Group, Inc. 6.615% 10/20/2027 (USD-SOFR + 1.73% on 10/20/2026)4 | 456 | 467 | ||
PNC Financial Services Group, Inc. 5.582% 6/12/2029 (USD-SOFR + 1.841% on 6/12/2028)4 | 2,163 | 2,187 | ||
Sumitomo Mitsui Financial Group, Inc. 1.902% 9/17/2028 | 1,129 | 990 | ||
Svenska Handelsbanken AB 5.50% 6/15/20282 | 3,684 | 3,709 | ||
Toronto-Dominion Bank (The) 5.523% 7/17/2028 | 519 | 526 | ||
Truist Financial Corp. 5.435% 1/24/2030 (USD-SOFR + 1.62% on 1/24/2029)4 | 1,851 | 1,847 | ||
U.S. Bancorp 4.653% 2/1/2029 (USD-SOFR + 1.23% on 2/1/2028)4 | 805 | 788 | ||
UBS Group AG 5.617% 9/13/2030 (1-year USD-ICE SOFR Swap + 1.34% on 9/13/2029)2,4 | 484 | 486 | ||
Capital Group Fixed Income ETF Trust | 4 |
Capital Group Core Bond ETF (continued)
Bonds, notes & other debt instruments (continued) | Principal amount (000) | Value (000) | ||
Corporate bonds, notes & loans (continued) | ||||
Financials (continued) | ||||
UBS Group AG 9.016% 11/15/2033 (USD-SOFR + 5.02% on 11/15/2032)2,4 | USD2,999 | $3,617 | ||
Wells Fargo & Co. 5.574% 7/25/2029 (USD-SOFR + 1.74% on 7/25/2028)4 | 9,495 | 9,583 | ||
Westpac Banking Corp. 4.11% 7/24/2034 (5-year UST Yield Curve Rate T Note Constant Maturity + 2.00% on 7/24/2029)4 | 1,913 | 1,769 | ||
111,528 | ||||
Utilities 4.10% | ||||
DTE Energy Co. 5.10% 3/1/2029 | 2,818 | 2,796 | ||
Edison International 4.125% 3/15/2028 | 1,041 | 995 | ||
Eversource Energy 5.00% 1/1/2027 | 3,220 | 3,195 | ||
FirstEnergy Corp. 2.65% 3/1/2030 | 4,237 | 3,686 | ||
Georgia Power Co. 4.95% 5/17/2033 | 1,947 | 1,899 | ||
Pacific Gas and Electric Co. 4.55% 7/1/2030 | 4,001 | 3,794 | ||
Pacific Gas and Electric Co. 5.80% 5/15/2034 | 908 | 903 | ||
PacifiCorp 5.10% 2/15/2029 | 4,612 | 4,610 | ||
Southern California Edison Co. 5.45% 6/1/2031 | 3,057 | 3,080 | ||
Xcel Energy, Inc. 5.45% 8/15/2033 | 2,062 | 2,027 | ||
26,985 | ||||
Health care 3.65% | ||||
Amgen, Inc. 5.25% 3/2/2033 | 4,369 | 4,358 | ||
Baxter International, Inc. 2.272% 12/1/2028 | 4,227 | 3,727 | ||
Becton, Dickinson and Co. 5.081% 6/7/2029 | 1,220 | 1,219 | ||
Bristol-Myers Squibb Co. 5.20% 2/22/2034 | 2,719 | 2,714 | ||
Cencora, Inc. 2.70% 3/15/2031 | 1,273 | 1,087 | ||
Centene Corp. 2.45% 7/15/2028 | 2,478 | 2,202 | ||
Cigna Group (The) 5.00% 5/15/2029 | 2,618 | 2,608 | ||
CVS Health Corp. 5.40% 6/1/2029 | 2,730 | 2,734 | ||
GE HealthCare Technologies, Inc. 5.857% 3/15/2030 | 665 | 684 | ||
Humana, Inc. 5.375% 4/15/2031 | 1,186 | 1,180 | ||
Pfizer Investment Enterprises Pte., Ltd. 4.75% 5/19/2033 | 1,566 | 1,527 | ||
24,040 | ||||
Consumer staples 1.85% | ||||
BAT Capital Corp. 6.343% 8/2/2030 | 2,771 | 2,890 | ||
Campbell Soup Co. 5.20% 3/19/2027 | 4,422 | 4,430 | ||
Constellation Brands, Inc. 2.875% 5/1/2030 | 1,445 | 1,276 | ||
Philip Morris International, Inc. 5.625% 11/17/2029 | 3,503 | 3,579 | ||
12,175 | ||||
Communication services 1.69% | ||||
AT&T, Inc. 4.30% 2/15/2030 | 4,885 | 4,682 | ||
Charter Communications Operating, LLC 6.10% 6/1/2029 | 1,306 | 1,311 | ||
Charter Communications Operating, LLC 6.384% 10/23/2035 | 1,838 | 1,793 | ||
T-Mobile USA, Inc. 3.875% 4/15/2030 | 3,554 | 3,323 | ||
11,109 | ||||
Industrials 1.50% | ||||
BAE Systems PLC 5.125% 3/26/20292 | 3,036 | 3,023 | ||
Boeing Co. 5.04% 5/1/2027 | 2,773 | 2,713 | ||
Boeing Co. 6.259% 5/1/20272 | 3,309 | 3,333 | ||
Carrier Global Corp. 2.722% 2/15/2030 | 194 | 171 | ||
Carrier Global Corp. 2.70% 2/15/2031 | 45 | 39 | ||
Carrier Global Corp. 5.90% 3/15/2034 | 550 | 574 | ||
9,853 | ||||
5 | Capital Group Fixed Income ETF Trust |
Capital Group Core Bond ETF (continued)
Bonds, notes & other debt instruments (continued) | Principal amount (000) | Value (000) | ||
Corporate bonds, notes & loans (continued) | ||||
Energy 1.47% | ||||
Cheniere Energy, Inc. 4.625% 10/15/2028 | USD3,112 | $3,022 | ||
Diamondback Energy, Inc. 5.15% 1/30/2030 | 1,720 | 1,713 | ||
Enbridge, Inc. 6.20% 11/15/2030 | 2,657 | 2,791 | ||
Energy Transfer, LP 5.25% 7/1/2029 | 1,007 | 1,001 | ||
Kinder Morgan, Inc. 7.75% 1/15/2032 | 1,011 | 1,142 | ||
9,669 | ||||
Consumer discretionary 1.16% | ||||
Daimler Trucks Finance North America, LLC 2.375% 12/14/20282 | 1,048 | 934 | ||
Ford Motor Credit Co., LLC 5.80% 3/5/2027 | 3,897 | 3,899 | ||
Hyundai Capital America 5.275% 6/24/20272 | 2,328 | 2,318 | ||
Sands China, Ltd. 5.125% 8/8/2025 | 500 | 496 | ||
7,647 | ||||
Real estate 0.57% | ||||
Equinix, Inc. 3.20% 11/18/2029 | 2,636 | 2,376 | ||
VICI Properties, LP 4.95% 2/15/2030 | 1,419 | 1,370 | ||
3,746 | ||||
Information technology 0.49% | ||||
Broadcom, Inc. 3.469% 4/15/20342 | 1,742 | 1,486 | ||
Microchip Technology, Inc. 5.05% 3/15/2029 | 1,054 | 1,046 | ||
SK hynix, Inc. 6.375% 1/17/20282 | 702 | 722 | ||
3,254 | ||||
Total corporate bonds, notes & loans | 220,006 | |||
U.S. Treasury bonds & notes 14.19% | ||||
U.S. Treasury 14.19% | ||||
U.S. Treasury 4.875% 5/31/2026 | 2,300 | 2,305 | ||
U.S. Treasury 4.625% 6/30/2026 | 530 | 529 | ||
U.S. Treasury 4.50% 5/31/2029 | 20,700 | 20,839 | ||
U.S. Treasury 4.125% 3/31/2031 | 1,230 | 1,213 | ||
U.S. Treasury 4.625% 4/30/2031 | 25,752 | 26,157 | ||
U.S. Treasury 4.50% 11/15/2033 | 425 | 429 | ||
U.S. Treasury 4.00% 2/15/2034 | 930 | 903 | ||
U.S. Treasury 4.375% 5/15/2034 | 3,000 | 3,001 | ||
U.S. Treasury 4.375% 8/15/2043 | 490 | 473 | ||
U.S. Treasury 3.75% 11/15/20435 | 20,531 | 18,150 | ||
U.S. Treasury 4.75% 11/15/20435 | 1,275 | 1,292 | ||
U.S. Treasury 4.125% 8/15/20535 | 4,800 | 4,472 | ||
U.S. Treasury 4.75% 11/15/2053 | 1,075 | 1,112 | ||
U.S. Treasury 4.625% 5/15/2054 | 12,400 | 12,571 | ||
93,446 | ||||
Asset-backed obligations 8.33% | ||||
ACHV ABS Trust, Series 2023-3PL, Class B, 7.17% 8/19/20301,2 | 194 | 194 | ||
ACHV ABS Trust, Series 2023-4CP, Class A, 6.81% 11/25/20301,2 | 11 | 11 | ||
Affirm Asset Securitization Trust, Series 2022-X1, Class A, 1.75% 2/15/20271,2 | 35 | 34 | ||
Affirm Asset Securitization Trust, Series 2023-A, Class A, 6.61% 1/18/20281,2 | 1,000 | 1,004 | ||
Affirm, Inc., Series 2023-B, Class A, 6.82% 9/15/20281,2 | 150 | 152 | ||
Affirm, Inc., Series 2023-X1, Class A, 7.11% 11/15/20281,2 | 47 | 47 | ||
Affirm, Inc., Series 2024, Class 1A, 5.61% 2/15/20291,2 | 3,143 | 3,133 | ||
Affirm, Inc., Series 2024-A, Class A, 5.61% 2/15/20291,2 | 139 | 139 | ||
Affirm, Inc., Series 2024-X1, Class A, 6.27% 5/15/20291,2 | 816 | 817 | ||
Ally Auto Receivables Trust, Series 2023, Class A2, 6.15% 1/17/20341,2 | 51 | 51 | ||
American Credit Acceptance Receivables Trust, Series 2024-1, Class B, 5.60% 11/12/20271,2 | 50 | 50 | ||
American Credit Acceptance Receivables Trust, Series 2024-1, Class C, 5.63% 1/14/20301,2 | 313 | 311 | ||
American Credit Acceptance Receivables Trust, Series 2024-2, Class D, 6.53% 4/12/20301,2 | 683 | 692 | ||
Capital Group Fixed Income ETF Trust | 6 |
Capital Group Core Bond ETF (continued)
Bonds, notes & other debt instruments (continued) | Principal amount (000) | Value (000) | ||
Asset-backed obligations (continued) | ||||
Apidos CLO, Ltd., Series 2015-23, Class AR, (3-month USD CME Term SOFR + 1.482%) 6.81% 4/15/20331,2,3 | USD275 | $275 | ||
Auxilior Term Funding, LLC, Series 24-1A, Class A2, 6.17% 3/15/20271,2 | 453 | 453 | ||
Auxilior Term Funding, LLC, Series 24-1A, Class A3, 5.71% 7/15/20311,2 | 613 | 613 | ||
Avis Budget Rental Car Funding (AESOP), LLC, Series 2020-1A, Class A, 2.33% 8/20/20261,2 | 100 | 97 | ||
Avis Budget Rental Car Funding (AESOP), LLC, Series 2023-6, Class A, 5.81% 12/20/20291,2 | 250 | 254 | ||
Avis Budget Rental Car Funding (AESOP), LLC, Series 2023-8, Class A, 6.02% 2/20/20301,2 | 150 | 154 | ||
Avis Budget Rental Car Funding (AESOP), LLC, Series 2024-1, Class A, 5.36% 6/20/20301,2 | 117 | 117 | ||
Bain Capital Credit CLO, Ltd., Series 2017-2, Class AR2, (3-month USD CME Term SOFR + 1.442%) 6.765% 7/25/20341,2,3 | 275 | 275 | ||
Ballyrock, Ltd., CLO, Series 2019-2A, Class A1R, (3-month USD CME Term SOFR + 1.40%) 6.714% 2/20/20361,2,3 | 480 | 481 | ||
Bank of America Credit Card Trust, Series 2024-A1, Class A, 4.93% 5/15/2029 | 1,483 | 1,485 | ||
Bankers Healthcare Group Securitization Trust, Series 2021-A, Class A, 1.42% 11/17/20331,2 | 165 | 158 | ||
Bankers Healthcare Group Securitization Trust, Series 2022-A, Class A, 1.71% 2/20/20351,2 | 67 | 67 | ||
BofA Auto Trust, Series 2024-1, Class A4, 5.31% 6/17/20301,2 | 1,000 | 1,007 | ||
Brex Commercial Charge Card Master Trust, Series 2024-1, Class A1, 6.05% 7/15/20271,2 | 403 | 403 | ||
Bridgecrest Lending Auto Securitization Trust, Series 2023-1, Class A3, 6.51% 11/15/20271 | 79 | 79 | ||
Bridgecrest Lending Auto Securitization Trust, Series 2024-1, Class A3, 5.53% 1/18/20281 | 111 | 111 | ||
Bridgecrest Lending Auto Securitization Trust, Series 2024-1, Class B, 5.43% 8/15/20281 | 67 | 67 | ||
Bridgecrest Lending Auto Securitization Trust, Series 2024-1, Class C, 5.65% 4/16/20291 | 99 | 99 | ||
CarMax Auto Owner Trust, Series 2024-1, Class A4, 4.94% 8/15/20291 | 500 | 498 | ||
CarMax Select Receivables Trust, Series 2024-A, Class A2A, 5.78% 9/15/2027 | 296 | 296 | ||
Carvana Auto Receivables Trust, Series 2023-N4, Class A, 6.42% 1/10/20281,2 | 152 | 153 | ||
CF Hippolyta, LLC, Series 2020-1, Class A1, 1.69% 7/15/20601,2 | 585 | 554 | ||
CF Hippolyta, LLC, Series 2021-1, Class A1, 1.53% 3/15/20611,2 | 150 | 138 | ||
Chase Issuance Trust, Series 2024-A2, Class A, 4.63% 1/15/20311 | 172 | 171 | ||
Citizens Auto Receivables Trust, Series 2024-1, Class A3, 5.11% 4/17/20281,2 | 111 | 111 | ||
Citizens Auto Receivables Trust, Series 2023-2, Class A4, 5.74% 10/15/20301,2 | 150 | 152 | ||
CLI Funding VI, LLC, Series 2020-3A, Class A, 2.07% 10/18/20451,2 | 127 | 115 | ||
CLI Funding VIII, LLC, Series 2022-1, Class A, 2.72% 1/18/20471,2 | 1,149 | 1,027 | ||
ClickLease Equipment Receivables 2024-1 Trust, Series 2024-1, Class A, 6.86% 2/15/20301,2 | 781 | 781 | ||
Commercial Equipment Finance, Series 2024-1, Class A, 5.97% 7/16/20291,2 | 333 | 333 | ||
CPS Auto Receivables Trust, Series 2023-C, Class A, 6.13% 9/15/20261,2 | 72 | 72 | ||
CPS Auto Receivables Trust, Series 2023-A, Class B, 5.47% 11/16/20261,2 | 150 | 150 | ||
CPS Auto Receivables Trust, Series 2023-D, Class A, 6.40% 6/15/20271,2 | 59 | 59 | ||
CPS Auto Receivables Trust, Series 2024-A, Class B, 5.65% 5/15/20281,2 | 100 | 100 | ||
CPS Auto Receivables Trust, Series 2022-C, Class B, 4.88% 4/15/20301,2 | 836 | 834 | ||
CPS Auto Receivables Trust, Series 2024-A, Class C, 5.74% 4/15/20301,2 | 100 | 100 | ||
CPS Auto Receivables Trust, Series 2024-A, Class D, 6.13% 4/15/20301,2 | 100 | 100 | ||
CPS Auto Trust, Series 2024-C, Class B, 5.68% 12/15/20281,2 | 505 | 505 | ||
Crossroads Asset Trust, Series 2024-A, Class A2, 5.90% 8/20/20301,2 | 580 | 581 | ||
Drive Auto Receivables Trust, Series 2024-1, Class A3, 5.35% 2/15/20281 | 75 | 75 | ||
Drive Auto Receivables Trust, Series 2024-1, Class B, 5.31% 1/16/20291 | 122 | 122 | ||
Dryden Senior Loan Fund, CLO, Series 2021-93, Class A1A, (3-month USD CME Term SOFR + 1.342%) 6.67% 1/15/20341,2,3 | 275 | 276 | ||
Enterprise Fleet Financing, LLC, Series 2024-1, Class A2, 5.23% 3/20/20301,2 | 146 | 146 | ||
Enterprise Fleet Financing, LLC, Series 2024-1, Class A3, 5.16% 9/20/20301,2 | 108 | 108 | ||
Exeter Automobile Receivables Trust, Series 2023-5, Class A3, 6.32% 3/15/20271 | 34 | 34 | ||
Exeter Automobile Receivables Trust, Series 2024-1, Class A3, 5.31% 8/16/20271 | 41 | 41 | ||
Exeter Automobile Receivables Trust, Series 2023-5, Class B, 6.58% 4/17/20281 | 101 | 102 | ||
7 | Capital Group Fixed Income ETF Trust |
Capital Group Core Bond ETF (continued)
Bonds, notes & other debt instruments (continued) | Principal amount (000) | Value (000) | ||
Asset-backed obligations (continued) | ||||
Exeter Automobile Receivables Trust, Series 2024-1, Class B, 5.29% 8/15/20281 | USD116 | $115 | ||
Exeter Automobile Receivables Trust, Series 2024-1, Class C, 5.41% 5/15/20301 | 121 | 120 | ||
First National Master Note Trust, Series 2023-2, Class A, 5.77% 9/17/20291 | 150 | 152 | ||
Ford Credit Auto Owner Trust, Series 2023-B, Class A4, 5.06% 2/15/20291 | 100 | 100 | ||
Ford Credit Auto Owner Trust, Series 2023-1, Class A, 4.85% 8/15/20351,2 | 150 | 149 | ||
Ford Credit Auto Owner Trust, Series 2024-1, Class A, 4.87% 8/15/20361,2,3 | 400 | 397 | ||
Global SC Finance V SRL, Series 2020-1A, Class A, 2.17% 10/17/20401,2 | 146 | 135 | ||
Global SC Finance VII SRL, Series 2020-2A, Class A, 2.26% 11/19/20401,2 | 147 | 137 | ||
Global SC Finance VII SRL, Series 2021-1A, Class A, 1.86% 4/17/20411,2 | 167 | 149 | ||
Global SC Finance VII SRL, Series 2021-2A, Class B, 2.49% 8/17/20411,2 | 174 | 154 | ||
GLS Auto Receivables Trust, Series 2023-4, Class A3, 6.42% 6/15/20271,2 | 96 | 97 | ||
GLS Auto Receivables Trust, Series 2024-1, Class A3, 5.40% 9/15/20271,2 | 32 | 32 | ||
GLS Auto Select Receivables Trust, Series 2024-1, Class A2, 5.24% 3/15/20301,2 | 213 | 213 | ||
GLS Auto Select Receivables Trust, Series 2024-2, Class A2, 5.58% 6/17/20301,2 | 147 | 147 | ||
GM Financial Revolving Receivables Trust, Series 2023-2, Class A, 5.77% 8/11/20361,2 | 312 | 321 | ||
Greatamerica Leasing Receivables Funding LLC, Series 23-1, Class A3, 5.15% 7/15/20271,2 | 2,241 | 2,232 | ||
Greatamerica Leasing Receivables Funding LLC, Series 22-1, Class A4, 5.35% 7/16/20291,2 | 2,646 | 2,646 | ||
Hertz Vehicle Financing III, LLC, Series 2021-2A, Class A, 1.68% 12/27/20271,2 | 250 | 228 | ||
Hertz Vehicle Financing III, LLC, Series 2021-2A, Class B, 2.12% 12/27/20271,2 | 150 | 137 | ||
Hertz Vehicle Financing III, LLC, Series 2023-4, Class A, 6.15% 3/25/20301,2 | 150 | 153 | ||
Hyundai Auto Lease Securitization Trust, Series 2024-A, Class A4, 5.07% 2/15/20281,2 | 100 | 100 | ||
John Deere Owner Trust, Series 2024-A, Class A3, 4.96% 11/15/20281 | 154 | 154 | ||
Juniper Valley Park CLO, Ltd., Series 2023-1, Class AR, (3-month USD CME Term SOFR + 1.25%) 6.575% 7/20/20361,2,3 | 1,958 | 1,958 | ||
LAD Auto Receivables Trust, Series 2021-1A, Class B, 1.94% 11/16/20261,2 | 1,000 | 988 | ||
LAD Auto Receivables Trust, Series 2023-4, Class A3, 6.10% 12/15/20271,2 | 33 | 33 | ||
LAD Auto Receivables Trust, Series 2024-1, Class A3, 5.23% 1/18/20281,2 | 35 | 35 | ||
LAD Auto Receivables Trust, Series 2023-2, Class A3, 5.42% 2/15/20281,2 | 250 | 250 | ||
LAD Auto Receivables Trust, Series 2024-1, Class A4, 5.17% 9/15/20281,2 | 80 | 79 | ||
LAD Auto Receivables Trust, Series 2024-2, Class A4, 5.46% 7/16/20291,2 | 355 | 355 | ||
Mercedes-Benz Auto Receivables Trust, Series 2023-2, Class A3, 5.95% 11/15/20281 | 75 | 76 | ||
Merchants Fleet Funding, LLC, Series 2024-1, Class A, 5.82% 4/20/20371,2 | 1,066 | 1,067 | ||
Mercury Financial Credit Card Master Trust, Series 2024-2A, Class A, 6.56% 7/20/20291,2 | 1,638 | 1,645 | ||
Mission Lane Credit Card Master Trust, Series 2024-A, Class A1, 6.20% 8/15/20291,2 | 1,212 | 1,212 | ||
Mission Lane Credit Card Master Trust, Series 2024-A, Class B, 6.58% 8/15/20291,2 | 798 | 798 | ||
Navient Student Loan Trust, Series 2021-B, Class A, 0.94% 7/15/20691,2 | 115 | 101 | ||
New Economy Assets Phase 1 Issuer, LLC, Series 2021-1, Class A1, 1.91% 10/20/20611,2 | 1,000 | 892 | ||
Oaktree CLO, Ltd., Series 2019-1, Class A1R, (3-month USD CME Term SOFR + 1.372%) 6.696% 4/22/20301,2,3 | 3,500 | 3,511 | ||
Ondeck Asset Securitization Trust, LLC, Series 2024-1, Class A, 6.27% 6/17/20311,2 | 612 | 617 | ||
Ondeck Asset Securitization Trust, LLC, Series 2024-1, Class B, 7.15% 6/17/20311,2 | 272 | 274 | ||
PEAC Solutions Receivables, LLC, Series 2024-1, Class A2, 5.79% 6/21/20271,2 | 1,116 | 1,119 | ||
PFS Financing Corp., Series 2022-D, Class B, 4.90% 8/16/20271,2 | 100 | 99 | ||
PFS Financing Corp., Series 2023-A, Class A, 5.80% 3/15/20281,2 | 150 | 151 | ||
Post Road Equipment Finance, Series 2024-1, Class C, 5.81% 10/15/20301,2 | 300 | 300 | ||
Santander Drive Auto Receivables Trust, Series 2024-1, Class A2, 5.71% 2/16/20271 | 64 | 64 | ||
Santander Drive Auto Receivables Trust, Series 2024-1, Class A3, 5.25% 4/17/20281 | 18 | 18 | ||
SBNA Auto Lease Trust, Series 2024-B, Class A4, 5.55% 12/20/20281,2 | 1,000 | 1,005 | ||
SCF Equipment Leasing, LLC, Series 2024-1A, Class A3, 5.52% 1/20/20321,2 | 3,597 | 3,621 | ||
SFS Auto Receivables Securitization Trust, Series 2024-1, Class A3, 4.95% 5/21/20291,2 | 234 | 233 | ||
TAL Advantage V, LLC, Series 2020-1A, Class A, 2.05% 9/20/20451,2 | 303 | 277 | ||
Textainer Marine Containers, Ltd., Series 2021-1, Class A, 1.68% 2/20/20461,2 | 176 | 156 | ||
TICP CLO, Ltd., Series 2018-12, Class AR, (3-month USD CME Term SOFR + 1.432%) 6.76% 7/15/20341,2,3 | 275 | 276 | ||
TIF Funding II, LLC, Series 2020-1A, Class A, 2.09% 8/20/20451,2 | 216 | 196 | ||
TIF Funding II, LLC, Series 2021-1A, Class A, 1.65% 2/20/20461,2 | 317 | 276 | ||
Verdant Receivables, LLC, Series 2024-1, Class A2, 5.68% 12/12/20311,2 | 826 | 830 | ||
Verdant Receivables, LLC, Series 2024-1, Class B, 5.72% 12/12/20311,2 | 1,750 | 1,762 | ||
Verizon Master Trust, Series 2024-1, Class A1A, 5.00% 12/20/20281 | 120 | 120 | ||
Verizon Master Trust, Series 2024-2, Class A, 4.83% 12/22/20311,2 | 109 | 108 | ||
VStrong Auto Receivables Trust, Series 2024-A, Class A3, 5.62% 12/15/20281,2 | 109 | 109 | ||
Capital Group Fixed Income ETF Trust | 8 |
Capital Group Core Bond ETF (continued)
Bonds, notes & other debt instruments (continued) | Principal amount (000) | Value (000) | ||
Asset-backed obligations (continued) | ||||
Westlake Automobile Receivables Trust, Series 2023-4, Class A3, 6.24% 7/15/20271,2 | USD62 | $62 | ||
Westlake Flooring Master Trust, Series 2024-1, Class A, 5.43% 2/15/20281,2 | 137 | 137 | ||
Wind River CLO, Ltd., Series 2015-1A, Class A1R3, (3-month USD CME Term SOFR + 1.20%) 6.525% 10/20/20301,2,3 | 967 | 968 | ||
World Financial Network Credit Card Master Trust, Series 2024-A, Class A, 5.47% 2/17/2031 | 405 | 408 | ||
54,818 | ||||
Municipals 0.11% | ||||
Massachusetts 0.11% | ||||
Educational Fncg. Auth., Education Loan Rev. Bonds, Series 2024-A, 6.352% 7/1/2049 | 705 | 712 | ||
Total bonds, notes & other debt instruments (cost: $638,736,000) | 641,152 | |||
Short-term securities 25.04% | Shares | |||
Money market investments 25.04% | ||||
Capital Group Central Cash Fund 5.37%6,7 | 1,648,426 | 164,843 | ||
Total short-term securities (cost: $164,843,000) | 164,843 | |||
Total investment securities 122.44% (cost: $803,579,000) | 805,995 | |||
Other assets less liabilities (22.44)% | (147,734 ) | |||
Net assets 100.00% | $658,261 |
Futures contracts
Contracts | Type | Number of contracts | Expiration date | Notional amount (000) | Value and unrealized appreciation (depreciation) at 6/30/2024 (000) |
2 Year U.S. Treasury Note Futures | Long | 89 | 9/30/2024 | USD18,175 | $13 |
5 Year U.S. Treasury Note Futures | Long | 47 | 9/30/2024 | 5,009 | — 8 |
10 Year U.S. Treasury Note Futures | Long | 76 | 9/19/2024 | 8,359 | (18 ) |
10 Year Ultra U.S. Treasury Note Futures | Long | 9 | 9/19/2024 | 1,022 | 2 |
30 Year U.S. Treasury Bond Futures | Long | 233 | 9/19/2024 | 27,567 | 192 |
30 Year Ultra U.S. Treasury Bond Futures | Long | 211 | 9/19/2024 | 26,448 | 164 |
$353 |
Swap contracts
Credit default swaps
Centrally cleared credit default swaps on credit indices — sell protection
Financing rate received | Payment frequency | Reference index | Expiration date | Notional amount9 (000) | Value at 6/30/202410 (000) | Upfront premium paid (received) (000) | Unrealized appreciation (depreciation) at 6/30/2024 (000) |
1.00% | Quarterly | CDX.NA.IG.42.V1 | 6/20/2029 | USD17,177 | $351 | $387 | $(36 ) |
9 | Capital Group Fixed Income ETF Trust |
Capital Group Core Bond ETF (continued)
Investments in affiliates7
Value at 1/1/2024 (000) | Additions (000) | Reductions (000) | Net realized gain (loss) (000) | Net unrealized appreciation (depreciation) (000) | Value at 6/30/2024 (000) | Dividend or interest income (000) | |
Short-term securities 25.04% | |||||||
Money market investments 25.04% | |||||||
Capital Group Central Cash Fund 5.37% 6 | $16,276 | $364,717 | $216,148 | $(4 ) | $2 | $164,843 | $1,942 |
1 | Principal payments may be made periodically. Therefore, the effective maturity date may be earlier than the stated maturity date. |
2 | Acquired in a transaction exempt from registration under Rule 144A or, for commercial paper, Section 4(a)(2) of the Securities Act of 1933. May be resold in the U.S. in transactions exempt from registration, normally to qualified institutional buyers. The total value of all such securities was $162,867,000, which represented 24.74% of the net assets of the fund. |
3 | Coupon rate may change periodically. Reference rate and spread are as of the most recent information available. Some coupon rates are determined by the issuer or agent based on current market conditions; therefore, the reference rate and spread are not available. |
4 | Step bond; coupon rate may change at a later date. |
5 | All or a portion of this security was pledged as collateral. The total value of pledged collateral was $3,060,000, which represented .46% of the net assets of the fund. |
6 | Rate represents the seven-day yield at 6/30/2024. |
7 | Part of the same "group of investment companies" as the fund as defined under the Investment Company Act of 1940, as amended. |
8 | Amount less than one thousand. |
9 | The maximum potential amount the fund may pay as a protection seller should a credit event occur. |
10 | The prices and resulting values for credit default swap indices serve as an indicator of the current status of the payment/performance risk. As the value of a sell protection credit default swap increases or decreases, when compared to the notional amount of the swap, the payment/performance risk may decrease or increase, respectively. |
Key to abbreviation(s) |
Auth. = Authority |
CLO = Collateralized Loan Obligations |
CME = CME Group |
Fncg. = Financing |
ICE = Intercontinental Exchange, Inc. |
LIBOR = London Interbank Offered Rate |
Rev. = Revenue |
SDR = Swedish Depositary Receipts |
SOFR = Secured Overnight Financing Rate |
USD = U.S. dollars |
Refer to the notes to financial statements.
Capital Group Fixed Income ETF Trust | 10 |
Capital Group Core Plus Income ETFunaudited
Investment portfolio June 30, 2024
Bonds, notes & other debt instruments 98.29% | Principal amount (000) | Value (000) | ||
Mortgage-backed obligations 41.86% | ||||
Federal agency mortgage-backed obligations 30.21% | ||||
Fannie Mae Pool #BQ7006 2.00% 1/1/2052 | USD2,183 | $1,713 | ||
Fannie Mae Pool #FS0647 3.00% 2/1/20521 | 3,794 | 3,290 | ||
Fannie Mae Pool #FS0893 3.00% 2/1/20521 | 774 | 660 | ||
Fannie Mae Pool #FS1030 3.00% 3/1/20521 | 871 | 741 | ||
Fannie Mae Pool #BV2954 3.00% 3/1/20521 | 728 | 621 | ||
Fannie Mae Pool #BV3117 3.00% 3/1/20521 | 724 | 618 | ||
Fannie Mae Pool #FS1598 2.00% 4/1/2052 | 1,177 | 922 | ||
Fannie Mae Pool #MA4577 2.00% 4/1/2052 | 893 | 700 | ||
Fannie Mae Pool #FS1405 3.00% 4/1/20521 | 728 | 621 | ||
Fannie Mae Pool #CB3361 3.00% 4/1/20521 | 707 | 607 | ||
Fannie Mae Pool #MA4597 2.00% 5/1/2052 | 839 | 658 | ||
Fannie Mae Pool #CB3586 3.00% 5/1/20521 | 2,619 | 2,240 | ||
Fannie Mae Pool #BX0466 4.00% 11/1/2052 | 998 | 915 | ||
Fannie Mae Pool #BW4985 4.00% 2/1/2053 | 915 | 839 | ||
Fannie Mae Pool #MA4919 5.50% 2/1/20531 | 1,537 | 1,518 | ||
Fannie Mae Pool #BW5000 4.00% 3/1/2053 | 998 | 915 | ||
Fannie Mae Pool #MA4962 4.00% 3/1/2053 | 990 | 907 | ||
Fannie Mae Pool #FS4191 5.50% 3/1/20531 | 365 | 361 | ||
Fannie Mae Pool #CB6297 4.00% 5/1/2053 | 995 | 911 | ||
Fannie Mae Pool #MA5010 5.50% 5/1/20531 | 264 | 261 | ||
Fannie Mae Pool #MA5072 5.50% 7/1/20531 | 1,982 | 1,956 | ||
Fannie Mae Pool #MA5107 5.50% 8/1/20531 | 112 | 110 | ||
Fannie Mae Pool #MA5177 4.00% 10/1/2053 | 7,210 | 6,601 | ||
Fannie Mae Pool #MA5165 5.50% 10/1/20531 | 465 | 459 | ||
Fannie Mae Pool #MA5166 6.00% 10/1/20531 | 11,535 | 11,574 | ||
Fannie Mae Pool #MA5207 4.00% 11/1/2053 | 3,286 | 3,009 | ||
Fannie Mae Pool #MA5191 6.00% 11/1/20531 | 2,959 | 2,969 | ||
Fannie Mae Pool #FS6668 5.50% 12/1/20531 | 274 | 270 | ||
Fannie Mae Pool #FS6809 5.50% 2/1/20541 | 261 | 258 | ||
Fannie Mae Pool #MA5274 7.00% 2/1/2054 | 9,161 | 9,426 | ||
Fannie Mae Pool #MA5296 5.50% 3/1/20541 | 6,733 | 6,643 | ||
Fannie Mae Pool #CB8148 5.50% 3/1/20541 | 3,033 | 3,004 | ||
Fannie Mae Pool #MA5341 4.00% 4/1/2054 | 102 | 94 | ||
Fannie Mae Pool #MA5378 4.00% 5/1/2054 | 5,584 | 5,112 | ||
Fannie Mae Pool #CB8755 6.00% 6/1/2054 | 3,785 | 3,813 | ||
Fannie Mae Pool #MA5421 6.00% 7/1/2054 | 2,937 | 2,946 | ||
Freddie Mac Pool #QD1841 2.00% 11/1/2051 | 1,958 | 1,536 | ||
Freddie Mac Pool #QD7819 3.00% 2/1/20521 | 649 | 556 | ||
Freddie Mac Pool #SD8199 2.00% 3/1/2052 | 2,149 | 1,685 | ||
Freddie Mac Pool #QD8010 2.00% 3/1/2052 | 1,001 | 786 | ||
Freddie Mac Pool #QE0312 2.00% 4/1/2052 | 994 | 780 | ||
Freddie Mac Pool #SD1156 3.00% 4/1/20521 | 861 | 734 | ||
Freddie Mac Pool #SD8206 3.00% 4/1/20521 | 861 | 734 | ||
Freddie Mac Pool #RA7130 3.00% 4/1/20521 | 823 | 701 | ||
Freddie Mac Pool #QE5301 3.50% 5/1/20521 | 700 | 620 | ||
Freddie Mac Pool #SD8214 3.50% 5/1/20521 | 34 | 30 | ||
Freddie Mac Pool #QE4383 4.00% 6/1/20521 | 779 | 715 | ||
Freddie Mac Pool #SD8225 3.00% 7/1/2052 | 10,461 | 8,913 | ||
Freddie Mac Pool #SD3117 4.00% 7/1/2052 | 6,085 | 5,580 | ||
Freddie Mac Pool #QF5342 4.00% 12/1/2052 | 998 | 914 | ||
Freddie Mac Pool #SD8305 4.00% 3/1/20531 | 2,403 | 2,200 | ||
Freddie Mac Pool #SD2610 4.00% 3/1/2053 | 297 | 272 | ||
Freddie Mac Pool #SD8321 4.00% 5/1/2053 | 1,249 | 1,144 | ||
Freddie Mac Pool #SD8331 5.50% 6/1/20531 | 3,811 | 3,761 | ||
Freddie Mac Pool #SD8353 4.00% 7/1/2053 | 993 | 909 | ||
Freddie Mac Pool #SD8342 5.50% 6/1/20531 | 2,148 | 2,120 | ||
Freddie Mac Pool #SD8357 4.00% 8/1/2053 | 991 | 907 | ||
Freddie Mac Pool #QG9041 4.00% 8/1/2053 | 590 | 541 | ||
Freddie Mac Pool #SD8375 4.00% 9/1/2053 | 995 | 911 | ||
Freddie Mac Pool #SD8362 5.50% 9/1/20531 | 22,439 | 22,142 | ||
Freddie Mac Pool #SD8379 4.00% 10/1/2053 | 5,536 | 5,068 | ||
Freddie Mac Pool #SD8367 5.50% 10/1/20531 | 1,708 | 1,686 | ||
Freddie Mac Pool #SD4977 5.00% 11/1/20531 | 103,319 | 99,906 | ||
11 | Capital Group Fixed Income ETF Trust |
Capital Group Core Plus Income ETF (continued)
Bonds, notes & other debt instruments (continued) | Principal amount (000) | Value (000) | ||
Mortgage-backed obligations (continued) | ||||
Federal agency mortgage-backed obligations (continued) | ||||
Freddie Mac Pool #SD8372 5.50% 11/1/20531 | USD5,978 | $5,899 | ||
Freddie Mac Pool #SD8406 4.00% 1/1/2054 | 2,374 | 2,173 | ||
Freddie Mac Pool #SD8408 5.50% 3/1/20541 | 38,495 | 37,981 | ||
Freddie Mac Pool #SD8420 5.50% 4/1/20541 | 9,129 | 9,007 | ||
Freddie Mac Pool #SD8447 6.00% 7/1/2054 | 2,720 | 2,729 | ||
Government National Mortgage Assn. Pool #MA8266 3.50% 9/20/20521 | 5,225 | 4,694 | ||
Uniform Mortgage-Backed Security 2.00% 7/1/20541,2 | 16,045 | 12,551 | ||
Uniform Mortgage-Backed Security 2.50% 7/1/20541,2 | 61,470 | 50,201 | ||
Uniform Mortgage-Backed Security 3.00% 7/1/20541,2 | 37,673 | 32,051 | ||
Uniform Mortgage-Backed Security 3.50% 7/1/20541,2 | 52,617 | 46,574 | ||
Uniform Mortgage-Backed Security 4.00% 7/1/20541,2 | 3,100 | 2,837 | ||
Uniform Mortgage-Backed Security 4.50% 7/1/20541,2 | 77,484 | 73,056 | ||
Uniform Mortgage-Backed Security 5.00% 7/1/20541,2 | 11,000 | 10,632 | ||
Uniform Mortgage-Backed Security 5.50% 7/1/20541,2 | 54,461 | 53,718 | ||
Uniform Mortgage-Backed Security 6.00% 7/1/20541,2 | 112,043 | 112,371 | ||
Uniform Mortgage-Backed Security 6.50% 7/1/20541,2 | 58,860 | 59,913 | ||
Uniform Mortgage-Backed Security 7.00% 7/1/20541,2 | 257 | 264 | ||
Uniform Mortgage-Backed Security 7.00% 8/1/20541,2 | 1,043 | 1,074 | ||
761,838 | ||||
Commercial mortgage-backed securities 9.78% | ||||
3650R Commercial Mortgage Trust, Series 2022-PF2, Class B, 5.466% 11/15/20551,3 | 1,690 | 1,575 | ||
Bank Commercial Mortgage Trust, Series 2023-BNK45, Class B, 6.148% 2/15/20561,3 | 1,873 | 1,884 | ||
Bank Commercial Mortgage Trust, Series 2023-BNK45, Class C, 6.488% 2/15/20561,3 | 512 | 508 | ||
Bank Commercial Mortgage Trust, Series 2023-5YR1, Class AS, 6.624% 4/15/20561,3 | 3,787 | 3,853 | ||
Bank Commercial Mortgage Trust, Series 2023-5YR1, Class B, 6.624% 3/15/20561,3 | 2,641 | 2,590 | ||
Bank Commercial Mortgage Trust, Series 2023-5YR2, Class C, 7.403% 7/15/20281,3 | 2,288 | 2,336 | ||
Bank Commercial Mortgage Trust, Series 2023-BNK46, Class B, 6.999% 8/15/20561,3 | 4,200 | 4,423 | ||
Bank Commercial Mortgage Trust, Series 2023-BNK46, Class C, 6.999% 8/15/20561,3 | 2,960 | 3,067 | ||
Bank Commercial Mortgage Trust, Series 2023-5YR3, Class C, 7.559% 9/15/20561,3 | 2,818 | 2,909 | ||
Bank Commercial Mortgage Trust, Series 2023-5YR4, Class B, 7.858% 12/15/20561,3 | 2,989 | 3,158 | ||
Bank Commercial Mortgage Trust, Series 2024-5YR6, Class C, % 5/15/20571,3 | 1,782 | 1,816 | ||
Bank Commercial Mortgage Trust, Series 2019-BN19, Class B, 3.647% 8/15/20611 | 1,000 | 814 | ||
Bank Commercial Mortgage Trust, Series 2019-BN24, Class B, 3.455% 11/15/20621,3 | 1,033 | 882 | ||
Bank Commercial Mortgage Trust, Series 2022-BNK40, Class B, 3.506% 3/15/20641,3 | 273 | 226 | ||
Bank Commercial Mortgage Trust, Series 2022-BNK40, Class AS, 3.506% 3/15/20641,3 | 250 | 215 | ||
Barclays Commercial Mortgage Securities, LLC, Series 2018-TALL, Class A, ((1-month USD CME Term SOFR + 0.047%) + 0.872%) 6.248% 3/15/20371,3,4 | 2,927 | 2,771 | ||
Barclays Commercial Mortgage Securities, LLC, Series 2022-C18, Class C, 6.348% 12/15/20551,3 | 1,355 | 1,304 | ||
Barclays Commercial Mortgage Securities, LLC, Series 2023-C19, Class B, 6.545% 4/15/20561,3 | 948 | 964 | ||
Barclays Commercial Mortgage Securities, LLC, Series 2023-C19, Class C, 6.597% 4/15/20561,3 | 1,253 | 1,239 | ||
Barclays Commercial Mortgage Securities, LLC, Series 2023-C20, Class C, 6.828% 7/15/20561,3 | 1,882 | 1,843 | ||
Barclays Commercial Mortgage Securities, LLC, Series 2024-C24, Class C, 6.00% 2/15/20571 | 276 | 270 | ||
Barclays Commercial Mortgage Securities, LLC, Series 2024-C26, Class C, 6.00% 5/15/20571,3 | 476 | 466 | ||
Benchmark Mortgage Trust, Series 2023-V2, Class B, 6.995% 5/15/20501,3 | 4,994 | 5,111 | ||
Benchmark Mortgage Trust, Series 2020-B21, Class AS, 2.2543% 12/17/20531 | 250 | 202 | ||
Benchmark Mortgage Trust, Series 2021-B23, Class A5, 2.07% 2/15/20541 | 1,200 | 964 | ||
Benchmark Mortgage Trust, Series 2022-B35, Class C, 4.592% 5/15/20551,3 | 2,005 | 1,578 | ||
Benchmark Mortgage Trust, Series 2023-V2, Class C, 6.995% 5/15/20551,3 | 3,464 | 3,511 | ||
Benchmark Mortgage Trust, Series 2023-B38, Class B, 6.245% 4/15/20561,3 | 4,994 | 5,014 | ||
Benchmark Mortgage Trust, Series 2023-B38, Class C, 6.245% 4/15/20561,3 | 2,996 | 2,653 | ||
Benchmark Mortgage Trust, Series 2023-V3, Class B, 6.924% 7/15/20561 | 1,499 | 1,534 | ||
Benchmark Mortgage Trust, Series 2023-V3, Class C, 7.412% 7/15/20561,3 | 2,644 | 2,685 | ||
Benchmark Mortgage Trust, Series 2024-V5, Class B, 6.059% 1/10/20571 | 693 | 692 | ||
Benchmark Mortgage Trust, Series 2024-V5, Class AM, 6.417% 1/10/20571 | 1,681 | 1,728 | ||
Capital Group Fixed Income ETF Trust | 12 |
Capital Group Core Plus Income ETF (continued)
Bonds, notes & other debt instruments (continued) | Principal amount (000) | Value (000) | ||
Mortgage-backed obligations (continued) | ||||
Commercial mortgage-backed securities (continued) | ||||
BLP Commercial Mortgage Trust, Series 2024-IND2, Class A, (1-month USD CME Term SOFR + 1.342%) 6.671% 3/15/20411,3,4 | USD3,138 | $3,119 | ||
BLP Commercial Mortgage Trust, Series 2024-IND2, Class D, (1-month USD CME Term SOFR + 2.59%) 7.907% 3/15/20411,3,4 | 1,349 | 1,341 | ||
BMO Mortgage Trust, Series 2023-C4, Class B, 5.39647% 2/15/20561,3 | 711 | 704 | ||
BMO Mortgage Trust, Series 2023-C5, Class B, 6.697% 6/15/20561,3 | 1,873 | 1,948 | ||
BMO Mortgage Trust, Series 2023-C5, Class C, 6.847% 6/15/20561,3 | 998 | 1,021 | ||
BMO Mortgage Trust, Series 2023-5C1, Class B, 6.96% 8/15/20561,3 | 3,505 | 3,598 | ||
BMO Mortgage Trust, Series 2023-5C1, Class C, 7.355% 8/15/20561,3 | 1,075 | 1,091 | ||
BMO Mortgage Trust, Series 2023-C6, Class B, 6.636% 9/15/20561,3 | 1,550 | 1,621 | ||
BMO Mortgage Trust, Series 2024-5C3, Class B, 6.557% 2/15/20571,3 | 1,115 | 1,135 | ||
BMO Mortgage Trust, Series 2024-5C3, Class C, 7.088% 2/15/20571,3 | 443 | 449 | ||
BMO Mortgage Trust, Series 2024-5C4, Class C, % 5/15/20571,3 | 5,202 | 5,307 | ||
BMP Trust, Series 2024-MF23, Class D, (1-month USD CME Term SOFR + 2.39%) 7.71% 6/15/20411,3,4 | 5,000 | 4,981 | ||
BMP Trust, Series 2024-MF23, Class E, (1-month USD CME Term SOFR + 3.389%) 8.718% 6/15/20411,3,4 | 2,408 | 2,398 | ||
BOCA Commercial Mortgage Trust, Series 2022-BOCA, Class A, (1-month USD CME Term SOFR + 1.77%) 7.098% 5/15/20391,3,4 | 623 | 623 | ||
BOCA Commercial Mortgage Trust, Series 2022-BOCA, Class B, (1-month USD CME Term SOFR + 2.319%) 7.648% 5/15/20391,3,4 | 317 | 317 | ||
BPR Trust, Series 2022-OANA, Class A, (1-month USD CME Term SOFR + 1.898%) 7.227% 4/15/20371,3,4 | 8,000 | 8,013 | ||
BX Trust, Series 2022-CSMO, Class A, (1-month USD CME Term SOFR + 2.115%) 7.444% 6/15/20271,3,4 | 716 | 719 | ||
BX Trust, Series 24-VLT4, Class E, (1-month USD CME Term SOFR + 2.889%) 8.209% 5/15/20291,3,4 | 4,757 | 4,747 | ||
BX Trust, Series 2024-KING, Class C, (1-month USD CME Term SOFR + 1.94%) 7.269% 5/15/20341,3,4 | 5,395 | 5,412 | ||
BX Trust, Series 2021-SDMF, Class D, (1-month USD CME Term SOFR + 1.501%) 6.83% 9/15/20341,3,4 | 480 | 467 | ||
BX Trust, Series 2021-VOLT, Class D, (1-month USD CME Term SOFR + 1.764%) 7.093% 9/15/20361,3,4 | 2,480 | 2,445 | ||
BX Trust, Series 2021-VOLT, Class E, (1-month USD CME Term SOFR + 2.114%) 7.443% 9/15/20361,3,4 | 4,000 | 3,953 | ||
BX Trust, Series 2021-ARIA, Class B, (1-month USD CME Term SOFR + 1.411%) 6.74% 10/15/20361,3,4 | 2,976 | 2,936 | ||
BX Trust, Series 2022-IND, Class D, (1-month USD CME Term SOFR + 2.839%) 8.168% 4/15/20371,3,4 | 116 | 116 | ||
BX Trust, Series 2022-AHP, Class A, (1-month USD CME Term SOFR + 0.99%) 6.319% 2/15/20391,3,4 | 4,887 | 4,833 | ||
BX Trust, Series 2022-PSB, Class A, (1-month USD CME Term SOFR + 2.451%) 7.78% 8/15/20391,3,4 | 614 | 613 | ||
BX Trust, Series 2022-GPA, Class B, (1-month USD CME Term SOFR + 2.664%) 7.989% 10/15/20391,3,4 | 968 | 970 | ||
BX Trust, Series 2022-GPA, Class C, (1-month USD CME Term SOFR + 3.213%) 8.539% 10/15/20391,3,4 | 613 | 615 | ||
BX Trust, Series 2022-GPA, Class D, (1-month USD CME Term SOFR + 4.061%) 9.389% 10/15/20391,3,4 | 167 | 167 | ||
BX Trust, Series 2020-VIV2, Class C, 3.66% 3/9/20441,3,4 | 2,000 | 1,743 | ||
BX Trust, Series 2020-VIV3, Class B, 3.662% 3/9/20441,3,4 | 989 | 875 | ||
BXSC Commercial Mortgage Trust, Series 2022-WSS, Class B, (1-month USD CME Term SOFR + 2.092%) 7.421% 3/15/20351,3,4 | 2,985 | 2,966 | ||
BXSC Commercial Mortgage Trust, Series 2022-WSS, Class D, (1-month USD CME Term SOFR + 3.188%) 8.517% 3/15/20351,3,4 | 249 | 245 | ||
CENT Trust 2023-CITY, Series 2023-CITY, Class B, (1-month USD CME Term SOFR + 3.15%) 8.479% 9/15/20281,3,4 | 3,354 | 3,379 | ||
Citigroup Commercial Mortgage Trust, Series 2023-SMRT, Class D, 6.048% 6/10/20281,3,4 | 3,950 | 3,823 | ||
Citigroup Commercial Mortgage Trust, Series 2023-SMRT, Class C, 6.048% 10/12/20401,3,4 | 1,225 | 1,206 | ||
Citigroup Commercial Mortgage Trust, Series 2015-GC27, Class C, 4.566% 2/10/20481,3 | 448 | 429 | ||
13 | Capital Group Fixed Income ETF Trust |
Capital Group Core Plus Income ETF (continued)
Bonds, notes & other debt instruments (continued) | Principal amount (000) | Value (000) | ||
Mortgage-backed obligations (continued) | ||||
Commercial mortgage-backed securities (continued) | ||||
Citigroup Commercial Mortgage Trust, Series 2020-GC46, Class B, 3.15% 2/15/20531,3 | USD840 | $711 | ||
DATA 2023-CNTR Mortgage Trust, Series 2023-CNTR, Class D, 5.919% 8/12/20431,3,4 | 3,984 | 3,384 | ||
DC Commercial Mortgage Trust, Series 2023-DC, Class D, 7.378% 9/10/20401,3,4 | 5,155 | 5,132 | ||
ELM Trust 2024, Series 2024-ELM, Class D15, 6.674% 6/10/20291,3,4 | 875 | 877 | ||
ELM Trust 2024, Series 2024-ELM, Class D10, 6.626% 6/10/20391,3,4 | 973 | 975 | ||
Extended Stay America Trust, Series 2021-ESH, Class B, (1-month USD CME Term SOFR + 1.494%) 6.823% 7/15/20381,3,4 | 7,262 | 7,239 | ||
Extended Stay America Trust, Series 2021-ESH, Class D, (1-month USD CME Term SOFR + 2.364%) 7.693% 7/15/20381,3,4 | 454 | 454 | ||
FIVE Mortgage Trust, Series 2023-V1, Class B, 6.507% 2/10/20561,3 | 1,982 | 1,977 | ||
FIVE Mortgage Trust, Series 2023-V1, Class C, 6.507% 2/10/20561,3 | 973 | 950 | ||
Great Wolf Trust, Series 2024-WOLF, Class C, (1-month USD CME Term SOFR + 2.391%) 7.72% 3/15/20391,3,4 | 3,963 | 3,969 | ||
Great Wolf Trust, Series 2024-WOLF, Class D, (1-month USD CME Term SOFR + 2.89%) 8.219% 3/15/20391,3,4 | 3,379 | 3,388 | ||
GS Mortgage Securities Trust, Series 2024-70P, Class B, 5.887% 3/10/20411,3,4 | 2,174 | 2,130 | ||
GS Mortgage Securities Trust., Series 2024-70P, Class C, 6.287% 3/10/20411,3,4 | 3,769 | 3,688 | ||
Hilton USA Trust, Series 2024-ORL, Class A, (1-month USD CME Term SOFR + 1.541%) 6.87% 5/15/20371,3,4 | 6,000 | 6,007 | ||
Hilton USA Trust, Series 2024-ORL, Class B, (1-month USD CME Term SOFR + 1.941%) 7.27% 5/15/20371,3,4 | 2,000 | 2,002 | ||
Hilton USA Trust, Series 2024-ORL, Class C, (1-month USD CME Term SOFR + 2.44%) 7.769% 5/15/20371,3,4 | 996 | 996 | ||
HTL Commercial Mortgage Trust, Series 2024-T53, Class C, 7.324% 5/10/20391,3,4 | 1,260 | 1,266 | ||
HTL Commercial Mortgage Trust, Series 2024-T53, Class D, 8.471% 5/10/20391,3,4 | 2,564 | 2,590 | ||
Morgan Stanley Bank of America Merrill Lynch Trust, Series 2015-C20, Class B, 4.16% 2/15/20481 | 2,000 | 1,950 | ||
Morgan Stanley Capital I Trust, Series 2019-L3, Class B, 3.771% 11/15/20521,3 | 750 | 660 | ||
MSFW Commercial Mortgage Trust, Series 2023-1, Class C, 6.906% 5/15/20331,3 | 1,698 | 1,753 | ||
MSFW Commercial Mortgage Trust, Series 2023-1, Class B, 6.906% 5/15/20331,3 | 1,642 | 1,752 | ||
Multifamily Connecticut Avenue Securities, Series 2020-1, Class M10, (30-day Average USD-SOFR + 3.864%) 9.20% 3/25/20501,3,4 | 2,946 | 2,963 | ||
Multifamily Connecticut Avenue Securities, Series 2023-01, Class M7, (30-day Average USD-SOFR + 4.00%) 9.335% 11/25/20531,3,4 | 1,651 | 1,716 | ||
Multifamily Connecticut Avenue Securities, Series 2023-01, Class M10, (30-day Average USD-SOFR + 6.50%) 11.835% 11/25/20531,3,4 | 2,699 | 3,031 | ||
Multifamily Structured Credit Risk, Series 21-MN1, Class M2, (30-day Average USD-SOFR + 3.75%) 9.085% 1/25/20511,3,4 | 910 | 919 | ||
ORL Trust, Series 2023-GLKS, Class C, (1-month USD CME Term SOFR + 3.651%) 8.98% 10/19/20361,3,4 | 4,914 | 4,926 | ||
ORL Trust, Series 2023-GLKS, Class D, (1-month USD CME Term SOFR + 4.301%) 9.63% 10/19/20361,3,4 | 6,283 | 6,324 | ||
SDR Commercial Mortgage Trust, Series 2024-DSNY, Class B, (1-month USD CME Term SOFR + 1.741%) 7.07% 5/15/20391,3,4 | 1,943 | 1,937 | ||
SFO Commerical Mortgage Trust, Series 2021-555, Class A, (1-month USD CME Term SOFR + 1.264%) 6.593% 5/15/2038 (1-month USD CME Term SOFR + 1.514% on 5/15/2026)1,4,5 | 8,900 | 8,437 | ||
StorageMart Commercial Mortgage Trust, Series 2022-MINI, Class D, (1-month USD CME Term SOFR + 1.95%) 7.279% 1/15/20391,3,4 | 3,000 | 2,945 | ||
UBS Commercial Mortgage Trust, Series 2017-C1, Class AS, 3.724% 6/15/20501,4 | 6,702 | 6,253 | ||
UBS Commercial Mortgage Trust, Series 2017-C3, Class C, 4.53% 8/15/20501,3 | 1,582 | 1,449 | ||
Wells Fargo Commercial Mortgage Trust, Series 2016-C35, Class C, 4.176% 7/15/20481,3 | 3,000 | 2,802 | ||
Wells Fargo Commercial Mortgage Trust, Series 2015-LC22, Class C, 4.692% 9/15/20581,3 | 130 | 125 | ||
WMRK Commercial Mortgage Trust, Series 2022-WMRK, Class A, (1-month USD CME Term SOFR + 2.789%) 8.118% 11/15/20271,3,4 | 1,646 | 1,652 | ||
WSTN Trust, Series 2023-MAUI, Class C, 7.958% 8/5/20271,3,4 | 594 | 588 | ||
WSTN Trust, Series 2023-MAUI, Class D, 8.748% 8/5/20271,3,4 | 1,820 | 1,806 | ||
246,833 | ||||
Capital Group Fixed Income ETF Trust | 14 |
Capital Group Core Plus Income ETF (continued)
Bonds, notes & other debt instruments (continued) | Principal amount (000) | Value (000) | ||
Mortgage-backed obligations (continued) | ||||
Collateralized mortgage-backed obligations (privately originated) 1.87% | ||||
Cascade Funding Mortgage Trust, Series 2023-HB12, Class M1, 4.25% 4/25/20331,3,4 | USD1,425 | $1,357 | ||
Connecticut Avenue Securities Trust, Series 2022-R03, Class 1M1, (30-day Average USD-SOFR + 2.10%) 7.435% 3/25/20421,3,4 | 207 | 211 | ||
Connecticut Avenue Securities Trust, Series 2023-R04, Class 1M2, (30-day Average USD-SOFR + 3.55%) 8.885% 5/25/20431,3,4 | 813 | 876 | ||
Freddie Mac Structured Agency Credit Risk Debt Notes, Series 2021-DNA6, Class M2, (30-day Average USD-SOFR + 1.50%) 6.835% 10/25/20411,3,4 | 793 | 797 | ||
Freddie Mac Structured Agency Credit Risk Debt Notes, Series 2022-DNA3, Class M1A, (30-day Average USD-SOFR + 2.00%) 7.335% 4/25/20421,3,4 | 361 | 367 | ||
Freddie Mac Structured Agency Credit Risk Debt Notes, Series 2024-DNA1, Class A1, (30-day Average USD-SOFR + 1.35%) 6.685% 2/25/20441,3,4 | 3,538 | 3,562 | ||
Freddie Mac Structured Agency Credit Risk Debt Notes, Series 2020-HQA1, Class B2, (30-day Average USD-SOFR + 5.214%) 10.55% 1/25/20501,3,4 | 3,055 | 3,304 | ||
Freddie Mac Structured Agency Credit Risk Debt Notes, Series 2020-DNA3, Class B2, (30-day Average USD-SOFR + 9.464%) 14.80% 6/25/20501,3,4 | 8,401 | 11,022 | ||
Freddie Mac Structured Agency Credit Risk Debt Notes, Series 2020-DNA4, Class B2, (30-day Average USD-SOFR + 10.114%) 15.45% 8/25/20501,3,4 | 5,500 | 7,472 | ||
Freddie Mac Structured Agency Credit Risk Debt Notes, Series 2020-DNA5, Class B2, (30-day Average USD-SOFR + 11.50%) 16.827% 10/25/20501,3,4 | 6,000 | 8,370 | ||
Legacy Mortgage Asset Trust, Series 2020-GS3, Class A1, 7.25% 5/25/2060 (7.25% on 4/25/2024)1,4,5 | 525 | 533 | ||
Legacy Mortgage Asset Trust, Series 2022-GS1, Class A1, 4.00% 2/25/2061 (7.00% on 4/25/2025)1,4,5 | 1,465 | 1,431 | ||
Progress Residential Trust, Series 2024-SFR1, Class E1, 3.85% 2/17/20411,4 | 1,697 | 1,507 | ||
Progress Residential Trust, Series 2024-SFR1, Class E2, 3.85% 2/17/20411,4 | 698 | 604 | ||
Progress Residential Trust, Series 2024-SFR2, Class E1, 3.40% 4/17/20411,3,4 | 1,532 | 1,334 | ||
Progress Residential Trust, Series 2024-SFR2, Class E2, 3.65% 4/17/20411,3,4 | 642 | 554 | ||
Progress Residential Trust, Series 2024-SFR3, Class E1, 4.00% 6/17/20411,4 | 3,457 | 3,078 | ||
Progress Residential Trust, Series 2024-SFR3, Class E2, 4.00% 6/17/20411,4 | 889 | 777 | ||
47,156 | ||||
Total mortgage-backed obligations | 1,055,827 | |||
Corporate bonds, notes & loans 31.52% | ||||
Financials 6.94% | ||||
AerCap Ireland Capital DAC 1.75% 1/30/2026 | 150 | 141 | ||
AG Issuer, LLC 6.25% 3/1/20284 | 1,375 | 1,346 | ||
AG TTMT Escrow Issuer, LLC 8.625% 9/30/20274 | 1,175 | 1,219 | ||
Alpha Bank SA 4.25% 2/13/2030 (5-year EUR Mid-Swap + 4.504% on 2/13/2025)5 | EUR715 | 763 | ||
Alpha Bank SA 4.25% 6/11/2031 (5-year EUR Mid-Swap + 5.823% on 6/11/2026)5 | 105 | 112 | ||
American Express Co. 5.043% 5/1/2034 (USD-SOFR + 1.835% on 5/1/2033)5 | USD200 | 196 | ||
AmWINS Group, Inc. 6.375% 2/15/20294 | 1,000 | 1,003 | ||
Aon Corp. 3.90% 2/28/2052 | 1,837 | 1,361 | ||
Aon North America, Inc. 5.45% 3/1/2034 | 1,230 | 1,225 | ||
Aretec Group, Inc. 7.50% 4/1/20294 | 300 | 289 | ||
Aretec Group, Inc. 10.00% 8/15/20304 | 840 | 915 | ||
Banco BTG Pactual SA 6.25% 4/8/20294 | 431 | 433 | ||
Bangkok Bank Public Co., Ltd. 3.733% 9/25/2034 (5-year UST Yield Curve Rate T Note Constant Maturity + 1.90% on 9/25/2029)5 | 1,530 | 1,357 | ||
Bangkok Bank Public Co., Ltd. 3.466% 9/23/2036 (5-year UST Yield Curve Rate T Note Constant Maturity + 2.15% on 9/23/2031)5 | 1,000 | 833 | ||
Bank of America Corp. 4.948% 7/22/2028 (USD-SOFR + 2.04% on 7/22/2027)5 | 750 | 744 | ||
Bank of America Corp. 5.288% 4/25/2034 (USD-SOFR + 1.91% on 4/25/2033)5 | 3,530 | 3,495 | ||
Bank of America Corp. 5.872% 9/15/2034 (USD-SOFR + 1.84% on 9/15/2033)5 | 1,354 | 1,393 | ||
Bank of America Corp. 5.468% 1/23/2035 (3-month USD CME Term SOFR + 1.65% on 1/23/2034)5 | 1,775 | 1,774 | ||
Bank of East Asia, Ltd. 4.875% 4/22/2032 (5-year UST Yield Curve Rate T Note Constant Maturity + 2.30% on 4/22/2027)5 | 650 | 618 | ||
Bank of Montreal 2.65% 3/8/2027 | 350 | 328 | ||
Bank of New York Mellon Corp. 5.188% 3/14/2035 (USD-SOFR + 1.418% on 3/14/2034)5 | 1,509 | 1,490 | ||
15 | Capital Group Fixed Income ETF Trust |
Capital Group Core Plus Income ETF (continued)
Bonds, notes & other debt instruments (continued) | Principal amount (000) | Value (000) | ||
Corporate bonds, notes & loans (continued) | ||||
Financials (continued) | ||||
BBVA Bancomer, SA 8.45% 6/29/2038 (5-year UST Yield Curve Rate T Note Constant Maturity + 4.661% on 6/29/2033)4,5 | USD1,055 | $1,088 | ||
BlackRock Funding, Inc. 5.00% 3/14/2034 | 2,460 | 2,442 | ||
BlackRock Funding, Inc. 5.25% 3/14/2054 | 1,710 | 1,654 | ||
Block, Inc. 6.50% 5/15/20324 | 2,200 | 2,232 | ||
BNP Paribas SA 2.591% 1/20/2028 (USD-SOFR + 1.228% on 1/20/2027)4,5 | 200 | 186 | ||
BNP Paribas SA 5.738% 2/20/2035 (USD-SOFR + 1.88% on 2/20/2034)4,5 | 4,150 | 4,131 | ||
Boost Newco Borrower, LLC 7.50% 1/15/20314 | 1,200 | 1,252 | ||
BPCE SA 5.936% 5/30/2035 (USD-SOFR + 1.85% on 5/30/2034)4,5 | 2,900 | 2,890 | ||
Bread Financial Holdings, Inc. 9.75% 3/15/20294 | 1,515 | 1,593 | ||
CaixaBank, SA 6.84% 9/13/2034 (USD-SOFR + 2.77% on 9/13/2033)4,5 | 1,600 | 1,691 | ||
CaixaBank, SA 6.037% 6/15/2035 (USD-SOFR + 2.26% on 9/15/2034)4,5 | 3,405 | 3,414 | ||
Capital One Financial Corp. 5.70% 2/1/2030 (USD-SOFR + 1.905% on 2/1/2029)5 | 1,700 | 1,708 | ||
Capital One Financial Corp. 6.377% 6/8/2034 (USD-SOFR + 2.86% on 6/8/2033)5 | 1,450 | 1,489 | ||
Capital One Financial Corp. 6.051% 2/1/2035 (USD-SOFR + 2.26% on 2/1/2034)5 | 2,216 | 2,230 | ||
Charles Schwab Corp. (The) 5.853% 5/19/2034 (USD-SOFR + 2.50% on 5/19/2033)5 | 1,592 | 1,624 | ||
Chubb INA Holdings, LLC 5.00% 3/15/2034 | 2,250 | 2,229 | ||
Citigroup, Inc. 3.057% 1/25/2033 (USD-SOFR + 1.351% on 1/25/2032)5 | 1,040 | 884 | ||
Citigroup, Inc. 6.27% 11/17/2033 (USD-SOFR + 2.338% on 11/17/2032)5 | 2,054 | 2,152 | ||
Citigroup, Inc. 6.174% 5/25/2034 (USD-SOFR + 2.661% on 5/25/2033)5 | 2,030 | 2,066 | ||
Citigroup, Inc. 5.827% 2/13/2035 (USD-SOFR + 2.056% on 2/13/2034)5 | 100 | 99 | ||
Citigroup, Inc. 5.449% 6/11/2035 (USD-SOFR + 1.447% on 6/11/2034)5 | 700 | 695 | ||
Coinbase Global, Inc. 3.625% 10/1/20314 | 350 | 281 | ||
Compass Group Diversified Holdings, LLC 5.25% 4/15/20294 | 3,549 | 3,369 | ||
Compass Group Diversified Holdings, LLC 5.00% 1/15/20324 | 1,630 | 1,476 | ||
Corebridge Financial, Inc. 3.90% 4/5/2032 | 741 | 663 | ||
Corebridge Financial, Inc. 4.35% 4/5/2042 | 98 | 81 | ||
Corebridge Financial, Inc. 4.40% 4/5/2052 | 1,335 | 1,051 | ||
Danske Bank AS 4.298% 4/1/2028 (1-year UST Yield Curve Rate T Note Constant Maturity + 1.75% on 4/1/2027)4,5 | 600 | 581 | ||
Deutsche Bank AG 5.706% 2/8/2028 (USD-SOFR + 1.594% on 2/8/2027)5 | 943 | 942 | ||
Deutsche Bank AG 6.819% 11/20/2029 (USD-SOFR + 2.51% on 11/20/2028)5 | 1,750 | 1,821 | ||
Goldman Sachs Group, Inc. 3.102% 2/24/2033 (USD-SOFR + 1.41% on 2/24/2032)5 | 1,017 | 869 | ||
Goldman Sachs Group, Inc. 5.851% 4/25/2035 (USD-SOFR + 1.552% on 4/25/2034)5 | 5,275 | 5,405 | ||
Goldman Sachs Group, Inc. 3.436% 2/24/2043 (USD-SOFR + 1.632% on 2/24/2042)5 | 4,243 | 3,207 | ||
Howden UK Refinance 2 PLC 8.125% 2/15/20324 | 1,925 | 1,914 | ||
Howden UK Refinance PLC 7.25% 2/15/20314 | 1,855 | 1,843 | ||
HSBC Holdings PLC 5.402% 8/11/2033 (USD-SOFR + 2.87% on 8/11/2032)5 | 1,125 | 1,113 | ||
HSBC Holdings PLC 5.719% 3/4/2035 (USD-SOFR + 1.78% on 3/4/2034)5 | 1,428 | 1,436 | ||
HSBC Holdings PLC 6.332% 3/9/2044 (USD-SOFR + 2.65% on 3/9/2043)5 | 2,869 | 3,003 | ||
HUB International, Ltd. 5.625% 12/1/20294 | 300 | 284 | ||
HUB International, Ltd. 7.25% 6/15/20304 | 2,350 | 2,411 | ||
ING Groep NV 4.017% 3/28/2028 (USD-SOFR + 1.83% on 3/28/2027)5 | 375 | 362 | ||
JPMorgan Chase & Co. 5.571% 4/22/2028 (USD-SOFR + 0.93% on 4/22/2027)5 | 338 | 341 | ||
JPMorgan Chase & Co. 5.35% 6/1/2034 (USD-SOFR + 1.845% on 6/1/2033)5 | 1,925 | 1,917 | ||
JPMorgan Chase & Co. 5.336% 1/23/2035 (USD-SOFR + 1.62% on 1/23/2034)5 | 400 | 398 | ||
JPMorgan Chase & Co. 5.766% 4/22/2035 (USD-SOFR + 1.49% on 4/22/2034)5 | 4,775 | 4,901 | ||
Kasikornbank PCL (Hong Kong Branch) 3.343% 10/2/2031 (5-year UST Yield Curve Rate T Note Constant Maturity + 1.70% on 10/2/2026)5 | 950 | 887 | ||
Ladder Capital Finance Holdings LLLP 7.00% 7/15/20314 | 970 | 979 | ||
Lloyds Banking Group PLC 5.679% 1/5/2035 (1-year UST Yield Curve Rate T Note Constant Maturity + 1.75% on 1/5/2034)5 | 2,095 | 2,088 | ||
Mastercard, Inc. 4.85% 3/9/2033 | 65 | 65 | ||
MetLife, Inc. 5.375% 7/15/2033 | 300 | 303 | ||
Metropolitan Life Global Funding I 5.15% 3/28/20334 | 3,102 | 3,066 | ||
Metropolitan Life Global Funding I 5.05% 1/8/20344 | 3,705 | 3,644 | ||
Morgan Stanley 4.21% 4/20/2028 (USD-SOFR + 1.61% on 4/20/2027)5 | 471 | 458 | ||
Morgan Stanley 5.164% 4/20/2029 (USD-SOFR + 1.59% on 4/20/2028)5 | 160 | 159 | ||
Morgan Stanley 5.656% 4/18/2030 (USD-SOFR + 1.26% on 4/18/2029)5 | 302 | 307 | ||
Morgan Stanley 4.889% 7/20/2033 (USD-SOFR + 2.077% on 7/20/2032)5 | 445 | 429 | ||
Morgan Stanley 5.25% 4/21/2034 (USD-SOFR + 1.87% on 4/21/2033)5 | 2,400 | 2,364 | ||
Morgan Stanley 5.424% 7/21/2034 (USD-SOFR + 1.88% on 7/21/2033)5 | 2,613 | 2,601 | ||
Capital Group Fixed Income ETF Trust | 16 |
Capital Group Core Plus Income ETF (continued)
Bonds, notes & other debt instruments (continued) | Principal amount (000) | Value (000) | ||
Corporate bonds, notes & loans (continued) | ||||
Financials (continued) | ||||
Morgan Stanley 5.831% 4/19/2035 (USD-SOFR + 1.58% on 4/19/2034)5 | USD6,075 | $6,230 | ||
Morgan Stanley 5.942% 2/7/2039 (5-year UST Yield Curve Rate T Note Constant Maturity + 1.80% on 2/7/2039)5 | 1,750 | 1,732 | ||
Nasdaq, Inc. 5.95% 8/15/2053 | 1,100 | 1,113 | ||
Nasdaq, Inc. 6.10% 6/28/2063 | 850 | 866 | ||
Navient Corp. 5.50% 3/15/2029 | 970 | 887 | ||
Navient Corp. 9.375% 7/25/2030 | 1,050 | 1,105 | ||
Navient Corp. 11.50% 3/15/2031 | 1,850 | 2,040 | ||
Navient Corp. 5.625% 8/1/2033 | 4,573 | 3,654 | ||
New York Life Global Funding 0.85% 1/15/20264 | 125 | 117 | ||
New York Life Global Funding 4.55% 1/28/20334 | 1,013 | 964 | ||
New York Life Global Funding 5.00% 1/9/20344 | 2,360 | 2,321 | ||
Onemain Finance Corp. 7.50% 5/15/2031 | 1,845 | 1,868 | ||
Piraeus Bank SA 5.00% 4/16/2030 (1-year EUR-ICE Swap EURIBOR + 2.245% on 4/16/2029)5 | EUR1,500 | 1,603 | ||
PNC Financial Services Group, Inc. 6.875% 10/20/2034 (USD-SOFR + 2.284% on 10/20/2033)5 | USD5,500 | 5,997 | ||
PNC Financial Services Group, Inc. 5.676% 1/22/2035 (USD-SOFR + 1.902% on 1/22/2034)5 | 23 | 23 | ||
State Street Corp. 4.821% 1/26/2034 (USD-SOFR + 1.567% on 1/26/2033)5 | 1,640 | 1,586 | ||
State Street Corp. 5.159% 5/18/2034 (USD-SOFR + 1.89% on 5/18/2033)5 | 678 | 670 | ||
Synchrony Financial 2.875% 10/28/2031 | 500 | 401 | ||
Synchrony Financial 7.25% 2/2/2033 | 475 | 473 | ||
Truist Financial Corp. 5.867% 6/8/2034 (USD-SOFR + 2.361% on 6/8/2033)5 | 1,597 | 1,610 | ||
Truist Financial Corp. 5.711% 1/24/2035 (USD-SOFR + 1.922% on 1/24/2034)5 | 2,524 | 2,514 | ||
U.S. Bancorp 5.836% 6/12/2034 (USD-SOFR + 2.26% on 6/10/2033)5 | 25 | 25 | ||
U.S. Bancorp 5.678% 1/23/2035 (USD-SOFR + 1.86% on 1/23/2034)5 | 3,775 | 3,791 | ||
UBS Group AG 3.091% 5/14/2032 (USD-SOFR + 1.73% on 5/14/2031)4,5 | 1,800 | 1,536 | ||
UBS Group AG 6.301% 9/22/2034 (1-year UST Yield Curve Rate T Note Constant Maturity + 2.00% on 9/22/2033)4,5 | 1,600 | 1,665 | ||
UBS Group AG 5.699% 2/8/2035 (1-year UST Yield Curve Rate T Note Constant Maturity + 1.77% on 2/8/2034)4,5 | 3,385 | 3,383 | ||
Wells Fargo & Co. 3.908% 4/25/2026 (USD-SOFR + 1.32% on 4/25/2025)5 | 469 | 462 | ||
Wells Fargo & Co. 4.808% 7/25/2028 (USD-SOFR + 1.98% on 7/25/2027)5 | 1,050 | 1,036 | ||
Wells Fargo & Co. 5.389% 4/24/2034 (USD-SOFR + 2.02% on 4/24/2033)5 | 3,045 | 3,011 | ||
Wells Fargo & Co. 5.557% 7/25/2034 (USD-SOFR + 1.99% on 7/25/2033)5 | 24 | 24 | ||
Wells Fargo & Co. 6.491% 10/23/2034 (USD-SOFR + 2.06% on 10/23/2033)5 | 4,149 | 4,425 | ||
Wells Fargo & Co. 5.499% 1/23/2035 (USD-SOFR + 1.78% on 1/23/2034)5 | 1,500 | 1,495 | ||
Wells Fargo & Co. 4.611% 4/25/2053 (USD-SOFR + 2.13% on 4/25/2052)5 | 790 | 676 | ||
175,106 | ||||
Energy 4.96% | ||||
3R Lux SARL 9.75% 2/5/20314 | 585 | 614 | ||
Apache Corp. 5.10% 9/1/2040 | 350 | 299 | ||
Apache Corp. 5.25% 2/1/2042 | 1,300 | 1,124 | ||
Apache Corp. 5.35% 7/1/2049 | 965 | 809 | ||
Ascent Resources Utica Holdings, LLC 7.00% 11/1/20264 | 250 | 250 | ||
Baytex Energy Corp. 7.375% 3/15/20324 | 1,145 | 1,164 | ||
Blue Racer Midstream, LLC 7.00% 7/15/20294 | 675 | 688 | ||
Blue Racer Midstream, LLC 7.25% 7/15/20324 | 505 | 520 | ||
Borr IHC, Ltd. 10.00% 11/15/20284 | 2,043 | 2,142 | ||
Borr IHC, Ltd. 10.375% 11/15/20304 | 878 | 921 | ||
BP Capital Markets America, Inc. 4.893% 9/11/2033 | 1,200 | 1,167 | ||
Cheniere Energy Partners, LP 4.00% 3/1/2031 | 789 | 718 | ||
Cheniere Energy Partners, LP 5.95% 6/30/2033 | 1,800 | 1,826 | ||
Cheniere Energy, Inc. 4.625% 10/15/2028 | 175 | 170 | ||
Chesapeake Energy Corp. 5.875% 2/1/20294 | 425 | 421 | ||
Chesapeake Energy Corp. 6.75% 4/15/20294 | 761 | 763 | ||
Chord Energy Corp. 6.375% 6/1/20264 | 350 | 350 | ||
Civitas Resources, Inc. 8.375% 7/1/20284 | 1,325 | 1,390 | ||
Civitas Resources, Inc. 8.625% 11/1/20304 | 1,525 | 1,636 | ||
Civitas Resources, Inc. 8.75% 7/1/20314 | 1,325 | 1,421 | ||
17 | Capital Group Fixed Income ETF Trust |
Capital Group Core Plus Income ETF (continued)
Bonds, notes & other debt instruments (continued) | Principal amount (000) | Value (000) | ||
Corporate bonds, notes & loans (continued) | ||||
Energy (continued) | ||||
CNX Resources Corp. 7.375% 1/15/20314 | USD185 | $189 | ||
CNX Resources Corp. 7.25% 3/1/20324 | 735 | 750 | ||
Comstock Resources, Inc. 5.875% 1/15/20304 | 4,207 | 3,918 | ||
ConocoPhillips Co. 3.80% 3/15/2052 | 2,950 | 2,204 | ||
Crescent Energy Finance, LLC 9.25% 2/15/20284 | 1,173 | 1,241 | ||
Crescent Energy Finance, LLC 7.625% 4/1/20324 | 805 | 821 | ||
Crescent Energy Finance, LLC 7.375% 1/15/20334 | 1,045 | 1,048 | ||
Diamondback Energy, Inc. 5.15% 1/30/2030 | 731 | 728 | ||
Diamondback Energy, Inc. 5.40% 4/18/2034 | 2,498 | 2,474 | ||
Diamondback Energy, Inc. 5.75% 4/18/2054 | 2,627 | 2,549 | ||
Diamondback Energy, Inc. 5.90% 4/18/2064 | 1,277 | 1,234 | ||
Ecopetrol SA 4.625% 11/2/2031 | 10 | 8 | ||
Ecopetrol SA 8.875% 1/13/2033 | 2,500 | 2,583 | ||
Ecopetrol SA 8.375% 1/19/2036 | 3,855 | 3,789 | ||
Enbridge, Inc. 6.70% 11/15/2053 | 673 | 735 | ||
Encino Acquisition Partners Holdings, LLC 8.75% 5/1/20314 | 1,925 | 2,009 | ||
Energy Transfer, LP 5.60% 9/1/2034 | 1,638 | 1,628 | ||
Energy Transfer, LP 5.95% 5/15/2054 | 1,500 | 1,462 | ||
Energy Transfer, LP 6.05% 9/1/2054 | 696 | 687 | ||
Eni SpA 5.50% 5/15/20344 | 2,883 | 2,858 | ||
Eni SpA 5.95% 5/15/20544 | 4,177 | 4,105 | ||
EQM Midstream Partners, LP 6.00% 7/1/20254 | 430 | 430 | ||
EQM Midstream Partners, LP 4.75% 1/15/20314 | 2,194 | 2,053 | ||
Exxon Mobil Corp. 3.452% 4/15/2051 | 3,755 | 2,712 | ||
Genesis Energy, LP 8.25% 1/15/2029 | 617 | 637 | ||
Genesis Energy, LP 7.875% 5/15/2032 | 200 | 202 | ||
GeoPark, Ltd. 5.50% 1/17/2027 | 400 | 364 | ||
Global Partners, LP 8.25% 1/15/20324 | 285 | 293 | ||
Harvest Midstream I, LP 7.50% 9/1/20284 | 75 | 76 | ||
Hilcorp Energy I, LP 6.00% 4/15/20304 | 135 | 131 | ||
Hilcorp Energy I, LP 6.25% 4/15/20324 | 2,175 | 2,093 | ||
Hilcorp Energy I, LP 8.375% 11/1/20334 | 1,410 | 1,504 | ||
Kinder Morgan, Inc. 5.20% 6/1/2033 | 189 | 184 | ||
Kinder Morgan, Inc. 5.40% 2/1/2034 | 1,640 | 1,616 | ||
Kinder Morgan, Inc. 3.60% 2/15/2051 | 2,985 | 2,040 | ||
Kinder Morgan, Inc. 5.45% 8/1/2052 | 145 | 134 | ||
Kinetik Holdings, LP 6.625% 12/15/20284 | 740 | 752 | ||
MPLX, LP 4.95% 9/1/2032 | 561 | 537 | ||
MPLX, LP 4.95% 3/14/2052 | 1,430 | 1,213 | ||
MPLX, LP 5.65% 3/1/2053 | 3,168 | 2,984 | ||
MV24 Capital BV 6.748% 6/1/2034 | 709 | 678 | ||
New Fortress Energy, Inc. 6.50% 9/30/20264 | 3,216 | 2,961 | ||
New Fortress Energy, Inc. 8.75% 3/15/20294 | 2,625 | 2,398 | ||
NGL Energy Operating, LLC 8.125% 2/15/20294 | 1,775 | 1,810 | ||
NGL Energy Operating, LLC 8.375% 2/15/20324 | 3,480 | 3,536 | ||
Noble Finance II, LLC 8.00% 4/15/20304 | 150 | 156 | ||
Northern Oil and Gas, Inc. 8.75% 6/15/20314 | 885 | 930 | ||
Occidental Petroleum Corp. 6.125% 1/1/2031 | 415 | 425 | ||
Occidental Petroleum Corp. 6.60% 3/15/2046 | 1,875 | 1,957 | ||
ONEOK, Inc. 4.00% 7/13/2027 | 50 | 48 | ||
ONEOK, Inc. 6.35% 1/15/2031 | 40 | 42 | ||
ONEOK, Inc. 6.05% 9/1/2033 | 575 | 592 | ||
ONEOK, Inc. 4.50% 3/15/2050 | 75 | 59 | ||
ONEOK, Inc. 7.15% 1/15/2051 | 150 | 165 | ||
Permian Resources Operating, LLC 9.875% 7/15/20314 | 820 | 908 | ||
Permian Resources Operating, LLC 7.00% 1/15/20324 | 285 | 293 | ||
Petrobras Global Finance BV 5.60% 1/3/2031 | 611 | 586 | ||
Petroleos Mexicanos 6.49% 1/23/2027 | 1,475 | 1,417 | ||
Petroleos Mexicanos 5.95% 1/28/2031 | 600 | 484 | ||
Petroleos Mexicanos 6.70% 2/16/2032 | 950 | 796 | ||
Raizen Fuels Finance SA 6.45% 3/5/20344 | 1,060 | 1,077 | ||
Raizen Fuels Finance SA 6.95% 3/5/20544 | 275 | 280 | ||
Saturn Oil & Gas, Inc. 9.625% 6/15/20294 | 1,400 | 1,414 | ||
Capital Group Fixed Income ETF Trust | 18 |
Capital Group Core Plus Income ETF (continued)
Bonds, notes & other debt instruments (continued) | Principal amount (000) | Value (000) | ||
Corporate bonds, notes & loans (continued) | ||||
Energy (continued) | ||||
Seadrill Finance, Ltd. 8.375% 8/1/20304 | USD210 | $220 | ||
Shell International Finance BV 2.75% 4/6/2030 | 75 | 67 | ||
Shell International Finance BV 3.00% 11/26/2051 | 5,247 | 3,439 | ||
Southwestern Energy Co. 4.75% 2/1/2032 | 2,281 | 2,100 | ||
Sunoco, LP 7.00% 5/1/20294 | 1,375 | 1,410 | ||
Sunoco, LP 4.50% 4/30/2030 | 150 | 139 | ||
Sunoco, LP 7.25% 5/1/20324 | 1,225 | 1,268 | ||
Talos Production, Inc. 9.00% 2/1/20294 | 705 | 741 | ||
Talos Production, Inc. 9.375% 2/1/20314 | 185 | 195 | ||
Transocean Aquila, Ltd. 8.00% 9/30/20284 | 440 | 447 | ||
Transocean, Inc. 8.00% 2/1/20274 | 686 | 684 | ||
Transocean, Inc. 8.25% 5/15/20294 | 1,180 | 1,184 | ||
Transocean, Inc. 8.75% 2/15/20304 | 611 | 642 | ||
Transocean, Inc. 8.50% 5/15/20314 | 1,010 | 1,011 | ||
Transocean, Inc. 6.80% 3/15/2038 | 2,005 | 1,665 | ||
USA Compression Partners, LP 7.125% 3/15/20294 | 1,340 | 1,351 | ||
Vallourec SA 7.50% 4/15/20324 | 2,070 | 2,146 | ||
Venture Global Calcasieu Pass, LLC 6.25% 1/15/20304 | 1,249 | 1,268 | ||
Venture Global Calcasieu Pass, LLC 4.125% 8/15/20314 | 1,994 | 1,791 | ||
Venture Global LNG, Inc. 8.125% 6/1/20284 | 750 | 773 | ||
Venture Global LNG, Inc. 8.375% 6/1/20314 | 465 | 483 | ||
Vital Energy, Inc. 7.875% 4/15/20324 | 1,955 | 1,989 | ||
Weatherford International, Ltd. 8.625% 4/30/20304 | 125 | 130 | ||
Williams Companies, Inc. 2.60% 3/15/2031 | 55 | 47 | ||
Williams Companies, Inc. 5.15% 3/15/2034 | 1,479 | 1,444 | ||
125,014 | ||||
Health care 4.32% | ||||
AbbVie, Inc. 5.05% 3/15/2034 | 5,600 | 5,586 | ||
AbbVie, Inc. 5.35% 3/15/2044 | 125 | 124 | ||
AbbVie, Inc. 5.40% 3/15/2054 | 3,100 | 3,068 | ||
AbbVie, Inc. 5.50% 3/15/2064 | 1,850 | 1,828 | ||
Amgen, Inc. 5.25% 3/2/2030 | 623 | 628 | ||
Amgen, Inc. 4.20% 3/1/2033 | 2,065 | 1,914 | ||
Amgen, Inc. 5.25% 3/2/2033 | 1,595 | 1,591 | ||
Amgen, Inc. 4.875% 3/1/2053 | 275 | 242 | ||
Amgen, Inc. 5.65% 3/2/2053 | 7,071 | 6,969 | ||
Amgen, Inc. 5.75% 3/2/2063 | 1,860 | 1,823 | ||
AstraZeneca Finance, LLC 4.90% 2/26/2031 | 275 | 274 | ||
AstraZeneca Finance, LLC 5.00% 2/26/2034 | 1,725 | 1,716 | ||
Bausch Health Companies, Inc. 6.125% 2/1/20274 | 75 | 62 | ||
Bausch Health Companies, Inc. 5.25% 2/15/20314 | 110 | 52 | ||
Baxter International, Inc. 2.539% 2/1/2032 | 922 | 757 | ||
Baxter International, Inc. 3.132% 12/1/2051 | 4,781 | 2,999 | ||
Bayer US Finance, LLC 6.50% 11/21/20334 | 2,203 | 2,254 | ||
Bayer US Finance, LLC 6.875% 11/21/20534 | 1,773 | 1,823 | ||
Bristol-Myers Squibb Co. 5.10% 2/22/2031 | 800 | 803 | ||
Bristol-Myers Squibb Co. 5.20% 2/22/2034 | 6,500 | 6,489 | ||
Bristol-Myers Squibb Co. 5.50% 2/22/2044 | 325 | 322 | ||
Bristol-Myers Squibb Co. 5.55% 2/22/2054 | 3,305 | 3,261 | ||
Bristol-Myers Squibb Co. 5.65% 2/22/2064 | 805 | 787 | ||
Centene Corp. 2.45% 7/15/2028 | 1,865 | 1,657 | ||
Centene Corp. 2.625% 8/1/2031 | 3,145 | 2,586 | ||
CHS / Community Health Systems, Inc. 5.25% 5/15/20304 | 75 | 62 | ||
CVS Health Corp. 1.875% 2/28/2031 | 50 | 40 | ||
CVS Health Corp. 5.70% 6/1/2034 | 5,100 | 5,088 | ||
CVS Health Corp. 6.00% 6/1/2044 | 2,250 | 2,206 | ||
CVS Health Corp. 5.875% 6/1/2053 | 3,213 | 3,081 | ||
CVS Health Corp. 6.05% 6/1/2054 | 2,900 | 2,846 | ||
CVS Health Corp. 6.00% 6/1/2063 | 1,061 | 1,017 | ||
Elevance Health, Inc. 4.10% 5/15/2032 | 423 | 393 | ||
Elevance Health, Inc. 5.375% 6/15/2034 | 2,300 | 2,312 | ||
19 | Capital Group Fixed Income ETF Trust |
Capital Group Core Plus Income ETF (continued)
Bonds, notes & other debt instruments (continued) | Principal amount (000) | Value (000) | ||
Corporate bonds, notes & loans (continued) | ||||
Health care (continued) | ||||
Elevance Health, Inc. 4.55% 5/15/2052 | USD203 | $170 | ||
Endo Finance Holdings, Inc. 8.50% 4/15/20314 | 2,005 | 2,072 | ||
Endo International PLC, Term Loan B, (3-month USD CME Term SOFR + 4.50%) 9.826% 4/23/20313,6 | 1,480 | 1,479 | ||
Gilead Sciences, Inc. 5.55% 10/15/2053 | 325 | 325 | ||
Grifols, SA 7.50% 5/1/2030 | EUR2,500 | 2,677 | ||
HCA, Inc. 3.625% 3/15/2032 | USD79 | 70 | ||
Humana, Inc. 5.75% 4/15/2054 | 1,767 | 1,704 | ||
Medline Borrower, LP 6.25% 4/1/20294 | 575 | 582 | ||
Molina Healthcare, Inc. 3.875% 11/15/20304 | 614 | 546 | ||
Molina Healthcare, Inc. 3.875% 5/15/20324 | 2,765 | 2,398 | ||
Owens & Minor, Inc. 6.25% 4/1/20304 | 1,265 | 1,151 | ||
Pfizer Investment Enterprises Pte., Ltd. 4.75% 5/19/2033 | 1,051 | 1,024 | ||
Pfizer Investment Enterprises Pte., Ltd. 5.11% 5/19/2043 | 1,500 | 1,427 | ||
Pfizer Investment Enterprises Pte., Ltd. 5.30% 5/19/2053 | 6,078 | 5,867 | ||
Radiology Partners, Inc. 7.775% 1/31/20294 | 598 | 561 | ||
Radiology Partners, Inc., Term Loan B, (3-month USD CME Term SOFR + 5.00%) 10.588% 1/31/20293,6 | 36 | 34 | ||
Roche Holdings, Inc. 5.593% 11/13/20334 | 750 | 778 | ||
Roche Holdings, Inc. 4.985% 3/8/20344 | 5,460 | 5,416 | ||
Sterigenics-Nordion Holdings, LLC 7.375% 6/1/20314 | 1,300 | 1,304 | ||
Tenet Healthcare Corp. 6.75% 5/15/2031 | 200 | 203 | ||
Teva Pharmaceutical Finance Netherlands III BV 3.15% 10/1/2026 | 2,027 | 1,904 | ||
Teva Pharmaceutical Finance Netherlands III BV 4.75% 5/9/2027 | 1,500 | 1,447 | ||
Teva Pharmaceutical Finance Netherlands III BV 6.75% 3/1/2028 | 482 | 494 | ||
Teva Pharmaceutical Finance Netherlands III BV 5.125% 5/9/2029 | 3,571 | 3,438 | ||
Teva Pharmaceutical Finance Netherlands III BV 7.875% 9/15/2029 | 1,300 | 1,398 | ||
Teva Pharmaceutical Finance Netherlands III BV 8.125% 9/15/2031 | 1,589 | 1,769 | ||
Teva Pharmaceutical Finance Netherlands III BV 4.10% 10/1/2046 | 2,168 | 1,517 | ||
UnitedHealth Group, Inc. 4.20% 5/15/2032 | 230 | 217 | ||
UnitedHealth Group, Inc. 4.75% 5/15/2052 | 355 | 314 | ||
108,946 | ||||
Industrials 2.39% | ||||
Ambipar Lux SARL 9.875% 2/6/20314 | 1,349 | 1,309 | ||
BAE Systems PLC 5.30% 3/26/20344 | 1,764 | 1,748 | ||
Boeing Co. 2.75% 2/1/2026 | 115 | 109 | ||
Boeing Co. 3.625% 2/1/2031 | 1,642 | 1,438 | ||
Boeing Co. 6.388% 5/1/20314 | 851 | 867 | ||
Boeing Co. 3.60% 5/1/2034 | 3,448 | 2,775 | ||
Boeing Co. 6.528% 5/1/20344 | 1,336 | 1,369 | ||
Boeing Co. 5.705% 5/1/2040 | 655 | 604 | ||
Boeing Co. 5.805% 5/1/2050 | 4,480 | 4,040 | ||
Boeing Co. 6.858% 5/1/20544 | 4,275 | 4,390 | ||
Boeing Co. 5.93% 5/1/2060 | 900 | 805 | ||
Bombardier, Inc. 7.125% 6/15/20264 | 64 | 65 | ||
Bombardier, Inc. 7.875% 4/15/20274 | 791 | 794 | ||
Bombardier, Inc. 6.00% 2/15/20284 | 1,021 | 1,010 | ||
Bombardier, Inc. 7.50% 2/1/20294 | 840 | 871 | ||
Bombardier, Inc. 8.75% 11/15/20304 | 550 | 595 | ||
Burlington Northern Santa Fe, LLC 5.20% 4/15/2054 | 2,535 | 2,430 | ||
Burlington Northern Santa Fe, LLC 5.50% 3/15/2055 | 786 | 788 | ||
Canadian Pacific Railway Co. 3.10% 12/2/2051 | 3,485 | 2,317 | ||
Carrier Global Corp. 2.722% 2/15/2030 | 130 | 115 | ||
Carrier Global Corp. 3.577% 4/5/2050 | 1,101 | 802 | ||
Carrier Global Corp. 6.20% 3/15/2054 | 1,457 | 1,561 | ||
Clean Harbors, Inc. 6.375% 2/1/20314 | 73 | 73 | ||
CoreLogic, Inc. 4.50% 5/1/20284 | 300 | 273 | ||
EquipmentShare.com, Inc. 8.625% 5/15/20324 | 530 | 550 | ||
Herc Holdings, Inc. 6.625% 6/15/20294 | 1,340 | 1,360 | ||
Hertz Corp. (The) 12.625% 7/15/20294 | 565 | 585 | ||
Icahn Enterprises, LP 9.75% 1/15/20294 | 1,949 | 2,022 | ||
Capital Group Fixed Income ETF Trust | 20 |
Capital Group Core Plus Income ETF (continued)
Bonds, notes & other debt instruments (continued) | Principal amount (000) | Value (000) | ||
Corporate bonds, notes & loans (continued) | ||||
Industrials (continued) | ||||
Ingersoll-Rand, Inc. 5.314% 6/15/2031 | USD796 | $801 | ||
Ingersoll-Rand, Inc. 5.45% 6/15/2034 | 744 | 751 | ||
IRB Infrastructure Developers, Ltd. 7.11% 3/11/20324 | 685 | 685 | ||
Lockheed Martin Corp. 5.70% 11/15/2054 | 212 | 218 | ||
Mileage Plus Holdings, LLC 6.50% 6/20/20274 | 36 | 36 | ||
Norfolk Southern Corp. 4.45% 3/1/2033 | 78 | 74 | ||
Norfolk Southern Corp. 5.35% 8/1/2054 | 4,524 | 4,318 | ||
Regal Rexnord Corp. 6.30% 2/15/2030 | 975 | 997 | ||
Regal Rexnord Corp. 6.40% 4/15/2033 | 2,097 | 2,147 | ||
Republic Services, Inc. 5.20% 11/15/2034 | 2,000 | 1,986 | ||
Ritchie Bros. Holdings, Inc. 7.75% 3/15/20314 | 35 | 37 | ||
RTX Corp. 6.10% 3/15/2034 | 877 | 924 | ||
RTX Corp. 2.82% 9/1/2051 | 925 | 564 | ||
RTX Corp. 5.375% 2/27/2053 | 2,317 | 2,202 | ||
Spirit AeroSystems, Inc. 9.375% 11/30/20294 | 1,583 | 1,706 | ||
Spirit AeroSystems, Inc. 9.75% 11/15/20304 | 925 | 1,022 | ||
TransDigm, Inc. 6.75% 8/15/20284 | 115 | 117 | ||
TransDigm, Inc. 4.625% 1/15/2029 | 838 | 783 | ||
TransDigm, Inc. 6.625% 3/1/20324 | 1,400 | 1,416 | ||
Union Pacific Corp. 2.80% 2/14/2032 | 409 | 353 | ||
Union Pacific Corp. 2.95% 3/10/2052 | 1,885 | 1,214 | ||
Union Pacific Corp. 4.95% 5/15/2053 | 2,275 | 2,121 | ||
United Airlines, Inc. 4.625% 4/15/20294 | 100 | 93 | ||
60,230 | ||||
Utilities 2.33% | ||||
Aegea Finance SARL 9.00% 1/20/20314 | 2,350 | 2,446 | ||
AES Panama Generation Holdings, SRL 4.375% 5/31/20304 | 193 | 168 | ||
Alabama Power Co. 5.85% 11/15/2033 | 300 | 312 | ||
Consumers Energy Co. 3.60% 8/15/2032 | 415 | 373 | ||
Consumers Energy Co. 4.625% 5/15/2033 | 625 | 599 | ||
Duke Energy Corp. 4.50% 8/15/2032 | 860 | 804 | ||
Duke Energy Corp. 6.10% 9/15/2053 | 300 | 305 | ||
Edison International 6.95% 11/15/2029 | 510 | 542 | ||
Electricité de France SA 9.125% junior subordinated perpetual bonds (5-year UST Yield Curve Rate T Note Constant Maturity + 5.411% on 6/15/2033)4,5 | 1,000 | 1,090 | ||
Entergy Louisiana, LLC 4.75% 9/15/2052 | 200 | 173 | ||
Eversource Energy 5.50% 1/1/2034 | 1,425 | 1,399 | ||
FirstEnergy Corp. 2.65% 3/1/2030 | 2,390 | 2,079 | ||
FirstEnergy Corp. 2.25% 9/1/2030 | 985 | 826 | ||
Florida Power & Light Co. 5.30% 4/1/2053 | 60 | 58 | ||
NiSource, Inc. 5.40% 6/30/2033 | 250 | 248 | ||
Northern States Power Co. 2.60% 6/1/2051 | 50 | 30 | ||
Pacific Gas and Electric Co. 3.15% 1/1/2026 | 40 | 39 | ||
Pacific Gas and Electric Co. 4.65% 8/1/2028 | 600 | 581 | ||
Pacific Gas and Electric Co. 4.55% 7/1/2030 | 755 | 716 | ||
Pacific Gas and Electric Co. 3.25% 6/1/2031 | 200 | 172 | ||
Pacific Gas and Electric Co. 6.15% 1/15/2033 | 200 | 203 | ||
Pacific Gas and Electric Co. 6.40% 6/15/2033 | 1,800 | 1,860 | ||
Pacific Gas and Electric Co. 6.95% 3/15/2034 | 350 | 377 | ||
Pacific Gas and Electric Co. 3.50% 8/1/2050 | 10,025 | 6,551 | ||
Pacific Gas and Electric Co. 6.70% 4/1/2053 | 5,129 | 5,344 | ||
PacifiCorp 5.45% 2/15/2034 | 3,013 | 2,978 | ||
PacifiCorp 5.35% 12/1/2053 | 1,625 | 1,476 | ||
PacifiCorp 5.50% 5/15/2054 | 2,650 | 2,464 | ||
PacifiCorp 5.80% 1/15/2055 | 5,210 | 5,049 | ||
PG&E Corp. 5.25% 7/1/2030 | 996 | 952 | ||
Public Service Company of Colorado 3.20% 3/1/2050 | 2,785 | 1,834 | ||
Public Service Company of Colorado 2.70% 1/15/2051 | 2,175 | 1,286 | ||
Public Service Company of Colorado 5.25% 4/1/2053 | 1,468 | 1,343 | ||
Southern California Edison Co. 2.75% 2/1/2032 | 864 | 729 | ||
Southern California Edison Co. 5.20% 6/1/2034 | 4,100 | 4,005 | ||
21 | Capital Group Fixed Income ETF Trust |
Capital Group Core Plus Income ETF (continued)
Bonds, notes & other debt instruments (continued) | Principal amount (000) | Value (000) | ||
Corporate bonds, notes & loans (continued) | ||||
Utilities (continued) | ||||
Southern California Edison Co. 3.65% 2/1/2050 | USD300 | $213 | ||
Southern California Edison Co. 2.95% 2/1/2051 | 2,670 | 1,659 | ||
Southern California Edison Co. 3.45% 2/1/2052 | 6,470 | 4,399 | ||
Southern California Edison Co. 5.75% 4/15/2054 | 1,160 | 1,137 | ||
Southwestern Public Service Co. 6.00% 6/1/2054 | 325 | 324 | ||
Talen Energy Supply, LLC 8.625% 6/1/20304 | 1,567 | 1,672 | ||
Xcel Energy, Inc. 4.60% 6/1/2032 | 75 | 70 | ||
58,885 | ||||
Communication services 2.13% | ||||
AT&T, Inc. 2.55% 12/1/2033 | 2,300 | 1,830 | ||
AT&T, Inc. 5.40% 2/15/2034 | 200 | 200 | ||
AT&T, Inc. 3.55% 9/15/2055 | 800 | 540 | ||
CCO Holdings, LLC 4.75% 2/1/20324 | 1,314 | 1,077 | ||
CCO Holdings, LLC 4.50% 5/1/2032 | 300 | 242 | ||
CCO Holdings, LLC 4.50% 6/1/20334 | 2,185 | 1,722 | ||
CCO Holdings, LLC 4.25% 1/15/20344 | 3,817 | 2,900 | ||
Charter Communications Operating, LLC 4.40% 4/1/2033 | 660 | 582 | ||
Charter Communications Operating, LLC 6.65% 2/1/2034 | 580 | 586 | ||
Charter Communications Operating, LLC 3.70% 4/1/2051 | 5,405 | 3,290 | ||
Charter Communications Operating, LLC 3.90% 6/1/2052 | 6,125 | 3,844 | ||
Charter Communications Operating, LLC 5.25% 4/1/2053 | 6,177 | 4,851 | ||
Comcast Corp. 5.30% 6/1/2034 | 4,369 | 4,382 | ||
Comcast Corp. 2.887% 11/1/2051 | 2,625 | 1,639 | ||
Comcast Corp. 5.65% 6/1/2054 | 1,422 | 1,421 | ||
Comcast Corp. 5.50% 5/15/2064 | 250 | 241 | ||
DISH DBS Corp. 5.875% 11/15/2024 | 248 | 236 | ||
DISH Network Corp. 11.75% 11/15/20274 | 1,350 | 1,325 | ||
Frontier Communications Holdings, LLC 5.00% 5/1/20284 | 711 | 671 | ||
Gray Television, Inc. 10.50% 7/15/20294 | 2,790 | 2,808 | ||
Gray Television, Inc. 4.75% 10/15/20304 | 180 | 108 | ||
Gray Television, Inc. 5.375% 11/15/20314 | 2,675 | 1,519 | ||
Gray Television, Inc., Term Loan B, (1-month USD CME Term SOFR + 5.25%) 10.57% 5/23/20293,6 | 710 | 676 | ||
Meta Platforms, Inc. 4.45% 8/15/2052 | 775 | 669 | ||
Midas OpCo Holdings, LLC 5.625% 8/15/20294 | 100 | 92 | ||
News Corp. 3.875% 5/15/20294 | 369 | 340 | ||
Sirius XM Radio, Inc. 4.00% 7/15/20284 | 664 | 600 | ||
Sirius XM Radio, Inc. 3.875% 9/1/20314 | 3,169 | 2,589 | ||
T-Mobile USA, Inc. 5.15% 4/15/2034 | 150 | 147 | ||
T-Mobile USA, Inc. 3.40% 10/15/2052 | 3,345 | 2,285 | ||
T-Mobile USA, Inc. 5.75% 1/15/2054 | 752 | 749 | ||
Univision Communications, Inc. 8.00% 8/15/20284 | 630 | 615 | ||
Univision Communications, Inc. 4.50% 5/1/20294 | 4,750 | 3,997 | ||
Univision Communications, Inc. 7.375% 6/30/20304 | 2,000 | 1,862 | ||
Univision Communications, Inc. 8.50% 7/31/20314 | 500 | 486 | ||
Verizon Communications, Inc. 1.75% 1/20/2031 | 400 | 324 | ||
Verizon Communications, Inc. 2.55% 3/21/2031 | 97 | 82 | ||
Verizon Communications, Inc. 2.875% 11/20/2050 | 132 | 83 | ||
Verizon Communications, Inc. 3.55% 3/22/2051 | 200 | 144 | ||
Verizon Communications, Inc. 3.875% 3/1/2052 | 1,132 | 859 | ||
Verizon Communications, Inc. 5.50% 2/23/2054 | 53 | 52 | ||
Verizon Communications, Inc. 2.987% 10/30/2056 | 264 | 162 | ||
WarnerMedia Holdings, Inc. 5.141% 3/15/2052 | 1,150 | 896 | ||
53,723 | ||||
Consumer discretionary 2.11% | ||||
Advance Auto Parts, Inc. 3.90% 4/15/2030 | 975 | 882 | ||
Advance Auto Parts, Inc. 3.50% 3/15/2032 | 1,700 | 1,445 | ||
Allied Universal Holdco, LLC 4.625% 6/1/20284 | 2,342 | 2,139 | ||
Amazon.com, Inc. 2.10% 5/12/2031 | 100 | 84 | ||
Amazon.com, Inc. 3.60% 4/13/2032 | 600 | 551 | ||
Capital Group Fixed Income ETF Trust | 22 |
Capital Group Core Plus Income ETF (continued)
Bonds, notes & other debt instruments (continued) | Principal amount (000) | Value (000) | ||
Corporate bonds, notes & loans (continued) | ||||
Consumer discretionary (continued) | ||||
Amazon.com, Inc. 3.95% 4/13/2052 | USD400 | $322 | ||
Atlas LuxCo 4 SARL 4.625% 6/1/20284 | 470 | 429 | ||
AutoNation, Inc. 3.85% 3/1/2032 | 300 | 267 | ||
Caesars Entertainment, Inc. 4.625% 10/15/20294 | 550 | 505 | ||
Carnival Corp. 5.75% 3/1/20274 | 1,250 | 1,236 | ||
Carnival Corp. 6.00% 5/1/20294 | 2,655 | 2,624 | ||
Carnival Corp. 7.00% 8/15/20294 | 520 | 539 | ||
Carnival Corp. 10.50% 6/1/20304 | 540 | 587 | ||
Cougar JV Subsidiary, LLC 8.00% 5/15/20324 | 1,105 | 1,144 | ||
Daimler Trucks Finance North America, LLC 3.65% 4/7/20274 | 350 | 335 | ||
Daimler Trucks Finance North America, LLC 5.375% 6/25/20344 | 1,380 | 1,365 | ||
Fertitta Entertainment, LLC 4.625% 1/15/20294 | 350 | 319 | ||
Ford Motor Co. 3.25% 2/12/2032 | 940 | 777 | ||
Ford Motor Co. 4.75% 1/15/2043 | 495 | 401 | ||
Ford Motor Co. 5.291% 12/8/2046 | 1,066 | 934 | ||
Ford Motor Credit Co., LLC 2.30% 2/10/2025 | 980 | 958 | ||
Ford Motor Credit Co., LLC 5.125% 6/16/2025 | 837 | 831 | ||
Ford Motor Credit Co., LLC 6.95% 6/10/2026 | 600 | 612 | ||
Ford Motor Credit Co., LLC 2.70% 8/10/2026 | 1,475 | 1,386 | ||
Ford Motor Credit Co., LLC 5.85% 5/17/2027 | 1,700 | 1,701 | ||
Ford Motor Credit Co., LLC 4.95% 5/28/2027 | 1,065 | 1,040 | ||
Ford Motor Credit Co., LLC 5.113% 5/3/2029 | 250 | 242 | ||
Ford Motor Credit Co., LLC 7.20% 6/10/2030 | 2,900 | 3,052 | ||
Ford Motor Credit Co., LLC 7.122% 11/7/2033 | 978 | 1,034 | ||
Ford Motor Credit Co., LLC 6.125% 3/8/2034 | 988 | 978 | ||
Ford Otomotiv Sanayi AS 7.125% 4/25/20294 | 1,530 | 1,546 | ||
General Motors Financial Co., Inc. 2.35% 2/26/2027 | 75 | 69 | ||
Hanesbrands, Inc. 9.00% 2/15/20314 | 1,994 | 2,091 | ||
Hanesbrands, Inc., Term Loan B, (3-month USD CME Term SOFR + 3.75%) 9.094% 3/8/20303,6 | 253 | 254 | ||
Harley-Davidson Financial Services, Inc. 5.95% 6/11/20294 | 2,734 | 2,729 | ||
Home Depot, Inc. 4.95% 6/25/2034 | 500 | 495 | ||
Home Depot, Inc. 5.40% 6/25/2064 | 1,776 | 1,732 | ||
Hyundai Capital America 1.65% 9/17/20264 | 100 | 92 | ||
International Game Technology PLC 5.25% 1/15/20294 | 650 | 629 | ||
LCM Investments Holdings II, LLC 4.875% 5/1/20294 | 1,335 | 1,250 | ||
LCM Investments Holdings II, LLC 8.25% 8/1/20314 | 1,350 | 1,410 | ||
Lithia Motors, Inc. 3.875% 6/1/20294 | 308 | 277 | ||
Lithia Motors, Inc. 4.375% 1/15/20314 | 650 | 579 | ||
Macy’s Retail Holdings, LLC 5.875% 3/15/20304 | 50 | 48 | ||
Party City Holdings, Inc. 12.00% 12/31/20284 | 140 | 135 | ||
Royal Caribbean Cruises, Ltd. 5.375% 7/15/20274 | 650 | 640 | ||
Royal Caribbean Cruises, Ltd. 3.70% 3/15/2028 | 1,510 | 1,412 | ||
Royal Caribbean Cruises, Ltd. 5.50% 4/1/20284 | 706 | 697 | ||
Royal Caribbean Cruises, Ltd. 8.25% 1/15/20294 | 800 | 845 | ||
Scientific Games Holdings, LP 6.625% 3/1/20304 | 975 | 951 | ||
Sonic Automotive, Inc. 4.625% 11/15/20294 | 485 | 438 | ||
Sonic Automotive, Inc. 4.875% 11/15/20314 | 5,663 | 4,990 | ||
Tapestry, Inc. 7.85% 11/27/2033 | 885 | 933 | ||
Wynn Resorts Finance, LLC 7.125% 2/15/20314 | 314 | 326 | ||
53,287 | ||||
Materials 2.03% | ||||
Alliance Resource Operating Partners, LP 8.625% 6/15/20294 | 1,025 | 1,053 | ||
Ball Corp. 6.875% 3/15/2028 | 590 | 606 | ||
Ball Corp. 6.00% 6/15/2029 | 200 | 201 | ||
BHP Billiton Finance (USA), Ltd. 4.90% 2/28/2033 | 314 | 308 | ||
BHP Billiton Finance (USA), Ltd. 5.25% 9/8/2033 | 1,246 | 1,247 | ||
BHP Billiton Finance (USA), Ltd. 5.50% 9/8/2053 | 1,227 | 1,219 | ||
Braskem Idesa SAPI 6.99% 2/20/2032 | 2,550 | 1,936 | ||
Braskem Netherlands Finance BV 8.75% 1/12/20314 | 1,530 | 1,564 | ||
Braskem Netherlands Finance BV 7.25% 2/13/2033 | 2,407 | 2,271 | ||
23 | Capital Group Fixed Income ETF Trust |
Capital Group Core Plus Income ETF (continued)
Bonds, notes & other debt instruments (continued) | Principal amount (000) | Value (000) | ||
Corporate bonds, notes & loans (continued) | ||||
Materials (continued) | ||||
Braskem Netherlands Finance BV 7.25% 2/13/20334 | USD475 | $448 | ||
Celanese US Holdings, LLC 6.35% 11/15/2028 | 1,044 | 1,073 | ||
Celanese US Holdings, LLC 6.379% 7/15/2032 | 539 | 554 | ||
Celanese US Holdings, LLC 6.70% 11/15/2033 | 807 | 849 | ||
Cleveland-Cliffs, Inc. 4.875% 3/1/20314 | 300 | 266 | ||
Consolidated Energy Finance SA 12.00% 2/15/20314 | 3,050 | 3,150 | ||
CSN Resources SA 8.875% 12/5/20304 | 1,700 | 1,690 | ||
Dow Chemical Co. (The) 5.15% 2/15/2034 | 273 | 267 | ||
Dow Chemical Co. (The) 5.55% 11/30/2048 | 571 | 542 | ||
Dow Chemical Co. (The) 3.60% 11/15/2050 | 2,070 | 1,443 | ||
Dow Chemical Co. (The) 6.90% 5/15/2053 | 107 | 119 | ||
Dow Chemical Co. (The) 5.60% 2/15/2054 | 2,271 | 2,186 | ||
Eastman Chemical Co. 5.625% 2/20/2034 | 686 | 682 | ||
EIDP, Inc. 4.80% 5/15/2033 | 695 | 671 | ||
First Quantum Minerals, Ltd. 6.875% 10/15/20274 | 2,900 | 2,836 | ||
First Quantum Minerals, Ltd. 9.375% 3/1/20294 | 4,825 | 5,048 | ||
FXI Holdings, Inc. 12.25% 11/15/20264 | 3,207 | 3,186 | ||
International Flavors & Fragrances, Inc. 2.30% 11/1/20304 | 230 | 192 | ||
International Flavors & Fragrances, Inc. 3.468% 12/1/20504 | 3,735 | 2,454 | ||
LABL, Inc. 5.875% 11/1/20284 | 575 | 525 | ||
LABL, Inc. 9.50% 11/1/20284 | 328 | 331 | ||
LSB Industries, Inc. 6.25% 10/15/20284 | 698 | 674 | ||
Mauser Packaging Solutions Holding Co. 7.875% 8/15/20264 | 696 | 698 | ||
NOVA Chemicals Corp. 4.25% 5/15/20294 | 1,360 | 1,200 | ||
NOVA Chemicals Corp. 9.00% 2/15/20304 | 1,260 | 1,331 | ||
OCI NV 6.70% 3/16/20334 | 699 | 690 | ||
Owens-Brockway Glass Container, Inc. 7.375% 6/1/20324 | 1,300 | 1,303 | ||
Sasol Financing USA, LLC 8.75% 5/3/20294 | 1,065 | 1,084 | ||
Sasol Financing USA, LLC 8.75% 5/3/20297 | 100 | 102 | ||
Sasol Financing USA, LLC 5.50% 3/18/2031 | 1,850 | 1,562 | ||
SCIH Salt Holdings, Inc. 4.875% 5/1/20284 | 742 | 691 | ||
Sealed Air Corp. 6.125% 2/1/20284 | 607 | 606 | ||
Stillwater Mining Co. 4.00% 11/16/20267 | 600 | 549 | ||
Stillwater Mining Co. 4.50% 11/16/20297 | 1,350 | 1,101 | ||
Vale Overseas Ltd. 6.40% 6/28/2054 | 630 | 624 | ||
51,132 | ||||
Real estate 1.86% | ||||
Boston Properties, LP 2.55% 4/1/2032 | 1,481 | 1,156 | ||
Boston Properties, LP 2.45% 10/1/2033 | 2,550 | 1,890 | ||
Boston Properties, LP 6.50% 1/15/2034 | 2,426 | 2,469 | ||
Brandywine Operating Partnership, LP 8.875% 4/12/2029 | 575 | 600 | ||
Crown Castle, Inc. 5.00% 1/11/2028 | 140 | 138 | ||
Crown Castle, Inc. 5.80% 3/1/2034 | 2,178 | 2,201 | ||
Equinix, Inc. 3.40% 2/15/2052 | 2,400 | 1,647 | ||
Howard Hughes Corp. (The) 4.375% 2/1/20314 | 1,175 | 1,013 | ||
Hudson Pacific Properties, LP 3.25% 1/15/2030 | 2,180 | 1,508 | ||
Kennedy-Wilson, Inc. 4.75% 3/1/2029 | 2,525 | 2,163 | ||
Kennedy-Wilson, Inc. 4.75% 2/1/2030 | 3,242 | 2,694 | ||
Kennedy-Wilson, Inc. 5.00% 3/1/2031 | 3,675 | 3,009 | ||
Kilroy Realty, LP 2.65% 11/15/2033 | 1,500 | 1,103 | ||
Kilroy Realty, LP 6.25% 1/15/2036 | 3,959 | 3,761 | ||
Ladder Capital Finance Holdings LLLP 4.75% 6/15/20294 | 1,550 | 1,433 | ||
Prologis, LP 5.125% 1/15/2034 | 2,975 | 2,942 | ||
Prologis, LP 5.00% 3/15/2034 | 1,655 | 1,619 | ||
Prologis, LP 5.25% 6/15/2053 | 514 | 485 | ||
Prologis, LP 5.25% 3/15/2054 | 580 | 549 | ||
Public Storage Operating Co. 5.35% 8/1/2053 | 1,462 | 1,412 | ||
Service Properties Trust 4.75% 10/1/2026 | 1,625 | 1,524 | ||
Service Properties Trust 3.95% 1/15/2028 | 1,145 | 960 | ||
Service Properties Trust 8.375% 6/15/2029 | 575 | 566 | ||
Service Properties Trust 4.95% 10/1/2029 | 3,200 | 2,431 | ||
Capital Group Fixed Income ETF Trust | 24 |
Capital Group Core Plus Income ETF (continued)
Bonds, notes & other debt instruments (continued) | Principal amount (000) | Value (000) | ||
Corporate bonds, notes & loans (continued) | ||||
Real estate (continued) | ||||
Service Properties Trust 4.375% 2/15/2030 | USD4,157 | $2,940 | ||
Service Properties Trust 8.625% 11/15/20314 | 2,245 | 2,342 | ||
Sun Communities Operating, LP 2.70% 7/15/2031 | 40 | 33 | ||
Sun Communities Operating, LP 4.20% 4/15/2032 | 649 | 582 | ||
VICI Properties, LP 3.875% 2/15/20294 | 75 | 69 | ||
VICI Properties, LP 4.125% 8/15/20304 | 250 | 228 | ||
VICI Properties, LP 5.125% 5/15/2032 | 1,430 | 1,363 | ||
46,830 | ||||
Consumer staples 1.48% | ||||
7-Eleven, Inc. 1.80% 2/10/20314 | 975 | 781 | ||
7-Eleven, Inc. 2.80% 2/10/20514 | 2,969 | 1,771 | ||
B&G Foods, Inc. 5.25% 9/15/2027 | 400 | 371 | ||
BAT Capital Corp. 2.259% 3/25/2028 | 100 | 90 | ||
BAT Capital Corp. 4.742% 3/16/2032 | 450 | 427 | ||
BAT Capital Corp. 6.421% 8/2/2033 | 573 | 599 | ||
BAT Capital Corp. 6.00% 2/20/2034 | 2,290 | 2,318 | ||
BAT Capital Corp. 4.758% 9/6/2049 | 1,351 | 1,065 | ||
BAT Capital Corp. 5.65% 3/16/2052 | 929 | 831 | ||
BAT Capital Corp. 7.081% 8/2/2053 | 3,125 | 3,325 | ||
Campbell Soup Co. 5.40% 3/21/2034 | 2,177 | 2,164 | ||
Coca-Cola Consolidated, Inc. 5.45% 6/1/2034 | 3,343 | 3,375 | ||
Constellation Brands, Inc. 4.35% 5/9/2027 | 326 | 318 | ||
Constellation Brands, Inc. 4.75% 5/9/2032 | 1,683 | 1,619 | ||
Constellation Brands, Inc. 4.90% 5/1/2033 | 886 | 856 | ||
Coty, Inc. 6.625% 7/15/20304 | 490 | 498 | ||
Imperial Brands Finance PLC 5.875% 7/1/20344 | 3,250 | 3,187 | ||
J. M. Smucker Co. (The) 6.20% 11/15/2033 | 372 | 391 | ||
J. M. Smucker Co. (The) 6.50% 11/15/2043 | 96 | 101 | ||
J. M. Smucker Co. (The) 6.50% 11/15/2053 | 269 | 289 | ||
Keurig Dr Pepper, Inc. 3.20% 5/1/2030 | 40 | 36 | ||
Kronos Acquisition Holdings Inc. 8.25% 6/30/20314 | 1,700 | 1,704 | ||
Kronos Acquisition Holdings Inc. 10.75% 6/30/20324 | 1,700 | 1,632 | ||
Kronos Acquisition Holdings, Inc. 5.00% 12/31/20264 | 250 | 256 | ||
Minerva Luxembourg SA 8.875% 9/13/20334 | 1,530 | 1,581 | ||
Philip Morris International, Inc. 5.75% 11/7/2032 | 1,297 | 1,325 | ||
Philip Morris International, Inc. 5.375% 2/15/2033 | 300 | 298 | ||
Philip Morris International, Inc. 5.625% 9/7/2033 | 3,230 | 3,259 | ||
Philip Morris International, Inc. 5.25% 2/13/2034 | 1,741 | 1,709 | ||
Post Holdings, Inc. 4.625% 4/15/20304 | 650 | 598 | ||
Post Holdings, Inc. 6.25% 2/15/20324 | 540 | 541 | ||
37,315 | ||||
Information technology 0.97% | ||||
Analog Devices, Inc. 2.95% 10/1/2051 | 1,053 | 690 | ||
Broadcom, Inc. 3.187% 11/15/20364 | 450 | 356 | ||
Broadcom, Inc. 4.926% 5/15/20374 | 3,676 | 3,459 | ||
Cisco Systems, Inc. 5.05% 2/26/2034 | 2,750 | 2,749 | ||
Cloud Software Group, Inc. 6.50% 3/31/20294 | 1,355 | 1,302 | ||
Cloud Software Group, Inc. 9.00% 9/30/20294 | 2,745 | 2,665 | ||
Cloud Software Group, Inc. 8.25% 6/30/20324 | 2,350 | 2,397 | ||
Cloud Software Group, Inc., Term Loan, (3-month USD CME Term SOFR + 4.00%) 9.335% 3/30/20293,6 | 494 | 496 | ||
CommScope, Inc. 4.75% 9/1/20294 | 400 | 278 | ||
Finastra USA, Inc., Term Loan B, (3-month USD CME Term SOFR + 7.25%) 12.459% 9/13/20293,6,7 | 273 | 274 | ||
Finastra USA, Inc., Term Loan, (3-month USD CME Term SOFR + 7.25%) 12.581% 9/13/20293,6,7 | 28 | 4 | ||
Helios Software Holdings, Inc. 8.75% 5/1/20294 | 2,875 | 2,930 | ||
Intel Corp. 5.15% 2/21/2034 | 1,213 | 1,198 | ||
Intel Corp. 5.60% 2/21/2054 | 695 | 674 | ||
NCR Atleos Corp. 9.50% 4/1/20294 | 900 | 974 | ||
25 | Capital Group Fixed Income ETF Trust |
Capital Group Core Plus Income ETF (continued)
Bonds, notes & other debt instruments (continued) | Principal amount (000) | Value (000) | ||
Corporate bonds, notes & loans (continued) | ||||
Information technology (continued) | ||||
Oracle Corp. 3.95% 3/25/2051 | USD450 | $333 | ||
Texas Instruments, Inc. 4.85% 2/8/2034 | 833 | 826 | ||
UKG, Inc. 6.875% 2/1/20314 | 2,150 | 2,178 | ||
Wolfspeed, Inc. 9.875% 6/23/2030 (10.875% on 6/23/2026)5,7,8 | 800 | 779 | ||
24,562 | ||||
Total corporate bonds, notes & loans | 795,030 | |||
U.S. Treasury bonds & notes 16.05% | ||||
U.S. Treasury 15.35% | ||||
U.S. Treasury 5.00% 9/30/2025 | 12,910 | 12,906 | ||
U.S. Treasury 4.875% 4/30/2026 | 73,247 | 73,357 | ||
U.S. Treasury 4.875% 5/31/2026 | 4,250 | 4,258 | ||
U.S. Treasury 4.625% 6/30/2026 | 25,842 | 25,793 | ||
U.S. Treasury 4.50% 4/15/2027 | 22,900 | 22,865 | ||
U.S. Treasury 4.50% 5/15/2027 | 10,350 | 10,337 | ||
U.S. Treasury 4.625% 6/15/2027 | 30,490 | 30,575 | ||
U.S. Treasury 2.875% 8/15/2028 | 720 | 678 | ||
U.S. Treasury 4.375% 8/31/20289 | 14,750 | 14,728 | ||
U.S. Treasury 4.625% 9/30/2028 | 9,258 | 9,337 | ||
U.S. Treasury 4.625% 4/30/2029 | 48,820 | 49,372 | ||
U.S. Treasury 4.50% 5/31/2029 | 5,500 | 5,537 | ||
U.S. Treasury 4.25% 6/30/2029 | 21,003 | 20,932 | ||
U.S. Treasury 4.00% 7/31/2030 | 200 | 196 | ||
U.S. Treasury 4.625% 9/30/2030 | 1,865 | 1,891 | ||
U.S. Treasury 4.625% 5/31/2031 | 30,850 | 31,343 | ||
U.S. Treasury 4.00% 2/15/2034 | 4,570 | 4,437 | ||
U.S. Treasury 4.375% 5/15/2034 | 13,580 | 13,585 | ||
U.S. Treasury 4.375% 8/15/20439 | 10,764 | 10,393 | ||
U.S. Treasury 4.75% 11/15/2043 | 7,440 | 7,541 | ||
U.S. Treasury 4.625% 5/15/2044 | 29,770 | 29,713 | ||
U.S. Treasury 3.625% 5/15/2053 | 2,777 | 2,364 | ||
U.S. Treasury 4.75% 11/15/2053 | 2,740 | 2,834 | ||
U.S. Treasury 4.25% 2/15/2054 | 2,180 | 2,077 | ||
387,049 | ||||
U.S. Treasury inflation-protected securities 0.70% | ||||
U.S. Treasury Inflation-Protected Security 1.625% 10/15/202710 | 18,097 | 17,809 | ||
Total U.S. Treasury bonds & notes | 404,858 | |||
Asset-backed obligations 6.77% | ||||
ACHV ABS Trust, Series 2023-2PL, Class B, 6.88% 5/20/20301,4 | 102 | 102 | ||
Affirm, Inc., Series 2023-B, Class D, 8.78% 9/15/20281,4 | 995 | 1,016 | ||
Affirm, Inc., Series 2023-B, Class E, 11.32% 9/15/20281,4 | 1,447 | 1,496 | ||
American Credit Acceptance Receivables Trust, Series 2022-3, Class C, 4.86% 10/13/20281,4 | 411 | 410 | ||
American Credit Acceptance Receivables Trust, Series 2024-2, Class D, 6.53% 4/12/20301,4 | 7,281 | 7,381 | ||
Auxilior Term Funding, LLC, Series 24-1A, Class C, 6.10% 7/15/20311,4 | 4,786 | 4,795 | ||
Avis Budget Rental Car Funding (AESOP), LLC, Series 2022-5, Class B, 7.09% 4/20/20271,4 | 2,394 | 2,434 | ||
Avis Budget Rental Car Funding (AESOP), LLC, Series 2023-5, Class C, 6.85% 4/20/20281,4 | 3,333 | 3,373 | ||
Avis Budget Rental Car Funding (AESOP), LLC, Series 2023-4A, Class B, 6.32% 6/20/20291,4 | 2,369 | 2,407 | ||
Avis Budget Rental Car Funding (AESOP), LLC, Series 2023-4A, Class C, 7.24% 6/20/20291,4 | 890 | 919 | ||
Avis Budget Rental Car Funding (AESOP), LLC, Series 2023-6, Class C, 7.03% 12/20/20291,4 | 4,000 | 4,114 | ||
CF Hippolyta, LLC, Series 2020-1, Class B1, 2.28% 7/15/20601,4 | 486 | 454 | ||
CFG Investments, Ltd., Series 2023-1, Class A, 8.56% 7/25/20341,4 | 1,530 | 1,537 | ||
Capital Group Fixed Income ETF Trust | 26 |
Capital Group Core Plus Income ETF (continued)
Bonds, notes & other debt instruments (continued) | Principal amount (000) | Value (000) | ||
Asset-backed obligations (continued) | ||||
CPS Auto Receivables Trust, Series 2022-B, Class D, 5.19% 8/15/20281,4 | USD1,250 | $1,233 | ||
CPS Auto Trust, Series 2024-A, Class E, 8.42% 8/15/20311,4 | 700 | 716 | ||
CPS Auto Trust, Series 2024-C, Class E, 8.04% 3/15/20321,4 | 5,800 | 5,814 | ||
Credit Acceptance Auto Loan Trust, Series 2022-1A, Class C, 5.70% 10/15/20321,4 | 1,000 | 991 | ||
Credit Acceptance Auto Loan Trust, Series 2022-1A, Class D, 6.63% 12/15/20321,4 | 1,000 | 985 | ||
Credit Acceptance Auto Loan Trust, Series 2024-2, Class C, 6.70% 10/16/20341,4 | 5,769 | 5,809 | ||
Exeter Automobile Receivables Trust, Series 2022-2A, Class D, 4.56% 7/17/20281 | 26 | 25 | ||
Exeter Automobile Receivables Trust, Series 2023-2, Class E, 9.75% 11/15/20301,4 | 848 | 894 | ||
Exeter Automobile Receivables Trust, Series 2023-3, Class E, 9.98% 1/15/20311,4 | 1,022 | 1,089 | ||
Exeter Automobile Receivables Trust, Series 2023-4, Class E, 9.57% 2/18/20311,4 | 3,010 | 3,143 | ||
Exeter Automobile Receivables Trust, Series 2023-5, Class E, 9.58% 6/16/20311,4 | 5,403 | 5,710 | ||
Exeter Automobile Receivables Trust, Series 2024-1, Class E, 7.89% 8/15/20311,4 | 4,799 | 4,837 | ||
Exeter Automobile Receivables Trust, Series 2024-3, Class E, 7.84% 10/15/20311,4 | 5,000 | 5,030 | ||
Exeter Automobile Receivables Trust, Series 2024-2A, Class E, 7.98% 10/15/20311,4 | 3,027 | 3,058 | ||
Ford Credit Floorplan Master Owner Trust, Series 2023-1, Class D, 6.62% 5/15/20281,4 | 2,335 | 2,350 | ||
GLS Auto Receivables Trust, Series 2023-3, Class E, 9.27% 8/15/20301,4 | 950 | 994 | ||
GLS Auto Receivables Trust, Series 2023-4, Class E, 9.72% 8/15/20301,4 | 1,900 | 2,021 | ||
GLS Auto Receivables Trust, Series 2024-1, Class E, 7.94% 10/15/20301,4 | 915 | 921 | ||
GLS Auto Receivables Trust, Series 2024-2, Class E, 7.98% 5/15/20311,4 | 1,170 | 1,183 | ||
Hertz Vehicle Financing III, LLC, Series 2023-1, Class C, 6.91% 6/25/20271,4 | 2,200 | 2,195 | ||
Hertz Vehicle Financing III, LLC, Series 2023-1, Class 1D, 9.13% 6/25/20271,4 | 672 | 671 | ||
Hertz Vehicle Financing III, LLC, Series 2022-2A, Class C, 2.95% 6/26/20281,4 | 300 | 271 | ||
Hertz Vehicle Financing III, LLC, Series 2022-2, Class D, 5.16% 6/26/20281,4 | 2,389 | 2,145 | ||
Hertz Vehicle Financing III, LLC, Series 2023-2, Class C, 7.13% 9/25/20291,4 | 2,167 | 2,195 | ||
Hertz Vehicle Financing III, LLC, Series 2023-4, Class C, 7.51% 3/25/20301,4 | 3,950 | 4,071 | ||
Hertz Vehicle Financing, LLC, Series 2021-2, Class D, 4.34% 12/27/20271,4 | 5,000 | 4,477 | ||
LAD Auto Receivables Trust, Series 2023-1, Class C, 6.18% 12/15/20271,4 | 1,368 | 1,375 | ||
Mercury Financial Credit Card Master Trust, Series 2024-2A, Class A, 6.56% 7/20/20291,4 | 5,734 | 5,759 | ||
Mission Lane Credit Card Master Trust, Series 2022-B, Class B, 10.42% 1/15/20281,7,8 | 465 | 469 | ||
Mission Lane Credit Card Master Trust, Series 2022-B, Class D, 14.45% 1/15/20281,7,8 | 3,500 | 3,528 | ||
Mission Lane Credit Card Master Trust, Series 2023-A, Class B, 8.15% 7/17/20281,4 | 2,459 | 2,478 | ||
Mission Lane Credit Card Master Trust, Series 2023-A, Class C, 10.03% 7/17/20281,4 | 5,600 | 5,688 | ||
Mission Lane Credit Card Master Trust, Series 2023-B, Class D, 12.43% 11/15/20281,4 | 5,000 | 5,026 | ||
Mission Lane Credit Card Master Trust, Series 2023-B, Class E, 0.162% 11/15/20281,4 | 5,000 | 5,014 | ||
Mission Lane Credit Card Master Trust, Series 2024-A, Class A1, 6.20% 8/15/20291,4 | 2,021 | 2,020 | ||
Mission Lane Credit Card Master Trust, Series 2024-A, Class B, 6.58% 8/15/20291,4 | 1,996 | 1,995 | ||
Ondeck Asset Securitization Trust, LLC, Series 2024-1, Class B, 7.15% 6/17/20311,4 | 726 | 732 | ||
Ondeck Asset Securitization Trust, LLC, Series 2024-1, Class C, 8.99% 6/17/20311,4 | 632 | 643 | ||
OnDeck Asset Securitization Trust, LLC, Series 2023-1A, Class B, 8.25% 8/19/20301,4 | 1,364 | 1,400 | ||
PEAC Solutions Receivables, LLC, Series 2024-1, Class B, 5.79% 11/20/20301,4 | 7,274 | 7,253 | ||
Prestige Auto Receivables Trust, Series 2023-1, Class D, 6.33% 4/16/20291,4 | 1,912 | 1,908 | ||
Prestige Auto Receivables Trust, Series 2024-1, Class E, 7.94% 4/15/20311,4 | 1,196 | 1,196 | ||
Research-Driven Pagaya Motor Asset Trust I, Series 2022-3, Class A, 5.38% 11/25/20301,4 | 467 | 465 | ||
Research-Driven Pagaya Motor Asset Trust I, Series 2022-3, Class B, 6.58% 11/25/20301,4 | 337 | 333 | ||
Santander Drive Auto Receivables Trust, Series 2022-7, Class C, 6.69% 3/17/20311 | 796 | 811 | ||
SMB Private Education Loan Trust, Series 2021-A, Class D1, 3.86% 1/15/20531,4 | 1,698 | 1,465 | ||
SMB Private Education Loan Trust, Series 2021-A, Class D2, 3.86% 1/15/20531,4 | 864 | 745 | ||
SMB Private Education Loan Trust, Series 2023-A, Class B, 5.88% 1/15/20531,4 | 2,490 | 2,480 | ||
SMB Private Education Loan Trust, Series 2022-A, Class D, 4.75% 11/16/20541,4 | 192 | 181 | ||
SMB Private Education Loan Trust, Series 2024-A, Class D, 8.22% 3/15/20561,4 | 8,883 | 9,109 | ||
SMB Private Education Loan Trust, Series 2023-B, Class D, 7.56% 10/16/20561,4 | 5,000 | 4,995 | ||
SMB Private Education Loan Trust, Series 2022-D, Class D, 7.23% 10/15/20581,4 | 2,000 | 1,990 | ||
United Auto Credit Securitization Trust, Series 2024-1, Class D, 8.30% 11/12/20291,4 | 6,000 | 6,062 | ||
Verdant Receivables, LLC, Series 2024-1, Class C, 6.25% 12/12/20311,4 | 771 | 774 | ||
Westlake Automobile Receivables Trust, Series 2022-2A, Class D, 5.48% 9/15/20271,4 | 1,562 | 1,549 | ||
170,709 | ||||
27 | Capital Group Fixed Income ETF Trust |
Capital Group Core Plus Income ETF (continued)
Bonds, notes & other debt instruments (continued) | Principal amount (000) | Value (000) | ||
Bonds & notes of governments & government agencies outside the U.S. 1.89% | ||||
Abu Dhabi (Emirate of) 1.70% 3/2/20314 | USD300 | $248 | ||
Angola (Republic of) 8.00% 11/26/2029 | 650 | 586 | ||
Angola (Republic of) 8.75% 4/14/2032 | 3,025 | 2,685 | ||
Angola (Republic of) 8.75% 4/14/20324 | 800 | 710 | ||
Argentine Republic 0.75% 7/9/2030 (1.75% on 7/9/2027)5 | 1,100 | 622 | ||
Chile (Republic of) 2.45% 1/31/2031 | 400 | 341 | ||
Chile (Republic of) 4.34% 3/7/2042 | 200 | 173 | ||
Colombia (Republic of) 8.00% 4/20/2033 | 280 | 290 | ||
Colombia (Republic of) 7.50% 2/2/2034 | 3,995 | 4,008 | ||
Colombia (Republic of) 8.00% 11/14/2035 | 3,290 | 3,391 | ||
Dominican Republic 4.50% 1/30/20304 | 500 | 456 | ||
Dominican Republic 5.875% 1/30/2060 | 3,080 | 2,621 | ||
Egypt (Arab Republic of) 5.80% 9/30/2027 | 200 | 181 | ||
Egypt (Arab Republic of) 5.875% 2/16/2031 | 600 | 467 | ||
Egypt (Arab Republic of) 8.50% 1/31/2047 | 3,580 | 2,662 | ||
Egypt (Arab Republic of) 8.70% 3/1/2049 | 1,700 | 1,282 | ||
Egypt (Arab Republic of) 8.75% 9/30/2051 | 2,589 | 1,956 | ||
Egypt (Arab Republic of) 8.15% 11/20/2059 | 200 | 143 | ||
Egypt (Arab Republic of) 7.50% 2/16/2061 | 1,300 | 874 | ||
Export-Import Bank of India 2.25% 1/13/20314 | 250 | 207 | ||
Honduras (Republic of) 5.625% 6/24/2030 | 2,440 | 2,086 | ||
Mongolia (State of) 4.45% 7/7/2031 | 500 | 422 | ||
Oman (Sultanate of) 7.00% 1/25/2051 | 980 | 1,033 | ||
Oman (Sultanate of) 7.00% 1/25/20514 | 500 | 527 | ||
Panama (Republic of) 7.50% 3/1/2031 | 315 | 330 | ||
Panama (Republic of) 2.252% 9/29/2032 | 1,450 | 1,045 | ||
Panama (Republic of) 6.875% 1/31/2036 | 1,475 | 1,444 | ||
Panama (Republic of) 8.00% 3/1/2038 | 770 | 813 | ||
Panama (Republic of) 4.50% 4/16/2050 | 1,100 | 742 | ||
Panama (Republic of) 6.853% 3/28/2054 | 1,550 | 1,423 | ||
Panama (Republic of) 4.50% 4/1/2056 | 5,000 | 3,248 | ||
Panama (Republic of) 7.875% 3/1/2057 | 260 | 271 | ||
Paraguay (Republic of) 4.95% 4/28/2031 | 800 | 767 | ||
Paraguay (Republic of) 6.00% 2/9/20364 | 622 | 627 | ||
Senegal (Republic of) 6.75% 3/13/2048 | 2,889 | 2,093 | ||
South Africa (Republic of) 5.875% 4/20/2032 | 1,003 | 932 | ||
United Mexican States 4.50% 4/22/2029 | 450 | 432 | ||
United Mexican States 4.75% 4/27/2032 | 860 | 796 | ||
United Mexican States 6.00% 5/7/2036 | 2,370 | 2,313 | ||
United Mexican States 6.338% 5/4/2053 | 1,485 | 1,404 | ||
United Mexican States 6.40% 5/7/2054 | 955 | 912 | ||
47,563 | ||||
Municipals 0.20% | ||||
California 0.05% | ||||
City of Rancho Mirage, Community Facs. Dist. No. 5 (Improvement Area No. 1), Special Tax Bonds, Series 2024-B, 7.25% 9/1/2039 | 1,100 | 1,101 | ||
Puerto Rico 0.09% | ||||
Electric Power Auth., Power Rev. Bonds, Series 2007-TT, 5.00% 7/1/201711 | 5 | 2 | ||
Electric Power Auth., Power Rev. Bonds, Series 2010-ZZ, 4.25% 7/1/201811 | 20 | 10 | ||
Electric Power Auth., Power Rev. Bonds, Series 2010-ZZ, 5.00% 7/1/201811 | 95 | 48 | ||
Electric Power Auth., Power Rev. Bonds, Series 2003-NN, 5.50% 7/1/202011 | 10 | 5 | ||
Electric Power Auth., Power Rev. Bonds, Series 2007-TT, 5.00% 7/1/202111 | 190 | 95 | ||
Electric Power Auth., Power Rev. Bonds, Series 2010-AAA, 5.25% 7/1/202111 | 265 | 133 | ||
Electric Power Auth., Power Rev. Bonds, Series 2010-DDD, 5.00% 7/1/202311 | 210 | 105 | ||
Electric Power Auth., Power Rev. Bonds, Series 2007-TT, 5.00% 7/1/202311 | 20 | 10 | ||
Electric Power Auth., Power Rev. Bonds, Series 2010-CCC, 5.00% 7/1/202411 | 75 | 38 | ||
Electric Power Auth., Power Rev. Bonds, Series 2010-XX, 4.625% 7/1/202511 | 10 | 5 | ||
Electric Power Auth., Power Rev. Bonds, Series 2010-XX, 4.75% 7/1/202611 | 10 | 5 | ||
Electric Power Auth., Power Rev. Bonds, Series 2010-ZZ, 5.00% 7/1/202611 | 5 | 3 | ||
Electric Power Auth., Power Rev. Bonds, Series 2010-ZZ, 5.25% 7/1/202611 | 400 | 201 | ||
Capital Group Fixed Income ETF Trust | 28 |
Capital Group Core Plus Income ETF (continued)
Bonds, notes & other debt instruments (continued) | Principal amount (000) | Value (000) | ||
Municipals (continued) | ||||
Puerto Rico (continued) | ||||
Electric Power Auth., Power Rev. Bonds, Series 2010-CCC, 5.25% 7/1/2026 | USD20 | $10 | ||
Electric Power Auth., Power Rev. Bonds, Series 2010-ZZ, 4.75% 7/1/202711 | 65 | 33 | ||
Electric Power Auth., Power Rev. Bonds, Series 2010-CCC, 4.80% 7/1/202811 | 220 | 111 | ||
Electric Power Auth., Power Rev. Bonds, Series 2008-WW, 5.00% 7/1/202811 | 55 | 28 | ||
Electric Power Auth., Power Rev. Bonds, Series 2007-TT, 5.00% 7/1/203211 | 165 | 83 | ||
Electric Power Auth., Power Rev. Bonds, Series 2008-WW, 5.25% 7/1/203311 | 610 | 307 | ||
Electric Power Auth., Power Rev. Bonds, Series 2013-A, 6.75% 7/1/203611 | 330 | 166 | ||
Electric Power Auth., Power Rev. Bonds, Series 2007-TT, 5.00% 7/1/203711 | 55 | 28 | ||
Electric Power Auth., Power Rev. Bonds, Series 2010-XX, 5.25% 7/1/204011 | 350 | 176 | ||
Electric Power Auth., Power Rev. Bonds, Series 2012-A, 5.00% 7/1/204211 | 95 | 48 | ||
Electric Power Auth., Power Rev. Ref. Bonds, Series 2007-UU, Assured Guaranty Municipal insured, 4.064% 7/1/20175,11 | 465 | 233 | ||
Electric Power Auth., Power Rev. Ref. Bonds, Series 2010-DDD, 5.00% 7/1/202111 | 70 | 35 | ||
Electric Power Auth., Power Rev. Ref. Bonds, Series 2010-DDD, 5.00% 7/1/202211 | 650 | 326 | ||
2,244 | ||||
Texas 0.06% | ||||
Brazoria County Industrial Dev. Corp., Solid Waste Disposal Facs. Rev. Bonds (Aleon Renewable Metals, LLC Project), Series 2023, AMT, 12.00% 6/1/20434 | 1,575 | 1,594 | ||
Total municipals | 4,939 | |||
Total bonds, notes & other debt instruments (cost: $2,469,813,000) | 2,478,926 | |||
Common stocks 0.00% | Shares | |||
Consumer discretionary 0.00% | ||||
Party City Holdco, Inc.8 | 7,446 | 130 | ||
Party City Holdco, Inc.4,8 | 74 | 1 | ||
131 | ||||
Total common stocks (cost: $63,000) | 131 | |||
Short-term securities 19.00% | ||||
Money market investments 19.00% | ||||
Capital Group Central Cash Fund 5.37%12,13 | 4,790,583 | 479,058 | ||
Total short-term securities (cost: $479,036,000) | 479,058 | |||
Total investment securities 117.29% (cost: $2,948,912,000) | 2,958,115 | |||
Other assets less liabilities (17.29)% | (436,147 ) | |||
Net assets 100.00% | $2,521,968 |
Futures contracts
Contracts | Type | Number of contracts | Expiration date | Notional amount (000) | Value and unrealized appreciation (depreciation) at 6/30/2024 (000) |
2 Year U.S. Treasury Note Futures | Long | 1,611 | 9/30/2024 | USD328,996 | $567 |
5 Year U.S. Treasury Note Futures | Long | 1,149 | 9/30/2024 | 122,458 | 557 |
10 Year U.S. Treasury Note Futures | Long | 1,420 | 9/19/2024 | 156,178 | 1,171 |
10 Year Ultra U.S. Treasury Note Futures | Short | 1,565 | 9/19/2024 | (177,676 ) | (1,075 ) |
30 Year U.S. Treasury Bond Futures | Long | 448 | 9/19/2024 | 53,004 | 286 |
30 Year Ultra U.S. Treasury Bond Futures | Short | 72 | 9/19/2024 | (9,025 ) | (152 ) |
$1,354 |
29 | Capital Group Fixed Income ETF Trust |
Capital Group Core Plus Income ETF (continued)
Forward currency contracts
Contract amount | Counterparty | Settlement date | Unrealized appreciation (depreciation) at 6/30/2024 (000) | |||
Currency purchased (000) | Currency sold (000) | |||||
USD | 2,462 | EUR | 2,646 | Morgan Stanley | 7/22/2024 | $8 |
USD | 2,060 | EUR | 2,204 | Morgan Stanley | 7/25/2024 | (5 ) |
$3 | ||||||
Swap contracts
Interest rate swaps
Centrally cleared interest rate swaps
Receive | Pay | Expiration date | Notional amount (000) | Value at 6/30/2024 (000) | Upfront premium paid (received) (000) | Unrealized appreciation (depreciation) at 6/30/2024 (000) | ||
Rate | Payment frequency | Rate | Payment frequency | |||||
5.0145% | Annual | SOFR | Annual | 10/27/2025 | USD275,000 | $424 | $— | $424 |
SOFR | Annual | 3.3885% | Annual | 4/18/2028 | 35,000 | 982 | — | 982 |
4.175% | Annual | SOFR | Annual | 11/21/2028 | 140,000 | 257 | — | 257 |
SOFR | Annual | 3.1585 | Annual | 1/18/2033 | 43,000 | 2,501 | — | 2,501 |
SOFR | Annual | 3.2205 | Annual | 4/18/2033 | 58,000 | 3,176 | — | 3,176 |
4.133% | Annual | SOFR | Annual | 11/20/2043 | 16,000 | 414 | — | 414 |
SOFR | Annual | 3.949 | Annual | 11/21/2053 | 10,000 | (331 ) | — | (331 ) |
$7,423 | $— | $7,423 | ||||||
Bilateral interest rate swaps
Receive | Pay | Counterparty | Expiration date | Notional amount (000) | Value at 6/30/2024 (000) | Upfront premium paid (received) (000) | Unrealized appreciation (depreciation) at 6/30/2024 (000) | ||
Rate | Payment frequency | Rate | Payment frequency | ||||||
12.57% | At maturity | BZDIOVER | At maturity | Barclays Bank PLC | 1/2/2026 | BRL19,454 | $64 | $— | $64 |
Investments in affiliates13
Value at 1/1/2024 (000) | Additions (000) | Reductions (000) | Net realized gain (loss) (000) | Net unrealized appreciation (depreciation) (000) | Value at 6/30/2024 (000) | Dividend or interest income (000) | |
Short-term securities 19.00% | |||||||
Money market investments 19.00% | |||||||
Capital Group Central Cash Fund 5.37% 12 | $422,052 | $643,469 | $586,475 | $(33 ) | $45 | $479,058 | $13,013 |
Capital Group Fixed Income ETF Trust | 30 |
Capital Group Core Plus Income ETF (continued)
Restricted securities7
Acquisition date(s) | Cost (000) | Value (000) | Percent of net assets | |
Mission Lane Credit Card Master Trust, Series 2022-B, Class D, 14.45% 1/15/20281,8 | 12/6/2022 | $3,499 | $3,528 | .14 % |
Mission Lane Credit Card Master Trust, Series 2022-B, Class B, 10.42% 1/15/20281,8 | 12/6/2022 | 465 | 469 | .02 |
Stillwater Mining Co. 4.50% 11/16/2029 | 2/20/2024 | 1,086 | 1,101 | .05 |
Stillwater Mining Co. 4.00% 11/16/2026 | 2/9/2024 | 548 | 549 | .02 |
Wolfspeed, Inc. 9.875% 6/23/2030 (10.875% on 6/23/2026)5,8 | 6/23/2023 | 771 | 779 | .03 |
Finastra USA, Inc., Term Loan B, (3-month USD CME Term SOFR + 7.25%) 12.459% 9/13/20293,6 | 9/12/2023 | 267 | 274 | .01 |
Finastra USA, Inc., Term Loan, (3-month USD CME Term SOFR + 7.25%) 12.581% 9/13/20293,6 | 9/12/2023 | 3 | 4 | .00 14 |
Sasol Financing USA, LLC 8.75% 5/3/2029 | 6/27/2024 | 102 | 102 | .01 |
$6,741 | $6,806 | .28 % |
1 | Principal payments may be made periodically. Therefore, the effective maturity date may be earlier than the stated maturity date. |
2 | Purchased on a TBA basis. |
3 | Coupon rate may change periodically. Reference rate and spread are as of the most recent information available. Some coupon rates are determined by the issuer or agent based on current market conditions; therefore, the reference rate and spread are not available. |
4 | Acquired in a transaction exempt from registration under Rule 144A or, for commercial paper, Section 4(a)(2) of the Securities Act of 1933. May be resold in the U.S. in transactions exempt from registration, normally to qualified institutional buyers. The total value of all such securities was $660,581,000, which represented 26.19% of the net assets of the fund. |
5 | Step bond; coupon rate may change at a later date. |
6 | Loan participations and assignments; may be subject to legal or contractual restrictions on resale. The total value of all such loans was $3,495,000, which represented 0.14% of the net assets of the fund. |
7 | Restricted security, other than Rule 144A securities or commercial paper issued pursuant to Section 4(a)(2) of the Securities Act of 1933. The total value of all such restricted securities was $6,806,000, which represented 0.28% of the net assets of the fund. |
8 | Value determined using significant unobservable inputs. |
9 | All or a portion of this security was pledged as collateral. The total value of pledged collateral was $7,581,000 , which represented .30% of the net assets of the fund. |
10 | Index-linked bond whose principal amount moves with a government price index. |
11 | Scheduled interest and/or principal payment was not received. |
12 | Rate represents the seven-day yield at 6/30/2024. |
13 | Part of the same "group of investment companies" as the fund as defined under the Investment Company Act of 1940, as amended. |
14 | Amount less than .01%. |
31 | Capital Group Fixed Income ETF Trust |
Capital Group Core Plus Income ETF (continued)
Key to abbreviation(s) |
AMT = Alternative Minimum Tax |
Assn. = Association |
Auth. = Authority |
BRL = Brazilian reais |
CME = CME Group |
DAC = Designated Activity Company |
Dev. = Development |
Dist. = District |
EUR = Euros |
EURIBOR = Euro Interbank Offered Rate |
Facs. = Facilities |
ICE = Intercontinental Exchange, Inc. |
Ref. = Refunding |
Rev. = Revenue |
SDR = Swedish Depositary Receipts |
SOFR = Secured Overnight Financing Rate |
USD = U.S. dollars |
Refer to the notes to financial statements.
Capital Group Fixed Income ETF Trust | 32 |
Capital Group International Bond ETF (USD-Hedged)unaudited
Investment portfolio June 30, 2024
Bonds, notes & other debt instruments 90.39% | Principal amount (000) | Value (000) | ||
Euros 29.31% | ||||
AIB Group PLC, 2.25% 4/4/2028 (1-year EUR Mid-Swap + 1.30% on 4/4/2027)1 | EUR150,000 | $154 | ||
Alpha Bank SA 4.25% 6/11/2031 (5-year EUR Mid-Swap + 5.823% on 6/11/2026)1 | 100,000 | 106 | ||
American Tower Corp. 0.875% 5/21/2029 | 170,000 | 158 | ||
AstraZeneca PLC 3.75% 3/3/2032 | 100,000 | 110 | ||
AT&T, Inc. 1.60% 5/19/2028 | 270,000 | 270 | ||
Banco de Sabadell, SA 5.25% 2/7/2029 (1-year EUR Mid-Swap + 2.40% on 2/7/2028)1 | 300,000 | 334 | ||
Belfius Bank SA 4.875% 6/11/2035 (5-year EUR Mid-Swap + 2.20% on 6/11/2030)1 | 100,000 | 108 | ||
Belgium (Kingdom of), Series 97, 3.00% 6/22/2033 | 290,000 | 310 | ||
Belgium (Kingdom of) 3.50% 6/22/2055 | 120,000 | 125 | ||
British American Tobacco PLC 3.00% subordinated perpetual bonds (5-year EUR Mid-Swap + 3.372% on 12/27/2026)1 | 100,000 | 101 | ||
CaixaBank, SA, subordinated, 1.25% 6/18/2031 (5-year EUR Mid-Swap + 1.63% on 6/18/2026)1 | 300,000 | 303 | ||
Deutsche Bank AG 4.125% 4/4/2030 (3-month EUR-EURIBOR + 1.50% on 4/4/2029)1 | 100,000 | 107 | ||
Electricité de France SA 2.875% junior subordinated perpetual bonds (5-year EUR Mid-Swap + 3.373% on 3/15/2027)1 | 200,000 | 200 | ||
Equinix, Inc. 0.25% 3/15/2027 | 100,000 | 98 | ||
Equinor ASA 1.375% 5/22/2032 | 100,000 | 92 | ||
ESB Finance DAC 4.00% 5/3/2032 | 140,000 | 153 | ||
Eurobank Ergasias Services and Holdings SA 10.00% 12/6/2032 (5-year EUR Mid-Swap + 7.588% on 12/6/2027)1 | 100,000 | 122 | ||
European Financial Stability Facility., 3.375% 8/30/2038 | 500,000 | 539 | ||
European Investment Bank., 2.75% 1/16/2034 | 250,000 | 261 | ||
European Union 3.00% 3/4/2053 | 500,000 | 487 | ||
Ford Motor Credit Co., LLC 4.445% 2/14/2030 | 100,000 | 108 | ||
French Republic O.A.T. 1.25% 5/25/2034 | 890,000 | 793 | ||
French Republic O.A.T. 3.00% 5/25/2054 | 665,000 | 620 | ||
Germany (Federal Republic of) 2.10% 4/12/2029 | 2,050,000 | 2,159 | ||
Germany (Federal Republic of) 2.20% 2/15/2034 | 1,500,000 | 1,568 | ||
Germany (Federal Republic of) 2.50% 8/15/2054 | 330,000 | 341 | ||
Iberdrola, SA, 1.874% 12/31/2079 (5-year EUR Mid-Swap + 2.321% on 4/28/2026)1 | 200,000 | 206 | ||
Indonesia (Republic of) 0.90% 2/14/2027 | 125,000 | 124 | ||
Intesa Sanpaolo SpA 5.625% 3/8/2033 | 170,000 | 199 | ||
Ireland (Republic of) 1.50% 5/15/2050 | 590,000 | 442 | ||
Italy (Republic of) 0.50% 7/15/2028 | 250,000 | 238 | ||
Italy (Republic of) 3.35% 7/1/2029 | 650,000 | 690 | ||
Italy (Republic of) 3.85% 7/1/2034 | 530,000 | 560 | ||
Italy (Republic of) 4.45% 9/1/2043 | 290,000 | 310 | ||
Italy (Republic of) 4.50% 10/1/2053 | 115,000 | 122 | ||
KBC Groep NV 4.75% 4/17/2035 (5-year EUR Mid-Swap + 2.25% on 4/17/2030)1 | 100,000 | 108 | ||
McDonalds Corp. 0.25% 10/4/20282 | 100,000 | 94 | ||
National Bank of Greece SA 8.00% 1/3/2034 (5-year EUR-ICE Swap EURIBOR + 4.646% on 1/3/2029)1 | 100,000 | 118 | ||
NatWest Group PLC 0.78% 2/26/2030 (3-month EUR-EURIBOR + 0.949% on 2/26/2029)1 | 240,000 | 224 | ||
PepsiCo, Inc. 0.75% 10/14/2033 | 100,000 | 85 | ||
Philip Morris International, Inc. 0.80% 8/1/2031 | 100,000 | 88 | ||
Piraeus Bank SA 7.25% 7/13/2028 (1-year EUR Mid-Swap + 3.692% on 7/13/2027)1 | 100,000 | 115 | ||
Romania 3.624% 5/26/2030 | 100,000 | 99 | ||
Spain (Kingdom of) 1.90% 10/31/2052 | 750,000 | 527 | ||
Svenska Handelsbanken AB 5.00% 8/16/2034 (5-year EUR Mid-Swap + 1.90% on 8/16/2029)1 | 210,000 | 232 | ||
UBS Group AG 7.75% 3/1/2029 (1-year EUR-ICE Swap EURIBOR + 4.95% on 3/1/2028)1 | 125,000 | 151 | ||
14,459 | ||||
33 | Capital Group Fixed Income ETF Trust |
Capital Group International Bond ETF (USD-Hedged) (continued)
Bonds, notes & other debt instruments (continued) | Principal amount (000) | Value (000) | ||
Japanese yen 12.97% | ||||
Japan, Series 346, 0.10% 3/20/2027 | JPY157,800,000 | $974 | ||
Japan 0.10% 12/20/2029 | 161,000,000 | 974 | ||
Japan 0.10% 12/20/2031 | 100,750,000 | 594 | ||
Japan 0.50% 12/20/2032 | 181,200,000 | 1,090 | ||
Japan 0.50% 12/20/2038 | 510,250,000 | 2,764 | ||
6,396 | ||||
South Korean won 7.55% | ||||
South Korea (Republic of), Series 2712, 2.375% 12/10/2027 | KRW1,418,870,000 | 1,004 | ||
South Korea (Republic of) 3.25% 3/10/2029 | 2,051,980,000 | 1,493 | ||
South Korea (Republic of), Series 3312, 4.125% 12/10/2033 | 1,581,030,000 | 1,228 | ||
3,725 | ||||
British pounds 7.30% | ||||
NatWest Group PLC 2.875% 9/19/2026 (1-year EUR (vs. 6-month GBP-LIBOR) + 1.49% on 9/19/2025)1 | GBP200,000 | 245 | ||
United Kingdom 0.875% 10/22/2029 | 3,110,000 | 3,357 | ||
3,602 | ||||
Australian dollars 4.26% | ||||
Australia (Commonwealth of) 3.50% 12/21/2034 | AUD1,400,000 | 869 | ||
New South Wales Treasury Corp. 4.75% 2/20/2035 | 1,904,000 | 1,234 | ||
2,103 | ||||
Brazilian reais 3.26% | ||||
Brazil (Federative Republic of) 0% 1/1/2025 | BRL2,814,000 | 478 | ||
Brazil (Federative Republic of) 0% 4/1/2025 | 2,892,000 | 478 | ||
Brazil (Federative Republic of) 10.00% 1/1/2031 | 3,000,000 | 485 | ||
Brazil (Federative Republic of) 6.00% 8/15/2050 | 996,613 | 168 | ||
1,609 | ||||
Canadian dollars 3.07% | ||||
Canada (Government) 4.00% 3/1/2029 | CAD1,250,000 | 933 | ||
Quebec Canada (Province of) 3.10% 12/1/2051 | 1,000,000 | 584 | ||
1,517 | ||||
Mexican pesos 2.56% | ||||
United Mexican States, Series M, 8.00% 7/31/2053 | MXN28,600,000 | 1,263 | ||
Malaysian ringgits 1.36% | ||||
Malaysia (Federation of), Series 0120, 3.422% 9/30/2027 | MYR1,910,000 | 403 | ||
Malaysia (Federation of), Series 0219, 3.885% 8/15/2029 | 1,250,000 | 268 | ||
671 | ||||
Indonesian rupiah 1.08% | ||||
Indonesia (Republic of) 7.50% 4/15/2040 | IDR8,414,000,000 | 532 | ||
New Zealand dollars 0.87% | ||||
New Zealand 3.00% 4/20/2029 | NZD750,000 | 427 | ||
Polish zloty 0.77% | ||||
Poland (Republic of), Series 1029, 2.75% 10/25/2029 | PLN1,750,000 | 382 | ||
Thai baht 0.74% | ||||
Thailand (Kingdom of) 3.45% 6/17/2043 | THB12,930,000 | 363 | ||
Capital Group Fixed Income ETF Trust | 34 |
Capital Group International Bond ETF (USD-Hedged) (continued)
Bonds, notes & other debt instruments (continued) | Principal amount (000) | Value (000) | ||
Singapore dollars 0.64% | ||||
Singapore (Republic of) 3.375% 9/1/2033 | SGD420,000 | $314 | ||
Indian rupees 0.39% | ||||
Inter-American Development Bank 7.00% 1/25/2029 | INR16,000,000 | 191 | ||
Turkish lira 0.10% | ||||
Turkey (Republic of) 12.60% 10/1/2025 | TRY2,100,000 | 49 | ||
U.S. dollars 14.16% | ||||
Amgen, Inc. 5.65% 3/2/2053 | USD75,000 | 74 | ||
Angola (Republic of) 9.50% 11/12/2025 | 200,000 | 203 | ||
Bristol-Myers Squibb Co. 5.65% 2/22/2064 | 70,000 | 68 | ||
BX Trust, Series 2021-SDMF, Class A, (1-month USD CME Term SOFR + 0.703%) 6.032% 9/15/20343,4,5 | 95,925 | 95 | ||
BX Trust, Series 2021-ACNT, Class A, (1-month USD CME Term SOFR + 0.964%) 6.293% 11/15/20383,4,5 | 94,318 | 93 | ||
China Oil and Gas Group, Ltd. 4.70% 6/30/2026 | 220,000 | 202 | ||
Connecticut Avenue Securities Trust, Series 2024-R02, Class 1M1, (30-day Average USD-SOFR + 1.10%) 6.435% 2/25/20443,4,5 | 90,604 | 91 | ||
Ecopetrol SA 8.625% 1/19/2029 | 200,000 | 211 | ||
Eskom Holdings SOC, Ltd. 7.125% 2/11/2025 | 200,000 | 199 | ||
Export Import Bank of Thailand 5.354% 5/16/2029 | 250,000 | 251 | ||
Freddie Mac Structured Agency Credit Risk Debt Notes, Series 2022-DNA6, Class M1B, (30-day Average USD-SOFR + 3.70%) 9.035% 9/25/20423,4,5 | 100,000 | 107 | ||
Kasikornbank PCL (Hong Kong Branch) 3.343% 10/2/2031 (5-year UST Yield Curve Rate T Note Constant Maturity + 1.70% on 10/2/2026)1 | 200,000 | 187 | ||
Korea Gas Corp. 5.00% 7/8/20294 | 200,000 | 200 | ||
MTN (Mauritius) Investments, Ltd. 6.50% 10/13/2026 | 200,000 | 200 | ||
Oleoducto Central SA 4.00% 7/14/20274 | 200,000 | 185 | ||
Petroleos Mexicanos 4.25% 1/15/2025 | 100,000 | 99 | ||
Petroleos Mexicanos 6.875% 10/16/2025 | 150,000 | 150 | ||
Petroleos Mexicanos 6.875% 8/4/2026 | 200,000 | 196 | ||
Petroleos Mexicanos 6.70% 2/16/2032 | 100,000 | 84 | ||
Pfizer Investment Enterprises Pte., Ltd. 5.30% 5/19/2053 | 70,000 | 67 | ||
Sasol Financing USA, LLC 4.375% 9/18/2026 | 200,000 | 189 | ||
Stillwater Mining Co. 4.00% 11/16/20262 | 200,000 | 183 | ||
Teva Pharmaceutical Finance Netherlands III BV 3.15% 10/1/2026 | 150,000 | 141 | ||
Uniform Mortgage-Backed Security 5.00% 7/1/20543,6 | 1,550,000 | 1,498 | ||
Uniform Mortgage-Backed Security 5.50% 7/1/20543,6 | 2,040,000 | 2,012 | ||
6,985 | ||||
Short-term securities 16.50% | Shares | |||
Money market investments 12.19% | ||||
Capital Group Central Cash Fund 5.37%7,8 | 60,138 | 6,014 | ||
35 | Capital Group Fixed Income ETF Trust |
Capital Group International Bond ETF (USD-Hedged) (continued)
Short-term securities (continued) | Weighted average yield at acquistion | Principal amount (000) | Value (000) | |
Bills & notes of governments & government agencies outside the U.S. 4.31% | ||||
Egypt (Arab Republic of) 9/17/2024 | 23.786 % | EGP7,600,000 | $150 | |
Japan 11/20/2024 | 0.01 | JPY200,000,000 | 1,243 | |
Japan 12/10/2024 | 0.01 | 117,500,000 | 730 | |
2,123 | ||||
Total Investments 106.89% (cost: $53,056,000) | 52,725 | |||
Other assets less liabilities (6.89)% | (3,400 ) | |||
Net Assets 100.00% | $49,325 | |||
Futures contracts
Contracts | Type | Number of contracts | Expiration date | Notional amount (000) | Value and unrealized appreciation (depreciation) at 6/30/2024 (000) |
2 Year Euro-Schatz Futures | Long | 34 | 9/6/2024 | USD3,594 | $(2 ) |
2 Year U.S. Treasury Note Futures | Long | 15 | 9/30/2024 | 3,063 | (2 ) |
3 Year Australian Treasury Bond Futures | Long | 13 | 9/16/2024 | 1,371 | (4 ) |
5 Year Euro-Bobl Futures | Long | 13 | 9/6/2024 | 1,514 | (3 ) |
5 Year U.S. Treasury Note Futures | Short | 12 | 9/30/2024 | (1,279 ) | 4 |
10 Year Euro-Bund Futures | Long | 6 | 9/6/2024 | 790 | (6 ) |
10 Year UK Gilt Futures | Long | 23 | 9/26/2024 | 2,244 | (28 ) |
10 Year Ultra U.S. Treasury Note Futures | Short | 2 | 9/19/2024 | (227 ) | 2 |
30 Year Euro-Buxl Futures | Short | 8 | 9/6/2024 | (1,042 ) | 21 |
30 Year Ultra U.S. Treasury Bond Futures | Short | 12 | 9/19/2024 | (1,504 ) | 37 |
$19 |
Forward currency contracts
Contract amount | Counterparty | Settlement date | Unrealized appreciation (depreciation) at 6/30/2024 (000) | |||
Currency purchased (000) | Currency sold (000) | |||||
USD | 2,570,000 | KRW | 1,850 | Standard Chartered Bank | 7/29/2024 | $(15 ) |
USD | 4,640 | EUR | 4,980 | Standard Chartered Bank | 7/29/2024 | 4 |
USD | 4,600 | EUR | 4,944 | Standard Chartered Bank | 8/27/2024 | 4 |
USD | 2,770 | BRL | 505 | Standard Chartered Bank | 9/3/2024 | 13 |
USD | 3,200 | MYR | 683 | Standard Chartered Bank | 9/18/2024 | 4 |
USD | 2,870 | GBP | 3,644 | Morgan Stanley | 9/18/2024 | 14 |
USD | 2,079 | CAD | 1,525 | BNY Mellon | 9/18/2024 | 3 |
USD | 720 | NZD | 440 | BNY Mellon | 9/18/2024 | 2 |
USD | 440 | SGD | 326 | BNY Mellon | 9/18/2024 | — 9 |
USD | 20,010 | MXN | 1,090 | BNY Mellon | 9/18/2024 | 9 |
USD | 3,230 | AUD | 2,151 | BNY Mellon | 9/18/2024 | (8 ) |
USD | 5,750,000 | IDR | 350 | Standard Chartered Bank | 9/18/2024 | (1 ) |
USD | 13,400 | THB | 366 | Standard Chartered Bank | 9/18/2024 | (1 ) |
USD | 4,750 | EUR | 5,110 | Standard Chartered Bank | 9/18/2024 | 4 |
USD | 1,590 | PLN | 395 | BNY Mellon | 9/18/2024 | 1 |
USD | 1,017,500 | JPY | 6,452 | BNY Mellon | 9/18/2024 | 53 |
EUR | 245 | USD | 263 | UBS AG | 9/18/2024 | — 9 |
USD | 2,562,000 | KRW | 1,850 | Standard Chartered Bank | 9/19/2024 | (15 ) |
USD | 7,080 | CNH | 977 | Standard Chartered Bank | 9/19/2024 | 2 |
USD | 200,000 | JPY | 1,272 | Barclays Bank PLC | 11/20/2024 | 3 |
USD | 127,760 | JPY | 820 | BNY Mellon | 12/12/2024 | 6 |
Capital Group Fixed Income ETF Trust | 36 |
Capital Group International Bond ETF (USD-Hedged) (continued)
Forward currency contracts (continued)
Contract amount | Counterparty | Settlement date | Unrealized appreciation (depreciation) at 6/30/2024 (000) | |||
Currency purchased (000) | Currency sold (000) | |||||
USD | 2,725 | BRL | 491 | Standard Chartered Bank | 1/6/2025 | $13 |
USD | 2,750 | BRL | 490 | Standard Chartered Bank | 4/4/2025 | 13 |
$108 | ||||||
Swap contracts
Credit default swaps
Centrally cleared credit default swaps on credit indices — buy protection
Reference index | Financing rate paid | Payment frequency | Expiration date | Notional amount (000) | Value at 6/30/2024 (000) | Upfront premium paid (received) (000) | Unrealized appreciation (depreciation) at 6/30/2024 (000) |
CDX.NA.HY.S42 | 5.00% | Quarterly | 6/20/2029 | USD250 | $(16 ) | $(16 ) | $— 9 |
Investments in affiliates8
Value at 6/25/202410 (000) | Additions (000) | Reductions (000) | Net realized gain (loss) (000) | Net unrealized appreciation (depreciation) (000) | Value at 6/30/2024 (000) | Dividend or interest income (000) | |
Short-term securities 12.19% | |||||||
Money market investments 12.19% | |||||||
Capital Group Central Cash Fund 5.37% 7 | $— | $41,053 | $35,039 | $— | $— | $6,014 | $10 |
Restricted securities2
Acquisition date(s) | Cost (000) | Value (000) | Percent of net assets | |
Stillwater Mining Co. 4.00% 11/16/2026 | 6/25/2024 | $184 | $183 | .38 % |
McDonalds Corp. 0.25% 10/4/2028 | 6/25/2024 | 94 | 94 | .19 |
$278 | $277 | .57 % |
1 | Step bond; coupon rate may change at a later date. |
2 | Restricted security, other than Rule 144A securities or commercial paper issued pursuant to Section 4(a)(2) of the Securities Act of 1933. The total value of all such restricted securities was $277,000, which represented 0.57% of the net assets of the fund. |
3 | Principal payments may be made periodically. Therefore, the effective maturity date may be earlier than the stated maturity date. |
4 | Acquired in a transaction exempt from registration under Rule 144A or, for commercial paper, Section 4(a)(2) of the Securities Act of 1933. May be resold in the U.S. in transactions exempt from registration, normally to qualified institutional buyers. The total value of all such securities was $771,000, which represented 1.56% of the net assets of the fund. |
5 | Coupon rate may change periodically. Reference rate and spread are as of the most recent information available. Some coupon rates are determined by the issuer or agent based on current market conditions; therefore, the reference rate and spread are not available. |
6 | Purchased on a TBA basis. |
7 | Rate represents the seven-day yield at 6/30/2024. |
8 | Part of the same "group of investment companies" as the fund as defined under the Investment Company Act of 1940, as amended. |
9 | Amount less than one thousand. |
10 | Commencement of operations. |
37 | Capital Group Fixed Income ETF Trust |
Capital Group International Bond ETF (USD-Hedged) (continued)
Key to abbreviation(s) |
AUD = Australian dollars |
BRL = Brazilian reais |
CAD = Canadian dollars |
CME = CME Group |
CNH = Chinese yuan renminbi |
DAC = Designated Activity Company |
EGP = Egyptian pounds |
EUR = Euros |
EURIBOR = Euro Interbank Offered Rate |
GBP = British pounds |
ICE = Intercontinental Exchange, Inc. |
IDR = Indonesian rupiah |
INR = Indian rupees |
JPY = Japanese yen |
KRW = South Korean won |
LIBOR = London Interbank Offered Rate |
MXN = Mexican pesos |
MYR = Malaysian ringgits |
NZD = New Zealand dollars |
PLN = Polish zloty |
SGD = Singapore dollars |
SOFR = Secured Overnight Financing Rate |
THB = Thai baht |
TRY = Turkish lira |
USD = U.S. dollars |
Refer to the notes to financial statements.
Capital Group Fixed Income ETF Trust | 38 |
Capital Group Municipal Income ETFunaudited
Investment portfolio June 30, 2024
Bonds, notes & other debt instruments 94.73% | Principal amount (000) | Value (000) | |
Alabama 4.09% | |||
Black Belt Energy Gas Dist., Gas Project Rev. Bonds, Series 2023-C, 5.50% 10/1/2054 (put 6/1/2032) | USD 1,000 | $1,096 | |
Black Belt Energy Gas Dist., Gas Project Rev. Bonds (Project No. 8), Series 2022-A, 4.00% 12/1/2052 (put 12/1/2029) | 1,250 | 1,245 | |
Black Belt Energy Gas Dist., Gas Project Rev. Ref. Bonds, Series 2023-D-1, 5.50% 6/1/2049 (put 2/1/2029) | 550 | 584 | |
Black Belt Energy Gas Dist., Gas Supply Rev. Bonds, Series 2021-A, 4.00% 6/1/2051 (put 12/1/2031) | 7,500 | 7,532 | |
Black Belt Energy Gas Dist., Gas Supply Rev. Bonds, Series 2022-F, 5.50% 11/1/2053 (put 12/1/2028) | 750 | 796 | |
Black Belt Energy Gas Dist., Gas Supply Rev. Bonds, Series 2023-B, 5.25% 12/1/2053 (put 12/1/2026) | 1,885 | 2,039 | |
Energy Southeast, Energy Supply Rev. Bonds (A Cooperative Dist.), Series 2023-A-1, 5.50% 11/1/2053 (put 1/1/2031) | 2,010 | 2,165 | |
Energy Southeast, Energy Supply Rev. Bonds (A Cooperative Dist.), Series 2024-B, 5.25% 7/1/2054 (put 6/1/2032) | 3,655 | 3,913 | |
City of Homewood, Educational Building Auth., Rev. Bonds (CHF - Horizons II, LLC, Student Housing & Parking Project at Samford University), Series 2024-C, 5.50% 10/1/2049 | 2,500 | 2,653 | |
County of Jefferson, Sewer Rev. Warrants, Series 2024, 5.00% 10/1/2039 | 1,715 | 1,884 | |
County of Jefferson, Sewer Rev. Warrants, Series 2024, 5.25% 10/1/2041 | 640 | 709 | |
County of Jefferson, Sewer Rev. Warrants, Series 2024, 5.25% 10/1/2044 | 655 | 718 | |
County of Mobile Industrial Dev. Auth., Solid Waste Disposal Rev. Bonds (AM/NS Calvert, LLC Project), Series 2024-A, AMT, 5.00% 6/1/2054 | 2,025 | 2,060 | |
City of Prattville, Industrial Dev. Board, Pollution Control Rev. Ref. Bonds (Union Camp Corp. Project), Series 1998, 5.30% 9/1/2028 | 1,250 | 1,323 | |
City of Selma, Industrial Dev. Board, Gulf Opportunity Zone Rev. Ref. Bonds (International Paper Co. Project), Series 2019-A, 2.00% 11/1/2033 (put 10/1/2024) | 2,000 | 1,986 | |
South East Gas Supply Dist., Gas Supply Rev. Ref. Bonds (Project No. 2), Series 2024-B, 5.00% 6/1/2049 (put 5/1/2032) | 1,000 | 1,055 | |
Southeast Energy Auth., Commodity Supply Rev. Bonds (Project No. 2), Series 2021-B-1, 4.00% 12/1/2051 (put 12/1/2031) | 500 | 497 | |
32,255 | |||
Alaska 0.38% | |||
Housing Fin. Corp., State Capital Project Bonds, Series 2015-A, 4.00% 12/1/2030 (preref. 6/15/2025) | 1,500 | 1,509 | |
International Airport System, Rev. Ref. Bonds, Series 2021-C, AMT, 5.00% 10/1/2026 | 1,455 | 1,497 | |
3,006 | |||
Arizona 2.68% | |||
City of Glendale, Senior Excise Tax Rev. and Ref. Ref. Obligations, Series 2024, 5.00% 7/1/2038 | 1,250 | 1,436 | |
Industrial Dev. Auth., Charter School Rev. Bonds (Equitable School Revolving Fund), Series 2023-A, 5.00% 11/1/2028 | 950 | 998 | |
Industrial Dev. Auth., Charter School Social Rev. Bonds (Equitable School Revolving Fund), Series 2021-A, 4.00% 11/1/2040 | 500 | 495 | |
Industrial Dev. Auth., Education Fac. Rev. Bonds (KIPP NYC Public Charter Schools - Macombs Fac. Project), Series 2021-A, 4.00% 7/1/2036 | 310 | 306 | |
Industrial Dev. Auth., Education Rev. Bonds (Academies of Math & Science Projects), Series 2019, 4.00% 7/1/20291 | 200 | 198 | |
Industrial Dev. Auth., Education Rev. Bonds (Pinecrest Academy of Northern Nevada Project), Series 2022-A, 4.50% 7/15/20291 | 1,500 | 1,433 | |
Industrial Dev. Auth., Education Rev. Bonds (Somerset Academy of Las Vegas - Aliante and Skye Canyon Campus Projects), Series 2021-A, 3.00% 12/15/20311 | 235 | 215 | |
Industrial Dev. Auth., Education Rev. Ref. Bonds (Doral Academy of Northern Nevada Project), Series 2021-A, 4.00% 7/15/20291 | 200 | 199 | |
Industrial Dev. Auth., Education Rev. Ref. Bonds (Doral Academy of Northern Nevada Project), Series 2021-A, 4.00% 7/15/20301 | 200 | 198 | |
Industrial Dev. Auth., Municipal Certs., Series 2019-2, Class A, 3.625% 5/20/2033 | 1,143 | 1,075 | |
County of Maricopa, Industrial Dev. Auth., Facs. Rev. Bonds (Commercial Metals Co. Project), Series 2022, AMT, 4.00% 10/15/20471 | 1,500 | 1,372 | |
County of Maricopa, Industrial Dev. Auth., Hospital Rev. Ref. Bonds (Honor Health), Series 2024-D, 5.00% 12/1/2041 | 1,000 | 1,070 | |
County of Maricopa, Pollution Control Rev. Ref. Bonds (El Paso Electric Co. Palo Verde Project), Series 2009-A, 3.60% 2/1/2040 | 750 | 675 | |
Maricopa County Pollution Control Corp., Pollution Control Rev. Ref. Bonds (Palo Verde Project), Series 2009-B, 3.60% 4/1/2040 | 2,140 | 1,924 | |
39 | Capital Group Fixed Income ETF Trust |
Capital Group Municipal Income ETF (continued)
Bonds, notes & other debt instruments (continued) | Principal amount (000) | Value (000) | |
Arizona (continued) | |||
Maricopa County Pollution Control Corp., Pollution Control Rev. Ref. Bonds (Southern California Edison Co.), Series 2000-A, 2.40% 6/1/2035 | USD 2,500 | $2,069 | |
Maricopa County Pollution Control Corp., Pollution Control Rev. Ref. Bonds (Southern California Edison Co.), Series 2000-B, 2.40% 6/1/2035 | 820 | 679 | |
City of Phoenix, Civic Improvement Corp., Airport Rev. Bonds, Series 2019-B, AMT, 5.00% 7/1/2026 | 3,500 | 3,584 | |
Board of Regents of the Arizona State University System, Rev. Bonds, Series 2024-A, 5.00% 8/1/2042 | 1,000 | 1,121 | |
Transportation Board, Highway Rev. and Rev. Ref. Bonds, Series 2023, 5.00% 7/1/2026 | 1,000 | 1,037 | |
Board of Regents of the University of Arizona, System Rev. Bonds, Series 2019-A, 5.00% 6/1/2042 | 1,000 | 1,054 | |
21,138 | |||
Arkansas 0.25% | |||
Dev. Fin. Auth., Industrial Dev. Rev. Bonds (Big River Steel Project), Series 2019, AMT, 4.50% 9/1/20491 | 2,000 | 1,976 | |
California 8.09% | |||
Community Choice Fncg. Auth., Clean Energy Project Rev. Green Bonds, Series 2021-B-1, 4.00% 2/1/2052 (put 8/1/2031) | 3,000 | 3,007 | |
Community Choice Fncg. Auth., Clean Energy Project Rev. Green Bonds, Series 2023-E-1, 5.00% 2/1/2054 (put 3/1/2031) | 850 | 901 | |
Community Choice Fncg. Auth., Clean Energy Project Rev. Green Bonds, Series 2024-A, 5.00% 5/1/2054 (put 4/1/2032) | 1,250 | 1,336 | |
Community Choice Fncg. Auth., Clean Energy Project Rev. Green Bonds, Series 2023-F, 5.50% 10/1/2054 (put 11/1/2030) | 650 | 711 | |
Community Choice Fncg. Auth., Clean Energy Project Rev. Green Bonds, Series 2023-G, 5.25% 11/1/2054 (put 4/1/2030) | 1,000 | 1,069 | |
CSCDA Community Improvement Auth., Essential Housing Social Rev. Bonds (Millennium South Bay - Hawthorne), Series 2021-A-1, 3.375% 7/1/20431 | 450 | 381 | |
CSCDA Community Improvement Auth., Essential Housing Social Rev. Bonds (Union South Bay), Series 2021-A-1, 3.10% 7/1/20451 | 500 | 431 | |
Davis Joint Unified School Dist., G.O Bonds, 2018 Election, Series 2020, BAM insured, 3.00% 8/1/2034 | 750 | 692 | |
Educational Facs. Auth., Rev. Bonds (Saint Mary’s College of California), Series 2023-A, 5.00% 10/1/2038 | 525 | 560 | |
Escondido Union High School Dist., G.O. Bonds, 2014 Election, Series 2015-A, 4.25% 2/1/2045 (preref. 8/1/2025) | 1,000 | 1,012 | |
Escondido Union High School Dist., G.O. Bonds, Capital Appreciation Bonds, 2008 Election, Series 2009-A, Assured Guaranty insured, 0% 8/1/2028 | 500 | 436 | |
Freddie Mac, Multi Family Mortgage Green Bonds, Series 2023, Class ACA, 2.25% 9/25/2037 | 1,239 | 1,004 | |
Fremont Unified School Dist., G.O. Bonds, 2014 Election, Series 2021-D, 3.00% 8/1/2033 | 1,600 | 1,490 | |
G.O. Bonds., Series 2024, 5.00% 9/1/2041 | 2,000 | 2,276 | |
G.O. Rev. Ref. Bonds, Series 2019, 5.00% 2032 | 500 | 572 | |
G.O. Rev. Ref. Bonds, Series 2015-C, 5.00% 8/1/2033 | 2,000 | 2,018 | |
G.O. Rev. Ref. Bonds, Series 2019, 3.00% 10/1/2037 | 500 | 458 | |
Glendale Community College Dist., G.O. Bonds, Capital Appreciation Bonds, 2016 Election, Series 2020-B, 0% 8/1/2041 | 2,150 | 1,033 | |
Glendale Community College Dist., G.O. Rev. Ref. Bonds, Capital Appreciation Bonds, 2016 Election, Series 2020-B, 0% 8/1/2032 | 500 | 370 | |
Glendale Community College Dist., G.O. Rev. Ref. Bonds, Capital Appreciation Bonds, 2016 Election, Series 2020-B, 0% 8/1/2036 | 1,000 | 623 | |
Golden State Tobacco Securitization Corp., Enhanced Tobacco Settlement Asset-Backed Bonds, Capital Appreciation Bonds, Series 2005-A, Assured Guaranty Municipal insured, 0% 6/1/2025 (escrowed to maturity) | 1,000 | 968 | |
Health Facs. Fncg. Auth., Rev. Bonds (Adventist Health System/West), Series 2024-A, 5.25% 12/1/2040 | 750 | 838 | |
Health Facs. Fncg. Auth., Rev. Bonds (Cedars-Sinai Medical Center), Series 2021-A, 3.00% 8/15/2051 | 500 | 401 | |
Health Facs. Fncg. Auth., Rev. Bonds (Children’s Hospital of Orange County), Series 2021-A, 3.00% 11/1/2038 | 635 | 569 | |
Health Facs. Fncg. Auth., Rev. Bonds (Episcopal Communities & Services), Series 2024-B, 5.00% 11/15/2038 | 430 | 467 | |
Health Facs. Fncg. Auth., Rev. Bonds (Providence Health & Services), Series 2014-A, 5.00% 10/1/2024 | 580 | 581 | |
Housing Fin. Agcy., Municipal Certs., Series 2019-A-1, 4.25% 1/15/2035 | 2,312 | 2,375 | |
Housing Fin. Agcy., Municipal Certs., Series 2021-A-1, 3.50% 11/20/2035 | 951 | 910 | |
Housing Fin. Agcy., Municipal Certs., Series 2021-A-3, 3.25% 8/20/2036 | 1,776 | 1,650 | |
Housing Fin. Agcy., Municipal Certs., Series 2023-1, Class A, 4.375% 9/20/2036 | 1,787 | 1,859 | |
Infrastructure and Econ. Dev. Bank, Rev. Bonds (WFCS Portfolio Projects), Series 2021-A-1, 5.00% 1/1/20561 | 500 | 473 | |
City of Long Beach, Harbor Rev. Bonds, Series 2015-C, AMT, 5.00% 5/15/2026 | 720 | 728 | |
Capital Group Fixed Income ETF Trust | 40 |
Capital Group Municipal Income ETF (continued)
Bonds, notes & other debt instruments (continued) | Principal amount (000) | Value (000) | |
California (continued) | |||
City of Los Angeles, Dept. of Airports, Los Angeles International Airport, Rev. Bonds, Series 2019-D, AMT, 5.00% 5/15/2026 | USD 495 | $508 | |
City of Los Angeles, Dept. of Airports, Los Angeles International Airport, Rev. Bonds, Series 2018-A, AMT, 5.00% 5/15/2037 | 1,000 | 1,039 | |
City of Los Angeles, Dept. of Airports, Los Angeles International Airport, Rev. Bonds, Series 2019-F, AMT, 5.00% 5/15/2039 | 1,000 | 1,046 | |
City of Los Angeles, Dept. of Airports, Los Angeles International Airport, Rev. Bonds, Series 2018-A, AMT, 4.00% 5/15/2048 | 1,000 | 951 | |
City of Los Angeles, Dept. of Water and Power, Power System Rev. Bonds, Series 2022-C, 5.00% 7/1/2042 | 1,000 | 1,109 | |
Monrovia Unified School Dist., G.O. Bonds, Capital Appreciation Bonds, 1997 Election, Series 2001-B, National insured, 0% 8/1/2032 | 750 | 561 | |
Municipal Fin. Auth., Educational Rev. Bonds (American Heritage Education Foundation Project), Series 2016-A, 5.00% 6/1/2036 | 180 | 182 | |
Municipal Fin. Auth., Multi Family Housing Rev. Bonds (Gibson Drive Apartments Project), Series 2024-B, 3.75% 6/1/2028 (put 6/1/2027) | 140 | 141 | |
Municipal Fin. Auth., Rev. Ref. Bonds (Biola University), Series 2017, 5.00% 10/1/2030 | 500 | 520 | |
Municipal Fin. Auth., School Fac. Rev. Bonds (St. Mary’s School - Aliso Viejo), Series 2024-B, 4.65% 5/1/2030 | 265 | 267 | |
Municipal Fin. Auth., Solid Waste Disposal Rev. Bonds (Republic Services, Inc. Project), Series 2023-A, AMT, 4.375% 9/1/2053 (put 9/1/2033) | 1,250 | 1,317 | |
Municipal Fin. Auth., Solid Waste Disposal Rev. Bonds (Waste Management, Inc. Project), Series 2019-A, AMT, 2.40% 10/1/2044 (put 10/1/2029) | 1,605 | 1,534 | |
Municipal Fin. Auth., Special Fac. Rev. Bonds (United Airlines, Inc. Los Angeles International Airport Project), Series 2019, AMT, 4.00% 7/15/2029 | 1,000 | 1,000 | |
Newport-Mesa Unified School Dist., G.O. Bonds, Capital Appreciation Bonds, 2005 Election, Series 2011, 0% 8/1/2033 | 700 | 518 | |
Northern California Energy Auth., Commodity Supply Rev. Bonds, Series 2018, 4.00% 7/1/2049 (put 7/1/2024) | 2,000 | 2,000 | |
Oakland Unified School Dist., G.O. Bonds, 2012 Election, Series 2019-A, Assured Guaranty Municipal insured, 4.00% 8/1/2034 | 1,000 | 1,014 | |
County of Orange, Community Facs. Dist. No. 2023-1 (Rienda Phase 2B), Special Tax Bonds, Series 2023-A, 5.50% 8/15/2038 | 450 | 480 | |
Public Works Board, Lease Rev. Bonds (Dept. of General Services, May Lee State Office Complex), Series 2024-A, 5.00% 4/1/2041 | 820 | 933 | |
Public Works Board, Lease Rev. Green Bonds (Dept. of General Services, Sacramento Region New Natural Resources Headquarters), Series 2021-C, 4.00% 11/1/2041 | 1,000 | 1,020 | |
Public Works Board, Lease Rev. Ref. Bonds (Various Capital Projects), Series 2023-C, 5.00% 9/1/2035 | 1,050 | 1,217 | |
Public Works Board, Lease Rev. Ref. Bonds (Various Capital Projects), Series 2021-B, 4.00% 5/1/2041 | 1,405 | 1,432 | |
Rialto Unified School Dist., G.O. Bonds, 2022 Election, Series 2023, BAM insured, 0% 8/1/2028 | 115 | 100 | |
Rialto Unified School Dist., G.O. Bonds, 2022 Election, Series 2023, BAM insured, 0% 8/1/2029 | 140 | 117 | |
River Islands Public Fncg. Auth., Community Facs. Dist. No. 2023-1 (Public Facs.), Special Tax Bonds, Series 2024, 4.50% 9/1/2044 | 215 | 209 | |
Rowland Unified School Dist., G.O. Bonds, 2006 Election, Capital Appreciation Bonds, Series 2009-B, 0% 8/1/2034 | 500 | 336 | |
San Diego Unified School Dist., G.O. Dedicated Unlimited Ad Valorem Property Tax Bonds, 2008 Election, Series 2012-E, 0% 7/1/2034 | 750 | 525 | |
City and County of San Francisco, Airport Commission, San Francisco International Airport, Rev. Ref. Bonds, Series 2019-A-2, AMT, 5.00% 5/1/2044 | 500 | 515 | |
City and County of San Francisco, Community Facs. Dist. No. 2016-1 (Treasure Island), Improvement Area No. 2, Special Tax Bonds, Series 2023-A, 5.00% 9/1/20331 | 800 | 865 | |
City and County of San Francisco, Community Facs. Dist. No. 2016-1 (Treasure Island), Improvement Area No. 2, Special Tax Bonds, Series 2023-A, 5.00% 9/1/20381 | 710 | 757 | |
City and County of San Francisco, Special Tax Dist. No. 2020-1 (Mission Rock Facs. and Services), Shoreline Special Tax Bonds, Series 2023-C, 5.25% 9/1/20381 | 875 | 948 | |
San Francisco Community College Dist., G.O. Bonds, 2020 Election, Series 2020-A, 3.00% 6/15/2045 | 1,000 | 814 | |
San Jacinto Unified School Dist., G.O. Bonds, 2016 Election, Series 2022, 4.00% 8/1/2043 | 1,105 | 1,124 | |
City of San Jose, Airport Rev. Ref. Bonds, Series 2017-A, AMT, 5.00% 3/1/2041 | 1,500 | 1,529 | |
City of San Jose, Multi Family Housing Rev. Bonds (Parkmoor), Series 2023-F-2, 5.00% 6/1/2027 (put 6/1/2026) | 215 | 220 | |
Statewide Communities Dev. Auth., Student Housing Rev. Ref. Bonds (CHF-Irvine, LLC - University of California, Irvine East Campus Apartments, Phase I Ref. and Phase IV-B), Series 2021, BAM insured, 5.00% 5/15/2027 | 500 | 520 | |
Stockton Unified School Dist., G.O. Bonds, Capital Appreciation Bonds, 2008 Election, Series 2011-D, Assured Guaranty Municipal insured, 0% 8/1/2033 | 1,000 | 722 | |
41 | Capital Group Fixed Income ETF Trust |
Capital Group Municipal Income ETF (continued)
Bonds, notes & other debt instruments (continued) | Principal amount (000) | Value (000) | |
California (continued) | |||
Regents of the University of California, General Rev. Bonds, Series 2024-BV, 5.00% 5/15/2039 | USD 2,000 | $2,314 | |
City of Vernon, Electric System Rev. Bonds, Series 2021-A, 5.00% 4/1/2025 | 750 | 757 | |
Whittier Union High School Dist., G.O. Rev. Ref. Bonds, Capital Appreciation Bonds, Series 2016, 0% 8/1/2032 | 750 | 545 | |
63,905 | |||
Colorado 2.56% | |||
County of Adams, Buffalo Highlands Metropolitan Dist., Limited Tax G.O Rev. Ref. and Improvement Bonds, Series 2018-A, 5.25% 12/1/2038 | 650 | 644 | |
County of Adams, The Village at Dry Creek Metropolitan Dist. No. 2, Limited Tax G.O. and Special Rev. Bonds, Series 2019, 4.375% 12/1/2044 | 500 | 481 | |
Bridge and Tunnel Enterprise, Infrastructure Rev. Bonds, Series 2024-A, Assured Guaranty Municipal insured, 5.00% 12/1/2041 | 750 | 832 | |
City of Brighton, Brighton Crossing Metropolitan Dist. No. 6, Limited Tax G.O. Bonds, Series 2020-A, 5.00% 12/1/2035 | 530 | 515 | |
Crowfoot Valley Ranch Metropolitan Dist. No. 2, Limited Tax G.O. Bonds, Series 2018-A, 5.625% 12/1/2038 | 555 | 552 | |
City and County of Denver, Airport System Rev. Bonds, Series 2022-A, AMT, 5.00% 11/15/2028 | 1,250 | 1,315 | |
City and County of Denver, Airport System Rev. Bonds, Series 2018-A, AMT, 5.00% 12/1/2034 | 1,145 | 1,269 | |
City and County of Denver, Broadway Park North Metropolitan Dist. No. 2, Limited Tax G.O. Rev. Ref. and Improvement Bonds, Series 2020, 5.00% 12/1/20401 | 835 | 805 | |
E-470 Public Highway Auth., Rev. Bonds, Series 2024-A, 5.00% 9/1/2040 | 310 | 345 | |
E-470 Public Highway Auth., Rev. Bonds, Capital Appreciation Bonds, Series 2004-A, National insured, 0% 9/1/2027 | 500 | 445 | |
Educational and Cultural Facs. Auth., Charter School Rev. Bonds (Ascent Classical Academy Charter Schools, Inc. Project), Series 2024, 5.25% 4/1/20391 | 1,500 | 1,561 | |
Educational and Cultural Facs. Auth., Charter School Rev. Bonds (Ascent Classical Academy Charter Schools, Inc. Project), Series 2024, 5.50% 4/1/20441 | 375 | 389 | |
Health Facs. Auth., Rev. Bonds (Sanford), Series 2019-A, 4.00% 11/1/2039 | 2,445 | 2,382 | |
Health Facs. Auth., Rev. Ref. Bonds (Covenant Retirement Communities, Inc.), Series 2015-A, 5.00% 12/1/2035 | 500 | 501 | |
Health Facs. Auth., Rev. Ref. Bonds (Sisters of Charity of Leavenworth Health System), Series 2019-A, 4.00% 1/1/2037 | 1,000 | 1,007 | |
Housing and Fin. Auth., Multi Family Housing Rev. Bonds (Wintergreen Ridge Apartments Project), Series 2023, 4.00% 5/1/2041 (put 5/1/2025) | 275 | 275 | |
Housing and Fin. Auth., Single Family Mortgage Bonds, Series 2023-I, Class III, 6.00% 5/1/2053 | 985 | 1,067 | |
Town of Johnstown, Thompson Crossing Metropolitan Dist. No. 4, Limited Tax G.O. Rev. Ref. and Improvement Bonds (Convertible to Unlimited Tax), Series 2019, 5.00% 12/1/2039 | 500 | 494 | |
City of Lone Tree, Rampart Range Metropolitan Dist. No. 5, Limited Tax Supported and Special Rev. Bonds, Series 2021, 4.00% 12/1/2036 | 500 | 462 | |
North Range Metropolitan Dist. No. 2, Limited Tax G.O. and Special Rev. Ref. and Improvement Bonds, Series 2017-A, 5.625% 12/1/2037 | 625 | 626 | |
Town of Parker, Cottonwood Highlands Metropolitan Dist. No. 1, Limited Tax G.O. Bonds (Convertible to Unlimited Tax), Series 2019-A, 5.00% 12/1/2049 | 500 | 497 | |
Regional Transportation Dist., Private Activity Bonds (Denver Transit Partners Eagle P3 Project), Series 2020-A, 4.00% 7/15/2033 | 500 | 510 | |
Town of Superior, STC Metropolitan Dist. No. 2, Limited Tax G.O. and Special Rev. Ref. and Improvement Bonds, Series 2019-A, 4.00% 12/1/2029 | 500 | 484 | |
Talon Pointe Metropolitan Dist., G.O. Rev. Ref. and Improvement Bonds, Series 2019-A, 5.25% 12/1/2039 | 955 | 787 | |
Regents of the University of Colorado, University Enterprise Rev. Ref. Bonds, Series 2017-A-2, 4.00% 6/1/2039 | 1,500 | 1,504 | |
Town of Windsor, Great Western Metropolitan Dist. No. 5, Limited Tax G.O. Rev. Ref. Bonds, Series 2020, 4.75% 12/1/2050 | 500 | 448 | |
20,197 | |||
Connecticut 0.51% | |||
Health and Educational Facs. Auth., Rev. Bonds (Connecticut Children’s Medical Center Issue), Series 2023-E, 5.00% 7/15/2038 | 555 | 595 | |
Higher Education Supplemental Loan Auth., Rev. Bonds (Chesla Loan Program), Series 2024-B, AMT, 4.125% 11/15/2040 | 770 | 761 | |
Housing Fin. Auth., Housing Mortgage Fin. Program Bonds, Series 2018-E-1, 4.25% 5/15/2042 | 310 | 310 | |
Mohegan Tribe of Indians, Gaming Auth., Priority Distribution Payment Rev. Ref. Bonds, Series 2015-C, 5.75% 2/1/20251 | 500 | 501 | |
Capital Group Fixed Income ETF Trust | 42 |
Capital Group Municipal Income ETF (continued)
Bonds, notes & other debt instruments (continued) | Principal amount (000) | Value (000) | |
Connecticut (continued) | |||
Mohegan Tribe of Indians, Gaming Auth., Priority Distribution Payment Rev. Ref. Bonds, Series 2015-C, 6.25% 2/1/20301 | USD 1,000 | $1,017 | |
Mohegan Tribe of Indians, Gaming Auth., Priority Distribution Payment Rev. Ref. Bonds, Series 2015-A, 6.75% 2/1/20451 | 308 | 309 | |
City of Stamford, Harbor Point Infrastructure Improvement Dist., Special Obligation Rev. Ref. Bonds (Harbor Point Project), Series 2017, 5.00% 4/1/20391 | 500 | 502 | |
3,995 | |||
Delaware 0.15% | |||
Econ. Dev. Auth., Charter School Rev. Bonds (First State Montessori Academy, Inc. Project), Series 2019-A, 4.00% 8/1/2029 | 400 | 391 | |
G.O. Bonds, Series 2021, 2.00% 2/1/2036 | 1,000 | 792 | |
1,183 | |||
District of Columbia 2.15% | |||
Hospital Rev. Ref. Bonds (Children’s Hospital Obligated Group Issue), Series 2015, 5.00% 7/15/2025 | 1,000 | 1,014 | |
Hospital Rev. Ref. Bonds (Children’s Hospital Obligated Group Issue), Series 2015, 5.00% 7/15/2044 | 1,000 | 1,011 | |
Housing Fin. Agcy., Collateralized Multi Family Housing Rev. Bonds (The Edmonson), Series 2024, 5.00% 12/1/2028 (put 12/1/2027) | 135 | 140 | |
Income Tax Secured Rev. Bonds, Series 2020-C, 5.00% 5/1/2037 | 980 | 1,078 | |
Income Tax Secured Rev. Bonds, Series 2020-A, 3.00% 3/1/2041 | 2,000 | 1,753 | |
Metropolitan Area Transit Auth., Dedicated Rev. Bonds, Series 2020-A, 4.00% 7/15/2020 | 750 | 753 | |
Metropolitan Area Transit Auth., Dedicated Rev. Bonds, Series 2020-A, 5.00% 7/15/2045 | 1,500 | 1,591 | |
Metropolitan Area Transit Auth., Dedicated Rev. Green Bonds, Series 2021-A, 4.00% 7/15/2034 | 1,030 | 1,073 | |
Metropolitan Area Transit Auth., Dedicated Rev. Green Bonds, Series 2021-A, 4.00% 7/15/2043 | 1,000 | 987 | |
Metropolitan Washington DC Airports Auth., Airport System Rev. and Rev. Ref. Bonds, Series 2021-A, AMT, 5.00% 10/1/2025 | 1,080 | 1,098 | |
Metropolitan Washington DC Airports Auth., Airport System Rev. Ref. Bonds, Series 2024-A, AMT, 5.00% 10/1/2030 | 1,155 | 1,232 | |
Metropolitan Washington DC Airports Auth., Airport System Rev. Ref. Bonds, Series 2016-A, AMT, 5.00% 10/1/2032 | 1,000 | 1,022 | |
Metropolitan Washington DC Airports Auth., Airport System Rev. Ref. Bonds, Series 2016-A, AMT, 5.00% 10/1/2035 | 1,000 | 1,019 | |
Metropolitan Washington DC Airports Auth., Airport System Rev. Ref. Bonds, Series 2023-A, AMT, 5.25% 10/1/2043 | 1,000 | 1,083 | |
Metropolitan Washington DC Airports Auth., Dulles Toll Road Rev. Ref. Bonds (Dulles Metrorail and Capital Improvement Projects), Series 2019-B, 5.00% 10/1/2033 | 1,055 | 1,123 | |
Rev. Bonds (Friendship Public Charter School, Inc. Issue), Series 2016-A, 5.00% 6/1/2041 | 1,000 | 1,006 | |
16,983 | |||
Florida 2.94% | |||
County of Broward, Housing Fin. Auth., Multi Family Housing Rev. Bonds (Pinnacle 441 Phase 2), Series 2023, 4.05% 9/1/2056 (put 3/1/2026) | 480 | 481 | |
Capital Trust Agcy., Educational Facs. Rev. Bonds (Renaissance Charter School), Series 2017-A, 4.375% 6/15/20271 | 380 | 374 | |
Capital Trust Agcy., Educational Facs. Rev. Bonds (Viera Charter Schools, Inc. Project), Series 2017-A, 4.00% 10/15/20291 | 400 | 397 | |
Capital Trust Agcy., Senior Rev. Bonds (Educational Growth Fund, LLC Charter School Portfolio Projects), Series 2021-A-1, 3.375% 7/1/20311 | 500 | 482 | |
Citizens Property Insurance Corp., Coastal Account Senior Secured Bonds, Series 2015-A-1, 5.00% 6/1/2025 (preref. 12/1/2024) | 590 | 594 | |
Dev. Fin. Corp., Educational Facs. Rev. Bonds (Cornerstone Classical Academy), Series 2024-A, 5.00% 6/1/20341 | 595 | 612 | |
Dev. Fin. Corp., Educational Facs. Rev. Bonds (Mater Academy Projects), Series 2022-A, 5.00% 6/15/2036 | 1,325 | 1,359 | |
Dev. Fin. Corp., Educational Facs. Rev. Bonds (Renaissance Charter School, Inc. Projects), Series 2023-A, 6.50% 6/15/20381 | 1,000 | 1,110 | |
Dev. Fin. Corp., Solid Waste Disposal Rev. Bonds (Waste Pro USA, Inc. Project), Series 2021, AMT, 3.00% 6/1/2032 | 2,000 | 1,743 | |
Dev. Fin. Corp., Solid Waste Disposal Rev. Bonds (Waste Pro USA, Inc. Project), Series 2023, AMT, 6.125% 7/1/2032 (put 7/1/2026)1 | 1,000 | 1,027 | |
43 | Capital Group Fixed Income ETF Trust |
Capital Group Municipal Income ETF (continued)
Bonds, notes & other debt instruments (continued) | Principal amount (000) | Value (000) | |
Florida (continued) | |||
Greater Orlando Aviation Auth., Airport Facs. Rev. Bonds, Series 202-A, AMT, 5.00% 10/1/2029 | USD 1,350 | $1,429 | |
County of Hillsborough, Aviation Auth., Tampa International Airport Rev. Bonds, Series 2015-A, AMT, 5.00% 10/1/2033 | 1,000 | 1,001 | |
Hobe-St. Lucie Conservancy Dist., Improvement Bonds (Unit of Dev. No. 1A), Series 2024, 4.75% 5/1/2031 | 590 | 604 | |
Housing Fin. Corp., Homeowner Mortgage Rev. Bonds, Series 2018-1, 4.00% 7/1/2049 | 305 | 303 | |
Housing Fin. Corp., Homeowner Mortgage Rev. Bonds, Series 2023-3, 5.75% 1/1/2054 | 1,050 | 1,130 | |
Housing Fin. Corp., Homeowner Mortgage Rev. Bonds, Series 2023-5, 6.25% 1/1/2054 | 900 | 992 | |
Housing Fin. Corp., Homeowner Mortgage Rev. Bonds, Series 2023-1, 5.25% 7/1/2054 | 495 | 514 | |
Housing Fin. Corp., Homeowner Mortgage Rev. Bonds, Series 2024-3, 6.25% 1/1/2055 | 1,185 | 1,299 | |
Housing Fin. Corp., Homeowner Mortgage Rev. Bonds, Series 2024-1, 6.25% 7/1/2055 | 230 | 255 | |
Lee Memorial Health System, Hospital Rev. and Rev. Ref. Bonds, Series 2019-A-1, 4.00% 4/1/2037 | 1,000 | 1,001 | |
City of Miami, Midtown Miami Community Dev. Dist., Special Assessment and Rev. Ref. Bonds (Infrastructure Project), Series 2014-B, 5.00% 5/1/2029 | 620 | 620 | |
County of Miami-Dade, Housing Fin. Auth., Multi Family Housing Rev. Bonds (Cutler Vista), Series 2023, 5.00% 3/1/2027 (put 9/1/2025) | 555 | 561 | |
County of Miami-Dade, Housing Fin. Auth., Multi Family Housing Rev. Bonds (Emerald Dunes), Series 2023-B, 4.05% 9/1/2026 (put 9/1/2025) | 500 | 501 | |
County of Miami-Dade, Sawyers Landing Community Dev. Dist., Special Assessment Rev. Bonds, Series 2021, 3.25% 5/1/2026 | 1,075 | 1,048 | |
County of Miami-Dade, Sawyers Landing Community Dev. Dist., Special Assessment Rev. Bonds, Series 2021, 4.125% 5/1/2041 | 250 | 216 | |
Municipal Power Agcy., Rev. Ref. Bonds (St. Lucie Project), Series 2021-B, 5.00% 10/1/2030 | 1,435 | 1,527 | |
Dept. of Transportation, Turnpike Rev. Ref. Bonds, Series 2021-C, 3.00% 7/1/2046 | 2,500 | 2,043 | |
23,223 | |||
Georgia 2.25% | |||
City of Atlanta, Airport General Rev. Ref. Bonds, Series 2023-G, AMT, 5.00% 7/1/2026 | 355 | 364 | |
City of Atlanta, Airport Passenger Fac. Charge and General Rev. Bonds, Series 2019-D, AMT, 4.00% 7/1/2040 | 500 | 492 | |
Augusta Dev. Auth., Rev. Bonds (AU Health System, Inc. Project), Series 2018, 4.00% 7/1/2038 | 460 | 460 | |
G.O. Bonds, Series 2022-A, 5.00% 7/1/2036 | 575 | 657 | |
Main Street Natural Gas, Inc., Gas Supply Rev. Bonds, Series 2021-C, 4.00% 5/1/2052 (put 12/1/2028) | 695 | 698 | |
Main Street Natural Gas, Inc., Gas Supply Rev. Bonds, Series 2021-A, 4.00% 7/1/2052 (put 9/1/2027) | 2,750 | 2,762 | |
Main Street Natural Gas, Inc., Gas Supply Rev. Bonds, Series 2023-B, 5.00% 7/1/2053 (put 3/1/2030) | 615 | 653 | |
Main Street Natural Gas, Inc., Gas Supply Rev. Bonds, Series 2023-C, 5.00% 9/1/2053 (put 12/1/2029) | 1,140 | 1,211 | |
Main Street Natural Gas, Inc., Gas Supply Rev. Bonds, Series 2024-B, 5.00% 12/1/2054 (put 3/1/2032) | 3,340 | 3,541 | |
Main Street Natural Gas, Inc., Gas Supply Rev. Bonds, Series 2024-C, 5.00% 12/1/2054 (put 12/1/2031) | 2,165 | 2,286 | |
Municipal Electric Auth., Project One Bonds, Series 2020-A, 5.00% 1/1/2027 | 620 | 641 | |
Private Colleges and Universities Auth., Rev. Bonds (Emory University), Series 2022-A, 5.00% 9/1/2032 | 500 | 570 | |
County of Rockdale, Rev. Ref. Bonds (Pratt Paper (GA), LLC Project), Series 2018, AMT, 4.00% 1/1/20381 | 3,500 | 3,460 | |
17,795 | |||
Guam 0.42% | |||
Business Privilege Tax Rev. Ref. Bonds, Series 2021-F, 5.00% 1/1/2029 | 1,250 | 1,313 | |
Business Privilege Tax Rev. Ref. Bonds, Series 2021-F, 4.00% 1/1/2036 | 1,000 | 1,004 | |
Limited Obligation Bonds (Section 30), Series 2016-A, 5.00% 12/1/2046 | 1,000 | 1,003 | |
3,320 | |||
Hawaii 1.39% | |||
Airports System Rev. Bonds, Series 2018-A, AMT, 5.00% 7/1/2029 | 500 | 523 | |
Airports System Rev. Bonds, Series 2020-A, AMT, 4.00% 7/1/2035 | 500 | 502 | |
Airports System Rev. Bonds, Series 2018-A, AMT, 5.00% 7/1/2035 | 1,965 | 2,041 | |
Dept. of Budget and Fin., Special Purpose Rev. Ref. Bonds (Hawaiian Electric Co., Inc.), Series 2019, 3.20% 7/1/2039 | 500 | 326 | |
G.O. Bonds, Series 2016-FG, 4.00% 10/1/2033 | 2,000 | 2,008 | |
Harbor System Rev. Bonds, Series 2020-A, AMT, 5.00% 7/1/2028 | 1,000 | 1,045 | |
Capital Group Fixed Income ETF Trust | 44 |
Capital Group Municipal Income ETF (continued)
Bonds, notes & other debt instruments (continued) | Principal amount (000) | Value (000) | |
Hawaii (continued) | |||
City and County of Honolulu, G.O. Bonds, Series 2021-A, 4.00% 7/1/2041 | USD 500 | $506 | |
City and County of Honolulu, G.O. Bonds (Honolulu Rail Transit Project), Series 2023-C, 3.00% 7/1/2034 | 1,030 | 999 | |
City and County of Honolulu, Wastewater System Rev. Bonds (First Bond Resolution), Series 2015-A, 5.00% 7/1/2045 (preref. 7/1/2025) | 3,000 | 3,052 | |
11,002 | |||
Idaho 0.32% | |||
Housing and Fin. Assn., Single Family Mortgage Bonds, Series 2023-C, 5.75% 1/1/2053 | 1,680 | 1,807 | |
Housing and Fin. Assn., Single Family Mortgage Bonds, Series 2024-A, 6.00% 7/1/2054 | 635 | 696 | |
2,503 | |||
Illinois 6.04% | |||
Build Illinois Bonds, Sales Tax Rev. Bonds, Series 2021-A, 3.00% 6/15/2032 | 500 | 466 | |
City of Chicago, Board of Education, Capital Improvement Tax Bonds (Dedicated Rev.), Series 2023, 5.25% 4/1/2036 | 250 | 281 | |
City of Chicago, Board of Education, Unlimited Tax G.O. Bonds (Dedicated Rev.), Series 2021-A, 5.00% 12/1/2033 | 1,350 | 1,419 | |
City of Chicago, Board of Education, Unlimited Tax G.O. Bonds (Dedicated Rev.), Series 2021-A, 5.00% 12/1/2037 | 1,000 | 1,035 | |
City of Chicago, Board of Education, Unlimited Tax G.O. Bonds (Dedicated Rev.), Series 2021-A, 5.00% 12/1/2040 | 1,500 | 1,537 | |
City of Chicago, Board of Education, Unlimited Tax G.O. Bonds (Dedicated Rev.), Series 2018-D, 5.00% 12/1/2046 | 500 | 502 | |
City of Chicago, Board of Education, Unlimited Tax G.O. Rev. Ref. Bonds (Dedicated Rev.), Series 2017-D, 5.00% 12/1/2026 | 1,250 | 1,279 | |
City of Chicago, Board of Education, Unlimited Tax G.O. Rev. Ref. Bonds (Dedicated Rev.), Series 2018-A, 5.00% 12/1/2030 | 500 | 519 | |
City of Chicago, Board of Education, Unlimited Tax G.O. Rev. Ref. Bonds (Dedicated Rev.), Series 2018-A, 5.00% 12/1/2035 | 1,250 | 1,287 | |
City of Chicago, Board of Education, Unlimited Tax G.O. Rev. Ref. Bonds (Dedicated Rev.), Series 2022-A, 4.00% 12/1/2047 | 500 | 440 | |
City of Chicago, Board of Education, Unlimited Tax G.O. Rev. Ref. Bonds (Dedicated Rev.), Capital Appreciation Bonds, Series 1998-B-1, National insured, 0% 12/1/2027 | 1,040 | 899 | |
City of Chicago, Chicago Midway Airport, Rev. Ref. Bonds, Series 2023-C, AMT, 5.00% 1/1/2028 | 1,130 | 1,173 | |
City of Chicago, G.O Bonds (City Colleges of Chicago Capital Improvement Project), Capital Appreciation Bonds, Series 1999, National insured, 0% 1/1/2026 (escrowed to maturity) | 500 | 473 | |
City of Chicago, G.O. Bonds, Series 2021-A, 4.00% 1/1/2035 | 500 | 501 | |
City of Chicago, G.O. Project and Rev. Ref. Bonds, Series 2017-A, 6.00% 1/1/2038 | 1,500 | 1,561 | |
City of Chicago, G.O. Rev. Ref. Bonds, Series 2020-A, 5.00% 1/1/2027 | 800 | 823 | |
City of Chicago, School Reform Board of Trustees of the Board of Education, Unlimited Tax G.O. Bonds (Dedicated Tax Rev.), Capital Appreciation Bonds, Series 1999-A, National insured, 0% 12/1/2025 | 500 | 472 | |
City of Chicago, Transit Auth., Capital Grant Receipts Rev. Ref. Bonds (Federal Transit Administration Section 5337 State of Good Repair Formula Funds), Series 2017, 5.00% 6/1/2026 | 775 | 793 | |
City of Chicago, Wastewater Transmission Rev. Ref. Bonds, Series 2008-C, 5.00% 1/1/2025 | 1,000 | 1,007 | |
City of Chicago, Wastewater Transmission Rev. Ref. Bonds, Series 2024-A, BAM insured, 5.00% 1/1/2041 | 400 | 441 | |
City of Chicago, Wastewater Transmission Rev. Ref. Bonds, Capital Appreciation Bonds, Series 1998-A, National insured, 0% 1/1/2026 | 1,000 | 942 | |
City of Chicago, Water Rev. Bonds, Series 2000, 5.00% 11/1/2028 | 1,000 | 1,028 | |
City of Chicago, Water Rev. Ref. Bonds, Series 2023-B, Assured Guaranty Municipal insured, 5.00% 11/1/2039 | 500 | 551 | |
Fin. Auth., Rev. Bonds (Advocate Health Care Network), Series 2008-A, 4.00% 11/1/2030 | 415 | 416 | |
Fin. Auth., Rev. Bonds (Mercy Health Corp.), Series 2016, 5.00% 12/1/2046 | 2,000 | 2,014 | |
Fin. Auth., Rev. Bonds (Northshore University HealthSystem), Series 2020-A, 4.00% 8/15/2037 | 2,000 | 2,007 | |
Fin. Auth., Rev. Bonds (OSF Healthcare System), Series 2015-A, 4.00% 11/15/2033 | 1,000 | 970 | |
Fin. Auth., Rev. Bonds (OSF Healthcare System), Series 2020-B-2, 5.00% 5/15/2050 (put 11/15/2026) | 2,000 | 2,045 | |
Fin. Auth., Rev. Bonds (Rush University Medical Center Obligated Group), Series 2015-A, 4.00% 11/15/2039 | 500 | 476 | |
Fin. Auth., Rev. Bonds (The Carle Foundation), Series 2021-A, 4.00% 8/15/2038 | 1,000 | 1,002 | |
Fin. Auth., Rev. Bonds (University of Chicago), Series 2024-A, 5.25% 4/1/2042 | 750 | 853 | |
Fin. Auth., Rev. Ref. Bonds (OSF Healthcare System), Series 2015-A, 5.00% 11/15/2035 | 500 | 503 | |
Fin. Auth., Solid Waste Disposal Rev. Bonds (Waste Management, Inc. Project), Series 2023, AMT, 4.60% 10/1/2053 (put 10/1/2026) | 1,565 | 1,588 | |
45 | Capital Group Fixed Income ETF Trust |
Capital Group Municipal Income ETF (continued)
Bonds, notes & other debt instruments (continued) | Principal amount (000) | Value (000) | |
Illinois (continued) | |||
Fin. Auth., Solid Waste Disposal Rev. Green Bonds (LRS Holdings, LLC Project), Series 2023-A, AMT, 7.25% 9/1/2052 (put 9/1/2030)1 | USD 500 | $532 | |
Fin. Auth., Student Housing Rev. Bonds (CHF-Cook, LLC - Northeastern Illinois University Project), Series 2015-A, 5.00% 7/1/2047 | 665 | 552 | |
G.O. Bonds, Series 2017-D, 5.00% 11/1/2024 | 1,225 | 1,230 | |
G.O. Bonds, Series 2014, 5.00% 5/1/2026 | 1,000 | 1,001 | |
G.O. Bonds, Series 2016, 4.00% 6/1/2033 | 1,060 | 1,054 | |
G.O. Bonds, Series 2024-B, 5.25% 5/1/2042 | 1,000 | 1,110 | |
Housing Dev. Auth., Multi Family Housing Rev. Bonds (6900 Crandon), Series 2023, 5.00% 2/1/2027 (put 2/1/2026) | 700 | 709 | |
Housing Dev. Auth., Multi Family Housing Rev. Bonds (South Shore HHDC), Series 2023, 5.00% 2/1/2027 (put 2/1/2026) | 650 | 658 | |
Housing Dev. Auth., Rev. Bonds, Series 2022-A, 3.50% 4/1/2052 | 830 | 812 | |
Housing Dev. Auth., Rev. Bonds, Series 2023-N, 6.25% 4/1/2054 | 995 | 1,099 | |
Housing Dev. Auth., Rev. Social Bonds, Series 2024-C, 6.25% 10/1/2054 | 1,410 | 1,566 | |
Metropolitan Pier and Exposition Auth., McCormick Place Expansion Project Bonds, Capital Appreciation Bonds, Series 1994, National insured, 0% 6/15/2028 | 1,055 | 899 | |
Metropolitan Pier and Exposition Auth., McCormick Place Expansion Project Bonds, Capital Appreciation Bonds, Series 2002-A, Assured Guaranty Municipal insured, 0% 6/15/2030 | 1,055 | 837 | |
Metropolitan Pier and Exposition Auth., McCormick Place Expansion Project Bonds, Capital Appreciation Bonds, Series 2002-A, National insured, 0% 6/15/2032 | 925 | 670 | |
Metropolitan Pier and Exposition Auth., McCormick Place Expansion Project Rev. Bonds, Capital Appreciation Bonds, National insured, Series 2002-A, 0% 12/15/2030 | 1,000 | 770 | |
Metropolitan Pier and Exposition Auth., McCormick Place Expansion Project Rev. Ref. Bonds, Capital Appreciation Bonds, Series 2010-B-1, Assured Guaranty Municipal insured, 0% 6/15/2027 | 1,040 | 927 | |
Sales Tax Securitization Corp., Sales Tax Securitization Bonds, Series 2020-A, 5.00% 1/1/2029 | 510 | 544 | |
Sports Facs. Auth., Sports Facs. Rev. Ref. Bonds (State Tax Supported), Series 2019, BAM insured, 5.00% 6/15/2029 | 665 | 705 | |
Toll Highway Auth., Toll Highway Rev. Bonds, Series 2023-A, 5.00% 1/1/2042 | 600 | 666 | |
47,644 | |||
Indiana 1.49% | |||
Fin. Auth., Environmental Improvement Rev. Ref. Bonds (U.S. Steel Corp. Project), Series 2021-A, 4.125% 12/1/2026 | 1,250 | 1,253 | |
Fin. Auth., Hospital Rev. Ref. Bonds (Indiana University Health), Series 2023-B-1, 5.00% 10/1/2062 (put 7/1/2028) | 755 | 797 | |
Fin. Auth., Midwestern Disaster Relief Rev. Bonds (Ohio Valley Electric Corp. Project), Series 2012-B, 3.00% 11/1/2030 | 655 | 614 | |
Fin. Auth., Midwestern Disaster Relief Rev. Bonds (Ohio Valley Electric Corp. Project), Series 2012-A, 4.25% 11/1/2030 | 1,000 | 1,005 | |
Fin. Auth., Pollution Control Rev. Bonds (Ohio Valley Electric Corp. Project), Series 2010-A, 3.00% 11/1/2030 | 1,000 | 938 | |
Fin. Auth., Wastewater Utility Rev. Ref. Bonds (CWA Auth. Project), Series 2016-B, 3.00% 10/1/2046 | 1,065 | 838 | |
City of Franklin, Econ. Dev. Rev. Ref. Bonds (Otterbein Homes Obligated Group), Series 2019-B, 5.00% 7/1/2027 | 400 | 413 | |
Housing and Community Dev. Auth., Single Family Mortgage Rev. Bonds, Series 2020-A, 3.75% 1/1/2049 | 880 | 870 | |
Housing and Community Dev. Auth., Single Family Mortgage Rev. Bonds, Series 2023-A-1, 5.75% 7/1/2053 | 415 | 437 | |
City of Valparaiso, Exempt Facs. Rev. Ref. Bonds (Pratt Paper (IN), LLC Project), Series 2024, AMT, 4.50% 1/1/20341 | 1,060 | 1,093 | |
City of Whiting, Environmental Facs. Rev. Bonds (BP Products North America, Inc. Project), Series 2015, AMT, 4.40% 11/1/2045 (put 6/10/2031) | 2,750 | 2,759 | |
City of Whiting, Environmental Facs. Rev. Bonds (BP Products North America, Inc. Project), Series 2016-A, AMT, 4.40% 3/1/2046 (put 6/10/2031) | 250 | 251 | |
City of Whiting, Environmental Facs. Rev. Ref. Bonds (BP Products North America, Inc. Project), Series 2019-A, AMT, 5.00% 12/1/2044 (put 6/15/2026) | 500 | 510 | |
11,778 | |||
Capital Group Fixed Income ETF Trust | 46 |
Capital Group Municipal Income ETF (continued)
Bonds, notes & other debt instruments (continued) | Principal amount (000) | Value (000) | |
Iowa 0.85% | |||
Fin. Auth., Midwestern Disaster Area Rev. Ref. Bonds (Iowa Fertilizer Co. Project), Series 2022, 4.00% 12/1/2050 (put 12/1/2032) | USD 2,000 | $2,098 | |
Fin. Auth., Midwestern Disaster Area Rev. Ref. Bonds (Iowa Fertilizer Co. Project), Series 2022, 5.00% 12/1/2050 (put 12/1/2042) | 1,000 | 1,057 | |
Fin. Auth., Multi Family Housing Rev. Bonds (AHEPA 192-IV Apartments Projects), Series 2023, 5.00% 11/1/2026 (put 11/1/2025) | 650 | 656 | |
PEFA, Inc., Gas Project Rev. Bonds, Series 2019, 5.00% 9/1/2049 (put 9/1/2026) | 1,500 | 1,530 | |
Student Loan Liquidity Corp., Student Loan Rev. Bonds, Series 2023-B, AMT, 5.00% 12/1/2029 | 350 | 364 | |
Tobacco Settlement Auth., Tobacco Settlement Asset-Backed Bonds, Series 2021-A-2, 4.00% 6/1/2038 | 1,000 | 987 | |
6,692 | |||
Kansas 0.07% | |||
Dev. Fin. Auth., Hospital Rev. Bonds (Advent Health Obligated Group), Series 2021-B, 5.00% 11/15/2054 (put 11/15/2028) | 500 | 531 | |
Kentucky 1.25% | |||
City of Ashland, Medical Center Rev. Bonds (Ashland Hospital Corp. - King’s Daughters Medical Center Project), Series 2016-A, 5.00% 2/1/2040 | 500 | 502 | |
City of Henderson, Exempt Facs. Rev. Bonds (Pratt Paper, LLC Project), Series 2022-B, AMT, 3.70% 1/1/20321 | 1,370 | 1,370 | |
Higher Education Student Loan Corp., Student Loan Rev. Bonds, Series 2019-A-1, AMT, 5.00% 6/1/2029 | 500 | 518 | |
Housing Corp., Multi Family Housing Rev. Bonds (Beecher Terrace Phase IV Project), Series 2023, 5.00% 9/1/2043 (put 9/1/2026) | 165 | 168 | |
Housing Corp., Single Family Mortgage Rev. Bonds, Series 2024-A, 6.25% 7/1/2054 | 600 | 664 | |
Housing Corp., Single Family Mortgage Rev. Bonds, Series 2024-C, 6.25% 1/1/2055 | 240 | 263 | |
Public Energy Auth., Gas Supply Rev. Bonds, Series 2019-C-1, 4.00% 2/1/2050 (put 2/1/2028) | 500 | 501 | |
Public Energy Auth., Gas Supply Rev. Bonds, Series 2022-A-1, 4.00% 8/1/2052 (put 8/1/2030) | 500 | 499 | |
Public Energy Auth., Gas Supply Rev. Ref. Bonds, Series 2023-A-1, 5.25% 4/1/2054 (put 2/1/2032) | 2,050 | 2,214 | |
Public Energy Auth., Gas Supply Rev. Ref. Bonds, Series 2024-B, 5.00% 1/1/2055 (put 8/1/2032) | 2,005 | 2,119 | |
County of Trimble, Environmental Facs. Rev. Bonds (Louisville Gas and Electric Co. Project), Series 2023-A, AMT, 4.70% 6/1/2054 (put 6/1/2027)2 | 1,000 | 1,006 | |
9,824 | |||
Louisiana 0.76% | |||
Housing Corp., Multi Family Housing Rev. Bonds (Deerwood Apartments Project), Series 2024, 4.00% 1/1/2043 (put 7/1/2027) | 1,000 | 998 | |
Housing Corp., Single Family Mortgage Rev. Bonds (Home Ownership Program), Series 2023-A, 5.75% 6/1/2054 | 390 | 417 | |
Local Government Environmental Facs. and Community Dev. Auth., Rev. Bonds (Louisiana Insurance Guaranty Assn. Project), Series 2022-B, 5.00% 8/15/2027 | 1,000 | 1,037 | |
Local Government Environmental Facs. and Community Dev. Auth., Rev. Ref. Bonds (East Baton Rouge Sewerage Commission Projects), Series 2023, 5.00% 2/1/2041 | 400 | 432 | |
Local Government Environmental Facs. and Community Dev. Auth., Rev. Ref. Bonds (Entergy Louisiana, LLC Projects), Series 2021-B, 2.50% 4/1/2036 | 1,300 | 1,081 | |
Public Facs. Auth., Hospital Rev. Bonds (Louisiana Children’s Medical Center Project), Series 2015-A-3, 5.00% 6/1/2045 (put 6/1/2028) | 365 | 380 | |
Public Facs. Auth., Solid Waste Disposal Fac. Rev. Bonds (Elementus Materials, LLC Project), Series 2023, AMT, 5.00% 1/1/2043 (put 11/1/2025)1 | 1,135 | 1,143 | |
Public Facs. Auth., Solid Waste Disposal Rev. Bonds (Waste Pro USA, Inc. Project), Series 2023, AMT, 6.75% 10/1/2053 (put 10/1/2028)1 | 500 | 541 | |
6,029 | |||
Maine 0.36% | |||
Fin. Auth., Solid Waste Disposal Rev. Bonds (Casella Waste Systems, Inc. Project), Series 2015-R-2, AMT, 4.375% 8/1/2035 (put 8/1/2025)1 | 1,500 | 1,497 | |
Fin. Auth., Solid Waste Disposal Rev. Bonds (Casella Waste Systems, Inc. Project), Series 2015, AMT, 5.125% 8/1/2035 (put 8/1/2025)1 | 500 | 503 | |
Turnpike Auth., Turnpike Rev. Bonds, Series 2020, 3.00% 7/1/2040 | 1,000 | 854 | |
2,854 | |||
47 | Capital Group Fixed Income ETF Trust |
Capital Group Municipal Income ETF (continued)
Bonds, notes & other debt instruments (continued) | Principal amount (000) | Value (000) | |
Maryland 0.67% | |||
County of Baltimore, Rev. Bonds (Riderwood Village, Inc. Fac.), Series 2020, 4.00% 1/1/2029 | USD 500 | $504 | |
Community Dev. Administration, Dept. of Housing and Community Dev., Residential Rev. Bonds, Series 2021-C, 3.00% 9/1/2051 | 2,365 | 2,286 | |
Community Dev. Administration, Dept. of Housing and Community Dev., Residential Rev. Bonds, Series 2023-A, 5.50% 9/1/2053 | 1,070 | 1,136 | |
County of Montgomery, Rev. Ref. Bonds (Dept. of Liquor Control), Series 2019-A, 4.00% 6/15/2037 | 750 | 762 | |
Dept. of Transportation, Consolidated Transportation Bonds, Series 2021-A, 2.00% 10/1/2034 | 735 | 593 | |
5,281 | |||
Massachusetts 0.99% | |||
Clean Water Trust, Revolving Fund Rev. Ref. Green Bonds, Series 2023-2B, 5.00% 2/1/2040 | 1,000 | 1,132 | |
Dev. Fin. Agcy., Rev. Bonds (Mass General Brigham, Inc.), Series 2020-A-2, 4.00% 7/1/2041 | 1,000 | 977 | |
Dev. Fin. Agcy., Rev. Bonds (Partners Healthcare System Issue), Series 2017-S, 4.00% 7/1/2035 | 500 | 502 | |
Educational Fncg. Auth., Education Loan Rev. Bonds, Series 2019-B, AMT, 5.00% 7/1/2026 | 500 | 510 | |
Educational Fncg. Auth., Education Loan Rev. Bonds, Series 2022-M, AMT, 5.00% 7/1/2027 | 1,000 | 1,029 | |
Educational Fncg. Auth., Education Loan Rev. Bonds, Series 2024-B, AMT, 4.25% 7/1/2032 | 80 | 79 | |
Educational Fncg. Auth., Education Loan Rev. Bonds, Series 2023-B, AMT, 4.25% 7/1/2044 | 235 | 226 | |
Massachusetts Bay Transportation Auth., Sales Tax Rev. Bonds, Series 2021, 4.00% 5/1/2025 | 3,380 | 3,395 | |
7,850 | |||
Michigan 1.87% | |||
Building Auth., Rev. Bonds (Facs. Program), Series 2021-I, 4.00% 10/15/2041 | 500 | 496 | |
City of Detroit, Unlimited Tax G.O. Bonds, Series 2021-A, 5.00% 4/1/2046 | 1,000 | 1,022 | |
Fin. Auth., Hospital Rev. and Rev. Ref. Bonds (Trinity Health Credit Group), Series 2019-A, 5.00% 12/1/2041 | 500 | 522 | |
Fin. Auth., Tobacco Settlement Asset-Backed Bonds, Series 2020-A-1, 5.00% 6/1/2033 | 500 | 542 | |
Fin. Auth., Tobacco Settlement Asset-Backed Bonds, Series 2020-A-1, 4.00% 6/1/2035 | 1,000 | 1,018 | |
Great Lakes Water Auth., Water Supply System Rev. Ref. Bonds, Series 2024-A, 5.00% 7/1/2025 | 3,000 | 3,051 | |
Great Lakes Water Auth., Water Supply System Rev. Ref. Bonds, Series 2016-B, 5.00% 7/1/2046 | 500 | 507 | |
Housing Dev. Auth., Single Family Mortgage Rev. Bonds, Series 2023-A, 5.50% 12/1/2053 | 435 | 461 | |
Housing Dev. Auth., Single Family Mortgage Rev. Bonds, Series 2023-B, 5.75% 6/1/2054 | 1,030 | 1,095 | |
Housing Dev. Auth., Single Family Mortgage Rev. Bonds, Series 2024-A, 6.00% 6/1/2054 | 900 | 973 | |
Roseville Community Schools, G.O. Rev. Ref. Bonds, Series 2015, 5.00% 5/1/2032 (preref. 5/1/2025) | 410 | 416 | |
Strategic Fund, Limited Obligation Rev. Bonds (I-75 Improvement Project), Series 2018, AMT, 5.00% 12/31/2028 | 550 | 566 | |
Strategic Fund, Limited Obligation Rev. Green Bonds (Graphic Packaging International, LLC Coated Recycled Board Machine Project), Series 2021, AMT, 4.00% 10/1/2061 (put 10/1/2026) | 1,250 | 1,252 | |
County of Wayne, Airport Auth., Airport Rev. Ref. Bonds (Detroit Metropolitan Wayne County Airport), Series 2015-F, AMT, 5.00% 12/1/2025 | 2,800 | 2,847 | |
14,768 | |||
Minnesota 0.81% | |||
G.O. Bonds, Various Purpose Rev. Ref. Bonds, Series 2023-D, 5.00% 8/1/2033 | 1,735 | 2,019 | |
Higher Education Supplemental Loan Auth., Rev. Bonds, Series 2023, AMT, 4.00% 11/1/2042 | 850 | 809 | |
Housing Fin. Agcy., Residential Housing Fin. Bonds, Series 2020-E, 1.90% 7/1/2029 | 735 | 637 | |
Housing Fin. Agcy., Residential Housing Fin. Bonds, Series 2020-I, 3.00% 1/1/2051 | 1,590 | 1,543 | |
Housing Fin. Agcy., Residential Housing Fin. Bonds, Series 2021-H, 3.00% 7/1/2052 | 1,390 | 1,344 | |
6,352 | |||
Mississippi 0.05% | |||
Home Corp., Single Family Mortgage Rev. Bonds, Series 2021-B, 3.00% 6/1/2051 | 400 | 386 | |
Missouri 1.12% | |||
Health and Educational Facs. Auth., Health Facs. Rev. Bonds (Bethesda Health Group, Inc.), Series 2021, 4.00% 8/1/2029 | 385 | 371 | |
Health and Educational Facs. Auth., Health Facs. Rev. Bonds (BJC Health System), Series 2021-A, 4.00% 7/1/2035 | 1,315 | 1,358 | |
Housing Dev. Commission, Single Family Mortgage Rev. Bonds (First Place Homeownership Loan Program), Series 2020-C, 3.50% 11/1/2050 | 420 | 412 | |
Capital Group Fixed Income ETF Trust | 48 |
Capital Group Municipal Income ETF (continued)
Bonds, notes & other debt instruments (continued) | Principal amount (000) | Value (000) | |
Missouri (continued) | |||
Housing Dev. Commission, Single Family Mortgage Rev. Bonds (First Place Homeownership Loan Program), Series 2023-B, 5.50% 5/1/2053 | USD 1,210 | $1,286 | |
Housing Dev. Commission, Single Family Mortgage Rev. Bonds (First Place Homeownership Loan Program), Series 2023-E, 6.50% 5/1/2054 | 1,000 | 1,118 | |
Housing Dev. Commission, Single Family Mortgage Rev. Bonds (First Place Homeownership Loan Program), Series 2024-A, 5.75% 5/1/2055 | 1,825 | 1,968 | |
Housing Dev. Commission, Single Family Mortgage Rev. Bonds (First Place Homeownership Loan Program), Series 2024-C, 6.00% 5/1/2055 | 1,300 | 1,426 | |
City of Kansas City, Planned Industrial Expansion Auth., Multi Family Housing Rev. Bonds (The Depot on Old Santa Fe), Series 2023, 5.00% 7/1/2045 (put 7/1/2027) | 750 | 768 | |
City of Lee’s Summit, Industrial Dev. Auth., Senior Living Facs. Rev. Bonds (John Knox Village), Series 2024-B-2, 4.325% 8/15/2047 | 75 | 75 | |
City of Lee’s Summit, Industrial Dev. Auth., Senior Living Facs. Rev. Bonds (John Knox Village), Series 2024-B-1, 4.825% 8/15/2047 | 35 | 35 | |
8,817 | |||
Montana 0.27% | |||
City of Forsyth, Pollution Control Rev. Ref. Bonds (Avista Corp. Colstrip Project), Series 2010-A, 3.875% 10/1/2032 | 1,500 | 1,489 | |
City of Forsyth, Pollution Control Rev. Ref. Bonds (Northwestern Corp. Colstrip Project), Series 2023, 3.875% 7/1/2028 | 650 | 652 | |
2,141 | |||
Nebraska 0.35% | |||
Central Plains Energy Project, Gas Supply Rev. Ref. Bonds, Series 2019, 4.00% 12/1/2049 (put 8/1/2025) | 1,000 | 1,001 | |
Educational, Health, Cultural, and Social Sciences Fin. Auth., Rev. Bonds (Immanuel Retirement Communities Obligated Group), Series 2019-A, 4.00% 1/1/2044 | 1,395 | 1,344 | |
Investment Fin. Auth., Single Family Housing Rev. Bonds, Series 2020-A, 2.35% 9/1/2035 | 500 | 412 | |
2,757 | |||
Nevada 1.73% | |||
Dept. of Business and Industry, Lease Rev. Bonds (Somerset Academy), Series 2018-A, 4.50% 12/15/20291 | 420 | 420 | |
County of Clark, Airport System Rev. Notes, Series 2021-B, AMT, 5.00% 7/1/2024 | 1,000 | 1,000 | |
County of Clark, Airport System Rev. Notes, Series 2021-B, AMT, 5.00% 7/1/2025 | 1,035 | 1,049 | |
County of Clark, Limited Tax G.O. Park Improvement Bonds, Series 2018, 5.00% 12/1/2031 | 600 | 643 | |
County of Clark, Limited Tax G.O. Stadium Improvement Bonds, Series 2018-A, 5.00% 6/1/2033 | 515 | 548 | |
County of Clark, Limited Tax G.O. Stadium Improvement Bonds, Series 2018-A, 5.00% 6/1/2043 | 1,500 | 1,575 | |
Highway Rev. Improvement and Rev. Ref. Bonds (Motor Vehicle Fuel Tax), Series 2016, 5.00% 12/1/2025 | 2,000 | 2,051 | |
City of Las Vegas, Special Improvement Dist. No. 817 (Summerlin Village 29), Local Improvement Bonds, Series 2023, 5.50% 6/1/2038 | 375 | 393 | |
City of Las Vegas, Special Improvement Dist. No. 612 (Skye Hills), Local Improvement Bonds, Series 2020, 3.75% 6/1/2042 | 965 | 763 | |
Las Vegas Convention and Visitors Auth., Convention Center Expansion and Renovation Rev. Bonds, Series 2022-B, 5.00% 7/1/2038 | 1,000 | 1,104 | |
Las Vegas Convention and Visitors Auth., Convention Center Expansion and Renovation Rev. Bonds, Series 2023-A, 5.00% 7/1/2038 | 350 | 391 | |
Las Vegas Valley Water Dist., Limited Tax G.O. Water Bonds, Series 2023-A, 5.00% 6/1/2044 | 1,000 | 1,092 | |
Las Vegas Valley Water Dist., Limited Tax G.O. Water Improvement and Rev. Ref. Bonds, Series 2016-A, 5.00% 6/1/2036 | 1,700 | 1,747 | |
Las Vegas Valley Water Dist., Limited Tax G.O. Water Improvement Bonds, Series 2022-A, 4.00% 6/1/2035 | 500 | 520 | |
City of North Las Vegas, Special Improvement Dist. No. 65 (Northern Beltway Commercial Area), Local Improvement Bonds, Series 2017, 4.00% 12/1/20271 | 400 | 393 | |
13,689 | |||
New Hampshire 1.07% | |||
Health and Education Facs. Auth., Education Loan Rev. Bonds (New Hampshire Higher Education Loan Corp. Issue), Series 2023-B, AMT, 5.00% 11/1/2043 | 510 | 532 | |
Housing Fin. Auth., Single Family Mortgage Rev. Bonds, Series 2023-B, 6.00% 1/1/2055 | 200 | 214 | |
Housing Fin. Auth., Single Family Mortgage Rev. Bonds, Series 2023-C, 6.25% 1/1/2055 | 1,000 | 1,084 | |
National Fin. Auth., Municipal Certs., Series 2020-1, Class A, 4.125% 1/20/2034 | 1,465 | 1,438 | |
49 | Capital Group Fixed Income ETF Trust |
Capital Group Municipal Income ETF (continued)
Bonds, notes & other debt instruments (continued) | Principal amount (000) | Value (000) | |
New Hampshire (continued) | |||
National Fin. Auth., Municipal Certs., Series 2022-2, Class A, 4.00% 10/20/2036 | USD 1,026 | $989 | |
National Fin. Auth., Municipal Certs., Series 2023-2, Class A, 3.875% 1/20/2038 | 1,033 | 974 | |
National Fin. Auth., Municipal Certs., Series 2024-2, Class X, 3.625% 8/20/2039 | 1,599 | 1,488 | |
National Fin. Auth., Municipal Certs., Series 2024-1, Class A, 4.25% 7/20/2041 | 1,087 | 1,065 | |
National Fin. Auth., Specialty Pharmacy Rev. Bonds (University Hospitals Home Care Services, Inc.), Series 2024-A, 5.625% 12/15/20331 | 435 | 445 | |
National Fin. Auth., Specialty Pharmacy Rev. Bonds (University Hospitals Home Care Services, Inc.), Series 2024-A, 6.25% 12/15/20381 | 220 | 227 | |
8,456 | |||
New Jersey 2.57% | |||
Econ. Dev. Auth., Special Fac. Rev. Bonds (Continental Airlines, Inc. Project), Series 1999, AMT, 5.25% 9/15/2029 | 2,000 | 2,002 | |
Educational Facs. Auth., Rev. Bonds (Princeton University), Series 2014-A, 5.00% 7/1/2044 | 1,300 | 1,300 | |
County of Gloucester, Improvement Auth., Rev. Ref. Bonds (Rowan University Project), Series 2017-A, Assured Guaranty Municipal insured, 5.00% 11/1/2028 | 1,750 | 1,809 | |
Health Care Facs. Fncg. Auth., Rev. Ref. Bonds (Hackensack Meridian Health Obligated Group Issue), Series 2017-A, 5.00% 7/1/2032 | 500 | 523 | |
Health Care Facs. Fncg. Auth., Rev. Ref. Bonds (RWJ Barnabas Health Obligated Group Issue), Series 2016-A, 5.00% 7/1/2033 | 610 | 626 | |
Higher Education Student Assistance Auth., Student Loan Rev. Bonds, Series 2019-B, AMT, 3.25% 12/1/2039 | 330 | 307 | |
Higher Education Student Assistance Auth., Student Loan Rev. Ref. Bonds, Series 2023-B, AMT, 4.00% 12/1/2044 | 900 | 859 | |
Higher Education Student Assistance Auth., Student Loan Rev. Ref. Bonds, Series 2024-B, AMT, 4.25% 12/1/2045 | 595 | 592 | |
Housing and Mortgage Fin. Agcy., Single Family Housing Rev. Bonds, Series 2020-E, 3.50% 4/1/2051 | 385 | 378 | |
Housing and Mortgage Fin. Agcy., Single Family Housing Rev. Bonds, Series 2020-H, 3.00% 10/1/2052 | 2,355 | 2,258 | |
Housing and Mortgage Fin. Agcy., Single Family Housing Rev. Bonds, Series 2023-J, 5.50% 4/1/2053 | 995 | 1,055 | |
County of Hudson, Jersey City Municipal Utilities Auth., Sewer Project Notes, Series 2024-B, 5.00% 5/1/2025 | 85 | 86 | |
Transportation Trust Fund Auth., Transportation Program Bonds, Series 2023-AA, 5.00% 6/15/2035 | 600 | 677 | |
Transportation Trust Fund Auth., Transportation Program Bonds, Series 2023-BB, 5.00% 6/15/2037 | 600 | 675 | |
Transportation Trust Fund Auth., Transportation System Bonds, Series 2019-A, 5.00% 12/15/2027 | 500 | 527 | |
Transportation Trust Fund Auth., Transportation System Bonds, Series 2018-A, 5.00% 12/15/2036 | 500 | 526 | |
Transportation Trust Fund Auth., Transportation System Bonds, Capital Appreciation Bonds, Series 2006-C, AMBAC insured, 0% 12/15/2026 | 500 | 457 | |
Transportation Trust Fund Auth., Transportation System Bonds, Capital Appreciation Bonds, Series 2006-C, AMBAC insured, 0% 12/15/2028 | 455 | 387 | |
Transportation Trust Fund Auth., Transportation System Bonds, Capital Appreciation Bonds, Series 2006-C, AMBAC insured, 0% 12/15/2035 | 550 | 356 | |
Turnpike Auth., Turnpike Rev. Bonds, Series 2015-E, 5.00% 1/1/2045 | 4,820 | 4,846 | |
20,246 | |||
New Mexico 0.61% | |||
Aspire Public Improvement Dist., Special Levy Rev. Bonds, Series 2024, 5.05% 10/1/2044 | 550 | 549 | |
City of Farmington, Pollution Control Rev. Ref. Bonds (Public Service Co. of San Juan and Four Corners Projects), Series 2016-B, 2.15% 4/1/2033 | 1,750 | 1,403 | |
City of Farmington, Pollution Control Rev. Ref. Bonds (Public Service Co. of San Juan Project), Series 2010-C, 3.875% 6/1/2040 (put 6/1/2029) | 450 | 453 | |
Hospital Equipment Loan Council, Hospital System Rev. Bonds (Presbyterian Healthcare Services), Series 2017-A, 4.00% 8/1/2037 | 815 | 817 | |
Mortgage Fin. Auth., Single Family Mortgage Program Bonds, Series 2020-A, Class I, 3.50% 1/1/2051 | 1,630 | 1,600 | |
4,822 | |||
New York 7.61% | |||
City of Albany Capital Resource Corp., Rev. Bonds (Kipp Capital Region Public Charter Schools Project), Series 2024, 4.50% 6/1/2044 | 400 | 392 | |
Brooklyn Arena Local Dev. Corp., PILOT Rev. Ref. Bonds (Barclays Center), Series 2016-A, 5.00% 7/15/2042 | 500 | 508 | |
Build NYC Resource Corp., Rev. Bonds (East Harlem Scholars Academy Charter School Project), Series 2022, 5.00% 6/1/20321 | 250 | 264 | |
Capital Group Fixed Income ETF Trust | 50 |
Capital Group Municipal Income ETF (continued)
Bonds, notes & other debt instruments (continued) | Principal amount (000) | Value (000) | |
New York (continued) | |||
Build NYC Resource Corp., Rev. Ref. Bonds (Albert Einstein School of Medicine, Inc. Project), Series 2015, 5.50% 9/1/20451 | USD 500 | $502 | |
Dormitory Auth., State Personal Income Tax Rev. Bonds (General Purpose), Series 2020-A, 4.00% 3/15/2037 | 1,000 | 1,015 | |
Dormitory Auth., State Personal Income Tax Rev. Bonds (General Purpose), Series 2024-A, 5.00% 3/15/2040 | 250 | 283 | |
Dormitory Auth., State Personal Income Tax Rev. Bonds (General Purpose), Series 2021-E, 4.00% 3/15/2042 | 1,110 | 1,095 | |
Dormitory Auth., State Personal Income Tax Rev. Bonds (General Purpose), Series 2021-A, 5.00% 3/15/2044 | 1,000 | 1,080 | |
Dormitory Auth., State Sales Tax Rev. Bonds, Series 2018-E, 5.00% 3/15/2039 | 755 | 793 | |
Energy Research and Dev. Auth., Pollution Control Rev. Bonds (New York State Electric & Gas Corp. Project), Series 2004-C, 4.00% 4/1/2034 | 120 | 120 | |
Environmental Facs. Corp., Solid Waste Disposal Rev. Bonds (Casella Waste Systems, Inc. Project), Series 2014-R-2, AMT, 3.125% 12/1/2044 (put 6/1/2026)1 | 500 | 487 | |
Environmental Facs. Corp., Solid Waste Disposal Rev. Bonds (Casella Waste Systems, Inc. Project), Series 2022-R-2, AMT, 5.125% 9/1/2050 (put 9/3/2030)1 | 500 | 518 | |
Housing Fin. Agcy., Affordable Housing Rev. Green Bonds, Series 2023-A-2, 3.60% 11/1/2062 (put 5/1/2027) | 720 | 720 | |
Liberty Dev. Corp., Liberty Rev. Ref. Bonds, Series 2021-WTC-1, 4.00% 2/15/2043 | 1,000 | 977 | |
Liberty Dev. Corp., Liberty Rev. Ref. Green Bonds (4 World Trade Center Project), Series 2021-A, 2.875% 11/15/2046 | 995 | 730 | |
Metropolitan Transportation Auth., Transportation Rev. Ref. Bonds, Series 2017-D, 5.00% 11/15/2035 | 600 | 630 | |
Metropolitan Transportation Auth., Transportation Rev. Ref. Green Bonds, Series 2017-C-1, 5.00% 11/15/2028 | 805 | 853 | |
County of Monroe, Industrial Dev. Agcy., Multi Family Housing Rev. Bonds (Andrews Terrace Community Partners, L.P. Project), Series 2023-B-1, 5.00% 7/1/2028 (put 7/1/2026) | 1,175 | 1,206 | |
Mortgage Agcy., Homeowner Mortgage Rev. Bonds, Series 213, 4.25% 10/1/2047 | 325 | 325 | |
New York City G.O. Bonds, Series 2023-F-1, 5.00% 8/1/2025 | 110 | 112 | |
New York City G.O. Bonds, Series 2009-B-3, 5.00% 9/1/2027 | 4,000 | 4,228 | |
New York City G.O. Bonds, Series 2023-1, 5.00% 8/1/2036 | 565 | 646 | |
New York City G.O. Bonds, Series 2024-C, 5.00% 3/1/2042 | 1,005 | 1,121 | |
New York City Health and Hospitals Corp., Health System Bonds, Series 2020-A, 3.00% 2/15/2026 | 1,440 | 1,432 | |
New York City Housing Dev. Corp., Multi Family Housing Rev. Bonds (Sustainable Dev. Bonds), Series 2020-A-1-B, 2.05% 11/1/2031 | 530 | 440 | |
New York City Housing Dev. Corp., Multi Family Housing Rev. Green Bonds (Sustainable Dev. Bonds), Series 2021-F-1, 2.40% 11/1/2046 | 500 | 344 | |
New York City Industrial Dev. Agcy., PILOT Rev. Ref. Bonds (Queens Baseball Stadium Project), Series 2021-A, Assured Guaranty Municipal insured, 2.00% 1/1/2038 | 2,375 | 1,770 | |
New York City Municipal Water Fin. Auth., Water and Sewer System Second General Resolution Rev. Bonds, Series 2020-CC-1, 4.00% 6/15/2037 | 750 | 757 | |
New York City Municipal Water Fin. Auth., Water and Sewer System Second General Resolution Rev. Bonds, Series 2020-DD-3, 4.00% 6/15/2042 | 1,170 | 1,168 | |
New York City Transitional Fin. Auth., Future Tax Secured Bonds, Series 2015-E-1, 5.00% 2/1/2030 | 500 | 504 | |
New York City Transitional Fin. Auth., Future Tax Secured Bonds, Series 2016-B-1, 5.00% 11/1/2034 | 500 | 509 | |
New York City Transitional Fin. Auth., Future Tax Secured Bonds, Series 2021-C-1, 4.00% 5/1/2035 | 500 | 516 | |
New York City Transitional Fin. Auth., Future Tax Secured Bonds, Series 2024-D, 5.00% 11/1/2038 | 1,000 | 1,143 | |
New York City Transitional Fin. Auth., Future Tax Secured Bonds, Fiscal 2020, Series 2020-A-2, 5.00% 5/1/2039 | 530 | 564 | |
Oneida Indian Nation, Tax Rev. Bonds, Series 2024-B, 6.00% 9/1/20431 | 465 | 510 | |
Port Auth., Consolidated Bonds, Series 227, AMT, 3.00% 10/1/2028 | 1,000 | 952 | |
Port Auth., Consolidated Bonds, Series 221, AMT, 4.00% 7/15/2038 | 900 | 891 | |
Port Auth., Consolidated Bonds, Series 221, AMT, 4.00% 7/15/2039 | 1,120 | 1,106 | |
County of Rockland, Industrial Dev. Agcy., Multi Family Housing Rev. Bonds (Rockland Gardens Project), Series 2023, 4.65% 5/1/2027 (put 5/1/2025) | 600 | 601 | |
Suffolk Regional Off-Track Betting Corp., Rev. Bonds, Series 2024, 5.75% 12/1/2044 | 1,000 | 1,043 | |
Sullivan County Infrastructure Local Dev. Corp., Rev. Bonds (Adelaar Infrastructure Project), Series 2016-A-1, 4.85% 11/1/20311 | 1,000 | 1,006 | |
Thruway Auth., General Rev. Bonds, Series 2021-O, 4.00% 1/1/2040 | 1,000 | 1,005 | |
Thruway Auth., Personal Income Tax Rev. Bonds, Series 2021-A-1, 5.00% 3/15/2025 (escrowed to maturity) | 1,000 | 1,012 | |
Thruway Auth., Personal Income Tax Rev. Bonds, Series 2021-A-1, 5.00% 3/15/2029 | 500 | 541 | |
Thruway Auth., Personal Income Tax Rev. Bonds, Series 2021-A-1, 4.00% 3/15/2036 | 1,125 | 1,161 | |
Thruway Auth., Personal Income Tax Rev. Bonds, Series 2022-A-1, 5.00% 3/15/2041 | 1,010 | 1,124 | |
Thruway Auth., Personal Income Tax Rev. Bonds, Series 2021-A-1, 3.00% 3/15/2048 | 500 | 399 | |
Transportation Dev. Corp., Special Fac. Rev. Bonds (American Airlines, Inc. John F. Kennedy International Airport Project), Series 2021, AMT, 2.25% 8/1/2026 | 820 | 800 | |
Transportation Dev. Corp., Special Fac. Rev. Bonds (Terminal Four John F. Kennedy International Airport Project), Series 2020-A, AMT, 5.00% 12/1/2024 | 1,250 | 1,254 | |
Transportation Dev. Corp., Special Fac. Rev. Bonds (Terminal Four John F. Kennedy International Airport Project), Series 2020-C, 5.00% 12/1/2034 | 500 | 543 | |
51 | Capital Group Fixed Income ETF Trust |
Capital Group Municipal Income ETF (continued)
Bonds, notes & other debt instruments (continued) | Principal amount (000) | Value (000) | |
New York (continued) | |||
Transportation Dev. Corp., Special Fac. Rev. Bonds (Terminal Four John F. Kennedy International Airport Project), Series 2022, AMT, 5.00% 12/1/2041 | USD 750 | $786 | |
Transportation Dev. Corp., Special Fac. Rev. Ref. Bonds (American Airlines, Inc. John F. Kennedy International Airport Project), Series 2016, AMT, 5.00% 8/1/2026 | 385 | 385 | |
Transportation Dev. Corp., Special Facs. Rev. Bonds (Delta Air Lines, Inc. LaGuardia Airport Terminals C & D Redev. Project), Series 2018, AMT, 5.00% 1/1/2029 | 500 | 519 | |
Transportation Dev. Corp., Special Facs. Rev. Bonds (Delta Air Lines, Inc. LaGuardia Airport Terminals C & D Redev. Project), Series 2020, AMT, 4.00% 10/1/2030 | 1,500 | 1,504 | |
Transportation Dev. Corp., Special Facs. Rev. Bonds (Delta Air Lines, Inc. LaGuardia Airport Terminals C & D Redev. Project), Series 2018, AMT, 5.00% 1/1/2033 | 1,500 | 1,548 | |
Transportation Dev. Corp., Special Facs. Rev. Bonds (Delta Air Lines, Inc. LaGuardia Airport Terminals C & D Redev. Project), Series 2023, AMT, 6.00% 4/1/2035 | 2,000 | 2,262 | |
Transportation Dev. Corp., Special Facs. Rev. Bonds (Delta Air Lines, Inc. LaGuardia Airport Terminals C & D Redev. Project), Series 2020, AMT, 5.00% 10/1/2040 | 500 | 520 | |
Transportation Dev. Corp., Special Facs. Rev. Bonds (Delta Air Lines, Inc. LaGuardia Airport Terminals C & D Redev. Project), Series 2020, AMT, 4.375% 10/1/2045 | 1,500 | 1,471 | |
Transportation Dev. Corp., Special Facs. Rev. Green Bonds (John. F. Kennedy International Airport New Terminal One Project), Series 2023, AMT, Assured Guaranty Municipal insured, 5.50% 6/30/2042 | 1,000 | 1,089 | |
Transportation Dev. Corp., Special Facs. Rev. Green Bonds (John. F. Kennedy International Airport New Terminal One Project), Series 2024, AMT, 5.25% 6/30/2044 | 1,000 | 1,064 | |
Triborough Bridge and Tunnel Auth., General Rev. Bonds (MTA Bridges and Tunnels), Series 2023-B-1, 5.00% 11/15/2040 | 1,000 | 1,125 | |
Triborough Bridge and Tunnel Auth., Payroll Mobility Tax Anticipation Notes (MTA Bridges and Tunnels), Series 2022-A, 5.00% 8/15/2024 (escrowed to maturity) | 400 | 401 | |
Triborough Bridge and Tunnel Auth., Payroll Mobility Tax Anticipation Notes (MTA Bridges and Tunnels), Series 2022-A, 5.00% 8/15/2024 | 325 | 326 | |
Triborough Bridge and Tunnel Auth., Payroll Mobility Tax Rev. Ref. Green Bonds (MTA Bridges and Tunnels), Series 2023-A, 5.00% 11/15/2034 | 550 | 629 | |
Triborough Bridge and Tunnel Auth., Payroll Mobility Tax Rev. Ref. Green Bonds (MTA Bridges and Tunnels), Series 2024-B, 5.00% 11/15/2043 (put 11/15/2025) | 850 | 869 | |
Urban Dev. Corp., State Personal Income Tax Rev. Bonds (General Purpose), Series 2020-C, 4.00% 3/15/2037 | 1,000 | 1,016 | |
Urban Dev. Corp., State Personal Income Tax Rev. Bonds (General Purpose), Series 2020-E, 4.00% 3/15/2038 | 1,500 | 1,516 | |
Urban Dev. Corp., State Personal Income Tax Rev. Bonds (General Purpose), Series 2020-E, 3.00% 3/15/2047 | 500 | 395 | |
Utility Debt Securitization Auth., Restructuring Bonds, Series 2023-TE-1, 5.00% 12/15/2041 | 840 | 966 | |
60,091 | |||
North Carolina 0.82% | |||
City of Charlotte, Charlotte Douglas International Airport, Airport Rev. Bonds, Series 2019-B, AMT, 5.00% 7/1/2030 | 500 | 531 | |
City of Charlotte, Charlotte Douglas International Airport, Airport Rev. Bonds, Series 2023-A, AMT, 5.00% 7/1/2048 | 500 | 545 | |
Educational Assistance Auth., Student Loan Rev. Bonds, Series 2023-A, AMT, 5.00% 6/1/2043 | 125 | 125 | |
Housing Fin. Agcy., Home Ownership Rev. Bonds, Series 50, 5.50% 1/1/2054 | 700 | 742 | |
Housing Fin. Agcy., Home Ownership Rev. Bonds (1998 Trust Agreement), Series 53-A, 6.25% 1/1/2055 | 550 | 599 | |
Housing Fin. Agcy., Home Ownership Rev. Bonds (1998 Trust Agreement), Series 54-A, 6.25% 1/1/2055 | 560 | 623 | |
Housing Fin. Agcy., Home Ownership Rev. Ref. Bonds, Series 42, 4.00% 1/1/2050 | 615 | 611 | |
Medical Care Commission, Retirement Facs. First Mortgage Rev. Bonds (The United Methodist Retirement Homes Project), Series 2024-A, 5.00% 10/1/2039 | 500 | 532 | |
Town of Morehead City, Multi Family Housing Rev. Bonds (Elijah’s Landing), Series 2024, 4.05% 1/1/2028 (put 1/1/2027) | 1,360 | 1,358 | |
Raleigh-Durham Airport Auth., Airport Rev. Ref. Bonds, Series 2020-A, AMT, 5.00% 5/1/2025 | 515 | 520 | |
Turnpike Auth., Triangle Expressway System, Appropriation Rev. Bonds, Capital Appreciation Bonds, Series 2019, 0% 1/1/2043 | 560 | 251 | |
6,437 | |||
Capital Group Fixed Income ETF Trust | 52 |
Capital Group Municipal Income ETF (continued)
Bonds, notes & other debt instruments (continued) | Principal amount (000) | Value (000) | |
North Dakota 0.36% | |||
County of Cass, Joint Water Resource Dist., Temporary Rev. Ref. Improvement Bonds, Series 2024-A, 3.45% 4/1/2027 | USD 300 | $300 | |
Housing Fin. Agcy., Housing Fin. Program Bonds (Home Mortgage Fin. Program), Series 2021-A, 3.00% 1/1/2052 | 1,255 | 1,216 | |
Housing Fin. Agcy., Housing Fin. Program Bonds (Home Mortgage Fin. Program), Series 2023-A, 5.75% 7/1/2053 | 695 | 733 | |
Housing Fin. Agcy., Housing Fin. Program Bonds (Home Mortgage Fin. Program), Series 2023-D, 5.75% 1/1/2054 | 115 | 122 | |
County of Ward, Health Care Facs. Rev. Bonds (Trinity Obligated Group), Series 2017-C, 5.00% 6/1/2038 | 500 | 496 | |
2,867 | |||
Ohio 1.99% | |||
Air Quality Dev. Auth., Air Quality Dev. Rev. Ref. Bonds (Duke Energy Corp. Project), Series 2022-B, AMT, 4.25% 11/1/2039 (put 6/1/2027) | 940 | 946 | |
Air Quality Dev. Auth., Air Quality Rev. Ref. Bonds (American Electric Co. Project), Series 2007-B, AMT, 2.50% 11/1/2042 (put 10/1/2029) | 1,000 | 883 | |
Air Quality Dev. Auth., Air Quality Rev. Ref. Bonds (Ohio Valley Electric Corp. Project), Series 2019-A, 3.25% 9/1/2029 | 500 | 481 | |
Air Quality Dev. Auth., Exempt Facs. Rev. Bonds (Pratt Paper (OH), LLC Project), Series 2017, AMT, 3.75% 1/15/20281 | 555 | 555 | |
Air Quality Dev. Auth., Exempt Facs. Rev. Bonds (Pratt Paper (OH), LLC Project), Series 2017, AMT, 4.25% 1/15/20381 | 1,500 | 1,507 | |
Buckeye Tobacco Settlement Fncg. Auth., Tobacco Settlement Asset-Backed Rev. Ref. Bonds, Series 2020-A-2, Class 1, 5.00% 6/1/2033 | 750 | 806 | |
Cleveland-Cuyahoga Port Auth., Tax Increment Fncg. Rev. and Rev. Ref. Bonds (Flats East Bank Project), Series 2021-A, 4.00% 12/1/20551 | 250 | 207 | |
Columbus-Franklin County Fin. Auth., Multi Family Housing Rev. Bonds (Dering Family Homes Project), Series 2023, 5.00% 7/1/2045 (put 2/1/2027) | 800 | 815 | |
County of Cuyahoga, Metropolitan Housing Auth., Multi Family Housing Rev. Bonds (Wade Park Apartments), Series 2022, 4.75% 12/1/2027 (put 12/1/2025) | 460 | 463 | |
County of Franklin, Hospital Facs. Rev. Ref. Bonds (Nationwide Children’s Hospital), Series 2016-C, 5.00% 11/1/2031 | 540 | 603 | |
County of Franklin, Hospital Facs. Rev. Ref. Bonds (Nationwide Children’s Hospital), Series 2016-C, 4.00% 11/1/2040 | 1,000 | 986 | |
Hospital Rev. Bonds (Aultman Health Foundation), Series 2018, 5.00% 12/1/20331 | 420 | 411 | |
Hospital Rev. Bonds (Aultman Health Foundation), Series 2018, 5.00% 12/1/20381 | 250 | 240 | |
Hospital Rev. Ref. Bonds (Cleveland Clinic Health System Obligated Group), Series 2017-A, 3.25% 1/1/2035 | 1,000 | 938 | |
Housing Fin. Agcy., Multi Family Housing Rev. Bonds (Robert Cassidy Manor Project), Series 2023, 5.00% 4/1/2026 (put 4/1/2025) | 475 | 478 | |
Housing Fin. Agcy., Residential Mortgage Rev. Bonds (Mortgage-Backed Securities Program), Series 2023-A, 5.50% 3/1/2053 | 990 | 1,038 | |
Housing Fin. Agcy., Residential Mortgage Rev. Bonds (Mortgage-Backed Securities Program), Series 2024-A, 6.25% 3/1/2055 | 750 | 819 | |
Ohio State University, General Receipts Green Bonds (Multiyear Debt Issuance Program II), Series 2023-B, 5.00% 12/1/2034 | 1,250 | 1,438 | |
Private Activity Bonds (Portsmouth Bypass Project), Series 2015, AMT, 5.00% 12/31/2025 | 1,300 | 1,310 | |
County of Warren, Healthcare Facs., Rev. Ref. Bonds (Otterbein Homes Obligated Group), Series 2019-A, 5.00% 7/1/2027 | 740 | 763 | |
15,687 | |||
53 | Capital Group Fixed Income ETF Trust |
Capital Group Municipal Income ETF (continued)
Bonds, notes & other debt instruments (continued) | Principal amount (000) | Value (000) | |
Oklahoma 0.85% | |||
Housing Fin. Agcy., Single Family Mortgage Rev. Bonds (Homeownership Loan Program), Series 2023-C, 6.00% 3/1/2054 | USD 775 | $845 | |
Housing Fin. Agcy., Single Family Mortgage Rev. Bonds (Homeownership Loan Program), Series 2024-A, 6.00% 9/1/2054 | 750 | 821 | |
Oklahoma City Water Utilities Trust, Water and Sewer System Rev. Ref. Bonds, Series 2016, 4.00% 7/1/2042 (preref. 7/1/2026) | 2,000 | 2,033 | |
Oklahoma City Water Utilities Trust, Water and Sewer System Rev. Ref. Bonds, Series 2016, 4.00% 7/1/2046 (preref. 7/1/2026) | 2,000 | 2,033 | |
Trustees of the Tulsa Municipal Airport Trust, Rev. Ref. Bonds, Series 2015, AMT, 5.00% 6/1/2035 (put 6/1/2025) | 1,000 | 1,009 | |
6,741 | |||
Oregon 1.13% | |||
Dept. of Administrative Services, State Lottery Rev. Ref. Bonds, Series 2024-A, 5.00% 4/1/2025 | 1,215 | 1,230 | |
G.O. Bonds, Series 2021-A, 5.00% 5/1/2026 | 1,050 | 1,084 | |
G.O. Bonds (Article XI-Q State Projects), Series 2023-A, 5.00% 5/1/2034 | 500 | 578 | |
G.O. Bonds (Higher Education), Series 2015-O, 5.00% 8/1/2030 (preref. 8/1/2025) | 1,820 | 1,855 | |
G.O. Bonds (Veteran’s Welfare Bonds Series 111), Series 2023-E, 5.50% 12/1/2053 | 255 | 270 | |
Port of Portland, Portland International Airport Rev. Bonds, Series 22, AMT, 5.00% 7/1/2044 | 2,000 | 2,000 | |
Dept. of Transportation, Highway User Tax Rev. Ref. Bonds, Series 2024-A, 5.00% 11/15/2031 | 1,705 | 1,928 | |
8,945 | |||
Pennsylvania 3.64% | |||
County of Allegheny, Hospital Dev. Auth., Rev. Bonds, (University of Pittsburgh Medical Center Issue), Series 2019-A, 4.00% 7/15/2038 | 1,000 | 984 | |
County of Allegheny, Hospital Dev. Auth., UPMC Rev. Bonds, Series 2019-A, 4.00% 7/15/2037 | 3,270 | 3,228 | |
City of Allentown, Neighborhood Improvement Zone Dev. Auth., Tax Rev. Bonds (City Center Project), Series 2024, 5.00% 5/1/20421 | 450 | 456 | |
City of Allentown, Neighborhood Improvement Zone Dev. Auth., Tax Rev. Bonds (City Center Ref. Project), Series 2017, 5.00% 5/1/20421 | 500 | 502 | |
County of Chester, Industrial Dev. Auth., Rev. Notes (Avon Grove Charter School Project), Series 2024, 5.00% 3/1/2027 | 345 | 348 | |
City of Doylestown, Hospital Auth., Rev. Bonds (Doylestown Hospital), Series 2024, 5.375% 7/1/20391 | 110 | 114 | |
Econ Dev. Fncg. Auth., Rev. Bonds (Presbyterian Senior Living Project), Series 2023-B-2, 5.00% 7/1/2038 | 800 | 853 | |
Econ. Dev. Fncg. Auth., Exempt Facs. Rev. Ref. Bonds (PPL Energy Supply, LLC Project), Series 2009-C, 5.25% 12/1/2037 (put 6/1/2027) | 500 | 505 | |
Econ. Dev. Fncg. Auth., Exempt Facs. Rev. Ref. Bonds (PPL Energy Supply, LLC Project), Series 2009-B, 5.25% 12/1/2038 (put 6/1/2027) | 210 | 212 | |
Econ. Dev. Fncg. Auth., Private Activity Rev. Bonds (The Penndot Major Bridges Package One Project), Series 2022, AMT, 5.00% 12/31/2030 | 700 | 743 | |
Econ. Dev. Fncg. Auth., Private Activity Rev. Bonds (The Penndot Major Bridges Package One Project), Series 2022, AMT, 5.25% 6/30/2035 | 1,000 | 1,096 | |
Econ. Dev. Fncg. Auth., Private Activity Rev. Bonds (The Pennsylvania Rapid Bridge Replacement Project), Series 2015, AMT, 5.00% 12/31/2034 | 500 | 506 | |
Econ. Dev. Fncg. Auth., Solid Waste Disposal Rev. Bonds (Waste Management, Inc. Project), Series 2021-A-2, AMT, 4.60% 10/1/2046 (put 10/1/2026) | 1,000 | 1,015 | |
Econ. Dev. Fncg. Auth., UPMC Rev. Bonds, Series 2020-A, 4.00% 4/15/2039 | 500 | 499 | |
Erie County School Dist., Limited Tax G.O. Bonds, Series 2019-A, Assured Guaranty Municipal insured, 5.00% 4/1/2031 | 525 | 558 | |
G.O. Bonds, Series 2016, Assured Guaranty Municipal insured, 5.00% 9/15/2026 | 560 | 583 | |
Higher Education Assistance Agcy., Education Loan Rev. Bonds, Series 2023-B, AMT, 4.00% 6/1/2044 | 310 | 297 | |
Higher Education Assistance Agcy., Education Loan Rev. Bonds, Series 2024-1A, AMT, 4.125% 6/1/2045 | 330 | 317 | |
Higher Educational Facs. Auth., Health System Rev. Bonds (University of Pennsylvania Health System), Series 2015, 5.00% 8/15/2026 | 500 | 508 | |
Housing Fin. Agcy., Single Family Mortgage Rev. Bonds, Series 2017-125-B, 3.65% 10/1/2042 | 1,000 | 924 | |
Housing Fin. Agcy., Single Family Mortgage Rev. Bonds, Series 2021-137, 3.00% 10/1/2051 | 1,010 | 966 | |
Housing Fin. Agcy., Single Family Mortgage Rev. Bonds, Series 2023-141-A, 5.75% 10/1/2053 | 770 | 813 | |
Housing Fin. Agcy., Single Family Mortgage Rev. Bonds, Series 2024-144A, 6.00% 10/1/2054 | 800 | 865 | |
County of Lancaster, Hospital Auth., Health Center Rev. Bonds (Masonic Villages Project), Series 2023, 5.125% 11/1/2038 | 360 | 389 | |
Capital Group Fixed Income ETF Trust | 54 |
Capital Group Municipal Income ETF (continued)
Bonds, notes & other debt instruments (continued) | Principal amount (000) | Value (000) | |
Pennsylvania (continued) | |||
County of Monroe, Lease Rental Rev. Bonds (Centurion Foundation Lehigh Valley), Series 2024-A, 5.10% 6/15/20393 | USD 4,890 | $4,875 | |
County of Montgomery, Industrial Dev. Auth., Exempt Facs. Rev. Ref. Bonds (Constellation Energy Generation, LLC Project), Series 2023-C, 4.10% 6/1/2029 | 600 | 616 | |
City of Philadelphia, Industrial Dev. Auth., Hospital Rev. Bonds (The Children’s Hospital of Philadelphia Project), Series 2017, 5.00% 7/1/2034 | 980 | 1,019 | |
Philadelphia School Dist., G.O. Bonds, Series 2019-A, National insured,5.00% 9/1/2026 | 500 | 517 | |
Philadelphia School Dist., G.O. Bonds, Series 2016-F, 5.00% 9/1/2028 | 250 | 257 | |
Philadelphia School Dist., G.O. Green Bonds, Series 2023-B, 5.25% 9/1/2038 | 1,000 | 1,130 | |
Turnpike Commission, Turnpike Rev. Bonds, Series 2019-A, 5.00% 12/1/2027 | 500 | 529 | |
Turnpike Commission, Turnpike Rev. Bonds, Series 2014-C, 5.00% 12/1/2034 | 2,000 | 2,010 | |
County of Westmoreland, Industrial Dev. Auth., Health System Rev. Bonds (Excela Health Project), Series 2020-A, 4.00% 7/1/2026 | 500 | 497 | |
28,731 | |||
Puerto Rico 2.15% | |||
Aqueduct and Sewer Auth., Rev. Ref. Bonds, Series 2021-B, 5.00% 7/1/20331 | 500 | 528 | |
Aqueduct and Sewer Auth., Rev. Ref. Bonds, Series 2020-A, 5.00% 7/1/20351 | 2,500 | 2,616 | |
Aqueduct and Sewer Auth., Rev. Ref. Bonds, Series 2022-A, 5.00% 7/1/20371 | 1,000 | 1,050 | |
Aqueduct and Sewer Auth., Rev. Ref. Bonds, Series 2021-B, 4.00% 7/1/20421 | 500 | 470 | |
Electric Power Auth., Power Rev. Ref. Bonds, Series 2007-UU, Assured Guaranty Municipal insured, (3-month USD CME Term SOFR x 0.67 + 0.52%) 4.247% 7/1/20294 | 500 | 489 | |
G.O. Restructured Bonds, Series 2022-A-1, 4.00% 7/1/2033 | 1,500 | 1,506 | |
G.O. Restructured Bonds, Series 2022-A-1, 4.00% 7/1/2037 | 1,500 | 1,448 | |
G.O. Restructured Bonds, Series 2022-A-1, 4.00% 7/1/2046 | 1,000 | 909 | |
G.O. Taxable Bonds, Capital Appreciation Bonds, Series 2022, 0% 11/1/2051 | 5,560 | 3,510 | |
Housing Fin. Auth., Collateralized Multi Family Housing Rev. Bonds (Mirador Las Casas Project), Series 2023-B, 5.00% 3/1/2027 (put 3/1/2026) | 125 | 128 | |
Industrial, Tourist, Educational, Medical and Environmental Control Facs. Fncg. Auth., Hospital Rev. and Rev. Ref. Bonds (Hospital Auxilio Mutuo Obligated Group Project), Series 2021, 5.00% 2033 | 435 | 460 | |
Industrial, Tourist, Educational, Medical and Environmental Control Facs. Fncg. Auth., Hospital Rev. and Rev. Ref. Bonds (Hospital Auxilio Mutuo Obligated Group Project), Series 2021, 4.00% 7/1/2041 | 455 | 420 | |
Sales Tax Fncg. Corp., Sales Tax Rev. Restructured Bonds, Series 2019-A-2, 4.329% 7/1/2040 | 2,500 | 2,475 | |
Sales Tax Fncg. Corp., Sales Tax Rev. Restructured Bonds, Series 2019-A-2, 4.329% 7/1/2040 | 500 | 495 | |
Sales Tax Fncg. Corp., Sales Tax Rev. Restructured Bonds, Capital Appreciation Bonds, Series 2018-A-1, 0% 7/1/2046 | 1,500 | 485 | |
16,989 | |||
Rhode Island 0.31% | |||
Student Loan Auth., Education Loan Rev. Bonds, Series 2022-A, AMT, 4.125% 12/1/2041 | 1,035 | 995 | |
Student Loan Auth., Education Loan Rev. Bonds, Series 2024-A, AMT, 4.125% 12/1/2043 | 400 | 386 | |
Student Loan Auth., Student Loan Program Rev. Bonds, Series 2020-A, AMT, 3.625% 12/1/2037 | 610 | 574 | |
Tobacco Settlement Fin. Corp., Tobacco Settlement Asset-Backed Bonds, Series 2015-A, 5.00% 6/1/2026 | 500 | 505 | |
2,460 | |||
South Carolina 2.05% | |||
County of Dorchester, Summers Corner Improvement Dist., Assessment Rev. Bonds, Series 2023, 4.50% 10/1/2033 | 210 | 207 | |
City of Greenville, Housing Auth., Multi Family Housing Rev. Bonds (Cherokee Landing Apartments Project) Series 2023, 5.00% 7/1/2027 (put 7/1/2026) | 800 | 814 | |
Jobs-Econ. Dev. Auth., Environmental Improvement Rev. Ref. Bonds (International Paper Company Project), Series 2023-A, AMT, 4.00% 4/1/2033 (put 4/1/2026) | 500 | 501 | |
Jobs-Econ. Dev. Auth., Health Care Facs. Rev. Bonds (Novant Health Obligated Group), Series 2024-A, 5.50% 11/1/2045 | 2,000 | 2,269 | |
Patriots Energy Group Fncg. Agcy., Gas Supply Rev. Bonds, Series 2023-B-1, 5.25% 2/1/2054 (put 3/1/2031) | 1,000 | 1,083 | |
Ports Auth., Rev. Bonds, Series 2015, AMT, 5.25% 7/1/2055 (preref. 7/1/2025) | 1,625 | 1,651 | |
Public Service Auth., Rev. Obligations (Santee Cooper), Series 2014-B, 5.00% 12/1/2038 | 1,750 | 1,750 | |
Public Service Auth., Rev. Obligations (Santee Cooper), Series 2022-A, 5.00% 12/1/2039 | 2,000 | 2,164 | |
Public Service Auth., Rev. Obligations (Santee Cooper), Series 2016-B, 5.00% 12/1/2041 | 1,000 | 1,010 | |
Public Service Auth., Rev. Obligations (Santee Cooper), Series 2014-A, 5.50% 12/1/2054 | 1,000 | 1,000 | |
55 | Capital Group Fixed Income ETF Trust |
Capital Group Municipal Income ETF (continued)
Bonds, notes & other debt instruments (continued) | Principal amount (000) | Value (000) | |
South Carolina (continued) | |||
Public Service Auth., Rev. Ref. Obligations (Santee Cooper), Series 2016-A, 5.00% 12/1/2029 | USD 500 | $510 | |
Public Service Auth., Rev. Ref. Obligations (Santee Cooper), Series 2016-A, 5.00% 12/1/2033 | 500 | 507 | |
Public Service Auth., Rev. Ref. Obligations (Santee Cooper), Series 2016-A, 5.00% 12/1/2038 | 1,465 | 1,481 | |
Spartanburg Regional Health Services Dist., Hospital Rev. Ref. Bonds, Series 2022, 5.00% 4/15/2030 | 1,140 | 1,238 | |
16,185 | |||
South Dakota 0.42% | |||
Housing Dev. Auth., Homeownership Mortgage Bonds, Series 2023-G, 6.25% 5/1/2055 | 600 | 652 | |
Housing Dev. Auth., Homeownership Mortgage Bonds, Series 2024-A, 6.25% 5/1/2055 | 2,445 | 2,673 | |
3,325 | |||
Tennessee 1.78% | |||
Housing Dev. Agcy., Residential Fin. Program Bonds, Series 2017-2A, AMT, 4.00% 1/1/2042 | 355 | 351 | |
Housing Dev. Agcy., Residential Fin. Program Bonds, Series 2019-1, 4.25% 1/1/2050 | 1,175 | 1,173 | |
Housing Dev. Agcy., Residential Fin. Program Bonds, Series 2023-3A, 6.25% 1/1/2054 | 3,320 | 3,601 | |
Housing Dev. Agcy., Residential Fin. Program Bonds, Series 2024-2A, 6.00% 1/1/2055 | 135 | 149 | |
County of Knox, Health, Educational and Housing Fac. Board, Student Housing Rev Bonds (Provident Group - UTK Properties, LLC. - University of Tennessee Project), Series 2024-A-1, 5.00% 7/1/2038 | 290 | 320 | |
County of Knox, Health, Educational and Housing Fac. Board, Student Housing Rev Bonds (Provident Group - UTK Properties, LLC. - University of Tennessee Project), Series 2024-B-1, BAM insured, 5.00% 7/1/2044 | 2,000 | 2,137 | |
Knoxville Community Dev. Corp., Collateralized Multi Family Housing Bonds (Grosvenor Square Project), Series 2022, 4.00% 12/1/2027 (put 6/1/2026) | 1,115 | 1,116 | |
Knoxville Community Dev. Corp., Collateralized Multi Family Housing Bonds (Willow Place Project), Series 2023, 3.75% 12/1/2027 (put 6/1/2026) | 700 | 693 | |
County of Shelby, Health, Health Care Rev. Ref. and Improvement Bonds (Baptist Memorial Health Care), Series 2024-B, 5.00% 9/1/2049 (put 9/1/2029) | 1,335 | 1,407 | |
Tenergy Corp, Gas Supply Rev. Bonds, Series 2021-A, 4.00% 12/1/2051 (put 9/1/2028) | 1,000 | 1,001 | |
Tennessee Energy Acquisition Corp., Gas Project Rev. Bonds, Series 2018, 4.00% 11/1/20494 | 1,000 | 1,001 | |
County of Williamson Industrial Dev. Board, Multi Family Housing Rev. Bonds (Wood Duck Court Apartments), Series 2023, 5.00% 5/1/2042 (put 5/1/2027) | 1,095 | 1,118 | |
14,067 | |||
Texas 12.19% | |||
Affordable Housing Corp., Multi Family Housing Rev. Bonds (Juniper Creek Apartments Project), Series 2023, 3.75% 7/1/2044 (put 7/1/2026) | 405 | 401 | |
Affordable Housing Corp., Multi Family Housing Rev. Bonds (Norman Commons), Series 2023, 3.625% 1/1/2045 (put 1/1/2027) | 140 | 138 | |
Alamo Community College Dist., Limited Tax Bonds, Series 2021, 5.00% 8/15/2026 | 2,150 | 2,232 | |
Alvin Independent School Dist., Unlimited Tax Schoolhouse and Rev. Ref. Bonds, Series 2024, 5.00% 2/15/2026 | 195 | 200 | |
Arlington Higher Education Fin. Corp., Education Rev. Bonds (Basis Texas Charter Schools, Inc.), Series 2024, 4.50% 6/15/20441 | 885 | 854 | |
Arlington Higher Education Fin. Corp., Education Rev. Bonds (Great Hearts America - Texas), Series 2024-A, 4.50% 8/15/2039 | 390 | 391 | |
Arlington Higher Education Fin. Corp., Education Rev. Bonds (Harmony Public Schools), Series 2024, 4.00% 2/15/2049 | 1,115 | 1,069 | |
City of Arlington, Special Tax Rev. Bonds, Series 2021-B, 5.00% 8/15/2024 | 800 | 801 | |
Aubrey Independent School Dist., Unlimited Tax School Building Bonds, Series 2022, 4.00% 2/15/2047 | 1,250 | 1,215 | |
Austin Community College Dist., Limited Tax Bonds, Series 2023, 5.00% 8/1/2039 | 1,000 | 1,117 | |
City of Austin, Airport System Rev. Bonds, Series 2019-B, AMT, 5.00% 11/15/2033 | 1,000 | 1,053 | |
City of Austin, Certs. Of Obligation, Series 2020, 5.00% 9/1/2025 | 1,000 | 1,020 | |
City of Austin, Electric Utility System Rev. Ref. Bonds, Series 2015-A, 5.00% 11/15/2031 | 1,000 | 1,016 | |
Azle Independent School Dist., Unlimited Tax School Building and Rev. Ref. Bonds, Series 2024, 5.00% 2/15/2041 | 1,500 | 1,666 | |
Boerne Independent School Dist., Unlimited Tax School Building Rev. Ref. Bonds, Series 2023, 3.125% 2/1/2053 (put 2/1/2027) | 495 | 488 | |
Brazoria County Industrial Dev. Corp., Solid Waste Disposal Facs. Rev. Bonds (Aleon Renewable Metals, LLC Project), Series 2023, AMT, 12.00% 6/1/20431 | 500 | 506 | |
Capital Area Housing Fin. Corp., Multi Family Housing Rev. Bonds (Redwood Apartments), Series 2020, 3.50% 1/1/2041 (put 1/1/2024) | 2,500 | 2,481 | |
Capital Group Fixed Income ETF Trust | 56 |
Capital Group Municipal Income ETF (continued)
Bonds, notes & other debt instruments (continued) | Principal amount (000) | Value (000) | |
Texas (continued) | |||
Central Texas Regional Mobility Auth., Rev. Bonds, Series 2021-B, 5.00% 1/1/2032 | USD 500 | $545 | |
Clear Creek Independent School Dist., Unlimited Tax Rev. Ref. Bonds, Series 2016, 3.00% 2/15/2033 | 1,000 | 939 | |
Clifton Higher Education Fin. Corp., Education Rev. Bonds (Idea Public Schools), Series 2018, 5.00% 8/15/2027 | 1,000 | 1,050 | |
Clifton Higher Education Fin. Corp., Education Rev. Bonds (Valor Education), Series 2023-A, 5.75% 6/15/20381 | 500 | 511 | |
Clifton Higher Education Fin. Corp., Education Rev. Ref. Bonds (Idea Public Schools), Series 2024, 5.00% 8/15/2039 | 1,000 | 1,098 | |
Clifton Higher Education Fin. Corp., Education Rev. Ref. Bonds (International Leadership of Texas, Inc.), Series 2024-A, 5.00% 8/15/2038 | 105 | 117 | |
College Student Loan G.O. Bonds, Series 2019, AMT, 5.00% 8/1/2027 | 1,000 | 1,043 | |
City of Dallas, Special Tax Rev. Bonds (Kay Bailey Hutchison Convention Center Dallas Venue Project), Series 2023, 6.00% 8/15/2053 (put 8/15/2028)1 | 850 | 857 | |
City of Dallas, Waterworks and Sewer System Rev. Ref. Bonds, Series 2015-A, 4.00% 10/1/2033 | 500 | 499 | |
City of Dallas, Waterworks and Sewer System Rev. Ref. Bonds, Series 2020-C, 5.00% 10/1/2038 | 1,440 | 1,574 | |
Dallas Area Rapid Transit Sales Tax Rev. Ref. Bonds, Series 2016-A, 5.00% 12/1/2048 (preref. 12/1/2025) | 1,000 | 1,025 | |
Dallas Independent School Dist., Unlimited Tax School Building Bonds, Series 2019-B, 3.00% 2/15/2034 | 1,000 | 941 | |
Dallas Independent School Dist., Unlimited Tax School Building Rev. Ref. Bonds, Series 2014-A, 5.00% 8/15/2029 (preref. 8/15/2024) | 2,000 | 2,003 | |
City of Dallas Housing Fin. Corp., Multi Family Housing Rev. Notes (Estates at Ferguson), Series 2023, 5.00% 7/1/2042 (put 7/1/2027) | 420 | 430 | |
Denton Independent School Dist., Unlimited Tax School Building Bonds, Series 2023, 5.00% 8/15/2042 | 2,965 | 3,297 | |
Fort Worth Independent School Dist., Unlimited Tax School Building and Rev. Ref. Bonds, Series 2015, 4.00% 2/15/2040 (preref. 2/15/2025) | 1,750 | 1,755 | |
City of Fort Worth, Water and Sewer System Rev. Bonds, Series 2024, 5.00% 2/15/2041 | 890 | 987 | |
County of Galveston, Municipal Utility Dist. No. 79, Unlimited Tax Bonds, Series 2024, 4.625% 4/1/2047 | 1,000 | 1,000 | |
City of Garland, Electric Utility System Rev. Ref. Bonds, Series 2023, Assured Guaranty Municipal insured, 5.00% 3/1/2025 | 485 | 490 | |
Gulf Coast Industrial Dev. Auth., Solid Waste Disposal Rev. Bonds (CITGO Petroleum Corp. Project), Series 1995, AMT, 4.875% 5/1/2025 | 1,000 | 1,000 | |
County of Harris, Toll Road Rev. and Rev. Ref. Bonds, Series 2018-A, 5.00% 2030 | 610 | 647 | |
Hays Consolidated Independent School Dist., Unlimited Tax School Building Bonds, Series 2022, 5.00% 2/15/2035 | 635 | 706 | |
Dept. of Housing and Community Affairs, Multi Family Housing Rev. Notes (Aspen Park), Series 2023, 5.00% 3/1/2041 (put 3/1/2026) | 595 | 599 | |
Dept. of Housing and Community Affairs, Residential Mortgage Rev. Bonds, Series 2021-A, 3.00% 1/1/2052 | 665 | 641 | |
Dept. of Housing and Community Affairs, Residential Mortgage Rev. Bonds, Series 2022-B, 5.75% 1/1/2053 | 1,965 | 2,082 | |
Dept. of Housing and Community Affairs, Single Family Mortgage Rev. Bonds, Series 2023-C, 6.00% 3/1/2054 | 3,045 | 3,330 | |
City of Houston, Airport System Facs. Rev. Bonds (United Airlines, Inc. Terminal Improvement Projects), Series 2021-A, AMT, 4.00% 7/1/2041 | 1,500 | 1,444 | |
City of Houston, Airport System Rev. Ref. Bonds, Series 2021-A, AMT, 5.00% 7/1/2029 | 500 | 528 | |
City of Houston, Airport System Rev. Ref. Bonds, Series 2023-B, Assured Guaranty Municipal insured, AMT, 5.00% 7/1/2031 | 1,820 | 1,961 | |
City of Houston, Airport System Rev. Ref. Bonds, Series 2021-A, AMT, 4.00% 7/1/2037 | 1,085 | 1,085 | |
City of Houston, Airport System Special Facs. Rev. Ref. Bonds (United Airlines, Inc. Terminal E Project), Series 2014, AMT, 4.75% 7/1/2024 | 500 | 500 | |
City of Houston, Airport System Special Facs. Rev. Ref. Bonds (United Airlines, Inc. Terminal E Project), Series 2014, AMT, 5.00% 7/1/2029 | 1,250 | 1,250 | |
City of Houston, Airport System Special Facs. Rev. Ref. Bonds (United Airlines, Inc. Terminal Improvement Projects), Series 2020-A, AMT, 5.00% 7/1/2027 | 500 | 509 | |
City of Houston, Combined Utility System Rev. Ref. Bonds, Series 2024-A, 5.00% 11/15/2025 | 750 | 767 | |
Houston Housing Fin. Corp., Multi Family Housing Rev. Notes (Summerdale Apartments), Series 2023, 5.00% 8/1/2041 (put 8/1/2026) | 500 | 509 | |
Las Varas Public Fac. Corp., Multi Family Housing Rev. Bonds (Palo Alto Apartments), Series 2022, 3.10% 11/1/2025 (put 11/1/2024) | 1,000 | 994 | |
Lazy Nine Municipal Utility Dist. No. 1A, Unlimited Tax Bonds, Series 2023, 5.625% 9/1/2042 | 500 | 524 | |
Love Field Airport Modernization Corp., Special Facs. Rev. Bonds, Series 2012, AMT, 5.00% 11/1/2028 | 1,355 | 1,355 | |
Lower Colorado River Auth., Rev. Ref. Bonds, Series 2022, Assured Guaranty Municipal insured, 5.00% 5/15/2026 | 535 | 553 | |
Lower Colorado River Auth., Rev. Ref. Bonds, Series 2023-B, 5.00% 5/15/2039 (put 5/15/2028) | 1,340 | 1,398 | |
Magnolia Independent School Dist., Unlimited Tax Schoolhouse and Rev. Ref. Bonds, Series 2016, 5.00% 8/15/2032 (preref. 8/15/2025) | 2,245 | 2,287 | |
57 | Capital Group Fixed Income ETF Trust |
Capital Group Municipal Income ETF (continued)
Bonds, notes & other debt instruments (continued) | Principal amount (000) | Value (000) | |
Texas (continued) | |||
County of Matagorda, Navigation Dist. No. 1, Pollution Control Rev. Ref. Bonds (Central Power and Light Co. Project), Series 1996, AMT, 4.25% 5/1/2030 | USD 200 | $199 | |
Medina Valley Independent School Dist., Unlimited Tax School Building Bonds, Series 2023, 4.00% 2/15/2053 | 1,000 | 957 | |
Midland Independent School Dist., Unlimited Tax Rev. Ref. Bonds, Series 2015, 5.00% 2/15/2029 (preref. 2/15/2025) | 1,335 | 1,346 | |
Mission Econ. Dev. Corp., Solid Waste Disposal Rev. Bonds (Republic Services, Inc. Project), Series 2024, AMT, 4.00% 6/1/2054 (put 6/1/2034) | 850 | 858 | |
Municipal Gas Acquisition and Supply Corp. IV, Gas Supply Rev. Bonds, Series 2023-A, 5.50% 1/1/2054 (put 1/1/2030) | 1,000 | 1,072 | |
Municipal Gas Acquisition and Supply Corp. IV, Gas Supply Rev. Bonds, Series 2023-B, 5.50% 1/1/2054 (put 1/1/2034) | 2,500 | 2,794 | |
North East Independent School Dist., Unlimited Tax Rev. Ref. Bonds, Series 2024, 3.75% 8/1/2049 (put 8/1/2027) | 470 | 472 | |
North Fort Bend Water Auth., Water System Rev. and Rev. Ref. Bonds, Series 2021, BAM insured, 5.00% 12/15/2027 | 500 | 528 | |
North Texas Municipal Water Dist., Water System Rev. Ref. and Improvement Bonds, Series 2021, 3.00% 9/1/2036 | 420 | 388 | |
North Texas Tollway Auth., System Rev. and Rev. Ref. Bonds, Series 2021-B, 4.00% 1/1/2035 | 1,100 | 1,125 | |
North Texas Tollway Auth., System Rev. and Rev. Ref. Bonds, Series 2021-B, 4.00% 1/1/2036 | 500 | 510 | |
Plano Independent School Dist., Unlimited Tax School Building. Bonds, Series 2023, 5.00% 2/15/2043 | 1,310 | 1,426 | |
City of San Antonio, Electric and Gas Systems Rev. Ref. Bonds, Series 2017, 5.00% 2/1/2033 | 1,500 | 1,562 | |
City of San Antonio, Electric and Gas Systems Rev. Ref. Bonds, Series 2024-B, 5.00% 2/1/2042 | 1,500 | 1,664 | |
City of San Antonio, Water System Rev. and Rev. Ref. Bonds, Series 2023-A, 5.00% 5/15/2040 | 1,000 | 1,112 | |
Sherman Independent School Dist., Unlimited Tax School Building Bonds, Series 2023-B, 5.00% 2/15/2040 | 500 | 557 | |
Greater Texoma Utility Auth., Contract Rev. Bonds (City of Sherman Project), Series 2023-A, 5.00% 10/1/2040 | 1,000 | 1,087 | |
Southwest Independent School Dist., Unlimited Tax School Building Bonds, Series 2023, 5.00% 2/1/2041 | 1,500 | 1,646 | |
Surface Transportation Corp., Private Activity Rev. Ref. Bonds (NTE Mobility Partners Segments 3 LLC), Series 2023, AMT, 5.50% 6/30/2040 | 1,500 | 1,627 | |
Tarrant County Cultural Education Facs. Fin. Corp., Rev. Bonds (Christus Health), Series 2018-B, 5.00% 7/1/2036 | 1,270 | 1,348 | |
Board of Regents of the Texas A&M University System, Permanent University Fund Bonds, Series 2023, 5.00% 7/1/2042 | 2,000 | 2,195 | |
Board of Regents of the Texas State University System, Rev. Fncg. System Rev. and Rev. Ref. Bonds, Series 2019-A, 5.00% 3/15/2033 | 500 | 539 | |
Board of Regents of the Texas State University System, Rev. Fncg. System Rev. and Rev. Ref. Bonds, Series 2024, 5.00% 3/15/2041 | 950 | 1,064 | |
Transportation Commission, G.O. Rev. Ref. Bonds, Series 2024, 5.00% 4/1/2025 | 1,045 | 1,057 | |
United Independent School Dist., Unlimited Tax School Building Bonds, Series 2015, 5.00% 8/15/2030 (preref. 8/15/2025) | 2,160 | 2,201 | |
Board of Regents of the University of Houston System, Consolidated Rev. and Rev. Ref. Bonds, Series 2017-C, 5.00% 2/15/2026 | 1,590 | 1,635 | |
Waco Education Fin. Corp., Rev. Bonds (Baylor University Issue), Series 2021, 4.00% 3/1/2040 | 500 | 503 | |
Water Dev. Board, State Water Implementation Rev. Fund, Rev. Bonds (Master Trust), Series 2020, 5.00% 4/15/2025 | 1,075 | 1,090 | |
Water Dev. Board, State Water Implementation Rev. Fund, Rev. Bonds (Master Trust), Series 2020, 5.00% 10/15/2025 | 1,045 | 1,070 | |
Water Dev. Board, State Water Implementation Rev. Fund, Rev. Bonds (Master Trust), Series 2023-A, 5.00% 10/15/2035 | 1,000 | 1,152 | |
96,262 | |||
United States 0.11% | |||
Freddie Mac, Multi Family Certs., Series 2023, 0.916% 6/25/20351,4 | 2,708 | 153 | |
Freddie Mac, Multi Family Certs., Series 2023, 4.141% 1/25/20404 | 545 | 534 | |
Freddie Mac, Multi Family Mortgage Green Bonds, Series 2023, Class A, 3.083% 4/25/20434 | 249 | 202 | |
889 | |||
Utah 0.60% | |||
Housing Corp., Single Family Mortgage Bonds, Series 2023-A, 6.00% 7/1/2053 | 1,050 | 1,126 | |
Housing Corp., Single Family Mortgage Bonds, Series 2024-A, 6.50% 1/1/2054 | 270 | 296 | |
Housing Corp., Single Family Mortgage Bonds, Series 2024-C, 6.00% 7/1/2054 | 275 | 302 | |
Capital Group Fixed Income ETF Trust | 58 |
Capital Group Municipal Income ETF (continued)
Bonds, notes & other debt instruments (continued) | Principal amount (000) | Value (000) | |
Utah (continued) | |||
MIDA Mountain Village Public Infrastructure Dist., Special Assessment Rev. Bonds (Mountain Village Assessment Area #2), Series 2021, 4.00% 8/1/20271 | USD 500 | $495 | |
MIDA Mountain Village Public Infrastructure Dist., Special Assessment Rev. Bonds (Mountain Village Assessment Area No. 2), Series 2021, 4.00% 8/1/20291 | 1,000 | 981 | |
Salt Lake City, Airport Rev. Bonds (Salt Lake City International Airport), Series 2018-A, AMT, 5.00% 7/1/2028 | 1,500 | 1,566 | |
4,766 | |||
Vermont 0.12% | |||
Econ. Dev. Auth., Solid Waste Disposal Rev. Bonds (Casella Waste Systems, Inc. Project), Series 2013, AMT, 4.625% 4/1/2036 (put 4/3/2028)1 | 500 | 503 | |
Student Assistance Corp., Education Loan Rev. Bonds, Series 2023-A, AMT, 4.00% 6/15/2041 | 430 | 403 | |
906 | |||
Virgin Islands 0.26% | |||
Matching Fund Special Purpose Securitization Corp., Matching Fund Securitization Bonds, Series 2022-A, 5.00% 10/1/2026 | 500 | 511 | |
Matching Fund Special Purpose Securitization Corp., Matching Fund Securitization Bonds, Series 2022-A, 5.00% 10/1/2030 | 500 | 525 | |
Matching Fund Special Purpose Securitization Corp., Matching Fund Securitization Bonds, Series 2022-A, 5.00% 10/1/2039 | 1,000 | 1,035 | |
2,071 | |||
Virginia 1.14% | |||
County of Arlington, Industrial Dev. Auth., Multifamily Housing Rev. Bonds (Park Shirlington Apartments), Series 2023-A, 5.00% 1/1/2026 | 150 | 152 | |
County of Charles City, Econ. Dev. Auth., Solid Waste Disposal Rev. Bonds (Waste Management, Inc. Project), Series 2004-A, 2.875% 2/1/2029 | 500 | 474 | |
College Building Auth., Educational Facs. Rev. Bonds (21st Century College and Equipment Programs), Series 2019-A, 4.00% 2/1/2034 | 1,000 | 1,022 | |
County of Fairfax, Redev. and Housing Auth., Multi Family Housing Rev. Bonds (Dominion Square North Project), Series 2023, 5.00% 1/1/2045 (put 1/1/2028) | 250 | 257 | |
Town of Farmville, Industrial Dev. Auth., Educational Facs. Rev. and Rev. Ref. Bonds (Longwood University Student Housing Project), Series 2018-A, 5.00% 1/1/2032 | 500 | 514 | |
Town of Farmville, Industrial Dev. Auth., Educational Facs. Rev. Ref. Bonds (Longwood University Student Housing Project), Series 2018-A, 5.00% 1/1/2033 | 270 | 277 | |
Town of Farmville, Industrial Dev. Auth., Educational Facs. Rev. Ref. Bonds (Longwood University Student Housing Project), Series 2018-A, 5.00% 1/1/2043 | 500 | 501 | |
County of Isle of Wight, Econ. Dev. Auth., Health System Rev. Bonds (Riverside Health System), Series 2023, 5.25% 7/1/2043 | 410 | 451 | |
County of James City, Econ. Dev. Auth., Residential Care Fac. Rev. Bonds (Williamsburg Landing), Series 2024-C-3, 5.25% 12/1/2027 | 400 | 402 | |
Town of Louisa, Industrial Dev. Auth., Pollution Control Rev. Ref. Bonds (Virginia Electric and Power Co. Project), Series 2008-C, 3.80% 11/1/2035 (put 5/28/2027) | 600 | 602 | |
City of Norfolk, G.O. Capital Rev. Ref. Bonds, Series 2014-C, 4.00% 8/1/2025 (preref. 8/1/2028) | 500 | 504 | |
City of Norfolk, Redev. and Housing Auth., Multi Family Housing Rev. Bonds (Braywood Manor Apartments), Series 2023, 5.00% 5/1/2043 (put 5/1/2026) | 100 | 102 | |
Small Business Fncg. Auth., Residential Care Facs. Rev. and Rev. Ref. Bonds (LifeSpire of Virginia), Series 2021, 4.00% 12/1/2036 | 575 | 559 | |
Small Business Fncg. Auth., Rev. Bonds (National Senior Campuses, Inc. Obligated Group), Series 2020-A, 5.00% 1/1/2026 | 975 | 989 | |
Small Business Fncg. Auth., Rev. Bonds (National Senior Campuses, Inc. Obligated Group), Series 2020-A, 5.00% 1/1/2034 | 550 | 583 | |
Small Business Fncg. Auth., Rev. Ref. Bonds (Elizabeth River Crossings Opco, LLC Project), Series 2022, AMT, 4.00% 7/1/2029 | 500 | 503 | |
Virginia Beach Dev. Auth., Residential Care Fac. Rev. Bonds (Westminster-Canterbury on Chesapeake Bay), Series 2023-B-3, 5.375% 9/1/2029 | 1,075 | 1,118 | |
9,010 | |||
59 | Capital Group Fixed Income ETF Trust |
Capital Group Municipal Income ETF (continued)
Bonds, notes & other debt instruments (continued) | Principal amount (000) | Value (000) | |
Washington 3.48% | |||
Central Puget Sound Regional Transit Auth., Sales Tax Improvement and Rev. Ref. Green Bonds, Series 2015-S-1, 5.00% 11/1/2036 (preref. 11/1/2025) | USD 1,000 | $1,023 | |
Central Puget Sound Regional Transit Auth., Sales Tax Improvement and Rev. Ref. Green Bonds, Series 2015-S-1, 4.00% 11/1/2050 (preref. 11/1/2025) | 3,000 | 3,031 | |
G.O. Bonds, Series 2020-A, 5.00% 8/1/2039 | 650 | 699 | |
G.O. Bonds, Series 2021-A-2, 5.00% 8/1/2039 | 1,300 | 1,419 | |
G.O. Bonds, Series 2024-C, 5.00% 2/1/2041 | 1,475 | 1,658 | |
G.O. Bonds, Series 2023-A, 5.00% 8/1/2044 | 1,185 | 1,299 | |
Health Care Facs. Auth., Rev. Bonds (CommonSpirit Health), Series 2019-B-1, 5.00% 8/1/2049 (put 8/1/2024) | 1,050 | 1,050 | |
Health Care Facs. Auth., Rev. Bonds (Multicare Health System), Series 2015-B, 5.00% 8/15/2025 | 500 | 506 | |
Health Care Facs. Auth., Rev. Bonds (Providence St. Joseph Health), Series 2014-C, 5.00% 10/1/2044 | 500 | 500 | |
Health Care Facs. Auth., Rev. Bonds (Seattle Cancer Care Alliance), Series 2021, 4.00% 12/1/20401 | 1,000 | 972 | |
Health Care Facs. Auth., Rev. Bonds (Virginia Mason Medical Center), Series 2017, 5.00% 8/15/2037 | 355 | 360 | |
Housing Fin. Commission, Multi Family Housing Rev. Bonds (Ardea at Totem Lake Apartments Project), Series 2023, 5.00% 12/1/2043 (put 2/1/2027) | 800 | 814 | |
Housing Fin. Commission, Municipal Certs., Series 2021-1, 3.50% 12/20/2035 | 2,614 | 2,378 | |
Housing Fin. Commission, Municipal Certs., Series 2023-1, 1.492% 4/20/20374 | 1,707 | 182 | |
Housing Fin. Commission, Municipal Certs., Series 2023-1, 3.375% 4/20/2037 | 3,409 | 3,055 | |
Housing Fin. Commission, Nonprofit Housing Rev. and Rev. Ref. Bonds (Emerald Heights Project), Series 2023-B-1, 4.75% 7/1/2027 | 40 | 40 | |
Housing Fin. Commission, Single Family Program Bonds, Series 2018-1-N, 4.00% 12/1/2048 | 320 | 318 | |
Housing Fin. Commission, Single Family Program Bonds, Series 2020-2-N, 3.00% 12/1/2050 | 530 | 514 | |
County of King, Convention Center Public Facs. Dist., Lodging Tax Green Notes, Series 2021, 4.00% 7/1/2031 | 750 | 742 | |
County of King, Unlimited Tax G.O. Bonds, Series 2023, 5.00% 12/1/2042 | 1,500 | 1,683 | |
Mercer Island School Dist. No. 400, Unlimited Tax G.O. Bonds, Series 2015, 3.00% 12/1/2024 | 750 | 747 | |
Motor Vehicle Fuel Tax G.O. Bonds, Capital Appreciation Bonds, Series 2005-F, 0% 12/1/2029 | 1,970 | 1,636 | |
Pasco School Dist. No. 1, Unlimited Tax G.O. Improvement and Rev. Ref. Bonds, Series 2023, 4.25% 12/1/2042 | 1,000 | 1,023 | |
City of Seattle, Municipal Light and Power Rev. Bonds, Series 2015-A, 4.00% 5/1/2030 (preref. 5/1/2025) | 735 | 739 | |
Port of Seattle, Industrial Dev. Corp., Special Facs. Rev. Ref. Bonds (Delta Air Lines, Inc. Project), Series 2012, AMT, 5.00% 4/1/2030 | 500 | 500 | |
Various Purpose G.O. Rev. Ref. Bonds, Series 2021-A-1, 5.00% 8/1/2035 | 530 | 586 | |
27,474 | |||
West Virginia 0.29% | |||
Econ. Dev. Auth., Solid Waste Disposal Facs. Rev. Bonds (Arch Resources Project), Series 2021, AMT, 4.125% 7/1/2045 (put 7/1/2025) | 500 | 499 | |
Econ. Dev. Auth., Solid Waste Disposal Facs. Rev. Bonds (Arch Resources Project), Series 2020, AMT, 5.00% 7/1/2045 (put 7/1/2025) | 500 | 502 | |
Econ. Dev. Auth., Solid Waste Disposal Facs. Rev. Ref. Bonds (Kentucky Power Co. - Mitchell Project), Series 2014-A, AMT, 4.70% 4/1/2036 (put 6/17/2026) | 400 | 405 | |
Hospital Fin. Auth., Hospital Rev. Ref. and Improvement Rev. Bonds (Vandalia Health Group), Series 2023-B, 6.00% 9/1/2048 | 800 | 909 | |
2,315 | |||
Wisconsin 2.32% | |||
Environmental Improvement Fund, Rev. Bonds, Series 2017-A, 5.00% 6/1/2032 (preref. 6/1/2025) | 1,000 | 1,015 | |
G.O. Bonds, Series 2020, 5.00% 5/1/2034 | 1,130 | 1,235 | |
G.O. Rev. Ref. Bonds, Series 2025-1, 5.00% 5/1/2033 | 510 | 568 | |
Health and Educational Facs. Auth., Rev. Bonds (Advocate Aurora Health Care Credit Group), Series 2018-C-3, 5.00% 8/15/2054 (put 6/24/2026) | 655 | 670 | |
Health and Educational Facs. Auth., Rev. Bonds (Ascension Health Alliance Senior Credit Group), Series 2013-B-1, 4.00% 11/15/2043 | 750 | 718 | |
Health and Educational Facs. Auth., Rev. Bonds (Dickson Hollow Phase II Project), Series 2024, 5.45% 10/1/2039 | 280 | 286 | |
Health and Educational Facs. Auth., Rev. Bonds (Hope Christian Schools Obligated Group), Series 2021, 3.00% 12/1/2031 | 450 | 388 | |
Health and Educational Facs. Auth., Rev. Bonds (Three Pillars Senior Living Communities), Series 2024-B-2, 4.20% 8/15/2028 | 350 | 348 | |
Health and Educational Facs. Auth., Rev. Ref. Bonds (ProHealth Care, Inc. Obligated Group), Series 2015, 5.00% 8/15/2039 | 1,000 | 1,001 | |
Public Fin. Auth., Air Cargo Rev. Bonds (AFCO Obligated Group), Series 2023, AMT, 5.00% 7/1/2025 | 265 | 267 | |
Capital Group Fixed Income ETF Trust | 60 |
Capital Group Municipal Income ETF (continued)
Bonds, notes & other debt instruments (continued) | Principal amount (000) | Value (000) | |
Wisconsin (continued) | |||
Public Fin. Auth., Exempt Facs. Rev. Ref. Bonds (Celanese Project), Series 2016-A, AMT, 5.00% 12/1/20251 | USD 1,000 | $1,005 | |
Public Fin. Auth., Infrastructure Program Rev. Anticipation Bonds (Legacy Hills Project), Series 2024-A-1, 6.125% 11/15/20371 | 2,120 | 2,078 | |
Public Fin. Auth., Infrastructure Program Rev. Anticipation Bonds (Wayside Project), Series 2024-A-2, 5.875% 11/15/20271 | 1,320 | 1,303 | |
Public Fin. Auth., Project Rev. Bonds (CFP3 - Eastern Michigan University Student Housing Project), Series 2022-A-1, BAM insured, 5.00% 7/1/2030 | 700 | 759 | |
Public Fin. Auth., Retirement Community Rev. Bonds (Lifespace Communities, Inc.), Series 2020-A, 4.00% 11/15/2037 | 600 | 598 | |
Public Fin. Auth., Retirement Community Rev. Bonds (Lifespace Communities, Inc.), Series 2020-A, 5.00% 11/15/2041 | 500 | 521 | |
Public Fin. Auth., Rev. Ref. Bonds (Celanese Corp.), Series 2016-C, AMT, 4.30% 11/1/2030 | 1,140 | 1,135 | |
Public Fin. Auth., Rev. Ref. Bonds (Roseman University of Health Sciences Project), Series 2022, 4.00% 4/1/20321 | 405 | 405 | |
Public Fin. Auth., Senior Rev. Bonds (Miami Worldcenter Project), Series 2024-A, 5.00% 6/1/20411 | 468 | 474 | |
Public Fin. Auth., Special Fac. Rev. Bonds (Austin FBO, LLC General Aviation Facs. Project), Series 2018-A, AMT, 7.05% 9/1/2046 (put 9/1/2027)1 | 1,000 | 982 | |
Public Fin. Auth., Special Rev. Bonds (Candela Project), Series 2023, 6.125% 12/15/20291 | 500 | 491 | |
Public Fin. Auth., Special Rev. Bonds (Signorelli Projects, Municipal Utility Dists., Montgomery and Waller Counties), Series 2024, 5.375% 12/15/20321 | 1,000 | 1,000 | |
Public Fin. Auth., Student Housing Rev. Bonds (Beyond Boone, LLC - Appalachian State University Project), Series 2020-A, Assured Guaranty Municipal insured, 4.00% 7/1/2045 | 600 | 581 | |
Public Fin. Auth., Student Housing Rev. Bonds (CHF-Manoa, LLC UH Residences for Graduate Students), Series 2023-A, 5.25% 7/1/20381 | 415 | 453 | |
18,281 | |||
Total bonds, notes & other debt instruments (cost: $736,400,000) | 747,897 | ||
Short-term securities 5.02% | |||
Municipals 5.02% | |||
State of Mississippi, Business Fin. Corp., Gulf Opportunity Zone Industrial Dev. Rev. Bonds (Chevron U.S.A., Inc. Project), Series 2010-J, 4.75% 11/1/20354 | 10,000 | 10,000 | |
State of South Carolina, Charleston County School Dist., G.O. Bond Anticipation Notes (Sales Tax Projects - Phase V), Series 2024-B, 4.75% 5/8/2025 | 1,000 | 1,010 | |
State of Tennesee, City of Clarksville, Public Building Auth., Pooled Fncg. Rev. Bonds, Series 2003, Bank of America LOC, 4.90% 1/1/20334 | 1,400 | 1,400 | |
State of Ohio, County of Franklin, Rev. Bonds (CHE Trinity Health Credit Group), Series 2013, 3.70% 12/1/2046 (put 8/1/2024)5 | 700 | 700 | |
State of Tennesee, County of Montgomery, Public Building Auth., Pooled Fncg. Rev. Bonds (Tennessee County Loan Pool), Series 2002, Bank of America LOC, 4.95% 4/1/20324 | 2,000 | 2,000 | |
State of Illinois, Fin. Auth., Demand Rev. Bonds (University of Chicago Medical Center), Series 2010-A, 4.90% 8/1/20444 | 1,400 | 1,400 | |
Fin. Auth., Econ. Dev. Rev. Ref. Bonds (Republic Services, Inc. Project), Series 2010-A, AMT, 4.20% 5/1/2034 (put 12/1/2023)5 | 1,270 | 1,271 | |
State of Missouri, Health and Educational Facs. Auth., Demand Educational Facs. Rev. Bonds (Washington University), Series 2003-B, 4.90% 2/15/20334 | 1,000 | 1,000 | |
State of South Carolina, Housing Fin. and Dev. Auth., Multi Family Housing Rev. Bonds (Villages at Congaree Pointe Project), Series 2021-B, 1.25% 6/1/2025 (put 6/1/2024)5 | 455 | 455 | |
State of Florida, Mission Econ. Dev. Corp., Solid Waste Disposal Rev. Ref. Bonds (Republic Services, Inc. Project), Series 2012, AMT, 4.05% 1/1/2026 (put 8/1/2024)5 | 1,215 | 1,215 | |
State of New Hampshire, National Fin. Auth., Solid Waste Disposal Rev. Ref. Bonds (Waste Management, Inc. Project), Series 2019-A-4, AMT, 2.15% 8/1/2038 (put 7/1/2024)5 | 2,690 | 2,690 | |
State of New York, New York City Transitional Fin. Auth., Future Tax Secured Bonds, Series 2016-A-4, 4.75% 8/1/20414 | 4,100 | 4,100 | |
State of New York, New York City Transitional Fin. Auth., Future Tax Secured Bonds, Series 2019-B-4, 4.70% 8/1/20424 | 1,500 | 1,500 | |
61 | Capital Group Fixed Income ETF Trust |
Capital Group Municipal Income ETF (continued)
Short-term securities (continued) | Principal amount (000) | Value (000) | |
Municipals (continued) | |||
State of Michigan, Regents of the University of Michigan, General Rev. Bonds, Series 2012-B, % 4/1/20424 | USD 7,400 | $7,400 | |
State of New York, Triborough Bridge and Tunnel Auth., General Rev. Bonds, Series 2001-C, 4.90% 1/1/20324 | 2,200 | 2,200 | |
State of New York, Triborough Bridge and Tunnel Auth., General Rev. Ref. Bonds, Series 2005-B-3, 4.75% 1/1/20354 | 1,300 | 1,300 | |
39,641 | |||
Total short-term securities (cost: $39,640,000) | 39,641 | ||
Total investment securities 99.75% (cost: $776,040,000) | 787,538 | ||
Other assets less liabilities 0.25% | 1,987 | ||
Net assets 100.00% | $789,525 | ||
Futures contracts
Contracts | Type | Number of contracts | Expiration date | Notional amount (000) | Value and unrealized appreciation (depreciation) at 6/30/2024 (000) |
2 Year U.S. Treasury Note Futures | Long | 298 | 9/30/2024 | USD60,857 | $113 |
10 Year U.S. Treasury Note Futures | Short | 180 | 9/19/2024 | (19,797 ) | (156 ) |
$(43 ) |
1 | Acquired in a transaction exempt from registration under Rule 144A or, for commercial paper, Section 4(a)(2) of the Securities Act of 1933. May be resold in the U.S. in transactions exempt from registration, normally to qualified institutional buyers. The total value of all such securities was $56,122,000, which represented 7.11% of the net assets of the fund. |
2 | Step bond; coupon rate may change at a later date. |
3 | Restricted security, other than Rule 144A securities or commercial paper issued pursuant to Section 4(a)(2) of the Securities Act of 1933. The total value of all such restricted securities was $4,875,000, which represented 0.63% of the net assets of the fund. |
4 | Coupon rate may change periodically. Reference rate and spread are as of the most recent information available. Some coupon rates are determined by the issuer or agent based on current market conditions; therefore, the reference rate and spread are not available. |
5 | For short-term securities, the mandatory put date is considered to be the maturity date. |
Key to abbreviation(s) |
Agcy. = Agency |
AMT = Alternative Minimum Tax |
Assn. = Association |
Auth. = Authority |
Certs. = Certificates |
CME = CME Group |
Dept. = Department |
Dev. = Development |
Dist. = District |
Dists. = Districts |
Econ. = Economic |
Fac. = Facility |
Facs. = Facilities |
Fin. = Finance |
Fncg. = Financing |
G.O. = General Obligation |
LOC = Letter of Credit |
preref. = Prerefunded |
Redev. = Redevelopment |
Ref. = Refunding |
Rev. = Revenue |
SOFR = Secured Overnight Financing Rate |
USD = U.S. dollars |
Refer to the notes to financial statements.
Capital Group Fixed Income ETF Trust | 62 |
Capital Group Municipal High-Income ETFunaudited
Investment portfolio June 30, 2024
Bonds, notes & other debt instruments 81.00% | Principal amount (000) | Value (000) | |
Alabama 9.48% | |||
Energy Southeast, Energy Supply Rev. Bonds (A Cooperative Dist.), Series 2024-B, 5.25% 7/1/2054 (put 6/1/2032) | USD 500 | $535 | |
City of Homewood, Educational Building Auth., Rev. Bonds (CHF - Horizons II, LLC, Student Housing & Parking Project at Samford University), Series 2024-C, 5.50% 10/1/2049 | 500 | 531 | |
County of Jefferson, Sewer Rev. Warrants, Series 2024, 5.50% 10/1/2053 | 300 | 325 | |
County of Mobile Industrial Dev. Auth., Solid Waste Disposal Rev. Bonds (AM/NS Calvert, LLC Project), Series 2024-A, AMT, 5.00% 6/1/2054 | 500 | 509 | |
1,900 | |||
Arizona 1.42% | |||
City of Glendale, Industrial Dev. Auth., Senior Living Rev. Bonds (Royal Oaks Life Care Community), Series 2016, 5.00% 5/15/2039 | 250 | 247 | |
Industrial Dev. Auth., Municipal Certs., Series 2019-2, Class X, interest only, 1.016% 5/20/20331,2 | 915 | 37 | |
284 | |||
California 8.38% | |||
Educational Facs. Auth., Rev. Bonds (Saint Mary’s College of California), Series 2023-A, 5.50% 10/1/2053 | 500 | 530 | |
Golden State Tobacco Securitization Corp., Enhanced Tobacco Settlement Asset-Backed Bonds, Capital Appreciation Bonds, Series 2021-B-2, 0% 6/1/2066 | 1,000 | 111 | |
Hastings Campus Housing Fin. Auth., Campus Housing Rev. Green Bonds, Series 2020-A, 5.00% 7/1/20613 | 300 | 285 | |
Municipal Fin. Auth., Special Fac. Rev. Bonds (United Airlines, Inc. Los Angeles International Airport Project), Series 2019, AMT, 4.00% 7/15/2029 | 500 | 500 | |
River Islands Public Fncg. Auth., Community Facs. Dist. No. 2023-1 (Public Facs.), Special Tax Bonds, Series 2024, 5.00% 9/1/2048 | 250 | 253 | |
1,679 | |||
Florida 1.42% | |||
County of Lee, Industrial Dev. Auth., Healthcare Facs. Rev. Bonds (Shell Point Obligated Group), Series 2024-A, 5.25% 11/15/2054 | 270 | 285 | |
Georgia 2.65% | |||
Main Street Natural Gas, Inc., Gas Supply Rev. Bonds, Series 2024-A, 5.00% 5/1/2054 (put 9/1/2031) | 500 | 531 | |
Illinois 4.94% | |||
City of Chicago, Board of Education, Unlimited Tax G.O. Bonds (Dedicated Rev.), Series 2022-A, 5.00% 12/1/2047 | 500 | 505 | |
G.O. Bonds, Series 2021-B, 3.00% 12/1/2041 | 140 | 115 | |
Board of Trustees of Northern Illinois University, Auxiliary Facs. System Rev. Ref. Bonds, Series 2020-B, BAM insured, 5.00% 4/1/2033 | 350 | 371 | |
991 | |||
Indiana 5.63% | |||
Fin. Auth., Midwestern Disaster Relief Rev. Bonds (Ohio Valley Electric Corp. Project), Series 2012-B, 3.00% 11/1/2030 | 265 | 249 | |
Fin. Auth., Pollution Control Rev. Bonds (Ohio Valley Electric Corp. Project), Series 2010-B, 2.50% 11/1/2030 | 310 | 277 | |
Fin. Auth., Rev. Ref. Bonds (BHI Senior Living Obligated Group), Series 2021-A, 4.00% 11/15/2041 | 500 | 469 | |
City of Whiting, Environmental Facs. Rev. Bonds (BP Products North America, Inc. Project), Series 2021, AMT, 3.00% 11/1/2051 | 170 | 134 | |
1,129 | |||
Mississippi 2.30% | |||
County of Lowndes, Solid Waste Disposal and Pollution Control Rev. Ref. Bonds (International Paper Co. Project), Series 2022, 2.65% 4/1/2037 (put 4/1/2027)4 | 475 | 461 | |
63 | Capital Group Fixed Income ETF Trust |
Capital Group Municipal High-Income ETF (continued)
Bonds, notes & other debt instruments (continued) | Principal amount (000) | Value (000) | |
Missouri 0.87% | |||
Health and Educational Facs. Auth., Senior Living Facs. Rev. Bonds (Lutheran Senior Services), Series 2016-B, 5.00% 2/1/2034 | USD 100 | $102 | |
City of Lee’s Summit, Industrial Dev. Auth., Senior Living Facs. Rev. Bonds (John Knox Village), Series 2024-A, 5.00% 8/15/2039 | 70 | 73 | |
175 | |||
Nevada 2.16% | |||
City of Las Vegas, Special Improvement Dist. No. 611 (Sunstone Phase I and II), Local Improvement Bonds, Series 2020, 4.125% 6/1/2050 | 500 | 433 | |
New Hampshire 2.41% | |||
National Fin. Auth., Municipal Certs., Series 2022-1, Class A, 4.375% 9/20/2036 | 487 | 484 | |
New York 8.48% | |||
Onongada Civic Dev. Corp., Rev. Ref. Bonds (Crouse Health Hospital, Inc. Project), Series 2024-A, 5.375% 8/1/2054 | 50 | 52 | |
Sullivan County Infrastructure Local Dev. Corp., Rev. Bonds (Adelaar Infrastructure Project), Series 2016-E-2, 5.35% 11/1/20493 | 500 | 503 | |
Transportation Dev. Corp., Special Facs. Rev. Bonds (Delta Air Lines, Inc. LaGuardia Airport Terminals C & D Redev. Project), Series 2020, AMT, 5.00% 10/1/2035 | 500 | 526 | |
Transportation Dev. Corp., Special Facs. Rev. Green Bonds (John. F. Kennedy International Airport New Terminal One Project), Series 2024, AMT, 5.50% 6/30/2060 | 500 | 528 | |
County of Westchester Industrial Dev. Agcy., Special Fac. Rev. Bonds (Million Air Two, LLC. General Aviation Facs. Project), Series 2017-A, AMT, 7.00% 6/1/20463 | 100 | 90 | |
1,699 | |||
Ohio 3.54% | |||
Buckeye Tobacco Settlement Fncg. Auth., Tobacco Settlement Asset-Backed Rev. Ref. Bonds, Series 2020-B-2, 5.00% 6/1/2055 | 500 | 462 | |
County of Hamilton, Hospital Facs. Rev. Bonds (UC Health), Series 2020, 5.00% 9/15/2050 | 250 | 247 | |
709 | |||
Puerto Rico 6.86% | |||
Aqueduct and Sewer Auth., Rev. Ref. Bonds, Series 2022-A, 4.00% 7/1/20423 | 500 | 470 | |
Electric Power Auth., Power Rev. Bonds, Series 2010-ZZ, 4.25% 7/1/20185 | 120 | 60 | |
Electric Power Auth., Power Rev. Bonds, Series 2012-A, 5.00% 7/1/20425 | 370 | 186 | |
Electric Power Auth., Power Rev. Ref. Bonds, Series 2007-UU, Assured Guaranty Municipal insured, 4.064% 7/1/20174,5 | 5 | 3 | |
Electric Power Auth., Power Rev. Ref. Bonds, Series 2010-DDD, 3.625% 7/1/20215 | 5 | 3 | |
G.O. Taxable Bonds, Series 2022, 0% 11/1/20432 | 444 | 272 | |
Sales Tax Fncg. Corp., Sales Tax Rev. Restructured Bonds, Capital Appreciation Bonds, Series 2018-A-1, 0% 7/1/2046 | 693 | 224 | |
Sales Tax Fncg. Corp., Sales Tax Rev. Restructured Bonds, Capital Appreciation Bonds, Series 2018-A-1, 0% 7/1/2051 | 665 | 157 | |
1,375 | |||
Texas 10.22% | |||
Arlington Higher Education Fin. Corp., Education Rev. Bonds (Basis Texas Charter Schools, Inc.), Series 2024, 4.50% 6/15/20443 | 500 | 483 | |
Eagle Mountain-Saginaw Independent School Dist., Unlimited Tax School Building Bonds, Series 2024, 4.00% 8/15/2054 | 500 | 469 | |
County of Galveston, Municipal Utility Dist. No. 79, Unlimited Tax Bonds, Series 2024, 4.625% 4/1/2047 | 550 | 550 | |
Dept. of Housing and Community Affairs, Residential Mortgage Rev. Bonds, Series 2024-C, 6.00% 7/1/2054 | 500 | 547 | |
2,049 | |||
Capital Group Fixed Income ETF Trust | 64 |
Capital Group Municipal High-Income ETF (continued)
Bonds, notes & other debt instruments (continued) | Principal amount (000) | Value (000) | |
Wisconsin 10.24% | |||
Health and Educational Facs. Auth., Rev. Bonds (Marshfield Clinic Health System, Inc.), Series 2024-A, 5.50% 2/15/2054 | USD 665 | $708 | |
Public Fin. Auth., Rev. Ref. Bonds (Roseman University of Health Sciences Project), Series 2022, 4.00% 4/1/20423 | 500 | 467 | |
Public Fin. Auth., Senior Living Rev. Ref. Bonds (Fellowship Senior Living Project), Series 2019-A, 5.00% 1/1/2035 | 250 | 254 | |
Public Fin. Auth., Special Rev. Bonds (Signorelli Projects, Municipal Utility Dists., Montgomery and Waller Counties), Series 2024, 5.375% 12/15/20323 | 350 | 350 | |
Public Fin. Auth., Pooled Charter School Certs., Series 2023-1, 5.75% 7/1/2062 | 250 | 273 | |
2,052 | |||
Total bonds, notes & other debt instruments (cost: $16,200,000) | 16,236 | ||
Short-term securities 44.15% | |||
Municipals 44.15% | |||
State of Tennesee, City of Clarksville, Public Building Auth., Pooled Fncg. Rev. Bonds, Series 2003, Bank of America LOC, 4.90% 1/1/20332 | 2,000 | 2,000 | |
State of Florida, City of Gainesville, Utilities System Rev. Bonds, Series 2019-C, 4.73% 10/1/20472 | 2,000 | 2,000 | |
State of Illinois, Fin. Auth., Demand Rev. Bonds (University of Chicago Medical Center), Series 2011-A, 4.50% 8/1/20442 | 2,000 | 2,000 | |
State of New Hampshire, National Fin. Auth., Solid Waste Disposal Rev. Ref. Bonds (Waste Management, Inc. Project), Series 2019-A-4, AMT, 2.15% 8/1/2038 (put 7/1/2024)6 | 850 | 850 | |
State of New York, New York City Transitional Fin. Auth., Future Tax Secured Bonds, Series 2019-B-4, 4.70% 8/1/20422 | 2,000 | 2,000 | |
8,850 | |||
Total short-term securities (cost: $8,850,000) | 8,850 | ||
Total investment securities 125.15% (cost: $25,050,000) | 25,086 | ||
Other assets less liabilities (25.15)% | (5,041 ) | ||
Net assets 100.00% | $20,045 | ||
Futures contracts
Contracts | Type | Number of contracts | Expiration date | Notional amount (000) | Value and unrealized appreciation (depreciation) at 6/30/2024 (000) |
5 Year U.S. Treasury Note Futures | Long | 12 | 9/30/2024 | USD1,279 | $(1 ) |
1 | Principal payments may be made periodically. Therefore, the effective maturity date may be earlier than the stated maturity date. |
2 | Coupon rate may change periodically. Reference rate and spread are as of the most recent information available. Some coupon rates are determined by the issuer or agent based on current market conditions; therefore, the reference rate and spread are not available. For short-term securities, the date of the next scheduled coupon rate change is considered to be the maturity date. |
3 | Acquired in a transaction exempt from registration under Rule 144A or, for commercial paper, Section 4(a)(2) of the Securities Act of 1933. May be resold in the U.S. in transactions exempt from registration, normally to qualified institutional buyers. The total value of all such securities was $2,648,000, which represented 13.21% of the net assets of the fund. |
4 | Step bond; coupon rate may change at a later date. |
5 | Scheduled interest and/or principal payment was not received. |
6 | For short-term securities, the mandatory put date is considered to be the maturity date. |
65 | Capital Group Fixed Income ETF Trust |
Capital Group Municipal High-Income ETF (continued)
Key to abbreviation(s) |
Agcy. = Agency |
AMT = Alternative Minimum Tax |
Auth. = Authority |
Certs. = Certificates |
Dept. = Department |
Dev. = Development |
Dist. = District |
Dists. = Districts |
Fac. = Facility |
Facs. = Facilities |
Fin. = Finance |
Fncg. = Financing |
G.O. = General Obligation |
LOC = Letter of Credit |
Redev. = Redevelopment |
Ref. = Refunding |
Rev. = Revenue |
USD = U.S. dollars |
Refer to the notes to financial statements.
Capital Group Fixed Income ETF Trust | 66 |
Capital Group Short Duration Income ETFunaudited
Investment portfolio June 30, 2024
Bonds, notes & other debt instruments 98.17% | Principal amount (000) | Value (000) | ||
Corporate bonds, notes & loans 38.65% | ||||
Financials 14.34% | ||||
AerCap Ireland Capital DAC 1.75% 10/29/2024 | USD995 | $982 | ||
AerCap Ireland Capital DAC 5.75% 6/6/2028 | 150 | 152 | ||
American Express Co. 2.50% 7/30/2024 | 1,050 | 1,050 | ||
American Express Co. 2.25% 3/4/2025 | 1,225 | 1,199 | ||
American Express Co. 6.338% 10/30/2026 (USD-SOFR + 1.33% on 10/30/2025)1 | 1,219 | 1,231 | ||
American Express Co. 5.532% 4/25/2030 (USD-SOFR + 1.09% on 4/25/2029)1 | 335 | 339 | ||
Aon Global, Ltd. 3.875% 12/15/2025 | 893 | 873 | ||
Aon North America, Inc. 5.125% 3/1/2027 | 600 | 599 | ||
Aon North America, Inc. 5.15% 3/1/2029 | 375 | 374 | ||
Bank of America Corp. 0.981% 9/25/2025 (USD-SOFR + 0.91% on 9/25/2024)1 | 4,171 | 4,125 | ||
Bank of America Corp. 1.319% 6/19/2026 (USD-SOFR + 1.15% on 6/19/2025)1 | 2,432 | 2,331 | ||
Bank of America Corp. 4.827% 7/22/2026 (USD-SOFR + 1.75% on 7/22/2025)1 | 1,350 | 1,337 | ||
Bank of America Corp. 4.948% 7/22/2028 (USD-SOFR + 2.04% on 7/22/2027)1 | 350 | 347 | ||
Bank of America Corp. 5.202% 4/25/2029 (USD-SOFR + 1.63% on 4/25/2028)1 | 650 | 649 | ||
Bank of America Corp. 5.819% 9/15/2029 (USD-SOFR + 1.57% on 9/15/2028)1 | 257 | 262 | ||
Bank of New York Mellon Corp. 4.414% 7/24/2026 (USD-SOFR + 1.345% on 7/24/2025)1 | 1,655 | 1,637 | ||
Bank of New York Mellon Corp. 4.975% 3/14/2030 (USD-SOFR + 1.085% on 3/14/2029)1 | 146 | 145 | ||
BNP Paribas SA 3.375% 1/9/20252 | 355 | 350 | ||
BNP Paribas SA 5.497% 5/20/2030 (USD-SOFR + 1.59% on 5/20/2029)1,2 | 300 | 299 | ||
BPCE SA 1.625% 1/14/20252 | 650 | 636 | ||
BPCE SA 6.612% 10/19/2027 (USD-SOFR + 1.98% on 10/19/2026)1,2 | 1,000 | 1,016 | ||
CaixaBank, SA 6.684% 9/13/2027 (USD-SOFR + 2.08% on 9/13/2026)1,2 | 600 | 612 | ||
CaixaBank, SA 6.208% 1/18/2029 (USD-SOFR + 2.70% on 1/18/2028)1,2 | 100 | 102 | ||
CaixaBank, SA 5.673% 3/15/2030 (USD-SOFR + 1.78% on 3/15/2029)1,2 | 215 | 214 | ||
Capital One Financial Corp. 3.20% 2/5/2025 | 582 | 573 | ||
Capital One Financial Corp. 4.25% 4/30/2025 | 1,380 | 1,364 | ||
Capital One Financial Corp. 4.985% 7/24/2026 (USD-SOFR + 2.16% on 7/24/2025)1 | 1,375 | 1,363 | ||
Capital One Financial Corp. 5.70% 2/1/2030 (USD-SOFR + 1.905% on 2/1/2029)1 | 213 | 214 | ||
Charles Schwab Corp. (The) 5.875% 8/24/2026 | 250 | 253 | ||
Charles Schwab Corp. (The) 5.643% 5/19/2029 (USD-SOFR + 2.21% on 5/19/2028)1 | 115 | 117 | ||
Citibank, NA 5.438% 4/30/2026 | 1,950 | 1,958 | ||
Citibank, NA 5.803% 9/29/2028 | 1,500 | 1,541 | ||
Citigroup, Inc. 1.281% 11/3/2025 (USD-SOFR + 0.528% on 11/3/2024)1 | 1,225 | 1,206 | ||
Citigroup, Inc. 5.174% 2/13/2030 (USD-SOFR + 1.364% on 2/13/2029)1 | 350 | 348 | ||
Citizens Financial Group, Inc. 5.841% 1/23/2030 (USD-SOFR + 2.01% on 1/23/2029)1 | 300 | 299 | ||
Corebridge Financial, Inc. 3.50% 4/4/2025 | 638 | 627 | ||
Deutsche Bank AG 6.819% 11/20/2029 (USD-SOFR + 2.51% on 11/20/2028)1 | 400 | 416 | ||
Global Payments, Inc. 2.65% 2/15/2025 | 875 | 858 | ||
Goldman Sachs Group, Inc. 5.70% 11/1/2024 | 2,215 | 2,216 | ||
Goldman Sachs Group, Inc. 3.50% 4/1/2025 | 2,413 | 2,377 | ||
Goldman Sachs Group, Inc. 6.484% 10/24/2029 (USD-SOFR + 1.77% on 10/24/2028)1 | 425 | 444 | ||
Goldman Sachs Group, Inc. 5.727% 4/25/2030 (USD-SOFR + 1.265% on 4/25/2029)1 | 850 | 865 | ||
HSBC Holdings PLC 5.887% 8/14/2027 (USD-SOFR + 1.57% on 8/14/2026)1 | 1,950 | 1,965 | ||
HSBC Holdings PLC 6.161% 3/9/2029 (USD-SOFR + 1.97% on 3/9/2028)1 | 425 | 435 | ||
HSBC USA, Inc. 5.625% 3/17/2025 | 1,132 | 1,132 | ||
Intercontinental Exchange, Inc. 4.00% 9/15/2027 | 125 | 121 | ||
JPMorgan Chase & Co. 1.561% 12/10/2025 (USD-SOFR + 0.605% on 12/10/2024)1 | 3,880 | 3,808 | ||
JPMorgan Chase & Co. 4.08% 4/26/2026 (USD-SOFR + 1.32% on 4/26/2025)1 | 2,914 | 2,876 | ||
JPMorgan Chase & Co. 5.04% 1/23/2028 (USD-SOFR + 1.19% on 1/23/2027)1 | 1,800 | 1,791 | ||
JPMorgan Chase & Co. 5.571% 4/22/2028 (USD-SOFR + 0.93% on 4/22/2027)1 | 630 | 635 | ||
JPMorgan Chase & Co. 5.299% 7/24/2029 (USD-SOFR + 1.45% on 7/24/2028)1 | 250 | 251 | ||
JPMorgan Chase & Co. 6.087% 10/23/2029 (USD-SOFR + 1.57% on 10/23/2028)1 | 400 | 413 | ||
JPMorgan Chase & Co. 5.581% 4/22/2030 (USD-SOFR + 1.16% on 4/22/2029)1 | 450 | 457 | ||
Lloyds Banking Group PLC 3.87% 7/9/2025 (1-year UST Yield Curve Rate T Note Constant Maturity + 3.50% on 7/9/2024)1 | 875 | 875 | ||
Lloyds Banking Group PLC 5.985% 8/7/2027 (1-year UST Yield Curve Rate T Note Constant Maturity + 1.48% on 8/7/2026)1 | 600 | 604 | ||
Lloyds Banking Group PLC 5.462% 1/5/2028 (1-year UST Yield Curve Rate T Note Constant Maturity + 1.375% on 1/5/2027)1 | 225 | 225 | ||
Metropolitan Life Global Funding I 3.45% 12/18/20262 | 450 | 433 | ||
Morgan Stanley 1.164% 10/21/2025 (USD-SOFR + 0.56% on 10/21/2024)1 | 3,544 | 3,493 | ||
67 | Capital Group Fixed Income ETF Trust |
Capital Group Short Duration Income ETF (continued)
Bonds, notes & other debt instruments (continued) | Principal amount (000) | Value (000) | ||
Corporate bonds, notes & loans (continued) | ||||
Financials (continued) | ||||
Morgan Stanley 5.652% 4/13/2028 (USD-SOFR + 1.01% on 4/13/2027)3 | USD1,775 | $1,793 | ||
Morgan Stanley 5.449% 7/20/2029 (USD-SOFR + 1.63% on 7/20/2028)1 | 475 | 478 | ||
Morgan Stanley 6.407% 11/1/2029 (USD-SOFR + 1.83% on 11/1/2028)1 | 305 | 318 | ||
Morgan Stanley 5.173% 1/16/2030 (USD-SOFR + 1.45% on 1/16/2029)1 | 325 | 324 | ||
Morgan Stanley 5.656% 4/18/2030 (USD-SOFR + 1.26% on 4/18/2029)1 | 550 | 559 | ||
Nasdaq, Inc. 5.65% 6/28/2025 | 1,025 | 1,026 | ||
National Australia Bank, Ltd. 5.087% 6/11/2027 | 750 | 751 | ||
NatWest Group PLC 5.583% 3/1/2028 (1-year UST Yield Curve Rate T Note Constant Maturity + 1.10% on 3/1/2027)1 | 450 | 451 | ||
PNC Financial Services Group, Inc. 5.671% 10/28/2025 (USD-SOFR + 1.09% on 10/28/2024)1 | 1,088 | 1,087 | ||
PNC Financial Services Group, Inc. 4.758% 1/26/2027 (USD-SOFR + 1.085% on 1/26/2026)1 | 650 | 642 | ||
PNC Financial Services Group, Inc. 6.615% 10/20/2027 (USD-SOFR + 1.73% on 10/20/2026)1 | 1,010 | 1,035 | ||
PNC Financial Services Group, Inc. 5.582% 6/12/2029 (USD-SOFR + 1.841% on 6/12/2028)1 | 108 | 109 | ||
PRICOA Global Funding I 1.15% 12/6/20242 | 1,088 | 1,067 | ||
Royal Bank of Canada 5.66% 10/25/2024 | 310 | 310 | ||
Royal Bank of Canada 4.875% 1/12/2026 | 530 | 526 | ||
Sumitomo Mitsui Financial Group, Inc. 5.716% 9/14/2028 | 475 | 484 | ||
Synchrony Bank 5.40% 8/22/2025 | 1,000 | 993 | ||
Toronto-Dominion Bank (The) 0.75% 9/11/2025 | 875 | 828 | ||
Truist Financial Corp. 6.047% 6/8/2027 (USD-SOFR + 2.05% on 6/8/2026)1 | 2,430 | 2,448 | ||
Truist Financial Corp. 5.435% 1/24/2030 (USD-SOFR + 1.62% on 1/24/2029)1 | 32 | 32 | ||
U.S. Bancorp 1.45% 5/12/2025 | 1,133 | 1,094 | ||
UBS Group AG 6.246% 9/22/2029 (1-year UST Yield Curve Rate T Note Constant Maturity + 1.80% on 9/22/2028)1,2 | 350 | 360 | ||
UBS Group AG 5.428% 2/8/2030 (1-year UST Yield Curve Rate T Note Constant Maturity + 1.52% on 2/8/2029)1,2 | 200 | 200 | ||
Wells Fargo & Co. 2.406% 10/30/2025 (3-month USD CME Term SOFR + 1.087% on 10/30/2024)1 | 1,360 | 1,345 | ||
Wells Fargo & Co. 5.707% 4/22/2028 (USD-SOFR + 1.07% on 4/22/2027)1 | 1,350 | 1,362 | ||
Wells Fargo & Co. 4.808% 7/25/2028 (USD-SOFR + 1.98% on 7/25/2027)1 | 150 | 148 | ||
Wells Fargo & Co. 5.574% 7/25/2029 (USD-SOFR + 1.74% on 7/25/2028)1 | 650 | 656 | ||
Wells Fargo & Co. 6.303% 10/23/2029 (USD-SOFR + 1.79% on 10/23/2028)1 | 850 | 882 | ||
Wells Fargo & Co. 5.198% 1/23/2030 (USD-SOFR + 1.50% on 1/23/2029)1 | 325 | 324 | ||
Wells Fargo Bank, N.A. 5.45% 8/7/2026 | 800 | 803 | ||
79,849 | ||||
Health care 4.90% | ||||
AbbVie, Inc. 2.60% 11/21/2024 | 1,380 | 1,365 | ||
AbbVie, Inc. 4.80% 3/15/2027 | 875 | 871 | ||
AbbVie, Inc. 4.80% 3/15/2029 | 825 | 822 | ||
Amgen, Inc. 1.90% 2/21/2025 | 1,055 | 1,031 | ||
Amgen, Inc. 5.507% 3/2/2026 | 885 | 885 | ||
Amgen, Inc. 2.20% 2/21/2027 | 300 | 278 | ||
Amgen, Inc. 5.15% 3/2/2028 | 658 | 658 | ||
AstraZeneca Finance, LLC 4.85% 2/26/2029 | 450 | 449 | ||
Baxter International, Inc. 1.322% 11/29/2024 | 2,527 | 2,481 | ||
Baxter International, Inc. 1.915% 2/1/2027 | 1,000 | 917 | ||
Becton, Dickinson and Co. 3.734% 12/15/2024 | 445 | 441 | ||
Becton, Dickinson and Co. 4.874% 2/8/2029 | 315 | 313 | ||
Becton, Dickinson and Co. 5.081% 6/7/2029 | 378 | 378 | ||
Boston Scientific Corp. 1.90% 6/1/2025 | 505 | 489 | ||
Bristol-Myers Squibb Co. 4.90% 2/22/2027 | 2,000 | 1,995 | ||
Bristol-Myers Squibb Co. 4.90% 2/22/2029 | 900 | 898 | ||
Cigna Group (The) 5.00% 5/15/2029 | 500 | 498 | ||
CVS Health Corp. 2.625% 8/15/2024 | 450 | 448 | ||
CVS Health Corp. 5.00% 2/20/2026 | 1,900 | 1,886 | ||
CVS Health Corp. 5.00% 1/30/2029 | 210 | 208 | ||
CVS Health Corp. 5.40% 6/1/2029 | 825 | 826 | ||
Capital Group Fixed Income ETF Trust | 68 |
Capital Group Short Duration Income ETF (continued)
Bonds, notes & other debt instruments (continued) | Principal amount (000) | Value (000) | ||
Corporate bonds, notes & loans (continued) | ||||
Health care (continued) | ||||
Elevance Health, Inc. 3.35% 12/1/2024 | USD245 | $243 | ||
Elevance Health, Inc. 2.375% 1/15/2025 | 1,106 | 1,087 | ||
GE HealthCare Technologies, Inc. 5.55% 11/15/2024 | 380 | 380 | ||
HCA, Inc. 5.375% 2/1/2025 | 1,906 | 1,900 | ||
HCA, Inc. 5.20% 6/1/2028 | 120 | 120 | ||
Humana, Inc. 3.85% 10/1/2024 | 1,180 | 1,175 | ||
Johnson & Johnson 4.80% 6/1/2029 | 750 | 756 | ||
Laboratory Corp. of America Holdings 3.60% 2/1/2025 | 977 | 965 | ||
Pfizer Investment Enterprises Pte., Ltd. 4.45% 5/19/2026 | 1,000 | 988 | ||
Pfizer Investment Enterprises Pte., Ltd. 4.45% 5/19/2028 | 500 | 491 | ||
Teva Pharmaceutical Finance Netherlands III BV 3.15% 10/1/2026 | 700 | 657 | ||
Thermo Fisher Scientific, Inc. 1.215% 10/18/2024 | 400 | 395 | ||
27,294 | ||||
Utilities 4.86% | ||||
CenterPoint Energy Houston Electric, LLC 5.20% 10/1/2028 | 250 | 252 | ||
CenterPoint Energy, Inc. 5.25% 8/10/2026 | 425 | 424 | ||
Consumers Energy Co. 4.90% 2/15/2029 | 300 | 299 | ||
DTE Energy Co. 5.10% 3/1/2029 | 350 | 347 | ||
Duke Energy Corp. 5.00% 12/8/2025 | 1,480 | 1,473 | ||
Edison International 4.70% 8/15/2025 | 4,149 | 4,103 | ||
Edison International 5.25% 11/15/2028 | 275 | 273 | ||
Edison International 5.45% 6/15/2029 | 600 | 600 | ||
Entergy Louisiana, LLC 0.95% 10/1/2024 | 1,480 | 1,463 | ||
Eversource Energy 5.95% 2/1/2029 | 275 | 281 | ||
Florida Power & Light Co. 5.05% 4/1/2028 | 200 | 201 | ||
Florida Power & Light Co. 5.15% 6/15/2029 | 525 | 530 | ||
Georgia Power Co. 5.004% 2/23/2027 | 580 | 578 | ||
Georgia Power Co. 4.65% 5/16/2028 | 400 | 394 | ||
Jersey Central Power & Light Co. 4.30% 1/15/20262 | 3,592 | 3,530 | ||
NiSource, Inc. 0.95% 8/15/2025 | 240 | 228 | ||
NiSource, Inc. 5.20% 7/1/2029 | 475 | 473 | ||
Pacific Gas and Electric Co. 3.45% 7/1/2025 | 4,542 | 4,432 | ||
Pacific Gas and Electric Co. 3.15% 1/1/2026 | 750 | 723 | ||
Pacific Gas and Electric Co. 2.95% 3/1/2026 | 750 | 718 | ||
Pacific Gas and Electric Co. 6.10% 1/15/2029 | 532 | 545 | ||
Pacific Gas and Electric Co. 5.55% 5/15/2029 | 445 | 446 | ||
PacifiCorp 5.10% 2/15/2029 | 375 | 375 | ||
PacifiCorp 5.30% 2/15/2031 | 247 | 246 | ||
Public Service Electric and Gas Co. 3.00% 5/15/2025 | 472 | 463 | ||
Southern California Edison Co. 4.20% 6/1/2025 | 1,297 | 1,280 | ||
Southern California Edison Co. 4.90% 6/1/2026 | 700 | 695 | ||
Southern California Edison Co. 4.875% 2/1/2027 | 340 | 338 | ||
Southern California Edison Co. 5.85% 11/1/2027 | 105 | 107 | ||
Virginia Electric & Power 3.10% 5/15/2025 | 530 | 519 | ||
WEC Energy Group, Inc. 5.60% 9/12/2026 | 325 | 326 | ||
Xcel Energy, Inc. 3.35% 12/1/2026 | 450 | 430 | ||
27,092 | ||||
Industrials 3.03% | ||||
Air Lease Corp. 5.30% 6/25/2026 | 850 | 847 | ||
BAE Systems PLC 5.125% 3/26/20292 | 200 | 199 | ||
Boeing Co. 4.875% 5/1/2025 | 4,114 | 4,071 | ||
Boeing Co. 2.196% 2/4/2026 | 2,660 | 2,501 | ||
Boeing Co. 6.259% 5/1/20272 | 626 | 630 | ||
Boeing Co. 6.298% 5/1/20292 | 253 | 257 | ||
Burlington Northern Santa Fe, LLC 3.40% 9/1/2024 | 225 | 224 | ||
Canadian Pacific Railway Co. 1.35% 12/2/2024 | 1,128 | 1,108 | ||
Carrier Global Corp. 2.242% 2/15/2025 | 1,210 | 1,185 | ||
CSX Corp. 3.40% 8/1/2024 | 685 | 684 | ||
Eaton Corp. 6.50% 6/1/2025 | 65 | 66 | ||
Ingersoll-Rand, Inc. 5.197% 6/15/2027 | 650 | 651 | ||
69 | Capital Group Fixed Income ETF Trust |
Capital Group Short Duration Income ETF (continued)
Bonds, notes & other debt instruments (continued) | Principal amount (000) | Value (000) | ||
Corporate bonds, notes & loans (continued) | ||||
Industrials (continued) | ||||
Ingersoll-Rand, Inc. 5.40% 8/14/2028 | USD260 | $262 | ||
Ingersoll-Rand, Inc. 5.176% 6/15/2029 | 312 | 312 | ||
L3Harris Technologies, Inc. 5.40% 1/15/2027 | 350 | 352 | ||
Lockheed Martin Corp. 4.95% 10/15/2025 | 440 | 439 | ||
Northrop Grumman Corp. 2.93% 1/15/2025 | 1,140 | 1,124 | ||
RTX Corp. 3.95% 8/16/2025 | 1,250 | 1,229 | ||
RTX Corp. 5.75% 11/8/2026 | 700 | 708 | ||
16,849 | ||||
Consumer discretionary 2.85% | ||||
Daimler Trucks Finance North America, LLC 5.00% 1/15/20272 | 350 | 348 | ||
Daimler Trucks Finance North America, LLC 5.125% 9/25/20272 | 675 | 672 | ||
Daimler Trucks Finance North America, LLC 5.125% 9/25/20292 | 214 | 212 | ||
Ford Motor Credit Co., LLC 5.125% 6/16/2025 | 2,818 | 2,798 | ||
Ford Motor Credit Co., LLC 3.375% 11/13/2025 | 1,100 | 1,065 | ||
Ford Motor Credit Co., LLC 6.95% 6/10/2026 | 1,225 | 1,249 | ||
Ford Motor Credit Co., LLC 5.85% 5/17/2027 | 1,000 | 1,000 | ||
Ford Motor Credit Co., LLC 6.798% 11/7/2028 | 300 | 310 | ||
Ford Motor Credit Co., LLC 5.80% 3/8/2029 | 350 | 349 | ||
General Motors Financial Co., Inc. 1.20% 10/15/2024 | 1,256 | 1,240 | ||
General Motors Financial Co., Inc. 2.75% 6/20/2025 | 1,060 | 1,031 | ||
General Motors Financial Co., Inc. 5.40% 4/6/2026 | 300 | 299 | ||
Home Depot, Inc. 5.15% 6/25/2026 | 750 | 751 | ||
Home Depot, Inc. 4.875% 6/25/2027 | 750 | 749 | ||
Home Depot, Inc. 4.75% 6/25/2029 | 511 | 508 | ||
Hyundai Capital America 1.80% 10/15/20252 | 990 | 944 | ||
Hyundai Capital America 5.45% 6/24/20262 | 529 | 528 | ||
Hyundai Capital America 5.30% 3/19/20272 | 525 | 524 | ||
Hyundai Capital America 6.10% 9/21/20282 | 275 | 282 | ||
Hyundai Capital America 6.50% 1/16/20292 | 53 | 55 | ||
Marriott International, Inc. 5.55% 10/15/2028 | 250 | 253 | ||
Marriott International, Inc. 4.875% 5/15/2029 | 350 | 346 | ||
McDonald’s Corp. 5.00% 5/17/2029 | 361 | 361 | ||
15,874 | ||||
Communication services 1.91% | ||||
AT&T, Inc. 1.70% 3/25/2026 | 825 | 775 | ||
Charter Communications Operating, LLC 4.908% 7/23/2025 | 666 | 660 | ||
Charter Communications Operating, LLC 6.15% 11/10/2026 | 2,015 | 2,035 | ||
Charter Communications Operating, LLC 6.10% 6/1/2029 | 596 | 598 | ||
Comcast Corp. 5.25% 11/7/2025 | 210 | 210 | ||
Comcast Corp. 5.10% 6/1/2029 | 600 | 604 | ||
Netflix, Inc. 5.875% 2/15/2025 | 1,515 | 1,518 | ||
T-Mobile USA, Inc. 3.50% 4/15/2025 | 1,370 | 1,347 | ||
T-Mobile USA, Inc. 2.25% 2/15/2026 | 1,043 | 991 | ||
T-Mobile USA, Inc. 4.80% 7/15/2028 | 175 | 173 | ||
Verizon Communications, Inc. 3.50% 11/1/2024 | 195 | 193 | ||
Verizon Communications, Inc. 3.376% 2/15/2025 | 572 | 564 | ||
WarnerMedia Holdings, Inc. 3.788% 3/15/2025 | 990 | 976 | ||
10,644 | ||||
Consumer staples 1.87% | ||||
Altria Group, Inc. 2.35% 5/6/2025 | 1,675 | 1,629 | ||
BAT Capital Corp. 3.222% 8/15/2024 | 1,317 | 1,312 | ||
BAT International Finance PLC 5.931% 2/2/2029 | 300 | 307 | ||
Campbell Soup Co. 5.20% 3/19/2027 | 425 | 426 | ||
Campbell Soup Co. 5.20% 3/21/2029 | 135 | 135 | ||
Conagra Brands, Inc. 4.60% 11/1/2025 | 500 | 494 | ||
Constellation Brands, Inc. 5.00% 2/2/2026 | 300 | 299 | ||
Constellation Brands, Inc. 4.35% 5/9/2027 | 290 | 283 | ||
J. M. Smucker Co. (The) 5.90% 11/15/2028 | 289 | 298 | ||
Philip Morris International, Inc. 5.125% 11/15/2024 | 541 | 540 | ||
Capital Group Fixed Income ETF Trust | 70 |
Capital Group Short Duration Income ETF (continued)
Bonds, notes & other debt instruments (continued) | Principal amount (000) | Value (000) | ||
Corporate bonds, notes & loans (continued) | ||||
Consumer staples (continued) | ||||
Philip Morris International, Inc. 5.00% 11/17/2025 | USD1,365 | $1,359 | ||
Philip Morris International, Inc. 4.875% 2/13/2026 | 475 | 472 | ||
Philip Morris International, Inc. 4.75% 2/12/2027 | 550 | 546 | ||
Philip Morris International, Inc. 5.25% 9/7/2028 | 250 | 252 | ||
Philip Morris International, Inc. 4.875% 2/13/2029 | 350 | 346 | ||
Reynolds American, Inc. 4.45% 6/12/2025 | 1,735 | 1,715 | ||
10,413 | ||||
Information technology 1.50% | ||||
Apple, Inc. 0.55% 8/20/2025 | 495 | 470 | ||
Broadcom Corp. 3.125% 1/15/2025 | 245 | 242 | ||
Broadcom, Inc. 3.625% 10/15/2024 | 549 | 545 | ||
Broadcom, Inc. 3.15% 11/15/2025 | 1,910 | 1,851 | ||
Hewlett Packard Enterprise Co. 5.90% 10/1/2024 | 964 | 964 | ||
Microchip Technology, Inc. 5.05% 3/15/2029 | 350 | 347 | ||
Oracle Corp. 3.40% 7/8/2024 | 978 | 978 | ||
Oracle Corp. 2.50% 4/1/2025 | 2,420 | 2,365 | ||
Oracle Corp. 1.65% 3/25/2026 | 500 | 469 | ||
Texas Instruments, Inc. 4.60% 2/8/2029 | 130 | 129 | ||
8,360 | ||||
Energy 1.49% | ||||
Canadian Natural Resources, Ltd. 2.05% 7/15/2025 | 1,486 | 1,432 | ||
Chevron USA, Inc. 0.687% 8/12/2025 | 400 | 381 | ||
Columbia Pipelines Holding Co., LLC 6.042% 8/15/20282 | 350 | 358 | ||
Diamondback Energy, Inc. 5.20% 4/18/2027 | 975 | 976 | ||
Enbridge, Inc. 5.90% 11/15/2026 | 450 | 455 | ||
Enbridge, Inc. 6.00% 11/15/2028 | 300 | 309 | ||
Energy Transfer, LP 6.10% 12/1/2028 | 438 | 452 | ||
Energy Transfer, LP 5.25% 7/1/2029 | 273 | 271 | ||
Exxon Mobil Corp. 2.002% 8/16/2024 | 130 | 129 | ||
Exxon Mobil Corp. 2.992% 3/19/2025 | 485 | 477 | ||
Kinder Morgan, Inc. 5.00% 2/1/2029 | 319 | 316 | ||
MPLX, LP 4.875% 12/1/2024 | 636 | 633 | ||
ONEOK, Inc. 2.75% 9/1/2024 | 165 | 164 | ||
ONEOK, Inc. 5.55% 11/1/2026 | 490 | 492 | ||
ONEOK, Inc. 5.65% 11/1/2028 | 620 | 630 | ||
Petroleos Mexicanos 6.875% 10/16/2025 | 50 | 50 | ||
Shell International Finance BV 3.25% 5/11/2025 | 515 | 506 | ||
Williams Companies, Inc. 5.30% 8/15/2028 | 275 | 276 | ||
8,307 | ||||
Real estate 1.10% | ||||
COPT Defense Properties, LP 2.25% 3/15/2026 | 565 | 534 | ||
Equinix, Inc. 2.625% 11/18/2024 | 2,143 | 2,118 | ||
Equinix, Inc. 1.00% 9/15/2025 | 2,124 | 2,011 | ||
Scentre Group Trust 1 3.50% 2/12/20252 | 640 | 631 | ||
VICI Properties, LP 4.625% 6/15/20252 | 855 | 845 | ||
6,139 | ||||
Materials 0.80% | ||||
Anglo American Capital PLC 3.625% 9/11/20242 | 1,035 | 1,030 | ||
BHP Billiton Finance (USA), Ltd. 4.875% 2/27/2026 | 375 | 373 | ||
BHP Billiton Finance (USA), Ltd. 5.10% 9/8/2028 | 250 | 251 | ||
Celanese US Holdings, LLC 6.35% 11/15/2028 | 536 | 551 | ||
Dow Chemical Co. (The) 4.55% 11/30/2025 | 65 | 64 | ||
International Flavors & Fragrances, Inc. 1.23% 10/1/20252 | 1,189 | 1,125 | ||
71 | Capital Group Fixed Income ETF Trust |
Capital Group Short Duration Income ETF (continued)
Bonds, notes & other debt instruments (continued) | Principal amount (000) | Value (000) | ||
Corporate bonds, notes & loans (continued) | ||||
Materials (continued) | ||||
LYB International Finance III, LLC 1.25% 10/1/2025 | USD670 | $634 | ||
Nutrien, Ltd. 5.95% 11/7/2025 | 29 | 29 | ||
Sherwin-Williams Co. 4.05% 8/8/2024 | 420 | 419 | ||
4,476 | ||||
Total corporate bonds, notes & loans | 215,297 | |||
Mortgage-backed obligations 32.73% | ||||
Collateralized mortgage-backed obligations (privately originated) 12.54% | ||||
Arroyo Mortgage Trust, Series 2019-1, Class A1, 3.805% 1/25/20492,3,4 | 87 | 83 | ||
Arroyo Mortgage Trust, Series 2019-2, Class A3, 3.80% 4/25/20492,3,4 | 390 | 372 | ||
Arroyo Mortgage Trust, Series 2022-1, Class A1A, 2.495% 12/25/2056 (3.495% on 2/25/2026)1,2,4 | 313 | 292 | ||
BRAVO Residential Funding Trust, Series 2020-RPL1, Class A1, 2.50% 5/26/20592,3,4 | 79 | 76 | ||
Cascade Funding Mortgage Trust, Series 2023-HB12, Class A, 4.25% 7/25/20262,3,4 | 505 | 496 | ||
CIM Trust, Series 2018-R3, Class A1, 5.00% 12/25/20572,3,4 | 50 | 49 | ||
COLT Funding, LLC, Series 2023-1, Class A1, 6.048% 4/25/2068 (7.048% on 4/1/2027)1,2,4 | 1,127 | 1,124 | ||
Connecticut Avenue Securities Trust, Series 2014-C04, Class 1M2, (30-day Average USD-SOFR + 5.014%) 10.35% 11/25/20243,4 | 156 | 158 | ||
Connecticut Avenue Securities Trust, Series 2015-C01, Class 1M2, (30-day Average USD-SOFR + 4.414%) 9.75% 2/25/20253,4 | 475 | 483 | ||
Connecticut Avenue Securities Trust, Series 2016-C02, Class 1M2, (30-day Average USD-SOFR + 6.114%) 11.45% 9/25/20283,4 | 95 | 99 | ||
Connecticut Avenue Securities Trust, Series 2023-R01, Class 1M1, (30-day Average USD-SOFR + 2.40%) 7.735% 12/25/20422,3,4 | 1,286 | 1,324 | ||
Connecticut Avenue Securities Trust, Series 2023-R05, Class 1M1, (30-day Average USD-SOFR + 1.90%) 7.235% 6/25/20432,3,4 | 424 | 429 | ||
Connecticut Avenue Securities Trust, Series 2023-R06, Class 1M1, (30-day Average USD-SOFR + 1.70%) 7.035% 7/25/20432,3,4 | 454 | 458 | ||
Connecticut Avenue Securities Trust, Series 2024-R01, Class 1M1, (30-day Average USD-SOFR + 1.05%) 6.385% 1/25/20442,3,4 | 1,385 | 1,387 | ||
Connecticut Avenue Securities Trust, Series 2024-R01, Class 1B1, (30-day Average USD-SOFR + 2.70%) 8.035% 1/25/20442,3,4 | 995 | 1,017 | ||
Connecticut Avenue Securities Trust, Series 2024-R02, Class 1M1, (30-day Average USD-SOFR + 1.10%) 6.435% 2/25/20442,3,4 | 1,008 | 1,009 | ||
Connecticut Avenue Securities Trust, Series 2024-R02, Class 1B1, (30-day Average USD-SOFR + 2.50%) 7.835% 2/25/20442,3,4 | 593 | 604 | ||
Connecticut Avenue Securities Trust, Series 2024-R04, Class 1M1, (30-day Average USD-SOFR + 1.10%) 6.424% 5/25/20442,3,4 | 1,449 | 1,451 | ||
Connecticut Avenue Securities Trust, Series 2024-R04, Class 1B1, (30-day Average USD-SOFR + 2.20%) 7.535% 5/25/20442,3,4 | 333 | 335 | ||
Freddie Mac Structured Agency Credit Risk Debt Notes, Series 2015-DNA1, Class M3, (30-day Average USD-SOFR + 3.414%) 8.75% 10/25/20273,4 | 27 | 27 | ||
Freddie Mac Structured Agency Credit Risk Debt Notes, Series 2015-DNA3, Class M3, (30-day Average USD-SOFR + 4.814%) 10.15% 4/25/20283,4 | 65 | 67 | ||
Freddie Mac Structured Agency Credit Risk Debt Notes, Series 2016-DNA1, Class M3, (30-day Average USD-SOFR + 5.664%) 11.00% 7/25/20283,4 | 195 | 206 | ||
Freddie Mac Structured Agency Credit Risk Debt Notes, Series 2016-DNA3, Class M3, (30-day Average USD-SOFR + 5.114%) 10.45% 12/25/20283,4 | 155 | 163 | ||
Freddie Mac Structured Agency Credit Risk Debt Notes, Series 2022-DNA4, Class M1A, (30-day Average USD-SOFR + 2.20%) 7.535% 5/25/20422,3,4 | 168 | 171 | ||
Freddie Mac Structured Agency Credit Risk Debt Notes, Series 2022-DNA5, Class M1A, (30-day Average USD-SOFR + 2.95%) 8.285% 6/25/20422,3,4 | 1,203 | 1,236 | ||
Freddie Mac Structured Agency Credit Risk Debt Notes, Series 2022-DNA6, Class M1A, (30-day Average USD-SOFR + 2.15%) 7.485% 9/25/20422,3,4 | 1,922 | 1,949 | ||
Freddie Mac Structured Agency Credit Risk Debt Notes, Series 2024-DNA1, Class A1, (30-day Average USD-SOFR + 1.35%) 6.685% 2/25/20442,3,4 | 1,573 | 1,583 | ||
Freddie Mac Structured Agency Credit Risk Debt Notes, Series 2024-DNA2, Class A1, (30-day Average USD-SOFR + 1.25%) 6.585% 5/25/20442,3,4 | 2,165 | 2,175 | ||
Freddie Mac Structured Agency Credit Risk Debt Notes, Series 2020-DNA1, Class M2, (30-day Average USD-SOFR + 1.814%) 7.15% 1/25/20502,3,4 | 223 | 224 | ||
Capital Group Fixed Income ETF Trust | 72 |
Capital Group Short Duration Income ETF (continued)
Bonds, notes & other debt instruments (continued) | Principal amount (000) | Value (000) | ||
Mortgage-backed obligations (continued) | ||||
Collateralized mortgage-backed obligations (privately originated) (continued) | ||||
Freddie Mac Structured Agency Credit Risk Debt Notes, Series 2020-DNA2, Class M2, (30-day Average USD-SOFR + 1.964%) 7.30% 2/25/20502,3,4 | USD161 | $163 | ||
GCAT Trust, Series 2024-NQM2, Class A1, 6.085% 6/25/2059 (7.359% on 5/1/2028)1,2,4 | 931 | 933 | ||
GS Mortgage-Backed Securities Trust, Series 2024-RPL2, Class A1, 3.75% 7/25/2061 (4.75% on 2/1/2028)1,2,4 | 1,983 | 1,879 | ||
Imperial Fund Mortgage Trust, Series 2022-NQM7, Class A1, 7.369% 11/25/2067 (8.369% on 11/1/2026)1,2,4 | 522 | 528 | ||
Imperial Fund Mortgage Trust, Series 2023-NQM1, Class A1, 5.941% 2/25/2068 (6.941% on 1/1/2027)1,2,4 | 1,673 | 1,660 | ||
Legacy Mortgage Asset Trust, Series 2020-GS4, Class A1, 6.25% 2/25/2060 (7.25% on 5/28/2024)1,2,4 | 1,184 | 1,189 | ||
Legacy Mortgage Asset Trust, Series 2020-GS3, Class A1, 7.25% 5/25/2060 (7.25% on 4/25/2024)1,2,4 | 1,049 | 1,065 | ||
Mill City Mortgage Trust, Series 2019-GS2, Class A1, 2.75% 8/25/20592,3,4 | 307 | 290 | ||
Mill City Mortgage Trust, Series 2019-1, Class A1, 3.25% 10/25/20692,3,4 | 139 | 134 | ||
Morgan Stanley Residential Mortgage Loan Trust, Series 2024-NQM2, Class A1, 6.386% 5/25/2069 (7.386% on 5/1/2028)1,2,4 | 2,217 | 2,240 | ||
New Residential Mortgage Loan Trust, Series 2019-RPL3, Class A1, 2.75% 7/25/20592,3,4 | 664 | 624 | ||
New Residential Mortgage Loan Trust, Series 2020-RPL1, Class A1, 2.75% 11/25/20592,3,4 | 245 | 229 | ||
New York Mortgage Trust, Series 2024-CP1, Class A1, 3.75% 2/25/20682,3,4 | 599 | 553 | ||
Onslow Bay Financial Mortgage Loan Trust, Series 2024-HYB1, Class A1, 3.564% 3/25/20532,3,4 | 1,179 | 1,144 | ||
Onslow Bay Financial Mortgage Loan Trust, Series 2022-NQM9, Class A1A, 6.45% 9/25/2062 (7.45% on 11/1/2026)1,2,4 | 851 | 852 | ||
Onslow Bay Financial Mortgage Loan Trust, Series 2023-NQM1, Class A1, 6.12% 11/25/2062 (7.12% on 12/1/2026)1,2,4 | 535 | 535 | ||
Onslow Bay Financial Mortgage Loan Trust, Series 2023-NQM4, Class A1, 6.113% 3/25/2063 (7.113% on 5/1/2027)1,2,4 | 578 | 579 | ||
Onslow Bay Financial, LLC, Series 2024-NQM5, Class A1, 5.988% 3/25/2028 (6.988% on 3/1/2028)1,2,4 | 1,336 | 1,336 | ||
Onslow Bay Financial, LLC, Series 2024-HYB2, Class A1, 3.601% 4/25/20532,3,4 | 2,599 | 2,497 | ||
Onslow Bay Financial, LLC, Series 2024-NQM4, Class A1, 6.067% 1/25/2064 (7.067% on 2/1/2028)1,2,4 | 1,798 | 1,797 | ||
Onslow Bay Financial, LLC, Series 2024-NQM7, Class A1, 6.243% 3/25/2064 (7.243% on 4/1/2028)1,2,4 | 1,581 | 1,589 | ||
Onslow Bay Financial, LLC, Series 2024-NQM10, Class A1, 6.18% 5/25/2064 (7.18% on 6/1/2028)2,3,4 | 3,265 | 3,265 | ||
Onslow Bay Financial, LLC, Series 2024-NQM8, Class A1, 6.233% 5/25/20641,2,4 | 4,226 | 4,249 | ||
Progress Residential Trust, Series 2021-SFR2, Class A, 1.546% 4/19/20382,4 | 2,139 | 1,995 | ||
Progress Residential Trust, Series 2021-SFR6, Class A, 1.524% 7/17/20382,4 | 1,957 | 1,808 | ||
Progress Residential Trust, Series 2022-SFR3, Class A, 3.20% 4/17/20392,4 | 491 | 463 | ||
Progress Residential Trust, Series 2024-SFR1, Class A, 3.35% 2/17/20412,4 | 1,154 | 1,063 | ||
Progress Residential Trust, Series 2024-SFR3, Class A, 3.097% 6/17/2041 (3.00% on 7/1/2024)2,4 | 2,249 | 2,027 | ||
Towd Point Mortgage Trust, Series 2015-4, Class M2, 3.75% 4/25/20552,3,4 | 62 | 61 | ||
Towd Point Mortgage Trust, Series 2016-2, Class M1, 3.00% 8/25/20552,3,4 | 435 | 421 | ||
Towd Point Mortgage Trust, Series 2017-1, Class A2, 3.50% 10/25/20562,3,4 | 266 | 261 | ||
Towd Point Mortgage Trust, Series 2017-2, Class A4, 3.542% 4/25/20572,3,4 | 568 | 551 | ||
Towd Point Mortgage Trust, Series 2017-3, Class A1, 2.75% 7/25/20572,3,4 | 161 | 159 | ||
Towd Point Mortgage Trust, Series 2017-6, Class A1, 2.75% 10/25/20572,3,4 | 453 | 437 | ||
Towd Point Mortgage Trust, Series 2018-1, Class A1, 3.00% 1/25/20582,3,4 | 352 | 343 | ||
Towd Point Mortgage Trust, Series 2019-1, Class A1, 3.75% 3/25/20582,3,4 | 484 | 462 | ||
Towd Point Mortgage Trust, Series 2019-2, Class A1, 3.728% 12/25/20582,3,4 | 487 | 465 | ||
Towd Point Mortgage Trust, Series 2023-1, Class A1, 3.75% 1/25/20632,4 | 1,087 | 1,025 | ||
Tricon Residential, Series 2024-SFR2, Class A, 4.75% 6/17/20402,4 | 1,374 | 1,342 | ||
Tricon Residential Trust, Series 2023-SFR2, Class A, 5.00% 12/17/20402,4 | 352 | 347 | ||
Verus Securitization Trust, Series 2023-1, Class A1, 5.85% 12/25/2067 (6.85% on 1/1/2027)1,2,4 | 585 | 581 | ||
Verus Securitization Trust, Series 2023-3, Class A1, 5.93% 3/25/2068 (6.93% on 4/1/2027)1,2,4 | 247 | 246 | ||
73 | Capital Group Fixed Income ETF Trust |
Capital Group Short Duration Income ETF (continued)
Bonds, notes & other debt instruments (continued) | Principal amount (000) | Value (000) | ||
Mortgage-backed obligations (continued) | ||||
Collateralized mortgage-backed obligations (privately originated) (continued) | ||||
Verus Securitization Trust, Series 2023-5, Class A5, 6.476% 6/25/2068 (7.476% on 6/1/2027)1,2,4 | USD767 | $768 | ||
Verus Securitization Trust, Series 2024-2, Class A1, 6.095% 2/25/2069 (7.095% on 2/1/2028)1,2,4 | 1,689 | 1,688 | ||
Verus Securitization Trust, Series 2024-3, Class A1, 6.338% 4/25/2069 (7.338% on 4/1/2028)1,2,4 | 3,586 | 3,606 | ||
Verus Securitization Trust, Series 2024-4, Class A1, 6.218% 6/25/2069 (7.218% on 5/1/2028)1,2,4 | 1,341 | 1,347 | ||
69,843 | ||||
Federal agency mortgage-backed obligations 11.98% | ||||
Fannie Mae Pool #MA5139 6.00% 9/1/20534 | 8,359 | 8,388 | ||
Freddie Mac Pool #SD4977 5.00% 11/1/2053 | 9,812 | 9,488 | ||
Freddie Mac Pool #RJ1419 5.50% 5/1/2054 | 4,072 | 4,025 | ||
Freddie Mac Pool #RJ1448 5.50% 5/1/2054 | 2,619 | 2,592 | ||
Uniform Mortgage-Backed Security 5.50% 7/1/20544,5 | 7,000 | 6,905 | ||
Uniform Mortgage-Backed Security 6.00% 7/1/20544,5 | 21,000 | 21,062 | ||
Uniform Mortgage-Backed Security 6.50% 7/1/20544,5 | 14,000 | 14,250 | ||
66,710 | ||||
Commercial mortgage-backed securities 8.21% | ||||
AMSR Trust, Series 2021-SFR3, Class A, 1.476% 10/17/20382,4 | 2,477 | 2,261 | ||
ARES Commercial Mortgage Trust., Series 24-IND, Class A, (1-month USD CME Term SOFR + 1.69%) 7.012% 7/15/20412,3,4 | 447 | 447 | ||
Banc of America Commercial Mortgage, Inc., Series 2015-UBS7, Class A4, 3.705% 9/15/20484 | 260 | 253 | ||
Bank Commercial Mortgage Trust, Series 2017-BNK4, Class A3, 3.362% 5/15/20504 | 819 | 781 | ||
Bank Commercial Mortgage Trust, Series 2017-BNK4, Class A4, 3.625% 5/15/20504 | 1,127 | 1,069 | ||
Bank Commercial Mortgage Trust, Series 2019-BN18, Class A4, 3.584% 5/15/20624 | 414 | 372 | ||
Bank of America Merrill Lynch Large Loan, Inc., Series 2015-200P, Class A, 3.218% 4/14/20332,4 | 1,000 | 969 | ||
Barclays Commercial Mortgage Securities, LLC, Series 2018-TALL, Class A, ((1-month USD CME Term SOFR + 0.047%) + 0.872%) 6.248% 3/15/20372,3,4 | 241 | 228 | ||
Benchmark Mortgage Trust, Series 2018-B2, Class A5, 3.882% 2/15/20513,4 | 305 | 286 | ||
Benchmark Mortgage Trust, Series 2018-B3, Class A5, 4.025% 4/10/20514 | 410 | 390 | ||
Benchmark Mortgage Trust, Series 2018-B3, Class AS, 4.195% 4/10/20513,4 | 800 | 746 | ||
BLP Commercial Mortgage Trust, Series 2024-IND2, Class A, (1-month USD CME Term SOFR + 1.342%) 6.671% 3/15/20412,3,4 | 1,046 | 1,040 | ||
BMO Mortgage Trust, Series 2024-5C3, Class AS, 6.286% 2/15/20573,4 | 561 | 574 | ||
BOCA Commercial Mortgage Trust, Series 2022-BOCA, Class A, (1-month USD CME Term SOFR + 1.77%) 7.098% 5/15/20392,3,4 | 500 | 500 | ||
BPR Trust, Series 2022-OANA, Class A, (1-month USD CME Term SOFR + 1.898%) 7.227% 4/15/20372,3,4 | 1,000 | 1,002 | ||
BX Trust, Series 2024-CNYN, Class A, (1-month USD CME Term SOFR + 1.442%) 6.771% 4/15/20292,3,4 | 2,176 | 2,180 | ||
BX Trust, Series 2024-KING, Class A, (1-month USD CME Term SOFR + 1.541%) 6.87% 5/15/20342,3,4 | 664 | 665 | ||
BX Trust, Series 2021-VOLT, Class B, (1-month USD CME Term SOFR + 1.064%) 6.393% 9/15/20362,3,4 | 189 | 186 | ||
BX Trust, Series 2021-ACNT, Class A, (1-month USD CME Term SOFR + 0.964%) 6.293% 11/15/20382,3,4 | 472 | 466 | ||
BX Trust, Series 2022-AHP, Class A, (1-month USD CME Term SOFR + 0.99%) 6.319% 2/15/20392,3,4 | 483 | 478 | ||
BX Trust, Series 2022-PSB, Class A, (1-month USD CME Term SOFR + 2.451%) 7.78% 8/15/20392,3,4 | 160 | 159 | ||
BX Trust, Series 2022-PSB, Class C, (1-month USD CME Term SOFR + 3.697%) 9.026% 8/15/20392,3,4 | 160 | 160 | ||
BXP Trust, Series 2017-GM, Class A, 3.379% 6/13/20392,4 | 887 | 825 | ||
Citigroup Commercial Mortgage Trust, Series 2023-PRM3, Class A, 6.572% 7/10/20282,3,4 | 750 | 763 | ||
Capital Group Fixed Income ETF Trust | 74 |
Capital Group Short Duration Income ETF (continued)
Bonds, notes & other debt instruments (continued) | Principal amount (000) | Value (000) | ||
Mortgage-backed obligations (continued) | ||||
Commercial mortgage-backed securities (continued) | ||||
Citigroup Commercial Mortgage Trust, Series 2023-SMRT, Class A, 6.015% 10/12/20402,3,4 | USD361 | $362 | ||
Citigroup Commercial Mortgage Trust, Series 2014-GC23, Class A4, 3.622% 7/10/20474 | 352 | 351 | ||
Citigroup Commercial Mortgage Trust, Series 2014-GC25, Class A4, 3.635% 10/10/20474 | 325 | 324 | ||
Citigroup Commercial Mortgage Trust, Series 2016-GC37, Class A4, 3.314% 4/10/20494 | 270 | 259 | ||
Commercial Mortgage Trust, Series 2014-CR20, Class A4, 3.59% 11/10/20474 | 500 | 497 | ||
Commercial Mortgage Trust, Series 2015-PC1, Class A5, 3.902% 7/10/20504 | 445 | 438 | ||
DC Commercial Mortgage Trust, Series 2023-DC, Class A, 6.314% 9/10/20402,4 | 2,490 | 2,556 | ||
ELM Trust 2024, Series 2024-ELM, Class A15, 5.801% 6/10/20392,3,4 | 1,928 | 1,931 | ||
ELM Trust 2024, Series 2024-ELM, Class A10, 5.801% 6/10/20392,3,4 | 1,752 | 1,755 | ||
Extended Stay America Trust, Series 2021-ESH, Class A, (1-month USD CME Term SOFR + 1.194%) 6.523% 7/15/20382,3,4 | 454 | 452 | ||
Extended Stay America Trust, Series 2021-ESH, Class B, (1-month USD CME Term SOFR + 1.494%) 6.823% 7/15/20382,3,4 | 454 | 452 | ||
FIVE Mortgage Trust, Series 2023-V1, Class A3, 5.668% 2/10/20564 | 1,216 | 1,223 | ||
Fontainebleau Miami Beach Trust, CMO, Series 2019-FBLU, Class A, 3.144% 12/10/20362,4 | 995 | 981 | ||
FS Commercial Trust, Series 2023-4SZN, Class A, 7.066% 11/10/20392,4 | 808 | 835 | ||
Great Wolf Trust, Series 2024-WLF2, Class A, (1-month USD CME Term SOFR + 1.691%) 7.02% 5/15/20412,3,4 | 1,356 | 1,357 | ||
GS Mortgage Securities Trust, Series 2018-HULA, Class A, (1-month USD CME Term SOFR + 1.223%) 6.363% 7/15/20252,3,4 | 419 | 418 | ||
GS Mortgage Securities Trust, Series 2014-GC24, Class A5, 3.931% 9/10/20474 | 1,141 | 1,137 | ||
HTL Commercial Mortgage Trust, Series 2024-T53, Class A, 6.072% 5/10/20392,3,4 | 591 | 590 | ||
Intown 2022-Stay Mortgage Trust, Series 2022-STAY, Class A, (1-month USD CME Term SOFR + 2.489%) 7.817% 8/15/20393,4 | 200 | 201 | ||
LUXE Commercial Mortgage Trust, Series 21-TRIP, Class C, (1-month USD CME Term SOFR + 1.864%) 7.20% 10/15/20382,3,4 | 250 | 249 | ||
Manhattan West Mortgage Trust, Series 2020-1MW, Class A, 2.13% 9/10/20392,4 | 857 | 763 | ||
Morgan Stanley Bank of America Merrill Lynch Trust, Series 2014-C18, Class AS, 4.11% 10/15/20473,4 | 592 | 588 | ||
Morgan Stanley Bank of America Merrill Lynch Trust, Series 2015-C21, Class A4, 3.338% 3/15/20484 | 200 | 196 | ||
Morgan Stanley Bank of America Merrill Lynch Trust, Series 2015-C22, Class AS, 3.561% 4/15/20484 | 500 | 486 | ||
Morgan Stanley Bank of America Merrill Lynch Trust, Series 2015-C24, Class AS, 4.036% 5/15/20483,4 | 500 | 473 | ||
Morgan Stanley Bank of America Merrill Lynch Trust, Series 2015-C25, Class A-4, 3.372% 10/15/20484 | 305 | 298 | ||
Morgan Stanley Capital I Trust, Series 2015-UBS8, Class AS, 4.114% 12/15/20484 | 550 | 525 | ||
Multifamily Connecticut Avenue Securities, Series 2023-01, Class M7, (30-day Average USD-SOFR + 4.00%) 9.335% 11/25/20532,3,4 | 206 | 214 | ||
SDR Commercial Mortgage Trust, Series 2024-DSNY, Class A, (1-month USD CME Term SOFR + 1.392%) 6.72% 5/15/20392,3,4 | 708 | 706 | ||
SDR Commercial Mortgage Trust, Series 2024-DSNY, Class B, (1-month USD CME Term SOFR + 1.741%) 7.07% 5/15/20392,3,4 | 486 | 484 | ||
SFO Commerical Mortgage Trust, Series 2021-555, Class A, (1-month USD CME Term SOFR + 1.264%) 6.593% 5/15/2038 (1-month USD CME Term SOFR + 1.514% on 5/15/2026)1,2,4 | 1,000 | 948 | ||
SFO Commerical Mortgage Trust, Series 2021-555, Class B, (1-month USD CME Term SOFR + 1.614%) 6.943% 5/15/20382,3,4 | 362 | 334 | ||
SG Commercial Mortgage Securities Trust, Series 2016-C5, Class A3, 2.779% 10/10/20484 | 872 | 833 | ||
StorageMart Commercial Mortgage Trust, Series 2022-MINI, Class A, (1-month USD CME Term SOFR + 1.00%) 6.329% 1/15/20392,3,4 | 500 | 494 | ||
Wells Fargo Commercial Mortgage Trust, Series 2015-C27, Class A5, 3.451% 2/15/20484 | 755 | 742 | ||
Wells Fargo Commercial Mortgage Trust, Series 2015-C28, Class AS, 3.872% 5/15/20483,4 | 500 | 487 | ||
75 | Capital Group Fixed Income ETF Trust |
Capital Group Short Duration Income ETF (continued)
Bonds, notes & other debt instruments (continued) | Principal amount (000) | Value (000) | ||
Mortgage-backed obligations (continued) | ||||
Commercial mortgage-backed securities (continued) | ||||
Wells Fargo Commercial Mortgage Trust, Series 2015-C29, Class AS, 4.013% 6/15/20483,4 | USD500 | $487 | ||
Wells Fargo Commercial Mortgage Trust, Series 2015-NXS-2, Class A-5, 3.767% 7/15/20583,4 | 1,565 | 1,521 | ||
Wells Fargo Commercial Mortgage Trust, Series 2016-C33, Class A4, 3.426% 3/15/20594 | 541 | 521 | ||
WF-RBS Commercial Mortgage Trust, Series 2014-C25, Class A5, 3.631% 11/15/20474 | 852 | 843 | ||
WF-RBS Commercial Mortgage Trust, Series 2014-C22, Class A4, 3.488% 9/15/20574 | 140 | 140 | ||
WMRK Commercial Mortgage Trust, Series 2022-WMRK, Class A, (1-month USD CME Term SOFR + 2.789%) 8.118% 11/15/20272,3,4 | 206 | 207 | ||
WSTN Trust, Series 2023-MAUI, Class C, 7.958% 8/5/20272,3,4 | 100 | 99 | ||
WSTN Trust, Series 2023-MAUI, Class B, 7.263% 7/5/20372,3,4 | 173 | 173 | ||
45,730 | ||||
Total mortgage-backed obligations | 182,283 | |||
Asset-backed obligations 26.52% | ||||
Affirm Asset Securitization Trust, Series 2022-X1, Class A, 1.75% 2/15/20272,4 | 111 | 110 | ||
Affirm Asset Securitization Trust, Series 2023-A, Class A, 6.61% 1/18/20282,4 | 597 | 599 | ||
Affirm, Inc., Series 2023-B, Class A, 6.82% 9/15/20282,4 | 457 | 463 | ||
Affirm, Inc., Series 2023-X1, Class A, 7.11% 11/15/20282,4 | 188 | 189 | ||
Affirm, Inc., Series 2024, Class 1A, 5.61% 2/15/20292,4 | 3,000 | 2,991 | ||
Affirm, Inc., Series 2024-A, Class A, 5.61% 2/15/20292,4 | 1,046 | 1,043 | ||
Affirm, Inc., Series 2024-X1, Class A, 6.27% 5/15/20292,4 | 1,224 | 1,225 | ||
AGL CLO, Ltd., Series 2023-24, Class A1, (3-month USD CME Term SOFR + 2.00%) 7.324% 7/25/20362,3,4 | 464 | 468 | ||
Ally Auto Receivables Trust, Series 2023, Class A2, 6.15% 1/17/20342,4 | 258 | 258 | ||
American Credit Acceptance Receivables Trust, Series 2024-1, Class B, 5.60% 11/12/20272,4 | 219 | 218 | ||
American Credit Acceptance Receivables Trust, Series 2024-2, Class B, 6.10% 12/13/20272,4 | 923 | 924 | ||
American Credit Acceptance Receivables Trust, Series 2024-1, Class C, 5.63% 1/14/20302,4 | 920 | 915 | ||
American Credit Acceptance Receivables Trust, Series 2024-2, Class D, 6.53% 4/12/20302,4 | 1,820 | 1,845 | ||
American Express Credit Account Master Trust, Series 2024-2, Class A, 5.24% 4/15/2031 | 766 | 781 | ||
American Money Management Corp., CLO, Series 2016-18, Class AR, (3-month USD CME Term SOFR + 1.362%) 6.697% 5/26/20312,3,4 | 134 | 134 | ||
Apidos CLO, Ltd., Series 2019-32A, Class A1R, (3-month USD CME Term SOFR + 1.10%) 6.434% 1/20/20332,3,4 | 1,172 | 1,172 | ||
Auxilior Term Funding, LLC, Series 24-1A, Class A2, 6.17% 3/15/20272,4 | 1,940 | 1,941 | ||
Avis Budget Rental Car Funding (AESOP), LLC, Series 2020-2, Class A, 2.02% 2/20/20272,4 | 350 | 333 | ||
Avis Budget Rental Car Funding (AESOP), LLC, Series 2022-5, Class A, 6.12% 4/20/20272,4 | 118 | 119 | ||
Avis Budget Rental Car Funding (AESOP), LLC, Series 2022-5, Class C, 6.24% 4/20/20272,4 | 500 | 498 | ||
Avis Budget Rental Car Funding (AESOP), LLC, Series 2023-2, Class B, 6.03% 10/20/20272,4 | 290 | 291 | ||
Avis Budget Rental Car Funding (AESOP), LLC, Series 2023-2, Class C, 6.18% 10/20/20272,4 | 1,000 | 995 | ||
Avis Budget Rental Car Funding (AESOP), LLC, Series 2023-5, Class A, 5.78% 4/20/20282,4 | 259 | 261 | ||
Avis Budget Rental Car Funding (AESOP), LLC, Series 2024-1, Class A, 5.36% 6/20/20302,4 | 700 | 698 | ||
Ballyrock, Ltd., CLO, Series 2019-2A, Class A1R, (3-month USD CME Term SOFR + 1.40%) 6.714% 2/20/20362,3,4 | 1,250 | 1,252 | ||
Bankers Healthcare Group Securitization Trust, Series 2021-A, Class A, 1.42% 11/17/20332,4 | 460 | 440 | ||
Benefit Street Partners CLO, Ltd., Series 2019-19, Class AR, (3-month USD CME Term SOFR + 1.18%) 6.504% 1/15/20332,3,4 | 1,480 | 1,480 | ||
Capital Group Fixed Income ETF Trust | 76 |
Capital Group Short Duration Income ETF (continued)
Bonds, notes & other debt instruments (continued) | Principal amount (000) | Value (000) | ||
Asset-backed obligations (continued) | ||||
Birch Grove CLO, Ltd., Series 2023-6, Class A1, (3-month USD CME Term SOFR + 2.20%) 7.525% 7/20/20352,3,4 | USD494 | $498 | ||
Brex Commercial Charge Card Master Trust, Series 2024-1, Class A1, 6.05% 7/15/20272,4 | 806 | 806 | ||
Bridgecrest Lending Auto Securitization Trust, Series 2024-1, Class A3, 5.53% 1/18/20284 | 623 | 622 | ||
Bridgecrest Lending Auto Securitization Trust, Series 2024-2, Class A3, 5.84% 6/15/2028 | 2,000 | 2,002 | ||
Bridgecrest Lending Auto Securitization Trust, Series 2024-1, Class B, 5.43% 8/15/20284 | 251 | 250 | ||
Bridgecrest Lending Auto Securitization Trust, Series 2024-1, Class C, 5.65% 4/16/20294 | 370 | 369 | ||
Bridgecrest Lending Auto Securitization Trust, Series 2024-2, Class B, 5.94% 2/15/2030 | 2,000 | 2,004 | ||
Carvana Auto Receivables Trust, Series 2023-N3, Class A, 6.41% 9/10/20272,4 | 333 | 334 | ||
Carvana Auto Receivables Trust, Series 2023-P3, Class A3, 5.82% 8/10/20282,4 | 206 | 207 | ||
CF Hippolyta, LLC, Series 2020-1, Class A1, 1.69% 7/15/20602,4 | 1,349 | 1,279 | ||
CF Hippolyta, LLC, Series 2021-1, Class A1, 1.53% 3/15/20612,4 | 1,079 | 989 | ||
Chesapeake Funding II, LLC, Series 2023-2, Class A1, 6.16% 10/15/20352,4 | 432 | 434 | ||
Citizens Auto Receivables Trust, Series 2023-2, Class A3, 5.83% 2/15/20282,4 | 572 | 576 | ||
Citizens Auto Receivables Trust, Series 2023-2, Class A4, 5.74% 10/15/20302,4 | 680 | 688 | ||
CLI Funding VI, LLC, Series 2020-2A, Class A, 2.03% 9/15/20452,4 | 374 | 337 | ||
CLI Funding VIII, LLC, Series 2022-1, Class A, 2.72% 1/18/20472,4 | 1,069 | 955 | ||
ClickLease Equipment Receivables 2024-1 Trust, Series 2024-1, Class A, 6.86% 2/15/20302,4 | 586 | 586 | ||
Commercial Equipment Finance, Series 2024-1, Class A, 5.97% 7/16/20292,4 | 1,000 | 1,000 | ||
CPS Auto Receivables Trust, Series 2023-A, Class A, 5.54% 3/16/20262,4 | 60 | 60 | ||
CPS Auto Receivables Trust, Series 2023-A, Class B, 5.47% 11/16/20262,4 | 656 | 655 | ||
CPS Auto Receivables Trust, Series 2023-C, Class B, 5.98% 6/15/20272,4 | 918 | 919 | ||
CPS Auto Receivables Trust, Series 2024-A, Class B, 5.65% 5/15/20282,4 | 139 | 139 | ||
CPS Auto Receivables Trust, Series 2023-A, Class C, 5.54% 4/16/20292,4 | 933 | 928 | ||
CPS Auto Receivables Trust, Series 2023-C, Class C, 6.27% 10/15/20292,4 | 465 | 468 | ||
CPS Auto Receivables Trust, Series 2024-A, Class C, 5.74% 4/15/20302,4 | 118 | 118 | ||
CPS Auto Receivables Trust, Series 2024-A, Class D, 6.13% 4/15/20302,4 | 100 | 100 | ||
CPS Auto Trust, Series 2024-B, Class B, 6.04% 10/16/20282,4 | 2,000 | 2,006 | ||
CPS Auto Trust, Series 2024-B, Class C, 6.28% 7/15/20302,4 | 2,000 | 2,028 | ||
Crossroads Asset Trust, Series 2024-A, Class A2, 5.90% 8/20/20302,4 | 1,087 | 1,090 | ||
Daimler Trucks Retail Trust, Series 2024-1, Class A3, 5.77% 12/15/2027 | 659 | 661 | ||
Daimler Trucks Retail Trust, Series 2024-1, Class A4, 5.74% 7/15/2031 | 1,452 | 1,465 | ||
Dell Equipment Finance Trust, Series 2024-1, Class A3, 5.39% 3/22/20302,4 | 4,000 | 4,012 | ||
DLLAD, LLC, Series 2024-1, Class A2, 5.50% 8/20/20272,4 | 1,027 | 1,028 | ||
DLLAD, LLC, Series 2024-1, Class A3, 5.30% 7/20/20292,4 | 491 | 493 | ||
Drive Auto Receivables Trust, Series 2024-1, Class A3, 5.35% 2/15/20284 | 751 | 749 | ||
Drive Auto Receivables Trust, Series 2024-1, Class B, 5.31% 1/16/20294 | 407 | 405 | ||
Drive Auto Receivables Trust, Series 2024-1, Class C, 5.43% 11/17/20314 | 723 | 719 | ||
DriveTime Auto Owner Trust, Series 2021-1A, Class D, 1.16% 11/16/20262,4 | 920 | 897 | ||
DriveTime Auto Owner Trust, Series 2023-1, Class C, 5.55% 10/16/20282,4 | 1,063 | 1,058 | ||
Dryden Senior Loan Fund, CLO, Series 2017-47A, Class A1R, (3-month USD CME Term SOFR + 1.242%) 6.57% 4/15/20282,3,4 | 171 | 171 | ||
Dryden Senior Loan Fund, CLO, Series 2015-37, Class AR, (3-month USD CME Term SOFR + 1.362%) 6.69% 1/15/20312,3,4 | 240 | 240 | ||
Dryden Senior Loan Fund, CLO, Series 2018-57, Class A, (3-month USD CME Term SOFR + 1.272%) 6.594% 5/15/20312,3,4 | 278 | 278 | ||
Elmwood CLO 18, Ltd., Series 2022-5, Class AR, (3-month USD CME Term SOFR + 1.65%) 6.967% 7/17/20332,3,4 | 1,000 | 1,005 | ||
Enterprise Fleet Financing, LLC, Series 2024-1, Class A3, 5.16% 9/20/20302,4 | 380 | 380 | ||
Exeter Automobile Receivables Trust, Series 2021-2, Class C, 0.98% 6/15/20264 | 7 | 7 | ||
Exeter Automobile Receivables Trust, Series 2024-1, Class A3, 5.31% 8/16/20274 | 183 | 182 | ||
Exeter Automobile Receivables Trust, Series 2022-6, Class B, 6.03% 8/16/20274 | 75 | 75 | ||
Exeter Automobile Receivables Trust, Series 2023-3, Class B, 6.11% 9/15/20274 | 307 | 307 | ||
Exeter Automobile Receivables Trust, Series 2023-4, Class B, 6.31% 10/15/20274 | 797 | 800 | ||
Exeter Automobile Receivables Trust, Series 2023-1, Class C, 5.82% 2/15/20284 | 1,000 | 998 | ||
Exeter Automobile Receivables Trust, Series 2022-6, Class C, 6.32% 5/15/20284 | 193 | 194 | ||
77 | Capital Group Fixed Income ETF Trust |
Capital Group Short Duration Income ETF (continued)
Bonds, notes & other debt instruments (continued) | Principal amount (000) | Value (000) | ||
Asset-backed obligations (continued) | ||||
Exeter Automobile Receivables Trust, Series 2024-1, Class B, 5.29% 8/15/20284 | USD514 | $512 | ||
Exeter Automobile Receivables Trust, Series 2023-4, Class C, 6.51% 8/15/20284 | 797 | 805 | ||
Exeter Automobile Receivables Trust, Series 2023-1, Class D, 6.69% 6/15/20294 | 240 | 243 | ||
Exeter Automobile Receivables Trust, Series 2024-1, Class C, 5.41% 5/15/20304 | 355 | 353 | ||
Exeter Automobile Receivables Trust, Series 2024-1, Class D, 5.84% 6/17/20304 | 574 | 574 | ||
First National Master Note Trust, Series 2023-1, Class A, 5.13% 4/16/20294 | 592 | 590 | ||
First National Master Note Trust, Series 2023-2, Class A, 5.77% 9/17/20294 | 668 | 677 | ||
First National Master Note Trust, Series 2024-1, Class A, 5.34% 5/15/2030 | 2,110 | 2,120 | ||
FirstKey Homes Trust, Series 2022-SFR2, Class A, 4.145% 5/17/20392,4 | 495 | 478 | ||
Flagship Credit Auto Trust, Series 2022-4, Class A2, 6.15% 9/15/20262,4 | 39 | 39 | ||
Flagship Credit Auto Trust, Series 2023-3, Class A3, 5.44% 4/17/20282,4 | 141 | 141 | ||
Flagship Credit Auto Trust, Series 2023-3, Class B, 5.64% 7/16/20292,4 | 399 | 399 | ||
Ford Credit Auto Lease Trust, Series 2024-A, Class A3, 5.06% 5/15/20274 | 806 | 803 | ||
Ford Credit Auto Lease Trust, Series 2024-A, Class A4, 5.05% 6/15/20274 | 175 | 174 | ||
Global SC Finance VII SRL, Series 2020-2A, Class A, 2.26% 11/19/20402,4 | 398 | 369 | ||
Global SC Finance VII SRL, Series 2021-2A, Class A, 1.95% 8/17/20412,4 | 905 | 817 | ||
GLS Auto Receivables Trust, Series 2023-4, Class A2, 6.40% 12/15/20262,4 | 779 | 781 | ||
GLS Auto Receivables Trust, Series 2023-3, Class B, 5.89% 1/18/20282,4 | 1,000 | 999 | ||
GLS Auto Receivables Trust, Series 2024-2, Class B, 5.77% 11/15/20282,4 | 537 | 538 | ||
GLS Auto Receivables Trust, Series 2023-3, Class C, 6.01% 5/15/20292,4 | 151 | 151 | ||
GLS Auto Receivables Trust, Series 2024-1, Class C, 5.64% 12/17/20292,4 | 1,303 | 1,300 | ||
GLS Auto Receivables Trust, Series 2024-1, Class D, 5.95% 12/17/20292,4 | 837 | 837 | ||
GLS Auto Receivables Trust, Series 2024-2, Class C, 6.03% 2/15/20302,4 | 746 | 753 | ||
GM Financial Revolving Receivables Trust, Series 2023-2, Class A, 5.77% 8/11/20362,4 | 773 | 795 | ||
GM Financial Securitized Term Auto Receivables Trust, Series 2024-1, Class A3, 4.85% 12/18/20284 | 441 | 439 | ||
GM Financial Securitized Term Auto Receivables Trust, Series 2024-1, Class A4, 4.86% 6/18/20294 | 624 | 621 | ||
Golub Capital Partners Static, Ltd., CLO, Series 2024-1, Class A2, (3-month USD CME Term SOFR + 1.55%) 6.877% 4/20/20332,3,4 | 1,496 | 1,497 | ||
GT Loan Financing, Ltd., Series 2013-1, Class AR, (3-month USD CME Term SOFR + 1.362%) 6.686% 7/28/20312,3,4 | 310 | 310 | ||
HalseyPoint CLO II, Ltd., Series 2020-2A, Class A1, (3-month USD CME Term SOFR + 2.122%) 7.446% 7/20/20312,3,4 | 149 | 149 | ||
Hertz Vehicle Financing III, LLC, Series 2023-1, Class A, 5.49% 6/25/20272,4 | 1,000 | 999 | ||
Hertz Vehicle Financing III, LLC, Series 2023-1, Class 1D, 9.13% 6/25/20272,4 | 250 | 250 | ||
Hertz Vehicle Financing III, LLC, Series 2022-2, Class D, 5.16% 6/26/20282,4 | 250 | 224 | ||
Hyundai Auto Lease Securitization Trust, Series 2024-A, Class A3, 5.02% 3/15/20272,4 | 960 | 956 | ||
Hyundai Auto Lease Securitization Trust, Series 2024-A, Class A4, 5.07% 2/15/20282,4 | 267 | 266 | ||
Jamestown CLO, Ltd., Series 2019-1, Class A1R, (3-month USD CME Term SOFR + 1.20%) 6.525% 4/20/20322,3,4 | 1,823 | 1,826 | ||
Jamestown CLO, Ltd., Series 2019-1, Class A2AR, (3-month USD CME Term SOFR + 1.65%) 6.975% 4/20/20322,3,4 | 1,000 | 1,001 | ||
Jamestown CLO, Ltd., Series 2019-1, Class A2BR, (3-month USD CME Term SOFR + 1.85%) 7.175% 4/20/20322,3,4 | 957 | 959 | ||
John Deere Owner Trust, Series 2024-A, Class A3, 4.96% 11/15/20284 | 923 | 921 | ||
Juniper Valley Park CLO, Ltd., Series 2023-1, Class A1, (3-month USD CME Term SOFR + 1.85%) 7.175% 7/20/20352,3,4 | 797 | 797 | ||
Juniper Valley Park CLO, Ltd., Series 2023-1, Class AR, (3-month USD CME Term SOFR + 1.25%) 6.575% 7/20/20362,3,4 | 797 | 797 | ||
LAD Auto Receivables Trust, Series 2023-1, Class A2, 5.68% 10/15/20262,4 | 270 | 270 | ||
LAD Auto Receivables Trust, Series 2023-1, Class C, 6.18% 12/15/20272,4 | 273 | 274 | ||
LAD Auto Receivables Trust, Series 2024-1, Class A3, 5.23% 1/18/20282,4 | 353 | 351 | ||
LAD Auto Receivables Trust, Series 2023-3, Class A4, 5.95% 3/15/20282,4 | 318 | 319 | ||
LAD Auto Receivables Trust, Series 2023-3, Class B, 6.09% 6/15/20282,4 | 721 | 726 | ||
LAD Auto Receivables Trust, Series 2023-3, Class C, 6.43% 12/15/20282,4 | 608 | 618 | ||
LAD Auto Receivables Trust, Series 2024-1, Class B, 5.33% 2/15/20292,4 | 367 | 365 | ||
LAD Auto Receivables Trust, Series 2024-1, Class C, 5.64% 6/15/20292,4 | 444 | 441 | ||
LAD Auto Receivables Trust, Series 2024-2, Class A4, 5.46% 7/16/20292,4 | 507 | 507 | ||
LAD Auto Receivables Trust, Series 2024-2, Class D, 6.37% 10/15/20312,4 | 175 | 176 | ||
LCM, LP, Series 2027, Class A1, (3-month USD CME Term SOFR + 1.342%) 6.669% 7/16/20312,3,4 | 558 | 559 | ||
Capital Group Fixed Income ETF Trust | 78 |
Capital Group Short Duration Income ETF (continued)
Bonds, notes & other debt instruments (continued) | Principal amount (000) | Value (000) | ||
Asset-backed obligations (continued) | ||||
Madison Park Funding, Ltd., CLO, Series 2021-50A, Class A, (3-month USD CME Term SOFR + 1.402%) 6.728% 4/19/20342,3,4 | USD300 | $301 | ||
Marathon CLO, Ltd., Series 2019-2, Class BAR, (3-month USD CME Term SOFR + 2.70%) 8.025% 1/20/20332,3,4 | 429 | 430 | ||
Mercedes-Benz Auto Lease Trust, Series 2024-A, Class A3, 5.32% 1/18/2028 | 2,385 | 2,394 | ||
Mercedes-Benz Auto Receivables Trust, Series 2024-1, Class A3, 4.80% 4/16/20294 | 1,500 | 1,491 | ||
Mercedes-Benz Auto Receivables Trust, Series 2024-1, Class A4, 4.79% 7/15/20314 | 857 | 852 | ||
Merchants Fleet Funding, LLC, Series 2024-1, Class A, 5.82% 4/20/20372,4 | 2,326 | 2,328 | ||
Mercury Financial Credit Card Master Trust, Series 2024-2A, Class A, 6.56% 7/20/20292,4 | 1,638 | 1,645 | ||
Mission Lane Credit Card Master Trust, Series 2024-A, Class A1, 6.20% 8/15/20292,4 | 1,212 | 1,212 | ||
OCP CLO, Ltd., Series 2018-15A, Class A1, (3-month USD CME Term SOFR + 1.362%) 6.686% 7/20/20312,3,4 | 164 | 165 | ||
Ondeck Asset Securitization Trust, LLC, Series 2024-1, Class A, 6.27% 6/17/20312,4 | 1,020 | 1,028 | ||
Palmer Square Loan Funding, CLO, Series 2021-3, Class A1, (3-month USD CME Term SOFR + 1.062%) 6.386% 7/20/20292,3,4 | 406 | 407 | ||
Palmer Square Loan Funding, CLO, Series 2022-4, Class A1, (3-month USD-CME Term SOFR + 1.75%) 7.073% 7/24/20312,3,4 | 521 | 522 | ||
Palmer Square Loan Funding, CLO, Series 2022-4, Class A2, (3-month USD CME Term SOFR + 2.35%) 7.623% 7/24/20312,3,4 | 889 | 889 | ||
Palmer Square, Ltd., Series 2013-2A, Class A1A3, (3-month USD CME Term SOFR + 1.262%) 6.579% 10/17/20312,3,4 | 187 | 188 | ||
PEAC Solutions Receivables, LLC, Series 2024-1, Class A2, 5.79% 6/21/20272,4 | 2,679 | 2,686 | ||
PFS Financing Corp., Series 2023-A, Class A, 5.80% 3/15/20282,4 | 2,000 | 2,014 | ||
PK ALIFT Loan Funding 3, LP, Series 2024-1, Class A1, 6.264% 9/15/20392,4 | 769 | 771 | ||
Prestige Auto Receivables Trust, Series 2023-1, Class A2, 5.88% 3/16/20262,4 | 255 | 255 | ||
Prestige Auto Receivables Trust, Series 2024-1, Class B, 5.71% 5/15/20282,4 | 353 | 353 | ||
Prestige Auto Receivables Trust, Series 2024-1, Class D, 6.21% 2/15/20302,4 | 422 | 425 | ||
Regatta XIV Funding, Ltd., CLO, Series 2018-3A, Class AR, (3-month USD CME Term SOFR + 1.10%) 6.213% 10/25/20312,3,4 | 1,500 | 1,500 | ||
Santander Drive Auto Receivables Trust, Series 2020-3, Class D, 1.64% 11/16/20264 | 174 | 172 | ||
Santander Drive Auto Receivables Trust, Series 2022-7, Class A3, 5.75% 4/15/20274 | 65 | 65 | ||
Santander Drive Auto Receivables Trust, Series 2022-7, Class B, 5.95% 1/17/20284 | 33 | 33 | ||
Santander Drive Auto Receivables Trust, Series 2024-1, Class A3, 5.25% 4/17/20284 | 105 | 105 | ||
Santander Drive Auto Receivables Trust, Series 2023-6, Class A3, 5.93% 7/17/20284 | 351 | 353 | ||
Santander Drive Auto Receivables Trust, Series 2024-1, Class B, 5.23% 12/15/20284 | 558 | 555 | ||
Santander Drive Auto Receivables Trust, Series 2024-2, Class B, 5.78% 7/16/2029 | 1,517 | 1,532 | ||
Santander Drive Auto Receivables Trust, Series 2024-1, Class C, 5.45% 3/15/20304 | 124 | 124 | ||
SMB Private Education Loan Trust, Series 2023-C, Class A1B, (30-day Average USD-SOFR + 1.55%) 6.883% 11/15/20522,3,4 | 246 | 250 | ||
Sound Point CLO, Ltd., Series 2017-3A, Class A1R, (3-month USD CME Term SOFR + 1.242%) 6.566% 10/20/20302,3,4 | 252 | 253 | ||
Sound Point CLO, Ltd., Series 2013-3R, Class A, (3-month USD CME Term SOFR + 1.412%) 6.739% 4/18/20312,3,4 | 265 | 266 | ||
Stratus Static CLO, Ltd., Series 2022-3, Class AR, (3-month USD CME Term SOFR + 1.30%) 6.618% 10/20/20312,3,4 | 145 | 145 | ||
Sycamore Tree CLO, Ltd., Series 2024-5, Class A1, (3-month USD CME Term SOFR + 1.42%) 6.749% 4/20/20362,3,4 | 2,000 | 2,003 | ||
Synchrony Card Issuance Trust, Series 2023-A2, Class A, 5.74% 10/15/20294 | 498 | 504 | ||
TAL Advantage V, LLC, Series 2020-1A, Class A, 2.05% 9/20/20452,4 | 952 | 870 | ||
Textainer Marine Containers, Ltd., Series 2021-1, Class A, 1.68% 2/20/20462,4 | 847 | 750 | ||
Textainer Marine Containers, Ltd., Series 2021-2A, Class A, 2.23% 4/20/20462,4 | 594 | 532 | ||
TIF Funding II, LLC, Series 2021-1A, Class A, 1.65% 2/20/20462,4 | 1,019 | 887 | ||
Toyota Auto Receivables Owner Trust, Series 2024-A, Class A3, 4.83% 10/16/20284 | 1,283 | 1,276 | ||
Toyota Auto Receivables Owner Trust, Series 2024-A, Class A4, 4.77% 4/16/20294 | 659 | 655 | ||
Trestles CLO, Ltd., Series 2023-6, Class A, (3-month USD CME Term SOFR + 1.70%) 7.062% 1/25/20362,3,4 | 800 | 803 | ||
Trinitas CLO, Ltd., Series 2020-12, Class A1R, (3-month USD CME Term SOFR + 1.37%) 6.694% 4/25/20332,3,4 | 250 | 250 | ||
Trinitas CLO, Ltd., Series 2020-12, Class B1R, (3-month USD CME Term SOFR + 2.00%) 7.324% 4/25/20332,3,4 | 1,000 | 1,004 | ||
Triton Container Finance VIII, LLC, Series 2020-1, Class A, 2.11% 9/20/20452,4 | 1,022 | 916 | ||
TSTAT 2022-1, Ltd., Series 2022-1, Class A2R, (3-month USD CME Term SOFR + 1.90%) 7.218% 7/20/20312,3,4 | 468 | 468 | ||
79 | Capital Group Fixed Income ETF Trust |
Capital Group Short Duration Income ETF (continued)
Bonds, notes & other debt instruments (continued) | Principal amount (000) | Value (000) | ||
Asset-backed obligations (continued) | ||||
TSTAT 2022-1, Ltd., Series 2022-1, Class BR, (3-month USD CME Term SOFR + 2.35%) 7.668% 7/20/20312,3,4 | USD500 | $500 | ||
TSTAT 2022-1, Ltd., Series 2022-1, Class CR, (3-month USD CME Term SOFR + 2.85%) 8.175% 7/20/20312,3,4 | 500 | 501 | ||
United Auto Credit Securitization Trust, Series 2024-1, Class A, 6.17% 8/10/20262,4 | 333 | 333 | ||
United Auto Credit Securitization Trust, Series 2024-1, Class B, 6.57% 6/10/20272,4 | 1,500 | 1,503 | ||
United Auto Credit Securitization Trust, Series 2024-1, Class C, 7.06% 10/10/20292,4 | 1,500 | 1,508 | ||
Valley Stream Park CLO, Ltd., Series 2022-1, Class AR, (3-month USD CME Term SOFR + 1.63%) 6.955% 10/20/20342,3,4 | 1,000 | 1,002 | ||
Verdant Receivables, LLC, Series 2024-1, Class A2, 5.68% 12/12/20312,4 | 661 | 664 | ||
Verdant Receivables, LLC, Series 2024-1, Class C, 6.25% 12/12/20312,4 | 164 | 165 | ||
Verizon Master Trust, Series 2024-2, Class A, 4.83% 12/22/20312,4 | 652 | 647 | ||
Verizon Master Trust., Series 24-5, Class A, 5.83% 6/21/20322,4 | 625 | 625 | ||
Voya CLO, Ltd., Series 2018-3, Class A1R2, (3-month USD CME Term SOFR + 1.20%) 6.524% 10/15/20312,3,4 | 1,692 | 1,692 | ||
Voya CLO, Ltd., Series 2018-3, Class BR2, (3-month USD CME Term SOFR + 1.80%) 7.124% 10/15/20312,3,4 | 870 | 870 | ||
VStrong Auto Receivables Trust, Series 2024-A, Class A2, 5.79% 8/16/20272,4 | 619 | 619 | ||
VStrong Auto Receivables Trust, Series 2024-A, Class A3, 5.62% 12/15/20282,4 | 217 | 217 | ||
Wellfleet CLO, Ltd., Series 2017-3A, Class A1, (3-month USD CME Term SOFR + 1.412%) 6.729% 1/17/20312,3,4 | 138 | 138 | ||
Westlake Automobile Receivables Trust, Series 2022-3, Class C, 5.49% 7/15/20262,4 | 93 | 93 | ||
Westlake Automobile Receivables Trust, Series 2024-1, Class A3, 5.44% 5/17/20272,4 | 416 | 415 | ||
Westlake Automobile Receivables Trust, Series 2024-1, Class B, 5.55% 11/15/20272,4 | 748 | 745 | ||
Westlake Automobile Receivables Trust, Series 2023-1, Class B, 5.41% 1/18/20282,4 | 212 | 211 | ||
Westlake Automobile Receivables Trust, Series 2023-1, Class C, 5.74% 8/15/20282,4 | 412 | 412 | ||
Westlake Automobile Receivables Trust, Series 2023-3, Class C, 6.02% 9/15/20282,4 | 597 | 599 | ||
Westlake Automobile Receivables Trust, Series 2024-1, Class C, 5.65% 2/15/20292,4 | 523 | 522 | ||
Westlake Automobile Receivables Trust, Series 2024-1, Class D, 6.02% 10/15/20292,4 | 703 | 704 | ||
Westlake Flooring Master Trust, Series 2024-1, Class A, 5.43% 2/15/20282,4 | 536 | 536 | ||
Wind River CLO, Ltd., Series 2015-1A, Class A1R3, (3-month USD CME Term SOFR + 1.20%) 6.525% 10/20/20302,3,4 | 1,612 | 1,613 | ||
World Financial Network Credit Card Master Trust, Series 2024-A, Class A, 5.47% 2/17/2031 | 2,157 | 2,172 | ||
147,713 | ||||
Bonds & notes of governments & government agencies outside the U.S. 0.27% | ||||
Chile (Republic of) 4.85% 1/22/2029 | 530 | 524 | ||
United Mexican States 5.00% 5/7/2029 | 1,000 | 979 | ||
1,503 | ||||
Total bonds, notes & other debt instruments (cost: $544,720,000) | 546,796 | |||
Short-term securities 9.40% | Shares | |||
Money market investments 9.40% | ||||
Capital Group Central Cash Fund 5.37%6,7 | 523,864 | 52,386 | ||
Total short-term securities (cost: $52,385,000) | 52,386 | |||
Total investment securities 107.57% (cost: $597,105,000) | 599,182 | |||
Other assets less liabilities (7.57)% | (42,191 ) | |||
Net assets 100.00% | $556,991 |
Capital Group Fixed Income ETF Trust | 80 |
Capital Group Short Duration Income ETF (continued)
Futures contracts
Contracts | Type | Number of contracts | Expiration date | Notional amount (000) | Value and unrealized appreciation (depreciation) at 6/30/2024 (000) |
2 Year U.S. Treasury Note Futures | Long | 1,386 | 9/30/2024 | USD283,047 | $188 |
5 Year U.S. Treasury Note Futures | Short | 130 | 9/30/2024 | (13,855 ) | (134 ) |
10 Year Ultra U.S. Treasury Note Futures | Short | 396 | 9/19/2024 | (44,958 ) | 290 |
30 Year U.S. Treasury Bond Futures | Short | 25 | 9/19/2024 | (2,958 ) | (30 ) |
$314 |
Investments in affiliates7
Value at 1/1/2024 (000) | Additions (000) | Reductions (000) | Net realized gain (loss) (000) | Net unrealized appreciation (depreciation) (000) | Value at 6/30/2024 (000) | Dividend or interest income (000) | |
Short-term securities 9.40% | |||||||
Money market investments 9.40% | |||||||
Capital Group Central Cash Fund 5.37% 6 | $30,363 | $156,970 | $63,359 | $(5 ) | $3 | $52,386 | $963 |
1 | Step bond; coupon rate may change at a later date. |
2 | Acquired in a transaction exempt from registration under Rule 144A or, for commercial paper, Section 4(a)(2) of the Securities Act of 1933. May be resold in the U.S. in transactions exempt from registration, normally to qualified institutional buyers. The total value of all such securities was $228,796,000, which represented 41.08% of the net assets of the fund. |
3 | Coupon rate may change periodically. Reference rate and spread are as of the most recent information available. Some coupon rates are determined by the issuer or agent based on current market conditions; therefore, the reference rate and spread are not available. |
4 | Principal payments may be made periodically. Therefore, the effective maturity date may be earlier than the stated maturity date. |
5 | Purchased on a TBA basis. |
6 | Rate represents the seven-day yield at 6/30/2024. |
7 | Part of the same "group of investment companies" as the fund as defined under the Investment Company Act of 1940, as amended. |
Key to abbreviation(s) |
CLO = Collateralized Loan Obligations |
CME = CME Group |
CMO = Collateralized Mortgage Obligations |
DAC = Designated Activity Company |
SDR = Swedish Depositary Receipts |
SOFR = Secured Overnight Financing Rate |
USD = U.S. dollars |
Refer to the notes to financial statements.
81 | Capital Group Fixed Income ETF Trust |
Capital Group Short Duration Municipal Income ETFunaudited
Investment portfolio June 30, 2024
Bonds, notes & other debt instruments 94.24% | Principal amount (000) | Value (000) | |
Alabama 2.56% | |||
Black Belt Energy Gas Dist., Gas Project Rev. Bonds (Project No. 7), Series 2021-C-1, 4.00% 10/1/2052 (put 12/1/2026) | USD 250 | $250 | |
County of Jefferson, Sewer Rev. Warrants, Series 2024, 5.00% 10/1/2028 | 355 | 376 | |
Midcity Improvement Dist., Special Assessment Rev. Bonds, Series 2022, 3.875% 11/1/2027 | 250 | 235 | |
Southeast Energy Auth., Commodity Supply Rev. Bonds (Project No. 4), Series 2022-B-1, 5.00% 5/1/2053 (put 8/1/2028) | 500 | 520 | |
1,381 | |||
Arizona 1.70% | |||
Deer Valley Unified School Dist. No. 97, School Improvement Bonds (Project of 2013), Series 2019-E, 5.00% 7/1/2025 | 500 | 508 | |
Industrial Dev. Auth., Charter School Rev. Bonds (Equitable School Revolving Fund), Series 2023-A, 5.00% 11/1/2028 | 200 | 210 | |
Industrial Dev. Auth., Education Rev. Bonds (Academies of Math & Science Projects), Series 2019, 4.00% 7/1/20291 | 200 | 199 | |
917 | |||
California 8.46% | |||
Educational Facs. Auth., Rev. Bonds (Saint Mary’s College of California), Series 2023-A, 5.25% 10/1/2030 | 400 | 433 | |
Foothill/Eastern Transportation Corridor Agcy., Toll Road Rev. Bonds, Capital Appreciation Bonds, Series 1995-A, 0% 1/1/2025 (escrowed to maturity) | 500 | 492 | |
Metropolitan Water Dist. of Southern California, Water Rev. Ref. Bonds, Series 2024-B-2, 5.00% 7/1/2037 (put 7/1/2029) | 300 | 322 | |
Municipal Fin. Auth., Community Facs. Dist. No. 2023-11 (City of Hisperia - Silverwood), Special Tax Bonds, Series 2024, 4.50% 9/1/2034 | 200 | 203 | |
Municipal Fin. Auth., Senior Living Rev. Bonds (Mt. San Antonio Gardens Project), Series 2022-B-1, 2.75% 11/15/2027 | 200 | 200 | |
Municipal Fin. Auth., Solid Waste Disposal Rev. Bonds (Waste Management, Inc. Project), Series 2020-B, AMT, 4.80% 11/1/2041 (put 6/2/2025) | 100 | 100 | |
County of Orange, Community Facs. Dist. No. 2023-1 (Rienda Phase 2B), Special Tax Bonds, Series 2023-A, 5.00% 8/15/2027 | 145 | 151 | |
County of Orange, Community Facs. Dist. No. 2023-1 (Rienda Phase 2B), Special Tax Bonds, Series 2023-A, 5.00% 8/15/2028 | 190 | 200 | |
Public Works Board, Lease Rev. Ref. Bonds (Various Capital Projects), Series 2023-C, 5.00% 9/1/2025 | 1,000 | 1,022 | |
City of San Diego, Housing Auth., Multi Family Housing Rev. Bonds, Series 2023-B, 5.00% 5/1/2057 (put 11/1/2026) | 350 | 358 | |
Southern California Public Power Auth., Clean Energy Project Rev. Bonds, Series 2024-A, 5.00% 4/1/2055 (put 9/1/2030) | 100 | 106 | |
Statewide Communities Dev. Auth., Rev. Bonds (American Baptist Homes of the West), Series 2015, 5.00% 10/1/2026 | 260 | 262 | |
Regents of the University of California, General Rev. Bonds, Series 2024-BT, 5.00% 5/15/2026 | 500 | 517 | |
City of Vernon, Electric System Rev. Bonds, Series 2022-A, 5.00% 8/1/2024 | 200 | 200 | |
4,566 | |||
Colorado 2.79% | |||
County of Adams, The Village at Dry Creek Metropolitan Dist. No. 2, Limited Tax G.O. and Special Rev. Bonds, Series 2019, 4.375% 12/1/2044 | 500 | 482 | |
Town of Johnstown, Thompson Crossing Metropolitan Dist. No. 4, Limited Tax G.O. Rev. Ref. and Improvement Bonds (Convertible to Unlimited Tax), Series 2019, 3.50% 12/1/2029 | 520 | 484 | |
Town of Superior, STC Metropolitan Dist. No. 2, Limited Tax G.O. and Special Rev. Ref. and Improvement Bonds, Series 2019-A, 3.00% 12/1/2025 | 555 | 543 | |
1,509 | |||
Connecticut 1.99% | |||
Housing Fin. Auth., Housing Mortgage Fin. Program Bonds, Series 2019-B-1, 4.00% 5/15/2049 | 675 | 671 | |
City of Stamford, Harbor Point Infrastructure Improvement Dist., Special Obligation Rev. Ref. Bonds (Harbor Point Project), Series 2017, 5.00% 4/1/20301 | 400 | 402 | |
1,073 | |||
Capital Group Fixed Income ETF Trust | 82 |
Capital Group Short Duration Municipal Income ETF (continued)
Bonds, notes & other debt instruments (continued) | Principal amount (000) | Value (000) | |
District of Columbia 0.99% | |||
Metropolitan Washington DC Airports Auth., Airport System Rev. Ref. Bonds, Series 2022-A, AMT, 5.00% 10/1/2025 | USD 525 | $534 | |
Florida 3.92% | |||
County of Broward, Airport System Rev. Ref. Bonds, Series 2012-P-1, AMT, 5.00% 10/1/2024 | 500 | 501 | |
Housing Fin. Corp., Homeowner Mortgage Rev. Bonds, Series 2019-1, 4.00% 7/1/2050 | 250 | 249 | |
City of Miami, Midtown Miami Community Dev. Dist., Special Assessment and Rev. Ref. Bonds (Infrastructure Project), Series 2014-B, 5.00% 5/1/2029 | 500 | 500 | |
City of Pompano Beach, Rev. Bonds (John Knox Village Project), Series 2021-B-2, 1.45% 1/1/2027 | 365 | 365 | |
City of Pompano Beach, Rev. Bonds (John Knox Village Project), Series 2015, 3.25% 9/1/2030 | 200 | 192 | |
Windward at Lakewood Ranch Community Dev. Dist., Capital Improvement Rev. Bonds (Phase 2 Project), Series 2022, 3.25% 5/1/2027 | 325 | 312 | |
2,119 | |||
Georgia 1.82% | |||
Geo. L. Smith II Georgia World Congress Center Auth., Convention Center Hotel First Tier Rev. Bonds, Series 2021-A, 2.375% 1/1/2031 | 500 | 450 | |
Main Street Natural Gas, Inc., Gas Supply Rev. Bonds, Series 2023-B, 5.00% 7/1/2053 (put 3/1/2030) | 500 | 531 | |
981 | |||
Hawaii 0.95% | |||
City and County of Honolulu, G.O. Bonds, Series 2015-B, 5.00% 10/1/2025 | 500 | 511 | |
Illinois 2.81% | |||
City of Chicago, G.O. Rev. Ref. Bonds, Series 2020-A, 5.00% 1/1/2027 | 250 | 257 | |
G.O. Bonds, Series 2024-B, 5.00% 5/1/2026 | 310 | 318 | |
Metropolitan Pier and Exposition Auth., McCormick Place Expansion Project Rev. Ref. Bonds, Series 2022-A, 3.00% 6/15/2025 | 500 | 494 | |
Metropolitan Pier and Exposition Auth., McCormick Place Expansion Project Rev. Ref. Bonds, Capital Appreciation Bonds, Series 2010-B-1, Assured Guaranty Municipal insured, 0% 6/15/2027 | 500 | 446 | |
1,515 | |||
Indiana 0.32% | |||
City of Valparaiso, Exempt Facs. Rev. Ref. Bonds (Pratt Paper (IN), LLC Project), Series 2024, AMT, 4.50% 1/1/20341 | 170 | 175 | |
Iowa 3.49% | |||
Fin. Auth., Multi Family Housing Rev. Bonds (AHEPA 192-IV Apartments Projects), Series 2023, 5.00% 11/1/2026 (put 11/1/2025) | 400 | 404 | |
Fin. Auth., Single Family Mortgage Bonds, Series 2022-A, 3.00% 1/1/2052 | 250 | 241 | |
Fin. Auth., Single Family Mortgage Bonds (Mortgage-Backed Securities Program), Series 2019-A, 4.00% 7/1/2047 | 740 | 735 | |
Fin. Auth., Single Family Mortgage Bonds (Mortgage-Backed Securities Program), Series 2019-D, 3.50% 1/1/2049 | 515 | 505 | |
1,885 | |||
Kentucky 1.86% | |||
Public Energy Auth., Gas Supply Rev. Bonds, Series 2019-C-1, 4.00% 2/1/2050 (put 2/1/2028) | 1,000 | 1,002 | |
Louisiana 1.92% | |||
Aviation Board, General Airport Rev. Bonds (North Terminal Project), Series 2015-B, AMT, 5.00% 1/1/2027 | 500 | 502 | |
Public Facs. Auth., Solid Waste Disposal Rev. Bonds (Waste Pro USA, Inc. Project), Series 2023-R-2, AMT, 6.50% 10/1/2053 (put 10/1/2028)1 | 500 | 536 | |
1,038 | |||
83 | Capital Group Fixed Income ETF Trust |
Capital Group Short Duration Municipal Income ETF (continued)
Bonds, notes & other debt instruments (continued) | Principal amount (000) | Value (000) | |
Maryland 1.86% | |||
County of Baltimore, Rev. Bonds (Riderwood Village, Inc. Fac.), Series 2020, 4.00% 1/1/2029 | USD 500 | $504 | |
City of Gaithersburg, Econ. Dev. Project Rev. and Rev. Ref. Bonds (Asbury Maryland Obligated Group), Series 2018-A, 4.50% 1/1/2025 | 500 | 500 | |
1,004 | |||
Massachusetts 1.78% | |||
Educational Fncg. Auth., Education Loan Rev. Bonds, Series 2024-B, AMT, 4.25% 7/1/2032 | 455 | 451 | |
Water Resources Auth., General Rev. Ref. Green Bonds, Series 2007-B, 5.25% 8/1/2025 | 500 | 511 | |
962 | |||
Michigan 1.85% | |||
Great Lakes Water Auth., Water Supply System Rev. Ref. Bonds, Series 2016-D, 5.00% 7/1/2024 | 1,000 | 1,000 | |
Minnesota 1.92% | |||
County of Hennepin, Housing and Redev. Auth., Multi Family Housing Rev. Bonds (Labor Retreat Project), Series 2023, 4.65% 10/1/2026 (put 10/1/2024) | 170 | 170 | |
Housing Fin. Agcy., Residential Housing Fin. Bonds, Series 2022-C, 3.50% 7/1/2052 | 885 | 868 | |
1,038 | |||
Missouri 1.41% | |||
City of Kansas City, Industrial Dev. Auth., Sales Tax Rev. Ref. and Improvement Bonds (Ward Parkway Center Community Improvement Dist.), Series 2016-A, 4.25% 4/1/20261 | 200 | 196 | |
City of St. Louis, Airport Rev. Ref. Bonds (Lambert-St. Louis International Airport), Series 2019-C, 5.00% 7/1/2025 | 555 | 563 | |
759 | |||
Nevada 1.61% | |||
Clark County School Dist., Limited Tax G.O. Building Bonds, Series 2020-A, Assured Guaranty Municipal insured, 5.00% 6/15/2026 | 500 | 516 | |
City of Las Vegas, Special Improvement Dist. No. 817 (Summerlin Village 29), Local Improvement Bonds, Series 2023, 5.00% 6/1/2028 | 345 | 353 | |
869 | |||
New Hampshire 1.01% | |||
Health and Education Facs. Auth., Education Loan Rev. Bonds (New Hampshire Higher Education Loan Corp. Issue), Series 2023-B, AMT, 5.00% 11/1/2043 | 325 | 339 | |
National Fin. Auth., Specialty Pharmacy Rev. Bonds (University Hospitals Home Care Services, Inc.), Series 2024-A, 5.625% 12/15/20331 | 200 | 204 | |
543 | |||
New Jersey 1.19% | |||
Higher Education Student Assistance Auth., Student Loan Rev. Bonds, Series 2022-B, AMT, 5.00% 12/1/2024 | 105 | 105 | |
Higher Education Student Assistance Auth., Student Loan Rev. Ref. Bonds, Series 2021-B, AMT, 2.50% 12/1/2040 | 500 | 447 | |
County of Hudson, Jersey City Municipal Utilities Auth., Sewer Project Notes, Series 2024-B, 5.00% 5/1/2025 | 90 | 91 | |
643 | |||
New Mexico 0.40% | |||
Mortgage Fin. Auth., Single Family Mortgage Program Bonds, Series 2020-A, Class I, 3.50% 1/1/2051 | 220 | 216 | |
Capital Group Fixed Income ETF Trust | 84 |
Capital Group Short Duration Municipal Income ETF (continued)
Bonds, notes & other debt instruments (continued) | Principal amount (000) | Value (000) | |
New York 3.31% | |||
Metropolitan Transportation Auth., Transportation Rev. Ref. Green Bonds, Series 2017-C-1, 5.00% 11/15/2025 | USD 500 | $511 | |
Port Auth., Consolidated Bonds, Series 185, AMT, 5.00% 9/1/2025 | 550 | 551 | |
Port Auth., Consolidated Bonds, Series 227, AMT, 3.00% 10/1/2028 | 500 | 476 | |
Sullivan County Infrastructure Local Dev. Corp., Rev. Bonds (Adelaar Infrastructure Project), Series 2016-A-1, 4.85% 11/1/20311 | 250 | 251 | |
1,789 | |||
North Carolina 2.09% | |||
City of Asheville, Housing Auth., Multi Family Housing Rev. Bonds (Vanderbilt Apartments), Series 2023, 5.00% 11/1/2026 (put 11/1/2025) | 515 | 521 | |
Housing Fin. Agcy., Home Ownership Rev. Bonds, Series 44, 2.05% 1/1/2028 | 500 | 459 | |
Town of Morehead City, Multi Family Housing Rev. Bonds (Elijah’s Landing), Series 2024, 4.05% 1/1/2028 (put 1/1/2027) | 150 | 150 | |
1,130 | |||
North Dakota 0.83% | |||
Housing Fin. Agcy., Housing Fin. Program Bonds (Home Mortgage Fin. Program), Series 2019-C, 4.00% 1/1/2050 | 450 | 447 | |
Ohio 2.75% | |||
Air Quality Dev. Auth., Air Quality Dev. Rev. Ref. Bonds (Duke Energy Corp. Project), Series 2022-B, AMT, 4.25% 11/1/2039 (put 6/1/2027) | 540 | 543 | |
Hospital Rev. Bonds (Aultman Health Foundation), Series 2018, 5.00% 12/1/20281 | 250 | 247 | |
Hospital Rev. Ref. Bonds (Cleveland Clinic Health System Obligated Group), Series 2017-A, 3.25% 1/1/2035 | 250 | 235 | |
Housing Fin. Agcy., Residential Mortgage Rev. Bonds (Mortgage-Backed Securities Program), Series 2022-A, 3.25% 9/1/2052 | 475 | 462 | |
1,487 | |||
Oregon 0.48% | |||
County of Multnomah, Hospital Facs. Auth., Rev. and Rev. Ref. Green Bonds (Exempt Terwilliger Plaza - Parkview Project), Series 2021-B, 1.20% 6/1/2028 | 290 | 260 | |
Pennsylvania 7.08% | |||
County of Chester, Industrial Dev. Auth., Rev. Notes (Avon Grove Charter School Project), Series 2024, 5.00% 3/1/2027 | 85 | 86 | |
City of Doylestown, Hospital Auth., Rev. Bonds (Doylestown Hospital), Series 2024, 5.00% 7/1/20311 | 155 | 160 | |
East Hempfield Township, Industrial Dev. Auth., Rev. and Rev. Ref. Bonds (Willow Valley Communities Project), Series 2016, 5.00% 12/1/2028 | 715 | 726 | |
Econ. Dev. Fncg. Auth., Solid Waste Disposal Rev. Bonds (Waste Management, Inc. Project), Series 2021-A-2, AMT, 4.60% 10/1/2046 (put 10/1/2026) | 750 | 761 | |
Higher Education Assistance Agcy., Education Loan Rev. Bonds, Series 2024-1A, AMT, 4.125% 6/1/2045 | 65 | 62 | |
Philadelphia School Dist., G.O. Bonds, Series 2016-D, 5.00% 9/1/2025 | 1,000 | 1,017 | |
Public School Building Auth., School Lease Rev. Ref. Bonds (Philadelphia School Dist. Project), Series 2016-A, Assured Guaranty Municipal insured, 5.00% 6/1/2025 | 1,000 | 1,013 | |
3,825 | |||
Puerto Rico 1.67% | |||
G.O. Taxable Bonds, Series 2022, 0% 11/1/20432 | 222 | 136 | |
G.O. Taxable Bonds, Capital Appreciation Bonds, Series 2022, 0% 11/1/2051 | 435 | 275 | |
Industrial, Tourist, Educational, Medical and Environmental Control Facs. Fncg. Auth., Hospital Rev. and Rev. Ref. Bonds (Hospital Auxilio Mutuo Obligated Group Project), Series 2021, 5.00% 7/1/2029 | 470 | 489 | |
900 | |||
Rhode Island 1.14% | |||
Student Loan Auth., Education Loan Rev. Bonds, Series 2022-A, AMT, 4.125% 12/1/2041 | 540 | 519 | |
Student Loan Auth., Education Loan Rev. Bonds, Series 2024-A, AMT, 4.125% 12/1/2043 | 100 | 97 | |
616 | |||
85 | Capital Group Fixed Income ETF Trust |
Capital Group Short Duration Municipal Income ETF (continued)
Bonds, notes & other debt instruments (continued) | Principal amount (000) | Value (000) | |
South Carolina 0.61% | |||
Housing Fin. and Dev. Auth., Mortgage Rev. Ref. Bonds, Series 2014-A-1, 4.00% 7/1/2041 | USD 330 | $330 | |
Tennessee 4.05% | |||
Housing Dev. Agcy., Residential Fin. Program Bonds, Series 2023-3A, 6.25% 1/1/2054 | 85 | 92 | |
Metropolitan Dev. and Housing Agcy., Tax Increment Dev. Rev. Bonds (Fifth & Broadway Dev. Project), Series 2018, 4.50% 6/1/20281 | 200 | 199 | |
Metropolitan Government of Nashville and Davidson County, G.O. Improvement Bonds, Series 2015-C, 5.00% 7/1/2032 (preref. 7/1/2025) | 850 | 865 | |
County of Shelby, Health, Health Care Rev. Ref. and Improvement Bonds (Baptist Memorial Health Care), Series 2024-B, 5.00% 9/1/2049 (put 9/1/2029) | 500 | 527 | |
Tenergy Corp, Gas Supply Rev. Bonds, Series 2021-A, 4.00% 12/1/2051 (put 9/1/2028) | 500 | 501 | |
2,184 | |||
Texas 12.95% | |||
Affordable Housing Corp., Multi Family Housing Rev. Bonds (Juniper Creek Apartments Project), Series 2023, 3.75% 7/1/2044 (put 7/1/2026) | 500 | 496 | |
Central Texas Regional Mobility Auth., Rev. Bond Anticipation Notes, Series 2021-C, 5.00% 1/1/2027 | 500 | 511 | |
County of Collin, Road and Rev. Ref. Bonds, Series 2016, 4.00% 2/15/2027 | 500 | 504 | |
Cypress-Fairbanks Independent School Dist., Unlimited Tax School Building Bonds, Series 2019-A, 5.00% 2/15/2025 | 500 | 505 | |
City of Dallas, Special Tax Rev. Bonds (Kay Bailey Hutchison Convention Center Dallas Venue Project), Series 2023, 6.00% 8/15/2053 (put 8/15/2028)1 | 400 | 403 | |
County of Harris, Toll Road Rev. and Rev. Ref. Bonds, Series 2018-A, 5.00% 8/15/2024 | 255 | 255 | |
City of Houston, Airport System Special Facs. Rev. Ref. Bonds (United Airlines, Inc. Terminal Improvement Projects), Series 2020-C, AMT, 5.00% 7/15/2027 | 500 | 510 | |
Humble Independent School Dist., Unlimited Tax School Building Bonds, Series 2022, 5.00% 2/15/2028 | 640 | 681 | |
City of Hutto, Combination Tax and Waterworks and Sewer System Rev. Certs. of Obligation, Series 2024, 5.00% 8/1/2029 | 240 | 259 | |
Klein Independent School Dist., Unlimited Tax Rev. Ref. Bonds, Series 2016-A, 3.00% 8/1/2028 | 750 | 728 | |
Love Field Airport Modernization Corp., Special Facs. Rev. Bonds, Series 2012, AMT, 5.00% 11/1/2028 | 750 | 750 | |
Municipal Gas Acquisition and Supply Corp. IV, Gas Supply Rev. Bonds, Series 2023-A, 5.50% 1/1/2054 (put 1/1/2030) | 250 | 268 | |
City of San Antonio, Electric and Gas Systems Rev. Ref. Bonds, Series 2019, 4.00% 2/1/2027 | 600 | 611 | |
Board of Regents of the University of Texas System, Rev. Fncg. System Rev. Ref. Bonds, Series 2014-B, 5.00% 8/15/2025 | 500 | 509 | |
6,990 | |||
Utah 0.98% | |||
Salt Lake City, Airport Rev. Bonds (Salt Lake City International Airport), Series 2023-A, AMT, 5.00% 7/1/2029 | 500 | 528 | |
Virginia 6.68% | |||
County of Henrico, Econ. Dev. Auth., Residential Care Fac. Rev. Ref. Bonds (LifeSpire of Virginia), Series 2017-C, 3.125% 12/1/2024 | 105 | 105 | |
County of James City, Econ. Dev. Auth., Residential Care Fac. Rev. Bonds (Williamsburg Landing), Series 2024-C-2, 5.50% 12/1/2028 | 365 | 367 | |
Public Building Auth., Public Facs. Rev. Bonds, Series 2015-B, AMT, 5.00% 8/1/2028 | 800 | 846 | |
Small Business Fncg. Auth., Rev. Bonds (National Senior Campuses, Inc. Obligated Group), Series 2020-A, 5.00% 1/1/2025 | 855 | 859 | |
Small Business Fncg. Auth., Rev. Bonds (National Senior Campuses, Inc. Obligated Group), Series 2020-A, 5.00% 1/1/2027 | 500 | 513 | |
Small Business Fncg. Auth., Rev. Ref. Bonds (Elizabeth River Crossings Opco, LLC Project), Series 2022, AMT, 4.00% 7/1/2029 | 500 | 503 | |
Virginia Beach Dev. Auth., Residential Care Fac. Rev. Bonds (Westminster-Canterbury on Chesapeake Bay), Series 2023-B-3, 5.375% 9/1/2029 | 400 | 416 | |
3,609 | |||
Capital Group Fixed Income ETF Trust | 86 |
Capital Group Short Duration Municipal Income ETF (continued)
Bonds, notes & other debt instruments (continued) | Principal amount (000) | Value (000) | |
Wisconsin 1.01% | |||
Public Fin. Auth., Special Rev. Bonds (Candela Project), Series 2023, 6.125% 12/15/20291 | USD 200 | $196 | |
Public Fin. Auth., Special Rev. Bonds (Signorelli Projects, Municipal Utility Dists., Montgomery and Waller Counties), Series 2024, 5.375% 12/15/20321 | 350 | 350 | |
546 | |||
Total bonds, notes & other debt instruments (cost: $50,002,000) | 50,881 | ||
Short-term securities 6.57% | |||
Municipals 6.57% | |||
State of Mississippi, Business Fin. Corp., Gulf Opportunity Zone Industrial Dev. Rev. Bonds (Chevron U.S.A., Inc. Project), Series 2011-E, 4.75% 11/1/20352 | 700 | 700 | |
State of Florida, Capital Facs. Fin. Agcy., Solid Waste Disposal Rev. Ref. Bonds (Republic Services, Inc. Project), Series 2010-A, 3.90% 7/1/2034 (put 9/3/2024)3 | 700 | 700 | |
State of California, City and County of San Francisco, Community Facs. Dist. No. 2016-1 (Treasure Island), Improvement Area No. 2, Special Tax Bonds, Series 2023-A, 5.00% 9/1/20241 | 250 | 250 | |
State of Illinois, Fin. Auth., Demand Rev. Bonds (University of Chicago Medical Center), Series 2011-A, 4.50% 8/1/20442 | 300 | 300 | |
State of Missouri, Health and Educational Facs. Auth., Demand Educational Facs. Rev. Bonds (Washington University), Series 2000-B, 4.60% 3/1/20402 | 1,000 | 1,000 | |
State of Ohio, Hospital Rev. Bonds (Cleveland Clinic Health System Obligated Group), Series 2013-B-3, 4.90% 1/1/20392 | 600 | 600 | |
3,550 | |||
Total short-term securities (cost: $3,551,000) | 3,550 | ||
Total investment securities 100.81% (cost: $53,553,000) | 54,431 | ||
Other assets less liabilities (0.81)% | (439 ) | ||
Net assets 100.00% | $53,992 | ||
Futures contracts
Contracts | Type | Number of contracts | Expiration date | Notional amount (000) | Value and unrealized appreciation (depreciation) at 6/30/2024 (000) |
2 Year U.S. Treasury Note Futures | Long | 8 | 9/30/2024 | USD1,634 | $(3 ) |
5 Year U.S. Treasury Note Futures | Short | 10 | 9/30/2024 | 1,066 | 7 |
10 Year U.S. Treasury Note Futures | Short | 4 | 9/19/2024 | (440 ) | 2 |
$6 |
1 | Acquired in a transaction exempt from registration under Rule 144A or, for commercial paper, Section 4(a)(2) of the Securities Act of 1933. May be resold in the U.S. in transactions exempt from registration, normally to qualified institutional buyers. The total value of all such securities was $3,768,000, which represented 6.98% of the net assets of the fund. |
2 | Coupon rate may change periodically. Reference rate and spread are as of the most recent information available. Some coupon rates are determined by the issuer or agent based on current market conditions; therefore, the reference rate and spread are not available. For short-term securities, the date of the next scheduled coupon rate change is considered to be the maturity date. |
3 | For short-term securities, the mandatory put date is considered to be the maturity date. |
87 | Capital Group Fixed Income ETF Trust |
Capital Group Short Duration Municipal Income ETF (continued)
Key to abbreviation(s) |
Agcy. = Agency |
AMT = Alternative Minimum Tax |
Auth. = Authority |
Certs. = Certificates |
Dev. = Development |
Dist. = District |
Dists. = Districts |
Econ. = Economic |
Fac. = Facility |
Facs. = Facilities |
Fin. = Finance |
Fncg. = Financing |
G.O. = General Obligation |
preref. = Prerefunded |
Redev. = Redevelopment |
Ref. = Refunding |
Rev. = Revenue |
USD = U.S. dollars |
Refer to the notes to financial statements.
Capital Group Fixed Income ETF Trust | 88 |
Capital Group Ultra Short Income ETFunaudited
Investment portfolio June 30, 2024
Bonds, notes & other debt instruments 79.28% | Principal amount (000) | Value (000) | ||
Corporate bonds, notes & loans 55.16% | ||||
Financials 25.60% | ||||
American Express Co. 2.25% 3/4/2025 | USD300 | $294 | ||
Aon Global, Ltd. 3.875% 12/15/2025 | 50 | 49 | ||
Bank of America Corp. 0.981% 9/25/2025 (USD-SOFR + 0.91% on 9/25/2024)1 | 300 | 297 | ||
Bank of America Corp. 1.319% 6/19/2026 (USD-SOFR + 1.15% on 6/19/2025)1 | 300 | 288 | ||
Bank of New York Mellon Corp. 4.414% 7/24/2026 (USD-SOFR + 1.345% on 7/24/2025)1 | 50 | 49 | ||
Barclays PLC 4.375% 1/12/2026 | 200 | 197 | ||
BNP Paribas SA 3.375% 1/9/20252 | 200 | 197 | ||
BPCE SA 1.625% 1/14/20252 | 250 | 245 | ||
Capital One Financial Corp. 3.20% 2/5/2025 | 100 | 98 | ||
Charles Schwab Corp. (The) 5.875% 8/24/2026 | 50 | 51 | ||
Citigroup, Inc. 1.281% 11/3/2025 (USD-SOFR + 0.528% on 11/3/2024)1 | 300 | 295 | ||
Citigroup, Inc. 2.014% 1/25/2026 (USD-SOFR + 0.694% on 1/25/2025)1 | 300 | 294 | ||
Citizens Financial Group, Inc. 4.30% 12/3/2025 | 50 | 49 | ||
Corebridge Financial, Inc. 3.50% 4/4/2025 | 100 | 98 | ||
Deutsche Bank AG 6.119% 7/14/2026 (USD-SOFR + 3.19% on 7/14/2025)1 | 150 | 150 | ||
Global Payments, Inc. 2.65% 2/15/2025 | 50 | 49 | ||
Goldman Sachs Group, Inc. 5.70% 11/1/2024 | 300 | 300 | ||
Goldman Sachs Group, Inc. 3.50% 4/1/2025 | 300 | 295 | ||
HSBC Holdings PLC 2.633% 11/7/2025 (USD-SOFR + 1.402% on 11/7/2024)1 | 250 | 247 | ||
Intercontinental Exchange, Inc. 3.65% 5/23/2025 | 50 | 49 | ||
JPMorgan Chase & Co. 1.561% 12/10/2025 (USD-SOFR + 0.605% on 12/10/2024)1 | 325 | 319 | ||
JPMorgan Chase & Co. 2.083% 4/22/2026 (USD-SOFR + 1.85% on 4/22/2025)1 | 325 | 316 | ||
Lloyds Banking Group PLC 4.582% 12/10/2025 | 200 | 196 | ||
Metropolitan Life Global Funding I 0.95% 7/2/20252 | 150 | 144 | ||
Morgan Stanley 2.72% 7/22/2025 (USD-SOFR + 1.152% on 7/22/2024)1 | 300 | 299 | ||
Morgan Stanley 1.164% 10/21/2025 (USD-SOFR + 0.56% on 10/21/2024)1 | 300 | 296 | ||
Nasdaq, Inc. 5.65% 6/28/2025 | 75 | 75 | ||
New York Life Global Funding 0.95% 6/24/20252 | 200 | 191 | ||
Northwestern Mutual Global Funding 4.00% 7/1/20252 | 50 | 49 | ||
PNC Bank, National Association 4.20% 11/1/2025 | 250 | 245 | ||
PRICOA Global Funding I 1.15% 12/6/20242 | 200 | 196 | ||
Royal Bank of Canada 5.66% 10/25/2024 | 150 | 150 | ||
Royal Bank of Canada 4.65% 1/27/2026 | 150 | 148 | ||
Sumitomo Mitsui Financial Group, Inc. 1.474% 7/8/2025 | 200 | 192 | ||
Synchrony Financial 4.50% 7/23/2025 | 50 | 49 | ||
Toronto-Dominion Bank (The) 1.15% 6/12/2025 | 50 | 48 | ||
Truist Bank 3.625% 9/16/2025 | 250 | 244 | ||
U.S. Bancorp 1.45% 5/12/2025 | 100 | 97 | ||
UBS AG 7.95% 1/9/2025 | 250 | 253 | ||
Wells Fargo & Co. 2.406% 10/30/2025 (3-month USD CME Term SOFR + 1.087% on 10/30/2024)1 | 300 | 297 | ||
Wells Fargo & Co. 2.188% 4/30/2026 (USD-SOFR + 2.00% on 4/30/2025)1 | 300 | 291 | ||
7,686 | ||||
Health care 7.54% | ||||
AbbVie, Inc. 3.60% 5/14/2025 | 300 | 295 | ||
Amgen, Inc. 1.90% 2/21/2025 | 300 | 293 | ||
Amgen, Inc. 5.507% 3/2/2026 | 300 | 300 | ||
AstraZeneca PLC 0.70% 4/8/2026 | 50 | 46 | ||
Baxter International, Inc. 1.322% 11/29/2024 | 50 | 49 | ||
Baxter International, Inc. 2.60% 8/15/2026 | 50 | 47 | ||
Becton, Dickinson and Co. 3.734% 12/15/2024 | 50 | 50 | ||
Boston Scientific Corp. 1.90% 6/1/2025 | 50 | 49 | ||
Bristol-Myers Squibb Co. 0.75% 11/13/2025 | 50 | 47 | ||
Bristol-Myers Squibb Co. 4.95% 2/20/2026 | 50 | 50 | ||
Cigna Group (The) 3.25% 4/15/2025 | 50 | 49 | ||
CVS Health Corp. 3.875% 7/20/2025 | 150 | 147 | ||
CVS Health Corp. 5.00% 2/20/2026 | 100 | 99 | ||
Elevance Health, Inc. 2.375% 1/15/2025 | 50 | 49 | ||
Eli Lilly and Co. 2.75% 6/1/2025 | 100 | 98 | ||
GE HealthCare Technologies, Inc. 5.55% 11/15/2024 | 100 | 100 | ||
89 | Capital Group Fixed Income ETF Trust |
Capital Group Ultra Short Income ETF (continued)
Bonds, notes & other debt instruments (continued) | Principal amount (000) | Value (000) | ||
Corporate bonds, notes & loans (continued) | ||||
Health care (continued) | ||||
HCA, Inc. 5.375% 2/1/2025 | USD100 | $100 | ||
Humana, Inc. 3.85% 10/1/2024 | 150 | 149 | ||
Laboratory Corp. of America Holdings 3.60% 2/1/2025 | 100 | 99 | ||
Pfizer Investment Enterprises Pte., Ltd. 4.45% 5/19/2026 | 100 | 99 | ||
Thermo Fisher Scientific, Inc. 1.215% 10/18/2024 | 50 | 49 | ||
2,264 | ||||
Utilities 5.85% | ||||
Berkshire Hathaway Energy Co. 4.05% 4/15/2025 | 100 | 99 | ||
CenterPoint Energy, Inc. 5.25% 8/10/2026 | 50 | 50 | ||
CMS Energy Corp. 3.00% 5/15/2026 | 50 | 48 | ||
DTE Energy Co. 1.05% 6/1/2025 | 50 | 48 | ||
Duke Energy Corp. 0.90% 9/15/2025 | 50 | 47 | ||
Duke Energy Corp. 5.00% 12/8/2025 | 50 | 50 | ||
Edison International 3.55% 11/15/2024 | 250 | 248 | ||
Edison International 4.70% 8/15/2025 | 250 | 247 | ||
Entergy Louisiana, LLC 0.95% 10/1/2024 | 50 | 49 | ||
Eversource Energy 0.80% 8/15/2025 | 50 | 47 | ||
FirstEnergy Corp. 2.05% 3/1/2025 | 50 | 49 | ||
Florida Power & Light Co. 2.85% 4/1/2025 | 50 | 49 | ||
Jersey Central Power & Light Co. 4.30% 1/15/20262 | 50 | 49 | ||
Pacific Gas and Electric Co. 3.45% 7/1/2025 | 250 | 244 | ||
Pacific Gas and Electric Co. 2.95% 3/1/2026 | 250 | 239 | ||
Southern Power Co. 0.90% 1/15/2026 | 50 | 47 | ||
Virginia Electric & Power 3.10% 5/15/2025 | 50 | 49 | ||
WEC Energy Group, Inc. 5.00% 9/27/2025 | 50 | 50 | ||
Xcel Energy, Inc. 3.30% 6/1/2025 | 50 | 49 | ||
1,758 | ||||
Communication services 4.07% | ||||
AT&T, Inc. 1.70% 3/25/2026 | 100 | 94 | ||
Charter Communications Operating, LLC 4.908% 7/23/2025 | 100 | 99 | ||
Comcast Corp. 3.95% 10/15/2025 | 50 | 49 | ||
Discovery Communications, LLC 4.90% 3/11/2026 | 100 | 99 | ||
Netflix, Inc. 5.875% 2/15/2025 | 50 | 50 | ||
T-Mobile USA, Inc. 3.50% 4/15/2025 | 250 | 246 | ||
T-Mobile USA, Inc. 2.25% 2/15/2026 | 200 | 190 | ||
Verizon Communications, Inc. 3.50% 11/1/2024 | 200 | 199 | ||
Verizon Communications, Inc. 3.376% 2/15/2025 | 200 | 197 | ||
1,223 | ||||
Industrials 2.60% | ||||
BAE Systems Holdings, Inc. 3.85% 12/15/20252 | 50 | 49 | ||
Boeing Co. 4.875% 5/1/2025 | 150 | 148 | ||
Boeing Co. 2.75% 2/1/2026 | 150 | 143 | ||
Burlington Northern Santa Fe, LLC 3.00% 4/1/2025 | 50 | 49 | ||
Canadian Pacific Railway Co. 1.35% 12/2/2024 | 50 | 49 | ||
Carrier Global Corp. 2.242% 2/15/2025 | 200 | 196 | ||
Northrop Grumman Corp. 2.93% 1/15/2025 | 100 | 98 | ||
RTX Corp. 3.95% 8/16/2025 | 50 | 49 | ||
781 | ||||
Consumer staples 2.13% | ||||
Altria Group, Inc. 2.35% 5/6/2025 | 100 | 97 | ||
BAT Capital Corp. 2.789% 9/6/2024 | 100 | 99 | ||
Conagra Brands, Inc. 4.60% 11/1/2025 | 50 | 50 | ||
Philip Morris International, Inc. 5.125% 11/15/2024 | 150 | 150 | ||
Philip Morris International, Inc. 1.50% 5/1/2025 | 100 | 97 | ||
Reynolds American, Inc. 4.45% 6/12/2025 | 150 | 148 | ||
641 | ||||
Capital Group Fixed Income ETF Trust | 90 |
Capital Group Ultra Short Income ETF (continued)
Bonds, notes & other debt instruments (continued) | Principal amount (000) | Value (000) | ||
Corporate bonds, notes & loans (continued) | ||||
Real estate 1.94% | ||||
Boston Properties, LP 2.75% 10/1/2026 | USD50 | $47 | ||
COPT Defense Properties, LP 2.25% 3/15/2026 | 50 | 47 | ||
Equinix, Inc. 2.625% 11/18/2024 | 150 | 148 | ||
Equinix, Inc. 1.00% 9/15/2025 | 150 | 142 | ||
VICI Properties, LP 4.625% 6/15/20252 | 200 | 198 | ||
582 | ||||
Consumer discretionary 1.81% | ||||
Daimler Trucks Finance North America, LLC 3.50% 4/7/20252 | 150 | 147 | ||
Ford Motor Credit Co., LLC 5.125% 6/16/2025 | 200 | 199 | ||
General Motors Financial Co., Inc. 2.75% 6/20/2025 | 50 | 49 | ||
Hyundai Capital America 1.80% 10/15/20252 | 50 | 48 | ||
Marriott International, Inc. 5.75% 5/1/2025 | 50 | 50 | ||
Toyota Motor Credit Corp. 3.40% 4/14/2025 | 50 | 49 | ||
542 | ||||
Energy 1.48% | ||||
Canadian Natural Resources, Ltd. 2.05% 7/15/2025 | 50 | 48 | ||
Columbia Pipeline Group, Inc. 4.50% 6/1/2025 | 50 | 49 | ||
Enbridge, Inc. 5.90% 11/15/2026 | 50 | 51 | ||
Energy Transfer, LP 4.05% 3/15/2025 | 50 | 50 | ||
Kinder Morgan, Inc. 4.30% 6/1/2025 | 50 | 49 | ||
MPLX, LP 4.875% 6/1/2025 | 100 | 99 | ||
ONEOK, Inc. 2.20% 9/15/2025 | 50 | 48 | ||
Williams Companies, Inc. 3.90% 1/15/2025 | 50 | 50 | ||
444 | ||||
Materials 1.48% | ||||
Anglo American Capital PLC 3.625% 9/11/20242 | 200 | 199 | ||
BHP Billiton Finance (USA), Ltd. 4.875% 2/27/2026 | 50 | 50 | ||
Celanese US Holdings, LLC 6.05% 3/15/2025 | 50 | 50 | ||
International Flavors & Fragrances, Inc. 1.23% 10/1/20252 | 50 | 47 | ||
LYB International Finance III, LLC 1.25% 10/1/2025 | 50 | 47 | ||
Sherwin-Williams Co. 4.05% 8/8/2024 | 50 | 50 | ||
443 | ||||
Information technology 0.66% | ||||
Broadcom Corp. 3.125% 1/15/2025 | 50 | 49 | ||
Hewlett Packard Enterprise Co. 5.90% 10/1/2024 | 50 | 50 | ||
Microchip Technology, Inc. 0.983% 9/1/2024 | 50 | 50 | ||
Oracle Corp. 2.50% 4/1/2025 | 50 | 49 | ||
198 | ||||
Total corporate bonds, notes & loans | 16,562 | |||
Asset-backed obligations 17.07% | ||||
ACHV ABS TRUST., Series 23-4CP, Class C, 7.71% 11/25/20302,3 | 205 | 208 | ||
Affirm, Inc., Series 23-A, Class 1A, 6.61% 1/18/20282,3 | 355 | 356 | ||
Auxilior Term Funding, LLC, Series 2023-1, Class A2, 6.18% 12/15/20282,3 | 200 | 201 | ||
Avis Budget Rental Car Funding (AESOP), LLC, Series 2020-2, Class A, 2.02% 2/20/20272,3 | 150 | 143 | ||
Avis Budget Rental Car Funding (AESOP), LLC, Series 2022-5, Class C, 6.24% 4/20/20272,3 | 100 | 100 | ||
Bankers Healthcare Group Securitization Trust, Series 2022-A, Class A, 1.71% 2/20/20352,3 | 219 | 217 | ||
Bridgecrest Lending Auto Securitization Trust, Series 2023-1, Class B, 6.80% 8/15/2029 | 290 | 294 | ||
Carvana Auto Receivables Trust, Series 2021-N4, Class C, 1.72% 9/11/2028 | 195 | 184 | ||
Chesapeake Funding II, LLC, Series 21-1A, Class A1, 0.47% 4/15/20332,3 | 69 | 69 | ||
CPS Auto Receivables Trust, Series 2022-C, Class B, 4.88% 4/15/20302,3 | 306 | 305 | ||
Discover Card Execution Note Trust, Series 2022-4, Class A, 5.03% 10/15/2027 | 200 | 199 | ||
Enterprise Fleet Financing, LLC, Series 22-1, Class A3, 3.27% 1/20/20282,3 | 256 | 249 | ||
91 | Capital Group Fixed Income ETF Trust |
Capital Group Ultra Short Income ETF (continued)
Bonds, notes & other debt instruments (continued) | Principal amount (000) | Value (000) | ||
Asset-backed obligations (continued) | ||||
Exeter Automobile Receivables Trust., Series 24-3A, Class A2, 5.82% 2/15/2027 | USD200 | $200 | ||
Firstkey Homes Trust., Series 20-SFR2, Class C, 1.667% 10/19/20372,3 | 200 | 189 | ||
Ford Credit Auto Owner Trust, Series 2020-2, Class A, 1.31% 4/15/20332,3 | 150 | 142 | ||
GLS Auto Receivables Trust, Series 2024-1, Class B, 5.49% 7/17/20282,3 | 409 | 408 | ||
Invitation Homes Trust., Series 18-SFR4, Class A, (1-month USD CME Term SOFR + 1.21%) 6.543% 1/17/20382,3,4 | 187 | 188 | ||
John Deere Owner Trust., Series 22-A, Class A4, 2.49% 1/16/2029 | 200 | 193 | ||
Navistar Financial Dealer Note Master Trust., Series 23-1, Class A, 6.18% 8/25/20282,3 | 345 | 347 | ||
PFS Financing Corp., Series 2023-B, Class A, 5.27% 5/15/20282,3 | 230 | 230 | ||
Santander Drive Auto Receivables Trust, Series 2022-3, Class C, 4.49% 8/15/2029 | 260 | 255 | ||
Synchrony Card Issuance Trust., Series 22-A2, Class A, 3.86% 7/15/2028 | 200 | 197 | ||
Voya CLO, Ltd., Series 2018-3, Class A1R2, (3-month USD CME Term SOFR + 1.20%) 6.524% 10/15/20312,3,4 | 250 | 250 | ||
5,124 | ||||
Mortgage-backed obligations 7.05% | ||||
Collateralized mortgage-backed obligations (privately originated) 4.72% | ||||
COLT Funding, LLC, Series 24-2, Class A1, 6.125% 4/25/20691,2,3 | 325 | 325 | ||
Connecticut Avenue Securities Trust, Series 2024-R02, Class 1M1, (30-day Average USD-SOFR + 1.10%) 6.435% 2/25/20442,3,4 | 408 | 408 | ||
Freddie Mac Structured Agency Credit Risk Debt Notes, Series 2022-DNA2, Class M1A, (30-day Average USD-SOFR + 1.30%) 6.635% 2/25/20422,3,4 | 182 | 183 | ||
Towd Point Mortgage Trust, Series 2017-4, Class A1, 2.75% 6/25/20572,3,4 | 284 | 271 | ||
Towd Point Mortgage Trust, Series 2018-2, Class A1, 3.25% 3/25/20582,3,4 | 236 | 230 | ||
1,417 | ||||
Commercial mortgage-backed securities 2.33% | ||||
BX Trust, Series 21-MFM1, Class A, (1-month USD CME Term SOFR + 0.81%) 6.143% 1/15/20342,3,4 | 354 | 351 | ||
BX Trust, Series 2021-SDMF, Class A, (1-month USD CME Term SOFR + 0.703%) 6.032% 9/15/20342,3,4 | 354 | 349 | ||
700 | ||||
Total mortgage-backed obligations | 2,117 | |||
Total bonds, notes & other debt instruments (cost: $23,796,000) | 23,803 | |||
Short-term securities 20.01% | Weighted average yield at acquisition | |||
Commercial paper 19.53% | ||||
Chariot Funding, LLC 9/5/20242 | 5.045 % | 600 | 594 | |
ING (U.S.) Funding, LLC 10/21/20242 | 5.250 | 1,200 | 1,179 | |
LMA-Americas, LLC 10/17/20242 | 5.287 | 1,067 | 1,049 | |
Oversea-Chinese Banking Corp., Ltd. 9/24/20242 | 5.175 | 1,000 | 987 | |
Starbird Funding Corp. 12/30/20242 | 5.381 | 1,000 | 973 | |
Victory Receivables Corp. 10/9/20242 | 5.219 | 1,100 | 1,083 | |
5,865 | ||||
U.S. Treasury bills 0.48% | ||||
U.S. Treasury 7/9/2024 | 3.284 | 145 | 145 | |
Total short-term securities (cost: $6,013,000) | 6,010 | |||
Total investment securities 99.29% (cost: $29,809,000) | 29,813 | |||
Other assets less liabilities 0.71% | 212 | |||
Net assets 100.00% | $30,025 |
Capital Group Fixed Income ETF Trust | 92 |
Capital Group Ultra Short Income ETF (continued)
1 | Step bond; coupon rate may change at a later date. |
2 | Acquired in a transaction exempt from registration under Rule 144A or, for commercial paper, Section 4(a)(2) of the Securities Act of 1933. May be resold in the U.S. in transactions exempt from registration, normally to qualified institutional buyers. The total value of all such securities was $13,343,000, which represented 44.44% of the net assets of the fund. |
3 | Principal payments may be made periodically. Therefore, the effective maturity date may be earlier than the stated maturity date. |
4 | Coupon rate may change periodically. Reference rate and spread are as of the most recent information available. Some coupon rates are determined by the issuer or agent based on current market conditions; therefore, the reference rate and spread are not available. |
Key to abbreviation(s) |
CLO = Collateralized Loan Obligations |
CME = CME Group |
CMS = Constant Maturity Swap |
SOFR = Secured Overnight Financing Rate |
USD = U.S. dollars |
Refer to the notes to financial statements.
93 | Capital Group Fixed Income ETF Trust |
Capital Group U.S. Multi-Sector Income ETFunaudited
Investment portfolio June 30, 2024
Bonds, notes & other debt instruments 95.35% | Principal amount (000) | Value (000) | ||
Corporate bonds, notes & loans 71.72% | ||||
Financials 13.92% | ||||
AG Issuer, LLC 6.25% 3/1/20281 | USD1,776 | $1,739 | ||
AG TTMT Escrow Issuer, LLC 8.625% 9/30/20271 | 940 | 976 | ||
Alliant Holdings Intermediate, LLC 6.75% 10/15/20271 | 760 | 750 | ||
Alliant Holdings Intermediate, LLC 5.875% 11/1/20291 | 1,300 | 1,218 | ||
Alliant Holdings Intermediate, LLC 7.00% 1/15/20311 | 1,190 | 1,203 | ||
Alpha Bank SA 4.25% 2/13/2030 (5-year EUR Mid-Swap + 4.504% on 2/13/2025)2 | EUR625 | 667 | ||
Alpha Bank SA 4.25% 6/11/2031 (5-year EUR Mid-Swap + 5.823% on 6/11/2026)2 | 100 | 106 | ||
American Express Co. 5.532% 4/25/2030 (USD-SOFR + 1.09% on 4/25/2029)2 | USD1,100 | 1,113 | ||
American International Group, Inc. 5.125% 3/27/2033 | 806 | 794 | ||
AmWINS Group, Inc. 6.375% 2/15/20291 | 500 | 502 | ||
AmWINS Group, Inc. 4.875% 6/30/20291 | 2,170 | 2,022 | ||
Aon North America, Inc. 5.45% 3/1/2034 | 900 | 896 | ||
Aretec Group, Inc. 7.50% 4/1/20291 | 1,055 | 1,018 | ||
Aretec Group, Inc. 10.00% 8/15/20301 | 685 | 746 | ||
AssuredPartners, Inc. 5.625% 1/15/20291 | 1,621 | 1,518 | ||
Baldwin Insurance Group Holdings, LLC 7.125% 5/15/20311 | 560 | 567 | ||
Banco BTG Pactual SA 6.25% 4/8/20291 | 370 | 372 | ||
Bangkok Bank Public Co., Ltd. 3.733% 9/25/2034 (5-year UST Yield Curve Rate T Note Constant Maturity + 1.90% on 9/25/2029)2 | 1,824 | 1,617 | ||
Bangkok Bank Public Co., Ltd. 3.466% 9/23/2036 (5-year UST Yield Curve Rate T Note Constant Maturity + 2.15% on 9/23/2031)2 | 400 | 333 | ||
Bank of America Corp. 5.872% 9/15/2034 (USD-SOFR + 1.84% on 9/15/2033)2 | 1,934 | 1,990 | ||
Bank of America Corp. 5.468% 1/23/2035 (3-month USD CME Term SOFR + 1.65% on 1/23/2034)2 | 1,820 | 1,819 | ||
Bank of East Asia, Ltd. 4.875% 4/22/2032 (5-year UST Yield Curve Rate T Note Constant Maturity + 2.30% on 4/22/2027)2 | 500 | 476 | ||
Bank of New York Mellon Corp. 5.188% 3/14/2035 (USD-SOFR + 1.418% on 3/14/2034)2 | 624 | 616 | ||
BBVA Bancomer SA 5.875% 9/13/2034 (5-year UST Yield Curve Rate T Note Constant Maturity + 4.308% on 9/13/2029)2 | 1,350 | 1,253 | ||
BBVA Bancomer SA 8.45% 6/29/2038 (5-year UST Yield Curve Rate T Note Constant Maturity + 4.661% on 6/29/2033)2 | 1,150 | 1,186 | ||
BlackRock Funding, Inc. 5.00% 3/14/2034 | 1,575 | 1,563 | ||
BlackRock Funding, Inc. 5.25% 3/14/2054 | 1,217 | 1,177 | ||
Block, Inc. 3.50% 6/1/2031 | 383 | 331 | ||
Block, Inc. 6.50% 5/15/20321 | 1,800 | 1,826 | ||
Boost Newco Borrower, LLC 7.50% 1/15/20311 | 1,475 | 1,539 | ||
BPCE SA 5.936% 5/30/2035 (USD-SOFR + 1.85% on 5/30/2034)1,2 | 1,300 | 1,295 | ||
Bread Financial Holdings, Inc. 9.75% 3/15/20291 | 920 | 967 | ||
CaixaBank, SA 6.84% 9/13/2034 (USD-SOFR + 2.77% on 9/13/2033)1,2 | 525 | 555 | ||
CaixaBank, SA 6.037% 6/15/2035 (USD-SOFR + 2.26% on 9/15/2034)1,2 | 2,630 | 2,637 | ||
Capital One Financial Corp. 5.468% 2/1/2029 (USD-SOFR + 2.08% on 2/1/2028)2 | 54 | 54 | ||
Capital One Financial Corp. 5.70% 2/1/2030 (USD-SOFR + 1.905% on 2/1/2029)2 | 1,901 | 1,911 | ||
Capital One Financial Corp. 6.377% 6/8/2034 (USD-SOFR + 2.86% on 6/8/2033)2 | 2,189 | 2,247 | ||
Capital One Financial Corp. 6.051% 2/1/2035 (USD-SOFR + 2.26% on 2/1/2034)2 | 1,016 | 1,022 | ||
Charles Schwab Corp. (The) 5.853% 5/19/2034 (USD-SOFR + 2.50% on 5/19/2033)2 | 1,292 | 1,318 | ||
Chubb INA Holdings, LLC 5.00% 3/15/2034 | 1,555 | 1,540 | ||
Citigroup, Inc. 5.174% 2/13/2030 (USD-SOFR + 1.364% on 2/13/2029)2 | 975 | 970 | ||
Citigroup, Inc. 6.174% 5/25/2034 (USD-SOFR + 2.661% on 5/25/2033)2 | 1,725 | 1,755 | ||
Coinbase Global, Inc. 3.375% 10/1/20281 | 1,271 | 1,091 | ||
Coinbase Global, Inc. 3.625% 10/1/20311 | 1,871 | 1,502 | ||
Compass Group Diversified Holdings, LLC 5.25% 4/15/20291 | 1,700 | 1,614 | ||
Compass Group Diversified Holdings, LLC 5.00% 1/15/20321 | 1,360 | 1,232 | ||
Corebridge Financial, Inc. 3.90% 4/5/2032 | 250 | 224 | ||
Corebridge Financial, Inc. 4.40% 4/5/2052 | 251 | 198 | ||
Deutsche Bank AG 6.819% 11/20/2029 (USD-SOFR + 2.51% on 11/20/2028)2 | 700 | 728 | ||
Fifth Third Bancorp 6.339% 7/27/2029 (USD-SOFR + 2.34% on 7/27/2028)2 | 65 | 67 | ||
Fifth Third Bancorp 5.631% 1/29/2032 (USD-SOFR + 1.84% on 1/29/2031)2 | 390 | 387 | ||
Goldman Sachs Group, Inc. 5.727% 4/25/2030 (USD-SOFR + 1.265% on 4/25/2029)2 | 1,450 | 1,476 | ||
Goldman Sachs Group, Inc. 3.102% 2/24/2033 (USD-SOFR + 1.41% on 2/24/2032)2 | 2,533 | 2,164 | ||
Goldman Sachs Group, Inc. 5.851% 4/25/2035 (USD-SOFR + 1.552% on 4/25/2034)2 | 3,275 | 3,356 | ||
Capital Group Fixed Income ETF Trust | 94 |
Capital Group U.S. Multi-Sector Income ETF (continued)
Bonds, notes & other debt instruments (continued) | Principal amount (000) | Value (000) | ||
Corporate bonds, notes & loans (continued) | ||||
Financials (continued) | ||||
Hightower Holding, LLC 6.75% 4/15/20291 | USD725 | $679 | ||
Howden UK Refinance 2 PLC 8.125% 2/15/20321 | 1,720 | 1,710 | ||
Howden UK Refinance PLC 7.25% 2/15/20311 | 2,160 | 2,146 | ||
HSBC Holdings PLC 6.254% 3/9/2034 (USD-SOFR + 2.39% on 3/9/2033)2 | 25 | 26 | ||
HSBC Holdings PLC 6.332% 3/9/2044 (USD-SOFR + 2.65% on 3/9/2043)2 | 1,614 | 1,689 | ||
HUB International, Ltd. 5.625% 12/1/20291 | 1,200 | 1,136 | ||
HUB International, Ltd. 7.25% 6/15/20301 | 1,116 | 1,145 | ||
HUB International, Ltd. 7.375% 1/31/20321 | 1,095 | 1,111 | ||
HUB International, Ltd., Term Loan B, (3-month USD CME Term SOFR + 3.25%) 8.575% 6/20/20303,4 | 49 | 49 | ||
Huntington Bancshares, Inc. 6.208% 8/21/2029 (USD-SOFR + 2.02% on 8/21/2028)2 | 175 | 179 | ||
Intercontinental Exchange, Inc. 5.25% 6/15/2031 | 192 | 193 | ||
Iron Mountain Information Management Services, Inc. 5.00% 7/15/20321 | 2,216 | 2,026 | ||
JPMorgan Chase & Co. 5.571% 4/22/2028 (USD-SOFR + 0.93% on 4/22/2027)2 | 150 | 151 | ||
JPMorgan Chase & Co. 5.581% 4/22/2030 (USD-SOFR + 1.16% on 4/22/2029)2 | 850 | 864 | ||
JPMorgan Chase & Co. 5.35% 6/1/2034 (USD-SOFR + 1.845% on 6/1/2033)2 | 175 | 174 | ||
JPMorgan Chase & Co. 5.336% 1/23/2035 (USD-SOFR + 1.62% on 1/23/2034)2 | 565 | 562 | ||
JPMorgan Chase & Co. 5.766% 4/22/2035 (USD-SOFR + 1.49% on 4/22/2034)2 | 2,600 | 2,669 | ||
Kasikornbank PCL (Hong Kong Branch) 3.343% 10/2/2031 (5-year UST Yield Curve Rate T Note Constant Maturity + 1.70% on 10/2/2026)2 | 1,260 | 1,176 | ||
Ladder Capital Finance Holdings LLLP 7.00% 7/15/20311 | 330 | 333 | ||
LPL Holdings, Inc. 4.00% 3/15/20291 | 385 | 359 | ||
Mastercard, Inc. 4.875% 5/9/2034 | 456 | 451 | ||
Morgan Stanley 5.656% 4/18/2030 (USD-SOFR + 1.26% on 4/18/2029)2 | 450 | 458 | ||
Morgan Stanley 1.794% 2/13/2032 (USD-SOFR + 1.034% on 2/13/2031)2 | 625 | 502 | ||
Morgan Stanley 5.424% 7/21/2034 (USD-SOFR + 1.88% on 7/21/2033)2 | 1,954 | 1,945 | ||
Morgan Stanley 6.627% 11/1/2034 (USD-SOFR + 2.05% on 11/1/2033)2 | 1,300 | 1,405 | ||
Morgan Stanley 5.831% 4/19/2035 (USD-SOFR + 1.58% on 4/19/2034)2 | 2,905 | 2,979 | ||
Morgan Stanley 5.942% 2/7/2039 (5-year UST Yield Curve Rate T Note Constant Maturity + 1.80% on 2/7/2039)2 | 200 | 198 | ||
Nasdaq, Inc. 5.55% 2/15/2034 | 400 | 401 | ||
Navient Corp. 4.875% 3/15/2028 | 770 | 707 | ||
Navient Corp. 9.375% 7/25/2030 | 1,150 | 1,210 | ||
Navient Corp. 11.50% 3/15/2031 | 855 | 943 | ||
Navient Corp. 5.625% 8/1/2033 | 3,070 | 2,453 | ||
New York Life Global Funding 4.55% 1/28/20331 | 46 | 44 | ||
Onemain Finance Corp. 7.50% 5/15/2031 | 3,360 | 3,403 | ||
Osaic Holdings, Inc. 10.75% 8/1/20271 | 500 | 515 | ||
Oxford Finance, LLC 6.375% 2/1/20271 | 135 | 130 | ||
Piraeus Bank SA 5.00% 4/16/2030 (1-year EUR-ICE Swap EURIBOR + 2.245% on 4/16/2029)2 | EUR750 | 801 | ||
PNC Financial Services Group, Inc. 6.875% 10/20/2034 (USD-SOFR + 2.284% on 10/20/2033)2 | USD2,554 | 2,785 | ||
PNC Financial Services Group, Inc. 5.676% 1/22/2035 (USD-SOFR + 1.902% on 1/22/2034)2 | 1,198 | 1,205 | ||
Power Finance Corp., Ltd. 3.35% 5/16/2031 | 450 | 394 | ||
Ryan Specialty Group, LLC 4.375% 2/1/20301 | 445 | 413 | ||
State Street Corp. 5.159% 5/18/2034 (USD-SOFR + 1.89% on 5/18/2033)2 | 866 | 856 | ||
Synchrony Financial 2.875% 10/28/2031 | 1,435 | 1,151 | ||
Synchrony Financial 7.25% 2/2/2033 | 1,585 | 1,577 | ||
Truist Financial Corp. 5.867% 6/8/2034 (USD-SOFR + 2.361% on 6/8/2033)2 | 1,424 | 1,436 | ||
Truist Financial Corp. 5.711% 1/24/2035 (USD-SOFR + 1.922% on 1/24/2034)2 | 1,936 | 1,928 | ||
Truist Insurance Holdings, LLC, Term Loan, (1-month USD CME Term SOFR + 4.75%) % 3/8/20323,4 | 1,540 | 1,574 | ||
U.S. Bancorp 5.836% 6/12/2034 (USD-SOFR + 2.26% on 6/10/2033)2 | 25 | 25 | ||
U.S. Bancorp 5.678% 1/23/2035 (USD-SOFR + 1.86% on 1/23/2034)2 | 1,725 | 1,732 | ||
UBS Group AG 4.194% 4/1/2031 (USD-SOFR + 3.73% on 4/1/2030)1,2 | 1,224 | 1,143 | ||
UBS Group AG 6.301% 9/22/2034 (1-year UST Yield Curve Rate T Note Constant Maturity + 2.00% on 9/22/2033)1,2 | 900 | 936 | ||
UBS Group AG 5.699% 2/8/2035 (1-year UST Yield Curve Rate T Note Constant Maturity + 1.77% on 2/8/2034)1,2 | 1,675 | 1,674 | ||
USI, Inc. 7.50% 1/15/20321 | 270 | 275 | ||
95 | Capital Group Fixed Income ETF Trust |
Capital Group U.S. Multi-Sector Income ETF (continued)
Bonds, notes & other debt instruments (continued) | Principal amount (000) | Value (000) | ||
Corporate bonds, notes & loans (continued) | ||||
Financials (continued) | ||||
Wells Fargo & Co. 5.707% 4/22/2028 (USD-SOFR + 1.07% on 4/22/2027)2 | USD250 | $252 | ||
Wells Fargo & Co. 2.39% 6/2/2028 (USD-SOFR + 2.10% on 6/2/2027)2 | 25 | 23 | ||
Wells Fargo & Co. 5.389% 4/24/2034 (USD-SOFR + 2.02% on 4/24/2033)2 | 1,175 | 1,162 | ||
Wells Fargo & Co. 5.557% 7/25/2034 (USD-SOFR + 1.99% on 7/25/2033)2 | 1,050 | 1,050 | ||
Wells Fargo & Co. 6.491% 10/23/2034 (USD-SOFR + 2.06% on 10/23/2033)2 | 2,191 | 2,337 | ||
Wells Fargo & Co. 5.499% 1/23/2035 (USD-SOFR + 1.78% on 1/23/2034)2 | 1,505 | 1,500 | ||
XP Inc. 6.75% 7/2/20291 | 200 | 199 | ||
124,792 | ||||
Energy 11.71% | ||||
3R Lux SARL 9.75% 2/5/20311 | 648 | 681 | ||
Apache Corp. 5.10% 9/1/2040 | 75 | 64 | ||
Apache Corp. 5.25% 2/1/2042 | 1,950 | 1,686 | ||
Ascent Resources Utica Holdings, LLC 5.875% 6/30/20291 | 700 | 685 | ||
Baytex Energy Corp. 8.50% 4/30/20301 | 930 | 973 | ||
Baytex Energy Corp. 7.375% 3/15/20321 | 1,060 | 1,078 | ||
Blue Racer Midstream, LLC 7.00% 7/15/20291 | 605 | 617 | ||
Blue Racer Midstream, LLC 7.25% 7/15/20321 | 730 | 751 | ||
Borr IHC, Ltd. 10.00% 11/15/20281 | 1,598 | 1,675 | ||
Borr IHC, Ltd. 10.375% 11/15/20301 | 731 | 766 | ||
BP Capital Markets America, Inc. 4.893% 9/11/2033 | 1,375 | 1,338 | ||
California Resources Corp. 7.125% 2/1/20261 | 240 | 241 | ||
Cheniere Energy Partners, LP 3.25% 1/31/2032 | 795 | 679 | ||
Cheniere Energy Partners, LP 5.95% 6/30/2033 | 1,095 | 1,111 | ||
Chesapeake Energy Corp. 5.875% 2/1/20291 | 555 | 550 | ||
CITGO Petroleum Corp. 8.375% 1/15/20291 | 555 | 573 | ||
Civitas Resources, Inc. 5.00% 10/15/20261 | 355 | 346 | ||
Civitas Resources, Inc. 8.375% 7/1/20281 | 873 | 916 | ||
Civitas Resources, Inc. 8.625% 11/1/20301 | 1,035 | 1,111 | ||
Civitas Resources, Inc. 8.75% 7/1/20311 | 2,125 | 2,278 | ||
CNX Resources Corp. 7.375% 1/15/20311 | 1,764 | 1,806 | ||
CNX Resources Corp. 7.25% 3/1/20321 | 740 | 755 | ||
Comstock Resources, Inc. 6.75% 3/1/20291 | 840 | 815 | ||
Comstock Resources, Inc. 5.875% 1/15/20301 | 2,170 | 2,021 | ||
Crescent Energy Finance, LLC 9.25% 2/15/20281 | 1,676 | 1,772 | ||
Crescent Energy Finance, LLC 7.625% 4/1/20321 | 1,580 | 1,611 | ||
Crescent Energy Finance, LLC 7.375% 1/15/20331 | 580 | 582 | ||
Diamondback Energy, Inc. 5.15% 1/30/2030 | 313 | 312 | ||
Diamondback Energy, Inc. 5.40% 4/18/2034 | 1,456 | 1,442 | ||
Diamondback Energy, Inc. 5.75% 4/18/2054 | 966 | 937 | ||
Diamondback Energy, Inc. 5.90% 4/18/2064 | 811 | 783 | ||
DT Midstream, Inc. 4.375% 6/15/20311 | 550 | 501 | ||
Ecopetrol SA 8.875% 1/13/2033 | 1,335 | 1,380 | ||
Ecopetrol SA 8.375% 1/19/2036 | 2,015 | 1,980 | ||
Enbridge, Inc. 6.70% 11/15/2053 | 297 | 325 | ||
Encino Acquisition Partners Holdings, LLC 8.75% 5/1/20311 | 1,500 | 1,565 | ||
Energy Transfer, LP 5.60% 9/1/2034 | 783 | 778 | ||
Energy Transfer, LP 5.95% 5/15/2054 | 500 | 487 | ||
Energy Transfer, LP 6.05% 9/1/2054 | 264 | 261 | ||
Eni SpA 5.50% 5/15/20341 | 1,894 | 1,877 | ||
Eni SpA 5.95% 5/15/20541 | 2,179 | 2,142 | ||
EQM Midstream Partners, LP 6.375% 4/1/20291 | 100 | 101 | ||
EQM Midstream Partners, LP 4.75% 1/15/20311 | 2,445 | 2,288 | ||
Exxon Mobil Corp. 3.452% 4/15/2051 | 1,300 | 939 | ||
Genesis Energy, LP 8.00% 1/15/2027 | 270 | 276 | ||
Genesis Energy, LP 8.25% 1/15/2029 | 845 | 873 | ||
Genesis Energy, LP 8.875% 4/15/2030 | 1,270 | 1,337 | ||
Genesis Energy, LP 7.875% 5/15/2032 | 840 | 849 | ||
GeoPark, Ltd. 5.50% 1/17/2027 | 289 | 263 | ||
Global Partners, LP 8.25% 1/15/20321 | 765 | 787 | ||
Harvest Midstream I, LP 7.50% 9/1/20281 | 625 | 636 | ||
Harvest Midstream I, LP 7.50% 5/15/20321 | 534 | 543 | ||
Capital Group Fixed Income ETF Trust | 96 |
Capital Group U.S. Multi-Sector Income ETF (continued)
Bonds, notes & other debt instruments (continued) | Principal amount (000) | Value (000) | ||
Corporate bonds, notes & loans (continued) | ||||
Energy (continued) | ||||
Hilcorp Energy I, LP 6.00% 4/15/20301 | USD300 | $290 | ||
Hilcorp Energy I, LP 6.25% 4/15/20321 | 1,680 | 1,617 | ||
Hilcorp Energy I, LP 8.375% 11/1/20331 | 1,750 | 1,866 | ||
Kinder Morgan, Inc. 4.80% 2/1/2033 | 1,135 | 1,076 | ||
Kinder Morgan, Inc. 5.20% 6/1/2033 | 148 | 144 | ||
Kinder Morgan, Inc. 5.40% 2/1/2034 | 690 | 680 | ||
Kinder Morgan, Inc. 5.45% 8/1/2052 | 845 | 778 | ||
Kinetik Holdings, LP 6.625% 12/15/20281 | 370 | 376 | ||
Leviathan Bond, Ltd. 6.75% 6/30/20301 | 780 | 698 | ||
MEG Energy Corp. 5.875% 2/1/20291 | 105 | 102 | ||
MPLX, LP 4.95% 9/1/2032 | 446 | 427 | ||
MPLX, LP 5.00% 3/1/2033 | 375 | 358 | ||
MPLX, LP 4.95% 3/14/2052 | 1,340 | 1,137 | ||
Nabors Industries, Inc. 7.375% 5/15/20271 | 1,100 | 1,120 | ||
Nabors Industries, Inc. 9.125% 1/31/20301 | 1,085 | 1,125 | ||
New Fortress Energy, Inc. 6.50% 9/30/20261 | 4,215 | 3,881 | ||
New Fortress Energy, Inc. 8.75% 3/15/20291 | 1,260 | 1,151 | ||
NGL Energy Operating, LLC 8.125% 2/15/20291 | 995 | 1,015 | ||
NGL Energy Operating, LLC 8.375% 2/15/20321 | 1,870 | 1,900 | ||
Noble Finance II, LLC 8.00% 4/15/20301 | 325 | 338 | ||
Northern Oil and Gas, Inc. 8.125% 3/1/20281 | 1,197 | 1,211 | ||
Northern Oil and Gas, Inc. 8.75% 6/15/20311 | 1,041 | 1,094 | ||
ONEOK, Inc. 6.05% 9/1/2033 | 180 | 185 | ||
Permian Resources Operating, LLC 8.00% 4/15/20271 | 52 | 53 | ||
Permian Resources Operating, LLC 5.875% 7/1/20291 | 680 | 670 | ||
Permian Resources Operating, LLC 9.875% 7/15/20311 | 1,105 | 1,224 | ||
Permian Resources Operating, LLC 7.00% 1/15/20321 | 850 | 874 | ||
Petroleos Mexicanos 4.50% 1/23/2026 | 166 | 158 | ||
Petroleos Mexicanos 6.875% 8/4/2026 | 884 | 866 | ||
Petroleos Mexicanos 6.49% 1/23/2027 | 1,098 | 1,055 | ||
Petroleos Mexicanos 6.50% 3/13/2027 | 300 | 286 | ||
Petroleos Mexicanos 5.95% 1/28/2031 | 950 | 766 | ||
Petroleos Mexicanos 6.70% 2/16/2032 | 1,264 | 1,059 | ||
Petroleos Mexicanos 10.00% 2/7/2033 | 950 | 954 | ||
Petroleos Mexicanos 6.95% 1/28/2060 | 700 | 464 | ||
Raizen Fuels Finance SA 6.45% 3/5/20341 | 200 | 203 | ||
Range Resources Corp. 4.75% 2/15/20301 | 500 | 469 | ||
Saturn Oil & Gas, Inc. 9.625% 6/15/20291 | 735 | 742 | ||
Shell International Finance BV 3.00% 11/26/2051 | 600 | 393 | ||
Southwestern Energy Co. 4.75% 2/1/2032 | 285 | 262 | ||
Sunoco, LP 7.00% 5/1/20291 | 680 | 697 | ||
Sunoco, LP 4.50% 5/15/2029 | 570 | 534 | ||
Sunoco, LP 7.25% 5/1/20321 | 1,010 | 1,045 | ||
Superior Plus, LP 4.50% 3/15/20291 | 50 | 46 | ||
Talos Production, Inc. 9.00% 2/1/20291 | 475 | 499 | ||
Talos Production, Inc. 9.375% 2/1/20311 | 820 | 866 | ||
TotalEnergies Capital International SA 3.127% 5/29/2050 | 1,660 | 1,120 | ||
Transocean Aquila, Ltd. 8.00% 9/30/20281 | 448 | 456 | ||
Transocean Poseidon, Ltd. 6.875% 2/1/20271 | 165 | 165 | ||
Transocean Titan Financing, Ltd. 8.375% 2/1/20281 | 617 | 637 | ||
Transocean, Inc. 8.00% 2/1/20271 | 361 | 360 | ||
Transocean, Inc. 8.25% 5/15/20291 | 750 | 752 | ||
Transocean, Inc. 8.75% 2/15/20301 | 1,298 | 1,364 | ||
Transocean, Inc. 8.50% 5/15/20311 | 800 | 801 | ||
Transocean, Inc. 6.80% 3/15/2038 | 1,250 | 1,038 | ||
USA Compression Partners, LP 7.125% 3/15/20291 | 605 | 610 | ||
Vallourec SA 7.50% 4/15/20321 | 1,760 | 1,825 | ||
Venture Global Calcasieu Pass, LLC 3.875% 8/15/20291 | 755 | 688 | ||
Venture Global Calcasieu Pass, LLC 6.25% 1/15/20301 | 1,824 | 1,852 | ||
Venture Global Calcasieu Pass, LLC 4.125% 8/15/20311 | 1,367 | 1,228 | ||
Venture Global LNG, Inc. 8.125% 6/1/20281 | 1,150 | 1,186 | ||
Venture Global LNG, Inc. 8.375% 6/1/20311 | 260 | 270 | ||
97 | Capital Group Fixed Income ETF Trust |
Capital Group U.S. Multi-Sector Income ETF (continued)
Bonds, notes & other debt instruments (continued) | Principal amount (000) | Value (000) | ||
Corporate bonds, notes & loans (continued) | ||||
Energy (continued) | ||||
Vital Energy, Inc. 7.875% 4/15/20321 | USD1,320 | $1,343 | ||
Williams Companies, Inc. 4.65% 8/15/2032 | 369 | 351 | ||
Williams Companies, Inc. 5.15% 3/15/2034 | 1,030 | 1,005 | ||
104,948 | ||||
Health care 9.31% | ||||
AbbVie, Inc. 4.80% 3/15/2029 | 750 | 747 | ||
AbbVie, Inc. 4.95% 3/15/2031 | 700 | 698 | ||
AbbVie, Inc. 5.05% 3/15/2034 | 3,500 | 3,491 | ||
AbbVie, Inc. 5.35% 3/15/2044 | 50 | 49 | ||
AbbVie, Inc. 5.40% 3/15/2054 | 2,176 | 2,153 | ||
AbbVie, Inc. 5.50% 3/15/2064 | 855 | 845 | ||
AdaptHealth, LLC 6.125% 8/1/20281 | 65 | 62 | ||
AdaptHealth, LLC 4.625% 8/1/20291 | 1,156 | 1,003 | ||
AdaptHealth, LLC 5.125% 3/1/20301 | 1,919 | 1,680 | ||
Amgen, Inc. 5.25% 3/2/2030 | 461 | 464 | ||
Amgen, Inc. 4.20% 3/1/2033 | 2,120 | 1,965 | ||
Amgen, Inc. 5.25% 3/2/2033 | 1,673 | 1,669 | ||
Amgen, Inc. 3.00% 1/15/2052 | 2,250 | 1,475 | ||
Amgen, Inc. 5.65% 3/2/2053 | 1,982 | 1,953 | ||
Amgen, Inc. 5.75% 3/2/2063 | 550 | 539 | ||
AstraZeneca Finance, LLC 4.85% 2/26/2029 | 750 | 749 | ||
AstraZeneca Finance, LLC 4.90% 2/26/2031 | 400 | 399 | ||
AstraZeneca Finance, LLC 5.00% 2/26/2034 | 475 | 473 | ||
Avantor Funding, Inc. 3.875% 11/1/20291 | 341 | 310 | ||
Bausch Health Americas, Inc. 8.50% 1/31/20271 | 115 | 80 | ||
Bausch Health Companies, Inc. 5.50% 11/1/20251 | 425 | 396 | ||
Bausch Health Companies, Inc. 9.00% 12/15/20251 | 250 | 227 | ||
Bausch Health Companies, Inc. 5.00% 2/15/20291 | 125 | 61 | ||
Bausch Health Companies, Inc. 5.25% 2/15/20311 | 235 | 110 | ||
Baxter International, Inc. 2.272% 12/1/2028 | 582 | 513 | ||
Baxter International, Inc. 2.539% 2/1/2032 | 1,592 | 1,306 | ||
Baxter International, Inc. 3.132% 12/1/2051 | 1,475 | 925 | ||
Bayer US Finance, LLC 6.50% 11/21/20331 | 1,254 | 1,283 | ||
Bayer US Finance, LLC 6.875% 11/21/20531 | 200 | 206 | ||
Becton, Dickinson and Co. 5.081% 6/7/2029 | 631 | 631 | ||
Becton, Dickinson and Co. 5.11% 2/8/2034 | 700 | 690 | ||
Bristol-Myers Squibb Co. 4.90% 2/22/2029 | 200 | 200 | ||
Bristol-Myers Squibb Co. 5.10% 2/22/2031 | 675 | 678 | ||
Bristol-Myers Squibb Co. 5.20% 2/22/2034 | 2,905 | 2,900 | ||
Bristol-Myers Squibb Co. 5.50% 2/22/2044 | 125 | 124 | ||
Bristol-Myers Squibb Co. 6.25% 11/15/2053 | 920 | 989 | ||
Bristol-Myers Squibb Co. 5.55% 2/22/2054 | 2,230 | 2,200 | ||
Bristol-Myers Squibb Co. 6.40% 11/15/2063 | 175 | 190 | ||
Bristol-Myers Squibb Co. 5.65% 2/22/2064 | 175 | 171 | ||
Catalent Pharma Solutions, Inc., Term Loan B4, (3-month USD CME Term SOFR + 3.00%) 8.344% 2/22/20283,4 | 216 | 217 | ||
Centene Corp. 2.45% 7/15/2028 | 365 | 324 | ||
Centene Corp. 2.50% 3/1/2031 | 3,390 | 2,785 | ||
Charles River Laboratories International, Inc. 3.75% 3/15/20291 | 895 | 818 | ||
CHS / Community Health Systems, Inc. 5.625% 3/15/20271 | 750 | 699 | ||
Cigna Group (The) 5.25% 2/15/2034 | 525 | 518 | ||
Concentra Escrow Issuer Corp. 6.875% 7/15/20321 | 200 | 203 | ||
CVS Health Corp. 5.70% 6/1/2034 | 1,830 | 1,826 | ||
CVS Health Corp. 6.00% 6/1/2044 | 750 | 735 | ||
CVS Health Corp. 5.875% 6/1/2053 | 1,134 | 1,087 | ||
CVS Health Corp. 6.05% 6/1/2054 | 875 | 859 | ||
CVS Health Corp. 6.00% 6/1/2063 | 738 | 707 | ||
Elevance Health, Inc. 5.375% 6/15/2034 | 850 | 854 | ||
Endo Finance Holdings, Inc. 8.50% 4/15/20311 | 1,585 | 1,638 | ||
Endo International PLC, Term Loan B, (3-month USD CME Term SOFR + 4.50%) 9.826% 4/23/20313,4 | 925 | 924 | ||
Capital Group Fixed Income ETF Trust | 98 |
Capital Group U.S. Multi-Sector Income ETF (continued)
Bonds, notes & other debt instruments (continued) | Principal amount (000) | Value (000) | ||
Corporate bonds, notes & loans (continued) | ||||
Health care (continued) | ||||
Fortrea Holdings, Inc. 7.50% 7/1/20301 | USD90 | $90 | ||
Fortrea Holdings, Inc., Term Loan B, (3-month USD CME Term SOFR + 3.75%) 9.094% 7/1/20303,4 | 25 | 25 | ||
Gilead Sciences, Inc. 5.25% 10/15/2033 | 1,094 | 1,102 | ||
Gilead Sciences, Inc. 5.55% 10/15/2053 | 458 | 458 | ||
Grifols, SA 7.50% 5/1/20305 | EUR1,700 | 1,821 | ||
HCA, Inc. 5.45% 4/1/2031 | USD250 | 250 | ||
HCA, Inc. 2.375% 7/15/2031 | 795 | 653 | ||
Humana, Inc. 5.75% 4/15/2054 | 967 | 933 | ||
Johnson & Johnson 4.90% 6/1/2031 | 1,100 | 1,111 | ||
Johnson & Johnson 4.95% 6/1/2034 | 750 | 759 | ||
Johnson & Johnson 5.25% 6/1/2054 | 450 | 452 | ||
Medline Borrower, LP 6.25% 4/1/20291 | 716 | 725 | ||
Medline Borrower, LP 5.25% 10/1/20291 | 1,200 | 1,146 | ||
Molina Healthcare, Inc. 3.875% 11/15/20301 | 975 | 867 | ||
Molina Healthcare, Inc. 3.875% 5/15/20321 | 2,022 | 1,754 | ||
Owens & Minor, Inc. 4.50% 3/31/20291 | 100 | 86 | ||
Owens & Minor, Inc. 6.25% 4/1/20301 | 585 | 532 | ||
Pfizer Investment Enterprises Pte., Ltd. 4.75% 5/19/2033 | 1,915 | 1,867 | ||
Pfizer Investment Enterprises Pte., Ltd. 5.11% 5/19/2043 | 100 | 95 | ||
Pfizer Investment Enterprises Pte., Ltd. 5.30% 5/19/2053 | 2,423 | 2,339 | ||
Radiology Partners, Inc. 7.775% 1/31/20291 | 888 | 833 | ||
Radiology Partners, Inc. 9.781% 2/15/20301 | 820 | 657 | ||
Radiology Partners, Inc., Term Loan B, (3-month USD CME Term SOFR + 5.00%) 10.588% 1/31/20293,4 | 89 | 85 | ||
Roche Holdings, Inc. 5.593% 11/13/20331 | 530 | 550 | ||
Roche Holdings, Inc. 4.985% 3/8/20341 | 2,655 | 2,634 | ||
Solventum Corp. 5.60% 3/23/20341 | 525 | 516 | ||
Sterigenics-Nordion Holdings, LLC 7.375% 6/1/20311 | 1,165 | 1,168 | ||
Surgery Center Holdings, Inc. 7.25% 4/15/20321 | 515 | 521 | ||
Tenet Healthcare Corp. 6.125% 10/1/2028 | 275 | 274 | ||
Tenet Healthcare Corp. 6.75% 5/15/2031 | 550 | 559 | ||
Teva Pharmaceutical Finance Netherlands III BV 6.75% 3/1/2028 | 2,065 | 2,116 | ||
Teva Pharmaceutical Finance Netherlands III BV 5.125% 5/9/2029 | 2,405 | 2,316 | ||
Teva Pharmaceutical Finance Netherlands III BV 7.875% 9/15/2029 | 1,442 | 1,551 | ||
Teva Pharmaceutical Finance Netherlands III BV 8.125% 9/15/2031 | 1,682 | 1,872 | ||
Teva Pharmaceutical Finance Netherlands III BV 4.10% 10/1/2046 | 846 | 592 | ||
UnitedHealth Group, Inc. 5.00% 4/15/2034 | 1,205 | 1,190 | ||
UnitedHealth Group, Inc. 2.90% 5/15/2050 | 280 | 182 | ||
83,479 | ||||
Consumer discretionary 7.03% | ||||
Advance Auto Parts, Inc. 3.90% 4/15/2030 | 1,936 | 1,751 | ||
Advance Auto Parts, Inc. 3.50% 3/15/2032 | 1,641 | 1,395 | ||
Aimbridge Acquisition Co., Inc., Term Loan B, (3-month USD CME Term SOFR + 3.75%) 9.208% 2/2/20263,4 | 400 | 392 | ||
Allied Universal Holdco, LLC 9.75% 7/15/20271 | 300 | 298 | ||
Allied Universal Holdco, LLC 4.625% 6/1/20281 | 1,595 | 1,457 | ||
Allwyn Entertainment Financing (UK) PLC 7.875% 4/30/20291 | 875 | 905 | ||
Asbury Automotive Group, Inc. 4.625% 11/15/20291 | 1,541 | 1,426 | ||
Atlas LuxCo 4 SARL 4.625% 6/1/20281 | 1,325 | 1,209 | ||
Bath & Body Works, Inc. 6.875% 11/1/2035 | 2,140 | 2,160 | ||
Bath & Body Works, Inc. 6.75% 7/1/2036 | 750 | 747 | ||
Boyd Gaming Corp. 4.75% 12/1/2027 | 1,020 | 984 | ||
Boyne USA, Inc. 4.75% 5/15/20291 | 630 | 588 | ||
Caesars Entertainment, Inc. 4.625% 10/15/20291 | 2,130 | 1,954 | ||
Caesars Entertainment, Inc. 7.00% 2/15/20301 | 105 | 107 | ||
Caesars Entertainment, Inc. 6.50% 2/15/20321 | 1,490 | 1,498 | ||
Carnival Corp. 5.75% 3/1/20271 | 1,275 | 1,260 | ||
Carnival Corp. 6.00% 5/1/20291 | 2,188 | 2,163 | ||
Carnival Corp. 7.00% 8/15/20291 | 375 | 389 | ||
Carnival Corp. 10.50% 6/1/20301 | 587 | 638 | ||
99 | Capital Group Fixed Income ETF Trust |
Capital Group U.S. Multi-Sector Income ETF (continued)
Bonds, notes & other debt instruments (continued) | Principal amount (000) | Value (000) | ||
Corporate bonds, notes & loans (continued) | ||||
Consumer discretionary (continued) | ||||
Clarios Global, LP 8.50% 5/15/20271 | USD351 | $354 | ||
Cougar JV Subsidiary, LLC 8.00% 5/15/20321 | 1,400 | 1,449 | ||
Daimler Trucks Finance North America, LLC 5.375% 6/25/20341 | 867 | 857 | ||
Fertitta Entertainment, LLC 4.625% 1/15/20291 | 1,225 | 1,116 | ||
First Student Bidco, Inc. 4.00% 7/31/20291 | 1,565 | 1,412 | ||
Ford Motor Co. 7.45% 7/16/2031 | 250 | 269 | ||
Ford Motor Co. 6.10% 8/19/2032 | 2,080 | 2,078 | ||
Ford Motor Co. 5.291% 12/8/2046 | 261 | 229 | ||
Ford Motor Credit Co., LLC 2.70% 8/10/2026 | 100 | 94 | ||
Ford Motor Credit Co., LLC 5.85% 5/17/2027 | 699 | 699 | ||
Ford Motor Credit Co., LLC 4.95% 5/28/2027 | 350 | 342 | ||
Ford Motor Credit Co., LLC 3.815% 11/2/2027 | 607 | 570 | ||
Ford Motor Credit Co., LLC 6.798% 11/7/2028 | 500 | 517 | ||
Ford Motor Credit Co., LLC 7.20% 6/10/2030 | 400 | 421 | ||
Ford Motor Credit Co., LLC 7.122% 11/7/2033 | 650 | 687 | ||
Ford Motor Credit Co., LLC 6.125% 3/8/2034 | 550 | 544 | ||
Ford Otomotiv Sanayi AS 7.125% 4/25/20291 | 785 | 793 | ||
Hanesbrands, Inc. 9.00% 2/15/20311 | 2,349 | 2,463 | ||
Hanesbrands, Inc., Term Loan B, (3-month USD CME Term SOFR + 3.75%) 9.094% 3/8/20303,4 | 78 | 78 | ||
Harley-Davidson Financial Services, Inc. 5.95% 6/11/20291 | 1,704 | 1,701 | ||
Home Depot, Inc. 4.75% 6/25/2029 | 790 | 786 | ||
Home Depot, Inc. 4.85% 6/25/2031 | 591 | 587 | ||
Home Depot, Inc. 4.95% 6/25/2034 | 785 | 777 | ||
Home Depot, Inc. 5.30% 6/25/2054 | 221 | 216 | ||
Home Depot, Inc. 5.40% 6/25/2064 | 630 | 614 | ||
Hyundai Capital America 5.30% 6/24/20291 | 462 | 460 | ||
International Game Technology PLC 5.25% 1/15/20291 | 200 | 194 | ||
LCM Investments Holdings II, LLC 4.875% 5/1/20291 | 1,075 | 1,006 | ||
LCM Investments Holdings II, LLC 8.25% 8/1/20311 | 535 | 559 | ||
Levi Strauss & Co. 3.50% 3/1/20311 | 725 | 628 | ||
Light and Wonder International, Inc. 7.50% 9/1/20311 | 1,550 | 1,603 | ||
Lithia Motors, Inc. 3.875% 6/1/20291 | 1,575 | 1,416 | ||
McDonald’s Corp. 5.00% 5/17/2029 | 328 | 328 | ||
McDonald’s Corp. 5.20% 5/17/2034 | 392 | 394 | ||
McDonald’s Corp. 5.15% 9/9/2052 | 675 | 623 | ||
Party City Holdings, Inc. 12.00% 12/31/20281 | 70 | 67 | ||
RHP Hotel Properties, LP 7.25% 7/15/20281 | 79 | 82 | ||
RHP Hotel Properties, LP 4.50% 2/15/20291 | 681 | 639 | ||
Royal Caribbean Cruises, Ltd. 4.25% 7/1/20261 | 565 | 547 | ||
Royal Caribbean Cruises, Ltd. 3.70% 3/15/2028 | 856 | 801 | ||
Royal Caribbean Cruises, Ltd. 5.50% 4/1/20281 | 665 | 657 | ||
Royal Caribbean Cruises, Ltd. 8.25% 1/15/20291 | 900 | 951 | ||
Royal Caribbean Cruises, Ltd. 7.25% 1/15/20301 | 76 | 79 | ||
Sally Holdings, LLC 6.75% 3/1/2032 | 1,518 | 1,501 | ||
Scientific Games Holdings, LP 6.625% 3/1/20301 | 113 | 110 | ||
Sonic Automotive, Inc. 4.625% 11/15/20291 | 1,114 | 1,007 | ||
Sonic Automotive, Inc. 4.875% 11/15/20311 | 2,806 | 2,473 | ||
Station Casinos, LLC 6.625% 3/15/20321 | 590 | 588 | ||
Tapestry, Inc. 7.85% 11/27/2033 | 851 | 897 | ||
Vail Resorts, Inc. 6.50% 5/15/20321 | 401 | 406 | ||
Valvoline, Inc. 3.625% 6/15/20311 | 1,185 | 1,022 | ||
Wand NewCo 3, Inc., Term Loan B, (3-month USD CME Term SOFR + 3.75%) 9.094% 1/30/20313,4 | 315 | 317 | ||
WASH Multifamily Acquisition, Inc. 5.75% 4/15/20261 | 1,115 | 1,091 | ||
Wyndham Hotels & Resorts, Inc. 4.375% 8/15/20281 | 763 | 712 | ||
Wynn Resorts Finance, LLC 7.125% 2/15/20311 | 808 | 838 | ||
62,970 | ||||
Capital Group Fixed Income ETF Trust | 100 |
Capital Group U.S. Multi-Sector Income ETF (continued)
Bonds, notes & other debt instruments (continued) | Principal amount (000) | Value (000) | ||
Corporate bonds, notes & loans (continued) | ||||
Industrials 5.32% | ||||
AAR Escrow Issuer, LLC 6.75% 3/15/20291 | USD199 | $203 | ||
Ambipar Lux SARL 9.875% 2/6/20311 | 856 | 831 | ||
American Airlines, Inc. 8.50% 5/15/20291 | 1,050 | 1,092 | ||
Avis Budget Car Rental, LLC 4.75% 4/1/20281 | 300 | 276 | ||
Avis Budget Car Rental, LLC 8.00% 2/15/20311 | 185 | 183 | ||
BAE Systems PLC 5.30% 3/26/20341 | 1,087 | 1,077 | ||
Boeing Co. 5.15% 5/1/2030 | 1,202 | 1,155 | ||
Boeing Co. 3.625% 2/1/2031 | 698 | 611 | ||
Boeing Co. 6.388% 5/1/20311 | 437 | 445 | ||
Boeing Co. 3.60% 5/1/2034 | 600 | 483 | ||
Boeing Co. 6.528% 5/1/20341 | 1,449 | 1,484 | ||
Boeing Co. 5.705% 5/1/2040 | 480 | 443 | ||
Boeing Co. 5.805% 5/1/2050 | 85 | 77 | ||
Boeing Co. 6.858% 5/1/20541 | 1,045 | 1,073 | ||
Boeing Co. 5.93% 5/1/2060 | 1,155 | 1,033 | ||
Bombardier, Inc. 7.875% 4/15/20271 | 277 | 278 | ||
Bombardier, Inc. 8.75% 11/15/20301 | 924 | 1,000 | ||
Bombardier, Inc. 7.45% 5/1/20341 | 275 | 310 | ||
Burlington Northern Santa Fe, LLC 5.20% 4/15/2054 | 1,535 | 1,472 | ||
Burlington Northern Santa Fe, LLC 5.50% 3/15/2055 | 549 | 550 | ||
Canadian National Railway Co. 6.125% 11/1/2053 | 276 | 305 | ||
Canadian Pacific Railway Co. 3.10% 12/2/2051 | 150 | 100 | ||
Carrier Global Corp. 6.20% 3/15/2054 | 327 | 350 | ||
Clarivate Science Holdings Corp. 3.875% 7/1/20281 | 340 | 316 | ||
Clean Harbors, Inc. 6.375% 2/1/20311 | 45 | 45 | ||
CoreLogic, Inc. 4.50% 5/1/20281 | 620 | 563 | ||
CSX Corp. 2.50% 5/15/2051 | 220 | 130 | ||
Dun & Bradstreet Corp. (The) 5.00% 12/15/20291 | 1,009 | 938 | ||
Enviri Corp. 5.75% 7/31/20271 | 155 | 148 | ||
EquipmentShare.com, Inc. 9.00% 5/15/20281 | 110 | 114 | ||
EquipmentShare.com, Inc. 8.625% 5/15/20321 | 650 | 675 | ||
Herc Holdings, Inc. 6.625% 6/15/20291 | 720 | 731 | ||
Hertz Corp. (The) 4.625% 12/1/20261 | 300 | 218 | ||
Hertz Corp. (The) 12.625% 7/15/20291 | 290 | 300 | ||
Hertz Corp. (The), Term Loan B-EXIT, (3-month USD CME Term SOFR + 3.25%) 8.859% 6/30/20283,4 | 418 | 378 | ||
Hertz Corp. (The), Term Loan C-EXIT, (3-month USD CME Term SOFR + 3.25%) 8.859% 6/30/20283,4 | 81 | 73 | ||
Honeywell International, Inc. 5.00% 3/1/2035 | 1,225 | 1,215 | ||
Icahn Enterprises, LP 6.25% 5/15/2026 | 1,024 | 1,017 | ||
Icahn Enterprises, LP 5.25% 5/15/2027 | 2,375 | 2,231 | ||
Icahn Enterprises, LP 9.75% 1/15/20291 | 700 | 726 | ||
Ingersoll-Rand, Inc. 5.314% 6/15/2031 | 627 | 631 | ||
Ingersoll-Rand, Inc. 5.45% 6/15/2034 | 573 | 578 | ||
IRB Infrastructure Developers, Ltd. 7.11% 3/11/20321 | 435 | 435 | ||
Lima Metro Line 2 Finance, Ltd. 5.875% 7/5/2034 | 348 | 343 | ||
Lockheed Martin Corp. 4.50% 2/15/2029 | 318 | 313 | ||
Lockheed Martin Corp. 4.80% 8/15/2034 | 935 | 913 | ||
Lockheed Martin Corp. 5.20% 2/15/2064 | 144 | 136 | ||
Miter Brands Acquisition Holdco, Inc. 6.75% 4/1/20321 | 308 | 310 | ||
NESCO Holdings II, Inc. 5.50% 4/15/20291 | 335 | 311 | ||
Norfolk Southern Corp. 5.05% 8/1/2030 | 57 | 57 | ||
Norfolk Southern Corp. 4.45% 3/1/2033 | 15 | 14 | ||
Norfolk Southern Corp. 5.35% 8/1/2054 | 2,183 | 2,084 | ||
Northrop Grumman Corp. 4.90% 6/1/2034 | 400 | 389 | ||
PM General Purchaser, LLC 9.50% 10/1/20281 | 505 | 516 | ||
Regal Rexnord Corp. 6.30% 2/15/2030 | 1,093 | 1,118 | ||
Regal Rexnord Corp. 6.40% 4/15/2033 | 2,080 | 2,129 | ||
Republic Services, Inc. 5.20% 11/15/2034 | 1,080 | 1,073 | ||
Reworld Holding Corp. 4.875% 12/1/20291 | 885 | 809 | ||
Ritchie Bros. Holdings, Inc. 7.75% 3/15/20311 | 60 | 63 | ||
RTX Corp. 5.15% 2/27/2033 | 250 | 248 | ||
RTX Corp. 6.10% 3/15/2034 | 469 | 494 | ||
101 | Capital Group Fixed Income ETF Trust |
Capital Group U.S. Multi-Sector Income ETF (continued)
Bonds, notes & other debt instruments (continued) | Principal amount (000) | Value (000) | ||
Corporate bonds, notes & loans (continued) | ||||
Industrials (continued) | ||||
Sensata Technologies BV 4.00% 4/15/20291 | USD1,350 | $1,241 | ||
Sensata Technologies, Inc. 3.75% 2/15/20311 | 150 | 131 | ||
Spirit AeroSystems, Inc. 4.60% 6/15/2028 | 492 | 461 | ||
Spirit AeroSystems, Inc. 9.375% 11/30/20291 | 285 | 307 | ||
Spirit AeroSystems, Inc. 9.75% 11/15/20301 | 660 | 729 | ||
Spirit AeroSystems, Inc., Term Loan, (3-month CME Term SOFR + 4.25%) 9.579% 1/15/20273,4 | 20 | 20 | ||
TransDigm, Inc. 6.75% 8/15/20281 | 807 | 818 | ||
TransDigm, Inc. 4.625% 1/15/2029 | 2,025 | 1,891 | ||
TransDigm, Inc. 6.375% 3/1/20291 | 300 | 302 | ||
TransDigm, Inc. 6.625% 3/1/20321 | 700 | 708 | ||
Triumph Group, Inc. 9.00% 3/15/20281 | 287 | 301 | ||
Uber Technologies, Inc. 8.00% 11/1/20261 | 345 | 348 | ||
Union Pacific Corp. 2.95% 3/10/2052 | 308 | 198 | ||
Union Pacific Corp. 4.95% 5/15/2053 | 610 | 569 | ||
United Rentals (North America), Inc. 5.25% 1/15/2030 | 385 | 373 | ||
United Rentals (North America), Inc. 6.125% 3/15/20341 | 400 | 399 | ||
WESCO Distribution, Inc. 7.25% 6/15/20281 | 435 | 443 | ||
WESCO Distribution, Inc. 6.625% 3/15/20321 | 850 | 860 | ||
47,712 | ||||
Materials 5.19% | ||||
Alliance Resource Operating Partners, LP 8.625% 6/15/20291 | 1,125 | 1,155 | ||
Ardagh Metal Packaging Finance PLC 4.00% 9/1/20291 | 2,450 | 2,076 | ||
ATI, Inc. 4.875% 10/1/2029 | 1,082 | 1,013 | ||
ATI, Inc. 7.25% 8/15/2030 | 349 | 361 | ||
Axalta Coating Systems Dutch Holding B BV 7.25% 2/15/20311 | 500 | 520 | ||
Axalta Coating Systems, LLC 4.75% 6/15/20271 | 625 | 608 | ||
BHP Billiton Finance (USA), Ltd. 4.90% 2/28/2033 | 36 | 35 | ||
BHP Billiton Finance (USA), Ltd. 5.25% 9/8/2033 | 1,116 | 1,117 | ||
BHP Billiton Finance (USA), Ltd. 5.50% 9/8/2053 | 286 | 284 | ||
Braskem Idesa SAPI 6.99% 2/20/2032 | 2,225 | 1,689 | ||
Braskem Netherlands Finance BV 8.75% 1/12/20311 | 705 | 721 | ||
Braskem Netherlands Finance BV 7.25% 2/13/20331 | 1,525 | 1,439 | ||
Celanese US Holdings, LLC 6.35% 11/15/2028 | 131 | 135 | ||
Celanese US Holdings, LLC 6.379% 7/15/2032 | 460 | 473 | ||
Celanese US Holdings, LLC 6.70% 11/15/2033 | 1,355 | 1,425 | ||
Consolidated Energy Finance SA 12.00% 2/15/20311 | 2,550 | 2,633 | ||
CSN Resources SA 8.875% 12/5/20301 | 1,280 | 1,273 | ||
Dow Chemical Co. (The) 5.15% 2/15/2034 | 283 | 277 | ||
Dow Chemical Co. (The) 6.90% 5/15/2053 | 275 | 306 | ||
Dow Chemical Co. (The) 5.60% 2/15/2054 | 786 | 757 | ||
Eastman Chemical Co. 5.625% 2/20/2034 | 474 | 471 | ||
EIDP, Inc. 4.80% 5/15/2033 | 691 | 667 | ||
Element Solutions, Inc. 3.875% 9/1/20281 | 1,110 | 1,021 | ||
First Quantum Minerals, Ltd. 6.875% 10/15/20271 | 2,120 | 2,073 | ||
First Quantum Minerals, Ltd. 9.375% 3/1/20291 | 2,175 | 2,275 | ||
FXI Holdings, Inc. 12.25% 11/15/20261 | 2,352 | 2,336 | ||
International Flavors & Fragrances, Inc. 3.468% 12/1/20501 | 2,185 | 1,436 | ||
LABL, Inc. 9.50% 11/1/20281 | 776 | 783 | ||
LSB Industries, Inc. 6.25% 10/15/20281 | 1,357 | 1,310 | ||
Mineral Resources, Ltd. 8.125% 5/1/20271 | 420 | 424 | ||
Mineral Resources, Ltd. 9.25% 10/1/20281 | 270 | 284 | ||
NOVA Chemicals Corp. 5.25% 6/1/20271 | 685 | 656 | ||
NOVA Chemicals Corp. 4.25% 5/15/20291 | 655 | 578 | ||
NOVA Chemicals Corp. 9.00% 2/15/20301 | 515 | 544 | ||
Novelis Corp. 3.875% 8/15/20311 | 1,905 | 1,651 | ||
OCI NV 6.70% 3/16/20331 | 1,530 | 1,511 | ||
Owens-Brockway Glass Container, Inc. 7.375% 6/1/20321 | 1,185 | 1,188 | ||
Sasol Financing USA, LLC 8.75% 5/3/20291 | 1,000 | 1,018 | ||
Sasol Financing USA, LLC 8.75% 5/3/20296 | 650 | 662 | ||
Sasol Financing USA, LLC 5.50% 3/18/2031 | 1,100 | 928 | ||
Capital Group Fixed Income ETF Trust | 102 |
Capital Group U.S. Multi-Sector Income ETF (continued)
Bonds, notes & other debt instruments (continued) | Principal amount (000) | Value (000) | ||
Corporate bonds, notes & loans (continued) | ||||
Materials (continued) | ||||
SCIH Salt Holdings, Inc. 4.875% 5/1/20281 | USD50 | $47 | ||
SCIH Salt Holdings, Inc. 6.625% 5/1/20291 | 1,275 | 1,201 | ||
Sealed Air Corp. 4.00% 12/1/20271 | 375 | 353 | ||
Sealed Air Corp. 6.125% 2/1/20281 | 1,306 | 1,304 | ||
Stillwater Mining Co. 4.00% 11/16/20266 | 537 | 491 | ||
Stillwater Mining Co. 4.50% 11/16/20296 | 200 | 163 | ||
Summit Materials, LLC 5.25% 1/15/20291 | 439 | 424 | ||
Summit Materials, LLC 7.25% 1/15/20311 | 896 | 929 | ||
Trivium Packaging Finance BV 8.50% 8/15/20271 | 963 | 957 | ||
Vale Overseas Ltd. 6.40% 6/28/2054 | 494 | 489 | ||
Venator Material, LLC, Term Loan, (3-month USD CME Term SOFR + 2.00%) 7.328% 1/16/20263,4 | 7 | 7 | ||
Venator Material, LLC, Term Loan, (USD-SOFR + 10.00%) 8.00% PIK and 2.00% Cash 10/10/20283,4,7 | 14 | 14 | ||
46,492 | ||||
Real estate 4.61% | ||||
Anywhere Real Estate Group, LLC 5.25% 4/15/20301 | 775 | 463 | ||
Boston Properties, LP 2.55% 4/1/2032 | 1,072 | 836 | ||
Boston Properties, LP 2.45% 10/1/2033 | 922 | 684 | ||
Boston Properties, LP 6.50% 1/15/2034 | 1,099 | 1,119 | ||
Brandywine Operating Partnership, LP 8.875% 4/12/2029 | 955 | 996 | ||
Brookfield Property REIT, Inc. 5.75% 5/15/20261 | 575 | 564 | ||
COPT Defense Properties, LP 2.75% 4/15/2031 | 355 | 294 | ||
Crown Castle, Inc. 5.00% 1/11/2028 | 82 | 81 | ||
Crown Castle, Inc. 5.80% 3/1/2034 | 2,202 | 2,225 | ||
Equinix Europe 2 Financing Corp., LLC 5.50% 6/15/2034 | 550 | 549 | ||
Highwoods Realty, LP 7.65% 2/1/2034 | 1,775 | 1,911 | ||
Howard Hughes Corp. (The) 5.375% 8/1/20281 | 5 | 5 | ||
Howard Hughes Corp. (The) 4.125% 2/1/20291 | 1,465 | 1,312 | ||
Howard Hughes Corp. (The) 4.375% 2/1/20311 | 1,041 | 897 | ||
Hudson Pacific Properties, LP 4.65% 4/1/2029 | 445 | 343 | ||
Hudson Pacific Properties, LP 3.25% 1/15/2030 | 2,235 | 1,546 | ||
Kennedy-Wilson, Inc. 4.75% 3/1/2029 | 1,020 | 874 | ||
Kennedy-Wilson, Inc. 4.75% 2/1/2030 | 3,150 | 2,618 | ||
Kennedy-Wilson, Inc. 5.00% 3/1/2031 | 2,890 | 2,366 | ||
Kilroy Realty, LP 2.50% 11/15/2032 | 786 | 590 | ||
Kilroy Realty, LP 2.65% 11/15/2033 | 528 | 388 | ||
Kilroy Realty, LP 6.25% 1/15/2036 | 1,681 | 1,597 | ||
Ladder Capital Finance Holdings LLLP 4.75% 6/15/20291 | 2,115 | 1,955 | ||
MPT Operating Partnership, LP 5.00% 10/15/2027 | 250 | 207 | ||
MPT Operating Partnership, LP 3.50% 3/15/2031 | 3,178 | 2,074 | ||
Park Intermediate Holdings, LLC 4.875% 5/15/20291 | 1,738 | 1,631 | ||
Prologis, LP 4.75% 6/15/2033 | 1,110 | 1,071 | ||
Prologis, LP 5.125% 1/15/2034 | 685 | 677 | ||
Prologis, LP 5.00% 3/15/2034 | 1,260 | 1,233 | ||
Prologis, LP 5.25% 3/15/2054 | 170 | 161 | ||
Public Storage Operating Co. 5.35% 8/1/2053 | 1,093 | 1,055 | ||
Service Properties Trust 4.75% 10/1/2026 | 245 | 230 | ||
Service Properties Trust 4.95% 2/15/2027 | 691 | 629 | ||
Service Properties Trust 3.95% 1/15/2028 | 1,700 | 1,426 | ||
Service Properties Trust 8.375% 6/15/2029 | 300 | 295 | ||
Service Properties Trust 4.95% 10/1/2029 | 2,679 | 2,035 | ||
Service Properties Trust 4.375% 2/15/2030 | 2,060 | 1,457 | ||
Service Properties Trust 8.625% 11/15/20311 | 1,257 | 1,311 | ||
Sun Communities Operating, LP 4.20% 4/15/2032 | 300 | 269 | ||
VICI Properties, LP 5.125% 5/15/2032 | 1,391 | 1,326 | ||
41,300 | ||||
103 | Capital Group Fixed Income ETF Trust |
Capital Group U.S. Multi-Sector Income ETF (continued)
Bonds, notes & other debt instruments (continued) | Principal amount (000) | Value (000) | ||
Corporate bonds, notes & loans (continued) | ||||
Communication services 4.45% | ||||
Altice France SA 5.125% 7/15/20291 | USD425 | $280 | ||
Altice France SA 5.50% 10/15/20291 | 275 | 182 | ||
AT&T, Inc. 2.25% 2/1/2032 | 165 | 134 | ||
AT&T, Inc. 5.40% 2/15/2034 | 200 | 200 | ||
AT&T, Inc. 3.55% 9/15/2055 | 240 | 162 | ||
CCO Holdings, LLC 4.25% 2/1/20311 | 970 | 793 | ||
CCO Holdings, LLC 4.75% 2/1/20321 | 1,025 | 840 | ||
CCO Holdings, LLC 4.50% 5/1/2032 | 755 | 609 | ||
CCO Holdings, LLC 4.50% 6/1/20331 | 2,685 | 2,115 | ||
CCO Holdings, LLC 4.25% 1/15/20341 | 2,610 | 1,983 | ||
Charter Communications Operating, LLC 2.30% 2/1/2032 | 760 | 586 | ||
Charter Communications Operating, LLC 4.40% 4/1/2033 | 675 | 595 | ||
Charter Communications Operating, LLC 6.65% 2/1/2034 | 125 | 126 | ||
Charter Communications Operating, LLC 3.70% 4/1/2051 | 3,250 | 1,978 | ||
Charter Communications Operating, LLC 5.25% 4/1/2053 | 1,375 | 1,080 | ||
Comcast Corp. 4.80% 5/15/2033 | 61 | 59 | ||
Comcast Corp. 5.30% 6/1/2034 | 2,027 | 2,033 | ||
Comcast Corp. 2.887% 11/1/2051 | 1,350 | 843 | ||
Comcast Corp. 5.65% 6/1/2054 | 848 | 847 | ||
Connect Finco SARL 6.75% 10/1/20261 | 1,168 | 1,128 | ||
DIRECTV Financing, LLC 5.875% 8/15/20271 | 825 | 777 | ||
DISH DBS Corp. 5.875% 11/15/2024 | 1,406 | 1,336 | ||
DISH DBS Corp. 7.75% 7/1/2026 | 250 | 155 | ||
DISH Network Corp. 11.75% 11/15/20271 | 710 | 697 | ||
Frontier Communications Holdings, LLC 6.75% 5/1/20291 | 1,509 | 1,386 | ||
Frontier Communications Holdings, LLC 5.875% 11/1/2029 | 675 | 589 | ||
Frontier Communications Holdings, LLC 6.00% 1/15/20301 | 356 | 310 | ||
Gray Television, Inc. 7.00% 5/15/20271 | 410 | 378 | ||
Gray Television, Inc. 10.50% 7/15/20291 | 1,590 | 1,600 | ||
Gray Television, Inc. 4.75% 10/15/20301 | 452 | 272 | ||
Gray Television, Inc. 5.375% 11/15/20311 | 1,171 | 665 | ||
Gray Television, Inc., Term Loan B, (1-month USD CME Term SOFR + 5.25%) 10.57% 5/23/20293,4 | 410 | 390 | ||
Meta Platforms, Inc. 4.45% 8/15/2052 | 1,146 | 989 | ||
Netflix, Inc. 5.375% 11/15/20291 | 85 | 86 | ||
News Corp. 3.875% 5/15/20291 | 280 | 258 | ||
Nexstar Media, Inc. 4.75% 11/1/20281 | 1,735 | 1,544 | ||
Sirius XM Radio, Inc. 4.00% 7/15/20281 | 375 | 339 | ||
Sirius XM Radio, Inc. 4.125% 7/1/20301 | 1,270 | 1,086 | ||
Sirius XM Radio, Inc. 3.875% 9/1/20311 | 3,500 | 2,860 | ||
Tencent Holdings, Ltd. 3.24% 6/3/20501 | 505 | 331 | ||
Tencent Holdings, Ltd. 3.84% 4/22/2051 | 310 | 226 | ||
T-Mobile USA, Inc. 2.55% 2/15/2031 | 100 | 85 | ||
T-Mobile USA, Inc. 5.15% 4/15/2034 | 315 | 310 | ||
T-Mobile USA, Inc. 3.40% 10/15/2052 | 100 | 68 | ||
Univision Communications, Inc. 8.00% 8/15/20281 | 1,515 | 1,479 | ||
Univision Communications, Inc. 4.50% 5/1/20291 | 1,725 | 1,452 | ||
Univision Communications, Inc. 7.375% 6/30/20301 | 2,450 | 2,281 | ||
Univision Communications, Inc. 8.50% 7/31/20311 | 250 | 243 | ||
Verizon Communications, Inc. 2.355% 3/15/2032 | 450 | 368 | ||
Verizon Communications, Inc. 3.55% 3/22/2051 | 310 | 223 | ||
Verizon Communications, Inc. 3.875% 3/1/2052 | 324 | 246 | ||
WMG Acquisition Corp. 3.875% 7/15/20301 | 287 | 256 | ||
39,858 | ||||
Consumer staples 3.74% | ||||
7-Eleven, Inc. 1.80% 2/10/20311 | 941 | 754 | ||
7-Eleven, Inc. 2.80% 2/10/20511 | 926 | 552 | ||
Albertsons Companies, Inc. 3.50% 3/15/20291 | 275 | 248 | ||
Anheuser-Busch InBev Worldwide, Inc. 5.00% 6/15/2034 | 580 | 576 | ||
Anheuser-Busch InBev Worldwide, Inc. 5.55% 1/23/2049 | 100 | 101 | ||
B&G Foods, Inc. 5.25% 4/1/2025 | 15 | 15 | ||
Capital Group Fixed Income ETF Trust | 104 |
Capital Group U.S. Multi-Sector Income ETF (continued)
Bonds, notes & other debt instruments (continued) | Principal amount (000) | Value (000) | ||
Corporate bonds, notes & loans (continued) | ||||
Consumer staples (continued) | ||||
B&G Foods, Inc. 5.25% 9/15/2027 | USD390 | $362 | ||
B&G Foods, Inc. 8.00% 9/15/20281 | 1,238 | 1,260 | ||
BAT Capital Corp. 6.421% 8/2/2033 | 1,205 | 1,260 | ||
BAT Capital Corp. 6.00% 2/20/2034 | 55 | 56 | ||
BAT Capital Corp. 7.081% 8/2/2053 | 1,958 | 2,084 | ||
Campbell Soup Co. 5.20% 3/21/2029 | 215 | 215 | ||
Campbell Soup Co. 5.40% 3/21/2034 | 1,044 | 1,038 | ||
Central Garden & Pet Co. 4.125% 4/30/20311 | 1,655 | 1,461 | ||
Coca-Cola Co. 5.00% 5/13/2034 | 488 | 490 | ||
Coca-Cola Consolidated, Inc. 5.45% 6/1/2034 | 1,572 | 1,587 | ||
Constellation Brands, Inc. 2.25% 8/1/2031 | 1,410 | 1,158 | ||
Constellation Brands, Inc. 4.75% 5/9/2032 | 993 | 955 | ||
Constellation Brands, Inc. 4.90% 5/1/2033 | 389 | 376 | ||
Coty, Inc. 6.625% 7/15/20301 | 880 | 894 | ||
Fiesta Purchaser, Inc., Term Loan B, (3-month USD CME Term SOFR + 4.00%) 9.344% 2/12/20313,4 | 235 | 237 | ||
Imperial Brands Finance PLC 5.875% 7/1/20341 | 825 | 809 | ||
Ingles Markets, Inc. 4.00% 6/15/20311 | 910 | 792 | ||
J. M. Smucker Co. (The) 6.20% 11/15/2033 | 874 | 918 | ||
J. M. Smucker Co. (The) 6.50% 11/15/2043 | 282 | 297 | ||
J. M. Smucker Co. (The) 6.50% 11/15/2053 | 290 | 312 | ||
Kronos Acquisition Holdings Inc. 10.75% 6/30/20321 | 700 | 672 | ||
Kronos Acquisition Holdings, Inc. 5.00% 12/31/20261 | 275 | 282 | ||
Kronos Acquisition Holdings, Inc. 7.00% 12/31/20271 | 210 | 217 | ||
MARB BondCo PLC 3.95% 1/29/2031 | 950 | 790 | ||
Minerva Luxembourg SA 8.875% 9/13/20331 | 1,422 | 1,469 | ||
Performance Food Group, Inc. 4.25% 8/1/20291 | 166 | 151 | ||
Philip Morris International, Inc. 5.75% 11/7/2032 | 1,075 | 1,098 | ||
Philip Morris International, Inc. 5.375% 2/15/2033 | 1,480 | 1,470 | ||
Philip Morris International, Inc. 5.625% 9/7/2033 | 2,381 | 2,403 | ||
Philip Morris International, Inc. 5.25% 2/13/2034 | 698 | 685 | ||
Post Holdings, Inc. 4.625% 4/15/20301 | 2,235 | 2,055 | ||
Post Holdings, Inc. 6.25% 2/15/20321 | 303 | 304 | ||
Prestige Brands, Inc. 3.75% 4/1/20311 | 1,445 | 1,259 | ||
Simmons Foods, Inc. 4.625% 3/1/20291 | 350 | 308 | ||
TreeHouse Foods, Inc. 4.00% 9/1/2028 | 1,135 | 1,021 | ||
US Foods, Inc. 4.625% 6/1/20301 | 320 | 297 | ||
Walmart, Inc. 4.10% 4/15/2033 | 250 | 238 | ||
33,526 | ||||
Utilities 3.72% | ||||
Aegea Finance SARL 9.00% 1/20/20311 | 1,273 | 1,325 | ||
Alabama Power Co. 5.85% 11/15/2033 | 160 | 167 | ||
Baltimore Gas and Electric Co. 5.30% 6/1/2034 | 875 | 870 | ||
Consumers Energy Co. 4.60% 5/30/2029 | 100 | 98 | ||
Consumers Energy Co. 3.60% 8/15/2032 | 75 | 67 | ||
Consumers Energy Co. 4.625% 5/15/2033 | 125 | 120 | ||
Duke Energy Carolinas, LLC 5.35% 1/15/2053 | 275 | 261 | ||
Duke Energy Corp. 4.50% 8/15/2032 | 329 | 308 | ||
Duke Energy Corp. 6.10% 9/15/2053 | 300 | 305 | ||
Duke Energy Florida, LLC 5.875% 11/15/2033 | 90 | 94 | ||
Edison International 6.95% 11/15/2029 | 395 | 420 | ||
Electricité de France SA 9.125% junior subordinated perpetual bonds (5-year UST Yield Curve Rate T Note Constant Maturity + 5.411% on 6/15/2033)1,2 | 200 | 218 | ||
Eversource Energy 5.50% 1/1/2034 | 1,239 | 1,216 | ||
FirstEnergy Corp. 2.65% 3/1/2030 | 1,495 | 1,301 | ||
FirstEnergy Corp. 2.25% 9/1/2030 | 905 | 758 | ||
Florida Power & Light Co. 5.30% 6/15/2034 | 700 | 706 | ||
Georgia Power Co. 4.95% 5/17/2033 | 225 | 220 | ||
Georgia Power Co. 5.25% 3/15/2034 | 300 | 299 | ||
MIWD Holdco II, LLC, Term Loan B, (3-month USD CME Term SOFR + 3.50%) 8.844% 3/20/20313,4 | 235 | 237 | ||
105 | Capital Group Fixed Income ETF Trust |
Capital Group U.S. Multi-Sector Income ETF (continued)
Bonds, notes & other debt instruments (continued) | Principal amount (000) | Value (000) | ||
Corporate bonds, notes & loans (continued) | ||||
Utilities (continued) | ||||
Pacific Gas and Electric Co. 3.00% 6/15/2028 | USD220 | $201 | ||
Pacific Gas and Electric Co. 4.55% 7/1/2030 | 74 | 70 | ||
Pacific Gas and Electric Co. 3.25% 6/1/2031 | 420 | 361 | ||
Pacific Gas and Electric Co. 6.15% 1/15/2033 | 900 | 915 | ||
Pacific Gas and Electric Co. 6.40% 6/15/2033 | 1,644 | 1,699 | ||
Pacific Gas and Electric Co. 3.30% 8/1/2040 | 135 | 96 | ||
Pacific Gas and Electric Co. 3.50% 8/1/2050 | 2,660 | 1,738 | ||
Pacific Gas and Electric Co. 6.70% 4/1/2053 | 200 | 208 | ||
PacifiCorp 5.30% 2/15/2031 | 370 | 369 | ||
PacifiCorp 5.45% 2/15/2034 | 1,520 | 1,502 | ||
PacifiCorp 3.30% 3/15/2051 | 325 | 210 | ||
PacifiCorp 2.90% 6/15/2052 | 758 | 447 | ||
PacifiCorp 5.35% 12/1/2053 | 700 | 636 | ||
PacifiCorp 5.50% 5/15/2054 | 1,566 | 1,456 | ||
PacifiCorp 5.80% 1/15/2055 | 1,075 | 1,042 | ||
PG&E Corp. 5.25% 7/1/2030 | 1,655 | 1,582 | ||
Public Service Company of Colorado 5.35% 5/15/2034 | 1,200 | 1,190 | ||
Public Service Company of Colorado 3.20% 3/1/2050 | 750 | 494 | ||
Public Service Company of Colorado 2.70% 1/15/2051 | 788 | 466 | ||
Public Service Company of Colorado 5.25% 4/1/2053 | 425 | 389 | ||
Public Service Company of Colorado 5.75% 5/15/2054 | 350 | 346 | ||
Southern California Edison Co. 5.65% 10/1/2028 | 300 | 305 | ||
Southern California Edison Co. 2.50% 6/1/2031 | 355 | 298 | ||
Southern California Edison Co. 5.45% 6/1/2031 | 350 | 353 | ||
Southern California Edison Co. 5.20% 6/1/2034 | 1,875 | 1,832 | ||
Southern California Edison Co. 3.65% 2/1/2050 | 2,157 | 1,535 | ||
Southern California Edison Co. 2.95% 2/1/2051 | 380 | 236 | ||
Southern California Edison Co. 5.75% 4/15/2054 | 350 | 343 | ||
Southwestern Public Service Co. 6.00% 6/1/2054 | 225 | 225 | ||
Talen Energy Supply, LLC 8.625% 6/1/20301 | 1,845 | 1,969 | ||
Talen Energy Supply, LLC, Term Loan B, (3-month USD CME Term SOFR + 3.50%) 8.827% 5/17/20303,4 | 64 | 65 | ||
Xcel Energy, Inc. 4.60% 6/1/2032 | 50 | 47 | ||
Xcel Energy, Inc. 5.45% 8/15/2033 | 1,795 | 1,764 | ||
33,379 | ||||
Information technology 2.72% | ||||
Analog Devices, Inc. 5.05% 4/1/2034 | 1,199 | 1,195 | ||
Analog Devices, Inc. 5.30% 4/1/2054 | 62 | 61 | ||
Broadcom, Inc. 2.60% 2/15/20331 | 116 | 94 | ||
Broadcom, Inc. 3.469% 4/15/20341 | 905 | 772 | ||
Broadcom, Inc. 4.926% 5/15/20371 | 915 | 861 | ||
Cisco Systems, Inc. 4.85% 2/26/2029 | 746 | 746 | ||
Cisco Systems, Inc. 4.95% 2/26/2031 | 740 | 740 | ||
Cisco Systems, Inc. 5.05% 2/26/2034 | 2,866 | 2,865 | ||
Cloud Software Group, Inc. 6.50% 3/31/20291 | 2,455 | 2,359 | ||
Cloud Software Group, Inc. 9.00% 9/30/20291 | 2,156 | 2,093 | ||
Cloud Software Group, Inc. 8.25% 6/30/20321 | 1,516 | 1,546 | ||
Cloud Software Group, Inc., Term Loan, (3-month USD CME Term SOFR + 4.00%) 9.335% 3/30/20293,4 | 198 | 199 | ||
CommScope Technologies, LLC 6.00% 6/15/20251 | 721 | 588 | ||
CommScope, Inc. 6.00% 3/1/20261 | 838 | 736 | ||
CommScope, Inc. 8.25% 3/1/20271 | 148 | 70 | ||
CommScope, Inc. 7.125% 7/1/20281 | 55 | 23 | ||
CommScope, Inc. 4.75% 9/1/20291 | 100 | 69 | ||
CommScope, Inc., Term Loan B, (3-month USD CME Term SOFR + 3.25%) 8.708% 4/6/20263,4 | 60 | 54 | ||
Diebold Nixdorf, Inc., Term Loan, (3-month USD CME Term SOFR + 7.50%) 12.826% 10/2/20281,3,4 | 497 | 515 | ||
Finastra USA, Inc., Term Loan B, (3-month USD CME Term SOFR + 7.25%) 12.459% 9/13/20293,4,6 | 273 | 274 | ||
Capital Group Fixed Income ETF Trust | 106 |
Capital Group U.S. Multi-Sector Income ETF (continued)
Bonds, notes & other debt instruments (continued) | Principal amount (000) | Value (000) | ||
Corporate bonds, notes & loans (continued) | ||||
Information technology (continued) | ||||
Finastra USA, Inc., Term Loan, (3-month USD CME Term SOFR + 7.25%) 12.581% 9/13/20293,4,6 | USD28 | $4 | ||
Gartner, Inc. 3.75% 10/1/20301 | 403 | 362 | ||
Helios Software Holdings, Inc. 8.75% 5/1/20291 | 1,550 | 1,580 | ||
Intel Corp. 5.15% 2/21/2034 | 710 | 701 | ||
Intel Corp. 5.60% 2/21/2054 | 215 | 208 | ||
ION Trading Technologies SARL 9.50% 5/30/20291 | 1,610 | 1,641 | ||
Microchip Technology, Inc. 5.05% 3/15/2029 | 775 | 769 | ||
NCR Atleos Corp. 9.50% 4/1/20291 | 900 | 974 | ||
ServiceNow, Inc. 1.40% 9/1/2030 | 120 | 97 | ||
Texas Instruments, Inc. 4.60% 2/8/2029 | 40 | 40 | ||
Texas Instruments, Inc. 4.85% 2/8/2034 | 388 | 385 | ||
UKG, Inc. 6.875% 2/1/20311 | 1,650 | 1,672 | ||
Wolfspeed, Inc. 9.875% 6/23/2030 (10.875% on 6/23/2026)2,5,6 | 110 | 107 | ||
24,400 | ||||
Total corporate bonds, notes & loans | 642,856 | |||
Mortgage-backed obligations 13.35% | ||||
Commercial mortgage-backed securities 11.64% | ||||
3650R Commercial Mortgage Trust, Series 2022-PF2, Class B, 5.466% 11/15/20554,8 | 634 | 591 | ||
Bank Commercial Mortgage Trust, Series 2022-BNK44, Class B, 5.936% 11/15/20324,8 | 556 | 546 | ||
Bank Commercial Mortgage Trust, Series 2022-BNK44, Class C, 5.936% 11/15/20324,8 | 500 | 474 | ||
Bank Commercial Mortgage Trust, Series 2023-BNK45, Class B, 6.148% 2/15/20564,8 | 375 | 377 | ||
Bank Commercial Mortgage Trust, Series 2023-BNK45, Class C, 6.488% 2/15/20564,8 | 102 | 101 | ||
Bank Commercial Mortgage Trust, Series 2023-5YR1, Class B, 6.624% 3/15/20564,8 | 745 | 731 | ||
Bank Commercial Mortgage Trust, Series 2023-5YR2, Class AS, 7.379% 6/15/20284,8 | 267 | 280 | ||
Bank Commercial Mortgage Trust, Series 2023-5YR2, Class C, 7.403% 7/15/20284,8 | 458 | 468 | ||
Bank Commercial Mortgage Trust, Series 2023-BNK46, Class B, 6.999% 8/15/20564,8 | 712 | 750 | ||
Bank Commercial Mortgage Trust, Series 2023-BNK46, Class C, 6.999% 8/15/20564,8 | 493 | 511 | ||
Bank Commercial Mortgage Trust, Series 2023-5YR4, Class B, 7.858% 12/15/20564,8 | 598 | 632 | ||
Bank Commercial Mortgage Trust, Series 2024-5YR6, Class C, % 5/15/20574,8 | 713 | 727 | ||
Bank Commercial Mortgage Trust, Series 2019-BN18, Class C, 4.357% 5/15/20624,8 | 500 | 379 | ||
Barclays Commercial Mortgage Securities, LLC, Series 2018-TALL, Class A, ((1-month USD CME Term SOFR + 0.047%) + 0.872%) 6.248% 3/15/20371,4,8 | 1,600 | 1,515 | ||
Barclays Commercial Mortgage Securities, LLC, Series 2022-C18, Class C, 6.348% 12/15/20554,8 | 1,008 | 970 | ||
Barclays Commercial Mortgage Securities, LLC, Series 2023-C19, Class AS, 6.07% 4/15/20564,8 | 148 | 150 | ||
Barclays Commercial Mortgage Securities, LLC, Series 2023-C19, Class B, 6.545% 4/15/20564,8 | 150 | 152 | ||
Barclays Commercial Mortgage Securities, LLC, Series 2023-C19, Class C, 6.597% 4/15/20564,8 | 198 | 196 | ||
Barclays Commercial Mortgage Securities, LLC, Series 2023-C20, Class C, 6.828% 7/15/20564,8 | 470 | 460 | ||
Barclays Commercial Mortgage Securities, LLC, Series 2024-C24, Class C, 6.00% 2/15/20578 | 207 | 202 | ||
Barclays Commercial Mortgage Securities, LLC, Series 2024-C26, Class C, 6.00% 5/15/20574,8 | 286 | 280 | ||
Barclays Commercial Mortgage Securities, LLC, Series 24-5C27, Class B, 6.70% 7/15/20574,8 | 2,530 | 2,606 | ||
Barclays Commercial Mortgage Securities, LLC, Series 24-5C27, Class C, 6.70% 7/15/20574,8 | 1,523 | 1,538 | ||
Benchmark Mortgage Trust, Series 2024-V7, Class AS, 6.533% 6/15/20298 | 1,074 | 1,112 | ||
Benchmark Mortgage Trust, Series 2023-V2, Class B, 6.995% 5/15/20504,8 | 999 | 1,022 | ||
Benchmark Mortgage Trust, Series 2021-B24, Class C, 3.293% 3/15/20544,8 | 980 | 728 | ||
Benchmark Mortgage Trust, Series 2023-V2, Class C, 6.995% 5/15/20554,8 | 742 | 752 | ||
Benchmark Mortgage Trust, Series 2023-B38, Class AM, 6.12% 4/15/20564,8 | 226 | 233 | ||
Benchmark Mortgage Trust, Series 2023-B38, Class B, 6.245% 4/15/20564,8 | 499 | 501 | ||
Benchmark Mortgage Trust, Series 2023-B38, Class C, 6.245% 4/15/20564,8 | 499 | 442 | ||
Benchmark Mortgage Trust, Series 2023-V3, Class B, 6.924% 7/15/20568 | 500 | 512 | ||
Benchmark Mortgage Trust, Series 2023-V3, Class C, 7.412% 7/15/20564,8 | 881 | 895 | ||
Benchmark Mortgage Trust, Series 2023-B40, Class B, 6.58% 12/15/20564,8 | 893 | 924 | ||
107 | Capital Group Fixed Income ETF Trust |
Capital Group U.S. Multi-Sector Income ETF (continued)
Bonds, notes & other debt instruments (continued) | Principal amount (000) | Value (000) | ||
Mortgage-backed obligations (continued) | ||||
Commercial mortgage-backed securities (continued) | ||||
Benchmark Mortgage Trust, Series 2024-V5, Class B, 6.059% 1/10/20578 | USD416 | $415 | ||
Benchmark Mortgage Trust, Series 2024-V5, Class AM, 6.417% 1/10/20578 | 403 | 414 | ||
Benchmark Mortgage Trust, Series 2024-V5, Class C, 7.205% 1/10/20574,8 | 101 | 103 | ||
BLP Commercial Mortgage Trust, Series 2024-IND2, Class D, (1-month USD CME Term SOFR + 2.59%) 7.907% 3/15/20411,4,8 | 1,686 | 1,676 | ||
BMO Mortgage Trust, Series 2023-C5, Class B, 6.697% 6/15/20564,8 | 312 | 324 | ||
BMO Mortgage Trust, Series 2023-C5, Class C, 6.847% 6/15/20564,8 | 166 | 170 | ||
BMO Mortgage Trust, Series 2023-5C1, Class B, 6.96% 8/15/20564,8 | 1,052 | 1,080 | ||
BMO Mortgage Trust, Series 2023-5C1, Class C, 7.355% 8/15/20564,8 | 403 | 409 | ||
BMO Mortgage Trust, Series 2023-C6, Class B, 6.636% 9/15/20564,8 | 520 | 544 | ||
BMO Mortgage Trust, Series 2024-5C3, Class D, 4.00% 2/15/20571,8 | 167 | 140 | ||
BMO Mortgage Trust, Series 2024-5C3, Class AS, 6.286% 2/15/20574,8 | 196 | 200 | ||
BMO Mortgage Trust, Series 2024-5C3, Class B, 6.557% 2/15/20574,8 | 446 | 454 | ||
BMO Mortgage Trust, Series 2024-5C3, Class C, 7.088% 2/15/20574,8 | 89 | 90 | ||
BMO Mortgage Trust, Series 2024-5C4, Class C, % 5/15/20574,8 | 2,601 | 2,653 | ||
BMO Mortgage Trust, Series 2024-C9, Class B, 6.562% 7/15/20574,8 | 1,897 | 1,954 | ||
BMO Mortgage Trust, Series 2024-C9, Class C, 6.601% 7/15/20574,8 | 2,858 | 2,858 | ||
BMP Trust, Series 2024-MF23, Class E, (1-month USD CME Term SOFR + 3.389%) 8.718% 6/15/20411,4,8 | 2,809 | 2,798 | ||
BX Trust, Series 24-VLT4, Class E, (1-month USD CME Term SOFR + 2.889%) 8.209% 5/15/20291,4,8 | 2,595 | 2,590 | ||
BX Trust, Series 2024-KING, Class C, (1-month USD CME Term SOFR + 1.94%) 7.269% 5/15/20341,4,8 | 2,698 | 2,707 | ||
BX Trust, Series 2024-KING, Class D, (1-month USD CME Term SOFR + 2.49%) 7.79% 5/15/20341,4,8 | 1,875 | 1,876 | ||
BX Trust, Series 2021-VOLT, Class D, (1-month USD CME Term SOFR + 1.764%) 7.093% 9/15/20361,4,8 | 280 | 276 | ||
BX Trust, Series 2021-VOLT, Class E, (1-month USD CME Term SOFR + 2.114%) 7.443% 9/15/20361,4,8 | 710 | 702 | ||
BX Trust, Series 2022-AHP, Class A, (1-month USD CME Term SOFR + 0.99%) 6.319% 2/15/20391,4,8 | 769 | 761 | ||
BX Trust, Series 2022-PSB, Class A, (1-month USD CME Term SOFR + 2.451%) 7.78% 8/15/20391,4,8 | 399 | 399 | ||
BX Trust, Series 2022-PSB, Class C, (1-month USD CME Term SOFR + 3.697%) 9.026% 8/15/20391,4,8 | 199 | 200 | ||
BX Trust, Series 2020-VIV4, Class A, 2.843% 3/9/20441,8 | 500 | 434 | ||
BX Trust, Series 2020-VIV3, Class B, 3.662% 3/9/20441,4,8 | 495 | 437 | ||
BX Trust, Series 2020-VIV2, Class C, 3.66% 3/9/20441,4,8 | 500 | 436 | ||
CENT Trust 2023-CITY, Series 2023-CITY, Class B, (1-month USD CME Term SOFR + 3.15%) 8.479% 9/15/20281,4,8 | 958 | 965 | ||
Citigroup Commercial Mortgage Trust, Series 2023-SMRT, Class D, 6.048% 6/10/20281,4,8 | 1,129 | 1,093 | ||
Citigroup Commercial Mortgage Trust, Series 2023-SMRT, Class C, 6.048% 10/12/20401,4,8 | 245 | 241 | ||
Citigroup Commercial Mortgage Trust, Series 2020-GC46, Class B, 3.15% 2/15/20534,8 | 140 | 118 | ||
DATA 2023-CNTR Mortgage Trust, Series 2023-CNTR, Class D, 5.919% 8/12/20431,4,8 | 664 | 564 | ||
DC Commercial Mortgage Trust, Series 2023-DC, Class D, 7.378% 9/10/20401,4,8 | 1,546 | 1,539 | ||
ELM Trust 2024, Series 2024-ELM, Class D15, 6.674% 6/10/20291,4,8 | 669 | 670 | ||
ELM Trust 2024, Series 2024-ELM, Class D10, 6.626% 6/10/20391,4,8 | 744 | 745 | ||
FIVE Mortgage Trust, Series 2023-V1, Class B, 6.507% 2/10/20564,8 | 495 | 494 | ||
FIVE Mortgage Trust, Series 2023-V1, Class C, 6.507% 2/10/20564,8 | 195 | 190 | ||
FS Commerical Mortgage Trust, Series 2023-4SZN, Class D, 9.383% 11/10/20391,4,8 | 2,095 | 2,179 | ||
Great Wolf Trust, Series 2024-WOLF, Class C, (1-month USD CME Term SOFR + 2.391%) 7.72% 3/15/20391,4,8 | 2,642 | 2,646 | ||
Great Wolf Trust, Series 2024-WOLF, Class D, (1-month USD CME Term SOFR + 2.89%) 8.219% 3/15/20391,4,8 | 1,859 | 1,864 | ||
GS Mortgage Securities Trust, Series 2024-70P, Class B, 5.887% 3/10/20411,4,8 | 380 | 372 | ||
GS Mortgage Securities Trust, Series 2019-GC40, Class C, 3.946% 7/10/20528 | 900 | 722 | ||
GS Mortgage Securities Trust, Series 2020-GSA2, Class C, 2.989% 12/12/20538 | 2,950 | 2,115 | ||
GS Mortgage Securities Trust., Series 2024-70P, Class A, 5.487% 3/6/20291,4,8 | 670 | 656 | ||
GS Mortgage Securities Trust., Series 2024-70P, Class C, 6.287% 3/10/20411,4,8 | 1,885 | 1,845 | ||
GS Mortgage Securities Trust., Series 2024-70P, Class D, 7.531% 3/6/20291,4,8 | 2,897 | 2,850 | ||
Capital Group Fixed Income ETF Trust | 108 |
Capital Group U.S. Multi-Sector Income ETF (continued)
Bonds, notes & other debt instruments (continued) | Principal amount (000) | Value (000) | ||
Mortgage-backed obligations (continued) | ||||
Commercial mortgage-backed securities (continued) | ||||
Hilton USA Trust, Series 2024-ORL, Class B, (1-month USD CME Term SOFR + 1.941%) 7.27% 5/15/20371,4,8 | USD2,000 | $2,002 | ||
Hilton USA Trust, Series 2024-ORL, Class C, (1-month USD CME Term SOFR + 2.44%) 7.769% 5/15/20371,4,8 | 2,324 | 2,324 | ||
HTL Commercial Mortgage Trust, Series 2024-T53, Class C, 7.324% 5/10/20391,4,8 | 945 | 949 | ||
HTL Commercial Mortgage Trust, Series 2024-T53, Class D, 8.471% 5/10/20391,4,8 | 1,026 | 1,036 | ||
Morgan Stanley Bank of America Merrill Lynch Trust, Series 2015-C22, Class AS, 3.561% 4/15/20488 | 483 | 470 | ||
Morgan Stanley Bank of America Merrill Lynch Trust, Series 2015-C24, Class AS, 4.036% 5/15/20484,8 | 508 | 481 | ||
MSFW Commercial Mortgage Trust, Series 2023-1, Class B, 6.906% 5/15/20334,8 | 410 | 438 | ||
MSFW Commercial Mortgage Trust, Series 2023-1, Class C, 6.906% 5/15/20334,8 | 283 | 292 | ||
Multifamily Connecticut Avenue Securities, Series 2020-1, Class M10, (30-day Average USD-SOFR + 3.864%) 9.20% 3/25/20501,4,8 | 1,336 | 1,343 | ||
Multifamily Connecticut Avenue Securities, Series 2023-01, Class M7, (30-day Average USD-SOFR + 4.00%) 9.335% 11/25/20531,4,8 | 1,506 | 1,566 | ||
Multifamily Connecticut Avenue Securities, Series 2023-01, Class M10, (30-day Average USD-SOFR + 6.50%) 11.835% 11/25/20531,4,8 | 4,882 | 5,482 | ||
ORL Trust, Series 2023-GLKS, Class C, (1-month USD CME Term SOFR + 3.651%) 8.98% 10/19/20361,4,8 | 983 | 985 | ||
ORL Trust, Series 2023-GLKS, Class D, (1-month USD CME Term SOFR + 4.301%) 9.63% 10/19/20361,4,8 | 1,795 | 1,807 | ||
SDR Commercial Mortgage Trust, Series 2024-DSNY, Class B, (1-month USD CME Term SOFR + 1.741%) 7.07% 5/15/20391,4,8 | 486 | 484 | ||
SFO Commerical Mortgage Trust, Series 2021-555, Class A, (1-month USD CME Term SOFR + 1.264%) 6.593% 5/15/2038 (1-month USD CME Term SOFR + 1.514% on 5/15/2026)1,2,8 | 3,395 | 3,219 | ||
StorageMart Commercial Mortgage Trust, Series 2022-MINI, Class D, (1-month USD CME Term SOFR + 1.95%) 7.279% 1/15/20391,4,8 | 2,000 | 1,963 | ||
UBS Commercial Mortgage Trust, Series 2017-C1, Class AS, 3.724% 6/15/20501,8 | 1,915 | 1,787 | ||
UBS Commercial Mortgage Trust, Series 2017-C3, Class C, 4.53% 8/15/20504,8 | 791 | 724 | ||
Wells Fargo Commercial Mortgage Trust, Series 2015-C28, Class AS, 3.872% 5/15/20484,8 | 481 | 468 | ||
Wells Fargo Commercial Mortgage Trust, Series 2015-C29, Class AS, 4.013% 6/15/20484,8 | 995 | 969 | ||
Wells Fargo Commercial Mortgage Trust, Series 2016-C35, Class C, 4.176% 7/15/20484,8 | 3,000 | 2,802 | ||
Wells Fargo Commercial Mortgage Trust, Series 2018-C46, Class B, 4.633% 8/15/20518 | 967 | 879 | ||
WMRK Commercial Mortgage Trust, Series 2022-WMRK, Class A, (1-month USD CME Term SOFR + 2.789%) 8.118% 11/15/20271,4,8 | 412 | 413 | ||
WSTN Trust, Series 2023-MAUI, Class C, 7.958% 8/5/20271,4,8 | 148 | 147 | ||
WSTN Trust, Series 2023-MAUI, Class B, 7.263% 7/5/20371,4,8 | 260 | 259 | ||
WSTN Trust, Series 2023-MAUI, Class D, 8.748% 8/5/20271,4,8 | 321 | 318 | ||
104,332 | ||||
Collateralized mortgage-backed obligations (privately originated) 1.71% | ||||
Cascade Funding Mortgage Trust, Series 2023-HB12, Class M1, 4.25% 4/25/20331,4,8 | 224 | 213 | ||
Cascade Funding Mortgage Trust, Series 2023-HB12, Class A, 4.25% 7/25/20261,4,8 | 46 | 45 | ||
Connecticut Avenue Securities Trust, Series 2023-R01, Class 1M1, (30-day Average USD-SOFR + 2.40%) 7.735% 12/25/20421,4,8 | 805 | 829 | ||
Connecticut Avenue Securities Trust, Series 2023-R04, Class 1M2, (30-day Average USD-SOFR + 3.55%) 8.885% 5/25/20431,4,8 | 285 | 307 | ||
FARM Mortgage Trust, Series 2024-1, Class B, 5.121% 10/1/20531,4,8 | 1,509 | 1,229 | ||
Freddie Mac Structured Agency Credit Risk Debt Notes, Series 2018-DNA3, Class B2, (30-day Average USD-SOFR + 7.864%) 13.20% 9/25/20481,4,8 | 2,500 | 2,935 | ||
Freddie Mac Structured Agency Credit Risk Debt Notes, Series 2019-DNA3, Class B2, (30-day Average USD-SOFR + 8.264%) 13.60% 7/25/20491,4,8 | 2,000 | 2,320 | ||
Freddie Mac Structured Agency Credit Risk Debt Notes, Series 2020-DNA2, Class M2, (30-day Average USD-SOFR + 1.964%) 7.30% 2/25/20501,4,8 | 282 | 285 | ||
Freddie Mac Structured Agency Credit Risk Debt Notes, Series 2020-DNA2, Class B2, (30-day Average USD-SOFR + 4.914%) 10.25% 2/25/20501,4,8 | 633 | 680 | ||
109 | Capital Group Fixed Income ETF Trust |
Capital Group U.S. Multi-Sector Income ETF (continued)
Bonds, notes & other debt instruments (continued) | Principal amount (000) | Value (000) | ||
Mortgage-backed obligations (continued) | ||||
Collateralized mortgage-backed obligations (privately originated) (continued) | ||||
Freddie Mac Structured Agency Credit Risk Debt Notes, Series 2020-DNA4, Class B1, (30-day Average USD-SOFR + 6.114%) 11.45% 8/25/20501,4,8 | USD310 | $357 | ||
Freddie Mac Structured Agency Credit Risk Debt Notes, Series 2020-DNA6, Class B2, (30-day Average USD-SOFR + 5.65%) 10.985% 12/25/20501,4,8 | 425 | 484 | ||
JP Morgan Mortgage Trust, Series 2024-CES1, Class A3, 6.397% 6/25/2054 (7.397% on 3/1/2028)1,2,4,8 | 564 | 564 | ||
JP Morgan Mortgage Trust, Series 2024-CES1, Class M1, 6.596% 6/25/2054 (7.596% on 3/1/2028)1,2,4,8 | 458 | 456 | ||
Progress Residential Trust, Series 2024-SFR1, Class E1, 3.85% 2/17/20411,8 | 1,131 | 1,004 | ||
Progress Residential Trust, Series 2024-SFR1, Class E2, 3.85% 2/17/20411,8 | 465 | 402 | ||
Progress Residential Trust, Series 2024-SFR2, Class E1, 3.40% 4/17/20411,4,8 | 1,073 | 934 | ||
Progress Residential Trust, Series 2024-SFR2, Class E2, 3.65% 4/17/20411,4,8 | 449 | 387 | ||
Progress Residential Trust, Series 2024-SFR3, Class E1, 4.00% 6/17/20411,8 | 1,383 | 1,231 | ||
Progress Residential Trust, Series 2024-SFR3, Class E2, 4.00% 6/17/20411,8 | 534 | 467 | ||
Tricon Residential Trust, Series 2023-SFR1, Class C, 5.10% 7/17/20401,8 | 100 | 96 | ||
Tricon Residential Trust, Series 2023-SFR1, Class E, 7.977% 7/17/20401,8 | 100 | 101 | ||
15,326 | ||||
Total mortgage-backed obligations | 119,658 | |||
Asset-backed obligations 8.57% | ||||
ACHV ABS Trust, Series 2023-2PL, Class B, 6.88% 5/20/20301,8 | 32 | 32 | ||
American Credit Acceptance Receivables Trust, Series 2023-2, Class D, 6.47% 8/13/20291,8 | 347 | 348 | ||
Avis Budget Rental Car Funding (AESOP), LLC, Series 2022-5, Class B, 7.09% 4/20/20271,8 | 553 | 562 | ||
Avis Budget Rental Car Funding (AESOP), LLC, Series 2023-3A, Class B, 6.12% 2/22/20281,8 | 100 | 101 | ||
Avis Budget Rental Car Funding (AESOP), LLC, Series 2023-3A, Class C, 7.05% 2/22/20281,8 | 187 | 190 | ||
Babson CLO, Ltd., Series 2021-1, Class D, (3-month USD CME Term SOFR + 3.162%) 8.485% 4/25/20341,4,8 | 1,000 | 988 | ||
Bridgecrest Lending Auto Securitization Trust, Series 2024-1, Class C, 5.65% 4/16/20298 | 271 | 270 | ||
Bridgecrest Lending Auto Securitization Trust, Series 2024-1, Class D, 6.03% 11/15/20298 | 527 | 528 | ||
CFG Investments, Ltd., Series 2023-1, Class A, 8.56% 7/25/20341,8 | 395 | 397 | ||
CPS Auto Receivables Trust, Series 2024-A, Class C, 5.74% 4/15/20301,8 | 100 | 100 | ||
CPS Auto Receivables Trust, Series 2024-A, Class D, 6.13% 4/15/20301,8 | 100 | 100 | ||
CPS Auto Receivables Trust, Series 2022-D, Class E, 12.12% 6/17/20301,8 | 3,000 | 3,306 | ||
CPS Auto Trust, Series 2024-A, Class E, 8.42% 8/15/20311,8 | 700 | 716 | ||
CPS Auto Trust, Series 2024-C, Class E, 8.04% 3/15/20321,8 | 4,350 | 4,361 | ||
Credit Acceptance Auto Loan Trust, Series 2023-3, Class B, 7.09% 10/17/20331,8 | 118 | 121 | ||
Credit Acceptance Auto Loan Trust, Series 2023-3, Class C, 7.62% 12/15/20331,8 | 136 | 141 | ||
Crossroads Asset Trust, Series 2024-A, Class A2, 5.90% 8/20/20301,8 | 254 | 255 | ||
DLLAD, LLC, Series 2024-1, Class A3, 5.30% 7/20/20291,8 | 245 | 246 | ||
DLLAD, LLC, Series 2024-1, Class A4, 5.38% 9/22/20311,8 | 241 | 243 | ||
DriveTime Auto Owner Trust, Series 2023-3, Class C, 6.40% 5/15/20291,8 | 260 | 262 | ||
DriveTime Auto Owner Trust, Series 2023-3, Class D, 7.12% 5/15/20291,8 | 269 | 275 | ||
Exeter Automobile Receivables Trust, Series 2023-2, Class E, 9.75% 11/15/20301,8 | 2,212 | 2,331 | ||
Exeter Automobile Receivables Trust, Series 2023-3, Class E, 9.98% 1/15/20311,8 | 1,014 | 1,080 | ||
Exeter Automobile Receivables Trust, Series 2023-4, Class E, 9.57% 2/18/20311,8 | 1,100 | 1,149 | ||
Exeter Automobile Receivables Trust, Series 2023-5, Class E, 9.58% 6/16/20311,8 | 1,351 | 1,428 | ||
Exeter Automobile Receivables Trust, Series 2024-1, Class E, 7.89% 8/15/20311,8 | 1,170 | 1,179 | ||
Exeter Automobile Receivables Trust, Series 2024-2A, Class E, 7.98% 10/15/20311,8 | 1,816 | 1,835 | ||
Ford Credit Floorplan Master Owner Trust, Series 2023-1, Class D, 6.62% 5/15/20281,8 | 584 | 588 | ||
Fortress Credit BSL, Ltd., CLO, Series 2023-1, Class B1, (3-month USD CME Term SOFR + 3.00%) 8.326% 4/23/20361,4,8 | 250 | 253 | ||
GLS Auto Receivables Trust, Series 2023-3, Class C, 6.01% 5/15/20291,8 | 75 | 75 | ||
GLS Auto Receivables Trust, Series 2023-3, Class D, 6.44% 5/15/20291,8 | 68 | 69 | ||
GLS Auto Receivables Trust, Series 2024-1, Class D, 5.95% 12/17/20291,8 | 397 | 397 | ||
GLS Auto Receivables Trust, Series 2023-3, Class E, 9.27% 8/15/20301,8 | 950 | 993 | ||
Capital Group Fixed Income ETF Trust | 110 |
Capital Group U.S. Multi-Sector Income ETF (continued)
Bonds, notes & other debt instruments (continued) | Principal amount (000) | Value (000) | ||
Asset-backed obligations (continued) | ||||
GLS Auto Receivables Trust, Series 2023-4, Class E, 9.72% 8/15/20301,8 | USD1,010 | $1,074 | ||
GLS Auto Receivables Trust, Series 2024-1, Class E, 7.94% 10/15/20301,8 | 2,072 | 2,086 | ||
GLS Auto Receivables Trust, Series 2024-2, Class E, 7.98% 5/15/20311,8 | 1,170 | 1,183 | ||
Hertz Vehicle Financing III, LLC, Series 2023-3, Class B, 6.53% 2/25/20281,8 | 203 | 204 | ||
Hertz Vehicle Financing III, LLC, Series 2023-3, Class C, 7.26% 2/25/20281,8 | 300 | 303 | ||
Hertz Vehicle Financing III, LLC, Series 2022-2, Class D, 5.16% 6/26/20281,8 | 478 | 429 | ||
Hertz Vehicle Financing III, LLC, Series 2023-4, Class B, 6.73% 3/25/20301,8 | 233 | 238 | ||
KKR Financial CLO, Ltd., Series 40, Class CR, (3-month USD CME Term SOFR + 2.20%) 7.543% 10/20/20341,4,8 | 1,000 | 1,003 | ||
LAD Auto Receivables Trust, Series 2023-1, Class C, 6.18% 12/15/20271,8 | 273 | 274 | ||
Mission Lane Credit Card Master Trust, Series 2022-B, Class C, 12.09% 1/15/20285,6,8 | 1,000 | 1,008 | ||
Mission Lane Credit Card Master Trust, Series 2023-A, Class B, 8.15% 7/17/20281,8 | 615 | 620 | ||
Mission Lane Credit Card Master Trust, Series 2023-A, Class C, 10.03% 7/17/20281,8 | 1,100 | 1,117 | ||
Mission Lane Credit Card Master Trust, Series 2023-A, Class D, 11.95% 7/17/20281,8 | 5,500 | 5,534 | ||
Mission Lane Credit Card Master Trust, Series 2023-B, Class C, 10.44% 11/15/20281,8 | 6,312 | 6,341 | ||
Mission Lane Credit Card Master Trust, Series 2024-A, Class D, 10.12% 8/15/20291,8 | 4,000 | 4,001 | ||
Mission Lane Credit Card Master Trust, Series 2024-A, Class E, 13.69% 8/15/20291,8 | 5,000 | 4,996 | ||
Ondeck Asset Securitization Trust, LLC, Series 2024-1, Class B, 7.15% 6/17/20311,8 | 545 | 550 | ||
Ondeck Asset Securitization Trust, LLC, Series 2024-1, Class C, 8.99% 6/17/20311,8 | 316 | 322 | ||
OnDeck Asset Securitization Trust, LLC, Series 2023-1A, Class B, 8.25% 8/19/20301,8 | 273 | 280 | ||
Orion CLO, Ltd., Series 2023-1, Class C, (3-month USD CME Term SOFR + 3.25%) 8.574% 10/25/20361,4,8 | 467 | 469 | ||
Orion CLO, Ltd., Series 2023-1, Class D, (3-month USD CME Term SOFR + 5.15%) 10.474% 10/25/20361,4,8 | 378 | 388 | ||
Palmer Square Loan Funding, CLO, Series 2023-1, Class C, (3-month USD CME Term SOFR + 4.75%) 10.075% 7/20/20311,4,8 | 250 | 250 | ||
Prestige Auto Receivables Trust, Series 2023-1, Class D, 6.33% 4/16/20291,8 | 273 | 273 | ||
Prestige Auto Receivables Trust, Series 2024-1, Class E, 7.94% 4/15/20311,8 | 512 | 512 | ||
RAD CLO, Ltd., Series 2020-7, Class CR, (3-month USD CME Term SOFR + 2.60%) 7.917% 4/17/20361,4,8 | 2,500 | 2,506 | ||
RAD CLO, Ltd., Series 2023-20, Class D, (3-month USD CME Term SOFR + 5.00%) 10.327% 7/20/20361,4,8 | 250 | 256 | ||
Santander Drive Auto Receivables Trust, Series 2022-7, Class C, 6.69% 3/17/20318 | 149 | 152 | ||
SMB Private Education Loan Trust, Series 2023-C, Class A1A, 5.67% 11/15/20521,8 | 141 | 142 | ||
SMB Private Education Loan Trust, Series 2021-A, Class D1, 3.86% 1/15/20531,8 | 272 | 235 | ||
SMB Private Education Loan Trust, Series 2021-A, Class D2, 3.86% 1/15/20531,8 | 130 | 112 | ||
SMB Private Education Loan Trust, Series 2023-A, Class B, 5.88% 1/15/20531,8 | 415 | 413 | ||
SMB Private Education Loan Trust, Series 2024-A, Class D, 8.22% 3/15/20561,8 | 4,935 | 5,060 | ||
SMB Private Education Loan Trust, Series 2023-B, Class D, 7.56% 10/16/20561,8 | 1,000 | 999 | ||
Stratus Static CLO, Ltd., Series 2022-3, Class BR, (3-month USD CME Term SOFR + 1.90%) 7.218% 10/20/20311,4,8 | 500 | 501 | ||
United Auto Credit Securitization Trust, Series 2024-1, Class D, 8.30% 11/12/20291,8 | 3,000 | 3,031 | ||
Vibrant CLO, Ltd., Series 2021-12, Class BR, (3-month USD CME Term SOFR + 2.50%) % 4/20/20341,4,8 | 2,287 | 2,291 | ||
Vibrant CLO, Ltd., Series 2021-12, Class C1R, (3-month USD CME Term SOFR + 3.75%) 9.236% 4/20/20341,4,8 | 2,422 | 2,429 | ||
Westlake Automobile Receivables Trust, Series 2023-3, Class C, 6.02% 9/15/20281,8 | 209 | 210 | ||
Westlake Automobile Receivables Trust, Series 2023-3, Class D, 6.47% 3/15/20291,8 | 116 | 117 | ||
76,828 | ||||
U.S. Treasury bonds & notes 1.52% | ||||
U.S. Treasury 1.52% | ||||
U.S. Treasury 4.875% 4/30/20269 | 6,507 | 6,517 | ||
U.S. Treasury 4.125% 2/15/2027 | 3,150 | 3,114 | ||
U.S. Treasury 4.25% 3/15/2027 | 300 | 297 | ||
U.S. Treasury 4.50% 4/15/2027 | 2,700 | 2,696 | ||
U.S. Treasury 4.50% 5/15/2027 | 650 | 649 | ||
U.S. Treasury 4.625% 6/15/2027 | 350 | 351 | ||
13,624 | ||||
111 | Capital Group Fixed Income ETF Trust |
Capital Group U.S. Multi-Sector Income ETF (continued)
Bonds, notes & other debt instruments (continued) | Principal amount (000) | Value (000) | ||
Municipals 0.19% | ||||
California 0.05% | ||||
City of Rancho Mirage, Community Facs. Dist. No. 5 (Improvement Area No. 1), Special Tax Bonds, Series 2024-B, 7.25% 9/1/2039 | USD440 | $440 | ||
Puerto Rico 0.12% | ||||
Electric Power Auth., Power Rev. Bonds, Series 2007-TT, 5.00% 7/1/201710 | 5 | 2 | ||
Electric Power Auth., Power Rev. Bonds, Series 2010-ZZ, 4.25% 7/1/201810 | 10 | 5 | ||
Electric Power Auth., Power Rev. Bonds, Series 2010-ZZ, 5.00% 7/1/201810 | 45 | 23 | ||
Electric Power Auth., Power Rev. Bonds, Series 2003-NN, 5.50% 7/1/202010 | 5 | 2 | ||
Electric Power Auth., Power Rev. Bonds, Series 2007-TT, 5.00% 7/1/202110 | 95 | 48 | ||
Electric Power Auth., Power Rev. Bonds, Series 2010-AAA, 5.25% 7/1/202110 | 135 | 68 | ||
Electric Power Auth., Power Rev. Bonds, Series 2010-DDD, 5.00% 7/1/202310 | 110 | 55 | ||
Electric Power Auth., Power Rev. Bonds, Series 2007-TT, 5.00% 7/1/202310 | 10 | 5 | ||
Electric Power Auth., Power Rev. Bonds, Series 2010-CCC, 5.00% 7/1/202410 | 35 | 18 | ||
Electric Power Auth., Power Rev. Bonds, Series 2010-XX, 4.625% 7/1/202510 | 5 | 2 | ||
Electric Power Auth., Power Rev. Bonds, Series 2010-XX, 4.75% 7/1/202610 | 5 | 3 | ||
Electric Power Auth., Power Rev. Bonds, Series 2010-ZZ, 5.00% 7/1/202610 | 5 | 3 | ||
Electric Power Auth., Power Rev. Bonds, Series 2010-ZZ, 5.25% 7/1/202610 | 195 | 98 | ||
Electric Power Auth., Power Rev. Bonds, Series 2010-CCC, 5.25% 7/1/2026 | 10 | 5 | ||
Electric Power Auth., Power Rev. Bonds, Series 2010-ZZ, 4.75% 7/1/202710 | 30 | 15 | ||
Electric Power Auth., Power Rev. Bonds, Series 2010-CCC, 4.80% 7/1/202810 | 110 | 55 | ||
Electric Power Auth., Power Rev. Bonds, Series 2008-WW, 5.00% 7/1/202810 | 30 | 15 | ||
Electric Power Auth., Power Rev. Bonds, Series 2007-TT, 5.00% 7/1/203210 | 80 | 40 | ||
Electric Power Auth., Power Rev. Bonds, Series 2008-WW, 5.25% 7/1/203310 | 310 | 156 | ||
Electric Power Auth., Power Rev. Bonds, Series 2013-A, 6.75% 7/1/203610 | 160 | 81 | ||
Electric Power Auth., Power Rev. Bonds, Series 2007-TT, 5.00% 7/1/203710 | 30 | 15 | ||
Electric Power Auth., Power Rev. Bonds, Series 2010-XX, 5.25% 7/1/204010 | 175 | 88 | ||
Electric Power Auth., Power Rev. Bonds, Series 2012-A, 5.00% 7/1/204210 | 40 | 20 | ||
Electric Power Auth., Power Rev. Ref. Bonds, Series 2007-UU, Assured Guaranty Municipal insured, 4.064% 7/1/20172,10 | 130 | 65 | ||
Electric Power Auth., Power Rev. Ref. Bonds, Series 2010-DDD, 5.00% 7/1/202110 | 35 | 18 | ||
Electric Power Auth., Power Rev. Ref. Bonds, Series 2010-DDD, 5.00% 7/1/202210 | 325 | 163 | ||
1,068 | ||||
Texas 0.02% | ||||
Brazoria County Industrial Dev. Corp., Solid Waste Disposal Facs. Rev. Bonds (Aleon Renewable Metals, LLC Project), Series 2023, AMT, 12.00% 6/1/20431 | 200 | 203 | ||
Total municipals | 1,711 | |||
Total bonds, notes & other debt instruments (cost: $846,801,000) | 854,677 | |||
Common stocks 0.03% | Shares | |||
Information technology 0.01% | ||||
Diebold Nixdorf, Inc.11 | 3,082 | 119 | ||
Consumer discretionary 0.01% | ||||
Party City Holdco, Inc.5 | 3,715 | 65 | ||
Party City Holdco, Inc.1,5 | 37 | — 12 | ||
65 | ||||
Materials 0.01% | ||||
Venator Materials PLC5,11 | 90 | 63 | ||
Real estate 0.00% | ||||
WeWork, Inc.5 | 2,870 | 29 | ||
Total common stocks (cost: $301,000) | 276 | |||
Capital Group Fixed Income ETF Trust | 112 |
Capital Group U.S. Multi-Sector Income ETF (continued)
Short-term securities 3.90% | Shares | Value (000) | ||
Money market investments 3.90% | ||||
Capital Group Central Cash Fund 5.37%13,14 | 349,924 | $34,993 | ||
Total short-term securities (cost: $34,991,000) | 34,993 | |||
Options purchased (equity style) 0.03% | ||||
Options purchased (equity style)* | 217 | |||
Total options purchased (equity style) (cost: $382,000) | 217 | |||
Total investment securities 99.31% (cost: $882,475,000) | 890,163 | |||
Total options written† (0.01)% (premium received: $307,000) | (77 ) | |||
Other assets less liabilities 0.70% | 6,248 | |||
Net assets 100.00% | $896,334 |
*Options purchased (equity style)
Options on futures
Description | Number of contracts | Expiration date | Exercise price | Notional amount (000) | Value at 6/30/2024 (000) |
Put | |||||
3 Month SOFR Futures Option | 160 | 12/13/2024 | USD94.38 | USD400 | $2 |
3 Month SOFR Futures Option | 160 | 12/13/2024 | 95.13 | 400 | 69 |
3 Month SOFR Futures Option | 669 | 12/13/2024 | 94.94 | 1,672 | 134 |
3 Month SOFR Futures Option | 669 | 12/13/2024 | 94.44 | 1,673 | 12 |
$217 |
†Options written (equity style)
Options on futures
Description | Number of contracts | Expiration date | Exercise price | Notional amount (000) | Value at 6/30/2024 (000) |
Put | |||||
3 Month SOFR Futures Option | 160 | 12/13/2024 | USD94.63 | USD(400) | $(4 ) |
3 Month SOFR Futures Option | 1,339 | 12/13/2024 | 94.69 | (3,348 ) | (50 ) |
3 Month SOFR Futures Option | 160 | 12/13/2024 | 94.87 | (400 ) | (23 ) |
$(77 ) |
Futures contracts
Contracts | Type | Number of contracts | Expiration date | Notional amount (000) | Value and unrealized appreciation (depreciation) at 6/30/2024 (000) |
30 Day Federal Funds Futures | Long | 165 | 8/30/2024 | USD65,108 | $(32 ) |
2 Year U.S. Treasury Note Futures | Long | 205 | 9/30/2024 | 41,865 | 93 |
5 Year U.S. Treasury Note Futures | Long | 339 | 9/30/2024 | 36,130 | 176 |
10 Year U.S. Treasury Note Futures | Long | 56 | 9/19/2024 | 6,159 | 38 |
10 Year Ultra U.S. Treasury Note Futures | Short | 750 | 9/19/2024 | (85,149 ) | (458 ) |
113 | Capital Group Fixed Income ETF Trust |
Capital Group U.S. Multi-Sector Income ETF (continued)
Futures contracts (continued)
Contracts | Type | Number of contracts | Expiration date | Notional amount (000) | Value and unrealized appreciation (depreciation) at 6/30/2024 (000) |
30 Year U.S. Treasury Bond Futures | Long | 122 | 9/19/2024 | 14,434 | $207 |
30 Year Ultra U.S. Treasury Bond Futures | Short | 4 | 9/19/2024 | (501 ) | 15 |
$39 |
Forward currency contracts
Contract amount | Counterparty | Settlement date | Unrealized appreciation (depreciation) at 6/30/2024 (000) | |||
Currency purchased (000) | Currency sold (000) | |||||
USD | 1,674 | EUR | 1,800 | Morgan Stanley | 7/22/2024 | $5 |
USD | 1,285 | EUR | 1,376 | Barclays Bank PLC | 7/25/2024 | (1 ) |
$4 | ||||||
Swap contracts
Interest rate swaps
Centrally cleared interest rate swaps
Receive | Pay | Expiration date | Notional amount (000) | Value at 6/30/2024 (000) | Upfront premium paid (received) (000) | Unrealized appreciation (depreciation) at 6/30/2024 (000) | ||
Rate | Payment frequency | Rate | Payment frequency | |||||
5.0615% | Annual | SOFR | Annual | 9/29/2025 | USD39,000 | $62 | $— | $62 |
4.834% | Annual | SOFR | Annual | 10/19/2026 | 13,500 | 97 | — | 97 |
4.692% | Annual | SOFR | Annual | 9/29/2028 | 16,200 | 344 | — | 344 |
4.1495% | Annual | SOFR | Annual | 11/27/2028 | 3,500 | 3 | — | 3 |
3.6875% | Annual | SOFR | Annual | 12/15/2028 | 2,900 | (51 ) | — | (51 ) |
4.4615% | Annual | SOFR | Annual | 9/29/2033 | 19,500 | 1,016 | — | 1,016 |
4.407% | Annual | SOFR | Annual | 11/3/2033 | 3,000 | 103 | — | 103 |
SOFR | Annual | 3.456% | Annual | 1/2/2034 | 55,000 | 2,182 | — | 2,182 |
4.5965% | Annual | SOFR | Annual | 11/2/2038 | 2,300 | 158 | — | 158 |
4.5595% | Annual | SOFR | Annual | 11/2/2043 | 1,500 | 125 | — | 125 |
SOFR | Annual | 3.7685 | Annual | 12/11/2043 | 500 | 11 | — | 11 |
SOFR | Annual | 3.364 | Annual | 5/15/2049 | 10,700 | 812 | — | 812 |
SOFR | Annual | 3.268 | Annual | 5/15/2049 | 750 | 68 | — | 68 |
4.392% | Annual | SOFR | Annual | 9/29/2053 | 4,400 | 483 | — | 483 |
SOFR | Annual | 3.2845 | Annual | 1/2/2054 | 11,700 | 967 | — | 967 |
$6,380 | $— | $6,380 | ||||||
Capital Group Fixed Income ETF Trust | 114 |
Capital Group U.S. Multi-Sector Income ETF (continued)
Swap contracts (continued)
Credit default swaps
Centrally cleared credit default swaps on credit indices — sell protection
Financing rate received | Payment frequency | Reference index | Expiration date | Notional amount15 (000) | Value at 6/30/202416 (000) | Upfront premium paid (received) (000) | Unrealized appreciation (depreciation) at 6/30/2024 (000) |
5.00% | Quarterly | CDX.NA.HY.S42 | 6/20/2029 | USD5,420 | $340 | $364 | $(24 ) |
Investments in affiliates14
Value at 1/1/2024 (000) | Additions (000) | Reductions (000) | Net realized gain (loss) (000) | Net unrealized appreciation (depreciation) (000) | Value at 6/30/2024 (000) | Dividend or interest income (000) | |
Short-term securities 3.90% | |||||||
Money market investments 3.90% | |||||||
Capital Group Central Cash Fund 5.37% 13 | $27,167 | $176,227 | $168,402 | $(4 ) | $5 | $34,993 | $687 |
Restricted securities6
Acquisition date(s) | Cost (000) | Value (000) | Percent of net assets | |
Mission Lane Credit Card Master Trust, Series 2022-B, Class C, 12.09% 1/15/20285,8 | 12/6/2022 | $1,000 | $1,008 | .11 % |
Finastra USA, Inc., Term Loan B, (3-month USD CME Term SOFR + 7.25%) 12.459% 9/13/20293,4 | 9/12/2023 | 268 | 274 | .03 |
Finastra USA, Inc., Term Loan, (3-month USD CME Term SOFR + 7.25%) 12.581% 9/13/20293,4 | 9/12/2023 | 3 | 4 | .00 17 |
Stillwater Mining Co. 4.00% 11/16/2026 | 2/9/2024 - 5/22/2024 | 488 | 491 | .06 |
Stillwater Mining Co. 4.50% 11/16/2029 | 6/5/2024 | 163 | 163 | .02 |
Wolfspeed, Inc. 9.875% 6/23/2030 (10.875% on 6/23/2026)2,5 | 6/23/2023 | 106 | 107 | .01 |
Sasol Financing USA, LLC 8.75% 5/3/2029 | 4/15/2024 - 6/27/2024 | 660 | 662 | .08 |
$2,688 | $2,709 | .31 % |
115 | Capital Group Fixed Income ETF Trust |
Capital Group U.S. Multi-Sector Income ETF (continued)
1 | Acquired in a transaction exempt from registration under Rule 144A or, for commercial paper, Section 4(a)(2) of the Securities Act of 1933. May be resold in the U.S. in transactions exempt from registration, normally to qualified institutional buyers. The total value of all such securities was $452,096,000, which represented 50.44% of the net assets of the fund. |
2 | Step bond; coupon rate may change at a later date. |
3 | Loan participations and assignments; may be subject to legal or contractual restrictions on resale. The total value of all such loans was $6,406,000, which represented 0.72% of the net assets of the fund. |
4 | Coupon rate may change periodically. Reference rate and spread are as of the most recent information available. Some coupon rates are determined by the issuer or agent based on current market conditions; therefore, the reference rate and spread are not available. |
5 | Value determined using significant unobservable inputs. |
6 | Restricted security, other than Rule 144A securities or commercial paper issued pursuant to Section 4(a)(2) of the Securities Act of 1933. The total value of all such restricted securities was $2,709,000, which represented 0.31% of the net assets of the fund. |
7 | Payment in kind; the issuer has the option of paying additional securities in lieu of cash. Payment methods and rates are as of the most recent payment when available. |
8 | Principal payments may be made periodically. Therefore, the effective maturity date may be earlier than the stated maturity date. |
9 | All or a portion of this security was pledged as collateral. The total value of pledged collateral was $1,233,000, which represented .14% of the net assets of the fund. |
10 | Scheduled interest and/or principal payment was not received. |
11 | Security did not produce income during the last 12 months. |
12 | Amount less than one thousand. |
13 | Rate represents the seven-day yield at 6/30/2024. |
14 | Part of the same "group of investment companies" as the fund as defined under the Investment Company Act of 1940, as amended. |
15 | The maximum potential amount the fund may pay as a protection seller should a credit event occur. |
16 | The prices and resulting values for credit default swap indices serve as an indicator of the current status of the payment/performance risk. As the value of a sell protection credit default swap increases or decreases, when compared to the notional amount of the swap, the payment/performance risk may decrease or increase, respectively. |
17 | Amount less than .01%. |
Key to abbreviation(s) |
AMT = Alternative Minimum Tax |
Auth. = Authority |
CLO = Collateralized Loan Obligations |
CME = CME Group |
Dev. = Development |
Dist. = District |
EUR = Euros |
EURIBOR = Euro Interbank Offered Rate |
Facs. = Facilities |
ICE = Intercontinental Exchange, Inc. |
Ref. = Refunding |
REIT = Real Estate Investment Trust |
Rev. = Revenue |
SDR = Swedish Depositary Receipts |
SOFR = Secured Overnight Financing Rate |
USD = U.S. dollars |
Refer to the notes to financial statements.
Capital Group Fixed Income ETF Trust | 116 |
Financial statementsunaudited
Statements of assets and liabilities at June 30, 2024(dollars and shares in thousands, except per-share amount)
Core Bond ETF | Core Plus Income ETF | International Bond ETF (USD-Hedged) | |
Assets: | |||
Investment securities, at value: | |||
Unaffiliated issuers | $641,152 | $2,479,057 | $46,711 |
Affiliated issuers | 164,843 | 479,058 | 6,014 |
Cash | 448 | 11,161 | 528 |
Cash collateral pledged for futures contracts | — | — | 479 |
Cash collateral pledged for swap contracts | — | — * | 62 |
Cash denominated in currencies other than U.S. dollars | — | — | — * |
Unrealized appreciation on open forward currency contracts | — | 8 | 148 |
Bilateral swaps, at value | — | 64 | — |
Receivables for: | |||
Sales of investments | 4,491 | 35,858 | — |
Sales of fund’s shares | 4,646 | 35,988 | — |
Dividends and interest | 4,570 | 20,759 | 392 |
Variation margin on futures contracts | — | — | 49 |
Variation margin on centrally cleared swap contracts | 469 | 2,060 | — |
820,619 | 3,064,013 | 54,383 | |
Liabilities: | |||
Unrealized depreciation on open forward currency contracts | — | 5 | 40 |
Options written, at value | — | — | — |
Payables for: | |||
Purchases of investments | 161,254 | 539,791 | 4,984 |
Investment advisory services | 135 | 663 | 3 |
Variation margin on futures contract | 589 | 85 | 31 |
Variation margin on centrally cleared swap contracts | 380 | 1,501 | — |
162,358 | 542,045 | 5,058 | |
Commitments and contingencies† | |||
Net assets at June 30, 2024 | $658,261 | $2,521,968 | $49,325 |
Net assets consist of: | |||
Capital paid in on shares of beneficial interest | $656,638 | $2,558,683 | $49,500 |
Total distributable earnings (accumulated loss) | 1,623 | (36,715 ) | (175 ) |
Net assets at June 30, 2024 | $658,261 | $2,521,968 | $49,325 |
Shares of beneficial interest issued and outstanding (no stated par value) — unlimited shares authorized | |||
Net assets | $658,261 | $2,521,968 | $49,325 |
Shares outstanding | 25,500 | 113,524 | 1,980 |
Net asset value per share | $25.81 | $22.22 | $24.91 |
Investment securities, at cost: | |||
Unaffiliated issuers | $638,736 | $2,469,876 | $47,042 |
Affiliated issuers | 164,843 | 479,036 | 6,014 |
Cash denominated in currencies other than U.S. dollars, at cost | — | — | — * |
Premiums received on options written | — | — | — |
Refer to the end of the statements of assets and liabilities for footnotes.Refer to the notes to financial statements.
117 | Capital Group Fixed Income ETF Trust |
Financial statements (continued)unaudited
Statements of assets and liabilities at June 30, 2024 (continued)(dollars and shares in thousands, except per-share amount)
Municipal Income ETF | Municipal High-Income ETF | Short Duration Income ETF | |
Assets: | |||
Investment securities, at value: | |||
Unaffiliated issuers | $787,538 | $25,086 | $546,796 |
Affiliated issuers | — | — | 52,386 |
Cash | 298 | 363 | 114 |
Cash collateral pledged for futures contracts | 439 | 67 | 1,526 |
Cash collateral pledged for swap contracts | — | — | 51 |
Cash denominated in currencies other than U.S. dollars | — | — | — |
Unrealized appreciation on open forward currency contracts | — | — | — |
Bilateral swaps, at value | — | — | — |
Receivables for: | |||
Sales of investments | 1 | 549 | 10,996 |
Sales of fund’s shares | 3,223 | — | 4,565 |
Dividends and interest | 9,270 | 126 | 3,444 |
Variation margin on futures contracts | 83 | — | 199 |
Variation margin on centrally cleared swap contracts | — | — | — |
800,852 | 26,191 | 620,077 | |
Liabilities: | |||
Unrealized depreciation on open forward currency contracts | — | — | — |
Options written, at value | — | — | — |
Payables for: | |||
Purchases of investments | 11,114 | 6,143 | 62,978 |
Investment advisory services | 170 | 2 | 108 |
Variation margin on futures contract | 43 | 1 | — |
Variation margin on centrally cleared swap contracts | — | — | — |
11,327 | 6,146 | 63,086 | |
Commitments and contingencies† | |||
Net assets at June 30, 2024 | $789,525 | $20,045 | $556,991 |
Net assets consist of: | |||
Capital paid in on shares of beneficial interest | $777,207 | $20,000 | $556,867 |
Total distributable earnings (accumulated loss) | 12,318 | 45 | 124 |
Net assets at June 30, 2024 | $789,525 | $20,045 | $556,991 |
Shares of beneficial interest issued and outstanding (no stated par value) — unlimited shares authorized | |||
Net assets | $789,525 | $20,045 | $556,991 |
Shares outstanding | 29,400 | 800 | 21,960 |
Net asset value per share | $26.85 | $25.06 | $25.36 |
Investment securities, at cost: | |||
Unaffiliated issuers | $776,040 | $25,050 | $544,720 |
Affiliated issuers | — | — | 52,385 |
Cash denominated in currencies other than U.S. dollars, at cost | — | — | — |
Premiums received on options written | — | — | — |
Refer to the end of the statements of assets and liabilities for footnotes.Refer to the notes to financial statements.
Capital Group Fixed Income ETF Trust | 118 |
Financial statements (continued)unaudited
Statements of assets and liabilities at June 30, 2024 (continued)(dollars and shares in thousands, except per-share amount)
Short Duration Municipal Income ETF | Ultra Short Income ETF | U.S. Multi-Sector Income ETF | |
Assets: | |||
Investment securities, at value: | |||
Unaffiliated issuers | $54,431 | $29,813 | $855,170 |
Affiliated issuers | — | — | 34,993 |
Cash | 267 | 53 | 154 |
Cash collateral pledged for futures contracts | 50 | — | 684 |
Cash collateral pledged for swap contracts | — | — | 2,323 |
Cash denominated in currencies other than U.S. dollars | — | — | — |
Unrealized appreciation on open forward currency contracts | — | — | 5 |
Bilateral swaps, at value | — | — | — |
Receivables for: | |||
Sales of investments | — | — | 2 |
Sales of fund’s shares | 1,543 | — | 11,304 |
Dividends and interest | 675 | 160 | 11,690 |
Variation margin on futures contracts | — | — | 191 |
Variation margin on centrally cleared swap contracts | — | — | 3,295 |
56,966 | 30,026 | 919,811 | |
Liabilities: | |||
Unrealized depreciation on open forward currency contracts | — | — | 1 |
Options written, at value | — | — | 77 |
Payables for: | |||
Purchases of investments | 2,963 | — | 20,296 |
Investment advisory services | 11 | 1 | 265 |
Variation margin on futures contract | — * | — | — |
Variation margin on centrally cleared swap contracts | — | — | 2,838 |
2,974 | 1 | 23,477 | |
Commitments and contingencies† | |||
Net assets at June 30, 2024 | $53,992 | $30,025 | $896,334 |
Net assets consist of: | |||
Capital paid in on shares of beneficial interest | $52,923 | $30,000 | $883,538 |
Total distributable earnings (accumulated loss) | 1,069 | 25 | 12,796 |
Net assets at June 30, 2024 | $53,992 | $30,025 | $896,334 |
Shares of beneficial interest issued and outstanding (no stated par value) — unlimited shares authorized | |||
Net assets | $53,992 | $30,025 | $896,334 |
Shares outstanding | 2,100 | 1,200 | 33,300 |
Net asset value per share | $25.71 | $25.02 | $26.92 |
Investment securities, at cost: | |||
Unaffiliated issuers | $53,553 | $29,809 | $847,484 |
Affiliated issuers | — | — | 34,991 |
Cash denominated in currencies other than U.S. dollars, at cost | — | — | — |
Premiums received on options written | — | — | 307 |
* | Amount less than one thousand. |
† | Refer to Note 5 for further information on unfunded commitments. |
Refer to the notes to financial statements.
119 | Capital Group Fixed Income ETF Trust |
Financial statements (continued)unaudited
Statements of operations for the six months ended June 30, 2024(dollars in thousands)
Core Bond ETF | Core Plus Income ETF | International Bond ETF (USD-Hedged)† | |
Investment income: | |||
Income (net of non-U.S. taxes*): | |||
Interest from unaffiliated issuers | $5,072 | $62,173 | $15 |
Dividends from affiliated issuers | 1,942 | 13,013 | 10 |
7,014 | 75,186 | 25 | |
Fees and expenses: | |||
Investment advisory services | 362 | 3,404 | 3 |
Other | — | — | — |
Total fees and expenses | 362 | 3,404 | 3 |
Net investment income | 6,652 | 71,782 | 22 |
Net realized gain (loss) and unrealized appreciation (depreciation): | |||
Net realized gain (loss)* on: | |||
Investments in: | |||
Unaffiliated issuers | (1,548 ) | (4,923 ) | — |
Affiliated issuers | (4 ) | (33 ) | — |
In-kind redemptions | — | — | — |
Futures contracts | (977 ) | (7,613 ) | — |
Forward currency contracts | — | 74 | — |
Swap contracts | 413 | (14,047 ) | — |
Currency transactions | — | 3 | 10 |
(2,116 ) | (26,539 ) | 10 | |
Net unrealized appreciation (depreciation)* on: | |||
Investments in: | |||
Unaffiliated issuers | (545 ) | (28,331 ) | (331 ) |
Affiliated issuers | 2 | 45 | — |
Options written | — | — | — |
Futures contracts | 353 | 2,045 | 19 |
Forward currency contracts | — | 24 | 108 |
Swap contracts | (536 ) | (3,436 ) | — |
Currency translations | — | (2 ) | (3 ) |
(726 ) | (29,655 ) | (207 ) | |
Net realized gain (loss) and unrealized appreciation (depreciation) | (2,842 ) | (56,194 ) | (197 ) |
Net increase (decrease) in net assets resulting from operations | $3,810 | $15,588 | $(175 ) |
Refer to the end of the statements of operations for footnotes.Refer to the notes to financial statements.
Capital Group Fixed Income ETF Trust | 120 |
Financial statements (continued)unaudited
Statements of operations for the six months ended June 30, 2024 (continued)(dollars in thousands)
Municipal Income ETF | Municipal High-Income ETF† | Short Duration Income ETF | |
Investment income: | |||
Income (net of non-U.S. taxes*): | |||
Interest from unaffiliated issuers | $13,019 | $11 | $14,789 |
Dividends from affiliated issuers | — | — | 963 |
13,019 | 11 | 15,752 | |
Fees and expenses: | |||
Investment advisory services | 868 | 1 | 531 |
Other | 1 | — | — |
Total fees and expenses | 869 | 1 | 531 |
Net investment income | 12,150 | 10 | 15,221 |
Net realized gain (loss) and unrealized appreciation (depreciation): | |||
Net realized gain (loss)* on: | |||
Investments in: | |||
Unaffiliated issuers | 413 | — | 236 |
Affiliated issuers | — | — | (5 ) |
In-kind redemptions | — | — | — |
Futures contracts | (304 ) | — | (910 ) |
Forward currency contracts | — | — | — |
Swap contracts | — | — | (5,325 ) |
Currency transactions | — | — | — |
109 | — | (6,004 ) | |
Net unrealized appreciation (depreciation)* on: | |||
Investments in: | |||
Unaffiliated issuers | (4,624 ) | 36 | (978 ) |
Affiliated issuers | — | — | 3 |
Options written | — | — | — |
Futures contracts | 23 | (1 ) | 5 |
Forward currency contracts | — | — | — |
Swap contracts | — | — | 337 |
Currency translations | — | — | — |
(4,601 ) | 35 | (633 ) | |
Net realized gain (loss) and unrealized appreciation (depreciation) | (4,492 ) | 35 | (6,637 ) |
Net increase (decrease) in net assets resulting from operations | $7,658 | $45 | $8,584 |
Refer to the end of the statements of operations for footnotes.Refer to the notes to financial statements.
121 | Capital Group Fixed Income ETF Trust |
Financial statements (continued)unaudited
Statements of operations for the six months ended June 30, 2024 (continued)(dollars in thousands)
Short Duration Municipal Income ETF | Ultra Short Income ETF† | U.S. Multi-Sector Income ETF | |
Investment income: | |||
Income (net of non-U.S. taxes*): | |||
Interest from unaffiliated issuers | $954 | $22 | $25,000 |
Dividends from affiliated issuers | — | — | 687 |
954 | 22 | 25,687 | |
Fees and expenses: | |||
Investment advisory services | 61 | 1 | 1,179 |
Other | — | — | — |
Total fees and expenses | 61 | 1 | 1,179 |
Net investment income | 893 | 21 | 24,508 |
Net realized gain (loss) and unrealized appreciation (depreciation): | |||
Net realized gain (loss)* on: | |||
Investments in: | |||
Unaffiliated issuers | 57 | — | 1,721 |
Affiliated issuers | — | — | (4 ) |
In-kind redemptions | 93 | — | — |
Futures contracts | (21 ) | — | 647 |
Forward currency contracts | — | — | 47 |
Swap contracts | — | — | (4,287 ) |
Currency transactions | — | — | 2 |
129 | — | (1,874 ) | |
Net unrealized appreciation (depreciation)* on: | |||
Investments in: | |||
Unaffiliated issuers | (329 ) | 4 | (4,906 ) |
Affiliated issuers | — | — | 5 |
Options written | — | — | 230 |
Futures contracts | 9 | — | 39 |
Forward currency contracts | — | — | 22 |
Swap contracts | — | — | 907 |
Currency translations | — | — | (1 ) |
(320 ) | 4 | (3,704 ) | |
Net realized gain (loss) and unrealized appreciation (depreciation) | (191 ) | 4 | (5,578 ) |
Net increase (decrease) in net assets resulting from operations | $702 | $25 | $18,930 |
† | For the period June 25, 2024, commencement of operations, through June 30, 2024. |
* | Additional information related to non-U.S. taxes is included in the notes to financial statements. |
Refer to the notes to financial statements.
Capital Group Fixed Income ETF Trust | 122 |
Financial statements (continued)
Statements of changes in net assets(dollars in thousands)
Core Bond ETF | Core Plus Income ETF | International Bond ETF (USD-Hedged) | ||||
Six months ended | Period ended | Six months ended | Year ended | Six months ended | ||
June 30, 20241 | December 31, 20232 | June 30, 20241 | December 31, 2023 | June 30, 20241,3 | ||
Operations: | ||||||
Net investment income | $6,652 | $865 | $71,782 | $61,904 | $22 | |
Net realized gain (loss) | (2,116 ) | (498 ) | (26,539 ) | (43,568 ) | 10 | |
Net unrealized appreciation (depreciation) | (726 ) | 3,459 | (29,655 ) | 58,790 | (207 ) | |
Net increase (decrease) in net assets resulting from operations | 3,810 | 3,826 | 15,588 | 77,126 | (175 ) | |
Distributions paid to shareholders | (5,407 ) | (606 ) | (52,266 ) | (49,339 ) | — | |
Net capital share transactions | 563,293 | 93,345 | 993,596 | 1,082,435 | 49,500 | |
Total increase (decrease) in net assets | 561,696 | 96,565 | 956,918 | 1,110,222 | 49,325 | |
Net assets: | ||||||
Beginning of period | 96,565 | — | 1,565,050 | 454,828 | — | |
End of period | $658,261 | $96,565 | $2,521,968 | $1,565,050 | $49,325 | |
Municipal Income ETF | Municipal High-Income ETF | Short Duration Income ETF | ||||
Six months ended | Year ended | Six months ended | Six months ended | Year ended | ||
June 30, 20241 | December 31, 2023 | June 30, 20241,3 | June 30, 20241 | December 31, 2023 | ||
Operations: | ||||||
Net investment income | $12,150 | $7,668 | $10 | $15,221 | $13,006 | |
Net realized gain (loss) | 109 | (613 ) | — | (6,004 ) | (3,517 ) | |
Net unrealized appreciation (depreciation) | (4,601 ) | 14,908 | 35 | (633 ) | 2,767 | |
Net increase (decrease) in net assets resulting from operations | 7,658 | 21,963 | 45 | 8,584 | 12,256 | |
Distributions paid to shareholders | (10,904 ) | (7,433 ) | — | (9,584 ) | (11,350 ) | |
Net capital share transactions | 275,958 | 428,667 | 20,000 | 225,594 | 242,033 | |
Total increase (decrease) in net assets | 272,712 | 443,197 | 20,045 | 224,594 | 242,939 | |
Net assets: | ||||||
Beginning of period | 516,813 | 73,616 | — | 332,397 | 89,458 | |
End of period | $789,525 | $516,813 | $20,045 | $556,991 | $332,397 | |
Refer to the end of the statements of changes in net assets for footnotes.Refer to the notes to financial statements.
123 | Capital Group Fixed Income ETF Trust |
Financial statements (continued)
Statements of changes in net assets (continued)(dollars in thousands)
Short Duration Municipal Income ETF | Ultra Short Income ETF | U.S. Multi-Sector Income ETF | ||||
Six months ended | Period ended | Six months ended | Six months ended | Year ended | ||
June 30, 20241 | December 31, 20232 | June 30, 20241,3 | June 30, 20241 | December 31, 2023 | ||
Operations: | ||||||
Net investment income | $893 | $365 | $21 | $24,508 | $12,942 | |
Net realized gain (loss) | 129 | (15 ) | — | (1,874 ) | (7,064 ) | |
Net unrealized appreciation (depreciation) | (320 ) | 1,204 | 4 | (3,704 ) | 17,074 | |
Net increase (decrease) in net assets resulting from operations | 702 | 1,554 | 25 | 18,930 | 22,952 | |
Distributions paid to shareholders | (819 ) | (368 ) | — | (18,930 ) | (11,122 ) | |
Net capital share transactions | 7,709 | 45,214 | 30,000 | 516,845 | 296,844 | |
Total increase (decrease) in net assets | 7,592 | 46,400 | 30,025 | 516,845 | 308,674 | |
Net assets: | ||||||
Beginning of period | 46,400 | — | — | 379,489 | 70,815 | |
End of period | $53,992 | $46,400 | $30,025 | $896,334 | $379,489 | |
1 | Unaudited. |
2 | For the period September 26, 2023, commencement of operations, through December 31, 2023. |
3 | For the period June 25, 2024, commencement of operations, through June 30, 2024. |
Refer to the notes to financial statements.
Capital Group Fixed Income ETF Trust | 124 |
Notes to financial statementsunaudited
1. Organization
Capital Group Fixed Income ETF Trust (the “series”) is registered under the Investment Company Act of 1940, as amended (the “1940 Act”), as an open-end management investment company. The series was organized on January 12, 2021, as a Delaware statutory trust. The series consists of nine nondiversified exchange-traded funds: Capital Group Core Bond ETF (“Core Bond ETF”), Capital Group Core Plus Income ETF (“Core Plus Income ETF”), Capital Group International Bond ETF (USD-Hedged) (“International Bond ETF (USD-Hedged)”), Capital Group Municipal Income ETF (“Municipal Income ETF”), Capital Group Municipal High-Income ETF (“Municipal High-Income ETF”), Capital Group Short Duration Income ETF (“Short Duration Income ETF”), Capital Group Short Duration Municipal Income ETF (“Short Duration Municipal Income ETF”), Capital Group Ultra Short Income ETF (“Ultra Short Income ETF”) and Capital Group U.S. Multi-Sector Income ETF (“U.S. Multi-Sector Income ETF”) (each a “fund”, or collectively, the “funds”). The funds’ fiscal year end is December 31.
The investment objective(s) for each fund are as follows:
Core Bond ETF — To provide as high a level of current income as is consistent with the preservation of capital.
Core Plus Income ETF — To provide current income and seek maximum total return, consistent with preservation of capital.
International Bond ETF (USD-Hedged) — To provide as high a level of current income as is consistent with the preservation of capital.
Municipal Income ETF — To provide a high level of current income exempt from regular federal income tax, consistent with the preservation of capital.
Municipal High-Income ETF — To provide a high level of current income exempt from regular federal income tax.
Short Duration Income ETF — To provide current income, consistent with a short duration profile and with the preservation of capital.
Short Duration Municipal Income ETF — To provide current income exempt from regular federal income tax, consistent with a short duration profile and with the preservation of capital.
Ultra Short Income ETF — To provide current income, consistent with an ultra-short duration profile, focused on preservation of capital.
U.S. Multi-Sector Income ETF — To provide a high level of current income. The secondary objective is to provide capital appreciation.
2. Significant accounting policies
Each fund is an investment company that applies the accounting and reporting guidance issued in Topic 946 by the U.S. Financial Accounting Standards Board. Each fund’s financial statements have been prepared to comply with U.S. generally accepted accounting principles (“U.S. GAAP”). These principles require the funds’ investment adviser to make estimates and assumptions that affect reported amounts and disclosures. Actual results could differ from those estimates. Subsequent events, if any, have been evaluated through the date of issuance in the preparation of the financial statements. The funds follow the significant accounting policies described in this section, as well as the valuation policies described in the next section on valuation.
Security transactions and related investment income — Security transactions are recorded by the funds as of the date the trades are executed with brokers. Realized gains and losses from security transactions are determined based on the specific identified cost of the securities. In the event a security is purchased with a delayed payment date, the funds will segregate liquid assets sufficient to meet their payment obligations. Dividend income is recognized on the ex-dividend date and interest income is recognized on an accrual basis. Market discounts, premiums and original issue discounts on fixed-income securities are amortized daily over the expected life of the security.
Distributions paid to shareholders — Income dividends and capital gain distributions are recorded on each fund’s ex-dividend date.
125 | Capital Group Fixed Income ETF Trust |
Currency translation — Assets and liabilities, including investment securities, denominated in currencies other than U.S. dollars are translated into U.S. dollars at the exchange rates supplied by one or more pricing vendors on the valuation date. Purchases and sales of investment securities and income and expenses are translated into U.S. dollars at the exchange rates on the dates of such transactions. The effects of changes in exchange rates on investment securities are included with the net realized gain or loss and net unrealized appreciation or depreciation on investments in each fund’s statement of operations. The realized gain or loss and unrealized appreciation or depreciation resulting from all other transactions denominated in currencies other than U.S. dollars are disclosed separately.
3. Valuation
Capital Research and Management Company (“CRMC”), the funds’ investment adviser, values each fund’s investments at fair value as defined by U.S. GAAP. The net asset value per share of each fund is calculated once daily as of the close of regular trading on the New York Stock Exchange, normally 4 p.m. New York time, each day the New York Stock Exchange is open.
Methods and inputs — The funds’ investment adviser uses the following methods and inputs to establish the fair value of each fund’s assets and liabilities. Use of particular methods and inputs may vary over time based on availability and relevance as market and economic conditions evolve.
Equity securities, including depositary receipts, are generally valued at the official closing price of, or the last reported sale price on, the exchange or market on which such securities are traded, as of the close of business on the day the securities are being valued or, lacking any sales, at the last available bid price. Prices for each security are taken from the principal exchange or market on which the security trades.
Fixed-income securities, including short-term securities, are generally valued at evaluated prices obtained from third-party pricing vendors. Vendors value such securities based on one or more of the inputs described in the following table. The table provides examples of inputs that are commonly relevant for valuing particular classes of fixed-income securities in which the funds are authorized to invest. However, these classifications are not exclusive, and any of the inputs may be used to value any other class of fixed-income security.
Fixed-income class | Examples of standard inputs |
All | Benchmark yields, transactions, bids, offers, quotations from dealers and trading systems, new issues, spreads and other relationships observed in the markets among comparable securities; and proprietary pricing models such as yield measures calculated using factors such as cash flows, financial or collateral performance and other reference data (collectively referred to as “standard inputs”) |
Corporate bonds, notes & loans; convertible securities | Standard inputs and underlying equity of the issuer |
Bonds & notes of governments & government agencies | Standard inputs and interest rate volatilities |
Mortgage-backed; asset-backed obligations | Standard inputs and cash flows, prepayment information, default rates, delinquency and loss assumptions, collateral characteristics, credit enhancements and specific deal information |
Municipal securities | Standard inputs and, for certain distressed securities, cash flows or liquidation values using a net present value calculation based on inputs that include, but are not limited to, financial statements and debt contracts |
Securities with both fixed-income and equity characteristics, or equity securities traded principally among fixed-income dealers, are generally valued in the manner described for either equity or fixed-income securities, depending on which method is deemed most appropriate by each funds’ investment adviser. The Capital Group Central Cash Fund (“CCF”), a fund within the Capital Group Central Fund Series (“Central Funds“), is valued based upon a floating net asset value, which fluctuates with changes in the value of CCF’s portfolio securities. The underlying securities are valued based on the policies and procedures in CCF’s statement of additional information. Exchange-traded options and futures are generally valued at the official closing price for options and official settlement price for futures of the exchange or market on which such instruments are traded, as of the close of business on the day such instruments are being valued. Forward currency contracts are valued based on the spot and forward exchange rates obtained from a third-party pricing vendor. Swaps are generally valued using evaluated prices obtained from third-party pricing vendors who calculate these values based on market inputs that may include the yields of the indices referenced in the instrument and the relevant curve, dealer quotes, default probabilities and recovery rates, other reference data, and terms of the contract.
Capital Group Fixed Income ETF Trust | 126 |
Securities and other assets for which representative market quotations are not readily available or are considered unreliable by each funds’ investment adviser are fair valued as determined in good faith under fair valuation guidelines adopted by each funds’ investment adviser and approved by the board of trustees as further described. The investment adviser follows fair valuation guidelines, consistent with U.S. Securities and Exchange Commission rules and guidance, to consider relevant principles and factors when making fair value determinations. The investment adviser considers relevant indications of value that are reasonably and timely available to it in determining the fair value to be assigned to a particular security, such as the type and cost of the security, restrictions on resale of the security, relevant financial or business developments of the issuer, actively traded similar or related securities, dealer or broker quotes, conversion or exchange rights on the security, related corporate actions, significant events occurring after the close of trading in the security, and changes in overall market conditions. In addition, the closing prices of equity securities that trade in markets outside U.S. time zones may be adjusted to reflect significant events that occur after the close of local trading but before the net asset value of each fund is determined. Fair valuations of investments that are not actively trading involve judgment and may differ materially from valuations that would have been used had greater market activity occurred.
Processes and structure — Each fund’s board of trustees has designated each funds’ investment adviser to make fair value determinations, subject to board oversight. The investment adviser has established a Joint Fair Valuation Committee (the “Committee”) to administer, implement and oversee the fair valuation process and to make fair value decisions. The Committee regularly reviews its own fair value decisions, as well as decisions made under its standing instructions to the investment adviser’s valuation team. The Committee reviews changes in fair value measurements from period to period, pricing vendor information and market data, and may, as deemed appropriate, update the fair valuation guidelines to better reflect the results of back testing and address new or evolving issues. Pricing decisions, processes and controls over security valuation are also subject to additional internal reviews facilitated by the investment adviser’s global risk management group. The Committee reports changes to the fair valuation guidelines to the board of trustees. Each fund’s board and audit committee also regularly review reports that describe fair value determinations and methods.
Classifications — Each funds’ investment adviser classifies each fund’s assets and liabilities into three levels based on the inputs used to value the assets or liabilities. Level 1 values are based on quoted prices in active markets for identical securities. Level 2 values are based on significant observable market inputs, such as quoted prices for similar securities and quoted prices in inactive markets. Certain securities trading outside the U.S. may transfer between Level 1 and Level 2 due to valuation adjustments resulting from significant market movements following the close of local trading. Level 3 values are based on significant unobservable inputs that reflect the investment adviser’s determination of assumptions that market participants might reasonably use in valuing the securities. The valuation levels are not necessarily an indication of the risk or liquidity associated with the underlying investment. For example, U.S. government securities are reflected as Level 2 because the inputs used to determine fair value may not always be quoted prices in an active market. The following tables present each funds’ valuation levels as of June 30, 2024 (dollars in thousands):
Core Bond ETF
Investment securities | ||||
Level 1 | Level 2 | Level 3 | Total | |
Assets: | ||||
Bonds, notes & other debt instruments: | ||||
Mortgage-backed obligations | $— | $272,170 | $— | $272,170 |
Corporate bonds, notes & loans | — | 220,006 | — | 220,006 |
U.S. Treasury bonds & notes | — | 93,446 | — | 93,446 |
Asset-backed obligations | — | 54,818 | — | 54,818 |
Municipals | — | 712 | — | 712 |
Short-term securities | 164,843 | — | — | 164,843 |
Total | $164,843 | $641,152 | $— | $805,995 |
Other investments* | ||||
Level 1 | Level 2 | Level 3 | Total | |
Assets: | ||||
Unrealized appreciation on futures contracts | $371 | $— | $— | $371 |
Liabilities: | ||||
Unrealized depreciation on futures contracts | (18 ) | — | — | (18 ) |
Unrealized depreciation on centrally cleared credit default swaps | — | (36 ) | — | (36 ) |
Total | $353 | $(36 ) | $— | $317 |
* | Futures contracts and credit default swaps are not included in the investment portfolio. |
127 | Capital Group Fixed Income ETF Trust |
Core Plus Income ETF
Investment securities | ||||
Level 1 | Level 2 | Level 3 | Total | |
Assets: | ||||
Bonds, notes & other debt instruments: | ||||
Mortgage-backed obligations | $— | $1,055,827 | $— | $1,055,827 |
Corporate bonds, notes & loans | — | 791,574 | 3,456 | 795,030 |
U.S. Treasury bonds & notes | — | 404,858 | — | 404,858 |
Asset-backed obligations | — | 166,712 | 3,997 | 170,709 |
Bonds & notes of governments & government agencies outside the U.S. | — | 47,563 | — | 47,563 |
Municipals | — | 4,939 | — | 4,939 |
Common stocks | — | — | 131 | 131 |
Short-term securities | 479,058 | — | — | 479,058 |
Total | $479,058 | $2,471,473 | $7,584 | $2,958,115 |
Other investments* | ||||
Level 1 | Level 2 | Level 3 | Total | |
Assets: | ||||
Unrealized appreciation on futures contracts | $2,581 | $— | $— | $2,581 |
Unrealized appreciation on open forward currency contracts | — | 8 | — | 8 |
Unrealized appreciation on centrally cleared interest rate swaps | — | 7,754 | — | 7,754 |
Unrealized appreciation on bilateral interest rate swaps | — | 64 | — | 64 |
Liabilities: | ||||
Unrealized depreciation on futures contracts | (1,227 ) | — | — | (1,227 ) |
Unrealized depreciation on open forward currency contracts | — | (5 ) | — | (5 ) |
Unrealized depreciation on centrally cleared interest rate swaps | — | (331 ) | — | (331 ) |
Total | $1,354 | $7,490 | $— | $8,844 |
* | Futures contracts, forward currency contracts and interest rate swaps are not included in the investment portfolio. |
International Bond ETF (USD-Hedged)
Investment securities | ||||
Level 1 | Level 2 | Level 3 | Total | |
Assets: | ||||
Bonds, notes & other debt instruments: | ||||
Euros | $— | $14,459 | $— | $14,459 |
Japanese yen | — | 6,396 | — | 6,396 |
South Korean won | — | 3,725 | — | 3,725 |
British pounds | — | 3,602 | — | 3,602 |
Australian dollars | — | 2,103 | — | 2,103 |
Brazilian reais | — | 1,609 | — | 1,609 |
Canadian dollars | — | 1,517 | — | 1,517 |
Mexican pesos | — | 1,263 | — | 1,263 |
Malaysian ringgits | — | 671 | — | 671 |
Indonesian rupiah | — | 532 | — | 532 |
New Zealand dollars | — | 427 | — | 427 |
Polish zloty | — | 382 | — | 382 |
Thai baht | — | 363 | — | 363 |
Singapore dollars | — | 314 | — | 314 |
Indian rupees | — | 191 | — | 191 |
Turkish lira | — | 49 | — | 49 |
U.S. dollars | — | 6,985 | — | 6,985 |
Short-term securities | 6,014 | 2,123 | — | 8,137 |
Total | $6,014 | $46,711 | $— | $52,725 |
Capital Group Fixed Income ETF Trust | 128 |
Other investments* | ||||
Level 1 | Level 2 | Level 3 | Total | |
Assets: | ||||
Unrealized appreciation on futures contracts | $64 | $— | $— | $64 |
Unrealized appreciation on open forward currency contracts | — | 148 | — | 148 |
Liabilities: | ||||
Unrealized depreciation on futures contracts | (45 ) | — | — | (45 ) |
Unrealized depreciation on open forward currency contracts | — | (40 ) | — | (40 ) |
Unrealized depreciation on centrally cleared credit default swaps | — | — | — † | — |
Total | $19 | $108 | $— | $127 |
* | Futures contracts, forward currency contracts and credit default swaps are not included in the investment portfolio. |
† | Amount less than one thousand. |
Municipal Income ETF
Investment securities | ||||
Level 1 | Level 2 | Level 3 | Total | |
Assets: | ||||
Bonds, notes & other debt instruments: | ||||
Texas | $— | $96,262 | $— | $96,262 |
California | — | 63,905 | — | 63,905 |
New York | — | 60,091 | — | 60,091 |
Illinois | — | 47,644 | — | 47,644 |
Alabama | — | 32,255 | — | 32,255 |
Pennsylvania | — | 28,731 | — | 28,731 |
Washington | — | 27,474 | — | 27,474 |
Florida | — | 23,223 | — | 23,223 |
Arizona | — | 21,138 | — | 21,138 |
New Jersey | — | 20,246 | — | 20,246 |
Other | — | 326,928 | — | 326,928 |
Short-term securities | — | 39,641 | — | 39,641 |
Total | $— | $787,538 | $— | $787,538 |
Other investments* | ||||
Level 1 | Level 2 | Level 3 | Total | |
Assets: | ||||
Unrealized appreciation on futures contracts | $113 | $— | $— | $113 |
Liabilities: | ||||
Unrealized depreciation on futures contracts | (156 ) | — | — | (156 ) |
Total | $(43 ) | $— | $— | $(43 ) |
* | Futures contracts are not included in the investment portfolio. |
129 | Capital Group Fixed Income ETF Trust |
Municipal High-Income ETF
Investment securities | ||||
Level 1 | Level 2 | Level 3 | Total | |
Assets: | ||||
Bonds, notes & other debt instruments: | ||||
Wisconsin | $— | $2,052 | $— | $2,052 |
Texas | — | 2,049 | — | 2,049 |
Alabama | — | 1,900 | — | 1,900 |
New York | — | 1,699 | — | 1,699 |
California | — | 1,679 | — | 1,679 |
Puerto Rico | — | 1,375 | — | 1,375 |
Indiana | — | 1,129 | — | 1,129 |
Illinois | — | 991 | — | 991 |
Ohio | — | 709 | — | 709 |
Georgia | — | 531 | — | 531 |
Other | — | 2,122 | — | 2,122 |
Short-term securities | — | 8,850 | — | 8,850 |
Total | $— | $25,086 | $— | $25,086 |
Other investments* | ||||
Level 1 | Level 2 | Level 3 | Total | |
Liabilities: | ||||
Unrealized depreciation on futures contracts | $(1 ) | $— | $— | $(1 ) |
Total | $(1 ) | $— | $— | $(1 ) |
* | Futures contracts are not included in the investment portfolio. |
Short Duration Income ETF
Investment securities | ||||
Level 1 | Level 2 | Level 3 | Total | |
Assets: | ||||
Bonds, notes & other debt instruments: | ||||
Corporate bonds, notes & loans | $— | $215,297 | $— | $215,297 |
Mortgage-backed obligations | — | 182,283 | — | 182,283 |
Asset-backed obligations | — | 147,713 | — | 147,713 |
Bonds & notes of governments & government agencies outside the U.S. | — | 1,503 | — | 1,503 |
Short-term securities | 52,386 | — | — | 52,386 |
Total | $52,386 | $546,796 | $— | $599,182 |
Other investments* | ||||
Level 1 | Level 2 | Level 3 | Total | |
Assets: | ||||
Unrealized appreciation on futures contracts | $478 | $— | $— | $478 |
Liabilities: | ||||
Unrealized depreciation on futures contracts | (164 ) | — | — | (164 ) |
Total | $314 | $— | $— | $314 |
* | Futures contract are not included in the investment portfolio. |
Capital Group Fixed Income ETF Trust | 130 |
Short Duration Municipal Income ETF
Investment securities | ||||
Level 1 | Level 2 | Level 3 | Total | |
Assets: | ||||
Bonds, notes & other debt instruments: | ||||
Texas | $— | $6,990 | $— | $6,990 |
California | — | 4,566 | — | 4,566 |
Pennsylvania | — | 3,825 | — | 3,825 |
Virginia | — | 3,609 | — | 3,609 |
Tennessee | — | 2,184 | — | 2,184 |
Florida | — | 2,119 | — | 2,119 |
Iowa | — | 1,885 | — | 1,885 |
New York | — | 1,789 | — | 1,789 |
Illinois | — | 1,515 | — | 1,515 |
Colorado | — | 1,509 | — | 1,509 |
Other | — | 20,890 | — | 20,890 |
Short-term securities | — | 3,550 | — | 3,550 |
Total | $— | $54,431 | $— | $54,431 |
Other investments* | ||||
Level 1 | Level 2 | Level 3 | Total | |
Assets: | ||||
Unrealized appreciation on futures contracts | $9 | $— | $— | $9 |
Liabilities: | ||||
Unrealized depreciation on futures contracts | (3 ) | — | — | (3 ) |
Total | $6 | $— | $— | $6 |
* | Futures contracts are not included in the investment portfolio. |
Ultra Short Income ETF
As of June 30, 2024, all of the fund’s investments were classified as Level 2.
U.S. Multi-Sector Income ETF
Investment securities | ||||
Level 1 | Level 2 | Level 3 | Total | |
Assets: | ||||
Bonds, notes & other debt instruments: | ||||
Corporate bonds, notes & loans | $— | $640,928 | $1,928 | $642,856 |
Mortgage-backed obligations | — | 119,658 | — | 119,658 |
Asset-backed obligations | — | 75,820 | 1,008 | 76,828 |
U.S. Treasury bonds & notes | — | 13,624 | — | 13,624 |
Municipals | — | 1,711 | — | 1,711 |
Common stocks | 119 | — | 157 | 276 |
Short-term securities | 34,993 | — | — | 34,993 |
Options purchased on futures (equity style) | 217 | — | — | 217 |
Total | $35,329 | $851,741 | $3,093 | $890,163 |
131 | Capital Group Fixed Income ETF Trust |
Other investments* | ||||
Level 1 | Level 2 | Level 3 | Total | |
Assets: | ||||
Unrealized appreciation on futures contracts | $529 | $— | $— | $529 |
Unrealized appreciation on open forward currency contracts | — | 5 | — | 5 |
Unrealized appreciation on centrally cleared interest rate swaps | — | 6,431 | — | 6,431 |
Liabilities: | ||||
Value of options written | (77 ) | — | — | (77 ) |
Unrealized depreciation on futures contracts | (490 ) | — | — | (490 ) |
Unrealized depreciation on open forward currency contracts | — | (1 ) | — | (1 ) |
Unrealized depreciation on centrally cleared interest rate swaps | — | (51 ) | — | (51 ) |
Unrealized depreciation on centrally cleared credit default swaps | — | (24 ) | — | (24 ) |
Total | $(38 ) | $6,360 | $— | $6,322 |
* | Options written, futures contracts, forward currency contracts, interest rate swaps and credit default swaps are not included in the investment portfolio. |
4. Risk factors
Investing in each fund may involve certain risks including, but not limited to, those described below (as applicable).
Market conditions — The prices of, and the income generated by, the securities held by a fund may decline due to various factors, including events or conditions affecting the general economy or particular industries or companies; overall market changes; local, regional or global political, social or economic instability; governmental, governmental agency or central bank responses to economic conditions; changes in inflation rates; and currency exchange rate, interest rate and commodity price fluctuations.
Economies and financial markets throughout the world are highly interconnected. Events (including public health emergencies, such as the spread of infectious disease), bank failures and other circumstances in one country or region could have impacts on global economies or markets. As a result, whether or not a fund invests in securities of issuers located in or with significant exposure to the countries affected, the value and liquidity of a fund’s investments may be negatively affected by developments in other countries and regions.
Issuer risks — The prices of, and the income generated by, securities held by a fund may decline in response to various factors directly related to the issuers of such securities, including reduced demand for an issuer’s goods or services, poor management performance, major litigation, investigations or other controversies related to the issuer, changes in the issuer’s financial condition or credit rating, changes in government regulations affecting the issuer or its competitive environment and strategic initiatives and the market response to any such initiatives. An individual security may also be affected by factors relating to the industry or sector of the issuer or the securities markets as a whole, and conversely an industry or sector or the securities markets may be affected by a change in financial condition or other event affecting a single issuer.
Investing in debt instruments — The prices of, and the income generated by, bonds and other debt securities held by a fund may be affected by factors such as the interest rates, maturities and credit quality of these securities.
Rising interest rates will generally cause the prices of bonds and other debt securities to fall. Also, when interest rates rise, issuers of callable debt securities that may be prepaid at any time, such as mortgage- or other asset-backed securities, are less likely to refinance existing debt securities, causing the average life of such securities to extend. A general change in interest rates may cause investors to sell debt securities on a large scale, which could also adversely affect the price and liquidity of debt securities and could also result in increased redemptions from a fund. Falling interest rates may cause an issuer to redeem, call or refinance a debt security before its stated maturity, which may result in a fund having to reinvest the proceeds in lower yielding securities. Longer maturity debt securities generally have greater sensitivity to changes in interest rates and may be subject to greater price fluctuations than shorter maturity debt securities.
Bonds and other debt securities are also subject to credit risk, which is the possibility that the credit strength of an issuer or guarantor will weaken or be perceived to be weaker, and/or an issuer of a debt security will fail to make timely payments of principal or interest and the security will go into default. Changes in actual or perceived creditworthiness may occur quickly. A downgrade or default affecting any of a fund’s securities could cause the net asset value of a fund’s shares to decrease. Lower quality debt securities generally have higher rates of interest and may be subject to greater price fluctuations than higher quality debt securities.
Capital Group Fixed Income ETF Trust | 132 |
Investing in cash equivalents — Cash equivalents, such as commercial paper, asset-backed commercial paper, short term-bank obligations and corporate bonds and notes that mature or may be redeemed or mature within thirteen months or less, like other fixed income instruments are subject to interest rate risk. However, the short-term nature of a commercial paper investment makes it less susceptible to volatility than many other fixed income securities because interest rate risk typically increases as maturity lengths increase. Commercial paper is often unsecured, but may be supported by letters of credit or other forms of collateral. Maturing commercial paper are usually repaid by the issuer from the proceeds of new commercial paper issuances. As a result, investment in commercial paper is subject to rollover risk, or the risk that the issuer cannot issue enough new commercial paper to satisfy its outstanding commercial paper. As with all fixed income securities, there is a chance that the issuer will default on its short-term obligations and these securities may become illiquid or suffer from reduced liquidity in these or other situations.
Financial services risk — A significant portion of the fund’s portfolio may be comprised of securities issued by companies in the financial services industry. As a result, the fund may be more susceptible to any economic, business, political or other developments which generally affect this industry sector. The profitability of many types of financial companies may be adversely affected in certain market cycles, including during periods of rising interest rates, which may restrict the availability and increase the cost of capital, and declining economic conditions, which may cause credit losses due to financial difficulties of borrowers. Because many types of financial services companies are vulnerable to these economic cycles, the fund’s investments may lose value during such periods.
Currency transactions — In addition to the risks generally associated with investing in derivative instruments, the use of forward currency contracts involves the risk that currency movements will not be accurately predicted by the investment adviser, which could result in losses to the fund. While entering into forward currency contracts could minimize the risk of loss due to a decline in the value of the hedged currency, it could also limit any potential gain that may result from an increase in the value of the currency. Additionally, the adviser may use forward currency contracts to increase exposure to a certain currency or to shift exposure to currency fluctuations from one country to another. Forward currency contracts may expose the fund to potential gains and losses in excess of the initial amount invested.
Currency — The prices of, and the income generated by, many debt securities held by the fund may also be affected by changes in relative currency values. If the U.S. dollar appreciates against foreign currencies, the value in U.S. dollars of the fund’s securities denominated in such currencies would generally fall and vice versa.
Currency hedging risk — The fund’s use of forward currency contracts to hedge all or substantially all of the fund’s foreign currency exposure could result in losses to the fund if currencies do not perform as expected. In addition, the reduction of the fund’s exposure to currency risks limits the fund’s ability to benefit from favorable changes in currency exchange rates. Currency markets generally are not as regulated as securities markets, and currency rates may experience volatility, which can reduce the fund’s returns.The fund’s use of forward currency contracts to hedge all or substantially all of the fund’s foreign currency exposure is intended to minimize the impact of currency fluctuations on fund returns; however, this strategy will not eliminate the fund’s exposure to currency risk. The use of forward currency contracts will not entirely offset the fluctuations between the fund’s exposure to non-U.S. currencies and the U.S. dollar. Additionally, there are transaction costs the fund will incur to hedge its foreign currency exposure. The fund’s exposure to foreign currencies may not be hedged at all times, including at times when the fund is implementing a currency hedging transaction. Volatility of the U.S. dollar relative to the currencies being hedged will generally reduce the effectiveness of the fund’s currency hedging transactions. Differences between U.S. dollar interest rates and foreign currency interest rates may also impact the effectiveness of the fund’s currency hedging transactions.
Liquidity risk — Certain fund holdings may be or may become difficult or impossible to sell, particularly during times of market turmoil. Liquidity may be impacted by the lack of an active market for a holding, legal or contractual restrictions on resale, or the reduced number and capacity of market participants to make a market in such holding. Market prices for less liquid or illiquid holdings may be volatile or difficult to determine, and reduced liquidity may have an adverse impact on the market price of such holdings. Additionally, the sale of less liquid or illiquid holdings may involve substantial delays (including delays in settlement) and additional costs and a fund may be unable to sell such holdings when necessary to meet its liquidity needs or to try to limit losses, or may be forced to sell at a loss. Depending on market conditions, reduced liquidity of fund holdings may also cause a fund’s shares to trade in the market at wider bid-ask spreads or greater premiums or discounts to the fund’s NAV.
Credit and liquidity support — Changes in the credit quality of banks and financial institutions providing credit and liquidity support features with respect to securities held by a fund could cause the values of these securities to decline.
133 | Capital Group Fixed Income ETF Trust |
Investing in lower rated debt instruments — Lower rated bonds and other lower rated debt securities generally have higher rates of interest and involve greater risk of default or price declines due to changes in the issuer’s creditworthiness than those of higher quality debt securities. The market prices of these securities may fluctuate more than the prices of higher quality debt securities and may decline significantly in periods of general economic difficulty. These risks may be increased with respect to investments in junk bonds.
Investing in mortgage-related and other asset-backed securities — Mortgage-related securities, such as mortgage-backed securities, and other asset-backed securities, include debt obligations that represent interests in pools of mortgages or other income-bearing assets, such as consumer loans or receivables. While such securities are subject to the risks associated with investments in debt instruments generally (for example, credit, extension and interest rate risks), they are also subject to other and different risks. Mortgage-backed and other asset-backed securities are subject to changes in the payment patterns of borrowers of the underlying debt, potentially increasing the volatility of the securities and a fund’s net asset value. When interest rates fall, borrowers are more likely to refinance or prepay their debt before its stated maturity. This may result in a fund having to reinvest the proceeds in lower yielding securities, effectively reducing a fund’s income. Conversely, if interest rates rise and borrowers repay their debt more slowly than expected, the time in which the mortgage-backed and other asset-backed securities are paid off could be extended, reducing a fund’s cash available for reinvestment in higher yielding securities. Mortgage-backed securities are also subject to the risk that underlying borrowers will be unable to meet their obligations and the value of property that secures the mortgages may decline in value and be insufficient, upon foreclosure, to repay the associated loans. Investments in asset-backed securities are subject to similar risks.
Investing in debt securities of sovereign, quasi-sovereign and supranational entities — While debt securities of sovereign, quasi-sovereign and supranational entities are subject to the risks associated with investments in debt instruments or foreign securities generally, they are also subject to other and different risks. A governmental or quasi-governmental entity may be unwilling or unable to pay interest and repay principal on its sovereign or quasi-sovereign debt, or otherwise meet its obligations when due, including for reasons such as the government’s policy towards principal international lenders such as the International Monetary Fund or the political considerations to which the government may be subject. If such issuers default (or threaten to default), the indebtedness may be restructured and/or a moratorium on the payments of such indebtedness may be declared, in each case, without the approval of some or all debt holders. In the event of a default on sovereign or quasi-sovereign debt, the fund may also have limited legal recourse against the defaulting government entity.
A “supranational entity” is an entity established or financially supported by the governments of several countries to promote reconstruction, economic development or trade (for example, the World Bank). Generally, the governmental members of these entities make initial capital contributions to and may also commit to making additional contributions if the supranational entity is unable to repay its borrowings. There is no guarantee that one or more governmental members of a supranational entity will continue to make any necessary additional capital contributions, and if such contributions are not made, the entity may be unable to pay interest or repay principal on its debt securities.
Investing in securities backed by the U.S. government — Securities backed by the U.S. Treasury or the full faith and credit of the U.S. government are guaranteed only as to the timely payment of interest and principal when held to maturity. Accordingly, the current market values for these securities will fluctuate with changes in interest rates and the credit rating of the U.S. government. Notwithstanding that these securities are backed by the full faith and credit of the U.S. government, circumstances could arise that would prevent or delay the payment of interest or principal on these securities, which could adversely affect their value and cause the fund to suffer losses. Such an event could lead to significant disruptions in U.S. and global markets. Securities issued by U.S. government-sponsored entities and federal agencies and instrumentalities that are not backed by the full faith and credit of the U.S. government are neither issued nor guaranteed by the U.S. government. U.S. government securities are subject to market risk, interest rate risk and credit risk.
Investing in inflation-linked bonds — The values of inflation-linked bonds generally fluctuate in response to changes in real interest rates —i.e., rates of interest after factoring in inflation. A rise in real interest rates may cause the prices of inflation-linked securities to fall, while a decline in real interest rates may cause the prices to increase. Inflation-linked bonds may experience greater losses than other debt securities with similar durations when real interest rates rise faster than nominal interest rates. There can be no assurance that the value of an inflation-linked security will be directly correlated to changes in interest rates; for example, if interest rates rise for reasons other than inflation, the increase may not be reflected in the security’s inflation measure. Investing in inflation-linked bonds may also reduce a fund’s distributable income during periods of deflation. If prices for goods and services decline throughout the economy, the principal and income on inflation-linked securities may decline and result in losses to a fund.
Capital Group Fixed Income ETF Trust | 134 |
Investing in future delivery contracts — A fund may enter into contracts, such as to-be-announced contracts and mortgage dollar rolls, that involve the fund selling mortgage-related securities and simultaneously contracting to repurchase similar securities for delivery at a future date at a predetermined price. This can increase a fund’s market exposure, and the market price of the securities that a fund contracts to repurchase could drop below their purchase price. While a fund can preserve and generate capital through the use of such contracts by, for example, realizing the difference between the sale price and the future purchase price, the income generated by the fund may be reduced by engaging in such transactions. In addition, these transactions increase the turnover rate of a fund.
Investing in futures contracts — In addition to the risks generally associated with investing in derivative instruments, futures contracts are subject to the creditworthiness of the clearing organizations, exchanges and futures commission merchants with which the fund transacts. Additionally, although futures require only a small initial investment in the form of a deposit of initial margin, the amount of a potential loss on a futures contract could greatly exceed the initial amount invested. While futures contracts are generally liquid instruments, under certain market conditions futures may be deemed to be illiquid. For example, a fund may be temporarily prohibited from closing out its position in a futures contract if intraday price change limits or limits on trading volume imposed by the applicable futures exchange are triggered. If a fund is unable to close out a position on a futures contract, the fund would remain subject to the risk of adverse price movements until the fund is able to close out the futures position. The ability of a fund to successfully utilize futures contracts may depend in part upon the ability of the fund’s investment adviser to accurately forecast interest rates and other economic factors and to assess and predict the impact of such economic factors on the futures in which the fund invests. If the investment adviser incorrectly forecasts economic developments or incorrectly predicts the impact of such developments on the futures in which it invests, the fund could suffer losses.
Investing in derivatives — The use of derivatives involves a variety of risks, which may be different from, or greater than, the risks associated with investing in traditional securities, such as stocks and bonds. Changes in the value of a derivative may not correlate perfectly with, and may be more sensitive to market events than, the underlying asset, rate or index, and a derivative instrument may cause a fund to lose significantly more than its initial investment. Derivatives may be difficult to value, difficult for a fund to buy or sell at an opportune time or price and difficult, or even impossible, to terminate or otherwise offset. A fund’s use of derivatives may result in losses to the fund, and investing in derivatives may reduce the fund’s returns and increase the fund’s price volatility. A fund’s counterparty to a derivative transaction (including, if applicable, the fund’s clearing broker, the derivatives exchange or the clearinghouse) may be unable or unwilling to honor its financial obligations in respect of the transaction. In certain cases, a fund may be hindered or delayed in exercising remedies against or closing out derivative instruments with a counterparty, which may result in additional losses. Derivatives are also subject to operational risk (such as documentation issues, settlement issues and systems failures) and legal risk (such as insufficient documentation, insufficient capacity or authority of a counterparty, and issues with the legality or enforceability of a contract).
Exposure to country, region, industry or sector — Subject to each fund’s investment limitations, a fund may have significant exposure to a particular country, region, industry or sector. Such exposure may cause the fund to be more impacted by risks relating to and developments affecting the country, region, industry or sector, and thus its net asset value may be more volatile, than a fund without such levels of exposure. For example, if a fund has significant exposure in a particular country, then social, economic, regulatory or other issues that negatively affect that country may have a greater impact on the fund than on a fund that is more geographically diversified.
Investing outside the U.S. — Securities of issuers domiciled outside the U.S. or with significant operations or revenues outside the U.S., and securities tied economically to countries outside the U.S. may lose value because of adverse political, social, economic or market developments in the countries or regions in which the issuers are domiciled, operate or generate revenue or to which the securities are tied economically. These securities may also lose value due to changes in foreign currency exchange rates against the U.S. dollar and/or currencies of other countries. Issuers of these securities may be more susceptible to actions of foreign governments, which could adversely impact the value of these securities. Securities markets in certain countries may be more volatile and/or less liquid than those in the U.S. Investments outside the U.S. may also be subject to different accounting practices and different regulatory, legal, auditing, financial reporting and recordkeeping standards and practices, and may be more difficult to value, than those in the U.S. In addition, the value of investments outside the U.S. may be reduced by foreign taxes. Further, there may be increased risks of delayed settlement of securities purchased or sold by a fund, which could impact the liquidity of the fund’s portfolio.
135 | Capital Group Fixed Income ETF Trust |
Investing in emerging markets — Investing in emerging markets may involve risks in addition to and greater than those generally associated with investing in the securities markets of developed countries. For instance, emerging market countries tend to have less developed political, economic and legal systems than those in developed countries. Accordingly, the governments of these countries may be less stable and more likely to intervene in the market economy in a manner that could adversely affect the prices of securities. Information regarding issuers in emerging markets may be limited, incomplete or inaccurate, and such issuers may not be subject to regulatory, accounting, auditing, and financial reporting and recordkeeping standards comparable to those to which issuers in more developed markets are subject. A fund’s rights with respect to its investments in emerging markets, if any, will generally be governed by local law, which may make it difficult or impossible for a fund to pursue legal remedies or to obtain and enforce judgments in local courts. In addition, the economies of these countries may be dependent on relatively few industries, may have limited access to capital and may be more susceptible to changes in local and global trade conditions and downturns in the world economy. Securities markets in these countries can also be relatively small and have substantially lower trading volumes. As a result, securities issued in these countries may be more volatile and less liquid, more vulnerable to market manipulation, and more difficult to value, than securities issued in countries with more developed economies and/or markets. Less certainty with respect to security valuations may lead to additional challenges and risks in calculating a fund’s net asset value. Additionally, emerging markets are more likely to experience problems with the clearing and settling of trades and the holding of securities by banks, agents and depositories that are less established than those in developed countries.
Investing in municipal securities — Municipal securities are debt obligations that are exempt from federal, state and/or local income taxes. The yield and/or value of a fund’s investments in municipal securities may be adversely affected by events tied to the municipal securities markets, which can be very volatile and significantly impacted by unfavorable legislative or political developments and negative changes in the financial conditions of municipal securities issuers and the economy. To the extent a fund invests in obligations of a municipal issuer, the volatility, credit quality and performance of a fund may be adversely impacted by local political and economic conditions of the issuer. For example, a credit rating downgrade, bond default or bankruptcy involving an issuer within a particular state or territory could affect the market values and marketability of many or all municipal obligations of that state or territory. Income from municipal securities held by a fund could also be declared taxable because of changes in tax laws or interpretations by taxing authorities or as a result of noncompliant conduct of a municipal issuer. Additionally, the relative amount of publicly available information about municipal securities is generally less than that for corporate securities.
Investing in similar municipal bonds — Investing significantly in municipal obligations of multiple issuers in the same state or backed by revenues of similar types of projects or industries may make a fund more susceptible to certain economic, political or regulatory occurrences. As a result, a fund has greater risk of volatility, and greater risk of loss, from these investments.
Insured municipal bonds – A fund may invest in municipal bonds that are insured generally as to the timely payment of interest and repayment of principal. Insurance that covers a municipal bond does not guarantee the market value of the bond or the prices of a fund’s shares. Market conditions or changes to ratings criteria could adversely impact the ratings of municipal bond insurers. If the credit rating of the insurer were downgraded or withdrawn by rating agencies, this could have an adverse effect upon the credit rating of the insured bond and, therefore, its market value, despite the quality of the underlying issuer.
Alternative minimum tax — A fund may invest in securities that may be subject to federal alternative minimum tax. Therefore, while a fund’s distributions from tax-exempt securities are not subject to regular federal income tax, a portion or all of the distributions may be included in determining a shareholder’s federal alternative minimum tax.
Interest rate risk — The values and liquidity of the securities held by a fund may be affected by changing interest rates. For example, the values of these securities may decline when interest rates rise and increase when interest rates fall. Longer maturity debt securities generally have greater sensitivity to changes in interest rates and may be subject to greater price fluctuations than shorter maturity debt securities. A fund may invest in variable and floating rate securities. When a fund holds variable or floating rate securities, a decrease in market interest rates will adversely affect the income received from such securities and the net asset value of the fund’s shares. Although the values of such securities are generally less sensitive to interest rate changes than those of other debt securities, the value of variable and floating rate securities may decline if their interest rates do not rise as quickly, or as much, as market interest rates. Conversely, floating rate securities will not generally increase in value if interest rates decline. During periods of extremely low short-term interest rates, a fund may not be able to maintain a positive yield or total return and, in relatively low interest rate environments, there are heightened risks associated with rising interest rates.
Capital Group Fixed Income ETF Trust | 136 |
Portfolio turnover — A fund may engage in frequent and active trading of its portfolio securities. Higher portfolio turnover may involve correspondingly greater transaction costs in the form of dealer spreads, brokerage commissions and other transaction costs on the sale of securities and on reinvestment in other securities. The sale of portfolio securities may also result in the realization of net capital gains, which are taxable when distributed to shareholders, unless the shareholder is exempt from taxation or the shareholder’s account is tax-favored. These costs and tax effects may adversely affect a fund’s returns to shareholders. A fund’s portfolio turnover rate may vary from year to year, as well as within a year.
Market trading — The funds’ shares are listed for trading on an exchange and are bought and sold on the secondary market at market prices. The market prices of fund shares are expected to fluctuate, in some cases materially, in response to changes in a fund’s net asset value (“NAV”), the intraday value of a fund’s holdings, and supply and demand for a fund’s shares. The existence of significant market volatility, disruptions to creations and redemptions, or potential lack of an active trading market for fund shares and/or for the holdings of a fund (including through a trading halt), among other factors, may result in the shares trading significantly above (at a premium) or below (at a discount) to the fund’s NAV and bid-ask spreads may widen. A bid-ask spread is the “spread” or difference between what investors are willing to pay for fund shares (the “bid” price) and the price at which the investors are willing to sell fund shares (the “ask” price). Purchasing a fund’s shares when its market price is at a premium or selling a fund’s shares when its market price is at a discount, may result in paying more than, or receiving less than, NAV, respectively.
Foreign securities held by a fund may be traded in markets that close at a different time than the exchange on which the fund’s shares are listed. Liquidity in those securities may be reduced after the applicable closing times. Accordingly, during the time when a fund’s exchange is open but after the applicable market closing, fixing or settlement times, bid-ask spreads on the fund’s exchange and the corresponding premium or discount to the fund’s NAV may widen.
Authorized participant concentration — Only authorized participants may engage in creation or redemption transactions directly with a fund, and none of them is obligated to do so. A fund has a limited number of institutions that may act as authorized participants. In addition, to the extent that securities held by the fund are traded outside a collateralized settlement system, authorized participants may be required to post collateral on certain trades on an agency basis (on behalf of other market participants), which only a limited number of authorized participants may be able to do. If authorized participants exit the business or are unable to or elect not to engage in creation or redemption transactions, and no other authorized participant engages in such function, fund shares may trade at a premium or discount to NAV and/or at wider intraday bid-ask spreads and possibly face trading halts or delisting.
Nondiversification — As nondiversified funds, each fund has the ability to invest a larger percentage of its assets in the securities of a smaller number of issuers than a diversified fund. As a result, poor performance by a single issuer could adversely affect fund performance more than if each fund were invested in a larger number of issuers. Each fund’s share price can be expected to fluctuate more than might be the case if the fund were more broadly diversified.
Cash transactions — Each fund currently expects to effect at least part of its creations and redemptions for cash rather than in-kind securities. When a fund effects redemptions partly or wholly for cash, rather than in-kind, the fund may have to sell portfolio securities at inopportune times in order to obtain the cash needed to meet redemption orders. If a fund realizes gains on these sales, the fund generally will be required to recognize a gain it might not otherwise have recognized, or to recognize such gain sooner than would otherwise be required if it were to distribute portfolio securities in-kind. This strategy may cause shareholders to be subject to tax from distributions to which they would not otherwise be subject. The use of cash creations and redemptions may also cause a fund’s shares to trade in the market at wider bid-ask spreads or greater premiums or discounts to the fund’s NAV. As a result of such cash transactions, a fund could incur brokerage costs which, to the extent not offset by transaction fees that are payable by an authorized participant, may reduce the fund’s NAV.
Management — The investment adviser to the funds actively manages the funds’ investments. Consequently, the funds are subject to the risk that the methods and analyses, including models, tools and data, employed by the investment adviser in this process may be flawed or incorrect and may not produce the desired results. This could cause the funds to lose value or their investment results to lag relevant benchmarks or other funds with similar objectives.
5. Certain investment techniques
Index-linked bonds — Some of the funds have invested in index-linked bonds, which are fixed-income securities whose principal value is periodically adjusted to a government price index. Over the life of an index-linked bond, interest is paid on the adjusted principal value. Increases or decreases in the principal value of index-linked bonds are recorded as interest income in the fund’s statement of operations.
137 | Capital Group Fixed Income ETF Trust |
Mortgage dollar rolls — Some of the funds have entered into mortgage dollar roll transactions of TBA securities in which the fund sells a TBA mortgage-backed security to a counterparty and simultaneously enters into an agreement with the same counterparty to buy back a similar TBA security on a specific future date at a predetermined price. Mortgage dollar rolls are accounted for as purchase and sale transactions and may result in an increase to the fund’s portfolio turnover rate. Portfolio turnover rates excluding and including mortgage dollar rolls are presented at the end of the fund’s financial highlights tables.
Loan transactions — Some of the funds have entered into loan transactions in which the fund acquires a loan either through an agent, by assignment from another holder, or as a participation interest in another holder’s portion of a loan. The loan is often administered by a financial institution that acts as agent for the holders of the loan, and the fund may be required to receive approval from the agent and/or borrower prior to the sale of the investment. The loan’s interest rate and maturity date may change based on the terms of the loan, including potential early payments of principal.
Unfunded commitments — Capital Group Core Plus Income ETF and Capital Group U.S. Multi-Sector Income ETF have participated in transactions that involve unfunded commitments, which may obligate each fund to purchase new or additional bonds and/or purchase additional shares of the applicable issuer if certain contingencies are met. As of June 30, 2024, the maximum exposure from these unfunded commitments for Capital Group Core Plus Income ETF was $25,000 and Capital Group U.S. Multi-Sector Income ETF was $27,000, respectively, which would represent less than 0.01% of the net assets of each fund should such commitments become due.
Option contracts — Some of the funds have has entered into option contracts, which give the purchaser of the option, in return for a premium payment, the right to buy from (in the case of a call) or sell to (in the case of a put) the writer of the option the reference instrument underlying the option (or the cash value of the instrument underlying the option) at a specified exercise price. The writer of an option on a security has the obligation, upon exercise of the option, to cash settle or deliver the underlying currency or instrument upon payment of the exercise price (in the case of a call) or to cash settle or take delivery of the underlying currency or instrument and pay the exercise price (in the case of a put).
By purchasing a put option, the fund obtains the right (but not the obligation) to sell the currency or instrument underlying the option (or to deliver the cash value of the instrument underlying the option) at a specified exercise price. In return for this right, the fund pays the current market price, or the option premium, for the option. The fund may terminate its position in a put option by allowing the option to expire or by exercising the option. If the option is allowed to expire, the fund will lose the entire amount of the premium paid. If the option is exercised, the fund completes the sale of the underlying instrument (or cash settles) at the exercise price. The fund may also terminate a put option position by entering into opposing close-out transactions in advance of the option expiration date.
The features of call options are essentially the same as those of put options, except that the purchaser of a call option obtains the right (but not the obligation) to purchase, rather than sell, the underlying currency or instrument (or cash settle) at the specified exercise price. The buyer of a call option typically attempts to participate in potential price increases of the underlying currency or instrument with risk limited to the cost of the option if the price of the underlying currency or instrument falls. At the same time, the call option buyer can expect to suffer a loss if the price of the underlying currency or instrument does not rise sufficiently to offset the cost of the option.
The writer of a put or call option takes the opposite side of the transaction from the option purchaser. In return for receipt of the option premium, the writer assumes the obligation to pay or receive the exercise price for the option’s underlying currency or instrument if the other party to the option chooses to exercise it. The writer may seek to terminate a position in a put option before exercise by entering into opposing close-out transactions in advance of the option expiration date. If the market for the relevant put option is not liquid, however, the writer must be prepared to pay the exercise price while the option is outstanding, regardless of price changes. Writing a call option obligates the writer to, upon exercise of the option, deliver the option’s underlying currency or instrument in return for the exercise price or to make a net cash settlement payment, as applicable. The characteristics of writing call options are similar to those of writing put options, except that writing call options is generally a profitable strategy if prices remain the same or fall. The potential gain for the option seller in such a transaction would be capped at the premium received.
Option contracts can be either equity style (premium is paid in full when the option is opened) or futures style (premium moves as part of variation margin over the life of the option, and is paid in full when the option is closed). For equity style options, premiums paid on options purchased, as well as the daily fluctuation in market value, are included in investment securities in the fund’s statement of asset and liabilities, and premiums received on options written, as well as the daily fluctuation in market value, are included in options written at value in the fund’s statement of assets and liabilities. The net realized gains or losses and net unrealized appreciation or depreciation from equity style options are recorded in investments for purchased options and in options written for written options in the fund’s statement of operations.
Option contracts can take different forms. Some of the funds have has entered into the following types of option contracts:
Capital Group Fixed Income ETF Trust | 138 |
Options on futures — The fund has entered into options on futures contracts to seek to manage the fund’s interest rate sensitivity by increasing or decreasing the duration of the fund or a portion of the fund’s portfolio. An option on a futures contract gives the holder of the option the right to buy or sell a position in a futures contract from or to the writer of the option, at a specified price on or before the specified expiration date.
Futures contracts — Some of the funds have entered into futures contracts, which provide for the future sale by one party and purchase by another party of a specified amount of a specific financial instrument for a specified price, date, time and place designated at the time the contract is made. Futures contracts are used to strategically manage the fund’s interest rate sensitivity by increasing or decreasing the duration of the fund or a portion of the fund’s portfolio.
Upon entering into futures contracts, and to maintain the fund’s open positions in futures contracts, the fund is required to deposit with a futures broker, known as a futures commission merchant (“FCM“), in a segregated account in the name of the FCM an amount of cash, U.S. government securities or other liquid securities, known as initial margin. The margin required for a particular futures contract is set by the exchange on which the contract is traded to serve as collateral, and may be significantly modified from time to time by the exchange during the term of the contract.
On a daily basis, each fund pays or receives variation margin based on the increase or decrease in the value of the futures contracts and records variation margin on futures contracts in the statement of assets and liabilities. Futures contracts may involve a risk of loss in excess of the variation margin shown on the fund’s statement of assets and liabilities. Each fund records realized gains or losses at the time the futures contract is closed or expires. Net realized gains or losses and net unrealized appreciation or depreciation from futures contracts are recorded in the fund’s statement of operations.
Forward currency contracts — Some of the funds have entered into forward currency contracts, which represent agreements to exchange currencies on specific future dates at predetermined rates. The fund’s investment adviser uses forward currency contracts to manage the fund’s exposure to changes in exchange rates. Upon entering into these contracts, risks may arise from the potential inability of counterparties to meet the terms of their contracts and from possible movements in exchange rates.
On a daily basis, the funds’ investment adviser values forward currency contracts and records unrealized appreciation or depreciation for open forward currency contracts in each fund’s statement of assets and liabilities. Realized gains or losses are recorded at the time the forward currency contract is closed or offset by another contract with the same broker for the same settlement date and currency.
Closed forward currency contracts that have not reached their settlement date are included in the respective receivables or payables for closed forward currency contracts in each fund’s statement of assets and liabilities. Net realized gains or losses from closed forward currency contracts and net unrealized appreciation or depreciation from open forward currency contracts are recorded in each fund’s statement of operations.
Swap contracts — Some of the funds have entered into swap agreements, which are two-party contracts entered into primarily by institutional investors for a specified time period. In a typical swap transaction, two parties agree to exchange the returns earned or realized from one or more underlying assets or rates of return. Swap agreements can be traded on a swap execution facility (SEF) and cleared through a central clearinghouse (cleared), traded over-the-counter (OTC) and cleared, or traded bilaterally and not cleared. Because clearing interposes a central clearinghouse as the ultimate counterparty to each participant’s swap, and margin is required to be exchanged under the rules of the clearinghouse, central clearing is intended to decrease (but not eliminate) counterparty risk relative to uncleared bilateral swaps. To the extent the funds enter into bilaterally negotiated swap transactions, the funds will enter into swap agreements only with counterparties that meet certain credit standards and subject to agreed collateralized procedures. The term of a swap can be days, months or years and certain swaps may be less liquid than others.
Upon entering into a centrally cleared swap contract, the funds are required to deposit cash, U.S. government securities or other liquid securities, which is known as initial margin. Generally, the initial margin required for a particular swap is set and held as collateral by the clearinghouse on which the contract is cleared. The amount of initial margin required may be significantly modified from time to time by the clearinghouse during the term of the contract.
On a daily basis, interest accruals related to the exchange of future payments are recorded as a receivable and payable in the funds’ statement of assets and liabilities for centrally cleared swaps and as unrealized appreciation or depreciation in the funds’ statement of assets and liabilities for bilateral swaps. For centrally cleared swaps, the fund also pays or receives a variation margin based on the increase or decrease in the value of the swaps, including accrued interest as applicable, and records variation margin in the statement of assets and liabilities. The funds record realized gains and losses on both the net accrued interest and any gain or loss recognized at the time the swap is closed or expires. Net realized gains or losses, as well as any net unrealized appreciation or depreciation, from swaps are recorded in the fund’s statement of operations.
139 | Capital Group Fixed Income ETF Trust |
Swap agreements can take different forms. Some of the funds have entered into the following types of swap agreements:
Interest rate swaps — Some of the funds have entered into interest rate swaps, which seek to manage the interest rate sensitivity of the fund by increasing or decreasing the duration of the fund or a portion of the funds’ portfolio. An interest rate swap is an agreement between two parties to exchange or swap payments based on changes in an interest rate or rates. Typically, one interest rate is fixed and the other is variable based on a designated short-term interest rate such as the Secured Overnight Financing Rate (SOFR), prime rate or other benchmark. In other types of interest rate swaps, known as basis swaps, the parties agree to swap variable interest rates based on different designated short-term interest rates. Interest rate swaps generally do not involve the delivery of securities or other principal amounts. Rather, cash payments are exchanged by the parties based on the application of the designated interest rates to a notional amount, which is the predetermined dollar principal of the trade upon which payment obligations are computed. Accordingly, the funds’ current obligation or right under the swap agreement is generally equal to the net amount to be paid or received under the swap agreement based on the relative value of the position held by each party.
Credit default swap indices — Some of the funds have entered into centrally cleared credit default swap indices, including CDX and iTraxx indices (collectively referred to as “CDSIs”), in order to assume exposure to a diversified portfolio of credits or to hedge against existing credit risks. A CDSI is based on a portfolio of credit default swaps with similar characteristics, such as credit default swaps on high-yield bonds. In a typical CDSI transaction, one party (the protection buyer) is obligated to pay the other party (the protection seller) a stream of periodic payments over the term of the contract. If a credit event, such as a default or restructuring, occurs with respect to any of the underlying reference obligations, the protection seller must pay the protection buyer the loss on those credits.
The funds may enter into a CDSI transaction as either protection buyer or protection seller. If the funds are protected buyers, they would pay the counterparty a periodic stream of payments over the term of the contract and would not recover any of those payments if no credit events were to occur with respect to any of the underlying reference obligations. However, if a credit event did occur, the funds, as protection buyers, would have the right to deliver the referenced debt obligations or a specified amount of cash, depending on the terms of the applicable agreement, and to receive the par value of such debt obligations from the counterparty protection seller. As protection sellers, the funds would receive fixed payments throughout the term of the contract if no credit events were to occur with respect to any of the underlying reference obligations. If a credit event were to occur, however, the value of any deliverable obligation received by the funds, coupled with the periodic payments previously received by the funds, may be less than the full notional value that the funds, as protection sellers, pays to the counterparty protection buyer, effectively resulting in a loss of value to the funds. Furthermore, as protection sellers, the funds would effectively add leverage to its portfolio because it would have investment exposure to the notional amount of the swap transaction.
Capital Group Fixed Income ETF Trust | 140 |
The following table presents the average month-end notional amounts of options contracts purchased, futures contracts, forward currency contracts, interest rate swaps and credit default swaps while held for each fund (dollars in thousands):
Options on futures | Futures contracts | Forward currency contracts | Interest rate swaps | Credit default swaps | |
Core Bond ETF | Not applicable | $62,370 | Not applicable | Not applicable | $16,939 |
Core Plus Income ETF | Not applicable | 738,940 | $2,058 | $598,354 | Not applicable |
International Bond ETF (USD-Hedged) | Not applicable | 16,628 | 40,974 | Not applicable | 250 |
Municipal Income ETF | Not applicable | 55,387 | Not applicable | Not applicable | Not applicable |
Municipal High-Income ETF | Not applicable | 1,279 | Not applicable | Not applicable | Not applicable |
Short Duration Income ETF | Not applicable | 159,805 | Not applicable | 183,200* | Not applicable |
Short Duration Municipal Income ETF | Not applicable | 2,376 | Not applicable | Not applicable | Not applicable |
Ultra Short Income ETF | Not applicable | Not applicable | Not applicable | Not applicable | Not applicable |
U.S. Multi-Sector Income ETF | $6,574 | 127,040 | 1,498 | 184,450 | 4,188 |
* | No contracts were held at the end of the reporting period; amount represents the average month-end notional amount of contracts while they were held. |
The following tables identify the location and fair value amounts on each fund’s statement of assets and liabilities and the effect on each fund’s statement of operations resulting from each fund’s use of options contracts, futures contracts, forward currency contracts, interest rate swaps and/or credit default swaps as of, or for the six months ended, June 30, 2024 (dollars in thousands):
Core Bond ETF
Assets | Liabilities | ||||
Contracts | Risk type | Location on statement of assets and liabilities | Value | Location on statement of assets and liabilities | Value |
Futures | Interest | Unrealized appreciation* | $371 | Unrealized depreciation* | $18 |
Swap (centrally cleared) | Credit | Unrealized appreciation* | — | Unrealized depreciation* | 36 |
$371 | $54 | ||||
Net realized gain (loss) | Net unrealized appreciation (depreciation) | ||||
Contracts | Risk type | Location on statement of operations | Value | Location on statement of operations | Value |
Futures | Interest | Net realized gain (loss) on futures contracts | $(977 ) | Net unrealized appreciation (depreciation) on futures contracts | $353 |
Swap | Interest | Net realized gain (loss) on swap contracts | 413 | Net unrealized appreciation (depreciation) on swap contracts | (529 ) |
Swap | Credit | Net realized gain (loss) on swap contracts | — | Net unrealized appreciation (depreciation) on swap contracts | (7 ) |
$(564 ) | $(183 ) | ||||
Core Plus Income ETF
Assets | Liabilities | ||||
Contracts | Risk type | Location on statement of assets and liabilities | Value | Location on statement of assets and liabilities | Value |
Futures | Interest | Unrealized appreciation* | $2,581 | Unrealized depreciation* | $1,227 |
Forward currency | Currency | Unrealized appreciation on open forward currency contracts | 8 | Unrealized depreciation on open forward currency contracts | 5 |
Swap (centrally cleared) | Interest | Unrealized appreciation* | 7,754 | Unrealized depreciation* | 331 |
Swap (bilateral) | Interest | Bilateral swaps, at value | 64 | Bilateral swaps, at value | — |
$10,407 | $1,563 | ||||
Refer to the end of the tables for footnotes.
141 | Capital Group Fixed Income ETF Trust |
Net realized gain (loss) | Net unrealized appreciation (depreciation) | ||||
Contracts | Risk type | Location on statement of operations | Value | Location on statement of operations | Value |
Futures | Interest | Net realized gain (loss) on futures contracts | $(7,613 ) | Net unrealized appreciation (depreciation) on futures contracts | $2,045 |
Forward currency | Currency | Net realized gain (loss) on forward currency contracts | 74 | Net unrealized appreciation (depreciation) forward currency contracts | 24 |
Swap | Interest | Net realized gain (loss) on swap contracts | (14,047 ) | Net unrealized appreciation (depreciation) on swap contracts | (3,436 ) |
$(21,586 ) | $(1,367 ) | ||||
International Bond ETF (USD-Hedged)
Assets | Liabilities | ||||
Contracts | Risk type | Location on statement of assets and liabilities | Value | Location on statement of assets and liabilities | Value |
Futures | Interest | Unrealized appreciation* | $64 | Unrealized depreciation* | $45 |
Forward currency | Currency | Unrealized appreciation on open forward currency contracts | 148 | Unrealized depreciation on open forward currency contracts | 40 |
Swap (centrally cleared) | Credit | Unrealized appreciation* | — † | Unrealized depreciation* | — |
$212 | $85 | ||||
Net realized gain (loss) | Net unrealized appreciation (depreciation) | ||||
Contracts | Risk type | Location on statement of operations | Value | Location on statement of operations | Value |
Futures | Interest | Net realized gain (loss) on futures contracts | $— | Net unrealized appreciation (depreciation) on futures contracts | $19 |
Forward currency | Currency | Net realized gain (loss) on forward currency contracts | — | Net unrealized appreciation (depreciation) forward currency contracts | 108 |
Swap | Credit | Net realized gain (loss) on swap contracts | — | Net unrealized appreciation (depreciation) on swap contracts | — † |
$— | $127 | ||||
Municipal Income ETF
Assets | Liabilities | ||||
Contracts | Risk type | Location on statement of assets and liabilities | Value | Location on statement of assets and liabilities | Value |
Futures | Interest | Unrealized appreciation* | $113 | Unrealized depreciation* | $156 |
Net realized gain (loss) | Net unrealized appreciation (depreciation) | ||||
Contracts | Risk type | Location on statement of operations | Value | Location on statement of operations | Value |
Futures | Interest | Net realized gain (loss) on futures contracts | $(304 ) | Net unrealized appreciation (depreciation) on futures contracts | $23 |
Refer to the end of the tables for footnotes.
Capital Group Fixed Income ETF Trust | 142 |
Municipal High-Income ETF
Assets | Liabilities | ||||
Contracts | Risk type | Location on statement of assets and liabilities | Value | Location on statement of assets and liabilities | Value |
Futures | Interest | Unrealized appreciation* | $— | Unrealized depreciation* | $1 |
Net realized gain (loss) | Net unrealized appreciation (depreciation) | ||||
Contracts | Risk type | Location on statement of operations | Value | Location on statement of operations | Value |
Futures | Interest | Net realized gain (loss) on futures contracts | $— | Net unrealized appreciation (depreciation) on futures contracts | $(1 ) |
Short Duration Income ETF
Assets | Liabilities | ||||
Contracts | Risk type | Location on statement of assets and liabilities | Value | Location on statement of assets and liabilities | Value |
Futures | Interest | Unrealized appreciation* | $478 | Unrealized depreciation* | $164 |
Net realized gain (loss) | Net unrealized appreciation (depreciation) | ||||
Contracts | Risk type | Location on statement of operations | Value | Location on statement of operations | Value |
Futures | Interest | Net realized gain (loss) on futures contracts | $(910 ) | Net unrealized appreciation (depreciation) on futures contracts | $5 |
Swap | Interest | Net realized gain (loss) on swap contracts | (5,325 ) | Net unrealized appreciation (depreciation) on swap contracts | 337 |
$(6,235 ) | $342 | ||||
Short Duration Municipal Income ETF
Assets | Liabilities | ||||
Contracts | Risk type | Location on statement of assets and liabilities | Value | Location on statement of assets and liabilities | Value |
Futures | Interest | Unrealized appreciation* | $9 | Unrealized depreciation* | $3 |
Net realized gain (loss) | Net unrealized appreciation (depreciation) | ||||
Contracts | Risk type | Location on statement of operations | Value | Location on statement of operations | Value |
Futures | Interest | Net realized gain (loss) on futures contracts | $(21 ) | Net unrealized appreciation (depreciation) on futures contracts | $9 |
Refer to the end of the tables for footnotes.
143 | Capital Group Fixed Income ETF Trust |
U.S. Multi-Sector Income ETF
Assets | Liabilities | ||||
Contracts | Risk type | Location on statement of assets and liabilities | Value | Location on statement of assets and liabilities | Value |
Options purchased (equity style) | Interest | Investment securities | $217 | Investment securities | $— |
Options written (equity style) | Interest | Options written, at value | — | Options written, at value | 77 |
Futures | Interest | Unrealized appreciation* | 529 | Unrealized depreciation* | 490 |
Forward currency | Currency | Unrealized appreciation on open forward currency contracts | 5 | Unrealized depreciation on open forward currency contracts | 1 |
Swap (centrally cleared) | Interest | Unrealized appreciation* | 6,431 | Unrealized depreciation* | 51 |
Swap (centrally cleared) | Credit | Unrealized appreciation* | — | Unrealized depreciation* | 24 |
$7,182 | $643 | ||||
Net realized gain (loss) | Net unrealized appreciation (depreciation) | ||||
Contracts | Risk type | Location on statement of operations | Value | Location on statement of operations | Value |
Options purchased (equity style) | Interest | Net realized gain (loss) on investments | $— | Net unrealized appreciation (depreciation) on investments | $(165 ) |
Options written (equity style) | Interest | Net realized gain (loss) on options written | — | Net unrealized appreciation (depreciation) on options written | 230 |
Futures | Interest | Net realized gain (loss) on futures contracts | 647 | Net unrealized appreciation (depreciation) on futures contracts | 39 |
Forward currency | Currency | Net realized gain (loss) on forward currency contracts | 47 | Net unrealized appreciation (depreciation) forward currency contracts | 22 |
Swap | Interest | Net realized gain (loss) on swap contracts | (4,287 ) | Net unrealized appreciation (depreciation) on swap contracts | 931 |
Swap | Credit | Net realized gain (loss) on swap contracts | — | Net unrealized appreciation (depreciation) on swap contracts | (24 ) |
$(3,593 ) | $1,033 | ||||
* | Includes cumulative appreciation/depreciation on futures contracts, centrally cleared interest rate swaps and/or centrally cleared credit default swaps as reported in the applicable tables following each fund’s investment portfolio. Only current day’s variation margin is reported within each fund’s statement of assets and liabilities. |
† | Amount less than one thousand. |
Collateral — Some funds either receive or pledge highly liquid assets, such as cash or U.S. government securities, as collateral due to their use of options contracts, futures contracts, forward currency contracts, interest rate swaps, credit default swaps and/or future delivery contracts. For options on futures, futures contracts, centrally cleared interest rate swaps and centrally cleared credit default swaps, the fund pledges collateral for initial and variation margin by contract. For forward currency contracts and bilateral swaps, the program calls for each participating fund to either receive or pledge collateral based on the net gain or loss on unsettled contracts by counterparty. For future delivery contracts, the program calls for each participating fund to either receive or pledge collateral based on the net gain or loss on unsettled contracts by certain counterparties. The purpose of the collateral is to cover potential losses that could occur in the event that either party cannot meet its contractual obligation. Non-cash collateral pledged by each participating fund, if any, is disclosed in each fund’s investment portfolio, and cash collateral pledged by each participating fund, if any, is held in a segregated account with the fund’s custodian, which is reflected as pledged cash collateral in each fund’s statement of assets and liabilities.
Capital Group Fixed Income ETF Trust | 144 |
Rights of offset — Funds that hold forward currency contracts and/or bilateral interest rate swaps have enforceable master netting agreements with certain counterparties, where amounts payable by each party to the other in the same currency (with the same settlement date and with the same counterparty) are settled net of each party’s payment obligation. If an early termination date occurs under these agreements following an event of default or termination event, all obligations of each party to its counterparty are settled net through a single payment in a single currency (“close-out netting“). For financial reporting purposes, the funds do not offset financial assets and financial liabilities that are subject to these master netting arrangements in the statements of assets and liabilities.
The following tables present each fund’s forward currency contracts and bilateral interest rate swaps by counterparty that are subject to master netting agreements but that are not offset in the funds’ statement of assets and liabilities. The net amount column shows the impact of offsetting on the funds’ statement of assets and liabilities as of June 30, 2024, if close-out netting was exercised (dollars in thousands):
Core Plus Income ETF
Counterparty | Gross amounts recognized in the statement of assets and liabilities | Gross amounts not offset in the statement of assets and liabilities and subject to a master netting agreement | Net amount | ||
Available to offset | Non-cash collateral* | Cash collateral* | |||
Assets: | |||||
Barclays Bank PLC | $64 | $— | $— | $— | $64 |
Morgan Stanley | 8 | (5 ) | — | — | 3 |
Total | $72 | $(5 ) | $— | $— | $67 |
Liabilities: | |||||
Morgan Stanley | $5 | $(5 ) | $— | $— | $— |
International Bond ETF (USD-Hedged)
Counterparty | Gross amounts recognized in the statement of assets and liabilities | Gross amounts not offset in the statement of assets and liabilities and subject to a master netting agreement | Net amount | ||
Available to offset | Non-cash collateral* | Cash collateral* | |||
Assets: | |||||
Barclays Bank PLC | $3 | $— | $— | $— | $3 |
BNY Mellon | 74 | (8 ) | — | — | 66 |
Morgan Stanley | 14 | — | — | — | 14 |
Standard Chartered Bank | 57 | (32 ) | — | — | 25 |
Total | $148 | $(40 ) | $— | $— | $108 |
Liabilities: | |||||
BNY Mellon | $8 | $(8 ) | $— | $— | $— |
Standard Chartered Bank | 32 | (32 ) | — | — | — |
Total | $40 | $(40 ) | $— | $— | $— |
U.S. Multi-Sector Income ETF
Counterparty | Gross amounts recognized in the statement of assets and liabilities | Gross amounts not offset in the statement of assets and liabilities and subject to a master netting agreement | Net amount | ||
Available to offset | Non-cash collateral* | Cash collateral* | |||
Assets: | |||||
Morgan Stanley | $5 | $— | $— | $— | $5 |
Liabilities: | |||||
Barclays Bank PLC | $1 | $— | $— | $— | $1 |
*Collateral is shown on a settlement basis. |
145 | Capital Group Fixed Income ETF Trust |
6. Taxation and distributions
Federal income taxation — Each fund complies with the requirements under Subchapter M of the Internal Revenue Code applicable to regulated investment companies and intends to distribute substantially all of its net taxable income and net capital gains each year. The funds are not subject to income taxes to the extent such distributions are made. Therefore, no federal income tax provision is required.
As of and during the period ended June 30, 2024, none of the funds had a liability for any unrecognized tax benefits. Each fund recognizes interest and penalties, if any, related to unrecognized tax benefits as income tax expense in their respective statements of operations. During the period, none of the funds incurred any significant interest or penalties.
Each fund’s tax returns are generally not subject to examination by federal, state and, if applicable, non-U.S. tax authorities after the expiration of each jurisdiction’s statute of limitations, which is typically three years after the date of filing but can be extended in certain jurisdictions.
Non-U.S. taxation — Dividend and interest income, if any, are recorded net of non-U.S. taxes paid. The funds may file withholding tax reclaims in certain jurisdictions to recover a portion of amounts previously withheld. These reclaims are recorded when the amount is known and there are no significant uncertainties on collectability. Gains realized by the funds on the sale of securities in certain countries, if any, may be subject to non-U.S. taxes. The funds generally record an estimated deferred tax liability based on unrealized gains to provide for potential non-U.S. taxes payable upon the sale of these securities.
Distributions — Distributions determined on a tax basis may differ from net investment income and net realized gains for financial reporting purposes. These differences are due primarily to different treatment for items such as currency gains and losses; short-term capital gains and losses; capital losses related to sales of certain securities within 30 days of purchase; cost of investments sold; paydowns on fixed-income securities; net capital losses; amortization of premiums and discounts and income on certain investments. The fiscal year in which amounts are distributed may differ from the year in which the net investment income and net realized gains are recorded by the funds for financial reporting purposes.
Additional tax basis disclosures for each fund are as follows (dollars in thousands):
Core Bond ETF | Core Plus Income ETF | International Bond ETF (USD-Hedged) | Municipal Income ETF | Municipal High-Income ETF | |
As of December 31, 2023 | |||||
Undistributed tax-exempt income | $— | $— | $— | $2,078 | $— |
Undistributed ordinary income | 329 | 8,618 | — | — | — |
Capital loss carryforward* | (238 ) | (47,201 ) | — | (803 ) | — |
As of June 30, 2024 | |||||
Gross unrealized appreciation on investments | 3,165 | 33,367 | 72 | 13,567 | 53 |
Gross unrealized depreciation on investments | (837 ) | (16,679 ) | (407 ) | (2,046 ) | (16 ) |
Net unrealized appreciation (depreciation) on investments | 2,328 | 16,688 | (335 ) | 11,521 | 37 |
Cost of investments | 803,985 | 2,950,272 | 53,079 | 775,973 | 25,048 |
* | Each fund’s capital loss carryforward will be used to offset any capital gains realized by the fund in future years. Funds with a capital loss carryforward will not make distributions from capital gains while a capital loss carryforward remains. |
Short Duration Income ETF | Short Duration Municipal Income ETF | Ultra Short Income ETF | U.S. Multi-Sector Income ETF | |
As of December 31, 2023 | ||||
Undistributed tax-exempt income | $— | $183 | $— | $— |
Undistributed ordinary income | 1,623 | — | — | 3,034 |
Capital loss carryforward* | (1,570 ) | (18 ) | — | (5,895 ) |
As of June 30, 2024 | ||||
Gross unrealized appreciation on investments | 3,035 | 921 | 11 | 18,482 |
Gross unrealized depreciation on investments | (976 ) | (42 ) | (8 ) | (4,252 ) |
Net unrealized appreciation (depreciation) on investments | 2,059 | 879 | 3 | 14,230 |
Cost of investments | 597,436 | 53,609 | 29,809 | 882,637 |
* | Each fund’s capital loss carryforward will be used to offset any capital gains realized by the fund in future years. Funds with a capital loss carryforward will not make distributions from capital gains while a capital loss carryforward remains. |
Capital Group Fixed Income ETF Trust | 146 |
Distributions paid by each fund were characterized for tax purposes as follows (dollars in thousands):
Six months ended June 30, 2024 | Year ended December 31, 2023 | |||||
Fund | Ordinary income | Tax-exempt income | Total distributions paid | Ordinary income | Tax-exempt income | Total distributions paid |
Core Bond ETF | $5,407 | $— | $5,407 | $606 * | $— | $606 * |
Core Plus Income ETF | 52,266 | — | 52,266 | 49,339 | — | 49,339 |
International Bond ETF (USD-Hedged) | — † | — | — † | |||
Municipal Income ETF | 10,904 | — | 10,904 | — | 7,433 | 7,433 |
Municipal High-Income ETF | — † | — | — † | |||
Short Duration Income ETF | 9,584 | — | 9,584 | 11,350 | — | 11,350 |
Short Duration Municipal Income ETF | 819 | — | 819 | — | 368 * | 368 * |
Ultra Short Income ETF | — † | — | — † | |||
U.S. Multi-Sector Income ETF | 18,930 | — | 18,930 | 11,122 | — | 11,122 |
* | For the period September 26, 2023, commencement of operations, through December 31, 2023. |
† | For the period June 25, 2024, commencement of operations, through June 30, 2024. |
7. Fees and transactions
CRMC, the funds’ investment adviser, is the parent company of American Funds Distributors, Inc.® ("AFD"), the principal underwriter of the fund’s’ shares. CRMC and AFD are considered related parties to the funds.
Investment advisory services – Each fund has an investment advisory and service agreement with CRMC that provides for monthly fees, accrued daily. These fees are based on an annual rate of daily net assets as follows:
Fund | Annual rate |
Core Bond ETF | 0.27 % |
Core Plus Income ETF | 0.34 |
International Bond ETF (USD-Hedged) | 0.45 |
Municipal Income ETF | 0.27 |
Municipal High-Income ETF | 0.34 |
Short Duration Income ETF | 0.25 |
Short Duration Municipal Income ETF | 0.25 |
Ultra Short Income ETF | 0.18 |
U.S. Multi-Sector Income ETF | 0.39 |
Under the terms of the agreements, in addition to providing investment advisory services, the investment adviser and its affiliates provide certain administrative services to help assist third parties providing non-distribution services to the funds’ shareholders. These services include providing in-depth information on each fund and market developments that impact each fund’s investments. The agreement provides that the investment adviser will pay all ordinary operating expenses of each fund other than management fees, interest expenses, taxes, acquired fund fees and expenses, costs of holding shareholder meetings, legal fees and expenses relating to arbitration or litigation, payments under each fund’s plan of distribution (if any) and other non-routine or extraordinary expenses. Additionally, each fund will be responsible for its non-operating expenses, including brokerage commissions and fees and expenses associated with the fund’s securities lending program, if applicable.
Transfer agency and administration services – Each fund has entered into a transfer agency and service agreement and an administration agreement with State Street Bank and Trust Company (“State Street”). Under the terms of the transfer agency agreement, State Street (or an agent, including an affiliate) acts as transfer agent and dividend disbursing agent for each fund. Under the terms of the administration agreement, State Street provides necessary administrative, legal, tax and accounting, regulatory and financial reporting services for the maintenance and operations of each fund. The investment adviser bears the costs of services under these agreements.
Affiliated officers and trustees – Officers and certain trustees of each fund are or may be considered to be affiliated with CRMC and AFD. No affiliated officers or trustees received any compensation directly from any of the funds.
147 | Capital Group Fixed Income ETF Trust |
Investment in CCF — Each fund holds shares of CCF, an institutional prime money market fund managed by CRMC. CCF invests in high-quality, short-term money market instruments. CCF is used as the primary investment vehicle for each fund’s short-term investments. CCF shares are only available for purchase by CRMC, its affiliates, and other funds managed by CRMC. CCF shares are not available to the public. CRMC does not receive an investment advisory services fee from CCF.
Security transactions with related funds — Each fund may purchase from, or sell securities to, other CRMC-managed funds (or funds managed by certain affiliates of CRMC) under procedures adopted by each fund’s board of trustees. The funds involved in such transactions are considered related by virtue of having a common investment adviser (or affiliated investment advisers), common trustees and/or common officers. When such transactions occur, each transaction is executed at the current market price of the security and no brokerage commissions or fees are paid in accordance with Rule 17a-7 of the 1940 Act. None of the funds engaged in any such purchase or sale transactions with any related funds during the period ended June 30, 2024.
Interfund lending — Pursuant to an exemptive order issued by the SEC, the funds, along with other CRMC-managed funds (or funds managed by certain affiliates of CRMC), may participate in an interfund lending program. The program provides an alternate credit facility that permits the funds to lend or borrow cash for temporary purposes directly to or from one another, subject to the conditions of the exemptive order. None of the funds lent or borrowed cash through the interfund lending program at any time during the period ended June 30, 2024.
8. Indemnifications
Each fund’s organizational documents provide board members and officers with indemnification against certain liabilities or expenses in connection with the performance of their duties to the fund. In the normal course of business, each fund may also enter into contracts that provide general indemnifications. Each fund’s maximum exposure under these arrangements is unknown since it is dependent on future claims that may be made against each fund. The risk of material loss from such claims is considered remote. Insurance policies are also available to each fund’s board members and officers.
9. Capital share transactions
Each fund issues and redeems shares at NAV only with certain authorized participants in large increments known as creation units. Purchases of creation units are made by tendering a basket of designated securities and cash to a fund, and redemption proceeds are paid with a basket of securities from a fund’s portfolio with a balancing cash component to equate the market value of the basket of securities delivered or redeemed to the NAV per creation unit on the transaction date. The funds may issue creation units to authorized participants in advance of the delivery and settlement of all or a portion of the designated securities. When this occurs, the authorized participant provides cash collateral in an amount equal to 105% of the daily marked to market value of the securities that have not yet been delivered to the fund. Cash may be substituted equivalent to the value of certain securities generally when they are not available in sufficient quantity for delivery. Realized gains or losses resulting from redemptions of shares in-kind, if any, are reflected separately in each fund’s statement of operations.
Each fund’s shares are available in smaller increments to investors in the secondary market at market prices and may be subject to commissions. Authorized participants pay a transaction fee to the shareholder servicing agent when purchasing and redeeming creation units of a fund. The transaction fee is used to defray the costs associated with the issuance and redemption of creation units. In addition, for cash creation unit transactions, a variable fee for creation transactions and redemption transactions may be charged to the authorized participant to cover certain brokerage, tax, foreign exchange, execution, market impact and other costs and expenses related to the execution of trades. Variable fees, if any, are included in capital share transactions in each fund’s statement of changes in net assets.
Capital Group Fixed Income ETF Trust | 148 |
Capital share transactions in each fund were as follows (dollars and shares in thousands):
Core Bond ETF
Sales | Reinvestments of distributions | Repurchases | Net increase (decrease) | |||||
Amount | Shares | Amount | Shares | Amount | Shares | Amount | Shares | |
Six months ended June 30, 2024 | ||||||||
$563,293 | 21,840 | $— | — | $— | — | $563,293 | 21,840 | |
For the period September 26, 2023*, through December 31, 2023 | ||||||||
$93,345 | 3,660 | $— | — | $— | — | $93,345 | 3,660 | |
Core Plus Income ETF
Sales | Reinvestments of distributions | Repurchases | Net increase (decrease) | |||||
Amount | Shares | Amount | Shares | Amount | Shares | Amount | Shares | |
Six months ended June 30, 2024 | ||||||||
$993,596 | 44,460 | $— | — | $— | — | $993,596 | 44,460 | |
Year ended December 31, 2023 | ||||||||
$1,082,435 | 48,600 | $— | — | $— | — | $1,082,435 | 48,600 | |
International Bond ETF (USD-Hedged)
Sales | Reinvestments of distributions | Repurchases | Net increase (decrease) | |||||
Amount | Shares | Amount | Shares | Amount | Shares | Amount | Shares | |
For the period June 25, 2024*, through June 30, 2024 | ||||||||
$49,500 | 1,980 | $— | — | $— | — | $49,500 | 1,980 | |
Municipal Income ETF
Sales | Reinvestments of distributions | Repurchases | Net increase (decrease) | |||||
Amount | Shares | Amount | Shares | Amount | Shares | Amount | Shares | |
Six months ended June 30, 2024 | ||||||||
$275,958 | 10,260 | $— | — | $— | — | $275,958 | 10,260 | |
Year ended December 31, 2023 | ||||||||
$430,271 | 16,380 | $— | — | $(1,604 ) | (60 ) | $428,667 | 16,320 | |
Municipal High-Income ETF
Sales | Reinvestments of distributions | Repurchases | Net increase (decrease) | |||||
Amount | Shares | Amount | Shares | Amount | Shares | Amount | Shares | |
For the period June 25, 2024*, through June 30, 2024 | ||||||||
$20,000 | 800 | $— | — | $— | — | $20,000 | 800 | |
Short Duration Income ETF
Sales | Reinvestments of distributions | Repurchases | Net increase (decrease) | |||||
Amount | Shares | Amount | Shares | Amount | Shares | Amount | Shares | |
Six months ended June 30, 2024 | ||||||||
$225,594 | 8,880 | $— | — | $— | — | $225,594 | 8,880 | |
Year ended December 31, 2023 | ||||||||
$242,033 | 9,540 | $— | — | $— | — | $242,033 | 9,540 | |
Refer to the end of the tables for footnote.
149 | Capital Group Fixed Income ETF Trust |
Short Duration Municipal Income ETF
Sales | Reinvestments of distributions | Repurchases | Net increase (decrease) | |||||
Amount | Shares | Amount | Shares | Amount | Shares | Amount | Shares | |
Six months ended June 30, 2024 | ||||||||
$10,797 | 420 | $— | — | $(3,088 ) | (120 ) | $7,709 | 300 | |
For the period September 26, 2023*, through December 31, 2023 | ||||||||
$45,214 | 1,800 | $— | — | $— | — | $45,214 | 1,800 | |
Ultra Short Income ETF
Sales | Reinvestments of distributions | Repurchases | Net increase (decrease) | |||||
Amount | Shares | Amount | Shares | Amount | Shares | Amount | Shares | |
For the period June 25, 2024*, through June 30, 2024 | ||||||||
$30,000 | 1,200 | $— | — | $— | — | $30,000 | 1,200 | |
U.S. Multi-Sector Income ETF
Sales | Reinvestments of distributions | Repurchases | Net increase (decrease) | |||||
Amount | Shares | Amount | Shares | Amount | Shares | Amount | Shares | |
Six months ended June 30, 2024 | ||||||||
$516,845 | 19,200 | $— | — | $— | — | $516,845 | 19,200 | |
Year ended December 31, 2023 | ||||||||
$296,844 | 11,340 | $— | — | $— | — | $296,844 | 11,340 | |
* | Commencement of operations. |
Capital Group Fixed Income ETF Trust | 150 |
10. Investment transactions
The following table presents purchases and sales of investments, excluding in-kind transactions, short-term securities and U.S. government obligations, if any, during the six months ended June 30, 2024 (dollars in thousands):
Fund | Purchases | Sales |
Core Bond ETF | $341,310 | $120,863 |
Core Plus Income ETF | 1,001,096 | 829,686 |
International Bond ETF (USD-Hedged) | 81,152 | 35,039 |
Municipal Income ETF | 327,023 | 48,350 |
Municipal High-Income ETF | 17,589 | 539 |
Short Duration Income ETF | 242,931 | 100,852 |
Short Duration Municipal Income ETF | 17,010 | 8,992 |
Ultra Short Income ETF | 15,906 | 199 |
U.S. Multi-Sector Income ETF | 326,721 | 138,467 |
The following table presents the value of securities received and delivered in-kind from the authorized participants to support creation and redemption transactions, if any, during the six months ended June 30, 2024 (dollars in thousands):
Fund | In-kind creations | In-kind redemptions |
Core Bond ETF | $200,155 | $— |
Core Plus Income ETF | 761,565 | — |
International Bond ETF (USD-Hedged) | — | — |
Municipal Income ETF | 1,007 | — |
Municipal High-Income ETF | — | — |
Short Duration Income ETF | 68,741 | — |
Short Duration Municipal Income ETF | 990 | 2,693 |
Ultra Short Income ETF | 16,558 | — |
U.S. Multi-Sector Income ETF | 320,766 | — |
The following table presents additional information for each fund for the six months ended June 30, 2024 (dollars in thousands):
Fund | Non-U.S. taxes paid on interest income |
Core Bond ETF | $— |
Core Plus Income ETF | 3 |
International Bond ETF (USD-Hedged) | 4 |
Municipal Income ETF | — |
Municipal High-Income ETF | — |
Short Duration Income ETF | — |
Short Duration Municipal Income ETF | — |
Ultra Short Income ETF | — |
U.S. Multi-Sector Income ETF | 2 |
151 | Capital Group Fixed Income ETF Trust |
Financial highlights
Income (loss) from investment operations1 | Dividends and distributions | |||||||||||
Year ended | Net asset value, beginning of year | Net investment income (loss) | Net gains (losses) on securities (both realized and unrealized) | Total from investment operations | Dividends (from net investment income) | Distributions (from capital gains) | Total dividends and distributions | Net asset value, end of year | Total return | Net assets, end of year (in millions) | Ratio of expenses to average net assets2 | Ratio of net income (loss) to average net assets |
Core Bond ETF | ||||||||||||
6/30/20243,4 | $26.38 | $.63 | $(.75 ) | $(.12 ) | $(.45 ) | $— | $(.45 ) | $25.81 | (.46 )%5 | $658 | .27 %6 | 4.96 %6 |
12/31/20233,7 | 25.00 | .45 | 1.18 | 1.63 | (.25 ) | — | (.25 ) | 26.38 | 6.56 5 | 97 | .27 6 | 6.77 6 |
Core Plus Income ETF | ||||||||||||
6/30/20243,4 | $22.66 | $.79 | $(.68 ) | $.11 | $(.55 ) | $— | $(.55 ) | $22.22 | 5.38 %5 | $2,522 | .34 %6 | 7.17 %6 |
12/31/2023 | 22.23 | 1.55 | .01 | 1.56 | (1.13 ) | — | (1.13 ) | 22.66 | 7.25 | 1,565 | .34 | 7.04 |
12/31/20223,8 | 25.30 | .83 | (3.24 ) | (2.41 ) | (.66 ) | — | (.66 ) | 22.23 | (9.59 )5 | 455 | .34 6 | 4.24 6 |
International Bond ETF (USD-Hedged) | ||||||||||||
6/30/20243,4,9 | $25.00 | $.01 | $(.10 ) | $(.09 ) | $— | $— | $— | $24.91 | (.36 )%5 | $49 | .45 %6 | 3.26 %6 |
Municipal Income ETF | ||||||||||||
6/30/20243,4 | $27.00 | $.50 | $(.21 ) | $.29 | $(.44 ) | $— | $(.44 ) | $26.85 | 1.08 %5 | $790 | .27 %6 | 3.78 %6 |
12/31/2023 | 26.11 | .98 | .75 | 1.73 | (.84 ) | — | (.84 ) | 27.00 | 6.78 | 517 | .27 | 3.75 |
12/31/20223,10 | 25.00 | .17 | 1.07 | 1.24 | (.13 ) | — | (.13 ) | 26.11 | 4.92 5 | 74 | .05 5 | .67 5 |
Municipal High-Income ETF | ||||||||||||
6/30/20243,4,9 | $25.00 | $.01 | $.05 | $.06 | $— | $— | $— | $25.06 | .16 %5 | $20 | .34 %6 | 3.66 %6 |
Short Duration Income ETF | ||||||||||||
6/30/20243,4 | $25.41 | $.90 | $(.41 ) | $.49 | $(.54 ) | $— | $(.54 ) | $25.36 | 1.95 %5 | $557 | .25 %6 | 7.17 %6 |
12/31/2023 | 25.27 | 1.37 | (.10 ) | 1.27 | (1.13 ) | — | (1.13 ) | 25.41 | 5.14 | 332 | .25 | 5.45 |
12/31/20223,10 | 25.00 | .22 | .21 | .43 | (.16 ) | — | (.16 ) | 25.27 | 1.73 5 | 89 | .05 5 | .87 5 |
Short Duration Municipal Income ETF | ||||||||||||
6/30/20243,4 | $25.78 | $.47 | $(.11 ) | $.36 | $(.43 ) | $— | $(.43 ) | $25.71 | 1.40 %5 | $54 | .25 %6 | 3.67 %6 |
12/31/20233,7 | 25.00 | .24 | .76 | 1.00 | (.22 ) | — | (.22 ) | 25.78 | 4.00 5 | 46 | .25 6 | 3.62 6 |
Ultra Short Income ETF | ||||||||||||
6/30/20243,4,9 | $25.00 | $.02 | $— | $.02 | $— | $— | $— | $25.02 | .08 %5 | $30 | .18 %6 | 5.12 %6 |
U.S. Multi-Sector Income ETF | ||||||||||||
6/30/20243,4 | $26.91 | $1.08 | $(.29 ) | $.79 | $(.78 ) | $— | $(.78 ) | $26.92 | 2.99 %5 | $896 | .39 %6 | 8.10 %6 |
12/31/2023 | 25.66 | 2.05 | .78 | 2.83 | (1.58 ) | — | (1.58 ) | 26.91 | 11.39 | 379 | .39 | 7.91 |
12/31/20223,10 | 25.00 | .29 | .62 | .91 | (.25 ) | — | (.25 ) | 25.66 | 3.63 5 | 71 | .07 5 | 1.13 5 |
Refer to the end of the tables for footnotes.
Capital Group Fixed Income ETF Trust | 152 |
Financial highlights (continued)
Portfolio turnover rate excluding mortgage dollar roll transactions11,12 | Six months ended June 30, 20243,4,5 | Year ended December 31, 2023 | Period ended December 31, 20223,5 |
Core Bond ETF | 56 % | 13 %7 | |
Core Plus Income ETF | 54 | 76 | 172 8 |
Short Duration Income ETF | 26 | 56 | 1 10 |
Portfolio turnover rate including mortgage dollar roll transactions, if any11,12 | Six months ended June 30, 20243,4,5 | Year ended December 31, 2023 | Period ended December 31, 20223,5 |
Core Bond ETF | 264 % | 26 %7 | |
Core Plus Income ETF | 276 | 581 | 446 8 |
International Bond ETF (USD-Hedged) | 70 9 | ||
Municipal Income ETF | 8 | 19 | 1 10 |
Municipal High-Income ETF | 3 9 | ||
Short Duration Income ETF | 109 | 203 | 55 10 |
Short Duration Municipal Income ETF | 21 | 37 7 | |
Ultra Short Income ETF | 1 9 | ||
U.S. Multi-Sector Income ETF | 23 | 43 | 6 10 |
1 | Based on average shares outstanding. |
2 | Ratios do not include expenses of any Central Funds. Each fund indirectly bears its proportionate share of the expenses of any Central Funds. |
3 | Based on operations for a period that is less than a full year. |
4 | Unaudited. |
5 | Not annualized. |
6 | Annualized. |
7 | For the period September 26, 2023, commencement of operations, through December 31, 2023. |
8 | For the period February 22, 2022, commencement of operations, through December 31, 2022. |
9 | For the period June 25, 2024, commencement of operations, through June 30, 2024. |
10 | For the period October 25, 2022, commencement of operations, through December 31, 2022. |
11 | Rates do not include each fund’s portfolio activity with respect to any Central Funds. |
12 | Refer to Note 5 for more information on mortgage dollar rolls. |
Refer to the notes to financial statements.
153 | Capital Group Fixed Income ETF Trust |
Changes in and disagreements with accountants
Not applicable
Matters submitted for shareholder vote
Not applicable
Remuneration paid to directors, officers and others
Refer to information in the financial statements.
Capital Group Fixed Income ETF Trust | 154 |
Approval of Investment Advisory and Service Agreement
The trust’s board has approved the continuation of the trust’s Investment Advisory and Service Agreement (the “agreement”) with Capital Research and Management Company (“CRMC”) for an additional one-year term through July 31, 2025. The board approved the agreement following the recommendation of the trust’s Contracts Committee (the “committee”), which is composed of all of the trust’s independent board members. The board and the committee determined in the exercise of their business judgment that each fund’s contractual fee rate was fair and reasonable in relation to the services provided, and that approving the agreement was in the best interests of each fund and its shareholders.
In reaching this decision, the board and the committee took into account their interactions with CRMC in addition to information furnished to them throughout the year and otherwise provided to them, as well as information prepared specifically in connection with their review of the agreement, and they were advised by their independent counsel with respect to the matters considered. They considered the following factors, among others, but did not identify any single issue or particular piece of information that, in isolation, was the controlling factor, and each board and committee member did not necessarily attribute the same weight to each factor.
1. Nature, extent and quality of services
The board and the committee considered the depth and quality of CRMC’s investment management process, including its global research capabilities; the experience, capability and integrity of its senior management and other personnel; the low turnover rates of its key personnel; the overall financial strength and stability of CRMC and the Capital Group organization; the resources and systems CRMC devotes to investment management (the manner in which each fund’s assets are managed, including liquidity management), financial, investment operations, compliance, trading, proxy voting, and other services; and the ongoing evolution of CRMC’s organizational structure designed to maintain and strengthen these qualities. The board and the committee also considered the nature, extent and quality of administrative services provided by CRMC to each fund under the agreement and other agreements. The board and the committee considered the risks assumed by CRMC in providing services to each fund, including operational, business, financial, reputational, regulatory and litigation risks. The board and the committee concluded that the nature, extent and quality of the services provided by CRMC have benefited and should continue to benefit each fund and its shareholders.
2. Investment results
The board and the committee considered the investment results of each fund in light of its objective and strategy. They compared each fund’s investment results with those of other funds (including funds that currently form the basis of the Lipper index for the category in which each fund is included) and data such as publicly disclosed benchmarks, including applicable market and fund indexes over various periods (including the fund’s lifetime) through December 31, 2023 while recognizing the fund’s short operational history. On the basis of this evaluation and the board’s and the committee’s ongoing review of investment operations and results, and considering the relative market conditions during certain reporting periods, the board and the committee concluded that each fund’s investment results have been satisfactory for renewal of the agreement, and that CRMC’s continued management should benefit each fund and its shareholders.
3. Advisory fees and total expenses
The board and the committee compared the advisory fees and total expense levels of each fund to those of other relevant funds, noting that each fund has a unitary fee structure. They observed that each fund’s advisory fees and expenses generally compared favorably to those of other similar active exchange traded funds and institutional share classes for comparable open-end funds included in the applicable Lipper categories. The board and the committee also reviewed information regarding the effective advisory fees charged to other funds and accounts managed by CRMC and its affiliates. They noted that, to the extent there were differences between the advisory fees paid by each fund and the advisory fees paid by those clients, the differences appropriately reflected the investment, operational, regulatory and market differences between advising each fund and the other clients. The board and the committee concluded that each fund’s contractual fee rate was fair and reasonable in relation to the services provided, as well as in relation to the risks assumed by the adviser in sponsoring and managing each fund, and that each fund’s shareholders receive reasonable value in return for the advisory fees and other amounts paid to CRMC by each fund.
155 | Capital Group Fixed Income ETF Trust |
4. Ancillary benefits
The board and the committee considered a variety of other benefits that CRMC and its affiliates receive as a result of CRMC’s relationship with each fund and other funds it sponsors, including fees for administrative services; and possible ancillary benefits to CRMC and its institutional management affiliates in managing other investment vehicles. The board and the committee reviewed CRMC’s portfolio trading practices, noting that CRMC bears the cost of third-party research. The board and committee also noted that CRMC benefited from the use of commissions from portfolio transactions made on behalf of each fund to facilitate payment to certain broker-dealers for research to comply with regulatory requirements applicable to these firms, with all such amounts reimbursed by CRMC. The board and the committee took these ancillary benefits into account in evaluating the reasonableness of the fees paid to CRMC by each fund.
5. Adviser financial information
The board and the committee reviewed information regarding CRMC’s costs of providing services to its U.S. registered fund business, including personnel, systems and resources of investment, compliance, trading, accounting and other administrative operations. They considered CRMC’s costs and related cost allocation methodology, as well as its track record of investing in technology, infrastructure and staff to maintain and expand services and capabilities, respond to industry and regulatory developments, and attract and retain qualified personnel. They noted information regarding the compensation structure for CRMC’s investment professionals. They reviewed information on the profitability of the investment adviser and its affiliates. The board and the committee also compared CRMC’s profitability and compensation data to the reported results and data of a number of large, publicly held investment management companies. The board and the committee noted the competitiveness and cyclicality of both the registered fund industry and the capital markets, and the importance in that environment of CRMC’s long-term profitability for maintaining its independence, company culture and management continuity. They further considered that shareholders benefited from the unitary fee structure because expenses were limited. The board and the committee also considered the fact that increases in assets would not lead to fee decreases, even if economies of scale are achieved, because the unitary fee structure does not contain breakpoints. The board and the committee concluded that each fund’s contractual fee rate reflected a reasonable sharing of benefits between CRMC and each fund’s shareholders.
Capital Group Fixed Income ETF Trust | 156 |
Approval of Investment Advisory and Service Agreement
The board of Capital Group Fixed Income ETF Trust (the “board”), including a majority of its independent board members, has approved the addition of Capital Group International Bond ETF (USD-Hedged), Capital Group Municipal High-Income ETF and Capital Group Ultra Short Income ETF (each a “fund”) to its Investment Advisory and Service Agreement (the “agreement”) with Capital Research and Management Company (“CRMC”) for an initial term through July 31, 2025. The board determined in the exercise of its business judgment that each fund’s contractual fee rate was fair and reasonable in relation to the services provided, and that approving the agreement was in the best interests of each fund and its shareholders.
In reaching this decision, the board took into account information prepared specifically in connection with their review of the agreement and information otherwise provided in the meeting material, as well as information previously provided to them in their capacity as board members of other investment companies managed by CRMC, and they were advised by their independent counsel with respect to the matters considered. They considered the following factors, among others, but did not identify any single issue or particular piece of information that, in isolation, was the controlling factor, and each board member did not necessarily attribute the same weight to each factor.
1. Nature, extent and quality of services
The board considered the depth and quality of CRMC’s investment management process, including its global research capabilities; the experience, capability and integrity of its senior management and other personnel; the low turnover rates of its key personnel; the overall financial strength and stability of CRMC and the Capital Group organization; the resources and systems CRMC devotes to investment management (the manner in which each fund’s assets will be managed, including liquidity management), financial, investment operations, compliance, trading, proxy voting, and other services; and the ongoing evolution of CRMC’s organizational structure designed to maintain and strengthen these qualities. The board also considered the nature, extent and quality of administrative services to be provided by CRMC to each fund under the agreement and other agreements. The board considered the risks assumed by CRMC in providing services to each fund, including operational, business, financial, reputational, regulatory and litigation risks. The board concluded that the nature, extent and quality of the services to be provided by CRMC should benefit each fund and its shareholders.
2. Investment results
The board considered the manner in which CRMC proposed to manage each fund in light of its objective and strategy. They also considered the proposed investment policies and restrictions on each fund, and CRMC’s experience in managing similar strategies. On the basis of this evaluation and the board’s plan to undertake ongoing review of investment operations and results, the board concluded that CRMC’s management should benefit each fund and its shareholders.
3. Advisory fees and total expenses
The board reviewed the proposed unitary fee structure and considered that CRMC would be, with certain exceptions, responsible for the operating expenses of each fund. The board considered the contractual fee rate that will be paid by each fund to CRMC and compared the estimated expense ratio of each fund to the expense ratios of other relevant funds. The board concluded that the proposed contractual fee rate was fair and reasonable in relation to the services that CRMC proposed to provide, as well as in relation to the risks assumed by the adviser in sponsoring and managing each fund, and that each fund’s shareholders would likely receive reasonable value in return for the fees paid to CRMC by each fund.
4. Ancillary benefits
The board considered a variety of other benefits that CRMC and its affiliates could receive as a result of CRMC’s proposed relationship with each fund and other funds it sponsors, including fees for administrative services and possible ancillary benefits to CRMC and its institutional management affiliates in managing other investment vehicles. The board considered CRMC’s portfolio trading practices, noting that CRMC bears the cost of third-party research. The board also noted that CRMC benefited from the use of commissions from portfolio transactions made on behalf of each fund to facilitate payments to certain broker-dealers for research to comply with regulatory requirements applicable to these firms, with all such amounts reimbursed to each fund by CRMC. The board took these ancillary benefits into account in evaluating the reasonableness of the fees payable to CRMC by each fund under the agreement.
157 | Capital Group Fixed Income ETF Trust |
5. Adviser financial information
The board considered CRMC’s commitment to providing to each fund the necessary resources, including personnel, systems and resources of investment, compliance, trading, accounting and other administrative operations. The board noted the competitiveness and cyclicality of both the registered fund industry and the capital markets, and the importance in that environment of CRMC’s long-term profitability for maintaining its independence, company culture and management continuity. The board further considered that shareholders would benefit from the unitary fee structure because expenses would be limited even when each fund was new and not achieving economies of scale. The board also considered the fact that increases in assets would not lead to fee decreases, even if economies of scale are achieved, because the unitary fee structure does not contain breakpoints, and that they would have the opportunity to further review the appropriateness of the fees payable to CRMC under the agreement experienced in the future. The board concluded that each fund’s proposed contractual fee rate reflected a reasonable sharing of benefits between CRMC and each fund’s shareholders.
Capital Group Fixed Income ETF Trust | 158 |
ITEM 8 - Changes in and Disagreements with Accountants for Open-End Management Investment Companies
Not applicable
ITEM 9 - Proxy Disclosures for Open-End Management Investment Companies
Not applicable
ITEM 10 - Remuneration Paid to Directors, Officers, and Others of Open-End Management Investment Companies
The information is included as part of the material filed under Item 7 of this Form.
ITEM 11 - Statement Regarding Basis for Approval of Investment Advisory Contract
The information is included as part of the material filed under Item 7 of this Form.
ITEM 12 - Disclosure of Proxy Voting Policies and Procedures for Closed-End Management Investment Companies
Not applicable to this Registrant, insofar as the Registrant is not a closed-end management investment company.
ITEM 13 - Portfolio Managers of Closed-End Management Investment Companies
Not applicable to this Registrant, insofar as the Registrant is not a closed-end management investment company.
ITEM 14 - Purchases of Equity Securities by Closed-End Management Investment Company and Affiliated Purchasers
Not applicable to this Registrant, insofar as the Registrant is not a closed-end management investment company.
ITEM 15 - Submission of Matters to a Vote of Security Holders
There have been no material changes to the procedures by which shareholders may recommend nominees to the Registrant’s board of trustees since the Registrant last submitted a proxy statement to its shareholders. The procedures are as follows. The Registrant has a nominating and governance committee comprised solely of persons who are not considered ‘‘interested persons’’ of the Registrant within the meaning of the Investment Company Act of 1940, as amended. The committee periodically reviews such issues as the board’s composition, responsibilities, committees, compensation and other relevant issues, and recommends any appropriate changes to the full board of trustees. While the committee normally is able to identify from its own resources an ample number of qualified candidates, it will consider shareholder suggestions of persons to be considered as nominees to fill future vacancies on the board. Such suggestions must be sent in writing to the nominating and governance committee of the Registrant, c/o the Registrant’s Secretary, and must be accompanied by complete biographical and occupational data on the prospective nominee, along with a written consent of the prospective nominee for consideration of his or her name by the nominating and governance committee.
ITEM 16 - Controls and Procedures
(a) The Registrant’s Principal Executive Officer and Principal Financial Officer have concluded, based on their evaluation of the Registrant’s disclosure controls and procedures (as such term is defined in Rule 30a-3 under the Investment Company Act of 1940), that such controls and procedures are adequate and reasonably designed to achieve the purposes described in paragraph (c) of such rule.
(b) There were no changes in the Registrant’s internal controls over financial reporting (as defined in Rule 30a-3(d) under the Investment Company Act of 1940) that occurred during the Registrant’s semi-annual period covered by this report that has materially affected, or is reasonably likely to materially affect, the Registrant’s internal control over financial reporting.
ITEM 17 - Disclosure of Securities Lending Activities for Closed-End Management Investment Companies
Not applicable to this Registrant, insofar as the Registrant is not a closed-end management investment company.
ITEM 18 - Recovery of Erroneously Awarded Compensation
Not applicable
SIGNATURES
Pursuant to the requirements of the Securities Exchange Act of 1934 and the Investment Company Act of 1940, the Registrant has duly caused this report to be signed on its behalf by the undersigned, thereunto duly authorized.
Capital Group Fixed Income ETF Trust
By /s/ Michael W. Stockton
Michael W. Stockton,
Executive Vice President and Principal Executive Officer
Date: August 30, 2024
Pursuant to the requirements of the Securities Exchange Act of 1934 and the Investment Company Act of 1940, this report has been signed below by the following persons on behalf of the Registrant and in the capacities and on the dates indicated.
By /s/ Michael W. Stockton
Michael W. Stockton,
Executive Vice President and Principal Executive Officer
Date: August 30, 2024
By /s/ Troy S. Tanner
Troy S. Tanner, Treasurer and
Principal Financial Officer
Date: August 30, 2024