Capital Group International Focus Equity ETF (CGXU)
Filed: 29 Jul 22, 11:48am
UNITED STATES
SECURITIES AND EXCHANGE COMMISSION
Washington, D.C. 20549
FORM N-CSR
Certified Shareholder Report of
Registered Management Investment Companies
Investment Company Act File Number: 811-23734
Capital Group International Focus Equity ETF
(Exact Name of Registrant as Specified in Charter)
6455 Irvine Center Drive
Irvine, California 92618
(Address of Principal Executive Offices)
Registrant's telephone number, including area code: (949) 975-5000
Date of fiscal year end: May 31
Date of reporting period: May 31, 2022
Troy S. Tanner
Capital Group International Focus Equity ETF
6455 Irvine Center Drive
Irvine, California 92618
(Name and Address of Agent for Service)
ITEM 1 – Reports to Stockholders
| Capital Group Growth ETFSM Capital Group Global Growth Equity ETFSM Capital Group International Focus Equity ETFSM Capital Group Core Equity ETFSM Capital Group Dividend Value ETFSM |  |
| First report for the period ended May 31, 2022 |

Signature active
management to
pursue better
investment outcomes
These five Capital Group Equity Exchange-Traded Funds pursue a variety of objectives for investors and are offered by Capital Group, home of American Funds. For over 90 years, Capital Group has invested with a long-term focus based on thorough research and attention to risk.
Figures shown are past results and are not predictive of results in future periods. Current and future results may be lower or higher than those shown. Prices and returns will vary, so investors may lose money. Investing for short periods makes losses more likely. For current information and month-end results, visit capitalgroup.com. Market price returns are determined using the official closing price of the fund’s shares and do not represent the returns you would receive if you traded shares at other times.
Here are the total returns on a $1,000 investment with all distributions reinvested for periods ended June 30, 2022 (the most recent calendar quarter-end):
| Since fund inception (2/22/22) | 30-day SEC yield as of 5/31/2022 | Expense ratio | ||||||||||
| Capital Group Growth ETF | 0.40 | % | 0.39% | |||||||||
| Net asset value | –18.16 | % | ||||||||||
| Market price | –18.12 | |||||||||||
| S&P 500 Index | –11.56 | |||||||||||
| Capital Group Global Growth Equity ETF | 0.73 | 0.47 | ||||||||||
| Net asset value | –18.01 | |||||||||||
| Market price | –17.77 | |||||||||||
| MSCI All Country World Index (ACWI) | –13.37 | |||||||||||
| Capital Group International Focus Equity ETF | 1.46 | 0.54 | ||||||||||
| Net asset value | –15.93 | |||||||||||
| Market price | –15.44 | |||||||||||
| MSCI All Country World Index (ACWI) ex USA | –14.80 | |||||||||||
| Capital Group Core Equity ETF | 1.26 | 0.33 | ||||||||||
| Net asset value | –11.61 | |||||||||||
| Market price | –11.57 | |||||||||||
| S&P 500 Index | –11.56 | |||||||||||
| Capital Group Dividend Value ETF | 1.73 | 0.33 | ||||||||||
| Net asset value | –9.35 | |||||||||||
| Market price | –9.35 | |||||||||||
| S&P 500 Index | –11.56 | |||||||||||
Capital Group Equity Exchange-Traded Funds (ETFs) are actively managed and do not seek to replicate a specific index. ETFs are bought and sold through an exchange at the then current market price, not net asset value (NAV), and are not individually redeemed from the fund. Shares may trade at a premium or discount to their NAV when traded on an exchange. Brokerage commissions will reduce returns. There can be no guarantee that an active market for ETFs will develop or be maintained, or that the ETF’s listing will continue or remain unchanged.
ETF market price returns since inception are calculated using NAV for the period until market price became available (generally a few days after inception).
As nondiversified funds, Capital Group Equity ETFs have the ability to invest a larger percentage of assets in securities of individual issuers than a diversified fund. As a result, a single issuer could adversely affect a fund’s results more than if the fund invested a smaller percentage of assets in securities of that issuer. See the applicable prospectus for details.
Investments are not FDIC-insured, nor are they deposits of or guaranteed by a bank or any other entity, so they may lose value.
Contents
| 1 | Letter to investors |
| 3 | Summary investment portfolio |
| 20 | Financial statements |
| 38 | Board of trustees and other officers |
Fellow investors:
We are pleased to present you with the first report for Capital Group Growth ETF, Capital Group Global Growth Equity ETF, Capital Group International Focus Equity ETF, Capital Group Core Equity ETF and Capital Group Dividend Value ETF. For the funds’ inception date — February 22, 2022 — to the end of the fiscal year, May 31, 2022, the funds’ results, which includes dividends reinvested, were as follows:
Capital Group Growth ETF dropped –8.69% on a net asset value (NAV) basis and –8.65% on a market price basis, notably lagging the fund’s benchmark, the S&P 500 Index, which declined –3.60%.
Capital Group Global Growth Equity ETF slumped –11.44% on a NAV basis and –11.32% on a market price basis, trailing the fund’s primary benchmark, MSCI All Country World Index, which returned –5.39%. The funds did not distribute any capital gains during the inception date to fiscal year-end period.
Capital Group International Focus Equity ETF weakened –6.90% on a NAV basis and –7.02% on a market price basis, while the fund’s primary benchmark, MSCI All Country World Index excluding USA, fell –6.78%.
Capital Group Core Equity ETF declined –3.59% on a NAV basis and –3.55% on a market price basis, which was in line with the fund’s benchmark, the S&P 500 Index, which decreased –3.60% over the period.
Capital Group Dividend Value ETF slipped –0.46% on a NAV basis and –0.37% on a market price basis, which was more than 300 basis points better than the S&P 500 Index, the fund’s primary benchmark.
Economic and market backdrop The global economy and equity markets faced headwinds over the funds’ lifetimes as a once-strong environment became hampered by labor market and supply chain constraints, rising rates, heightened geopolitical conflict and rapidly escalating inflation. For the February 22, 2022, to May 31, 2022 period, the S&P 500 Index declined –3.60%, while the MSCI All Country World Index (ACWI) and MSCI ACWI excluding USA dropped –5.39% and –6.78%, respectively.
The U.S. economy showed signs of weakness as gross domestic product declined 1.4% in the first quarter, a notable reversal from the 6.9% growth experienced in the last quarter of 2021. Declines in fixed investment and defense spending, along with record trade imbalances hampered growth. Consumer spending rose 2.7%, but this came as inflation reached the highest level in nearly 40 years.
In Europe, Russia’s invasion of Ukraine and sharply higher inflation threatened to derail Europe’s pandemic recovery efforts. The conflict sent energy prices soaring and resulted in unprecedented sanctions on Russia which effectively removed the country from the global financial system.
Meanwhile, in the Asia-Pacific region and emerging markets, rounds of COVID lockdowns in China hampered economic growth across the region. However, for
| Capital Group Equity Exchange-Traded Funds | 1 |
some commodity-producing countries, global shortages drove up prices and provided a tailwind to growth.
Central banks throughout the world faced escalating inflation and fears of an impending global recession. Monetary policymakers at the U.S. Federal Reserve raised rates and signaled additional monetary measures, such as greater rate hikes and unwinding the Fed’s balance sheet, to dampen high inflation. Similarly, the Bank of England and Swiss National Bank raised benchmark interest rates. The European Central Bank outlined expectations for raising benchmark rates later in 2022.
Looking forward
Volatile equity markets can be painful for investors — especially in a high inflation environment — and reinforce the need to take a long-term approach to investing. We are mindful that financial markets may be volatile and result in uneven returns in the future. Yet, market volatility can create new or enhance existing investment opportunities in what we believe are companies with great potential. In this environment, we continue to employ the funds’ flexibility and deep fundamental research on a company-by-company basis to uncover attractive investment opportunities.
We appreciate your investment in these ETFs and look forward to helping you pursue your investment goals.
Cordially,

Irfan Furniturewala
Co-President, Capital Group Growth ETF

Alan J. Wilson
Co-President, Capital Group Growth ETF

Patrice Collette
President, Capital Group Global
Growth Equity ETF

Sung Lee
President, Capital Group
International Focus Equity ETF

Keiko McKibben
Co-President, Capital Group
Core Equity ETF

Carlos A. Schonfeld
Co-President, Capital Group
Core Equity ETF

Christopher D. Buchbinder
President, Capital Group
Dividend Value ETF
July 14, 2022
| 2 | Capital Group Equity Exchange-Traded Funds |
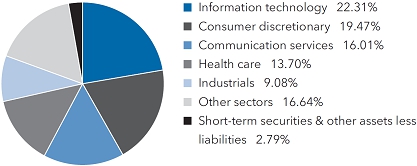
Capital Group Growth ETF
Investment portfolio May 31, 2022
| Sector diversification | Percent of net assets |
| Largest equity holdings | Percent of net assets | |||
| Tesla | 8.31 | % | ||
| Microsoft | 6.21 | |||
| Meta Platforms | 5.98 | |||
| Alphabet | 3.62 | |||
| UnitedHealth Group | 2.82 | |||
| Regeneron Pharmaceuticals | 2.52 | |||
| Broadcom | 2.49 | |||
| Netflix | 2.32 | |||
| Amazon.com | 2.14 | |||
| Bank of America | 1.91 | |||
| Common stocks 97.21% | Shares | Value (000) | ||||||
| Information technology 22.31% | ||||||||
| Microsoft Corp. | 65,149 | $ | 17,712 | |||||
| Broadcom, Inc. | 12,252 | 7,108 | ||||||
| ASML Holding NV | 5,746 | 3,306 | ||||||
| ASML Holding NV (New York registered) (ADR) | 2,179 | 1,256 | ||||||
| Taiwan Semiconductor Manufacturing Company, Ltd. (ADR) | 32,066 | 3,056 | ||||||
| Applied Materials, Inc. | 25,991 | 3,048 | ||||||
| Apple, Inc. | 13,602 | 2,025 | ||||||
| FleetCor Technologies, Inc.1 | 7,130 | 1,774 | ||||||
| Mastercard, Inc., Class A | 4,833 | 1,730 | ||||||
| Micron Technology, Inc. | 22,980 | 1,697 | ||||||
| Cloudflare, Inc., Class A1 | 27,541 | 1,542 | ||||||
| ServiceNow, Inc.1 | 3,115 | 1,456 | ||||||
| Wolfspeed, Inc.1 | 18,406 | 1,385 | ||||||
| NVIDIA Corp. | 7,133 | 1,332 | ||||||
| Tyler Technologies, Inc.1 | 3,639 | 1,295 | ||||||
| Salesforce, Inc.1 | 7,796 | 1,249 | ||||||
| Shopify, Inc., Class A, subordinate voting shares1 | 3,111 | 1,167 | ||||||
| Fidelity National Information Services, Inc. | 9,347 | 977 | ||||||
| RingCentral, Inc., Class A1 | 15,085 | 952 | ||||||
| Bill.com Holdings, Inc.1 | 7,984 | 944 | ||||||
| Visa, Inc., Class A | 4,277 | 907 | ||||||
| Keyence Corp. | 2,000 | 801 | ||||||
| Genpact, Ltd. | 17,806 | 790 | ||||||
| Trimble, Inc.1 | 10,789 | 734 | ||||||
| Unity Software, Inc.1 | 17,044 | 681 | ||||||
| MongoDB, Inc., Class A1 | 2,702 | 641 | ||||||
| Intel Corp. | 13,336 | 592 | ||||||
| GoDaddy, Inc., Class A1 | 7,657 | 575 | ||||||
| Ceridian HCM Holding, Inc.1 | 9,461 | 533 | ||||||
| NetApp, Inc. | 7,046 | 507 | ||||||
| Amadeus IT Group SA, Class A, non-registered shares1 | 8,082 | 502 | ||||||
| Concentrix Corp. | 3,178 | 492 | ||||||
| MicroStrategy, Inc., Class A1 | 1,646 | 436 | ||||||
| Nuvei Corp., subordinate voting shares1,2 | 8,459 | 433 | ||||||
| 63,635 | ||||||||
| Consumer discretionary 19.47% | ||||||||
| Tesla, Inc.1 | 31,273 | 23,713 | ||||||
| Amazon.com, Inc.1 | 2,540 | 6,107 | ||||||
| Dollar General Corp. | 24,299 | 5,354 | ||||||
| Home Depot, Inc. | 9,574 | 2,898 | ||||||
| D.R. Horton, Inc. | 32,550 | 2,446 | ||||||
| LVMH Moët Hennessy-Louis Vuitton SE | 3,178 | 2,037 | ||||||
| Las Vegas Sands Corp.1 | 53,804 | 1,908 | ||||||
| Chipotle Mexican Grill, Inc.1 | 1,216 | 1,705 | ||||||
| Booking Holdings, Inc.1 | 644 | 1,445 | ||||||
| Capital Group Equity Exchange-Traded Funds | 3 |
Capital Group Growth ETF (continued)
| Common stocks (continued) | Shares | Value (000) | ||||||
| Consumer discretionary (continued) | ||||||||
| Hermès International | 1,094 | $ | 1,304 | |||||
| Airbnb, Inc., Class A1 | 10,123 | 1,224 | ||||||
| Royal Caribbean Cruises, Ltd.1 | 18,382 | 1,067 | ||||||
| NVR, Inc.1 | 230 | 1,024 | ||||||
| Target Corp. | 5,280 | 855 | ||||||
| Aramark | 22,408 | 772 | ||||||
| Darden Restaurants, Inc. | 5,719 | 715 | ||||||
| Norwegian Cruise Line Holdings, Ltd.1 | 37,601 | 602 | ||||||
| Caesars Entertainment, Inc.1 | 7,588 | 381 | ||||||
| 55,557 | ||||||||
| Communication services 16.01% | ||||||||
| Meta Platforms, Inc., Class A1 | 88,167 | 17,073 | ||||||
| Alphabet, Inc., Class C1 | 2,720 | 6,204 | ||||||
| Alphabet, Inc., Class A1 | 1,814 | 4,127 | ||||||
| Netflix, Inc.1 | 33,487 | 6,612 | ||||||
| Activision Blizzard, Inc. | 35,159 | 2,738 | ||||||
| Verizon Communications, Inc. | 46,559 | 2,388 | ||||||
| Charter Communications, Inc., Class A1 | 3,326 | 1,686 | ||||||
| Snap, Inc., Class A, nonvoting shares1 | 91,531 | 1,291 | ||||||
| ZoomInfo Technologies, Inc.1 | 29,945 | 1,209 | ||||||
| Comcast Corp., Class A | 26,125 | 1,157 | ||||||
| Frontier Communications Parent, Inc.1 | 30,737 | 797 | ||||||
| Pinterest, Inc., Class A1 | 19,948 | 392 | ||||||
| 45,674 | ||||||||
| Health care 13.70% | ||||||||
| UnitedHealth Group, Inc. | 16,164 | 8,030 | ||||||
| Regeneron Pharmaceuticals, Inc.1 | 10,809 | 7,185 | ||||||
| Intuitive Surgical, Inc.1 | 19,247 | 4,381 | ||||||
| Centene Corp.1 | 43,579 | 3,549 | ||||||
| Thermo Fisher Scientific, Inc. | 5,259 | 2,985 | ||||||
| Vertex Pharmaceuticals, Inc.1 | 8,673 | 2,330 | ||||||
| NovoCure, Ltd.1 | 27,573 | 2,216 | ||||||
| Alnylam Pharmaceuticals, Inc.1 | 12,904 | 1,623 | ||||||
| Moderna, Inc.1 | 7,014 | 1,019 | ||||||
| Edwards Lifesciences Corp.1 | 9,693 | 978 | ||||||
| Seagen, Inc.1 | 6,363 | 863 | ||||||
| AstraZeneca PLC | 6,506 | 857 | ||||||
| Danaher Corp. | 3,183 | 840 | ||||||
| Gilead Sciences, Inc. | 10,935 | 709 | ||||||
| Horizon Therapeutics PLC1 | 6,442 | 578 | ||||||
| Molina Healthcare, Inc.1 | 1,876 | 545 | ||||||
| Inari Medical, Inc.1 | 5,802 | 382 | ||||||
| 39,070 | ||||||||
| Industrials 9.08% | ||||||||
| Carrier Global Corp. | 86,352 | 3,395 | ||||||
| Jacobs Engineering Group, Inc. | 23,068 | 3,232 | ||||||
| TransDigm Group, Inc.1 | 5,257 | 3,183 | ||||||
| Delta Air Lines, Inc.1 | 73,479 | 3,063 | ||||||
| Uber Technologies, Inc.1 | 103,025 | 2,390 | ||||||
| United Rentals, Inc.1 | 6,841 | 2,040 | ||||||
| Caterpillar, Inc. | 7,192 | 1,552 | ||||||
| MTU Aero Engines AG | 7,103 | 1,402 | ||||||
| Robert Half International, Inc. | 13,469 | 1,214 | ||||||
| Ryanair Holdings PLC (ADR)1 | 13,920 | 1,214 | ||||||
| Airbus SE, non-registered shares | 10,266 | 1,199 | ||||||
| 4 | Capital Group Equity Exchange-Traded Funds |
Capital Group Growth ETF (continued)
| Common stocks (continued) | Shares | Value (000) | ||||||
| Industrials (continued) | ||||||||
| United Airlines Holdings, Inc.1 | 16,760 | $ | 798 | |||||
| Dun & Bradstreet Holdings, Inc.1 | 45,462 | 785 | ||||||
| Axon Enterprise, Inc.1 | 4,331 | 439 | ||||||
| 25,906 | ||||||||
| Financials 6.12% | ||||||||
| Bank of America Corp. | 146,469 | 5,449 | ||||||
| Capital One Financial Corp. | 16,507 | 2,111 | ||||||
| S&P Global, Inc. | 5,195 | 1,815 | ||||||
| First Republic Bank | 11,314 | 1,754 | ||||||
| KKR & Co., Inc. | 17,375 | 952 | ||||||
| Western Alliance Bancorporation | 11,058 | 900 | ||||||
| SVB Financial Group1 | 1,834 | 896 | ||||||
| MSCI, Inc. | 1,801 | 797 | ||||||
| Tradeweb Markets, Inc., Class A | 11,244 | 760 | ||||||
| Blackstone, Inc., nonvoting shares | 5,041 | 594 | ||||||
| Apollo Asset Management, Inc. | 9,268 | 534 | ||||||
| Intercontinental Exchange, Inc. | 4,559 | 467 | ||||||
| Signature Bank | 1,997 | 432 | ||||||
| 17,461 | ||||||||
| Energy 5.61% | ||||||||
| Halliburton Company | 119,548 | 4,842 | ||||||
| Canadian Natural Resources, Ltd. (CAD denominated) | 66,612 | 4,408 | ||||||
| Cenovus Energy, Inc. | 135,774 | 3,147 | ||||||
| EQT Corp. | 22,289 | 1,064 | ||||||
| Suncor Energy, Inc. | 22,299 | 897 | ||||||
| ConocoPhillips | 7,393 | 831 | ||||||
| EOG Resources, Inc. | 5,864 | 803 | ||||||
| 15,992 | ||||||||
| Materials 2.62% | ||||||||
| Wheaton Precious Metals Corp. | 40,490 | 1,673 | ||||||
| Grupo México, SAB de CV, Series B | 264,411 | 1,306 | ||||||
| Vale SA, ordinary nominative shares (ADR) | 60,086 | 1,085 | ||||||
| Linde PLC | 3,184 | 1,034 | ||||||
| Barrick Gold Corp. | 48,779 | 999 | ||||||
| CF Industries Holdings, Inc. | 7,716 | 762 | ||||||
| Allegheny Technologies, Inc.1 | 22,856 | 628 | ||||||
| 7,487 | ||||||||
| Consumer staples 1.97% | ||||||||
| Costco Wholesale Corp. | 4,212 | 1,964 | ||||||
| Constellation Brands, Inc., Class A | 6,924 | 1,700 | ||||||
| Altria Group, Inc. | 26,251 | 1,420 | ||||||
| Molson Coors Beverage Company, Class B, restricted voting shares | 9,482 | 529 | ||||||
| 5,613 | ||||||||
| Utilities 0.32% | ||||||||
| PG&E Corp.1 | 73,747 | 900 | ||||||
| Total common stocks (cost: $290,856,000) | 277,295 | |||||||
| Capital Group Equity Exchange-Traded Funds | 5 |
Capital Group Growth ETF (continued)
| Short-term securities 2.82% | Shares | Value (000) | ||||||
| Money market investments 2.82% | ||||||||
| Capital Group Central Cash Fund 0.85%3,4 | 80,564 | $ | 8,056 | |||||
| Total short-term securities (cost: $8,056,000) | 8,056 | |||||||
| Total investment securities 100.03% (cost: $298,912,000) | 285,351 | |||||||
| Other assets less liabilities (0.03)% | (82 | ) | ||||||
| Net assets 100.00% | $ | 285,269 | ||||||
Investments in affiliates4
| Value of affiliate at 2/22/20225 (000) | Additions (000) | Reductions (000) | Net realized gain (000) | Net unrealized appreciation (000) | Value of affiliate at 5/31/2022 (000) | Dividend income (000) | ||||||||||||||||||||||
| Short-term securities 2.82% | ||||||||||||||||||||||||||||
| Money market investments 2.82% | ||||||||||||||||||||||||||||
| Capital Group Central Cash Fund 0.85%3 | $ | — | $ | 12,829 | $ | 4,773 | $ | — | 6 | $ | — | 6 | $ | 8,056 | $ | 5 | ||||||||||||
| 1 | Security did not produce income during the last 12 months. |
| 2 | Acquired in a transaction exempt from registration under Rule 144A of the Securities Act of 1933. May be resold in the U.S. in transactions exempt from registration, normally to qualified institutional buyers. The total value of all such securities was $433,000, which represented 0.15% of the net assets of the fund. |
| 3 | Rate represents the seven-day yield at May 31, 2022. |
| 4 | Part of the same “group of investment companies” as the fund as defined under the Investment Company Act of 1940, as amended. |
| 5 | Commencement of operations. |
| 6 | Amount less than one thousand. |
Key to abbreviations
ADR = American Depositary Receipts
CAD = Canadian dollars
Refer to the notes to financial statements.
| 6 | Capital Group Equity Exchange-Traded Funds |
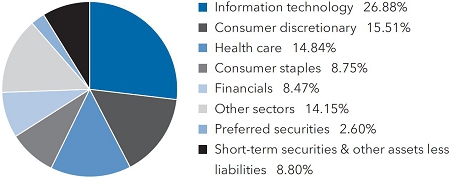
Capital Group Global Growth Equity ETF
Investment portfolio May 31, 2022
| Sector diversification | Percent of net assets |
| Country diversification by domicile | Percent of net assets | |||
| United States | 48.55 | % | ||
| Eurozone* | 15.88 | |||
| Taiwan | 5.65 | |||
| United Kingdom | 4.43 | |||
| Hong Kong | 2.20 | |||
| China | 2.19 | |||
| India | 2.14 | |||
| Switzerland | 1.88 | |||
| Canada | 1.60 | |||
| Other | 6.68 | |||
| Short-term securities & other assets less liabilities | 8.80 | |||
| * | Countries using the euro as a common currency; those represented in the fund’s portfolio are France, Germany and the Netherlands. |
| Common stocks 88.60% | Shares | Value (000) | ||||||
| Information technology 26.88% | ||||||||
| Microsoft Corp. | 56,520 | $ | 15,366 | |||||
| ASML Holding NV | 21,797 | 12,543 | ||||||
| Taiwan Semiconductor Manufacturing Company, Ltd. (ADR) | 130,461 | 12,433 | ||||||
| Adyen NV1,2 | 2,240 | 3,480 | ||||||
| Applied Materials, Inc. | 29,575 | 3,469 | ||||||
| Broadcom, Inc. | 4,267 | 2,475 | ||||||
| Fiserv, Inc.2 | 19,768 | 1,980 | ||||||
| Hexagon AB, Class B | 132,546 | 1,614 | ||||||
| Keyence Corp. | 3,200 | 1,282 | ||||||
| Zendesk, Inc.2 | 13,931 | 1,274 | ||||||
| NVIDIA Corp. | 6,492 | 1,212 | ||||||
| MongoDB, Inc., Class A2 | 4,853 | 1,151 | ||||||
| EPAM Systems, Inc.2 | 2,723 | 922 | ||||||
| 59,201 | ||||||||
| Consumer discretionary 15.51% | ||||||||
| Chipotle Mexican Grill, Inc.2 | 4,771 | 6,692 | ||||||
| Amazon.com, Inc.2 | 2,357 | 5,667 | ||||||
| LVMH Moët Hennessy-Louis Vuitton SE | 7,933 | 5,086 | ||||||
| Floor & Decor Holdings, Inc., Class A2 | 31,481 | 2,375 | ||||||
| Domino’s Pizza, Inc. | 5,327 | 1,935 | ||||||
| Renault SA2 | 66,733 | 1,830 | ||||||
| NIKE, Inc., Class B | 13,894 | 1,651 | ||||||
| Cie. Financière Richemont SA, Class A | 13,464 | 1,493 | ||||||
| Prosus NV, Class N | 28,461 | 1,475 | ||||||
| Home Depot, Inc. | 3,552 | 1,075 | ||||||
| Booking Holdings, Inc.2 | 427 | 958 | ||||||
| Domino’s Pizza Enterprises, Ltd. | 19,011 | 939 | ||||||
| IDP Education, Ltd. | 47,480 | 820 | ||||||
| MercadoLibre, Inc.2 | 993 | 780 | ||||||
| Coupang, Inc., Class A2 | 53,644 | 725 | ||||||
| MGM China Holdings, Ltd.2 | 1,289,200 | 651 | ||||||
| 34,152 | ||||||||
| Health care 14.84% | ||||||||
| UnitedHealth Group, Inc. | 10,339 | 5,136 | ||||||
| Pfizer, Inc. | 65,511 | 3,475 | ||||||
| AstraZeneca PLC | 25,161 | 3,315 | ||||||
| ResMed, Inc. | 13,112 | 2,668 | ||||||
| Cigna Corp. | 9,408 | 2,524 | ||||||
| DexCom, Inc.2 | 8,418 | 2,508 | ||||||
| Capital Group Equity Exchange-Traded Funds | 7 |
Capital Group Global Growth Equity ETF (continued)
| Common stocks (continued) | Shares | Value (000) | ||||||
| Health care (continued) | ||||||||
| Regeneron Pharmaceuticals, Inc.2 | 3,710 | $ | 2,466 | |||||
| Merck & Co., Inc. | 25,510 | 2,348 | ||||||
| Mettler-Toledo International, Inc.2 | 1,731 | 2,226 | ||||||
| CVS Health Corp. | 16,057 | 1,554 | ||||||
| Fisher & Paykel Healthcare Corp., Ltd. | 95,105 | 1,301 | ||||||
| Bayer AG | 16,557 | 1,183 | ||||||
| NovoCure, Ltd.2 | 12,737 | 1,024 | ||||||
| Tandem Diabetes Care, Inc.2 | 13,979 | 953 | ||||||
| 32,681 | ||||||||
| Consumer staples 8.75% | ||||||||
| British American Tobacco PLC | 120,366 | 5,312 | ||||||
| Philip Morris International, Inc. | 31,998 | 3,400 | ||||||
| Kweichow Moutai Co., Ltd., Class A | 12,300 | 3,333 | ||||||
| Nestlé SA | 21,593 | 2,634 | ||||||
| Altria Group, Inc. | 44,890 | 2,428 | ||||||
| Keurig Dr Pepper, Inc. | 62,508 | 2,171 | ||||||
| 19,278 | ||||||||
| Financials 8.47% | ||||||||
| AIA Group, Ltd. | 407,000 | 4,196 | ||||||
| Tradeweb Markets, Inc., Class A | 56,145 | 3,796 | ||||||
| Kotak Mahindra Bank, Ltd. | 105,176 | 2,502 | ||||||
| AXA SA | 78,010 | 1,969 | ||||||
| JPMorgan Chase & Co. | 11,992 | 1,585 | ||||||
| Société Générale | 46,741 | 1,255 | ||||||
| Citigroup, Inc. | 23,351 | 1,247 | ||||||
| Prudential PLC | 87,652 | 1,146 | ||||||
| Ping An Insurance (Group) Company of China, Ltd., Class H | 151,000 | 968 | ||||||
| 18,664 | ||||||||
| Communication services 4.87% | ||||||||
| Alphabet, Inc., Class A2 | 3,919 | 8,916 | ||||||
| Meta Platforms, Inc., Class A2 | 9,367 | 1,814 | ||||||
| 10,730 | ||||||||
| Industrials 4.04% | ||||||||
| MTU Aero Engines AG | 7,631 | 1,506 | ||||||
| Caterpillar, Inc. | 6,957 | 1,502 | ||||||
| DSV A/S | 8,785 | 1,442 | ||||||
| Airbus SE, non-registered shares | 11,028 | 1,288 | ||||||
| Alliance Global Group, Inc. | 5,749,800 | 1,174 | ||||||
| NIBE Industrier AB, Class B | 119,577 | 1,042 | ||||||
| GT Capital Holdings, Inc. | 97,940 | 940 | ||||||
| 8,894 | ||||||||
| Energy 3.09% | ||||||||
| Canadian Natural Resources, Ltd. (CAD denominated) | 53,163 | 3,518 | ||||||
| Reliance Industries, Ltd. | 64,763 | 2,196 | ||||||
| Equinor ASA | 28,089 | 1,081 | ||||||
| Gazprom PJSC (ADR)3 | 18,466 | — | 4 | |||||
| 6,795 | ||||||||
| Materials 1.91% | ||||||||
| Sherwin-Williams Company | 15,668 | 4,200 | ||||||
| 8 | Capital Group Equity Exchange-Traded Funds |
Capital Group Global Growth Equity ETF (continued)
| Common stocks (continued) | Shares | Value (000) | ||||||
| Real estate 0.24% | ||||||||
| Country Garden Services Holdings Co., Ltd. | 135,000 | $ | 535 | |||||
| Total common stocks (cost: $199,793,000) | 195,130 | |||||||
| Preferred securities 2.60% | ||||||||
| Health care 1.53% | ||||||||
| Sartorius AG, nonvoting non-registered preferred shares | 8,363 | 3,372 | ||||||
| Information technology 1.07% | ||||||||
| Samsung Electronics Co., Ltd., nonvoting preferred shares | 48,244 | 2,367 | ||||||
| Total preferred securities (cost: $5,557,000) | 5,739 | |||||||
| Short-term securities 10.05% | ||||||||
| Money market investments 10.05% | ||||||||
| Capital Group Central Cash Fund 0.85%5,6 | 221,270 | 22,127 | ||||||
| Total short-term securities (cost: $22,127,000) | 22,127 | |||||||
| Total investment securities 101.25% (cost: $227,477,000) | 222,996 | |||||||
| Other assets less liabilities (1.25)% | (2,753 | ) | ||||||
| Net assets 100.00% | $ | 220,243 | ||||||
| Investments in affiliates6 | ||||||||||||||||||||||||||||
| Value of affiliate at 2/22/20227 (000) | Additions (000) | Reductions (000) | Net realized loss (000) | Net unrealized appreciation (000) | Value of affiliate at 5/31/2022 (000) | Dividend income (000) | ||||||||||||||||||||||
| Short-term securities 10.05% | ||||||||||||||||||||||||||||
| Money market investments 10.05% | ||||||||||||||||||||||||||||
| Capital Group Central Cash Fund 0.85%5 | $ | — | $ | 35,041 | $ | 12,914 | $ | — | 4 | $ | — | 4 | $ | 22,127 | $ | 11 | ||||||||||||
| 1 | Acquired in a transaction exempt from registration under Rule 144A of the Securities Act of 1933. May be resold in the U.S. in transactions exempt from registration, normally to qualified institutional buyers. The total value of all such securities was $3,480,000, which represented 1.58% of the net assets of the fund. |
| 2 | Security did not produce income during the last 12 months. |
| 3 | Value determined using significant unobservable inputs. |
| 4 | Amount less than one thousand. |
| 5 | Rate represents the seven-day yield at May 31, 2022. |
| 6 | Part of the same “group of investment companies” as the fund as defined under the Investment Company Act of 1940, as amended. |
| 7 | Commencement of operations. |
Key to abbreviations
ADR = American Depositary Receipts
CAD = Canadian dollars
Refer to the notes to financial statements.
| Capital Group Equity Exchange-Traded Funds | 9 |
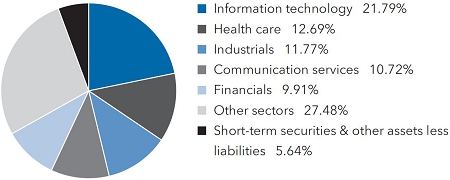
Capital Group International Focus Equity ETF
Investment portfolio May 31, 2022
| Sector diversification | Percent of net assets |

| Country diversification by domicile | Percent of net assets | |||
| Eurozone* | 22.86 | % | ||
| Japan | 12.94 | |||
| India | 10.83 | |||
| Canada | 7.80 | |||
| China | 5.71 | |||
| Brazil | 4.83 | |||
| Hong Kong | 3.50 | |||
| Australia | 3.36 | |||
| United Kingdom | 3.32 | |||
| Other | 12.74 | |||
| Short-term securities & other assets less liabilities | 12.11 | |||
| * | Countries using the euro as a common currency; those represented in the fund’s portfolio are Belgium, Finland, France, Germany, Ireland, Italy, the Netherlands and Spain. |
| Common stocks 87.89% | Shares | Value (000) | ||||||
| Industrials 14.06% | ||||||||
| Airbus SE, non-registered shares | 42,033 | $ | 4,909 | |||||
| Recruit Holdings Co., Ltd. | 100,400 | 3,692 | ||||||
| Ryanair Holdings PLC (ADR)1 | 23,728 | 2,069 | ||||||
| Melrose Industries PLC | 1,070,193 | 1,826 | ||||||
| Safran SA | 17,141 | 1,771 | ||||||
| International Container Terminal Services, Inc. | 335,030 | 1,388 | ||||||
| ASSA ABLOY AB, Class B | 54,347 | 1,337 | ||||||
| Siemens AG | 9,629 | 1,266 | ||||||
| MTU Aero Engines AG | 6,173 | 1,218 | ||||||
| SMC Corp. | 2,300 | 1,190 | ||||||
| Ashtead Group PLC | 22,670 | 1,186 | ||||||
| NIBE Industrier AB, Class B | 124,888 | 1,088 | ||||||
| Kingspan Group PLC | 12,826 | 1,057 | ||||||
| Shenzhen Inovance Technology Co., Ltd., Class A | 101,000 | 929 | ||||||
| Aena SME, SA, non-registered shares1,2 | 5,123 | 782 | ||||||
| Grab Holdings, Ltd., Class A1 | 280,354 | 746 | ||||||
| 26,454 | ||||||||
| Information technology 12.60% | ||||||||
| Taiwan Semiconductor Manufacturing Company, Ltd. | 191,000 | 3,685 | ||||||
| ASML Holding NV | 5,597 | 3,221 | ||||||
| Shopify, Inc., Class A, subordinate voting shares1 | 6,787 | 2,546 | ||||||
| Nice, Ltd. (ADR)1 | 11,866 | 2,358 | ||||||
| Nomura Research Institute, Ltd. | 82,700 | 2,280 | ||||||
| SK hynix, Inc. | 20,983 | 1,832 | ||||||
| Fujitsu, Ltd. | 11,700 | 1,758 | ||||||
| STMicroelectronics NV | 40,157 | 1,605 | ||||||
| Samsung Electronics Co., Ltd. | 22,814 | 1,243 | ||||||
| Atlassian Corp. PLC, Class A1 | 6,914 | 1,226 | ||||||
| NXP Semiconductors NV | 5,617 | 1,066 | ||||||
| Infineon Technologies AG | 28,203 | 876 | ||||||
| 23,696 | ||||||||
| Health care 11.21% | ||||||||
| Daiichi Sankyo Company, Ltd. | 230,200 | 6,114 | ||||||
| Olympus Corp. | 161,000 | 3,365 | ||||||
| Grifols, SA, Class A, non-registered shares | 106,984 | 2,250 | ||||||
| WuXi Biologics (Cayman), Inc.1,2 | 302,000 | 2,232 | ||||||
| Bayer AG | 22,051 | 1,576 | ||||||
| WuXi AppTec Co., Ltd., Class H2 | 118,300 | 1,460 | ||||||
| M3, Inc. | 41,100 | 1,193 | ||||||
| 10 | Capital Group Equity Exchange-Traded Funds |
Capital Group International Focus Equity ETF (continued)
| Common stocks (continued) | Shares | Value (000) | ||||||
| Health care (continued) | ||||||||
| Siemens Healthineers AG2 | 18,606 | $ | 1,116 | |||||
| Alcon, Inc. | 13,570 | 1,016 | ||||||
| Hapvida Participacoes e Investimentos SA2 | 538,501 | 761 | ||||||
| 21,083 | ||||||||
| Financials 11.15% | ||||||||
| Kotak Mahindra Bank, Ltd. | 208,983 | 4,971 | ||||||
| AIA Group, Ltd. | 375,800 | 3,874 | ||||||
| ABN AMRO Bank NV2 | 277,004 | 3,243 | ||||||
| HDFC Bank, Ltd. (ADR) | 33,215 | 1,912 | ||||||
| Aegon NV | 324,382 | 1,732 | ||||||
| CaixaBank, SA | 355,076 | 1,284 | ||||||
| ING Groep NV | 101,831 | 1,151 | ||||||
| XP, Inc., Class A1 | 48,605 | 1,099 | ||||||
| Bajaj Finance, Ltd. | 11,323 | 887 | ||||||
| KBC Groep NV | 12,996 | 811 | ||||||
| 20,964 | ||||||||
| Materials 10.75% | ||||||||
| First Quantum Minerals, Ltd. | 273,466 | 7,918 | ||||||
| Vale SA, ordinary nominative shares (ADR) | 204,600 | 3,693 | ||||||
| Fortescue Metals Group, Ltd. | 255,561 | 3,688 | ||||||
| Shin-Etsu Chemical Co., Ltd. | 16,900 | 2,407 | ||||||
| Linde PLC (EUR denominated)1 | 5,192 | 1,680 | ||||||
| Ivanhoe Mines, Ltd., Class A1 | 110,493 | 842 | ||||||
| 20,228 | ||||||||
| Energy 9.83% | ||||||||
| Reliance Industries, Ltd. | 246,061 | 8,344 | ||||||
| Petróleo Brasileiro SA (Petrobras), ordinary nominative shares (ADR) | 213,399 | 2,962 | ||||||
| Neste OYJ | 47,813 | 2,192 | ||||||
| Canadian Natural Resources, Ltd. (CAD denominated) | 27,140 | 1,796 | ||||||
| TotalEnergies SE | 26,968 | 1,610 | ||||||
| Cenovus Energy, Inc. | 68,253 | 1,582 | ||||||
| 18,486 | ||||||||
| Consumer discretionary 8.38% | ||||||||
| MercadoLibre, Inc.1 | 3,939 | 3,095 | ||||||
| Evolution AB2 | 23,826 | 2,492 | ||||||
| Sony Group Corp. | 25,000 | 2,353 | ||||||
| LVMH Moët Hennessy-Louis Vuitton SE | 2,728 | 1,749 | ||||||
| Galaxy Entertainment Group, Ltd. | 320,000 | 1,707 | ||||||
| Ferrari NV | 8,470 | 1,649 | ||||||
| Maruti Suzuki India, Ltd. | 11,538 | 1,184 | ||||||
| Entain PLC1 | 51,553 | 950 | ||||||
| Americanas SA, ordinary nominative shares | 139,876 | 591 | ||||||
| 15,770 | ||||||||
| Consumer staples 3.65% | ||||||||
| Kweichow Moutai Co., Ltd., Class A | 7,900 | 2,141 | ||||||
| Danone SA | 31,958 | 1,878 | ||||||
| British American Tobacco PLC | 32,343 | 1,427 | ||||||
| Treasury Wine Estates, Ltd. | 165,311 | 1,412 | ||||||
| 6,858 | ||||||||
| Capital Group Equity Exchange-Traded Funds | 11 |
Capital Group International Focus Equity ETF (continued)
| Common stocks (continued) | Shares | Value (000) | ||||||
| Communication services 3.62% | ||||||||
| Bharti Airtel, Ltd.1 | 339,911 | $ | 3,066 | |||||
| Universal Music Group NV | 49,663 | 1,114 | ||||||
| Sea, Ltd., Class A (ADR)1 | 11,119 | 919 | ||||||
| Informa PLC1 | 124,844 | 857 | ||||||
| Ubisoft Entertainment SA1 | 16,320 | 854 | ||||||
| 6,810 | ||||||||
| Utilities 2.11% | ||||||||
| ENN Energy Holdings, Ltd. | 259,400 | 3,977 | ||||||
| Real estate 0.53% | ||||||||
| ESR Cayman, Ltd.1,2 | 335,600 | 994 | ||||||
| Total common stocks (cost: $165,575,000) | 165,320 | |||||||
| Short-term securities 12.83% | ||||||||
| Money market investments 12.83% | ||||||||
| Capital Group Central Cash Fund 0.85%3,4 | 241,229 | 24,123 | ||||||
| Total short-term securities (cost: $24,123,000) | 24,123 | |||||||
| Total investment securities 100.72% (cost: $189,698,000) | 189,443 | |||||||
| Other assets less liabilities (0.72)% | (1,347 | ) | ||||||
| Net assets 100.00% | $ | 188,096 | ||||||
| Investments in affiliates4 | ||||||||||||||||||||||||||||
| Value of affiliate at 2/22/20225 (000) | Additions (000) | Reductions (000) | Net realized gain (000) | Net unrealized appreciation (000) | Value of affiliate at 5/31/2022 (000) | Dividend income (000) | ||||||||||||||||||||||
| Short-term securities 12.83% | ||||||||||||||||||||||||||||
| Money market investments 12.83% | ||||||||||||||||||||||||||||
| Capital Group Central Cash Fund 0.85%3 | $ | — | $ | 45,230 | $ | 21,107 | $ | — | 6 | $ | — | 6 | $ | 24,123 | $ | 16 | ||||||||||||
| 1 | Security did not produce income during the last 12 months. |
| 2 | Acquired in a transaction exempt from registration under Rule 144A of the Securities Act of 1933. May be resold in the U.S. in transactions exempt from registration, normally to qualified institutional buyers. The total value of all such securities was $13,080,000, which represented 6.95% of the net assets of the fund. |
| 3 | Rate represents the seven-day yield at May 31, 2022. |
| 4 | Part of the same “group of investment companies” as the fund as defined under the Investment Company Act of 1940, as amended. |
| 5 | Commencement of operations. |
| 6 | Amount less than one thousand. |
Key to abbreviations
ADR = American Depositary Receipts
CAD = Canadian dollars
EUR = Euros
Refer to the notes to financial statements.
| 12 | Capital Group Equity Exchange-Traded Funds |
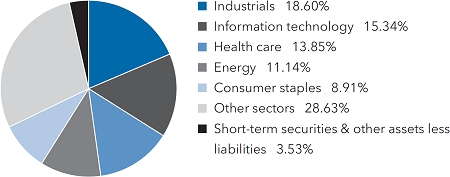
Capital Group Core Equity ETF
Investment portfolio May 31, 2022
| Sector diversification | Percent of net assets |
| Largest equity holdings | Percent of net assets | |||
| Microsoft | 6.29 | % | ||
| Broadcom | 4.50 | |||
| Alphabet | 4.26 | |||
| UnitedHealth Group | 3.68 | |||
| Amazon.com | 2.82 | |||
| Abbott Laboratories | 2.31 | |||
| Philip Morris International | 2.15 | |||
| Meta Platforms | 2.11 | |||
| Comcast | 1.93 | |||
| Raytheon Technologies | 1.87 | |||
| Common stocks 94.36% | Shares | Value (000) | ||||||
| Information technology 21.79% | ||||||||
| Microsoft Corp. | 37,991 | $ | 10,329 | |||||
| Broadcom, Inc. | 12,747 | 7,395 | ||||||
| Mastercard, Inc., Class A | 8,242 | 2,949 | ||||||
| Apple, Inc. | 13,502 | 2,010 | ||||||
| Visa, Inc., Class A | 7,938 | 1,684 | ||||||
| Accenture PLC, Class A | 4,176 | 1,246 | ||||||
| ASML Holding NV | 2,081 | 1,197 | ||||||
| Automatic Data Processing, Inc. | 5,087 | 1,134 | ||||||
| Applied Materials, Inc. | 7,805 | 915 | ||||||
| Taiwan Semiconductor Manufacturing Company, Ltd. | 44,000 | 849 | ||||||
| Fidelity National Information Services, Inc. | 6,917 | 723 | ||||||
| Concentrix Corp. | 4,511 | 699 | ||||||
| Global Payments, Inc. | 5,206 | 682 | ||||||
| FleetCor Technologies, Inc.1 | 2,438 | 607 | ||||||
| QUALCOMM, Inc. | 4,129 | 591 | ||||||
| GoDaddy, Inc., Class A1 | 7,595 | 570 | ||||||
| Cognizant Technology Solutions Corp., Class A | 7,078 | 529 | ||||||
| Intel Corp. | 11,790 | 524 | ||||||
| Euronet Worldwide, Inc.1 | 4,150 | 503 | ||||||
| ServiceNow, Inc.1 | 1,034 | 483 | ||||||
| Dye & Durham, Ltd. | 9,004 | 166 | ||||||
| 35,785 | ||||||||
| Health care 12.69% | ||||||||
| UnitedHealth Group, Inc. | 12,157 | 6,039 | ||||||
| Abbott Laboratories | 32,232 | 3,786 | ||||||
| AbbVie, Inc. | 11,177 | 1,647 | ||||||
| Novo Nordisk A/S, Class B | 11,771 | 1,304 | ||||||
| Anthem, Inc. | 2,454 | 1,250 | ||||||
| AstraZeneca PLC | 7,632 | 1,006 | ||||||
| Thermo Fisher Scientific, Inc. | 1,692 | 960 | ||||||
| Humana, Inc. | 2,061 | 936 | ||||||
| Danaher Corp. | 3,408 | 899 | ||||||
| GSK PLC | 30,826 | 673 | ||||||
| PerkinElmer, Inc. | 4,425 | 662 | ||||||
| Eli Lilly and Company | 2,111 | 662 | ||||||
| Pfizer, Inc. | 11,663 | 619 | ||||||
| Seagen, Inc.1 | 2,971 | 403 | ||||||
| 20,846 | ||||||||
| Industrials 11.77% | ||||||||
| Raytheon Technologies Corp. | 32,306 | 3,073 | ||||||
| General Electric Co. | 29,075 | 2,276 | ||||||
| Carrier Global Corp. | 42,493 | 1,671 | ||||||
| Northrop Grumman Corp. | 3,480 | 1,629 | ||||||
| Capital Group Equity Exchange-Traded Funds | 13 |
Capital Group Core Equity ETF (continued)
| Common stocks (continued) | Shares | Value (000) | ||||||
| Industrials (continued) | ||||||||
| Woodward, Inc. | 12,356 | $ | 1,256 | |||||
| General Dynamics Corp. | 5,475 | 1,231 | ||||||
| TFI International, Inc. | 13,762 | 1,129 | ||||||
| Waste Connections, Inc. | 8,642 | 1,102 | ||||||
| TransDigm Group, Inc.1 | 1,359 | 823 | ||||||
| Lockheed Martin Corp. | 1,688 | 743 | ||||||
| Waste Management, Inc. | 4,473 | 709 | ||||||
| BWX Technologies, Inc. | 13,523 | 692 | ||||||
| Norfolk Southern Corp. | 2,795 | 670 | ||||||
| ITT, Inc. | 8,591 | 634 | ||||||
| Old Dominion Freight Line, Inc. | 2,398 | 619 | ||||||
| Air Lease Corp., Class A | 11,754 | 442 | ||||||
| Safran SA | 3,099 | 320 | ||||||
| Airbus SE, non-registered shares | 2,641 | 309 | ||||||
| 19,328 | ||||||||
| Communication services 10.72% | ||||||||
| Alphabet, Inc., Class A1 | 1,795 | 4,084 | ||||||
| Alphabet, Inc., Class C1 | 1,280 | 2,919 | ||||||
| Meta Platforms, Inc., Class A1 | 17,936 | 3,473 | ||||||
| Comcast Corp., Class A | 71,640 | 3,172 | ||||||
| Netflix, Inc.1 | 8,610 | 1,700 | ||||||
| Charter Communications, Inc., Class A1 | 2,383 | 1,208 | ||||||
| Electronic Arts, Inc. | 5,891 | 817 | ||||||
| Tencent Holdings, Ltd. | 5,300 | 245 | ||||||
| 17,618 | ||||||||
| Financials 9.91% | ||||||||
| JPMorgan Chase & Co. | 22,487 | 2,973 | ||||||
| PNC Financial Services Group, Inc. | 7,964 | 1,397 | ||||||
| BlackRock, Inc. | 2,056 | 1,376 | ||||||
| Marsh & McLennan Companies, Inc. | 7,970 | 1,275 | ||||||
| Chubb, Ltd. | 5,925 | 1,252 | ||||||
| Bank of America Corp. | 27,717 | 1,031 | ||||||
| Arthur J. Gallagher & Co. | 5,237 | 848 | ||||||
| Aon PLC, Class A | 2,762 | 761 | ||||||
| B3 SA-Brasil, Bolsa, Balcao | 273,171 | 734 | ||||||
| Intercontinental Exchange, Inc. | 6,900 | 707 | ||||||
| Charles Schwab Corp. | 10,028 | 703 | ||||||
| Discover Financial Services | 5,500 | 624 | ||||||
| Moody’s Corp. | 2,057 | 620 | ||||||
| KeyCorp | 26,842 | 536 | ||||||
| Webster Financial Corp. | 10,365 | 509 | ||||||
| American International Group, Inc. | 8,260 | 485 | ||||||
| State Street Corp. | 6,239 | 452 | ||||||
| 16,283 | ||||||||
| Consumer discretionary 8.36% | ||||||||
| Amazon.com, Inc.1 | 1,929 | 4,638 | ||||||
| General Motors Company1 | 47,315 | 1,830 | ||||||
| Dollar Tree Stores, Inc.1 | 6,919 | 1,109 | ||||||
| Wyndham Hotels & Resorts, Inc. | 12,709 | 1,018 | ||||||
| Hilton Worldwide Holdings, Inc. | 7,226 | 1,018 | ||||||
| Royal Caribbean Cruises, Ltd.1 | 16,422 | 954 | ||||||
| Home Depot, Inc. | 3,097 | 938 | ||||||
| InterContinental Hotels Group PLC | 9,697 | 603 | ||||||
| Lear Corp. | 3,466 | 488 | ||||||
| 14 | Capital Group Equity Exchange-Traded Funds |
Capital Group Core Equity ETF (continued)
| Common stocks (continued) | Shares | Value (000) | ||||||
| Consumer discretionary (continued) | ||||||||
| Chipotle Mexican Grill, Inc.1 | 348 | $ | 488 | |||||
| Kering SA | 622 | 340 | ||||||
| Rivian Automotive, Inc., Class A1 | 9,937 | 312 | ||||||
| 13,736 | ||||||||
| Energy 6.11% | ||||||||
| Canadian Natural Resources, Ltd. (CAD denominated) | 39,501 | 2,614 | ||||||
| Chevron Corp. | 12,423 | 2,170 | ||||||
| ConocoPhillips | 17,582 | 1,976 | ||||||
| Baker Hughes Co., Class A | 36,534 | 1,314 | ||||||
| EOG Resources, Inc. | 6,905 | 946 | ||||||
| TC Energy Corp. | 10,271 | 594 | ||||||
| Equitrans Midstream Corp. | 53,342 | 420 | ||||||
| 10,034 | ||||||||
| Consumer staples 4.85% | ||||||||
| Philip Morris International, Inc. | 33,287 | 3,537 | ||||||
| British American Tobacco PLC | 47,323 | 2,088 | ||||||
| Keurig Dr Pepper, Inc. | 25,634 | 891 | ||||||
| Molson Coors Beverage Company, Class B, restricted voting shares | 10,354 | 578 | ||||||
| Nestlé SA | 3,835 | 468 | ||||||
| Anheuser-Busch InBev SA/NV | 7,292 | 408 | ||||||
| 7,970 | ||||||||
| Materials 2.97% | ||||||||
| Linde PLC | 3,872 | 1,257 | ||||||
| LyondellBasell Industries NV | 9,300 | 1,062 | ||||||
| Celanese Corp. | 6,591 | 1,032 | ||||||
| Vale SA, ordinary nominative shares (ADR) | 50,160 | 905 | ||||||
| Freeport-McMoRan, Inc. | 15,828 | 619 | ||||||
| 4,875 | ||||||||
| Utilities 2.77% | ||||||||
| PG&E Corp.1 | 99,599 | 1,215 | ||||||
| Edison International | 11,724 | 820 | ||||||
| Sempra Energy | 4,075 | 668 | ||||||
| CenterPoint Energy, Inc. | 19,745 | 633 | ||||||
| AES Corp. | 28,364 | 625 | ||||||
| Enel SpA | 90,001 | 584 | ||||||
| 4,545 | ||||||||
| Real estate 2.42% | ||||||||
| VICI Properties, Inc. REIT | 70,323 | 2,169 | ||||||
| Equinix, Inc. REIT | 1,417 | 974 | ||||||
| Crown Castle International Corp. REIT | 4,356 | 826 | ||||||
| 3,969 | ||||||||
| Total common stocks (cost: $156,472,000) | 154,989 | |||||||
| Capital Group Equity Exchange-Traded Funds | 15 |
Capital Group Core Equity ETF (continued)
| Short-term securities 5.44% | Shares | Value (000) | ||||||
| Money market investments 5.44% | ||||||||
| Capital Group Central Cash Fund 0.85%2,3 | 89,385 | $ | 8,939 | |||||
| Total short-term securities (cost: $8,939,000) | 8,939 | |||||||
| Total investment securities 99.80% (cost: $165,411,000) | 163,928 | |||||||
| Other assets less liabilities 0.20% | 323 | |||||||
| Net assets 100.00% | $ | 164,251 | ||||||
| Investments in affiliates3 | ||||||||||||||||||||||||||||
| Value of affiliate at 2/22/20224 (000) | Additions (000) | Reductions (000) | Net realized gain (000) | Net unrealized appreciation (000) | Value of affiliate at 5/31/2022 (000) | Dividend income (000) | ||||||||||||||||||||||
| Short-term securities 5.44% | ||||||||||||||||||||||||||||
| Money market investments 5.44% | ||||||||||||||||||||||||||||
| Capital Group Central Cash Fund 0.85%2 | $ | — | $ | 13,490 | $ | 4,551 | $ | — | 5 | $ | — | 5 | $ | 8,939 | $ | 5 | ||||||||||||
| 1 | Security did not produce income during the last 12 months. |
| 2 | Rate represents the seven-day yield at May 31, 2022. |
| 3 | Part of the same “group of investment companies” as the fund as defined under the Investment Company Act of 1940, as amended. |
| 4 | Commencement of operations. |
| 5 | Amount less than one thousand. |
Key to abbreviations
ADR = American Depositary Receipts
CAD = Canadian dollars
Refer to the notes to financial statements.
| 16 | Capital Group Equity Exchange-Traded Funds |
Capital Group Dividend Value ETF
Investment portfolio May 31, 2022
| Sector diversification | Percent of net assets |
| Largest equity holdings | Percent of net assets | |||
| Microsoft | 6.30 | % | ||
| Broadcom | 6.14 | |||
| Raytheon Technologies | 5.78 | |||
| Philip Morris International | 4.92 | |||
| Abbott Laboratories | 4.62 | |||
| General Electric | 4.00 | |||
| Baker Hughes | 3.68 | |||
| Comcast | 3.63 | |||
| Edison International | 3.50 | |||
| British American Tobacco | 2.93 | |||
| Common stocks 96.47% | Shares | Value (000) | ||||||
| Industrials 18.60% | ||||||||
| Raytheon Technologies Corp. | 183,017 | $ | 17,408 | |||||
| General Electric Co. | 153,580 | 12,024 | ||||||
| General Dynamics Corp. | 37,404 | 8,412 | ||||||
| Carrier Global Corp. | 150,030 | 5,898 | ||||||
| Illinois Tool Works, Inc. | 18,297 | 3,807 | ||||||
| Union Pacific Corp. | 14,732 | 3,238 | ||||||
| TFI International, Inc. | 33,018 | 2,709 | ||||||
| Stanley Black & Decker, Inc. | 20,782 | 2,467 | ||||||
| 55,963 | ||||||||
| Information technology 15.34% | ||||||||
| Microsoft Corp. | 69,754 | 18,964 | ||||||
| Broadcom, Inc. | 31,829 | 18,465 | ||||||
| Apple, Inc. | 58,718 | 8,740 | ||||||
| 46,169 | ||||||||
| Health care 13.85% | ||||||||
| Abbott Laboratories | 118,314 | 13,897 | ||||||
| UnitedHealth Group, Inc. | 15,428 | 7,664 | ||||||
| Amgen, Inc. | 26,263 | 6,743 | ||||||
| Gilead Sciences, Inc. | 77,856 | 5,049 | ||||||
| Medtronic PLC | 43,429 | 4,349 | ||||||
| AbbVie, Inc. | 26,930 | 3,969 | ||||||
| 41,671 | ||||||||
| Energy 11.14% | ||||||||
| Baker Hughes Co., Class A | 307,860 | 11,077 | ||||||
| Canadian Natural Resources, Ltd. | 109,733 | 7,278 | ||||||
| EOG Resources, Inc. | 46,568 | 6,378 | ||||||
| Chevron Corp. | 34,329 | 5,996 | ||||||
| Halliburton Company | 69,188 | 2,802 | ||||||
| 33,531 | ||||||||
| Consumer staples 8.91% | ||||||||
| Philip Morris International, Inc. | 139,316 | 14,802 | ||||||
| British American Tobacco PLC | 199,619 | 8,809 | ||||||
| Coca-Cola Company | 50,204 | 3,182 | ||||||
| 26,793 | ||||||||
| Capital Group Equity Exchange-Traded Funds | 17 |
Capital Group Dividend Value ETF (continued)
| Common stocks (continued) | Shares | Value (000) | ||||||
| Communication services 8.05% | ||||||||
| Comcast Corp., Class A | 246,879 | $ | 10,932 | |||||
| Meta Platforms, Inc., Class A1 | 22,658 | 4,388 | ||||||
| Alphabet, Inc., Class A1 | 1,806 | 4,109 | ||||||
| Omnicom Group, Inc. | 39,769 | 2,967 | ||||||
| Netflix, Inc.1 | 9,224 | 1,821 | ||||||
| 24,217 | ||||||||
| Consumer discretionary 7.13% | ||||||||
| McDonald’s Corp. | 27,545 | 6,947 | ||||||
| TopBuild Corp.1 | 16,491 | 3,253 | ||||||
| Aptiv PLC1 | 29,987 | 3,186 | ||||||
| General Motors Company1 | 81,622 | 3,157 | ||||||
| Amazon.com, Inc.1 | 1,228 | 2,952 | ||||||
| Burlington Stores, Inc.1 | 11,621 | 1,956 | ||||||
| 21,451 | ||||||||
| Utilities 4.52% | ||||||||
| Edison International | 150,604 | 10,529 | ||||||
| Public Service Enterprise Group, Inc. | 44,689 | 3,063 | ||||||
| 13,592 | ||||||||
| Financials 4.05% | ||||||||
| American International Group, Inc. | 108,331 | 6,357 | ||||||
| JPMorgan Chase & Co. | 44,009 | 5,819 | ||||||
| 12,176 | ||||||||
| Materials 3.53% | ||||||||
| Linde PLC | 25,733 | 8,355 | ||||||
| Freeport-McMoRan, Inc. | 58,148 | 2,273 | ||||||
| 10,628 | ||||||||
| Real estate 1.35% | ||||||||
| Crown Castle International Corp. REIT | 21,445 | 4,067 | ||||||
| Total common stocks (cost: $293,448,000) | 290,258 | |||||||
| Short-term securities 3.35% | ||||||||
| Money market investments 3.35% | ||||||||
| Capital Group Central Cash Fund 0.85%2,3 | 100,768 | 10,077 | ||||||
| Total short-term securities (cost: $10,077,000) | 10,077 | |||||||
| Total investment securities 99.82% (cost: $303,525,000) | 300,335 | |||||||
| Other assets less liabilities 0.18% | 539 | |||||||
| Net assets 100.00% | $ | 300,874 | ||||||
| 18 | Capital Group Equity Exchange-Traded Funds |
Capital Group Dividend Value ETF (continued)
Investments in affiliates3
| Value of affiliate at 2/22/20224 (000) | Additions (000) | Reductions (000) | Net realized loss (000) | Net unrealized appreciation (000) | Value of affiliate at 5/31/2022 (000) | Dividend income (000) | ||||||||||||||||||||||
| Short-term securities 3.35% | ||||||||||||||||||||||||||||
| Money market investments 3.35% | ||||||||||||||||||||||||||||
| Capital Group Central Cash Fund 0.85%2 | $ | — | $ | 15,284 | $ | 5,207 | $ | — | 5 | $ | — | 5 | $ | 10,077 | $ | 7 |
| 1 | Security did not produce income during the last 12 months. |
| 2 | Rate represents the seven-day yield at May 31, 2022. |
| 3 | Part of the same “group of investment companies” as the fund as defined under the Investment Company Act of 1940, as amended. |
| 4 | Commencement of operations. |
| 5 | Amount less than one thousand. |
Refer to the notes to financial statements.
| Capital Group Equity Exchange-Traded Funds | 19 |
| Financial statements | |
| Statements of assets and liabilities at May 31, 2022 | (dollars and shares in thousands, except per-share amounts) |
| Growth ETF | Global Growth Equity ETF | International Focus Equity ETF | Core Equity ETF | Dividend Value ETF | ||||||||||||||||
| Assets: | ||||||||||||||||||||
| Investment securities, at value: | ||||||||||||||||||||
| Unaffiliated issuers | $ | 277,295 | $ | 200,869 | $ | 165,320 | $ | 154,989 | $ | 290,258 | ||||||||||
| Affiliated issuers | 8,056 | 22,127 | 24,123 | 8,939 | 10,077 | |||||||||||||||
| Cash | 51 | — | — | 24 | 254 | |||||||||||||||
| Cash denominated in currencies other than U.S. dollars | — | * | 220 | 25 | — | * | — | |||||||||||||
| Receivables for: | ||||||||||||||||||||
| Sales of investments | 252 | 404 | 321 | — | — | |||||||||||||||
| Sales of fund’s shares | 4,456 | 1,734 | — | 3,796 | 8,890 | |||||||||||||||
| Dividends and interest | 112 | 124 | 459 | 108 | 271 | |||||||||||||||
| 290,222 | 225,478 | 190,248 | 167,856 | 309,750 | ||||||||||||||||
| Liabilities: | ||||||||||||||||||||
| Payables for: | ||||||||||||||||||||
| Purchases of investments | 4,881 | 4,702 | 536 | 3,571 | 8,814 | |||||||||||||||
| Investment advisory services | 72 | 65 | 62 | 34 | 62 | |||||||||||||||
| Bank overdraft | — | 429 | 1,494 | — | — | |||||||||||||||
| Non-U.S. taxes | — | 39 | 60 | — | — | |||||||||||||||
| 4,953 | 5,235 | 2,152 | 3,605 | 8,876 | ||||||||||||||||
| Net assets at May 31, 2022 | $ | 285,269 | $ | 220,243 | $ | 188,096 | $ | 164,251 | $ | 300,874 | ||||||||||
| Net assets consist of: | ||||||||||||||||||||
| Capital paid in on shares of beneficial interest | 300,232 | 228,061 | 190,367 | 166,541 | 303,812 | |||||||||||||||
| Total accumulated loss | (14,963 | ) | (7,818 | ) | (2,271 | ) | (2,290 | ) | (2,938 | ) | ||||||||||
| Net assets at May 31, 2022 | $ | 285,269 | $ | 220,243 | $ | 188,096 | $ | 164,251 | $ | 300,874 | ||||||||||
| Shares of beneficial interest issued and outstanding (no stated par value) — unlimited shares authorized | ||||||||||||||||||||
| Net assets | $ | 285,269 | $ | 220,243 | $ | 188,096 | $ | 164,251 | $ | 300,874 | ||||||||||
| Shares outstanding | 12,804 | 10,164 | 8,244 | 6,924 | 12,244 | |||||||||||||||
| Net asset value per share | $ | 22.28 | $ | 21.67 | $ | 22.82 | $ | 23.72 | $ | 24.57 | ||||||||||
| Investment securities, at cost: | ||||||||||||||||||||
| Unaffiliated issuers | $ | 290,856 | $ | 205,350 | $ | 165,575 | $ | 156,472 | $ | 293,448 | ||||||||||
| Affiliated issuers | 8,056 | 22,127 | 24,123 | 8,939 | 10,077 | |||||||||||||||
| Cash denominated in currencies other than U.S. dollars, at cost | — | * | 220 | 25 | — | * | — | |||||||||||||
| * | Amount less than one thousand. |
Refer to the notes to financial statements.
| 20 | Capital Group Equity Exchange-Traded Funds |
| Financial statements (continued) | |
| Statements of operations for the period February 22, 2022, commencement of operations, to May 31, 2022 | (dollars in thousands) |
| Growth ETF | Global Growth Equity ETF | International Focus Equity ETF | Core Equity ETF | Dividend Value ETF | ||||||||||||||||
| Investment income: | ||||||||||||||||||||
| Income (net of non-U.S. taxes*): | ||||||||||||||||||||
| Dividends: | ||||||||||||||||||||
| Unaffiliated issuers | $ | 329 | $ | 525 | $ | 1,077 | $ | 348 | $ | 646 | ||||||||||
| Affiliated issuers | 5 | 11 | 16 | 5 | 7 | |||||||||||||||
| 334 | 536 | 1,093 | 353 | 653 | ||||||||||||||||
| Fees and expenses: | ||||||||||||||||||||
| Investment advisory services | 147 | 133 | 130 | 73 | 117 | |||||||||||||||
| Net investment income | 187 | 403 | 963 | 280 | 536 | |||||||||||||||
| Net realized (loss) gain and unrealized depreciation: | ||||||||||||||||||||
| Net realized (loss) gain* on: | ||||||||||||||||||||
| Investments in: | ||||||||||||||||||||
| Unaffiliated issuers | (1,588 | ) | (3,688 | ) | (2,884 | ) | (1,006 | ) | (177 | ) | ||||||||||
| Affiliated issuers | — | † | — | † | — | † | — | † | — | † | ||||||||||
| In-kind redemptions | 148 | — | — | — | 262 | |||||||||||||||
| Currency transactions | (2 | ) | (11 | ) | (31 | ) | (1 | ) | (2 | ) | ||||||||||
| (1,442 | ) | (3,699 | ) | (2,915 | ) | (1,007 | ) | 83 | ||||||||||||
| Net unrealized (depreciation) appreciation* on: | ||||||||||||||||||||
| Investments in: | ||||||||||||||||||||
| Unaffiliated issuers | (13,561 | ) | (4,520 | ) | (317 | ) | (1,483 | ) | (3,190 | ) | ||||||||||
| Affiliated issuers | — | † | — | † | — | † | — | † | — | † | ||||||||||
| Currency translations | — | (2 | ) | (2 | ) | — | — | |||||||||||||
| (13,561 | ) | (4,522 | ) | (319 | ) | (1,483 | ) | (3,190 | ) | |||||||||||
| Net realized (loss) gain and unrealized depreciation | (15,003 | ) | (8,221 | ) | (3,234 | ) | (2,490 | ) | (3,107 | ) | ||||||||||
| Net decrease in net assets resulting from operations | $ | (14,816 | ) | $ | (7,818 | ) | $ | (2,271 | ) | $ | (2,210 | ) | $ | (2,571 | ) | |||||
| * | Additional information related to non-U.S. taxes, if any, is included in the notes to financial statements. |
| † | Amount less than one thousand. |
Refer to the notes to financial statements.
| Capital Group Equity Exchange-Traded Funds | 21 |
| Financial statements (continued) | |
| Statements of changes in net assets | (dollars in thousands) |
| Growth ETF | Global Growth Equity ETF | International Focus Equity ETF | ||||||||||
| Period ended May 31, 2022* | Period ended May 31, 2022* | Period ended May 31, 2022* | ||||||||||
| Operations: | ||||||||||||
| Net investment income | $ | 187 | $ | 403 | $ | 963 | ||||||
| Net realized (loss) gain | (1,442 | ) | (3,699 | ) | (2,915 | ) | ||||||
| Net unrealized depreciation | (13,561 | ) | (4,522 | ) | (319 | ) | ||||||
| Total decrease in net assets resulting from operations | (14,816 | ) | (7,818 | ) | (2,271 | ) | ||||||
| Distributions paid to shareholders | — | — | — | |||||||||
| Net capital share transactions | 300,085 | 228,061 | 190,367 | |||||||||
| Total increase in net assets | 285,269 | 220,243 | 188,096 | |||||||||
| Net assets: | ||||||||||||
| Beginning of period | — | — | — | |||||||||
| End of period | $ | 285,269 | $ | 220,243 | $ | 188,096 | ||||||
| Core Equity ETF | Dividend Value ETF | |||||||||||
| Period ended May 31, 2022* | Period ended May 31, 2022* | |||||||||||
| Operations: | ||||||||||||
| Net investment income | $ | 280 | $ | 536 | ||||||||
| Net realized (loss) gain | (1,007 | ) | 83 | |||||||||
| Net unrealized depreciation | (1,483 | ) | (3,190 | ) | ||||||||
| Total decrease in net assets resulting from operations | (2,210 | ) | (2,571 | ) | ||||||||
| Distributions paid to shareholders | (80 | ) | (105 | ) | ||||||||
| Net capital share transactions | 166,541 | 303,550 | ||||||||||
| Total increase in net assets | 164,251 | 300,874 | ||||||||||
| Net assets: | ||||||||||||
| Beginning of period | — | — | ||||||||||
| End of period | $ | 164,251 | $ | 300,874 | ||||||||
| * | For the period February 22, 2022, commencement of operations, to May 31, 2022. |
Refer to the notes to financial statements.
| 22 | Capital Group Equity Exchange-Traded Funds |
Notes to financial statements
1. Organization
Capital Group Growth ETF (“Growth ETF”), Capital Group Global Growth Equity ETF (“Global Growth Equity ETF”), Capital Group International Focus Equity ETF (“International Focus Equity ETF”), Capital Group Core Equity ETF (“Core Equity ETF”), and Capital Group Dividend Value ETF (“Dividend Value ETF”) (each a “fund”, or collectively the “funds”) were each organized on January 12, 2021, as a Delaware statutory trust. Each fund’s fiscal year ends on May 31. The funds, each operating as an exchange-traded fund, are registered under the Investment Company Act of 1940, as amended, as open-end, non-diversified management investment companies.
Each fund’s investment objectives are as follows:
Growth ETF – To provide growth of capital.
Global Growth Equity ETF – To provide long-term growth of capital.
International Focus Equity ETF – To provide long-term growth of capital.
Core Equity ETF – To achieve long-term growth of capital and income.
Dividend Value ETF – To produce income exceeding the average yield on U.S. stocks generally and provide an opportunity for growth of principal consistent with sound common stock investing.
2. Significant accounting policies
Each fund is an investment company that applies the accounting and reporting guidance issued in Topic 946 by the U.S. Financial Accounting Standards Board. Each fund’s financial statements have been prepared to comply with U.S. generally accepted accounting principles (“U.S. GAAP”). These principles require the funds’ investment adviser to make estimates and assumptions that affect reported amounts and disclosures. Actual results could differ from those estimates. Subsequent events, if any, have been evaluated through the date of issuance in the preparation of the financial statements. The funds follow the significant accounting policies described in this section, as well as the valuation policies described in the next section on valuation.
Security transactions and related investment income — Security transactions are recorded by the funds as of the date the trades are executed with brokers. Realized gains and losses from security transactions are determined based on the specific identified cost of the securities. In the event a security is purchased with a delayed payment date, the funds will segregate liquid assets sufficient to meet their payment obligations. Dividend income is recognized on the ex-dividend date and interest income is recognized on an accrual basis. Market discounts, premiums and original issue discounts on fixed-income securities are amortized daily over the expected life of the security.
Distributions paid to shareholders — Income dividends and capital gain distributions are recorded on each fund’s ex-dividend date.
Currency translation — Assets and liabilities, including investment securities, denominated in currencies other than U.S. dollars are translated into U.S. dollars at the exchange rates supplied by one or more pricing vendors on the valuation date. Purchases and sales of investment securities and income and expenses are translated into U.S. dollars at the exchange rates on the dates of such transactions. The effects of changes in exchange rates on investment securities are included with the net realized gain or loss and net unrealized appreciation or depreciation on investments in each fund’s statement of operations. The realized gain or loss and unrealized appreciation or depreciation resulting from all other transactions denominated in currencies other than U.S. dollars are disclosed separately.
3. Valuation
Capital Research and Management Company (“CRMC”), the funds’ investment adviser, values each fund’s investments at fair value as defined by U.S. GAAP. The net asset value per share of each fund is calculated once daily as of the close of regular trading on the New York Stock Exchange, normally 4 p.m. New York time, each day the New York Stock Exchange is open. Security transactions are recorded by each fund as of the date the trades are executed with brokers. Assets and liabilities, including investment securities, denominated in currencies other than U.S. dollars are translated into U.S. dollars at the exchange rates supplied by one or more pricing vendors on the valuation date.
| Capital Group Equity Exchange-Traded Funds | 23 |
Methods and inputs — The funds’ investment adviser uses the following methods and inputs to establish the fair value of each fund’s assets and liabilities. Use of particular methods and inputs may vary over time based on availability and relevance as market and economic conditions evolve.
Equity securities are generally valued at the official closing price of, or the last reported sale price on, the exchange or market on which such securities are traded, as of the close of business on the day the securities are being valued or, lacking any sales, at the last available bid price. Prices for each security are taken from the principal exchange or market on which the security trades.
Fixed-income securities, including short-term securities, are generally valued at prices obtained from one or more pricing vendors. Vendors value such securities based on one or more of the inputs described in the following table. The table provides examples of inputs that are commonly relevant for valuing particular classes of fixed-income securities in which the funds are authorized to invest. However, these classifications are not exclusive, and any of the inputs may be used to value any other class of fixed-income security.
| Fixed-income class | Examples of standard inputs | |
| All | Benchmark yields, transactions, bids, offers, quotations from dealers and trading systems, new issues, spreads and other relationships observed in the markets among comparable securities; and proprietary pricing models such as yield measures calculated using factors such as cash flows, financial or collateral performance and other reference data (collectively referred to as “standard inputs”) | |
| Corporate bonds, notes & loans; convertible securities | Standard inputs and underlying equity of the issuer | |
| Bonds & notes of governments & government agencies | Standard inputs and interest rate volatilities | |
| Mortgage-backed; asset-backed obligations | Standard inputs and cash flows, prepayment information, default rates, delinquency and loss assumptions, collateral characteristics, credit enhancements and specific deal information |
When the funds’ investment adviser deems it appropriate to do so (such as when vendor prices are unavailable or deemed to be not representative), fixed-income securities will be valued in good faith at the mean quoted bid and ask prices that are reasonably and timely available (or bid prices, if ask prices are not available) or at prices for securities of comparable maturity, quality and type.
Securities with both fixed-income and equity characteristics, or equity securities traded principally among fixed-income dealers, are generally valued in the manner described for either equity or fixed-income securities, depending on which method is deemed most appropriate by the funds’ investment adviser. The Capital Group Central Cash Fund (“CCF”), a fund within the Capital Group Central Fund Series (“Central Funds”), is valued based upon a floating net asset value, which fluctuates with changes in the value of CCF’s portfolio securities. The underlying securities are valued based on the policies and procedures in CCF’s statement of additional information.
Securities and other assets for which representative market quotations are not readily available or are considered unreliable by the funds’ investment adviser are fair valued as determined in good faith under fair value guidelines adopted by authority of each fund’s board of trustees as further described. The investment adviser follows fair valuation guidelines, consistent with U.S. Securities and Exchange Commission rules and guidance, to consider relevant principles and factors when making fair value determinations. The investment adviser considers relevant indications of value that are reasonably and timely available to it in determining the fair value to be assigned to a particular security, such as the type and cost of the security; contractual or legal restrictions on resale of the security; relevant financial or business developments of the issuer; actively traded similar or related securities; conversion or exchange rights on the security; related corporate actions; significant events occurring after the close of trading in the security; and changes in overall market conditions. In addition, the closing prices of equity securities that trade in markets outside U.S. time zones may be adjusted to reflect significant events that occur after the close of local trading but before the net asset value of each fund is determined. Fair valuations and valuations of investments that are not actively trading involve judgment and may differ materially from valuations that would have been used had greater market activity occurred.
Processes and structure — Each fund’s board of trustees has delegated authority to the funds’ investment adviser to make fair value determinations, subject to board oversight. The investment adviser has established a Joint Fair Valuation Committee (the “Fair Valuation Committee”) to administer, implement and oversee the fair valuation process, and to make fair value decisions. The Fair Valuation Committee regularly reviews its own fair value decisions, as well as decisions made under its standing instructions to the investment adviser’s valuation teams. The Fair Valuation Committee reviews changes in fair value measurements from period to period and may, as deemed appropriate, update the fair valuation guidelines to better reflect the results of back testing and address new or evolving issues. The Fair Valuation Committee reports any changes to the fair valuation guidelines to the board of trustees. Each fund’s board and audit committee also regularly review reports that describe fair value determinations and methods.
| 24 | Capital Group Equity Exchange-Traded Funds |
The funds’ investment adviser has also established a Fixed-Income Pricing Review Group to administer and oversee the fixed-income valuation process, including the use of fixed-income pricing vendors. This group regularly reviews pricing vendor information and market data. Pricing decisions, processes and controls over security valuation are also subject to additional internal reviews facilitated by the investment adviser’s global risk management group.
Classifications — The funds’ investment adviser classifies each fund’s assets and liabilities into three levels based on the inputs used to value the assets or liabilities. Level 1 values are based on quoted prices in active markets for identical securities. Level 2 values are based on significant observable market inputs, such as quoted prices for similar securities and quoted prices in inactive markets. Certain securities trading outside the U.S. may transfer between Level 1 and Level 2 due to valuation adjustments resulting from significant market movements following the close of local trading. Level 3 values are based on significant unobservable inputs that reflect the investment adviser’s determination of assumptions that market participants might reasonably use in valuing the securities. The valuation levels are not necessarily an indication of the risk or liquidity associated with the underlying investment. For example, U.S. government securities are reflected as Level 2 because the inputs used to determine fair value may not always be quoted prices in an active market. The following tables present the funds’ valuation levels as of May 31, 2022 (dollars in thousands):
Growth ETF
At May 31, 2022, all of the fund’s investment securities were classified as Level 1.
Global Growth Equity ETF
| Investment securities | ||||||||||||||||
| Level 1 | Level 2 | Level 3 | Total | |||||||||||||
| Assets: | ||||||||||||||||
| Common stocks: | ||||||||||||||||
| Information technology | $ | 59,201 | $ | — | $ | — | $ | 59,201 | ||||||||
| Consumer discretionary | 34,152 | — | — | 34,152 | ||||||||||||
| Health care | 32,681 | — | — | 32,681 | ||||||||||||
| Consumer staples | 19,278 | — | — | 19,278 | ||||||||||||
| Financials | 18,664 | — | — | 18,664 | ||||||||||||
| Communication services | 10,730 | — | — | 10,730 | ||||||||||||
| Industrials | 8,894 | — | — | 8,894 | ||||||||||||
| Energy | 6,795 | — | — | * | 6,795 | |||||||||||
| Materials | 4,200 | — | — | 4,200 | ||||||||||||
| Real estate | 535 | — | — | 535 | ||||||||||||
| Preferred securities | 5,739 | — | — | 5,739 | ||||||||||||
| Short-term securities | 22,127 | — | — | 22,127 | ||||||||||||
| Total | $ | 222,996 | $ | — | $ | — | * | $ | 222,996 | |||||||
| * | Amount less than one thousand. |
International Focus Equity ETF
At May 31, 2022, all of the fund’s investment securities were classified as Level 1.
Core Equity ETF
At May 31, 2022, all of the fund’s investment securities were classified as Level 1.
Dividend Value ETF
At May 31, 2022, all of the fund’s investment securities were classified as Level 1.
4. Risk factors
Investing in each fund may involve certain risks including, but not limited to, those described below.
Market conditions — The prices of, and the income generated by, the common stocks and other securities held by a fund may decline due to various factors, including events or conditions affecting the general economy or particular industries; overall market changes; local, regional or global political, social or economic instability; governmental, governmental agency or central bank responses to economic conditions; and currency exchange rate, interest rate and commodity price fluctuations.
| Capital Group Equity Exchange-Traded Funds | 25 |
Economies and financial markets throughout the world are highly interconnected. Events (including public health emergencies, such as the spread of infectious disease) and other circumstances in one country or region could have impacts on global economies or markets. As a result, whether or not a fund invests in securities of issuers located in or with significant exposure to the countries affected, the value and liquidity of the fund’s investments may be negatively affected by developments in other countries and regions.
Issuer risks — The prices of, and the income generated by, securities held by a fund may decline in response to various factors directly related to the issuers of such securities, including reduced demand for an issuer’s goods or services, poor management performance, major litigation, investigations or other controversies related to the issuer, changes in government regulations affecting the issuer or its competitive environment and strategic initiatives and the market response to any such initiatives.
Investing in growth-oriented stocks — Growth-oriented common stocks may involve larger price swings and greater potential for loss than other types of investments.
Investing in income-oriented stocks — The value of a fund’s securities and income provided by the fund may be reduced by changes in the dividend policies of, and the capital resources available for dividend payments at, the companies in which the fund invests.
Investing outside the U.S. — Securities of issuers domiciled outside the United States, or with significant operations or revenues outside the United States, may lose value because of adverse political, social, economic or market developments in the countries or regions in which the issuers operate or generate revenue. These securities may also lose value due to changes in foreign currency exchange rates against the U.S. dollar and/or currencies of other countries. Issuers of these securities may be more susceptible to actions of foreign governments, which could adversely impact the value of these securities. Securities markets in certain countries may be more volatile and/or less liquid than those in the United States. Investments outside the United States may also be subject to different accounting and auditing practices and standards and different regulatory, legal and reporting requirements, and may be more difficult to value, than those in the United States. In addition, the value of investments outside the United States may be reduced by foreign taxes. Further, there may be increased risks of delayed settlement of securities purchased or sold by the fund.
Investing in emerging markets — Investing in emerging markets may involve risks in addition to and greater than those generally associated with investing in the securities markets of developed countries. For instance, emerging market countries tend to have less developed political, economic and legal systems and accounting and auditing practices and standards than those in developed countries. Accordingly, the governments of these countries may be less stable and more likely to intervene in the market economy in a manner that could adversely affect the prices of securities. Information regarding issuers in emerging markets may be limited, incomplete or inaccurate, and there may be fewer rights and remedies available to the fund and its shareholders. In addition, the economies of these countries may be dependent on relatively few industries, may have limited access to capital and may be more susceptible to changes in local and global trade conditions and downturns in the world economy. Securities markets in these countries can also be relatively small and have substantially lower trading volumes. As a result, securities issued in these countries may be more volatile and less liquid, and may be more difficult to value, than securities issued in countries with more developed economies and/or markets. Less certainty with respect to security valuations may lead to additional challenges and risks in calculating the fund’s net asset value. Additionally, emerging markets are more likely to experience problems with the clearing and settling of trades and the holding of securities by banks, agents and depositories that are less established than those in developed countries.
Market trading — Each fund’s shares are listed for trading on an exchange and are bought and sold on the secondary market at market prices. The market prices of each fund’s shares are expected to fluctuate, in some cases materially, in response to changes in the fund’s net asset value (“NAV”), the intraday value of each fund’s holdings, and supply and demand for each fund’s shares. The existence of significant market volatility, disruptions to creations and redemptions, or potential lack of an active trading market for fund shares (including through a trading halt), among other factors, may result in the shares of each fund trading significantly above (at a premium) or below (at a discount) to NAV. If you buy fund shares when their market price is at a premium or sell the fund shares when their market price is at a discount, you may pay more than, or receive less than, NAV, respectively.
Foreign securities held by the funds may be traded in markets that close at a different time than the exchange on which the fund’s shares are listed. Liquidity in those securities may be reduced after the applicable closing times. Accordingly, during the time when the fund’s exchange is open but after the applicable market closing, fixing or settlement times, bid-ask spreads on the fund’s exchange and the corresponding premium or discount to the fund’s NAV may widen.
| 26 | Capital Group Equity Exchange-Traded Funds |
Authorized participant concentration — Only authorized participants may engage in creation or redemption transactions directly with each of the funds, and none of them is obligated to do so. Each fund has a limited number of institutions that may act as authorized participants. If authorized participants exit the business or are unable to or elect not to engage in creation or redemption transactions, and no other authorized participant engages in such function, fund shares may trade at a premium or discount to NAV and/or at wider intraday bid-ask spreads and possibly face trading halts or delisting.
Nondiversification — As nondiversified funds, each fund has the ability to invest a larger percentage of its assets in the securities of a smaller number of issuers than a diversified fund. As a result, poor performance by a single issuer could adversely affect fund performance more than if each fund were invested in a larger number of issuers. Each fund’s share price can be expected to fluctuate more than might be the case if each fund were more broadly diversified.
Management — The investment adviser to the funds actively manages the funds’ investments. Consequently, the funds are subject to the risk that the methods and analyses, including models, tools and data, employed by the investment adviser in this process may be flawed or incorrect and may not produce the desired results. This could cause the fund to lose value or its investment results to lag relevant benchmarks or other funds with similar objectives.
5. Taxation and distributions
Federal income taxation — Each fund complies with the requirements under Subchapter M of the Internal Revenue Code applicable to regulated investment companies and intends to distribute substantially all of its net taxable income and net capital gains each year. The funds are not subject to income taxes to the extent such distributions are made. Therefore, no federal income tax provision is required.
As of and during the period ended May 31, 2022, none of the funds had a liability for any unrecognized tax benefits. Each fund recognizes interest and penalties, if any, related to unrecognized tax benefits as income tax expense in their respective statements of operations. During the period, none of the funds incurred any significant interest or penalties.
Each fund’s tax returns are generally not subject to examination by federal, state and, if applicable, non-U.S. tax authorities after the expiration of each jurisdiction’s statute of limitations, which is typically three years after the date of filing but can be extended in certain jurisdictions.
Non-U.S. taxation — Dividend and interest income, if any, are recorded net of non-U.S. taxes paid. The funds may file withholding tax reclaims in certain jurisdictions to recover a portion of amounts previously withheld. These reclaims are recorded when the amount is known and there are no significant uncertainties on collectability. Gains realized by the funds on the sale of securities in certain countries, if any, may be subject to non-U.S. taxes. If applicable, the funds record an estimated deferred tax liability based on unrealized gains to provide for potential non-U.S. taxes payable upon the sale of these securities.
Distributions — Distributions determined on a tax basis may differ from net investment income and net realized gains for financial reporting purposes. These differences are due primarily to different treatment for items such as currency gains and losses; short-term capital gains and losses; capital losses related to sales of certain securities within 30 days of purchase; cost of investments sold; net capital losses and income on certain investments. The fiscal year in which amounts are distributed may differ from the year in which the net investment income and net realized gains are recorded by the funds for financial reporting purposes.
| Capital Group Equity Exchange-Traded Funds | 27 |
Additional tax basis disclosures for each fund as of May 31, 2022, were as follows (dollars in thousands):
| Growth ETF | Global Growth Equity ETF | International Focus Equity ETF | Core Equity ETF | Dividend Value ETF | ||||||||||||||||
| Undistributed ordinary income | $ | 185 | $ | 391 | $ | 945 | $ | 199 | $ | 430 | ||||||||||
| Capital loss carryforward* | (1,059 | ) | (3,092 | ) | (1,836 | ) | (841 | ) | (173 | ) | ||||||||||
| Gross unrealized appreciation on investments | 7,551 | 5,686 | 6,548 | 4,757 | 7,157 | |||||||||||||||
| Gross unrealized depreciation on investments | (21,639 | ) | (10,804 | ) | (7,928 | ) | (6,405 | ) | (10,351 | ) | ||||||||||
| Net unrealized depreciation on investments | (14,088 | ) | (5,118 | ) | (1,380 | ) | (1,648 | ) | (3,194 | ) | ||||||||||
| Cost of investments | 299,439 | 228,293 | 190,785 | 165,576 | 303,529 | |||||||||||||||
| Reclassification from total accumulated loss to capital paid in on shares of beneficial interest | 147 | — | — | — | 262 | |||||||||||||||
| * | Each fund’s capital loss carryforward will be used to offset any capital gains realized by the fund in future years. Funds with a capital loss carryforward will not make distributions from capital gains while a capital loss carryforward remains. |
Distributions paid by each fund during the period February 22, 2022, commencement of operations, to May 31, 2022, were characterized for tax purposes as follows (dollars in thousands):
| Fund | Ordinary income | Long-term capital gains | Total distributions paid | |||||||||
| Growth ETF | $ | — | $ | — | $ | — | ||||||
| Global Growth Equity ETF | — | — | — | |||||||||
| International Focus Equity ETF | — | — | — | |||||||||
| Core Equity ETF | 80 | — | 80 | |||||||||
| Dividend Value ETF | 105 | — | 105 | |||||||||
6. Fees and transactions
CRMC, the funds’ investment adviser, is the parent company of American Funds Distributors, Inc.® (“AFD”), the principal underwriter of the fund’s’ shares. CRMC and AFD are considered related parties to the funds.
Investment advisory services – Each fund has an investment advisory and service agreement with CRMC that provides for monthly fees, accrued daily. These fees are based on an annual rate of daily net assets as follows:
| Fund | Annual rate | |||
| Growth ETF | 0.39 | % | ||
| Global Growth Equity ETF | 0.47 | |||
| International Focus Equity ETF | 0.54 | |||
| Core Equity ETF | 0.33 | |||
| Dividend Value ETF | 0.33 | |||
Under the terms of the agreements, in addition to providing investment advisory services, the investment adviser and its affiliates provide certain administrative services to help assist third parties providing non-distribution services to the funds’ shareholders. These services include providing in-depth information on each fund and market developments that impact each fund’s investments. The agreement provides that the investment adviser will pay all ordinary operating expenses of each fund other than management fees, interest expenses, taxes, acquired fund fees and expenses, costs of holding shareholder meetings, legal fees and expenses relating to arbitration or litigation, payments under each fund’s plan of distribution (if any) and other non-routine or extraordinary expenses. Additionally, each fund will be responsible for its non-operating expenses, including brokerage commissions and fees and expenses associated with the fund’s securities lending program, if applicable.
Transfer agency and administration services — Each fund has entered into a transfer agency and service agreement and an administration agreement with State Street Bank and Trust Company (“State Street”). Under the terms of the transfer agency agreement, State Street (or an agent, including an affiliate) acts as transfer agent and dividend disbursing agent for each fund. Under the terms of the administration agreement, State Street provides necessary administrative, legal, tax and accounting, regulatory and financial reporting services for the maintenance and operations of each fund. The investment adviser bears the costs of services under these agreements.
| 28 | Capital Group Equity Exchange-Traded Funds |
Affiliated officers and trustees – Officers and certain trustees of each fund are or may be considered to be affiliated with CRMC and AFD. No affiliated officers or trustees received any compensation directly from any of the funds.
Investment in CCF — Each fund holds shares of CCF, an institutional prime money market fund managed by CRMC. CCF invests in high-quality, short-term money market instruments. CCF is used as the primary investment vehicle for each fund’s short-term investments. CCF shares are only available for purchase by CRMC, its affiliates, and other funds managed by CRMC. CCF shares are not available to the public. CRMC does not receive an investment advisory services fee from CCF.
Security transactions with related funds — Each fund may purchase from, or sell securities to, other CRMC-managed funds (or funds managed by certain affiliates of CRMC) under procedures adopted by each fund’s board of trustees. The funds involved in such transactions are considered related by virtue of having a common investment adviser (or affiliated investment advisers), common trustees and/or common officers. When such transactions occur, each transaction is executed at the current market price of the security and no brokerage commissions or fees are paid in accordance with Rule 17a-7 of the 1940 Act. None of the funds engaged in any such purchase or sale transactions with any related funds during the period ended May 31, 2022.
Interfund lending - Pursuant to an exemptive order issued by the SEC, the funds, along with other CRMC-managed funds (or funds managed by certain affiliates of CRMC), may participate in an interfund lending program. The program provides an alternate credit facility that permits the funds to lend or borrow cash for temporary purposes directly to or from one another, subject to the conditions of the exemptive order. None of the funds lent or borrowed cash through the interfund lending program at any time during the period ended May 31, 2022.
7. Indemnifications
Each fund’s organizational documents provide board members and officers with indemnification against certain liabilities or expenses in connection with the performance of their duties to the fund. In the normal course of business, each fund may also enter into contracts that provide general indemnifications. Each fund’s maximum exposure under these arrangements is unknown since it is dependent on future claims that may be made against each fund. The risk of material loss from such claims is considered remote. Insurance policies are also available to each fund’s board members and officers.
8. Capital share transactions
The funds issue and redeem shares at NAV only with certain authorized participants in large increments known as creation units. Purchases of creation units are made by tendering a basket of designated securities and cash to a fund, and redemption proceeds are paid with a basket of securities from a fund’s portfolio with a balancing cash component to equate the market value of the basket of securities delivered or redeemed to the NAV per creation unit on the transaction date. The funds may issue creation units to authorized participants in advance of the delivery and settlement of all or a portion of the designated securities. When this occurs, the authorized participant provides cash collateral in an amount equal to 105% of the daily marked to market value of the securities that have not yet been delivered to the fund. Cash may be substituted equivalent to the value of certain securities generally when they are not available in sufficient quantity for delivery. Realized gains or losses resulting from redemptions of shares in-kind are reflected separately in the fund’s statement of operations.
Each fund’s shares are available in smaller increments to investors in the secondary market at market prices and may be subject to commissions. Authorized participants pay a transaction fee to the shareholder servicing agent when purchasing and redeeming creation units of a fund. The transaction fee is used to defray the costs associated with the issuance and redemption of creation units. In addition, for cash creation unit transactions, a variable fee for creation transactions and redemption transactions may be charged to the authorized participant to cover certain brokerage, tax, foreign exchange, execution, market impact and other costs and expenses related to the execution of trades. Variable fees, if any, are included in capital share transactions in each fund’s statement of changes in net assets.
| Capital Group Equity Exchange-Traded Funds | 29 |
Capital share transactions in each of the funds were as follows (dollars and shares in thousands):
| Growth ETF | ||||||||||||||||||||||||||||||||
| Sales | Reinvestments of distributions | Repurchases | Net increase | |||||||||||||||||||||||||||||
| Amount | Shares | Amount | Shares | Amount | Shares | Amount | Shares | |||||||||||||||||||||||||
| For the period February 22, 2022*, through May 31, 2022 | ||||||||||||||||||||||||||||||||
| $ | 301,946 | 12,884 | $ | — | — | $ | (1,861 | ) | (80 | ) | $ | 300,085 | 12,804 | |||||||||||||||||||
| Global Growth Equity ETF | ||||||||||||||||||||||||||||||||
| Sales | Reinvestments of distributions | Repurchases | Net increase | |||||||||||||||||||||||||||||
| Amount | Shares | Amount | Shares | Amount | Shares | Amount | Shares | |||||||||||||||||||||||||
| For the period February 22, 2022*, through May 31, 2022 | ||||||||||||||||||||||||||||||||
| $ | 228,061 | 10,164 | $ | — | — | $ | — | — | $ | 228,061 | 10,164 | |||||||||||||||||||||
| International Focus Equity ETF | ||||||||||||||||||||||||||||||||
| Sales | Reinvestments of distributions | Repurchases | Net increase | |||||||||||||||||||||||||||||
| Amount | Shares | Amount | Shares | Amount | Shares | Amount | Shares | |||||||||||||||||||||||||
| For the period February 22, 2022*, through May 31, 2022 | ||||||||||||||||||||||||||||||||
| $ | 190,367 | 8,244 | $ | — | — | $ | — | — | $ | 190,367 | 8,244 | |||||||||||||||||||||
| Core Equity ETF | ||||||||||||||||||||||||||||||||
| Sales | Reinvestments of distributions | Repurchases | Net increase | |||||||||||||||||||||||||||||
| Amount | Shares | Amount | Shares | Amount | Shares | Amount | Shares | |||||||||||||||||||||||||
| For the period February 22, 2022*, through May 31, 2022 | ||||||||||||||||||||||||||||||||
| $ | 166,541 | 6,924 | $ | — | — | $ | — | — | $ | 166,541 | 6,924 | |||||||||||||||||||||
| Dividend Value ETF | ||||||||||||||||||||||||||||||||
| Sales | Reinvestments of distributions | Repurchases | Net increase | |||||||||||||||||||||||||||||
| Amount | Shares | Amount | Shares | Amount | Shares | Amount | Shares | |||||||||||||||||||||||||
| For the period February 22, 2022*, through May 31, 2022 | ||||||||||||||||||||||||||||||||
| $ | 311,566 | 12,584 | $ | — | — | $ | (8,016 | ) | (340 | ) | $ | 303,550 | 12,244 | |||||||||||||||||||
| * | Commencement of operations. |
9. Investment transactions
The following table presents purchases and sales of investments, excluding in-kind transactions, short-term securities and U.S. government obligations, if any, during the period February 22, 2022, commencement of operations, to May 31, 2022 (dollars in thousands):
| Fund | Purchases | Sales | ||||||
| Growth ETF | $ | 18,374 | $ | 13,778 | ||||
| Global Growth Equity ETF | 31,119 | 18,952 | ||||||
| International Focus Equity ETF | 57,375 | 19,808 | ||||||
| Core Equity ETF | 7,927 | 6,591 | ||||||
| Dividend Value ETF | 9,061 | 3,909 | ||||||
| 30 | Capital Group Equity Exchange-Traded Funds |
The following table presents the value of securities received and delivered in-kind from the authorized participants to support creation and redemption transactions, if any, during the period February 22, 2022, commencement of operations, to May 31, 2022 (dollars in thousands):
| Fund | In-kind creations | In-kind redemptions | ||||||
| Growth ETF | $ | 289,167 | $ | 1,468 | ||||
| Global Growth Equity ETF | 196,872 | — | ||||||
| International Focus Equity ETF | 130,892 | — | ||||||
| Core Equity ETF | 156,143 | — | ||||||
| Dividend Value ETF | 295,536 | 7,325 | ||||||
| Capital Group Equity Exchange-Traded Funds | 31 |
Financial highlights
| Loss from investment operations1 | Dividends and distributions | |||||||||||||||||||||||||||||||||||||||||||||||
| Period ended | Net asset value, beginning of period | Net investment income | Net losses on securities (both realized and unrealized) | Total from investment operations | Dividends (from net investment income) | Distributions (from capital gains) | Total dividends and distributions | Net asset value, end of period | Total return2 | Net assets, end of period (in millions) | Ratio of expenses to average net assets2,3 | Ratio of net income to average net assets2 | ||||||||||||||||||||||||||||||||||||
| Growth ETF | ||||||||||||||||||||||||||||||||||||||||||||||||
| 5/31/20224,5 | $ | 24.40 | $ | .03 | $ | (2.15 | ) | $ | (2.12 | ) | $ | — | $ | — | $ | — | $ | 22.28 | (8.69 | )% | $ | 285 | .10 | % | .13 | % | ||||||||||||||||||||||
| Global Growth Equity ETF | ||||||||||||||||||||||||||||||||||||||||||||||||
| 5/31/20224,5 | $ | 24.47 | $ | .08 | $ | (2.88 | ) | $ | (2.80 | ) | $ | — | $ | — | $ | — | $ | 21.67 | (11.44 | )% | $ | 220 | .13 | % | .38 | % | ||||||||||||||||||||||
| International Focus Equity ETF | ||||||||||||||||||||||||||||||||||||||||||||||||
| 5/31/20224,5 | $ | 24.51 | $ | .24 | $ | (1.93 | ) | $ | (1.69 | ) | $ | — | $ | — | $ | — | $ | 22.82 | (6.90 | )% | $ | 188 | .14 | % | 1.07 | % | ||||||||||||||||||||||
| Core Equity ETF | ||||||||||||||||||||||||||||||||||||||||||||||||
| 5/31/20224,5 | $ | 24.63 | $ | .08 | $ | (.96 | ) | $ | (.88 | ) | $ | (.03 | ) | $ | — | $ | (.03 | ) | $ | 23.72 | (3.59 | )% | $ | 164 | .09 | % | .34 | % | ||||||||||||||||||||
| Dividend Value ETF | ||||||||||||||||||||||||||||||||||||||||||||||||
| 5/31/20224,5 | $ | 24.71 | $ | .10 | $ | (.21 | ) | $ | (.11 | ) | $ | (.03 | ) | $ | — | $ | (.03 | ) | $ | 24.57 | (.46 | )% | $ | 301 | .09 | % | .41 | % | ||||||||||||||||||||
| Portfolio turnover rate6 | Period ended May 31, 20222,4,5 | |
| Growth ETF | 9 | % |
| Global Growth Equity ETF | 17 | |
| International Focus Equity ETF | 21 | |
| Core Equity ETF | 8 | |
| Dividend Value ETF | 3 | |
| 1 | Based on average shares outstanding. |
| 2 | Not annualized. |
| 3 | Ratios do not include expenses of any Central Funds. Each fund indirectly bears its proportionate share of the expenses of any Central Funds, if applicable. |
| 4 | Based on operations for a period that is less than a full year. |
| 5 | For the period February 22, 2022, commencement of operations, through May 31, 2022. |
| 6 | Rates do not include each fund’s portfolio activity with respect to any Central Funds. |
Refer to the notes to financial statements.
| 32 | Capital Group Equity Exchange-Traded Funds |
Report of Independent Registered Public Accounting Firm
To the Board of Trustees and Shareholders of Capital Group Growth ETF, Capital Group Global Growth Equity ETF, Capital Group International Focus Equity ETF, Capital Group Core Equity ETF, and Capital Group Dividend Value ETF
Opinions on the Financial Statements
We have audited the accompanying statement of assets and liabilities, including the investment portfolio, of Capital Group Growth ETF, Capital Group Global Growth Equity ETF, Capital Group International Focus Equity ETF, Capital Group Core Equity ETF, and Capital Group Dividend Value ETF (hereafter collectively referred to as the “Funds”) as of May 31, 2022, and the related statements of operations and changes in net assets, including the related notes, and the financial highlights for the period February 22, 2022 (commencement of operations) through May 31, 2022 (collectively referred to as the “financial statements”). In our opinion, the financial statements present fairly, in all material respects, the financial position of each of the Funds as of May 31, 2022, and the results of each of their operations, changes in their net assets and each of the financial highlights for the period February 22, 2022 (commencement of operations) through May 31, 2022 in conformity with accounting principles generally accepted in the United States of America.
Basis for Opinions
These financial statements are the responsibility of the Funds’ management. Our responsibility is to express an opinion on the Funds’ financial statements based on our audits. We are a public accounting firm registered with the Public Company Accounting Oversight Board (United States) (PCAOB) and are required to be independent with respect to the Funds in accordance with the U.S. federal securities laws and the applicable rules and regulations of the Securities and Exchange Commission and the PCAOB.
We conducted our audits of these financial statements in accordance with the standards of the PCAOB. Those standards require that we plan and perform the audit to obtain reasonable assurance about whether the financial statements are free of material misstatement, whether due to error or fraud.
Our audits included performing procedures to assess the risks of material misstatement of the financial statements, whether due to error or fraud, and performing procedures that respond to those risks. Such procedures included examining, on a test basis, evidence regarding the amounts and disclosures in the financial statements. Our audits also included evaluating the accounting principles used and significant estimates made by management, as well as evaluating the overall presentation of the financial statements. Our procedures included confirmation of securities owned as of May 31, 2022 by correspondence with the custodian, transfer agent and brokers; when replies were not received from brokers, we performed other auditing procedures. We believe that our audits provide a reasonable basis for our opinions.
/s/ PricewaterhouseCoopers LLP
Los Angeles, California
July 14, 2022
We have served as the auditor of one or more investment companies in The Capital Group Companies Investment Company Complex since 1934.
| Capital Group Equity Exchange-Traded Funds | 33 |
| Expense example | unaudited |
As a fund shareholder, you incur two types of costs: (1) transaction costs, such as initial sales charges on purchase payments and contingent deferred sales charges on redemptions (loads), and (2) ongoing costs, including management fees and other expenses. This example is intended to help you understand your ongoing costs (in dollars) of investing in the fund so you can compare these costs with the ongoing costs of investing in other mutual funds. The example is based on an investment of $1,000 invested at the beginning of the period and held for the entire six-month period.
Actual expenses:
The first line of each fund in the tables below provides information about actual account values and actual expenses. You may use the information in this line, together with the amount you invested, to estimate the expenses that you paid over the period. Simply divide your account value by $1,000 (for example, an $8,600 account value divided by $1,000 = 8.6), then multiply the result by the number in the first line under the heading titled “Expenses paid during period” to estimate the expenses you paid on your account during this period.
Hypothetical example for comparison purposes:
The second line of each fund in the tables below provides information about hypothetical account values and hypothetical expenses based on the actual expense ratio for the share class and an assumed rate of return of 5.00% per year before expenses, which is not the actual return of the share class. The hypothetical account values and expenses may not be used to estimate the actual ending account balance or expenses you paid for the period. You may use this information to compare the ongoing costs of investing in the fund and other funds. To do so, compare this 5.00% hypothetical example with the 5.00% hypothetical examples that appear in the shareholder reports of the other funds.
Notes:
Note that the expenses shown in the tables are meant to highlight your ongoing costs only and do not reflect any transactional costs. Therefore, the second line of each share class in the tables is useful in comparing ongoing costs only and will not help you determine the relative total costs of owning different funds. In addition, if these transactional costs were included, your costs would have been higher.
| Beginning account value | Ending account value 5/31/2022 | Expenses paid during period* | Annualized expense ratio | |||||||||||||
| Growth ETF | ||||||||||||||||
| Actual return | $ | 1,000.00 | $ | 913.10 | $ | 1.00 | .39 | % | ||||||||
| Assumed 5% return | 1,000.00 | 1,022.99 | 1.97 | .39 | ||||||||||||
| Global Growth Equity ETF | ||||||||||||||||
| Actual return | $ | 1,000.00 | $ | 885.60 | $ | 1.19 | .47 | % | ||||||||
| Assumed 5% return | 1,000.00 | 1,022.59 | 2.37 | .47 | ||||||||||||
| International Focus Equity ETF | ||||||||||||||||
| Actual return | $ | 1,000.00 | $ | 931.00 | $ | 1.40 | .54 | % | ||||||||
| Assumed 5% return | 1,000.00 | 1,022.24 | 2.72 | .54 | ||||||||||||
| Core Equity ETF | ||||||||||||||||
| Actual return | $ | 1,000.00 | $ | 964.10 | $ | .87 | .33 | % | ||||||||
| Assumed 5% return | 1,000.00 | 1,023.29 | 1.66 | .33 | ||||||||||||
| Dividend Value ETF | ||||||||||||||||
| Actual return | $ | 1,000.00 | $ | 995.40 | $ | .88 | .33 | % | ||||||||
| Assumed 5% return | 1,000.00 | 1,023.29 | 1.66 | .33 | ||||||||||||
| * | The period for the “annualized expense ratio” and “actual return” line is based on the number of days from February 22, 2022, commencement of operations, through May 31, 2022, and accordingly, is not representative of a full period. The “assumed 5% return” line is based on 182 days. |
| 34 | Capital Group Equity Exchange-Traded Funds |
| Tax information | unaudited |
We are required to advise you of the federal tax status of certain distributions received by shareholders during the fiscal year. Each fund hereby designates the following amounts for the funds’ fiscal year ended May 31, 2022:
| Capital Group Growth ETF | Capital Group Global Growth Equity ETF | Capital Group International Focus Equity ETF | Capital Group Core Equity ETF | Capital Group Dividend Value ETF | ||||||||||||||||
| Foreign taxes (per share) | $ | – | $ | – | $ | 0.01 | $ | – | $ | – | ||||||||||
| Foreign source income (per share) | $ | – | $ | – | $ | 0.14 | $ | – | $ | – | ||||||||||
| Qualified dividend income | – | % | – | % | – | % | 100 | % | 100 | % | ||||||||||
| Corporate dividends received deduction | – | % | – | % | – | % | 100 | % | 100 | % | ||||||||||
Individual shareholders should refer to their Form 1099 or other tax information, which will be mailed in January 2023, to determine the calendar year amounts to be included on their 2022 tax returns. Shareholders should consult their tax advisors.
| Capital Group Equity Exchange-Traded Funds | 35 |
Approval of Investment Advisory and Service Agreement
Capital Group Growth ETF
Capital Group Global Growth Equity ETF
Capital Group International Focus Equity ETF
Capital Group Core Equity ETF
Capital Group Dividend Value ETF
The boards of Capital Group Growth ETF, Capital Group Global Growth Equity ETF, Capital Group International Focus Equity ETF, Capital Group Core Equity ETF and Capital Group Dividend Value ETF (the “board”), including a majority of its independent board members, have approved each fund’s Investment Advisory and Service Agreement (the “agreement”) with Capital Research and Management Company (“CRMC”) for an initial term through July 31, 2023. The board determined in the exercise of its business judgment that each fund’s contractual fee rate was fair and reasonable in relation to the services provided, and that approving the agreement was in the best interests of each fund and its shareholders.
In reaching this decision, the board took into account information prepared specifically in connection with their review of the agreement and information otherwise provided in the meeting material, as well as information previously provided to them in their capacity as board members of other investment companies managed by CRMC, and they were advised by their independent counsel with respect to the matters considered. They considered the following factors, among others, but did not identify any single issue or particular piece of information that, in isolation, was the controlling factor, and each board member did not necessarily attribute the same weight to each factor.
1. Nature, extent and quality of services
The board considered the depth and quality of CRMC’s investment management process, including its global research capabilities; the experience, capability and integrity of its senior management and other personnel; the low turnover rates of its key personnel; the overall financial strength and stability of CRMC and the Capital Group organization; the resources and systems CRMC devotes to investment management (the manner in which each fund’s assets will be managed, including liquidity management), financial, investment operations, compliance, trading, proxy voting, and other services; and the ongoing evolution of CRMC’s organizational structure designed to maintain and strengthen these qualities. The board also considered the nature, extent and quality of administrative services to be provided by CRMC to each fund under the agreement and other agreements. The board considered the risks assumed by CRMC in providing services to each fund, including operational, business, financial, reputational, regulatory and litigation risks. The board concluded that the nature, extent and quality of the services to be provided by CRMC should benefit each fund and its shareholders.
2. Investment results
The board considered the manner in which CRMC proposed to manage each fund in light of its objective and strategy. They also considered the proposed investment policies and restrictions on each fund, and CRMC’s experience in managing similar strategies. On the basis of this evaluation and the board’s plan to undertake ongoing review of investment operations and results, the board concluded that CRMC’s management should benefit each fund and its shareholders. This report, including the letter to shareholders and related disclosures, contains certain information about each fund’s investment results and related benchmarks.
3. Advisory fees and total expenses
The board reviewed the proposed unitary fee structure and considered that CRMC would be, with certain exceptions, responsible for the operating expenses of each fund. The board considered the contractual fee rate that will be paid by each fund to CRMC and compared the estimated expense ratio of each fund to the expense ratios of other relevant funds. The board concluded that the proposed contractual fee rate was fair and reasonable in relation to the services that CRMC proposed to provide, as well as in relation to the risks assumed by the adviser in sponsoring and managing each fund, and that each fund’s shareholders would likely receive reasonable value in return for the fees paid to CRMC by each fund.
| 36 | Capital Group Equity Exchange-Traded Funds |
4. Ancillary benefits
The board considered a variety of other benefits that CRMC and its affiliates could receive as a result of CRMC’s proposed relationship with each fund and other funds it sponsors, including fees for administrative services and possible ancillary benefits to CRMC and its institutional management affiliates in managing other investment vehicles. The board considered CRMC’s portfolio trading practices, noting that, since 2019, CRMC has borne the cost of third-party research. The board also noted that CRMC benefited from the use of commissions from portfolio transactions made on behalf of each fund to facilitate payments to certain broker-dealers for research to comply with regulatory requirements, with all such amounts reimbursed to each fund by CRMC. The board took these ancillary benefits into account in evaluating the reasonableness of the fees payable to CRMC by each fund under the agreement.
5. Adviser financial information
The board considered CRMC’s commitment to providing to each fund the necessary resources, including personnel, systems and resources of investment, compliance, trading, accounting and other administrative operations. The board noted the competitiveness and cyclicality of both the registered fund industry and the capital markets, and the importance in that environment of CRMC’s long-term profitability for maintaining its independence, company culture and management continuity. The board further considered that shareholders would benefit from the unitary fee structure because expenses would be limited even when each fund was new and not achieving economies of scale. The board also considered the fact that increases in assets would not lead to fee decreases, even if economies of scale are achieved, because the unitary fee structure does not contain breakpoints, and that they would have the opportunity to further review the appropriateness of the fees payable to CRMC under the agreement experienced in the future. The board concluded that each fund’s proposed contractual fee rate reflected a reasonable sharing of benefits between CRMC and each fund’s shareholders.
| Capital Group Equity Exchange-Traded Funds | 37 |
Board of trustees and other officers
| Independent trustees1 | ||||||||||
| Name and year of birth | Year first elected a trustee of the fund2 | Principal occupation(s) during past five years | Number of portfolios in fund complex overseen by trustee | Other directorships3 held by trustee | ||||||
| Vanessa C. L. Chang, 1952 Chair of the Board (Independent and Non-Executive) | CGGR CGGO CGXU CGUS CGDV | 2021 2021 2021 2021 2021 | Former Director, EL & EL Investments (real estate) | 22 | Edison International/Southern California Edison; Transocean Ltd. (offshore drilling contractor) | |||||
| Jennifer C. Feikin, 1968 | CGGR CGGO CGXU CGUS CGDV | 2021 2021 2021 2021 2021 | Business Advisor; previously held positions at Google, AOL, 20th Century Fox and McKinsey & Company; Trustee, The Nature Conservancy of Utah; former Trustee, The Nature Conservancy of California; former Director, First Descents | 15 | Hertz Global Holdings, Inc. | |||||
| Pablo R. González Guajardo, 1967 | CGGR CGGO CGDV CGUS CGDV | 2021 2021 2021 2021 2021 | CEO, Kimberly-Clark de México, SAB de CV | 22 | América Móvil, SAB de CV (telecommunications company); Grupo Lala, SAB de CV (dairy company); Grupo Sanborns, SAB de CV (retail stores and restaurants); Kimberly-Clark de México, SAB de CV (consumer staples) | |||||
| Leslie Stone Heisz, 1961 | CGGR CGGO CGXU CGUS CGDV | 2021 2021 2021 2021 2021 | Former Managing Director, Lazard (retired, 2010); Director, Edwards Lifesciences; Trustee, Public Storage; Director, Kaiser Permanente (California public benefit corporation); Former Lecturer, UCLA Anderson School of Management | 15 | None | |||||
| William D. Jones, 1955 | CGGR CGGO CGXU CGUS CGDV | 2021 2021 2021 2021 2021 | Real estate developer/owner, President and CEO, CityLink Investment Corporation (acquires, develops and manages real estate ventures in urban communities) and for the former City Scene Management Company (provided commercial asset management services) | 23 | Biogen Inc.; Sempra Energy | |||||
| Interested trustees4,5 | ||||||||||
| Name, year of birth and position with fund | Year first elected a trustee or officer of the fund2 | Principal occupation(s) during past five years and positions held with affiliated entities or the principal underwriter of the fund | Number of portfolios in fund complex overseen by trustee | Other directorships3 held by trustee | ||||||
| William L. Robbins, 1968 Trustee: CGGR, CGGO, CGXU, CGDV Senior Vice President and Trustee: CGUS | CGGR CGGO CGXU CGUS CGDV | 2021 2021 2021 2021 2021 | Partner — Capital International Investors, Capital Research and Management Company; Partner — Capital International Investors, Capital Bank and Trust Company6; Chair and Director, Capital Group International, Inc.6 | 10 | None | |||||
| The fund’s statement of additional information includes further details about fund trustees and is available without charge upon request by calling American Funds Service Company at (800) 421-4225 or by visiting the American Funds website at americanfunds.com. The address for all trustees and officers of the fund is 333 South Hope Street, Los Angeles, CA 90071, Attention: Secretary. | ||||||||||
| 38 | Capital Group Equity Exchange-Traded Funds |
| Other officers5 | ||||||
| Name, year of birth and position with fund | Year first elected an officer of the fund2 | Principal occupation(s) during past five years and positions held with affiliated entities or the principal underwriter of the fund | ||||
| Irfan M. Furniturewala, 1971 Co-President | CGGR | 2021 | Partner — Capital International Investors, Capital Research and Management Company | |||
| Alan J. Wilson, 1961 Co-President | CGGR | 2021 | Partner — Capital World Investors, Capital Research and Management Company; Director, Capital Research and Management Company | |||
| Patrice Collette, 1967 President | CGGO | 2021 | Partner — Capital World Investors, Capital International, Inc.6 | |||
| Sung Lee, 1966 President | CGXU | 2021 | Partner — Capital Research Global Investors, Capital International, Inc.6; Director, The Capital Group Companies, Inc.6 | |||
| Keiko McKibben, 1969 Co-President | CGUS | 2021 | Partner — Capital Research Global Investors, Capital Research and Management Company | |||
| Carlos A. Schonfeld, 1971 Co-President | CGUS | 2021 | Partner — Capital International Investors, Capital Research and Management Company; Director, Capital International Limited6 | |||
| Christopher D. Buchbinder, 1971 CGDV President | 2021 | Partner — Capital Research Global Investors, Capital Research and Management Company; Director, The Capital Group Companies, Inc.6 | ||||
| Walt Burkley, 1966 Principal Executive Officer | CGGR CGGO CGXU CGUS CGDV | 2021 2021 2021 2021 2021 | Senior Vice President and Senior Counsel — Fund Business Management Group, Capital Research and Management Company; Director, Capital Research Company6; Director, Capital Research and Management Company | |||
| Michael W. Stockton, 1967 Executive Vice President | CGGR CGGO CGXU CGUS CGDV | 2021 2021 2021 2021 2021 | Senior Vice President — Fund Business Management Group, Capital Research and Management Company | |||
| Erik A. Vayntrub, 1984 Senior Vice President | CGGR CGGO CGXU CGUS CGDV | 2021 2021 2021 2021 2021 | Senior Vice President and Senior Counsel — Fund Business Management Group, Capital Research and Management Company; Secretary, Capital Management Services, Inc.6 | |||
| Paul Benjamin, 1979 Senior Vice President | CGGR | 2021 | Partner — Capital World Investors, Capital Research and Management Company; Director, Capital Strategy Research, Inc.6 | |||
| Mark L. Casey, 1970 Senior Vice President | CGGR | 2021 | Partner — Capital International Investors, Capital Research and Management Company | |||
| Anne-Marie Peterson, 1972 Senior Vice President | CGGR | 2021 | Partner — Capital World Investors, Capital Research and Management Company | |||
| Andraz Razen, 1975 Senior Vice President | CGGR | 2021 | Partner — Capital World Investors, Capital Research Company | |||
| Paul Flynn, 1966 Senior Vice President | CGGO | 2021 | Partner — Capital World Investors, Capital International, Inc.6 | |||
| Roz Hongsaranagon, 1979 Senior Vice President | CGGO | 2021 | Partner — Capital World Investors, Capital Research and Management Company | |||
| Jonathan Knowles, PhD, 1961 Senior Vice President | CGGO | 2021 | Partner — Capital World Investors, Capital International, Inc.6 | |||
| Nicholas J. Grace, 1966 Senior Vice President | CGXU | 2021 | Partner — Capital Research Global Investors, Capital Research Company6 | |||
| Renaud H. Samyn, 1974 Senior Vice President | CGXU | 2021 | Partner — Capital Research Global Investors, Capital International Inc.6 | |||
| Christopher Thomsen, 1970 Senior Vice President | CGXU | 2021 | Partner — Capital Research Global Investors, Capital Research Company6 | |||
| Charles E. Ellwein, 1968 Senior Vice President | CGUS | 2021 | Partner — Capital Research Global Investors, Capital Research and Management Company; Director, Capital Research and Management Company | |||
| J. Blair Frank, 1966 Senior Vice President | CGUS | 2021 | Partner — Capital Research Global Investors, Capital Research and Management Company | |||
| Donald D. O’Neal, 1960 Senior Vice President | CGUS | 2021 | Partner — Capital International Investors, Capital Research and Management Company; Partner — Capital International Investors, Capital Bank and Trust Company6 | |||
| Capital Group Equity Exchange-Traded Funds | 39 |
| Other officers5 (continued) | ||||||
| Name, year of birth and position with fund | Year first elected an officer of the fund2 | Principal occupation(s) during past five years and positions held with affiliated entities or the principal underwriter of the fund | ||||
| Martin Jacobs, 1962 Senior Vice President | CGDV | 2021 | Partner — Capital Research Global Investors, Capital Research and Management Company; Director, The Capital Group Companies, Inc.6 | |||
| James B. Lovelace, 1956 Senior Vice President | CGDV | 2021 | Partner — Capital Research Global Investors, Capital Research and Management Company; Partner — Capital Research Global Investors, Capital Bank and Trust Company6 | |||
| Keiko McKibben, 1969 Senior Vice President | CGDV | 2021 | Partner — Capital Research Global Investors, Capital Research and Management Company | |||
| James Terrile, 1965 Senior Vice President | CGDV | 2021 | Partner — Capital Research Global Investors, Capital Research and Management Company | |||
| Jennifer L. Butler, 1966 Secretary | CGGR CGGO CGXU CGUS CGDV | 2021 2021 2021 2021 2021 | Assistant Vice President — Fund Business Management Group, Capital Research and Management Company | |||
| Troy S. Tanner, 1983 Treasurer | CGGR CGGO CGXU CGUS CGDV | 2021 2021 2021 2021 2021 | Vice President — Investment Operations, Capital Research and Management Company | |||
| Susan K. Countess, 1966 Assistant Secretary | CGGR CGGO CGXU CGUS CGDV | 2021 2021 2021 2021 2021 | Associate — Fund Business Management Group, Capital Research and Management Company | |||
| Michael R. Tom, 1988 Assistant Secretary | CGGR CGGO CGXU CGUS CGDV | 2021 2021 2021 2021 2021 | Associate — Fund Business Management Group, Capital Research and Management Company | |||
| Sandra Chuon, 1972 Assistant Treasurer | CGGR CGGO CGXU CGUS CGDV | 2021 2021 2021 2021 2021 | Vice President — Investment Operations, Capital Research and Management Company | |||
| Gregory F. Niland, 1971 Assistant Treasurer | CGGR CGGO CGXU CGUS CGDV | 2021 2021 2021 2021 2021 | Vice President — Investment Operations, Capital Research and Management Company | |||
| 1 | The term independent trustee refers to a trustee who is not an “interested person” of the fund within the meaning of the Investment Company Act of 1940. |
| 2 | Trustees and officers of the fund serve until their resignation, removal or retirement. |
| 3 | This includes all directorships/trusteeships (other than those in the American Funds or other funds managed by Capital Research and Management Company or its affiliates) that are held by each trustee as a trustee or director of a public company or a registered investment company. |
| 4 | The term interested trustee refers to a trustee who is an “interested person” within the meaning of the Investment Company Act of 1940, on the basis of their affiliation with the fund’s investment adviser, Capital Research and Management Company, or affiliated entities (including the fund’s principal underwriter). |
| 5 | All of the trustees and/or officers listed are officers and/or directors/trustees of one or more of the other funds for which Capital Research and Management Company serves as investment adviser. |
| 6 | Company affiliated with Capital Research and Management Company. |
| 40 | Capital Group Equity Exchange-Traded Funds |
This page was intentionally left blank.
| Capital Group Equity Exchange-Traded Funds | 41 |
This page was intentionally left blank.
| 42 | Capital Group Equity Exchange-Traded Funds |
This page was intentionally left blank.
| Capital Group Equity Exchange-Traded Funds | 43 |
Office of the fund
6455 Irvine Center Drive
Irvine, CA 92618-4518
Investment adviser
Capital Research and Management Company
333 South Hope Street
Los Angeles, CA 90071-1406
Transfer agent for shareholder accounts
State Street Bank and Trust Company
One Lincoln Street
Boston, MA 02111-2900
Custodian of assets
State Street Bank and Trust Company
One Lincoln Street
Boston, MA 02111-2900
Counsel
Dechert LLP
One Bush Street, Suite 1600
San Francisco, CA 94104-4446
Independent registered public accounting firm
PricewaterhouseCoopers LLP
601 South Figueroa Street
Los Angeles, CA 90017-3874
Principal underwriter
American Funds Distributors, Inc.
333 South Hope Street
Los Angeles, CA 90071-1406
| 44 | Capital Group Equity Exchange-Traded Funds |
Investors should carefully consider investment objectives, risks, charges and expenses. This and other important information is contained in the fund prospectus and summary prospectus, which can be obtained from your financial professional and should be read carefully before investing. You may also call American Funds Service Company (AFS) at (800) 421-4225 or visit the Capital Group website at capitalgroup.com.
“Proxy Voting Procedures and Principles” — which describes our procedures and principles for voting portfolio securities — is available on our American Funds website or upon request by calling AFS. Each fund files its proxy voting record with the U.S. Securities and Exchange Commission (SEC) for the 12 months ended June 30 by August 31. The proxy voting record is available free of charge on the SEC website at sec.gov and on our website.
Capital Group Equity Exchange-Traded Funds
Investment results assume all distributions are reinvested and reflect applicable fees and expenses. Past results are not predictive of results in future periods.
Investing outside the United States involves risks, such as currency fluctuations, periods of illiquidity and price volatility, as more fully described in the prospectus. These risks may be heightened in connection with investments in developing countries. The expense ratio is as of the fund’s prospectus available at the time of publication. The expense ratio is estimated.
S&P 500 Index is a market capitalization-weighted index based on the results of approximately 500 widely held common stocks. This index is unmanaged, and its results include reinvested dividends and/or distributions but do not reflect the effect of sales charges, commissions, account fees, expenses or U.S. federal income taxes. Each S&P Index (“Index”) shown is a product of S&P Dow Jones Indices LLC and/or its affiliates and has been licensed for use by Capital Group. Copyright © 2022 S&P Dow Jones Indices LLC, a division of S&P Global, and/or its affiliates. All rights reserved. Redistribution or reproduction in whole or in part is prohibited without written permission of S&P Dow Jones Indices LLC.
MSCI All Country World ex USA Index is a free float-adjusted market capitalization weighted index that is designed to measure equity market results in the global developed and emerging markets, excluding the United States. The index consists of more than 40 developed and emerging market country indexes. Results reflect dividends gross of withholding taxes through December 31, 2000, and dividends net of withholding taxes thereafter. MSCI All Country World Index is a free float-adjusted market capitalization weighted index that is designed to measure equity market results in the global developed and emerging markets, consisting of more than 40 developed and emerging market country indexes. Results reflect dividends gross of withholding taxes through December 31, 2000, and dividends net of withholding taxes thereafter. These indexes are unmanaged, and its results include reinvested dividends and/or distributions but do not reflect the effect of sales charges, commissions, account fees, expenses or U.S. federal income taxes.
MSCI has not approved, reviewed or produced this report, makes no express or implied warranties or representations and is not liable whatsoever for any data in the report. You may not redistribute the MSCI data or use it as a basis for other indices or investment products.
American Funds Distributors, Inc., member FINRA.
This content, developed by Capital Group, home of American Funds, should not be used as a primary basis for investment decisions and is not intended to serve as impartial investment or fiduciary advice.

ITEM 2 – Code of Ethics
The Registrant has adopted a Code of Ethics that applies to its Principal Executive Officer and Principal Financial Officer. The Registrant undertakes to provide to any person without charge, upon request, a copy of the Code of Ethics. Such request can be made by calling 800/421-4225 or to the Secretary of the Registrant, 6455 Irvine Center Drive, Irvine, California 92618.
ITEM 3 – Audit Committee Financial Expert
The Registrant’s board has determined that Leslie Stone Heisz, a member of the Registrant’s audit committee, is an “audit committee financial expert” and "independent," as such terms are defined in this Item. This designation will not increase the designee’s duties, obligations or liability as compared to his or her duties, obligations and liability as a member of the audit committee and of the board, nor will it reduce the responsibility of the other audit committee members. There may be other individuals who, through education or experience, would qualify as "audit committee financial experts" if the board had designated them as such. Most importantly, the board believes each member of the audit committee contributes significantly to the effective oversight of the Registrant’s financial statements and condition.
ITEM 4 – Principal Accountant Fees and Services
| CGXU | ||
| Registrant: | ||
| a) Audit Fees: | ||
| Audit | 2021 | None |
| 2022 | None | |
| b) Audit-Related Fees: | ||
| 2021 | None | |
| 2022 | None | |
| c) Tax Fees: | ||
| 2021 | None | |
| 2022 | None | |
| The tax fees consist of professional services relating to the preparation of the Registrant’s tax returns. | ||
| d) All Other Fees: | ||
| 2021 | None | |
| 2022 | None | |
| Adviser and affiliates (includes only fees for non-audit services billed to the adviser and affiliates for engagements that relate directly to the operations and financial reporting of the Registrant and were subject to the pre-approval policies described below): | ||
| a) Audit Fees: | ||
| Not Applicable | ||
| b) Audit-Related Fees: | ||
| 2021 | None | |
| 2022 | None | |
| The audit-related fees consist of assurance and related services relating to the examination of the Registrant’s transfer agent, principal underwriter and investment adviser conducted in accordance with Statement on Standards for Attestation Engagements Number 18 issued by the American Institute of Certified Public Accountants. | ||
| c) Tax Fees: | ||
| 2021 | None | |
| 2022 | None | |
| The tax fees consist of consulting services relating to the Registrant’s investments. | ||
| d) All Other Fees: | ||
| 2021 | 2,000 | |
| 2022 | None | |
| The other fees consist of subscription services related to an accounting research tool. | ||
| All audit and permissible non-audit services that the Registrant’s audit committee considers compatible with maintaining the independent registered public accounting firm’s independence are required to be pre-approved by the committee. The pre-approval requirement will extend to all non-audit services provided to the Registrant, the investment adviser, and any entity controlling, controlled by, or under common control with the investment adviser that provides ongoing services to the Registrant, if the engagement relates directly to the operations and financial reporting of the Registrant. The committee will not delegate its responsibility to pre-approve these services to the investment adviser. The committee may delegate to one or more committee members the authority to review and pre-approve audit and permissible non-audit services. Actions taken under any such delegation will be reported to the full committee at its next meeting. The pre-approval requirement is waived with respect to non-audit services if certain conditions are met. The pre-approval requirement was not waived for any of the non-audit services listed above provided to the Registrant, adviser and affiliates. | ||
| Aggregate non-audit fees paid to the Registrant’s auditors, including fees for all services billed to the Registrant, adviser and affiliates that provide ongoing services to the Registrant, were $0 for fiscal year 2021 and $0 for fiscal year 2022. The non-audit services represented by these amounts were brought to the attention of the committee and considered to be compatible with maintaining the auditors’ independence. |
ITEM 5 – Audit Committee of Listed Registrants
Not applicable to this Registrant, insofar as the Registrant is not a listed issuer as defined in Rule 10A-3 under the Securities Exchange Act of 1934.
ITEM 6 – Schedule of Investments
Not applicable, insofar as the schedule is included as part of the report to shareholders filed under Item 1 of this Form.
ITEM 7 – Disclosure of Proxy Voting Policies and Procedures for Closed-End Management Investment Companies
Not applicable to this Registrant, insofar as the Registrant is not a closed-end management investment company.
ITEM 8 – Portfolio Managers of Closed-End Management Investment Companies
Not applicable to this Registrant, insofar as the Registrant is not a closed-end management investment company.
ITEM 9 – Purchases of Equity Securities by Closed-End Management Investment Company and Affiliated Purchasers
Not applicable to this Registrant, insofar as the Registrant is not a closed-end management investment company.
ITEM 10 – Submission of Matters to a Vote of Security Holders
There have been no material changes to the procedures by which shareholders may recommend nominees to the Registrant’s board of trustees since the Registrant last submitted a proxy statement to its shareholders. The procedures are as follows. The Registrant has a nominating and governance committee comprised solely of persons who are not considered ‘‘interested persons’’ of the Registrant within the meaning of the Investment Company Act of 1940, as amended. The committee periodically reviews such issues as the board’s composition, responsibilities, committees, compensation and other relevant issues, and recommends any appropriate changes to the full board of trustees. While the committee normally is able to identify from its own resources an ample number of qualified candidates, it will consider shareholder suggestions of persons to be considered as nominees to fill future vacancies on the board. Such suggestions must be sent in writing to the nominating and governance committee of the Registrant, c/o the Registrant’s Secretary, and must be accompanied by complete biographical and occupational data on the prospective nominee, along with a written consent of the prospective nominee for consideration of his or her name by the nominating and governance committee.
ITEM 11 – Controls and Procedures
| (a) | The Registrant’s Principal Executive Officer and Principal Financial Officer have concluded, based on their evaluation of the Registrant’s disclosure controls and procedures (as such term is defined in Rule 30a-3 under the Investment Company Act of 1940), that such controls and procedures are adequate and reasonably designed to achieve the purposes described in paragraph (c) of such rule. |
| (b) | There were no changes in the Registrant’s internal controls over financial reporting (as defined in Rule 30a-3(d) under the Investment Company Act of 1940) that occurred during the Registrant’s semi-annual period covered by this report that has materially affected, or is reasonably likely to materially affect, the Registrant’s internal control over financial reporting.
|
ITEM 12 – Exhibits
| (a)(1) | The Code of Ethics that is the subject of the disclosure required by Item 2 is attached as an exhibit hereto. |
| (a)(2) | The certifications required by Rule 30a-2 of the Investment Company Act of 1940 and Sections 302 and 906 of the Sarbanes-Oxley Act of 2002 are attached as exhibits hereto. |
SIGNATURES
Pursuant to the requirements of the Securities Exchange Act of 1934 and the Investment Company Act of 1940, the Registrant has duly caused this report to be signed on its behalf by the undersigned, thereunto duly authorized.
| CAPITAL GROUP INTERNATIONAL FOCUS EQUITY ETF | |
| By __/s/ Walter R. Burkley________________ | |
Walter R. Burkley, Principal Executive Officer | |
| Date: July 29, 2022 |
Pursuant to the requirements of the Securities Exchange Act of 1934 and the Investment Company Act of 1940, this report has been signed below by the following persons on behalf of the Registrant and in the capacities and on the dates indicated.
| By _ /s/ Walter R. Burkley_____________ |
Walter R. Burkley, Principal Executive Officer |
| Date: July 29, 2022 |
| By ___/s/ Troy S. Tanner__________________ |
Troy S. Tanner, Treasurer and Principal Financial Officer |
| Date: July 29, 2022 |