
CROMWELL FUNDS
Core Financial Statements
June 30, 2024 (Unaudited)
UNITED STATES
SECURITIES AND EXCHANGE COMMISSION
Washington, D.C. 20549
FORM N-CSR
CERTIFIED SHAREHOLDER REPORT OF REGISTERED
MANAGEMENT INVESTMENT COMPANIES
Investment Company Act file number 811-23724
Total Fund Solution
(Exact name of Registrant as specified in charter)
615 East Michigan Street
Milwaukee, WI 53202
(Address of principal executive offices) (Zip code)
Stephen E. Baird, President
Total Fund Solution
c/o U.S. Bancorp Fund Services, LLC
777 East Wisconsin Ave, 6th Fl
Milwaukee, WI 53202
(Name and address of agent for service)
(855) 625-7333
Registrant’s telephone number, including area code
Date of fiscal year end: December 31, 2024
Date of reporting period: June 30, 2024
Item 1. Reports to Stockholders.
| (a) |
 | Cromwell CenterSquare Real Estate Fund |  |
| Investor Class | MRESX | ||
| Semi-Annual Shareholder Report | June 30, 2024 |
Class Name | Costs of a $10,000 investment | Costs paid as a percentage of a $10,000 investment |
| Investor Class | $54 | 1.10% |
Net Assets | $115,570,078 |
Number of Holdings | 47 |
Portfolio Turnover | 15% |

Top 10 Issuers | (%) |
American Tower Corp. | 9.2% |
Equinix, Inc. | 7.4% |
Prologis, Inc. | 7.2% |
Welltower, Inc. | 4.9% |
UDR, Inc. | 4.2% |
Ventas, Inc. | 3.8% |
Extra Space Storage, Inc. | 3.8% |
Digital Realty Trust, Inc. | 3.7% |
Invitation Homes, Inc. | 3.1% |
Equity Residential | 3.0% |
| * | Percentages are stated as a percentage of net assets. |
| Cromwell CenterSquare Real Estate Fund | PAGE 1 | TSR-SAR-89156Y407 |
 | Cromwell CenterSquare Real Estate Fund |  |
| Institutional Class | MRASX | ||
| Semi-Annual Shareholder Report | June 30, 2024 |
Class Name | Costs of a $10,000 investment | Costs paid as a percentage of a $10,000 investment |
| Institutional Class | $51 | 1.03% |
Net Assets | $115,570,078 |
Number of Holdings | 47 |
Portfolio Turnover | 15% |
Top 10 Issuers | (%) |
American Tower Corp. | 9.2% |
Equinix, Inc. | 7.4% |
Prologis, Inc. | 7.2% |
Welltower, Inc. | 4.9% |
UDR, Inc. | 4.2% |
Ventas, Inc. | 3.8% |
Extra Space Storage, Inc. | 3.8% |
Digital Realty Trust, Inc. | 3.7% |
Invitation Homes, Inc. | 3.1% |
Equity Residential | 3.0% |
| * | Percentages are stated as a percentage of net assets. |
| Cromwell CenterSquare Real Estate Fund | PAGE 1 | TSR-SAR-89156Y506 |
 | Cromwell Long Short Fund |  |
| Investor Class | MFADX | ||
| Semi-Annual Shareholder Report | June 30, 2024 |
Class Name | Costs of a $10,000 investment | Costs paid as a percentage of a $10,000 investment |
| Investor Class | $115 | 2.28% |
Net Assets | $99,116,724 |
Number of Holdings | 120 |
Portfolio Turnover | 91% |

Top 10 Issuers | (%) |
Microsoft Corp. | 7.4% |
NVIDIA Corp. | 6.8% |
Alphabet, Inc. | 3.7% |
Apple, Inc. | 3.5% |
JPMorgan Chase & Co. | 2.6% |
Costco Wholesale Corp. | 2.6% |
Amazon.com, Inc. | 2.6% |
Visa, Inc. | 2.4% |
ConocoPhillips | 2.4% |
Lam Research Corp. | 1.9% |
| * | Percentages are stated as a percentage of net assets. |
| ** | The Global Industry Classification Standard (‘‘GICS®’’) was developed by and/or is the exclusive property of MSCI, Inc. (‘‘MSCI’’) and Standard & Poor’s Financial Services LLC (‘‘S&P’’). GICS® is a service mark of MSCI and S&P and has been licensed for use by U.S. Bank Global Fund Services. |
| † | Net exposure, includes securities sold short. |
| Cromwell Long Short Fund | PAGE 1 | TSR_SAR_89156Y100 |
| Cromwell Long Short Fund | PAGE 2 | TSR_SAR_89156Y100 |
 | Cromwell Long Short Fund |  |
| Institutional Class | MFLDX | ||
| Semi-Annual Shareholder Report | June 30, 2024 |
Class Name | Costs of a $10,000 investment | Costs paid as a percentage of a $10,000 investment |
| Institutional Class | $102 | 2.02% |
Net Assets | $99,116,724 |
Number of Holdings | 120 |
Portfolio Turnover | 91% |
Top 10 Issuers | (%) |
Microsoft Corp. | 7.4% |
NVIDIA Corp. | 6.8% |
Alphabet, Inc. | 3.7% |
Apple, Inc. | 3.5% |
JPMorgan Chase & Co. | 2.6% |
Costco Wholesale Corp. | 2.6% |
Amazon.com, Inc. | 2.6% |
Visa, Inc. | 2.4% |
ConocoPhillips | 2.4% |
Lam Research Corp. | 1.9% |
| * | Percentages are stated as a percentage of net assets. |
| ** | The Global Industry Classification Standard (‘‘GICS®’’) was developed by and/or is the exclusive property of MSCI, Inc. (‘‘MSCI’’) and Standard & Poor’s Financial Services LLC (‘‘S&P’’). GICS® is a service mark of MSCI and S&P and has been licensed for use by U.S. Bank Global Fund Services. |
| † | Net exposure, includes securities sold short. |
| Cromwell Long Short Fund | PAGE 1 | TSR_SAR_89156Y308 |
| Cromwell Long Short Fund | PAGE 2 | TSR_SAR_89156Y308 |
 | Cromwell Foresight Global Sustainable Infrastructure Fund |  |
| Institutional Class | CFGIX | ||
| Semi-Annual Shareholder Report | June 30, 2024 |
Class Name | Costs of a $10,000 investment | Costs paid as a percentage of a $10,000 investment |
| Institutional Class | $51 | 1.05% |
Net Assets | $44,789,135 |
Number of Holdings | 26 |
Portfolio Turnover | 12% |
Top 10 Issuers | (%) |
Cellnex Telecom SA | 6.2% |
3i Infrastructure PLC | 5.3% |
Infratil Ltd. | 5.3% |
Boralex, Inc. | 5.3% |
Equinix, Inc. | 5.2% |
Brookfield Renewable Partners LP | 5.0% |
American Tower Corp. | 4.8% |
Innergex Renewable Energy, Inc. | 4.6% |
Transurban Group | 4.1% |
Northland Power, Inc. | 4.1% |
Top 10 Countries | (%) |
United States | 30.8% |
Canada | 19.0% |
United Kingdom | 18.3% |
New Zealand | 7.3% |
Spain | 6.2% |
Jersey | 5.4% |
Australia | 4.1% |
Germany | 3.0% |
Ireland | 2.7% |
Cash & Other | 3.2% |
| * | Percentages are stated as a percentage of net assets. |
| Cromwell Foresight Global Sustainable Infrastructure Fund | PAGE 1 | TSR_SAR_89156Y878 |
| Cromwell Foresight Global Sustainable Infrastructure Fund | PAGE 2 | TSR_SAR_89156Y878 |
 | Cromwell Tran Sustainable Focus Fund |  |
| Investor Class | LIMAX | ||
| Semi-Annual Shareholder Report | June 30, 2024 |
Class Name | Costs of a $10,000 investment | Costs paid as a percentage of a $10,000 investment |
| Investor Class | $57 | 1.10% |
Net Assets | $31,423,804 |
Number of Holdings | 28 |
Portfolio Turnover | 26% |

Top 10 Issuers | (%) |
Amazon.com, Inc. | 8.5% |
Microsoft Corp. | 8.1% |
Danaher Corp. | 6.2% |
NVIDIA Corp. | 6.0% |
AerCap Holdings NV | 5.0% |
Palo Alto Networks, Inc. | 4.9% |
Entegris, Inc. | 4.9% |
Taiwan Semiconductor Manufacturing Co. Ltd. | 4.8% |
T-Mobile US, Inc. | 4.7% |
Meta Platforms, Inc. | 4.3% |
| * | Percentages are stated as a percentage of net assets. |
| ** | The Global Industry Classification Standard (‘‘GICS®’’) was developed by and/or is the exclusive property of MSCI, Inc. (‘‘MSCI’’) and Standard & Poor’s Financial Services LLC (‘‘S&P’’). GICS® is a service mark of MSCI and S&P and has been licensed for use by U.S. Bank Global Fund Services. |
| Cromwell Tran Sustainable Focus Fund | PAGE 1 | TSR-SAR-89156Y803 |
| Cromwell Tran Sustainable Focus Fund | PAGE 2 | TSR-SAR-89156Y803 |
 | Cromwell Tran Sustainable Focus Fund |  |
| Institutional Class | LIMIX | ||
| Semi-Annual Shareholder Report | June 30, 2024 |
Class Name | Costs of a $10,000 investment | Costs paid as a percentage of a $10,000 investment |
| Institutional Class | $44 | 0.85% |
Net Assets | $31,423,804 |
Number of Holdings | 28 |
Portfolio Turnover | 26% |
Top 10 Issuers | (%) |
Amazon.com, Inc. | 8.5% |
Microsoft Corp. | 8.1% |
Danaher Corp. | 6.2% |
NVIDIA Corp. | 6.0% |
AerCap Holdings NV | 5.0% |
Palo Alto Networks, Inc. | 4.9% |
Entegris, Inc. | 4.9% |
Taiwan Semiconductor Manufacturing Co. Ltd. | 4.8% |
T-Mobile US, Inc. | 4.7% |
Meta Platforms, Inc. | 4.3% |
| * | Percentages are stated as a percentage of net assets. |
| ** | The Global Industry Classification Standard (‘‘GICS®’’) was developed by and/or is the exclusive property of MSCI, Inc. (‘‘MSCI’’) and Standard & Poor’s Financial Services LLC (‘‘S&P’’). GICS® is a service mark of MSCI and S&P and has been licensed for use by U.S. Bank Global Fund Services. |
| Cromwell Tran Sustainable Focus Fund | PAGE 1 | TSR-SAR-89156Y704 |
| Cromwell Tran Sustainable Focus Fund | PAGE 2 | TSR-SAR-89156Y704 |
 | Cromwell Greenspring Mid Cap Fund |  |
| Institutional Class | GRSPX | ||
| Semi-Annual Shareholder Report | June 30, 2024 |
Class Name | Costs of a $10,000 investment | Costs paid as a percentage of a $10,000 investment |
| Institutional Class | $53 | 1.03% |
Net Assets | $121,769,602 |
Number of Holdings | 56 |
Portfolio Turnover | 7% |
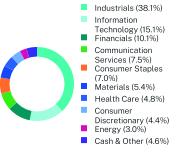
Top 10 Issuers | (%) |
Republic Services, Inc. | 9.7% |
KBR, Inc. | 8.8% |
EMCOR Group, Inc. | 8.4% |
MYR Group, Inc. | 4.8% |
Johnson Controls International PLC | 3.9% |
Primo Water Corp. | 3.4% |
DuPont de Nemours, Inc. | 3.1% |
W.R. Berkley Corp. | 3.1% |
EOG Resources, Inc. | 2.6% |
Ziff Davis, Inc. | 2.6% |
| * | Percentages are stated as a percentage of net assets. |
| ** | The Global Industry Classification Standard (‘‘GICS®’’) was developed by and/or is the exclusive property of MSCI, Inc. (‘‘MSCI’’) and Standard & Poor’s Financial Services LLC (‘‘S&P’’). GICS® is a service mark of MSCI and S&P and has been licensed for use by U.S. Bank Global Fund Services. |
| Cromwell Greenspring Mid Cap Fund | PAGE 1 | TSR-SAR-89156Y852 |
| Cromwell Greenspring Mid Cap Fund | PAGE 2 | TSR-SAR-89156Y852 |
 | Cromwell Sustainable Balanced Fund |  |
| Institutional Class | CSBIX | ||
| Semi-Annual Shareholder Report | June 30, 2024 |
Class Name | Costs of a $10,000 investment | Costs paid as a percentage of a $10,000 investment |
| Institutional Class | $57 | 1.10% |
Net Assets | $11,008,989 |
Number of Holdings | 46 |
Portfolio Turnover | 21% |
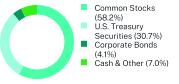
Top 10 Issuers | (%) |
United States Treasury Note/Bond | 30.7% |
Microsoft Corp. | 4.3% |
Amazon.com, Inc. | 4.2% |
NVIDIA Corp. | 3.4% |
Danaher Corp. | 3.4% |
AerCap Holdings NV | 3.1% |
Ferguson PLC | 2.7% |
Meta Platforms, Inc. | 2.6% |
Taiwan Semiconductor Manufacturing Co. Ltd. | 2.6% |
Ball Corp. | 2.6% |
| * | Percentages are stated as a percentage of net assets. |
| ** | The Global Industry Classification Standard (‘‘GICS®’’) was developed by and/or is the exclusive property of MSCI, Inc. (‘‘MSCI’’) and Standard & Poor’s Financial Services LLC (‘‘S&P’’). GICS® is a service mark of MSCI and S&P and has been licensed for use by U.S. Bank Global Fund Services. |
| Cromwell Sustainable Balanced Fund | PAGE 1 | TSR_SAR_89156Y837 |
| (b) | Not applicable. |
Item 2. Code of Ethics.
Not applicable for semi-annual reports.
Item 3. Audit Committee Financial Expert.
Not applicable for semi-annual reports.
Item 4. Principal Accountant Fees and Services.
Not applicable for semi-annual reports.
Item 5. Audit Committee of Listed Registrants.
Not applicable.
Item 6. Investments.
| (a) | Schedule of Investments is included within the financial statements filed under Item 7 of this Form. |
| (b) | Not applicable. |
Item 7. Financial Statements and Financial Highlights for Open-End Investment Companies.
| (a) |
Page | |||
Schedules of Investments | | ||
Shares | Value | |||||
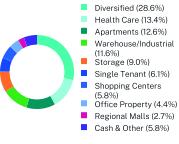
REAL ESTATE INVESTMENT TRUSTS - 99.2% | ||||||
Apartments - 12.6% | ||||||
Camden Property Trust | 23,810 | $2,597,909 | ||||
Equity Residential | 50,190 | 3,480,175 | ||||
Invitation Homes, Inc. | 100,630 | 3,611,611 | ||||
UDR, Inc. | 118,610 | 4,880,801 | ||||
14,570,496 | ||||||
Diversified - 28.6%(a) | ||||||
American Tower Corp. | 54,830 | 10,657,855 | ||||
Broadstone Net Lease, Inc. | 47,050 | 746,683 | ||||
Digital Realty Trust, Inc. | 27,800 | 4,226,990 | ||||
Equinix, Inc. | 11,338 | 8,578,331 | ||||
Lamar Advertising Co. - Class A | 13,660 | 1,632,780 | ||||
SBA Communications Corp. | 17,707 | 3,475,884 | ||||
VICI Properties, Inc. | 77,829 | 2,229,023 | ||||
Weyerhaeuser Co. | 55,179 | 1,566,532 | ||||
33,114,078 | ||||||
Health Care - 13.4% | ||||||
American Healthcare REIT, Inc | 55,499 | 810,840 | ||||
CareTrust REIT, Inc. | 33,195 | 833,194 | ||||
Healthpeak Properties, Inc. | 125,290 | 2,455,684 | ||||
Omega Healthcare Investors, Inc. | 40,570 | 1,389,523 | ||||
Ventas, Inc. | 86,750 | 4,446,805 | ||||
Welltower, Inc. | 53,770 | 5,605,523 | ||||
15,541,569 | ||||||
Hotels - 2.5% | ||||||
DiamondRock Hospitality Co | 80,840 | 683,098 | ||||
Host Hotels & Resorts, Inc. | 80,980 | 1,456,020 | ||||
Ryman Hospitality Properties, Inc. | 3,440 | 343,518 | ||||
Xenia Hotels & Resorts, Inc. | 26,590 | 381,035 | ||||
2,863,672 | ||||||
Manufactured Homes - 2.5% | ||||||
Sun Communities, Inc. | 24,039 | 2,892,853 | ||||
Office Property - 4.4% | ||||||
Alexandria Real Estate Equities, Inc. | 7,590 | 887,802 | ||||
BXP, Inc. | 21,769 | 1,340,100 | ||||
Cousins Properties, Inc. | 51,280 | 1,187,132 | ||||
Douglas Emmett, Inc. | 50,762 | 675,642 | ||||
Kilroy Realty Corp. | 17,470 | 544,540 | ||||
Vornado Realty Trust | 15,070 | 396,190 | ||||
5,031,406 | ||||||
Regional Malls - 2.7% | ||||||
Simon Property Group, Inc. | 19,741 | 2,996,684 | ||||
The Macerich Co. | 11,520 | 177,869 | ||||
3,174,553 | ||||||
Shares | Value | |||||
Shopping Centers - 5.8% | ||||||
Brixmor Property Group, Inc. | 71,410 | $1,648,857 | ||||
Kimco Realty Corp. | 166,570 | 3,241,452 | ||||
Retail Opportunity Investments Corp. | 96,620 | 1,200,987 | ||||
Urban Edge Properties | 30,302 | 559,678 | ||||
6,650,974 | ||||||
Single Tenant - 6.1% | ||||||
Agree Realty Corp. | 40,770 | 2,525,294 | ||||
NNN REIT, Inc. | 47,710 | 2,032,446 | ||||
Realty Income Corp. | 46,294 | 2,445,249 | ||||
7,002,989 | ||||||
Storage - 9.0% | ||||||
CubeSmart | 14,400 | 650,448 | ||||
Extra Space Storage, Inc. | 28,191 | 4,381,163 | ||||
Iron Mountain, Inc. | 30,420 | 2,726,240 | ||||
Public Storage | 9,150 | 2,631,998 | ||||
10,389,849 | ||||||
Warehouse/Industrial - 11.6% | ||||||
Americold Realty Trust, Inc. | 15,150 | 386,931 | ||||
EastGroup Properties, Inc. | 2,640 | 449,064 | ||||
First Industrial Realty Trust, Inc. | 48,923 | 2,324,332 | ||||
Prologis, Inc. | 73,620 | 8,268,262 | ||||
Rexford Industrial Realty, Inc. | 44,269 | 1,973,955 | ||||
13,402,544 | ||||||
TOTAL REAL ESTATE INVESTMENT TRUSTS (Cost $99,811,302) | 114,634,983 | |||||
TOTAL INVESTMENTS - 99.2% (Cost $99,811,302) | 114,634,983 | |||||
Other Assets in Excess of Liabilities - 0.8% | 935,095 | |||||
TOTAL NET ASSETS - 100.0% | $115,570,078 | |||||
(a) | To the extent that the Fund invests more heavily in a particular industry or sector of the economy, its performance will be especially sensitive to developments that significantly affect those industries or sectors. |
1 |
Shares | Value | |||||
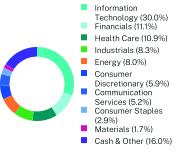
COMMON STOCKS - 95.0% | ||||||
Banks - 3.1% | ||||||
Citigroup, Inc. | 6,933 | $439,968 | ||||
JPMorgan Chase & Co. | 12,981 | 2,625,537 | ||||
3,065,505 | ||||||
Biotechnology - 4.1% | ||||||
AbbVie, Inc. | 6,040 | 1,035,981 | ||||
Gilead Sciences, Inc. | 7,830 | 537,216 | ||||
Halozyme Therapeutics, Inc.(a) | 20,040 | 1,049,294 | ||||
Regeneron Pharmaceuticals, Inc.(a) | 484 | 508,699 | ||||
Vertex Pharmaceuticals, Inc.(a) | 2,091 | 980,094 | ||||
4,111,284 | ||||||
Broadline Retail - 2.6% | ||||||
Amazon.com, Inc.(a)(b) | 13,178 | 2,546,648 | ||||
Building Products - 2.3% | ||||||
Builders FirstSource, Inc.(a) | 5,085 | 703,815 | ||||
Carlisle Cos., Inc. | 1,224 | 495,977 | ||||
Trane Technologies PLC | 3,142 | 1,033,498 | ||||
2,233,290 | ||||||
Capital Markets - 3.2% | ||||||
Ameriprise Financial, Inc. | 2,323 | 992,362 | ||||
Houlihan Lokey, Inc. | 3,844 | 518,402 | ||||
LPL Financial Holdings, Inc. | 3,567 | 996,263 | ||||
Morgan Stanley | 6,602 | 641,649 | ||||
3,148,676 | ||||||
Chemicals - 1.2% | ||||||
Ecolab, Inc. | 2,029 | 482,902 | ||||
The Sherwin-Williams Co. | 2,464 | 735,331 | ||||
1,218,233 | ||||||
Construction & Engineering - 0.7% | ||||||
EMCOR Group, Inc. | 1,955 | 713,731 | ||||
Consumer Staples Distribution & Retail - 2.6% | ||||||
Costco Wholesale Corp. | 3,058 | 2,599,269 | ||||
Containers & Packaging - 0.5% | ||||||
Crown Holdings, Inc. | 6,062 | 450,952 | ||||
Diversified Telecommunication Services - 1.6% | ||||||
AT&T, Inc. | 41,259 | 788,460 | ||||
Verizon Communications, Inc. | 18,226 | 751,640 | ||||
1,540,100 | ||||||
Electric Utilities - 0.5% | ||||||
NRG Energy, Inc. | 6,107 | 475,491 | ||||
Electronic Equipment, Instruments & Components - 1.7% | ||||||
Amphenol Corp. - Class A | 7,220 | 486,412 | ||||
Vontier Corp. | 31,996 | 1,222,247 | ||||
1,708,659 | ||||||
Entertainment - 0.5% | ||||||
Electronic Arts, Inc. | 3,632 | 506,047 | ||||
Shares | Value | |||||
Financial Services - 3.9% | ||||||
Mastercard, Inc. - Class A | 3,369 | $ 1,486,268 | ||||
Visa, Inc. - Class A | 9,204 | 2,415,774 | ||||
3,902,042 | ||||||
Ground Transportation - 2.0% | ||||||
Old Dominion Freight Line, Inc. | 2,956 | 522,030 | ||||
Union Pacific Corp. | 6,443 | 1,457,793 | ||||
1,979,823 | ||||||
Health Care Equipment & Supplies - 1.8% | ||||||
Intuitive Surgical, Inc.(a) | 4,075 | 1,812,764 | ||||
Health Care Providers & Services - 3.5% | ||||||
McKesson Corp. | 1,110 | 648,285 | ||||
The Cigna Group | 3,744 | 1,237,654 | ||||
UnitedHealth Group, Inc. | 3,058 | 1,557,317 | ||||
3,443,256 | ||||||
Hotels, Restaurants & Leisure - 1.5% | ||||||
Booking Holdings, Inc. | 187 | 740,801 | ||||
Hilton Worldwide Holdings, Inc. | 3,425 | 747,335 | ||||
1,488,136 | ||||||
Household Durables - 1.0% | ||||||
DR Horton, Inc. | 3,479 | 490,295 | ||||
Toll Brothers, Inc. | 4,177 | 481,107 | ||||
971,402 | ||||||
Household Products - 1.3% | ||||||
Colgate-Palmolive Co. | 13,285 | 1,289,176 | ||||
Insurance - 2.5% | ||||||
Arch Capital Group Ltd.(a) | 10,036 | 1,012,532 | ||||
Everest Group Ltd. | 1,331 | 507,138 | ||||
Reinsurance Group of America, Inc. | 2,409 | 494,495 | ||||
The Hartford Financial Services Group, Inc. | 5,006 | 503,303 | ||||
2,517,468 | ||||||
Interactive Media & Services - 3.7% | ||||||
Alphabet, Inc. - Class A(b) | 20,119 | 3,664,676 | ||||
Machinery - 3.8% | ||||||
Caterpillar, Inc. | 3,046 | 1,014,622 | ||||
Crane Co. | 5,305 | 769,119 | ||||
Deere & Co. | 3,971 | 1,483,685 | ||||
Parker-Hannifin Corp. | 967 | 489,118 | ||||
3,756,544 | ||||||
Metals & Mining - 0.5% | ||||||
Barrick Gold Corp. | 30,332 | 505,938 | ||||
GMK Norilskiy Nickel PAO - ADR(a)(c) | 105,916 | 0 | ||||
505,938 | ||||||
Oil, Gas & Consumable Fuels - 8.5% | ||||||
Chevron Corp. | 10,433 | 1,631,930 | ||||
ConocoPhillips | 20,628 | 2,359,431 | ||||
2 |
Shares | Value | |||||
COMMON STOCKS - (Continued) | ||||||
Oil, Gas & Consumable Fuels - (Continued) | ||||||
Devon Energy Corp. | 31,963 | $1,515,046 | ||||
EOG Resources, Inc. | 9,283 | 1,168,451 | ||||
Marathon Petroleum Corp. | 9,987 | 1,732,545 | ||||
8,407,403 | ||||||
Pharmaceuticals - 2.7% | ||||||
Johnson & Johnson | 10,231 | 1,495,363 | ||||
Merck & Co., Inc. | 9,554 | 1,182,785 | ||||
2,678,148 | ||||||
Semiconductors & Semiconductor Equipment - 10.6% | ||||||
Lam Research Corp. | 1,772 | 1,886,914 | ||||
NVIDIA Corp.(b) | 54,471 | 6,729,347 | ||||
NXP Semiconductors NV | 3,516 | 946,121 | ||||
QUALCOMM, Inc. | 4,620 | 920,212 | ||||
10,482,594 | ||||||
Software - 13.2% | ||||||
Adobe, Inc.(a) | 2,500 | 1,388,850 | ||||
Cadence Design Systems, Inc.(a) | 4,202 | 1,293,165 | ||||
Check Point Software Technologies Ltd.(a) | 6,298 | 1,039,170 | ||||
Fortinet, Inc.(a) | 12,313 | 742,105 | ||||
Intuit, Inc. | 2,000 | 1,314,420 | ||||
Microsoft Corp. | 16,359 | 7,311,655 | ||||
13,089,365 | ||||||
Specialty Retail - 1.9% | ||||||
AutoZone, Inc.(a) | 245 | 726,205 | ||||
The Home Depot, Inc. | 3,484 | 1,199,332 | ||||
1,925,537 | ||||||
Technology Hardware, Storage & Peripherals - 5.0% | ||||||
Apple, Inc. | 16,435 | 3,461,540 | ||||
Dell Technologies, Inc. - Class C | 3,502 | 482,961 | ||||
NetApp, Inc. | 7,933 | 1,021,770 | ||||
4,966,271 | ||||||
Textiles, Apparel & Luxury Goods - 0.7% | ||||||
Ralph Lauren Corp. | 4,074 | 713,194 | ||||
Shares | Value | |||||
Tobacco - 1.0% | ||||||
Philip Morris International, Inc. | 9,596 | $972,363 | ||||
Trading Companies & Distributors - 0.8% | ||||||
Applied Industrial Technologies, Inc. | 4,059 | 787,446 | ||||
Wireless Telecommunication Services - 0.5% | ||||||
T-Mobile US, Inc. | 2,776 | 489,076 | ||||
TOTAL COMMON STOCKS (Cost $86,294,198) | 94,160,507 | |||||
EXCHANGE TRADED FUNDS - 0.0%(d) | ||||||
VanEck Russia ETF(c) | 81,903 | 0 | ||||
TOTAL EXCHANGE TRADED FUNDS (Cost $1,778,634) | 0 | |||||
TOTAL INVESTMENTS - 95.0% (Cost $88,072,832) | 94,160,507 | |||||
Securities Sold Short - (11.1)% | (11,006,069) | |||||
Other Assets in Excess of Liabilities - 16.1% | 15,962,286 | |||||
TOTAL NET ASSETS - 100.0% | $99,116,724 | |||||
(a) | Non-income producing security. |
(b) | All or a portion of security has been pledged as collateral. The total value of assets committed as collateral as of June 30, 2024 is $7,268,011. |
(c) | Fair value determined using significant unobservable inputs in accordance with procedures established by and under the supervision of the Adviser, acting as Valuation Designee. These securities represented $0 or 0.0% of net assets as of June 30, 2024. |
(d) | Represents less than 0.05% of net assets. |
3 |
Shares | Value | |||||
COMMON STOCKS - (10.5)% | ||||||
Aerospace & Defense - (0.3)% | ||||||
Hexcel Corp. | (4,151) | $ (259,230) | ||||
Beverages - (0.2)% | ||||||
Monster Beverage Corp.(a) | (4,966) | (248,052) | ||||
Biotechnology - (0.2)% | ||||||
Moderna, Inc.(a) | (1,853) | (220,044) | ||||
Building Products - (0.2)% | ||||||
Fortune Brands Innovations, Inc. | (3,815) | (247,746) | ||||
Capital Markets - (0.8)% | ||||||
FactSet Research Systems, Inc. | (622) | (253,944) | ||||
MarketAxess Holdings, Inc. | (1,300) | (260,689) | ||||
Nasdaq, Inc. | (4,304) | (259,359) | ||||
(773,992) | ||||||
Chemicals - (0.5)% | ||||||
Albemarle Corp. | (2,231) | (213,105) | ||||
PPG Industries, Inc. | (1,953) | (245,863) | ||||
(458,968) | ||||||
Consumer Staples Distribution & Retail - (0.9)% | ||||||
Dollar General Corp. | (1,854) | (245,154) | ||||
Dollar Tree, Inc.(a) | (2,296) | (245,144) | ||||
Maplebear, Inc.(a) | (7,768) | (249,663) | ||||
Walgreens Boots Alliance, Inc. | (15,880) | (192,069) | ||||
(932,030) | ||||||
Distributors - (0.3)% | ||||||
LKQ Corp. | (6,059) | (251,994) | ||||
Electrical Equipment - (0.2)% | ||||||
Bloom Energy Corp. - Class A(a) | (18,990) | (232,438) | ||||
Electronic Equipment, Instruments & Components - (0.3)% | ||||||
Zebra Technologies Corp. - Class A(a) | (841) | (259,810) | ||||
Energy Equipment & Services - (0.3)% | ||||||
NOV, Inc. | (14,249) | (270,873) | ||||
Entertainment - (0.8)% | ||||||
Live Nation Entertainment, Inc.(a) | (2,804) | (262,847) | ||||
ROBLOX Corp. - Class A(a) | (7,120) | (264,935) | ||||
Warner Music Group Corp. - Class A | (8,264) | (253,292) | ||||
(781,074) | ||||||
Financial Services - (0.8)% | ||||||
Affirm Holdings, Inc.(a) | (10,744) | (324,576) | ||||
Shift4 Payments, Inc. - Class A(a) | (3,504) | (257,018) | ||||
StoneCo Ltd. - Class A(a) | (20,838) | (249,848) | ||||
(831,442) | ||||||
Shares | Value | |||||
Food Products - (0.5)% | ||||||
Campbell Soup Co. | (5,900) | $ (266,621) | ||||
The J.M. Smucker Co. | (2,243) | (244,577) | ||||
(511,198) | ||||||
Ground Transportation - (0.3)% | ||||||
Lyft, Inc. - Class A(a) | (18,154) | (255,971) | ||||
Health Care Equipment & Supplies - (0.2)% | ||||||
Integer Holdings Corp.(a) | (2,082) | (241,075) | ||||
Health Care Providers & Services - (0.3)% | ||||||
Acadia Healthcare Co., Inc.(a) | (3,939) | (266,040) | ||||
Hotels, Restaurants & Leisure - (0.5)% | ||||||
Las Vegas Sands Corp. | (5,762) | (254,969) | ||||
Norwegian Cruise Line Holdings Ltd.(a) | (14,456) | (271,628) | ||||
(526,597) | ||||||
Household Durables - (0.3)% | ||||||
Whirlpool Corp. | (2,784) | (284,525) | ||||
Household Products - (0.3)% | ||||||
The Clorox Co. | (1,920) | (262,022) | ||||
Life Sciences Tools & Services - (0.2)% | ||||||
Avantor, Inc.(a) | (11,226) | (237,991) | ||||
Media - (0.3)% | ||||||
Liberty Broadband Corp. - Class C(a) | (5,383) | (295,096) | ||||
Oil, Gas & Consumable Fuels - (0.3)% | ||||||
ONEOK, Inc. | (3,183) | (259,574) | ||||
Passenger Airlines - (0.2)% | ||||||
United Airlines Holdings, Inc.(a) | (4,754) | (231,330) | ||||
Pharmaceuticals - (0.2)% | ||||||
Catalent, Inc.(a) | (4,427) | (248,930) | ||||
Semiconductors & Semiconductor Equipment - (0.3)% | ||||||
Intel Corp. | (8,478) | (262,564) | ||||
Specialty Retail - (0.8)% | ||||||
Five Below, Inc.(a) | (2,114) | (230,363) | ||||
Floor & Decor Holdings, Inc. - Class A(a) | (2,176) | (216,316) | ||||
Lithia Motors, Inc. | (1,379) | (348,128) | ||||
(794,807) | ||||||
TOTAL COMMON STOCKS (Proceeds $10,595,654) | (10,445,413) | |||||
REAL ESTATE INVESTMENT TRUSTS - (0.6)% | ||||||
Industrial Real Estate Investment Trusts - (0.3)% | ||||||
Americold Realty Trust, Inc. | (9,646) | (246,359) | ||||
4 |
Shares | Value | |||||
REAL ESTATE INVESTMENT TRUSTS - (Continued) | ||||||
Office Real Estate Investment Trusts - (0.3)% | ||||||
Vornado Realty Trust | (11,955) | $(314,297) | ||||
TOTAL REAL ESTATE INVESTMENT TRUSTS (Proceeds $1,126,471) | (560,656) | |||||
TOTAL SECURITIES SOLD SHORT - (11.1)% (Proceeds $11,722,125) | $(11,006,069) | |||||
(a) | Non-income producing security. |
5 |
Shares | Value | |||||
COMMON STOCKS - 66.9% | ||||||
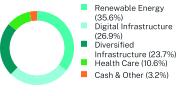
Digital Infrastructure - 11.3% | ||||||
Cellnex Telecom SA(a) | 85,871 | $2,795,005 | ||||
Chorus Ltd. | 189,544 | 888,186 | ||||
Cordiant Digital Infrastructure Ltd.(a) | 1,450,527 | 1,393,539 | ||||
5,076,730 | ||||||
Diversified Infrastructure - 20.0% | ||||||
3i Infrastructure PLC | 591,245 | 2,394,804 | ||||
Infratil Ltd. | 349,963 | 2,389,483 | ||||
International Public Partnerships Ltd. | 686,885 | 1,107,374 | ||||
Sequoia Economic Infrastructure Income Fund Ltd. | 1,205,632 | 1,217,974 | ||||
Transurban Group | 223,533 | 1,845,681 | ||||
8,955,316 | ||||||
Renewable Energy - 35.6%(b) | ||||||
Boralex, Inc. - Class A | 97,089 | 2,377,646 | ||||
Brookfield Renewable Partners LP | 91,229 | 2,256,807 | ||||
Clearway Energy, Inc. - Class C | 66,057 | 1,630,947 | ||||
Encavis AG(c) | 72,448 | 1,327,754 | ||||
Greencoat Renewables PLC | 1,291,461 | 1,204,494 | ||||
Greencoat UK Wind PLC/Funds | 605,796 | 1,010,834 | ||||
Innergex Renewable Energy, Inc. | 275,665 | 2,060,915 | ||||
Northland Power, Inc. | 106,561 | 1,831,633 | ||||
Octopus Renewables Infrastructure Trust PLC | 867,459 | 789,313 | ||||
Renewables Infrastructure Group Ltd. | 1,184,822 | 1,428,017 | ||||
15,918,360 | ||||||
TOTAL COMMON STOCKS (Cost $33,093,288) | 29,950,406 | |||||
REAL ESTATE INVESTMENT TRUSTS - 29.9% | ||||||
Digital Infrastructure - 15.6% | ||||||
American Tower Corp. | 11,159 | 2,169,086 | ||||
Crown Castle, Inc. | 11,849 | 1,157,647 | ||||
Digital Realty Trust, Inc. | 8,577 | 1,304,133 | ||||
Equinix, Inc. | 3,106 | 2,350,000 | ||||
6,980,866 | ||||||
Diversified Infrastructure - 3.7% | ||||||
Easterly Government Properties, Inc. | 136,011 | 1,682,456 | ||||
Shares | Value | |||||
Health Care - 10.6% | ||||||
Assura PLC | 2,438,952 | $1,236,263 | ||||
Healthcare Realty Trust, Inc. | 106,552 | 1,755,977 | ||||
Healthpeak Properties, Inc. | 88,903 | 1,742,499 | ||||
4,734,739 | ||||||
TOTAL REAL ESTATE INVESTMENT TRUSTS (Cost $14,283,467) | 13,398,061 | |||||
TOTAL INVESTMENTS - 96.8% (Cost $47,376,755) | 43,348,467 | |||||
Other Assets in Excess of Liabilities - 3.2% | 1,440,668 | |||||
TOTAL NET ASSETS - 100.0% | $44,789,135 | |||||
(a) | Security is exempt from registration pursuant to Rule 144A under the Securities Act of 1933, as amended. These securities may only be resold in transactions exempt from registration to qualified institutional investors. As of June 30, 2024, the value of these securities total $4,188,544 or 9.4% of the Fund’s net assets. |
(b) | To the extent that the Fund invests more heavily in a particular industry or sector of the economy, its performance will be especially sensitive to developments that significantly affect those industries or sectors. |
(c) | Non-income producing security. |
6 |
Shares | Value | |||||
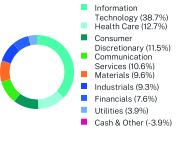
COMMON STOCKS - 103.9% | ||||||
Broadline Retail - 8.5% | ||||||
Amazon.com, Inc.(a) | 13,877 | $2,681,730 | ||||
Capital Markets - 3.6% | ||||||
The Charles Schwab Corp. | 15,184 | 1,118,909 | ||||
Chemicals - 3.0% | ||||||
The Sherwin-Williams Co. | 3,133 | 934,981 | ||||
Construction Materials - 3.5% | ||||||
Martin Marietta Materials, Inc. | 2,001 | 1,084,142 | ||||
Containers & Packaging - 3.2% | ||||||
Ball Corp. | 16,615 | 997,232 | ||||
Financial Services - 2.0% | ||||||
PayPal Holdings, Inc.(a) | 10,635 | 617,149 | ||||
Health Care Providers & Services - 4.0% | ||||||
AMN Healthcare Services, Inc.(a) | 10,892 | 557,997 | ||||
UnitedHealth Group, Inc. | 1,386 | 705,835 | ||||
1,263,832 | ||||||
Hotels, Restaurants & Leisure - 2.0% | ||||||
Expedia Group, Inc.(a) | 5,100 | 642,549 | ||||
Household Durables - 1.0% | ||||||
DR Horton, Inc. | 2,169 | 305,677 | ||||
Independent Power and Renewable Electricity Producers - 3.9% | ||||||
Talen Energy Corp.(a) | 11,022 | 1,223,662 | ||||
Insurance - 2.1% | ||||||
The Progressive Corp. | 3,207 | 666,126 | ||||
Interactive Media & Services - 5.8% | ||||||
Alphabet, Inc. - Class A | 2,549 | 464,300 | ||||
Meta Platforms, Inc. - Class A | 2,700 | 1,361,394 | ||||
1,825,694 | ||||||
IT Services - 1.9% | ||||||
Accenture PLC - Class A | 1,987 | 602,876 | ||||
Life Sciences Tools & Services - 8.7% | ||||||
Danaher Corp. | 7,834 | 1,957,325 | ||||
IQVIA Holdings, Inc.(a) | 3,669 | 775,773 | ||||
2,733,098 | ||||||
Shares | Value | |||||
Semiconductors & Semiconductor Equipment - 15.6% | ||||||
Entegris, Inc. | 11,278 | $1,527,041 | ||||
NVIDIA Corp. | 15,170 | 1,874,102 | ||||
Taiwan Semiconductor Manufacturing Co. Ltd. - ADR | 8,711 | 1,514,059 | ||||
4,915,202 | ||||||
Software - 21.1% | ||||||
Gitlab, Inc. - Class A(a) | 12,467 | 619,859 | ||||
Intuit, Inc. | 1,633 | 1,073,224 | ||||
Microsoft Corp. | 5,730 | 2,561,024 | ||||
Palo Alto Networks, Inc.(a) | 4,519 | 1,531,986 | ||||
Salesforce, Inc. | 3,330 | 856,143 | ||||
6,642,236 | ||||||
Trading Companies & Distributors - 9.3% | ||||||
AerCap Holdings NV | 16,973 | 1,581,883 | ||||
Ferguson PLC | 6,901 | 1,336,379 | ||||
2,918,262 | ||||||
Wireless Telecommunication Services - 4.7% | ||||||
T-Mobile US, Inc. | 8,464 | 1,491,188 | ||||
TOTAL COMMON STOCKS (Cost $23,242,738) | 32,664,545 | |||||
TOTAL INVESTMENTS - 103.9% (Cost $23,242,738) | 32,664,545 | |||||
Liabilities in Excess of Other Assets - (3.9)% | (1,240,741) | |||||
TOTAL NET ASSETS - 100.0% | $ 31,423,804 | |||||
(a) | Non-income producing security. |
7 |
Shares | Value | |||||
COMMON STOCKS - 95.4% | ||||||
Aerospace & Defense - 0.1% | ||||||
Cadre Holdings, Inc. | 3,419 | $ 114,742 | ||||
Air Freight & Logistics - 0.7% | ||||||
United Parcel Service, Inc. - Class B | 6,445 | 881,998 | ||||
Banks - 5.1% | ||||||
OceanFirst Financial Corp. | 30,012 | 476,891 | ||||
Primis Financial Corp. | 258,169 | 2,705,611 | ||||
Shore Bancshares, Inc. | 124,014 | 1,419,960 | ||||
WSFS Financial Corp. | 32,805 | 1,541,835 | ||||
6,144,297 | ||||||
Beverages - 3.5% | ||||||
Keurig Dr Pepper, Inc. | 3,050 | 101,870 | ||||
Primo Water Corp. | 189,582 | 4,144,263 | ||||
4,246,133 | ||||||
Broadline Retail - 0.7% | ||||||
Amazon.com, Inc.(a) | 4,020 | 776,865 | ||||
Building Products - 4.8% | ||||||
Advanced Drainage Systems, Inc. | 7,316 | 1,173,413 | ||||
Johnson Controls International PLC | 70,795 | 4,705,744 | ||||
5,879,157 | ||||||
Chemicals - 5.4% | ||||||
DuPont de Nemours, Inc. | 47,262 | 3,804,118 | ||||
Minerals Technologies, Inc. | 27,728 | 2,305,861 | ||||
The Sherwin-Williams Co. | 1,629 | 486,142 | ||||
6,596,121 | ||||||
Commercial Services & Supplies - 9.7% | ||||||
Republic Services, Inc. | 60,783 | 11,812,568 | ||||
Construction & Engineering - 13.3% | ||||||
EMCOR Group, Inc. | 28,138 | 10,272,621 | ||||
MYR Group, Inc.(a) | 43,482 | 5,900,942 | ||||
16,173,563 | ||||||
Consumer Staples Distribution & Retail - 1.1% | ||||||
US Foods Holding Corp.(a) | 24,486 | 1,297,268 | ||||
Electric Utilities - 1.1% | ||||||
NextEra Energy, Inc. | 19,279 | 1,365,146 | ||||
Electrical Equipment - 4.6% | ||||||
Emerson Electric Co. | 14,405 | 1,586,855 | ||||
NEXTracker, Inc. - Class A(a) | 33,094 | 1,551,447 | ||||
nVent Electric PLC | 20,000 | 1,532,200 | ||||
Shoals Technologies Group, Inc. - Class A(a) | 137,915 | 860,589 | ||||
5,531,091 | ||||||
Electronic Equipment, Instruments & Components - 1.5% | ||||||
Flex Ltd.(a) | 61,989 | 1,828,056 | ||||
Shares | Value | |||||
Financial Services - 1.0% | ||||||
Cannae Holdings, Inc. | 30,599 | $ 555,066 | ||||
Visa, Inc. - Class A | 2,422 | 635,702 | ||||
1,190,768 | ||||||
Food Products - 0.9% | ||||||
Darling Ingredients, Inc.(a) | 29,221 | 1,073,872 | ||||
Health Care Equipment & Supplies - 4.5% | ||||||
Abbott Laboratories | 9,105 | 946,100 | ||||
Hologic, Inc.(a) | 2,174 | 161,419 | ||||
Medtronic PLC | 28,597 | 2,250,870 | ||||
STERIS PLC | 598 | 131,285 | ||||
Teleflex, Inc. | 1,899 | 399,417 | ||||
Zimmer Biomet Holdings, Inc. | 14,107 | 1,531,033 | ||||
5,420,124 | ||||||
Hotels, Restaurants & Leisure - 2.1% | ||||||
Wyndham Hotels & Resorts, Inc. | 34,688 | 2,566,912 | ||||
Insurance - 4.1% | ||||||
Chubb Ltd. | 4,938 | 1,259,585 | ||||
W.R. Berkley Corp. | 47,610 | 3,741,194 | ||||
5,000,779 | ||||||
Interactive Media & Services - 5.0% | ||||||
Alphabet, Inc. - Class C | 16,240 | 2,978,741 | ||||
Ziff Davis, Inc.(a) | 57,042 | 3,140,162 | ||||
6,118,903 | ||||||
IT Services - 2.3% | ||||||
Akamai Technologies, Inc.(a) | 12,931 | 1,164,824 | ||||
Amdocs Ltd. | 20,718 | 1,635,065 | ||||
2,799,889 | ||||||
Oil, Gas & Consumable Fuels - 2.9% | ||||||
EOG Resources, Inc. | 25,226 | 3,175,197 | ||||
Phillips 66 | 2,813 | 397,111 | ||||
3,572,308 | ||||||
Personal Care Products - 1.5% | ||||||
Kenvue, Inc. | 102,927 | 1,871,213 | ||||
Pharmaceuticals - 0.4% | ||||||
Johnson & Johnson | 3,289 | 480,720 | ||||
Professional Services - 12.6% | ||||||
Alight, Inc. - Class A(a) | 358,217 | 2,643,641 | ||||
Dun & Bradstreet Holdings, Inc. | 208,520 | 1,930,895 | ||||
KBR, Inc. | 167,691 | 10,755,701 | ||||
15,330,237 | ||||||
Software - 1.0% | ||||||
Blackbaud, Inc.(a) | 16,583 | 1,263,127 | ||||
Technology Hardware, Storage & Peripherals - 0.3% | ||||||
Pure Storage, Inc. - Class A(a) | 6,195 | 397,781 | ||||
8 |
Shares | Value | |||||
COMMON STOCKS - (Continued) | ||||||
Textiles, Apparel & Luxury Goods - 1.6% | ||||||
Levi Strauss & Co. - Class A | 103,241 | $1,990,487 | ||||
Trading Companies & Distributors - 1.2% | ||||||
Rush Enterprises, Inc. - Class A | 17,839 | 746,919 | ||||
Rush Enterprises, Inc. - Class B | 17,328 | 679,951 | ||||
1,426,870 | ||||||
Wireless Telecommunication Services - 2.4% | ||||||
T-Mobile US, Inc. | 16,777 | 2,955,772 | ||||
TOTAL COMMON STOCKS (Cost $58,104,118) | 116,106,767 | |||||
REAL ESTATE INVESTMENT TRUSTS - 1.3% | ||||||
Residential Real Estate Investment Trusts - 1.3% | ||||||
American Homes 4 Rent - Class A | 43,695 | 1,623,706 | ||||
TOTAL REAL ESTATE INVESTMENT TRUSTS (Cost $1,177,639) | 1,623,706 | |||||
EXCHANGE TRADED FUNDS - 1.1% | ||||||
Invesco Solar ETF | 33,518 | 1,347,759 | ||||
TOTAL EXCHANGE TRADED FUNDS (Cost $1,120,903) | 1,347,759 | |||||
PREFERRED STOCKS - 0.0%(b) | ||||||
Oil, Gas & Consumable Fuels - 0.0%(b) | ||||||
GasLog Partners LP Series A, 8.63% to 06/15/2027 then 3 mo. LIBOR US + 6.31%, Perpetual(c) | 884 | 22,144 | ||||
TOTAL PREFERRED STOCKS (Cost $11,376) | 22,144 | |||||
TOTAL INVESTMENTS - 97.8% (Cost $60,414,036) | 119,100,376 | |||||
Other Assets in Excess of Liabilities - 2.2% | $2,669,226 | |||||
TOTAL NET ASSETS - 100.0% | $121,769,602 | |||||
(a) | Non-income producing security. |
(b) | Represents less than 0.05% of net assets. |
(c) | Securities referencing LIBOR are expected to transition to an alternative reference rate by the security’s next scheduled coupon reset date. |
9 |
Shares | Value | |||||
COMMON STOCKS - 58.2% | ||||||
Broadline Retail - 4.1% | ||||||
Amazon.com, Inc.(a) | 2,371 | $458,196 | ||||
Capital Markets - 1.8% | ||||||
The Charles Schwab Corp. | 2,693 | 198,447 | ||||
Chemicals - 2.0% | ||||||
The Sherwin-Williams Co. | 742 | 221,435 | ||||
Construction Materials - 2.1% | ||||||
Martin Marietta Materials, Inc. | 421 | 228,098 | ||||
Containers & Packaging - 2.5% | ||||||
Ball Corp. | 4,682 | 281,014 | ||||
Financial Services - 1.1% | ||||||
PayPal Holdings, Inc.(a) | 2,058 | 119,426 | ||||
Health Care Providers & Services - 2.2% | ||||||
AMN Healthcare Services, Inc.(a) | 2,082 | 106,661 | ||||
UnitedHealth Group, Inc. | 258 | 131,389 | ||||
238,050 | ||||||
Hotels, Restaurants & Leisure - 1.1% | ||||||
Expedia Group, Inc.(a) | 948 | 119,438 | ||||
Household Durables - 0.5% | ||||||
DR Horton, Inc. | 405 | 57,077 | ||||
Independent Power and Renewable Electricity Producers - 2.2% | ||||||
Talen Energy Corp.(a) | 2,169 | 240,802 | ||||
Insurance - 1.2% | ||||||
The Progressive Corp. | 621 | 128,988 | ||||
Interactive Media & Services - 3.4% | ||||||
Alphabet, Inc. - Class A | 484 | 88,160 | ||||
Meta Platforms, Inc. - Class A | 562 | 283,372 | ||||
371,532 | ||||||
IT Services - 1.0% | ||||||
Accenture PLC - Class A | 369 | 111,958 | ||||
Life Sciences Tools & Services - 5.2% | ||||||
Danaher Corp. | 1,495 | 373,526 | ||||
IQVIA Holdings, Inc.(a) | 946 | 200,022 | ||||
573,548 | ||||||
Semiconductors & Semiconductor Equipment - 8.0% | ||||||
Entegris, Inc. | 1,639 | 221,921 | ||||
NVIDIA Corp. | 3,030 | 374,326 | ||||
Taiwan Semiconductor Manufacturing Co. Ltd. - ADR | 1,627 | 282,789 | ||||
879,036 | ||||||
Software - 11.5% | ||||||
Gitlab, Inc. - Class A(a) | 2,848 | 141,603 | ||||
Shares | Value | |||||
Intuit, Inc. | 329 | $ 216,222 | ||||
Microsoft Corp. | 1,063 | 475,108 | ||||
Palo Alto Networks, Inc.(a) | 790 | 267,818 | ||||
Salesforce, Inc. | 633 | 162,744 | ||||
1,263,495 | ||||||
Trading Companies & Distributors - 5.8% | ||||||
AerCap Holdings NV | 3,680 | 342,976 | ||||
Ferguson PLC | 1,538 | 297,834 | ||||
640,810 | ||||||
Wireless Telecommunication Services - 2.5% | ||||||
T-Mobile US, Inc. | 1,570 | 276,602 | ||||
TOTAL COMMON STOCKS (Cost $5,943,062) | 6,407,952 | |||||
Par | ||||||
U.S. TREASURY SECURITIES - 30.7% | ||||||
United States Treasury Note/Bond | ||||||
4.63%, 06/30/2026 | $500,000 | 499,111 | ||||
4.25%, 03/15/2027 | 600,000 | 595,266 | ||||
4.25%, 02/28/2029 | 1,150,000 | 1,145,036 | ||||
4.00%, 02/15/2034 | 600,000 | 582,516 | ||||
4.38%, 05/15/2034 | 50,000 | 50,019 | ||||
4.25%, 02/15/2054 | 530,000 | 504,784 | ||||
TOTAL U.S. TREASURY SECURITIES (Cost $3,411,711) | 3,376,732 | |||||
CORPORATE BONDS - 4.1% | ||||||
Banks - 0.9% | ||||||
Bank of America Corp., 3.85% to 03/08/2032 then 5 yr. CMT Rate + 2.00%, 03/08/2037 | 50,000 | 43,841 | ||||
Morgan Stanley, 5.83% to 04/19/2034 then SOFR + 1.58%, 04/19/2035 | 50,000 | 51,273 | ||||
95,114 | ||||||
Biotechnology - 0.4% | ||||||
Amgen, Inc., 4.20%, 03/01/2033 | 50,000 | 46,345 | ||||
Computers - 0.5% | ||||||
Booz Allen Hamilton, Inc., 5.95%, 08/04/2033 | 50,000 | 51,634 | ||||
Environmental Control - 0.4% | ||||||
Veralto Corp., 5.45%, 09/18/2033 (b) | 50,000 | 49,929 | ||||
Healthcare-Services - 0.6% | ||||||
Elevance Health, Inc., 5.65%, 06/15/2054 | 20,000 | 19,799 | ||||
Humana, Inc., 5.38%, 04/15/2031 | 50,000 | 49,751 | ||||
69,550 | ||||||
10 |
Par | Value | |||||
CORPORATE BONDS - (Continued) | ||||||
Lodging - 0.4% | ||||||
Marriott International, Inc., 2.75%, 10/15/2033 | $ 50,000 | $40,389 | ||||
Real Estate Investment Trusts - 0.5% | ||||||
Brixmor Operating Partnership LP, 5.75%, 02/15/2035 | 25,000 | 24,967 | ||||
Equinix Europe 2 Financing Corp. LLC, 5.50%, 06/15/2034 | 20,000 | 19,975 | ||||
Host Hotels & Resorts LP, 5.70%, 07/01/2034 | 10,000 | 9,834 | ||||
54,776 | ||||||
Software - 0.4% | ||||||
Fiserv, Inc., 5.60%, 03/02/2033 | 50,000 | 50,439 | ||||
TOTAL CORPORATE BONDS (Cost $458,033) | 458,176 | |||||
TOTAL INVESTMENTS - 93.0% (Cost $9,812,806) | 10,242,860 | |||||
Other Assets in Excess of Liabilities - 7.0% | 766,129 | |||||
TOTAL NET ASSETS - 100.0% | $11,008,989 | |||||
(a) | Non-income producing security. |
(b) | Security is exempt from registration pursuant to Rule 144A under the Securities Act of 1933, as amended. These securities may only be resold in transactions exempt from registration to qualified institutional investors. As of June 30, 2024, the value of these securities total $49,929 or 0.4% of the Fund’s net assets. |
11 |
Cromwell CenterSquare Real Estate Fund | Cromwell Long Short Fund | Cromwell Foresight Global Sustainable Infrastructure Fund | |||||||
ASSETS | |||||||||
Investments in securities, at value* | $114,634,983 | $94,160,507 | $43,348,467 | ||||||
Foreign currency, at value*** | — | — | 24,214 | ||||||
Cash & cash equivalents | 801,927 | 4,145,676 | 1,435,796 | ||||||
Dividends & interest receivable | 398,662 | 277,787 | 241,568 | ||||||
Receivable for capital shares sold | 5,724 | 205 | — | ||||||
Broker interest receivable | — | 44,258 | — | ||||||
Deposits at brokers(1) | — | 11,696,249 | — | ||||||
Receivable for investment securities sold | 247,434 | — | — | ||||||
Prepaid expenses & other assets | 18,176 | 21,208 | 6,986 | ||||||
Total Assets | 116,106,906 | 110,345,890 | 45,057,031 | ||||||
LIABILITIES | |||||||||
Payable for capital shares redeemed | 20,836 | 67,233 | — | ||||||
Securities sold short, at value** | — | 11,006,069 | — | ||||||
Payable for investment securities purchased | 375,870 | — | 189,953 | ||||||
Payable to investment adviser | 48,832 | 83,750 | 23,370 | ||||||
Payable for fund administration & accounting fees | 9,259 | 18,783 | 7,128 | ||||||
Payable for compliance fees | 874 | 874 | 874 | ||||||
Payable for custody fees | 4,274 | 2,472 | 2,539 | ||||||
Payable for transfer agent fees & expenses | 48,229 | 25,408 | 2,020 | ||||||
Accrued distribution and/or shareholder service fees | — | 9,333 | — | ||||||
Payable for trustee fees | 7,684 | — | 4,362 | ||||||
Dividends & interest on short positions | — | 3,015 | — | ||||||
Payable for audit fees | 6,941 | 6,891 | 8,492 | ||||||
Other accrued expenses & liabilities | 14,029 | 5,338 | 29,158 | ||||||
Total Liabilities | 536,828 | 11,229,166 | 267,896 | ||||||
NET ASSETS | $115,570,078 | $99,116,724 | $44,789,135 | ||||||
Net Assets Consist of: | |||||||||
Paid-in capital | $111,876,444 | $420,639,330 | $51,250,260 | ||||||
Total distributable earnings/(accumulated deficit) | 3,693,634 | (321,522,606) | (6,461,125) | ||||||
Net assets | $115,570,078 | $99,116,724 | $44,789,135 | ||||||
Investor Class: | |||||||||
Net assets | $50,056,099 | $44,021,937 | $— | ||||||
Shares issued and outstanding(2) | 4,741,474 | 1,979,459 | — | ||||||
Net asset value | $10.56 | $22.24 | $— | ||||||
Institutional Class: | |||||||||
Net assets | $65,513,979 | $55,094,787 | $44,789,135 | ||||||
Shares issued and outstanding(2) | 6,210,189 | 2,426,025 | 2,570,357 | ||||||
Net asset value | $10.55 | $22.71 | $17.43 | ||||||
12 |
Cromwell CenterSquare Real Estate Fund | Cromwell Long Short Fund | Cromwell Foresight Global Sustainable Infrastructure Fund | |||||||
* Cost of securities | $99,811,302 | $88,072,832 | $47,376,755 | ||||||
**Proceeds received on securities sold short | — | 11,722,125 | — | ||||||
*** Cost of foreign currency | — | — | 24,230 | ||||||
(1) | Serves as collateral for securities sold short. |
(2) | Unlimited number of shares authorized with no par value. |
13 |
Cromwell Tran Sustainable Focus Fund | Cromwell Greenspring Mid Cap Fund | Cromwell Sustainable Balanced Fund | |||||||
ASSETS | |||||||||
Investments in securities, at value* | $32,664,545 | $119,100,376 | $10,242,860 | ||||||
Cash & cash equivalents | 331,465 | 2,659,014 | 1,223,946 | ||||||
Due from investment adviser | — | — | 6,552 | ||||||
Dividends & interest receivable | 13,426 | 103,808 | 54,332 | ||||||
Receivable for capital shares sold | — | 1,790 | — | ||||||
Receivable for investment securities sold | — | 25,355 | — | ||||||
Prepaid expenses & other assets | 13,307 | 13,602 | 26,406 | ||||||
Total Assets | 33,022,743 | 121,903,945 | 11,554,096 | ||||||
LIABILITIES | |||||||||
Payable for capital shares redeemed | 1,547,318 | 9,660 | — | ||||||
Payable for investment securities purchased | — | — | 499,243 | ||||||
Payable to investment adviser | 6,413 | 74,340 | — | ||||||
Payable for fund administration & accounting fees | 10,497 | 7,361 | 23,034 | ||||||
Payable for compliance fees | 874 | 874 | 894 | ||||||
Payable for custody fees | 564 | 4,063 | 498 | ||||||
Payable for transfer agent fees & expenses | 8,721 | 6,936 | 6,196 | ||||||
Accrued distribution and/or shareholder service fees | 3,734 | — | — | ||||||
Payable for trustee fees | 4,033 | 7,951 | 4,197 | ||||||
Payable for audit fees | 7,128 | 6,847 | 7,090 | ||||||
Other accrued expenses & liabilities | 9,657 | 16,311 | 3,955 | ||||||
Total Liabilities | 1,598,939 | 134,343 | 545,107 | ||||||
NET ASSETS | $31,423,804 | $121,769,602 | $11,008,989 | ||||||
Net Assets Consists of: | |||||||||
Paid-in capital | $21,093,661 | $58,007,895 | $10,555,663 | ||||||
Total distributable earnings/(accumulated deficit) | 10,330,143 | 63,761,707 | 453,326 | ||||||
Net assets | $31,423,804 | $121,769,602 | $11,008,989 | ||||||
Investor Class: | |||||||||
Net assets | $16,783,259 | $— | $— | ||||||
Shares issued and outstanding(1) | 2,529,084 | — | — | ||||||
Net asset value | $6.64 | $— | $— | ||||||
Institutional Class: | |||||||||
Net assets | $14,640,545 | $121,769,602 | $11,008,989 | ||||||
Shares issued and outstanding(1) | 1,983,606 | 4,884,155 | 515,691 | ||||||
Net asset value | $7.38 | $24.93 | $21.35 | ||||||
* Cost of securities | $23,242,738 | $60,414,036 | $9,812,806 | ||||||
(1) | Unlimited number of shares authorized with no par value. |
14 |
Cromwell CenterSquare Real Estate Fund | Cromwell Long Short Fund | Cromwell Foresight Global Sustainable Infrastructure Fund | |||||||
INVESTMENT INCOME: | |||||||||
Dividend income | $2,203,954 | $994,085 | $926,380 | ||||||
Less: Foreign taxes witheld | (1,758) | (23,328) | (62,323) | ||||||
Broker interest income | — | 820,905 | — | ||||||
Interest income | 13,992 | 290,917 | 14,998 | ||||||
Total Investment Income | 2,216,188 | 2,082,579 | 879,055 | ||||||
EXPENSES: | |||||||||
Investment advisory fees (See Note 4) | 350,309 | 879,942 | 184,203 | ||||||
Dividend expense | — | 300,226 | — | ||||||
Transfer agent fees & expenses (See Note 4) | 23,606 | 97,980 | 9,953 | ||||||
Fund administration & accounting fees (See Note 4) | 39,240 | 49,933 | 29,787 | ||||||
Federal & state registration fees | 19,625 | 25,311 | 4,103 | ||||||
Trustee fees | 15,697 | 16,962 | 9,518 | ||||||
Audit fees | 7,193 | 7,193 | 8,582 | ||||||
Custody fees (See Note 4) | 7,044 | 5,537 | 9,691 | ||||||
Other expenses | 5,270 | 5,797 | 2,071 | ||||||
Legal fees | 22,595 | 25,792 | 8,097 | ||||||
Interest expense | — | — | 581 | ||||||
Insurance expense | 740 | 27 | 784 | ||||||
Postage & printing fees | 10,211 | 10,529 | 2,067 | ||||||
Compliance fees (See Note 4) | 6,807 | 6,807 | 6,807 | ||||||
Tax expense | 7,414 | — | — | ||||||
Distribution and/or shareholder service fees (See Note 5) | |||||||||
Investor Class | 53,787 | 59,723 | — | ||||||
Institutional Class | 44,174 | — | — | ||||||
Total Expenses Before Reimbursement/Recoupment | 613,712 | 1,491,759 | 276,244 | ||||||
Adviser recoupment (See Note 4) | 5,630 | — | — | ||||||
Reimbursement from adviser (See Note 4) | — | (157,588) | (48,119) | ||||||
Total Net Expenses | 619,342 | 1,334,171 | 228,125 | ||||||
Net Investment Income (loss) | 1,596,846 | 748,408 | 650,930 | ||||||
REALIZED AND UNREALIZED GAIN (LOSS) ON INVESTMENTS | |||||||||
Net realized gain (loss) on: | |||||||||
Investments | (2,331,066) | 43,685,787 | (928,157) | ||||||
Securities sold short | — | (12,927,797) | — | ||||||
Foreign currency transactions | — | (59,296) | (14,967) | ||||||
(2,331,066) | 30,698,694 | (943,124) | |||||||
Net change in unrealized appreciation(depreciation) on: | |||||||||
Investments | (1,832,885) | (37,304,318) | (1,637,686) | ||||||
Securities sold short | — | 9,613,878 | — | ||||||
Foreign currency translations | — | (5,209) | (44,293) | ||||||
(1,832,885) | (27,695,649) | (1,681,979) | |||||||
Net realized and unrealized gain(loss) | (4,163,951) | 3,003,045 | (2,625,103) | ||||||
NET INCREASE(DECREASE) IN NET ASSETS RESULTING FROM OPERATIONS | $(2,567,105) | $3,751,453 | $(1,974,173) | ||||||
15 |
Cromwell Tran Sustainable Focus Fund | Cromwell Greenspring Mid Cap Fund | Cromwell Sustainable Balanced Fund | |||||||
INVESTMENT INCOME: | |||||||||
Dividend income | $108,925 | $841,471 | $18,263 | ||||||
Less: Foreign taxes witheld | (1,550) | (10,532) | (281) | ||||||
Interest income | 12,000 | 69,647 | 92,641 | ||||||
Total Investment Income | 119,375 | 900,586 | 110,623 | ||||||
EXPENSES: | |||||||||
Investment advisory fees (See Note 4) | 138,651 | 458,331 | 37,228 | ||||||
Transfer agent fees & expenses (See Note 4) | 28,458 | 60,801 | 15,259 | ||||||
Fund administration & accounting fees (See Note 4) | 37,792 | 34,558 | 48,102 | ||||||
Federal & state registration fees | 22,143 | 13,605 | 13,462 | ||||||
Trustee fees | 8,756 | 16,007 | 7,401 | ||||||
Audit fees | 7,193 | 7,090 | 7,090 | ||||||
Custody fees (See Note 4) | 1,767 | 3,345 | 2,701 | ||||||
Other expenses | 2,828 | 1,482 | 1,944 | ||||||
Legal fees | 6,284 | 21,808 | 2,844 | ||||||
Interest expense | 103 | — | — | ||||||
Insurance expense | 752 | — | 401 | ||||||
Postage & printing fees | 3,972 | 6,098 | 1,801 | ||||||
Compliance fees (See Note 4) | 6,807 | 6,807 | 6,827 | ||||||
Distribution and/or shareholder service fees (See Note 5) | |||||||||
Investor Class | 22,632 | — | — | ||||||
Total Expenses Before Reimbursement/Recoupment | 288,138 | 629,932 | 145,060 | ||||||
Adviser recoupment (See Note 4) | — | — | — | ||||||
Reimbursement from adviser (See Note 4) | (126,753) | — | (96,883) | ||||||
Total Net Expenses | 161,385 | 629,932 | 48,177 | ||||||
Net Investment Income (loss) | (42,010) | 270,654 | 62,446 | ||||||
REALIZED AND UNREALIZED GAIN (LOSS) ON INVESTMENTS | |||||||||
Net realized gain (loss) on: | |||||||||
Investments | 1,540,939 | 3,613,809 | (39,174) | ||||||
Net change in unrealized appreciation (depreciation) on: | |||||||||
Investments | 1,500,291 | 5,151,196 | 430,054 | ||||||
Net realized and unrealized gain (loss) | 3,041,230 | 8,765,005 | 390,880 | ||||||
NET INCREASE (DECREASE) IN NET ASSETS RESULTING FROM OPERATIONS | $2,999,220 | $9,035,659 | $453,326 | ||||||
16 |
Cromwell CenterSquare Real Estate Fund | ||||||
For the Period Ended June 30, 2024 | For the Year Ended December 31, 2023 | |||||
OPERATIONS: | ||||||
Net investment income (loss) | $1,596,846 | $2,827,489 | ||||
Net realized gain (loss) on investments | (2,331,066) | (3,624,573) | ||||
Net change in unrealized appreciation (depreciation) on investments | (1,832,885) | 14,646,431 | ||||
Net Increase (Decrease) in Net Assets Resulting From Operations | (2,567,105) | 13,849,347 | ||||
CAPITAL SHARE TRANSACTIONS: | ||||||
Investor Class: | ||||||
Proceeds from shares sold | 2,017,395 | 4,974,648 | ||||
Proceeds from reinvestment of distributions | 631,998 | 1,240,881 | ||||
Payments for shares redeemed | (10,618,414) | (21,674,509) | ||||
Increase (Decrease) in Net Assets Resulting From Investor Class Transactions | (7,969,021) | (15,458,980) | ||||
Institutional Class: | ||||||
Proceeds from shares sold | 7,849,499 | 8,499,718 | ||||
Proceeds from reinvestment of distributions | 888,620 | 1,416,531 | ||||
Payments for shares redeemed | (7,354,489) | (19,971,469) | ||||
Proceeds from shares issued in conversion of Class Z(1) | — | 6,974,078 | ||||
Increase (Decrease) in Net Assets Resulting From Institutional Class Transactions | 1,383,630 | (3,081,142) | ||||
Class Z(1): | ||||||
Proceeds from shares sold | — | 821 | ||||
Payments for shares redeemed | — | (78,119) | ||||
Payments for shares redeemed in conversion of Class Z | — | (6,974,078) | ||||
Increase (Decrease) in Net Assets Resulting From Class Z Transactions | — | (7,051,376) | ||||
Net Increase (Decrease) in Net Assets Resulting From Capital Share Transactions | (6,585,391) | (25,591,498) | ||||
DISTRIBUTIONS TO SHAREHOLDERS: | ||||||
Investor Class | (648,258) | (1,281,919) | ||||
Institutional Class | (889,953) | (1,420,237) | ||||
Total Distributions to Shareholders | (1,538,211) | (2,702,156) | ||||
Total increase (decrease) in net assets | (10,690,707) | (14,444,307) | ||||
NET ASSETS: | ||||||
Beginning of period | 126,260,785 | 140,705,092 | ||||
End of period | $115,570,078 | $126,260,785 | ||||
(1) | On February 28, 2023 the Fund converted Class Z shares into Institutional Class Shares and closed the Class Z shares of the Fund. |
17 |
Cromwell Long Short Fund | ||||||
For the Period Ended June 30, 2024 | For the Year Ended December 31, 2023 | |||||
OPERATIONS: | ||||||
Net investment income (loss) | $748,408 | $3,078,883 | ||||
Net realized gain (loss) on: | ||||||
Investments | 43,685,787 | 411,782 | ||||
Securities sold short | (12,927,797) | (247,735) | ||||
Purchased options | — | (417,687) | ||||
Foreign currency transactions | (59,296) | 10,579 | ||||
Net change in unrealized appreciation (depreciation) on: | ||||||
Investments | (37,304,318) | 11,175,292 | ||||
Securities sold short | 9,613,878 | (14,578,326) | ||||
Foreign currency translations | (5,209) | 4,804 | ||||
Net Increase (Decrease) in Net Assets Resulting From Operations | 3,751,453 | (562,408) | ||||
CAPITAL SHARE TRANSACTIONS: | ||||||
Investor Class: | ||||||
Proceeds from shares sold | 114,359 | 11,028,006 | ||||
Proceeds from reinvestment of distributions | — | 955,320 | ||||
Payments for shares redeemed | (7,606,122) | (7,925,720) | ||||
Proceeds from shares issued in conversion of Class C(1) | — | 771,360 | ||||
Increase (Decrease) in Net Assets Resulting From Investor Class Transactions | (7,491,763) | 4,828,966 | ||||
Institutional Class: | ||||||
Proceeds from shares sold | 1,746,998 | 12,124,962 | ||||
Proceeds from reinvestment of distributions | — | 1,966,556 | ||||
Payments for shares redeemed | (35,681,870) | (26,221,873) | ||||
Increase (Decrease) in Net Assets Resulting From Institutional Class Transactions | (33,934,872) | (12,130,355) | ||||
Class C(1): | ||||||
Proceeds from shares sold | — | 50,743 | ||||
Payments for shares redeemed | — | (11,323,625) | ||||
Payments for shares redeemed in conversion of Class C | — | (771,360) | ||||
Increase (Decrease) in Net Assets Resulting From Class C Transactions | — | (12,044,242) | ||||
Net Increase (Decrease) in Net Assets Resulting From Capital Share Transactions | (41,426,635) | (19,345,631) | ||||
DISTRIBUTIONS TO SHAREHOLDERS: | ||||||
Investor Class | — | (1,071,172) | ||||
Institutional Class | — | (2,070,360) | ||||
Total Distributions to Shareholders | — | (3,141,532) | ||||
Total increase (decrease) in net assets | (37,675,182) | (23,049,571) | ||||
NET ASSETS: | ||||||
Beginning of period | 136,791,906 | 159,841,477 | ||||
End of period | $99,116,724 | $136,791,906 | ||||
(1) | On November 17, 2023 the Fund converted Class C shares into Investor Class Shares and closed the Class C shares of the Fund. |
18 |
Cromwell Foresight Global Sustainable Infrastructure Fund | ||||||
For the Period Ended June 30, 2024 | For the Period Ended December 31, 2023(1) | |||||
OPERATIONS: | ||||||
Net investment income (loss) | $650,930 | $1,103,909 | ||||
Net realized gain (loss) on: | ||||||
Investments | (928,157) | (2,078,692) | ||||
Foreign currency transactions | (14,967) | (6,261) | ||||
Net change in unrealized appreciation (depreciation) on: | ||||||
Investments | (1,637,686) | (2,390,602) | ||||
Foreign currency translations | (44,293) | 43,277 | ||||
Net Increase (Decrease) in Net Assets Resulting From Operations | (1,974,173) | (3,328,369) | ||||
CAPITAL SHARE TRANSACTIONS: | ||||||
Institutional Class: | ||||||
Proceeds from shares sold | 1,072,856 | 50,173,038 | ||||
Proceeds from reinvestment of distributions | — | 4,366 | ||||
Net Increase (Decrease) in Net Assets Resulting From Capital Share Transactions | 1,072,856 | 50,177,404 | ||||
DISTRIBUTIONS TO SHAREHOLDERS: | ||||||
Institutional Class | — | (1,158,583) | ||||
Total increase (decrease) in net assets | (901,317) | 45,690,452 | ||||
NET ASSETS: | ||||||
Beginning of period | 45,690,452 | — | ||||
End of period | $44,789,135 | $45,690,452 | ||||
(1) | Since commencement of operations on January 31, 2023. |
19 |
Cromwell Tran Sustainable Focus Fund | |||||||||
For the Period Ended June 30, 2024 | For the Period Ended December 31, 2023(1) | For the Year Ended April 30, 2023 | |||||||
OPERATIONS: | |||||||||
Net investment income (loss) | $(42,010) | $(59,001) | $(127,792) | ||||||
Net realized gain (loss) on investments | 1,540,939 | 1,954,525 | (2,492,845) | ||||||
Net change in unrealized appreciation (depreciation) on investments | 1,500,291 | 4,743,672 | (4,222,827) | ||||||
Net Increase (Decrease) in Net Assets Resulting From Operations | 2,999,220 | 6,639,196 | (6,843,464) | ||||||
CAPITAL SHARE TRANSACTIONS: | |||||||||
Investor Class: | |||||||||
Proceeds from shares sold | 1,016,617 | 146,127 | 763,473 | ||||||
Proceeds from reinvestment of distributions | — | — | 1,632,003 | ||||||
Payments for shares redeemed | (2,912,040) | (3,267,442) | (2,156,557) | ||||||
Increase (Decrease) in Net Assets Resulting From Investor Class Transactions | (1,895,423) | (3,121,315) | 238,919 | ||||||
Institutional Class: | |||||||||
Proceeds from shares sold | 656,477 | 195,456 | 1,539,228 | ||||||
Proceeds from reinvestment of distributions | — | — | 1,917,717 | ||||||
Payments for shares redeemed | (1,754,329) | (6,398,667) | (6,693,339) | ||||||
Increase (Decrease) in Net Assets Resulting From Institutional Class Transactions | (1,097,852) | (6,203,211) | (3,236,394) | ||||||
Net Increase (Decrease) in Net Assets Resulting From Capital Share Transactions | (2,993,275) | (9,324,526) | (2,997,475) | ||||||
DISTRIBUTIONS TO SHAREHOLDERS: | |||||||||
Investor Class | — | — | (1,983,656) | ||||||
Institutional Class | — | — | (2,075,393) | ||||||
Total Distributions to Shareholders | — | — | (4,059,049) | ||||||
Total increase (decrease) in net assets | 5,945 | (2,685,330) | (13,899,988) | ||||||
NET ASSETS: | |||||||||
Beginning of period | 31,417,859 | 34,103,189 | 48,003,177 | ||||||
End of period | $31,423,804 | $31,417,859 | $34,103,189 | ||||||
(1) | For the period May 1, 2023 through December 31, 2023. On November 1, 2023 the Tran Sustainable Balanced Fund changed its fiscal year end from April 30 to December 31. |
20 |
Cromwell Greenspring Mid Cap Fund | ||||||
For the Period Ended June 30, 2024 | For the Year Ended December 31, 2023 | |||||
OPERATIONS: | ||||||
Net investment income (loss) | $270,654 | $1,053,508 | ||||
Net realized gain (loss) on: | ||||||
Investments | 3,613,809 | 7,836,772 | ||||
Net change in unrealized appreciation (depreciation) on: | ||||||
Investments | 5,151,196 | 4,533,577 | ||||
Net Increase (Decrease) in Net Assets Resulting From Operations | 9,035,659 | 13,423,857 | ||||
CAPITAL SHARE TRANSACTIONS: | ||||||
Institutional Class: | ||||||
Proceeds from shares sold | 1,161,914 | 3,836,050 | ||||
Proceeds from reinvestment of distributions | — | 7,632,278 | ||||
Payments for shares redeemed | (7,926,920) | (33,393,965) | ||||
Net Increase (Decrease) in Net Assets Resulting From Capital Share Transactions | (6,765,006) | (21,925,637) | ||||
DISTRIBUTIONS TO SHAREHOLDERS: | ||||||
Institutional Class | — | (7,898,481) | ||||
Total increase (decrease) in net assets | 2,270,653 | (16,400,261) | ||||
NET ASSETS: | ||||||
Beginning of period | 119,498,949 | 135,899,210 | ||||
End of period | $121,769,602 | $119,498,949 | ||||
21 |
Cromwell Sustainable Balanced Fund | |||
For the Period Ended June 30, 2024 | |||
OPERATIONS: | |||
Net investment income (loss) | $62,446 | ||
Net realized gain (loss) on: | |||
Investments | (39,174) | ||
Net change in unrealized appreciation (depreciation) on: | |||
Investments | 430,054 | ||
Net Increase (Decrease) in Net Assets Resulting From Operations | 453,326 | ||
CAPITAL SHARE TRANSACTIONS: | |||
Institutional Class: | |||
Proceeds from shares sold | 10,556,649 | ||
Payments for shares redeemed | (1,006) | ||
Net Increase (Decrease) in Net Assets Resulting From Capital Share Transactions | 10,555,643 | ||
Total increase (decrease) in net assets | 11,008,969 | ||
NET ASSETS: | |||
Beginning of period | 20 | ||
End of period | $11,008,989 | ||
22 |
Period Ended June 30, 2024 | Year Ended December 31, | |||||||||||||||||
2023 | 2022 | 2021 | 2020 | 2019 | ||||||||||||||
PER SHARE DATA: | ||||||||||||||||||
Net Asset Value, Beginning of Period | $10.89 | $9.97 | $14.06 | $10.51 | $11.04 | $9.56 | ||||||||||||
Investment operations: | ||||||||||||||||||
Net investment income (loss)(2)(3) | 0.14 | 0.22 | 0.17 | 0.10 | 0.11 | 0.18 | ||||||||||||
Net realized and unrealized gain (loss) on investments | (0.33) | 0.91 | (3.63) | 4.00 | (0.42) | 1.99 | ||||||||||||
Total From Investment Operations | (0.19) | 1.13 | (3.46) | 4.10 | (0.31) | 2.17 | ||||||||||||
Less distributions from: | ||||||||||||||||||
Net investment income | (0.14) | (0.21) | (0.17) | (0.21) | (0.13) | (0.21) | ||||||||||||
Net realized gain | — | — | (0.46) | (0.34) | — | (0.48) | ||||||||||||
Paid in capital | — | — | — | — | (0.09) | — | ||||||||||||
Total Distributions | (0.14) | (0.21) | (0.63) | (0.55) | (0.22) | (0.69) | ||||||||||||
Net Asset Value, End of Period | $10.56 | $10.89 | $9.97 | $14.06 | $10.51 | $11.04 | ||||||||||||
TOTAL RETURN(3)(7) | (1.86)% | 11.70% | (24.72)% | 39.45% | (2.61)% | 22.90% | ||||||||||||
SUPPLEMENTAL DATA AND RATIOS: | ||||||||||||||||||
Net assets, end of period (in 000’s) | $50,056 | $59,869 | $69,987 | $104,438 | $90,167 | $166,047 | ||||||||||||
Ratio of expenses to average net assets: | ||||||||||||||||||
Before expense reimbursement/recoupment(4)(8) | 1.09% | 1.12% | 1.11% | 1.12%(5) | 1.15% | 1.10% | ||||||||||||
After expense reimbursement/recoupment(6)(8) | 1.10% | 1.12% | 1.12% | 1.12%(5) | 1.11% | 1.10% | ||||||||||||
Ratio of expenses excluding interest and tax expenses to average net assets: | ||||||||||||||||||
Before expense reimbursement/recoupment(4)(8) | 1.08% | 1.12% | 1.11% | 1.12%(5) | 1.15% | 1.10% | ||||||||||||
After expense reimbursement/recoupment(8) | 1.09% | 1.12% | 1.12% | 1.12%(5) | 1.11% | 1.10% | ||||||||||||
Ratio of net investment income (loss) to average net assets: | ||||||||||||||||||
After expense reimbursement/recoupment(8) | 2.67% | 2.15% | 1.46% | 0.84% | 1.07% | 1.62% | ||||||||||||
Portfolio turnover rate(7) | 15% | 47% | 57% | 68% | 131% | 76% | ||||||||||||
(1) | Prior to March 7, 2022, the Investor Class was known as Class N. Prior to February 27, 2017, Class N was known as Class S. |
(2) | Calculated using the average shares oustanding method. |
(3) | Total returns and net investment income would have been lower had certain expenses not been offset. |
(4) | Includes reduction from broker recapture amounting to less than 0.01% for the fiscal year ended December 31, 2021, 0.01% for the fiscal year ended December 31, 2020 and less than 0.01% for the fiscal year ended December 31, 2019. |
(5) | Such ratio includes recapture of waived/reimbursed fees from prior periods amounting to less than 0.01%. |
(6) | Excludes the impact of expense reimbursement or fee waivers and expense reductions such as brokerage credits, but includes expense repayments and non-reimbursable expenses, if any, such as interest, taxes, and extraordinary expenses. |
(7) | Not annualized for periods less than one year. |
(8) | Annualized for periods less than one year. |
23 |
Period Ended June 30, 2024 | Year Ended December 31, | |||||||||||||||||
2023 | 2022 | 2021 | 2020 | 2019 | ||||||||||||||
PER SHARE DATA: | ||||||||||||||||||
Net Asset Value, Beginning of Period | $10.89 | $9.96 | $14.05 | $10.51 | $11.04 | $9.56 | ||||||||||||
Investment operations: | ||||||||||||||||||
Net investment income (loss)(2)(3) | 0.14 | 0.24 | 0.19 | 0.12 | 0.12 | 0.19 | ||||||||||||
Net realized and unrealized gain (loss) on investments | (0.34) | 0.91 | (3.63) | 3.98 | (0.42) | 1.99 | ||||||||||||
Total From Investment Operations | (0.20) | 1.15 | (3.44) | 4.10 | (0.30) | 2.18 | ||||||||||||
Less distributions from: | ||||||||||||||||||
Net investment income | (0.14) | (0.22) | (0.19) | (0.22) | (0.13) | (0.22) | ||||||||||||
Net realized gain | — | — | (0.46) | (0.34) | — | (0.48) | ||||||||||||
Paid in capital | — | — | — | — | (0.10) | — | ||||||||||||
Total Distributions | (0.14) | (0.22) | (0.65) | (0.56) | (0.23) | (0.70) | ||||||||||||
Net Asset Value, End of Period | $10.55 | $10.89 | $9.96 | $14.05 | $10.51 | $11.04 | ||||||||||||
TOTAL RETURN(3)(8) | (1.80)% | 11.71% | (24.65)%(4) | 39.53% | (2.47)% | 23.06% | ||||||||||||
SUPPLEMENTAL DATA AND RATIOS: | ||||||||||||||||||
Net assets, end of period (in 000’s) | $65,514 | $66,391 | $63,915 | $102,347 | $50,587 | $56,324 | ||||||||||||
Ratio of expenses to average net assets: | ||||||||||||||||||
Before expense reimbursement/recoupment(5)(9) | 1.02% | 1.03% | 0.99% | 1.00%(6) | 1.02% | 0.97% | ||||||||||||
After expense reimbursement/recoupment(7)(9) | 1.03% | 1.02% | 1.00% | 1.00%(6) | 0.98% | 0.97% | ||||||||||||
Ratio of expenses excluding interest and tax expenses to average net assets: | ||||||||||||||||||
Before expense reimbursement/recoupment(5)(9) | 1.01% | 1.03% | 0.99% | 1.00%(6) | 1.02% | 0.97% | ||||||||||||
After expense reimbursement/recoupment(9) | 1.02% | 1.02% | 1.00% | 1.00%(6) | 0.98% | 0.97% | ||||||||||||
Ratio of net investment income (loss) to average net assets: | ||||||||||||||||||
After expense reimbursement/recoupment(9) | 2.79% | 2.36% | 1.56% | 0.96% | 1.19% | 1.75% | ||||||||||||
Portfolio turnover rate(8) | 15% | 47% | 57% | 68% | 131% | 76% | ||||||||||||
(1) | Prior to March 7, 2022, the Institutional Class was known as Class I. |
(2) | Calculated using the average shares oustanding method. |
(3) | Total returns and net investment income would have been lower had certain expenses not been offset. |
(4) | Includes adjustments in accordance with accounting principles generally accepted in the United States and, consequently, the net asset values for financial reporting purposes and the returns based upon those net asset values may differ from the net asset values and returns for shareholder transactions. |
(5) | Includes reduction from broker recapture amounting to less than 0.01% for the fiscal year ended December 31, 2021, 0.01% for the fiscal year ended December 31, 2020 and less than 0.01% for the fiscal year ended December 31, 2019. |
(6) | Such ratio includes recapture of waived/reimbursed fees from prior periods amounting to less than 0.01%. |
(7) | Excludes the impact of expense reimbursement or fee waivers and expense reductions such as brokerage credits, but includes expense repayments and non-reimbursable expenses, if any, such as interest, taxes, and extraordinary expenses. |
(8) | Not annualized for periods less than one year. |
(9) | Annualized for periods less than one year. |
24 |
Period Ended June 30, 2024 | Year Ended December 31, | |||||||||||||||||
2023 | 2022 | 2021 | 2020 | 2019 | ||||||||||||||
PER SHARE DATA: | ||||||||||||||||||
Net Asset Value, Beginning of Period | $21.59 | $22.13 | $21.62 | $19.96 | $16.65 | $14.92 | ||||||||||||
Investment operations: | ||||||||||||||||||
Net investment income (loss)(2) | 0.11 | 0.41 | 0.11 | (0.02) | (0.16) | 0.04 | ||||||||||||
Net realized and unrealized gain (loss) on investments | 0.54 | (0.48) | 0.50 | 1.68 | 3.47 | 1.73 | ||||||||||||
Total From Investment Operations | 0.65 | (0.07) | 0.61 | 1.66 | 3.31 | 1.77 | ||||||||||||
Less distributions from: | ||||||||||||||||||
Net investment income | — | (0.47) | (0.10) | — | — | (0.04) | ||||||||||||
Total Distributions | — | (0.47) | (0.10) | — | — | (0.04) | ||||||||||||
Net Asset Value, End of Period | $22.24 | $21.59 | $22.13 | $21.62 | $19.96 | $16.65 | ||||||||||||
TOTAL RETURN(5) | 3.01% | (0.34)% | 2.81% | 8.32% | 19.88% | 11.87% | ||||||||||||
SUPPLEMENTAL DATA AND RATIOS: | ||||||||||||||||||
Net assets, end of period (in 000’s) | $44,022 | $50,106 | $46,575 | $47,709 | $42,483 | $37,761 | ||||||||||||
Ratio of expenses to average net assets: | ||||||||||||||||||
Before expense reimbursement/recoupment(6) | 2.53% | 2.60% | 2.44% | 2.58% | 2.75% | 2.94% | ||||||||||||
After expense reimbursement/recoupment(6) | 2.28% | 2.38% | 2.25% | 2.36% | 2.47% | 2.70% | ||||||||||||
Ratio of expenses excluding dividend and interest expense on short positions to average net assets: | ||||||||||||||||||
Before expense reimbursement/recoupment(6) | 2.05% | 2.02% | 1.99% | 2.02% | 2.08% | 2.04% | ||||||||||||
After expense reimbursement/recoupment(6) | 1.80% | 1.80% | 1.80% | 1.80% | 1.80% | 1.80% | ||||||||||||
Ratio of net investment income (loss) to average net assets: | ||||||||||||||||||
After expense reimbursement/recoupment(3)(6) | 1.01% | 1.89% | 0.51% | (0.08)% | (0.95)% | 0.26% | ||||||||||||
Portfolio turnover rate(4)(5) | 91% | 30% | 40% | 26% | 12% | 17% | ||||||||||||
(1) | Prior to March 14, 2022, the Investor Class was known as Class A. |
(2) | Calculated using the average shares oustanding method. |
(3) | The net investment income(loss) ratios include dividend and interest expense on short positions. |
(4) | Consists of long-term investments only; excludes securities sold short and derivative instruments. |
(5) | Not annualized for periods less than one year. |
(6) | Annualized for periods less than one year. |
25 |
Period Ended June 30, 2024 | Year Ended December 31, | |||||||||||||||||
2023 | 2022 | 2021 | 2020 | 2019 | ||||||||||||||
PER SHARE DATA: | ||||||||||||||||||
Net Asset Value, Beginning of Period | $22.02 | $22.56 | $22.03 | $20.29 | $16.88 | $15.14 | ||||||||||||
Investment operations: | ||||||||||||||||||
Net investment income (loss)(2) | 0.15 | 0.48 | 0.18 | 0.03 | (0.12) | 0.08 | ||||||||||||
Net realized and unrealized gain (loss) on investments | 0.54 | (0.50) | 0.50 | 1.71 | 3.53 | 1.75 | ||||||||||||
Total From Investment Operations | 0.69 | (0.02) | 0.68 | 1.74 | 3.41 | 1.83 | ||||||||||||
Less distributions from: | ||||||||||||||||||
Net investment income | — | (0.52) | (0.15) | — | — | (0.09) | ||||||||||||
Total Distributions | — | (0.52) | (0.15) | — | — | (0.09) | ||||||||||||
Net Asset Value, End of Period | $22.71 | $22.02 | $22.56 | $22.03 | $20.29 | $16.88 | ||||||||||||
TOTAL RETURN(5) | 3.13% | (0.10)% | 3.10% | 8.58% | 20.20% | 12.13% | ||||||||||||
SUPPLEMENTAL DATA AND RATIOS: | ||||||||||||||||||
Net assets, end of period (in 000’s) | $55,095 | $86,686 | $101,115 | $90,440 | $91,645 | $105,998 | ||||||||||||
Ratio of expenses to average net assets: | ||||||||||||||||||
Before expense reimbursement/recoupment(6) | 2.27% | 2.35% | 2.19% | 2.33% | 2.47% | 2.68% | ||||||||||||
After expense reimbursement/recoupment(6) | 2.02% | 2.13% | 2.00% | 2.11% | 2.20% | 2.44% | ||||||||||||
Ratio of expenses excluding dividend and interest expense on short positions to average net assets: | ||||||||||||||||||
Before expense reimbursement/recoupment(6) | 1.80% | 1.77% | 1.74% | 1.78% | 1.83% | 1.80% | ||||||||||||
After expense reimbursement/recoupment(6) | 1.55% | 1.55% | 1.55% | 1.56% | 1.56% | 1.56% | ||||||||||||
Ratio of net investment income (loss) to average net assets: | ||||||||||||||||||
After expense reimbursement/recoupment(3)(6) | 1.30% | 2.14% | 0.81% | 0.13% | (0.71)% | 0.49% | ||||||||||||
Portfolio turnover rate(4)(5) | 91% | 30% | 40% | 26% | 12% | 17% | ||||||||||||
(1) | Prior to March 14, 2022, the Institutional Class was known as Class I. |
(2) | Calculated using the average shares oustanding method. |
(3) | The net investment income(loss) ratios include dividend and interest expense on short positions. |
(4) | Consists of long-term investments only; excludes securities sold short and derivative instruments. |
(5) | Not annualized for periods less than one year. |
(6) | Annualized for periods less than one year. |
26 |
Period Ended June 30, 2024 | Period Ended December 31, 2023(5) | |||||
PER SHARE DATA: | ||||||
Net Asset Value, Beginning of Period | $18.21 | $20.00 | ||||
Investment operations: | ||||||
Net investment income (loss)(1) | 0.25 | 0.44 | ||||
Net realized and unrealized gain (loss) on investments | (1.03) | (1.77) | ||||
Total From Investment Operations | (0.78) | (1.33) | ||||
Less distributions from: | ||||||
Net investment income | — | (0.46) | ||||
Total Distributions | — | (0.46) | ||||
Net Asset Value, End of Period | $17.43 | $18.21 | ||||
TOTAL RETURN(2)(4) | (4.28)% | (6.65)% | ||||
SUPPLEMENTAL DATA AND RATIOS: | ||||||
Net assets, end of period (in 000’s) | $44,789 | $45,690 | ||||
Ratio of expenses to average net assets: | ||||||
Before expense reimbursement/recoupment(3)(6) | 1.27% | 1.37% | ||||
After expense reimbursement/recoupment(3)(6) | 1.05% | 1.05% | ||||
Ratio of net investment income (loss) to average net assets: | ||||||
After expense reimbursement/recoupment(3) | 3.00% | 2.66% | ||||
Portfolio turnover rate(2) | 12% | 20% | ||||
(1) | Calculated using the average shares oustanding method. |
(2) | Not annualized for periods less than one year. |
(3) | Annualized for periods less than one year. |
(4) | Total return is calculated assuming a purchase of shares on the first day and a sale of shares on the last day of each period reported and includes reinvestments of dividends and distributions, if any. |
(5) | Since commencement of operations on January 31, 2023. |
(6) | Ratio excludes any expenses not included under the expense cap of the Fund including interest expense which amounts to less than 0.005%. |
27 |
Period Ended June 30, 2024 | Period Ended December 31, 2023(8) | Year Ended April 30, | |||||||||||||||||||
2023 | 2022 | 2021 | 2020 | 2019 | |||||||||||||||||
PER SHARE DATA: | |||||||||||||||||||||
Net Asset Value, Beginning of Period | $6.06 | $4.95 | $6.51 | $9.39 | $6.74 | $7.73 | $8.60 | ||||||||||||||
Investment operations: | |||||||||||||||||||||
Net investment income (loss)(2) | (0.01) | (0.01) | (0.02) | (0.07) | (0.04) | (0.03) | (0.02) | ||||||||||||||
Net realized and unrealized gain (loss) on investments | 0.59 | 1.12 | (0.94) | (0.92) | 3.85 | 0.27 | 0.79 | ||||||||||||||
Total From Investment Operations | 0.58 | 1.11 | (0.96) | (0.99) | 3.81 | 0.24 | 0.77 | ||||||||||||||
Less distributions from: | |||||||||||||||||||||
Net investment income | — | — | — | (1.89) | (1.16) | (1.23) | (1.64) | ||||||||||||||
Net realized gain | — | — | (0.60) | — | — | — | — | ||||||||||||||
Paid in capital | — | — | —(7) | — | — | — | — | ||||||||||||||
Total Distributions | — | — | (0.60) | (1.89) | (1.16) | (1.23) | (1.64) | ||||||||||||||
Net Asset Value, End of Period | $6.64 | $6.06 | $4.95 | $6.51 | $9.39 | $6.74 | $7.73 | ||||||||||||||
TOTAL RETURN(3)(5) | 9.57% | 22.42% | (14.76)% | (15.09)% | 60.14% | 2.11% | 12.62% | ||||||||||||||
SUPPLEMENTAL DATA AND RATIOS: | |||||||||||||||||||||
Net assets, end of period (in 000’s) | $16,783 | $17,028 | $16,855 | $21,825 | $33,768 | $22,395 | $17,375 | ||||||||||||||
Ratio of expenses to average net assets: | |||||||||||||||||||||
Before expense reimbursement/recoupment(4) | 1.88%(6) | 1.87%(6) | 1.96%(6) | 1.78% | 1.82% | 1.94% | 1.69% | ||||||||||||||
After expense reimbursement/recoupment(4) | 1.10%(6) | 1.10%(6) | 1.10%(6) | 1.10% | 1.10% | 1.10% | 1.10% | ||||||||||||||
Ratio of net investment income (loss) to average net assets: | |||||||||||||||||||||
After expense reimbursement/recoupment(4) | (0.37)% | (0.40)% | (0.45)% | (0.84)% | (0.56)% | (0.43)% | (0.23)% | ||||||||||||||
Portfolio turnover rate(3) | 26% | 49% | 49% | 38% | 66% | 58% | 51% | ||||||||||||||
(1) | Prior to August 8, 2022, the Investor Class was known as Class A. |
(2) | Calculated using the average shares oustanding method. |
(3) | Not annualized for periods less than one year. |
(4) | Annualized for periods less than one year. |
(5) | Total return is calculated assuming a purchase of shares on the first day and a sale of shares on the last day of each period reported and includes reinvestments of dividends and distributions, if any. If the Adviser had not waived fees/reimbursed expenses, the total return would have been lower. Total return does not reflect the impact of the maximum front-end sales load of 5.00% in effect prior to August 8, 2022. If reflected, the return would be lower. |
(6) | Ratio excludes any expenses not included under the expense cap of the Fund including interest expense which amounts to less than 0.005%. |
(7) | Amount is less than $0.005 per share. |
(8) | For the period May 1, 2023 through December 31, 2023. On November 1, 2023 the Tran Sustainable Balanced Fund changed its fiscal year end from April 30 to December 31. |
28 |
Period Ended June 30, 2024 | Period Ended December 31, 2023(8) | Year Ended April 30, | |||||||||||||||||||
2023 | 2022 | 2021 | 2020 | 2019 | |||||||||||||||||
PER SHARE DATA: | |||||||||||||||||||||
Net Asset Value, Beginning of Period | $6.73 | $5.49 | $7.13 | $10.09 | $7.16 | $8.12 | $8.93 | ||||||||||||||
Investment operations: | |||||||||||||||||||||
Net investment income (loss)(2) | —(6) | (0.01) | (0.01) | (0.06) | (0.03) | (0.01) | —(6) | ||||||||||||||
Net realized and unrealized gain (loss) on investments | 0.65 | 1.25 | (1.03) | (1.01) | 4.12 | 0.28 | 0.83 | ||||||||||||||
Total From Investment Operations | 0.65 | 1.24 | (1.04) | (1.07) | 4.09 | 0.27 | 0.83 | ||||||||||||||
Less distributions from: | |||||||||||||||||||||
Net investment income | — | — | — | (1.89) | (1.16) | (1.23) | (1.64) | ||||||||||||||
Net realized gain | — | — | (0.60) | — | — | — | — | ||||||||||||||
Paid in capital | — | — | —(6) | — | — | — | — | ||||||||||||||
Total Distributions | — | — | (0.60) | (1.89) | (1.16) | (1.23) | (1.64) | ||||||||||||||
Net Asset Value, End of Period | $7.38 | $6.73 | $5.49 | $7.13 | $10.09 | $7.16 | $8.12 | ||||||||||||||
TOTAL RETURN(3)(5) | 9.66% | 22.59% | (14.59)% | (14.80)% | 60.55% | 2.40% | 12.85% | ||||||||||||||
SUPPLEMENTAL DATA AND RATIOS: | |||||||||||||||||||||
Net assets, end of period (in 000’s) | $14,641 | $14,390 | $17,248 | $26,178 | $28,590 | $18,045 | $23,167 | ||||||||||||||
Ratio of expenses to average net assets: | |||||||||||||||||||||
Before expense reimbursement/recoupment(4) | 1.63%(7) | 1.62%(7) | 1.71%(7) | 1.54% | 1.58% | 1.68% | 1.44% | ||||||||||||||
After expense reimbursement/recoupment(4) | 0.85%(7) | 0.85%(7) | 0.85%(7) | 0.85% | 0.85% | 0.85% | 0.85% | ||||||||||||||
Ratio of net investment income (loss) to average net assets: | |||||||||||||||||||||
After expense reimbursement/recoupment(4) | (0.12)% | (0.14)% | (0.20)% | (0.59)% | (0.31)% | (0.16)% | 0.02% | ||||||||||||||
Portfolio turnover rate(3) | 26% | 42% | 49% | 38% | 66% | 58% | 51% | ||||||||||||||
(1) | Prior to August 8, 2022, the Institutional Class was known as Class I. |
(2) | Calculated using the average shares oustanding method. |
(3) | Not annualized for periods less than one year. |
(4) | Annualized for periods less than one year. |
(5) | Total return is calculated assuming a purchase of shares on the first day and a sale of shares on the last day of each period reported and includes reinvestments of dividends and distributions, if any. If the Adviser had not waived fees/reimbursed expenses, the total return would have been lower. |
(6) | Amount is less than $0.005 per share. |
(7) | Ratio excludes any expenses not included under the expense cap of the Fund including interest expense which amounts to less than 0.005%. |
(8) | For the period May 1, 2023 through December 31, 2023. On November 1, 2023 the Tran Sustainable Balanced Fund changed its fiscal year end from April 30 to December 31. |
29 |
Period Ended June 30, 2024 | Year Ended December 31, | |||||||||||||||||
2023 | 2022 | 2021 | 2020 | 2019 | ||||||||||||||
PER SHARE DATA: | ||||||||||||||||||
Net Asset Value, Beginning of Period | $23.16 | $22.19 | $26.27 | $22.36 | $22.13 | $19.77 | ||||||||||||
Investment operations: | ||||||||||||||||||
Net investment income (loss)(2) | 0.05 | 0.19 | 0.26 | 0.10 | 0.30 | 0.30 | ||||||||||||
Net realized and unrealized gain (loss) on investments | 1.72 | 2.36 | (2.55) | 5.83 | 0.47 | 3.80 | ||||||||||||
Total From Investment Operations | 1.77 | 2.55 | (2.29) | 5.93 | 0.77 | 4.10 | ||||||||||||
Less distributions from: | ||||||||||||||||||
Net investment income | — | (0.21) | (0.28) | (0.11) | (0.33) | (0.35) | ||||||||||||
Net realized gain | — | (1.37) | (1.51) | (1.91) | (0.21) | (1.39) | ||||||||||||
Total Distributions | — | (1.58) | (1.79) | (2.02) | (0.54) | (1.74) | ||||||||||||
Net Asset Value, End of Period | $24.93 | $23.16 | $22.19 | $26.27 | $22.36 | $22.13 | ||||||||||||
TOTAL RETURN(3)(4) | 7.64% | 11.95% | (8.67)% | 26.83% | 3.78% | 20.86% | ||||||||||||
SUPPLEMENTAL DATA AND RATIOS: | ||||||||||||||||||
Net assets, end of period (in 000’s) | $121,770 | $119,499 | $135,900 | $172,800 | $138,700 | $192,200 | ||||||||||||
Ratio of expenses to average net assets: | ||||||||||||||||||
Before expense reimbursement/recoupment(5) | 1.03% | 1.14% | 1.09% | 1.07% | 1.12% | 1.04% | ||||||||||||
After expense reimbursement/recoupment(5) | 1.03% | 1.14% | 1.09% | 1.07% | 1.12% | 1.04% | ||||||||||||
Ratio of net investment income (loss) to average net assets: | ||||||||||||||||||
After expense reimbursement/recoupment(5) | 0.44% | 0.86% | 1.06% | 0.40% | 1.45% | 1.29% | ||||||||||||
Portfolio turnover rate(4) | 7% | 18% | 11% | 29% | 31% | 13% | ||||||||||||
(1) | Prior to August 14, 2023, the Fund consisted of one class. |
(2) | Calculated using the average shares oustanding method. |
(3) | Total return is calculated assuming a purchase of shares on the first day and a sale of shares on the last day of each period reported and includes reinvestments of dividends and distributions, if any. If the Adviser had not waived fees/reimbursed expenses, the total return would have been lower. |
(4) | Not annualized for periods less than one year. |
(5) | Annualized for periods less than one year. |
30 |
Period Ended June 30, 2024 | |||
PER SHARE DATA: | |||
Net Asset Value, Beginning of Period | $20.00 | ||
Investment operations: | |||
Net investment income (loss)(1) | 0.15 | ||
Net realized and unrealized gain (loss) on investments | 1.20 | ||
Total From Investment Operations | 1.35 | ||
Net Asset Value, End of Period | $21.35 | ||
TOTAL RETURN(2)(3) | 6.75% | ||
SUPPLEMENTAL DATA AND RATIOS: | |||
Net assets, end of period (in 000’s) | $11,009 | ||
Ratio of expenses to average net assets: | |||
Before expense reimbursement/recoupment(4) | 3.31% | ||
After expense reimbursement/recoupment(4) | 1.10% | ||
Ratio of net investment income (loss) to average net assets: | |||
After expense reimbursement/recoupment(4) | 1.43% | ||
Portfolio turnover rate(3) | 21% | ||
(1) | Calculated using the average shares oustanding method. |
(2) | Total return is calculated assuming a purchase of shares on the first day and a sale of shares on the last day of each period reported and includes reinvestments of dividends and distributions, if any. |
(3) | Not annualized for periods less than one year. |
(4) | Annualized for periods less than one year. |
31 |
32 |
33 |
| Level 1 – | Unadjusted quoted prices in active markets for identical assets or liabilities that the Funds have the ability to access. |
| Level 2 – | Observable inputs other than quoted prices included in Level 1 that are observable for the asset or liability, either directly or indirectly. These inputs may include quoted prices for the identical instrument on an inactive market, prices for similar instruments, interest rates, prepayment speeds, credit risk, yield curves, default rates and similar data. |
34 |
| Level 3 – | Unobservable inputs for the asset or liability, to the extent relevant observable inputs are not available, representing the Funds’ own assumptions about the assumptions a market participant would use in valuing the asset or liability, and would be based on the best information available. |
35 |
Level 1 | Level 2 | Level 3 | Total | |||||||||
CenterSquare Real Estate Fund | ||||||||||||
Real Estate Investment Trusts | $114,634,982 | $ — | $ — | $ 114,634,982 | ||||||||
Total Investments in Securities | $114,634,982 | $— | $— | $114,634,982 | ||||||||
Long Short Fund | ||||||||||||
Assets: | ||||||||||||
Common Stocks | $ 94,160,507 | $ — | $— (1) | $94,160,507 | ||||||||
Exchange Traded Funds | — | — | — (1) | — | ||||||||
Total Assets | $94,160,507 | $— | $— | $94,160,507 | ||||||||
Liabilities: Securities Sold Short | ||||||||||||
Common Stocks | $ 10,445,413 | $ — | $— | $10,445,413 | ||||||||
Real Estate Investment Trusts | 560,656 | — | — | 560,656 | ||||||||
Total Liabilities | $11,006,069 | $— | $— | $11,006,069 | ||||||||
Foresight Global Sustainable Infrastructure Fund | ||||||||||||
Common Stocks | $ 14,778,261 | $15,172,145 | $— | $29,950,406 | ||||||||
Real Estate Investment Trusts | 12,161,798 | 1,236,263 | — | 13,398,061 | ||||||||
Total Investments in Securities | $26,940,059 | $16,408,408 | $— | $43,348,467 | ||||||||
Tran Sustainable Focus Fund | ||||||||||||
Common Stocks | $ 32,664,545 | $ — | $— | $32,664,545 | ||||||||
Total Investments in Securities | $32,664,545 | $— | $— | $32,664,545 | ||||||||
Greenspring Mid Cap Fund | ||||||||||||
Common Stocks | $116,106,767 | $ — | $— | $116,106,767 | ||||||||
Real Estate Investment Trusts | 1,623,706 | — | — | 1,623,706 | ||||||||
Exchange-Traded Funds | 1,347,759 | — | — | 1,347,759 | ||||||||
Preferred Stocks | 22,144 | — | — | 22,144 | ||||||||
Total Investments in Securities | $119,100,376 | $— | $— | $119,100,376 | ||||||||
Sustainable Balanced Fund | ||||||||||||
Common Stocks | $ 6,407,952 | $— | $— | $6,407,952 | ||||||||
U.S. Treasury Securities | — | 3,376,732 | — | 3,376,732 | ||||||||
Corporate Bonds | — | 458,176 | — | 458,176 | ||||||||
Total Investments in Securities | $6,407,952 | $ 3,834,908 | $— | $10,242,860 | ||||||||
(1) | For the period ended June 30, 2024, all Level 3 securities held by the Long Short Fund were valued at $0. |
36 |
Long Short Fund | Investments in Securities | ||
Balance as of December 31, 2023 | $ —(1) | ||
Purchases | — | ||
Sales proceeds | — | ||
Realized gain (loss) | — | ||
Change in net unrealized appreciation (depreciation) | — | ||
Net sales | — | ||
Transfers into and/or out of Level 3 | — | ||
Balance as of June 30, 2024 | $— | ||
Change in unrealized appreciation/depreciation during the period for Level 3 investments held at as of June 30, 2024 | — | ||
(1) | As of December 31, 2023, all Level 3 assets were valued at $0. |
Fund | |||
CenterSquare Real Estate Fund | 0.60% | ||
Long Short Fund | 1.40% | ||
Foresight Global Sustainable Infrastructure Fund | 0.85% | ||
Tran Sustainable Focus Fund | 0.85% | ||
Greenspring Mid Cap Fund | 0.75% | ||
Sustainable Balanced Fund | 0.85% | ||
37 |
Fund | |||
CenterSquare Real Estate Fund – Investor Class | 1.12% | ||
CenterSquare Real Estate Fund – Institutional Class | 1.02% | ||
Long Short Fund – Investor Class | 1.80% | ||
Long Short Fund – Institutional Class | 1.55% | ||
Foresight Global Sustainable Infrastructure Fund – Institutional Class | 1.05% | ||
Tran Sustainable Focus Fund – Investor Class | 1.10% | ||
Tran Sustainable Focus Fund – Institutional Class | 0.85% | ||
Greenspring Mid Cap Fund – Institutional Class | 1.21% | ||
Sustainable Balanced Fund – Institutional Class | 1.10% | ||
Fund | July-December 2024 | January-December 2025 | January-December 2026 | January-June 2027 | ||||||||
CenterSquare Real Estate Fund | $— | $— | $1,644 | $— | ||||||||
Long Short Fund | 165,557 | 284,167 | 343,145 | 157,588 | ||||||||
Foresight Global Sustainable Infrastructure Fund | — | — | 131,437 | 48,119 | ||||||||
Tran Sustainable Focus Fund | — | 118,873 | 286,504 | 126,753 | ||||||||
Greenspring Mid Cap Fund | — | — | — | — | ||||||||
Sustainable Balanced Fund | — | — | — | 96,883 | ||||||||
38 |
CenterSquare Real Estate Fund | Long Short Fund | |||||||||||
Period Ended June 30, 2024 | Year Ended December 31, 2023 | Period Ended June 30, 2024 | Year Ended December 31, 2023 | |||||||||
Investor Class: | ||||||||||||
Shares sold | 193,383 | 495,854 | 5,239 | 499,321 | ||||||||
Shares issued in reinvestment of distributions | 60,494 | 124,824 | — | 44,044 | ||||||||
Shares redeemed | (1,007,743) | (2,148,000) | (346,953) | (362,529) | ||||||||
Shares issued in conversion of Class C(6) | — | — | — | 36,014 | ||||||||
Net increase (decrease) | (753,866) | (1,527,322) | (341,714) | 216,850 | ||||||||
Class C(6): | ||||||||||||
Shares sold | — | — | — | 2,516 | ||||||||
Shares issued in reinvestment of distributions | — | — | — | — | ||||||||
Shares redeemed | — | — | — | (553,364) | ||||||||
Shares redeemed in conversion of Class C | — | — | — | (38,976) | ||||||||
Net increase (decrease) | — | — | — | (589,824) | ||||||||
Institutional Class: | ||||||||||||
Shares sold | 739,340 | 842,940 | 78,256 | 538,898 | ||||||||
Shares issued in reinvestment of distributions | 85,112 | 142,576 | — | 88,904 | ||||||||
Shares redeemed | (710,582) | (1,980,271) | (1,589,369) | (1,172,741) | ||||||||
Shares issued in conversion of Class Z(4) | — | 675,678 | — | — | ||||||||
Net increase (decrease) | 113,870 | (319,077) | (1,511,113) | (544,939) | ||||||||
Class Z(4): | ||||||||||||
Shares sold | — | 78 | — | — | ||||||||
Shares issued in reinvestment of distributions | — | — | — | — | ||||||||
Shares redeemed | — | (7,410) | — | — | ||||||||
Shares redeemed in conversion of Class Z | — | (674,939) | — | — | ||||||||
Net increase (decrease) | — | (682,271) | — | — | ||||||||
Net increase (decrease) in capital shares | (639,996) | (2,528,670) | (1,852,827) | (917,913) | ||||||||
39 |
Foresight Global Sustainable Infrastructure Fund | Tran Sustainable Focus Fund | ||||||||||||||
Period Ended June 30, 2024 | Period Ended December 31, 2023(3) | Period Ended June 30, 2024 | Period Ended December 31, 2023(5) | Year Ended April 30, 2023 | |||||||||||
Investor Class(1): | |||||||||||||||
Shares sold | — | — | 164,145 | 26,792 | 137,034 | ||||||||||
Shares issued in reinvestment of distributions | — | — | — | — | 327,055 | ||||||||||
Shares redeemed | — | — | (446,626) | (622,595) | (406,757) | ||||||||||
Net increase (decrease) | — | — | (282,481) | (595,803) | 57,332 | ||||||||||
Institutional Class(2): | |||||||||||||||
Shares sold | 60,661 | 2,509,457 | 92,475 | 32,208 | 248,795 | ||||||||||
Shares issued in reinvestment of distributions | — | 239 | — | — | 346,784 | ||||||||||
Shares redeemed | — | — | (247,863) | (1,037,271) | (1,123,296) | ||||||||||
Net increase (decrease) | 60,661 | 2,509,696 | (155,388) | (1,005,063) | (527,717) | ||||||||||
Net increase (decrease) in capital shares | 60,661 | 2,509,696 | (437,869) | (1,600,866) | (470,385) | ||||||||||
Greenspring Mid Cap Fund | Sustainable Balanced Fund | ||||||||
Period Ended June 30, 2024 | Year Ended December 30, 2024 | Period Ended June 30, 2024 | |||||||
Institutional Class(2): | |||||||||
Shares sold | 46,825 | 167,668 | 515,737 | ||||||
Shares issued in reinvestment of distributions | — | 346,434 | — | ||||||
Shares redeemed | (323,384) | (1,476,892) | (47) | ||||||
Net increase (decrease) | (276,559) | (962,790) | 515,690 | ||||||
Net increase (decrease) in capital shares | (276,559) | (962,790) | 515,690 | ||||||
(1) | Prior to August 8, 2022, the Tran Sustainable Focus Fund’s Investor Class shares were known as Class A Shares. |
(2) | Prior to August 8, 2022, the Tran Sustainable Focus Fund’s Institutional Class shares were known as Class I shares. Prior to August 14, 2023 the Greenspring Mid Cap Fund consisted of one class. |
(3) | Since commencement of operations on January 31, 2023. |
(4) | On February 28, 2023, the CenterSquare Real Estate Fund converted Class Z shares into Institutional Class shares and closed the Class Z shares of the Fund. |
(5) | For the period May 1, 2023 through December 31, 2023. On November 1, 2023 the Tran Sustainable Focus Fund changed its fiscal year end from April 30 to December 31. |
(6) | On November 17, 2023, the Long Short Fund converted Class C shares into Investor Class shares and closed the Class C shares of the Fund. |
40 |
U.S. Government Securities | Other Securities | |||||||||||
Fund | Purchases | Sales | Purchases | Sales | ||||||||
CenterSquare Real Estate Fund | $— | $— | $18,019,660 | $24,352,654 | ||||||||
Long Short Fund | — | — | 99,086,813 | 137,741,692 | ||||||||
Foresight Global Sustainable Infrastructure Fund | — | — | 6,413,802 | 5,061,047 | ||||||||
Tran Sustainable Focus Fund | — | — | 8,409,383 | 10,042,620 | ||||||||
Greenspring Mid Cap Fund | — | — | 7,950,048 | 15,255,203 | ||||||||
Sustainable Balanced Fund | 3,904,057 | 483,527 | 7,526,537 | 1,095,016 | ||||||||
Fund | Aggregate Gross Appreciation | Aggregate Gross Depreciation | Net Unrealized Appreciation (Depreciation) | Federal Income Tax Cost | ||||||||
CenterSquare Real Estate Fund | $20,760,683 | $(7,728,777) | $13,031,906 | $112,100,022 | ||||||||
Long Short Fund | 49,175,531 | (14,794,213) | 34,381,318 | 44,030,624 | ||||||||
Foresight Global Sustainable Infrastructure Fund | 1,260,916 | (4,091,750) | (2,830,834) | 47,522,051 | ||||||||
Tran Sustainable Focus Fund | 8,649,432 | (1,358,699) | 7,290,733 | 23,965,818 | ||||||||
Greenspring Mid Cap Fund | 55,578,268 | (2,079,208) | 53,499,060 | 64,141,912 | ||||||||
Fund | Undistributed Ordinary Income | Undistributed Long-Term Capital Gains | Other Accumulated Gains (Losses) | Net Unrealized Appreciation (Depreciation) | Total Distributable Earnings | ||||||||||
CenterSquare Real Estate Fund | $160,251 | $— | $(5,393,207) | $13,031,906 | $7,798,950 | ||||||||||
Long Short Fund | 81,829 | — | (359,737,206) | 34,381,318 | (325,274,059) | ||||||||||
Foresight Global Sustainable Infrastructure Fund | 120,021 | — | (1,776,139) | (2,830,834) | (4,486,952) | ||||||||||
Tran Sustainable Focus Fund | — | 40,190 | — | 7,290,733 | 7,330,923 | ||||||||||
Greenspring Mid Cap Fund | 62,609 | 1,164,379 | — | 53,499,060 | 54,726,048 | ||||||||||
41 |
Fund | Ordinary Income(1) | Long-Term Capital Gains | Return of Capital | Total | ||||||||
CenterSquare Real Estate Fund | ||||||||||||
12/31/23 | $2,702,156 | $— | $ — | $2,702,156 | ||||||||
12/31/22 | 2,806,421 | 6,439,618 | — | 9,246,039 | ||||||||
Long Short Fund | ||||||||||||
12/31/23 | 3,141,532 | — | — | 3,141,532 | ||||||||
12/31/22 | 877,440 | — | — | 877,440 | ||||||||
Foresight Global Sustainable Infrastructure Fund | ||||||||||||
12/31/23 | 1,158,583 | — | — | 1,158,583 | ||||||||
Tran Sustainable Focus Fund | ||||||||||||
12/31/23 | — | — | — | — | ||||||||
4/30/23(2) | — | 4,058,988 | 61 | 4,059,049 | ||||||||
4/30/22 | 129,697 | 11,617,064 | — | 11,746,761 | ||||||||
Greenspring Mid Cap Fund | ||||||||||||
12/31/23 | 1,078,101 | 6,820,380 | — | 7,898,481 | ||||||||
12/31/22 | 1,673,909 | 8,845,537 | — | 10,519,446 | ||||||||
(1) | For Federal income tax purposes, distributions of short-term capital gains are treated as ordinary income distributions. |
(2) | On November 1, 2023 the Tran Sustainable Focus Fund changed its fiscal year end from April 30 to December 31. |
Fund | Distributable Earnings/ (Accumulated Deficit) | Paid-in Capital | ||||
CenterSquare Real Estate Fund | $— | $— | ||||
Long Short Fund | — | — | ||||
Foresight Global Sustainable Infrastructure Fund | — | — | ||||
Tran Sustainable Focus Fund | 102,012 | (102,012) | ||||
Greenspring Mid Cap Fund | (2,196) | 2,196 | ||||
42 |
Fund | Average Principal Balance | Average Interest Rate | Maximum Loan Outstanding | Period Maximum Loan was Outstanding | ||||||||
CenterSquare Real Estate Fund | $— | N/A | $— | N/A | ||||||||
Long Short Fund | — | N/A | — | N/A | ||||||||
Foresight Global Sustainable Infrastructure Fund | 253,500 | 8.50% | 487,000 | January 1, 2024 | ||||||||
Tran Sustainable Focus Fund | 108,750 | 8.50% | 195,000 | May 6-7, 2024 | ||||||||
Greenspring Mid Cap Fund | — | N/A | — | N/A | ||||||||
Sustainable Balanced Fund | — | N/A | — | N/A | ||||||||
43 |
| 1. | THE NATURE, EXTENT AND QUALITY OF THE SERVICES PROVIDED AND TO BE PROVIDED BY THE ADVISER AND SUB-ADVISERS UNDER THE ADVISORY AGREEMENTS. The Board considered the nature, extent and quality of the Adviser and Sub-Advisers’ overall services to be provided to the Fund, as well as their specific responsibilities in all aspects of day-to-day investment management of the Fund. The Board considered the qualifications, experience and responsibilities of the portfolio managers, as well as the responsibilities of other key personnel of the Adviser and Sub-Advisers that would be involved in the day-to-day activities of the Fund. The Board also considered the resources and compliance structure of the Adviser and Sub-Advisers, including information regarding their compliance programs, their chief compliance officers and the Adviser and Sub-Advisers’ compliance records, as well as the Adviser and Sub-Advisers’ cybersecurity programs, liquidity risk management programs, business continuity plans, and risk management processes. Additionally, the Board considered how the Adviser and Sub-Advisers’ business continuity and cybersecurity plans will operate. The Board further considered that the Adviser has recently formed and has limited operating history; but noted that the Adviser’s employees each have extensive experience working in the past with other investment advisers or in the investment management industry. The Board considered the Sub-Advisers’ experience in managing other regulated investment companies. The Board concluded that the Adviser and the Sub-Advisers had the quality and depth of personnel, resources, investment processes and compliance policies and procedures essential to performing its duties under the Advisory Agreements and that they were satisfied with the nature, overall quality and extent of such management services. |
| 2. | THE FUND’S HISTORICAL PERFORMANCE AND THE OVERALL PERFORMANCE OF THE ADVISER AND SUB-ADVISERS. As the Fund was newly created, there was no Fund performance for the Board to review. The Board did consider the investment performance history of the Sub-Advisers with respect to their respective similarly managed investment strategies. |
| 3. | THE COSTS OF THE SERVICES TO BE PROVIDED BY THE ADVISER AND SUB-ADVISERS AND THE STRUCTURE OF THE ADVISER AND SUB-ADVISERS’ FEES UNDER THE ADVISORY AGREEMENTS. In considering the proposed advisory and sub-advisory fees and the total fees and expenses of the Fund, the Board reviewed comparisons to the peer funds and each Sub-Adviser’s similarly managed accounts for other types of clients, as well as all expense waivers and reimbursements. When reviewing fees charged to other separately managed accounts, the Board took into account the type of account and the differences in the management of those accounts that might be germane to the difference, if any, in the fees charged to such accounts. |
44 |
| 4. | ECONOMIES OF SCALE. The Board also considered whether economies of scale could be expected to be realized by the Adviser as assets of the Fund grow. The Board noted that the Adviser has contractually agreed to reduce its advisory fees or reimburse Fund expenses so that the Fund does not exceed the specified Expense Caps. |
| 5. | THE PROFITS TO BE REALIZED BY THE ADVISER AND ITS AFFILIATES FROM THEIR RELATIONSHIP WITH THE FUNDS. The Board discussed the likely overall profitability of the Adviser from managing the new Fund. In assessing possible profitability, the Trustees reviewed the Adviser and Sub-Advisers’ financial information and took into account both the likely direct and indirect benefits to the Adviser and Sub-Advisers from advising the Fund. In particular, the Trustees discussed and considered the fall-out benefits that the Adviser may receive from the Fund. The Trustees concluded that the Adviser profit from managing the Fund would likely not be excessive and, after review of relevant financial information, the Adviser and Sub-Advisers would have adequate capitalization and/or would maintain adequate profit levels to support the Fund. |
45 |
| 1. | THE NATURE, EXTENT AND QUALITY OF THE SERVICES TO BE PROVIDED BY THE SUB-ADVISER UNDER THE SUB-ADVISORY AGREEMENT. The Board considered the nature, extent and quality of the Sub-Adviser’s overall services to be provided to the Fund, as well as their specific responsibilities in all aspects of day-to-day investment management of the Fund. The Board considered the qualifications, experience and responsibilities of the portfolio managers, as well as the responsibilities of other key personnel of the Sub-Adviser that would be involved in the day-to-day activities of the Fund. The Board also considered the resources and compliance structure of the Sub-Adviser, including information relating to its compliance program, its chief compliance officer and the Sub-Adviser’s compliance records, as well as the Sub-Adviser’s cybersecurity program and business continuity plans and risk management processes. The Board considered the Sub-Adviser’s experience in managing other regulated investment companies, and the collective experience among the portfolio managers and investment personnel with regard to long portfolio strategies and short portfolio strategies. The Board concluded that the Sub-Adviser had the quality and depth of personnel, resources, investment processes and compliance policies and procedures essential to performing its duties under the Sub-Advisory Agreement and that they were satisfied with the nature, overall quality and extent of such management services. |
| 2. | THE FUND’S HISTORICAL PERFORMANCE AND THE OVERALL PERFORMANCE OF THE SUB-ADVISER. The Board considered the investment performance history of the Sub-Adviser with respect to the other regulated investment companies it manages, noting that a direct long-short strategy comparison was not available. In lieu of long-short strategy performance, the Board considered the investment performance history and risk-return ratios of a long-only equity investment strategy managed by the Sub-Adviser that was similar to the long strategy anticipated to be utilized for the Fund, and also considered the performance history of a short strategy previously managed by one of the portfolio managers who would be primarily responsible for directing the Fund’s short selling strategy. The Board concluded that the Sub-Adviser’s and portfolio manager’s long and short investment performance was satisfactory. |
| 3. | THE COSTS OF THE SERVICES TO BE PROVIDED BY THE SUB-ADVISER’S AND THE STRUCTURE OF THE SUB-ADVISER’S FEES UNDER THE SUB-ADVISORY AGREEMENT. In considering the proposed sub-advisory fees and the total fees and expenses of the Fund, the Board reviewed comparisons to the fees charged by the Sub-Adviser to other registered investment companies it manages. When considering fees charged by the Sub-Adviser to other accounts, the Board took into account the differences in the management of those accounts that might be germane to the difference, if any, in the fees charged to such accounts. The Board also recalled comparative fee information that had been provided in connection with its last review of the Fund’s advisory and sub-advisory arrangements and noted that under the proposed sub-advisory arrangement it was anticipated that certain Fund expenses would be lower. The Board concluded that, at this time, the fees to be paid to the Sub-Adviser were fair and reasonable. |
46 |
| 4. | ECONOMIES OF SCALE. The Board also considered whether economies of scale could be expected to be realized by the Sub-Adviser and/or Adviser as assets of the Fund grow. The Board acknowledged that neither the Adviser nor Sub-Adviser believed there to be any meaningful economies of scale in the foreseeable future. However, the Board noted that the Adviser agreed to continue the consideration of potential shared economies of scale going forward as the Fund’s assets grow. The Board also noted that the Adviser has contractually agreed to reduce its advisory fees or reimburse Fund expenses so that the Fund does not exceed the specified its expense caps. |
| 5. | THE PROFITS TO BE REALIZED BY THE SUB-ADVISER AND ITS AFFILIATES FROM THEIR RELATIONSHIP WITH THE FUND. The Board did not consider the profitability of the Sub-Adviser to be a material factor based on representations from the Adviser that it negotiated the sub-advisory fee with the Sub-Adviser on an arm’s-length basis. The Board reviewed the Sub-Adviser’s financial information and took into account both the likely direct and indirect benefits to the Sub-Adviser from advising the Fund. The Board also discussed and considered the fall-out benefits that the Sub-Adviser may receive from the Fund. The Board concluded that any expected fall out benefits to the Sub-Adviser were reasonable and, after review of relevant financial information, the Sub-Adviser would have adequate capitalization to support its management of the Fund. |
47 |
| 1. | THE NATURE, EXTENT AND QUALITY OF THE SERVICES PROVIDED BY THE ADVISER AND SUB-ADVISERS UNDER THE ADVISORY AGREEMENTS. The Board considered the nature, extent and quality of the Adviser and each Sub-Adviser’s overall services provided to each Fund, as well as their specific responsibilities in all aspects of the day-to-day investment management of each Fund. The Board considered the qualifications, experience and responsibilities of the portfolio managers, as well as the responsibilities of other key personnel of the Adviser and Sub-Adviser involved in the day-to-day activities of the Funds. The Board also considered the resources and compliance structure of the Adviser and Sub-Advisers, including, as applicable, information regarding their compliance programs, their chief compliance officers and the Adviser and Sub-Advisers’ compliance records, as well as the Adviser and Sub-Advisers’ cybersecurity program, liquidity risk management programs, business continuity plans, and risk management processes. The Board further considered its knowledge of the Adviser’s and Sub-Advisers’ operations, and noted that during the course of the prior year, the Trustees had met with certain personnel of the Adviser and Sub-Advisers to discuss the Funds’ performance and investment outlook as well as various other topics. With respect to the Sub-Advisers, the Board took into account the Adviser’s ongoing due diligence, evaluation and recommendation that the Sub-Advisers be approved to continue managing the Funds. The Board concluded that the Adviser and the Sub-Advisers had the quality and depth of personnel, resources, investment processes and compliance policies and procedures essential to performing their duties under the Advisory Agreements and that they were satisfied with the nature, overall quality and extent of such management services. |
| 2. | THE FUND’S HISTORICAL PERFORMANCE AND THE OVERALL PERFORMANCE OF THE ADVISER AND SUB-ADVISERS. In assessing the quality of the portfolio management delivered by the Sub-Advisers, the Board reviewed the short-term and long-term performance of the Funds as of periods ended April 30, 2024, on both an absolute basis and a relative basis in comparison to its peer funds utilizing |
48 |
| 3. | THE COSTS OF THE SERVICES TO BE PROVIDED BY THE ADVISER AND SUB-ADVISERS AND THE STRUCTURE OF THE ADVISER AND SUB-ADVISERS’ FEES UNDER THE ADVISORY AGREEMENTS. In considering the advisory fee and sub-advisory fees and the total fees and expenses of the Funds, the Board reviewed comparisons to the Morningstar peer funds. Where a Fund’s contractual management fee and/or total net expense ratio (net of Rule 12b-1 distribution fees) was above the peer group average and/or median, the Board considered the level of such fee or expenses in the context of nature, quality and extent of the services provided by the Adviser and applicable Sub-Adviser and the nature of each Fund, and concluded that such fees and expenses were fair and reasonable. The Board determined that it would continue to monitor the appropriateness of the advisory fees for the Funds and concluded that, at this time, the fees to be paid to the Adviser and Sub-Advisers were fair and reasonable. |
| 4. | ECONOMIES OF SCALE. The Board also considered whether economies of scale were being realized by the Adviser that should be shared with shareholders. The Board further noted that the Adviser has contractually agreed to reduce its advisory fees or reimburse Fund expenses so that the Funds do not exceed specified expense caps. The Board noted that it would continue to monitor economies of scale in the future as circumstances changed and Fund asset levels increased. |
| 5. | THE PROFITS TO BE REALIZED BY THE ADVISER AND ITS AFFILIATES; OTHER POTENTIAL BENEFITS TO THE ADVISER AND SUB-ADVISERS FROM THEIR RELATIONSHIPS WITH THE FUNDS. The Board considered the information it received regarding the profitability of the Adviser from managing the Funds. The Board did not consider the profitability of the Sub-Advisers to be a material factor based on representations from the Adviser that it negotiated sub-advisory fees on an arm’s-length basis. Based on its review of the foregoing information, and in light of the nature, extent and quality of the services provided by the Adviser, the Board concluded that the profits realized by the Adviser supported the renewal of the Advisory Agreement. The Trustees reviewed the Adviser’s and Sub-Advisers’ financial information and took into account both the likely direct and indirect benefits to the Adviser and the Sub-Advisers from advising the Funds. In particular, the Trustees discussed and considered any fall-out benefits that the Adviser and the Sub-Advisers may receive from the Funds. |
49 |
50 |
Fund | |||
CenterSquare Real Estate Fund | 2.22% | ||
Long Short Fund | 74.52% | ||
Foresight Global Sustainable Infrastructure Fund | 64.69% | ||
Tran Sustainable Focus Fund | 0.00% | ||
Greenspring Mid Cap Fund | 100.00% | ||
Fund | |||
CenterSquare Real Estate Fund | 0.23% | ||
Long Short Fund | 48.81% | ||
Foresight Global Sustainable Infrastructure Fund | 7.28% | ||
Tran Sustainable Focus Fund | 0.00% | ||
Greenspring Mid Cap Fund | 92.69% | ||
Fund | |||
CenterSquare Real Estate Fund | 0.00% | ||
Long Short Fund | 0.00% | ||
Foresight Global Sustainable Infrastructure Fund | 0.00% | ||
Tran Sustainable Focus Fund | 0.00% | ||
Greenspring Mid Cap Fund | 0.00% | ||
51 |
INVESTMENT ADVISER Cromwell Investment Advisors, LLC 810 Gleneagles Court, Suite 106 Baltimore, MD 21286 SUB-ADVISERS CenterSquare Investment Management LLC 630 West Germantown Pike, Suite 300 Plymouth Meeting, PA 19462 Mutual of America Capital Management LLC 320 Park Avenue New York, NY 10022 Foresight Group LLP The Shard, 32 London Bridge Street London SE1 9SG, United Kingdom DISTRIBUTOR Foreside Fund Services, LLC Three Canal Plaza, Suite 100 Portland, ME 04101 CUSTODIAN U.S. Bank National Association Custody Operations 1555 North Rivercenter Drive, Suite 302 Milwaukee, WI 53212 | Tran Capital Management L.P. 1000 Fourth Street, Suite 800 San Rafael, CA 94901 Corbyn Investment Management, Inc. 2330 West Joppa Road, Suite 108 Lutherville, MD 21093 Aristotle Pacific Capital, LLC 840 Newport Center Drive, 7th Floor Newport Beach, CA 92660 | ||
| (b) | Financial Highlights are included within the financial statements filed under Item 7 of this Form. |
Item 8. Changes in and Disagreements with Accountants for Open-End Investment Companies.
There were no changes in or disagreements with accountants during the period covered by this report.
Item 9. Proxy Disclosure for Open-End Investment Companies.
There were no matters submitted to a vote of shareholders during the period covered by this report.
Item 10. Remuneration Paid to Directors, Officers, and Others of Open-End Investment Companies.
See Item 7(a).
Item 11. Statement Regarding Basis for Approval of Investment Advisory Contract.
See Item 7(a).
Item 12. Disclosure of Proxy Voting Policies and Procedures for Closed-End Management Investment Companies.
Not applicable to open-end investment companies.
Item 13. Portfolio Managers of Closed-End Management Investment Companies.
Not applicable to open-end investment companies.
Item 14. Purchases of Equity Securities by Closed-End Management Investment Company and Affiliated Purchasers.
Not applicable to open-end investment companies.
Item 15. Submission of Matters to a Vote of Security Holders.
There have been no material changes to the procedures by which shareholders may recommend nominees to the Registrant’s board of trustees.
Item 16. Controls and Procedures.
| (a) | The Registrant’s President and Treasurer have reviewed the Registrant’s disclosure controls and procedures (as defined in Rule 30a-3(c) under the Investment Company Act of 1940 (the “Act”)) as of a date within 90 days of the filing of this report, as required by Rule 30a-3(b) under the Act and Rules 13a-15(b) or 15d-15(b) under the Securities Exchange Act of 1934. Based on their review, such officers have concluded that the disclosure controls and procedures are effective in ensuring that information required to be disclosed in this report is appropriately recorded, processed, summarized and reported and made known to them by others within the Registrant and by the Registrant’s service provider. |
| (b) | There were no changes in the Registrant’s internal control over financial reporting (as defined in Rule 30a-3(d) under the Act) that occurred during the period covered by this report that has materially affected, or is reasonably likely to materially affect, the Registrant’s internal control over financial reporting. |
Item 17. Disclosure of Securities Lending Activities for Closed-End Management Investment Companies
Not applicable to open-end investment companies.
Item 18. Recovery of Erroneously Awarded Compensation.
Not applicable.
Item 19. Exhibits.
| (a) | (1) Any code of ethics or amendment thereto, that is the subject of the disclosure required by Item 2, to the extent that the registrant intends to satisfy Item 2 requirements through filing an exhibit. Not applicable. |
(2) Any policy required by the listing standards adopted pursuant to Rule 10D-1 under the Exchange Act (17 CFR 240.10D-1) by the registered national securities exchange or registered national securities association upon which the registrant’s securities are listed. Not applicable.
(4) Any written solicitation to purchase securities under Rule 23c-1 under the Act sent or given during the period covered by the report by or on behalf of the registrant to 10 or more persons. Not applicable.
(5) Change in the registrant’s independent public accountant. Provide the information called for by Item 4 of Form 8-K under the Exchange Act (17 CFR 249.308). Unless otherwise specified by Item 4, or related to and necessary for a complete understanding of information not previously disclosed, the information should relate to events occurring during the reporting period. Not applicable.
| (b) | Certifications pursuant to Section 906 of the Sarbanes-Oxley Act of 2002. Furnished herewith. |
SIGNATURES
Pursuant to the requirements of the Securities Exchange Act of 1934 and the Investment Company Act of 1940, the registrant has duly caused this report to be signed on its behalf by the undersigned, thereunto duly authorized.
| (Registrant) | Total Fund Solution |
| By (Signature and Title)* | /s/ Stephen E. Baird | ||
| Stephen E. Baird | |||
| President, Principal Executive Officer |
| Date | 8/28/2024 |
Pursuant to the requirements of the Securities Exchange Act of 1934 and the Investment Company Act of 1940, this report has been signed below by the following persons on behalf of the registrant and in the capacities and on the dates indicated.
| By (Signature and Title)* | /s/ Stephen E. Baird | ||
| Stephen E. Baird | |||
| President, Principal Executive Officer |
| Date | 8/28/2024 |
| By (Signature and Title)* | /s/ Kyle L. Kroken | ||
| Kyle L. Kroken | |||
| Treasurer, Principal Financial and Accounting Officer |
| Date | 8/28/2024 |