UNITED STATES
SECURITIES AND EXCHANGE COMMISSION
Washington, D.C. 20549
FORM N-CSR
CERTIFIED SHAREHOLDER REPORT OF REGISTERED MANAGEMENT INVESTMENT COMPANIES
Investment Company Act file number 811-22525
Total Fund Solution
(Exact name of registrant as specified in charter)
615 East Michigan Street
Milwaukee, WI 53202
(Address of principal executive offices) (Zip code)
Michael J. Weckwerth, President
Total Fund Solution
c/o U.S. Bancorp Fund Services, LLC
777 East Wisconsin Ave, 6th Fl
Milwaukee, WI 53202
(Name and address of agent for service)
(414) 516-1605
Registrant's telephone number, including area code
Date of fiscal year end: December 31, 2022
Date of reporting period: December 31, 2022
Item 1. Reports to Stockholders.
![]()
December 31, 2022
Annual Report
Cromwell CenterSquare Real Estate Fund
Cromwell Marketfield L/S Fund
| Table of Contents | |
| December 31, 2022 (Unaudited) | |
| Page | |
| President’s Letter | 2 |
| Market and Economic Update . | 3 |
| Management Commentary | 5 |
| Disclosures . | 16 |
| Fund Performance | 18 |
| Holdings Presentations | 22 |
| Expense Examples | 24 |
| Schedules of Investments | 26 |
| Statements of Assets and Liabilities | 33 |
| Statements of Operations | 35 |
| Statements of Changes in Net Assets . | 37 |
| Financial Highlights | 39 |
| Notes to Financial Statements . | 51 |
| Report of Independent Registered Public Accounting Firm | 67 |
| Trustees and Officers | 69 |
| Additional Information | 71 |
| Privacy Notice | 72 |
1
CROMWELL FUNDS
President’s Letter
As of December 31, 2022 (Unaudited)
Dear Shareholder,
It is a pleasure to report on the market environment for 2022 and provide an analysis of the investment activities for the Cromwell CenterSquare Real Estate Fund and the Cromwell Marketfield L/S Fund for the year ended December 31, 2022.
On the following pages, the Funds’ portfolio managers highlight key factors that influenced the performance of their respective Funds during the year. You will also find a Schedule of Investments and audited financial statements for each Fund. We hope you find the portfolio reports from CenterSquare Investment Management and Marketfield Asset Management to be informative. Please refer to our website for timely quarterly commentaries from each of Cromwell’s sub-advisors.
We are pleased to report that the number of Cromwell Funds continues to grow. In addition to the August inclusion of the Cromwell Tran Sustainable Focus Fund, the Cromwell Funds recently launched its first new strategy. In January 2023, the Cromwell Foresight Global Sustainable Infrastructure Fund became available to investors. The Fund invests in listed securities of infrastructure companies located across the globe. The Fund is managed by London-based Foresight Group, a leading listed infrastructure and private equity manager. Foresight operates in eight countries across Europe, Australia and the United States with assets under management of $15 billion. More information on the Fund can be found at thecromwellfunds.com.
We look forward to introducing more funds to the Cromwell family of Funds in 2023. It is a privilege to have you as one of Cromwell’s valued clients. We appreciate the confidence you have in Cromwell to serve as a component of your diversified investment portfolio.
Please feel free to contact me directly at 443.279.2008 if I can be of any assistance. Thanks again for your support of the Cromwell Funds.
Sincerely,

Brian C. Nelson
President
2
CROMWELL FUNDS
Market and Economic Update
As of December 31, 2022 (Unaudited)
In 2022, the S&P 500 Index of the largest U.S. companies declined 18%, the worst annual return since the Financial Crisis in 2008. Bonds, as measured by the Bloomberg U.S. Aggregate Bond Index, also fell losing 13% in 2022—the worst annual decline for bonds since 1976.
The decline in equity prices was widespread as nine of the 11 S&P 500 sectors experienced negative returns in 2022. The Communication Services sector fared the worst losing nearly 40%. The top performing sector was Energy, which had its best year on record, climbing nearly 66% as a combination of tight supplies and rising demand boosted the bottom line of many energy-related companies.
Macroeconomic events took a toll on the markets in 2022. During the year, investors were confronted with inflation levels not seen in 40 years, rapidly increasing interest rate hikes, geopolitical tensions, mid-term elections, and the continued recovery from the COVID-19 pandemic. Seemingly, any negative headline news resulted in heightened volatility and would drive the market lower. In fact, the five worst trading days in 2022 accounted for nearly all of the S&P 500’s decline for the entire year:
Worst Trading Days in 2022 (%)
| September 13 | -4.3 |
| May 18 | -4.0 |
| June 13 | -3.9 |
| April 29 | -3.6 |
| May 5 | -3.6 |
Source: BusinessInsider.com, DataTrek
Notably, after more than a decade in an ultra-low interest rate environment, the Federal Reserve increased rates seven times in 2022 to combat persistent inflation, raising the federal funds rate between 25 and 75 basis points each time. By the end of the year, the fed funds rate reached its highest level in 15 years.
Higher interest rates may be having the desired effect of lowering inflation. As the year ended, inflation levels appear to be moderating. Over the 12 months ended in June 2022, the Consumer Price Index peaked at 9.1% and began a downward trajectory to 7.1% by November 2022. According to the Census Bureau, inflation has been affecting mid-income households the most as the goods and services they tend to purchase, including cars and gasoline, rose the most in price.
3
CROMWELL FUNDS
Market and Economic Update
As of December 31, 2022 (Unaudited) — (Continued)
Market Rebounds After Down Years
After a volatile year, it’s important to put the 2022 market performance in context to broader history.
| 1. | Rebounds after significant declines. Since 1939, the S&P 500 Index has declined 25% or more only 12 times from peak to trough. Over a 1-year period following a 25% drawdown, the market declined only once, losing 7% during the 2008 Financial Crisis. On average, the market gained over 21% in the year following a 25% drawdown. |
| 2. | More positive market years than negative ones. Over the past 50 years through 2022, annual returns for the S&P 500 have been positive approximately 80% of the time. |
| 3. | Considerable long-term returns. Over a 40-year period as of the end of 2022, the average annual returns of the S&P 500 and the Bloomberg U.S. Aggregate Bond Index were over 11% and nearly 7%, respectively. While short-term returns can fluctuate, stock and bond returns have been significant for long-term investors. |
4
CROMWELL CENTERSQUARE REAL ESTATE FUND
Management Commentary
As of December 31, 2022 (Unaudited)
Real estate securities in the U.S., as represented by the FTSE Nareit All Equity REITs Index, returned -24.95% in 2022, underperforming the -18.11% return of S&P 500 and the -6.86% return of the Dow Jones Industrial Average in 2022. The NASDAQ Composite declined 32.51% as growth and tech-related stocks suffered a significant setback. The Federal Reserve reacted to rising inflation by tightening monetary policy for the first time since December 2018. The Fed raised rates 425 basis points (bps) throughout the year including multiple hikes of 75 bps each and ended its quantitative easing policy of buying bonds. The yield on the U.S. 10-year Treasury climbed from 1.52% to 3.88% to end the year with a peak of 4.24% in the fourth quarter. Shorter-dated treasury yields rose even faster resulting in an inverted yield curve. The Fed’s response seems to have cooled inflation, but the ultimate effects of its policy on economic growth remain to be seen. Equities suffered setbacks in the first three quarters of the year in anticipation of constrictive monetary policy. There was a rally early in the fourth quarter as investors grew optimistic that the Fed may have been getting close to ended hikes or possibly lowering rates in early 2023. Overall, U.S. listed real estate ended a rally that had begun in late spring of 2020.
The Cromwell CenterSquare Real Estate Securities Fund - Investor Class declined 24.72% but outperformed the FTSE Nareit All Equity REITs Index by 23 bps. Relative outperformance came from stock selection and the Fund’s cash allocation. Relative performance was offset by sector selection, fees, and fund expenses.
The largest performance contributor for the year came from Office REITs which contributed alpha both from the underweight allocation through sector selection as well as through stock selection. Uncertainty about office space needs in a more flexible, work-at-home environment and potential recession impacted the group. The underweight allocation was, therefore, a benefit to the portfolio. In addition, our preference for owners of high-quality office space in Sunbelt markets compared to coastal names and REITs with higher leverage added to outperformance.
Health Care REITs were a leading contributor of outperformance due to both an overweight to the sector overall and superior stock selection within the group. The Fund benefited from overweight allocations to Health Care REITs that own senior housing and skilled nursing facility properties. After facing challenges late in 2021 from the Omicron variant of Covid-19, REITs such as Ventas and Sabra Health Care began the year with attractive valuations. As the wave of infections
5
CROMWELL CENTERSQUARE REAL ESTATE FUND
Management Commentary
As of December 31, 2022 (Unaudited) — (Continued)
dissipated and operating metrics rebounded, senior housing and skilled nursing facility stocks outperformed by limiting negative returns in an overall down market for listed real estate.
Finally, the Fund’s holdings of Industrial REITs also added to outperformance. The Industrial sector was out of favor with investors in 2022 due to the potential higher interest rates to negatively affect property values. The Fund benefited from mergers and acquisitions activity that generated excess returns for the merger target, an overweight position. The Fund also benefited from an investment in a REIT specializing in cold storage warehouses, a company which recovered from previous operational missteps.
The only notable offsets to strong relative performance of the portfolio were Diversified REITs and Specialized REITs. Both Diversified and Specialized REITs are an idiosyncratic mix of un-related property types. Most of the relative underperformance came from the portfolio’s underweight to the sector. Despite relatively strong alpha from stock selection, an underweight to Specialized REIT sector detracted from relative returns. The defensive nature of some of these property types included in these two categories, particularly casino REITs, found them in favor with investors in 2022. We remain underweight as we sought better operating fundamentals and valuations elsewhere.
6
CROMWELL MARKETFIELD L/S FUND
Management Commentary
As of December 31, 2022 (Unaudited)
The Cromwell Marketfield L/S Fund, Investor Class return for Q4 2022 was 10.97%, compared to the S&P 500 Total Return of 7.56%, and for 2022 as a whole, the Fund returned 2.81%, compared to a loss of 18.11% for the S&P 500. This represents the Fund’s best relative performance since 2008, and we are pleased to have been able to deliver a positive return in what proved to be a very difficult environment for both equity and fixed income investments. We are also pleased that our three-year return now beats the S&P 500, not because this is a much-watched metric by investors but because this effectively captures the influence of the pandemic and its aftermath.
It is our belief that we entered a different macroeconomic environment in early 2020, and much in the same manner as which the Financial Crisis changed both monetary and fiscal policy for roughly a decade after it ended, the shifts in government and central banking policies that were born under the pandemic are likely to retain an influence for a good while longer than the disease itself. While the inflationary impact of the decisions made in the pandemic was not obvious to most investors from the summer of 2020 through to the end of 2021, it has dominated returns since the start of 2022. Looking ahead, it is now the monetary response to inflation that seems likely to be the key influence, with the Federal Reserve running a tight policy for the first time in 16 years, and likely to tighten a little more before pausing in early 2023.
As far as 2022 is concerned, our portfolio benefited from a few key decisions. On the long side, the almost complete absence of technology exposure meant that we were spared the large losses that were suffered by the prior bull market leadership. Equally important was our patience with a large energy allocation after it lagged badly in 2021, since this was the only U.S. sector that generated large positive returns across its membership. We believe that energy prices will remain well bid in 2023, with the artificial supply from the rundown of strategic reserves ending and demand likely to be somewhat more resilient than most expect. Overall, our long book lost money during 2022, but at a far lower rate than the overall market and this is all we can hope for in a year like 2022. Obviously 2022 was a good year to be short most securities, but here we also outperformed by concentrating shorts in technology at the start of 2022, and then switching most shorts over to specialty financial companies later in the year. We also managed to avoid being “too short” in both the late March and October rallies, although we did miss out on most of the powerful July/August rebound.
7
CROMWELL MARKETFIELD L/S FUND
Management Commentary
As of December 31, 2022 (Unaudited) — (Continued)
This is not to say that 2022 was without mistakes, since we lost our entire investment in Russia by not reacting quickly to the invasion of Ukraine and were inevitably too early or too late in a number of other investment decisions. However, the main job at a time of great change is to understand the “big picture” and position a portfolio accordingly. There are always unseen pitfalls and windfalls at a time such as this, but this also represents the best sort of conditions for a flexible investment vehicle to outperform either passive vehicles or a traditional long only active mandate.
As we mention above, we do not think that 2022 completed this process, and the many years of excessive returns in U.S. technology probably require more of a valuation reset than we have seen thus far. With monetary policy likely to remain tight throughout most, if not all of 2023, we would expect to see pockets of distress emerge in the portions of the U.S. economy that were inflated to bubble territory. This mostly comprises technology and commercial real estate. Although we have no concerns about the overall banking system this time around, there is potential for large losses to be realized by non-bank lenders and equity investors. With this in mind, we have built short exposure in a number of financial companies that encompass this risk. As far as technology is concerned, we have mostly relied upon index hedges, since these effectively capture most of the risk, and we do not claim any particular expertise in analyzing the specific business models of the various companies in this sector.
On the long side, we believe that overall economic conditions are likely to be a little better than most expect on the physical side, helped by the shift of both medical and monetary policies within China. It may take a couple of months for this to become visible in the data, but commodity markets are starting to take on a much more pro-cyclical stance, and if this is maintained, valuations across mining companies look to be inappropriately cheap. The performance of our industrial exposure has also been much better than one would expect if we were on the verge of a recession, and our smaller position in homebuilding also recovered strongly during the last few weeks of 2022.
Our overall positioning remains conservative, with a net long position of approximately 40% at year end. Over the course of 2022, this fluctuated between a low of approximately 35% and a peak of nearly 60%, and we foresee a fairly similar range being utilized in 2023, although of course this will be driven by developments over the next few months rather than a pre-conceived idea of what is appropriate.
8
CROMWELL MARKETFIELD L/S FUND
Management Commentary
As of December 31, 2022 (Unaudited) — (Continued)
Collateral Damage
The year 2022 was eventful but unsurprising, at least from an investing perspective. Many of the glaring excesses we discussed in our year-end commentary 12 months ago began to correct. The Fed Board finally reversed course, but only after sailing thousands of miles away from their stated objectives.
In the face of a generally difficult year, the Fund did manage to return slightly more than the average money market fund—a tolerable but not wholly satisfying result given that we anticipated the consequences of the historic monetary inflation that reached a crescendo in 2021.
In assessing the year ahead, we expect several important misconceptions to be undermined by markets. Part of the role of free markets is to stand in contrast to and demonstrate the invalidity of bad ideas. There is not a single one right now as glaring or comprehensive as the “transitory” inflation viewpoint to which the Fed was in thrall only one year ago. The academic nonsense (a term that is becoming redundant) of modern monetary theory used to defend the unlimited inflationism of central banks during the pandemic years has withdrawn back to the shadows, although it is still being offered in some purportedly serious educational institutions.
The central pod (cohort, flock, swarm, node) of fallacies yet to be consumed by events concerns the actual mechanics and likely effectiveness of Federal Reserve policy actions. We are somewhat tired of concentrating our commentary on monetary authorities, but as the Federal Reserve has seized center stage in all matters financial and economic it has made too famous to ignore.
The Federal Reserve Bank was organized and empowered in the wake of the panic of 1907 to supplant the influence of the large, private banks e.g., J.P. Morgan, in maintaining order and general solvency in the banking system.
The main historical idea that we want to emphasize is that the mechanisms used by the Federal Reserve to intervene in the financial system and thereby the economy have changed radically over the past few generations, particularly in the past fifteen years.
Until fairly recently, the financial system and the banking system were virtually one and the same. Thrifts, insurance companies and brokers were a much smaller part of the picture. Private lending hardly existed, and there were no hedge funds, venture capital or private equity firms.
9
CROMWELL MARKETFIELD L/S FUND
Management Commentary
As of December 31, 2022 (Unaudited) — (Continued)
The traditional banking system relies on short-term funding to support the bulk of its loans and investments. This funding occurs in the form of deposits, credit instruments, borrowings between banks and a variety of Fed liquidity provisions. This summary is a vast oversimplification of the complex mechanisms actually at work in money markets. It will, nonetheless, suffice to make our point.
For much of its history, the Fed had an arsenal of macro-prudential tools to adjust flows of funding to the banking system. Two of the most straightforward were loan-to-value limits on lending against various forms of collateral and deposit rate ceilings that capped levels at which banks (and certain non-bank depository institutions) could compete to acquire funds. As part of this toolbox, banks were forbidden to pay any interest for demand deposits.
The most direct consequence of these rules was the ability of the Fed to make deposit funding difficult by allowing money market rates to exceed the rate that banks could pay for deposits. This diverted funds away from the banking system toward securities and made it difficult to fund bank credit expansion.
The most prominent episode of credit restriction came in 1966, at the outset of the last great inflation. Short-term market rates rose above deposit rate ceilings for banks and savings and loans (S&Ls), resulting in an acute credit crunch and a marked slowing in housing activity. Money supply actually contracted over six months beginning in October 1966 and a mild recession ensued.
Loan to value limits on bank lending in specific sectors were jointly administered by state and federal authorities, but they were routinely applied in hindsight and failed to stop destructive bouts of speculation. The most well-known of these is regulation T, introduced in 1934, which set securities margin requirements after the stock market mania in the late 1920s, that precipitated a collapse of the banking system and money supply after the bubble burst.
We still have reg-T limits in place, although instead of 90% margin on stocks as was routine in the unregulated environment of 1928-1929, we now have similar leverage ratios in bonds and other credit instruments.
Since the full repeal of all interest rate ceilings in 1986, Fed interventions in money market funding rates have served as their primary policy tool. Unlike the central bank of China, which regularly adjusts reserve requirements to accomplish loosening or tightening of credit conditions, the Fed has been content to allow reserve requirements to remain stable while drastically altering the cost of inter-bank funds and discount window borrowing.
10
CROMWELL MARKETFIELD L/S FUND
Management Commentary
As of December 31, 2022 (Unaudited) — (Continued)
Congress has chimed in periodically to alter capital requirements, but these changes have all been reactionary and largely counter-productive.
Following the panic and credit deflation of 2007-2009, the monetary landscape changed profoundly.
The Fed and its fellow travelers among developed world central banks embarked on a monetary inflation without modern precedent. Unlimited purchases of securities introduced overwhelming amounts of liquidity into the global financial system.
The general result was as though gravity had all of a sudden become a repulsive rather than attractive force. Finance was turned upside down and inside out.
Liquid assets, once the lifeblood of financial institution, were distained rather than shepherded. Banks in Europe refused deposits or charged depositors to park funds. High-grade bonds in much of the world offered negative yields.
In 1980 banks were offering free appliances to customers who would purchase a CD yielding 14% or higher. In 2021, bouncers were on call by bank managers looking to toss out anyone attempting to deposit a large sum in an account yielding three basis points.
Despite a series of rate increases by the Fed, banks are still offering minuscule nominal deposit rates, and the Fed is parking more than two trillion dollars in excess cash in its reverse repo facility. Funding scarcity for the banking system is no longer an effective governor on the credit creation process.
This points to several analytic challenges, the first and most prominent of which is the yield curve.
In more normal monetary times, an inverted yield curve would strain the ability of banks to raise short-term funds and profitably reinvest them in longer-term loans or securities. This is somewhat analogous to the situation that arose when deposit rate caps made funding scarce. In an uncapped deposit cost environment, the funding becomes unprofitable rather than unavailable, but the braking effects on credit expansion are similar.
Today’s inverted yield curve has not materially increased the funding costs for large, commercial banks, as they still have more liquidity remaining from quantitative easing (QE) than they know what to do with. It is why the five largest banks still offer short-term deposit rates only slightly above 0, and a brief perusal of their certificate of deposit (CD) rates for six and 12-month deposits reveals a
11
CROMWELL MARKETFIELD L/S FUND
Management Commentary
As of December 31, 2022 (Unaudited) — (Continued)
similar lack of interest (literally) in attracting new deposits. This might change when statutory capital adequacy becomes an issue, but for now, all of the Fed’s efforts to tighten things up have bypassed their traditional stomping grounds in the banking system.
Loans are not scarce, and the only institutions paying up somewhat to attract deposits are those that specialize in unsecured, high yield consumer lending e.g., credit cards, where yields of 25% are the norm and free appliances (and lots more) abound for anyone willing to sign on for that degree of pain.
The yield curve as a harbinger and artificer of recession no longer applies.
The banking system and the hybridized commercial/investment banks that funded the housing mania and nearly brought down the whole system in 2008 seem to have acquired a sort of herd immunity to fluctuations in short-term funding costs.
Where, then, are the effects of the surge in short-term rates that we have witnessed since our last annual letter?
Just as the investment banks were overlooked as the epicenter of systemic risk during the last great credit revulsion, there is, as always, another, somewhat recondite corner of finance that has been hyper-inflated by reckless policy initiatives.
Monetary Policy Theorem 1:
The Federal Reserve’s manipulations of funding liquidity and costs have its initial, direct effects in markets for collateral. The contents of these collateral markets vary from one cycle to the next. Recent history is never a guide in type, but always in form.
Within the collateral markets that Fed policy influences, there is always one central element around which the entire credit cycle coalesces.
In the 1920s, stocks loans were the primary constituent of bank credit expansion. In the 1970s it was commodities, with an emphasis on energy lending, in the first decade of the 21st century it was single-family homes.
The great change that has taken place during the Fed’s lifespan is the expansion of the financial system and lending capacity away from to traditional banking system to a host of non-bank lenders.
As the system has expanded, the monetary toolbox used to control it has become increasingly less effective.
12
CROMWELL MARKETFIELD L/S FUND
Management Commentary
As of December 31, 2022 (Unaudited) — (Continued)
Two main factors currently undermine the Federal Reserve’s ability to influence the course of credit cycles. One is structural and the other entirely self-inflicted.
The evolution of the financial system away from the heavily regulated core in commercial banking is a natural response to the expanded role of finance in all corners of the economy.
During the past two decades, total debt in the U.S. has expanded from around $33 trillion to more than $92 trillion in 2022. Global non-financial debt is in the neighborhood of $313 trillion.
Finance has metastasized to a point where it is not only the main source of wealth creation across the globe but is detached from much of the real economy from where it supposedly derives its value. This phenomenon has been epitomized by the development of the crypto-currency and digital token universe, which is entirely self-referential and un-moored to any tangible sources of value.
The underlying propellant behind the final, dramatic ascent of finance has been the great QE experiment of the post-2008 cycle. The unlimited provision of liquidity and the virtual elimination of interest costs created an eleventh, secular commandment reading “Thou shalt borrow.” Unlike the original ten, it was largely obeyed.
An important technical consequence of the great monetary flood has been a colossal surplus of bank reserves. This has eliminated the interbank market for short-term loans as a meaningful input into banks’ funding costs. The cost and availability of federal funds that could be borrowed in the interbank market was the principal avenue through which the Fed addressed the funding posture of the banking system and thereby its capacity and willingness to lend.
With reserves still in excess and the interbank market relegated to the outer reaches of obscurity, the Fed is without its most frequently used tool. Furthermore, the surfeit of funding enjoyed by banks has virtually eliminated their need to compete for deposits.
With long-term bond market funding allowing corporations to eliminate the need for sporadic bank lending, the sensitivity of the real economy to changes in Fed policy has fallen dramatically.
As we stated in Theorem 1, the Fed’s influence on the economy passes through markets for leveraged collateral, where varying borrowing costs change asset prices. Another way of looking at this is that the Fed acts mainly through the
13
CROMWELL MARKETFIELD L/S FUND
Management Commentary
As of December 31, 2022 (Unaudited) — (Continued)
balance sheet of the economy, which comprises asset values, rather than the income statement, which measures output and exchange. The two are certainly related, but it is common to have them move asynchronously i.e., out of step.
Disruptions in balance sheet (collateral) prices diminish the security and creditworthiness of loans securitized by the deflating assets. This is very clear in the downside of every credit cycle, where favored assets deflate and prompt owners to default and creditors to recover small fractions of the money lent.
The important thing to keep in mind about the distinction between balance sheet assets and the earnings, income or utility that they help to produce is that fluctuations in national balance sheet values are not directly captured in any popular economic statistics.
Robust GDP figures can arise even when some important element of the national balance sheet is impaired and losing value. Financing mechanisms are much more important to balance sheet items than to operations. Even though central banks directly influence asset values through changes in rates and financial conditions, their main focus remains fixed on economic statistics that reflect activity rather than asset prices.
It is only when deflating asset prices begin to prompt actual failures and the resulting impairments that monetary policy tends to respond forcefully.
The Fed and other central banks constantly reiterate the mantra that they are entirely data driven. Fruit flies are entirely data driven. Policy makers entrusted with anticipating constantly evolving conditions need to be guided by conceptual frameworks that provide context for the endless flood of data that comes over the transom.
In the current cycle, the sensitivity of incomes and spending to short-term borrowing costs have been dampened by the tremendous balance sheet cushions that households and businesses have built during the free money era that ended less than a year ago.
The main area of vulnerability to tighter financing conditions and higher short-term rates is in the leveraged private markets that have been the great beneficiaries of the free credit era. Leveraged loans have replaced traditional commercial and industrial (C&I) loans as the critical variable-rate financing tool upon which a significant slice of the business community is dependent.
Variable rate consumer mortgages, clearly important aspects of the risk matrix in 2003-2008, represent a much smaller share of household obligations.
14
CROMWELL MARKETFIELD L/S FUND
Management Commentary
As of December 31, 2022 (Unaudited) — (Continued)
The nightmare scenario for the Federal Reserve, and one that we believe to be more likely than not, is a real economy that does not slow meaningfully further than it already has, while robust government spending, still healthy private balance sheets and a continuing structural shortage of skilled labor mean than the current bout of commodity and goods deflation that we have seen over the past half year prove to be, dare we say, transitory.
The vulnerability of private venture and leveraged private equity borrowers to rising short rates, tightening financing conditions for unprofitable companies and an absence of initial public offering (IPO) exits will intensify in proportion to the amount of time that the Fed keeps rates at or above current levels. Time of application is the most burdensome aspect of compound interest cost. Another year of 4%+ short rates will prompt a wave of bankruptcies in the new economy, dwarfing the warm-up act that we have witnessed in cryptoland.
A large majority of traditional lending institutions will be relatively unscathed, although the seemingly well-behaved financial institutions that will be shown to have quietly stowed away on the private markets’ gravy train will no doubt surprise.
Financial institutions, some relatively obscure, involved in the origination and management of private enterprises will be the next cadre of unregulated and possibly systemically influential entities involved in a large-scale crisis.
University endowments and public pensions will be the most prominent casualties, with many suffering irreparable damage. Problems in the latter sphere will force political scrutiny and endless finger pointing.
In light of these strong crosscurrents, market strategy becomes increasingly challenging. Equity markets tend to run into acute problems e.g., 1929, 1962, 1966, 1987, 2000, during periods of economic strength when liquidity is drawn toward operating activities and away from financing. The current worry about impending recession appears to us to be misplaced, so equity markets should respond with a continued emphasis on the more cyclical sectors and concentrated risk in the high-value, high expectations growth areas. We are much more concerned about unexpected economic resilience. In any event, high-grade, long duration fixed income remains wholly unappealing while equity risk should be assumed only in narrow slices rather than the index level.
15
CROMWELL FUNDS
Disclosures
December 31, 2022 (Unaudited)
Must be preceded or accompanied by a prospectus. Mutual fund investing involves risk. Principal loss is possible.
CenterSquare Real Estate Fund Risks: The Fund is subject to special risk considerations similar to those associated with the direct ownership of real estate. Real estate valuations may be subject to factors such as changing general and local economic, financial, competitive, and environmental conditions. A greater percentage of the Fund’s holdings may be focused in a smaller number of securities which may place the Fund at greater risk than a more diversified fund. Investing in initial public offerings (IPOs) is risky and the prices of stocks purchased in IPOs tend to fluctuate more widely than stocks of companies that have been publicly traded for a longer period of time. Stocks purchased in IPOs generally do not have a trading history, and information about the companies may be available for very limited periods. Market prices of investments held by the Fund may fall rapidly or unpredictably due to a variety of economic or political factors, market conditions, disasters or public health issues, or in response to events that affect particular industries or companies. Companies that are in similar industry sectors may be similarly affected by particular economic or market events; to the extent the Fund has substantial holdings within a particular sector, the risks associated with that sector increase.
Marketfield L/S Fund Risks: The Fund regularly makes short sales of securities, which involves the risk that losses may exceed the original amount invested. The Fund may also use options and futures contracts, which have the risks of unlimited losses of the underlying holdings due to unanticipated market movements and failure to correctly predict the direction of securities prices, interest rates, and currency exchange rates. However, a mutual fund investor’s risk is limited to the amount invested in a fund. Investments in absolute return strategies are not intended to outperform stocks and bonds during strong market rallies. Investing in ETFs are subject to additional risks that do not apply to conventional mutual funds, including the risks that the market price of the shares may trade at a discount to its net asset value (NAV), an active secondary trading market may not develop or be maintained, or trading may be halted by the exchange in which they trade, which may impact a Funds ability to sell its shares. Foreign securities are subject to interest rate, currency exchange rate, economic, and political risks. These risks may be greater for emerging markets. Investing in smaller companies involves special risks, including higher volatility and lower liquidity. Investing in mid-cap stocks may carry more risk than investing in stocks of larger, more well-established companies. This risk is usually greater for longer-term debt securities. Investment by the Fund in lower-rated and non-rated securities presents a greater risk of loss to principal and
16
CROMWELL FUNDS
Disclosures
December 31, 2022 (Unaudited) — (Continued)
interest than higher-rated securities. Investments in asset-backed and mortgage-backed securities involve additional risks such as credit risk, prepayment risk, possible illiquidity and default, and increased susceptibility to adverse economic developments. The Fund involves the risk that the macroeconomic trends identified by portfolio management will not come to fruition and their advantageous duration may not last as long as portfolio management forecasts. The Fund may invest in derivatives, which may increase the volatility of the Fund’s NAV and may result in a loss to the Fund.
A basis point is one hundredth of one percent. Alpha is the excess return of an investment relative to the return of a benchmark index. Consumer Price Index measures the average change over time in the prices paid for consumer goods and services. The yield curve plots the interest rates, at a set point in time, of bonds having equal credit quality, but differing maturity dates.
The FTSE Nareit All Equity REITs Index is an index of U.S. equity REITs. Constituents include all tax-qualified REITs with more than 50% of total assets in qualifying real estate assets other than mortgages secured by real property. The S&P 500 Index is a capitalization-weighted index of 500 stocks. Dow Jones Industrial Average Index is a commonly used measure of the performance of U.S. stocks. The NASDAQ Composite Index is a broad-based capitalization-weighted index of all the NASDAQ National Market and Small Cap stocks. Indices are unmanaged, are not available for investment and do not incur expenses. The Bloomberg U.S. Aggregate Bond Index is a broad-based, market capitalization-weighted index representing U.S. intermediate term investment grade bonds.
Fund holdings and sector allocations are subject to change and should not be considered a recommendation to buy or sell any security. For a complete list of fund holdings, please refer to the Schedule of Investments section of this report.
Cromwell Funds distributed by Foreside Fund Services, LLC.
17
CROMWELL CENTERSQUARE REAL ESTATE FUND
Fund Performance
As of December 31, 2022 (Unaudited)
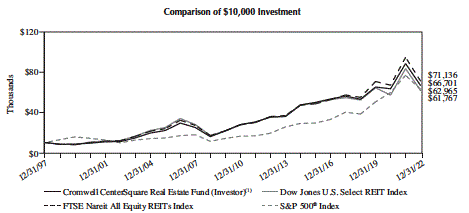
The chart assumes an initial investment of $10,000. Performance reflects waivers of fee and operating expenses in effect. In the absence of such waivers, total return would be reduced. Past performance is not predictive of future performance. Investment return and principal value will fluctuate, so that your shares, when redeemed may be worth more or less than their original cost. Performance current to the most recent month-end may be lower or higher than the performance quoted and can be obtained by calling 1-855-625-7333. Performance assumes the reinvestment of capital gains and income distributions. The performance does not reflect the deduction of taxes that a shareholder would pay on Fund distributions or the redemption of Fund shares.
| Annualized Rates of Return as of December 31, 2022 | |||||
| Since | |||||
| 1 year | 3 years | 5 years | 10 years | Inception(9) | |
| Investor Class(2) | -24.72% | 0.74% | 3.49% | 6.57% | 7.89% |
| Institutional Class(3)(10) | -24.57% | 0.88% | 3.63% | N/A | 3.55% |
| Class Z(4)(10) | -24.45% | 1.04% | 3.77% | N/A | 3.69% |
| FTSE Nareit All Equity REITs Index(5)(6) | -24.95% | 0.20% | 4.43% | 7.10% | 8.16% |
| Dow Jones U.S. Select REIT Index(7) | -26.03% | -1.41% | 2.48% | 5.73% | 7.55% |
| S&P 500® Index(8) | -18.11% | 7.66% | 9.42% | 12.56% | 7.64% |
| (1) | Effective on March 7, 2022, AMG Managers CenterSquare Real Estate Fund, a series of AMG Funds I (the “Predecessor Fund”), reorganized into the Fund. Performance shown prior to March 7, 2022, is that of the Predecessor Fund. The Predecessor Fund had the same investment objectives, strategies and portfolio management team as the Fund as of the date of the reorganization. |
| (2) | Prior to March 7, 2022, the Investor Class was known as Class N. The Investor Class commenced operations on December 31, 1997. |
| (3) | Prior to March 7, 2022, the Institutional Class was known as Class I. The Institutional Class commenced operations on February 24, 2017. |
| (4) | Class Z commenced operations on February 24, 2017. |
| (5) | Effective on March 7, 2022, the FTSE Nareit All Equity REITs Index has replaced the Dow Jones U.S. Select REIT Index as the Fund’s broad-based securities market index because it more closely aligns with the principal investment strategies of the Fund. |
| (6) | The FTSE Nareit All Equity REITs Index is an index of U.S. equity REITs. Constituents include all tax-qualified REITs with more than 50% of total assets in qualifying real estate assets other than mortgages secured by real property. Indices are unmanaged, are not available for investment and do not incur expenses. |
18
CROMWELL CENTERSQUARE REAL ESTATE FUND
Fund Performance
As of December 31, 2022 (Unaudited) — (Continued)
| (7) | The Dow Jones U.S. Select REIT Index measures U.S. publicly traded real estate investment trusts. Indices are unmanaged, are not available for investment and do not incur expenses. |
| (8) | The S&P 500 Index is a capitalization-weighted index of 500 stocks. Indices are unmanaged, are not available for investment and do not incur expenses. |
| (9) | Since Inception returns for the benchmarks are as of the inception of the Investor Class (December 31, 1997). |
| (10) | The returns reflect the actual performance for each period and do not include the impact of any adjustments made for financial reporting required by Generally Accepted Accounting Principals (GAAP). |
The following is expense information for the Cromwell CenterSquare Real Estate Fund as disclosed in the most recent prospectus dated March 7, 2022: Investor Class – Gross Expenses: 1.02%; Institutional Class – Gross Expenses: 0.90%; Class Z – Gross Expenses: 0.77%.
19
CROMWELL MARKETFIELD L/S FUND
Fund Performance
As of December 31, 2022 (Unaudited)
![]()
The chart assumes an initial investment of $25,000. Performance reflects waivers of fee and operating expenses in effect. In the absence of such waivers, total return would be reduced. Past performance is not predictive of future performance. Investment return and principal value will fluctuate, so that your shares, when redeemed may be worth more or less than their original cost. Performance current to the most recent month-end may be lower or higher than the performance quoted and can be obtained by calling 1-855-625-7333. Performance assumes the reinvestment of capital gains and income distributions. The performance does not reflect the deduction of taxes that a shareholder would pay on Fund distributions or the redemption of Fund shares.
| Annualized Rates of Return as of December 31, 2022 | |||||
| Since | |||||
| 1 year | 3 years | 5 years | 10 years | Inception(8) | |
| Investor Class(3) | 2.81% | 10.11% | 5.28% | 3.47% | 3.46% |
| Investor Class (Max 5.50% Load)(4) | -2.86% | 8.05% | 4.09% | 2.89% | 2.89% |
| Class C (Max 1.00% CDSC)(5) | 1.03% | 9.27% | 4.46% | 2.68% | 2.67% |
| Institutional Class(6) | 3.10% | 10.40% | 5.53% | 3.72% | 5.55% |
| S&P 500® Index(7) | -18.11% | 7.66% | 9.42% | 12.56% | 8.68% |
| (1) | $25,000 is the minimum required investment in the Cromwell Marketfield L/S Fund’s Institutional Class. |
| (2) | During the past 10 years, the Fund was a series of different registered investment companies. The Fund launched on July 31, 2007, as a series of Trust for Professional Managers (“TPM”). The Fund reorganized into the MainStay Marketfield Fund as a series of Mainstay Funds Trust on October 5, 2012. On April 8, 2016, the Fund reorganized back into the Marketfield Fund (the “Predecessor Fund”) as part of TPM where it remained until March 14, 2022, when it reorganized into the Fund. The Predecessor Fund had the same investment objectives, strategies and portfolio management team as the Fund as of the date of the reorganization. |
| (3) | Prior to March 14, 2022, the Investor Class was known as Class A. The Investor Class commenced operations on October 5, 2012. |
| (4) | Performance figures reflect the imposition of the Class A sales load prior to March 14, 2022. Going forward, Investor Class shares will have no sales load. |
| (5) | Class C commenced operations on October 5, 2012. |
| (6) | Prior to March 14, 2022, the Institutional Class was known as Class I. The Institutional Class commenced operations on July 31, 2007. |
| (7) | The S&P 500 Index is a capitalization-weighted index of 500 stocks. Indices are unmanaged, are not available for investment and do not incur expenses. |
| (8) | Since Inception returns for the benchmarks are as of the inception of the Institutional Class on July 31, 2007. |
20
CROMWELL MARKETFIELD L/S FUND
Fund Performance
As of December 31, 2022 (Unaudited) — (Continued)
The following is expense information for the Cromwell Marketfield L/S Fund as disclosed in the most recent prospectus dated March 14, 2022: Investor Class – Gross Expenses: 2.63%, Net Expenses: 2.49%; Class C – Gross Expenses: 3.38%, Net Expenses: 3.24%; Institutional Class – Gross Expenses: 2.38%, Net Expenses: 2.24%. The Fund’s Investment Adviser has contractually agreed to limit fund operating expenses through 3/14/24. Please refer to the prospectus for detailed information.
21
CROMWELL CENTERSQUARE REAL ESTATE FUND
Holdings Presentations
As of December 31, 2022 (Unaudited)
| PORTFOLIO BREAKDOWN(1) | |
| (% OF NET ASSETS) | |
| Diversified | 29.2% |
| Apartments | 13.5% |
| Warehouse/Industrials | 13.1% |
| Health Care | 9.3% |
| Single Tenant | 7.3% |
| Storage | 7.0% |
| Office Property | 6.0% |
| Shopping Centers | 4.9% |
| Manufactured Homes | 3.4% |
| Hotels | 2.6% |
| Regional Malls | 2.6% |
| Short-Term Investments | 0.3% |
| TOP TEN EQUITY HOLDINGS(1) | |
| (% OF NET ASSETS) | |
| Prologis, Inc | 9.0% |
| American Tower Corp | 7.8% |
| Crown Castle International Corp | 4.5% |
| Equinix, Inc | 4.4% |
| SBA Communications Corp | 4.1% |
| Public Storage | 3.7% |
| Sun Communities, Inc | 3.4% |
| Digital Realty Trust, Inc. | 3.3% |
| Welltower, Inc | 3.1% |
| Ventas, Inc | 2.9% |
| (1) | Fund holdings and sector allocations are subject to change at any time and are not recommendations to buy or sell any security. |
22
CROMWELL MARKETFIELD L/S FUND
Holdings Presentations
As of December 31, 2022 (Unaudited)
| ALLOCATION OF PORTFOLIO ASSETS(1) | |
| (% OF NET ASSETS) | |
| Common Stocks | 57.4% |
| Short-Term Investments | 35.4% |
| Other Assets Less Liabilities | 29.0% |
| Exchange-Traded Funds | 6.8% |
| Real Estate Investment Trusts Sold Short | -0.3% |
| Exchange-Traded Funds Sold Short | -13.7% |
| Common Stocks Sold Short | -14.6% |
| TOP TEN EQUITY HOLDINGS(1) | |
| (% OF NET ASSETS) | |
| ConocoPhillips . | 3.4% |
| Schlumberger Ltd | 3.1% |
| Deere & Co. | 3.0% |
| DR Horton, Inc. | 2.9% |
| Chevron Corp. | 2.7% |
| iShares MSCI United Kingdom ETF | 2.6% |
| Devon Energy Corp. | 2.6% |
| Franco-Nevada Corp | 2.5% |
| Norfolk Southern Corp. . | 2.5% |
| Caterpillar, Inc | 2.4% |
(1) Fund holdings and sector allocations are subject to change at any time and are not recommendations to buy or sell any security.
23
Expense Examples
December 31, 2022 (Unaudited)
As a shareholder of a Fund, you incur two types of costs: (1) transactions costs, including brokerage commissions on purchases and sales of Fund shares, and (2) ongoing costs, including management fees; distribution and/or service (12b-1) fees, shareholder servicing fees, and other Fund expenses. This Example is intended to help you understand your ongoing costs (in dollars) of investing in the Fund and to compare these costs with the ongoing costs of investing in other mutual funds. The Example is based on an investment of $1,000 invested at the beginning of the period and held for the entire period (July 1, 2022 – December 31, 2022).
ACTUAL EXPENSES
For each class, the first line of the table provides information about actual account values and actual expenses. You may use the information in this line, together with the amount you invested, to estimate the expenses that you paid over the period. Simply divide your account value by $1,000 (for example, an $8,600 account value divided by $1,000 = 8.6), then multiply the result by the number in the first line under the heading entitled “Expenses Paid During Period” to estimate the expenses you paid on your account during this period.
HYPOTHETICAL EXAMPLE FOR COMPARISON PURPOSES
For each class, the second line of the table below provides information about hypothetical account values and hypothetical expenses based on the Fund’s actual expense ratio and an assumed rate of return of 5% per year before expenses, which is not the Fund’s actual return. The hypothetical account values and expenses may not be used to estimate the actual ending account balance or expenses you paid for the period. You may use this information to compare the ongoing costs of investing in the Fund and other funds. To do so, compare this 5% hypothetical example with the 5% hypothetical examples that appear in the shareholder reports of the other funds.
Please note that the expenses shown in the tables are meant to highlight your ongoing costs only. Therefore, the second line of the tables are useful in comparing ongoing costs only, and will not help you determine the relative total costs of owning different funds, In addition, if transactional costs were included, your costs may have been higher.
24
Expense Examples
December 31, 2022 (Unaudited) — (Continued)
| Cromwell CenterSquare Real Estate Fund | |||
| Expenses Paid | |||
| Beginning | Ending | During Period(1) | |
| Account Value | Account Value | (7/1/2022 to | |
| (7/1/2022) | (12/31/2022) | 12/31/2022) | |
| Investor Class | |||
| Actual(2) | $1,000.00 | $919.70 | $5.66 |
| Hypothetical (5% return before expenses) | $1,000.00 | $1,019.31 | $5.96 |
| Institutional Class | |||
| Actual(2) | $1,000.00 | $920.30 | $5.08 |
| Hypothetical (5% return before expenses) | $1,000.00 | $1,019.91 | $5.35 |
| Class Z | |||
| Actual(2) | $1,000.00 | $921.00 | $4.21 |
| Hypothetical (5% return before expenses) | $1,000.00 | $1,020.82 | $4.43 |
| (1) | Expenses are equal to the Fund’s annualized expense ratio for the most recent six-month period of 1.17%, 1.05% and 0.87% for the Investor Class, Institutional Class and Class Z, respectively, multiplied by the average account value over the period, multiplied by 184/365 to reflect the one-half year period. |
| (2) | Based on the actual returns for the six-month period ended December 31, 2022 of -8.03%, -7.97% and -7.90% for the Investor Class, Institutional Class and Class Z, respectively. |
| Cromwell Marketfield L/S Fund | |||
| Expenses Paid | |||
| Beginning | Ending | During Period(1) | |
| Account Value | Account Value | (7/1/2022 to | |
| (7/1/2022) | (12/31/2022) | 12/31/2022) | |
| Investor Class | |||
| Actual(2) | $1,000.00 | $1,099.20 | $9.52 |
| Hypothetical (5% return before expenses) | $1,000.00 | $1,016.13 | $9.15 |
| Class C | |||
| Actual(2) | $1,000.00 | $1,095.20 | $13.47 |
| Hypothetical (5% return before expenses) | $1,000.00 | $1,012.35 | $12.93 |
| Institutional Class | |||
| Actual(2) | $1,000.00 | $1,100.90 | $8.21 |
| Hypothetical (5% return before expenses) | $1,000.00 | $1,017.39 | $7.88 |
| (1) | Expenses are equal to the Fund’s annualized expense ratio for the most recent six-month period of 1.80%, 2.55% and 1.55% for the Investor Class, Class C and Institutional Class, respectively, multiplied by the average account value over the period, multiplied by 184/365 to reflect the one-half year period. |
| (2) | Based on the actual returns for the six-month period ended December 31, 2022 of 9.92%, 9.52% and 10.09% for the Investor Class, Class C and Institutional Class, respectively. |
25
CROMWELL CENTERSQUARE REAL ESTATE FUND
Schedule of Investments
December 31, 2022
| Shares | Value | |
| REITs – 98.94% | ||
| Apartments – 13.49% | ||
| American Homes 4 Rent – Class A | 62,830 | $1,893,696 |
| AvalonBay Communities, Inc | 24,400 | 3,941,088 |
| Equity Residential | 67,550 | 3,985,450 |
| Essex Property Trust, Inc | 5,040 | 1,068,077 |
| Invitation Homes, Inc | 129,980 | 3,852,607 |
| Mid-America Apartment Communities, Inc | 11,450 | 1,797,536 |
| UDR, Inc | 63,080 | 2,443,088 |
| 18,981,542 | ||
| Diversified – 29.15% | ||
| American Tower Corp | 52,000 | 11,016,720 |
| Broadstone Net Lease, Inc | 109,500 | 1,774,995 |
| Crown Castle, Inc | 46,770 | 6,343,883 |
| Digital Realty Trust, Inc | 46,930 | 4,705,671 |
| Equinix, Inc | 9,490 | 6,216,235 |
| Outfront Media, Inc | 20,644 | 342,278 |
| SBA Communications Corp | 20,790 | 5,827,645 |
| VICI Properties, Inc | 63,140 | 2,045,736 |
| Weyerhaeuser Co | 88,770 | 2,751,870 |
| 41,025,033 | ||
| Health Care – 9.31% | ||
| Healthpeak Properties, Inc | 55,630 | 1,394,644 |
| Medical Properties Trust, Inc | 154,696 | 1,723,313 |
| Omega Healthcare Investors, Inc | 7,700 | 215,215 |
| Sabra Health Care REIT, Inc | 101,220 | 1,258,165 |
| Ventas, Inc | 90,944 | 4,097,027 |
| Welltower, Inc | 67,289 | 4,410,794 |
| 13,099,158 | ||
| Hotels – 2.61% | ||
| Apple Hospitality REIT, Inc | 25,460 | 401,759 |
| DiamondRock Hospitality Co | 62,230 | 509,664 |
| Host Hotels & Resorts, Inc | 89,910 | 1,443,055 |
| Park Hotels & Resorts, Inc | 32,950 | 388,481 |
| Xenia Hotels & Resorts, Inc | 71,070 | 936,703 |
| 3,679,662 | ||
See Notes to Financial Statements
26
CROMWELL CENTERSQUARE REAL ESTATE FUND
Schedule of Investments
December 31, 2022 — (Continued)
| Shares | Value | |
| Manufactured Homes – 3.38% | ||
| Sun Communities, Inc | 33,220 | $4,750,460 |
| 4,750,460 | ||
| Office Property – 6.04% | ||
| Alexandria Real Estate Equities, Inc | 23,390 | 3,407,221 |
| Douglas Emmett, Inc | 66,130 | 1,036,918 |
| Cousins Properties, Inc | 36,006 | 910,592 |
| Highwoods Properties, Inc | 32,310 | 904,034 |
| Kilroy Realty Corp | 45,105 | 1,744,210 |
| Veris Residential, Inc. (a) | 30,828 | 491,090 |
| 8,494,065 | ||
| Regional Malls – 2.60% | ||
| Simon Property Group, Inc | 31,180 | 3,663,026 |
| 3,663,026 | ||
| Shopping Centers – 4.97% | ||
| Acadia Realty Trust | 68,910 | 988,858 |
| Brixmor Property Group, Inc | 94,850 | 2,150,249 |
| Phillips Edison & Co, Inc | 23,748 | 756,136 |
| Regency Centers Corp | 22,320 | 1,395,000 |
| RPT Realty | 112,214 | 1,126,629 |
| Urban Edge Properties | 40,710 | 573,604 |
| 6,990,476 | ||
| Single Tenant – 7.39% | ||
| Agree Realty Corp | 55,090 | 3,907,534 |
| Four Corners Property Trust, Inc | 48,800 | 1,265,384 |
| Realty Income Corp | 63,700 | 4,040,491 |
| Spirit Realty Capital, Inc | 29,530 | 1,179,133 |
| 10,392,542 | ||
| Storage – 6.96% | ||
| CubeSmart | 19,579 | 788,055 |
| Extra Space Storage, Inc | 8,269 | 1,217,031 |
| Life Storage, Inc | 26,080 | 2,568,880 |
| Public Storage | 18,610 | 5,214,336 |
| 9,788,302 | ||
See Notes to Financial Statements
27
CROMWELL CENTERSQUARE REAL ESTATE FUND
Schedule of Investments
December 31, 2022 — (Continued)
| Shares | Value | |
| Warehouse/Industrials – 13.04% | ||
| Americold Realty Trust, Inc | 44,970 | $1,273,101 |
| First Industrial Realty Trust, Inc | 44,450 | 2,145,157 |
| Prologis, Inc | 112,552 | 12,687,987 |
| Rexford Industrial Realty, Inc | 41,100 | 2,245,704 |
| 18,351,949 | ||
| TOTAL REITS | ||
| (Cost $137,206,080) | 139,216,215 | |
| SHORT-TERM INVESTMENTS – 0.32% | ||
| U.S. Bank Money Market Deposit Account, 3.90% (b) | 457,289 | 457,289 |
| TOTAL SHORT-TERM INVESTMENTS | ||
| (Cost $457,289) | 457,289 | |
| Total Investments | ||
| (Cost $137,663,369) – 99.26% | 139,673,504 | |
| Other Assets in Excess of Liabilities – 0.74%. | 1,031,588 | |
| TOTAL NET ASSETS – 100.00% | $140,705,092 | |
REITs Real estate investment trusts.
| (a) | Non-income producing security. |
| (b) | The Money Market Deposit Account (“MMDA”) is a short-term investment vehicle in which the Fund holds cash balances. The MMDA will bear interest at a variable rate that is determined based on conditions and may change daily and by any amount. The rate shown is as of December 31, 2022. |
See Notes to Financial Statements
28
CROMWELL MARKETFIELD L/S FUND
Schedule of Investments
December 31, 2022
| Shares | Value | |
| COMMON STOCKS – 57.43% | ||
| Building Products – 0.73% | ||
| TOTO Ltd. (a) | 33,886 | $1,161,894 |
| Chemicals – 3.56% | ||
| The Mosaic Co. (b) | 67,558 | 2,963,770 |
| The Sherwin-Williams Co. (b) | 11,489 | 2,726,684 |
| 5,690,454 | ||
| Electrical Equipment – 1.61% | ||
| Rockwell Automation, Inc | 9,975 | 2,569,261 |
| Electronic Equipment, Instruments & Components – 1.79% | ||
| Keyence Corp. (a) | 7,324 | 2,869,553 |
| Energy Equipment & Services – 3.08% | ||
| Schlumberger Ltd. – ADR (b) | 92,203 | 4,929,172 |
| Food & Staples Retailing – 1.82% | ||
| Costco Wholesale Corp. (b) | 6,358 | 2,902,427 |
| Hotels, Restaurants & Leisure – 0.45% | ||
| Dalata Hotel Group PLC (a)(c) | 207,835 | 727,497 |
| Household Durables – 6.44% | ||
| DR Horton, Inc. (b) | 52,675 | 4,695,449 |
| Lennar Corp. – Class A | 29,641 | 2,682,511 |
| Mohawk Industries, Inc. (c) | 28,513 | 2,914,599 |
| 10,292,559 | ||
| Industrial Conglomerates – 0.53% | ||
| Siemens AG (a) | 6,132 | 850,954 |
| Machinery – 7.64% | ||
| Caterpillar, Inc. (b) | 15,834 | 3,793,193 |
| Cummins, Inc. (b) | 14,785 | 3,582,258 |
| Deere & Co. (b) | 11,265 | 4,829,981 |
| 12,205,432 | ||
See Notes to Financial Statements
29
CROMWELL MARKETFIELD L/S FUND
Schedule of Investments
December 31, 2022 — (Continued)
| Shares | Value | |
| Metals & Mining – 12.40% | ||
| Barrick Gold Corp. – ADR (b) | 136,014 | $2,336,720 |
| Cleveland-Cliffs, Inc. (b)(c) | 194,737 | 3,137,213 |
| Compania de Minas Buenaventura SAA – ADR. | 97,865 | 729,094 |
| Franco-Nevada Corp. – ADR (b) | 29,070 | 3,967,474 |
| Freeport-McMoRan, Inc. (b) | 70,949 | 2,696,062 |
| MMC Norilsk Nickel PJSC – ADR (d)(e) | 105,916 | — |
| Newmont Corp. (b) | 51,994 | 2,454,117 |
| Rio Tinto Plc – ADR | 36,239 | 2,580,217 |
| Wheaton Precious Metals Corp. – ADR | 49,029 | 1,916,053 |
| 19,816,950 | ||
| Oil, Gas & Consumable Fuels – 11.39% | ||
| Chevron Corp. (b) | 23,665 | 4,247,631 |
| ConocoPhillips (b) | 45,389 | 5,355,902 |
| Devon Energy Corp. (b) | 66,451 | 4,087,401 |
| EOG Resources, Inc. (b) | 19,299 | 2,499,606 |
| Golar LNG Ltd. – ADR (c) | 88,634 | 2,019,969 |
| 18,210,509 | ||
| Real Estate Management & Development – 1.04% | ||
| The St. Joe Co | 42,951 | 1,660,056 |
| Road & Rail – 4.30% | ||
| Norfolk Southern Corp. (b) | 15,963 | 3,933,603 |
| Union Pacific Corp. (b) | 14,173 | 2,934,803 |
| 6,868,406 | ||
| Semiconductors & Semiconductor Equipment – 0.65% | ||
| Intel Corp | 39,466 | 1,043,086 |
| TOTAL COMMON STOCKS | ||
| (Cost $59,024,157) | 91,798,210 | |
See Notes to Financial Statements
30
CROMWELL MARKETFIELD L/S FUND
Schedule of Investments
December 31, 2022 — (Continued)
| Shares | Value | |
| EXCHANGE-TRADED FUNDS – 6.83% | ||
| iShares MSCI United Kingdom ETF | 136,163 | $4,174,757 |
| SPDR S&P Oil & Gas Exploration & Production ETF (b) | 22,753 | 3,091,678 |
| VanEck Gold Miners ETF (b) | 127,143 | 3,643,919 |
| VanEck Russia ETF (c)(d)(e) | 81,903 | — |
| TOTAL EXCHANGE-TRADED FUNDS | ||
| (Cost $11,467,706) | 10,910,354 | |
| SHORT-TERM INVESTMENTS – 35.37% | ||
| U.S. Bank Money Market Deposit Account, 3.90% (f) | 56,541,873 | 56,541,873 |
| TOTAL SHORT-TERM INVESTMENTS | ||
| (Cost $56,541,873) | 56,541,873 | |
| Total Investments | ||
| (Cost $127,033,736) – 99.63% | 159,250,437 | |
| Other Assets in Excess of Liabilities – 0.37%. | 591,040 | |
| TOTAL NET ASSETS – 100.00% | $159,841,477 | |
| (a) | Foreign issued security. |
| (b) | All or a portion of this security is pledged as collateral for securities sold short with an aggregate fair value of $49,682,420 as of December 31, 2022. |
| (c) | Non-income producing security. |
| (d) | Value determined using significant unobservable inputs. Classified as Level 3 in the fair value hierarchy. See Note 3 in the Notes to the Financial Statements. |
| (e) | As of December 31, 2022, the Valuation Committee has fair valued these securities. The value of these securities were $0, which represents 0.00% of total net assets. |
| (f) | The Money Market Deposit Account (“MMDA”) is a short-term investment vehicle in which the Fund holds cash balances. The MMDA will bear interest at a variable rate that is determined based on conditions and may change daily and by any amount. The rate shown is as of December 31, 2022. |
Abbreviations:
ADR American Depositary Receipt
AG Aktiengesellschaft is a German term that refers to a corporation that is limited by shares, i.e. owned by shareholders.
Ltd. Limited is a term indicating a company is incorporated and shareholders have limited liability.
PJSC An abbreviation used by many countries to signify an open joint-stick company.
PLC Public Limited Company is a publicly traded company which signifies that shareholders have limited liability.
SAA An abbreviation used by many countries to signify a stock company whereby shareholders have limited liability.
The Global Industry Classification Standard (GICS®) was developed by and/or is the exclusive property of MSCI, Inc. and Standard & Poor Financial Services LLC (“S&P”). GICS is a service mark of MSCI and S&P and has been licensed for use by U.S. Bancorp Fund Services, LLC.
See Notes to Financial Statements
31
CROMWELL MARKETFIELD L/S FUND
Schedule of Investments
December 31, 2022 — (Continued)
| Shares | Value | |
| SECURITIES SOLD SHORT – -28.56% | ||
| COMMON STOCKS – -14.57% | ||
| Banks – -3.54% | ||
| Signature Bank | (21,236) | $ (2,446,812) |
| SVB Financial Group (a) | (13,954) | (3,211,373) |
| (5,658,185) | ||
| Capital Markets – -6.83% | ||
| BlackRock, Inc | (6,847) | (4,851,990) |
| The Carlyle Group, Inc | (76,436) | (2,280,850) |
| Coinbase Global, Inc. (a) | (9,388) | (332,241) |
| Invesco Ltd | (85,493) | (1,538,019) |
| The Blackstone Group LP | (25,742) | (1,909,799) |
| (10,912,899) | ||
| Consumer Finance – -1.68% | ||
| Synchrony Financial | (81,550) | (2,679,733) |
| Industrial Conglomerates – -2.52% | ||
| General Electric Co | (48,163) | (4,035,578) |
| TOTAL COMMON STOCKS | ||
| (Proceeds $27,104,547) | (23,286,395) | |
| EXCHANGE-TRADED FUNDS – -13.67% | ||
| Invesco QQQ Trust Series 1 | (53,429) | (14,227,074) |
| iShares Russell 2000 ETF | (43,715) | (7,622,148) |
| TOTAL EXCHANGE-TRADED FUNDS | ||
| (Proceeds $22,400,445) | (21,849,222) | |
| REAL ESTATE INVESTMENT TRUSTS – -0.32% | ||
| Vornado Realty Trust | (24,854) | (517,212) |
| TOTAL REAL ESTATE INVESTMENT TRUSTS | ||
| (Proceeds $1,828,341) | (517,212) | |
| Total Securities Sold Short (Proceeds $51,333,333) | $ (45,652,829) | |
(a) Non-income producing security.
(b) Foreign issued security.
Ltd. Limited is a term indicating a company is incorporated and shareholders have limited liability.
LP Limited Partnership
See Notes to Financial Statements
32
CROMWELL FUNDS
Statements of Assets & Liabilities
As of December 31, 2022
| Cromwell | Cromwell | ||
| CenterSquare | Marketfield | ||
| Real | L/S | ||
| Estate Fund | Fund | ||
| ASSETS | |||
| Investment in securities, at value (cost $137,663,369 and | |||
| $127,033,736, respectively) | $139,673,504 | $ 159,250,437 | |
| Dividends & interest receivable | 691,291 | 379,473 | |
| Broker interest receivable | — | 129,321 | |
| Receivable from investment securities sold | 3,906,962 | — | |
| Receivable for capital shares sold | 140,306 | 70,668 | |
| Deposits at brokers(1) | — | 45,928,907 | |
| Prepaid expenses and other assets | 30,439 | 31,676 | |
| Total Assets | 144,442,502 | 205,790,482 | |
| LIABILITIES | |||
| Securities sold short, at value (proceeds received of $0 and | |||
| $51,333,333, respectively | — | 45,652,829 | |
| Payable for capital shares redeemed. | 3,357,981 | 33,886 | |
| Payable for investment securities purchased | 129,601 | — | |
| Interest payable on line of credit | 11,663 | — | |
| Payable to investment adviser. | 90,990 | 125,940 | |
| Payable for fund administration & accounting fees | 27,751 | 39,809 | |
| Payable for compliance fees | 5,588 | 5,789 | |
| Payable for transfer agent fees & expenses | 14,142 | 21,781 | |
| Payable for custody fees | 5,990 | 2,217 | |
| Payable for trustee fees | 14,922 | 13,582 | |
| Payable for audit fees | 13,537 | 13,506 | |
| Dividends & interest on short positions | — | 5,157 | |
| Accrued distribution and/or shareholder service fees | 55,499 | 21,085 | |
| Accrued expenses | 9,746 | 13,424 | |
| Total Liabilities | 3,737,410 | 45,949,005 | |
| NET ASSETS | $140,705,092 | $ 159,841,477 | |
| NET ASSETS CONSIST OF: | |||
| Paid-in capital | 144,053,333 | 481,411,596 | |
| Total distributable earnings/(accumulated deficit) | (3,348,241) | (321,570,119) | |
| NET ASSETS | $140,705,092 | $ 159,841,477 | |
See Notes to Financial Statements
33
CROMWELL FUNDS
Statements of Assets & Liabilities
As of December 31, 2022 — (Continued)
| Cromwell | Cromwell | |||
| CenterSquare | Marketfield | |||
| Real | L/S | |||
| Estate Fund | Fund | |||
| Investor Class(2): | ||||
| Net Assets | $ | 69,987,036 | $ | 46,575,399 |
| Shares issued and outstanding(3) | 7,022,662 | 2,104,323 | ||
| Net asset value, offering price, and redemption price per share | $ | 9.97 | $ | 22.13 |
| Class C(4): | ||||
| Net Assets | $ | — | $ | 12,151,021 |
| Shares issued and outstanding(3) | — | 589,824 | ||
| Net asset value, offering price, and redemption price per share | $ | — | $ | 20.60 |
| Institutional Class(5): | ||||
| Net Assets | $ | 63,914,999 | $ | 101,115,057 |
| Shares issued and outstanding(3) | 6,415,396 | 4,482,077 | ||
| Net asset value, offering price, and redemption price per share | $ | 9.96 | $ | 22.56 |
| Class Z: | ||||
| Net Assets | $ | 6,803,057 | $ | — |
| Shares issued and outstanding(3) | 682,271 | — | ||
| Net asset value, offering price, and redemption price per share | $ | 9.97 | $ | — |
| (1) | Serves as collateral for securities sold short. |
| (2) | Prior to March 7, 2022, the Cromwell CenterSquare Real Estate Fund’s Investor Class shares were known as Class N shares. Prior to March 14, 2022, the Cromwell Marketfield L/S Fund’s Investor Class shares were known as Class A Shares, and were subject to a sales load of up to 5.50%. |
| (3) | Unlimited number of shares authorized with no par value. |
| (4) | A contingent deferred sales charge (“CDSC”) of 1.00% may be charged on shares redeemed within twelve months of purchase. |
| (5) | Prior to March 7, 2022 and March 14, 2022, respectively, the Cromwell CenterSquare Real Estate Fund’s and Cromwell Marketfield L/S Fund’s Institutional Class shares were known as Class I shares. |
See Notes to Financial Statements
34
CROMWELL FUNDS
Statements of Operations
For the year ended December 31, 2022
| Cromwell | Cromwell | |||
| CenterSquare | Marketfield | |||
| Real | L/S | |||
| Estate Fund | Fund | |||
| INVESTMENT INCOME: | ||||
| Dividend income | $4,767,128 | $ 3,219,503 | ||
| Less: Foreign taxes withheld | — | (68,553) | ||
| Broker interest income | — | 320,847 | ||
| Interest income | 23,417 | 637,702 | ||
| Total Investment Income | 4,790,545 | 4,109,499 | ||
| EXPENSES: | ||||
| Investment advisory fees (See Note 4) | 1,126,017 | 2,068,420 | ||
| Dividend expense | — | 660,401 | ||
| Transfer agent fees & expenses (See Note 4) | 60,120 | 159,145 | ||
| Fund administration & accounting fees (See Note 4) | 152,352 | 123,696 | ||
| Federal & state registration fees | 45,174 | 43,782 | ||
| Trustee fees | 62,989 | 55,683 | ||
| Audit fees | 14,769 | 13,884 | ||
| Custody fees (See Note 4) | 12,335 | 9,095 | ||
| Other expenses | 8,391 | 8,106 | ||
| Interest expense | 11,663 | — | ||
| Legal fees | 45,259 | 49,973 | ||
| Insurance expense | 7,522 | 3,957 | ||
| Postage & printing fees | 54,018 | 24,516 | ||
| Compliance fees (See Note 4) | 14,505 | 16,339 | ||
| Distribution and/or shareholder service fees (See Note 5) | ||||
| Investor Class | 205,721 | 116,083 | ||
| Class C | — | 134,722 | ||
| Institutional Class | 104,101 | — | ||
| Total Expenses Before Reimbursement/Recoupment | 1,924,936 | 3,487,802 | ||
| Adviser recoupment (See Note 4) | 24,269 | — | ||
| Reimbursement from adviser (See Note 4) | — | (284,167) | ||
| Total Net Expenses | 1,949,205 | 3,203,635 | ||
| NET INVESTMENT INCOME (LOSS) | 2,841,340 | 905,864 | ||
See Notes to Financial Statements
35
CROMWELL FUNDS
Statements of Operations
For the year ended December 31, 2022 — (Continued)
| Cromwell | Cromwell | |||
| CenterSquare | Marketfield | |||
| Real | L/S | |||
| Estate Fund | Fund | |||
| REALIZED AND UNREALIZED GAIN (LOSS) ON INVESTMENTS AND | ||||
| TRANSLATIONS OF FOREIGN CURRENCY | ||||
| Net realized gain (loss) on: | ||||
| Investments | $(474,269) | $ 9,778,534 | ||
| Securities sold short | — | 2,659,306 | ||
| Purchased options | — | 226,647 | ||
| Foreign currency translations. | — | (858) | ||
| (474,269) | 12,663,629 | |||
| Net change in unrealized appreciation (depreciation) on: | ||||
| Investments | (56,563,765) | (22,698,707) | ||
| Securities sold short | — | 13,196,945 | ||
| Foreign currency translations. | — | (9,459) | ||
| (56,563,765) | (9,511,221) | |||
| Net Realized and Unrealized Gain (Loss) on Investments and | ||||
| Foreign Currency | (57,038,034) | 3,152,408 | ||
| NET INCREASE (DECREASE) IN NET ASSETS RESULTING | ||||
| FROM OPERATIONS | $ (54,196,694) | $ 4,058,272 | ||
See Notes to Financial Statements
36
CROMWELL CENTERSQUARE REAL ESTATE FUND
Statements of Changes in Net Assets
| For the Year | For the Year | ||
| Ended | Ended | ||
| December 31, | December 31, | ||
| 2022 | 2021 | ||
| OPERATIONS: | |||
| Net investment income (loss) | 2,841,340 | $ 1,874,352 | |
| Net realized gain (loss) on investments | (474,269) | 25,283,218 | |
| Net change in unrealized appreciation (depreciation) on investments | |||
| and translations of foreign currency | (56,563,765) | 41,316,511 | |
| Net Increase (Decrease) in Net Assets Resulting From Operations | (54,196,694) | 68,474,081 | |
| CAPITAL SHARE TRANSACTIONS: | |||
| Investor Class(1): | |||
| Proceeds from shares sold | 10,444,016 | 9,506,090 | |
| Proceeds from reinvestment of distributions | 4,204,816 | 3,945,006 | |
| Payments for shares redeemed | (20,507,900) | (26,884,374) | |
| Increase (Decrease) in Net Assets Resulting From Investor | |||
| Class Transactions | (5,859,068) | (13,433,278) | |
| Institutional Class(2): | |||
| Proceeds from shares sold | 8,458,869 | 42,365,653 | |
| Proceeds from reinvestment of distributions | 4,064,023 | 3,931,764 | |
| Payments for shares redeemed | (23,684,592) | (20,551,396) | |
| Increase (Decrease) in Net Assets Resulting From Institutional | |||
| Class Transactions | (11,161,700) | 25,746,021 | |
| Class Z | |||
| Proceeds from shares sold | 6,750,134 | 30,102,555 | |
| Proceeds from reinvestment of distributions | 839,949 | 1,361,068 | |
| Payments for shares redeemed | (30,269,469) | (18,605) | |
| Increase (Decrease) in Net Assets Resulting from Class Z Transactions | (22,679,386) | 31,445,018 | |
| Net Increase (Decrease) in Net Assets Resulting From Capital | |||
| Share Transactions | (39,700,154) | 43,757,761 | |
| DISTRIBUTIONS TO SHAREHOLDERS: | |||
| Investor Class(1) | (4,325,438) | (4,071,602) | |
| Institutional Class(2) | (4,080,652) | (4,005,476) | |
| Class Z | (839,949) | (1,361,068) | |
| Total Distributions to Shareholders | (9,246,039) | (9,438,146) | |
| TOTAL INCREASE (DECREASE) IN NET ASSETS | (103,142,887) | 102,793,696 | |
| NET ASSETS: | |||
| Beginning of period | 243,847,979 | 141,054,283 | |
| End of period | $140,705,092 | $243,847,979 | |
(1) Prior to March 7, 2022, the Investor Class was previously known as Class N.
(2) Prior to March 7, 2022, the Institutional Class was previously known as Class I.
See Notes to Financial Statements
37
CROMWELL MARKETFIELD L/S FUND
Statements of Changes in Net Assets
| For the Year | For the Year | ||
| Ended | Ended | ||
| December 31, | December 31, | ||
| 2022 | 2021 | ||
| OPERATIONS: | |||
| Net investment income (loss) | 905,864 | $ (159,357) | |
| Net realized gain (loss) on: | |||
| Investments | 9,778,534 | 38,492,889 | |
| Securities sold short | 2,659,306 | (5,494,803) | |
| Purchased options | 226,647 | (331,538) | |
| Foreign currency translations. | (858) | (3,790) | |
| Net change in unrealized appreciation (depreciation) on: | |||
| Investments | (22,698,707) | (16,539,859) | |
| Securities sold short | 13,196,945 | (3,066,252) | |
| Foreign currency translations. | (9,459) | (34,322) | |
| Net Increase (Decrease) in Net Assets Resulting From Operations | 4,058,272 | 12,862,968 | |
| CAPITAL SHARE TRANSACTIONS: | |||
| Investor Class(1): | |||
| Proceeds from shares sold | 6,319,797 | 8,238,975 | |
| Dividends reinvested | 173,968 | – | |
| Payments for shares redeemed | (8,669,085) | (6,710,571) | |
| Increase (Decrease) in Net Assets Resulting From Investor | |||
| Class Transactions | (2,175,320) | 1,528,404 | |
| Class C: | |||
| Proceeds from shares sold | 16,372 | 35,455 | |
| Payments for shares redeemed | (5,625,617) | (12,260,520) | |
| Increase (Decrease) in Net Assets Resulting From Class C Transactions | (5,609,245) | (12,225,065) | |
| Institutional Class(2): | |||
| Proceeds from shares sold | 34,896,076 | 6,116,986 | |
| Dividends reinvested | 655,430 | – | |
| Payments for shares redeemed | (26,776,466) | (14,817,719) | |
| Increase (Decrease) in Net Assets Resulting From Institutional | |||
| Class Transactions | 8,775,040 | (8,700,733) | |
| Net Increase (Decrease) in Net Assets Resulting From Capital | |||
| Share Transactions | 990,475 | (19,397,394) | |
| DISTRIBUTIONS TO SHAREHOLDERS: | |||
| Investor Class(1) | (202,611) | – | |
| Institutional Class(2) | (674,829) | – | |
| Total Distributions to Shareholders | (877,440) | – | |
| TOTAL INCREASE (DECREASE) IN NET ASSETS | 4,171,307 | (6,534,426) | |
| NET ASSETS: | |||
| Beginning of period | 155,670,170 | 162,204,596 | |
| End of period | $159,841,477 | $155,670,170 | |
(1) Prior to March 14, 2022, the Investor Class was previously known as Class A.
(2) Prior to March 14, 2022, the Institutional Class was previously known as Class I.
See Notes to Financial Statements
38
CROMWELL CENTERSQUARE REAL ESTATE FUND
Financial Highlights
For a Fund share outstanding throughout the periods
| Investor Class(1) | |||
| Year Ended | Year Ended | Year Ended | |
| December 31, | December 31, | December 31, | |
| 2022 | 2021 | 2020 | |
| PER SHARE DATA: | |||
| Net asset value, beginning of period | $ 14.06 | $ 10.51 | $ 11.04 |
| Investment operations: | |||
| Net investment income (loss)(2)(3) | 0.17 | 0.10 | 0.11 |
| Net realized and unrealized gain (loss) on investments | (3.63) | 4.00 | (0.42) |
| Total from investment operations | (3.46) | 4.10 | (0.31) |
| Less distributions from: | |||
| Net investment income | (0.17) | (0.21) | (0.13) |
| Net realized gains | (0.46) | (0.34) | – |
| Paid in capital | – | – | (0.09) |
| Total distributions | (0.63) | (0.55) | (0.22) |
| NET ASSET VALUE, END OF PERIOD | $ 9.97 | $ 14.06 | $ 10.51 |
| TOTAL RETURN(3)(4) | -24.72% | 39.45% | -2.61% |
| SUPPLEMENTAL DATA AND RATIOS: | |||
| Net assets, end of period (in 000’s) | $69,987 | $104,438 | $90,167 |
| Ratio of expenses to average net assets: | |||
| Before expense reimbursement/recoupment(5)(7) | 1.11% | 1.12%(8) | 1.15% |
| After expense reimbursement/recoupment(5)(6) | 1.12% | 1.12%(8) | 1.11% |
| Ratio of net investment income (loss) to average net assets: | |||
| After expense reimbursement/recoupment(5) | 1.46% | 0.84% | 1.07% |
| Portfolio turnover rate(4) | 57% | 68% | 131% |
| 1) | Prior to March 7, 2022, the Investor Class was known as Class N. Prior to February 27, 2017, Class N was known as Class S. |
| (2) | Calculated using the average shares outstanding method. |
| (3) | Total returns and net investment income would have differed had certain expenses not been offset. |
| (4) | Not annualized for periods less than one year. |
| (5) | Annualized for periods less than one year. |
| (6) | Excludes the impact of expense reimbursement/recoupment or fee waivers and expense reductions such as brokerage credits, but includes expense repayments and non-reimbursable expenses, if any, such as interest, taxes, and extraordinary expenses. |
| (7) | Includes reduction from broker recapture amounting to less than 0.01% for the fiscal year ended December 31, 2021, 0.01% for the fiscal year ended December 31, 2020, less than 0.01% for the fiscal year ended December 31, 2019, and 0.01% for the fiscal year ended December 31, 2018. |
| (8) | Such ratio includes recapture of waived/reimbursed fees from prior periods amounting to less than 0.01%. |
See Notes to Financial Statements
39
CROMWELL CENTERSQUARE REAL ESTATE FUND
Financial Highlights (Continued)
For a Fund share outstanding throughout the periods
| Year Ended | Year Ended |
| December 31, | December 31, |
| 2019 | 2018 |
| $ 9.56 | $ 10.43 |
| 0.18 | 0.15 |
| 1.99 | (0.73) |
| 2.17 | (0.58) |
| (0.21) | (0.19) |
| (0.48) | (0.07) |
| – | (0.03) |
| (0.69) | (0.29) |
| $ 11.04 | $ 9.56 |
| 22.90% | -5.55% |
| $166,047 | $169,546 |
| 1.10% | 1.12% |
| 1.10% | 1.11% |
| 1.62% | 1.50% |
| 76% | 57% |
See Notes to Financial Statements
40
CROMWELL CENTERSQUARE REAL ESTATE FUND
Financial Highlights (Continued)
For a Fund share outstanding throughout the periods
| Institutional Class(1) | |||
| Year Ended | Year Ended | Year Ended | |
| December 31, | December 31, | December 31, | |
| 2022 | 2021 | 2020 | |
| PER SHARE DATA: | |||
| Net asset value, beginning of period | $ 14.05 | $ 10.51 | $ 11.04 |
| Investment operations: | |||
| Net investment income (loss)(2)(3) | 0.19 | 0.12 | 0.12 |
| Net realized and unrealized gain (loss) on investments | (3.63) | 3.98 | (0.42) |
| Total from investment operations | (3.44) | 4.10 | (0.30) |
| Less distributions from: | |||
| Net investment income | (0.19) | (0.22) | (0.13) |
| Net realized gains | (0.46) | (0.34) | – |
| Paid in capital | – | – | (0.10) |
| Total distributions | (0.65) | (0.56) | (0.23) |
| NET ASSET VALUE, END OF PERIOD | $ 9.96 | $ 14.05 | $ 10.51 |
| TOTAL RETURN(3)(4) | -24.65%(9) | 39.53% | -2.47% |
| SUPPLEMENTAL DATA AND RATIOS: | |||
| Net assets, end of period (in 000’s) | $63,915 | $102,347 | $50,587 |
| Ratio of expenses to average net assets: | |||
| Before expense reimbursement/recoupment(5)(7) | 0.99% | 1.00%(8) | 1.02% |
| After expense reimbursement/recoupment(5)(6) | 1.00% | 1.00%(8) | 0.98% |
| Ratio of net investment income (loss) to average net assets: | |||
| After expense reimbursement/recoupment(5) | 1.56% | 0.96% | 1.19% |
| Portfolio turnover rate(4) | 57% | 68% | 131% |
| (1) | Prior to March 7, 2022, the Institutional Class was known as Class I. |
| (2) | Calculated using the average shares outstanding method. |
| (3) | Total returns and net investment income would have differed had certain expenses not been offset. |
| (4) | Not annualized for periods less than one year. |
| (5) | Annualized for periods less than one year. |
| (6) | Excludes the impact of expense reimbursement/recoupment or fee waivers and expense reductions such as brokerage credits, but includes expense repayments and non-reimbursable expenses, if any, such as interest, taxes, and extraordinary expenses. |
| (7) | Includes reduction from broker recapture amounting to less than 0.01% for the fiscal year ended December 31, 2021, 0.01% for the fiscal year ended December 31, 2020, less than 0.01% for the fiscal year ended December 31, 2019, and 0.01% for the fiscal year ended December 31, 2018. |
| (8) | Such ratio includes recapture of waived/reimbursed fees from prior periods amounting to less than 0.01%. |
| (9) | Includes adjustments in accordance with accounting principles generally accepted in the United States and, consequently, the net asset values for financial reporting purposes and the returns based upon those net asset values may differ from the net asset values and returns for shareholder transactions. |
See Notes to Financial Statements
41
CROMWELL CENTERSQUARE REAL ESTATE FUND
Financial Highlights (Continued)
For a Fund share outstanding throughout the periods
| Year Ended | Year Ended |
| December 31, | December 31, |
| 2019 | 2018 |
| $ 9.56 | $ 10.43 |
| 0.19 | 0.17 |
| 1.99 | (0.73) |
| 2.18 | (0.56) |
| (0.22) | (0.21) |
| (0.48) | (0.07) |
| – | (0.03) |
| (0.70) | (0.31) |
| $ 11.04 | $ 9.56 |
| 23.06% | -5.40% |
| $56,324 | $54,734 |
| 0.97% | 0.99% |
| 0.97% | 0.98% |
| 1.75% | 1.64% |
| 76% | 57% |
See Notes to Financial Statements
42
CROMWELL CENTERSQUARE REAL ESTATE FUND
Financial Highlights (Continued)
For a Fund share outstanding throughout the periods
| Class Z | |||
| Year Ended | Year Ended | Year Ended | |
| December 31, | December 31, | December 31, | |
| 2022 | 2021 | 2020 | |
| PER SHARE DATA: | |||
| Net asset value, beginning of period | $ 14.06 | $ 10.51 | $11.04 |
| Investment operations: | |||
| Net investment income (loss)(1)(2) | 0.18 | 0.14 | 0.13 |
| Net realized and unrealized gain (loss) on investments | (3.61) | 3.99 | (0.42) |
| Total from investment operations | (3.43) | 4.13 | (0.29) |
| Less distributions from: | |||
| Net investment income | (0.20) | (0.24) | (0.14) |
| Net realized gains | (0.46) | (0.34) | – |
| Paid in capital | – | – | (0.10) |
| Total distributions | (0.66) | (0.58) | (0.24) |
| NET ASSET VALUE, END OF PERIOD | $ 9.97 | $ 14.06 | $10.51 |
| TOTAL RETURN(2)(3) | -24.52%(8) | 39.80% | -2.34% |
| SUPPLEMENTAL DATA AND RATIOS: | |||
| Net assets, end of period (in 000’s) | $ 6,803 | $37,063 | $ 300 |
| Ratio of expenses to average net assets: | |||
| Before expense reimbursement/recoupment(4)(6) | 0.86% | 0.87%(7) | 0.90% |
| After expense reimbursement/recoupment(4)(5) | 0.87% | 0.87%(7) | 0.86% |
| Ratio of net investment income (loss) to average net assets: | |||
| After expense reimbursement/recoupment(4) | 1.51% | 1.09% | 1.32% |
| Portfolio turnover rate(3) | 57% | 68% | 131% |
| (1) | Calculated using the average shares outstanding method. |
| (2) | Total returns and net investment income would have differed had certain expenses not been offset. |
| (3) | Not annualized for periods less than one year. |
| (4) | Annualized for periods less than one year. |
| (5) | Excludes the impact of expense reimbursement/recoupment or fee waivers and expense reductions such as brokerage credits, but includes expense repayments and non-reimbursable expenses, if any, such as interest, taxes, and extraordinary expenses. |
| (6) | Includes reduction from broker recapture amounting to less than 0.01% for the fiscal year ended December 31, 2021, 0.01% for the fiscal year ended December 31, 2020, less than 0.01% for the fiscal year ended December 31, 2019, and 0.01% for the fiscal year ended December 31, 2018. |
| (7) | Such ratio includes recapture of waived/reimbursed fees from prior periods amounting to less than 0.01%. |
| (8) | Includes adjustments in accordance with accounting principles generally accepted in the United States and, consequently, the net asset values for financial reporting purposes and the returns based upon those net asset values may differ from the net asset values and returns for shareholder transactions. |
See Notes to Financial Statements
43
CROMWELL CENTERSQUARE REAL ESTATE FUND
Financial Highlights (Continued)
For a Fund share outstanding throughout the periods
| Year Ended | Year Ended |
| December 31, | December 31, |
| 2019 | 2018 |
| $ 9.56 | $10.43 |
| 0.21 | 0.18 |
| 1.99 | (0.73) |
| 2.20 | (0.55) |
| (0.24) | (0.22) |
| (0.48) | (0.07) |
| – | (0.03) |
| (0.72) | (0.32) |
| $11.04 | $ 9.56 |
| 23.21% | -5.30% |
| $6,441 | $ 278 |
| 0.85% | 0.87% |
| 0.85% | 0.86% |
| 1.87% | 1.75% |
| 76% | 57% |
See Notes to Financial Statements
44
CROMWELL MARKETFIELD L/S FUND
Financial Highlights
For a Fund share outstanding throughout the periods
| Investor Class(1) | |||
| Year Ended | Year Ended | Year Ended | |
| December 31, | December 31, | December 31, | |
| 2022 | 2021 | 2020 | |
| PER SHARE DATA: | |||
| Net asset value, beginning of period | $ 21.62 | $ 19.96 | $ 16.65 |
| Investment operations: | |||
| Net investment income (loss)(2) | 0.11 | (0.02) | (0.16) |
| Net realized and unrealized gain (loss) on investments | 0.50 | 1.68 | 3.47 |
| Total from investment operations | 0.61 | 1.66 | 3.31 |
| Less distributions from: | |||
| Net investment income | (0.10) | – | – |
| Total distributions | (0.10) | – | – |
| NET ASSET VALUE, END OF PERIOD | $ 22.13 | $ 21.62 | $ 19.96 |
| TOTAL RETURN(3) | 2.81% | 8.32% | 19.88% |
| SUPPLEMENTAL DATA AND RATIOS: | |||
| Net assets, end of period (in 000’s) | $46,575 | $47,709 | $42,483 |
| Ratio of expenses to average net assets: | |||
| Before expense reimbursement(4)(5) | 2.44% | 2.58% | 2.75% |
| After expense reimbursement(4)(6) | 2.25% | 2.36% | 2.47% |
| Ratio of net investment income (loss) to average net assets: | |||
| After expense reimbursement(4)(7) | 0.51% | -0.08% | -0.95% |
| Portfolio turnover rate(3)(8) | 40% | 26% | 12% |
| (1) | Prior to March 14, 2022, the Investor Class was known as Class A. |
| (2) | Calculated using the average shares outstanding method. |
| (3) | Not annualized for periods less than one year. |
| (4) | Annualized for periods less than one year. |
| (5) | Expense ratios of expenses to average net assets before waivers and reimbursements of expenses excluding dividend and interest expense on short positions were 1.99%, 2.02%, 2.08%, 2.04%, and 2.01% for the years ended December 31, 2022, 2021, 2020, 2019, and 2018, respectively. |
| (6) | Expense ratios of expenses to average net assets after waivers and reimbursements of expenses excluding dividend and interest expense on short positions were 1.80% for the years ended December 31, 2022, 2021, 2020, 2019, and 2018, respectively. |
| (7) | The net investment income (loss) ratios include dividend and interest expense on short positions. |
| (8) | Consists of long-term investments only; excludes securities sold short and derivative instruments. |
See Notes to Financial Statements
45
CROMWELL MARKETFIELD L/S FUND
Financial Highlights (Continued)
For a Fund share outstanding throughout the periods
| Year Ended | Year Ended |
| December 31, | December 31, |
| 2019 | 2018 |
| $ 14.92 | $ 17.23 |
| 0.04 | (0.05) |
| 1.73 | (2.26) |
| 1.77 | (2.31) |
| (0.04) | – |
| (0.04) | – |
| $ 16.65 | $ 14.92 |
| 11.87% | -13.41% |
| $37,761 | $46,183 |
| 2.94% | 2.73% |
| 2.70% | 2.52% |
| 0.26% | -0.30% |
| 17% | 40% |
See Notes to Financial Statements
46
CROMWELL MARKETFIELD L/S FUND
Financial Highlights (Continued)
For a Fund share outstanding throughout the periods
| Class C | |||
| Year Ended | Year Ended | Year Ended | |
| December 31, | December 31, | December 31, | |
| 2022 | 2021 | 2020 | |
| PER SHARE DATA: | |||
| Net asset value, beginning of period | $ 20.19 | $ 18.78 | $ 15.79 |
| Investment operations: | |||
| Net investment income (loss)(1) | (0.06) | (0.20) | (0.28) |
| Net realized and unrealized gain (loss) on investments | 0.47 | 1.61 | 3.27 |
| Total from investment operations | 0.41 | 1.41 | 2.99 |
| Less distributions from: | |||
| Net investment income | – | – | – |
| Total distributions | – | – | – |
| NET ASSET VALUE, END OF PERIOD | $ 20.60 | $ 20.19 | $ 18.78 |
| TOTAL RETURN(2)(8) | 2.03% | 7.51% | 18.94% |
| SUPPLEMENTAL DATA AND RATIOS: | |||
| Net assets, end of period (in 000’s) | $12,151 | $17,521 | $28,077 |
| Ratio of expenses to average net assets: | |||
| Before expense reimbursement(3)(4) | 3.19% | 3.23% | 3.46% |
| After expense reimbursement(3)(5) | 3.00% | 3.11% | 3.20% |
| Ratio of net investment income (loss) to average net assets: | |||
| After expense reimbursement(3)(6) | -0.31% | -1.00% | -1.74% |
| Portfolio turnover rate(2)(7) | 40% | 26% | 12% |
| (1) | Calculated using the average shares outstanding method. |
| (2) | Not annualized for periods less than one year. |
| (3) | Annualized for periods less than one year. |
| (4) | Expense ratios of expenses to average net assets before waivers and reimbursements of expenses excluding dividend and interest expense on short positions were 2.74%, 2.69%, 2.83%, 2.80%, and 2.76% for the years ended December 31, 2022, 2021, 2020, 2019, and 2018, respectively. |
| (5) | Expense ratios of expenses to average net assets after waivers and reimbursements of expenses excluding dividend and interest expense on short positions were 2.57% for the years ended December 31, 2021, 2020, 2019, and 2018 and 2.55% for the year ended December 31, 2022, respectively. |
| (6) | The net investment income (loss) ratios include dividend and interest expense on short positions. |
| (7) | Consists of long-term investments only; excludes securities sold short and derivative instruments. |
| (8) | Excludes max 1.00% CDSC. |
See Notes to Financial Statements
47
CROMWELL MARKETFIELD L/S FUND
Financial Highlights (Continued)
For a Fund share outstanding throughout the periods
| Year Ended | Year Ended |
| December 31, | December 31, |
| 2019 | 2018 |
| $ 14.22 | $ 16.56 |
| (0.08) | (0.17) |
| 1.65 | (2.17) |
| 1.57 | (2.34) |
| – | – |
| – | – |
| $ 15.79 | $ 14.22 |
| 11.04% | -14.13% |
| $38,675 | $55,958 |
| 3.69% | 3.49% |
| 3.46% | 3.30% |
| -0.53% | -1.08% |
| 17% | 40% |
See Notes to Financial Statements
48
CROMWELL MARKETFIELD L/S FUND
Financial Highlights (Continued)
For a Fund share outstanding throughout the periods
| Institutional Class(1) | |||
| Year Ended | Year Ended | Year Ended | |
| December 31, | December 31, | December 31, | |
| 2022 | 2021 | 2020 | |
| PER SHARE DATA: | |||
| Net asset value, beginning of period | $ 22.03 | $ 20.29 | $ 16.88 |
| Investment operations: | |||
| Net investment income (loss)(2) | 0.18 | 0.03 | (0.12) |
| Net realized and unrealized gain (loss) on investments | 0.50 | 1.71 | 3.53 |
| Total from investment operations | 0.68 | 1.74 | 3.41 |
| Less distributions from: | |||
| Net investment income | (0.15) | – | – |
| Total distributions | (0.15) | – | – |
| NET ASSET VALUE, END OF PERIOD | $ 22.56 | $ 22.03 | $ 20.29 |
| TOTAL RETURN(3) | 3.10% | 8.58% | 20.20% |
| SUPPLEMENTAL DATA AND RATIOS: | |||
| Net assets, end of period (in 000’s) | $101,115 | $90,440 | $91,645 |
| Ratio of expenses to average net assets: | |||
| Before expense reimbursement(4)(5) | 2.19% | 2.33% | 2.47% |
| After expense reimbursement(4)(6) | 2.00% | 2.11% | 2.20% |
| Ratio of net investment income (loss) to average net assets: | |||
| After expense reimbursement(4)(7) | 0.81% | 0.13% | -0.71% |
| Portfolio turnover rate(3)(8) | 40% | 26% | 12% |
| (1) | Prior to March 14, 2022, the Institutional Class was known as Class I. |
| (2) | Calculated using the average shares outstanding method. |
| (3) | Not annualized for periods less than one year. |
| (4) | Annualized for periods less than one year. |
| (5) | Expense ratios of expenses to average net assets before waivers and reimbursements of expenses excluding dividend and interest expense on short positions were 1.74%, 1.78%, 1.83%, 1.80%, and 1.76% for the years ended December 31, 2022, 2021, 2020, 2019, and 2018, respectively. |
| (6) | Expense ratios of expenses to average net assets after waivers and reimbursements of expenses excluding dividend and interest expense on short positions were 1.56% for the years ended December 31, 2021, 2020, 2019, and 2018 and 1.55% for the year ended December 31, 2022, respectively. |
| (7) | The net investment income (loss) ratios include dividend and interest expense on short positions. |
| (8) | Consists of long-term investments only; excludes securities sold short and derivative instruments. |
See Notes to Financial Statements
49
CROMWELL MARKETFIELD L/S FUND
Financial Highlights (Continued)
For a Fund share outstanding throughout the periods
| Year Ended | Year Ended |
| December 31, | December 31, |
| 2019 | 2018 |
| $ 15.14 | $ 17.44 |
| 0.08 | (0.02) |
| 1.75 | (2.28) |
| 1.83 | (2.30) |
| (0.09) | – |
| (0.09) | – |
| $ 16.88 | $ 15.14 |
| 12.13% | -13.25% |
| $105,998 | $163,260 |
| 2.68% | 2.47% |
| 2.44% | 2.27% |
| 0.49% | -0.09% |
| 17% | 40% |
See Notes to Financial Statements
50
CROMWELL FUNDS
Notes to the Financial Statements
December 31, 2022
1. ORGANIZATION
Total Fund Solution (the “Trust”) was organized as a Delaware statutory trust on July 29, 2021. The Trust is registered under the Investment Company Act of 1940, as amended (the “1940 Act”), as an open-end management investment company. The Cromwell CenterSquare Real Estate Fund (“CenterSquare Real Estate Fund”), and Cromwell Marketfield L/S Fund (“Marketfield L/S Fund”) (each a “Fund” and collectively, the “Funds”) are investment companies and therefore follow the investment company accounting and reporting guidance of the Financial Accounting Standards Board (“FASB”) Accounting Standards Codification Topic 946 Financial Services – Investment Companies.
The CenterSquare Real Estate Fund is a non-diversified series with its own investment objectives and policies within the Trust. The investment objective of the Fund is to achieve a combination of income and long-term capital appreciation. The Fund offers three different share classes – Investor Class (previously known as Class N, prior to March 7, 2022), which commenced operations on December 31, 1997, Institutional Class (previously known as Class I, prior to March 7, 2022), and Class Z, each of which commenced operations on February 24, 2017. Each class of shares has identical rights and privileges except with respect to shareholder servicing fees, and voting rights on matters affecting a single share class. Institutional Class shares are subject to a maximum 0.15% shareholder servicing fee. Investor Class shares are subject to a maximum 0.25% shareholder servicing fee. The Fund may issue an unlimited number of shares of beneficial interest with no par value.
The Marketfield L/S Fund is a diversified series with its own investment objectives and policies within the Trust. The investment objective of the Fund is capital appreciation. The Fund offers three different share classes – Investor Class (previously known as Class A, prior to March 14, 2022) and Class C, which each commenced operations on October 5, 2012, and the Institutional Class (previously known as Class I, prior to March 14, 2022), which commenced operations on July 31, 2007. Each class of shares has identical rights and privileges except with respect to Rule 12b-1 and shareholder servicing fees, and voting rights on matters affecting a single share class. Investor Class shares are subject to a maximum 0.25% Rule 12b-1 distribution and shareholder servicing fee. Class C shares may be subject to a deferred sales charge of up to 1.00% and are subject to a 1.00% Rule 12b-1 and shareholder servicing fee. The Fund may issue an unlimited number of shares of beneficial interest with no par value.
51
CROMWELL FUNDS
Notes to the Financial Statements
December 31, 2022 — (Continued)
2. SIGNIFICANT ACCOUNTING POLICIES
The following is a summary of significant accounting policies consistently followed by the Funds in preparation of their financial statements. These policies are in conformity with generally accepted accounting principles in the United States of America (“GAAP”).
Security Valuation – All investments in securities are recorded at their estimated fair value, as described in Note 3.
Federal IncomeTaxes – The Funds comply with the requirements of subchapter M of the Internal Revenue Code of 1986, as amended, necessary to qualify as regulated investment companies and distribute substantially all net taxable investment income and net realized gains to shareholders in a manner which results in no tax cost to the Funds. Therefore, no federal income or excise tax provision is required. As of and during the year ended December 31, 2022, the Funds did not have any tax positions that did not meet the “more-likely-than-not” threshold of being sustained by the applicable tax authority. As of and during the year ended December 31, 2022, the Funds did not have liabilities for any unrecognized tax benefits. The Funds recognize interest and penalties, if any, related to unrecognized tax benefits on uncertain tax positions as income tax expense in the Statement of Operations. As of and during the year ended December 31, 2022, the Funds did not incur any interest or penalties. The Funds are not subject to examination by U.S. tax authorities for tax years prior to the fiscal year ended December 31, 2019.
Security Transactions, Investment Income and Distributions – The Funds follow industry practice and record security transactions on the trade date. Realized gains and losses on sales of securities are calculated on the basis of identified cost. Dividend income is recorded on the ex-dividend date and interest income is recorded on an accrual basis. Withholding taxes on foreign dividends have been provided for in accordance with the Funds’ understanding of the applicable country’s tax rules and regulations. Discounts and premiums on securities purchased are amortized over the expected life of the respective securities using the constant yield method.
The Funds distribute substantially all net investment income and net realized capital gains, if any, at least annually. Distributions to shareholders are recorded on the ex-dividend date. The treatment for financial reporting purposes of distributions made to shareholders during the year from net investment income or net realized capital gains may differ from their treatment for federal income tax purposes. These differences are caused primarily by differences in the timing of the recognition of certain components of income, expense, or realized capital
52
CROMWELL FUNDS
Notes to the Financial Statements
December 31, 2022 — (Continued)
gain for federal income tax purposes. Where such differences are permanent in nature, GAAP requires that they be reclassified in the components of the net assets based on their ultimate characterization for federal income tax purposes. Any such reclassifications will have no effect on net assets, results of operations or net asset value (“NAV”) per share of the Funds.
Distributions received from investments in real estate investment trusts (“REITs”) are comprised of ordinary income, capital gains and return of capital. For financial statement purposes, estimates are used to characterize these distributions received as return of capital, capital gains or ordinary income. Such estimates are based on historical information available from each REIT and other industry sources. These estimates may subsequently be revised and reflected on the Form 1099 received by shareholders based on information received for the security after its tax reporting periods are concluded, as the actual character of these distributions is not known until after the fiscal year end. The distributions received from REITs that have been classified as income and capital gains are included in dividend income and net realized gain (loss) on investments, respectively, on the Statements of Operations. The distributions received that are classified as return of capital reduce the cost of investments on the Statements of Assets and Liabilities.
Foreign Currency – Investment securities and other assets and liabilities denominated in foreign currencies are translated into U.S. dollar amounts at the date of valuation. Purchases and sales of investment securities and income and expense items denominated in foreign currencies are translated into U.S. dollar amounts on the respective dates of such transactions. The Funds do not isolate that portion of the results of operations resulting from changes in foreign exchange rates on investments from the fluctuations arising from changes in market prices of securities held. Such fluctuations are included with the net realized and unrealized gain or loss from investments. The Funds report net realized foreign exchange gains or losses that arise from sales of foreign currencies, currency gains or losses realized between the trade and settlement dates on securities transactions, and the difference between the amounts of dividends, interest, and foreign withholding taxes recorded on the Funds’ books and the U.S. dollar equivalent of the amounts actually received or paid. Net unrealized foreign exchange gains and losses arise from changes in the fair values of assets and liabilities, other than investments in securities at fiscal period end, resulting from changes in exchange rates.
53
CROMWELL FUNDS
Notes to the Financial Statements
December 31, 2022 — (Continued)
Short Sales – A short sale is the sale by a Fund of a security which they do not own in anticipation of purchasing the same security in the future at a lower price to close the short position. A short sale will be successful if the price of the shorted security decreases. However, if the underlying security goes up in price during the period in which the short position is outstanding, a Fund will realize a loss. The risk on a short sale is unlimited because a Fund must buy the shorted security at the higher price to complete the transaction. Therefore, short sales may be subject to greater risks than investments in long positions. With a long position, the maximum sustainable loss is limited to the amount paid for the security plus the transaction costs, whereas there is no maximum attainable price of the shorted security. A Fund would also incur increased transaction costs associated with selling securities short. In addition, a Fund segregates liquid securities at least equal to the fair value of the securities sold short (not including the proceeds from the short sales). Cash deposits by a Fund are presented as deposits at broker on the Statement of Assets and Liabilities and may exceed federally insured limits.
Rule 18f-4 imposes limits on the amount of derivatives a fund can enter into, eliminates the asset segregation framework currently used by funds to comply with Section 18 of the 1940 Act, treats derivatives as senior securities and requires funds whose use of derivatives is more than a limited specified exposure amount to establish and maintain a comprehensive derivatives risk management program and appoint a derivatives risk manager. Effective July 20 the Marketfield L/S Fund has adopted a Full Derivatives Fund Program and the Adviser has nominated a Derivatives Risk Manager.
Allocation of Income, Expenses and Gains/Losses – Income, expenses (other than those deemed attributable to a specific share class), and gains and losses of the Funds are allocated daily to each class of shares based upon the ratio of net assets represented by each class as a percentage of the net assets of each Fund. Expenses deemed directly attributable to a class of shares are recorded by the specific class. Most Fund expenses are allocated by class based on relative net assets. Shareholder servicing fees are expensed at an annual rate up to 0.15% of Institutional Class shares and 0.25% of Investor Class shares for the CenterSquare Real Estate Fund and 12b-1 fees are expensed at annual rate of 0.25% of Investor Class shares and 1.00% of Class C shares of the Marketfield L/S Fund (See Note 5). Trust expenses are typically allocated evenly among the Funds of the Trust, or by other equitable means.
54
CROMWELL FUNDS
Notes to the Financial Statements
December 31, 2022 — (Continued)
Use of Estimates – The preparation of financial statements in conformity with GAAP requires management to make estimates and assumptions that affect the reported amounts of assets and liabilities and disclosure of contingent assets and liabilities at the date of the financial statements and the reported amounts of revenues and expenses during the reporting period. Actual results could differ from those estimates.
3. SECURITIES VALUATION
The Funds have adopted authoritative fair value accounting standards which establish an authoritative definition of fair value and set out a hierarchy for measuring fair value. These standards require additional disclosures about the various inputs and valuation techniques used to develop the measurements of fair value, a discussion in changes in valuation techniques and related inputs during the period and expanded disclosure of valuation Levels for major security types. These inputs are summarized in the three broad Levels listed below:
Level 1 – Unadjusted quoted prices in active markets for identical assets or liabilities that the Funds have the ability to access.
Level 2 – Observable inputs other than quoted prices included in Level 1 that are observable for the asset or liability, either directly or indirectly. These inputs may include quoted prices for the identical instrument on an inactive market, prices for similar instruments, interest rates, prepayment speeds, credit risk, yield curves, default rates and similar data.
Level 3 – Unobservable inputs for the asset or liability, to the extent relevant observable inputs are not available, representing the Funds’ own assumptions about the assumptions a market participant would use in valuing the asset or liability, and would be based on the best information available.
Following is a description of the valuation techniques applied to each Fund’s major categories of assets and liabilities measured at fair value on a recurring basis. Each Fund’s investments are carried at fair value.
Equity Securities – Equity securities that are primarily traded on a national securities exchange shall be valued at the last sale price on the exchange on which they are primarily traded on the day of valuation or, if there has been no sale on such day, at the mean between the bid and ask prices. Securities traded primarily in the NASDAQ Global Market System for which market quotations are readily available shall be valued using the NASDAQ Official Closing Price (“NOCP”). If the NOCP is not available, such securities shall be valued at the last
55
CROMWELL FUNDS
Notes to the Financial Statements
December 31, 2022 — (Continued)
sale price on the day of valuation, or if there has been no sale on such day, at the mean between the bid and ask prices. To the extent these securities are actively traded and valuation adjustments are not applied, they are categorized in Level 1 of the fair value hierarchy. If the market for a particular security is not active, and the mean between bid and ask prices is used, these securities are categorized in Level 2 of the fair value hierarchy.
In the case of foreign securities, the occurrence of events after the close of foreign markets, but prior to the time a Fund’s NAV is calculated will result in an adjustment to the trading prices of foreign securities when foreign markets open on the following business day. The Funds will value foreign securities at fair value, taking into account such events in calculating the NAV. In such cases, use of fair valuation can reduce an investor’s ability to seek to profit by estimating a Fund’s NAV in advance of the time the NAV is calculated.
Corporate Bonds – Corporate bonds, including listed issues, are valued at fair value on the basis of valuations furnished by an independent pricing service which utilizes both dealer-supplied valuations and formula-based techniques. The pricing service may consider recently executed transactions in securities of the issuer or comparable issuers, market price quotations (where observable), bond spreads, and fundamental data relating to the issuer. Most corporate and municipal bonds are categorized in Level 2 of the fair value hierarchy.
U.S. Government & Agency Securities – U.S. government & agency securities are normally valued using a model that incorporates market observable data such as reported sales of similar securities, broker quotes, yields, bids, offers, and reference data. Certain securities are valued principally using dealer quotations. U.S. government and agency securities are categorized in Level 2 of the fair value hierarchy depending on the inputs used and market activity levels for specific securities.
Derivative Instruments – Listed derivatives, including rights and warrants that are actively traded are valued based on quoted prices from the exchange and categorized in Level 1 of the fair value hierarchy. Exchange traded options that are valued at the mean of the highest bid price and lowest ask price across the exchanges where the option is traded are categorized in Level 2 of the fair value hierarchy.
There were no derivative instruments within the Statements of Assets and Liabilities as of December 31, 2022.
56
CROMWELL FUNDS
Notes to the Financial Statements
December 31, 2022 — (Continued)
The effect of derivative instruments on the Statements of Operations for the year ended December 31, 2022 was as follows:
| Amount of Realized Gain (Loss) on Derivatives | ||||
| Marketfield L/S Fund | Recognized in Income | |||
| Purchased | Written | Futures | ||
| Derivatives not accounted for as hedging instruments | Options | Options | Contracts | Total |
| Equity Contracts | $226,647 | $ — | $ — | $226,647 |
| Total | $226,647 | $ — | $ — | $226,647 |
Short-Term Investments – Investments in other mutual funds, including money market funds, are valued at their NAV per share. Deposit accounts are valued at acquisition cost, which approximates fair value. To the extent these securities are actively traded and valuation adjustments are not applied, they are categorized in Level 1 of the fair value hierarchy.
Securities for which market quotations are not readily available, or if the closing price does not represent fair value, are valued at fair value in accordance with Rule 2a-5 of the 1940 Act as determined under the Adviser’s fair value pricing procedures, subject to oversight by the Board of Trustees (the “Board”). These procedures consider many factors, including the type of security, size of holding, trading volume and news events. There can be no assurance that the Fund could obtain the fair value assigned to a security if they were to sell the security at approximately the time at which the Fund determines their net asset values per share. The Adviser will regularly evaluate whether the Fund’s fair value pricing procedures continue to be appropriate in light of the specific circumstances of the Fund and the quality of prices obtained through the application of such procedures.
The inputs or methodology used for valuing securities are not an indication of the risk associated with investing in those securities. The following tables are a summary of the inputs used to value each Fund’s securities as of December 31, 2022:
| CenterSquare Real Estate Fund | Level 1 | Level 2 | Level 3 | Total |
| Real Estate Investment Trusts | $139,216,215 | $ — | $ — | $139,216,215 |
| Short-Term Investments | 457,289 | — | — | 457,289 |
| Total Investments in Securities | $139,673,504 | $ — | $ — | $139,673,504 |
| Marketfield L/S Fund | ||||
| Assets: | Level 1 | Level 2 | Level 3 | Total |
| Common Stocks | $91,798,210 | $ — | $ —(1) | $91,798,210 |
| Exchange-Traded Funds | 10,910,354 | — | —(1) | 10,910,354 |
| Short-Term Investments | 56,541,873 | — | — | 56,541,873 |
| Total Assets | $159,250,437 | $ — | $ — | $159,250,437 |
57
CROMWELL FUNDS
Notes to the Financial Statements
December 31, 2022 — (Continued)
| Liabilities: | ||||
| Securities Sold Short | Level 1 | Level 2 | Level 3 | Total |
| Common Stocks | $23,286,395 | $ — | $ — | $23,286,395 |
| Exchange-Traded Funds | 21,849,222 | — | — | 21,849,222 |
| Real Estate Investment Trusts | 517,212 | — | — | 517,212 |
| Total Liabilities | $45,652,829 | $ — | $ — | $45,652,829 |
(1) For the year ended December 31, 2022, all Level 3 securities held by the Marketfield L/S Fund were valued at $0.
The following is a reconciliation of Level 3 assets for which significant unobservable inputs were used to determine fair value:
| Marketfield L/S Fund | Investments in |
| Securities | |
| Balance as of December 31, 2021 | $ — |
| Purchases | — |
| Sales proceeds | — |
| Realized gain (loss) | — |
| Change in net unrealized appreciation (depreciation) | — |
| Net sales | — |
| Transfers into and/or out of Level 3 | —(1) |
| Balance as of December 31, 2022 | $ — |
| Change in unrealized appreciation/depreciation during the period for Level 3 | |
| investments held at as of December 31, 2022 | (5,459,516) |
| (1) As of December 31, 2022, all transfers into Level 3 were valued at $0. |
The Level 3 investments as of December 31, 2022, represented 0.00% of the Marketfield L/S Fund’s net assets.
Refer to the Schedules of Investments for further information on the classification of investments.
4. INVESTMENT ADVISORY FEE AND OTHER TRANSACTIONS WITH AFFILIATES
The Trust has an agreement with Cromwell Investment Advisors, LLC (the “Adviser”) to furnish investment advisory services to the Funds. For its services, the Funds pay the Adviser a monthly management fee based upon the average daily net assets of the Funds at the following annual rates:
| Fund | |
| CenterSquare Real Estate Fund | 0.60% |
| Marketfield L/S Fund | 1.40% |
58
CROMWELL FUNDS
Notes to the Financial Statements
December 31, 2022 — (Continued)
The Adviser has engaged CenterSquare Investment Management LLC (“CenterSquare”) as the sub-adviser to the CenterSquare Real Estate Fund and Marketfield Asset Management LLC (“Marketfield”) as the sub-adviser of the Marketfield L/S Fund. Subject to the supervision of the Adviser, each Sub-Adviser is primarily responsible for the day-to-day management of a Fund’s portfolio, including purchase, retention and sale of securities. Fees associated with these services are paid to each Sub-Adviser by the Adviser.
Prior to March 7, 2022, AMG Funds LLC (“AMG”) served as the investment adviser of the AMG Managers CenterSquare Real Estate Fund (the “Predecessor CenterSquare Fund”), and CenterSquare served as the investment sub-adviser. AMG was entitled to receive an annual advisory fee based on the average daily net assets of the Predecessor CenterSquare Fund of 0.60%. The sub-adviser fees were paid by AMG.
Prior to March 14, 2022, Marketfield served as the investment adviser of the Marketfield Fund (the “Predecessor Marketfield Fund”). Marketfield was entitled to receive an annual advisory fee based on the average daily net assets of the Predecessor Marketfield Fund of 1.40% on the first $7.5 billion, 1.38% on assets from $7.5 billion to $15 billion, and 1.36% on assets in excess of $15 billion.
The Funds’ Adviser has contractually agreed to waive a portion or all of its management fees and/or reimburse the Funds for their expenses to ensure that total annual operating expenses (excluding contingent deferred sales loads, acquired fund fees and expenses, brokerage commissions, leverage, interest, taxes, dividends or interest expense on short positions, and extraordinary expenses) do not exceed the following rates (based upon the average daily net assets of the Funds):
| Fund | |
| CenterSquare Real Estate Fund – Investor Class | 1.12% |
| CenterSquare Real Estate Fund – Institutional Class | 1.02% |
| CenterSquare Real Estate Fund – Class Z | 0.87% |
| Marketfield L/S Fund – Investor Class | 1.80% |
| Marketfield L/S Fund – Class C | 2.55% |
| Marketfield L/S Fund – Institutional Class | 1.55% |
Fees waived and expenses reimbursed by the Adviser may be recouped by the Adviser for a period of thirty-six months following the month during which such waiver or reimbursement was made if such recoupment can be achieved without exceeding the expense limit in effect at the time the waiver or reimbursement
59
CROMWELL FUNDS
Notes to the Financial Statements
December 31, 2022 — (Continued)
occurred. The Operating Expense Limitation Agreement is indefinite in term, but cannot be terminated within a year after the effective date of the Funds’ prospectus. After that date, the agreement may be terminated at any time upon 60 days’ written notice by the Board or the Adviser with the consent of the Board. During the year ended December 31, 2022, the Adviser was able to recoup $16,213, from the CenterSquare Real Estate Fund relating to fees waived in prior fiscal years. During the period January 1, 2022 through March 6, 2022, AMG was able to recoup $8,056, from the Predecessor CenterSquare Fund relating to fees waived in prior fiscal years. Waived fees and reimbursed expenses subject to potential recovery by month of expiration are as follows:
| January-December | January-December | January- December | |
| Fund | 2023 | 2024 | 2025 |
| Marketfield L/S Fund | $419,893 | $333,716 | $284,167 |
| CenterSquare Real Estate Fund | — | — | — |
Prior to March 7, 2022, AMG had contractually agreed to limit its fees or reimburse expenses (excluding Rule 12b-1 fees, taxes, interest (including interest incurred in connection with bank and custody overdrafts, and in connection with securities sold short), shareholder servicing fees, distribution and service (12b-1) fees, brokerage commissions and other transaction costs, dividends payable with respect to securities sold short, acquired fund fees and expenses and extraordinary expenses) to ensure total annual operating expenses did not exceed 0.87% of the average daily net assets of the Predecessor CenterSquare Fund. Waived fees and reimbursed expenses subject to potential recovery during the months that AMG served as investment manager are eligible for recoupment.
Prior to March 14, 2022, Marketfield had contractually agreed to limit its fees or reimburse expenses (excluding front-end or contingent deferred sales loads, taxes, leverage, interest, brokerage commissions, expenses incurred in connection with any merger or reorganization, dividends or interest expenses on short positions, acquired fund fees and expenses and extraordinary expenses such as litigation) to ensure total annual operating expenses did not exceed 1.80%, 2.57% and 1.56% for Class A, Class C and Class I, respectively. Waived fees and reimbursed expenses subject to potential recovery during the months that Marketfield served as investment manager are eligible for recoupment.
60
CROMWELL FUNDS
Notes to the Financial Statements
December 31, 2022 — (Continued)
Prior to March 7, 2022, Bank of NewYork Mellon (“BNYM”), was the Administrator, Fund Accountant and Transfer Agent for the Predecessor CenterSquare Fund. For the period January 1, 2022 through March 6, 2022, the Predecessor CenterSquare Fund was charged $59,246 and $2,125 for Administration and Fund Accounting fees and Transfer Agent fees, respectively.
U.S. Bancorp Fund Services, LLC (the “Administrator”), doing business as U.S. Bank Global Fund Services, acts as the Funds’ Administrator, Transfer Agent, and Fund Accountant. U.S. Bank N.A. (the “Custodian”) serves as the Custodian to the Funds. The Custodian is an affiliate of the Administrator. The Administrator performs various administrative and accounting services for the Funds. The Administrator prepares various federal and state regulatory filings, reports and returns for the Funds; prepares reports and materials to be supplied to the Trustees; monitors the activities of the Custodian; coordinates the payment of the Funds’ expenses and reviews the Funds’ expense accruals. The officers of the Trust, including the Chief Compliance Officer, are employees of the Administrator. As compensation for its services, the Administrator is entitled to a monthly fee at an annual rate based upon the average daily net assets of the Funds, subject to annual minimums. Fees paid by the Funds for administration and fund accounting, transfer agency, custody and compliance services for the year ended December 31, 2022, are disclosed in the Statements of Operations.
5. DISTRIBUTION & SHAREHOLDER SERVICING FEES
The Marketfield L/S Fund has adopted a Distribution Plan pursuant to Rule 12b-1 (the “Plan”) in the Investor Class and Class C. The Plan permits the Marketfield L/S Fund to pay for distribution and related expenses at an annual rate of 0.25% of the Investor Class average daily net assets and 1.00% of Class C average daily net assets. The expenses covered by the Plan may include the cost of preparing and distributing prospectuses and other sales material, advertising and public relations expenses, payments to financial intermediaries and compensation of personnel involved in selling shares of the Funds. For the year ended December 31, 2022, the Investor Class and Class C of the Marketfield L/S Fund incurred expenses pursuant to the Plan as follows:
| Marketfield L/S Fund | |
| Investor Class | $116,083 |
| Class C | $134,722 |
61
CROMWELL FUNDS
Notes to the Financial Statements
December 31, 2022 — (Continued)
The Predecessor Marketfield Fund had adopted a Plan pursuant to Rule 12b-1 in Class A and Class C. The Plan permitted the Predecessor Marketfield Fund to pay for distribution and related expenses at an annual rate of 0.25% and 1.00% of Class A and Class C shares, respectively. The expenses covered by the Plan may include the cost of preparing and distributing prospectuses and other sales material, advertising and public relations expenses, payments to financial intermediaries and compensation of personnel involved in selling shares of the Funds. For the period January 1, 2022 through March 13, 2022, Class A and Class C incurred expenses of $23,740 and $32,164 respectively, pursuant to the Plan.
The CenterSquare Real Estate Fund has entered into a shareholder servicing agreement (the “Agreement”) with the Adviser, under which the Funds may pay servicing fees at an annual rate of up to 0.15% of the average daily net assets of the Institutional Class and 0.25% of the average daily net assets Investor Class. Payments to the Adviser under the Agreement may reimburse the Adviser for payments it makes to selected brokers, dealers and administrators which have entered into service agreements with the Adviser for services provided to shareholders of the CenterSquare Real Estate Fund. The services provided by such intermediaries are primarily designed to assist shareholders of the Fund and include the furnishing of office space and equipment, telephone facilities, personnel and assistance to the Funds in servicing such shareholders. Services provided by such intermediaries also include the provision of support services to the Funds and include establishing and maintaining shareholders’ accounts and record processing, purchase and redemption transactions, answering routine client inquiries regarding the Funds, and providing such other personal services to shareholders as the Fund may reasonably request. For the year ended December 31, 2022, the Fund incurred shareholder servicing fees as follows:
| CenterSquare Real Estate Fund | |
| Investor Class | $205,721 |
| Institutional Class | $104,101 |
62
CROMWELL FUNDS
Notes to the Financial Statements
December 31, 2022 — (Continued)
6. CAPITAL SHARE TRANSACTIONS
Transactions in shares of the Funds were as follows:
| CenterSquare Real Estate Fund | Marketfield L/S Fund | |||
| Year Ended | Year Ended | Year Ended | Year Ended | |
| December 31, | December 31, | December 31, | December 31, | |
| 2022 | 2021 | 2022 | 2021 | |
| Investor Class(1): | ||||
| Shares sold | 883,715 | 786,944 | 292,257 | 396,711 |
| Shares issued in reinvestment of distributions | 404,231 | 301,576 | 7,858 | — |
| Shares redeemed | (1,694,693) | (2,235,991) | (402,533) | (318,458) |
| Net increase (decrease) | (406,747) | (1,147,471) | (102,418) | 78,253 |
| Class C: | ||||
| Shares sold | — | — | 823 | 1,799 |
| Shares issued in reinvestment of distributions | — | — | — | — |
| Shares redeemed | — | — | (278,889) | (628,747) |
| Net increase (decrease) | — | — | (278,066) | (626,948) |
| Institutional Class(2): | ||||
| Shares sold | 710,120 | 3,840,023 | 1,572,590 | 283,056 |
| Shares issued in reinvestment of distributions | 389,554 | 300,610 | 29,053 | — |
| Shares redeemed | (1,967,031) | (1,670,610) | (1,224,277) | (694,631) |
| Net increase (decrease) | (867,357) | 2,470,023 | 377,366 | (411,575) |
| Class Z: | ||||
| Shares sold | 642,315 | 2,506,564 | — | — |
| Shares issued in reinvestment of distributions | 78,248 | 102,649 | — | — |
| Shares redeemed | (2,674,346) | (1,686) | — | — |
| Net increase (decrease) | (1,953,783) | 2,607,527 | — | — |
| Net increase (decrease) in capital shares | (3,227,887) | 3,930,079 | (3,118) | (960,270) |
| (1) | Prior to March 7, 2022, the CenterSquare Real Estate Fund’s Investor Class shares were known as Class N shares. Prior to March 14, 2022, the Marketfield L/S Fund’s Investor Class shares were known as Class A Shares. |
| (2) | Prior to March 7, 2022 and March 14, 2022, respectively, the CenterSquare Real Estate Fund’s and Marketfield L/S Fund’s Institutional Class shares were known as Class I shares. |
7. INVESTMENT TRANSACTIONS
The aggregate purchases and sales, excluding short-term investments, by Fund for the year ended December 31, 2022, were as follows:
| U.S. Government Securities | Other Securities | |||
| Fund | Purchases | Sales | Purchases | Sales |
| CenterSquare Real Estate Fund | $ — | $ — | $107,229,545 | $151,842,948 |
| Marketfield L/S Fund | — | — | $44,581,595 | $74,945,360 |
63
CROMWELL FUNDS
Notes to the Financial Statements
December 31, 2022 — (Continued)
8. FEDERAL TAX INFORMATION
The aggregate gross unrealized appreciation and depreciation of securities held by the Funds and the total cost of securities for federal income tax purposes at December 31, 2022, were as follows:
| Net | ||||
| Aggregate | Aggregate | Unrealized | Federal | |
| Gross | Gross | Appreciation | Income Tax | |
| Fund | Appreciation | Depreciation | (Depreciation) | Cost |
| CenterSquare Real Estate Fund | $12,281,188 | $(14,027,765) | $(1,746,577) | $141,420,081 |
| Marketfield L/S Fund | $43,342,174 | $(5,456,560) | $37,885,614 | $75,702,868 |
The differences between book-basis and tax-basis unrealized appreciation (depreciation) is attributable primarily to the deferral of wash sale losses.
At December 31, 2022, the components of distributable earnings on a tax-basis were as follows:
| Undistributed | Undistributed | Other | Net Unrealized | Total | |
| Ordinary | Long-Term | Accumulated | Appreciation | Distributable | |
| Fund | Income | Capital Gains | Gains (Losses) | (Depreciation) | Earnings |
| CenterSquare Real | |||||
| Estate Fund | $34,919 | $ — | $(1,636,583) | $(1,746,577) | $(3,348,241) |
| Marketfield L/S Fund | $27,833 | $ — | $(359,483,566) | $37,885,614 | $(321,570,119) |
As of December 31, 2022, the Marketfield L/S Fund had short-term capital losses of $359,483,566, which will be carried forward indefinitely to offset future realized capital gains.
A regulated investment company may elect for any taxable year to treat any portion of any qualified late year loss as arising on the first day of the next taxable year. Qualified late year losses are certain capital, and ordinary losses which occur during the portion of the Fund’s taxable year subsequent to October 31 and December 31, respectively. For the taxable year ended December 31, 2022, the CenterSquare Real Estate Fund deferred $1,636,583 of post-October losses.
64
CROMWELL FUNDS
Notes to the Financial Statements
December 31, 2022 — (Continued)
The tax character of distributions paid during the years ended December 31, 2022 and December 31, 2021, were as follows:
| Ordinary | Long-Term | |||
| Fund | Income* | Capital Gains | Paid-In Capital | Total |
| CenterSquare Real Estate Fund | ||||
| 2022 | $2,806,421 | $6,439,618 | – | $9,246,039 |
| 2021 | $1,874,352 | $7,563,794 | – | $9,438,146 |
| Marketfield L/S Fund | ||||
| 2022 | $877,440 | – | – | $877,440 |
| 2021 | – | – | – | – |
| * | For Federal income tax purposes, distributions of short-term capital gains are treated as ordinary income distributions. |
U.S. GAAP requires that certain components of net assets be reclassified between distributable earnings/(accumulated deficit) and additional paid–in capital. These reclassifications have no effect on net assets or net asset value per share. For the year ended December 31, 2022, the Funds did not make any permanent book–to–tax reclassifications.
10. CONTROL OWNERSHIP
The beneficial ownership, either directly or indirectly, of more than 25% of the voting securities of a fund creates a presumption of control of that fund, under Section 2(a)(9) of the 1940 Act. As of December 31, 2022, National Financial Services, for the benefit of its customers, owned 50.19% of the CenterSquare Real Estate Fund.
11. CREDIT AGREEMENT
Effective July 12, 2022, the Trust established an unsecured line of credit (“LOC”) in the amount of $50,000,000, 20% of a Fund’s gross market value, or 33.33% of the unencumbered assets of a Fund, whichever is less. The LOC matures, unless renewed, on July 11, 2023. The LOC is intended to provide short-term financing, if necessary, subject to certain restrictions and covenants, in connection with shareholder redemptions and other short-term liquidity needs. Interest is charged at the prime rate. The LOC is with the Custodian. The Funds of the Trust have
65
CROMWELL FUNDS
Notes to the Financial Statements
December 31, 2022 — (Continued)
authorized the Custodian to charge any of the accounts of the Funds for any missed payments. As of December 31, 2022 the Fund’s activity under the LOC was as follows:
| Average | Period Maximum | |||
| Principal | Average | Maximum Loan | Loan was | |
| Fund | Balance | Interest Rate | Outstanding | Outstanding |
| CenterSquare Real Estate Fund | $14,995,250 | 7.00% | $15,131,000 | December 5, 2022 |
| Marketfield L/S Fund | — | N/A | — | N/A |
12. RECENT ACCOUNTING PRONOUNCEMENT
In June 2022, the FASB issued Accounting Standards Update 2022-03, which amends Fair Value Measurement (Topic 820): Fair Value Measurement of Equity Securities Subject to Contractual Sale Restrictions (“ASU 2022-03”). ASU 2022-03 clarifies guidance for fair value measurement of an equity security subject to a contractual sale restriction and establishes new disclosure requirements for such equity securities. ASU 2022-03 is effective for fiscal years beginning after December 15, 2023 and for interim periods within those fiscal years, with early adoption permitted. Management is currently evaluating the impact of these amendments on the financial statements.
13. SUBSEQUENT EVENT
Based on a recommendation of the Adviser, on January 30, 2023, the Board of Trustees of the Trust approved converting the Cromwell CenterSquare Real Estate Fund Class Z shares into Institutional Class shares and then closing the Class Z shares of the Fund. Class Z is expected to close on or about February 28, 2023.
Management has performed an evaluation of subsequent events through the date of the financial statements were issued and has determined that no additional items require recognition or disclosure.
66
CROMWELL FUNDS
Report of Independent Registered Public Accounting Firm
December 31, 2022
To the Board of Trustees of Total Fund Solution and the Shareholders of Cromwell CenterSquare Real Estate Fund and Cromwell Marketfield L/S Fund
Opinion on the Financial Statements
We have audited the accompanying statements of assets and liabilities of Cromwell CenterSquare Real Estate Fund (formerly the AMG Managers CenterSquare Real Estate Fund) and Cromwell Marketfield L/S Fund (formerly the Marketfield Fund), each a series of shares of beneficial interest in Total Fund Solution (the “Funds”), including the schedules of investments, as of December 31, 2022, and the related statements of operations and changes in net assets and the financial highlights for the year then ended, and the related notes (collectively referred to as the “financial statements”). In our opinion, the financial statements present fairly, in all material respects, the financial position of the Funds as of December 31, 2022, and the results of their operations, the changes in their net assets and their financial highlights for the year then ended, in conformity with accounting principles generally accepted in the United States of America. The statements of changes in net assets for the year ended December 31, 2021 and the financial highlights for each of the years in the four-year period then ended were audited by other auditors whose reports dated February 24, 2022 for Cromwell CenterSquare Real Estate Fund and February 28, 2022 for Cromwell Marketfield L/S Fund, each expressed an unqualified opinion on such financial statements and financial highlights.
Basis for Opinion
These financial statements are the responsibility of the Funds’ management. Our responsibility is to express an opinion on the Funds’ financial statements based on our audits. We are a public accounting firm registered with the Public Company Accounting Oversight Board (United States) (“PCAOB”) and are required to be independent with respect to the Funds in accordance with the U.S. federal securities law and the applicable rules and regulations of the Securities and Exchange Commission and the PCAOB.
We conducted our audits in accordance with the standards of the PCAOB. Those standards require that we plan and perform the audits to obtain reasonable assurance about whether the financial statements are free of material misstatement, whether due to error or fraud. The Funds are not required to have, nor were we engaged to perform, an audit of their internal control over financial reporting. As part of our audits we are required to obtain an understanding of internal control
67
CROMWELL FUNDS
Report of Independent Registered Public Accounting Firm
December 31, 2022 — (Continued)
over financial reporting but not for the purpose of expressing an opinion on the effectiveness of the Funds’ internal control over financial reporting. Accordingly, we express no such opinion.
Our audits included performing procedures to assess the risk of material misstatement of the financial statements, whether due to error or fraud, and performing procedures that respond to those risks. Such procedures included examining, on a test basis, evidence regarding the amounts and disclosures in the financial statements. Our procedures included confirmation of securities owned as of December 31, 2022 by correspondence with the custodian, brokers, or by other appropriate auditing procedures where replies from brokers were not received. Our audits also included evaluating the accounting principles used and significant estimates made by management, as well as evaluating the overall presentation of the financial statements. We believe that our audits provide a reasonable basis for our opinion.

We have served as the auditor of one or more of the Funds in the Total Fund Solution since 2022.
Philadelphia, Pennsylvania
February 28, 2023
68
CROMWELL FUNDS
Trustees and Officers
December 31, 2022
| Number | |||||
| of | Principal | ||||
| Portfolios | Occupation(s) | ||||
| Term of Office | in Trust | During the | Other Directorships Held | ||
| Name, Address and | Position(s) Held | and Length of | Overseen | Past Five | by Trustee During the |
| Year of Birth | with the Trust | Time Served | by Trustee | Years | Past Five Years |
| Independent Trustees | |||||
| R. Alastair Short | Trustee and Lead | Indefinite Term; | 4 | President, | Independent Director |
| 615 E. Michigan Street | Independent | Since September | Apex Capital | of Contingency Capital | |
| Milwaukee, WI 53202 | 2021 | Corporation | LLC (a global asset | ||
| Year of Birth: 1953 | (personal | management firm) | |||
| investment | from 2021 to present; | ||||
| vehicle). | Trustee, VanEck Funds | ||||
| (mutual fund, 13 series) | |||||
| from 2004 to present; | |||||
| Trustee, VanEck Vectors | |||||
| ETF Trust (mutual fund, | |||||
| 98 series) from 2006 to | |||||
| present; Trustee, VanEck | |||||
| VIP Trust (mutual fund, | |||||
| 7 series) from 2004 | |||||
| to present; Chairman | |||||
| and Independent | |||||
| Director, EULAV Asset | |||||
| Management; Trustee, | |||||
| Kenyon Review; Trustee, | |||||
| Children’s Village. | |||||
| Thomas F. Mann | Trustee | Indefinite Term; | 4 | Private | Director, Virtus Global |
| 615 E. Michigan Street | Since September | Investor (2012 | Multi-Sector Income | ||
| Milwaukee, WI 53202 | 2021 | to present). | Fund from 2011 to 2016; | ||
| Year of Birth: 1950 | Director, Virtus Total | ||||
| Return Fund and Virtus | |||||
| Alternative Solutions | |||||
| Fund from 2012 to 2016; | |||||
| Trustee, Trust for Advisor | |||||
| Solutions/ Hatteras | |||||
| Alternative Mutual Funds | |||||
| Trust (mutual fund) from | |||||
| 2002 to 2019. | |||||
| Julie T. Thomas, CPA | Trustee | Indefinite Term; | 4 | Chief | None. |
| 615 E. Michigan | Since September | Compliance | |||
| Street | 2021 | Officer, Fund | |||
| Milwaukee, WI | Evaluation | ||||
| 53202 | Group, LLC | ||||
| Year of Birth: 1962 | (investment | ||||
| advisory firm) | |||||
| from 2015 to | |||||
| present. |
69
CROMWELL FUNDS
Trustees and Officers
December 31, 2022 — (Continued)
| Number | |||||
| of | |||||
| Portfolios | Principal | ||||
| Term of Office | in Trust | Occupation(s) | Other Directorships | ||
| Name, Address and | Position(s) Held | and Length of | Overseen | During the Past | Held by Trustee During |
| Year of Birth | with the Trust | Time Served | by Trustee | Five Years | the Past Five Years |
| Interested Trustee and Officers | |||||
| Michael Weckwerth | Trustee. | Indefinite Term; | 4 | Senior Vice | Chairman and Interested |
| 615 E. Michigan Street | Chairman, and | Since September | President, | Trustee, Trust for Advisor | |
| Milwaukee, WI 53202 | President | 2021 | U.S. Bancorp | Solutions/ Hatteras | |
| Year of Birth: 1973 | Fund Services, | Alternative Mutual Funds | |||
| LLC (1996 - | Trust (mutual fund) from | ||||
| present). | 2016 to 2018. | ||||
| Elaine E. Richards | Secretary and | Indefinite Term; | N/A | Senior Vice | N/A |
| 615 E. Michigan Street | Vice President | Since September | President, | ||
| Milwaukee, WI 53202 | 2021 | U.S. Bancorp | |||
| Year of Birth: 1968 | Fund Services, | ||||
| LLC (2007 - | |||||
| present). | |||||
| Kyle L. Kroken | Treasurer and | Indefinite Term; | N/A | Vice President, | N/A |
| 615 E. Michigan Street | Vice President | Since November | U.S. Bancorp | ||
| Milwaukee, WI 53202 | 2022 | Fund | |||
| Year of Birth: 1992 | Services, LLC | ||||
| (2009-present). | |||||
| Michael L. Ceccato | Chief | Indefinite Term; | N/A | Senior Vice | N/A |
| 615 E. Michigan St. | Compliance | Since September | President, U.S. | ||
| Milwaukee, WI 53202 | Officer, | 2021 | Bank Global | ||
| Year of Birth: 1957 | Anti-Money | Fund Services | |||
| Laundering | and Senior | ||||
| Officer and Vice | Vice President, | ||||
| President | U.S. Bank | ||||
| N.A. (2008 - | |||||
| present). | |||||
70
CROMWELL FUNDS
Additional Information
December 31, 2022 (Unaudited)
AVAILABILITY OF FUND PORTFOLIO INFORMATION
Each Fund files complete schedules of portfolio holdings with the SEC for the first and third quarters of each fiscal year on Part F of Form N-PORT. The Funds’ Part F of N-PORT are available on the SEC’s website at www.sec.gov and may be reviewed and coped at the SEC’s Public Reference Room in Washington, D.C. For information on the Public Reference Room call 1-800-SEC-0330. In addition, each Funds’ Part F of Form N-PORT is available without charge upon request by calling 1-855-625-7333.
AVAILABILITY OF FUND PROXY VOTING INFORMATION
A description of the Funds’ Proxy Voting Policies and Procedures is available without charge, upon request, by calling 1-855-625-7333. Information regarding how the Funds voted proxies relating to portfolio securities during the most recent 12 month period ended June 30 is available (1) without charge, upon request, by calling 1-855-625-7333, or (2) on the SEC’s website at www.sec.gov.
TAX INFORMATION
For the year ended December 31, 2022, the CenterSquare Real Estate Fund and Marketfield L/S Fund, respectively, designated 4.33% and 100% of its ordinary income distribution as qualified dividend income under the Jobs and Growth Tax Relief Reconciliation Act of 2003.
For the year ended December 31, 2022, for the CenterSquare Real Estate Fund and Marketfield L/S Fund, respectively, 3.68% and 100% of dividends paid from net ordinary income qualified for the dividends received deduction available to corporate shareholders.
For the year ended December 31, 2022, the CenterSquare Real Estate Fund and Marketfield L/S Fund, respectively, designated 0.00% and 0.00% of its taxable ordinary income distributions as short-term capital gain distributions under Internal Revenue Code Section 871(k)(2)(c).
71
CROMWELL FUNDS
Privacy Notice
December 31, 2022 (Unaudited)
The Funds collect non-public personal information about you from the following sources:
• information the Fund receives about you on applications or other forms;
• information you give the Fund orally; and/or
• information about your transactions with the Fund or others.
The Funds do not disclose any non-public personal information about its shareholders or former shareholders without the shareholder’s authorization, except as permitted by law or in response to inquiries from governmental authorities. The Funds may share information with affiliated parties and unaffiliated third parties with whom it has contracts for servicing the Funds. The Funds will provide unaffiliated third parties with only the information necessary to carry out its assigned responsibility. All shareholder records will be disposed of in accordance with applicable law. The Funds maintain physical, electronic and procedural safeguards to protect your non-public personal information and requires third parties to treat your non-public personal information with the same high degree of confidentiality.
In the event that you hold shares of the Funds through a financial intermediary, including, but not limited to, a broker-dealer, bank or trust company, the privacy policy of your financial intermediary governs how your non-public personal information is shared with unaffiliated third parties.
72
[THIS PAGE INTENTIONALLY LEFT BLANK]
73
[THIS PAGE INTENTIONALLY LEFT BLANK]
74
CROMWELL FUNDS
December 31, 2022 (Unaudited)
INVESTMENT ADVISER
Cromwell Investment Advisors, LLC
810 Gleneagles Court, Suite 106
Baltimore, MD 21286
SUB-ADVISERS
CenterSquare Investment Management LLC
630 West Germantown Pike, Suite 300
Plymouth Meeting, PA 19462
Marketfield Asset Management LLC
369 Lexington Avenue, 3rd Floor
New York, NY 10017
DISTRIBUTOR
Foreside Fund Services, LLC
Three Canal Plaza, Suite 100
Portland, ME 04101
CUSTODIAN
U.S. Bank National Association
Custody Operations
1555 North Rivercenter Drive, Suite 302
Milwaukee, WI 53212
ADMINISTRATOR, FUND ACCOUNTANT AND TRANSFER AGENT
U.S. Bancorp Fund Services, LLC
615 East Michigan Street
Milwaukee, WI 53202
INDEPENDENT REGISTERED PUBLIC ACCOUNTING FIRM
BBD, LLP
1835 Market Street, 3rd Floor
Philadelphia, PA 19103
LEGAL COUNSEL
Stradley Ronon Stevens & Young, LLP
2005 Market Street, Suite 2600
Philadelphia, PA 19103
This report should be accompanied or preceded by a prospectus.
The Funds’ Statement of Additional Information contains additional information about the Funds’ trustees and is available without charge upon request by calling 1-855-625-7333.
Item 2. Code of Ethics.
The registrant has adopted a code of ethics that applies to the registrant’s principal executive officer and principal financial officer. The registrant has not made any substantive amendments to its code of ethics during the period covered by this report. The registrant has not granted any waivers from any provisions of the code of ethics during the period covered by this report.
The registrant undertakes to provide to any person without charge, upon request, a copy of its code of ethics by mail when they call the registrant at 1-855-625-7333.
Item 3. Audit Committee Financial Expert.
The registrant’s board of trustees has determined that there is at least one audit committee financial expert serving on its audit committee. Julie Thomas is the “audit committee financial expert” and is considered to be “independent” as each term is defined in Item 3 of Form N-CSR.
Item 4. Principal Accountant Fees and Services.
The registrant has engaged its principal accountant to perform audit services, audit-related services, tax services and other services during the past fiscal year. “Audit services” refer to performing an audit of the registrant's annual financial statements or services that are normally provided by the accountant in connection with statutory and regulatory filings or engagements for those fiscal years. “Audit-related services” refer to the assurance and related services by the principal accountant that are reasonably related to the performance of the audit. “Tax services” refer to professional services rendered by the principal accountant for tax compliance, tax advice, and tax planning. The following table details the aggregate fees billed or expected to be billed for each of the last two fiscal years for audit fees, audit-related fees, tax fees and other fees by the principal accountant.
| FYE 12/31/2022 | FYE 12/31/2021 | |
| ( a ) Audit Fees | $ 21,000 | N/A |
| ( b ) Audit-Related Fees | $ - | N/A |
| ( c ) Tax Fees | $ 6,000 | N/A |
| ( d ) All Other Fees | $ - | N/A |
The audit committee has adopted pre-approval policies and procedures that require the audit committee to pre-approve all audit and non-audit services of the registrant, including services provided to any entity affiliated with the registrant.
The percentage of fees billed by the principal accountant applicable to non-audit services pursuant to waiver of pre-approval requirement were as follows:
| FYE 12/31/2022 | FYE 12/31/2021 | |
| Audit-Related Fees | 0% | N/A |
| Tax Fees | 0% | N/A |
| All Other Fees | 0% | N/A |
All of the principal accountant’s hours spent on auditing the registrant’s financial statements were attributed to work performed by full-time permanent employees of the principal accountant.
(The following table indicates the non-audit fees billed or expected to be billed by the registrant’s accountant for services to the registrant and to the registrant’s investment adviser (and any other controlling entity, etc.—not sub-adviser) for the last two years.
| Non-Audit Related Fees | FYE 12/31/2022 | FYE 12/31/2021 |
| Registrant | $ 6,000 | N/A |
| Registrant’s Investment Adviser | $ - | N/A |
The audit committee of the board of trustees has considered whether the provision of non-audit services that were rendered to the registrant's investment adviser is compatible with maintaining the principal accountant's independence and has concluded that the provision of such non-audit services by the accountant has not compromised the accountant’s independence.
The registrant has not been identified by the U.S. Securities and Exchange Commission as having filed an annual report issued by a registered public accounting firm branch or office that is located in a foreign jurisdiction where the Public Company Accounting Oversight Board is unable to inspect or completely investigate because of a position taken by an authority in that jurisdiction.
The registrant is not a foreign issuer.
Item 5. Audit Committee of Listed Registrants.
Not applicable to registrants who are not listed issuers (as defined in Rule 10A-3 under the Securities Exchange Act of 1934).
Item 6. Investments.
| (a) | Schedule of Investments is included as part of the report to shareholders filed under Item 1 of this Form. |
| (b) | Not Applicable |
Item 7. Disclosure of Proxy Voting Policies and Procedures for Closed-End Management Investment Companies.
Not applicable to open-end investment companies.
Item 8. Portfolio Managers of Closed-End Management Investment Companies.
Not applicable to open-end investment companies.
Item 9. Purchases of Equity Securities by Closed-End Management Investment Company and Affiliated Purchasers.
Not applicable to open-end investment companies.
Item 10. Submission of Matters to a Vote of Security Holders.
There have been no material changes to the procedures by which shareholders may recommend nominees to the registrant’s board of trustees.
Item 11. Controls and Procedures.
| (a) | The Registrant’s President and Treasurer have reviewed the Registrant's disclosure controls and procedures (as defined in Rule 30a-3(c) under the Investment Company Act of 1940 (the “Act”)) as of a date within 90 days of the filing of this report, as required by Rule 30a-3(b) under the Act and Rules 13a-15(b) or 15d-15(b) under the Securities Exchange Act of 1934. Based on their review, such officers have concluded that the disclosure controls and procedures are effective in ensuring that information required to be disclosed in this report is appropriately recorded, processed, summarized and reported and made known to them by others within the Registrant and by the Registrant’s service provider. |
| (b) | There were no changes in the Registrant's internal control over financial reporting (as defined in Rule 30a-3(d) under the Act) that occurred during the period covered by this report that have materially affected, or are reasonably likely to materially affect, the Registrant's internal control over financial reporting. |
Item 12. Disclosure of Securities Lending Activities for Closed-End Management Investment Companies
Not applicable to open-end investment companies.
Item 13. Exhibits.
(2) A separate certification for each principal executive officer and principal financial officer pursuant to Section 302 of the Sarbanes-Oxley Act of 2002. Filed herewith.
(3) Any written solicitation to purchase securities under Rule 23c-1 under the Act sent or given during the period covered by the report by or on behalf of the registrant to 10 or more persons. Not applicable to open-end investment companies.
(4) Change in the registrant’s independent public accountant. There was no change in the registrant’s independent public accountant for the period covered by this report.
| (b) | Certifications pursuant to Section 906 of the Sarbanes-Oxley Act of 2002. Furnished herewith. |
SIGNATURES
Pursuant to the requirements of the Securities Exchange Act of 1934 and the Investment Company Act of 1940, the registrant has duly caused this report to be signed on its behalf by the undersigned, thereunto duly authorized.
(Registrant) Total Fund Solution
By (Signature and Title)*_ /s/ Michael J. Weckwerth______________________
Michael J. Weckwerth
President, Principal Executive Officer, Chairperson and Interested Trustee
Date_________3/8/2023_____________________________________________
Pursuant to the requirements of the Securities Exchange Act of 1934 and the Investment Company Act of 1940, this report has been signed below by the following persons on behalf of the registrant and in the capacities and on the dates indicated.
By (Signature and Title)* ____________/s/ Michael J. Weckwerth____________
Michael J. Weckwerth
President, Principal Executive Officer, Chairperson and Interested Trustee
Date____________3/8/2023________________________________________
By (Signature and Title)* ___/s/ Kyle L. Kroken__________________________
Kyle L. Kroken
Treasurer, Principal Financial and Accounting Officer
Date_________3/8/2023_____________________________________________