UNITED STATES
SECURITIES AND EXCHANGE COMMISSION
Washington, D.C. 20549
FORM 10-K/A
(Amendment No. 1)
(Mark One)
☒ ANNUAL REPORT PURSUANT TO SECTION 13 OR 15(d) OF THE SECURITIES EXCHANGE ACT OF 1934
For the fiscal year ended: December 31, 2023
☐ TRANSITION REPORT PURSUANT TO SECTION 13 OR 15(d) OF THE SECURITIES EXCHANGE ACT OF 1934
For the transition period from ____________ to _____________
Commission File No. 001-41038
| STRAN & COMPANY, INC. |
| (Exact name of registrant as specified in its charter) |
| Nevada | | 04-3297200 |
(State or other jurisdiction of
incorporation or organization) | | (I.R.S. Employer
Identification No.) |
| | | |
| 2 Heritage Drive, Suite 600, Quincy, MA | | 02171 |
| (Address of principal executive offices) | | (Zip Code) |
| 800-833-3309 |
| (Registrant’s telephone number, including area code) |
Securities registered pursuant to Section 12(b) of the Act:
| Title of each class | | Trading Symbol(s) | | Name of each exchange on which registered |
| Common Stock, $0.0001 par value per share | | SWAG | | The Nasdaq Stock Market LLC |
| Warrants, each warrant exercisable for one share of Common Stock, $0.0001 par value per share, at an exercise price of $4.81375 | | SWAGW | | The Nasdaq Stock Market LLC |
Securities registered pursuant to Section 12(g) of the Act: None
Indicate by check mark if the registrant is a well-known seasoned issuer, as defined in Rule 405 of the Securities Act. Yes ☐ No ☒
Indicate by check mark if the registrant is not required to file reports pursuant to Section 13 or Section 15(d) of the Act. Yes ☐ No ☒
Indicate by check mark whether the registrant (1) has filed all reports required to be filed by Section 13 or 15(d) of the Securities Exchange Act of 1934 during the preceding 12 months (or for such shorter period that the registrant was required to file such reports), and (2) has been subject to such filing requirements for the past 90 days. Yes ☒ No ☐
Indicate by check mark whether the registrant has submitted electronically every Interactive Data File required to be submitted pursuant to Rule 405 of Regulation S-T during the preceding 12 months (or for such shorter period that the registrant was required to submit such files). Yes ☒ No ☐
Indicate by check mark whether the registrant is a large accelerated filer, an accelerated filer, a non-accelerated filer, a smaller reporting company, or an emerging growth company. See the definitions of “large accelerated filer,” “accelerated filer,” “smaller reporting company,” and “emerging growth company” in Rule 12b-2 of the Exchange Act.
| | Large accelerated filer | ☐ | Accelerated filer | ☐ |
| | Non-accelerated filer | ☒ | Smaller reporting company | ☒ |
| | | | Emerging growth company | ☒ |
If an emerging growth company, indicate by check mark if the registrant has elected not to use the extended transition period for complying with any new or revised financial accounting standards provided pursuant to Section 13(a) of the Exchange Act. ☐
Indicate by check mark whether the registrant has filed a report on and attestation to its management’s assessment of the effectiveness of its internal control over financial reporting under Section 404(b) of the Sarbanes-Oxley Act by the registered public accounting firm that prepared or issued its audit report. ☐
If securities are registered pursuant to Section 12(b) of the Act, indicate by check mark whether the financial statements of the registrant included in the filing reflect the correction of an error to previously issued financial statements. ☒
Indicate by check mark whether any of those error corrections are restatements that required a recovery analysis of incentive-based compensation received by any of the registrant’s executive officers during the relevant recovery period pursuant to §240.10D-1(b). ☒
Indicate by check mark whether the registrant is a shell company (as defined in Rule 12b-2 of the Act). Yes ☐ No ☒
As of June 30, 2023 (the last business day of the registrant’s most recently completed second fiscal quarter), the aggregate market value of the registrant’s shares of common stock held by non-affiliates (based upon the closing price of such shares as reported on The Nasdaq Stock Market LLC) was $13,484,863.01. Shares held by each executive officer and director and by each person who owned more than 10% of the outstanding shares of common stock have been excluded from the calculation in that such persons may be deemed to be affiliates of the registrant. This determination of affiliate status is not necessarily a conclusive determination for other purposes.
As of March 28, 2024, there were a total of 18,607,329 shares of the registrant’s common stock outstanding.
As of January 17, 2025, there were a total of 18,608,408 shares of the registrant’s common stock outstanding.
DOCUMENTS INCORPORATED BY REFERENCE
None.
EXPLANATORY NOTE
This Amendment No. 1 to Form 10-K/A amends the Annual Report on Form 10-K of Stran & Company, Inc. (the “Company”), for the fiscal year ended December 31, 2023, as filed by the Company with the Securities and Exchange Commission (the “SEC”), on March 28, 2024 (the “Original Filing”).
As previously reported in the Current Report on Form 8-K filed by the Company with the SEC on May 13, 2024, on May 3, 2024, the SEC issued an Order Instituting Public Administrative and Cease-and-Desist Proceedings Pursuant to Section 8A of the Securities Act of 1933, Sections 4C and 21C of the Securities Exchange Act of 1934 and Rule 102(e) of the Commission’s Rules of Practice, Making Findings, and Imposing Remedial Sanctions and a Cease-and-Desist Order (the “Order”), reporting that it had settled administrative and cease-and-desist proceedings against the Company’s prior auditor, BF Borgers CPA PC and its sole audit partner, Benjamin F. Borgers CPA, permanently barring BF Borgers CPA PC and Mr. Borgers from appearing or practicing before the SEC as an accountant. As a result of the Order, BF Borgers CPA PC is not currently permitted to appear or practice before the SEC for the reasons described in the Order. In addition, as a result of the Order, the Company’s financial statements as of and for the years ending December 31, 2023 and December 31, 2022, which were audited by BF Borgers CPA PC, and the Company’s interim financial statements as of and for the periods ending March 31, 2023, June 30, 2023 and September 30, 2023, which were reviewed by BF Borgers CPA PC, may no longer be included in or incorporated into the Company’s filings with the SEC. Effective May 13, 2024, the Audit Committee of the board of directors of the Company (the “Audit Committee”) dismissed BF Borgers CPA PC as the Company’s auditor.
As previously reported in the Current Report on Form 8-K filed by the Company with the SEC on June 20, 2024, on June 15, 2024, the Company engaged Marcum LLP as the Company’s new independent registered public accounting firm with the prior approval of the Audit Committee.
As previously reported in the Current Report on Form 8-K filed by the Company with the SEC on September 16, 2024, the Company commenced the re-audit (the “Re-audit”) of its financial statements as of and for the fiscal year ended December 31, 2023. In connection with the Re-Audit, the Company identified certain accounting errors relating to compliance with U.S. GAAP in connection with the Company’s accounting of certain assets and liabilities as well as acquisition accounting. On September 10, 2024, the Audit Committee, in consultation with the Company’s management, concluded that the Company’s previously issued audited consolidated financial statements and the notes thereto as of and for the fiscal years ended December 31, 2023 and December 31, 2022 included in the Company’s Annual Report on Form 10-K for the fiscal year ended December 31, 2023 that was filed by the Company with the SEC on March 28, 2024, as well as the Company’s previously issued unaudited condensed consolidated financial statements and the notes thereto as of and for the fiscal periods ended March 31, 2022, June 30, 2022, September 30, 2022, March 31, 2023, June 30, 2023, and September 30, 2023 included in the Company’s Quarterly Reports on Form 10-Q for the fiscal periods ended March 31, 2023, June 30, 2023, and September 30, 2023 that were filed by the Company with the SEC on May 15, 2023, August 14, 2023, and November 6, 2023 (collectively, the “Subject Periods”), respectively, require restatement and should not be relied upon. Similarly, any previously issued or filed reports, press releases, earnings releases, investor presentations or other communications of the Company describing the Company’s financial results or other financial information relating to the Subject Periods should no longer be relied upon. Additionally, the reports of BF Borgers CPA PC, the Company’s prior independent registered public accounting firm, on the Company’s consolidated financial statements and the notes thereto as of and for the fiscal years ended December 31, 2023 and December 31, 2022 likewise should no longer be relied upon.
This Annual Report on Form 10-K/A includes financial statements that amend and restate the Company’s financial statements as of and for the fiscal years ended December 31, 2023 and 2022. Refer to Note B to the financial statements included in this Annual Report on Form 10-K/A for a discussion of the restatement and the impact on the specific accounts in such financial statements.
Following the filing of this Annual Report on Form 10-K/A, the Company will file with the SEC its Quarterly Reports for the fiscal quarters ended March 31, 2024, June 30, 2024, and September 30, 2024, which will include financial statements that amend and restate the Company’s financial statements as of and for the three-month periods ended March 31, 2023, as of and for the three- and six-month periods ended June 30, 2023, and as of and for the three- and nine-month periods ended September 30, 2023, and as of December 31, 2023. Refer to Note B to the financial statements included in such Quarterly Reports on Form 10-Q for a discussion of the restatements and the impact on the specific accounts in such financial statements.
In connection with the Re-audit and the resulting restatement of the Company’s financial statements as described above, and pursuant to Rule 10D-1(b) of the Securities Exchange Act of 1934, as amended, Listing Rule 5608 of The Nasdaq Stock Market LLC, and the Company’s Clawback Policy, the Company conducted a recovery analysis of incentive-based compensation received by its executive officers and that was subject to recovery, to ascertain whether any adjustments were required as a result of error corrections to its financial results during the year. Accordingly, Item 11 of the Original Filing is amended to report the results of the recovery analysis, which found that no adjustments to executive compensation were required because the error corrections did not impact any of the measures by which the Company compensated its executives with respect to the compensation received by its executive officers and subject to recovery.
In light of the restatement of the Company’s financial statements, management reassessed its evaluation of the effectiveness of the Company’s disclosure controls and procedures and the Company’s internal control over financial reporting. Based on this assessment, management concluded that disclosure controls and procedures and internal control over financial reporting were not effective as of December 31, 2023. Item 9A. “Controls and Procedures” of this Annual Report on Form 10-K/A has been amended accordingly.
For the convenience of the reader, this Annual Report on Form 10-K/A sets forth the Original Filing in its entirety as amended. This Annual Report on Form 10-K/A does not reflect events occurring after the filing of the Original Filing, or modify or update those disclosures, except as applicable in the Company’s financial statement footnote subsequent event disclosures and related disclosures contained in other items of this filing. The following items of the Original Filing have been amended:
| ● | Part I, Item 1. Business; |
| ● | Part I, Item 1A. Risk Factors; |
| | ● | Part I, Item 2. Properties; |
| ● | Part II, Item 7. Management’s Discussion and Analysis of Financial Condition and Results of Operations; |
| ● | Part II, Item 8. Financial Statements and Supplementary Data; |
| ● | Part II, Item 9A. Controls and Procedures; |
| ● | Part III, Item 10. Directors, Executive Officers and Corporate Governance; |
| ● | Part III, Item 11. Executive Compensation; |
| | ● | Part III, Item 13. Certain Relationships and Related Transactions, and Director Independence; |
| ● | Part III, Item 14. Principal Accountant Fees and Services; and |
| ● | Part IV, Item 15. Exhibit and Financial Statement Schedules. |
This Annual Report on Form 10-K/A has been signed as of the date hereof and all certifications of the Company’s Principal Executive Officer and Principal Financial Officer are given as the date hereof. Accordingly, this Annual Report on Form 10-K/A should be read in conjunction with the Company’s filings made with the SEC subsequent to the filing of the Original Filing, including any amendments to those filings.
Stran & Company, Inc.
Annual Report on Form 10-K/A
Year Ended December 31, 2023
TABLE OF CONTENTS
INTRODUCTORY NOTES
Use of Terms
Except as otherwise indicated by the context and for the purposes of this Annual Report on Form 10-K/A only, references to “we,” “us,” “our,” the “Company,” “Stran,” and “our company” are to Stran & Company, Inc., a Nevada corporation.
Note Regarding Trademarks, Trade Names and Service Marks
We use various trademarks, trade names and service marks in our business, including “STRÄN,” “STRÄN promotional solutions” and “Stran Promotional Solutions”. For convenience, we may not include the ℠, ® or ™ symbols, but such omission is not meant to indicate that we would not protect our intellectual property rights to the fullest extent allowed by law. Any other trademarks, trade names or service marks referred to in this report are the property of their respective owners.
Note Regarding Industry and Market Data
This report includes industry data and forecasts that we obtained from industry publications and surveys including but not limited to certain publications of the promotional products member groups Advertising Specialty Institute (ASI) and the Promotional Products Association International (PPAI), as well as public filings and internal company sources. Industry publications, surveys and forecasts generally state that the information contained therein has been obtained from sources believed to be reliable, but there can be no assurance as to the accuracy or completeness of the included information. Statements as to our ranking, market position and market estimates are based on third-party forecasts, management’s estimates and assumptions about our markets and our internal research. We have not independently verified such third-party information, nor have we ascertained the underlying economic assumptions relied upon in those sources, and we cannot assure you of the accuracy or completeness of such information contained in this report. Such data involve risks and uncertainties and is subject to change based on various factors, including those discussed under Item 1A. “Risk Factors” and “—Note Regarding Forward-Looking Statements” below.
Note Regarding Forward-Looking Statements
This report contains forward-looking statements that are based on our management’s beliefs and assumptions and on information currently available to us. All statements other than statements of historical facts are forward-looking statements. These statements relate to future events or to our future financial performance and involve known and unknown risks, uncertainties and other factors that may cause our actual results, levels of activity, performance or achievements to be materially different from any future results, levels of activity, performance or achievements expressed or implied by these forward-looking statements. Forward-looking statements include, but are not limited to, statements about:
| ● | the expected timing, availability and effects on our stock price and financial condition of our stock repurchase program; |
| ● | our goals and strategies; |
| ● | our business development, financial condition and results of operations; |
| ● | expected changes in our revenue, costs or expenditures; |
| ● | growth and competition trends in our industry; |
| ● | our expectations regarding demand for, and market acceptance of, our products or services; |
| ● | our expectations regarding our relationships with investors, institutional funding sources and other parties with whom we collaborate; |
| ● | our expectations regarding the availability and use of financing from our revolving line of bank credit, other credit facilities, or sales of equity or debt securities; |
| ● | future fluctuations in general economic and business conditions in the markets in which we operate; and |
| ● | future relevant government policies and regulations relating to our industry. |
In some cases, you can identify forward-looking statements by terms such as “may,” “could,” “will,” “should,” “would,” “expect,” “plan,” “intend,” “anticipate,” “believe,” “estimate,” “predict,” “potential,” “project” or “continue” or the negative of these terms or other comparable terminology. These statements are only predictions. You should not place undue reliance on forward-looking statements because they involve known and unknown risks, uncertainties and other factors, which are, in some cases, beyond our control and which could materially affect results. Factors that may cause actual results to differ materially from current expectations include, among other things, those listed under Item 1A. “Risk Factors” and elsewhere in this report. If one or more of these risks or uncertainties occur, or if our underlying assumptions prove to be incorrect, actual events or results may vary significantly from those implied or projected by the forward-looking statements. No forward-looking statement is a guarantee of future performance.
In addition, statements that “we believe” and similar statements reflect our beliefs and opinions on the relevant subject. These statements are based upon information available to us as of the date of this report, and while we believe such information forms a reasonable basis for such statements, such information may be limited or incomplete, and our statements should not be read to indicate that we have conducted an exhaustive inquiry into, or review of, all potentially available relevant information. These statements are inherently uncertain and investors are cautioned not to unduly rely upon these statements.
The forward-looking statements made in this report relate only to events or information as of the date on which the statements are made in this report. Except as expressly required by the federal securities laws, there is no undertaking to publicly update or revise any forward-looking statements, whether as a result of new information, future events, changed circumstances or any other reason.
Summary of Risk Factors
The following is a summary of material risks that could affect our business. This summary may not contain all of our material risks, and it is qualified in its entirety by the more detailed risk factors set forth under “Item 1A. Risk Factors”.
| ● | Shortages of supply of merchandise from suppliers, interruptions in our manufacturing, and local conditions in the countries in which we source goods and materials could adversely affect our results of operations. |
| ● | Increases in the price of merchandise and raw materials used to manufacture our products could materially increase our costs and decrease our profitability. |
| ● | Our customers may cancel or decrease the quantity of their orders, which could negatively impact our operating results. |
| ● | We may be unable to identify or to complete acquisitions or to successfully integrate the businesses we acquire. |
| ● | If our information technology systems suffer interruptions or failures, including as a result of cyberattacks, our business operations could be disrupted and our reputation could suffer. |
| ● | We rely on software and services from other parties. Defects in or the loss of access to software or services from third parties could increase our costs and adversely affect the quality of our products. |
| ● | Failure to comply with data privacy and security laws and regulations could adversely affect our operating results and business. |
| ● | The Consumer Product Safety Improvement Act and other existing or future government regulation could harm our business or may cause us to incur additional costs associated with compliance. |
| ● | We are subject to international, federal, national, regional, state, local and other laws and regulations, and failure to comply with them may expose us to potential liability. |
| ● | Implementation of technology initiatives could disrupt our operations in the near term and fail to provide the anticipated benefits. |
| ● | Inability to attract and retain key management or other personnel could adversely impact our business. |
| ● | Failure to preserve positive labor relationships with our employees could adversely affect our results of operations. |
| ● | We are exposed to the risk of non-payment by our customers on a significant amount of our sales. |
| ● | There is a risk of dependence on one or a group of customers. |
| ● | Our business incurs significant freight and transportation costs. Any changes in our shipping arrangements or any interruptions in shipping could harm our business, results of operations and financial condition. |
| ● | Our business may be impacted by unforeseen or catastrophic events, including the emergence of pandemics or other widespread health emergencies, terrorist attacks, extreme weather events or other natural disasters and other unpredicted events. |
| ● | We face intense competition within our industry and our revenue and/or profits may decrease if we are not able to respond to this competition effectively. |
| ● | We face intense competition to gain market share, which may lead some competitors to sell substantial amounts of goods at prices against which we cannot profitably compete. |
| ● | Global, national or regional economic slowdowns, high unemployment levels, fewer jobs, changes in tax laws or cost increases might have an adverse effect on our operating results. |
| ● | The promotional products, trade show and events marketplace, loyalty and program management business industries are subject to pricing pressures that may cause us to lower the prices we charge for our products and services that adversely affect our financial performance. |
| ● | Changes to trade regulation, quotas, duties, tariffs or other restrictions caused by the changing U.S. and geopolitical environments or otherwise, such as those with respect to China, may materially harm our revenue and results of operations, such as by increasing our costs and/or limiting the amount of products that we can import. |
| ● | The apparel industry, including corporate identity apparel, is subject to changing fashion trends and if we misjudge consumer preferences, the image of one or more of our brands may suffer and the demand for our products may decrease. |
| ● | Climate change impacts including supply chain disruptions, operational impacts, and geopolitical events may impact our business operations. |
| ● | Our success depends upon the continued protection of our intellectual property rights and we may be forced to incur substantial costs to maintain, defend, protect and enforce our intellectual property rights. |
| ● | Increased focus by governments, vendors, stockholders, and customers on sustainability issues, including those related to climate change, may have a material adverse effect on our business and operations. |
| ● | Some of the products that we design or otherwise assist customers with producing create exposure to potential product liability, warranty liability or personal injury claims and litigation. |
| ● | Defects in the products that we design or otherwise assist customers with producing could reduce demand for our products and result in a decrease in sales and market acceptance and damage to our reputation. |
| ● | We may be subject to periodic litigation in both domestic and international jurisdictions that may adversely affect our financial position and results of operations. |
| ● | Volatility in the global financial markets could adversely affect results. |
| ● | Failure to achieve and maintain effective internal control over financial reporting could adversely affect our business and price of our securities. |
| ● | Increases in the cost of employee benefits could impact our financial results and cash flow. |
| ● | Adverse developments affecting the financial services industry, such as actual events or concerns involving liquidity, defaults, or non-performance by financial institutions or transactional counterparties, could adversely affect our current and projected business operations and our financial condition and results of operations. |
| ● | We have restated our financial statements. The restatement has consumed a significant amount of management time and resources and may continue to do so. In addition, the restatement may subject us to a number of additional risks and uncertainties, including the increased possibility of legal proceedings and could adversely impact our operations. |
| ● | We may recognize impairment charges, which could adversely affect our financial condition and results of operations. |
| ● | If we are unable to accurately predict our future tax liabilities, become subject to increased levels of taxation or our tax contingencies are unfavorably resolved, our results of operations and financial condition could be adversely affected. |
PART I
ITEM 1. BUSINESS.
Overview
We are an outsourced marketing solutions provider, working closely with our customers to develop sophisticated marketing programs that leverage our promotional products and loyalty incentive expertise. We develop long-term relationships with our customers, enabling them to connect with both their customers and employees in order to build lasting brand loyalty. It is our mission to drive brand awareness and affect behavior through visual, creative, and technology solutions.
We purchase products and branding through various third-party manufacturers and decorators and resell the finished goods to customers. In addition to selling branded products, we offer our clients custom sourcing capabilities; a flexible and customizable e-commerce solution for promoting branded merchandise and other promotional products, managing promotional loyalty and incentives, print collateral, and event assets, order and inventory management, and designing and hosting online retail popup shops, fixed public retail online stores, and online business-to-business service offerings; creative and merchandising services; warehousing/fulfillment and distribution; print-on-demand; kitting; point of sale displays; and loyalty and incentive programs.
These valuable services, as well as the deep level of commitment we have to the business operations of our customers, have resulted in a strong and stable position within the industry.
We specialize in managing complex promotional marketing programs to help recognize the value of promotional products and branded merchandise as a tool to drive awareness, build brands and impact sales. This form of advertising is very powerful and impactful and particularly effective at building brand loyalty because it typically uses products that are considered useful and appreciated by recipients and are retained and used or seen repeatedly, repeating the imprinted message many times without adding cost to the advertiser. We have built the tools, processes, relationships and the blueprint to maximize the potential of these products and deliver the most value to our customers.
For over 28 years we have grown into a leader in the promotional products industry, ranking 24th on PPAI’s Top 100 Distributors 2023 list and 34th on ASI’s Top 40 Distributors 2023 list. Our co-founder and Chief Executive Officer and President, Andrew Shape, was also recently named 2023 Person of the Year by promotional products industry periodical Counselor. Since our first year of operations in 1995, our annual revenues have gradually grown from approximately $240,000 to approximately $76.0 million in 2023, a compound annual growth rate of approximately 22.8%, and between 2018 and 2023, our revenues grew at a compound annual growth rate of approximately 25.5%. During 2018 through 2023, we had consistent gross margins of approximately 30%, and processed more than 50,000 customer orders per year.
As of December 31, 2023, we had total assets of $49.0 million with total stockholders’ equity of $35.7 million.
We serve a highly diversified customer base across many industry verticals including pharmaceutical and healthcare, manufacturing, technology, finance, construction and consumer goods. Many of our customers are household names and include some of the largest corporations in the world.
Our sales increased 31.3% year-over-year in 2023 compared to 2022, which we believe was primarily due to higher spending from existing clients as well as business from new customers. Additionally, we benefited from the acquisition of the G.A.P. Promotions, LLC, or G.A.P. Promotions, assets in January 2022, the assets of Trend Promotional Marketing Corporation (d/b/a Trend Brand Solutions), or Trend Brand Solutions, in August 2022, the assets of Premier Business Services, or Premier NYC, in December 2022, and T R Miller Co., Inc., or T R Miller, in June 2023, respectively.
Our headquarters are located at Quincy, Massachusetts, with additional offices located in Warsaw, Indiana; Mt. Pleasant, South Carolina; Walpole, Massachusetts; and Tomball, Texas. We also have sales representatives in 20 additional locations across the United States and a network of service providers in the U.S. and abroad, including factories, decorators, printers, logistics firms, and warehouses.
Our Industry
Overview of Promotional Products Market
The promotional products industry is large yet highly-fragmented, with thousands of smaller participants and indications of a lack of market power in any one firm or group of firms. The industry has generally experienced growth as businesses continuously invest in sophisticated marketing campaigns involving multiple types of advertising. Promotional products are items used to promote a product, service or company program including advertising specialties, premiums, incentives, business gifts, awards, prizes, commemoratives and other imprinted or decorated items. They are usually given away by companies to consumers or employees. The largest promotional products trade organizations are the Advertising Specialty Institute (ASI) and Promotional Products Association International (PPAI).
U.S. Promotional Products is a Large and Growing Market
According to ASI, the market for promotional products sales reached a record high of $26.1 billion in 2023. Moreover, the promotional products market is only one segment of a total addressable market of possibly up to $406 billion, based on the size of the promotional products market ($26.1 billion in 2023 according to ASI); the product packaging market ($185 billion as of 2021, according to Mordor Intelligence, a leading market intelligence and advisory firm); the loyalty incentive programs market ($90 billion annually according to the Incentive Marketing Association, the umbrella organization for suppliers in the incentive marketplace); the printing market ($83 billion projected for 2023, according to IBISWorld, an industry research provider); and the trade show and conference planning market ($22 billion projected for 2023, according to IBISWorld).
The Promotional Products Industry Is Resilient To Other Forms of Advertising
The promotional products industry is relatively insulated from other forms of advertising such as television and digital advertising. Although promotional products compete for space within an advertising budget with other forms of advertising, particularly online advertising, they offer distinct benefits, particularly due to their physical nature, which may help distributors and suppliers continue to sell these products and related services despite these budgetary pressures. Data shows that promotional products are more effective in generating brand recognition and sales than other forms of advertising, including television and online advertisements. These factors help shield established industry firms like ours from the technological and competitive disruption experienced by other types of media advertisers.
The Promotional Products Industry is Highly Fragmented
The promotional products industry is also highly fragmented. As of 2023, the firm with the greatest percentage of industry sales generated $1.3 billion in sales but made up only approximately 5.1% of the $26.1 billion in sales generated in 2023 by promotional products distributors, based on information reported by ASI and the firm itself. There are only two firms that have reported achieving sales above $1.0 billion in 2023. As a group, the top 40 distributors had approximately 37.5% market share as of 2022, based on total sales of approximately $9.7 billion out of total promotional products distributors’ revenues for 2022 of $25.8 billion, based on ASI’s reports.
Unlike our company, which provides comprehensive solutions to complex promotional and branding challenges, we view most of our competitors as generally falling into one of the five categories below:
| ● | Online e-tailer. Heavily rely on marketing and online advertising to sell directly to businesses, offering little or no strategic support or program infrastructure. |
| ● | Franchise Model. Consists of many smaller firms or independent representatives without a consistent strategic vision. They do not offer consistent pricing and have fragmented service capabilities. |
| ● | Large and Inflexible. Focus on large enterprise customers, struggling to serve the needs of smaller spend opportunities (less than $3 million annually). They tend to lack in delivering a high level of service and are limited in their ability to react to changes in the market. |
| ● | Non-Core Offering. Offer promotional merchandise as an add-on to their core business or have grown through acquisition without any unification strategy. |
| ● | Small Mom-and-Pop. Have little or no infrastructure or executive oversight. Do not have the financial backing, technology, or infrastructure to support growth or ability to execute comprehensive marketing programs or large opportunities. |
Promotional Products are a High-impact, Cost-effective Advertising Medium
Because promotional products are useful and appreciated by recipients, they are retained and used, repeating the imprinted message many times without added cost to the advertiser. ASI’s Global Ad Impressions Study, 2023 Edition, reported:
| ● | Promotional products are the most highly regarded form of advertising, more than newspapers, radio, magazine, television, internet, or mobile ads. |
| ● | Up to 85% of promotional products recipients remember the advertiser worldwide. |
| ● | Over 60% of consumers who received outwear and drinkware as promotional products report they would keep the items for two years or longer, suggesting that businesses using promotional products may generate long-term revenues and other valuable goodwill from them. |
In 2018, PPAI reported that promotional products are the most impactful form of advertising across all generations. Whereas reportedly less than 55% of consumers read or watch an entire advertisement online, in an email, on television, in the mail, in a magazine, or on the radio, over 80% of consumers retain promotional products. Moreover, promotional products have been ranked the most effective form of advertising across all generations, outranking even television, online, print, and mobile forms. A 2019 PPAI report revealed additional statistics reflecting the significant impact of promotional products on consumers:
| ● | 96% of consumers like to know ahead of time when companies offer promotional products. |
| ● | Eight out of ten consumers enjoy receiving promotional products. |
| ● | Seven in ten consumers would like to receive promotional products more often. |
| ● | 79% of consumers, including over a third of Millennials and 20% of Generation Z consumers, pass on promotional products that they no longer want, increasing their potential reach and effectiveness. |
Nearly all consumers say they would go out of their way to receive promotional products.
As of 2016, PPAI reported that, overall, buyers consider promotional products mostly or always effective in achieving marketing goals. They generally consider promotional products more effective than social media and nearly as effective as all other media. Data indicates that the majority of buyers do have a budget set aside for promotional products. However, for more than 72% the allocation is less than 20% of their marketing advertising budget. When asked what their plans were for promotional products spend over the next 12 months, only 3% projected a decrease in product purchases. This data suggests that the potential for promotional products’ market growth is significant.
Competitive Strengths
We believe our key competitive strengths include:
| ● | Superior and Distinctive Technology. We have invested in sophisticated, efficient ordering and logistics technology that provides order processing, warehousing and fulfillment functions. We continue to invest in our technology infrastructure, including many customized solutions developed on Adobe Inc. (“Adobe”)’s open-source e-commerce platform, Magento Open Source. We have also invested in an internal commercial Enterprise Resource Planning (ERP) system, Oracle/NetSuite’s NetSuite ERP, which is expected to enhance the process of gathering and organizing the business data of our company through an integrated software suite, and is expected to be implemented in the second half of 2024. Additional NetSuite phases will be planned and rolled out in subsequent years. |
| ● | Leading Market Position. Our over 28 years’ history and size make us a leader in the U.S. promotional products industry. We believe that the key benefits of our scale include an ability to efficiently implement large and intensive programs; an ability to invest in sales tools and technologies to support our customers; and operating efficiencies from our scalable infrastructure. We believe our market position and scale enhances our ability to increase sales to existing customers, attract new customers and enter into new markets. |
| ● | Extensive Network. We have developed a deep network of collaborator factories, decorators, printers, and warehouses around the globe. This network helps us find the right solution to meet our customers’ needs, whether they are financial, timing, geographic, or brand goals. This model provides the flexibility to proactively manage our customers’ promotional needs efficiently. As a result, we believe that we have an excellent reputation with our customers for providing a high level of prompt customer service. |
| ● | Customer-Centric Approach. Our customer-centric approach is what has fueled our growth since our inception and our early adoption of technology to solve challenges for our clients set us apart in our early growth. We strive to understand the goals and challenges that our customers face, building unique solutions and seeing each campaign through to completion as an extension of their team. |
| ● | Diversified Customer Base. We sell our products to over 2,000 active customers and over 30 Fortune 500 companies, including long-standing programs with recurring revenue coming from well recognized brands and companies. Our largest customer accounted for 13.4% and 9.0% of overall revenue during 2023 and 2022, respectively. Our top 10 customers in 2023 and 2022 contributed 46.4% and 44.7% of revenue, respectively. Our customers span many industries, including pharmaceutical and healthcare, manufacturing, technology, finance, construction and consumer goods. |
| ● | Experienced Senior Management Team. Our senior management team, led by our co-founder and Chief Executive Officer and President, Andrew Shape, is comprised of seasoned industry professionals and veterans of our company. Our senior management has an average of over 20 years of experience in the promotional products industry. |
| ● | Asset Acquisition Experience. We have made five acquisitions over the past three and a half years through asset purchase agreements. In September 2020, we acquired all of the customers of the promotional products business Wildman Imprints, the former promotional products business division of Wildman Business Group, LLC, in an asset purchase. In 2019, that business recorded over $10 million in revenue. In January 2022, we purchased the promotional products business and assets of G.A.P. Promotions, with 2021 revenue of approximately $7.2 million. In August and December, 2022, we also acquired the promotional products businesses and assets of Texas-based Trend Brand Solutions and New York-based Premier NYC, respectively. In June 2023, we also acquired the promotional products business and assets of Massachusetts-based T R Miller. We continue to explore and pursue additional acquisition opportunities that are appropriate. Please see “—Growth Strategies – Selectively Pursue Acquisitions” below for a discussion of our asset acquisition experience and strategy. |
Growth Strategies
The key elements of our strategy to grow our business include:
| ● | Selectively Pursue Acquisitions. We believe that we are well-suited to capitalize on opportunities to acquire businesses with key customer relationships or have other value-added products or services that complement our current offerings. Our acquisition strategy consists of increasing our share in existing markets, adding a presence in new or complementary regions, utilizing our scale to realize cost savings, and acquiring businesses offering synergistic services such as printing, packaging, point of sale (POS) displays, loyalty and incentive program management, and decoration, or offering additional differentiators. In September 2020, we acquired all the customer account managers and customer accounts of the promotional products business Wildman Imprints in Warsaw, Indiana. As a result, we gained approximately over 1,400 customer accounts, including over 120 customer programs with higher repeat-business potential; 20 additional employees; inventory worth approximately $650,000; and additional revenues of over $10 million as of 2019. This acquisition allowed us to extend our geographical reach into the Midwest and further diversify our customer base. In January 2022, we acquired the promotional products business and assets of G.A.P. Promotions in Gloucester, Massachusetts. From this acquisition, we expanded our major beverage-specific customer accounts; hired 13 additional employees; gained inventory worth approximately $90,000; and gained a business with sales of approximately $7.2 million as of 2021. In August 2022, we acquired the promotional products business and assets of Trend Brand Solutions in Houston-area Tomball, Texas. From this acquisition, we diversified and expanded our customers’ geographic accounts; gained eight additional employees; acquired inventory worth approximately $124,000; obtained a warehouse with kitting and fulfillment capabilities; and gained a business with annualized sales of approximately $3 million as of 2022. In December 2022, we acquired the promotional products business and assets of Premier NYC in Larchmont, New York. From this acquisition, we acquired a business with annualized sales of approximately $2 million as of 2022 and a number of noteworthy customers including several large law firms and a national stock exchange. In June 2023, we acquired the promotional products business and assets of T R Miller in Walpole, Massachusetts. From this acquisition, we acquired a business with in-house decoration and fulfillment capabilities with sales of approximately $20.4 million for its fiscal year ended June 30, 2022; obtained an approximately 25,000 square foot distribution and processing center; gained 29 additional employees and contractors; acquired inventory worth approximately $0.2 million; and acquired customer accounts for noteworthy clients including a major accounting firm, a major insurance provider, a large sportswear manufacturer, a leading beverage and coffeemaker conglomerate, and an online food ordering and delivery platform. |
We believe that this experience will help us to pursue suitable acquisition opportunities in the future and integrate them successfully. Consistent with this strategy, we continue to evaluate potential acquisition targets, particularly with the following attributes:
| o | Geographic balance, with a focus on acquiring a company in the branded merchandise space based in the western United States (including Texas, California, Colorado, Oregon, or Washington state) in the $5-10 million revenue range; |
| o | Smaller promotional companies in the $2-5 million revenue range who lack the programmatic capabilities but have a minimum of 30% gross margins and comparable or improved profitability; and |
| o | Businesses with complimentary offerings to increase Stran’s portfolio of services and depth of expertise in these additional industries: Packaging; Loyalty & Incentive; Decorators (for screen printer, embroidery, direct-to-garment, rub-on transfers, etc.); and Event/Tradeshow Services. |
| ● | Innovate and Invest in Technology. We continue to invest in upgrades to our platform for customers’ promotional e-commerce objectives, including customizable and scalable features, developed on Adobe’s open-source e-commerce platform, Magento Open Source. We have also invested in an internal commercial ERP system, NetSuite ERP, which is expected to enhance the process of gathering and organizing the business data of our company through an integrated software suite, and is expected to be implemented in the second half of 2024. Additional NetSuite phases will be planned and rolled out in subsequent years. We believe that it is necessary to continue focusing on the buildout of our technology offerings in order to meet the evolving needs of our customers. Additionally, our strong technology platform will support our acquisition strategy to integrate acquired businesses into our existing platforms. We intend to continue making significant investments in research and development and hiring top technical talent. |
| ● | New Client Development. Our sales and marketing teams are tasked with continuously growing their books of business by nurturing existing business relationships while actively seeking new opportunities with new customers. We will continue to promote and ask for referrals from satisfied customers who often refer us to other potential clients. We continuously seek to build our sales forces through hiring of experienced individuals with established books of business as well as hiring less-experienced individuals that we hope to develop into productive sales representatives. As we continue to grow, we are hiring sales representatives in different geographies across the U.S. that further diversify our customer base and attract new customers. Currently we have employees or sales reps located in offices or remotely in Colorado, Connecticut, Florida, Georgia, Illinois, Indiana, Maryland, Massachusetts, Michigan, Minnesota, Nevada, New Hampshire, New Jersey, New York, North Carolina, Ohio, Pennsylvania, Rhode Island, South Carolina, and Texas. We will continue to build sales and marketing campaigns to promote Stran, including social media, search engine optimization (SEO), HubSpot Inbound Marketing, and other alternative platforms. We also plan to continue to identify and exhibit at appropriate tradeshows, conferences, and events where we have had success. |
| ● | Develop and Penetrate Customer Base. We plan to further expand and leverage our sales force and broad product and service offering to upsell and cross-sell to both develop new clients and further penetrate our existing customer base. Many of our services work together and build on each other to offer greater control and consistency of our customers’ brands as well as improved efficiency and ease of use for their team. Our goal is to become an extension of our customers’ team and to support their organizations in using physically branded products in the most effective means possible. For example, we can offer a one-stop solution for all tradeshow and event asset management objectives. From pre-show mailings to special event materials, we can help design as well as produce and manage all tradeshow materials and processes from start to finish. With multiple warehouses strategically located throughout the United States, we offer logistics solutions and expertise to effectively fulfill customers’ events needs across the country. The internal inventory-management version of our e-commerce platform provides the ability to manage not only a customer’s assets for its booth or event setup, but also its literature, giveaways, and more. We will ship out all assets with return labels for post-show logistics and establish standard operating procedures for every asset to be returned back into inventory. |
Other strategies that we plan to implement to expand our customer base with expanded sales staff and technology resources include:
| o | Convert Transactional Customers to Programs. The majority of our revenue is derived from program business, although only a small percentage of our customers are considered programmatic. For the years 2023 and 2022, program clients accounted for 81.4% and 76.8% of total revenue, respectively. Less than 350 of our more than 2,000 active customers are considered to be program clients. With a larger sales force and other resources, we believe we can convert more of our customer base from transactional customers into program clients with much greater revenue potential. We define transactional customers as customers that place an order with us and do not have an agreement with us covering ongoing branding requirements. We define program clients as clients that have a contractual obligation for specific ongoing branding needs. Program offerings include ongoing inventory, use of technology platform, warehousing, creative services, and additional client support. Program customers are typically geared towards longer-lasting relationships that help secure recurring revenue well into the future. |
| o | Strengthen Marketing and Social Media Outreach. We plan to expand sales and marketing tools and campaigns to promote the Company, and enhancing our digital marketing efforts, including paid search advertising, search engine optimization (SEO), social media platforms, such as Instagram and LinkedIn, and other alternative marketing platforms. |
| o | Tradeshows and Events. We plan to increase our exhibitor presence at appropriate shows and events such as ProcureCon Marketing, Association of National Advertisers Brand Masters Conference, Association of National Advertisers Masters of B2B Conference, National Beer Wholesalers Association (NBWA), Wine and Spirits Wholesalers of America: AccessLive, Bar Convent Brooklyn, New England Cannabis Convention (NECANN), Marijuana Business Conference and Cannabis Expo (MJBizCon). |
| o | Extend Relationships. We plan to identify and approach more print, fulfillment, and agency collaborators to sell into their customer base. |
| o | Referrals. We believe we will generate more customer referrals by offering an enhanced loyalty and customer incentive program. |
Products and Services
Overview
Since our inception over 28 years ago, we have provided clients with marketing services that help drive sales, and make an impact using custom-branded merchandise, commercial print, loyalty and incentive programs, packaging and point of sale solutions while providing a technology solution to deliver these products and services efficiently via our warehouse and fulfillment system.
Our value to our customers is to be an extension of their own teams. We work to understand the different business and marketing goals of each customer and provide solutions that incorporate technology, human capital, and physical branded goods to solve their business challenges. This model of outsourced combined marketing and program-management services is unique in the promotional products industry, which is dominated by online e-tailers, franchisees, and mom-and-pop businesses. To achieve this value, we have built the internal resources, knowledge, and processes to support our clients with more than just commodity items.
We are both program managers and creative marketers, having developed multiple teams within our organization to specialize and focus our efforts on supporting customers with the specific support that they need:
| ● | Operations and e-commerce teams create custom-tailored technology solutions that enable our clients to view, manage and distribute branded merchandise to their appropriate audience in an efficient and cost-effective manner. |
| ● | Account teams work with client stakeholders to understand goals, objectives, marketing and human-resources initiatives, and the ongoing management of the account. |
| ● | In-house creative agency and product merchandising teams support the account team to provide unique and custom product ideas along with additional design services such as billboards, annual reports, and digital ad assets. |
| ● | Merchandising team as well as members of our account teams attend trade shows domestically and internationally across a variety of markets, allowing us to provide a diverse assortment of product offerings to our clients. |
| ● | Technology and program teams offer technology solutions to help efficiently manage the order process, view products and inventory available, distribute products in the most cost-effective manner, and provide reports and metrics on the activity of the account. |
We work closely with industrial designers of several of our key collaborators to understand the research and trends that are influencing product development in the six- to 18-month window ensuring that our team is up-to-date on trends in the industry.
Promotional Product Programs
We run complex corporate promotional marketing programs for clients across many different industry verticals. Most of our clients take advantage of all the services we provide; however, at the core of every program are the promotional products themselves. Our team works diligently to stay on point with the current trends so our clients’ branded products are relevant. We distribute a wide variety of promotional products to our customers, with the most popular promotional products including wearables, writing utensils, drinkware, technology and events-related products.
Loyalty and Incentives Programs
We build custom solutions for customers looking to drive either customer or employee behavior. We help our customers build a customer loyalty program or an employee incentive program that meets each customer’s specific needs. Our solutions can include gamification tools, social media integration, and a points-based plan that rewards clients’ users with a combination of physical products, digital rewards, gift cards, and experiential rewards nurturing loyalty to their brand. For example, we worked closely with a global producer of vaccines and medicines for animals, to design and implement a two-tier incentive program in which, on one tier, veterinarians were incentivized to purchase from our customer through providing them with promotional branded products, and, on a second tier, a loyalty points program featuring prepaid debit card rewards for end-user pet owners who buy their products.
In developing our loyalty and incentive offering, Stran has taken a similar approach as we have in other areas of our business. Instead of developing our own internal solutions organically, we have sought out relationships with businesses with a variety of offerings that meet the very different needs of each of our customers. By using a collection of third party providers, we are able to offer a more robust technology solution that meets the constantly evolving and changing needs of our incentive users.
Packaging and Point of Sale
Presentation makes all the difference. Clever and custom packaging point of sale, or POS, displays are essentials for elevating brand awareness and critical for driving sales. From packaging of corporate merchandise and promotional products to developing custom POS displays, clients come to us when they want to stand out and show the quality that their brands offer. We produce custom packaging and POS projects domestically as well as overseas for larger-run custom programs for many of our clients.
Commercial and Digital Printing
Printed informational materials used for marketing, or marketing collateral, such as business cards and brochures, are an essential component to effectively conveying information and marketing messages, and arguably all businesses use some form of marketing collateral. When a customer needs print collateral, our digital print-on-demand options route their orders through our technology platform and to our network of commercial printers to ensure that our customers can print each piece of collateral in the most effective and efficient manner. By offering print management with our promotional branded merchandise solutions, we help our customers create impactful presentations and mailings through the most efficient processes.
Warehouse and Fulfillment
We offer a global solution for warehousing and fulfillment through a network of fulfillment providers including a twelve-year relationship with industry leader Harte Hanks. These long-standing, strategic relationships provide our clients with process-driven fulfillment solutions that are scalable to meet client needs including real-time inventory reporting, climate-controlled facilities, high-value product security, storage, digital print-on-demand, and direct-mail solutions. Our custom front-end technology solution is directly integrated with the warehouse management software of our strategic global warehouse collaborators.
In addition to continuing to use our third-party logistics partners like Harte Hanks, we are expanding our in-house warehouse, decoration, and fulfillment capabilities. Our acquisition of T R Miller provides us with an approximately 25,000-square-foot warehouse, production, and distribution center in Walpole, Massachusetts and our acquisition of Trend Brand Solutions provides us with an approximately 5,000 square-foot warehouse and distribution center in Tomball, Texas. We leverage these facilities to offer our customers specialty fulfillment, kitting, and warehousing, allowing us greater control and flexibility to meet the complex demands of our customers.
Technology
Our custom-developed e-commerce Magento Open Source platform allows our customers to manage all facets of their marketing program, linking branded merchandise, print, event assets, customer relationship management, or CRM, loyalty and incentives in a single solution. Our platform creates cost savings, increasing market efficiencies and brand consistency. With real-time accessibility to the necessary data to operate a complex demanding marketing program including hierarchy user profile groups, multi-lingual, multi-currency, multi-checkout methods and integration into many major ERP systems (SAP ERP, NetSuite ERP, Workday, etc.). Our on-demand mobile reporting dashboard capabilities allows the ability for self-service access within our systems empowering clients with raw data to make informative decisions for their program.
We have also invested in an internal commercial ERP software system, NetSuite ERP, which is expected to enhance the process of gathering and organizing the business data of our company through an integrated software suite, and is expected to be implemented in the second half of 2024. Additional NetSuite phases will be planned and rolled out in subsequent years. NetSuite combines accounting, order management, inventory, CRM, and presentation functionality. We believe that this ERP will reduce inefficiencies, expenses and headcount, automate current manual processes, and potentially contribute to growing net revenues.
Human Capital and Culture
We are more than an efficient distributor or supplier, and we offer our customers more than just products. We help them achieve their marketing and business goals using branded merchandise supported with technology, logistics, creative services, and account support. In order to provide all of these value-added services, we must leverage and cultivate the talent of our employees.
As an organization we encourage our team to engage with professional development opportunities. These opportunities include online courses, webinars, training sessions, and participation in various networking and professional development groups. As such we currently have a member of our team who serves on the board of directors for NEPPA (New England Promotional Products Association), a regional trade association, as well as a member of Chief, a network of 20,000 women executives, representing 10,000 companies and 77% of the Fortune 100, designed specifically for women executives to strengthen their leadership and maximize their business impact. Empowering our team to grow their own careers helps ensure that we are more knowledgeable, experienced, and engaged.
Pricing
As a large and growing firm with over 500 suppliers and due to our membership in Facilisgroup, Stran has the purchasing power to receive advantageous pricing, helping us with price-sensitive bids. Facilisgroup, a buying group of fewer than 1% of distributors in the industry, processed over $1.4 billion of sales in 2022. Pursuant to our Sublicense Agreement, we may access Facilisgroup’s @ease proprietary software tools for promotional products business management and analysis and a white labelled, managed, product website which we may use to sell promotional products under our brand. We may also access its “Signature Collection” website which Facilisgroup promises offers the best products and margins.
In addition to this competitive buying power, Stran has developed factory direct relationships with multiple factories in the U.S. and overseas. These direct relationships require additional vetting, longer production times, and larger production runs. However, we work to blend production from factory direct manufacturing with our other suppliers to continue to drive costs down on commodity-based items. We compete regularly with larger competitors and maintain healthy margins using this strategy for sourcing and procuring products.
Supplier and Fulfillment Relationships
We have formed strategic relationships with fulfillment and commercial print providers in the United States in order to effectively warehouse and distribute merchandise from one or more of our warehouse facilities depending on our customer’s requirements. For over 28 years, we have developed these strategic relationships in order to offer our clients a powerful solution for their branded merchandise needs. Together, we have experience in developing custom marketing solutions for our clients and regularly kit together promotional printed items and branded product into a single package. Our expertise in product development and sourcing, technology development, and program management combined with our various collaborators’ superior warehousing, logistics, fulfillment, distribution and print services are a competitive advantage.
We offer a global solution for warehousing and fulfillment through a network of fulfillment providers including a twelve-year relationship with industry leader Harte Hanks. We buy products and certain raw materials from a supplier network of factories, both domestic and international, as needed. We also outsource certain technology services such as web hosting and data backup. We do not believe that we are dependent on any supplier. Should any of these suppliers terminate their relationship with us or fail to provide the agreed-on services, we believe that there would be sufficient alternatives to continue to meet customer demand and comply with our contractual obligations without interruption.
Marketing
We have a direct sales team consisting of over 36 outside sales representatives and 30 in-house sales representatives. We incentivize our representatives with a competitive compensation, incentive, and commission structure.
Our marketing approach combines the sales funnel concept of the marketing process with digital and in-person marketing efforts. We market to a large number of prospects at the top of the sales funnel to make them aware of our business and our products and services by combining lead-generation activities with digital marketing, including website content, SEO, paid ads, and email list promotions, and in-person activities including tradeshow and other events. We use targeted emails, social media messages, and other digital and in-person lead-nurturing activities, develop case studies, and apply other digital and in-person sales tools to market to prospects that demonstrate interest in our business. For prospects that demonstrate readiness to buy and reach the bottom of the sales funnel, we use tools such as sales presentations, sales proposals, and sell sheets.
Our efforts in in-person marketing include expanding the number of tradeshows and conferences that we attend and sponsor across different industry verticals. At these tradeshows, we plan to target representatives of specific industry verticals, such as the beverage industry or the cannabis market, and a variety of professionals attending events focused in the areas of marketing or procurement development.
In addition to efforts to develop new business opportunities, our marketing team works closely with our sales team and our managers to develop opportunities from existing customer accounts. With existing customers, we are seeking to cross-sell and expand our services to encompass all employee, customer, and partner loyalty and engagement programs that are designed to reward loyalty through a combination of premium products, branded merchandise, and digital and experiential rewards.
Customers and Markets
Stran’s customer base includes approximately 2,000 active customers and over 30 Fortune 500 companies, servicing a diverse customer base, encompassing pharmaceutical and healthcare, manufacturing, technology, finance, construction and consumer goods. Our active customers are any organizations, businesses, or divisions of a parent organization which have purchased directly or indirectly from us within the last two years, and include organizations that have bought from other organizations for which Stran acts as an established subcontractor. We have long-term contracts with many of our customers, though most do not have minimum guarantees. We have ongoing contracts with clientele in such industries as financial services, consumer packaged goods, retail clothing and accessories, pet food and medicine, fitness, child care, retail hardware, fast food franchises, health care, and environmental services. Contracts are often multi-year and auto-renewing. Our average contract lifespan is approximately 10 years. Alternatively, we do have inventory guarantees where the customer must purchase any inventory held by us that has been purchased on their behalf within the contractual time periods. Our active customers may be broken into two main categories, transactional clients and program clients.
During 2023, sales to our largest two customers were 14.4% and 7.8% of total revenue, respectively. During 2022, sales to our largest three customers were 9.0%, 7.1% and 6.6% of total revenue, respectively. All other customers generated less than 5% of sales, and the vast majority generated less than 1% of sales.
While our customer contracts are typically auto-renewing and we have many long-term established customer relationships, most of our customer contracts do not have any minimum or exclusive purchase guarantees, other than as to inventory already ordered by them or their program participants. There is no assurance of recurring revenues. We are not dependent on any particular customer or group of customers, and our highest-grossing contracts may change from year to year due to client brand initiatives.
We do business principally with customers based in the United States, although we also provide e-store, logistical support and other promotional services for client programs in Canada and Europe.
Online Store
We have been a leader in the use of technology to offer our clients an online platform to more efficiently manage their promotional marketing programs and to give them the ability to sell branded merchandise directly to consumers. We launched our first online store for one of our clients in 1999. Today we offer a custom-built technology platform which offers a B2C (business-to-consumer) retail shopping experience combined with all of the back-end functionality required of a powerful B2B (business-to-business) marketing services platform. Our technology platform services over 280 online stores for our clients.
Our Online Store Account Managers are responsible for ensuring that our stores are up to date with all products, images, and descriptions. As new products are approved to be added to the online store, our account manager will work the appropriate resources to prep the images, write the descriptions and upload the images. Typically, this process will take 24-48 hours. For inventoried products, we typically do not make the products live on the website until they have been received into inventory and are ready to be fulfilled.
If there is an issue with an online store, we have dedicated account-specific customer service teams who support all aspects of order fulfillment that the user can contact to help resolve. If there is a back-order situation where an order would not be able to ship complete or on time, the appropriate team will review the order and advise the customer on the best and timeliest options to fulfill the order.
Competition
Our major competitors for our promotional products business include larger companies such as 4Imprint Group plc, Brand Addition Limited (The Pebble Group plc), BAMKO LLC (Superior Group of Companies, Inc.), Staples Promotional Products (Staples, Inc.), Boundless Network, Inc. (Zazzle Inc.), Custom Ink, Cimpress plc and HALO Branded Solutions, Inc. We also compete with a multitude of foreign, regional and local competitors that vary by market. If our existing or future competitors seek to gain or retain market share by reducing prices, we may be required to lower our prices, which would adversely affect our operating results. Similarly, if customers or potential customers perceive the products or services offered by our existing or future competitors to be of higher quality than ours or part of a broader product mix, our revenues may decline, which would adversely affect our operating results.
Our Program Management
We are experienced and industry-leading program managers who integrate all aspects of a successful program. Our program team works hand in hand with our account teams to drive the processes and procedures that ensure we are effectively managing our programs. For Stran, program management is built upon six key building blocks:
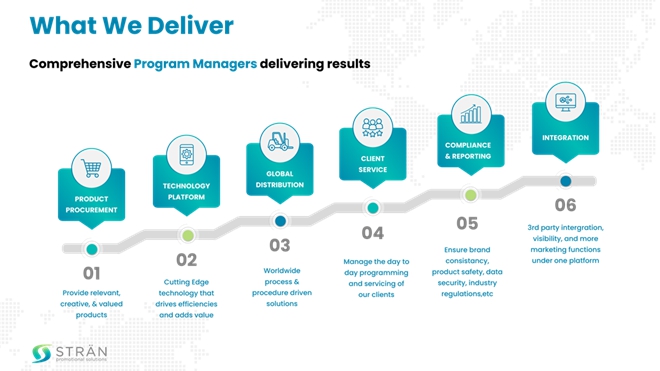
| ● | Creative Products. We approach promotional marketing, branded merchandise, and loyalty and incentives with the structure and vision of an ad agency. We have built a robust creative and merchandising team that works collaboratively with our account teams to bring fresh ideas and identify future trends for each of our program clients. We proactively develop merchandising plans, source products, offer individual personalization, understand trends, and make continuous improvements to the product offering based on user demand and marketing goals. We also offer multiple procurement methods within the same platform. These include inventoried products, made-to-order products, and personalized products. Our approach is to utilize all three procurement methods within a single program to take advantage of the benefits each method offers. In addition to these three procurement models, Stran has developed strong factory direct relationships with factories around the globe. We utilize these relationships to help drive down costs for our clients. In order to ensure that we can bring products to market quickly and reduce the possibility of backorders, Stran uses a blended approach to sourcing. We work with our domestic supply base to bookend our overseas inventory purchases. Stran purchases and owns inventory for many clients. This benefits our customers by allowing for budget flexibility and a pay-as-you-go model, resulting in reduced upfront costs and streamlined accounting and reporting. |
| ● | Robust Technology. We have developed our own custom technology platform based on Magento Open Source, an open-source software e-commerce platform. Using Magento we have been able to build a custom solution that meets the very distinctive needs of each of our clients. Stran is constantly making improvements and enhancements to our technology offerings. Client stores feature the ability to purchase a combination of inventoried products in addition to on-demand, and personalized products. The front-end responsive design ensures an impressive mobile experience. Our platform is user-friendly and easy to use while robust enough to offer many of the requirements needed in a traditional B2B solution. The requirements can include allocation to cost centers, departments, or general ledger codes; approval hierarchies; varied product selection or pricing by user group; and robust reporting. Our custom-built platform is also tied directly into our fulfilment center system for streamlined flow of data and we are capable to tying our platform into third party software such as Salesforce as well as accounting and procurement software. |
| ● | Global Distribution. We offer a global solution for warehousing and fulfillment through a network of industry-leading fulfillment providers including a close working relationship with Harte Hanks, an industry leader in warehousing, fulfillment, print-on-demand, direct mail, and kitting. The relationship between Stran and Harte Hanks has been fine-tuned over a twelve-year period and allows Stran to do what we do best, which is the creativity, product procurement, technology and account management while allowing Harte Hanks to do what they do best, which is process-driven fulfillment. Through our longstanding relationship with Harte Hanks we have developed integrated account management teams which ensures that while the customer has a large and diverse account team to support all their program needs, they also have a single account director responsible for all aspects of their program. |
Under our agreement with Harte Hanks, as amended and supplemented, we may subcontract to Harte Hanks one or multiple functions as appropriate, such as e-store website setup; ongoing website inventory management services; monthly account management services; and print-on-demand, warehousing, fulfillment, pick/pack/ship, and other inventory management services. Costs and fees depend on types of services provided and any special or custom work that we request on behalf of our customers.
In addition to continuing to use our third-party logistics partners like Harte Hanks, we are expanding our in-house warehouse, decoration, and fulfillment capabilities. Our acquisition of T R Miller provides us with a 25,000-square-foot warehouse and distribution center in Walpole, Massachusetts and our acquisition of Trend Brand Solutions provides us with a 5,000 square-foot warehouse and distribution center in Tomball, Texas. We leverage these facilities to offer our customers specialty fulfillment, kitting, and warehousing, allowing us greater control and flexibility to meet the complex demands of our customers.
| ● | Proactive Customer Services. Customer service is a key component of the overall success of an organization. Each account is assigned a single dedicated account director who is responsible for all aspects of the customer’s program. This account director is supported by an online store account manager, a special-order account manager, a fulfillment account manager, account coordinators, a merchandiser, art team support, operations team support, and accounting support. The customer’s account director works with program stakeholders on weekly status calls, quarterly business reviews and an annual review. We also use customer feedback surveys periodically to gain insight from the power users of the customer’ program and we have a formal corrective action process to address any issues that are not caught through our proactive efforts. |
| ● | Compliance and Emissions Reporting. We take issues of compliance very seriously. We recognize that we are an extension of the customer’s brand, and our systems are built to ensure full compliance around brand standards, quality and safety of products and the meeting of industry/firm rules. We have also begun to implement a program to assess and manage our carbon emissions policies, standards, and goals. To that end, we are working on finalizing a contract with a third-party emissions auditor to help us identify our historical, or “baseline,” Scope 1-3 carbon emissions. Scope 1 emissions are direct greenhouse gas (GHG) emissions that occur from sources that are controlled or owned by an organization (e.g., emissions associated with fuel combustion in boilers, furnaces, vehicles). Scope 2 emissions are indirect GHG emissions associated with the purchase of electricity, steam, heat, or cooling. Scope 3 emissions are the result of activities from assets not owned or controlled by the reporting organization, but that the organization indirectly affects in its value chain. Scope 3 emissions include all sources not within an organization’s scope 1 and 2 boundary. As we are not a manufacturer ourselves, and for the most part do not control the manufacturing or decoration process, Scope 3 emissions are expected to comprise the largest share of our carbon footprint. As such, the Scope 3 emission evaluation will be the most challenging for us to quantify and to change. We believe through benchmarking and continued education, both internally and with our customers, we will be able to use the data compiled by the third-party emissions auditor to develop a longer-term mitigation strategy. Once our baseline numbers are determined, we plan to begin to report those to Ecovadis, the world’s largest and most trusted provider of business sustainability ratings, along with our future plans and policies designed to drive increased compliance across our supply chain and to reduce our impact. Ecovadis will produce a scorecard of our efforts, policies, and procedures, which we expect to become available to the public. We anticipate that by the end of 2024, our baseline Scope 1 and 2 emissions data will be established and to begin our evaluation of Scope 3 emissions with Ecovadis prior to completing our Scope 3 emissions audit. |
| ● | Integration. Offering our clients an industry-leading technology platform that stands alone only adds so much value. We have worked to ensure that our platform can be easily integrated with as many other technology platforms used by our clients as possible. This helps our clients in many different ways depending on the specific integrations. We can integrate with various CRM or marketing automation platforms to help our clients track and measure who is using the marketing assets that we provide and how they are performing. We can also integrate with a number of different accounting and procurement systems. This helps our clients better control their spend as well as account for their spend. By forming a close working relationship with worldwide logistics leader Harte Hanks as our warehouse collaborator, we offer the most robust warehousing, fulfillment, kitting, and other logistics capabilities available domestically and internationally. In addition to their multiple U.S. locations for warehousing and fulfillment, Harte Hanks is a leader in print-on-demand and direct mail. Harte Hanks completes over 3 million on-time shipments of time-sensitive materials each year. Being able to integrate print, product, packaging, kitting, and direct mail, we help our client be more impactful and efficient with their promotional marketing efforts. |
Intellectual Property
We conduct our business using the registered trademark “STRÄN” and the registered trade name “Stran Promotional Solutions”. We also use the unregistered logo “STRÄN promotional solutions”.
To protect our intellectual property, we rely on a combination of laws and regulations, as well as contractual restrictions. Federal trademark law protects our registered trademark STRÄN and may protect our unregistered logo “STRÄN promotional solutions”. We also rely on the protection of laws regarding unregistered copyrights for certain content we create and trade secret laws to protect our proprietary technology including our e-commerce platform and new ERP system currently under development. To further protect our intellectual property, we enter into confidentiality agreements with our executive officers and directors.
Seasonality and Cyclicality
Our business and the promotional products industry overall is generally subject to some seasonal fluctuations. The final quarter of the calendar year is generally the strongest due to the holiday selling season and customers exhausting annual marketing budgets, while the first quarter of the calendar year is generally the weakest due to customers planning their budgets and marketing campaigns for the upcoming year.
Portions of the promotional products industry are cyclical in nature. Generally, when economic conditions are favorable, the industry tends to perform well. When the economy is weak or if there are economic disturbances that create uncertainty with corporate profits, the promotional products industry tends to experience low or negative growth.
Security
We regularly receive and store information about our customers, vendors and other third parties. We have programs in place to detect, contain, and respond to data security incidents. See Item 1C. “Cybersecurity”. However, because the techniques used to obtain unauthorized access, disable or degrade service, or sabotage systems change frequently and may be difficult to detect for long periods of time, we may be unable to anticipate these techniques or implement adequate preventive measures. In addition, hardware, software, or applications we develop or procure from third parties or through open-source solutions may contain defects in design or manufacture or other problems that could unexpectedly compromise information security. Unauthorized parties may also attempt to gain access to our systems or facilities, or those of third parties with whom we do business, through fraud, trickery, or other forms of deceiving our team members, contractors, and vendors.
Employees
As of March 20, 2024, we employed 118 full-time employees, 3 part-time employees and 16 independent contractors.
We do not believe any of our employees are represented by labor unions, and we believe that we have an excellent relationship with our employees.
Regulation
Trade Regulations
As disclosed above, our suppliers generally source or manufacture finished goods in parts of the world that may be affected by the imposition of duties, tariffs or other import regulations by the United States. The Company believes that its redundant network of suppliers provide sufficient capacity to mitigate any dependency risks on a single supplier.
We buy promotional products from suppliers or factories both domestically and internationally as needed. We do not depend on any single supplier. However, if we are unable to continue to obtain our finished products from international locations or if our suppliers are unable to source raw materials, it could significantly disrupt our business. Further, we are affected by economic, political and other conditions in the United States and internationally, including those resulting in the imposition or increase of import duties, tariffs and other import regulations and widespread health emergencies, which could have a material adverse effect on our business.
Laws and Regulations Relating to E-Commerce
Our business is subject to a variety of laws and regulations applicable to companies conducting business on the internet. Jurisdictions vary as to how, or whether, existing laws governing areas such as personal privacy and data security, consumer protection or sales and other taxes, among other areas, apply to the internet and e-commerce, and these laws are continually evolving. For example, certain applicable privacy laws and regulations require us to provide customers with our policies on sharing information with third parties, and advance notice of any changes to these policies. Related laws may govern the manner in which we store or transfer sensitive information or impose obligations on us in the event of a security breach or inadvertent disclosure of such information. Additionally, tax regulations in jurisdictions where we do not currently collect state or local taxes may subject us to the obligation to collect and remit such taxes, or to additional taxes, or to requirements intended to assist jurisdictions with their tax collection efforts.
The production, distribution and sale in the United States of many of our products are subject to the Federal Food, Drug, and Cosmetic Act, the Federal Trade Commission Act, the Lanham Act, state consumer protection laws, competition laws, federal, state and local workplace health and safety laws, various federal, state and local environmental protection laws, various other federal, state and local statutes applicable to the production, transportation, sale, safety, advertising, labeling and ingredients of such products, and rules and regulations adopted pursuant to these laws. Outside the United States, the distribution and sale of our many products and related operations are also subject to numerous similar and other statutes and regulations.
A California law known as Proposition 65 requires a specific warning to appear on any product containing a component listed by the state as having been found to cause cancer or birth defects. The state maintains lists of these substances and periodically adds other substances to these lists. Proposition 65 exposes all food and beverage producers to the possibility of having to provide warnings on their products in California because it does not provide for any generally applicable quantitative threshold below which the presence of a listed substance is exempt from the warning requirement. Consequently, the detection of even a trace amount of a listed substance can subject an affected product to the requirement of a warning label. However, Proposition 65 does not require a warning if the manufacturer of a product can demonstrate that the use of that product exposes consumers to a daily quantity of a listed substance that is:
| ● | below a “safe harbor” threshold that may be established; |
| ● | the result of necessary cooking; or |
| ● | subject to another applicable exemption. |
In January 2019, New York State’s governor announced the “Consumer Right to Know Act,” a proposed law that would impose similar and potentially more stringent labeling requirements than California Proposition 65. The law has not yet been adopted, and to our knowledge California Proposition 65 remains the most onerous state-level chemical exposure labeling statutory scheme. However, due in part to the large size of California’s market, promotional products sold or distributed anywhere in the United States may be subject to California Proposition 65.
We are unable to predict whether a component found in a product that we assisted a client in producing might be added to the California list in the future. Furthermore, we are also unable to predict when or whether the increasing sensitivity of detection methodology may become applicable under this law and related regulations as they currently exist, or as they may be amended.
We are subject to various federal, state and local laws and regulations, including but not limited to, laws and regulations relating to labor and employment, U.S. customs and consumer product safety, including the Consumer Product Safety Improvement Act (the “CPSIA”). The CPSIA created more stringent safety requirements related to lead and phthalates content in children’s products. The CPSIA regulates the future manufacture of these items and existing inventories and may cause us to incur losses if we offer for sale or sell any non-compliant items. Failure to comply with the various regulations applicable to us may result in damage to our reputation, civil and criminal liability, fines and penalties and increased cost of regulatory compliance. These current and any future laws and regulations could harm our business, results of operations and financial condition.
Legal requirements apply in various jurisdictions in the United States and overseas requiring deposits or certain taxes or fees be charged for the sale, marketing and use of certain non-refillable beverage containers. The precise requirements imposed by these measures vary. Other types of beverage container-related deposit, recycling, tax and/or product stewardship statutes and regulations also apply in various jurisdictions in the United States and overseas. We anticipate additional, similar legal requirements may be proposed or enacted in the future at local, state and federal levels, both in the United States and elsewhere.
New legislation or regulation, the application of laws from jurisdictions whose laws do not currently apply to our business, or the application of existing laws and regulations to the internet and e-commerce generally could result in significant additional taxes on our business. Further, we could be subject to fines or other payments for any past failures to comply with these requirements. The continued growth and demand for e-commerce is likely to result in more laws and regulations that impose additional compliance burdens on e-commerce companies.
Laws and Regulations Relating to Data Privacy
In the ordinary course of our business, we might collect and store in our internal and external data centers, cloud services and networks sensitive data, including our proprietary business information and that of our customers, suppliers and business collaborators, as well as personal information of our customers and employees. The secure processing, maintenance and transmission of this information is critical to our operations and business strategy. The number and sophistication of attempted attacks and intrusions that companies have experienced from third parties has increased over the past few years. Despite our security measures, it is impossible for us to eliminate this risk.
A number of U.S. states have enacted data privacy and security laws and regulations that govern the collection, use, disclosure, transfer, storage, disposal, and protection of personal information, such as social security numbers, financial information and other sensitive personal information. For example, all 50 states and several U.S. territories now have data breach laws that require timely notification to affected individuals, and at times regulators, credit reporting agencies and other bodies, if a company has experienced the unauthorized access or acquisition of certain personal information. Other state laws, particularly the California Consumer Privacy Act, as amended (“CCPA”), among other things, contain disclosure obligations for businesses that collect personal information about residents in their state and affords those individuals new rights relating to their personal information that may affect our ability to collect and/or use personal information. Moreover, on January 28, 2022, the California Attorney General announced that certain consumer loyalty programs are subject to the CCPA, which may affect some of our customers who use our loyalty program services if they are found not to comply with the CCPA’s requirements. The Virginia Consumer Data Protection Act (“CDPA”) also establishes rights for Virginia consumers to control how companies use individuals’ personal data. The CDPA dictates how companies must protect personal data in their possession and respond to consumers exercising their rights, as prescribed by the law, regarding such personal data. The CDPA went into effect on January 1, 2023. Effective January 1, 2023, we also became subject to the California Privacy Rights Act (the “CPRA”), which expands upon the consumer data use restrictions, penalties and enforcement provisions under the California Consumer Privacy Act. Effective July 1, 2023, we also became subject to the Colorado Privacy Act and Connecticut’s An Act Concerning Personal Data Privacy and Online Monitoring, which are also comprehensive consumer privacy laws. Effective December 31, 2023, we also became subject to the Utah Consumer Privacy Act, regarding business handling of consumers’ personal data. Effective January 1, 2025, we may also become subject to the Iowa Consumer Privacy Act, a similar consumer data privacy law. Meanwhile, several other states and the federal government have considered or are considering privacy laws like the CCPA. We will continue to monitor and assess the impact of these laws, which may impose substantial penalties for violations, impose significant costs for investigations and compliance, allow private class-action litigation and carry significant potential liability for our business.
Outside of the U.S., data protection laws, including the EU General Data Protection Regulation (the “GDPR”), also might apply to some of our operations or business collaborators. Legal requirements in these countries relating to the collection, storage, processing and transfer of personal data/information continue to evolve. The GDPR imposes, among other things, data protection requirements that include strict obligations and restrictions on the ability to collect, analyze and transfer EU personal data/information, a requirement for prompt notice of data breaches to data subjects and supervisory authorities in certain circumstances, and possible substantial fines for any violations (including possible fines for certain violations of up to the greater of 20 million Euros or 4% of total company revenue). Other governmental authorities around the world have enacted or are considering similar types of legislative and regulatory proposals concerning data protection.
The interpretation and enforcement of the laws and regulations described above are uncertain and subject to change, and may require substantial costs to monitor and implement and maintain adequate compliance programs. Failure to comply with U.S. and international data protection laws and regulations could result in government enforcement actions (which could include substantial civil and/or criminal penalties), private litigation and/or adverse publicity and could negatively affect our operating results and business.
Environmental Regulations
We use certain plastic, glass, fabric, metal and other products in our business which may be harmful if released into the environment. In view of the nature of our business, compliance with federal, state, and local laws regulating the discharge of materials into the environment, or otherwise relating to the protection of the environment, has had no material effect upon our operations or earnings, and we do not expect it to have a material impact in the foreseeable future. However, see “Risk Factors – Risks Related to Our Business and Industry – Climate change and increased focus by governments, stockholders and customers on sustainability issues, including those related to climate change, may have a material adverse effect on our business and operations.” and “Risk Factors – General Risk Factors – Environmental regulations may impact our future operating results.” for discussion of material related risks.
Tax Laws and Regulations
Changes in tax laws or regulations in the jurisdictions in which we do business, including the United States, or changes in how the tax laws are interpreted, could further impact our effective tax rate, further restrict our ability to repatriate undistributed offshore earnings, or impose new restrictions, costs or prohibitions on our current practices and reduce our net income and adversely affect our cash flows.
We are also subject to tax audits in the United States and other jurisdictions and our tax positions may be challenged by tax authorities. Although we believe that our current tax provisions are reasonable and appropriate, there can be no assurance that these items will be settled for the amounts accrued, that additional tax exposures will not be identified in the future or that additional tax reserves will not be necessary for any such exposures. Any increase in the amount of taxation incurred as a result of challenges to our tax filing positions could result in a material adverse effect on our business, results of operations and financial condition.
Other Regulations
We are subject to international, federal, national, regional, state, local and other laws and regulations affecting our business, including those promulgated under the Occupational Safety and Health Act, the Consumer Product Safety Act, the Flammable Fabrics Act, the Textile Fiber Product Identification Act, the rules and regulations of the Consumer Products Safety Commission, the Food, Drug, and Cosmetic Act, the Foreign Corrupt Practices Act of 1977 (the “FCPA”), various securities laws and regulations including but not limited to the Securities Exchange Act of 1934, as amended (the “Exchange Act”), the Securities Act of 1933, as amended (the “Securities Act”), the Listing Rules of The Nasdaq Stock Market LLC (“Nasdaq”), various labor, workplace and related laws, and environmental laws and regulations. Failure to comply with such laws and regulations may expose us to potential liability and have an adverse effect on our results of operations.
Corporate Structure and History
Our company was incorporated in Massachusetts on November 17, 1995 under the name “Strän & Company, Inc.” We also use the registered trade name “Stran Promotional Solutions”.
On September 26, 2020, we acquired certain assets including the customer account managers and customer base of the Wildman Imprints promotional products business division of Wildman Business Group, LLC, or WBG.
On May 24, 2021, we changed our state of incorporation to the State of Nevada by merging into Stran & Company, Inc., a Nevada corporation that was incorporated on May 19, 2021, and changed the spelling of our name to “Stran & Company, Inc.” In addition, on May 24, 2021, our authorized capital stock changed from 200,000 shares of common stock, $0.01 par value, to 350,000,000 shares, consisting of 300,000,000 shares of Common Stock, $0.0001 par value per share (“common stock”), and 50,000,000 shares of Preferred Stock, $0.0001 par value per share (“preferred stock”). At the same time, we also completed a 100,000-for-1 forward stock split of our outstanding common stock through the merger by issuing 100,000 shares of our common stock for each previously outstanding share of common stock of our predecessor Massachusetts company. As a result of this stock split, our issued and outstanding common stock increased from 100 shares to 10,000,000 shares, all of which were then held by Andrew Stranberg, our Executive Chairman, Treasurer, Secretary, and director.
Following our reincorporation in Nevada, on May 24, 2021, Mr. Stranberg was our sole stockholder then holding a total of 10,000,000 shares of our common stock. On the date of the reincorporation transaction, Mr. Stranberg transferred 3,400,000 shares of common stock to Andrew Shape, our Chief Executive Officer and President and director, and 800,000 shares of common stock to Randolph Birney, a former executive officer of the Company, pursuant to stock purchase agreements. The price per share was equal to $0.1985 per share, which was the calculated price of a share of common stock of the Company as of December 31, 2020 determined through a valuation of the shares of common stock of the Company dated April 27, 2021. Each of Messrs. Shape and Birney paid the purchase price for the shares to Mr. Stranberg through the delivery to Mr. Stranberg of a secured promissory note effective as of May 24, 2021. Each of the promissory notes provides for 2% simple annual interest, and principal and accrued interest must be repaid by the note’s third anniversary, May 24, 2024. Each note grants a security interest to Mr. Stranberg in the transferred shares as to the repayment obligations under the note.
The stock purchase agreements between Mr. Stranberg and Messrs. Shape and Birney provided that the shares are also subject to a lockup provision providing that one-half of the purchased shares may not be sold until the second anniversary of the date of the stock purchase agreement, or May 24, 2023; provided, however, that such restriction on transfer will expire at a rate of 1/48th of the shares subject to the restriction per month over such two-year period. The shares were also subject to a market standoff provision restricting transfers and other dispositions of the shares as reasonably requested by the Company and its underwriter until the date that is two years after its initial public offering, which occurred on November 8, 2021 (the “IPO”). The shares were also formerly subject to a repurchase right which lapsed upon the occurrence of the IPO. Subject to the above remaining restrictions, Messrs. Shape and Birney may sell the shares subject to the security interest at prevailing market prices so long as such portion of the sale proceeds as is required under the promissory note to repay the note is so used to repay the note. The foregoing description of each stock purchase agreement and promissory note referenced above is qualified in its entirety by reference to the full text of such documents which are filed as Exhibit 10.9, Exhibit 10.10, Exhibit 10.11, and Exhibit 10.12 to this Annual Report on Form 10-K/A, respectively, and which are incorporated herein by reference.
On May 24, 2021, Mr. Stranberg also transferred 700,000 shares of common stock to Theseus Capital Ltd. (“Theseus”), pursuant to a stock purchase agreement. Pursuant to a different arrangement with Mr. Stranberg from Mr. Shape and Mr. Birney’s, Theseus paid Mr. Stranberg a nominal cash purchase price of $100 for its stock. Theseus did not have any relationship with the Company other than as a stockholder after the transfer by Mr. Stranberg, and its payment for Mr. Stranberg’s stock was made to Mr. Stranberg and not to the Company. The stock was subject to a market standoff provision restricting transfers and other dispositions of the stock as reasonably requested by the Company and its underwriter until the date that is two years after the IPO. Theseus also executed an irrevocable proxy providing that Mr. Stranberg may vote and exercise all voting and related rights with respect to the shares. During 2021 and 2022, Theseus transferred all of the shares to others with the consent of the Company, its underwriter and Mr. Stranberg. The irrevocable proxy automatically terminated with respect to the shares upon their subsequent sale by Theseus.
On November 12, 2021, we completed the IPO, in which we sold 4,337,349 units, each unit consisting of one share of common stock and a publicly-traded warrant to purchase one share of common stock at the initial public offering price (the “IPO Price”) of $4.15 per unit, plus an additional 650,602 shares of common stock and 650,602 publicly-traded warrants pursuant to the exercise of the underwriters’ over-allotment option. Initially, the common stock and publicly-traded warrants had been listed on The Nasdaq Capital Market tier of Nasdaq under the initial ticker symbols “STRN” and “STRNW”, respectively. Subsequently, we changed the ticker symbols of the shares and publicly-traded warrants to “SWAG” and “SWAGW”, respectively. Each whole share exercisable pursuant to the publicly-traded warrants had an initial exercise price per share of $5.1875, equal to 125% of the IPO Price. Due to our subsequent private placement of common stock and common stock purchase warrants at a purchase price of $4.97 for one share and 1.25 warrants combined, after attributing a warrant value of $0.125, the exercise price per share of the publicly-traded warrants was reduced to $4.81375 as of December 10, 2021. The publicly-traded warrants were immediately exercisable and will expire on the fifth anniversary of the original issuance date. The units were not certificated. The shares of common stock and publicly-traded warrants were immediately separable and were issued separately, though they were issued and purchased together as a unit in the offering.
On December 10, 2021, we completed a private placement with several investors, wherein a total of 4,371,926 shares of common stock were issued at a purchase price of $4.97 per share, with each investor also receiving a warrant to purchase up to a number of shares of common stock equal to 125% of the number of shares of common stock purchased by such investor in the private placement, or a total of 5,464,903 shares, at an exercise price of $4.97 per share, for a total purchase price of approximately $21.7 million. The warrants were immediately exercisable on the date of issuance, expire five years from the date of issuance and have certain downward-pricing adjustment mechanisms, including with respect to any subsequent equity sale that is deemed a dilutive issuance, in which case the warrants were subject to a floor price of $4.80 per share before stockholder approval of the private placement was obtained, and after stockholder approval was obtained, such floor price would be reduced to $1.00 per share, as set forth in the warrants. On December 10, 2021, the holders of shares of common stock entitled to vote approximately 65.4% of our outstanding voting stock on December 10, 2021 approved the Company’s entry into the private placement. We filed preliminary and definitive information statements on Schedule 14C with the SEC on December 29, 2021 and January 11, 2022, and delivered copies of the definitive information statement to stockholders January 12, 2022. On January 31, 2022, the stockholders’ consent became effective pursuant to Rule 14c-2 under the Exchange Act. As a result, the exercise price of the warrants may be reduced to as low as $1.00 per share if their downward-pricing adjustment mechanisms become applicable. The warrants issued in this private placement are not registered for resale or listed on any stock exchange and are subject to restrictions on transfer. We engaged EF Hutton, division of Benchmark Investments, LLC (“EF Hutton”) as our placement agent for the private placement. We agreed, among other things, to issue the EF Hutton’s designees warrants to purchase an aggregate of 131,158 shares of common stock, which is equal to 3.0% of the total number of shares issued in the private placement, at an exercise price of $4.97 per share. See “Item 7. Management’s Discussion and Analysis of Results of Operations and Financial Condition – Liquidity and Capital Resources – December 2021 Private Placement” for further discussion of this transaction.
On January 31, 2022, we acquired substantially all of the assets used in the branding, marketing and promotional products and services business of G.A.P. Promotions. See Item 7. “Management’s Discussion and Analysis of Results of Operations and Financial Condition – Liquidity and Capital Resources – Contractual Obligations – G.A.P. Promotions Assets Acquisition” for further discussion of this transaction. On August 31, 2022, we acquired substantially all of the assets used in the branding, marketing and promotional products and services business of Trend Brand Solutions. See Item 7. “Management’s Discussion and Analysis of Results of Operations and Financial Condition – Liquidity and Capital Resources – Contractual Obligations – Trend Brand Solutions Assets Acquisition” for further discussion of this transaction. On December 20, 2022, we acquired substantially all of the assets used in the branding, marketing and promotional products and services business of Premier NYC. See Item 7. “Management’s Discussion and Analysis of Results of Operations and Financial Condition – Liquidity and Capital Resources – Contractual Obligations – Premier NYC Assets Acquisition” for further discussion of this transaction. On June 1, 2023, we acquired substantially all of the assets used in the branding, marketing and promotional products and services business of T R Miller. See Item 7. “Management’s Discussion and Analysis of Results of Operations and Financial Condition – Liquidity and Capital Resources – Contractual Obligations – T R Miller Assets Acquisition” for further discussion of this transaction.
As of March 28, 2024, we had no subsidiaries.
Our principal executive offices are located at 2 Heritage Drive, Suite 600, Quincy, MA 02171 and our telephone number is 800-833-3309. We maintain a website at https://www.stran.com. Information available on our website is not incorporated by reference in and is not deemed a part of this report. Our fiscal year ends on December 31. Neither we nor any of our predecessors have been in bankruptcy, receivership or any similar proceeding.
ITEM 1A. RISK FACTORS.
An investment in our securities involves a high degree of risk. You should carefully read and consider all of the risks described below, together with all of the other information contained or referred to in this report, before making an investment decision with respect to our securities. If any of the following events occur, our financial condition, business and results of operations (including cash flows) may be materially adversely affected. In that event, the market price of our shares could decline, and you could lose all or part of your investment.
Risks Related to Our Business and Industry
Shortages of supply of merchandise from suppliers, interruptions in our manufacturing, and local conditions in the countries in which we source goods and materials could adversely affect our results of operations.
Along with many companies that source goods and raw materials from abroad, we are currently experiencing continued supply disruptions and delays due to a variety of reasons. These changes are partially driven by interruptions in global supply chains (including as a result of port congestion, canal blockages and disruptions, and trucking shortages) and partially by a shift in customer buying habits to e-commerce, which has the effect of increasing demand for shipping capacity from Asia, leading to capacity constraints. Both factors have increased shipping times as well as the price of shipping, whether by sea, air, rail, or vehicle. Shipping delays combined with significant increases in orders for our products have recently created, and are expected to continue to create, inventory pressure for us.
As a distributor, we buy merchandise both from multiple supply sources and from a network of factories in which we have developed direct relationships around the globe over the past 28 years. However, an unexpected interruption in any of the sources or facilities may temporarily adversely affect our results of operations until alternate sources or facilities can be secured. We rely on the supply of different types of raw materials as well as textiles, including plastic, glass, fabric and metal for our promotional products. Further, our suppliers generally source or manufacture finished goods in parts of the world that may be affected by economic uncertainty, political unrest, labor disputes, health emergencies, or the imposition of duties, tariffs or other import regulations by the United States.
Increases in the price of merchandise and raw materials used to manufacture our products could materially increase our costs and decrease our profitability.
The principal components in our promotional products are plastic, glass, fabric and metal. The prices we pay for these fabrics and components and our merchandise are dependent on the market price for the raw materials used to produce them, primarily cotton and chemical components of synthetic fabrics including raw materials such as chemicals and dyestuffs. These finished goods and raw materials are subject to price volatility caused by weather, supply conditions, government regulations, economic and political climate, currency exchange rates, labor costs, and other unpredictable factors. Fluctuations in petroleum prices also may influence the prices of related items such as chemicals, dyestuffs and polyester yarn.
During the years ended December 31, 2023 and 2022, many promotional products companies saw increases in the cost of finished goods and raw materials purchased, as well as in the average cost of finished goods and raw materials purchased, as compared to the prior year, driven by rising inflation rates and challenges in the supply chain which continue to persist. The challenges in the supply chain, which include shipping and logistics issues, also delayed the arrival of product that many promotional products companies could sell; this challenge also persists.
Our shipping costs for importing raw materials from overseas increased significantly after the emergence of COVID-19 and the general inflation in the prices of goods and services that has occurred since that time. Any increase in raw material prices or shipping costs increases our cost of sales and can decrease our profitability unless we are able to pass the costs on to our customers in the form of higher prices. In addition, if one or more of our competitors is able to reduce their production costs by taking advantage of any reductions in raw material prices or favorable sourcing agreements, we may face pricing pressures from those competitors and may be forced to reduce our prices or face a decline in revenues, either of which could have a material adverse effect on our business, results of operations and financial condition.
Furthermore, significant or sustained inflation could have an adverse impact on our operating and general and administrative expenses. During inflationary periods, these costs could increase at a rate higher than our ability to offset them via customer-facing pricing adjustments, alternative supply sources or other measures. Inflation could also have an adverse effect on consumer spending, which could adversely impact demand for our products and services. If our operating and other expenses increase faster than anticipated due to inflation, our financial condition, results of operations and cash flow could be materially adversely affected.
Our customers may cancel or decrease the quantity of their orders, which could negatively impact our operating results.
Sales to many of our customers are on an order-by-order basis. If we cannot fill customers’ orders on time, orders may be cancelled and relationships with customers may suffer, which could have an adverse effect on us, especially if the relationship is with a major customer. Furthermore, if any of our customers experience a significant downturn in their business, or fail to remain committed to our programs or brands, the customer may reduce or discontinue purchases from us. The reduction in the amount of our products purchased by customers could have a material adverse effect on our business, results of operations or financial condition.
In addition, some of our customers have experienced significant changes and difficulties, including consolidation of ownership, increased centralization of buying decisions, buyer turnover, restructurings, bankruptcies and liquidations. A significant adverse change in a customer relationship or in a customer’s financial position could cause us to limit or discontinue business with that customer, require us to assume more credit risk relating to that customer’s receivables or limit our ability to collect amounts related to previous purchases by that customer, all of which could have a material adverse effect on our business, results of operations or financial condition.
We may be unable to identify or to complete acquisitions or to successfully integrate the businesses we acquire.
We have evaluated, and may continue to evaluate, potential acquisition transactions. We attempt to address the potential risks inherent in assessing the attractiveness of acquisition candidates, as well as other challenges such as retaining the employees and integrating the operations of the businesses we acquire. Integrating acquired operations involves significant risks and uncertainties, including maintenance of uniform standards, controls, policies and procedures; diversion of management’s attention from normal business operations during the integration process; unplanned expenses associated with integration efforts; and unidentified issues not discovered in due diligence, including legal contingencies. Acquisition valuations require us to make certain estimates and assumptions to determine the fair value of the acquired entities (including the underlying assets and liabilities). If our estimates or assumptions to value the acquired assets and liabilities are not accurate, we may be exposed to losses, and/or unexpected usage of cash flow to fund the operations of the acquired operations that may be material.
Even if we are able to acquire businesses on favorable terms, managing growth through acquisition is a difficult process that includes integration and training of personnel, combining facility and operating procedures, and additional matters related to the integration of acquired businesses within our existing organization. Unanticipated issues related to integration may result in additional expense and disruption to our operations, and may require a disproportionate amount of our management’s attention, any of which could negatively impact our ability to achieve anticipated benefits, such as revenue and cost synergies. Growth of our business through acquisition generally increases our operating complexity and the level of responsibility for both existing and new management personnel. Managing and sustaining our growth and expansion may require substantial enhancements to our operational and financial systems and controls, as well as additional administrative, operational and financial resources. We may be required to invest in additional support personnel, facilities and systems to address the increased complexities associated with business or segment expansion. These investments could result in higher overall operating costs and lower operating profits for the business as a whole. There can be no assurance that we will be successful in integrating acquired businesses or managing our expanding operations.
In addition, although we conduct due diligence investigations prior to each acquisition, there can be no assurance that we will discover or adequately protect against all material liabilities of an acquired business for which we may be responsible as a successor owner or operator. The failure to identify suitable acquisitions, successfully integrate these acquired businesses, successfully manage our expanding operations, or to discover liabilities associated with such businesses in the diligence process, could adversely affect our business, results of operations or financial condition.
In order to finance such acquisitions, we may need to obtain additional funds either through public or private financings, including bank and other secured and unsecured borrowings and/or the issuance of equity or debt securities. There can be no assurance that such financings would be available to us on reasonable terms. Any future issuances of equity securities or debt securities with equity features may be dilutive to our stockholders.
If our information technology systems suffer interruptions or failures, including as a result of cyberattacks, our business operations could be disrupted and our reputation could suffer.
We rely on information technology systems to process transactions, communicate with customers, manage our business and process and maintain information. The measures we have in place to monitor and protect our information technology systems might not provide sufficient protection from catastrophic events, power surges, viruses, malicious software (including ransomware), attempts to gain unauthorized access to data or other types of cyberattacks. As cyberattacks become more frequent, sophisticated, damaging and difficult to predict, any such event could negatively impact our business operations, such as by product disruptions that result in an unexpected delay in operations, interruptions in our ability to deliver products and services to our customers, loss of confidential or otherwise protected information, corruption of data and expenses related to the repair or replacement of our information technology systems. Compromising and/or loss of information could result in loss of sales or legal or regulatory claims which could adversely affect our revenues and profits or damage our reputation.
We rely on software and services from other parties. Defects in or the loss of access to software or services from third parties could increase our costs and adversely affect the quality of our products.
We rely on technologies from third parties to operate critical functions of our business, including cloud infrastructure services, payment processing services, certain aspects of distribution center automation and customer relationship management services. Our business would be disrupted if any of the third-party software or services we utilize, or functional equivalents thereof, were unavailable due to extended outages or interruptions or because they are no longer available on commercially reasonable terms or prices. In each case, we would be required to either seek licenses to software or services from other parties and redesign our business and marketplace to function with such software or services or develop these components ourselves, which would result in increased costs and could result in delays in the launch of new offerings on our marketplace until equivalent technology can be identified, licensed or developed, and integrated into our business and marketplace. Furthermore, we might be forced to limit the features available in our current or future products. These delays and feature limitations, if they occur, could harm our business, results of operations and financial condition.
Failure to comply with data privacy and security laws and regulations could adversely affect our operating results and business.
In the ordinary course of our business, we might collect and store in our internal and external data centers, cloud services and networks sensitive data, including our proprietary business information and that of our customers, suppliers and business collaborators, as well as personal information of our customers and employees. The secure processing, maintenance and transmission of this information is critical to our operations and business strategy. The number and sophistication of attempted attacks and intrusions that companies have experienced from third parties has increased over the past few years. Despite our security measures, it is impossible for us to eliminate this risk.
A number of U.S. states have enacted data privacy and security laws and regulations that govern the collection, use, disclosure, transfer, storage, disposal, and protection of personal information, such as social security numbers, financial information and other sensitive personal information. For example, all 50 states and several U.S. territories now have data breach laws that require timely notification to affected individuals, and at times regulators, credit reporting agencies and other bodies, if a company has experienced the unauthorized access or acquisition of certain personal information. Other state laws, such as the CCPA, among other things, contain disclosure obligations for businesses that collect personal information about residents in their state and affords those individuals new rights relating to their personal information that may affect our ability to collect and/or use personal information. Moreover, on January 28, 2022, the California Attorney General announced that certain consumer loyalty programs are subject to the CCPA, which may affect some of our customers who use our loyalty program services if they are found not to comply with the CCPA’s requirements. The CDPA also establishes rights for Virginia consumers to control how companies use individuals’ personal data. The CDPA dictates how companies must protect personal data in their possession and respond to consumers exercising their rights, as prescribed by the law, regarding such personal data. The CDPA went into effect on January 1, 2023. Effective January 1, 2023, we also became subject to the CPRA, which expands upon the consumer data use restrictions, penalties and enforcement provisions under the California Consumer Privacy Act. Effective July 1, 2023, we also became subject to the Colorado Privacy Act and Connecticut’s An Act Concerning Personal Data Privacy and Online Monitoring, which are also comprehensive consumer privacy laws. Effective December 31, 2023, we also became subject to the Utah Consumer Privacy Act, regarding business handling of consumers’ personal data. Effective January 1, 2025, we may also become subject to the Iowa Consumer Privacy Act, a similar consumer data privacy law. Meanwhile, several other states and the federal government have considered or are considering privacy laws like the CCPA. We will continue to monitor and assess the impact of these laws, which may impose substantial penalties for violations, impose significant costs for investigations and compliance, allow private class-action litigation and carry significant potential liability for our business.
Outside of the U.S., data protection laws, including the GDPR, also might apply to some of our operations or business collaborators. Legal requirements in these countries relating to the collection, storage, processing and transfer of personal data/information continue to evolve. The GDPR imposes, among other things, data protection requirements that include strict obligations and restrictions on the ability to collect, analyze and transfer EU personal data/information, a requirement for prompt notice of data breaches to data subjects and supervisory authorities in certain circumstances, and possible substantial fines for any violations (including possible fines for certain violations of up to the greater of 20 million Euros or 4% of total company revenue). Other governmental authorities around the world have enacted or are considering similar types of legislative and regulatory proposals concerning data protection.
The interpretation and enforcement of the laws and regulations described above are uncertain and subject to change, and may require substantial costs to monitor and implement and maintain adequate compliance programs. Failure to comply with U.S. and international data protection laws and regulations could result in government enforcement actions (which could include substantial civil and/or criminal penalties), private litigation and/or adverse publicity and could negatively affect our operating results and business.
The Consumer Product Safety Improvement Act and other existing or future government regulation could harm our business or may cause us to incur additional costs associated with compliance.
We are subject to various federal, state and local laws and regulations, including but not limited to, laws and regulations relating to labor and employment, U.S. customs and consumer product safety, including the CPSIA. The CPSIA created more stringent safety requirements related to lead and phthalates content in children’s products. The CPSIA regulates the future manufacture of these items and existing inventories and may cause us to incur losses if we offer for sale or sell any non-compliant items. Failure to comply with the various regulations applicable to us may result in damage to our reputation, civil and criminal liability, fines and penalties and increased cost of regulatory compliance. These current and any future laws and regulations could harm our business, results of operations and financial condition.
We are subject to international, federal, national, regional, state, local and other laws and regulations, and failure to comply with them may expose us to potential liability.
We are subject to international, federal, national, regional, state, local and other laws and regulations affecting our business, including those promulgated under the Occupational Safety and Health Act, the Consumer Product Safety Act, the Flammable Fabrics Act, the Textile Fiber Product Identification Act, the rules and regulations of the Consumer Products Safety Commission, the Food, Drug, and Cosmetic Act, the rules and regulations of the Food and Drug Administration, the FCPA, various securities laws and regulations including but not limited to the Securities Act, the Exchange Act, the Nasdaq Listing Rules, various labor, workplace and related laws, and environmental laws and regulations. Failure to comply with such laws and regulations may expose us to potential liability and have an adverse effect on our results of operations.
Implementation of technology initiatives could disrupt our operations in the near term and fail to provide the anticipated benefits.
As our business grows, we continue to make significant investments in our technology, including in the areas of warehouse management, enterprise risk management and product design. The costs, potential problems and interruptions associated with the implementation of technology initiatives could disrupt or reduce the efficiency of our operations in the near term. They may also require us to divert resources from our core business to ensure that implementation is successful. In addition, new or upgraded technology might not provide the anticipated benefits, might take longer than expected to realize the anticipated benefits, might fail or might cost more than anticipated.
Inability to attract and retain key management or other personnel could adversely impact our business.
Our success is largely dependent on the skills, experience and efforts of our senior management and other key personnel, including Andrew Shape, our Chief Executive Officer and President, Andrew Stranberg, our Executive Chairman, David Browner, our Chief Financial Officer, Ian Wall, our Chief Information Officer, and John Audibert, our Vice President of Growth and Strategic Initiatives. If, for any reason, one or more senior executives or key personnel were not to remain active in our company, or if we were unable to attract and retain senior management or key personnel, our results of operations could be adversely affected.
Failure to preserve positive labor relationships with our employees could adversely affect our results of operations.
Our operations rely heavily on our employees, and any labor shortage, disruption or stoppage caused by poor relations with our employees could reduce our operating margins and income. While we believe that our employee relations are good, have no knowledge of any employees as subject to collective bargaining agreements, and unions have not traditionally been active in the U.S. marketing industry, unionization of our workforce could increase our operating costs or constrain our operating flexibility.
We are exposed to the risk of non-payment by our customers on a significant amount of our sales.
We allow many of our customers to pay us within 30 days of service, also known as net 30 credit terms. For certain customers who are considered low credit risks, we have extended the credit term to 90 days, though in such cases we may also request a personal guaranty of payment from the principal owner of the customer business. Our extension of credit involves considerable judgment and is based on an evaluation of each customer’s financial condition and payment history. We monitor our credit risk exposure by periodically obtaining credit reports and updated financials on our customers. We generally see a heightened amount of bankruptcies by our customers during economic downturns and financial crises. While we maintain an allowance for doubtful receivables for potential credit losses based upon our historical trends and other available information, in times of economic turmoil, there is heightened risk that our historical indicators may prove to be inaccurate. The inability to collect on sales to significant customers or a group of customers could have a material adverse effect on our results of operations.
There is a risk of dependence on one or a group of customers.
During the fiscal year ended December 31, 2023, our top ten customers accounted for 46.4% of revenues, and our top customer accounted for 13.4% of revenues. During the fiscal year ended December 31, 2022, our top ten customers accounted for 44.7% of revenues, and our top customer accounted for 9.0% of revenues. If we are unable to retain our current customers or finding new major customers or gain major new engagements from existing customers to replace any nonrecurring contracts, there may be material adverse effects on our financial condition or results of operations. If on the other hand we successfully source major new contracts, the risk that we may become dependent on one or a few customers may increase. This potential dependency could threaten the sustainability of our growth and have a material adverse effect on our financial condition or results of operations if we are unable to retain such major contracts or replace them with similarly major contracts on a regular basis.
Our business incurs significant freight and transportation costs. Any changes in our shipping arrangements or any interruptions in shipping could harm our business, results of operations and financial condition.
We incur transportation expenses to ship our products to our customers. Significant increases in the costs of freight and transportation could have a material adverse effect on our results of operations, as there can be no assurance that we could pass on these increased costs to our customers. Government regulations can and have impacted the availability of drivers, which will be a significant challenge to the industry. Costs to employ drivers have increased and transportation disruptions have become more prevalent.
If we are not able to negotiate acceptable pricing and other terms with these vendors or they experience performance problems or other difficulties, it could negatively impact our business and results of operations and negatively affect the experiences of our customers, which could affect the degree to which they continue to do business with us. Disruption to delivery services due to inclement weather, climate change, or political instability, among other causes, could result in delays that could adversely affect our reputation, business and results of operations. If our products are not delivered in a timely fashion or are damaged or lost during the supply or the delivery process, our customers could become dissatisfied and cease doing business with us, which could adversely affect our business and results of operations.
Our business may be impacted by unforeseen or catastrophic events, including the emergence of pandemics or other widespread health emergencies, terrorist attacks, extreme weather events or other natural disasters and other unpredicted events.
The occurrence of unforeseen or catastrophic events, such as the emergence of pandemics or other widespread health emergencies (or concerns over the possibility of such pandemics or emergencies), terrorist attacks, extreme weather events or other natural disasters or other unpredicted events, could create economic and financial disruptions, and could lead to operational difficulties (including travel limitations) that could impair our ability to source and supply products and services and manage our businesses, and could negatively impact our customers’ ability or willingness to purchase our products and services.
For example, our corporate headquarters is located in Massachusetts, which experiences natural hazards such as flooding and coastal erosion; should any unforeseen or catastrophic events occur, the possibly resulting infrastructure damage and disruption to the area could negatively affect our company, such as by damage to or total destruction of our headquarters, surrounding transportation infrastructure, network communications and other forms of communication. Some of our other locations and those of our suppliers also are exposed to hurricanes, earthquakes, floods and other extreme weather events; the damage that such events could produce could affect the supply of our products and services.
We face intense competition within our industry and our revenue and/or profits may decrease if we are not able to respond to this competition effectively.
Customers in the promotional products, tradeshow and event marketplace, loyalty and program management business process outsourcing industries choose distributors primarily based upon the quality, price and breadth of products and services offered. We encounter competition from a number of companies in the geographic areas we serve. The majority of our revenue is derived from the sale of promotional products. Our major competitors for our promotional products business include companies such as 4Imprint Group plc, Brand Addition Limited (The Pebble Group plc), BAMKO LLC (Superior Group of Companies, Inc.), Staples Promotional Products (Staples, Inc.), Boundless Network, Inc. (Zazzle Inc.), Custom Ink, Cimpress plc and HALO Branded Solutions, Inc. We also compete with a multitude of foreign, regional and local competitors that vary by market. If our existing or future competitors seek to gain or retain market share by reducing prices, we may be required to lower our prices, which would adversely affect our operating results. Similarly, if customers or potential customers perceive the products or services offered by our existing or future competitors to be of higher quality than ours or part of a broader product mix, our revenues may decline, which would adversely affect our operating results.
We face intense competition to gain market share, which may lead some competitors to sell substantial amounts of goods at prices against which we cannot profitably compete.
Our marketing strategy is to differentiate ourselves by providing quality service and quality products to our customers. Even if this strategy is successful, the results may be offset by reductions in demand or price declines due to competitors’ pricing strategies or other micro- or macroeconomic factors. We face the risk of our competition following a strategy of selling its products at or below cost in order to cover some amount of fixed costs, especially in stressed economic times.
Global, national or regional economic slowdowns, high unemployment levels, fewer jobs, changes in tax laws or cost increases might have an adverse effect on our operating results.
Our primary products within our promotional products are used by workers and, as a result, our business prospects are dependent upon levels of employment and overall economic conditions on a global, national and regional level, among other factors. Our revenues are impacted by our customers’ opening and closing of locations and reductions and increases in headcount, including from voluntary turnover and increased automation. If we are unable to offset these effects, such as through the addition of new customers, the penetration of existing customers with a broader mix of product and service offerings, or decreased production costs that can be passed on in the form of lower prices, our revenue growth rates will be negatively impacted. Likewise, increases in tax rates or other changes in tax laws or other regulations can negatively affect our profitability.
While we do not believe that our exposure is greater than that of our competitors, we could be adversely affected by increases in the prices of fabric, natural gas, gasoline, wages, employee benefits, insurance costs and other components of product cost unless we can recover such increases through proportional increases in the prices for our products and services. Competitive and general economic conditions might limit our ability and that of our competitors to increase prices to cover any increases in our product cost.
The promotional products, trade show and events marketplace, loyalty and program management business industries are subject to pricing pressures that may cause us to lower the prices we charge for our products and services that adversely affect our financial performance.
Many of our competitors also source their product requirements from developing countries to achieve a lower cost operating environment, possibly with lower costs than our offshore facilities, and those manufacturers may use these cost savings to reduce prices. Some of our competitors have more purchasing power than we do, which may enable them to obtain products at lower costs. To remain competitive, we may adjust our product and service prices and margins from time-to-time in response to these industry-wide pricing pressures. Additionally, increased customer demands for allowances, incentives and other forms of economic support could reduce our margins and affect our profitability. Our financial performance will be negatively affected by these pricing pressures if we are forced to reduce our prices and we cannot reduce our product costs proportionally or if our product costs increase and we cannot increase our prices proportionally.
Changes to trade regulation, quotas, duties, tariffs or other restrictions caused by the changing U.S. and geopolitical environments or otherwise, such as those with respect to China, may materially harm our revenue and results of operations, such as by increasing our costs and/or limiting the amount of products that we can import.
Our operations are subject to various international trade agreements and regulations, such as the Dominican Republic–Central America Free Trade Agreement (CAFTA-DR), Caribbean Basin Trade Partnership Act (CBTPA), Haitian Hemispheric Opportunity through Partnership Encouragement Act, as amended (HOPE), the Food Conservation and Energy Act of 2008 (HOPE II), the Haiti Economic Lift Program of 2010 (HELP), the African Growth and Opportunity Act (AGOA), the Middle East Free Trade Area Initiative (MEFTA) and the activities and regulations of the World Trade Organization (WTO). Generally, these trade agreements and regulations benefit our business by reducing or eliminating the quotas, duties and/or tariffs assessed on products manufactured in a particular country. However, trade agreements and regulations can also impose requirements that have a material adverse effect on our business, revenue and results of operations, such as limiting the countries from which we can purchase raw materials, limiting the products that qualify as duty free, and setting quotas, duties and/or tariffs on products that may be imported into the United States from a particular country. Certain inbound products to the United States are subject to tariffs assessed on the manufactured cost of goods at the time of import. As a result, we have had to increase prices for certain products and may be required to raise those prices further, or raise our prices on other products, which may result in the loss of customers and harm our operating performance. In response, in part, to tariffs levied on products imported from China we have shifted some production out of China and may seek to shift additional production out of China, which may result in additional costs and disruption to our operations.
The countries in which our products are manufactured or into which they are imported may from time-to-time impose new quotas, duties, tariffs and requirements as to where raw materials must be purchased to qualify for free or reduced duty. These countries also may create additional workplace regulations or other restrictions on our imports or adversely modify existing restrictions. Adverse changes in these costs and restrictions could harm our business. We cannot assure that future trade agreements or regulations will not provide our competitors an advantage over us or increase our costs, either of which could have a material adverse effect on our business, results of operations or financial condition. Nor can we assure that the changing geopolitical and U.S. political environments will not result in a trade agreement or regulation being altered which adversely affects our company. The U.S. government may decide to impose or alter existing import quotas, duties, tariffs or other restrictions on products or raw materials sourced from those countries, which include countries from which we import raw materials or in which we manufacture our products. Any such quotas, duties, tariffs or restrictions could have a material adverse effect on our business, results of operations or financial condition.
The apparel industry, including corporate identity apparel, is subject to changing fashion trends and if we misjudge consumer preferences, the image of one or more of our brands may suffer and the demand for our products may decrease.
The apparel industry, including corporate identity apparel for promotional products, is subject to shifting customer demands and evolving fashion trends and our success is also dependent upon our ability to anticipate and promptly respond to these changes. Failure to anticipate, identify or promptly react to changing trends or styles may result in decreased demand for our products, as well as excess inventories and markdowns, which could have a material adverse effect on our business, results of operations and financial condition. In addition, if we misjudge consumer preferences, our brand image may be impaired.
Our success depends upon the continued protection of our intellectual property rights and we may be forced to incur substantial costs to maintain, defend, protect and enforce our intellectual property rights.
Our owned intellectual property and certain of our licensed intellectual property have significant value and are instrumental to our ability to market our products. We cannot assure that our owned or licensed intellectual property or the operation of our business does not infringe on or otherwise violate the intellectual property rights of others. We cannot assure that third parties will not assert claims against us on any such basis or that we will be able to successfully resolve such claims. In addition, the laws of some foreign countries do not allow us to protect, defend or enforce our intellectual property rights to the same extent as the laws of the United States. We could also incur substantial costs to defend legal actions relating to use of our intellectual property or prosecute legal actions against others using our intellectual property, either of which could have a material adverse effect on our business, results of operations or financial condition. There also can be no assurance that we will be able to negotiate and conclude extensions of existing license agreements on similar economic terms or at all.
Climate change impacts including supply chain disruptions, operational impacts, and geopolitical events may impact our business operations.
We source a large number of raw materials from third-party suppliers globally. These products include both natural and synthetic materials derived from plants, animal products, and organic and petroleum-based raw materials. Disruptions to the global supply chain due to climate-related impacts or geopolitical events are possible and exist as external risk factors that the Company can respond to but not control. These events could limit the supply of key raw materials to the Company, or could have significant impacts to pricing. We work with multiple raw material suppliers to mitigate lack of availability from a single supplier, however in some cases products with limited numbers of suppliers may become difficult to obtain.
Some of our vendors have manufacturing operations in areas vulnerable to coastal storms which may increase in magnitude and impact due to climate change. Increasingly large and unprecedented weather events may pose a risk to business operations in vulnerable areas. Storms could cause business interruptions, incur additional restoration costs, and impact product availability and pricing.
Increased focus by governments, vendors, stockholders, and customers on sustainability issues, including those related to climate change, may have a material adverse effect on our business and operations.
Federal, state and local governments, as well as some of our vendors and customers, are beginning to respond to climate change and other sustainability issues. This increased focus on sustainability may result in new legislation or regulations and vendor and customer requirements that could negatively affect us as we may incur additional costs or be required to make changes to our operations in order to comply with any new regulations or vendor, customer, or stockholder requirements. Legislation or regulations that potentially impose restrictions, caps, taxes, or other controls on emissions of greenhouse gases such as carbon dioxide, a by-product of burning fossil fuels such as those used in the trucks of our logistics vendors, may have a material adverse effect on our business and operations. For example, if the logistics vendors we contract with become subject to increasingly restrictive laws protecting the environment, including those relating to climate change, we expect that they would incur increased shipment costs and may pass such costs on to us, which could have a material adverse effect on our business. If our customers or stockholders were to require us to use vendors that source, manufacture, or supply their products in accordance with certain sustainability standards, we expect that such standards would likewise force us to incur additional costs and we may fail to pass such additional costs on to our customers, which could also have a material adverse effect on our business.
On March 6, 2024, the SEC adopted rules that will require us to disclose:
| ● | Climate-related risks that have had or are reasonably likely to have a material impact on our business strategy, results of operations, or financial condition; |
| ● | The actual and potential material impacts of any identified climate-related risks on our strategy, business model, and outlook; |
| ● | If, as part of our strategy, we have undertaken activities to mitigate or adapt to a material climate-related risk, a quantitative and qualitative description of material expenditures incurred and material impacts on financial estimates and assumptions that directly result from such mitigation or adaptation activities; |
| ● | Specified disclosures regarding our activities, if any, to mitigate or adapt to a material climate-related risk including the use, if any, of transition plans, scenario analysis, or internal carbon prices; |
| ● | Any oversight by our board of directors of climate-related risks and any role by management in assessing and managing our material climate-related risks; |
| ● | Any processes we have for identifying, assessing, and managing material climate-related risks and, if we are managing those risks, whether and how any such processes are integrated into our overall risk management system or processes; |
| ● | Information about our climate-related targets or goals, if any, that have materially affected or are reasonably likely to materially affect our business, results of operations, or financial condition; required disclosures would include material expenditures and material impacts on financial estimates and assumptions as a direct result of the target or goal or actions taken to make progress toward meeting such target or goal; |
| ● | The capitalized costs, expenditures expensed, charges, and losses incurred as a result of severe weather events and other natural conditions, such as hurricanes, tornadoes, flooding, drought, wildfires, extreme temperatures, and sea level rise, subject to applicable one percent and de minimis disclosure thresholds, disclosed in a note to the financial statements; |
| ● | The capitalized costs, expenditures expensed, and losses related to carbon offsets and renewable energy credits or certificates if used as a material component of our plans to achieve our disclosed climate-related targets or goals, disclosed in a note to our financial statements; and |
| ● | If the estimates and assumptions we use to produce our financial statements were materially impacted by risks and uncertainties associated with severe weather events and other natural conditions or any disclosed climate-related targets or transition plans, a qualitative description of how the development of such estimates and assumptions was impacted, disclosed in a note to our financial statements. |
We will be exempt from the SEC rules’ requirements to disclose certain information about our greenhouse gas emissions and comply with related auditor assurance requirements as long as we remain a “smaller reporting company” (as described below under —Risks Related to our Common Stock and Publicly-Traded Warrants – We are a ‘smaller reporting company’ within the meaning of the Exchange Act, and if we take advantage of certain exemptions from disclosure requirements available to smaller reporting companies, this could make our securities less attractive to investors and may make it more difficult to compare our performance with other public companies.”) or an “emerging growth company” (as described below under “—Risks Related to our Common Stock and Publicly-Traded Warrants – We are subject to ongoing public reporting requirements that are less rigorous than Exchange Act rules for companies that are not emerging growth companies and our stockholders could receive less information than they might expect to receive from more mature public companies.”). In addition, these disclosure rules will not require compliance by us until our fiscal year beginning in 2027, with certain requirements not becoming effective until our fiscal year beginning in 2028, if we remain a smaller reporting company or emerging growth company.
A number of petitions have been filed in federal courts seeking to challenge the SEC’s climate disclosure rules. On April 4, 2024, the SEC issued an order staying the rules. The SEC’s administrative stay will remain in place until the completion of litigation filed in the federal courts that challenges the agency’s authority to adopt the rules. The outcome of this litigation cannot be determined.
Assuming that the SEC climate disclosure rules are ultimately upheld in their present form, and even in light of the exemptions and accommodations made for smaller reporting companies and emerging growth companies described above, the costs to adopt the necessary disclosure controls and procedures to disclose all required information, the potential costs to make changes in our operations to allow us to improve our climate change-related disclosures, or the potential loss of revenues from these disclosure requirements due to investor, customer, or vendor requirements to disclose and meet certain climate change-related targets pursuant to these disclosure rules, may still have a material adverse effect on our business and operations.
General Risk Factors
Adverse developments affecting the financial services industry, such as actual events or concerns involving liquidity, defaults, or non-performance by financial institutions or transactional counterparties, could adversely affect our current and projected business operations and our financial condition and results of operations.
Actual events involving limited liquidity, defaults, non-performance or other adverse developments that affect financial institutions, transactional counterparties or other companies in the financial services industry or the financial services industry generally, or concerns or rumors about any events of these kinds or other similar risks, have in the past and may in the future lead to market-wide liquidity problems. For example, on March 10, 2023, Silicon Valley Bank (“SVB”), was closed by the California Department of Financial Protection and Innovation, which appointed the Federal Deposit Insurance Corporation (the “FDIC”), as receiver. Similarly, on March 12, 2023, Signature Bank Corp. (“Signature”), and Silvergate Capital Corp. were each swept into receivership
A statement by the Department of the Treasury, the Federal Reserve and the FDIC indicated that all depositors of SVB would have access to all of their money after only one business day of closure, including funds held in uninsured deposit accounts. In addition, U.S. regional banks have experienced a broad recovery since the turmoil of March 2023. Following the acute stress triggered by the collapse of SVB, aggregate financial indicators of the group have shown improvements. Between March 2023 and January 31, 2024, deposit outflows have stabilized. However, vulnerabilities in the U.S. banking sector are believed to persist.
Although we are not a borrower under or party to any material letter of credit or any other such instruments with any financial institution currently in receivership, if we enter into any such instruments and any of our lenders or counterparties to such instruments were to be placed into receivership, we may be unable to access such funds. In addition, if any of our customers, suppliers or other parties with whom we conduct business are unable to access funds pursuant to such instruments or lending arrangements with such a financial institution, such parties’ ability to pay their obligations to us or to enter into new commercial arrangements requiring additional payments to us could be adversely affected. In this regard, counterparties to credit agreements and arrangements with these financial institutions, and third parties such as beneficiaries of letters of credit (among others), may experience direct impacts from the closure of these financial institutions and uncertainty remains over liquidity concerns in the broader financial services industry. Similar impacts have occurred in the past, such as during the 2008-2010 financial crisis.
Inflation and rapid increases in interest rates have led to a decline in the trading value of previously-issued government securities with interest rates below current market interest rates. Although the U.S. Department of Treasury, FDIC and Federal Reserve Board have announced a program to provide up to $25 billion of loans to financial institutions secured by certain of such government securities held by financial institutions to mitigate the risk of potential losses on the sale of such instruments, widespread demands for customer withdrawals or other liquidity needs of financial institutions for immediately liquidity may exceed the capacity of such program.
Our access to funding sources and other credit arrangements in amounts adequate to finance or capitalize our current and projected future business operations could be significantly impaired by factors that affect us, any financial institutions with which we enter into credit agreements or arrangements directly, or the financial services industry or economy in general. These factors could include, among others, events such as liquidity constraints or failures, the ability to perform obligations under various types of financial, credit or liquidity agreements or arrangements, disruptions or instability in the financial services industry or financial markets, or concerns or negative expectations about the prospects for companies in the financial services industry. These factors could involve financial institutions or financial services industry companies with which we have financial or business relationships, but could also include factors involving financial markets or the financial services industry generally.
The results of events or concerns that involve one or more of these factors could include a variety of material and adverse impacts on our current and projected business operations and our financial condition and results of operations. These risks include, but may not be limited to, the following:
| ● | delayed access to deposits or other financial assets or the uninsured loss of deposits or other financial assets; |
| ● | inability to enter into credit facilities or other working capital resources; |
| ● | potential or actual breach of contractual obligations that require us to maintain letters of credit or other credit support arrangements; or |
| ● | termination of cash management arrangements and/or delays in accessing or actual loss of funds subject to cash management arrangements. |
In addition, investor concerns regarding the U.S. or international financial systems could result in less favorable commercial financing terms, including higher interest rates or costs and tighter financial and operating covenants, or systemic limitations on access to credit and liquidity sources, thereby making it more difficult for us to acquire financing on acceptable terms or at all. Any decline in available funding or access to our cash and liquidity resources could, among other risks, adversely impact our ability to meet our operating expenses or other obligations, financial or otherwise, result in breaches of our financial and/or contractual obligations, or result in violations of federal or state wage and hour laws. Any of these impacts, or any other impacts resulting from the factors described above or other related or similar factors, could have material adverse impacts on our liquidity and our current and/or projected business operations and financial condition and results of operations.
In addition, any further deterioration in the economy or financial services industry could lead to losses or defaults by our customers, service providers, vendors, or suppliers, which in turn, could have a material adverse effect on our current and/or projected business operations and results of operations and financial condition. For example, a customer may fail to make payments when due, default under their agreements with us, become insolvent or declare bankruptcy, or a service provider, vendor, or supplier may determine that it will no longer deal with us as a customer. In addition, a service provider, vendor or supplier could be adversely affected by any of the liquidity or other risks that are described above as factors that could result in material adverse impacts on us, including but not limited to delayed access or loss of access to uninsured deposits or loss of the ability to draw on existing credit facilities involving a troubled or failed financial institution. The bankruptcy or insolvency of any customers, service providers, vendors, or suppliers, or the failure of any customer to make payments when due, or any breach or default by a customer, service provider, vendor, or supplier, or the loss of any significant supplier relationships, could cause us to suffer material losses and may have a material adverse impact on our business.
Some of the products that we design or otherwise assist customers with producing create exposure to potential product liability, warranty liability or personal injury claims and litigation.
Some of the products that we design or otherwise assist customers with producing are used in applications and situations that involve risk of personal injury and death. Our services expose us to potential product liability, warranty liability, and personal injury claims and litigation relating to the use or misuse of our products including allegations of defects in manufacturing, defects in design, a failure to warn of dangers inherent in the product or activities associated with the product, negligence and strict liability. If successful, such claims could have a material adverse effect on our business.
Defects in the products that we design or otherwise assist customers with producing could reduce demand for our products and result in a decrease in sales and market acceptance and damage to our reputation.
Although we carry certain standard commercial insurance, including products-completed operations coverage, we do not currently maintain separate product liability insurance, and we may not be able to obtain and maintain such insurance on acceptable terms, if at all, in the future. Even if we have purchased product liability insurance in the future, product liability claims may exceed the amount of our insurance coverage. In addition, our reputation may be adversely affected by such claims, whether or not successful, including potential negative publicity about our products.
We may be subject to periodic litigation in both domestic and international jurisdictions that may adversely affect our financial position and results of operations.
From time to time we may be involved in legal or regulatory actions regarding product liability, employment practices, intellectual property infringement, bankruptcies and other litigation or enforcement matters. These proceedings may be in jurisdictions with reputations for aggressive application of laws and procedures against corporate defendants. We are impacted by trends in litigation, including class-action allegations brought under various consumer protection and employment laws. Due to the inherent uncertainties of litigation in both domestic and foreign jurisdictions, we cannot accurately predict the ultimate outcome of any such proceedings. These proceedings could cause us to incur costs and may require us to devote resources to defend against these claims and could ultimately result in a loss or other remedies, such as product recalls, which could adversely affect our financial position and results of operations.
Volatility in the global financial markets could adversely affect results.
In the past, global financial markets have experienced extreme disruption, including, among other things, volatility in securities prices, diminished liquidity and credit availability, rating downgrades of certain investments and declining valuations of others. There can be no assurance that there will not be further change or volatility, which could lead to challenges in our business and negatively impact our financial results. Any future tightening of credit in financial markets could adversely affect the ability of our customers and suppliers to obtain financing for significant purchases and operations and could result in a decrease in orders and spending for our products and services. We are unable to predict the likely duration and severity of any disruption in financial markets and adverse economic conditions and the effects they may have on our business and financial condition.
We identified material weaknesses in our internal control over financial reporting as of December 31, 2023. If we fail to remediate the material weaknesses, we may be unable to accurately report our financial results or prevent fraud, and investor confidence and the market price of our shares may be adversely affected.
To implement Section 404 of the Sarbanes-Oxley Act of 2002 (the “Sarbanes-Oxley Act”), the SEC adopted rules requiring public companies to include a report of management on the company’s internal control over financial reporting in their annual reports on Form 10-K. A report of our management is included under Item 9A of this Annual Report on Form 10-K/A. A “material weakness” is a deficiency, or a combination of deficiencies, in internal control over financial reporting, such that there is a reasonable possibility that a material misstatement of the Company’s annual or interim financial statements will not be prevented or detected on a timely basis.
Our management has identified the following material weaknesses in our internal control over financial reporting:
| ● | There was a material weakness in our internal controls related to the proper design and implementation of control over formal review, approval, and evaluation of complex accounting transactions associated with business combinations. |
| ● | We identified a material weakness in internal control related to the proper design and implementation of certain controls over management’s formal review process that includes multiple levels of review as well as timely review of accounts and reconciliations leading to material adjustments. |
| ● | We identified a material weakness in internal control related to the proper design and implementation of certain controls over income tax provision and management’s review of the income tax provision. |
| ● | We did not design and maintain effective controls over financial reporting for accounts receivable and unearned revenue, freight charges, and inventory and cost of sales accounts. |
| ● | We did not design and maintain effective controls over financial reporting related to the proper presentation and disclosure for related party transactions. |
| ● | We did not effectively select and develop certain information technology general controls related to access and change management controls that led to deficiencies in the design and operation of control activities. |
We have commenced a plan of remediation to remedy the material weaknesses. However, the implementation of these measures may not fully address the material weaknesses in our internal control over financial reporting. Our failure to address any control deficiency could result in inaccuracies in our financial statements and could also impair our ability to comply with applicable financial reporting requirements and related regulatory filings on a timely basis. Moreover, effective internal control over financial reporting is important to prevent fraud. As a result, our business, financial condition, results of operations and prospects, as well as the trading price of our shares, may be adversely affected.
Increases in the cost of employee benefits could impact our financial results and cash flow.
Our expenses relating to employee health benefits are significant. Unfavorable changes in the cost of such benefits could impact our financial results and cash flow. Healthcare costs have risen significantly in recent years, and recent legislative and private sector initiatives regarding healthcare reform could result in significant changes to the U.S. healthcare system. While the Company has various cost control measures in place and employs an outside consultant to review larger claims, employee health benefits have been and are expected to continue to be a significant cost to the Company. Medical costs will continue to be a significant expense to the Company and may increase due to factors outside the Company’s control.
We have restated our financial statements. The restatement has consumed a significant amount of management time and resources and may continue to do so. In addition, the restatement may subject us to a number of additional risks and uncertainties, including the increased possibility of legal proceedings and could adversely impact our operations.
We have restated certain financial information in our previously issued financial statements as of and for the fiscal years ended December 31, 2023 and 2022 included in the Company’s Annual Report on Form 10-K for the year ended December 31, 2023 that was filed by the Company with the SEC on March 28, 2024. The restatement has resulted in substantial costs in the form of accounting, legal fees, and similar professional fees, in addition to the substantial diversion of time and attention of our senior management and members of our accounting team in preparing the restatement.
Further, as a result of the restatement, we face the potential for litigation or other disputes which may include, among others, claims invoking the federal and state securities laws, contractual claims or other claims arising from the restatement and the preparation of our financial statements. As of the date of this filing, we have no knowledge of any such litigation or dispute resulting from the restatement. However, we can provide no assurance that litigation or disputes will not arise in the future. Any such litigation or dispute, whether successful or not, could have a material adverse effect on our business, results of operations and financial condition.
We may recognize impairment charges, which could adversely affect our financial condition and results of operations.
We assess our goodwill, intangible assets and long-lived assets for impairment when required by generally accepted accounting principles in the United States (“U.S. GAAP”). These accounting principles require that we record an impairment charge if circumstances indicate that the asset carrying values exceed their estimated fair values. The estimated fair value of these assets is impacted by general economic conditions in the locations in which we operate. Deterioration in these general economic conditions may result in: declining revenue, which can lead to excess capacity and declining operating cash flow; reductions in management’s estimates for future revenue and operating cash flow growth; increases in borrowing rates and other deterioration in factors that impact our weighted average cost of capital; and deteriorating real estate values. If our assessment of goodwill, intangible assets or long-lived assets indicates an impairment of the carrying value for which we recognize an impairment charge, this may adversely affect our financial condition and results of operations.
Environmental regulations may impact our future operating results.
We are subject to extensive and changing federal, state and foreign laws and regulations establishing health and environmental quality standards, and may be subject to liability or penalties for violations of those standards. We may be subject to future liabilities or obligations as a result of new or more stringent interpretations of existing laws and regulations. In addition, we may have liabilities or obligations in the future if we discover any environmental contamination or liability at any of our facilities, or at facilities we may acquire.
If we are unable to accurately predict our future tax liabilities, become subject to increased levels of taxation or our tax contingencies are unfavorably resolved, our results of operations and financial condition could be adversely affected.
Changes in tax laws or regulations in the jurisdictions in which we do business, including the United States, or changes in how the tax laws are interpreted, could further impact our effective tax rate, further restrict our ability to repatriate undistributed offshore earnings, or impose new restrictions, costs or prohibitions on our current practices and reduce our net income and adversely affect our cash flows.
We are also subject to tax audits in the United States and other jurisdictions and our tax positions may be challenged by tax authorities. Although we believe that our current tax provisions are reasonable and appropriate, there can be no assurance that these items will be settled for the amounts accrued, that additional tax exposures will not be identified in the future or that additional tax reserves will not be necessary for any such exposures. Any increase in the amount of taxation incurred as a result of challenges to our tax filing positions could result in a material adverse effect on our business, results of operations and financial condition.
Risks Related to Ownership of Our Securities
The market prices of our securities may fluctuate, and you could lose all or part of your investment.
The market prices for our securities are likely to be volatile, in part because our shares and publicly-traded warrants have only been traded publicly since November 9, 2021. In addition, the market prices of our securities may fluctuate significantly in response to several factors, most of which we cannot control, including:
| ● | actual or anticipated variations in our periodic operating results; |
| ● | increases in market interest rates that lead investors of our common stock and publicly-traded warrants to demand a higher investment return; |
| ● | changes in earnings estimates; |
| ● | changes in market valuations of similar companies; |
| ● | actions or announcements by our competitors; |
| ● | adverse market reaction to any increased indebtedness we may incur in the future; |
| ● | additions or departures of key personnel; |
| ● | actions by stockholders; |
| ● | speculation in the media, online forums, or investment community; and |
| ● | our intentions and ability to maintain the listing of our common stock and publicly-traded warrants on Nasdaq. |
Volatility in the market prices of our securities may prevent investors from being able to sell their securities at or above their purchase price. As a result, you may suffer a loss on your investment.
We may not be able to maintain a listing of our common stock and publicly-traded warrants on Nasdaq.
Although our common stock and publicly-traded warrants are listed on Nasdaq, we must meet certain financial and liquidity criteria to maintain such listing. If we violate Nasdaq’s listing requirements, or if we fail to meet any of Nasdaq’s listing standards, our common stock and publicly-traded warrants may be delisted. In addition, our board of directors may determine that the cost of maintaining our listing on a national securities exchange outweighs the benefits of such listing. A delisting of our common stock and publicly-traded warrants from Nasdaq may materially impair our stockholders’ ability to buy and sell our common stock and publicly-traded warrants and could have an adverse effect on the market price of, and the efficiency of the trading market for, our common stock and publicly-traded warrants. The delisting of our common stock and publicly-traded warrants could significantly impair our ability to raise capital and the value of your investment.
Our publicly-traded warrants may not have any value.
Our publicly-traded warrants are exercisable for five years from the date of initial issuance and currently have an exercise price of $4.81375 per share. There can be no assurance that the market price of our shares of common stock will equal or exceed the exercise price of the publicly-traded warrants. In the event that the stock price of our shares of common stock does not exceed the exercise price of the publicly-traded warrants during the period when the publicly-traded warrants are held and exercisable, the publicly-traded warrants may not have any value to their holders.
Holders of publicly-traded warrants have no rights as stockholders until such holders exercise their publicly-traded warrants and acquire our shares of common stock.
Until holders of our publicly-traded warrants acquire shares of common stock upon exercise thereof, such holders will have no rights with respect to the shares of common stock underlying the publicly-traded warrants. Upon exercise of the publicly-traded warrants, the holders will be entitled to exercise the rights of a stockholder only as to matters for which the record date occurs after the date they were entered in the register of members of the Company as a stockholder.
The warrant certificate governing our publicly-traded warrants designates the state and federal courts of the State of New York sitting in the City of New York, Borough of Manhattan, as the exclusive forum for actions and proceedings with respect to all matters arising out of the publicly-traded warrants, which could limit a warrantholder’s ability to choose the judicial forum for disputes arising out of the publicly-traded warrants.
The warrant certificate governing our publicly-traded warrants provides that all legal proceedings concerning the interpretations, enforcement and defense of the transactions contemplated by the warrant certificate (whether brought against a party to the warrant certificate or their respective affiliates, directors, officers, stockholders, partners, members, employees or agents) shall be commenced exclusively in the state and federal courts sitting in the City of New York. The warrant certificate further provides that we and the warrantholders irrevocably submit to the exclusive jurisdiction of the state and federal courts sitting in the City of New York, Borough of Manhattan for the adjudication of any dispute under the warrant certificate or in connection with it or with any transaction contemplated by it or discussed in it, including under the Securities Act. Furthermore, we and the warrantholders irrevocably waive, and agree not to assert in any suit, action or proceeding, any claim that we or they are not personally subject to the jurisdiction of any such court, that such suit, action or proceeding is improper or is an inconvenient venue for such proceeding. With respect to any complaint asserting a cause of action arising under the Securities Act or the rules and regulations promulgated thereunder, we note, however, that there is uncertainty as to whether a court would enforce this provision and that investors cannot waive compliance with the federal securities laws and the rules and regulations thereunder. Section 22 of the Securities Act creates concurrent jurisdiction for state and federal courts over all suits brought to enforce any duty or liability created by the Securities Act or the rules and regulations thereunder.
Notwithstanding the foregoing, these provisions of the warrant certificate will not apply to suits brought to enforce any liability or duty created by the Exchange Act or any other claim for which the federal district courts of the United States of America are the sole and exclusive forum.
Any person or entity purchasing or otherwise acquiring or holding or owning (or continuing to hold or own) any interest in any of our publicly-traded warrants shall be deemed to have notice of and consented to the foregoing provisions. Although we believe this exclusive forum provision benefits us by providing increased consistency in the application of the governing law in the types of lawsuits to which it applies, the exclusive forum provision may limit a warrantholder’s ability to bring a claim in a judicial forum of its choosing for disputes with us or any of our directors, officers, other employees, stockholders, or others which may discourage lawsuits with respect to such claims. Our warrantholders will not be deemed to have waived our compliance with the federal securities laws and the rules and regulations thereunder as a result of this exclusive forum provision. Further, in the event a court finds the exclusive forum provision contained in our warrant certificates to be unenforceable or inapplicable in an action, we may incur additional costs associated with resolving such action in other jurisdictions, which could harm our results of operations.
Risks Related to our Common Stock and Publicly-Traded Warrants
Although we adopted a stock repurchase program, we have discretion to not repurchase your shares, to suspend the program, and to cease repurchases.
On February 23, 2022, we announced that our board of directors had authorized a stock repurchase program under which we may repurchase up to $10 million of our outstanding shares of common stock in the open market, in accordance with all applicable securities laws and regulations, including Rule 10b-18 of the Exchange Act (“Rule 10b-18”). On May 23, 2022, we filed a Current Report on Form 8-K that announced that on May 20, 2022 we had established a trading plan (the “Trading Plan”) with B. Riley Securities, Inc. (“B. Riley”) intended to qualify under Rule 10b-18. The Trading Plan instructs B. Riley to repurchase shares of common stock of the Company for the Company’s account in accordance with Rule 10b-18 and the Company’s instructions. Repurchases under the Trading Plan were scheduled to terminate as late as June 2024. Our insider trading policy generally permits insider purchases of our stock only during the period beginning on the second business day following the day of public release of our quarterly or annual earnings and ending on the last day of the then-current quarter.
Our decision to repurchase our shares, as well as the timing of such repurchases, will also depend on a variety of factors that include ongoing assessments of our capital needs, market conditions and the price of our common stock, and other corporate considerations, as determined by management.
Although we have conducted repurchases of our common stock under the Trading Plan, we may suspend or terminate it at any time. Additionally, a stock repurchase program has many limitations and will be subject to compliance with applicable contractual and regulatory restrictions, and should not be relied upon as a method to sell shares promptly, at a desired price, or at a time that would be advantageous to stockholders.
The reduction of total outstanding shares through the execution of a stock repurchase program of common stock may increase the risk that a stockholder or group of stockholders could control us.
A stock repurchase program may be conducted from time to time under authorization made by our board of directors. Although no single stockholder or group of stockholders currently owns a majority of our shares, as of March 28, 2024, Andrew Stranberg, our Executive Chairman, beneficially owned approximately 28.7% shares of our common stock, and Andrew Shape, our President and Chief Executive Officer, beneficially owned approximately 19.2% shares of our common stock. As such, our officers and directors together hold a significant percentage of our outstanding shares of common stock and therefore may effectively control our operations. The reduction of total outstanding shares through the execution of a stock repurchase program of common stock may increase the risk that Mr. Stranberg or Mr. Shape alone or that our officers and directors together will be controlling stockholders.
A controlling stockholder or group of stockholders has significant influence over, and may have the ability to control, matters requiring approval by our stockholders, including the election of directors and approval of mergers, consolidations, sales of assets, recapitalizations and amendments to our articles of incorporation. Furthermore, a controlling stockholder or group of stockholders may take actions with which other stockholders do not agree, including actions that delay, defer or prevent a change of control of the Company and that could cause the price that investors are willing to pay for the Company’s stock to decline.
We do not expect to declare or pay dividends in the foreseeable future.
We do not expect to declare or pay dividends in the foreseeable future, as we anticipate that we will invest future earnings in the development and growth of our business. Therefore, holders of our common stock will not receive any return on their investment unless they sell their securities, and holders may be unable to sell their securities on favorable terms or at all.
If securities industry analysts do not publish research reports on us, or publish unfavorable reports on us, then the market price and market trading volume of our securities could be negatively affected.
Any trading market for our common stock and publicly-traded warrants may be influenced in part by any research reports that securities industry analysts publish about us. We currently do not have any research coverage. We may never obtain new research coverage by securities industry analysts. If no securities industry analysts commence coverage of us, the market price and market trading volume of our securities could be negatively affected. In the event we are covered by new analysts, and one or more analyst downgrades our securities, or otherwise reports on us unfavorably, or discontinues coverage of us, the market price and market trading volume of our securities could be negatively affected.
Future issuances of our common stock or securities convertible into, or exercisable or exchangeable for, our common stock, or the expiration of lock-up agreements that restrict the issuance of new common stock or the trading of outstanding common stock, could cause the market price of our securities to decline and would result in the dilution of your holdings.
Future issuances of our common stock or securities convertible into, or exercisable or exchangeable for, our common stock, or the expiration of lock-up agreements that restrict the issuance of new common stock or the trading of outstanding common stock, could cause the market price of our common stock to decline. We cannot predict the effect, if any, of future issuances of our securities on the price of our securities. In all events, future issuances of our securities would result in the dilution of your holdings. In addition, the perception that new issuances of our securities could occur, or the perception that locked-up parties will sell their securities when the lock-ups expire, could adversely affect the market price of our securities.
Future issuances of debt securities, which would rank senior to our common stock upon our bankruptcy or liquidation, and future issuances of preferred stock, which could rank senior to our common stock for the purposes of dividends and liquidating distributions, may adversely affect the level of return you may be able to achieve from an investment in our securities.
In the future, we may attempt to increase our capital resources by offering debt securities. Upon bankruptcy or liquidation, holders of our debt securities, and lenders with respect to other borrowings we may make, would receive distributions of our available assets prior to any distributions being made to holders of our common stock. Moreover, if we issue preferred stock, the holders of such preferred stock could be entitled to preferences over holders of common stock in respect of the payment of dividends and the payment of liquidating distributions. Because our decision to issue debt or preferred stock in any future offering, or borrow money from lenders, will depend in part on market conditions and other factors beyond our control, we cannot predict or estimate the amount, timing or nature of any such future offerings or borrowings. Holders of our securities must bear the risk that any future offerings we conduct or borrowings we make may adversely affect the level of return, if any, they may be able to achieve from an investment in our securities.
We are authorized to issue “blank check” preferred stock without stockholder approval, which could adversely impact the rights of holders of our securities.
Our articles of incorporation authorize us to issue up to 50,000,000 shares of blank check preferred stock. Any preferred stock that we issue in the future may rank ahead of our securities in terms of dividend priority or liquidation premiums and may have greater voting rights than our securities. In addition, such preferred stock may contain provisions allowing those shares to be converted into shares of common stock, which could dilute the value of our securities to current stockholders and could adversely affect the market price, if any, of our securities. In addition, the preferred stock could be utilized, under certain circumstances, as a method of discouraging, delaying or preventing a change in control of our company. Although we have no present intention to issue any shares of authorized preferred stock, there can be no assurance that we will not do so in the future.
If our securities become subject to the penny stock rules, it would become more difficult to trade our shares.
The Securities and Exchange Commission (the “SEC”) has adopted rules that regulate broker-dealer practices in connection with transactions in penny stocks. Penny stocks are generally equity securities with a price of less than $5.00, other than securities registered on certain national securities exchanges or authorized for quotation on certain automated quotation systems, provided that current price and volume information with respect to transactions in such securities is provided by the exchange or system. If we do not retain a listing on Nasdaq or another national securities exchange and if the price of our securities is less than $5.00, our securities could be deemed a penny stock. The penny stock rules require a broker-dealer, before a transaction in a penny stock not otherwise exempt from those rules, to deliver a standardized risk disclosure document containing specified information. In addition, the penny stock rules require that before effecting any transaction in a penny stock not otherwise exempt from those rules, a broker-dealer must make a special written determination that the penny stock is a suitable investment for the purchaser and receive (i) the purchaser’s written acknowledgment of the receipt of a risk disclosure statement; (ii) a written agreement to transactions involving penny stocks; and (iii) a signed and dated copy of a written suitability statement. These disclosure requirements may have the effect of reducing the trading activity in the secondary market for our securities, and therefore stockholders may have difficulty selling their securities.
We are subject to ongoing public reporting requirements that are less rigorous than Exchange Act rules for companies that are not emerging growth companies and our stockholders could receive less information than they might expect to receive from more mature public companies.
We are required to publicly report on an ongoing basis as an “emerging growth company” (as defined in the JOBS Act) under the reporting rules set forth under the Exchange Act. For so long as we remain an emerging growth company, we may take advantage of certain exemptions from various reporting requirements that are applicable to other Exchange Act reporting companies that are not emerging growth companies, including but not limited to:
| ● | not being required to comply with the auditor attestation requirements of Section 404 of the Sarbanes-Oxley Act; |
| ● | being exempt from certain greenhouse gas emissions disclosure and related third-party assurance requirements; |
| ● | being permitted to comply with reduced disclosure obligations regarding executive compensation in our periodic reports and proxy statements; and |
| ● | being exempt from the requirement to hold a non-binding advisory vote on executive compensation and stockholder approval of any golden parachute payments not previously approved. |
In addition, Section 107 of the JOBS Act also provides that an emerging growth company can take advantage of the extended transition period provided in Section 7(a)(2)(B) of the Securities Act for complying with new or revised accounting standards. In other words, an emerging growth company can delay the adoption of certain accounting standards until those standards would otherwise apply to private companies. We have elected to take advantage of the benefits of this extended transition period. Our financial statements may therefore not be comparable to those of companies that comply with such new or revised accounting standards.
We expect to take advantage of these reporting exemptions until we are no longer an emerging growth company. We will remain an emerging growth company for up to five years, although if the market value of our securities that is held by non-affiliates exceeds $700 million as of any June 30 before that time, we would cease to be an emerging growth company as of the following December 31.
Because we are subject to ongoing public reporting requirements that are less rigorous than Exchange Act rules for companies that are not emerging growth companies, our stockholders could receive less information than they might expect to receive from more mature public companies. We cannot predict if investors will find our securities less attractive if we elect to rely on these exemptions, or if taking advantage of these exemptions would result in less active trading or more volatility in the price of our securities.
As a non-accelerated filer, we are not required to comply with the auditor attestation requirements of the Sarbanes-Oxley Act.
We are not an “accelerated filer” or a “large accelerated filer” under the Exchange Act. Rule 12b-2 under the Exchange Act defines an “accelerated filer” to mean any company that first meets the following conditions at the end of each fiscal year: The company had a public float of $75 million or more, but less than $700 million, as of the last business day of the company’s most recently completed second fiscal quarter; the company has been subject to the reporting requirements of the Exchange Act for at least twelve calendar months; the company has filed at least one annual report under the Exchange Act; the company did not have annual revenues of less than $100 million and either no public float or a public float of less than $700 million; and, once the company determines that it does not qualify for “smaller reporting company” status because it exceeded one or more of the current thresholds for such status, is not eligible to regain “smaller reporting company” status under the test provided under paragraph (3)(iii)(B) of the “smaller reporting company” definition in Rule 12b-2 of the Exchange Act. Rule 12b-2 under the Exchange Act defines a “large accelerated filer” in the same way as an “accelerated filer” except that the company meeting the definition must have a public float of $700 million or more as of the last business day of the company’s most recently completed second fiscal quarter.
A non-accelerated filer is not required to file an auditor attestation report on internal control over financial reporting that is otherwise required under Section 404(b) of the Sarbanes-Oxley Act.
Therefore, our internal control over financial reporting will not receive the level of review provided by the process relating to the auditor attestation included in annual reports of issuers that are subject to the auditor attestation requirements. In addition, we cannot predict if investors will find our common stock less attractive because we are not required to comply with the auditor attestation requirements. If some investors find our common stock less attractive as a result, there may be a less active trading market for our common stock and trading price for our common stock may be negatively affected. See also above, “—We are subject to ongoing public reporting requirements that are less rigorous than Exchange Act rules for companies that are not emerging growth companies and our stockholders could receive less information than they might expect to receive from more mature public companies.”
We are a “smaller reporting company” within the meaning of the Exchange Act, and if we take advantage of certain exemptions from disclosure requirements available to smaller reporting companies, this could make our securities less attractive to investors and may make it more difficult to compare our performance with other public companies.
Rule 12b-2 of the Exchange Act defines a “smaller reporting company” as an issuer that is not an investment company, an asset-backed issuer, or a majority-owned subsidiary of a parent that is not a smaller reporting company and that:
| | ● | had a public float of less than $250 million as of the last business day of its most recently completed second fiscal quarter, computed by multiplying the aggregate worldwide number of shares of its voting and non-voting common equity held by non-affiliates by the price at which the common equity was last sold, or the average of the bid and asked prices of common equity, in the principal market for the common equity; or |
| | | |
| | ● | in the case of an initial registration statement under the Securities Act or the Exchange Act for shares of its common equity, had a public float of less than $250 million as of a date within 30 days of the date of the filing of the registration statement, computed by multiplying the aggregate worldwide number of such shares held by non-affiliates before the registration plus, in the case of a Securities Act registration statement, the number of such shares included in the registration statement by the estimated public offering price of the shares; or |
| | | |
| | ● | in the case of an issuer whose public float as calculated under paragraph (1) or (2) of this definition was zero or whose public float was less than $700 million, had annual revenues of less than $100 million during the most recently completed fiscal year for which audited financial statements are available. |
If a company determines that it does not qualify for smaller reporting company status because it exceeded one or more of the above thresholds, it will remain unqualified unless when making its annual determination it meets certain alternative threshold requirements which will be lower than the above thresholds if its prior public float or prior annual revenues exceed certain thresholds.
As a smaller reporting company, we are not required to include a Compensation Discussion and Analysis section in our proxy statements; we may provide only two years of financial statements; and we need not provide the table of selected financial data. We will also be exempt from certain greenhouse gas emissions disclosure and related third-party assurance requirements. We also have other “scaled” disclosure requirements that are less comprehensive than issuers that are not smaller reporting companies which could make our securities less attractive to potential investors, which could make it more difficult for our securityholders to sell their securities.
As a “smaller reporting company,” we may at some time in the future choose to exempt our company from certain corporate governance requirements that could have an adverse effect on our public stockholders.
Under Nasdaq rules, a “smaller reporting company,” as defined in Rule 12b-2 under the Exchange Act, is not subject to certain corporate governance requirements otherwise applicable to companies listed on Nasdaq. For example, a smaller reporting company is exempt from the requirement of having a compensation committee composed solely of directors meeting certain enhanced independence standards, as long as the compensation committee has at least two members who do meet such standards. Although we have determined not to avail ourselves of this or other exemptions from Nasdaq requirements that are or may be afforded to smaller reporting companies while our shares and warrants are listed on Nasdaq, in the future we may elect to rely on any or all of these exemptions. By electing to utilize any such exemptions, our company may be subject to greater risks of poor corporate governance, poorer management decision-making processes, and reduced results of operations from problems in our corporate organization. Consequently, if we were to avail ourselves of these exemptions, the prices of our securities might suffer, and there is no assurance that we would be able to continue to meet all continuing listing requirements of Nasdaq from which we would not be exempt, including minimum stock price requirements.
ITEM 1B. UNRESOLVED STAFF COMMENTS.
Not applicable.
ITEM 1C. CYBERSECURITY.
Risk Management and Strategy
The Company recognizes the critical importance of developing, implementing, and maintaining robust cybersecurity measures to safeguard our information systems and protect the confidentiality, integrity, and availability of our data. We have developed the following processes as part of our strategy for assessing, identifying, and managing material risks from cybersecurity threats.
Managing Material Risks & Integrated Overall Risk Management
Information technology is important to our business operations and we are committed to protecting the privacy, security and integrity of our data, as well as our employee and customer data. This program is integrated into the Company’s overall enterprise risk management process.
We monitor and update our information technology networks and infrastructure to prevent, detect, address and mitigate risks associated with unauthorized access, misuse, computer viruses and other events that could have a security impact. Additionally, to protect and secure sensitive data such as customer information, we employ multi-factor authentication, a suite of security tools, systems monitoring and alerting, audit logs, and controls across our major systems, corporate devices, and business processes. Our cybersecurity process is designed to assess, identify, prevent, and manage cybersecurity risks and threats, as well as identify, contain and respond to cybersecurity incidents. This process includes a variety of activities, such as company-wide security awareness training, including regular phishing simulations, acceptable use training, self-assessments, and other targeted training throughout the year as appropriate. These cybersecurity trainings provide employees the opportunity to gain an understanding of the various forms of cybersecurity incidents and enable our employees to handle and report any suspicious activity or threat.
To date, our approach to cybersecurity has been effective in protecting the confidentiality, integrity, and availability of our information; however, we cannot guarantee that its efforts will be successful in preventing all cybersecurity incidents. Further, we currently maintain a cyber insurance policy that provides coverage for security breaches; however, such insurance may not be sufficient in type or amount to cover us against claims related to security breaches, cyber-attacks and other related breaches.
Engaging Third-parties on Risk Management
Recognizing the complexity and evolving nature of cybersecurity threats, we leverage the expertise of a managed service provider, and when warranted will engage with independent third parties in evaluating and testing our risk management systems. These service providers enable us to leverage specialized knowledge and insights, ensuring our cybersecurity strategies meet generally accepted industry best practices. Our Chief Information Officer also performs ongoing review of current practices to further ensure cybersecurity.
Overseeing Third-Party Risk
Because we are aware of the risks associated with third-party service providers, we implement processes to oversee and manage these risks. We conduct thorough security assessments of all third-party providers before engagement and maintain ongoing monitoring to ensure compliance with our cybersecurity standards. The monitoring includes regular assessments by our Chief Information Officer. This approach is designed to mitigate risks related to data breaches or other security incidents originating from third parties.
Risks from Cybersecurity Threats
We have not encountered cybersecurity challenges that have materially affected or are reasonably likely to materially affect us, including our business strategy, results of operations, or financial condition.
Governance
Board of Directors Oversight
Our board of directors oversees the management of risks associated with cybersecurity threats.
Management’s Role Managing Risk
The Company’s Chief Information Officer is primarily responsible for assessing, monitoring and managing our cybersecurity risks. The Chief Information Officer must ensure that all industry standard cybersecurity measures are functioning as required to prevent or detect cybersecurity threats and related risks. The Chief Information Officer provides briefings on cybersecurity threats and related risks to the Chief Executive Officer on a regular basis. Our Chief Information Officer has had responsibility over cybersecurity, data privacy and classification, incident response, disaster recovery, and business continuity in a number of positions in the field of information technology. The Chief Information Officer oversees and tests our compliance with standards, remediates known risks, and leads our employee training program.
Monitoring Cybersecurity Incidents
The Chief Information Officer is continually informed about the latest developments in cybersecurity, including potential threats and innovative risk management techniques. The Chief Information Officer implements and oversees processes for the regular monitoring of our information systems. This includes the deployment of industry-standard security measures and regular system audits to identify potential vulnerabilities. In the event of a cybersecurity incident, the Chief Information Officer will implement an incident response plan. This plan includes immediate actions to mitigate the impact and long-term strategies for remediation and prevention of future incidents.
Reporting to Board of Directors
Significant cybersecurity matters, and strategic risk management decisions, will be escalated to the board of directors.
ITEM 2. PROPERTIES.
We are headquartered in Quincy, Massachusetts, where we occupy approximately 10,000 square feet of office space pursuant to a lease agreement, as amended, that will terminate on May 31, 2025. Our management team, client service team, marketing, operations, and sales team are all primarily based in this office. Our monthly rent for this facility was $24,521 from June 2020 to May 2021, $25,178 from June 2021 to May 2022, $25,835 from June 2022 to May 2023, and will be $26,491 from June 2023 to May 2024 and $27,148 from June 2024 to May 2025. We may also be required to pay certain taxes and expenses to the landlord under the lease agreement. The foregoing description of the lease agreement and amendment to the lease agreement is qualified in its entirety by reference to the full text of such agreements which are filed as Exhibit 10.3 and Exhibit 10.4 to this Annual Report on Form 10-K/A, respectively, and which are incorporated herein by reference.
Under a lease agreement dated May 31, 2023 (the “Miller Lease Agreement”) with Miller Family Walpole LLC, as landlord (the “Miller Landlord”), for a warehouse facility in Walpole, Massachusetts, we will pay base rent of $179,550.00 in the first year of the lease and an increase of 2% per annum in each subsequent year. We may extend the term for an additional five years upon the same base rent terms upon 12 months’ notice. We will be responsible for all property and other taxes and expenses related to the facility except for maintenance of certain structural elements. The initial lease term commenced on June 1, 2023 and terminates on May 31, 2028. We may assign our rights to the lease and property at the facility as collateral to a lender. The Miller Landlord is also required to execute a landlord lien waiver and collateral access agreement upon request. The Miller Lease Agreement contains provisions for minimum insurance, mutual indemnification from certain claims relating to the Miller Lease Agreement, and customary default and related termination and remedy provisions. The foregoing description of the Miller Lease Agreement is qualified in its entirety by reference to the full text of the agreement, a copy of which is filed as Exhibit 10.37 to this Annual Report on Form 10-K/A.
We also lease satellite office space in Warsaw, Indiana; Mt. Pleasant, South Carolina; Walpole, Massachusetts; and Tomball, Texas. Our aggregate rent payments for these facilities was $508,288 during the fiscal year ended December 31, 2023. Our employees also work remotely from 20 additional locations around the United States using other facilities.
We believe that all our properties have been adequately maintained, are generally in good condition, and are suitable and adequate for our businesses.
ITEM 3. LEGAL PROCEEDINGS.
From time to time, we may become involved in various lawsuits and legal proceedings which arise in the ordinary course of business. However, litigation is subject to inherent uncertainties, and an adverse result in these or other matters may arise from time to time that may harm our business. We are not currently aware of any such legal proceedings or claims that we believe will have a material adverse effect on our business, financial condition or operating results.
ITEM 4. MINE SAFETY DISCLOSURES.
Not applicable.
PART II
ITEM 5. MARKET FOR REGISTRANT’S COMMON EQUITY, RELATED STOCKHOLDER MATTERS AND ISSUER PURCHASES OF EQUITY SECURITIES.
Market Information
Our common stock and publicly-traded warrants were listed and began trading on the Nasdaq Capital Market on November 9, 2021, under the symbols “STRN” and “STRNW,” respectively. On December 16, 2022, the ticker symbols for the common stock and publicly-traded warrants were changed to “SWAG” and “SWAGW,” respectively. Prior to the listing, there was no public market for our common stock and publicly-traded warrants.
Number of Holders of Our Common Stock
As of March 28, 2024, there were approximately 66 holders of record of our common stock, which does not include holders whose shares are held in nominee or “street name” accounts through banks, brokers or other financial institutions.
Securities Authorized for Issuance Under Equity Compensation Plans
The information required by this Item regarding equity compensation plans is incorporated by reference to the information set forth in Item 12. “Security Ownership of Certain Beneficial Owners and Management and Related Stockholder Matters – Securities Authorized for Issuance Under Equity Compensation Plans”.
Dividend Policy
We have never declared or paid cash dividends on our common stock. We currently intend to retain all available funds and any future earnings for use in the operation of our business and do not anticipate paying any cash dividends on our common stock in the near future. We may also enter into credit agreements or other borrowing arrangements in the future that will restrict our ability to declare or pay cash dividends on our common stock. Any future determination to declare dividends will be made at the discretion of our board of directors and will depend on our financial condition, operating results, capital requirements, contractual restrictions, general business conditions and other factors that our board of directors may deem relevant. See also Item 1A. “Risk Factors—Risks Related to Our Common Stock and Publicly-Traded Warrants—We do not expect to declare or pay dividends in the foreseeable future.”
Recent Sales of Unregistered Securities
We did not sell any equity securities during the 2023 fiscal year that were not previously disclosed in a Quarterly Report on Form 10-Q or a Current Report on Form 8-K that was filed during the 2023 fiscal year.
Purchases of Equity Securities
The following table provides information about our repurchases of common stock during the three months ended December 31, 2023:
| Period | | Total
Number of
Shares
Purchased | | | Average
Price Paid per
Share | | | Total
Number of
Shares
Purchased
as Part of
Publicly
Announced
Plans or
Programs(1) | | | Maximum
Approximate
Dollar Value
of Shares
that May Yet
be Purchased
Under the
Plans or
Programs(1) | |
| October 1, 2023 – October 31, 2023 | | | — | | | $ | — | | | | 1,797,159 | | | $ | 6,643,289 | |
| November 1, 2023 – November 30, 2023 | | | 4,505 | | | $ | 1.31 | | | | 1,801,664 | | | $ | 6,637,399 | |
| December 1, 2023 – December 31, 2023 | | | 13,502 | | | $ | 1.47 | | | | 1,815,166 | | | $ | 6,617,594 | |
| (1) | For a description of the Company’s stock repurchase program, see Item 2. “Management’s Discussion and Analysis of Financial Condition and Results of Operations. – Liquidity and Capital Resources – Stock Repurchase Program”. |
ITEM 6. [RESERVED]
ITEM 7. MANAGEMENT’S DISCUSSION AND ANALYSIS OF FINANCIAL CONDITION AND RESULTS OF OPERATIONS.
The following discussion and analysis summarizes the significant factors affecting our operating results, financial condition, liquidity and cash flows as of and for the periods presented below. The following discussion and analysis should be read in conjunction with our financial statements and the related notes thereto included elsewhere in this report. The discussion contains forward-looking statements that are based on the beliefs of management, as well as assumptions made by, and information currently available to, management. Actual results could differ materially from those discussed in or implied by forward-looking statements as a result of various factors, including those discussed below and elsewhere in this report, particularly in the sections titled Item 1A. “Risk Factors” and “Introductory Notes – Note Regarding Forward-Looking Statements.”
Overview
We are an outsourced marketing solutions provider that sells branded products to customers. We purchase products and branding through various third-party manufacturers and decorators and resell the finished goods to customers.
In addition to selling branded products, we offer clients custom sourcing capabilities; a flexible and customizable e-commerce solution for promoting branded merchandise and other promotional products, managing promotional loyalty and incentives, print collateral, and event assets, order and inventory management, and designing and hosting online retail popup shops, fixed public retail online stores, and online business-to-business service offerings; creative and merchandising services; warehousing/fulfillment and distribution; print-on-demand; kitting; point of sale displays; and loyalty and incentive programs.
We earn the majority of our revenue from the sale of unique, quality promotional products for a wide variety of industries primarily to support marketing efforts. We also derive revenues from service fees from loyalty programs, event management, print services, fulfillment services, and technology services.
The majority of our revenue is derived from program business, although only a small percentage of our customers are considered programmatic. For the years 2023 and 2022, program clients accounted for 81.4% and 76.8% of total revenue, respectively. Fewer than 350 of our more than 2,000 active customers are considered to be program clients. Our active customers are any organizations, businesses, or divisions of a parent organization which have purchased directly or indirectly from us within the last two years, and include organizations that have bought from other organizations for which Stran acts as an established sub-contractor. We define transactional customers as customers that place an order with us and do not have an agreement with us covering ongoing branding requirements. We define program clients as clients that have a contractual obligation for specific ongoing branding needs. Program offerings include ongoing inventory, use of technology platform, warehousing, creative services, and additional client support. Those program customers are geared towards longer-lasting relationships that helps secure recurring revenue well into the future.
Our sales increased 31.3% year-over-year in 2023 compared to 2022, which we believe was primarily due to higher spending from existing clients as well as business from new customers. Additionally, we benefited from the acquisition of the assets of G.A.P. Promotions in January 2022, the assets of Trend Brand Solutions in August 2022, the assets of Premier NYC in December 2022, and the assets of T R Miller in June 2023, respectively.
As of December 31, 2023, we had approximately $49.0 million of total assets with approximately $35.7 million of total stockholders’ equity.
Restatement of Previously Issued Consolidated Financial Statements
This Annual Report on Form 10-K/A includes financial statements that amend and restate the Company’s financial statements as of and for the fiscal years ended December 31, 2023 and 2022. This Item 7. “Management’s Discussion and Analysis of Financial Condition and Results of Operations” has been amended and restated to give effect to the restatement. Refer to Note B to the financial statements included in this Annual Report on Form 10-K/A for a discussion of the restatement and the impact on the specific accounts in such financial statements. In addition, Part II, Item 9A. “Controls and Procedures” and certain other items have been amended and restated. For additional information regarding the restatement and the items of this filing that have been amended and restated, refer to the Explanatory Note to this Annual Report on Form 10-K/A.
Recent Developments
Restatement of Financial Statements
This Annual Report on Form 10-K/A includes financial statements that amend and restate the Company’s financial statements as of and for the fiscal years ended December 31, 2023 and 2022. Refer to Note B to the financial statements included in this Annual Report on Form 10-K/A for a discussion of the restatement and the impact on the specific accounts in such financial statements.
Lease Agreement
On January 10, 2025, the Company entered into a seven-year lease agreement for new office space in North Quincy, Massachusetts. The Company’s existing lease agreement for its office space expires May 31, 2025. The new lease term begins on June 1, 2025 and expires on May 31, 2032 with an option to extend the lease an additional five years. The lease contains an initial base rent of $21 per month with 2.2% - 2.5% annual escalations, plus a percentage of taxes and operating expenses incurred by the lessor in connection with the ownership and management of the property.
Termination of Revolving Line of Credit
Stran Loyalty Solutions, LLC, a Nevada limited liability company (“Stran Loyalty Solutions”), a wholly-owned subsidiary of the Company, entered into a factoring arrangement with a third party to provide accounts receivable financing to Stran Loyalty Solutions. In connection with the factoring arrangement, the Company provided a secured guarantee of Stran Loyalty Solutions’ obligations under the factoring arrangement. Prior to this arrangement, the Company had been a party to the Revolving Demand Line of Credit Loan Agreement, dated as of November 22, 2021 (the “Initial Loan Agreement”), between the Company and Salem Five Cents Savings Bank, a Massachusetts savings bank (“Salem Five Cents”), as amended by the Commercial Loan Modification Agreement, dated as of February 12, 2024, between the Company and Salem Five Cents (as amended, the “Loan Agreement”), and the Revolving Demand Line of Credit Note, dated November 22, 2021, by the Company in favor of Salem Five Cents (the “Demand Note”). The Loan Agreement and the Demand Note provided for a secured revolving loan facility in an aggregate principal amount of up to $7.0 million (the “Revolving Line of Credit”). In discussions with Salem Five Cents prior to the establishment of the factoring arrangement, Salem Five Cents indicated that it would terminate the Revolving Line of Credit because of a policy which prohibited it from agreeing to subordination of its security interest in the Company’s assets.
Accordingly, on September 9, 2024, Salem Five Cents delivered a letter (the “Termination Letter”) to the Company that stated that, effective August 26, 2024 (the “Termination Date”), Salem Five Cents terminated all obligations under the Loan Agreement and the Demand Note. The Termination Letter further stated that the Loan Agreement and the Demand Note and certain related loan documents shall be considered no longer in force or effect. The Company had no funds drawn on the Revolving Line of Credit on the Termination Date.
Acquisition of Assets of Bangarang Enterprises, LLC
On August 23, 2024, Stran Loyalty Solutions entered into a Secured Party Sale Agreement, dated as of August 23, 2024 (the “Sale Agreement”), between Stran Loyalty Solutions and Sallyport Commercial Finance, LLC, a Delaware limited liability company (“Secured Party”), pursuant to which Stran Loyalty Solutions agreed to purchase, on an as-is basis, all of the rights and interests of Bangarang Enterprises, LLC, a California limited liability company (d/b/a Gander Group) (“Bangarang”), in and to substantially all of the assets of Bangarang (the “Bangarang Assets”) from Secured Party as a private sale pursuant to Article 9 of the Uniform Commercial Code (the “Bangarang Transaction”).
Under the Sale Agreement, the aggregate consideration for the Bangarang Assets consisted of (a) cash payments by Stran Loyalty Solutions to Secured Party of approximately $1.1 million (the “Cash Purchase Price”), and (b) the assumption by Stran Loyalty Solutions of certain liabilities totaling approximately $5.5 million (the “Bangarang Assumed Liabilities”), subject to adjustments, as described below, at and following the Bangarang Transaction Closing (as defined below), including the payment at the Bangarang Transaction Closing of $150 thousand to Warson Capital Partners, LLC, an investment banking firm retained by Bangarang, for its fees and expenses with respect to the Bangarang Transaction, including the marketing for sale of the Bangarang Assets (the “Transaction Expense Payment”).
At the consummation of the transactions contemplated by the Sale Agreement (the “Bangarang Transaction Closing”), Stran Loyalty Solutions paid the Cash Purchase Price and assumed the Bangarang Assumed Liabilities, including the payment of the Transaction Expense Payment. As a result of the Bangarang Transaction Closing, the Company indirectly acquired substantially all of the assets of Bangarang, including all of the equity of Gander Group Louisiana, LLC, a Louisiana limited liability company (“GGLA”), which became a wholly-owned subsidiary of Stran Loyalty Solutions.
In addition, Stran Loyalty Solutions entered into a Release Agreement, dated as of August 23, 2024, between Bangarang and Stran Loyalty Solutions (the “Release Agreement”). Under the Release Agreement, Bangarang granted a full and complete waiver and release of Stran Loyalty Solutions and its affiliates of any non-competition, non-solicitation, or similar restrictive covenants of any parties owed to Bangarang or any of its affiliates.
The agreements included provisions for indemnification, reimbursement for returned items, handling of assets and liabilities during Bangarang’s wind-down, and certain other matters.
Annual Executive Bonuses
On February 15, 2024, the Company awarded annual bonuses for the fiscal year ended December 31, 2023 to Andrew Shape, David Browner, John Audibert, and Sheila Johnshoy. The bonus compensation is described in Item 11. “Executive Compensation”.
Chief Information Officer Compensation
Effective January 2, 2024, Ian Wall became our Chief Information Officer. Mr. Wall’s compensation package is described in Item 11. “Executive Compensation – Executive Officer Employment and Consulting Agreements – Employment Agreement with Ian Wall”.
Emerging Growth Company and Smaller Reporting Company
We qualify as an “emerging growth company” under the Jumpstart Our Business Startups Act of 2012 (the “JOBS Act”). As a result, we are permitted to, and intend to, rely on exemptions from certain disclosure requirements. For so long as we are an emerging growth company, we will not be required to:
| ● | have an auditor report on our internal control over financial reporting pursuant to Section 404(b) of the Sarbanes-Oxley Act; |
| ● | present three years, and may instead present only two years, of audited financial statements, with correspondingly reduced “Management’s Discussion and Analysis of Financial Condition and Results of Operations” disclosure in this report; |
| ● | comply with any requirement that may be adopted by the Public Company Accounting Oversight Board regarding mandatory audit firm rotation or a supplement to the auditor’s report providing additional information about the audit and the financial statements (i.e., an auditor discussion and analysis); |
| ● | comply with certain greenhouse gas emissions disclosure and related third-party assurance requirements; |
| ● | submit certain executive compensation matters to stockholder advisory votes, such as “say-on-pay” and “say-on-frequency;” and |
| ● | disclose certain executive compensation related items such as the correlation between executive compensation and performance and comparisons of the chief executive officer’s compensation to median employee compensation. |
In addition, Section 107 of the JOBS Act also provides that an emerging growth company can take advantage of the extended transition period provided in Section 7(a)(2)(B) of the Securities Act of 1933, as amended, for complying with new or revised accounting standards. In other words, an emerging growth company can delay the adoption of certain accounting standards until those standards would otherwise apply to private companies. We have elected to take advantage of the benefits of this extended transition period. Our financial statements may therefore not be comparable to those of companies that comply with such new or revised accounting standards.
We will remain an emerging growth company until the earliest of (i) the last day of the fiscal year following the fifth anniversary of the IPO, (ii) the last day of the first fiscal year in which our total annual gross revenues are $1.07 billion or more, (ii) the date that we become a “large accelerated filer” as defined in Rule 12b-2 under the Securities Exchange Act of 1934, as amended (the “Exchange Act”), which would occur if the market value of our common stock that is held by non-affiliates exceeds $700.0 million as of the last business day of our most recently completed second fiscal quarter or (iv) the date on which we have issued more than $1.0 billion in non-convertible debt during the preceding three year period.
To the extent that we continue to qualify as a “smaller reporting company,” as such term is defined in Rule 12b-2 under the Exchange Act, after we cease to qualify as an emerging growth company, certain of the exemptions and accommodations available to us as an emerging growth company may continue to be available to us as a smaller reporting company, including as to: (i) the auditor attestation requirements of Section 404(b) of the Sarbanes-Oxley Act; (ii) scaled executive compensation disclosures; (iii) presenting three years of audited financial statements; and (iv) compliance with certain greenhouse gas emissions disclosure and related third-party assurance requirements.
Principal Factors Affecting Our Financial Performance
Our operating results are primarily affected by the following factors:
| ● | our ability to acquire new customers or retain existing customers; |
| ● | our ability to offer competitive product pricing; |
| ● | our ability to broaden product offerings; |
| ● | industry demand and competition; |
| ● | our ability to leverage technology and use and develop efficient processes; |
| ● | our ability to attract and retain talented employees; and |
| ● | market conditions and our market position. |
Results of Operations
The following table sets forth key components of our results of operations during the years ended December 31, 2023 and 2022, both in dollars and as a percentage of our revenues.
| | | Years Ended December 31, | |
| | | 2023 (Restated) | | | 2022 (Restated) | |
| | | Amount (in thousands) | | | % of Revenues | | | Amount (in thousands) | | | % of Revenues | |
| SALES | | | | | | | | | | | | |
| Sales | | $ | 75,147 | | | | 98.9 | % | | $ | 57,878 | | | | 100.0 | % |
| Sales – related parties | | | 853 | | | | 1.1 | % | | | — | | | | — | % |
| Total sales | | | 76,000 | | | | 100.0 | % | | | 57,878 | | | | 100.0 | % |
| | | | | | | | | | | | | | | | | |
| COST OF SALES: | | | | | | | | | | | | | | | | |
| Cost of sales | | | 50,492 | | | | 66.4 | % | | | 42,493 | | | | 73.4 | % |
| Cost of sales - related parties | | | 656 | | | | 0.9 | % | | | — | | | | — | % |
| Total cost of sales | | | 51,148 | | | | 67.3 | % | | | 42,493 | | | | 73.4 | % |
| | | | | | | | | | | | | | | | | |
| GROSS PROFIT | | | 24,852 | | | | 32.7 | % | | | 15,385 | | | | 26.6 | % |
| | | | | | | | | | | | | | | | | |
| OPERATING EXPENSES: | | | | | | | | | | | | | | | | |
| General and administrative expenses | | | 25,310 | | | | 33.3 | % | | | 17,789 | | | | 30.7 | % |
| Goodwill impairment | | | 810 | | | | 1.1 | % | | | 1,182 | | | | 2.0 | % |
| Total operating expenses | | | 26,120 | | | | 34.4 | % | | | 18,971 | | | | 32.8 | % |
| | | | | | | | | | | | | | | | | |
| LOSS FROM OPERATIONS | | | (1,268 | ) | | | (1.7 | )% | | | (3,586 | ) | | | (6.2 | )% |
| | | | | | | | | | | | | | | | | |
| OTHER INCOME AND (LOSS): | | | | | | | | | | | | | | | | |
| Other income | | | 186 | | | | 0.2 | % | | | 34 | | | | 0.1 | % |
| Interest income | | | 570 | | | | 0.8 | % | | | 95 | | | | 0.2 | % |
| Change in fair value of contingent earn-out liability | | | 65 | | | | 0.1 | % | | | 180 | | | | 0.3 | % |
| Realized gain (loss) on investments | | | 103 | | | | 0.1 | % | | | (1 | ) | | | — | % |
| Total other income | | | 924 | | | | 1.2 | % | | | 308 | | | | 0.5 | % |
| | | | | | | | | | | | | | | | | |
| LOSS BEFORE INCOME TAXES | | | (344 | ) | | | (0.5 | )% | | | (3,278 | ) | | | (5.7 | )% |
| | | | | | | | | | | | | | | | | |
| Provision for income taxes | | | 41 | | | | 0.1 | % | | | 222 | | | | 0.4 | % |
| | | | | | | | | | | | | | | | | |
| NET LOSS | | $ | (385 | ) | | | (0.5 | )% | | $ | (3,500 | ) | | | (6.0 | )% |
Sales
Sales consist primarily of the selling price of the merchandise, service or outbound shipping and handling charges, less discounts, coupons redeemed, returns and credits.
Our sales increased 31.3% to approximately $76.0 million for the year ended December 31, 2023, from approximately $57.9 million for the year ended December 31, 2022. The increase was primarily due to higher spending from existing clients as well as business from new customers. Additionally, the acquisitions of G.A.P. Promotions in January 2022, Trend Brand Solutions in August 2022, Premier NYC in December 2022, and T R Miller in June 2023 accounted for approximately $15.1 million, or 19.9%, of sales, for 2023, compared to approximately $6.8 million, or 11.7%, of sales for 2022, as described in more detail immediately below.
The January 2022 acquisition of G.A.P. Promotions generated approximately $4.3 million of sales for the year ended December 31, 2023, compared to approximately $5.7 million from such assets for the year ended December 31, 2022. The August 2022 acquisition of Trend Brand Solutions generated approximately $2.5 million of sales for the year ended December 31, 2023 compared to approximately $1.1 million from such assets for the year ended December 31, 2022. The December 2022 acquisition of Premier NYC generated approximately $1.3 million of sales for the year ended December 31, 2023, compared to no sales from such assets for the year ended December 31, 2022. The June 2023 acquisition of T R Miller generated approximately $7.0 million of sales for the year ended December 31, 2023, compared to no sales from such assets for the year ended December 31, 2022. Our recurring organic sales, defined as sales excluding revenue from the G.A.P Promotions, Trend Brand Solutions, Premier NYC, and T R Miller acquisitions, increased 19.2%, or approximately $9.8 million, to approximately $60.9 million for the year ended December 31, 2023, from approximately $51.1 million for the year ended December 31, 2022.
Cost of Sales
Our total cost of sales increased 20.4% to approximately $51.1 million for the year ended December 31, 2023, from approximately $42.5 million for the year ended December 31, 2022. As a percentage of sales, cost of sales decreased to 67.3% for the year ended December 31, 2023 from 73.4% for the year ended December 31, 2022. The increase in the dollar amount of cost of purchases and freight was primarily due to an increase in sales of 31.3% from period to period.
Gross Profit
Gross profit consists of sales less total costs of sales. Our gross profit increased 61.5% to approximately $24.9 million, or 32.7% of sales, for the year ended December 31, 2023, from approximately $15.4 million, or 26.6% of sales, for the year ended December 31, 2022. The increase in the dollar amount of gross profit was due to an increase in sales of approximately $18.1 million for the reasons described above, partially offset by an increase in cost of sales of approximately $8.7 million in aggregate for the reasons described above. The increase in gross profit margin to 32.7% for the year ended December 31, 2023 compared to 26.6% for the year ended December 31, 2022, was primarily due to larger margins recognized on certain customer orders in excess of 40.0%, efficiencies gained in the sales process, and large write downs of inventory during the year ended December 31, 2022.
Operating Expenses
Operating expenses consist of general and administrative expenses and goodwill impairment. Our operating expenses increased 37.7%, or approximately $7.1 million, to approximately $26.1 million for the year ended December 31, 2023, from approximately $19.0 million for the year ended December 31, 2022. As a percentage of sales, operating expenses increased to 34.4% for the year ended December 31, 2023, from 32.8% for the year ended December 31, 2022. The increase in the dollar amount of operating expenses was primarily due to an increase in general and administrative expenses of approximately $7.5 million, or 42.3%, which in turn was primarily due to aggregate expenses related to the organic growth in our business.
Other Income and (Loss)
Other income and (loss) consist of other income, interest income, change in fair value of contingent earn-out liability and unrealized gain (loss) on investments. Our other income was approximately $186 thousand for the year ended December 31, 2023, compared to approximately $34 thousand for the year ended December 31, 2022. This change was primarily due to an accrual adjustment to certain earn-out obligations relating to our acquisition of the assets of Wildman Imprints, Trend Brand Solutions, and Premier NYC. Our interest income was approximately $570 thousand for the year ended December 31, 2023, compared to approximately $95 thousand for the year ended December 31, 2022. This change was primarily due to interest generated from investments. Our change in fair value of contingent earn-out liability was approximately $65 thousand for the year ended December 31, 2023, compared to approximately $180 thousand for the year ended December 31, 2022. This change was primarily due to an update to the estimated fair value of the remaining contingent earn-out liabilities related to business combinations. Our unrealized gain on investments was approximately $103 thousand for the year ended December 31, 2023, compared to our unrealized loss on investment of approximately $1 thousand for the year ended December 31, 2022. This change was primarily due to the recording of all investments at estimated fair value.
Income Tax Provision
Income tax provision reflects statutory tax rates in the jurisdictions in which we operate adjusted for permanent book/tax differences.
Income tax provision for the year ended December 31, 2023 was approximately $41 thousand compared to income tax provision of approximately $0.2 million for the year ended December 31, 2022. Income tax provision for the years ended December 31, 2023 and 2022 accounted for 11.9% and 6.8%, respectively, of loss before income taxes of approximately $0.3 million and approximately $3.3 million, respectively. For 2023 and 2022, the Company recorded an income tax provision comprised of state income taxes and a valuation allowance against its net deferred tax assets as well as a minimum state tax liability. The Company recorded a valuation allowance since it generated a deficit over a three-year cumulative period.
Based on management’s expectations of future earnings and recognition of a valuation allowance, we anticipate that our effective tax rate will remain similar to the rate recorded in 2023.
For further discussion of changes in the income tax provision, refer to Notes A and R to our financial statements beginning on page F-1 of this Annual Report on Form 10-K/A.
Net Loss
Our net loss for the year ended December 31, 2023 was approximately $0.4 million, compared to approximately $3.5 million for the year ended December 31, 2022. This change was primarily due to the increase in sales during 2023 from the acquisition of each of G.A.P. Promotions, Trend Brand Solutions, Premier NYC, and T R Miller to approximately $15.1 million in aggregate, from approximately $6.8 million from the acquisition of G.A.P. Promotions, Trend Brand Solutions, and Premier NYC during 2022, and the increase of approximately $9.8 million from recurring organic sales during 2023 compared to 2022. These factors were partially offset by the reasons described above for the increase in operating expenses and the increase in purchasing costs.
Liquidity and Capital Resources
As of December 31, 2023, we had cash and cash equivalents of approximately $8.1 million and investments of approximately $10.4 million. We have financed our operations primarily through cash generated from our initial public offering of common stock and warrants to purchase common stock in November 2021, our private placement of common stock and warrants to purchase common stock in December 2021, and operations.
We believe that our current levels of cash will be sufficient to meet our anticipated cash needs for our operations and cash payment obligations for both the 12 months ended December 31, 2024 and in the long-term beyond this period, including our anticipated costs associated with being a public reporting company. We may, however, in the future require additional cash resources due to changing business conditions, implementation of our strategy to expand our business, or other investments or acquisitions we may decide to pursue. If our own financial resources are insufficient to satisfy our capital requirements, we may seek to sell additional equity or debt securities or obtain additional credit facilities. The sale of additional equity securities could result in dilution to our stockholders. The incurrence of indebtedness would result in increased debt service obligations and could require us to agree to operating and financial covenants that would restrict our operations. Financing may not be available in amounts or on terms acceptable to us, if at all. Any failure by us to raise additional funds on terms favorable to us, or at all, could limit our ability to expand our business operations and could harm our overall business prospects.
Summary of Cash Flow
The following table provides detailed information about our net cash flow for fiscal years ended December 31, 2023 and 2022:
| | | Years Ended December 31, | |
| | | 2023 (Restated) (in thousands) | | | 2022 (Restated) (in thousands) | |
| Net cash used in operating activities | | $ | (2,550 | ) | | $ | (2,000 | ) |
| Net cash used in investing activities | | | (3,736 | ) | | | (12,280 | ) |
| Net cash used in financing activities | | | (909 | ) | | | (2,693 | ) |
| Net decrease in cash and cash equivalents | | | (7,195 | ) | | | (16,973 | ) |
| Cash and cash equivalents at beginning of year | | | 15,254 | | | | 32,227 | |
| Cash and cash equivalents at end of year | | $ | 8,059 | | | $ | 15,254 | |
Net cash used in operating activities was approximately $2.6 million for the year ended December 31, 2023, as compared to approximately $2.0 million for the year ended December 31, 2022. The increase in net cash used in operating activities for the year ended December 31, 2023 compared to the year ended December 31, 2022 was primarily due to a decrease in rewards program liability.
Net cash used in investing activities was approximately $3.7 million for the year ended December 31, 2023, as compared to approximately $12.3 million for the year ended December 31, 2022. The decrease in net cash used in investing activities for the year ended December 31, 2023 compared to the year ended December 31, 2022 was primarily due to reduced purchases of investments.
Net cash used in financing activities was approximately $0.9 million for the year ended December 31, 2023, as compared to approximately $2.7 million for the year ended December 31, 2022. The decrease in net cash used in financing activities for the year ended December 31, 2023 compared to the year ended December 31, 2022 was primarily due to reduced repurchases of our common stock.
Stock Repurchase Program
As initially announced on February 23, 2022, under our stock repurchase program, we may repurchase up to $10.0 million of our outstanding shares of common stock from time to time in the open market, in accordance with all applicable securities laws and regulations, including Rule 10b-18. Our decision to repurchase our shares, as well as the timing of such repurchases, will depend on a variety of factors that include ongoing assessments of our capital needs, market conditions and the price of our common stock, and other corporate considerations, as determined by management. Repurchases will also only be made in accordance with the Company’s insider trading policy as if such purchases were made by a person covered by the policy. Our insider trading policy generally permits insider purchases of our stock only during the period beginning on the second business day following the day of public release of our quarterly or annual earnings and ending on the last day of the then-current quarter. There is no defined number of shares to be repurchased over a specified timeframe through the life of the stock repurchase program. The repurchase authorization has no expiration date but may be suspended or discontinued at any time. Stock repurchases are paid using cash generated by operations.
In connection with our stock repurchase program, on May 23, 2022, we announced that we had established a trading plan with B. Riley intended to qualify under Rule 10b-18. In May 2023, we renewed the trading plan. The trading plan instructs B. Riley to repurchase shares of common stock for our account in accordance with Rule 10b-18 and our instructions. Repurchases under the trading plan may continue until the trading plan terminates in June 2024 unless terminated earlier or extended.
As of December 31, 2023, we had repurchased a total of 1,815,166 shares of common stock for total payments of approximately $3.4 million, and approximately $6.6 million remained available under the stock repurchase program for future stock repurchases. During the three months ended December 31, 2023, we repurchased a total of 18,007 shares for aggregate payments of approximately $26 thousand under the Trading Plan. See Item 5. “Market For Registrant’s Common Equity, Related Stockholder Matters and Issuer Purchases of Equity Securities. – Purchases of Equity Securities” for further information about repurchases of common stock during the three months ended December 31, 2023.
Debt
On November 22, 2021, we entered into the Initial Loan Agreement with Salem Five Cents, for the Revolving Line of Credit, consisting of aggregate loans of up to $7.0 million, evidenced by the Demand Note. The Revolving Line of Credit and the Demand Note were secured by a first priority security interest in all assets and property of the Company, as provided in the Security Agreement, dated November 22, 2021, between Salem Five Cents and the Company (the “Security Agreement” and together with the Initial Loan Agreement and the Demand Note, the “Loan Documents”), and as described below.
The amount available under the Revolving Line of Credit was the lesser of $7.0 million or the sum of (x) eighty percent (80.0%) of the then-outstanding amount of Eligible Accounts (as defined below), plus (y) fifty percent (50.0%) of Eligible Inventory (as defined below); minus one hundred (100.0%) percent of the aggregate amount then drawn under the Revolving Line of Credit for the account of the Company. In addition, advances based upon Eligible Inventory were required to be capped at all times at $2.0 million. “Eligible Accounts” was defined as accounts that meet a number of requirements, including, unless otherwise approved by Salem Five Cents, being less than 90 days from the date of invoice not subject to any prior assignment, claim, lien, or security interest, not subject to set-off, credit, allowance or adjustment by the account debtor, arose in the ordinary course of the Company’s business, not an intercompany obligation, not subject to notice of bankruptcy or insolvency of the account debtor, not owed by an account debtor whose principal place of business was outside the United States, not a government account, not be evidenced by promissory notes, and not one of the accounts owed by an account debtor 25% or more of whose accounts were 90 or more days past invoice date; or otherwise not deemed acceptable by Salem Five Cents in accordance with its normal credit policies. “Eligible Inventory” was defined as all finished goods, work in progress and raw materials and component parts of inventory owned by the Company. Eligible Inventory did not include any inventory held on consignment or not otherwise owned by the Company; any inventory which had been returned by a customer or was damaged or subject to any legal encumbrances other than a first priority security interest held by the Company; any inventory which was not in the possession of the Company; any inventory which was held by the Company on property leased by the Company unless Salem Five Cents had received a Landlord’s Waiver and Consent from the lessor of such property satisfactory to Salem Five Cents; any inventory which was not located within the United States; any inventory which Salem Five Cents reasonably deemed to be obsolete or non-marketable; and any inventory not subject to a first priority fully perfected lien held by Salem Five Cents.
The Revolving Line of Credit was subject to interest at the prime rate plus 0.5% per annum. The Company was required to repay interest on the Revolving Line of Credit proceeds on a monthly basis. The Revolving Line of Credit continued indefinitely, subject to Salem Five Cents’ demand rights and the Company’s ongoing affirmative and other obligations under the Loan Documents, as summarized below.
The Company could freely draw upon the Revolving Line of Credit subject to Salem Five Cents’ right to demand complete repayment of the Revolving Line of Credit at any time. Late payments were subject to a late payment charge of 5.0%. In the event of failure to repay the loan after Salem Five Cents made demand for full repayment, the interest rate would increase by 10.0%. The Demand Note could be prepaid at any time without penalty. Salem Five Cents could assign the Demand Note without the Company’s consent.
Under the Security Agreement and the other Loan Documents, the Company granted Salem Five Cents a first priority security interest in all of its assets, including both assets owned as of the date of the Revolving Line of Credit and afterwards, as collateral for full repayment of the Revolving Line of Credit. Salem Five Cents had the right to file Uniform Commercial Code financing statements with any jurisdiction and with sufficient descriptions of the property to perfect its security interest in all of the Company’s current and future assets. Upon default of the Revolving Line of Credit, Salem Five Cents could accelerate repayment of the Revolving Line of Credit, take possession of the Company’s assets, assign a receiver over the Company’s assets, and enforce other rights as to the Company’s assets as secured creditor. The Company was required to pay for all of Salem Five Cents’s reasonable legal fees and expenses incurred to enforce its rights under the Loan Documents.
Under the Initial Loan Agreement, the Company was required to continue its current business of outsourced marketing solutions, and, without the prior consent of Salem Five Cents, the Company could not acquire in whole or in part any other company or business or engage in any other business or open any other locations. The Company was required to use the proceeds of the Revolving Line of Credit only in connection with the general and ordinary operations of its business and for the following purpose: general working capital for accounts receivable and inventory purchases.
The Revolving Line of Credit was also subject to ongoing affirmative obligations of the Company, including: Making punctual repayment of the Revolving Line of Credit amount; maintaining proper accounting books and records in accordance with the opinion of LMHS, P.C. or another Certified Public Accountant acceptable to Salem Five Cents; allowing Salem Five Cents to inspect its accounting books and records; furnishing audited, quarterly, monthly and other financial statements to Salem Five Cents; making payment of Salem Five Cents’s reasonable expenses for a field exam in 2022; allowing Salem Five Cents to communicate with its accountants; maintaining its properties in good repair subject to ordinary wear and tear; obtaining replacement-cost insurance for its property with Salem Five Cents as Mortgagee/Loss Payee; causing management contracts for the Company’s properties to be subordinated to the rights of Salem Five Cents; and allowing no change of property management company without the prior written consent of Salem Five Cents.
The Revolving Line of Credit was further subject to the following financial requirements: (a) Debt Service Coverage Ratio: Cash flow to be calculated on an annual basis of at least 1.20 times EBITDA less cash taxes, distributions, dividends, shareholder withdrawals in any form, and unfinanced CAPEX divided by all scheduled principal payments on all debt plus cash interest payments made on all debt; and (b) Minimum Net Worth thresholds: The Company was required to meet the following minimum net worth thresholds: $2.0 million at December 31, 2021; $2.75 million at December 31, 2022; and $3.5 million at December 31, 2023.
The Company also could not incur any additional indebtedness, secured or unsecured, except in the ordinary course of business; make loans or advances to others or guarantee others’ obligations except for certain ordinary advances to employees or ordinary customer credit terms; make investments; acquire any business; make capital expenditures except in the ordinary course of business; sell any material assets except in the ordinary course of business; or grant any security interests or mortgages in its properties or assets.
The foregoing description of the Initial Loan Agreement, the Demand Note, and the Security Agreement is qualified in its entirety by reference to the full text of the Initial Loan Agreement, the Demand Note, and the Security Agreement, copies of which are attached as Exhibit 10.19, Exhibit 10.20 and Exhibit 10.21 to this Annual Report on Form 10-K/A, respectively, which are incorporated herein by reference.
In connection with the Initial Loan Agreement, on November 22, 2021, the Company, Salem Five Cents and Harte Hanks Response Management/ Boston, Inc. (the “Warehouse Provider”), the lessor of certain warehouse facilities to the Company, executed a Warehouseman’s Waiver in favor of Salem Five Cents (the “Warehouseman’s Waiver”). Under the Warehouseman’s Waiver, the Warehouse Provider disclaimed any interest in the property of the Company stored on the premises (the “Collateral”), and agreed not to interfere with Salem Five Cents’ enforcement of its rights in the Collateral. The Warehouse Provider further agreed to provide notice to Salem Five Cents of any default by the Company of its obligations as to the Warehouse Provider, and to give Salem Five Cents at least 30 days to exercise its rights, which period could be extended by Salem Five Cents up to 60 days upon its payment of the per-diem rental amount. After that period, unless the default had been cured by Salem Five Cents, the Warehouse Provider could dispose of such Collateral as it deemed fit. Upon the receipt of written notice from Salem Five Cents and until such notice was rescinded, the Warehouse Provider was required to honor only instructions from Salem Five Cents with respect to the Collateral, including, any direction from Salem Five Cents to dispose of all or any portion of the Collateral at any time, without any further consent or instruction from Company.
The foregoing summary of the Warehouseman’s Waiver is qualified in its entirety by reference to the full text of the Warehouseman’s Waiver, a copy of which is attached as Exhibit 10.22 to this Annual Report on Form 10-K/A, which is incorporated herein by reference.
As of December 31, 2023 and 2022, we had not drawn any funds from the Revolving Line of Credit.
See “—Recent Developments – Termination of Revolving Line of Credit” for related recent developments.
Contractual Obligations
Property Leases
The following is a schedule by years of future minimum lease payments (in thousands):
| 2024 | | $ | 570 | |
| 2025 | | | 361 | |
| 2026 | | | 189 | |
| 2027 | | | 185 | |
| 2028 | | | 67 | |
| Total future non-cancelable minimum lease payments | | $ | 1,372 | |
Lease cost for the years ended December 31, 2023 and 2022 totaled approximately $0.6 million and $0.5 million, respectively. We anticipate no deficiencies in our ability to make these payments.
Other Cash Obligations
The Company manages reward card programs for clients. Under these programs, the Company receives cash and simultaneously records a liability for the total amount received. These accounts are adjusted on a periodic basis as reward cards are funded or reduced at the direction of the customers. At December 31, 2023 and 2022, the Company had net deposits totaling approximately $0.9 million and $6.0 million, respectively.
Our other principal cash payment obligations have consisted principally of obligations under the Revolving Line of Credit. As stated above, as of December 31, 2023 and 2022, we had not drawn any funds from the Revolving Line of Credit under the Loan Documents.
Critical Accounting Estimates
We prepare our financial statements in accordance with U.S. GAAP. The preparation of financial statements requires us to make estimates and assumptions that affect the reported amounts of assets, liabilities, revenue, costs and expenses, and related disclosures. We evaluate our estimates and assumptions on an ongoing basis. We base our estimates on historical experience and on various other assumptions that we believe to be reasonable under the circumstances. Actual results could differ significantly from the estimates made by our management. To the extent that there are differences between our estimates and actual results, our future financial statements presentation, financial condition, results of operations, and cash flows will be affected.
We believe that the assumptions and estimates associated with the valuation of goodwill and intangible assets and contingent earn-out liabilities have the greatest potential impact on our financial statements. Therefore, we consider these to be our critical accounting policies and estimates. For further information on all of our significant accounting policies, see the notes to our financial statements beginning on page F-1 of this Annual Report on Form 10-K/A.
Valuation of Goodwill and Intangible Assets
We perform an annual impairment review of our goodwill during the fourth fiscal quarter of each year, and more frequently if we believe indicators of impairment exist. The process of evaluating the potential impairment of goodwill is highly subjective and requires significant judgment. To review for impairment, we first assess qualitative factors to determine whether events or circumstances lead to a determination that it is more likely than not that the fair value of our reporting unit is less than its carrying amount. Our qualitative assessment of the recoverability of goodwill, whether performed annually or based on specific events or circumstances, considers various macroeconomic, industry-specific and company-specific factors. These factors include: (i) severe adverse industry or economic trends; (ii) significant company-specific actions; (iii) current, historical or projected deterioration of our financial performance; or (iv) a sustained decrease in our market capitalization below our net book value. After assessing the totality of events and circumstances, if we determine that it is more likely than not that the fair value of our reporting unit is greater than its carrying amount, no further assessment is performed. If we determine that it is more likely than not that the fair value of our reporting unit is less than its carrying amount, we calculate the fair value of that reporting unit and compare the fair value to the reporting unit’s net book value.
Determining the fair value of a reporting unit involves the use of significant estimates and assumptions. Our goodwill impairment test uses both the income approach and the market approach to estimate a reporting unit’s fair value. The income approach is based on the discounted cash flow method that uses the reporting unit estimates for forecasted future financial performance, including revenues, operating expenses, and taxes, as well as working capital and capital asset requirements. These estimates are developed as part of our long-term planning process based on assumed market segment growth rates and our assumed market segment share, estimated costs based on historical data and various internal estimates. Projected cash flows are then discounted to a present value employing a discount rate that properly accounts for the estimated market weighted-average cost of capital, as well as any risk unique to the subject cash flows. The market approach is based on weighting the financial multiples of comparable companies and applying a control premium. A reporting unit’s carrying value represents the assignment of various assets and liabilities, excluding certain corporate assets and liabilities, such as cash and debt.
We assess the impairment of long-lived assets, including purchased property and equipment, right-of-use assets, and intangible assets, whenever events or changes in circumstances indicate that the carrying value of such assets may not be recoverable. Factors we consider important which could trigger an impairment review include: (i) significant under-performance relative to historical or projected future operating results, (ii) significant changes in the manner of our use of the acquired assets or the strategy for our overall business, or (iii) significant negative industry or economic trends. The process of evaluating the potential impairment of long-lived assets under the accounting guidance on property and equipment and intangible assets is also highly subjective and requires significant judgment. In order to estimate the fair value of long-lived assets, we typically make various assumptions about the future prospects of our business or the part of our business to which the long-lived assets relate. We also consider market factors specific to the business and estimate future cash flows to be generated by the business, which requires significant judgment as it is based on assumptions about market demand for our products over a number of future years. Based on these assumptions and estimates, we determine whether we need to take an impairment charge to reduce the value of the long-lived assets stated on our consolidated balance sheets to reflect their estimated fair value. Assumptions and estimates about future values and remaining useful lives are complex and often subjective. They can be affected by a variety of factors, including external factors, such as the real estate market, industry and economic trends, and internal factors, such as changes in our business strategy and our internal forecasts. Although we believe the assumptions and estimates we have made in the past have been reasonable and appropriate, changes in assumptions and estimates could materially impact our reported financial results.
Contingent Earn-Out Liabilities
We measure our contingent earn-out liabilities at fair value on a recurring basis using significant unobservable inputs classified within Level 3 of the fair value hierarchy. The Black-Scholes-Merton Call Option Formula was utilized to determine the fair value of the earn-out liability. The significant unobservable inputs used in the fair value measurements are (i) the operating income projections (projected gross profit amounts within the risk-neutral framework) over the earn-out period (generally three or five years), (ii) the strike price, and (iii) volatility. Significant increases or decreases to any of these inputs in isolation would result in a significantly higher or lower liability, with a higher liability capped by the contractual maximum of the contingent earn-out obligations. Ultimately, the liability will be equivalent to the amount paid, and the difference between the fair value estimate and amount paid will be recorded in earnings. The amount paid that is less than or equal to the contingent earn-out liability on the acquisition date is reflected as cash used in financing activities in the consolidated statements of cash flows. Any amount paid in excess of the contingent earn-out liability on the acquisition date is reflected as cash used in operating activities in the consolidated statements of cash flows.
Recent Accounting Pronouncements
For a discussion of recently adopted accounting pronouncements, see Recently Issued Accounting Pronouncements in Note A.27 to our financial statements beginning on page F-1 of this Annual Report on Form 10-K/A.
ITEM 7A. QUANTITATIVE AND QUALITATIVE DISCLOSURES ABOUT MARKET RISK.
Not applicable.
ITEM 8. FINANCIAL STATEMENTS AND SUPPLEMENTARY DATA.
The full text of our audited consolidated financial statements begins on page F-1 of this Annual Report on Form 10-K/A.
ITEM 9. CHANGES IN AND DISAGREEMENTS WITH ACCOUNTANTS ON ACCOUNTING AND FINANCIAL DISCLOSURE.
None.
ITEM 9A. CONTROLS AND PROCEDURES.
Evaluation of Disclosure Controls and Procedures
Our management, with the participation of our Chief Executive Officer and Chief Financial Officer, have evaluated our disclosure controls and procedures (as defined in Rules 13a-15(e) and 15d-15(e) under the Exchange Act) prior to the filing of this Annual Report on Form 10-K/A. Based on that evaluation, our Chief Executive Officer and Chief Financial Officer concluded that, as of the end of the period covered by this Annual Report on Form 10-K/A, our disclosure controls and procedures were not effective due to the restatement of our previously issued financial statements and corresponding material weaknesses described below.
Management’s Annual Report on Internal Control over Financial Reporting
Management is responsible for establishing and maintaining adequate internal control over financial reporting as such term is defined in Rule 13a-15(f) of the Exchange Act. Our internal control system is designed to provide reasonable assurance regarding the preparation and fair presentation of financial statements for external purposes in accordance with generally accepted account principles. All internal control systems, no matter how well designed, have inherent limitations and can provide only reasonable assurance that the objectives of the internal control system are met.
Management assessed the effectiveness of our internal control over financial reporting as of December 31, 2023. In making this assessment, management used the framework set forth in the report entitled Internal Control - Integrated Framework (2013) issued by the Committee of Sponsoring Organizations of the Treadway Commission, or COSO. The COSO framework summarizes each of the components of a company’s internal control system, including (i) the control environment, (ii) risk assessment, (iii) control activities, (iv) information and communication, and (v) monitoring.
During this assessment, management identified material weaknesses in our internal control over financial reporting that are discussed further below. As a result of the material weaknesses, management concluded that our internal control over financial reporting was not effective as of December 31, 2023.
A material weakness is a deficiency, or combination of deficiencies, in internal control over financial reporting, such that there is a reasonable possibility that a material misstatement of a company’s annual and interim financial statements will not be detected or prevented on a timely basis. The following material weaknesses were identified:
| ● | There was a material weakness in our internal controls related to the proper design and implementation of control over formal review, approval, and evaluation of complex accounting transactions associated with business combinations. |
| ● | We identified a material weakness in internal control related to the proper design and implementation of certain controls over management’s formal review process that includes multiple levels of review as well as timely review of accounts and reconciliations leading to material adjustments. |
| ● | We identified a material weakness in internal control related to the proper design and implementation of certain controls over income tax provision and management’s review of the income tax provision. |
| ● | We did not design and maintain effective controls over financial reporting for accounts receivable and unearned revenue, freight charges, and inventory and cost of sales accounts. |
| ● | We did not design and maintain effective controls over financial reporting related to the proper presentation and disclosure for related party transactions. |
| ● | We did not effectively select and develop certain information technology general controls related to access and change management controls that led to deficiencies in the design and operation of control activities. |
Plan of Remediation of Material Weaknesses in Internal Control Over Financial Reporting
As reported in this Annual Report on Form 10-K/A for the fiscal year ended December 31, 2023, following the identification and communication of the material weaknesses described above, management commenced remediation actions relating to these material weaknesses beginning in the fourth quarter of fiscal year 2024, as follows:
| ● | We are utilizing the services of external consultants for non-routine and\or technical accounting issues as they arise. |
| ● | We are expanding and improving our review process for complex accounting transactions. We plan to further improve this process by enhancing access to accounting literature, identification of third-party professionals with whom to consult regarding complex accounting applications and consideration of additional staff with the requisite experience and training to supplement existing accounting professionals. |
| ● | Management, with the assistance of a third party, will perform an evaluation of the processes and procedures around our processes, internal control design gaps, and recommend process enhancements. |
| ● | We are implementing enhancements and process improvements, including the design and implementation of well-defined controls and related control attributes. |
The material weaknesses identified above will not be considered fully remediated until these additional controls and procedures have operated effectively for a sufficient period of time and management has concluded, through testing, that these controls are effective. Our management will monitor the effectiveness of our remediation plans and will make changes management determines to be appropriate. If not remediated, these material weaknesses could result in material misstatements to our annual or interim consolidated financial statements that may not be prevented or detected on a timely basis or result in a delayed filing of required periodic reports. If we are unable to assert that our internal control over financial reporting is effective, investors may lose confidence in the accuracy and completeness of our financial reports, the market price of our common stock could be adversely affected, and we could become subject to litigation or investigations by Nasdaq, the SEC, or other regulatory authorities, which could require additional financial and management resources.
This Annual Report on Form 10-K/A does not include an attestation report of our independent registered public accounting firm regarding internal control over financial reporting. Pursuant to Item 308(b) of Regulation S-K, management’s report is not subject to attestation by our independent registered public accounting firm because the Company is neither an “accelerated filer” nor a “large accelerated filer” as those terms are defined by the SEC.
Changes in Internal Control over Financial Reporting
There were no changes in our internal control over financial reporting during the quarter ended December 31, 2023 that have materially affected, or are reasonably likely to materially affect, our internal control over financial reporting, except as described above.
Inherent Limitation on the Effectiveness of Internal Control
The effectiveness of any system of internal control over financial reporting, including ours, is subject to inherent limitations, including the exercise of judgment in designing, implementing, operating, and evaluating the controls and procedures, and the inability to eliminate misconduct completely. Accordingly, any system of internal control over financial reporting, including ours, no matter how well designed and operated, can only provide reasonable, not absolute assurances. In addition, projections of any evaluation of effectiveness to future periods are subject to the risk that controls may become inadequate because of changes in conditions, or that the degree of compliance with the policies or procedures may deteriorate. We intend to continue to monitor and upgrade our internal controls as necessary or appropriate for our business but cannot assure you that such improvements will be sufficient to provide us with effective internal control over financial reporting.
ITEM 9B. OTHER INFORMATION.
We have no information to disclose that was required to be disclosed in a report on Form 8-K during the fourth quarter of fiscal year 2023 but was not reported.
ITEM 9C. DISCLOSURE REGARDING FOREIGN JURISDICTIONS THAT PREVENT INSPECTIONS.
Not applicable.
PART III
ITEM 10. DIRECTORS, EXECUTIVE OFFICERS AND CORPORATE GOVERNANCE.
Directors and Executive Officers
The following sets forth information about our directors and executive officers:
| Name | | Age | | Position |
| Andrew Stranberg | | 52 | | Executive Chairman, Treasurer, Secretary, and Director |
| Andrew Shape | | 51 | | President, Chief Executive Officer and Director |
| David Browner | | 36 | | Chief Financial Officer |
| John Audibert | | 37 | | Vice President of Growth and Strategic Initiatives |
| Ian Wall | | 53 | | Chief Information Officer |
| Travis McCourt | | 41 | | Director |
| Alan Chippindale | | 66 | | Director |
| Alejandro Tani | | 51 | | Director |
| Ashley Marshall | | 39 | | Director |
Andrew Stranberg co-founded the Company and has served as our Executive Chairman since 1995. From 1995 to January 2020, Mr. Stranberg was also our Chief Executive Officer. In 1995, Mr. Stranberg founded Stran Capital LLC, a family office, and has since been its Chief Executive Officer. From 1997 to 2016 Mr. Stranberg served as Chairman of STRAN Technologies IT Services, LLC. From 2012 to November 2019, Mr. Stranberg was the founder and manager of Stran Maritime LLC for a joint venture with Atlas Maritime Ltd., an international shipping company. Mr. Stranberg is a graduate of the University of New Hampshire Peter T. Paul College of Business and Economics. We believe that Mr. Stranberg is qualified to serve on our board of directors due to his deep knowledge of Stran and his long executive and board experience with us since his co-founding of the Company.
Andrew Shape is our co-founder and since 1996 has served as our President and director, and as our Chief Executive Officer since January 2020. From July 2018 to February 2021, Mr. Shape also served as the Chief Executive Officer and President and a director of Long Blockchain Corp. (formerly OTC Pink: LBCC), in connection with a business co-managed with us for its subsidiary Stran Loyalty Group Inc., a Delaware corporation. From June 2018 through December 2021, Mr. Shape served as a director for Naked Brand Group Limited (formerly Nasdaq: NAKD) until the closing of its business combination with Cenntro Electric Group Limited (Nasdaq: CENN). Prior to forming Stran, from August 1995 to September 1996, Mr. Shape worked at Copithorne & Bellows Public Relations (a Porter Novelli company) as an Account Executive. Mr. Shape holds a BA degree from the University of New Hampshire. We believe that Mr. Shape is qualified to serve on our board of directors due to his deep knowledge of Stran, his industry expertise, and his experience as a director on other Nasdaq-listed companies.
David Browner has been our Chief Financial Officer since March 2023 and was our Interim Chief Financial Officer from July 2022 to March 2023. From July 2021 to July 2022, Mr. Browner was our Controller. From November 2015 to July 2021, Mr. Browner was the Company’s Accounting Manager. From July 2012 to November 2015, Mr. Browner was a staff accountant for the Company. Mr. Browner has a Master of Business Administration in Accounting and a Bachelor of Business Administration from the University of Massachusetts Lowell.
John Audibert has been our Vice President of Growth and Strategic Initiatives since March 2020. Mr. Audibert has over 12 years of investment banking, corporate finance and strategy consulting experience. He has been the President of Josselin Capital Advisors, Inc., a company wholly-owned by John Audibert (“JCA”), since October 2019, which provides consulting services to high-growth businesses. He was formerly President of Woodland Way Advisors, Inc., a consulting firm, from January 2015 through December 2020. Mr. Audibert previously worked in the investment banking group of Sandler O’Neill + Partners, L.P. where he provided merger and acquisition advisory as well as capital raising services to middle-market clients. Prior to joining Sandler O’Neill, he was a strategic consultant at Putnam Associates. Mr. Audibert received a bachelor’s degree with a concentration in finance from the Carroll School of Management at Boston College. Mr. Audibert was an employee of the Company from March 2020 to May 2021, and since then has continued acting in his current capacity as an independent contractor.
Ian Wall has been our Chief Information Officer since January 2024. From April 2021 to November 2023, Mr. Wall was Senior Vice President of Digital Transformation and Service Delivery at Digital Radius. From November 2019 to January 2021, Mr. Wall held several positions at Bentley University, as Interim Vice President and Chief Information Officer from May 2020 to January 2021, and as Executive Director from November 2019 to May 2020. From February 2016 to May 2020, Mr. Wall was Director, Enterprise Applications at Tufts University. From September 2014 to November 2015, Mr. Wall was Director, Enterprise Business Intelligence at Vertex Pharmaceuticals. Mr. Wall received a Masters in Science and Engineering Management from Tufts University Gordon Institute and a Bachelor of Arts in Liberal Arts from University of Massachusetts Amherst.
Travis McCourt has been a member of the Board of Directors since November 2021. In June 2014, he founded Conchoid Capital Fund where he still serves as a principal. From May 2012 to December 2014, he was a Principal at the investment firm McCourt. From November 2007 to May 2012, he was the Vice President of Alternative Capital Markets at Goldman Sachs (NYSE: GS). From November 2004 to December 2007, he served as a Front Office Executive for the Los Angeles Dodgers. Mr. McCourt graduated from Georgetown University. We believe that Mr. McCourt is qualified to serve on our board of directors due to his investment management, buyout analysis, capital markets, investor relations and other business experience.
Alan Chippindale has been a member of the Board of Directors since November 2021. Mr. Chippindale has been President of Engage & Excel Enterprises Inc. (“Engage & Excel”) since July 2017. From January 2008 to June 2017, Mr. Chippindale was Chief Business Development Officer of BrandAlliance Inc. Mr. Chippindale was President of Proforma Inc. from September 1987 to December 2004. Mr. Chippindale graduated from Bowling Green State University with a bachelor degree in International Business and Marketing. We believe that Mr. Chippindale is qualified to serve on our board of directors due to his leading role in the promotional products industry.
Alejandro Tani has been a member of the Board of Directors since November 2021. Since January 2007, Mr. Tani has been the owner of Clair Trading. Since February 2017, Mr. Tani has also been Chief Information Officer and Chief Executive Officer of Innovative Genetics Inc. (“Innovative Genetics”), and a Director and Partner of Green Beehive II LLC. Mr. Tani graduated from University Catolica Andres Bello, located in Venezuela. We believe that Mr. Tani is qualified to serve on our board of directors due to his business experience.
Ashley L. Marshall has been a member of the Board of Directors since November 2021. From December 2021 to September 2022, Ms. Marshall was Merchandise Manager Lighting - Birch Lane at Wayfair (NYSE: W). From January 2015 to September 2021, Ms. Marshall held several positions with The TJX Companies, Inc. (NYSE: TJX): Allocation Analyst, January 2015 to December 2015; Senior Analyst, December 2015 to September 2017; and Associate Planner, September 2017 to September 2021. From January 2014 to December 2015, Ms. Marshall was an attorney in the United States Treasury Department. Ms. Marshall earned a Bachelor of Business Administration from the University of Mississippi and a Juris Doctor from The George Washington University Law School. We believe that Ms. Marshall is qualified to serve on the Board of Directors due to her experience developing business strategy and her background in law.
Arrangements Between Officers and Directors
Our directors currently have terms which will end at our next annual meeting of the stockholders or until their successors are elected and qualified, subject to their prior death, resignation or removal. Officers serve at the discretion of the board of directors. There is no arrangement or understanding between any director or executive officer and any other person pursuant to which the director or executive officer was or is to be selected as a director, nominee or officer.
Family Relationships
There are no family relationships among any of our executive officers or directors.
Involvement in Certain Legal Proceedings
To the best of our knowledge, except as described below, none of our directors or executive officers has, during the past ten years:
| ● | been convicted in a criminal proceeding or been subject to a pending criminal proceeding (excluding traffic violations and other minor offences); |
| ● | had any bankruptcy petition filed by or against the business or property of the person, or of any partnership, corporation or business association of which he was a general partner or executive officer, either at the time of the bankruptcy filing or within two years prior to that time; |
| ● | been subject to any order, judgment, or decree, not subsequently reversed, suspended or vacated, of any court of competent jurisdiction or federal or state authority, permanently or temporarily enjoining, barring, suspending or otherwise limiting, his involvement in any type of business, securities, futures, commodities, investment, banking, savings and loan, or insurance activities, or to be associated with persons engaged in any such activity; |
| ● | been found by a court of competent jurisdiction in a civil action or by the SEC or the Commodity Futures Trading Commission to have violated a federal or state securities or commodities law, and the judgment has not been reversed, suspended, or vacated; |
| ● | been the subject of, or a party to, any federal or state judicial or administrative order, judgment, decree, or finding, not subsequently reversed, suspended or vacated (not including any settlement of a civil proceeding among private litigants), relating to an alleged violation of any federal or state securities or commodities law or regulation, any law or regulation respecting financial institutions or insurance companies including, but not limited to, a temporary or permanent injunction, order of disgorgement or restitution, civil money penalty or temporary or permanent cease-and-desist order, or removal or prohibition order, or any law or regulation prohibiting mail or wire fraud or fraud in connection with any business entity; or |
| ● | been the subject of, or a party to, any sanction or order, not subsequently reversed, suspended or vacated, of any self-regulatory organization (as defined in Section 3(a)(26) of the Exchange Act (15 U.S.C. 78c(a)(26))), any registered entity (as defined in Section 1(a)(29) of the Commodity Exchange Act (7 U.S.C. 1(a)(29))), or any equivalent exchange, association, entity or organization that has disciplinary authority over its members or persons associated with a member. |
Committees of the Board of Directors
Our board of directors established the Company’s Audit Committee, Compensation Committee, Nominating and Corporate Governance Committee, and Disclosure Controls and Procedures Committee, each with its own charter approved by the board. Each committee’s charter is available on our website at https://ir.stran.com.
In addition, our board of directors may, from time to time, designate one or more additional committees, which shall have the duties and powers granted to it by our board of directors.
For further related discussion, see Item 13. “Certain Relationships and Related Transactions, and Director Independence – Director Independence – Committees of the Board of Directors”.
Audit Committee and Audit Committee Members
Our Audit Committee was established in accordance with section 3(a)(58)(A) of the Exchange Act. Travis McCourt, Alejandro Tani, and Ashley Marshall, each of whom has been determined by our board of directors to satisfy the “independence” requirements of Rule 10A-3 under the Exchange Act and Nasdaq’s rules, serve on our Audit Committee, with Mr. McCourt serving as the chairman. Our board has determined that each of Mr. McCourt and Mr. Tani qualifies as an “audit committee financial expert” as defined by Item 407(d)(5) of Regulation S-K.
Material Changes to Director Nomination Procedures
There have been no material changes to the procedures by which stockholders may recommend nominees to our board of directors since such procedures were last disclosed.
Code of Ethics and Business Conduct
We have adopted a Code of Ethics and Business Conduct that applies to all of our directors, officers and employees, including our principal executive officer, principal financial officer and principal accounting officer. Such Code of Ethics and Business Conduct addresses, among other things, honesty and ethical conduct, conflicts of interest, compliance with laws, regulations and policies, including disclosure requirements under the federal securities laws, and reporting of violations of the code.
The full text of the Code of Ethics and Business Conduct is posted on our website at https://ir.stran.com. Any waiver of the Code of Ethics and Business Conduct for directors or executive officers must be approved by our Audit Committee. We will disclose future amendments to our Code of Ethics and Business Conduct, or waivers from our Code of Ethics and Business Conduct for our principal executive officer, principal financial officer, principal accounting officer or controller, or persons performing similar functions, on our website within four business days following the date of the amendment or waiver. In addition, we will disclose any waiver from our Code of Ethics and Business Conduct for our other executive officers and our directors on our website. A copy of our Code of Ethics and Business Conduct will also be provided free of charge upon request to: Secretary, Stran & Company, Inc., 2 Heritage Drive, Suite 600, Quincy, MA 02171.
Insider Trading Policy
Effective March 27, 2023, we adopted the Stran & Company, Inc. Second Amended and Restated Insider Trading Policy (the “Insider Trading Policy”). The Insider Trading Policy applies to all our executive officers, directors and key employees. The Insider Trading Policy codifies the legal and ethical principles that govern trading in our securities by persons associated with the Company that may possess material nonpublic information relating to the Company. A copy of the Insider Trading Policy is filed as Exhibit 99.1 to this Annual Report on Form 10-K/A.
Delinquent Section 16(a) Reports
Section 16(a) of the Exchange Act requires our directors and executive officers and beneficial holders of more than 10% of our shares of common stock to file with the SEC initial reports of ownership and reports of changes in ownership of our equity securities. We believe, based solely on a review of the copies of such reports furnished to us and representations of these persons, that all reports were timely filed for the year ended December 31, 2023 and prior years, except as otherwise disclosed in our previous filings with the SEC and as follows: A late Form 4 was filed for Alan Chippindale on June 29, 2023 relating to a purchase of shares of common stock on June 23, 2023.
ITEM 11. EXECUTIVE COMPENSATION.
Summary Compensation Table - Years Ended December 31, 2023 and 2022
The following table sets forth information concerning all cash and non-cash compensation awarded to, earned by or paid to the named persons for services rendered in all capacities during the noted periods. No other executive officers received total annual salary and bonus compensation in excess of $100,000 during 2023.
| Name and Principal Position | | Year | | | Salary ($) | | | Bonus ($) | | | Stock Awards ($) | | | Option Awards ($) | | | All Other Compensation ($) | | | Total ($) | |
| Andrew Shape, | | | 2023 | | | | 400,000 | | | | 50,000 | | | | - | | | | - | | | | 31,220 | (1) | | | 481,220 | |
| President and Chief Executive Officer | | | 2022 | | | | 400,000 | | | | - | | | | - | | | | - | | | | 121,918 | (1) | | | 521,918 | |
| | | | | | | | | | | | | | | | | | | | | | | | | | | | | |
| David Browner, | | | 2023 | | | | 235,577 | | | | 26,250 | | | | 67,950 | (2) | | | 64,963 | (3) | | | 9,000 | | | | 403,740 | |
| Chief Financial Officer | | | 2022 | | | | 169,426 | | | | - | | | | - | | | | - | | | | 4,051 | | | | 173,477 | |
| | | | | | | | | | | | | | | | | | | | | | | | | | | | | |
| Andrew Stranberg, | | | 2023 | | | | 500,000 | | | | - | | | | - | | | | - | | | | - | | | | 500,000 | |
| Executive Chairman | | | 2022 | | | | 500,000 | | | | - | | | | - | | | | - | | | | - | | | | 500,000 | |
| | | | | | | | | | | | | | | | | | | | | | | | | | | | | |
| Randolph Birney, | | | 2023 | | | | 300,000 | | | | - | | | | - | | | | - | | | | 86,581 | (4) | | | 386,581 | |
| Vice President | | | 2022 | | | | 300,000 | | | | - | | | | - | | | | - | | | | 131,742 | (4) | | | 431,742 | |
| | | | | | | | | | | | | | | | | | | | | | | | | | | | | |
| Stephen Paradiso, | | | 2023 | | | | 167,596 | | | | 175,000 | | | | - | | | | - | | | | - | | | | 342,596 | |
| Former Chief of Staff (5) | | | 2022 | | | | 176,346 | | | | - | | | | - | | | | - | | | | - | | | | 176,346 | |
| (1) | Mr. Shape was entitled to the payment of $10,000 per month during 2023 and 2022 as repayment of sales commissions that had been earned in previous years totaling approximately $140,927, subject to certain terms and conditions. During 2022, Mr. Shape was entitled to $120,000 in total payments toward prior-year commissions in addition to accrued interest of $1,918, and was paid $90,000. During 2023, Mr. Shape became entitled to an additional $20,927 in total payments and accrued interest of $293. All $30,927 of outstanding payable prior-year commissions were paid to Mr. Shape during 2023. All outstanding accrued interest upon prior-year commissions payable to Mr. Shape was orally waived on March 25, 2024. |
| (2) | On April 14, 2023, David Browner became entitled to awards of up to 35,000 shares of common stock subject to performance conditions with respect to the fiscal year ended December 31, 2023. The aggregate grant date fair value of these awards was computed based upon the probable outcome of such conditions consistent with the estimate of aggregate compensation cost to be recognized over the service period determined as of the grant date under ASC Topic 718, excluding the effect of estimated forfeitures, and based upon the assumptions described in Note Q to the Company’s financial statements beginning on page F-1 of this Annual Report on Form 10-K/A. The maximum aggregate grant date fair value of these awards was $60,200 assuming that the highest level of performance conditions will be achieved. In addition, on February 15, 2024, Mr. Browner was granted 5,000 shares of common stock as a bonus award with respect to the fiscal year ended December 31, 2023. The aggregate grant date fair value of this award was computed in accordance with ASC Topic 718 based on the assumptions described in Note Q to the Company’s financial statements beginning on page F-1 of this Annual Report on Form 10-K/A. |
| (3) | On April 14, 2023, David Browner was granted an option to purchase 100,000 shares of common stock. The option vests subject to performance conditions with respect to the fiscal year ended December 31, 2023. The aggregate grant date fair value of this award was computed based upon the probable outcome of such conditions consistent with the estimate of aggregate compensation cost to be recognized over the service period determined as of the grant date under ASC Topic 718, excluding the effect of estimated forfeitures, and based upon the assumptions described in Note Q to the Company’s financial statements beginning on page F-1 of this Annual Report on Form 10-K/A. The maximum aggregate grant date fair value of the award was $60,800 assuming that the highest level of performance conditions will be achieved. On February 15, 2024, Mr. Browner was granted an option to purchase 7,500 shares of common stock as a bonus award with respect to the fiscal year ended December 31, 2023. The aggregate grant date fair value of this award was computed in accordance with ASC Topic 718 based on the assumptions described in Note Q to the Company’s financial statements beginning on page F-1 of this Annual Report on Form 10-K/A. |
| (4) | Mr. Birney was entitled to the payment of $10,000 per month during 2022 and 2023 as repayment of sales commissions that had been earned in previous years totaling approximately $197,110, subject to certain terms and conditions. During 2022, Mr. Birney was entitled to $120,000 in total payments toward these prior-year commissions in addition to accrued interest of $2,742, and was paid $120,000. During 2023, Mr. Birney became entitled to approximately $77,110 and was entitled to accrued interest of $471, and was paid $77,110. Mr. Birney also received $9,000 as an automobile allowance in each of 2022 and 2023. All outstanding accrued interest upon prior-year commissions payable to Mr. Shape was orally waived on March 25, 2024. Effective January 2, 2024, Mr. Birney was no longer an “executive officer” of the Company as such term is defined under Rule 3b-7 of the Exchange Act. Mr. Birney remained an employee of the Company. |
| (5) | Stephen Paradiso resigned from his position with the Company effective December 1, 2023. |
Executive Officer Employment and Consulting Agreements
Employment Agreement with Andrew Shape
Under our employment agreement with our Chief Executive Officer, Andrew Shape, dated July 13, 2021 and effective as of November 8, 2021 (the “Shape Employment Agreement”), we agreed that, for a three-year term, unless terminated earlier in accordance with its terms, we will pay Mr. Shape an annual salary of $400,000 and will be eligible to receive an annual cash bonus as determined by the board of directors. Pursuant to the Shape Employment Agreement, on November 12, 2021, we awarded Mr. Shape a stock option for the purchase of 323,810 shares of the Company’s common stock at an exercise price of $4.15 per share. The stock option will vest over a four-year period with 25% of the option vesting on the first anniversary of the date of grant and the balance of the option (75%) vesting monthly over the following three years after the first anniversary of the date of grant at a rate of 1/36 per month.
Mr. Shape was entitled to the payment of $10,000 per month as repayment of sales commissions that had been earned in previous years totaling approximately $140,927, subject to certain terms and conditions. During 2022, Mr. Shape was entitled to $120,000 in total payments toward prior-year commissions in addition to accrued interest of $1,918, and was paid $90,000 towards these commissions. During 2023, Mr. Shape became entitled to an additional $20,927 in total payments toward these prior-year commissions and accrued interest of $293. All $30,927 of outstanding payable prior-year commissions were paid to Mr. Shape during 2023. All outstanding accrued interest upon prior-year commissions payable to Mr. Shape was orally waived on March 25, 2024.
Mr. Shape will be provided with standard executive benefits. The Company will also provide standard indemnification and directors’ and officers’ insurance. The Company may terminate Mr. Shape’s employment by giving at least 30 days written notice. If we terminate Mr. Shape without cause or Mr. Shape resigns for good reason as provided under the Shape Employment Agreement, we must pay at least 24 months’ severance, reimbursement of Mr. Shape for the first 18 months of the premiums associated with Mr. Shape’s continuation of health insurance for Mr. Shape and his family pursuant to COBRA, and immediate vesting of any outstanding unvested equity granted to Mr. Shape during Mr. Shape’s employment and immediate lifting of all lockups and restrictions on sales of such equity or exercise of stock options. If we do not renew the Shape Employment Agreement after the initial three-year term, then we must pay six months’ severance and reimburse the first six months of the premiums associated with Mr. Shape’s continuation of health insurance for him and his family pursuant to COBRA. Mr. Shape is also subject to standard confidentiality and noncompetition provisions.
On February 15, 2024, in connection with the Company’s fiscal year 2023 executive bonus determinations, the Compensation Committee determined that Mr. Shape would be awarded a $50,000 cash bonus.
Mr. Shape’s stock option agreement contains certain non-competition and non-solicitation provisions pursuant to the standard form under the Stran & Company, Inc. Amended and Restated 2021 Equity Incentive Plan (the “Plan”).
The foregoing description of the Shape Employment Agreement is qualified in its entirety by reference to the full text of such agreement, a copy of which is filed as Exhibit 10.5 to this Annual Report on Form 10-K/A.
Employment Agreement with David Browner
From January 1, 2022 to July 28, 2022, David Browner, then the Company’s Controller, was provided an annual salary of $150,000 and standard employee benefits on an at will basis. As of July 29, 2022, Mr. Browner was appointed as the Company’s Interim Chief Financial Officer. In connection with the appointment, effective as of July 29, 2022, Mr. Browner’s salary was increased to $200,000, and Mr. Browner was provided with a $750 monthly car allowance. On March 27, 2023, Mr. Browner was appointed as the Company’s Chief Financial Officer. Mr. Browner’s compensation was left unchanged pending review by the Compensation Committee.
On April 14, 2023, the Compensation Committee approved an Employment Agreement with Mr. Browner (the “Browner Employment Agreement”), and it was entered into as of the same date. Under the Browner Employment Agreement, Mr. Browner will continue to be employed as the Company’s Chief Financial Officer and will continue to function as its principal financial officer and principal accounting officer during the term of the agreement. The initial term of the agreement will be two years and will automatically extend an additional year each year unless one party gives 60 days’ notice before the end of the term, unless terminated earlier in accordance with its terms as described below. Mr. Browner will receive an annual base salary of $250,000. In addition, the Company will pay up to $750 per month to maintain a leased automobile for business use by Mr. Browner.
For each fiscal year during the term of the Browner Employment Agreement, Mr. Browner will receive up to three cash bonuses and six equity bonuses depending on the board’s or the Compensation Committee’s certification of the Company’s attainment of the performance conditions provided for in the Browner Employment Agreement. The performance conditions will be based on an annual sales target, an annual gross profit target, and an annual net profit target. Each target will be set by the board, the Compensation Committee, or an executive officer or other party delegated with such authority other than Mr. Browner, for the applicable fiscal year. Each target will generally be measured against the audited U.S. GAAP-compliant financial statements of the Company for that year, except that net profit or the equivalent item will be adjusted to exclude expenses related to annual bonus payments to the Company’s executive officers or members of its management team. The annual targets for fiscal year 2023 for purposes of the Browner Employment Agreement were determined by the Compensation Committee to be $72,000,000 for the annual sales target, $21,600,000 for the gross profit target, and $1,080,000 for the net profit target.
Each portion of an equity bonus consisting of common stock will be granted upon certification of attainment of the respective target. Each portion of an equity bonus consisting of vesting of a stock option will relate to a stock option that was or will be granted on the date of the Browner Employment Agreement and at the beginning of each subsequent fiscal year during the term of the Browner Employment Agreement. In accordance with the Browner Employment Agreement, on April 14, 2023, the Company granted Mr. Browner a stock option for the purchase of 100,000 shares of common stock at an exercise price of $1.72 per share, which vests and becomes exercisable upon certification of attainment of the applicable targets by the board or the Compensation Committee in accordance with the equity bonus terms described below. All equity grants under the Browner Employment Agreement have been or will be made under a standard form of agreement under the Plan.
An annual sales-based cash bonus will be awarded based on the percentage of the annual sales target that is certified as attained, as follows: (a) $1,250 if 95% of the target is certified as attained; (b) $5,000 if 100% of the target is certified as attained; (c) $7,500 if 110% of the target is certified as attained; or (d) $10,000 if 120% of the target is certified as attained. An annual gross profit-based cash bonus will also be awarded based on the percentage of an annual gross profit target that is attained, as follows: (a) $6,250 if 95% of the target is certified as attained, (b) $25,000 if 100% of the target is certified as attained; (c) $37,500 if 110% of the target is certified as attained; or (d) $50,000 if 120% of the target is certified as attained. An annual net profit-based cash bonus will also be awarded based on the percentage of annual net profit target that is certified as attained, as follows: (a) $5,000 if 95% of the target is certified as attained, (b) $20,000 if 100% of the target is certified as attained; (c) $30,000 if 110% of the target is certified as attained; or (d) $40,000 if 120% of the target is certified as attained. In accordance with the Browner Employment Agreement, each cash bonus will be paid in three equal installments in the third, fourth and fifth months of the fiscal year following the fiscal year in which the respective target or targets are attained upon certification of the attainment of the respective target or targets.
Five of the six annual equity bonuses will consist of the grant of fully-vested shares of common stock and the vesting of a portion of the stock option granted each year under the Browner Employment Agreement. The other annual equity bonus will consist of the vesting of a portion of such stock option only. In each case, each annual equity bonus will be based on whether such bonus’s designated target or target percentage is certified as attained, as follows: (1) grant of 5,000 shares and vesting of the stock option as to 7,500 shares if the annual sales target is certified as attained; (2) grant of 5,000 shares and vesting of the stock option as to 7,500 shares if the annual gross profit target is certified as attained; (3) grant of 5,000 shares and vesting of the stock option as to 7,500 shares if the annual net profit target is certified as attained; (4) grant of 10,000 shares and vesting of the stock option as to 12,500 shares if 125% of the annual net profit target is certified as attained; (5) grant of 10,000 shares and vesting of the stock option as to 15,000 shares if 150% of the annual net profit target is certified as attained; and (6) vesting of the stock option as to 2,000 shares for every $100,000 by which net profit is certified as exceeding 150% the annual net profit target, up to a maximum of 50,000 shares.
All equity bonuses under the Browner Employment Agreement will be awarded under the Plan. The Plan provides that to the extent that equity bonuses of grants of common stock are designated Performance Compensation Awards (as defined by the Plan) by the board or the Compensation Committee and to the extent that each fiscal year constitutes a Performance Period (as defined by the Plan), pursuant to the Plan, such awards must be granted as soon as administratively practicable following completion of the certification of the attainment of the performance conditions for such awards but in no event later than 2 1/2 months following the end of the fiscal year during which the respective Performance Period is completed. Otherwise, such grants will be considered Performance Shares (as defined by the Plan) and will be granted when certified by the board or the Compensation Committee.
Under the Browner Employment Agreement, Mr. Browner will also be eligible for additional bonus amounts as determined by the board or the Compensation Committee within its sole discretion. Mr. Browner will receive unlimited paid time off and paid public holidays, standard executive benefits, standard directors and officers indemnification and insurance coverage, and business-related expense reimbursements.
On February 15, 2024, in connection with the Company’s fiscal year 2023 executive bonus determinations, the Compensation Committee certified the attainment of the performance conditions under the Browner Agreement for the award of a $26,250 cash bonus, the grant of 5,000 shares of common stock, and the vesting of the stock option granted to Mr. Browner on April 14, 2023 as to 7,500 shares of common stock.
Mr. Browner’s employment is terminable with cause upon certain grounds by written notice, subject to a 30-day notice and cure period with respect to certain of these grounds for termination for cause. Mr. Browner may be terminated without cause upon 30 days’ written notice. Mr. Browner may terminate employment with good reason upon certain grounds, subject to a 30-day notice and cure period with respect to certain of these grounds that must begin within 10 days of Mr. Browner’s knowledge of the initial existence of the grounds for termination for good reason. The effect of Mr. Browner’s termination of the Browner Employment Agreement without complying with the requirements to terminate with good reason will be equivalent to termination with cause. Termination under any provision of the Browner Employment Agreement will generally result in the Company’s obligation to provide accrued and unpaid or pending cash, equity or other compensation. If the Company terminates Mr. Browner without cause or he terminates for good reason, and provided that Mr. Browner signs the general release and waiver annexed to the Browner Employment Agreement within 60 days, the Company will be required to pay the lesser of the number of months’ severance remaining under the term of the Browner Employment Agreement and either four months if the termination occurs during the first year of the term or three months if the termination occurs during the second year of the term, provided that Mr. Browner receives at least three months’ severance; reimburse Mr. Browner for the first 18 months of the premiums associated with Mr. Browner’s continuation of health insurance for Mr. Browner and his family pursuant to COBRA; and approve immediate vesting of any outstanding unvested equity awards granted to Mr. Browner during his employment and immediate lifting of all lockups and restrictions on sales or exercise of such awards. If the Company elects not to renew the Browner Employment Agreement, then the Company must pay three months’ severance and reimburse the first six months of the premiums associated with Mr. Browner’s continuation of health insurance for Mr. Browner and his family pursuant to COBRA. If Mr. Browner is terminated in the event of death or disability, then the Company must approve immediate vesting of any outstanding unvested equity awards granted to Mr. Browner during his employment and immediate lifting of all lockups and restrictions on sales or exercise of such awards. In addition, if the Company does not renew the term of the Browner Employment Agreement and Mr. Browner’s termination occurs within 90 days before or 12 months after a Change in Control (as defined by the Browner Employment Agreement), then, provided that Mr. Browner signs the general release and waiver annexed to the Browner Employment Agreement within 60 days, the Company must pay the same severance amount as described above in the event of a termination for cause or resignation for good reason; provide the same COBRA benefits as described above in the event of a termination for cause or resignation for good reason; and approve the immediate vesting of all equity awards held by Mr. Browner unless expressly provided otherwise by the governing documents for such awards.
The Browner Employment Agreement also contains general confidentiality and non-competition provisions. Mr. Browner’s stock option agreements and restricted stock award agreements contain certain non-competition and non-solicitation provisions pursuant to the standard forms of such agreements under the Plan.
The foregoing description of the Browner Employment Agreement is qualified in its entirety by reference to the full text of such agreement, a copy of which is filed as Exhibit 10.38 to this Annual Report on Form 10-K/A.
Employment Agreement with Andrew Stranberg
Under our employment agreement with our Executive Chairman, Andrew Stranberg, dated July 13, 2021 and effective as of November 8, 2021 (the “Stranberg Employment Agreement”), we agreed that, for a three-year term, unless terminated earlier in accordance with its terms, Mr. Stranberg’s annual salary will be $500,000, and Mr. Strangberg will be eligible for an annual cash bonus as determined by the board of directors. Pursuant to the Stranberg Employment Agreement, on November 12, 2021, we awarded Mr. Stranberg a stock option for the purchase of 400,000 shares of the Company’s common stock at an exercise price of $4.15 per share under a standard form of stock option agreement under the Plan. The stock option will vest over a four-year period with 25% of the option vesting on the first anniversary of the date of grant and the balance of the option (75%) vests monthly over the following three years after the first anniversary of the date of grant at a rate of 1/36 per month. Mr. Stranberg will be provided with standard executive benefits. The Company will also provide standard indemnification and directors’ and officers’ insurance. The Company may terminate Mr. Stranberg’s employment by giving at least 30 days written notice. If we terminate Mr. Stranberg without cause or he resigns for good reason as provided under the Stranberg Employment Agreement, we must pay at least 24 months’ severance, reimbursement of Mr. Stranberg for the first 18 months of the premiums associated with Mr. Stranberg’s continuation of health insurance for Mr. Stranberg and his family pursuant to COBRA, and immediate vesting of any outstanding unvested equity granted to Mr. Stranberg during his employment and immediate lifting of all lockups and restrictions on sales of such equity, or exercise of stock options. If we do not renew the Stranberg Employment Agreement after the initial three-year term, then we must pay six months’ severance and reimburse the first six months of the premiums associated with Mr. Stranberg’s continuation of health insurance for him and his family pursuant to COBRA. Mr. Stranberg is also subject to standard confidentiality and noncompetition provisions, and Mr. Stranberg’s stock option agreement contains certain non-competition and non-solicitation provisions pursuant to the standard form of such agreement under the Plan.
The foregoing description of the Stranberg Employment Agreement is qualified in its entirety by reference to the full text of such agreement, a copy of which is filed as Exhibit 10.6 to this Annual Report on Form 10-K/A.
Previous Consulting Agreement with John Audibert and Josselin Capital Advisors, Inc.
Under the Consulting Agreement among John Audibert, JCA, which is Mr. Audibert’s his wholly-owned company, and the Company, dated December 2, 2021 (the “Audibert Consulting Agreement”), which was in effect from December 2, 2021 until April 14, 2023, we agreed that, for a 27-month term, unless terminated earlier in accordance with its terms, we will receive the services of JCA and pay or grant JCA the compensation described below, and Mr. Audibert would continue to serve as our Vice President of Growth and Strategic Initiatives. We agreed to pay JCA a signing fee of $30,000, an annual fee of $100,000 and a monthly automobile bonus of $750. We agreed to grant JCA base restricted stock bonuses as follows: (i) 20,000 restricted shares of common stock, granted as of the agreement date, which vested on the three-month anniversary of the date of grant; (ii) 20,000 additional fully-vested shares of common stock to be granted on the six-month anniversary of the agreement date; and (iii) 20,000 additional fully-vested shares of common stock to be granted on the twelve-month anniversary of the agreement date. Due to an administrative oversight, we did not grant the 20,000 shares required to be granted to JCA on each of the six-month and twelve-month anniversaries of the agreement date as provided under the Audibert Consulting Agreement. JCA agreed to receive these grants in 2023. On April 14, 2023, the Compensation Committee approved the grants.
We also agreed to equity grants to JCA consisting of (i) the grant of an option which may be exercised to purchase 65,000 shares of common stock at the exercise price per share of $3.90 which will vest based on the attainment of the option’s performance conditions, and (ii) fully-vested restricted stock to be granted upon attainment of the same performance conditions, as follows: (a) 10,000 fully-vested restricted shares granted and the stock option vested as to 10,000 shares of common stock if our sales exceeded $21,000,000 combined for any two consecutive quarters or if our market capitalization exceeded $65,000,000 for twenty-five (25) out of thirty (30) consecutive trading days anytime within the Audibert Consulting Agreement’s term; (b) 10,000 additional fully-vested restricted shares granted and the stock option vested as to 10,000 additional shares of common stock if our sales exceeded $25,000,000 combined for any two consecutive quarters or if our market capitalization exceeded $75,000,000 for twenty-five (25) out of thirty (30) consecutive trading days anytime within the Audibert Consulting Agreement’s term; (c) 15,000 additional fully-vested restricted shares granted and the stock option vested as to 20,000 additional shares if our sales exceeded $37,500,000 combined for any two consecutive quarters or if our market capitalization exceeded $90,000,000 for twenty-five (25) out of thirty (30) consecutive trading days anytime within the Audibert Consulting Agreement’s term; and (d) 25,000 additional fully-vested restricted shares granted and the stock option vested as to 25,000 additional shares if our sales exceeded $45,000,000 combined for any two consecutive quarters or if our market capitalization exceeded $180,000,000 for twenty-five (25) out of thirty (30) consecutive trading days anytime within the Audibert Consulting Agreement’s term. “Sales” were determined by our audited or reviewed financial statements and according to U.S. GAAP. Our “market capitalization” was defined as the closing stock price of our common stock as reported by Nasdaq multiplied by the total shares of common stock outstanding as of 4:00 PM E.T. on the date that such closing stock price was determined as reported by our transfer agent. All such grants were subject to standard forms of stock option or restricted stock award agreements and the terms and conditions of the Plan. Pursuant to the Audibert Consulting Agreement, on December 2, 2021, the Company granted a stock option to JCA to purchase up to 65,000 shares of common stock subject to the vesting conditions described above. On March 11, 2022, the Compensation Committee determined that the performance conditions for the vesting of the option as to a total of 20,000 shares of common stock and to the issuance of 20,000 shares of common stock had been met, resulting in vesting of the option as to 20,000 shares and the issuance of 20,000 shares of common stock to JCA.
All equity bonuses under the Audibert Consulting Agreement were awarded under the Plan. The Plan provides that to the extent that equity bonuses of grants of common stock are designated Performance Compensation Awards (as defined by the Plan) by the board or the Compensation Committee and to the extent that each fiscal year constitutes a Performance Period (as defined by the Plan), pursuant to the Plan, such awards must be granted as soon as administratively practicable following completion of the certification of the attainment of the performance conditions for such awards but in no event later than 2 1/2 months following the end of the fiscal year during which the respective Performance Period is completed. Otherwise, such grants will be considered Performance Shares (as defined by the Plan) and will be granted when certified by the board or the Compensation Committee.
Upon the occurrence of a change in control during the Audibert Consulting Agreement’s term, whether or not JCA’s engagement is terminated, or upon JCA’s termination without cause, all restricted stock, stock option, stock appreciation right or similar awards granted to or pending grant to and held by JCA will immediately vest and no longer be subject to forfeiture, unless expressly provided otherwise in the governing documents for such awards. For each fiscal year completed during the Audibert Consulting Agreement’s term, JCA was also eligible to receive additional bonuses as determined by the board. Both we and JCA were permitted to terminate the Audibert Consulting Agreement by giving at least 30 days’ written notice. If we or JCA terminated the Audibert Consulting Agreement without cause as provided under the Audibert Consulting Agreement, and JCA and Mr. Audibert delivered their signatures to the general release and waiver form annexed to the Audibert Consulting Agreement, we were required to make a $25,000 severance payment. JCA and Mr. Audibert were also subject to certain independent contractor, non-solicitation, confidentiality and non-interference provisions under the Audibert Consulting Agreement and JCA’s stock option agreement and restricted stock award agreement pursuant to the standard forms of such agreements under the Plan.
On June 29, 2023, the rights to all equity awards that had been granted to JCA under the Audibert Consulting Agreement were distributed or transferred to Mr. Audibert.
The foregoing description of the Audibert Consulting Agreement is qualified in its entirety by reference to the full text of such agreement, a copy of which is filed as Exhibit 10.28 to this Annual Report on Form 10-K/A.
Amended and Restated Consulting Agreement with John Audibert and Josselin Capital Advisors, Inc.
On April 14, 2023, the Compensation Committee approved an Amended and Restated Consulting Agreement (the “A&R Audibert Consulting Agreement”) with John Audibert, the Company’s Vice President of Growth and Strategic Initiatives, and JCA, Mr. Audibert’s wholly-owned company, and was entered into as of the same date. The A&R Audibert Consulting Agreement amended and restated the Audibert Consulting Agreement. However, a stock option granted to JCA on December 2, 2021 under the Audibert Consulting Agreement and pursuant to the Plan, subsequently assigned to Mr. Audibert, remains outstanding. See “—Previous Consulting Agreement with John Audibert and Josselin Capital Advisors, Inc.” for the terms of this stock option.
Under the A&R Audibert Consulting Agreement, JCA will continue to provide services to the Company in connection with Mr. Audibert’s position as an executive officer of the Company for a 24-month term, unless terminated earlier in accordance with its terms as described below. JCA will receive an annual fee of $200,000 and a monthly automobile bonus of $750.
For each fiscal year during the term of the A&R Audibert Consulting Agreement, JCA will receive up to six equity bonuses depending on the board of directors’ or the Compensation Committee’s certification of the Company’s attainment of the performance conditions provided for such bonuses to be granted in the agreement. The performance conditions will be based on an annual sales target and an annual net profit target. Each target will be set by the board, the Compensation Committee, or an executive officer or other party delegated with such authority other than Mr. Audibert, for the applicable fiscal year. Each target will generally be measured against the audited U.S. GAAP-compliant financial statements of the Company for that year, except that net profit or the equivalent item will be adjusted to exclude expenses related to annual bonus payments to the Company’s executive officers or members of its management team. The annual targets for fiscal year 2023 for purposes of the A&R Audibert Consulting Agreement were determined by the Compensation Committee to be $72,000,000 for the annual sales target and $1,080,000 for the net profit target.
Each fiscal year during the term of the A&R Audibert Consulting Agreement, JCA will be granted restricted common stock with performance conditions for vesting in the number of shares of restricted stock equal to $80,000 divided by the closing price of the common stock on The Nasdaq Capital Market tier of Nasdaq on the grant date. Each restricted stock grant will vest as to the amounts described below upon certification by the board or the Compensation Committee of attainment of the respective performance targets. For the first term year, the A&R Audibert Consulting Agreement provided that the restricted stock’s grant date would be the date of the agreement and the number of shares would be based on the closing price of the common stock on The Nasdaq Capital Market on the later of that date or the date of the approval of the grant by the Board or the Compensation Committee. For the subsequent year, the restricted stock will be granted at the beginning of the fiscal year upon approval of the Board or the Compensation Committee and will be equal to $80,000 divided by the closing price of the common stock on The Nasdaq Capital Market on the anniversary of the date of the agreement, or as otherwise determined by the Board or Compensation Committee. On April 14, 2023, JCA was granted 46,511 shares of restricted common stock and such amount was accepted by JCA as the restricted stock grant provided for by the A&R Audibert Consulting Agreement for the initial year of the term of the agreement.
In addition, on the date of the A&R Audibert Consulting Agreement and at the beginning of each subsequent fiscal year during the term of the agreement, JCA will be granted a stock option to purchase the maximum number of shares subject to approval of the board or the Compensation Committee and the equity bonus performance conditions to vesting described below. Accordingly, on April 14, 2023, the Company granted JCA a stock option for the purchase of 180,000 shares of common stock at an exercise price of $1.72 per share, which vests and becomes exercisable upon certification of attainment of the applicable targets by the Board or the Compensation Committee in accordance with the equity bonus terms described below.
On June 29, 2023, the rights to all equity awards that had been granted to JCA and rights to equity awards that may be granted to JCA under the A&R Consulting Agreement were distributed or transferred to Mr. Audibert. The Company, Mr. Audibert and JCA agreed to make any future awards under the A&R Consulting Agreement to Mr. Audibert directly.
Each fiscal year during the term of the A&R Audibert Consulting Agreement, JCA will also be granted fully-vested common stock upon, and in an amount based on, the Board’s or the Compensation Committee’s certification of attainment of the applicable targets in accordance with the equity bonus terms described below.
Two of the equity bonuses will consist of the vesting of a percentage of the restricted stock granted each year under the A&R Audibert Consulting Agreement based on the percentage of the annual sales target that is certified as attained, the percentage of the net profit target that is certified as attained, or both. The restricted stock will vest based on the certification of attainment of the annual sales target as follows: (a) vesting of 5% of the restricted stock if 95% of the annual sales target is certified as attained; (b) 20% of the restricted stock if 100% of the annual sales target is certified as attained; (c) 30% of the restricted stock if 110% of the annual sales target is certified as attained; or (d) 40% of the restricted stock if 120% of the annual sales target is certified as attained. The restricted stock will also vest based on the certified attainment of the annual net profit target as follows: (a) vesting of 7.5% of the restricted stock if 95% of the annual net profit target is certified as attained; (b) 30% of the restricted stock if 100% of the annual net profit target is certified as attained; (c) 45% of the restricted stock if 110% of the annual net profit target is certified as attained; or (d) 60% of the restricted stock if 120% of the annual net profit target is certified as attained.
Two of the other equity bonuses will consist of the grant of fully-vested shares of common stock and the vesting of a portion of the stock option granted each year under the A&R Audibert Consulting Agreement, and two of the other equity bonuses will consist of the vesting of a portion of such stock option only, in each case based on whether each bonus’s designated target or target percentage is certified as attained, as follows: (1) grant of 8,000 shares and vesting of the stock option as to 40,000 shares if the annual sales target is certified as attained; (2) grant of 12,000 shares and vesting of the stock option as to 40,000 shares if the annual net profit target is certified as attained; (3) vesting of the stock option as to 50,000 shares if 125% of the annual net profit target is certified as attained; and (4) vesting of the stock option as to 50,000 shares if 150% of the annual net profit target is certified as attained.
All equity bonuses under the A&R Audibert Consulting Agreement will be awarded under standard forms of award agreements under the Plan. The Plan provides that to the extent that equity bonuses of grants of common stock are designated Performance Compensation Awards (as defined by the Plan) by the board or the Compensation Committee and to the extent that each fiscal year constitutes a Performance Period (as defined by the Plan), pursuant to the Plan, such awards must be granted as soon as administratively practicable following completion of the certification of the attainment of the performance conditions for such awards but in no event later than 2 1/2 months following the end of the fiscal year during which the respective Performance Period is completed. Otherwise, such grants will be considered Performance Shares (as defined by the Plan) and will be granted when certified by the board or the Compensation Committee.
Under the A&R Audibert Consulting Agreement, JCA will also be eligible for additional bonus amounts as determined by the Board or the Compensation Committee within its sole discretion. JCA will provide services under the A&R Audibert Consulting Agreement as an independent contractor. JCA and Mr. Audibert will not receive employee or executive benefits. JCA and Mr. Audibert will be solely responsible for any business-related expenses.
On February 15, 2024, in connection with the Company’s fiscal year 2023 executive bonus determinations, the Compensation Committee certified the attainment of the performance conditions under the A&R Audibert Consulting Agreement for the vesting of 2,339 shares of the restricted stock initially granted to JCA on April 14, 2023. In accordance with the above, the initial grant of 46,511 shares of restricted stock to JCA on April 14, 2023 was cancelled and 2,339 shares were issued to Mr. Audibert. In addition, the Compensation Committee awarded discretionary bonuses of a cash bonus of $10,000 to JCA, the grant of an additional 2,661 shares of common stock to Mr. Audibert, and the grant of an option to purchase 7,500 shares of common stock to Mr. Audibert at an exercise price of $1.55 per share.
Upon the occurrence of a Change in Control (as defined by the A&R Audibert Consulting Agreement) during the A&R Audibert Consulting Agreement’s term, whether or not JCA’s engagement is terminated, or upon JCA’s termination without cause, all restricted stock, stock option, stock appreciation right or similar awards granted to or pending grant to and held by JCA will immediately vest and will no longer be subject to forfeiture, unless expressly provided otherwise in the governing documents for such awards. Either the Company or JCA may terminate the A&R Audibert Consulting Agreement for material breach and failure to cure such breach within 15 days of receipt of notice by the non-breaching party. Both the Company and JCA may terminate the A&R Audibert Consulting Agreement without cause by giving at least 30 days’ written notice. Termination under any provision of the A&R Audibert Consulting Agreement will generally result in the Company’s obligation to provide accrued and unpaid or pending cash, equity or other compensation. If the Company or JCA terminates the agreement without cause as provided under the A&R Audibert Consulting Agreement, and JCA and Mr. Audibert then deliver their signatures to the general release and waiver form annexed to the A&R Audibert Consulting Agreement within 60 days, then the Company must pay JCA a $50,000 fee.
JCA and Mr. Audibert are also subject to general confidentiality and non-interference provisions under the A&R Audibert Consulting Agreement and general non-competition and non-solicitation provisions in JCA’s stock option agreement and restricted stock award agreement pursuant to the standard forms of such agreements under the Plan.
The foregoing description of the A&R Consulting Agreement is qualified in its entirety by reference to the full text of such agreement, a copy of which is filed as Exhibit 10.39 to this Annual Report on Form 10-K/A.
Employment Agreement with Sheila Johnshoy
The Company and Sheila Johnshoy, the Company’s former Chief Operating Officer, were parties to the Johnshoy Employment Agreement. Under the Johnshoy Employment Agreement, Ms. Johnshoy’s initial annual base salary was $250,000. With respect to fiscal year 2022, Ms. Johnshoy was entitled to a cash bonus of 25%, 50%, 75%, or 100% of base salary, conditioned on (i) the occurrence of annual revenue of the Company of $10 million, $53 million, $60 million, or $70 million, respectively, provided that the Company also had normalized annual operating profit for any annual cash bonus of 50%, 75% or 100% of base salary, or (ii) the discretionary approval of the Company’s Chief Executive Officer, subject to approval by the Compensation Committee. In accordance with the Johnshoy Employment Agreement, Ms. Johnshoy received a cash bonus consisting of 50% of base salary earned during 2022, or $100,000, due to the occurrence of annual revenue of more than $53 million and normalized annual operating profit during the fiscal year ended December 31, 2022.
In addition, under the Johnshoy Employment Agreement, on March 11, 2022, Ms. Johnshoy was granted 5,000 shares of common stock and a stock option to purchase 40,000 shares at an exercise price per share of $1.60. The stock option was immediately vested as to 5,000 shares of common stock and otherwise subject to a six-month lock-up provision and certain performance conditions to vesting described as follows. Upon the occurrence of the following annual revenue amounts of the Company or at the discretionary approval of the Company’s Chief Executive Officer, subject in each case to final approval by the Compensation Committee, Ms. Johnshoy would granted up to 35,000 additional shares of common stock and the stock option will vest as to 35,000 shares of common stock, as follows: (a) grant of 5,000 shares and the vesting of the stock option as to 5,000 shares upon attainment of annual revenue of $50 million, (b) grant of 10,000 shares and the vesting of the stock option as to 10,000 shares upon attainment of annual revenue of $60 million, (c) grant of 10,000 shares and the vesting of the stock option as to 10,000 shares upon attainment of annual revenue of $70 million, and (d) grant of 10,000 shares and the vesting of the stock option as to 10,000 shares upon attainment of annual revenue of $80 million. On April 14, 2023, the Compensation Committee certified the attainment of the performance conditions for the grant of 5,000 shares of common stock and the vesting of the stock option as to 5,000 shares of common stock based on annual revenue of more than $50 million during the fiscal year ended December 31, 2022.
Additionally, under the Johnshoy Employment Agreement, if a trailing 12-month revenue of the Company of $250 million occurred within 3.5 years of Ms. Johnshoy’s start of employment, she would earn an additional bonus of 100,000 shares of common stock.
All annual equity compensation awards under the Johnshoy Employment Agreement must be reviewed and provided if applicable no later than March 15 of the following fiscal year. This requirement is in addition to the requirements under the Plan, which provides that to the extent that equity bonuses of grants of common stock are designated Performance Compensation Awards (as defined by the Plan) by the board or the Compensation Committee and to the extent that each fiscal year constitutes a Performance Period (as defined by the Plan), pursuant to the Plan, such awards must be granted as soon as administratively practicable following completion of the certification of the attainment of the performance conditions for such awards but in no event later than 2 1/2 months following the end of the fiscal year during which the respective Performance Period was completed. Otherwise, such grants would be considered Performance Shares (as defined by the Plan) and would be granted when certified by the Board or the Compensation Committee.
Under the Johnshoy Employment Agreement, after the first year of employment, all cash and equity bonus compensation goals and bonus figures were to be reviewed, and benchmarks and bonus percentages were to be adjusted each year based on changing business factors.
On February 15, 2024, the Compensation Committee determined that the cash and equity bonus compensation performance conditions under the Johnshoy Employment Agreement for the fiscal year ended December 31, 2023 would be the same cash and equity bonus compensation provided for under the Browner Agreement for the fiscal year ended December 31, 2023. In accordance with the foregoing, the Compensation Committee approved the following bonuses for Ms. Johnshoy: The award of a cash payment of $26,250, the grant of 5,000 shares of common stock, and the grant of a fully vested stock option to purchase 7,500 shares of common stock at an exercise price of $1.55 per share.
Ms. Johnshoy was entitled to severance benefits equal to four months’ salary if terminated without Cause (as defined in the Johnshoy Employment Agreement) during the first year of employment and two months’ salary if terminated during the second year of employment. Ms. Johnshoy was eligible to receive certain health care, dental, life insurance, disability, and retirement benefits after three months’ employment.
The Johnshoy Employment Agreement and Ms. Johnshoy’s equity award agreements have general non-solicitation provisions. Ms. Johnshoy is also subject to a standard non-disclosure requirement under the Johnshoy Employment Agreement.
The foregoing description of the Johnshoy Employment Agreement is qualified in its entirety by reference to the full text of such agreement, a copy of which is filed as Exhibit 10.34 to this Annual Report on Form 10-K/A.
Employment Agreement with Ian Wall
The Company and Ian Wall, its Chief Information Officer, are parties to an employment letter agreement, dated as of December 11, 2023 (the “Wall Employment Agreement”). Under the Wall Employment Agreement, Mr. Wall will receive an initial annual base salary of $265,000 and potential salary and annual bonus increases in future years based on the successful achievement of personal and business-related goals. Mr. Wall will receive a monthly car and phone allowance of $750. Mr. Wall also received a signing bonus of a stock option to purchase 15,000 shares of common stock which vested immediately as to one-third and will vest as to each remaining third each subsequent year subject to its terms and conditions. On January 29, 2024, Mr. Wall was awarded the option to purchase the shares at an exercise price of $1.46 per share.
Mr. Wall will receive an annual cash bonus based on three performance targets relating to the Company’s results of operations. The bonus targets are weighted 10% to sales, 50% to gross profit, and 40% to net profit. The bonus will equal each bonus target’s weight percentage multiplied by (i) 5% of base salary if 95% of the target is met, (ii) 20% of base salary if 100% of the target is met, (iii) 30% if 110% of the target is met; or (iv) 40% if 120% of the target is met. The performance targets for 2024 will be $87,500,000 sales, $26,250,000 gross profit, and $1,312,500 net profit. Mr. Wall may receive this cash bonus without the related target performance at the discretion of the Chief Executive Officer upon approval of the Compensation Committee.
In addition, Mr. Wall will receive an annual stock option bonus to purchase 100,000 shares each year with an exercise price equal to the stock price at the time of issuance. The annual stock option bonus will vest based on the same annual performance targets set for the annual cash bonus for that year, as follows: (i) If the sales target is met, the option will vest as to 15,000 shares; (ii) if the gross profit target is met, the option will vest as to 15,000 shares; (iii) if the net profit target is met, the option will vest as to 15,000 shares; (iv) if 125% of the net profit target is met, the option will vest as to 25,000 shares; and (v) if 150% of the net profit target is met, the option will vest as to 30,000 shares.
All equity bonuses under the Wall Employment Agreement will be awarded under the Plan. The Plan provides that to the extent that equity bonuses of grants of common stock are designated Performance Compensation Awards (as defined by the Plan) by the board or the Compensation Committee and to the extent that each fiscal year constitutes a Performance Period (as defined by the Plan), pursuant to the Plan, such awards must be granted as soon as administratively practicable following completion of the certification of the attainment of the performance conditions for such awards but in no event later than 2 1/2 months following the end of the fiscal year during which the respective Performance Period is completed. Otherwise, such grants will be considered Performance Shares (as defined by the Plan) and will be granted when certified by the board or the Compensation Committee.
Mr. Wall is entitled to severance benefits equal to four months’ salary if terminated without Cause (as defined in the Wall Employment Agreement) during the first year of employment and two months’ salary if terminated during the second year of employment. Mr. Wall will be offered certain health care, dental, life insurance, disability, and retirement benefits. Mr. Wall will receive unlimited vacation days encompassing vacation, personal and sick days, subject to two weeks’ notice and approval whenever possible.
After the first year of employment, all cash and equity bonus compensation goals and bonus figures will be reviewed. Benchmarks and bonus percentages will be adjusted each year based on changing business factors.
The Wall Employment Agreement and Mr. Wall’s equity award agreements have general non-solicitation provisions but do not have non-competition provisions. Mr. Wall is also subject to a standard non-disclosure requirement under the Wall Employment Agreement.
The foregoing description of the Wall Employment Agreement is qualified in its entirety by reference to the full text of such agreement, a copy of which is filed as Exhibit 10.41 to this Annual Report on Form 10-K/A.
Mr. Wall has executed the Company’s standard Indemnification Agreement with officers and directors. Mr. Wall is covered by the Company’s directors and officers insurance policy as an executive officer.
Employment Agreement with Randolph Birney
Under our employment agreement with Randolph Birney, dated July 13, 2021 and effective as of November 8, 2021 (the “Birney Employment Agreement”), we agreed that, for a three-year term, unless terminated earlier in accordance with its terms, Mr. Birney will receive an annual salary of $300,000 and an annual cash bonus as determined by the board. Pursuant to the Birney Employment Agreement, on November 12, 2021, we awarded Mr. Birney a stock option for the purchase of 76,190 shares of common stock at an exercise price of $4.15 per share. The stock option will vest over a four-year period with 25% of the option vesting on the first anniversary of the date of grant and the balance of the option (75%) will vest monthly over the following three years after the first anniversary of the date of grant at a rate of 1/36 per month. Mr. Birney was entitled to $10,000 per month as repayment of sales commissions totaling approximately $197,109.95 that had been earned in previous years, subject to certain terms and conditions. All equity compensation under the Birney Employment Agreement has been made under standard forms of award agreements under the Plan.
Mr. Birney was entitled to the payment of $10,000 per month during 2022 and 2023 as repayment of sales commissions that had been earned in previous years totaling approximately $197,110, subject to certain terms and conditions. During 2022, Mr. Birney was entitled to $120,000 in total payments toward these prior-year commissions in addition to accrued interest of $2,742, and was paid $120,000. During 2023, Mr. Birney became entitled to approximately $77,110 and was entitled to accrued interest of $471, and was paid $77,110. Mr. Birney also received $9,000 as an automobile allowance in each of 2022 and 2023. All outstanding accrued interest upon prior-year commissions payable to Mr. Shape was orally waived on March 25, 2024.
Mr. Birney will be provided with standard executive benefits. The Company may terminate Mr. Birney’s employment by giving at least 30 days written notice. If we terminate Mr. Birney without cause or he resigns for good reason as provided under the agreement, we must pay at least 24 months’ severance, reimbursement of Mr. Birney for the first 18 months of the premiums associated with Mr. Birney’s continuation of health insurance for him and his family pursuant to COBRA, and immediate vesting of any outstanding unvested equity granted to Mr. Birney during his employment and immediate lifting of all lockups and restrictions on sales of such equity, or exercise of stock options. If we do not renew Mr. Birney’s employment agreement after the initial three-year term, then we must pay six months’ severance and reimburse the first six months of the premiums associated with Mr. Birney’s continuation of health insurance for him and his family pursuant to COBRA. Mr. Birney is also subject to standard confidentiality and noncompetition provisions. Mr. Birney’s stock option agreement contains certain non-competition and non-solicitation provisions pursuant to the standard form of such agreements under the Plan.
Effective January 2, 2024, Mr. Birney was no longer an “executive officer” of the Company as such term is defined under Rule 3b-7 of the Exchange Act. Mr. Birney remained an employee of the Company.
The foregoing description of the Birney Employment Agreement is qualified in its entirety by reference to the full text of such agreement, a copy of which is filed as Exhibit 10.7 to this Annual Report on Form 10-K/A.
Employment Agreement with Jason Nolley
Under our employment letter agreement with Jason Nolley, the Company’s former Chief Technology Officer, dated November 19, 2021 (the “Nolley Employment Agreement”), Mr. Nolley will receive an annual base salary of $150,000 and a monthly automobile and cell phone allowance of $750. As a signing bonus, on November 19, 2021, Mr. Nolley was granted an option to purchase 60,000 shares of common stock at an exercise price of $4.36 per share. The option vests in three equal amounts at each of the first, second and third anniversaries of the date of the date of the Nolley Employment Agreement. Mr. Nolley was initially eligible to receive a bonus of up to $125,000 in the Company’s common stock upon our achievement of certain amounts of trailing 12-month annual sales amounts. Effective March 8, 2024, Mr. Nolley orally waived his rights to such bonus shares. All equity compensation under the Nolley Employment Agreement has been made under standard forms of award agreements under the Plan. Mr. Nolley’s stock option agreement contains certain non-competition and non-solicitation provisions pursuant to the standard form under the Plan.
Mr. Nolley is entitled to severance benefits equal to six months’ salary if terminated without due cause. Mr. Nolley will be eligible to receive certain health care, dental, life insurance, disability, and retirement benefits after three months’ employment. Mr. Nolley will receive 15 days of paid time off, subject to two weeks’ notice and approval whenever possible. Mr. Nolley is subject to certain non-competition and non-solicitation provisions under his stock option agreement.
Effective January 2, 2024, Jason Nolley was no longer an “executive officer” of the Company as such term is defined under Rule 3b-7 of the Exchange Act. Mr. Nolley continued to be employed by the Company under the Nolley Employment Agreement as the Company’s Senior Vice President of Information Technology.
The foregoing description of the Nolley Employment Agreement is qualified in its entirety by reference to the full text of such agreement, a copy of which is filed as Exhibit 10.36 to this Annual Report on Form 10-K/A.
Employment Agreement with Stephen Paradiso
The Company and Stephen Paradiso, the former Chief of Staff of the Company, were parties to an employment letter agreement, dated as of December 6, 2021 (the “Paradiso Employment Agreement”). Mr. Paradiso resigned from his position with the Company on December 1, 2023.
Under the Paradiso Employment Agreement, Mr. Paradiso received an annual base salary of $175,000 and potential salary and annual bonus increases in future years based on the successful achievement of personal and business-related goals. For each of the first two years of the term of the Paradiso Employment Agreement, Mr. Paradiso was required to receive an annual performance cash bonus based on a review of the Company’s results for the fiscal year ended December 31, 2022 and the fiscal year ended December 31, 2023, respectively, with a target bonus percentage of 25%, 50%, 75%, or 100% of base salary, conditioned on (i) for fiscal year 2022, the occurrence of trailing 12-month revenue of the Company of $42 million, $47 million, $52 million, or $57 million, respectively, and, for fiscal year 2023, the occurrence of trailing 12-month revenue of the Company of $45 million, $55 million, $65 million, or $75 million, respectively, or (ii) the discretionary approval of the Company’s Chief Executive Officer, subject to approval by the Compensation Committee. In accordance with the Paradiso Employment Agreement, Mr. Paradiso received a cash bonus consisting of 100% of base salary, or $175,000, due to the occurrence of trailing 12-month revenue of more than $57 million during the fiscal year ended December 31, 2022.
In addition, pursuant to the Paradiso Employment Agreement, on December 6, 2021, Mr. Paradiso was granted a bonus of 65,000 restricted shares and an option to purchase up to 125,000 shares at an exercise price of $4.72 per share. The shares of restricted stock and 65,000 of the shares under the option were subject to vesting in eight equal installments over two years and were subject to a six-month lockup provision. Mr. Paradiso was also required to be granted up to 40,000 bonus shares of common stock and the option was subject to vesting as to an aggregate of 40,000 additional shares of common stock upon the occurrence of trailing 12-month revenue amounts, as follows: (i) grant of 10,000 shares and vesting of the stock option as to 10,000 shares any trailing 12-month revenue of $50 million; (ii) grant of 10,000 shares and vesting of the stock option as to 10,000 shares any trailing 12-month revenue of $60 million; (iii) grant of 10,000 shares and vesting of the stock option as to 10,000 shares any trailing 12-month revenue of $70 million; and (iv) grant of 10,000 shares and vesting of the stock option as to 10,000 shares any trailing 12-month revenue of $80 million. Mr. Paradiso was also required to be granted up to an aggregate of 22,500 bonus shares of common stock and the stock option was subject to vesting as to an aggregate of 22,500 shares of common stock once certain service conditions were achieved, as follows: (i) grant of 2,500 shares and vesting of the stock option as to 2,500 shares upon successfully executing a company “rhythm” by setting recurring meetings and tasks; (ii) grant of 10,000 shares and vesting of the stock option as to 10,000 shares upon successfully hiring and onboarding three chief officer-level or executive vice president-level leaders; and (iii) grant of 10,000 shares and vesting of the stock option as to 10,000 shares upon successfully creating and putting in motion a business plan and succession plan. On April 14, 2023, the Compensation Committee certified the attainment of the conditions for the grant of 12,500 shares of common stock and the vesting of the stock option as to 12,500 shares of common stock based on trailing 12-month revenue of more than $50 million during the fiscal year ended December 31, 2022 and Mr. Paradiso’s successfully executing a company “rhythm” by setting recurring meetings and tasks. Additionally, under the Paradiso Employment Agreement, if trailing 12-month revenue of the Company of $250 million occurred within three years of Mr. Paradiso’s start of employment, he was required to be granted an additional 100,000 bonus shares of common stock. After the second year of employment, all bonus compensation terms would be subject to review. All equity compensation under the Paradiso Employment Agreement was made under standard forms of award agreements under the Plan.
Mr. Paradiso was eligible to receive certain health care, dental, life insurance, disability, and retirement benefits since the end of his first three months’ employment. Mr. Paradiso was entitled to 25 days of paid time off annually, including vacation and sick days, subject to two weeks’ notice and approval whenever possible.
The Paradiso Employment Agreement did not provide for directors and officers indemnification or insurance to Mr. Paradiso. However, due to Mr. Paradiso’s position as an executive officer, the Company provided indemnification and advancement of expenses to Mr. Paradiso with respect to certain legal proceedings to the fullest extent not prohibited by the NRS or any other applicable law as directed by the Bylaws, subject to the limitations and exceptions provided therein. Likewise, Mr. Paradiso was automatically covered by the Company’s directors and officers insurance policy as an executive officer.
Mr. Paradiso was required to sign a standard nondisclosure and noncompete agreement that will not restrict Mr. Paradiso from working within the print or promotional industry, except for any specific direct competitors that are individually listed in that agreement, but Mr. Paradiso will be required not to solicit any current or existing clients or customers that were obtained prior to Mr. Paradiso’s employment or obtained during his employment unless given prior approval by the Company for the period specified in the noncompete agreement. Due to Mr. Paradiso’s voluntary execution of the equity award agreements described above, however, Mr. Paradiso is subject to their general non-competition provisions as well as their general non-solicitation provisions. Mr. Paradiso is also subject to a standard non-disclosure requirement under the Paradiso Employment Agreement. Mr. Paradiso’s restricted stock award agreement and stock option agreement contain certain non-competition and non-solicitation provisions pursuant to the standard forms of such agreements under the Plan.
The foregoing description of the Paradiso Employment Agreement is qualified in its entirety by reference to the full text of such agreement, a copy of which is filed as Exhibit 10.35 to this Annual Report on Form 10-K/A.
Outstanding Equity Awards at Fiscal Year-End
As of December 31, 2023, the following named executive officers had the following unexercised options, stock that has not vested, and equity incentive plan awards:
| | | Option Awards | | | Stock Awards | |
| Name | | | Number of
Securities
Underlying
Unexercised
Options
Exercisable (#) | | | | Number of
Securities Underlying Unexercised Options Unexercisable (#) | | | | Equity Incentive Plan
Awards: Number of Securities Underlying Unexercised Unearned Options (#) | | | | Option Exercise Price ($) | | | | Option
Expiration
Date | | | | Number of
Shares or
Units of
Stock
That
Have Not Vested (#) | | | | Market
Value of
Shares of
Units of
Stock
That
Have Not Vested ($) | | | | Equity
Incentive
Plan
Awards:
Number of
Unearned
Shares,
Units or
Other
Rights That
Have Not
Vested (#) | | | | Equity
Incentive
Plan
Awards: Market or
Payout
Unearned
Shares,
Units or
Other
Rights That
Have Not
Vested ($) | |
| Andrew Shape | | | 168,651 | (1) | | | 155,159 | (1) | | | — | | | $ | 4.15 | | | | 11/11/2031 | | | | — | | | $ | — | | | | — | | | $ | — | |
| David Browner | | | 38,667 | (2) | | | 19,333 | (2) | | | — | | | $ | 4.15 | | | | 11/11/2031 | | | | — | | | $ | — | | | | — | | | $ | — | |
| | | | — | | | | — | | | | — | | | $ | — | | | | — | | | | 2,500 | (3) | | $ | 3,700 | | | | — | | | $ | — | |
| | | | 7,500 | (4) | | | — | | | | 92,500 | (4) | | $ | 1.72 | | | | 4/14/2033 | | | | — | | | $ | — | | | | — | | | $ | — | |
| | | | — | | | | — | | | | — | | | $ | — | | | | — | | | | — | | | $ | — | | | | 30,000 | (5) | | $ | 44,400 | |
| Andrew Stranberg | | | 208,333 | (6) | | | 191,667 | (6) | | | — | | | $ | 4.15 | | | | 11/11/2031 | | | | — | | | $ | — | | | | — | | | $ | — | |
| Randolph Birney | | | 39,682 | (7) | | | 36,508 | (7) | | | — | | | $ | 4.15 | | | | 11/11/2031 | | | | — | | | $ | — | | | | — | | | $ | — | |
| Stephen Paradiso | | | 54,688 | (8) | | | — | | | | — | | | $ | 4.72 | | | | 12/5/2031 | | | | — | | | $ | — | | | | — | | | $ | — | |
(1) On November 12, 2021, Andrew Shape was granted an option to purchase 323,810 shares of common stock. The option is subject to vesting over a four-year period with 25% of the option vesting on the first anniversary of the date of grant and the balance (75%) vesting monthly over the following three years after the first anniversary of the date of grant at a rate of 1/36 per month.
(2) On November 12, 2021, David Browner was granted an option to purchase 58,000 shares of common stock. The option is subject to vesting over a three-year period with one-third (1/3) of the option vesting on each of the first, second and third anniversaries of the date of grant.
(3) On November 12, 2021, David Browner was granted 7,500 restricted shares of common stock. The restricted stock is subject to vesting over a three-year period with one-third (1/3) of the restricted stock vesting on each of the first, second and third anniversaries of the date of grant.
(4) On April 14, 2023, David Browner was granted an option to purchase 100,000 shares of common stock. The option is subject to performance conditions to vesting. On February 15, 2024, the Compensation Committee certified the attainment of performance conditions as to the vesting of 7,500 shares upon exercise of this option.
(5) On April 14, 2023, David Browner became entitled to grants of an aggregate of 35,000 shares of common stock subject to performance conditions. On February 15, 2024, the Compensation Committee certified the attainment of performance conditions as to the grant and vesting of 5,000 of these shares.
(6) On November 12, 2021, Andrew Stranberg was granted an option to purchase 400,000 shares of common stock. The option is subject to vesting over a four-year period with 25% of the option vesting on the first anniversary of the date of grant and the balance (75%) vesting monthly over the following three years after the first anniversary of the date of grant at a rate of 1/36 per month.
(7) Randolph Birney was granted an option to purchase 76,190 shares of common stock on November 12, 2021. The option is subject to vesting over a four-year period with 25% of the option vesting on the first anniversary of the date of grant and the balance (75%) vesting monthly over the following three years after the first anniversary of the date of grant at a rate of 1/36 per month.
(8) On December 6, 2021, Stephen Paradiso was granted an option to purchase 62,500 shares of common stock subject to vesting as to one-eighth of the shares at the end of every full quarter after the date of grant that Mr. Paradiso remained employed by the Company. Mr. Paradiso resigned from his position with the Company effective December 1, 2023. The vested portion of the option remained exercisable for three months following Mr. Paradiso’s resignation.
Director Compensation
The following table sets forth information concerning all cash and non-cash compensation awarded to, earned by or paid to the directors who are not named executive officers for services rendered in all capacities during the fiscal year ended December 31, 2023:
| Name | | Fees
Earned or
Paid in
Cash | | | Stock
Awards | | | Option
Awards | | | Non-Equity
Incentive
Plan
Compensation
Earnings | | | Nonqualified
Deferred
Compensation
Earnings | | | All Other
Compensation | | | Total | |
| Travis McCourt | | $ | 26,000 | | | | - | (1) | | | - | (1) | | | - | | | | - | | | | - | | | $ | 26,000 | |
| | | | | | | | | | | | | | | | | | | | | | | | | | | | | |
| Alan Chippindale | | $ | 26,000 | | | | - | (1) | | | - | (1) | | | - | | | | - | | | | | | | $ | 63,500 | |
| | | | | | | | | | | | | | | | | | | | | | | | | | | | | |
| Alejandro Tani | | $ | 20,000 | | | | - | (1) | | | - | (1) | | | - | | | | - | | | | - | | | $ | 20,000 | |
| | | | | | | | | | | | | | | | | | | | | | | | | | | | | |
| Ashley Marshall | | $ | 20,000 | | | | - | (1) | | | - | (1) | | | - | | | | - | | | | - | | | $ | 20,000 | |
(1) Each of Travis McCourt, Alan Chippindale, Alejandro Tani and Ashley Marshall had outstanding option awards consisting of a fully-vested option to purchase up to 5,000 shares of common stock and outstanding stock awards consisting of 2,892 shares of common stock as of December 31, 2023.
Under their independent director agreements, each director that has been determined to be independent will receive an annual cash fee and an initial award of restricted common stock and a stock option. We will pay the annual cash compensation fee to each non-employee director in four equal installments no later than the fifth business day of each calendar quarter commencing in the quarter ending March 31, 2022. We granted the restricted stock and options to the non-employee directors on November 12, 2021. The cash fee paid to each non-employee director will be $20,000 as to Ms. Marshall, $26,000 as to Mr. McCourt, $26,000 as to Mr. Chippindale, and $20,000 as to Mr. Tani. Under their agreements, 2,892 shares of restricted common stock were awarded to each independent director. The restricted stock vested in four (4) equal quarterly installments commencing in the quarter ending March 31, 2022. The option that was awarded to each non-employee director may be exercised to purchase 5,000 shares of common stock at the exercise price of $4.15 per share. The option vested and became exercisable in twelve (12) equal monthly installments over the first year following the date of grant, subject to the respective non-employee director continuing in service on our board through each such vesting date. The term of each stock option is ten years from the date of grant. We will also reimburse each non-employee director for pre-approved reasonable business-related expenses incurred in good faith in connection with the performance of the non-employee director’s duties for us.
The foregoing description of the independent director agreements is qualified in its entirety by reference to the full text of the forms of such document which are filed as 10.13 to this Annual Report on Form 10-K/A, and which is incorporated herein by reference.
Indemnification Agreements and Directors and Officers Liability Insurance
We have entered into a standard indemnification agreement with each of our officers and directors. The full text of the form of indemnification agreement is filed with this Annual Report on Form 10-K/A as Exhibit 10.14.
We have also obtained standard policies of insurance under which coverage is provided (a) to our directors and officers against loss rising from claims made by reason of breach of duty or other wrongful act, and (b) to us with respect to payments which we may make to such officers and directors pursuant to the indemnification agreements referred to above, our articles of incorporation and amended and restated bylaws, or otherwise as a matter of law.
Amended and Restated 2021 Equity Incentive Plan
On September 14, 2021, we established the Stran & Company, Inc. Amended and Restated 2021 Equity Incentive Plan. The purpose of the Plan is to grant restricted stock, stock options and other forms of incentive compensation to our officers, employees, directors and consultants. The maximum number of shares of common stock that may be issued pursuant to awards granted under the Plan is 3,000,000 shares. Cancelled and forfeited stock options and stock awards may again become available for grant under the Plan. As of December 31, 2023, 1,041,147 shares remained available for issuance under the Plan, including shares not otherwise reserved for outstanding stock options issued under the Plan.
The following description of the Plan is qualified in its entirety by reference to the full text of the Plan which is filed as Exhibit 10.15 to this Annual Report on Form 10-K/A, and which is incorporated herein by reference.
Summary of Principal Features of the Plan
Awards that may be granted include: (a) Incentive Stock Options, (b) Non-qualified Stock Options, (c) Stock Appreciation Rights, (d) Restricted Awards, (e) Performance Share Awards, and (f) Performance Compensation Awards, each as defined by the Plan. These awards offer our officers, employees, consultants and directors the possibility of future value, depending on the long-term price appreciation of our common stock and the award holder’s continuing service with our company.
Stock options give the option holder the right to acquire from us a designated number of shares of common stock at a purchase price that is fixed upon the grant of the option. The exercise price generally will not be less than the market price of the common stock on the date of grant. Stock options granted may be either Incentive Stock Options or Non-qualified Stock Option.
Stock Appreciation Rights, or SARs, may be granted alone or in tandem with options, and have an economic value similar to that of options. When a SAR for a particular number of shares is exercised, the holder receives a payment equal to the difference between the fair market value of the shares on the date of exercise and the exercise price of the shares under the SAR. The exercise price for SARs is normally the market price of the shares on the date the SAR is granted. Under the Plan, holders of SARs may receive this payment — the appreciation value — either in cash or shares of common stock valued at the fair market value on the date of exercise. The form of payment will be determined by the administrator.
Restricted Awards are awards of shares of common stock or rights to shares of common stock to participants at no cost. Restricted Stock (as defined by the Plan) represents issued and outstanding shares of common stock which may be subject to vesting criteria under the terms of the award within the discretion of the administrator. Restricted Stock Units (as defined by the Plan) represent the right to receive shares of common stock which may be subject to satisfaction of vesting criteria under the terms of the award within the discretion of the administrator. Restricted Stock and the rights under Restricted Stock Units are forfeitable and non-transferable until they vest. The vesting date or dates and other conditions for vesting are established when the shares are awarded.
The Plan also provides for Performance Compensation Awards, representing the right to receive a payment, which may be in the form of cash, shares of common stock, or a combination, based on the attainment of pre-established goals.
Principal Features of the Plan
Purposes of the Plan: The purposes of the Plan are (a) to enable the Company and any affiliate company to attract and retain the types of employees, consultants and directors who will contribute to the Company’s long-term success; (b) provide incentives that align the interests of employees, consultants and directors with those of the stockholders of the Company; and (c) promote the success of the Company’s business.
Administration of the Plan: The Plan is administered by the Compensation Committee. In this summary, we refer to the Compensation Committee as the administrator. Among other things, the administrator has the authority to select persons who will receive awards, determine the types of awards and the number of shares to be covered by awards, and to establish the terms, conditions, performance criteria, restrictions and other provisions of awards. The administrator has authority to establish, amend and rescind rules and regulations relating to the Plan.
Eligible Recipients: Persons eligible to receive awards under the Plan are employees (including officers or directors who are also treated as employees); consultants, i.e., individuals engaged to provide consulting or advisory services to the Company; and directors.
Shares Available Under the Plan: The maximum number of shares of our common stock that may be delivered to participants under the Plan is 3,000,000, subject to adjustment for certain corporate changes affecting the shares, such as stock splits. Shares subject to an award under the Plan which is canceled, forfeited or expires again become available for grants under the Plan.
Stock Options:
General. Subject to the provisions of the Plan, the administrator has the authority to determine all grants of stock options. That determination will include: (i) the number of shares subject to any option; (ii) the exercise price per share; (iii) the expiration date of the option; (iv) the manner, time and date of permitted exercise; (v) other restrictions, if any, on the option or the shares underlying the option; and (vi) any other terms and conditions as the administrator may determine.
Option Price. The exercise price for stock options will be determined at the time of grant. Normally, the exercise price will not be less than the fair market value on the date of grant. As a matter of tax law, the exercise price for any Incentive Stock Option awarded may not be less than the fair market value of the shares on the date of grant. However, Incentive Stock Option grants to any person owning more than 10% of our voting stock must have an exercise price of not less than 110% of the fair market value on the grant date.
Exercise of Options. An option may be exercised only in accordance with the terms and conditions of the option agreement as established by the administrator at the time of the grant. The option must be exercised by notice to us, accompanied by payment of the exercise price. Payments may be made in cash or, at the option of the administrator, by actual or constructive delivery of shares of common stock based upon the fair market value of the shares on the date of exercise.
Expiration or Termination. Options, if not previously exercised, will expire on the expiration date established by the administrator at the time of grant. In the case of Incentive Stock Options, such term cannot exceed ten years provided that in the case of holders of more than 10% of our voting stock, such term cannot exceed five years. Options will terminate before their expiration date if the holder’s service with the Company or an affiliate company terminates before the expiration date. The option may remain exercisable for specified periods after certain terminations of employment, including terminations as a result of death, disability or retirement, with the precise period during which the option may be exercised to be established by the administrator and reflected in the grant evidencing the award.
Incentive Stock Options and Non-Qualified Stock Options. As described elsewhere in this summary, an Incentive Stock Option is an option that is intended to qualify under certain provisions of the U.S. Internal Revenue Code of 1986, as amended (the “Code”), for more favorable tax treatment than applies to Non-qualified Stock Options. Only employees may be granted Incentive Stock Options. Any option that does not qualify as an Incentive Stock Option will be a Non-qualified Stock Option. Under the Code, certain restrictions apply to Incentive Stock Options. For example, the exercise price for Incentive Stock Options may not be less than the fair market value of the shares on the grant date and the term of the option may not exceed ten years. In addition, an Incentive Stock Option may not be transferred, other than by will or the laws of descent and distribution, and is exercisable during the holder’s lifetime only by the holder. In addition, no Incentive Stock Options may be granted to a holder that is first exercisable in a single year if that option, together with all Incentive Stock Options previously granted to the holder that also first become exercisable in that year, relate to shares having an aggregate market value in excess of $100,000, measured at the grant date.
Stock Appreciation Rights: Awards of SARs may be granted alone or in tandem with stock options. SARs provide the holder with the right, upon exercise, to receive a payment, in cash or shares of stock, having a value equal to the excess of the fair market value on the exercise date of the shares covered by the award over the exercise price of those shares. Essentially, a holder of a SAR benefits when the market price of the common stock increases, to the same extent that the holder of an option does, but, unlike an option holder, the SAR holder need not pay an exercise price upon exercise of the award.
Restricted Stock Awards. A Restricted Stock Award is a grant of shares of common stock. These awards may be subject to such vesting conditions, restrictions and contingencies as the administrator shall determine at the date of grant. Those may include requirements for continuous service and/or the achievement of specified performance goals. Restricted Stock is forfeitable and generally non-transferable until it vests. The vesting date or dates and other conditions for vesting are established when the shares are awarded. The administrator may remove any vesting or other restrictions from restricted stock whenever it may determine that, by reason of changes in applicable laws or other changes in circumstances arising after the date of grant, such action is appropriate. Holders of Restricted Stock otherwise generally have the rights of stockholders of the Company, including voting and dividend rights, to the same extent as other stockholders of the Company.
Restricted Stock Units. A Restricted Stock Unit is a right to receive stock on a future date, at which time the Restricted Stock Unit will be settled and the stock to which it granted rights will be issued to the Restricted Stock Unit holder. These awards may be subject to such vesting conditions, restrictions and contingencies as the administrator shall determine at the date of grant. Restricted stock units are forfeitable and generally non-transferable until they vest. The administrator may remove any vesting or other restrictions from a Restricted Stock Unit whenever it may determine that, by reason of changes in applicable laws or other changes in circumstances arising after the date of grant, such action is appropriate. A Restricted Stock Unit holder has no rights as a stockholder. The administrator may exercise discretion to credit a Restricted Stock Unit with cash and stock dividends, with or without interest, and distribute such credited amounts upon settlement of a Restricted Stock Unit, and if the Restricted Stock Unit is forfeited, such dividend equivalents will also be forfeited.
Performance Share Awards and Performance Compensation Awards: The administrator may grant Performance Share Awards and Performance Compensation Awards. A Performance Share Award means the grant of a right to receive a number of actual shares of common stock or share units based upon the performance of the Company during a performance period, as determined by the administrator. The administrator may determine the number of shares subject to the performance share award, the performance period, the conditions to be satisfied to earn an award, and the other terms, conditions and restrictions of the award. No payout of a performance share award will be made except upon written certification by the administrator that the minimum threshold performance goal(s) have been achieved.
The administrator may also designate any of the other awards described above as a Performance Compensation Award (other than stock options and SARs granted with an exercise price equal to or greater than the fair market value per share of common stock on the grant date). In addition, the administrator shall have the authority to make an award of a cash bonus to any participant and designate such award as a Performance Compensation Award. The participant must be employed by the Company on the last day of the performance period to be eligible for payment in respect of a Performance Compensation Award unless otherwise provided in the applicable award agreement. A Performance Compensation Award will be paid only to the extent that the administrator certifies in writing whether and the extent to which the applicable performance goals for the performance period have been achieved and the applicable performance formula determines that the Performance Compensation Award has been earned. A performance formula means, for a performance period, the one or more objective formulas applied against the relevant performance goal to determine, with regard to the Performance Compensation Award of a particular participant, whether all, some portion but less than all, or none of the Performance Compensation Award has been earned for the performance period. The administrator will not have the discretion to grant or provide payment in respect of a Performance Compensation Award for a performance period if the performance goals for such performance period have not been attained.
The administrator will establish performance goals for each Performance Compensation Award based upon the performance criteria that it has selected. The performance criteria shall be based on the attainment of specific levels of performance of the Company and may include the following: (a) net earnings or net income (before or after taxes); (b) basic or diluted earnings per share (before or after taxes); (c) net revenue or net revenue growth; (d) gross revenue; (e) gross profit or gross profit growth; (f) net operating profit (before or after taxes); (g) return on assets, capital, invested capital, equity, or sales; (h) cash flow (including, but not limited to, operating cash flow, free cash flow, and cash flow return on capital); (i) earnings before or after taxes, interest, depreciation and/or amortization; (j) gross or operating margins; (k) improvements in capital structure; (l) budget and expense management; (m) productivity ratios; (n) economic value added or other value added measurements; (o) share price (including, but not limited to, growth measures and total stockholder return); (p) expense targets; (q) margins; (r) operating efficiency; (s) working capital targets; (t) enterprise value; (u) safety record; (v) completion of acquisitions or business expansion; (w) achieving research and development goals and milestones; (x) achieving product commercialization goals; and (y) other criteria as may be set by the administrator from time to time.
The administrator will also determine the performance period for the achievement of the performance goals under a Performance Compensation Award. At any time during the first 90 days of a performance period (or such longer or shorter time period as the administrator shall determine) or at any time thereafter, in its sole and absolute discretion, to adjust or modify the calculation of a performance goal for such performance period in order to prevent the dilution or enlargement of the rights of participants based on the following events: (a) asset write-downs; (b) litigation or claim judgments or settlements; (c) the effect of changes in tax laws, accounting principles, or other laws or regulatory rules affecting reported results; (d) any reorganization and restructuring programs; (e) extraordinary nonrecurring items as described in Accounting Principles Board Opinion No. 30 (or any successor or pronouncement thereto) and/or in management’s discussion and analysis of financial condition and results of operations appearing in the Company’s annual report to stockholders for the applicable year; (f) acquisitions or divestitures; (g) any other specific unusual or nonrecurring events, or objectively determinable category thereof; (h) foreign exchange gains and losses; and (i) a change in the Company’s fiscal year.
Any one or more of the performance criteria may be used on an absolute or relative basis to measure the performance of our company, as the administrator may deem appropriate, or as compared to the performance of a group of comparable companies, or published or special index that the administrator deems appropriate.
In determining the actual size of an individual Performance Compensation Award, the administrator may reduce or eliminate the amount of the award through the use of negative discretion if, in its sole judgment, such reduction or elimination is appropriate. The administrator shall not have the discretion to (i) grant or provide payment in respect of Performance Compensation Awards if the performance goals have not been attained or (ii) increase a Performance Compensation Award above the maximum amount payable under the Plan.
Other Material Provisions: Awards will be evidenced by a written agreement, in such form as may be approved by the administrator. In the event of various changes to the capitalization of our company, such as stock splits, stock dividends and similar re-capitalizations, an appropriate adjustment will be made by the administrator to the number of shares covered by outstanding awards or to the exercise price of such awards. The administrator generally has the power to accelerate the exercise or vesting period of an award. The administrator is also permitted to include in the written agreement provisions that provide for certain changes in the award in the event of a change of control of our company, including acceleration of vesting or payment of the value of the award in cash or stock. Except as otherwise determined by the administrator at the date of grant, awards will generally not be transferable, other than by will or the laws of descent and distribution. Prior to any award distribution, to the extent provided by the terms of an award agreement and subject to the discretion of the administrator, a participant may satisfy any employee withholding tax requirements relating to the exercise or acquisition of common stock under an award by tendering a cash payment authorizing the Company to withhold shares of common stock otherwise issuable to the participant as a result of the exercise or acquisition of common stock under the award (in addition to the Company’s right to withhold from any compensation paid to the participant by the Company). The Board of Directors has the authority, at any time, to discontinue the granting of awards. The Board also has the authority to alter or amend the Plan or any outstanding award or may terminate the Plan as to further grants, provided that no amendment to the Plan will be made, without the approval of our stockholders, to the extent that such approval is required by law or the rules of an applicable securities exchange, or such alteration or amendment would change the number of shares available under the Plan or change the persons eligible for awards under the Plan. No amendment to an outstanding award made under the Plan that would adversely affect the award may be made without the consent of the holder of such award.
Clawback Policy
On November 2, 2023, our board of directors adopted a Clawback Policy in accordance with applicable Nasdaq rules (the “Clawback Policy”). The Clawback Policy provides that we will recover reasonably promptly the amount of erroneously awarded incentive-based compensation to any current or former executive officers in the event that the Company is required to prepare an accounting restatement due to the material noncompliance of the Company with any financial reporting requirement under the securities laws, including any required accounting restatement to correct an error in previously issued financial statements that is material to the previously issued financial statements, or that would result in a material misstatement if the error were corrected in the current period or left uncorrected in the current period. A copy of the Clawback Policy is filed as Exhibit 97.1 to this Annual Report on Form 10-K/A.
Pursuant to Rule 10D-1(b) of the Exchange Act, Nasdaq Listing Rule 5608, and the Clawback Policy, the Company conducted a recovery analysis of incentive-based compensation received by its executive officers and that was subject to recovery, to ascertain whether any adjustments were required as a result of the error corrections to the Company’s financial results during the year that are described in Note B to the financial statements included in this Annual Report on Form 10-K/A. The recovery analysis concluded that no adjustments to executive compensation were required because the error corrections did not impact any of the measures by which the Company compensated its executives with respect to the compensation received by its executive officers and subject to recovery.
ITEM 12. SECURITY OWNERSHIP OF CERTAIN BENEFICIAL OWNERS AND MANAGEMENT AND RELATED STOCKHOLDER MATTERS.
The following table sets forth certain information with respect to the beneficial ownership of our common stock as of March 28, 2024 by (i) each of our named executive officers, other executive officers, and directors; (ii) all of our executive officers and directors as a group; and (iii) each person who is known by us to beneficially own more than 5% of our common stock.
| Title of Class | | Name and Address of Beneficial Owner(1) | | Amount and
Nature of
Beneficial
Ownership(2) | | | Percent of
Class (%)(3) | |
| Common Stock | | Andrew Shape | | | 3,619,381 | (4) | | | 19.2 | |
| Common Stock | | David Browner | | | 58,667 | (5) | | | 0.3 | |
| Common Stock | | Andrew Stranberg | | | 5,416,190.143 | (6) | | | 28.7 | |
| Common Stock | | John Audibert | | | 215,255 | (7) | | | 1.2 | |
| Common Stock | | Sheila Johnshoy | | | 32,500 | (8) | | | 0.2 | |
| Common Stock | | Alan Chippindale | | | 15,892 | (9) | | | * | |
| Common Stock | | Travis McCourt | | | 7,892 | (10) | | | * | |
| Common Stock | | Alejandro Tani | | | 7,892 | (10) | | | * | |
| Common Stock | | Ashley Marshall | | | 8,652 | (11) | | | * | |
| Common Stock | | All directors and executive officers (9 persons) | | | 9,382,321.143 | | | | 48.9 | % |
| Common Stock | | Randolph Birney(12) | | | 847,619 | (13) | | | 4.5 | |
| Common Stock | | Stephen Paradiso(14) | | | 51,562 | | | | 0.3 | |
| * | The percentage of shares beneficially owned by this person, a director of the Company, does not exceed one percent of the outstanding shares of common stock as of March 28, 2024. |
| (1) | Unless otherwise specified, the address of each of the persons named in this table is c/o Stran & Company, Inc., 2 Heritage Drive, Suite 600, Quincy, MA 02171. |
| (2) | Beneficial ownership is determined in accordance with the rules of the SEC and generally includes voting or investment power with respect to securities. Under those rules, beneficial ownership includes any shares as to which a person has sole or shared voting power or investment power, and also any shares which the person has the right to acquire within 60 days of March 28, 2024, through the exercise or conversion of any stock option, convertible security, warrant or other right. Except as set forth below, each of the beneficial owners listed above has direct ownership of and sole voting power and investment power with respect to the shares of our common stock. |
| (3) | Based on 18,607,329 shares of common stock issued and outstanding as of March 28, 2024. For each beneficial owner above, any options exercisable within 60 days of March 28, 2024 have been included in the denominator. |
| (4) | Consisted of 3,417,000 shares of common stock and 202,381 shares of common stock issuable upon exercise of an option within 60 days of March 28, 2024. 3,400,000 of the shares of common stock are pledged as a security interest pursuant to a purchase money promissory note issued to Andrew Stranberg as collateral for Andrew Shape’s repayment obligations under this instrument. Mr. Shape may sell these shares subject to the security interest at prevailing market prices so long as such portion of the sale proceeds as is required under the promissory note to repay the note is so used to repay the note. The foregoing description of this instrument is qualified in its entirety by reference to the full text of such instrument which is filed as Exhibit 10.9 to this Annual Report on Form 10-K/A. |
| (5) | Consisted of (i) 12,500 shares of common stock, (ii) 7,500 shares of common stock issuable upon exercise of an option, and (iii) 38,667 shares of common stock issuable upon exercise of an option within 60 days of March 28, 2024. |
| (6) | Consisted of 5,166,190.143 shares of common stock and 250,000 shares of common stock issuable upon exercise of an option within 60 days of March 28, 2024. |
| (7) | Consisted of (i) 152,422 shares of common stock, (ii) 7,500 shares of common stock issuable upon exercise of an option, and (iii) 35,333 shares of common stock issuable upon exercise of an option within 60 days of March 28, 2024. |
| (8) | Consisted of (i) 15,000 shares of common stock, (ii) 7,500 shares of common stock issuable upon exercise of an option, and (iii) 10,000 shares of common stock issuable upon exercise of an option. |
| (9) | Consisted of 10,892 shares of common stock and 5,000 shares of common stock issuable upon exercise of an option. |
| (10) | Consisted of 2,892 shares of common stock and 5,000 shares of common stock issuable upon exercise of an option. |
| (11) | Consisted of 3,652 shares of common stock and 5,000 shares of common stock issuable upon exercise of an option. |
| (12) | Effective January 2, 2024, Mr. Birney was no longer an “executive officer” of the Company as such term is defined under Rule 3b-7 of the Exchange Act. Mr. Birney remained an employee of the Company. |
| (13) | Consisted of 800,000 shares of common stock and 47,619 shares of common stock issuable upon exercise of an option within 60 days of March 28, 2024. 800,000 of the shares of common stock are pledged as a security interest pursuant to a purchase money promissory note issued to Andrew Stranberg as collateral for Randolph Birney’s repayment obligations under this instrument. Mr. Birney may sell these shares subject to the security interest at prevailing market prices so long as such portion of the sale proceeds as is required under the promissory note to repay the note is so used to repay the note. The foregoing description of this instrument is qualified in its entirety by reference to the full text of such instrument which is filed as Exhibit 10.10 to this Annual Report. |
| (14) | Stephen Paradiso resigned from his position with the Company effective December 1, 2023. |
Changes in Control
We do not have any arrangements known to us the operation of which may at a subsequent date result in a change in control of the Company.
Securities Authorized for Issuance Under Equity Compensation Plans
The following table sets forth certain information about the securities authorized for issuance under our incentive plans as of December 31, 2023.
Plan Category | | Number of securities to be
issued upon
exercise of
outstanding
options,
warrants and
rights (a) | | | | Weighted-average
exercise price
of outstanding
options, warrants and
rights (b) | | | Number of securities
remaining available
for future issuance
under equity
compensation plans
(excluding securities
reflected in
column (a)) (c) | |
| Equity compensation plans approved by security holders(1) | | | 1,958,853 | (2)(3) | | | $ | 4.02 | (3) | | | 1,041,147 | (4) |
| Equity compensation plans not approved by security holders | | | - | | | | | - | | | | - | |
| Total | | | 1,958,853 | (2)(3) | | | $ | 4.02 | (3) | | | 1,041,147 | (4) |
| (1) | On September 14, 2021, the board of directors and the stockholders of the Company approved the Stran & Company, Inc. Amended and Restated 2021 Equity Incentive Plan. The purpose of the Plan is to grant restricted stock, stock options and other forms of incentive compensation to our officers, employees, directors and consultants. The maximum number of shares of common stock that may be issued pursuant to awards granted under the Plan is 3,000,000 shares. Cancelled and forfeited stock options and stock awards may again become available for grant under the Plan. For a further description of the Plan, see Item 11. “Executive Compensation – Amended and Restated 2021 Equity Incentive Plan”. |
| (2) | Includes both vested and unvested options to purchase common stock under the Plan. Does not include any restricted stock that has been granted subject to forfeiture as of December 31, 2023. |
| (3) | The amount in column (a) includes the following maximum number of shares of common stock that must be issued under performance share awards if specified targets are met and pursuant to the other terms and conditions of the Plan as of December 31, 2023: (i) up to 35,000 shares to David Browner, Chief Financial Officer; (ii) up to 40,000 shares to John Audibert, Vice President of Growth and Strategic Initiatives; (iii) up to 100,000 shares to Sheila Johnshoy, Chief Operating Officer; and (iv) up to 84,459 shares to Jason Nolley, former Chief Technology Officer, based on the price at which the common stock of the Company was last sold on the Nasdaq Capital Market as of December 31, 2023 ($1.48), which may overstate or understate the actual number of shares to be issued to Mr. Nolley, which must be valued at up to $125,000 in aggregate when issued. The number of shares subject to these awards may overstate expected dilution because the awards reflect the maximum number of shares to be awarded under best-case targets that may be unlikely to be achieved. The weighted-average exercise price in column (b) does not take these awards into account. |
| (4) | Represents shares available for award grant purposes under the Plan. Does not include any restricted stock that has been granted subject to forfeiture as of December 31, 2023. |
ITEM 13. CERTAIN RELATIONSHIPS AND RELATED TRANSACTIONS, AND DIRECTOR INDEPENDENCE.
Transactions with Related Persons
The following includes a summary of transactions since the beginning of our 2022 fiscal year, or any currently proposed transaction, in which we were or are to be a participant and the amount involved exceeded or exceeds the lesser of $120,000 or 1% of the average of our total assets at year-end for the last two completed fiscal years, and in which any related person had or will have a direct or indirect material interest (other than compensation described under Item 11 “Executive Compensation” above). We believe the terms obtained or consideration that we paid or received, as applicable, in connection with the transactions described below were comparable to terms available or the amounts that would be paid or received, as applicable, in arm’s-length transactions.
Transactions with Non-Employee Director Affiliates
Transaction with Innovative Genetics (Alejandro Tani)
Alejandro Tani, a member of our board of directors, the chairman of the Company’s Nominating and Corporate Governance Committee, and a member of the Compensation Committee and the Company’s Audit Committee, is the Chief Executive Officer, Chief Information Officer, and majority owner of Innovative Genetics. Under a Branded Packaging Agreement between Innovative Genetics and the Company, dated as of March 6, 2023 (the “Innovative Genetics Packaging Agreement”), Innovative Genetics granted the Company a limited, non-exclusive, revocable license to use Innovative Genetics’s logos, trade names and trademarks on apparel and promotional products as branded products for sale to Innovative Genetics and Innovative Genetics-authorized persons. The branded products must meet Innovative Genetics’s quality standards. Innovative Genetics will pay the Company within 90 days after the date of an invoice under the agreement, subject to the Company’s credit policies and procedures and discretionary right to modify payment or credit. Each statement of work under the Innovative Genetics Packaging Agreement must have a personal guaranty stating that Innovative Genetics’s principal will pay any invoices related to that statement of work regardless of financial stability of Innovative Genetics. All products and services provided to Innovative Genetics and any services that Innovative Genetics may provide to the Company in exchange for such products and services under the Innovative Genetics Packaging Agreement will be based on a commercial relationship and any such services will include only non-advisory services. The Innovative Genetics Packaging Agreement does not contemplate any accounting, consulting, legal, investment banking or financial advisory services. The Innovative Genetics Packaging Agreement will terminate upon 90 days’ written notice to the other party.
Under Statement of Work No. 1 under the Innovative Genetics Packaging Agreement, effective as of March 6, 2023 (the “Innovative Genetics SOW”), the Company will provide Innovative Genetics with branded packaging products from various factories located in China, finance the cost to manufacture that packaging, and import/transport those goods into one location in the United States where Innovative Genetics will then co-pack, sell, and distribute the final product itself. The Company will only deliver the packaging to Innovative Genetics and will not touch or be involved in the co-packing, distribution, or any other matter related to the final product, which will include cannabis. The Company will invoice Innovative Genetics upon delivery of each shipment. In connection with the foregoing, the Company will purchase products from various factories, pay them directly, and subsequently charge Innovative Genetics the prices following an outline set forth in the Innovative Genetics SOW. The Innovative Genetics SOW will not require the Company to, and the Company will not, make any payments to Innovative Genetics in connection with this SOW, including any extensions of credit involving any payments to Innovative Genetics. The total amount to be charged to Innovative Genetics under the Innovative Genetics SOW will be $1,159,331, related shipping costs with a 15% markup, and duties, taxes, or tariffs will be charged at cost. The Company will not be a participant in any transaction involving the packaging, sale or distribution of the final product.
In connection with the Innovative Genetics SOW, Mr. Tani executed a Guaranty, dated as of March 6, 2023, in favor of and for the benefit of the Company (the “Tani Guaranty”). Under the Tani Guaranty, Mr. Tani guaranteed the payment of all obligations of Innovative Genetics under the Innovative Genetics Packaging Agreement and Innovative Genetics SOW. The Tani Guaranty contains other standard provisions for a personal guaranty, including standard waivers of defenses to payment obligations, reinstatement in the event that any payment must be returned to Innovative Genetics, non-exercise of subrogation rights against Innovative Genetics or any other guarantor until all payments required under the Innovative Genetics SOW have been made, subordination of any debts against Innovative Genetics to the obligations of Innovative Genetics to the Company under the SOW, and payment of any reasonable expenses of the Company, including attorneys’ fees and legal expenses, which the Company may incur in enforcing its rights under the Innovative Genetics SOW or the Tani Guaranty.
As of December 31, 2023, the balance owed by Innovative Genetics under the Innovative Genetics SOW was $852,668, in addition to related shipping costs with a 30% markup, and duties, taxes, or tariffs at cost. 8% annual interest will accrue on the balance for past due payment status subsequent to December 31, 2023.
As of December 31, 2023, the approximate dollar value of Mr. Tani’s interest in the transaction described above was $852,668. In addition, accrued annual interest of 8% for past due payment status, related shipping costs with a 30% markup, and duties, taxes, or tariffs at cost will be the responsibility of Mr. Tani as guarantor of Innovative Genetics’s payment obligations and a potential debtor to the Company pursuant to the Tani Guaranty. The payments by Innovative Genetics in the current or any of the past three fiscal years do not exceed 5% of our consolidated gross revenues for that year, or $200,000, whichever is more.
Transactions with Engage and Excel (Alan Chippindale)
Alan Chippindale, a member of our board of directors, the chairman of the Compensation Committee, and a member of the Company’s Nominating and Corporate Governance Committee, is the President of Engage & Excel. We and Engage & Excel are parties to a Buyer’s Agreement, dated June 25, 2020 (the “Buyer’s Agreement”). Under the Buyer’s Agreement, Engage & Excel agreed to provide certain merger and acquisition, management and recruitment consulting services in connection with our acquisition of the Wildman Imprint assets. We agreed to pay Engage & Excel a fee of $20,000 upon completion of a purchase and sale agreement and two annual fees of 1.5% of gross margin less costs attributable to the acquisition. We paid Engage & Excel $9,954 as the first annual fee in November 2021 and $12,836 in December 2022 under the Buyer’s Agreement. Separately from the Buyer’s Agreement, in 2023, we paid Engage & Excel $17,500 for recruiting fees and $20,000 for consulting fees relating to the T R Miller assets acquisition. We also agreed to pay Engage & Excel 1.5% of the contribution margin of the T R Miller assets for two years, paid annually. In September 2022, we paid Engage & Excel a one-time fee of $15,000 for providing certain merger and acquisition consulting services in connection with our acquisition of Trend Brand Solutions. In addition, we paid Engage & Excel a total of $13,750 in 2022 related to other recruitment consulting services. The fees paid or that we have agreed to pay to Engage & Excel for consulting services to date have totaled less than $200,000. The Board of Directors has determined that Mr. Chippindale remains eligible under Nasdaq rules to serve as an “independent director” of the Company and as a member and chairman of the Compensation Committee and a member of the Nominating and Corporate Governance Committee.
Open-Market Purchases of Common Stock by Related Persons
On June 23, 2023, Alan Chippindale, a director of the Company, purchased 8,000 shares of common stock on the open market at $1.4667 per share.
On August 28, 2023, Andrew Stranberg, Executive Chairman, Treasurer, Secretary, and director, purchased 10,560 shares of common stock on the open market at $1.0995 per share.
On June 30, 2023, Mr. Stranberg purchased 9,934.436 shares of common stock on the open market at $1.5099 per share.
On June 29, 2023, Mr. Stranberg purchased 2,695.707 shares of common stock on the open market at $1.4838 per share.
On December 14, 2022, Mr. Stranberg purchased 25,000 shares of common stock on the open market at $1.2702 per share.
On May 20, 2022, Mr. Stranberg purchased 18,000 shares of Common stock on the open market at $1.7563 per share.
On December 13, 2022, Andrew Shape, Chief Executive Officer and President of the Company, purchased 141.2639 shares of common stock on the open market at $1.3892 per share.
On December 12, 2022, Mr. Shape purchased 1,858.7361 shares of common stock on the open market at $1.345 per share.
On May 20, 2022, Andrew Shape purchased 15,000 shares of common stock on the open market at $1.7584 per share.
On May 20, 2022, John Audibert, Vice President of Growth and Strategic Initiatives of the Company, purchased 5,000 shares of common stock on the open market at $1.7656 per share.
On December 9, 2022, Mr. Audibert purchased 5,000 shares of common stock on the open market at $1.3617 per share.
On June 27, 2023, Mr. Audibert purchased 3,250 shares of common stock on the open market at $1.4723 per share.
On September 7, 2023, Ashley Marshall, a director of the Company, purchased 760 shares of common stock on the open market at $1.26 per share.
On December 30, 2022, Jason Nolley, a former executive officer of the Company, purchased 4,000 shares of common stock on the open market at $1.24 per share.
Director Independence
Independent Directors
Nasdaq’s rules generally require that a majority of an issuer’s board of directors consist of independent directors. Our board of directors consists of six directors, four of whom have been determined by our board of directors to be “independent directors” within the meaning of Nasdaq Listing Rule 5605(a)(2). For a discussion of certain considerations relating to transactions with Alan Chippindale, see “—Transactions with Related Persons – Transactions with Non-Employee Director”, which is incorporated by reference herein. For discussion of compensation and indemnification arrangements with our independent directors for services performed as members of our board of directors, see Item 11 “Executive Compensation – Director Compensation”, which is incorporated by reference herein.
Committees of the Board of Directors
Our board of directors has established the Audit Committee, the Compensation Committee, the Nominating and Corporate Governance Committee, and the Disclosure Controls and Procedures Committee, each with its own charter approved by the board. Each committee’s charter is also available on our website at https://www.ir.stran.com/.
In addition, our board of directors may, from time to time, designate one or more additional committees, which shall have the duties and powers granted to it by the board.
Audit Committee
Travis McCourt, Alejandro Tani, and Ashley Marshall, each of whom has been determined by our board of directors to satisfy the “independence” requirements of Rule 10A-3 under the Exchange Act and Nasdaq’s rules, serve on our Audit Committee, with Mr. McCourt serving as the chairman. Our board has determined that each of Mr. McCourt and Mr. Tani qualifies as an “audit committee financial expert” as defined by Item 407(d)(5) of Regulation S-K. The Audit Committee oversees our accounting and financial reporting processes and the audits of the financial statements of our company.
Compensation Committee
Alan Chippindale, Travis McCourt and Alejandro Tani, each of whom has been determined by our board of directors to satisfy the “independence” requirements of Rule 10C-1 under the Exchange Act and Nasdaq’s rules, serve on our Compensation Committee, with Mr. Chippindale serving as the chairman. The members of the Compensation Committee are also “non-employee directors” within the meaning of Section 16 of the Exchange Act. The Compensation Committee assists the board in reviewing and approving the compensation structure, including all forms of compensation, relating to our directors and executive officers.
Nominating and Corporate Governance Committee
Alejandro Tani, Ashley Marshall, and Alan Chippindale, each of whom has been determined by our board of directors to satisfy the “independence” requirements of Nasdaq’s rules, serve on our Nominating and Corporate Governance Committee, with Mr. Tani serving as the chairman. The Nominating and Corporate Governance Committee assists the board of directors in selecting individuals qualified to become our directors and in determining the composition of the board and its committees.
Disclosure Controls and Procedures Committee
The members of the Disclosure Controls and Procedures Committee are the officers and directors of the Company. The Chief Financial Officer of the Company acts as the chair of the committee. The Disclosure Controls and Procedures Committee assist the Company’s officers and directors in fulfilling the Company’s and their responsibilities regarding (i) the identification and disclosure of material information about the Company and (ii) the accuracy, completeness and timeliness of the Company’s financial reports under the Exchange Act and the rules of Nasdaq.
ITEM 14. PRINCIPAL ACCOUNTANT FEES AND SERVICES.
Independent Auditors’ Fees
The aggregate fees billed to the Company by Marcum LLP as the Company’s accountant for the indicated services for each of the last two fiscal years were as follows:
| | | Year Ended
December 31, | |
| | | 2023 | | | 2022 | |
| Audit fees | | $ | 225,000 | | | $ | 115,000 | |
| Audit-related fees | | | 38,500 | | | | — | |
| Tax fees | | | — | | | | — | |
| All other fees | | | — | | | | — | |
| Total | | $ | 263,500 | | | $ | 115,000 | |
As used in the table above, the following terms have the meanings set forth below.
Audit Fees
Audit fees consist of aggregate fees billed for each of the last two fiscal years for professional services performed by the Company’s prior principal accountant for the audit of the financial statements included in our Annual Report on Form 10-K and review of the financial statements included in our Quarterly Reports on Form 10-Q, reviews of registration statements and issuances of consents, and services that are normally provided in connection with statutory and regulatory filings or engagements for those fiscal years.
Audit-Related Fees
Audit-related fees consist of aggregate fees billed in each of the last two fiscal years for assurance and related services performed by the Company’s prior principal accountant that are reasonably related to the performance of the audit or review of our financial statements and are not reported under the paragraph captioned “Audit-Fees” above. During the fiscal year ended December 31, 2023, audit-related services consisted of an audit of the financial statements of T R Miller, related to the Company’s acquisition of the assets of T R Miller, which closed in June 2023.
Tax Fees
Tax fees consist of aggregate fees billed in each of the last two fiscal years for professional services performed by the Company’s prior principal accountant with respect to tax compliance, tax advice, tax consulting and tax planning. We did not engage our prior principal accountant to provide tax compliance, tax advice or tax planning services during the last two fiscal years.
All Other Fees
All other fees consist of aggregate fees billed in each of the last two fiscal years for products and services provided by the Company’s prior principal accountant, other than for the services reported under the headings “Audit Fees,” “Audit-Related Fees” and “Tax Fees” above. We did not engage our prior principal accountant to render services to us during the last two fiscal years, other than as reported above.
Pre-Approval Policies and Procedures
The Audit Committee has reviewed and approved all fees earned in 2023 and 2022 by the Company’s prior principal accountant with respect to these years, and actively monitored the relationship between audit and non-audit services provided. The Audit Committee has concluded that the fees earned by the prior principal accountant with respect to these years were consistent with the maintenance of the prior principal accountant’s independence in the conduct of its auditing functions.
None of the services described in “—Audit-Related Fees” above for 2023 were approved by the Audit Committee pursuant to paragraph (c)(7)(i)(C) of Rule 2-01 of Regulation S-X.
The Audit Committee annually considers the provision of audit services. The Audit Committee must pre-approve all services provided and fees earned by the Company’s principal accountant. The Audit Committee has established pre-approval policies and procedures that are detailed as to the particular service, that require that the Audit committee be informed of each service, and that do not include delegation of the Audit Committee’s responsibilities under the Exchange Act to management. The pre-approval policies and procedures provide only for defined audit services and, if any, specified audit-related fees, tax services, and other services, and may impose specific dollar value limits for the fees for pre-approved services. The Audit Committee also considers on a case-by-case basis specific engagements that are not otherwise pre-approved under the pre-approval policies and procedures or that materially exceed pre-approved fee amounts. On an interim basis, any proposed engagement that does not fit within the definition of a pre-approved service may be presented to a designated member of the Audit Committee for approval and to the full Audit Committee at its next regular meeting.
The percentage of hours expended on the Company’s prior principal accountant’s engagement to audit the Company’s financial statements for the most recent fiscal year that were attributed to work performed by persons other than the prior principal accountant’s full-time, permanent employees was not greater than 50%.
PART IV
ITEM 15. EXHIBIT AND FINANCIAL STATEMENT SCHEDULES.
| (a) | List of Documents Filed as a Part of This Report: |
| (1) | Index to Financial Statements: |
| | Report of Independent Registered Public Accounting Firm (PCAOB ID 00688) |
| | Balance Sheets as of December 31, 2023 and 2022 (Restated) |
| | Statements of Operations for the Years Ended December 31, 2023 and 2022 (Restated) |
| | Statements of Comprehensive Loss for the Years Ended December 31, 2023 and 2022 (Restated) |
| | Statement of Stockholders’ Equity for the Years Ended December 31, 2023 and 2022 (Restated) |
| | Statements of Cash Flows for the Years Ended December 31, 2023 and 2022 (Restated) |
| | Notes to the Restated Financial Statements |
| (2) | Index to Financial Statement Schedules: |
All schedules have been omitted because the required information is included in the financial statements or the notes thereto, or because it is not required.
See exhibits listed under “—(b) Exhibits” below.
(b) Exhibits:
Exhibit No. | | Description |
| 2.1 | | Asset Purchase Agreement, dated as of January 21, 2022, by and among Stran & Company, Inc., G.A.P. Promotions, LLC, and Gayle Piraino and Stephen Piraino (incorporated by reference to Exhibit 2.1 to the Current Report on Form 8-K filed on January 26, 2022) |
| 2.2 | | Amendment No. 1 to Asset Purchase Agreement, dated as of January 31, 2022, by and among Stran & Company, Inc., G.A.P. Promotions, LLC, and Gayle Piraino and Stephen Piraino (incorporated by reference to Exhibit 2.2 to the Current Report on Form 8-K filed on February 1, 2022) |
| 2.3 | | Asset Purchase Agreement, dated as of July 13, 2022, by and among Stran & Company, Inc., Trend Promotional Marketing Corporation (d/b/a Trend Brand Solutions) and Michael Krauser (incorporated by reference to Exhibit 2.1 to the Current Report on Form 8-K filed on July 19, 2022) |
| 2.4 | | Amendment No. 1 to Asset Purchase Agreement, dated as of August 31, 2022, by and among Stran & Company, Inc., Trend Promotional Marketing Corporation (d/b/a Trend Brand Solutions) and Michael Krauser (incorporated by reference to Exhibit 2.2 to the Current Report on Form 8-K filed on September 7, 2022) |
| 2.5 | | Asset Purchase Agreement, dated as of January 25, 2023, by and among Stran & Company, Inc., T R Miller Co., Inc. and Thomas R. Miller (incorporated by reference to Exhibit 2.1 to the Current Report on Form 8-K filed on January 31, 2023) |
| 3.1 | | Articles of Incorporation of Stran & Company, Inc. (incorporated by reference to Exhibit 3.1 to the Registration Statement on Form S-1 filed on October 7, 2021) |
| 3.2 | | Amended and Restated Bylaws of Stran & Company, Inc. (incorporated by reference to Exhibit 3.2 to the Amendment No.1 to Registration Statement on Form S-1 filed on October 22, 2021) |
| 4.1 | | Description of Securities of Stran & Company, Inc. (incorporated by reference to Exhibit 4.1 to Annual Report on Form 10-K filed on March 28, 2024) |
| 10.1 | | Asset Purchase Agreement between Wildman Business Group, LLC and Stran & Company, Inc., dated as of August 24, 2020 (incorporated by reference to Exhibit 10.1 to Registration Statement on Form S-1 filed on October 7, 2021) |
| 10.2 | | Buyer’s Agreement between Engage & Excel Enterprises Inc. and Stran & Company, Inc., dated as of June 25, 2020 (incorporated by reference to Exhibit 10.2 to Registration Statement on Form S-1 filed on October 7, 2021) |
| 10.3 | | Lease Agreement between Campanelli-Trigate Heritage Quincy, LLC and Stran & Company, Inc., dated as of December 26, 2014 (incorporated by reference to Exhibit 10.12 to Registration Statement on Form S-1 filed on October 7, 2021) |
| 10.4 | | First Amendment to Lease Agreement among GCP H2 LLC, GCP H2 A LLC, GCP H2 B LLC, GCP H2 C LLC and Stran & Company, Inc., dated as of May 31, 2019 (incorporated by reference to Exhibit 10.13 to Registration Statement on Form S-1 filed on October 7, 2021) |
| 10.5† | | Employment Agreement between Stran & Company, Inc. and Andrew Shape, dated as of July 13, 2021 (incorporated by reference to Exhibit 10.14 to Registration Statement on Form S-1 filed on October 7, 2021) |
| 10.6† | | Employment Agreement between Stran & Company, Inc. and Andrew Stranberg, dated as of July 13, 2021 (incorporated by reference to Exhibit 10.15 to Registration Statement on Form S-1 filed on October 7, 2021) |
| 10.7† | | Employment Agreement between Stran & Company, Inc. and Randolph Birney, dated as of July 13, 2021 (incorporated by reference to Exhibit 10.16 to Registration Statement on Form S-1 filed on October 7, 2021) |
| 10.8† | | Employment Agreement between Stran & Company, Inc. and Christopher Rollins, dated as of September 7, 2021 (incorporated by reference to Exhibit 10.17 to Registration Statement on Form S-1 filed on October 7, 2021) |
| 10.9 | | Purchase Money Promissory Note between Andrew Shape and Andrew Stranberg, effective as of May 24, 2021 (incorporated by reference to Exhibit 10.18 to Registration Statement on Form S-1 filed on October 7, 2021) |
| 10.10 | | Purchase Money Promissory Note between Randolph Birney and Andrew Stranberg, effective as of May 24, 2021 (incorporated by reference to Exhibit 10.19 to Registration Statement on Form S-1 filed on October 7, 2021) |
| 10.11 | | Stock Purchase Agreement between Andrew Shape and Andrew Stranberg, dated as of May 24, 2021 (incorporated by reference to Exhibit 10.20 to Registration Statement on Form S-1 filed on October 7, 2021) |
| 10.12 | | Stock Purchase Agreement between Randolph Birney and Andrew Stranberg, dated as of May 24, 2021 (incorporated by reference to Exhibit 10.21 to Registration Statement on Form S-1 filed on October 7, 2021) |
| 10.13† | | Form of Independent Director Agreement between Stran & Company, Inc. and each non-employee director (incorporated by reference to Exhibit 10.24 to Registration Statement on Form S-1 filed on October 7, 2021) |
| 10.14 | | Form of Indemnification Agreement between Stran & Company, Inc. and each officer or director (incorporated by reference to Exhibit 10.14 to the Annual Report on Form 10-K filed on March 28, 2024) |
| 10.15† | | Stran & Company, Inc. Amended and Restated 2021 Equity Incentive Plan (incorporated by reference to Exhibit 10.26 to Registration Statement on Form S-1 filed on October 7, 2021) |
| 10.16† | | Form of Stock Option Agreement for Stran & Company, Inc. Amended and Restated 2021 Equity Incentive Plan (incorporated by reference to Exhibit 10.27 to Registration Statement on Form S-1 filed on October 7, 2021) |
| 10.17† | | Form of Restricted Stock Award Agreement for Stran & Company, Inc. Amended and Restated 2021 Equity Incentive Plan (incorporated by reference to Exhibit 10.28 to Registration Statement on Form S-1 filed on October 7, 2021) |
| 10.18 | | Warrant Agency Agreement, dated November 8, 2021, between Stran & Company, Inc. and Vstock Transfer, LLC and Form of Warrant (incorporated by reference to Exhibit 10.1 to the Current Report on Form 8-K filed on November 12, 2021) |
| 10.19 | | Revolving Demand Line of Credit Loan Agreement, dated November 22, 2021, by and between Stran & Company, Inc. and Salem Five Cents Savings Bank (incorporated by reference to Exhibit 10.1 to the Current Report on Form 8-K filed on November 26, 2021) |
| 10.20 | | Revolving Demand Line of Credit Note, dated November 22, 2021, by Stran & Company, Inc. in favor of Salem Five Cents Savings Bank (incorporated by reference to Exhibit 10.2 to the Current Report on Form 8-K filed on November 26, 2021) |
| 10.21 | | Security Agreement, dated November 22, 2021, by and between Stran & Company, Inc. in favor of Salem Five Cents Savings Bank (incorporated by reference to Exhibit 10.3 to the Current Report on Form 8-K filed on November 26, 2021) |
| 10.22 | | Warehouseman’s Waiver, dated November 4, 2021 and executed November 22, 2021, by and among Harte Hanks Response Management/ Boston, Inc., Stran & Company, Inc. and Salem Five Cents Savings Bank (incorporated by reference to Exhibit 10.4 to the Current Report on Form 8-K filed on November 26, 2021) |
| 10.23 | | Underwriting Agreement, dated November 8, 2021, by and between Stran & Company, Inc. and EF Hutton, division of Benchmark Investments, LLC (as representative of the underwriters named therein) (incorporated by reference to Exhibit 1.1 to the Current Report on Form 8-K filed on November 12, 2021) |
| 10.24 | | Representative’s Warrant Agreement, dated November 12, 2021, between Stran & Company, Inc. and Benchmark Investments, LLC (incorporated by reference to Exhibit 10.2 to the Quarterly Report on Form 10-Q filed on December 7, 2021) |
| 10.25 | | Representative’s Warrant Agreement, dated November 12, 2021, between Stran & Company, Inc. and David W. Boral (incorporated by reference to Exhibit 10.3 to the Quarterly Report on Form 10-Q filed on December 7, 2021) |
| 10.26 | | Representative’s Warrant Agreement, dated November 12, 2021, between Stran & Company, Inc. and Joseph T. Rallo (incorporated by reference to Exhibit 10.4 to the Quarterly Report on Form 10-Q filed on December 7, 2021) |
| 10.27 | | Representative’s Warrant Agreement, dated November 12, 2021, between Stran & Company, Inc. and U.S. Tiger Securities, Inc. (incorporated by reference to Exhibit 10.5 to the Quarterly Report on Form 10-Q filed on December 7, 2021) |
| 10.28† | | Consulting Agreement between Stran & Company, Inc., Josselin Capital Advisors, Inc. and John Audibert, dated as of December 2, 2021 (incorporated by reference to Exhibit 10.11 to the Quarterly Report on Form 10-Q filed on December 7, 2021) |
| 10.29 | | Form of Securities Purchase Agreement, dated as of December 8, 2021 (incorporated by reference to Exhibit 10.1 to the Current Report on Form 8-K filed on December 13, 2021) |
| 10.30 | | Placement Agency Agreement dated December 8, 2021 (incorporated by reference to Exhibit 10.2 to the Current Report on Form 8-K filed on December 13, 2021) |
| 10.31 | | Form of Registration Rights Agreement, dated as of December 8, 2021 (incorporated by reference to Exhibit 10.3 to the Current Report on Form 8-K filed on December 13, 2021) |
| 10.32 | | Form of Private Placement Common Stock Purchase Warrant, dated December 10, 2021 (incorporated by reference to Exhibit 10.4 to the Current Report on Form 8-K filed on December 13, 2021) |
| 10.33 | | Form of Placement Agent Warrant (incorporated by reference to Exhibit 10.5 to the Current Report on Form 8-K filed on December 13, 2021) |
| 10.34† | | Employment Offer Letter, dated March 11, 2022, by and between Stran & Company, Inc. and Sheila Johnshoy (incorporated by reference to Exhibit 10.1 to the Current Report on Form 8-K filed on March 16, 2022) |
| 10.35† | | Employment Offer Letter, dated December 6, 2021, by and between Stran & Company, Inc. and Stephen Paradiso (incorporated by reference to Exhibit 10.45 to the Annual Report on Form 10-K filed on March 28, 2022) |
| 10.36† | | Employment Offer Letter, dated November 19, 2021, by and between Stran & Company, Inc. and Jason Nolley (incorporated by reference to Exhibit 10.46 to the Annual Report on Form 10-K filed on March 28, 2022) |
| 10.37 | | Land and Building Lease Agreement, dated May 31, 2023, between Miller Family Walpole LLC and Stran & Company, Inc. (incorporated by reference to Exhibit 10.1 to the Current Report on Form 8-K filed on June 1, 2023) |
| 10.38† | | Employment Agreement, dated as of April 14, 2023, by and between Stran & Company, Inc. and David Browner (incorporated by reference to Exhibit 10.1 to the Current Report on Form 8-K filed on April 20, 2023) |
| 10.39† | | Amended and Restated Consulting Agreement, dated as of April 14, 2023, by and between Stran & Company, Inc., John Audibert and Josselin Capital Advisors, Inc. (incorporated by reference to Exhibit 10.2 to the Current Report on Form 8-K filed on April 20, 2023) |
| 10.40† | | Employment Agreement between Stran & Company, Inc. and David Leuci, dated August 14, 2023 (incorporated by reference to Exhibit 10.1 to the Quarterly Report on Form 10-Q filed on November 6, 2023) |
| 10.41† | | Employment Agreement between Stran & Company, Inc. and Ian Wall, dated December 11, 2023 (incorporated by reference to Exhibit 10.41 to the Annual Report on Form 10-K filed on March 28, 2024) |
| 10.42 | | Commercial Loan Modification Agreement, dated as of February 12, 2024, between Salem Five Cents Savings Bank and Stran & Company, Inc. (incorporated by reference to Exhibit 10.42 to the Annual Report on Form 10-K filed on March 28, 2024) |
| 14.1 | | Code of Ethics and Business Conduct (incorporated by reference to Exhibit 14.1 to Registration Statement on Form S-1 filed on October 7, 2021) |
| 31.1* | | Certifications of Principal Executive Officer filed pursuant to Section 302 of the Sarbanes-Oxley Act of 2002 |
| 31.2* | | Certifications of Principal Financial and Accounting Officer filed pursuant to Section 302 of the Sarbanes-Oxley Act of 2002 |
| 32.1** | | Certifications of Principal Executive Officer furnished pursuant to Section 906 of the Sarbanes-Oxley Act of 2002 |
| 32.2** | | Certifications of Principal Financial and Accounting Officer furnished pursuant to Section 906 of the Sarbanes-Oxley Act of 2002 |
| 97.1 | | Stran & Company, Inc. Clawback Policy (incorporated by reference to Exhibit 97.1 to the Annual Report on Form 10-K filed on March 28, 2024) |
| 99.1 | | Stran & Company, Inc. Second Amended and Restated Insider Trading Policy (incorporated by reference to Exhibit 99.1 to the Annual Report on Form 10-K filed on March 28, 2024) |
| 101.PRE* | | XBRL Instance Document |
| 101.INS* | | XBRL Taxonomy Extension Schema Document |
| 101.SCH* | | XBRL Taxonomy Extension Calculation Linkbase Document |
| 101.CAL* | | XBRL Taxonomy Extension Definition Linkbase Document |
| 101.DEF* | | XBRL Taxonomy Extension Label Linkbase Document |
| 101.LAB* | | XBRL Taxonomy Extension Presentation Linkbase Document |
| 104* | | Cover Page Interactive Data File (formatted as Inline XBRL and contained in Exhibit 101) |
| † | Executive compensation plan or arrangement |
ITEM 16. FORM 10-K SUMMARY.
None.
INDEX TO FINANCIAL STATEMENTS
Report of Independent Registered Public Accounting Firm
To the Shareholders and Board of Directors of
Stran & Company Inc.
Opinion on the Financial Statements
We have audited the accompanying balance sheets of Stran & Company Inc. (the “Company”) as of December 31, 2023 and 2022, the related statements of operations, comprehensive loss, stockholders’ equity, and cash flows for each of the two years in the period ended December 31, 2023, and the related notes (collectively referred to as the “financial statements”). In our opinion, the financial statements present fairly, in all material respects, the financial position of the Company as of December 31, 2023 and 2022, and the results of its operations and its cash flows for each of the two years in the period ended December 31, 2023, in conformity with accounting principles generally accepted in the United States of America.
Restatement to Correct Previously Issued Financial Statements
As discussed in Note B to the financial statements, the Company has restated its financial statements as of and for the years ended December 31, 2023 and 2022 to correct misstatements.
Basis for Opinion
These financial statements are the responsibility of the Company's management. Our responsibility is to express an opinion on the Company's financial statements based on our audits. We are a public accounting firm registered with the Public Company Accounting Oversight Board (United States) ("PCAOB") and are required to be independent with respect to the Company in accordance with the U.S. federal securities laws and the applicable rules and regulations of the Securities and Exchange Commission and the PCAOB.
We conducted our audits in accordance with the standards of the PCAOB and in accordance with auditing standards generally accepted in the United States of America. Those standards require that we plan and perform the audits to obtain reasonable assurance about whether the financial statements are free of material misstatement, whether due to error or fraud. The Company is not required to have, nor were we engaged to perform, an audit of its internal control over financial reporting. As part of our audits, we are required to obtain an understanding of internal control over financial reporting but not for the purpose of expressing an opinion on the effectiveness of the Company's internal control over financial reporting. Accordingly, we express no such opinion.
Our audits included performing procedures to assess the risks of material misstatement of the financial statements, whether due to error or fraud, and performing procedures that respond to those risks. Such procedures included examining, on a test basis, evidence regarding the amounts and disclosures in the financial statements. Our audits also included evaluating the accounting principles used and significant estimates made by management, as well as evaluating the overall presentation of the financial statements. We believe that our audits provide a reasonable basis for our opinion.
/s/ Marcum llp
Marcum llp
We have served as the Company’s auditor since 2024.
Marlton, New Jersey
January 22, 2025
STRAN & COMPANY, INC.
BALANCE SHEETS
(in thousands, except share and per share amounts)
| | | December 31,
2023 | | | December 31,
2022 | |
| | | (Restated) | | | (Restated) | |
| ASSETS | | | | | | |
| CURRENT ASSETS: | | | | | | |
| Cash and cash equivalents | | $ | 8,059 | | | $ | 15,254 | |
| Investments | | | 10,393 | | | | 9,779 | |
| Accounts receivable, net | | | 16,223 | | | | 13,750 | |
| Accounts receivable – related parties | | | 853 | | | | — | |
| Inventory | | | 4,782 | | | | 5,927 | |
| Prepaid corporate taxes | | | 62 | | | | 87 | |
| Prepaid expenses | | | 953 | | | | 387 | |
| Deposits | | | 1,717 | | | | 910 | |
| Total current assets | | | 43,042 | | | | 46,094 | |
| | | | | | | | | |
| Property and equipment, net | | | 1,521 | | | | 1,000 | |
| | | | | | | | | |
| OTHER ASSETS: | | | | | | | | |
| Intangible assets, net | | | 3,114 | | | | 2,238 | |
| Goodwill | | | — | | | | 90 | |
| Other assets | | | 23 | | | | 23 | |
| Right of use asset - office leases | | | 1,336 | | | | 785 | |
| Total other assets | | | 4,473 | | | | 3,136 | |
| Total assets | | $ | 49,036 | | | $ | 50,230 | |
| | | | | | | | | |
| LIABILITIES AND STOCKHOLDERS’ EQUITY | | | | | | | | |
| CURRENT LIABILITIES: | | | | | | | | |
| Accounts payable and accrued expenses | | $ | 4,745 | | | $ | 4,049 | |
| Accrued payroll and related | | | 2,568 | | | | 610 | |
| Unearned revenue | | | 1,116 | | | | 633 | |
| Rewards program liability | | | 875 | | | | 6,000 | |
| Sales tax payable | | | 344 | | | | 365 | |
| Current portion of contingent earn-out liabilities | | | 224 | | | | 738 | |
| Current portion of installment payment liabilities | | | 786 | | | | 267 | |
| Current portion of lease liability | | | 528 | | | | 325 | |
| Note payable - Wildman | | | — | | | | 162 | |
| Total current liabilities | | | 11,186 | | | | 13,149 | |
| | | | | | | | | |
| LONG-TERM LIABILITIES: | | | | | | | | |
| Long-term contingent earn-out liabilities | | | 763 | | | | 488 | |
| Long-term installment payment liabilities | | | 639 | | | | 414 | |
| Long-term lease liability | | | 798 | | | | 460 | |
| Total long-term liabilities | | | 2,200 | | | | 1,362 | |
| Total liabilities | | $ | 13,386 | | | $ | 14,511 | |
| | | | | | | | | |
| Commitments and contingencies (Note M) | | | | | | | | |
| | | | | | | | | |
| STOCKHOLDERS’ EQUITY: | | | | | | | | |
| Preferred stock, $0.0001 par value; 50,000,000 shares authorized, 0 shares issued and outstanding as of December 31, 2023 and 2022 | | | — | | | | — | |
| Common stock, $0.0001 par value; 300,000,000 shares authorized, 18,539,000 and 18,475,336 shares issued and outstanding as of December 31, 2023 and 2022, respectively | | | 2 | | | | 2 | |
| Additional paid-in capital | | | 38,263 | | | | 38,113 | |
| Accumulated deficit | | | (2,602 | ) | | | (2,217 | ) |
| Accumulated other comprehensive loss | | | (13 | ) | | | (179 | ) |
| Total stockholders’ equity | | | 35,650 | | | | 35,719 | |
| Total liabilities and stockholders’ equity | | $ | 49,036 | | | $ | 50,230 | |
The accompanying notes are an integral part of these restated financial statements.
STRAN & COMPANY, INC.
STATEMENTS OF OPERATIONS
YEARS ENDED DECEMBER 31, 2023 AND 2022
(in thousands, except share and per share amounts)
| | | 2023 | | | 2022 | |
| | | (Restated) | | | (Restated) | |
| SALES | | | | | | |
| Sales | | $ | 75,147 | | | $ | 57,878 | |
| Sales – related parties | | | 853 | | | | — | |
| Total sales | | | 76,000 | | | | 57,878 | |
| | | | | | | | | |
| COST OF SALES: | | | | | | | | |
| Cost of sales | | | 50,492 | | | | 42,493 | |
| Cost of sales - related parties | | | 656 | | | | — | |
| Total cost of sales | | | 51,148 | | | | 42,493 | |
| | | | | | | | | |
| GROSS PROFIT | | | 24,852 | | | | 15,385 | |
| | | | | | | | | |
| OPERATING EXPENSES: | | | | | | | | |
| General and administrative expenses | | | 25,310 | | | | 17,789 | |
| Goodwill impairment | | | 810 | | | | 1,182 | |
| Total operating expenses | | | 26,120 | | | | 18,971 | |
| | | | | | | | | |
| LOSS FROM OPERATIONS | | | (1,268 | ) | | | (3,586 | ) |
| | | | | | | | | |
| OTHER INCOME AND (LOSS): | | | | | | | | |
| Other income | | | 186 | | | | 34 | |
| Interest income | | | 570 | | | | 95 | |
| Change in fair value of contingent earn-out liability | | | 65 | | | | 180 | |
| Realized gain (loss) on investments | | | 103 | | | | (1 | ) |
| Total other income | | | 924 | | | | 308 | |
| | | | | | | | | |
| LOSS BEFORE INCOME TAXES | | | (344 | ) | | | (3,278 | ) |
| | | | | | | | | |
| Provision for income taxes | | | 41 | | | | 222 | |
| | | | | | | | | |
| NET LOSS | | $ | (385 | ) | | $ | (3,500 | ) |
| | | | | | | | | |
| NET LOSS PER COMMON SHARE | | | | | | | | |
| Basic | | $ | (0.02 | ) | | $ | (0.18 | ) |
| Diluted | | $ | (0.02 | ) | | $ | (0.18 | ) |
| | | | | | | | | |
| WEIGHTED-AVERAGE COMMON SHARES OUTSTANDING | | | | | | | | |
| Basic | | | 18,519,892 | | | | 19,202,594 | |
| Diluted | | | 18,519,892 | | | | 19,202,594 | |
The accompanying notes are an integral part of these restated financial statements.
STRAN & COMPANY, INC.
STATEMENTS OF COMPREHENSIVE LOSS
YEARS ENDED DECEMBER 31, 2023 AND 2022
(in thousands)
| | | 2023 | | | 2022 | |
| | | (Restated) | | | (Restated) | |
| Net loss | | $ | (385 | ) | | $ | (3,500 | ) |
| | | | | | | | | |
| Other comprehensive income (loss): | | | | | | | | |
| Change in unrealized gain (loss) on investments (net of tax) | | | 167 | | | | (179 | ) |
| Total other comprehensive income (loss) | | | 167 | | | | (179 | ) |
| | | | | | | | | |
| Comprehensive loss | | $ | (218 | ) | | $ | (3,679 | ) |
The accompanying notes are an integral part of these restated financial statements.
STRAN & COMPANY, INC.
STATEMENTS OF STOCKHOLDERS’ EQUITY
YEARS ENDED DECEMBER 31, 2023 AND 2022
(in thousands, except share amounts)
| | | Preferred Stock | | | Common Stock | | | Additional
Paid-In | | | Accumulated
Other
Comprehensive | | | Retained
Earnings
(Accumulated | | | Stockholders’ | |
| | | Shares | | | Value | | | Shares | | | Value | | | Capital | | | Loss | | | Deficit) | | | Equity | |
Balance, January 1, 2022
(Restated) | | | — | | | $ | — | | | | 19,753,852 | | | $ | 2 | | | $ | 39,748 | | | $ | — | | | $ | 1,283 | | | $ | 41,033 | |
| IPO Warrants exercised | | | — | | | | — | | | | 271,589 | | | | — | | | | 1,307 | | | | — | | | | — | | | | 1,307 | |
| Business acquisitions | | | — | | | | — | | | | 74,577 | | | | — | | | | 58 | | | | — | | | | — | | | | 58 | |
| Stock-based compensation | | | — | | | | — | | | | 152,975 | | | | — | | | | 331 | | | | — | | | | — | | | | 331 | |
| Stock repurchased and retired | | | — | | | | — | | | | (1,777,657 | ) | | | — | | | | (3,331 | ) | | | — | | | | — | | | | (3,331 | ) |
| Other comprehensive loss | | | — | | | | | | | | — | | | | — | | | | — | | | | (179 | ) | | | — | | | | (179 | ) |
| Net loss | | | — | | | | — | | | | — | | | | — | | | | — | | | | — | | | | (3,500 | ) | | | (3,500 | ) |
Balance, December 31, 2022
(Restated) | | | — | | | $ | — | | | | 18,475,336 | | | $ | 2 | | | $ | 38,113 | | | $ | (179 | ) | | $ | (2,217 | ) | | $ | 35,719 | |
| Stock-based compensation | | | — | | | | — | | | | 101,173 | | | | — | | | | 200 | | | | — | | | | — | | | | 200 | |
| Stock repurchased and retired | | | — | | | | — | | | | (37,509 | ) | | | — | | | | (50 | ) | | | — | | | | — | | | | (50 | ) |
| Other comprehensive income | | | — | | | | — | | | | — | | | | — | | | | — | | | | 166 | | | | — | | | | 166 | |
| Net loss | | | — | | | | — | | | | — | | | | — | | | | — | | | | — | | | | (385 | ) | | | (385 | ) |
Balance, December 31, 2023
(Restated) | | | — | | | $ | — | | | | 18,539,000 | | | $ | 2 | | | $ | 38,263 | | | $ | (13 | ) | | $ | (2,602 | ) | | $ | 35,650 | |
The accompanying notes are an integral part of these restated financial statements.
STRAN & COMPANY, INC.
STATEMENTS OF CASH FLOWS
YEARS ENDED DECEMBER 31, 2023 AND 2022
(in thousands)
| | | 2023 | | | 2022 | |
| | | (Restated) | | | (Restated) | |
| CASH FLOWS FROM OPERATING ACTIVITIES: | | | | | | |
| Net loss | | $ | (385 | ) | | $ | (3,500 | ) |
| Adjustments to reconcile net loss to net cash used in operating activities: | | | | | | | | |
| Adjustment to deferred income taxes | | | — | | | | 217 | |
| Depreciation and amortization | | | 772 | | | | 420 | |
| Adjustment to reconcile operating lease expense to cash paid | | | 8 | | | | — | |
| Change in allowance for credit losses | | | (174 | ) | | | 36 | |
| Change in fair value of contingent earn-out liability | | | (65 | ) | | | (180 | ) |
| Gain on extinguishment of debt | | | (162 | ) | | | — | |
| Goodwill impairment | | | 810 | | | | 1,182 | |
| Noncash interest accretion | | | 11 | | | | — | |
| Stock-based compensation | | | 200 | | | | 331 | |
| Unrealized gain (loss) on investments | | | 167 | | | | (179 | ) |
| Changes in operating assets and liabilities: | | | | | | | | |
| Accounts receivable | | | (677 | ) | | | (3,007 | ) |
| Accounts receivable – related parties | | | (853 | ) | | | — | |
| Inventory | | | 2,027 | | | | (945 | ) |
| Prepaid taxes | | | 25 | | | | — | |
| Prepaid expenses | | | (561 | ) | | | 865 | |
| Deposits | | | (807 | ) | | | (611 | ) |
| Accounts payable and accrued expenses | | | 104 | | | | (1,901 | ) |
| Accrued payroll and related | | | 1,958 | | | | (227 | ) |
| Unearned revenue | | | 198 | | | | (715 | ) |
| Rewards program liability | | | (5,125 | ) | | | 5,956 | |
| Sales tax payable | | | (21 | ) | | | 258 | |
| Net cash used in operating activities | | | (2,550 | ) | | | (2,000 | ) |
| | | | | | | | | |
| CASH FLOWS FROM INVESTING ACTIVITIES: | | | | | | | | |
| Business acquisitions, net of cash acquired | | | (2,123 | ) | | | (1,875 | ) |
| Purchases of property and equipment | | | (999 | ) | | | (626 | ) |
| Proceeds from sale of investments | | | 4,231 | | | | 200 | |
| Purchase of investments | | | (4,845 | ) | | | (9,979 | ) |
| Net cash used in investing activities | | | (3,736 | ) | | | (12,280 | ) |
| | | | | | | | | |
| CASH FLOWS FROM FINANCING ACTIVITIES: | | | | | | | | |
| Payment of contingent earn-out liabilities | | | (641 | ) | | | (669 | ) |
| Payment of installment payment liabilities | | | (218 | ) | | | — | |
| Payment for stock repurchase | | | (50 | ) | | | (3,331 | ) |
| Proceeds from warrants exercised | | | — | | | | 1,307 | |
| Net cash used in financing activities | | | (909 | ) | | | (2,693 | ) |
| | | | | | | | | |
| NET DECREASE IN CASH | | | (7,195 | ) | | | (16,973 | ) |
| | | | | | | | | |
| CASH - BEGINNING | | | 15,254 | | | | 32,227 | |
| CASH - ENDING | | | 8,059 | | | | 15,254 | |
The accompanying notes are an integral part of these restated financial statements.
STRAN & COMPANY, INC.
STATEMENTS OF CASH FLOWS
YEARS ENDED DECEMBER 31, 2023 AND 2022
(CONTINUED)
(in thousands)
SUPPLEMENTAL DISCLOSURES OF CASH FLOW INFORMATION
| | | 2023 | | | 2022 | |
| Cash paid during the period for: | | (Restated) | | | (Restated) | |
| Interest | | $ | — | | | $ | 4 | |
| Income taxes | | $ | — | | | $ | 76 | |
| | | | | | | | | |
| Noncash investing and financing activities: | | | | | | | | |
| Assets acquired in GAP business acquisition | | $ | — | | | $ | 2,834 | |
| Liabilities assumed in GAP business acquisition | | $ | — | | | $ | 1,323 | |
| Assets acquired in Trend business acquisition | | $ | — | | | $ | 1,154 | |
| Liabilities assumed in Trend business acquisition | | $ | — | | | $ | 1,104 | |
| Fair value of common stock issued for Trend business acquisition | | $ | — | | | $ | 48 | |
| Assets acquired in Premier business acquisition | | $ | — | | | $ | 848 | |
| Liabilities assumed in Premier business acquisition | | $ | — | | | $ | 398 | |
| Fair value of common stock issued for Premier business acquisition | | $ | — | | | $ | 10 | |
| Assets acquired in TR Miller business acquisition | | $ | 5,236 | | | $ | — | |
| Liabilities assumed in TR Miller business acquisition | | $ | 3,113 | | | $ | — | |
| Lease liabilities arising from obtaining right-of-use assets | | $ | 1,034 | | | $ | — | |
The accompanying notes are an integral part of these restated financial statements.
STRAN & COMPANY, INC.
NOTES TO THE RESTATED FINANCIAL STATEMENTS
(in thousands, except share and per share amounts)
| A. | ORGANIZATION AND SUMMARY OF SIGNIFICANT ACCOUNTING POLICIES: |
| 1. | Organization - Stran & Company, Inc., (the “Company”) was incorporated under the laws of the Commonwealth of Massachusetts and commenced operations on November 17, 1995. The Company re-incorporated under the laws of the State of Nevada on May 24, 2021. |
| 2. | Operations - The Company is an outsourced marketing solutions provider that sells branded products to customers. The Company purchases products and branding through various third-party manufacturers and decorators and resells the finished goods to customers. |
In addition to selling branded products, the Company offers clients custom sourcing capabilities; a flexible and customizable e-commerce solution for promoting branded merchandise and other promotional products, managing promotional loyalty and incentives, print collateral, and event assets, order and inventory management, and designing and hosting online retail popup shops, fixed public retail online stores, and online business-to-business service offerings; creative and merchandising services; warehousing/fulfillment and distribution; print-on-demand; kitting; point of sale displays; and loyalty and incentive programs.
| 3. | Method of Accounting - The Company’s financial statements are prepared using the accrual basis of accounting in accordance with accounting principles generally accepted in the United States of America. (“U.S. GAAP”). |
| 4. | Emerging Growth Company - The Company is an “emerging growth company,” as defined in Section 2(a) of the Securities Act, of 1933, as amended (the “Securities Act”), as modified by the Jumpstart Our Business Startups Act of 2012 (the “JOBS Act”), and it may take advantage of certain exemptions from various reporting requirements that are applicable to other public companies that are not emerging growth companies including, but not limited to, not being required to comply with the auditor attestation requirements of Section 404 of the Sarbanes-Oxley Act of 2002, reduced disclosure obligations regarding executive compensation in its periodic reports and proxy statements, and exemptions from the requirements of holding a nonbinding advisory vote on executive compensation and approval of any golden parachute payments not previously approved. Further, Section 102(b)(1) of the JOBS Act exempts emerging growth companies from being required to comply with new or revised financial accounting standards until private companies (that is, those that have not had a Securities Act registration statement declared effective or do not have a class of securities registered under the Securities Exchange Act of 1934 (the “Exchange Act”)) are required to comply with the new or revised financial accounting standards. The JOBS Act provides that a company can elect to opt out of the extended transition period and comply with the requirements that apply to non-emerging growth companies but any such election to opt out is irrevocable. The Company has elected not to opt out of such extended transition period which means that when a standard is issued or revised and it has different application dates for public or private companies, the Company, as an emerging growth company, can adopt the new or revised standard at the time private companies adopt the new or revised standard. This may make comparison of the Company’s consolidated financial statements with another public company which is neither an emerging growth company nor an emerging growth company which has opted out of using the extended transition period difficult or impossible because of the potential differences in accounting standards used. |
| 5. | Cash and Cash Equivalents - For purposes of the statement of cash flows, the Company considers all highly liquid investments with an initial maturity of three months or less to be cash equivalents. |
| 6. | Fair Value Measurements and Fair Value of Financial Instruments - The Company follows the guidance in ASC 820 for its financial assets and liabilities that are re-measured and reported at fair value at each reporting period, and non-financial assets and liabilities that are re-measured and reported at fair value at least annually. |
The fair value of the Company’s financial assets and liabilities reflects management’s estimate of amounts that the Company would have received in connection with the sale of the assets or paid in connection with the transfer of the liabilities in an orderly transaction between market participants at the measurement date. In connection with measuring the fair value of its assets and liabilities, the Company seeks to maximize the use of observable inputs (market data obtained from independent sources) and to minimize the use of unobservable inputs (internal assumptions about how market participants would price assets and liabilities). The following fair value hierarchy is used to classify assets and liabilities based on the observable inputs and unobservable inputs used in order to value the assets and liabilities:
| | Level 1: | Quoted prices in active markets for identical assets or liabilities. An active market for an asset or liability is a market in which transactions for the asset or liability occur with sufficient frequency and volume to provide pricing information on an ongoing basis. |
| | | |
| | Level 2: | Observable inputs other than Level 1 inputs. Examples of Level 2 inputs include quoted prices in active markets for similar assets or liabilities and quoted prices for identical assets or liabilities in markets that are not active. |
| | | |
| | Level 3: | Unobservable inputs based on our assessment of the assumptions that market participants would use in pricing the asset or liability. |
STRAN & COMPANY, INC.
NOTES TO THE RESTATED FINANCIAL STATEMENTS
(in thousands, except share and per share amounts)
The carrying value of certain financial instruments, including cash and cash equivalents, accounts receivable, accounts payable and note payable - Wildman are carried at historical cost basis, which approximates their fair values because of the short-term nature of these instruments.
| 7. | Investments - The Company’s investments consist of U.S. treasury bills, corporate bonds, mutual funds, and money market funds. Investments are classified as available-for-sale, recorded at fair value and considered current on the balance sheet. |
| 8. | Concentration of Credit Risk - Financial instruments that potentially subject the Company to concentrations of credit risk consist primarily of accounts receivable and deposits in excess of federally insured limits. These risks are managed by performing ongoing credit evaluations of customers’ financial condition and by maintaining all deposits in high quality financial institutions. |
During the years ended December 31, 2023 and 2022, the Company maintained deposits in three banks that exceeded the federal insured deposit limit of the Federal Deposit Insurance Corporation (FDIC).
For the year ended December 31, 2023, the Company had one major customer to which sales accounted for approximately 14.4% of the Company’s revenues. The Company had accounts receivable from this customer amounting to 0.8% of the total accounts receivable balance.
For the year ended December 31, 2022, the Company had no major customers.
| 9. | Inventory – Inventory consists of finished goods (branded products) and goods in process (un-branded products awaiting decoration). All inventory is stated at the lower of cost (first-in, first-out method) or net realizable value. |
| 10. | Property and Equipment, Net - Property and equipment are recorded at cost. Maintenance and repairs are charged to expense as incurred whereas major betterments are capitalized. Depreciation is provided using straight-line and accelerated methods over five years. |
| 11. | Goodwill and Intangible Assets - Goodwill represents the excess purchase price of the acquired companies over the fair value of identifiable net assets acquired. Goodwill is not amortized; rather, it is subject to a periodic assessment for impairment. The Company reviews goodwill for possible impairment annually on October 1 every year or whenever events or circumstances indicate that the carrying amount may not be recoverable. |
To determine whether goodwill is impaired, annually or more frequently if needed, the Company performs a multi-step impairment test. Impairment testing is conducted at the reporting unit level. The Company first has the option to assess qualitative factors to determine if it is more likely than not that the carrying value of a reporting unit exceeds its estimated fair value. Under ASC 350, Intangibles - Goodwill and Other, the qualitative assessment requires the consideration of factors such as recent market transactions, macroeconomic conditions, and changes in projected future cash flows or planned revenue or earnings of the reporting unit as potential indicators when determining the need for a quantitative assessment of impairment. The Company may also elect to skip the qualitative testing and proceed directly to the quantitative testing. When performing quantitative testing, the Company first estimates the fair values of its reporting unit using a combination of an income and market approach. To determine fair values, the Company is required to make assumptions about a wide variety of internal and external factors. Significant assumptions used in the impairment analysis include financial projections of free cash flow (including significant assumptions about operations including the rate of future revenue growth, capital requirements, and income taxes), long-term growth rates for determining terminal value, and discount rates. Comparative market multiples are used to corroborate the results of the discounted cash flow test. These assumptions require significant judgement. The single step is to determine the estimated fair value of the reporting unit and compare it to the carrying value of the reporting unit, including goodwill. If we conclude based on our qualitative assessment that it is more likely than not that the fair value of a reporting unit is less than its carrying value, we then measure the fair value of the reporting unit and compare its fair value to its carrying value (Step 1 of the goodwill impairment test). The Company also completes a reconciliation between the implied equity valuation prepared and the Company’s market capitalization. The majority of the inputs used in the discounted cash flow model are unobservable and thus are considered to be Level 3 inputs. The inputs for the market capitalization calculation are considered Level 1 inputs.
STRAN & COMPANY, INC.
NOTES TO THE RESTATED FINANCIAL STATEMENTS
(in thousands, except share and per share amounts)
| 12. | Revenue Recognition - The Company accounts for revenue under ASC 606, Revenue for Contract with Customers (“ASC 606”). Revenue is generated through various types of transactions, including promotional product sales, administering a customer’s rewards program, facilitating redemption code programs, and additional contract add-ons to enhance customer experience. The Company follows the five step model of revenue recognition: |
| i. | identify the contract(s) with a customer; |
| ii. | identify the performance obligations in the contract; |
| iii. | determine the transaction price; |
| iv. | allocate the transaction price to the performance obligations within the contract; and |
| v. | recognize revenue when (or as) the entity satisfies a performance obligation. |
The Company’s contract assessment and approval varies based on whether the customer requests a one time sale or a long-term contract. Customers with long-term contracts require signed Master Sales Agreements, while one time sales contracts may be approved via email, electronic signature, or verbally. Once the contract is identified and approved, the Company assesses the goods or services promised within the contract to determine whether each promised good or service is a performance obligation. The Company identifies each piece of promotional product as an individual performance obligation based on the following fact pattern. Customers can benefit from each item of promotional product produced on its own. Each piece of promotional product does not significantly modify or customize other promotional products and are not highly interdependent or interrelated with each other. The Company can, and frequently does, break portions of contracts into separate shipments to meet Customer demands. As such, each piece of promotional product is considered a separate and distinct performance obligation.
The transaction price for the majority of the Company’s sales can be clearly identified in a significant majority of the contracts due to an observable selling price. The transaction price is then allocated to the performance obligation(s), i.e. promotional product. The agreements include clearly identified prices.
The Company recognizes revenue when or as performance obligations are satisfied by transferring control of a promised good or service to a customer. Stran evaluates transfer of control primarily from the customer’s perspective. Considering the transaction from the customer’s perspective reduces the risk that revenue is recognized for activities that do not transfer control of a good or service to the customer. Management determines, at contract inception, whether control of a good or service transfers to a customer over time or at a point in time. The assessment of whether control transfers over time or at a point in time is critical to the timing of revenue recognition. Revenue is recognized over time if any of the following three criteria are met:
| i. | the customer simultaneously receives and consumes the benefits provided by the entity’s performance as the entity performs; or |
| ii. | the entity’s performance creates or enhances an asset (for example, work in process) that the customer controls as the asset is created or enhanced; or |
| iii. | the entity’s performance does not create an asset with an alternative use to the entity and the entity has an enforceable right to payment for performance completed to date. |
| 13. | Accounts Receivable and Allowance for Credit Losses - Accounts receivable as of December 31, 2023 and 2022 includes allowance for credit losses of $317 and $264, respectively. |
STRAN & COMPANY, INC.
NOTES TO THE RESTATED FINANCIAL STATEMENTS
(in thousands, except share and per share amounts)
| | | December 31,
2023 | | | December 31,
2022 | |
| | | (Restated) | | | (Restated) | |
| Trade accounts receivable | | $ | 17,393 | | | $ | 14,014 | |
| Less: allowance for credit losses on accounts receivable | | | (317 | ) | | | (264 | ) |
| Total accounts receivable, net | | $ | 17,076 | | | $ | 13,750 | |
The Company evaluates our accounts receivable through a continuous process of assessing our portfolio on an individual customer and overall basis. This process consists of a thorough review of historical collection experience, current aging status of the customer accounts and the financial condition of our customers. The Company also considers the economic environment of our customers, both from a marketplace and geographic perspective, in evaluating the need for an allowance. Based on our review of these factors, we establish or adjust allowances for specific customers. Credit losses can vary substantially over time and the process involves judgment and estimation that require a number of assumptions about matters that are uncertain. Accordingly, our results of operations can be affected by adjustments to the allowance due to actual write-offs that differ from estimated amounts. See Note R, “Credit Losses,” to our financial statements included in this report for more information.
| 14. | Freight - The Company includes freight charges as a component of cost of goods sold. |
| 15. | Leases - The Company’s lease arrangements relate primarily to office space. The Company’s leases may include renewal options and rent escalation clauses. The Company is typically required to make fixed minimum rent payments relating to its right to use an underlying leased asset. |
The Company determines if an arrangement is a lease at inception and classifies its leases at commencement. Operating leases are presented as right-of-use (“ROU”) assets and the corresponding lease liabilities are included in operating lease liabilities, current and operating lease liabilities on the Company’s consolidated balance sheets. ROU assets represent the Company’s right to use an underlying asset, and lease liabilities represent the Company’s obligation for lease payments in exchange for the ability to use the asset for the duration of the lease term. The Company does not recognize short term leases that have a term of twelve months or less as ROU assets or lease liabilities.
ROU assets and lease liabilities are recognized at commencement date and determined using the present value of the future minimum lease payments over the lease term. The Company uses an incremental borrowing rate based on estimated rate of interest for collateralized borrowing since the Company’s leases do not include an implicit interest rate. The estimated incremental borrowing rate considers market data, actual lease economic environment, and actual lease term at commencement date. The lease term may include options to extend when it is reasonably certain that the Company will exercise that option. The Company recognizes lease expense on a straight-line basis over the lease term.
The Company has lease agreements which contain both lease and non-lease components, which it has not elected to account for as a single lease component. As such, minimum lease payments exclude fixed payments for non-lease components within a lease agreement, in addition to excluding variable lease payments not dependent on an index or rate, such as common area maintenance, operating expenses, utilities, or other costs that are subject to fluctuation from period to period.
| 16. | Segments - The Company operates as one operating segment with a focus on providing outsourced marketing solutions that also sells branded products to customers. The CEO, as the Company’s chief operating decision maker, manages and allocates resources to the operations of our Company on an aggregated basis. This enables the CEO to assess the Company’s overall level of available resources and determine how best to deploy these resources across functions, product and service lines, and strategic opportunities in line with our long-term Company-wide strategic goals. |
| 17. | Uncertainty in Income and Other Taxes - The Company adopted the standards for Accounting for Uncertainty in Income Taxes, which required the Company to report any uncertain tax positions and to adjust its financial statements for the impact thereof. As of December 31, 2023 and 2022, the Company determined it had an uncertain tax position of $2,448 and $2,185. The Company believes the impact will not be material as it will be able to utilize net operating losses to offset a majority of the risk. The Company recorded a nominal amount of interest expense which is included as part of income tax expense. |
STRAN & COMPANY, INC.
NOTES TO THE RESTATED FINANCIAL STATEMENTS
(in thousands, except share and per share amounts)
| 18. | Income Taxes - Income taxes are provided for the tax effects of transactions reported in the financial statements and consist of taxes currently due plus deferred taxes. Deferred taxes are provided for differences between the basis of assets and liabilities for financial statements and income tax purposes offset by a valuation allowance for 2023 and 2022. |
| 19. | Earnings/ Loss per Share - Basic earnings per share (“EPS”) is computed based on the weighted average number of shares of common stock outstanding during the period. Diluted EPS is computed based on the weighted average number of shares of common stock plus the effect of dilutive potential shares of common stock outstanding during the period using the treasury stock method. Dilutive potential common shares include the issuance of potential shares of common stock for outstanding stock options and warrants. |
| 20. | Stock-Based Compensation - The Company accounts for its stock-based awards in accordance with FASB ASC 718, Compensation - Stock Compensation. ASC 718 requires all stock-based payments to employees to be recognized in the consolidated statements of operations based on their fair values. The Company uses the Black-Scholes option pricing model to determine the fair value of options granted. The Company is recognizing compensation costs only for those stock-based awards expected to vest after considering expected forfeitures. Cumulative compensation expense is at least equal to the compensation expense for vested awards. Stock-based compensation is recognized on a straight-line basis over the service period of each award. The Company records compensation cost as an element of general and administrative expense in the accompanying statements of operations. |
| 21. | Stock Option and Warrant Valuation - Stock option and warrant valuation models require the input of highly subjective assumptions. The fair value of stock-based payment awards was estimated using the Black-Scholes option model with a volatility figure derived from an index of historical stock prices for comparable entities. For warrants and stock options issued to non- employees, the Company accounts for the expected life based on the contractual life of the warrants and stock options. For employees, the Company accounts for the expected life of options in accordance with the “simplified” method, which is used for “plain-vanilla” options, as defined in the accounting standards codification. The risk-free interest rate was determined from the implied yields of U.S. Treasury zero-coupon bonds with a remaining life consistent with the expected term of the options. |
| 22. | Sales Tax - Sales tax collected from customers is recorded as a liability, pending remittance to the taxing jurisdiction. Consequently, sales taxes have been excluded from revenues and costs. The Company remits sales, use, and GST taxes to Massachusetts, other state jurisdictions, and Canada, respectively. |
| 23. | Use of Estimates - The preparation of financial statements in conformity with generally accepted accounting principles requires management to make estimates and assumptions that affect certain reported amounts and disclosure of certain assets, liabilities and expenses. The most significant estimates in the Company’s financial statements relate to the allowance for credit losses, the fair value of assets and liabilities assumed in acquisitions, goodwill, the fair value of the contingent earnout liability, and the fair value of stock options and warrants. These estimates and assumptions are based on current facts, historical experience and various other factors believed to be reasonable under the circumstances, the results of which form the basis for making judgments about the carrying values of assets and liabilities and the recording of expenses that are not readily apparent from other sources. Actual results may differ materially and adversely from these estimates. To the extent there are material differences between the estimates and actual results, the Company’s future results of operations will be affected. |
| 24. | Derivative Financial Instruments - The Company accounts for warrants as either equity-classified or liability-classified instruments based on an assessment of the warrant’s specific terms and applicable authoritative guidance in ASC 480, Distinguishing Liabilities from Equity (“ASC 480”) and ASC 815, Derivatives and Hedging (“ASC 815”). The assessment considers whether the warrants are freestanding financial instruments pursuant to ASC 480, meet the definition of a liability pursuant to ASC 480, and whether the warrants meet all of the requirements for equity classification under ASC 815, including whether the warrants are indexed to the Company’s own common stock and whether the warrant holders could potentially require “net cash settlement” in a circumstance outside of the Company’s control, among other conditions for equity classification. This assessment, which requires the use of professional judgment, is conducted at the time of warrant issuance and as of each subsequent quarterly period end date while the warrants are outstanding. |
| 25. | Contingent Earn-Out Liabilities - The Company measures its contingent earn-out liabilities at fair value on a recurring basis using significant unobservable inputs classified within Level 3 of the fair value hierarchy. The Black-Scholes-Merton Call Option Formula was utilized to determine the fair value of the earn-out liability. The significant unobservable inputs used in the fair value measurements are (i) the operating income projections (projected gross profit amounts within the risk-neutral framework) over the earn-out period (generally three or five years), (ii) the strike price, and (iii) volatility. Significant increases or decreases to any of these inputs in isolation would result in a significantly higher or lower liability, with a higher liability capped by the contractual maximum of the contingent earn-out obligations. Ultimately, the liability will be equivalent to the amount paid, and the difference between the fair value estimate and amount paid will be recorded in earnings. The amount paid that is less than or equal to the contingent earn-out liability on the acquisition date is reflected as cash used in financing activities in the consolidated statements of cash flows. Any amount paid in excess of the contingent earn-out liability on the acquisition date is reflected as cash used in operating activities in the consolidated statements of cash flows. |
| 26. | Reclassifications - Certain reclassifications have been made to the Company’s previously issued Statements of Operations whereby amounts relating to (i) cost of sales, previously reflected as multiple components, have been aggregated and reclassified as a single line item, cost of sales, and (ii) change in fair value of the earn-out liability, previously reflected in other income in the other income (expense) section, have been reclassified to change in fair value of contingent earn-out liability. Additionally, certain reclassifications have been made to the Company’s previously issued Statements of Cash Flows whereby amounts relating to the payment of contingent earn-out and installment payments, previously aggregated and reflected as a single line item in the cash flows from financing activities, have been shown gross and shown as separate line items, payment of contingent earn-out liabilities and payment of installment payment liabilities. These reclassifications had no impact on previously reported net income, cash flows, or shareholders’ equity. |
STRAN & COMPANY, INC.
NOTES TO THE RESTATED FINANCIAL STATEMENTS
(in thousands, except share and per share amounts)
| 27. | Recent Accounting Pronouncements - Management has reviewed the following recent accounting pronouncements: |
2023-07 – Segment Reporting (Topic 280)
In November 2023, the FASB issued ASU 2023-07, which amends the guidance on segment reporting. This update enhances the disclosure requirements for reportable segments, primarily by requiring more detailed information about significant segment expenses. The amendments also clarify the circumstances under which an entity can disclose multiple measures of segment profit or loss and provide new segment disclosure requirements for entities with a single reportable segment.
The guidance is effective for fiscal years beginning after December 15, 2023, and interim periods within fiscal years beginning after December 15, 2024, with early adoption permitted. The guidance is to be applied retrospectively to all prior periods presented in the financial statements.
The Company is currently evaluating the timing and impacts of adoption of this ASU, and expects to adopt ASU 2023-07 effective for the fiscal year 2024 as required under the standard.
2023-09 – Income Taxes (Topic 740)
In December 2023, the FASB issued ASU 2023-09, which amends the guidance on income tax disclosures. This update aims to improve the transparency and usefulness of income tax disclosures by requiring entities to provide more detailed information about the nature and effects of income tax uncertainties, the components of income tax expense, and the effective tax rate reconciliation. Additionally, the ASU mandates enhanced disclosures about deferred tax assets and liabilities, including the valuation allowance and the impact of tax law changes.
The Company is currently evaluating the timing and impacts of adoption of this ASU.
2024-01 – Compensation – Stock Compensation (Topic 718)
In March 2024, the FASB issued ASU 2024-01, which clarifies the accounting for profits interest awards. This update provides guidance on determining whether a profits interest or similar award falls within the scope of ASC 718 (Compensation—Stock Compensation) or other guidance. The ASU aims to ensure consistency and transparency in the accounting for these awards by providing clearer criteria and illustrative examples.
The Company is currently evaluating the timing and impacts of adoption of this ASU.
2024-03 - Income Statement - Reporting Comprehensive Income - Expense Disaggregation Disclosure
In November 2024, the FASB issued ASU 2024-03, Income Statement-Reporting Comprehensive Income-Expense Disaggregation Disclosures (Subtopic 220-40): Disaggregation of Income Statement Expenses (“ASU 2024-03”), which requires the disaggregation, in the notes to the financial statements, of certain cost and expense captions presented on the face of the Company’s Statement of Operations, to provide enhanced transparency to investors. The update may be applied either prospectively or retrospectively. ASU 2024-03 is effective for fiscal years beginning after December 15, 2026 and interim periods within fiscal years beginning after December 15, 2027. Early adoption is permitted.
The Company is currently evaluating the impact ASU 2024-03 will have on its disclosures.
| 28. | Subsequent Events - Management has evaluated events occurring after the balance sheet date through January 22, 2025, the date on which the financial statements were filed. |
STRAN & COMPANY, INC.
NOTES TO THE RESTATED FINANCIAL STATEMENTS
(in thousands, except share and per share amounts)
| B. | RESTATEMENT OF PREVIOUSLY ISSUED FINANCIAL STATEMENTS: |
The Company has identified certain accounting errors relating to compliance with U.S. GAAP in connection with the Company’s accounting of certain assets and liabilities as well as acquisition accounting. As a result of the re-audit, the Audit Committee, in consultation with the Company’s management, concluded that the Company’s previously issued audited consolidated financial statements and the notes thereto as of and for the fiscal years ended December 31, 2023 and 2022 require restatement and should not be relied upon.
The following include descriptions of the significant adjustments to the Company’s previously reported 2023 and 2022 financial statements.
1. Business Acquisitions
The Company incorrectly accounted for the Wildman, GAP, Trend, Premier and T.R. Miller acquisitions (“Acquisitions”) as asset acquisitions that would properly be accounted for as business combinations in accordance with ASC Topic 805, Business Combinations.
The Company improperly determined the fair value of certain assets acquired and liabilities assumed and the fair value of contingent earn-out payments, which was part of the total consideration, in accordance with ASC Topic 820, Fair Value Measurement.
As a part of the restatement process, the Company performed a separate assessment of each acquisition in accordance with the relevant guidance of ASC Topic 805, Business Combinations, and completed a purchase price allocation analysis, including the proper calculation of the fair value of the certain assets acquired and liabilities assumed and the fair value of contingent earn-out payments.
To correct the error, the Company adjusted the final purchase price accounting for inventory, identifiable intangibles, goodwill and contingent earn-out liabilities, including associated mark-to-market adjustments subsequent to the acquisition dates.
2. Goodwill Impairment
As a result of the incorrect accounting treatment of the Acquisitions, the Company omitted the recognition of goodwill and failed to perform an annual goodwill impairment analysis as of October 1, 2023 and 2022.
As a part of the restatement process, the Company performed quantitative goodwill impairment testing in accordance with ASC 350, Intangibles - Goodwill and Other as of October 1, 2023 and October 1, 2022. The Company determined that the carrying value of its reporting unit was in excess of its fair value.
To correct the error, the Company recorded a non-cash goodwill impairment charge during the fourth quarter of fiscal years 2023 and 2022.
3. Income Taxes
The Company improperly calculated deferred tax asset and liability balances. The Company also established several improper methods of accounting for income taxes with respect to the Acquisitions, bad debt reserve, capitalized research, and inventory capitalization as well as other book to tax adjustments that needed to be corrected such as charitable contributions and stock option expense.
As a part of the restatement process, the Company calculated the correct tax adjustments for the 2021 through 2023 tax years and the impact to the income tax provision and deferred tax asset/(liability) balances.
To correct the error, the Company recorded journal entries to correct end of the year deferred tax asset/(liability) balances. With respect to improper methods of tax accounting, the Company recorded an uncertain tax position (“FIN 48”) reserve for each of these items and will correct the improper methods of tax accounting by filing an automatic method change in its 2024 U.S. federal income tax return, which will be filed in 2025. The Company generated tax losses in 2021 and 2022, these losses were able to offset the effects of the improper methods for both 2021 and 2022. In addition, the Company plans to amend its 2023 U.S. federal income tax return, which will include a statement explaining additional adjustments such as charitable contributions and stock option expense to its 2021 and 2022 net operating loss carryforward balances. All tax entries have been booked as of December 31, 2023, and 2022, to reflect the correct income tax provision and deferred tax asset/(liability) balances. The Company recorded a valuation allowance as well in 2022 as the Company was in a cumulative deficit at that time.
STRAN & COMPANY, INC.
NOTES TO THE RESTATED FINANCIAL STATEMENTS
(in thousands, except share and per share amounts)
4. Related Party Presentation
Certain amounts relating to the accounts receivable from related parties, sales to related parties, and cost of sales to related parties, previously reflected in Accounts Receivable, Net, Sales, and Cost of Sales on the Company’s Balance Sheet and Statement of Earnings, have been reclassified to Accounts receivable – related parties, Sales – related parties, and Cost of sales – related parties. These reclassifications had no impact on the previously reported net earnings, cash flows or shareholders’ equity.
5. Accounts Receivable and Unearned Revenue Adjustment
The Company incorrectly recorded certain amounts in Accounts Receivable for products that were shipped but not billed as of December 31, 2023, rather than reducing Unearned Revenue for the customer deposit that was received prior to December 31, 2023.
As a part of the restatement process, the Company performed reconciliations of unbilled receivables and unearned revenue and adjusted overstated Accounts Receivable and Unearned Revenue balances.
6. Sales Adjustment
The Company incorrectly recognized Sales relating to freight charges for certain orders.
As a part of the restatement process, the Company conducted a thorough analysis of sales including freight charges. Multiple reviews were carried out to ensure all potential errors were addressed.
To correct the error, the Company adjusted overstated freight revenue and corresponding freight expenses for the year ended December 31, 2023.
7. Inventory Adjustment
The Company failed to perform a proper full physical inventory count.
As a part of the restatement process, the Company performed physical inventory count and corresponding rollback analysis. The Company identified discrepancies between recorded and actual inventory levels.
To correct the error, the Company adjusted its inventory records and reduced its reported inventory value as of December 31, 2023, to accurately reflect the findings.
8. Subsequent Measurement of Available-for-Sale Securities
The Company incorrectly recorded unrealized holding gains and losses for available-for-sale securities that should be excluded from earnings and reported in other comprehensive income (loss).
As a part of the restatement process, the Company performed a separate analysis related to subsequent measurement of available-for-sale securities in accordance with the relevant guidance of ASC Topic 320, Investments – Debt Securities.
To correct the error, the Company adjusted realized gain (loss) on investment and corresponding other comprehensive income (loss) for the years ended December 31, 2023 and 2022.
9. Unearned Revenue and Sales Adjustment
The Company failed to recognize certain amounts as Sales for the products that were included in Unearned Revenue but shipped as of December 31, 2023. In addition, the Company did not reduce the inventory balance for the products that were shipped as of December 31, 2023.
As a part of the restatement process, the Company performed reconciliations of unearned revenue and adjusted overstated Unearned Revenue and Inventory balances for the products that were shipped as of December 31, 2023.
STRAN & COMPANY, INC.
NOTES TO THE RESTATED FINANCIAL STATEMENTS
(in thousands, except share and per share amounts)
| * | Represents revision for immaterial error correction. |
The following tables summarize the effect of the restatement on each financial statement line item as of the dates indicated:
| Balance Sheet as of December 31, 2023 | | As
Reported | | | Adjustment | | | As
Restated | | | Reference | |
| Cash and cash equivalents | | $ | 7,989 | | | $ | 70 | | | | 8,059 | | | | * | |
| Investments | | | 10,464 | | | | (71 | ) | | | 10,393 | | | | * | |
| Accounts receivable, net | | | 20,466 | | | | (4,243 | ) | | | 16,223 | | | | 4,5 | |
| Accounts receivable – related parties | | | — | | | | 853 | | | | 853 | | | | 4 | |
| Deferred income taxes | | | 841 | | | | (841 | ) | | | — | | | | 3 | |
| Inventory | | | 6,639 | | | | (1,857 | ) | | | 4,782 | | | | 7,9 | |
| Prepaid corporate taxes | | | 17 | | | | 45 | | | | 62 | | | | 3 | |
| Total current assets | | | 49,086 | | | | (6,044 | ) | | | 43,042 | | | | | |
| | | | | | | | | | | | | | | | | |
| Intangible assets, net | | | 9,659 | | | | (6,545 | ) | | | 3,114 | | | | 1 | |
| Goodwill | | | — | | | | — | | | | — | | | | 1,2 | |
| Other assets | | | — | | | | 23 | | | | 23 | | | | 1 | |
| Total other assets | | | 10,995 | | | | (6,522 | ) | | | 4,473 | | | | | |
| Total assets | | $ | 61,602 | | | $ | (12,566 | ) | | $ | 49,036 | | | | | |
| | | | | | | | | | | | | | | | | |
| Accounts payable and accrued expenses | | $ | 4,316 | | | $ | 429 | | | $ | 4,745 | | | | 3 | |
| Accrued payroll and related | | | 2,563 | | | | 5 | | | | 2,568 | | | | * | |
| Unearned revenue | | | 5,171 | | | | (4,055 | ) | | | 1,116 | | | | 5,9 | |
| Current portion of contingent earn-out liabilities | | | 2,870 | | | | (2,646 | ) | | | 224 | | | | 1 | |
| Current portion of installment payment liabilities | | | — | | | | 786 | | | | 786 | | | | 1 | |
| Total current liabilities | | | 16,667 | | | | (5,481 | ) | | | 11,186 | | | | | |
| | | | | | | | | | | | | | | | | |
| Long-term contingent earn-out liabilities | | | 4,587 | | | | (3,824 | ) | | | 763 | | | | 1 | |
| Long-term installment payment liabilities | | | — | | | | 639 | | | | 639 | | | | 1 | |
| Total long-term liabilities | | | 5,385 | | | | (3,185 | ) | | | 2,200 | | | | | |
| | | | | | | | | | | | | | | | | |
| Additional paid-in capital | | | 38,429 | | | | (166 | ) | | | 38,263 | | | | 1 | |
| Accumulated deficit | | | 1,119 | | | | (3,721 | ) | | | (2,602 | ) | | | 1,2,3,6,7,* | |
| Accumulated other comprehensive loss | | | — | | | | (13 | ) | | | (13 | ) | | | 8 | |
| Total stockholders’ equity | | | 39,550 | | | | (3,900 | ) | | | 35,650 | | | | | |
| Total liabilities and stockholders’ equity | | $ | 61,602 | | | $ | (12,566 | ) | | $ | 49,036 | | | | | |
STRAN & COMPANY, INC.
NOTES TO THE RESTATED FINANCIAL STATEMENTS
(in thousands, except share and per share amounts)
| Balance Sheet as of December 31, 2022 | | As
Reported | | | Adjustment | | | As
Restated | | | Reference | |
| Accounts receivable, net | | | 14,443 | | | | (693 | ) | | | 13,750 | | | | 5 | |
| Deferred income taxes | | | 841 | | | | (841 | ) | | | — | | | | 3 | |
| Inventory | | | 6,868 | | | | (941 | ) | | | 5,927 | | | | 7 | |
| Total current assets | | | 48,569 | | | | (2,475 | ) | | | 46,094 | | | | 3,5,7 | |
| | | | | | | | | | | | | | | | | |
| Intangible assets, net | | | 6,272 | | | | (4,034 | ) | | | 2,238 | | | | 1 | |
| Goodwill | | | — | | | | 90 | | | | 90 | | | | 1,2 | |
| Other assets | | | — | | | | 23 | | | | 23 | | | | 1 | |
| Total other assets | | | 7,057 | | | | (3,921 | ) | | | 3,136 | | | | 1,2 | |
| Total assets | | $ | 56,626 | | | $ | (6,396 | ) | | $ | 50,230 | | | | 1,2,3,5,7 | |
| | | | | | | | | | | | | | | | | |
| Accounts payable and accrued expenses | | $ | 4,051 | | | $ | (2 | ) | | $ | 4,049 | | | | * | |
| Accrued payroll and related | | | 609 | | | | 1 | | | | 610 | | | | * | |
| Current portion of contingent earn-out liabilities | | | 1,810 | | | | (1,072 | ) | | | 738 | | | | 1 | |
| Current portion of installment payment liabilities | | | — | | | | 267 | | | | 267 | | | | 1 | |
| Total current liabilities | | | 13,955 | | | | (806 | ) | | | 13,149 | | | | 1,* | |
| | | | | | | | | | | | | | | | | |
| Long-term contingent earn-out liabilities | | | 2,846 | | | | (2,358 | ) | | | 488 | | | | 1 | |
| Long-term installment payment liabilities | | | — | | | | 414 | | | | 414 | | | | 1 | |
| Total long-term liabilities | | | 3,306 | | | | (1,944 | ) | | | 1,362 | | | | 1 | |
| | | | | | | | | | | | | | | | | |
| Additional paid-in capital | | | 38,279 | | | | (166 | ) | | | 38,113 | | | | 1 | |
| Accumulated deficit | | | 1,084 | | | | (3,301 | ) | | | (2,217 | ) | | | 1,2,3,6,7,* | |
| Accumulated other comprehensive loss | | | — | | | | (179 | ) | | | (179 | ) | | | 8 | |
| Total stockholders’ equity | | | 39,365 | | | | (3,646 | ) | | | 35,719 | | | | 1,2,3,6,7,8,* | |
| Total liabilities and stockholders’ equity | | $ | 56,626 | | | $ | (6,396 | ) | | $ | 50,230 | | | | 1,2,3,6,7,8,* | |
STRAN & COMPANY, INC.
NOTES TO THE RESTATED FINANCIAL STATEMENTS
(in thousands, except share and per share amounts)
| Statement of Operations for the Year Ended December 31, 2023 | | As
Reported | | | Adjustment | | | As
Restated | | | Reference | |
| Sales | | $ | 75,894 | | | $ | (747 | ) | | $ | 75,147 | | | | 4,6,9 | |
| Sales – related parties | | | — | | | | 853 | | | | 853 | | | | 4 | |
| Total sales | | | 75,894 | | | | 106 | | | | 76,000 | | | | 4,6,9 | |
| | | | | | | | | | | | | | | | | |
| Cost of sales | | | 51,012 | | | | (520 | ) | | | 50,492 | | | | 4,6,9 | |
| Cost of sales - related parties | | | — | | | | 656 | | | | 656 | | | | 4 | |
| Total cost of sales | | | 51,012 | | | | 136 | | | | 51,148 | | | | 4,6,9 | |
| | | | | | | | | | | | | | | | | |
| GROSS PROFIT | | | 24,882 | | | | (30 | ) | | | 24,852 | | | | 4,6,9 | |
| | | | | | | | | | | | | | | | | |
| General and administrative expenses | | | 26,030 | | | | (720 | ) | | | 25,310 | | | | 1,* | |
| Goodwill impairment | | | — | | | | 810 | | | | 810 | | | | 2 | |
| Total operating expenses | | | 26,030 | | | | 90 | | | | 26,120 | | | | 1,2,* | |
| | | | | | | | | | | | | | | | | |
| LOSS FROM OPERATIONS | | | (1,148 | ) | | | (120 | ) | | | (1,268 | ) | | | 1,2,4,6,9,* | |
| | | | | | | | | | | | | | | | | |
| Other income | | | 375 | | | | (189 | ) | | | 186 | | | | 1 | |
| Change in fair value of contingent earn-out liability | | | — | | | | 65 | | | | 65 | | | | 1 | |
| Realized gain (loss) on investments | | | 270 | | | | (167 | ) | | | 103 | | | | 8 | |
| Total other income | | | 1,215 | | | | (291 | ) | | | 924 | | | | 1,8 | |
| | | | | | | | | | | | | | | | | |
| EARNING (LOSS) BEFORE INCOME TAXES | | | 67 | | | | (411 | ) | | | (344 | ) | | | 1,2,4,6,8,9,* | |
| | | | | | | | | | | | | | | | | |
| Provision for income taxes | | | 31 | | | | 10 | | | | 41 | | | | 3 | |
| | | | | | | | | | | | | | | | | |
| NET EARNINGS (LOSS) | | | 35 | | | | (420 | ) | | | (385 | ) | | | 1,2,3,4,6,8,9,* | |
| | | | | | | | | | | | | | | | | |
| NET LOSS PER COMMON SHARE | | | | | | | | | | | | | | | | |
| Basic | | $ | 0.00 | | | $ | (0.02 | ) | | $ | (0.02 | ) | | | 1,2,3,4,6,8,9,* | |
| Diluted | | $ | 0.00 | | | $ | (0.02 | ) | | $ | (0.02 | ) | | | 1,2,3,4,6,8,9,* | |
| | | | | | | | | | | | | | | | | |
| WEIGHTED-AVERAGE COMMON SHARES OUTSTANDING | | | | | | | | | | | | | | | | |
| Basic | | | 18,519,615 | | | | 277 | | | | 18,519,892 | | | | * | |
| Diluted | | | 29,453,206 | | | | (10,933,314 | ) | | | 18,519,892 | | | | 1,2,3,4,6,8,9,* | |
STRAN & COMPANY, INC.
NOTES TO THE RESTATED FINANCIAL STATEMENTS
(in thousands, except share and per share amounts)
| Statement of Operations for the Year Ended December 31, 2022 | | As
Reported | | | Adjustment | | | As
Restated | | | Reference | |
| Sales | | $ | 58,953 | | | $ | (1,075 | ) | | $ | 57,878 | | | | 6 | |
| Total sales | | | 58,953 | | | | (1,075 | ) | | | 57,878 | | | | 6 | |
| | | | | | | | | | | | | | | | | |
| Cost of sales | | | 42,384 | | | | 109 | | | | 42,493 | | | | 6 | |
| Total cost of sales | | | 42,384 | | | | 109 | | | | 42,493 | | | | 6 | |
| | | | | | | | | | | | | | | | | |
| GROSS PROFIT | | | 16,569 | | | | (1,184 | ) | | | 15,385 | | | | 6 | |
| | | | | | | | | | | | | | | | | |
| General and administrative expenses | | | 18,075 | | | | (286 | ) | | | 17,789 | | | | 1,* | |
| Goodwill impairment | | | — | | | | 1,182 | | | | 1,182 | | | | 2 | |
| Total operating expenses | | | 18,075 | | | | 896 | | | | 18,971 | | | | 1,2,* | |
| | | | | | | | | | | | | | | | | |
| LOSS FROM OPERATIONS | | | (1,506 | ) | | | (2,080 | ) | | | (3,586 | ) | | | 1,2,6,* | |
| | | | | | | | | | | | | | | | | |
| Other income | | | 113 | | | | (79 | ) | | | 34 | | | | 1 | |
| Change in fair value of contingent earn-out liability | | | — | | | | 180 | | | | 180 | | | | 1 | |
| Realized gain (loss) on investments | | | (179 | ) | | | 178 | | | | (1 | ) | | | 8 | |
| Total other income | | | 29 | | | | 279 | | | | 308 | | | | 1,8 | |
| | | | | | | | | | | | | | | | | |
| LOSS BEFORE INCOME TAXES | | | (1,477 | ) | | | (1,801 | ) | | | (3,278 | ) | | | 1,2,6,8,* | |
| | | | | | | | | | | | | | | | | |
| Provision for income taxes | | | (699 | ) | | | 921 | | | | 222 | | | | 3 | |
| | | | | | | | | | | | | | | | | |
| NET LOSS | | | (778 | ) | | | (2,722 | ) | | | (3,500 | ) | | | 1,2,3,6,8,* | |
| | | | | | | | | | | | | | | | | |
| NET LOSS PER COMMON SHARE | | | | | | | | | | | | | | | | |
| Basic | | $ | (0.04 | ) | | $ | (0.14 | ) | | $ | (0.18 | ) | | | 1,2,3,6,8,* | |
| Diluted | | $ | (0.04 | ) | | $ | (0.14 | ) | | $ | (0.18 | ) | | | 1,2,3,6,8,* | |
| | | | | | | | | | | | | | | | | |
| WEIGHTED-AVERAGE COMMON SHARES OUTSTANDING | | | | | | | | | | | | | | | | |
| Basic | | | 19,202,619 | | | | (25 | ) | | | 19,202,594 | | | | * | |
| Diluted | | | 19,202,619 | | | | (25 | ) | | | 19,202,594 | | | | * | |
STRAN & COMPANY, INC.
NOTES TO THE RESTATED FINANCIAL STATEMENTS
(in thousands, except share and per share amounts)
| Statement of Stockholders’ Equity for the Years Ended December 31, 2023 and 2022 | | Common Stock | | | Additional
Paid-In | | | Accumulated Other
Comprehensive | | | Retained Earnings
(Accumulated | | | Stock-holders’ | |
| | Shares | | | Value | | | Capital | | | Loss | | | Deficit) | | | Equity | |
Balance, December 31, 2023
(As Reported) | | | 18,534,073 | | | $ | 2 | | | $ | 38,429 | | | $ | — | | | $ | 1,119 | | | $ | 39,550 | |
| Adjustments | | | 4,927 | | | | — | | | | (166 | ) | | | (13 | ) | | | (3,721 | ) | | | (3,900 | ) |
Balance, December 31, 2023
(As Restated) | | | 18,539,000 | | | $ | 2 | | | $ | 38,263 | | | $ | (13 | ) | | $ | (2,602 | ) | | $ | 35,650 | |
| | | | | | | | | | | | | | | | | | | | | | | | | |
Balance, December 31, 2022
(As Reported) | | | 18,475,521 | | | | 2 | | | | 38,279 | | | | — | | | | 1,084 | | | | 39,365 | |
| Adjustments | | | (185 | ) | | | — | | | | (166 | ) | | | (179 | ) | | | (3,301 | ) | | | (3,646 | ) |
Balance, December 31, 2022
(As Restated) | | | 18,475,336 | | | $ | 2 | | | $ | 38,113 | | | $ | (179 | ) | | $ | (2,217 | ) | | $ | 35,719 | |
| Statement of Cash Flows for the Year Ended December 31, 2023 | | As
Reported | | | Adjustment | | | As
Restated | | | Reference | |
| CASH FLOWS FROM OPERATING ACTIVITIES: | | | | | | | | | | | | |
| Net earnings (loss) | | $ | 35 | | | $ | (420 | ) | | $ | (385 | ) | | | 1,2,3,4,6,8,9 | |
| Depreciation and amortization | | | 1,506 | | | | (734 | ) | | | 772 | | | | 1,7 | |
| Adjustment to reconcile operating lease expense to cash paid | | | (11 | ) | | | 19 | | | | 8 | | | | * | |
| Change in allowance for credit losses | | | — | | | | (174 | ) | | | (174 | ) | | | 5,* | |
| Change in fair value of contingent earn-out liability | | | — | | | | (65 | ) | | | (65 | ) | | | 1 | |
| Intangible asset impairment, net | | | (178 | ) | | | 178 | | | | — | | | | 1 | |
| Goodwill impairment | | | — | | | | 810 | | | | 810 | | | | 1,2 | |
| Noncash interest accretion | | | — | | | | 11 | | | | 11 | | | | 1 | |
| Unrealized gain (loss) on investments | | | (270 | ) | | | 437 | | | | 167 | | | | 8 | |
| Accounts receivable | | | (6,023 | ) | | | 5,346 | | | | (677 | ) | | | 4,5 | |
| Accounts receivable – related parties | | | — | | | | (853 | ) | | | (853 | ) | | | 4 | |
| Inventory | | | 228 | | | | 1,799 | | | | 2,027 | | | | 7 | |
| Prepaid taxes | | | 71 | | | | (46 | ) | | | 25 | | | | 3 | |
| Prepaid expenses | | | (566 | ) | | | 5 | | | | (561 | ) | | | * | |
| Accounts payable and accrued expenses | | | 265 | | | | (161 | ) | | | 104 | | | | * | |
| Accrued payroll and related | | | 1,955 | | | | 3 | | | | 1,958 | | | | * | |
| Unearned revenue | | | 4,538 | | | | (4,340 | ) | | | 198 | | | | 5 | |
| Net cash used in operating activities | | | (4,365 | ) | | | 1,815 | | | | (2,550 | ) | | | 1,2,3,4,5,6,7,8,9,* | |
| | | | | | | | | | | | | | | | | |
| CASH FLOWS FROM INVESTING ACTIVITIES: | | | | | | | | | | | | | | | | |
| Business acquisitions, net of cash acquired | | | (660 | ) | | | (1,463 | ) | | | (2,123 | ) | | | 1 | |
| Proceeds from sale of investments | | | — | | | | 4,231 | | | | 4,231 | | | | 8 | |
| Purchase of investments | | | (415 | ) | | | (4,430 | ) | | | (4,845 | ) | | | 8 | |
| Net cash used in investing activities | | | (2,074 | ) | | | (1,662 | ) | | | (3,736 | ) | | | 1,8 | |
| | | | | | | | | | | | | | | | | |
| CASH FLOWS FROM FINANCING ACTIVITIES: | | | | | | | | | | | | | | | | |
| Payment of contingent earn-out liabilities | | | (775 | ) | | | 134 | | | | (641 | ) | | | 1 | |
| Payment of installment payment liabilities | | | — | | | | (218 | ) | | | (218 | ) | | | 1 | |
| Net cash used in financing activities | | | (825 | ) | | | (84 | ) | | | (909 | ) | | | 1 | |
| | | | | | | | | | | | | | | | | |
| NET DECREASE IN CASH | | | (7,264 | ) | | | 69 | | | | (7,195 | ) | | | 1,2,3,4,5,6,7,8,9,* | |
| | | | | | | | | | | | | | | | | |
| CASH - ENDING | | $ | 7,990 | | | $ | 69 | | | $ | 8,059 | | | | 1,2,3,4,5,6,7,8,9,* | |
STRAN & COMPANY, INC.
NOTES TO THE RESTATED FINANCIAL STATEMENTS
(in thousands, except share and per share amounts)
| Statement of Cash Flows for the Year Ended December 31, 2022 | | As
Reported | | | Adjustment | | | As
Restated | | | Reference | |
| CASH FLOWS FROM OPERATING ACTIVITIES: | | | | | | | | | | | | |
| Net loss | | $ | (778 | ) | | $ | (2,722 | ) | | $ | (3,500 | ) | | | 1,2,3,6,8 | |
| Adjustment to deferred income taxes | | | (728 | ) | | | 945 | | | | 217 | | | | 3 | |
| Depreciation and amortization | | | 725 | | | | (305 | ) | | | 420 | | | | 1,7 | |
| Change in allowance for credit losses | | | — | | | | 36 | | | | 36 | | | | * | |
| Change in fair value of contingent earn-out liability | | | — | | | | (180 | ) | | | (180 | ) | | | 1 | |
| Intangible asset impairment, net | | | (149 | ) | | | 149 | | | | — | | | | 1 | |
| Goodwill impairment | | | — | | | | 1,182 | | | | 1,182 | | | | 1,2 | |
| Unrealized gain (loss) on investments | | | 179 | | | | (358 | ) | | | (179 | ) | | | 8 | |
| Accounts receivable | | | (5,460 | ) | | | 2,453 | | | | (3,007 | ) | | | 5 | |
| Inventory | | | (1,637 | ) | | | 692 | | | | (945 | ) | | | 7 | |
| Prepaid expenses | | | (87 | ) | | | 952 | | | | 865 | | | | 1 | |
| Deposits | | | (287 | ) | | | (324 | ) | | | (611 | ) | | | 1 | |
| Accounts payable and accrued expenses | | | (932 | ) | | | (969 | ) | | | (1,901 | ) | | | 1 | |
| Accrued payroll and related | | | (228 | ) | | | 1 | | | | (227 | ) | | | * | |
| Unearned revenue | | | (113 | ) | | | (602 | ) | | | (715 | ) | | | 5 | |
| Net cash used in operating activities | | | (2,950 | ) | | | 950 | | | | (2,000 | ) | | | 1,2,3,5,6,7,8,* | |
| | | | | | | | | | | | | | | | | |
| CASH FLOWS FROM INVESTING ACTIVITIES: | | | | | | | | | | | | | | | | |
| Business acquisitions, net of cash acquired | | | (737 | ) | | | (1,138 | ) | | | (1,875 | ) | | | 1 | |
| Proceeds from sale of investments | | | — | | | | 200 | | | | 200 | | | | 8 | |
| Purchase of investments | | | (9,966 | ) | | | (13 | ) | | | (9,979 | ) | | | 8 | |
| Net cash used in investing activities | | | (11,329 | ) | | | (951 | ) | | | (12,280 | ) | | | 1,8 | |
| | | | | | | | | | | | | | | | | |
| CASH FLOWS FROM FINANCING ACTIVITIES: | | | | | | | | | | | | | | | | |
| Payment for stock repurchase | | | (3,332 | ) | | | 1 | | | | (3,331 | ) | | | * | |
| Net cash used in financing activities | | | (2,694 | ) | | | 1 | | | | (2,693 | ) | | | * | |
| C. | FAIR VALUE MEASUREMENTS: |
Fair value measurements discussed herein are based upon certain market assumptions and pertinent information available to management as of and during the years ended December 31, 2023 and 2022. The carrying amount of accounts payable approximated fair value as they are short term in nature. The fair value of stock options and warrants are estimated based on the Black-Scholes model during the years ended December 31, 2023 and 2022.
Fair Value on a Recurring Basis
The Company follows the guidance in ASC 820 for its financial assets and liabilities that are re-measured and reported at fair value at each reporting period, and non-financial assets and liabilities that are re-measured and reported at fair value at least annually. The estimated fair value of the Company’s investments and money market accounts represent Level 1 measurements. The estimated fair value of the earn-out liabilities represent Level 3 measurements. The following table presents information about the Company’s assets and liabilities that are measured at fair value on a recurring basis at periods ended December 31, 2023 and 2022, and indicates the fair value hierarchy of the valuation inputs the Company utilized to determine such fair value:
| Description | | Level | | December 31,
2023 | | | December 31,
2022 | |
| | | | | (Restated) | | | (Restated) | |
| Assets: | | | | | | | | |
| Investments | | 1 | | $ | 10,393 | | | $ | 9,779 | |
| | | | | | | | | | | |
| Liabilities: | | | | | | | | | | |
| Earn-out liabilities | | 3 | | $ | 987 | | | $ | 1,226 | |
STRAN & COMPANY, INC.
NOTES TO THE RESTATED FINANCIAL STATEMENTS
(in thousands, except share and per share amounts)
Investments
The Company’s investments consisted of the following as of December 31, 2023:
| | | Cost | | | Unrealized
Gain | | | Fair
Value | |
| | | (Restated) | | | (Restated) | | | (Restated) | |
| Money market fund | | $ | 947 | | | $ | — | | | $ | 947 | |
| Corporate bonds | | | 3,869 | | | | 38 | | | | 3,907 | |
| Mutual funds | | | 490 | | | | 10 | | | | 500 | |
| US Treasury bills | | | 4,920 | | | | 119 | | | | 5,039 | |
| | | $ | 10,226 | | | $ | 167 | | | $ | 10,393 | |
The Company’s investments consisted of the following as of December 31, 2022:
| | | Cost | | | Unrealized
Loss | | | Fair
Value | |
| Money market fund | | $ | 487 | | | $ | — | | | $ | 487 | |
| Corporate bonds | | | 4,540 | | | | (136 | ) | | | 4,404 | |
| US Treasury bills | | | 4,931 | | | | (43 | ) | | | 4,888 | |
| | | $ | 9,958 | | | $ | (179 | ) | | $ | 9,779 | |
Earn-Out Liabilities
A reconciliation of the earn-out liability is included below:
| | | (Restated) | |
| Balance as of December 31, 2021 | | $ | 1,523 | |
| Additions pursuant to acquisitions | | | 552 | |
| Gain upon re-measurement | | | (180 | ) |
| Payments earned and paid | | | (669 | ) |
| Balance as of December 31, 2022 | | $ | 1,226 | |
| Additions pursuant to acquisitions | | | 467 | |
| Gain upon re-measurement | | | (65 | ) |
| Payments earned and paid | | | (641 | ) |
| Balance as of December 31, 2023 | | $ | 987 | |
| | | | | |
| Current portion of contingent earn-out liabilities | | $ | 224 | |
| Long-term contingent earn-out liabilities | | $ | 763 | |
STRAN & COMPANY, INC.
NOTES TO THE RESTATED FINANCIAL STATEMENTS
(in thousands, except share and per share amounts)
Fair Value on a Non-Recurring Basis
Installment Payment Liabilities
The estimated fair value of the installment payment liabilities represent a Level 2 measurement. The Company measures the initial installment payment liabilities at fair value by discounting the contractually agreed upon payments by Bloomberg’s B+ corporate yield curve as of the valuation date, using rates commensurate with the term to payment. The credit rating was determined utilizing Bloomberg’s default risk function for the Company as of the valuation date. The installment payments and payment date (term) are based on the purchase agreements and the discount rate represents a quoted market price classified within Level 2 of the fair value hierarchy.
Inventory consists of the following:
| | | December 31,
2023 | | | December 31,
2022 | |
| | | (Restated) | | | (Restated) | |
| Finished goods (branded products) | | $ | 4,182 | | | $ | 5,616 | |
| Goods in process (un-branded products) | | | 600 | | | | 311 | |
| | | $ | 4,782 | | | $ | 5,927 | |
| E. | PROPERTY AND EQUIPMENT, NET: |
Property and equipment, net consists of the following:
| | | December 31,
2023 | | | December 31,
2022 | |
| Leasehold improvements | | $ | 6 | | | $ | 6 | |
| Office furniture and equipment | | | 558 | | | | 501 | |
| Software | | | 2,468 | | | | 1,525 | |
| Transportation equipment | | | 62 | | | | 62 | |
| | | | 3,094 | | | | 2,094 | |
| Accumulated depreciation | | | (1,573 | ) | | | (1,094 | ) |
| | | $ | 1,521 | | | $ | 1,000 | |
The Company recorded depreciation expense of $479 and $257, for the years ended December 31, 2023 and 2022, respectively.
STRAN & COMPANY, INC.
NOTES TO THE RESTATED FINANCIAL STATEMENTS
(in thousands, except share and per share amounts)
| F. | GOODWILL AND INTANGIBLE ASSETS: |
During the fourth quarter of fiscal years 2023 and 2022, the Company completed a goodwill impairment analysis for its single reporting unit. The Company determined that the carrying value of its reporting unit was in excess of its fair value and recorded a non-cash impairment charge of $1,182 and $810 during the fourth quarter of fiscal years 2023 and 2022, respectively. This impairment reduced the goodwill to $90 and $0 as of December 31, 2023 and 2022, respectively. When performing quantitative testing, the Company first estimates the fair values of its reporting unit using a combination of an income and market approach. The single step is to determine the estimated fair value of the reporting unit and compare it to the carrying value of the reporting unit, including goodwill. The majority of the inputs used in the discounted cash flow model are unobservable and thus are considered to be Level 3 inputs. See Note A – Organization and Summary of Significant Accounting Policies for more detail of methodology.
The following table summarizes the activity in the Company’s goodwill balance:
| | | (Restated) | |
| Balance as of December 31, 2021 | | $ | 335 | |
| Acquisitions (see Note G) | | | 937 | |
| Impairment | | | (1,182 | ) |
| Balance as of December 31, 2022 | | $ | 90 | |
| Acquisition (see Note G) | | | 720 | |
| Impairment | | | (810 | ) |
| Balance as of December 31, 2023 | | $ | — | |
The following table presents details of the Company’s intangible assets, estimated lives and related accumulated amortization:
| | | | | As of December 31, 2023 | | | As of December 31, 2022 | |
| | | | | (Restated) | | | (Restated) | |
| | | Estimated
Useful Life | | Gross | | | Accumulated
Amortization | | | Net
Carrying
Amount | | | Gross | | | Accumulated
Amortization | | | Net
Carrying
Amount | |
| Customer lists | | 10 - 12 years | | $ | 3,716 | | | $ | (602 | ) | | $ | 3,114 | | | $ | 2,546 | | | $ | (308 | ) | | $ | 2,238 | |
| Total | | | | $ | 3,716 | | | $ | (602 | ) | | $ | 3,114 | | | $ | 2,546 | | | $ | (308 | ) | | $ | 2,238 | |
STRAN & COMPANY, INC.
NOTES TO THE RESTATED FINANCIAL STATEMENTS
(in thousands, except share and per share amounts)
The Company recorded amortization expense of $294 and $163 for the years ended December 31, 2023 and 2022, respectively. The following table presents future estimated amortization expense based on existing intangible assets held for use:
| Fiscal Years: | | (Restated) | |
| 2024 | | $ | 343 | |
| 2025 | | | 343 | |
| 2026 | | | 343 | |
| 2027 | | | 343 | |
| 2028 | | | 343 | |
| Thereafter | | | 1,399 | |
| Total | | $ | 3,114 | |
Actual future estimated amortization expense could differ from these estimated amounts as a result of future acquisitions, dispositions, impairments, and other factors or changes.
GAP Acquisition
On January 31, 2022 (the “G.A.P. Closing Date”), the Company completed its acquisition (the “G.A.P. Acquisition”) of substantially all of the assets of G.A.P. Promotions, LLC (the “G.A.P. Acquired Assets”), pursuant to the Asset Purchase Agreement by and among the Company, G.A.P. Promotions, and Gayle Piraino and Stephen Piraino, dated as of January 21, 2022 as amended on January 31, 2022 (as amended, the “G.A.P. Purchase Agreement”).
The aggregate consideration required to be paid by the Company to G.A.P. Promotions for the purchase of the G.A.P. Acquired Assets (the “G.A.P. Purchase Price”) was: (a) $500 paid on the G.A.P. Closing Date; (b) an amount paid on the G.A.P. Closing Date equal to the amount paid by G.A.P. Promotions (at cost) for all of the Inventory (as defined in the G.A.P. Purchase Agreement) that was on hand as of the date and time of the G.A.P. Closing Date; (c) following the G.A.P. Closing Date, two annual installment payments, consisting of (i) $180 within 45 days of the first anniversary of the G.A.P. Closing Date and (ii) $300 within 45 days of the second anniversary of the G.A.P. Closing Date; and (d) required earnout payments within a certain period after each of the first two anniversaries of the G.A.P. Closing Date, in an amount equal to 70% of annual Gross Profit (as defined in the G.A.P. Purchase Agreement) to the extent that Gross Profit during the immediately trailing 12-month period prior to the applicable G.A.P. Closing Date anniversary exceeded $1,500.
The G.A.P. Purchase Price was approximately $1,981, as detailed below.
Additionally, the Company issued restricted shares of common stock on the G.A.P. Closing Date in an amount equal to the quotient of $100 divided by the closing price of the common stock at the close of trading on the date of the public announcement of the G.A.P. Purchase Agreement, which were determined to be post-combination expense as they were subject to forfeiture under certain conditions resulting in the termination of continuous employment during the vesting period, and therefore excluded from the G.A.P Purchase Price.
STRAN & COMPANY, INC.
NOTES TO THE RESTATED FINANCIAL STATEMENTS
(in thousands, except share and per share amounts)
The G.A.P. Acquisition was accounted for as a business combination in accordance with U.S. GAAP, with the Company as the accounting acquirer. Under this method of accounting, the G.A.P. Acquired Assets are recorded at estimated fair value as of the G.A.P. Closing Date. The excess of the purchase price over the estimated fair value of the net assets acquired, if applicable, is recognized as goodwill.
The following table summarizes the estimated fair value of the total consideration required to be paid pursuant to the G.A.P. Purchase Agreement as of the G.A.P. Closing Date:
| | | As
Reported | | | Adjustment | | | As
Restated | |
| Cash | | $ | 1,511 | | | $ | (1,011 | ) | | $ | 500 | |
| Cash adjustment for working capital | | | — | | | | 920 | | | | 920 | |
| Cash payment for inventory | | | — | | | | 91 | | | | 91 | |
| Fair value of restricted stock | | | 100 | | | | (100 | ) | | | — | |
| Fair value of contingent earn-out payments | | | 1,635 | | | | (1,622 | ) | | | 13 | |
| Present value of installment payments | | | — | | | | 457 | | | | 457 | |
| Total consideration | | $ | 3,246 | | | $ | (1,265 | ) | | $ | 1,981 | |
The Company determined the estimated fair value of the earn-out payments based on a discounted cash flow method.
The following table summarizes the purchase price allocations relating to the G.A.P. Acquisition:
| | | (Restated) | |
| Accounts receivable | | $ | 1,105 | |
| Prepaid expenses | | | 627 | |
| Inventory | | | 112 | |
| Customer relationships | | | 410 | |
| Goodwill | | | 580 | |
| Accounts payable and accrued expenses | | | (227 | ) |
| Unearned revenue | | | (626 | ) |
| Total consideration | | $ | 1,981 | |
The G.A.P. Acquired Assets were valued using a combination of a multi-period excess earnings methodology, a discounted cash flow approach, and present value of cash flows approach. The goodwill represents the excess fair value after the allocation of intangibles, of which approximately $580 is expected to be deductible for tax purposes.
Pro forma disclosure for the GAP Acquisition
The financial results of this acquisition are included in the Company’s statements of operations from the date of acquisition. As a privately held company, G.A.P. Promotions’ historic cash basis financial statements were unaudited and not prepared under US GAAP, including, but not limited to, differences in revenue recognition. The disclosure of supplemental pro forma financial information required under ASC 805 for a public business entity has been deemed impracticable by management due to these reasons.
Trend Acquisition
On August 31, 2022 (the “Trend Closing Date”), the Company completed its acquisition (the “Trend Acquisition”) of substantially all of the assets of Trend Brand Solutions (the “Trend Acquired Assets”), pursuant to the Asset Purchase Agreement by and among the Company, Trend Brand Solutions, and Michael Krausner, dated as of July 13, 2022 (as amended on August 31, 2022, the “Trend Purchase Agreement”).
STRAN & COMPANY, INC.
NOTES TO THE RESTATED FINANCIAL STATEMENTS
(in thousands, except share and per share amounts)
The aggregate consideration required to be paid by the Company to Trend Brand Solutions for the purchase of the Trend Acquired Assets (the “Trend Purchase Price”) was: (a) $175 paid on the Trend Closing Date; (b) an amount equal to the amount paid by Trend Brand Solutions (at cost) for all of the Inventory (as defined in the Trend Purchase Agreement) that was on hand as of the Trend Closing Date; (c) an amount equal to the depreciated value of the Fixed Assets (as defined in the Trend Purchase Agreement); (d) four annual installment payments (each, a “Trend Installment Payment” and collectively, the “Trend Installment Payments”), consisting of (i) approximately $38 within 45 days of the first anniversary of the Trend Closing Date, (ii) approximately $38 within 45 days of the second anniversary of the Trend Closing Date, (iii) $25 within 45 days of the third anniversary of the Trend Closing Date, and (iv) $25 within 45 days of the fourth anniversary of the Trend Closing Date; (e) restricted shares of common stock in an amount equal to the quotient of $100 divided by the daily volume-weighted average price of the common stock on The Nasdaq Capital Market for the five trading days prior to the Trend Closing Date; and (f) earn-out payments within a certain period after each of the first four anniversaries of the Trend Closing Date, in an amount equal to 40% of annual Gross Profit (as defined in the Trend Purchase Agreement) to the extent that such Gross Profit during the immediately trailing 12-month period prior to the applicable Trend Closing Date anniversary is in excess of $800.
The Trend Purchase Price was subject to certain adjustments. The Trend Purchase Price was decreased by the amount of any outstanding indebtedness of Trend Brand Solutions for borrowed money existing as of the Trend Closing Date, other than any indebtedness constituting Assumed Liabilities (as defined in the Trend Purchase Agreement) provided that such deducted amount was utilized to pay off such outstanding indebtedness. In addition, the Trend Purchase Price was subject to customary estimated and final working capital adjustment provisions with a target working capital of $0. In the event that any Inventory remained in stock was included in the Purchased Assets (as defined in the Trend Purchase Agreement), and during the first 24 months following the Trend Closing Date it was not purchased or became part of a contractual obligation of a client to purchase, then a deduction for such unsold Inventory required to be made from the next applicable Trend Installment Payment (and if the amount of the next Trend Installment Payment was not sufficient, then from future Trend Installment Payments until fully deducted). In the event that the Inventory is eventually purchased after such 24-month period, the amount that the Company receives for such Inventory will be credited and paid as part of the next applicable Trend Installment Payment.
The Trend Purchase Price was approximately $433, as detailed below.
The Trend Acquisition was accounted for as a business combination in accordance with U.S. GAAP, with the Company as the accounting acquirer. Under this method of accounting, the Trend Acquired Assets are recorded at estimated fair value as of the Trend Closing Date. The excess of the purchase price over the estimated fair value of the net assets acquired, if applicable, is recognized as goodwill.
The following table summarizes the estimated fair value of the total consideration required to be paid pursuant to the Trend Purchase Agreement as of the Trend Closing Date:
| | | As
Reported | | | Adjustment | | | As
Restated | |
| Cash | | $ | 2 | | | $ | 173 | | | $ | 175 | |
| Cash adjustment for working capital | | | — | | | | (213 | ) | | | (213 | ) |
| Cash payment for inventory and fixed assets | | | — | | | | 138 | | | | 138 | |
| Fair value of restricted stock | | | 100 | | | | (52 | ) | | | 48 | |
| Fair value of contingent earn-out payments | | | 1,370 | | | | (1,095 | ) | | | 275 | |
| Present value of installment payments | | | — | | | | 108 | | | | 108 | |
| Cash assumed | | | — | | | | 64 | | | | 64 | |
| Loan repayment | | | — | | | | (162 | ) | | | (162 | ) |
| Liabilities assumed | | | 721 | | | | (721 | ) | | | — | |
| Total consideration | | $ | 2,193 | | | $ | (1,760 | ) | | $ | 433 | |
The Company determined the estimated fair value of the earn-out payments based on a discounted cash flow method adjusted for the probability of Trend Brand Solutions achieving certain milestones as set forth in the Trend Purchase Agreement.
STRAN & COMPANY, INC.
NOTES TO THE RESTATED FINANCIAL STATEMENTS
(in thousands, except share and per share amounts)
The following table summarizes the purchase price allocations relating to the Trend Acquisition:
| | | (Restated) | |
| Cash | | $ | 64 | |
| Accounts receivable | | | 347 | |
| Prepaid expenses | | | 2 | |
| Inventory | | | 151 | |
| Property and equipment, net | | | 14 | |
| Customer relationships | | | 286 | |
| Goodwill | | | 267 | |
| Other assets | | | 23 | |
| Accounts payable and accrued expenses | | | (559 | ) |
| Note payable | | | (162 | ) |
| Total consideration | | $ | 433 | |
The Trend Acquired Assets were valued using a combination of a multi-period excess earnings methodology, a discounted cash flow approach and present value of cash flows approach. The goodwill represents the excess fair value after the allocation of intangibles, of which approximately $10 is expected to be deductible for tax purposes.
Pro forma disclosure for the Trend Acquisition
The financial results of this acquisition are included in the Company’s statements of operations from the date of acquisition. As a privately held company, Trend’s historic cash basis financial statements were unaudited and not prepared under US GAAP, including, but not limited to, differences in revenue recognition. The disclosure of supplemental pro forma financial information required under ASC 805 for a public business entity has been deemed impracticable by management due to these reasons.
Premier Business Services Acquisition
On December 20, 2022 (the “Premier Closing Date”), the Company completed its acquisition (the “Premier Acquisition”) of substantially all of the assets of Premier NYC (the “Premier NYC Acquired Assets”), pursuant to the Asset Purchase Agreement dated as of November 29, 2022 (the “Premier Purchase Agreement”), by and between the Company and Peter Poser (the “Premier NYC Seller”).
The aggregate consideration required to be paid by the Company to the Premier NYC Seller for the purchase of the Premier NYC Acquired Assets (the “Premier Purchase Price”) was: (a) $100 paid on the Premier Closing Date; (b) restricted shares of common stock issued on the Premier Closing Date that was equal to the quotient of $25 divided by the daily volume-weighted average price of the common stock on The Nasdaq Capital Market for the five trading days prior to the Premier Closing Date; (c) three annual installment payments to the Premier NYC Seller due on each anniversary of the Premier Closing Date equal to $60, $40, and $30, respectively; and (d) three annual earn-out payments payable in cash, in an amount equal to 45% of annual Gross Profit (as defined in the Premier Purchase Agreement) to the extent that such Gross Profit during the immediately trailing 12-month period prior to the applicable Premier Closing Date anniversary is in excess of $350. The Premier Purchase Price was subject to a working capital adjustment and certain other adjustments. The aggregate purchase price was approximately $830.
The Premier Acquisition was accounted for as a business combination in accordance with U.S. GAAP, with the Company as the accounting acquirer. Under this method of accounting, the Premier NYC Acquired Assets are recorded at estimated fair value as of the acquisition date. The excess of the purchase price over the estimated fair value of the net assets acquired, if applicable, is recognized as goodwill.
STRAN & COMPANY, INC.
NOTES TO THE RESTATED FINANCIAL STATEMENTS
(in thousands, except share and per share amounts)
The following table summarizes the estimated fair value of the total consideration required to be paid pursuant to the Premier Purchase Agreement as of the Premier Closing Date:
| | | As
Reported | | | Adjustment | | | As
Restated | |
| Cash | | $ | 440 | | | $ | (340 | ) | | $ | 100 | |
| Cash adjustment for working capital | | | — | | | | 340 | | | | 340 | |
| Fair value of restricted stock | | | 25 | | | | (15 | ) | | | 10 | |
| Fair value of earn-out payments | | | 908 | | | | (644 | ) | | | 264 | |
| Present value of installment payments | | | — | | | | 116 | | | | 116 | |
| Liabilities assumed | | | 18 | | | | (18 | ) | | | — | |
| Total consideration | | $ | 1,391 | | | $ | (561 | ) | | $ | 830 | |
The Company determined the estimated fair value of the earn-out payments based on a discounted cash flow method adjusted for the probability of Premier NYC achieving certain milestones as set forth in the Premier Purchase Agreement.
The following table summarizes the purchase price allocations relating to the Premier Acquisition:
| | | (Restated) | |
| Cash | | $ | 14 | |
| Accounts receivable | | | 344 | |
| Customer relationships | | | 400 | |
| Goodwill | | | 90 | |
| Accounts payable and accrued expenses | | | (18 | ) |
| Total consideration | | $ | 830 | |
The Premier NYC Acquired Assets were valued using a combination of a multi-period excess earnings methodology, a discounted cash flow approach and present value of cash flows approach. The goodwill represents the excess fair value after the allocation of intangibles, of which $0 is expected to be deductible for tax purposes.
Pro forma disclosure for the Premier Acquisition
The financial results of this acquisition are included in the Company’s statements of operations from the date of acquisition. As a privately held company, Premier’s historic cash basis financial statements were unaudited and not prepared under US GAAP, including, but not limited to, differences in revenue recognition. The disclosure of supplemental pro forma financial information required under ASC 805 for a public business entity has been deemed impracticable by management due to these reasons.
T.R. Miller Acquisition
On June 1, 2023 (the “T R Miller Closing Date”), the Company completed its acquisition (the “T R Miller Acquisition”) of substantially all of the assets of T R Miller (the “T R Miller Acquired Assets”), pursuant to the Asset Purchase Agreement, date as of January 25, 2023 (the “T R Miller Purchase Agreement”), among the Company, T R Miller, and Thomas R Miller (the “T R Miller Stockholder”).
The aggregate consideration required to be paid by to T R Miller for the purchase of the T R Miller Acquired Assets was (a) $1,000 payable in cash on the T R Miller Closing Date; (b) an amount equal to the cost basis of Inventory (as defined in the T R Miller Purchase Agreement); (c) four annual installment payments due on each anniversary of the T R Miller Closing Date, equal to $400, $300, $200, and $200, respectively; (d) four annual earn-out payments equal to (i) 45% of the annual Gross Profit (as defined in the T R Miller Purchase Agreement) during the immediately trailing 12-month period prior to the applicable T R Miller Closing Date anniversary with respect to certain customers of T R Miller or primarily resulting from the efforts of the T R Miller Stockholder or certain employees or independent contractors of T R Miller, to the extent that such Gross Profit amount exceeded $4,000, plus (ii) 25% of the annual Gross Profit during the immediately trailing 12-month period prior to the applicable T R Miller Closing Date anniversary with respect to certain customers primarily resulting from the past or future efforts of the Company that are assigned to and the primary responsibility of any employee or independent contractor of T R Miller as designated by the T R Miller Purchase Agreement, to the extent that such Gross Profit amount exceeded $4,000. The aggregate T R Miller Purchase Price was approximately $3,541 and was subject to a working capital adjustment.
STRAN & COMPANY, INC.
NOTES TO THE RESTATED FINANCIAL STATEMENTS
(in thousands, except share and per share amounts)
The following table summarizes the estimated fair value of the total consideration required to be paid pursuant to the T R Miller Purchase Agreement as of the T R Miller Closing Date:
| | | As
Reported | | | Adjustment | | | As
Restated | |
| Cash | | $ | 2,123 | | | $ | (1,123 | ) | | $ | 1,000 | |
| Cash adjustment for working capital | | | — | | | | 1,123 | | | | 1,123 | |
| Fair value of earn-out payments | | | 4,551 | | | | (4,084 | ) | | | 467 | |
| Present value of installment payments | | | — | | | | 951 | | | | 951 | |
| Total consideration | | $ | 6,674 | | | $ | (3,133 | ) | | $ | 3,541 | |
The Company determined the estimated fair value of the earn-out payments based on a discounted cash flow method adjusted for the probability of T R Miller achieving certain milestones as set forth in the T R Miller Purchase Agreement.
The Company determined the estimated fair value of the installment payments based on the present value of the future cash flows in accordance with the T R Miller Purchase Agreement.
The following table summarizes the purchase price allocations relating to the T R Miller Acquisition:
| | | (Restated) | |
| Accounts receivable | | $ | 1,622 | |
| Prepaid expense | | | 5 | |
| Inventory | | | 882 | |
| Customer relationships | | | 1,170 | |
| Goodwill | | | 720 | |
| Right of use asset - office leases | | | 837 | |
| Accounts payable and accrued expenses | | | (591 | ) |
| Unearned revenue | | | (285 | ) |
| Lease liability | | | (819 | ) |
| Total consideration | | $ | 3,541 | |
The T R Miller Acquired Assets were valued using a combination of a multi-period excess earnings methodology, a discounted cash flow approach and present value of cash flows approach. The goodwill represents the excess fair value after the allocation of intangibles, of which approximately $420 is expected to be deductible for tax purposes.
The Company incurred approximately $39 of acquisition-related transaction costs in conjunction with the T R Miller Acquisition.
STRAN & COMPANY, INC.
NOTES TO THE RESTATED FINANCIAL STATEMENTS
(in thousands, except share and per share amounts)
Pro forma disclosure for the T R Miller Acquisition
The following unaudited pro forma financial information reflects the consolidated results of operations of the Company as if the T R Miller Acquisition had taken place on January 1, 2022. The pro forma financial information is not necessarily indicative of the results of operations as they would have been had the transactions been effected on the assumed date:
| | | December 31,
2023 | | | December 31,
2022 | |
| | | (Restated) | | | (Restated) | |
| Sales | | $ | 80,256 | | | $ | 77,131 | |
| Costs of sales | | | 54,228 | | | | 57,163 | |
| Gross profit | | | 26,028 | | | | 19,968 | |
| Operating expenses | | | 27,543 | | | | 22,545 | |
| Loss from operations | | | (1,515 | ) | | | (2,577 | ) |
| Other income (expense) | | | | | | | | |
| Other income | | | 271 | | | | 1 | |
| Interest income (expense), net | | | 582 | | | | 135 | |
| Realized gain (loss) on investments | | | 103 | | | | (179 | ) |
| | | | 956 | | | | (43 | ) |
| Loss before taxes | | | (559 | ) | | | (2,620 | ) |
| Provision for income taxes | | | 41 | | | | 467 | |
| Net loss | | | (600 | ) | | | (3,087 | ) |
| | | | | | | | | |
| Net loss per share - basic & diluted | | $ | (0.03 | ) | | $ | (0.16 | ) |
| Weighted average shares outstanding - basic & diluted | | | 18,519,892 | | | | 19,202,594 | |
| H. | ACCOUNTS PAYABLE AND ACCRUED EXPENSES: |
Accounts payable and accrued expenses consists of the following:
| | | December 31,
2023 | | | December 31,
2022 | |
| | | (Restated) | | | (Restated) | |
| Cost of sales - purchases | | $ | 3,218 | | | $ | 3,571 | |
| Other payables and accrued expenses | | | 1,527 | | | | 478 | |
| | | $ | 4,745 | | | $ | 4,049 | |
| I. | NOTE PAYABLE - LINE OF CREDIT: |
The Company has a $7,000 line of credit with Salem Five Cents Savings Bank at December 31, 2023 and 2022, borrowings on this line of credit amounted to zero. The line bears interest at prime rate plus 0.5% per annum. At December 31, 2023 and 2022, the interest rate was 9.0% and 8.0%, respectively. The line is reviewed annually and is due on demand. This line of credit is secured by substantially all assets of the Company. The line of credit was terminated effective August 26, 2024.
| J. | REWARD CARD PROGRAM LIABILITY: |
The Company manages reward card programs for customers. Under this program, the Company receives cash and simultaneously records a liability for the total amount received. These accounts are adjusted on a periodic basis as reward cards are funded or reduced at the direction of the customers. At December 31, 2023 and 2022, the company had deposits totaling $875 and $6,000, respectively.
| K. | NOTE PAYABLE - WILDMAN: |
In connection with the asset acquisition of Wildman Imprints on September 26, 2020, the Company had an amount due to the seller of $162 for the inventory purchased. This amount accrues no interest, and is to be paid “as used” on a quarterly basis through the three years earn-out period as discussed in Note J. During the year ended December 31, 2023, the seller forgave the outstanding note payable and the Company recognized a gain on the extinguishment of debt of $162 for the outstanding principal balance which is recorded in general and administrative expense on the statement of operations. At December 31, 2023 and 2022, the note totaled $0 and $162, respectively.
STRAN & COMPANY, INC.
NOTES TO THE RESTATED FINANCIAL STATEMENTS
(in thousands, except share and per share amounts)
| L. | INSTALLMENT PAYMENT LIABILITY: |
A reconciliation of the installment payment liability is included below:
| | | (Restated) | |
| Balance as of December 31, 2021 | | $ | — | |
| Additions pursuant to acquisitions | | | 681 | |
| Balance as of December 31, 2022 | | $ | 681 | |
| Additions pursuant to acquisitions | | | 951 | |
| Interest accretion | | | 11 | |
| Payments made | | | (218 | ) |
| Balance as of December 31, 2023 | | $ | 1,425 | |
| | | | | |
| Current portion of installment payment liabilities | | $ | 786 | |
| Long-term installment payment liabilities | | $ | 639 | |
Revenue disaggregated according to the timing of transfer of goods or services (e.g., at a point in time) was as follows:
| Revenue generated per major product category | | December 31,
2023 | | | December 31,
2022 | |
| | | | (Restated) | | | | (Restated) | |
| Promotional products - dropshipping | | $ | 32,794 | | | $ | 33,179 | |
| Promotional products – Company owned inventory | | | 17,911 | | | | 11,086 | |
| Promotional products – bulk dropshipping | | | 17,686 | | | | 6,797 | |
| Promotional products – third party distributor | | | 6,076 | | | | 5,392 | |
| Rewards program | | | 1,233 | | | | 1,213 | |
| Additional services | | | 300 | | | | 211 | |
| | | $ | 76,000 | | | $ | 57,878 | |
Unearned revenue includes customer deposits and deferred revenue which represent prepayments from customers. The Company had unearned revenue as follows:
| | | December 31,
2023 | | | December 31,
2022 | |
| | | (Restated) | | | (Restated) | |
| Balance at January 1, | | $ | 633 | | | $ | 722 | |
| Revenue recognized | | | (633 | ) | | | (722 | ) |
| Amounts collected or invoiced | | | 1,116 | | | | 633 | |
| Unearned revenue | | $ | 1,116 | | | $ | 633 | |
| N. | COMMITMENTS AND CONTINGENCIES: |
Legal Proceedings
The Company may from time to time become involved in various legal actions incidental to our business. As of the date of this report, the Company is not involved in any legal proceedings that it believes could have a material adverse effect on its financial position or results of operations. However, the outcome of any current or future legal proceeding is inherently difficult to predict and any dispute resolved unfavorably could have a material adverse effect on the Company’s business, financial position, and operating results.
STRAN & COMPANY, INC.
NOTES TO THE RESTATED FINANCIAL STATEMENTS
(in thousands, except share and per share amounts)
Lease Agreements - Operating Leases
On May 31, 2020, the Company renewed a lease for a 10,500 square foot office space in Quincy, MA. The lease renewed on June 1, 2020 and is for a term of 60 months from the renewal date. The lease included an escalation clause with annual increases of approximately 2.5% increase per year. The associated lease right-of-use asset and lease liability is $433 as of December 31, 2023, based on the present value of payments and an incremental borrowing rate of 12%. As the Company’s lease did not provide an implicit rate, the Company estimated the incremental borrowing rate based on the credit quality of the Company and by comparing interest rates available in the market for similar borrowings.
On September 8, 2020, the Company entered into a lease for a 10,500 square foot office space in Warsaw, IN. The lease commenced on September 10, 2020 and is for a term of 36 months from the commencement date. The lease included an escalation clause with annual increases of approximately 2.5% increase per year. The associated lease right-of-use asset and lease liability as of December 31, 2023, were zero. As the Company’s lease did not provide an implicit rate, the Company estimated the incremental borrowing rate based on the credit quality of the Company and by comparing interest rates available in the market for similar borrowings.
On February 1, 2023, the Company entered into a lease for a 5,600 square foot office space in Tomball, TX. The lease commenced on February 1, 2023 and is for a term of 36 months from the commencement date. The lease included an escalation clause with annual increases of approximately 2.3% increase per year. The Company recorded a lease right-of-use asset and lease liability of $130 as of December 31, 2023, based on the present value of payments and an incremental borrowing rate of 4%. As the Company’s lease did not provide an implicit rate, the Company estimated the incremental borrowing rate based on the credit quality of the Company and by comparing interest rates available in the market for similar borrowings.
On May 31, 2023, the Company entered into a lease for a 25,000 square foot office space and warehouse in Walpole, MA. The lease commenced on June 1, 2023 and is for a term of 60 months from the commencement date. The lease included an escalation clause with annual increases of approximately 2% increase per year. The Company recorded a lease right-of-use asset and lease liability of $760 as of December 31, 2023, based on the present value of payments and an incremental borrowing rate of 4%. As the Company’s lease did not provide an implicit rate, the Company estimated the incremental borrowing rate based on the credit quality of the Company and by comparing interest rates available in the market for similar borrowings.
The following schedule represents the components of lease expense:
| | | December 31,
2023 | | | December 31,
2022 | |
| | | (Restated) | | | (Restated) | |
| Lease cost | | | | | | |
| Operating lease cost | | $ | 537 | | | $ | 457 | |
| Total | | $ | 537 | | | $ | 457 | |
The following schedule represents maturities of operating and finance lease liabilities as of December 31, 2023:
| | | Operating Minimum
Lease Payments | |
| | | (Restated) | |
| 2024 | | $ | 570 | |
| 2025 | | | 361 | |
| 2026 | | | 189 | |
| 2027 | | | 185 | |
| 2028 | | | 67 | |
| Thereafter | | | — | |
| Total payments | | | 1,372 | |
| Less amount representing interest | | | (46 | ) |
| Present value of payments | | $ | 1,326 | |
STRAN & COMPANY, INC.
NOTES TO THE RESTATED FINANCIAL STATEMENTS
(in thousands, except share and per share amounts)
The following schedule sets forth supplemental cash flow information related to operating and finance leases as of December 31, 2023 and 2022:
| | | December 31,
2023 | | | December 31,
2022 | |
| | | (Restated) | | | (Restated) | |
| Other information | | | | | | |
| Operating cash flows from operating lease | | $ | 8 | | | $ | — | |
The aggregate weighted average remaining lease term was 3.2 years as of December 31, 2023. The aggregate weighted average discount rate was 3.3% as of December 31, 2023.
Common Stock
In accordance with the Company’s Articles of Incorporation dated May 24, 2021, the Company is authorized to issue 300,000,000 shares of $0.0001 par value common stock, of which 18,539,000 and 18,475,336 shares were issued and outstanding at December 31, 2023 and 2022, respectively. Common stockholders are entitled to one vote per share and are entitled to receive dividends when, as and if declared by the Board of Directors.
Warrants
The Company has outstanding publicly-traded warrants which entitle the holders to purchase one share of common stock at an exercise price of $4.81375 per share as of December 31, 2023, which expire five years from issuance (“IPO Warrants”). As of December 31, 2023 and 2022, IPO Warrant holders exercised an aggregate 659,456 IPO Warrants and there were 4,478,134 IPO Warrants outstanding.
The Company has 149,639 outstanding warrants issued to the underwriters of the Company’s IPO that were exercisable beginning six months after the date of the IPO at an exercise price of $5.19 with a five-year expiration term.
The Company has outstanding private placement warrants which entitle the holders to purchase up to 5,464,903 shares of common stock at an exercise price of $4.97 per share, which will expire five years from issuance (“PIPE Warrants”). The PIPE Warrants have certain downward pricing adjustment mechanisms, including with respect to any subsequent equity sale that is deemed a dilutive issuance, in which case the PIPE Warrants will be subject to a floor price of $1.00 per share, as set forth in the PIPE Warrants.
The Company has outstanding 131,158 warrants issued to the placement agent for the PIPE that were exercisable beginning six months from the date of the PIPE at an exercise price of $4.97 with a five-year expiration term.
As of December 31, 2023 and 2022 PIPE Warrant holders have exercised zero PIPE Warrants and there were 5,596,061 PIPE Warrants outstanding.
The following table reflects all outstanding and exercisable warrants at December 31, 2023 and 2022:
| | | Number of
Warrants
Outstanding | | | Weighted
Average
Exercise Price | | | Weighted
Average Life
(Years) | | | Aggregate
Intrinsic Value | |
| Balance January 1, 2022 | | | 10,345,784 | | | $ | 4.90 | | | | 5.0 | | | $ | — | |
| Warrants exercised | | | (271,589 | ) | | | 4.81 | | | | — | | | | — | |
| Balance December 31, 2022 | | | 10,074,195 | | | $ | 4.91 | | | | 5.0 | | | $ | — | |
| Balance December 31, 2023 | | | 10,074,195 | | | $ | 4.91 | | | | 4.0 | | | $ | — | |
STRAN & COMPANY, INC.
NOTES TO THE RESTATED FINANCIAL STATEMENTS
(in thousands, except share and per share amounts)
Stock Repurchase Program
On February 21, 2022, the Board of Directors of the Company authorized a repurchase of up to $10,000 of the Company’s shares from time to pursuant to a stock repurchase program, or the Repurchase Program. Under the terms of the Repurchase Program, the Company may repurchase shares through open market or negotiated private transactions. The timing and extent of any purchases depend upon ongoing assessments of the Company’s capital needs, market conditions and the price of the Company’s common stock, and other corporate considerations, as determined by management, and are subject to the restrictions relating to volume, price and timing under applicable laws, including but not limited to, Rule 10b-18 promulgated under the Exchange Act. Upon retirement, the Company allocates amounts in excess of par value between additional paid-in capital and retained earnings. The portion charged to retained earnings is first limited to positive amounts (i.e., credit balances) in retained earnings and then to positive amounts in additional paid-in capital.
Below is a table containing information about purchases made by the company:
| Period | | Total
Number of
Shares
Purchased | | | Average
Price
Paid per
Share | | | Total
Number of
Shares
Purchased as
Part of
Publicly
Announced
Plans or
Programs | | | Maximum
Approximate
Dollar Value
of Shares
that May Yet
be Purchased
Under the
Plans or
Programs | |
| January 1, 2022 - December 31, 2022 | | | 1,777,657 | | | $ | 1.87 | | | | 1,777,657 | | | $ | 6,668 | |
| January 1, 2023 – December 31, 2023 | | | 37,509 | | | $ | 1.32 | | | | 1,815,166 | | | $ | 6,618 | |
| P. | STOCK-BASED COMPENSATION: |
In November 2021, the Board of Directors adopted the Amended and Restated 2021 Equity Incentive Plan (the “2021 Plan”) which provides for the granting of non-qualified stock options and restricted stock to the Company’s employees, officers, directors, and outside consultants to purchase shares of the Company’s common stock. The number of shares of common stock available for issuance under the 2021 Plan is 1,041,147 shares of common stock.
Stock-based compensation expense included the following components:
| | | December 31,
2023 | | | December 31,
2022 | |
| | | (Restated) | | | (Restated) | |
| Stock options | | $ | 49 | | | $ | 161 | |
| Restricted stock | | | 151 | | | | 170 | |
| | | $ | 200 | | | $ | 331 | |
All stock-based compensation expense is recorded in General and Administrative expense in the Statement of Operations.
Non-Qualified Stock Options
The fair value of options is estimated on the date of grant using the Black-Scholes option pricing model using the assumptions noted in the table below. The fair value is amortized as compensation cost on a straight-line basis over the requisite service period of the awards, which is generally the vesting period. The Company uses historical data on employee turnover and terminations to estimate the percentage of options that will ultimately be exercised. Expected volatility is based on historical volatility from a representative sample of publicly traded companies. The expected term represents the period of time that the options are expected to be outstanding. The risk-free interest rate is estimated using the rate of return on U.S. Treasury Notes with a life that approximates the expected life of the option. Forfeitures are estimated at the time of grant and revised, if necessary, in subsequent periods if actual results differ from the estimates. Stock-based compensation is based on awards that are ultimately expected to vest.
Option awards are generally granted with an exercise price equal to the fair value of the Company’s stock at the date of grant; those options generally vest based on four years of continuous service and have 10-years contractual terms.
The Black-Scholes option pricing model assumptions are as follows:
| Risk-free interest rate | | 3.86% |
| Expected term | | 5.5-6.25 years |
| Expected volatility | | 29.24% |
| Expected dividends | | 0% |
STRAN & COMPANY, INC.
NOTES TO THE RESTATED FINANCIAL STATEMENTS
(in thousands, except share and per share amounts)
A summary of option activity under the 2021 Plan as of December 31, 2023 and 2022 and changes during the years then ended is presented below:
| Options | | Shares | | | Weighted Average
Exercise Price | | | Aggregate
Intrinsic Value | |
| | | (Restated) | | | (Restated) | | | (Restated) | |
| Outstanding at January 1, 2022 | | | 1,515,000 | | | $ | 4.15 | | | $ | 2,879 | |
| Granted | | | 81,000 | | | | 2.32 | | | | — | |
| Forfeited or expired and other adjustments | | | (90,667 | ) | | | 4.15 | | | | — | |
| Outstanding at December 31, 2022 | | | 1,505,333 | | | $ | 4.11 | | | $ | — | |
| Granted | | | 76,500 | | | | 1.66 | | | | — | |
| Forfeited or expired and other adjustments | | | (115,771 | ) | | | 4.13 | | | | — | |
| Outstanding at December 31, 2023 | | | 1,466,062 | | | $ | 3.98 | | | $ | — | |
| Vested and exercisable at December 31, 2023 | | | 852,896 | | | $ | 4.09 | | | $ | — | |
The weighted-average grant-date fair value of options granted during the years ended December 31, 2023 and 2022 was $1.54 and $1.80, respectively. The weighted-average remaining contractual term for the outstanding options is approximately 8 years and 9 years as of December 31, 2023 and 2022, respectively.
Restricted Stock:
Restricted stock consists of time-based restricted stock units (RSUs) and performance-based restricted stock units (PSUs). RSUs granted under the 2021 Plan generally vest over 3 to 4 years, based on continued employment, and are settled upon vesting shares of the Company’s common stock on a one-for-one basis. PSUs granted under the 2021 Plan are issued and vest immediately as various performance goals and targets are achieved.
A summary of restricted stock activity under the 2021 Plan as of December 31, 2023 and 2022 and changes during the years then ended is presented below:
| Restricted Stock | | Time-Based | |
| Outstanding at January 1, 2022 | | | 154,960 | |
| Granted | | | 145,660 | |
| Vested | | | (227,737 | ) |
| Forfeited | | | (8,717 | ) |
| Outstanding at December 31, 2022 | | | 64,166 | |
| Granted | | | 32,252 | |
| Vested | | | (33,333 | ) |
| Forfeited | | | (10,897 | ) |
| Outstanding at December 1, 2023 | | | 52,188 | |
The following outstanding shares of common stock equivalents were excluded from the computation of diluted net loss per share for the periods in which a net loss is presented because their effect would have been anti-dilutive.
| | | December 31,
2023 | | | December 31,
2022 | |
| | | (Restated) | | | (Restated) | |
| Warrants | | | 10,074,195 | | | | 10,074,195 | |
| Stock options | | | 852,896 | | | | 453,918 | |
| | | | 10,927,091 | | | | 10,528,113 | |
For the years ended December 31, 2023 and 2022, as a result of the net losses in these years, all warrants and stock options have been excluded from the calculation of diluted earnings per share and, therefore, there was no difference in the weighted average number of common shares for basic and diluted loss per share as the effect of all potentially dilutive shares outstanding was anti-dilutive.
STRAN & COMPANY, INC.
NOTES TO THE RESTATED FINANCIAL STATEMENTS
(in thousands, except share and per share amounts)
Income taxes are provided for the tax effects of transactions reported in the financial statements and consist of taxes currently due. Deferred taxes relate to differences between the basis of assets and liabilities for financial and income tax reporting which will be either taxable or deductible when the assets or liabilities are recovered or settled.
The provision for income taxes consisted of the following:
| | | December 31,
2023 | | | December 31,
2022 | |
| | | (Restated) | | | (Restated) | |
| Current provision | | | | | | |
| Federal | | $ | 33 | | | $ | — | |
| State | | | 8 | | | | 5 | |
| Total current provision | | | 41 | | | | 5 | |
| | | | | | | | | |
| Deferred provision | | | | | | | | |
| Federal | | | — | | | | 170 | |
| State | | | — | | | | 47 | |
| Total deferred provision | | | — | | | | 217 | |
| | | | | | | | | |
| Provision for income taxes | | $ | 41 | | | $ | 222 | |
For the years ended December 31, 2023 and 2022, the income (loss) before income taxes was $(344) and $(3,278), respectively. The Company had an effective tax rate of (11.92)% and (6.77)% for the years ended December 31, 2023 and 2022, respectively. The reconciliation of the statutory federal income tax rate to the Company’s effective tax rate were as follows:
| | | For the Year Ended | |
| | | December 31, 2023 | | | December 31, 2022 | |
| | | (Restated) | | | (Restated) | |
| U.S. statutory rate | | | 21.00 | % | | | 21.00 | % |
| State taxes, net of federal | | | (0.68 | )% | | | 5.64 | % |
| Change in valuation allowance | | | (27.45 | )% | | | (33.28 | )% |
| Return to provision | | | — | % | | | — | % |
| Meals and entertainment expenses | | | (9.53 | )% | | | —% | |
| Other permanent differences | | | 4.74 | % | | | (0.13 | )% |
| Effective tax rate | | | (11.92 | )% | | | (6.77 | )% |
STRAN & COMPANY, INC.
NOTES TO THE RESTATED FINANCIAL STATEMENTS
(in thousands, except share and per share amounts)
The table below presents the effects of temporary differences that gave rise to significant portions of deferred tax assets and liabilities as of December 31, 2023 and 2022:
| | | December 31,
2023 | | | December 31,
2022 | |
| | | | (Restated) | | | | (Restated) | |
| Deferred tax assets: | | | | | | | | |
| Net operating loss carryforwards | | $ | 384 | | | $ | 613 | |
| Charitable contributions | | | 18 | | | | 8 | |
| Lease liability | | | 347 | | | | 211 | |
| Stock compensation | | | 184 | | | | 135 | |
| Compensation expense | | | 26 | | | | 27 | |
| Unrealized gains | | | 3 | | | | 48 | |
| Section 163j | | | — | | | | 37 | |
| Allowance for credit losses | | | 44 | | | | 30 | |
| UNICAP | | | 27 | | | | 49 | |
| Amortization | | | 578 | | | | 261 | |
| Other | | | — | | | | — | |
| Total gross deferred tax assets | | | 1,611 | | | | 1,419 | |
| Less: Valuation allowance | | | (1,216 | ) | | | (1,166 | ) |
| Net deferred tax assets | | | 395 | | | | 253 | |
| | | | | | | | | |
| Deferred tax liabilities: | | | | | | | | |
| Lease liability | | | (349 | ) | | | (210 | ) |
| Depreciation | | | (46 | ) | | | (43 | ) |
| Other | | | — | | | | — | |
| Total deferred tax liabilities | | | (395 | ) | | | (253 | ) |
| | | | | | | | | |
| Total deferred tax assets (liabilities) | | $ | — | | | $ | — | |
The Company has Federal and State net operating loss (“NOLs”) carryforwards of approximately $1,683 and $1,941, respectively, as of December 31, 2023. The Federal NOLs were generated after December 31, 2017 and have an infinite carryforward period but are subject to 80% deduction limitation based upon pre-NOL deduction taxable income. State NOLs generated have various expiration rules and dates with the first amount of NOLs expiring in 2028.
The utilization of the Company’s net operating loss carryforwards and research tax credit carryovers could be subject to annual limitations under Section 382 and 383 of the Internal Revenue Code of 1986, as amended (the “Code”), and similar state tax provisions, due to ownership change limitations that may have occurred previously or that could occur in the future. These ownership changes limit the amount of net operating loss carryforwards and other deferred tax assets that can be utilized to offset future taxable income and tax, respectively. In general, an ownership change, as defined by Section 382 and 383 of the Code, results from transactions increasing ownership of certain stockholders or public groups in the stock of the corporation by more than 50 percent points over a three-year period. The Company has completed an analysis of an ownership change under Section 382 of the Code. The Section 382 analysis concluded that an ownership change occurred on November 12, 2021, the date of the Company’s IPO. The Company also determined that on the date of the ownership change it was reasonable to conclude that it was in a net unrealized built-in gain position. The Company did not do any work to determine what realized built-in gains were available to increase its Section 382 limitation each year. Based on the Section 382 analysis, the Company has plenty of cumulative base Section 382 limitation available to utilize pre-ownership change 2021 net operating losses in 2023 as well as all of its post-ownership change net operating losses, which are not limited under Section 382.
STRAN & COMPANY, INC.
NOTES TO THE RESTATED FINANCIAL STATEMENTS
(in thousands, except share and per share amounts)
In assessing the realization of deferred tax assets, management considers whether it is more likely than not that some portion or all the deferred income tax assets will not be realized. The ultimate realization of deferred income tax assets is dependent upon the generation of future taxable income during the periods in which those temporary differences become deductible. Management considers the scheduled reversal of deferred income tax liabilities, projected future taxable income, and tax planning strategies in making this assessment. Based on consideration of these items, management has determined that enough uncertainty exists relative to the realization of the deferred income tax asset balances to warrant the application of a full valuation allowance as of December 31, 2023 and 2022.
There was income tax expense for the years ended December 31, 2023 and 2022 of $41 and $222, respectively.
Uncertain Tax Positions
As of December 31, 2023, the Company has three uncertain tax positions that total a gross amount of $2,448, which included an increase of $263, of which 80% is covered via NOLs. After the impact of NOLs, interest is immaterial. The Company expects to release its FIN 48 reserve as well as making corresponding adjustment to its NOLs in 2025.
| | | (Restated) | |
| Unrecognized tax benefits as of January 1, 2022 | | $ | 1,752 | |
| Gross increase in unrecognized tax benefits for prior year positions | | | 433 | |
| Decreases due to settlements | | | — | |
| Unrecognized tax benefits as of December 31, 2022 | | $ | 2,185 | |
| Gross increase in unrecognized tax benefits for prior year | | | 263 | |
| Decreases due to settlements | | | — | |
| Unrecognized tax benefits as of December 31, 2023 | | $ | 2,448 | |
The Company is exposed to credit losses primarily through sales of products and services. The Company’s expected loss allowance methodology for accounts receivable is developed using historical collection experience, current and future economic and market conditions and a review of the current status of customers’ trade accounts receivable. Customers are pooled based on sharing specific risk factors. Due to the short-term nature of such receivables, the estimated accounts receivable that may not be collected is based on aging of the accounts receivable balances.
Customers are assessed for credit worthiness upfront through a credit review, which includes assessment based on the Company’s analysis of their financial statements when a credit rating is not available. The Company evaluates contract terms and conditions, country and political risk, and may require prepayment to mitigate risk of loss. Specific allowance amounts are established to record the appropriate provision for customers that have a higher probability of default. The Company monitors changes to the receivables balance on a timely basis, and balances are written off as they are determined to be uncollectible after all collection efforts have been exhausted. Estimates of potential credit losses are used to determine the allowance. It is based on assessment of anticipated payment and all other historical, current and future information that is reasonably available.
The accounts receivable balance on the Company’s consolidated balance sheets as of December 31, 2023 was $17,076, net of $317 of allowances. The following table provides a roll-forward of the allowance for credit losses in 2023 and 2022 that is deducted from the amortized cost basis of accounts receivable to present the net amount expected to be collected:
| | | December 31,
2023 | | | December 31,
2022 | |
| Balance of allowance for credit losses, beginning of period | | $ | (264 | ) | | $ | (303 | ) |
| Current period change for write-offs | | | 121 | | | | 3 | |
| Current period change for expected credit losses | | | (174 | ) | | | 36 | |
| Balance of allowance for credit losses, end of period | | $ | (317 | ) | | $ | (264 | ) |
STRAN & COMPANY, INC.
NOTES TO THE RESTATED FINANCIAL STATEMENTS
(in thousands, except share and per share amounts)
| T. | RELATED PARTY TRANSACTIONS: |
Amount due from related party
| Name of Related Party | | Relationship | | Nature | | December 31,
2023(1) | | | December 31,
2022 | |
| | | | | | | (Restated) | | | | |
| Innovative Genetics, Inc. | | Alejandro Tani, member of board of directors, the chairman of the Company’s Nominating and Corporate Governance Committee, and a member of the Compensation Committee and the Company’s Audit Committee, is the Chief Executive Officer, Chief Information Officer, and majority owner of Innovative Genetics. | | Limited, non-exclusive, revocable license to use Innovative Genetics’ logos, trade names and trademarks on apparel and promotional products as branded products for sale to Innovative Genetics and Innovative Genetics-authorized persons. | | $ | 853 | | | $ | — | |
| (1) | As of the date of this report, such balance was repaid by Innovative Genetics, Inc. |
Amounts due and paid to related party
Transactions with Engage & Excel Enterprises Inc.
Alan Chippindale, a member of the Company’s board of directors, the chairman of the Compensation Committee, and a member of the Nominating and Corporate Governance Committee, is the President of Engage & Excel Enterprises Inc. (“Engage & Excel”). The Company and Engage & Excel are parties to a Buyer’s Agreement, dated June 25, 2020 (the “Buyer’s Agreement”). Under the Buyer’s Agreement, Engage & Excel agreed to provide certain merger and acquisition, management and recruitment consulting services in connection with the Company’s acquisition of the Wildman Imprints assets. The Company agreed to pay Engage & Excel a fee of $20 upon completion of a purchase and sale agreement and two annual fees of 1.5% of gross margin less costs attributable to the acquisition. The Company paid Engage & Excel approximately $10 as the first annual fee in November 2021 and approximately $13 in December 2022 under the Buyer’s Agreement.
Separately from the Buyer’s Agreement, in 2023, the Company paid Engage & Excel approximately $18 for recruiting fees and $20 for consulting fees relating to the T R Miller assets acquisition. The Company also agreed to pay Engage & Excel 1.5% of the contribution margin of the T R Miller assets for two years, paid annually. In September 2022, the Company paid Engage & Excel a one-time fee of $15 for providing certain merger and acquisition consulting services in connection with our acquisition of Trend Brand Solutions. In addition, the Company paid Engage & Excel a total of approximately $14 in 2022 related to other recruitment consulting services. The fees paid or that the Company agreed to pay to Engage & Excel for consulting services to date have totaled less than $200. The Company’s board of directors has determined that Mr. Chippindale remains eligible under Nasdaq rules to serve as an “independent director” of the Company and as a member and chairman of the Compensation Committee and a member of the Nominating and Corporate Governance Committee. Due to Mr. Chippindale’s indirect compensation under the agreement, the board has determined that he is currently not eligible to be a member of our Audit Committee.
The Company follows the policy of charging the costs of advertising to expense as incurred. For the years ended December 31, 2023 and 2022, advertising costs amounted to $418 and $375, respectively.
| V. | DEFINED PROFIT SHARING PLAN |
On January 1, 2023, the Company adopted the Stran 401(k) Savings Plan (the “Plan”), which qualifies under Section 401(k) of the Internal Revenue Code of 1986, as amended. Any eligible employee is allowed to participate in the Plan after three months of service. The Company matches the first three percent (3%) of a participant’s contributions, which vest based on years of service, as defined in the Plan document. The Company made matching contributions of $238 during the year ended December 31, 2023.
STRAN & COMPANY, INC.
NOTES TO THE RESTATED FINANCIAL STATEMENTS
(in thousands, except share and per share amounts)
Completion of Bangarang Acquisition:
On August 23, 2024, Stran Loyalty Solutions, LLC, a Nevada limited liability company (the “Purchaser” or “Stran Loyalty Solutions”), a wholly-owned subsidiary of the Company, entered into a Secured Party Sale Agreement, dated as of August 23, 2024 (the “Sale Agreement”), with Sallyport Commercial Finance, LLC, a Delaware limited liability company (“Secured Party”), pursuant to which the Purchaser agreed to purchase, on an as-is basis, all of the rights and interests of Bangarang Enterprises, LLC, a California limited liability company (d/b/a Gander Group) (“Bangarang”), in and to substantially all of the assets of Bangarang (the “Bangarang Assets”) from Secured Party as a private sale pursuant to Article 9 of the Uniform Commercial Code (the “Bangarang Transaction”).
Under the Sale Agreement, the aggregate consideration for the Bangarang Assets consisted of (a) cash payments by the Purchaser to Secured Party of $1,099 (the “Cash Purchase Price”), and (b) the assumption by the Purchaser of certain liabilities totaling approximately $5.5 million (the “Assumed Liabilities”), subject to adjustments, as described below, at and following the Closing (as defined below), including the payment at the Closing of $150 to Warson Capital Partners, LLC, an investment banking firm retained by Bangarang, for its fees and expenses with respect to the Bangarang Transaction, including the marketing for sale of the Bangarang Assets (the “Transaction Expense Payment”).
As a result of the Closing, the Company indirectly acquired substantially all of the assets of Bangarang, including all of the equity of Gander Group Louisiana, LLC, a Louisiana limited liability company (“GGLA”), which will be a wholly-owned subsidiary of the Purchaser.
The Company has not completed the purchase price allocation of this acquisition prior to the issuance of these financial statements, and an estimate of the financial effect of the transaction cannot be made. All other business combination disclosures are not available due to the proximity of the acquisition to the issuance of these financial statements.
Factoring Arrangement and Termination of Revolving Line of Credit
On August 23, 2024, Stran Loyalty Solutions entered into a factoring arrangement with a third party to provide accounts receivable financing to Stran Loyalty Solutions. In connection with the factoring arrangement, the Company provided a secured guarantee of Stran Loyalty Solutions’ obligations under the factoring arrangement. Prior to this arrangement, the Company had been a party to the Revolving Demand Line of Credit Loan Agreement, dated as of November 22, 2021, between the Company and Salem Five Cents Savings Bank, a Massachusetts savings bank (“Salem Five Cents”), as amended by the Commercial Loan Modification Agreement, dated as of February 12, 2024, between the Company and Salem Five Cents (the “Loan Agreement”), and the Revolving Demand Line of Credit Note, dated November 22, 2021, by the Company in favor of Salem Five Cents (the “Demand Note”). The Loan Agreement and the Demand Note provided for a secured revolving loan facility in an aggregate principal amount of up to $7,000 (the “Revolving Line of Credit”). In discussions with Salem Five Cents prior to the establishment of the factoring arrangement, Salem Five Cents indicated that it would terminate the Revolving Line of Credit because of a policy which prohibited it from agreeing to subordination of its security interest in the Company’s assets.
Accordingly, on September 9, 2024, Salem Five Cents delivered a letter (the “Termination Letter”) to the Company that stated that, effective August 26, 2024 (the “Termination Date”), Salem Five Cents terminated all obligations under the Loan Agreement and the Demand Note. The Termination Letter further stated that the Loan Agreement and the Demand Note and any related loan documents shall be considered no longer in force or effect. The Company had no funds drawn on the Revolving Line of Credit on the Termination Date.
Operating Lease Agreement
On January 10, 2025, the Company entered into a seven-year lease agreement for new office space in North Quincy, Massachusetts. The Company’s existing lease agreement for its office space expires May 31, 2025. The new lease term begins on June 1, 2025 and expires on May 31, 2032 with an option to extend the lease an additional five years. The lease contains an initial base rent of $21 per month with 2.2% - 2.5% annual escalations, plus a percentage of taxes and operating expenses incurred by the lessor in connection with the ownership and management of the property.
SIGNATURE
Pursuant to the requirements of Section 13 or 15(d) of the Securities Exchange Act of 1934, the registrant has duly caused this report to be signed on its behalf by the undersigned, thereunto duly authorized.
| Date: January 22, 2025 | STRAN & COMPANY, INC. |
| | |
| | /s/ Andrew Shape |
| | Name: | Andrew Shape |
| | Title: | Chief Executive Officer and President |
| | (Principal Executive Officer) |
86
iso4217:USD xbrli:shares