Q1 2024 Shareholder Letter | © 2024 Rivian. All rights reserved. | 2 |
During the first quarter of 2024, we unveiled our new midsize platform (“MSP”) with R2, R3, and R3X and we’re pleased with the reaction they received. Distinctly Rivian in terms of performance, capability, and usability, R2, R3, and R3X address the largest consumer segment of midsize SUV and crossover vehicles. We also announced that we will start R2 production in Normal which we expect to drive greater capital efficiency with over $2.25 billion of savings from plan, enable production to start in the first half of 2026, and reduce risk to launch the platform and associated ramp. We believe that the operating plan for our Normal factory at 215,000 units of annual production while executing against our cost efficiency roadmap will allow Rivian to generate positive free cash flow excluding growth capital investments in new production capacity and tooling. Rivian produced 13,980 vehicles and delivered 13,588 vehicles during the first quarter of 2024. These results exceeded our outlook and help establish a strong foundation for the remainder of the year as we focus on driving continued demand and enhancing the customer experience, delivering greater cost downs and plant efficiencies, progressing R2 development, and driving towards profitability. The R1S was the fourth best-selling electric vehicle in the US during the first quarter of 20241, the best-selling electric vehicle in the US above $70,0001, and the best-selling large luxury SUV in California across both electric and combustion engine vehicles2. Amazon and Rivian remain focused on bringing 100,000 Rivian electric delivery vans (“EDV”) to the road, which will help save Amazon millions of metric tons of carbon per year. Rivian is also excited to help the broader commercial vehicle market to reduce emissions in the transition to electric vehicles with our state-of-the-art vehicle. The Rivian Commercial Van (“RCV”) is designed from the ground up prioritizing safety, driver comfort, and sustainability. 1 Data source: J.D. Power PIN retail 2 Data source from Experian Automotive. California Auto Outlook, published by Auto Outlook, Inc. on behalf of the California New Car Dealers Association |
Q1 2024 Shareholder Letter | © 2024 Rivian. All rights reserved. | 3 |
Results for the first quarter of 2024 reflect continued progress against our key value drivers: | |||||
Focus on demand generation and enhancing the customer experience: We have seen a positive reaction to our demand generating and brand awareness strategies implemented during the first quarter. We recently launched R1S leasing and grew the number of states with this offering. Additionally, the introduction of the Standard Range R1 variant brought more accessible pricing to the R1 platform. While the broader vehicle market is still experiencing challenges, we are encouraged by the early results of our initiatives and have confidence in our 2024 delivery outlook. Optimize operational efficiencies: The changes being implemented on the R1 manufacturing line during the second quarter plant retooling upgrade are designed to deliver greater plant efficiency with the R1 line rate expected to improve by approximately 30%. We expect greater plant efficiency will result in lower conversion costs per vehicle during the second half of 2024. Develop R2 and core technologies: On March 7th, Rivian unveiled the new MSP product lines with R2, R3, and R3X. The MSP vehicles are expected to offer amazing performance, utility, and range at a significantly lower price point than our flagship R1. It is expected to position Rivian to expand its addressable market by opening up new, global segments. MSP is designed to build upon our industry-leading technology platform as well as focus on reducing manufacturing complexity. Drive towards profitability: The first quarter of 2024 gross profit per vehicle delivered was $(38,784), which includes $15,455 of depreciation and $1,693 of stock-based compensation expense. Our results were negatively impacted by $9,346 per unit delivered, primarily related to various supplier and other costs incurred in advance of the new technology changes and parts integration into the R1 platform as part of our cost of revenue efficiency initiatives. As a result of the retooling upgrade, we expect significant improvement in the material, depreciation, and conversion cost of our vehicles and remain confident in our path to achieving modest gross profit in the fourth quarter of this year. Further, we are focused on extending our cash runway by managing operating and capital expenditures and optimizing our working capital. We want to thank our employees, customers, suppliers, partners, communities, and shareholders for their continued support of our vision. |
Q1 2024 Shareholder Letter | © 2024 Rivian. All rights reserved. | 4 |
Building Demand and Scaling Our Go-to-Market Operations We are focused on improving our customer experience and continuing to generate demand for our vehicles. We believe that our direct relationship with our customers is a long-term competitive differentiator. In the first quarter of 2024, we benefited from increased top of funnel and brand awareness with the unveil of R2, R3, and R3X and introduced marketing campaigns to support sales initiatives such as leasing and the introduction of our Standard Range R1. We grew demo drives which allow potential customers the opportunity to experience our vehicles, their capabilities, safety features, and technology and has proven to be an effective demand generation strategy. In the first quarter of 2024, we hosted over 28,000 demo drives, a 91% increase versus the fourth quarter of 2023. Our physical footprint continues to expand across the United States and Canada to support the sales, marketing, and service of Rivian vehicles. We currently have 11 spaces which serve as an invitation to current and potential customers to get up close with our vehicles, software, and accessories. In the first quarter of 2024, we have hosted over 257,000 visitors, an 8% increase versus the fourth quarter of 2023. In addition, we currently have 59 service centers operational across North America and Germany (for our European EDV deliveries) in addition to over 530 mobile service vans which handle the majority of our service events. In addition to the vehicle service these centers provide, they also represent great customer facing spaces for hosting demo drives and other engaging brand and sales opportunities. |
Q1 2024 Shareholder Letter | © 2024 Rivian. All rights reserved. | 5 |
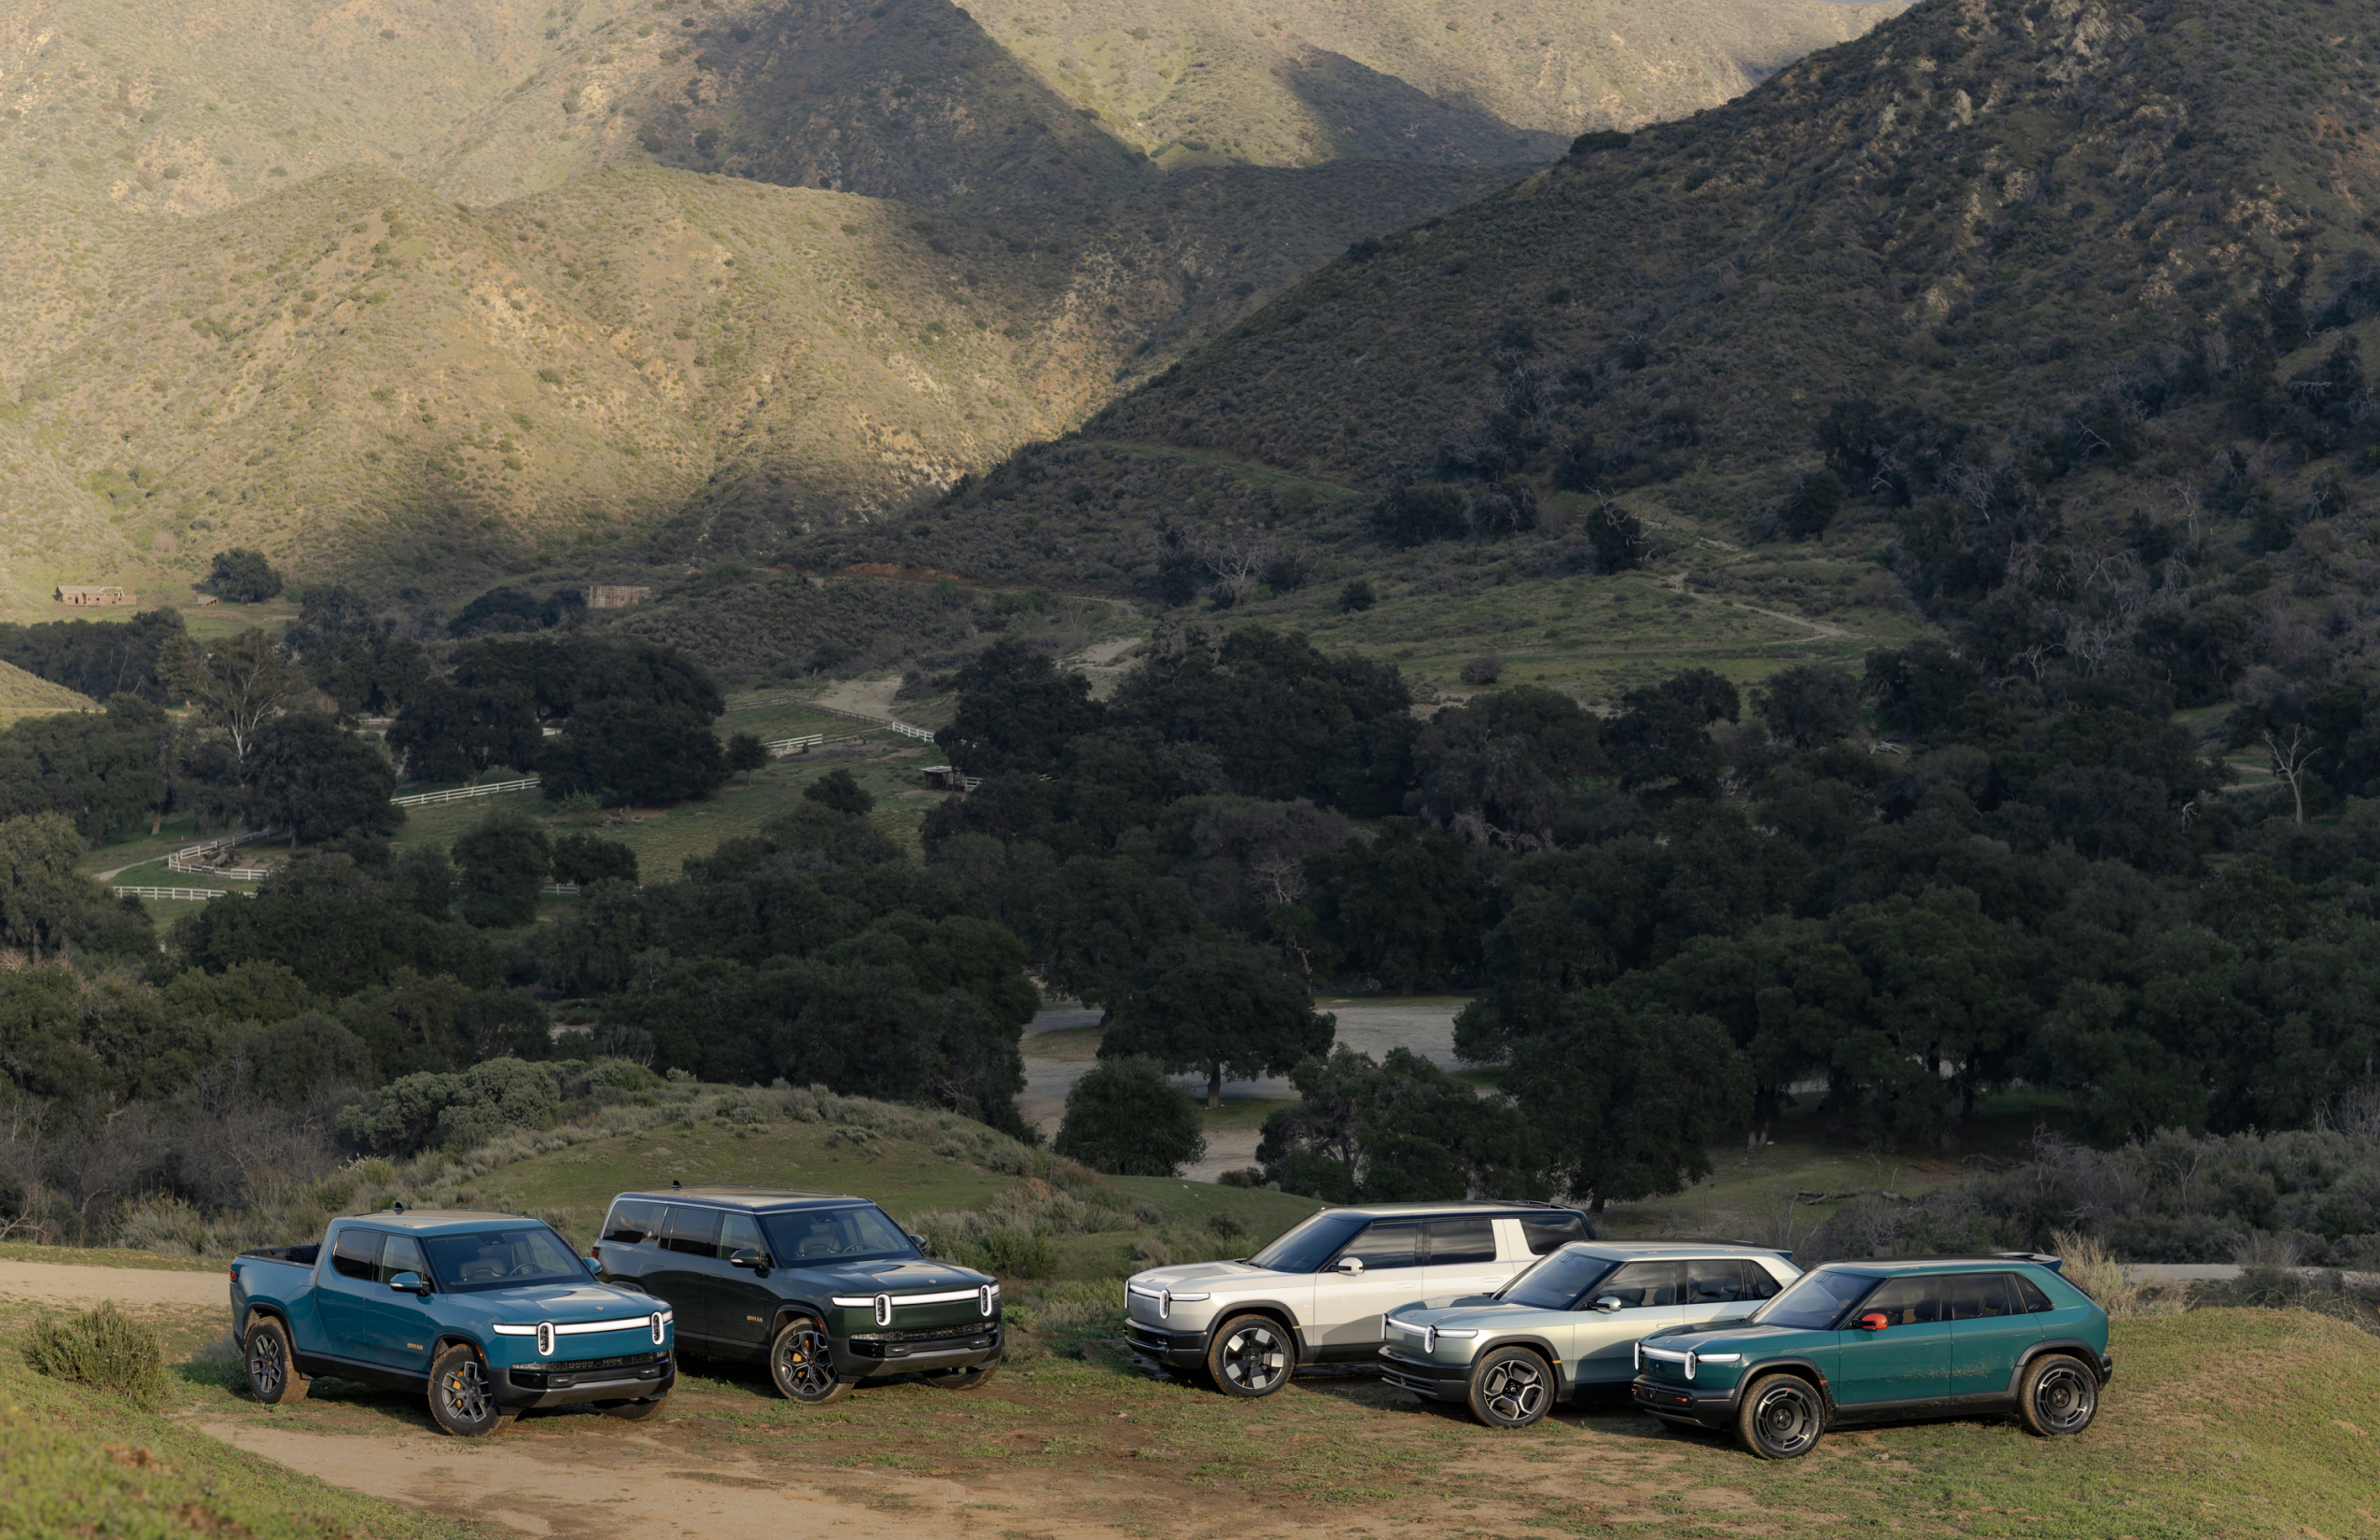
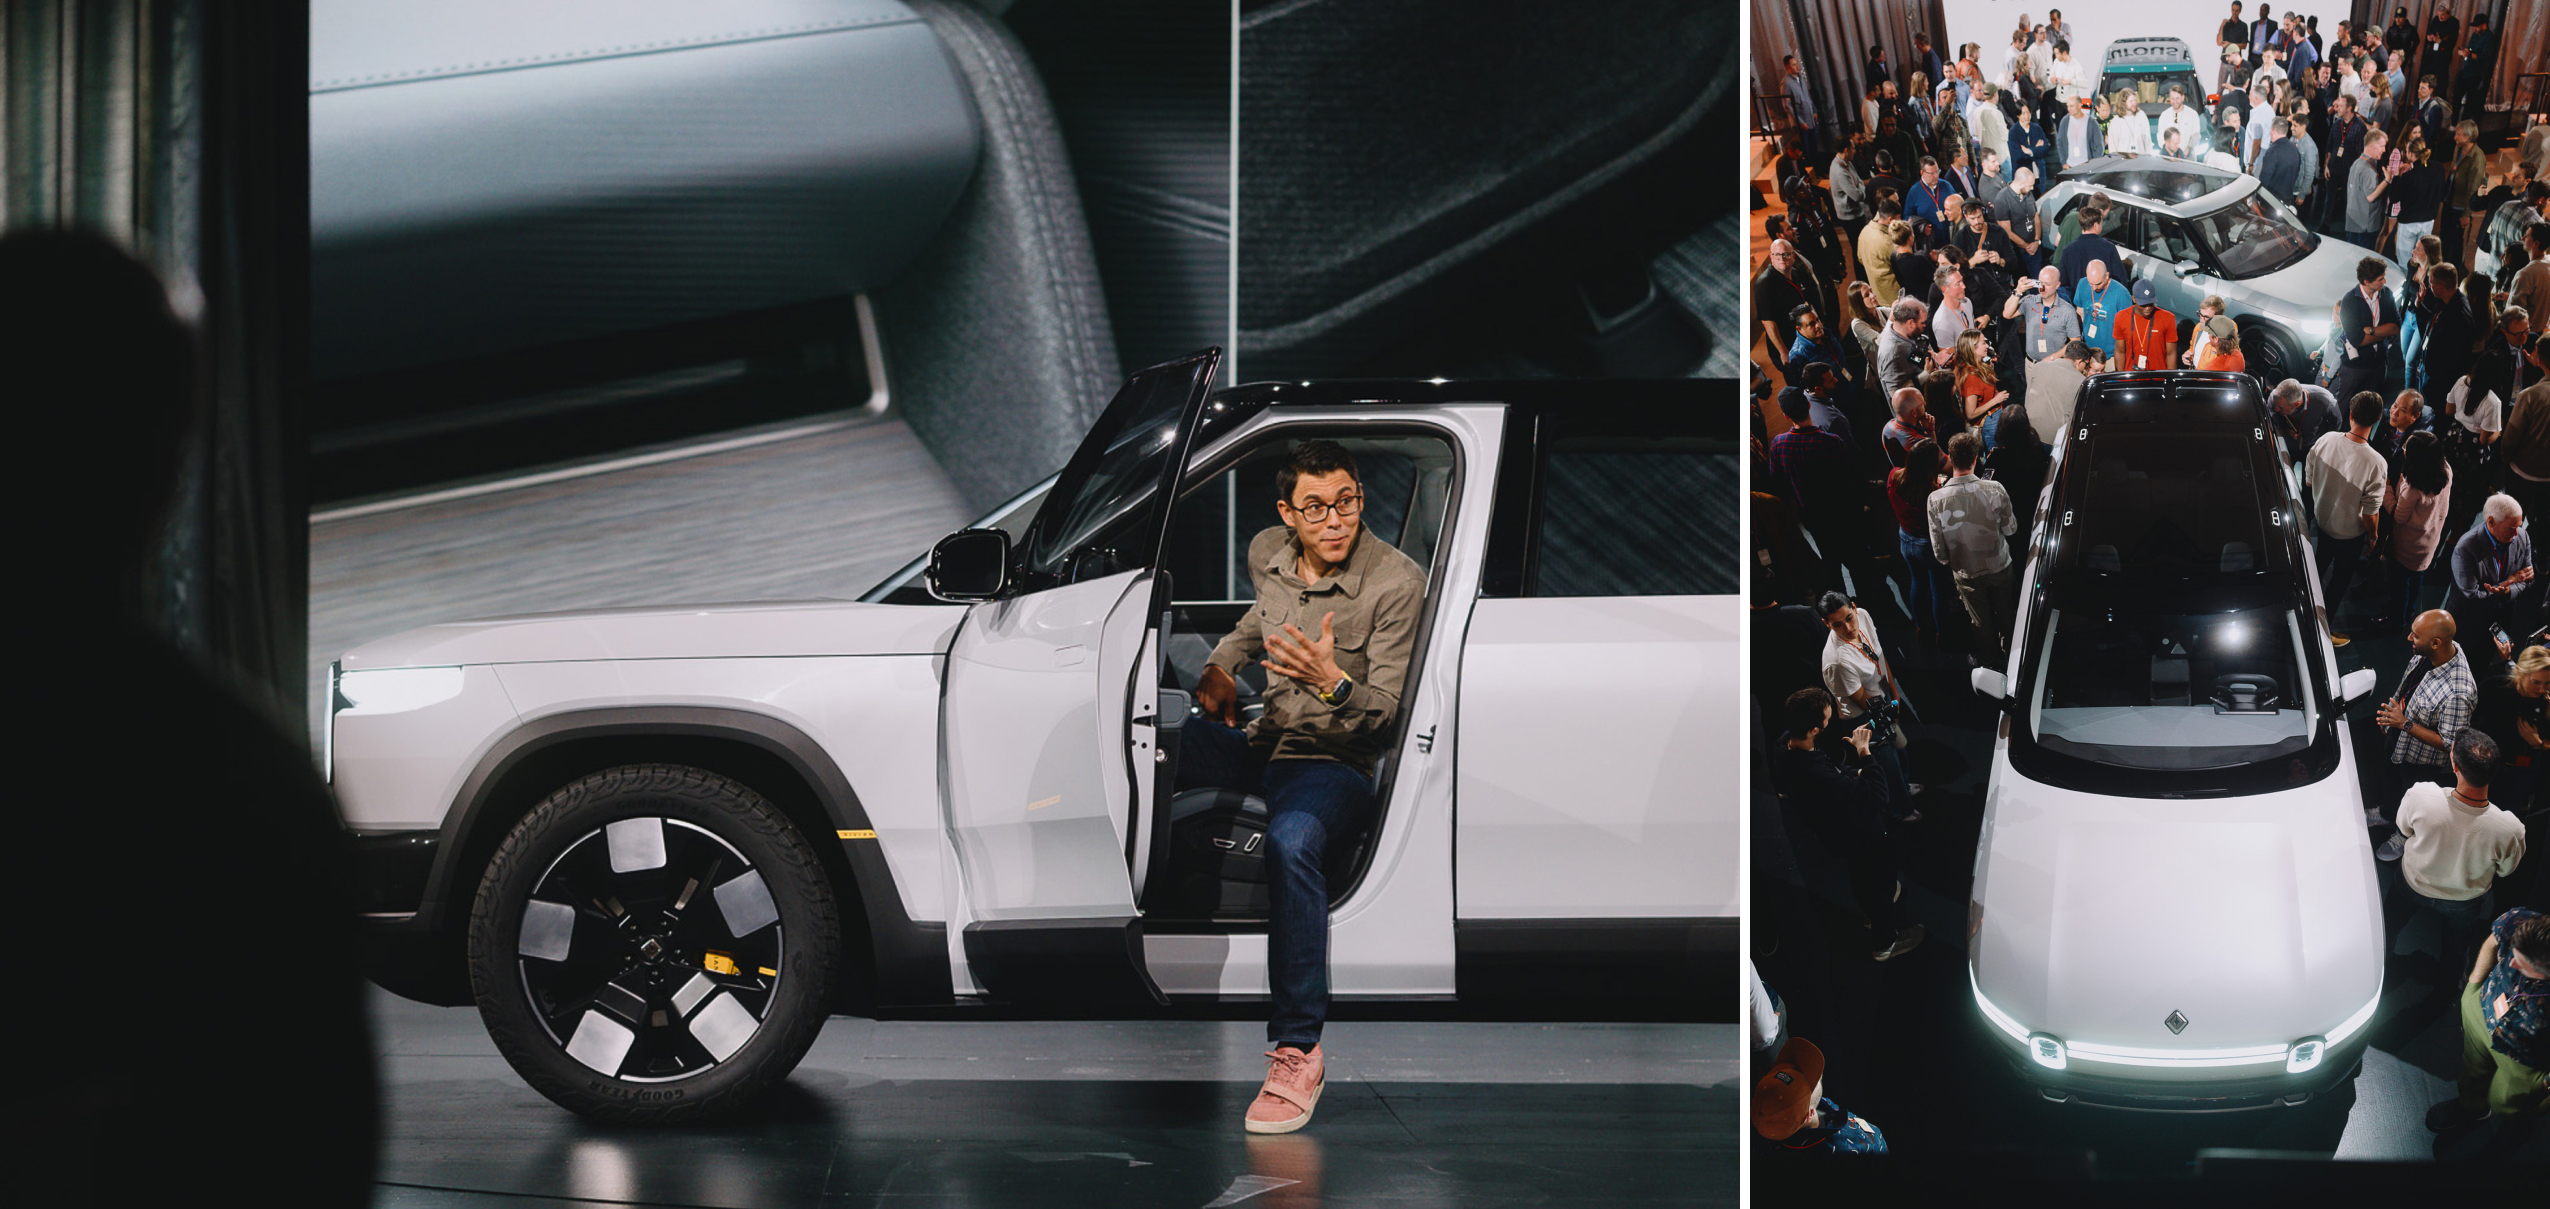
R2, R3, and R3X Reveal 
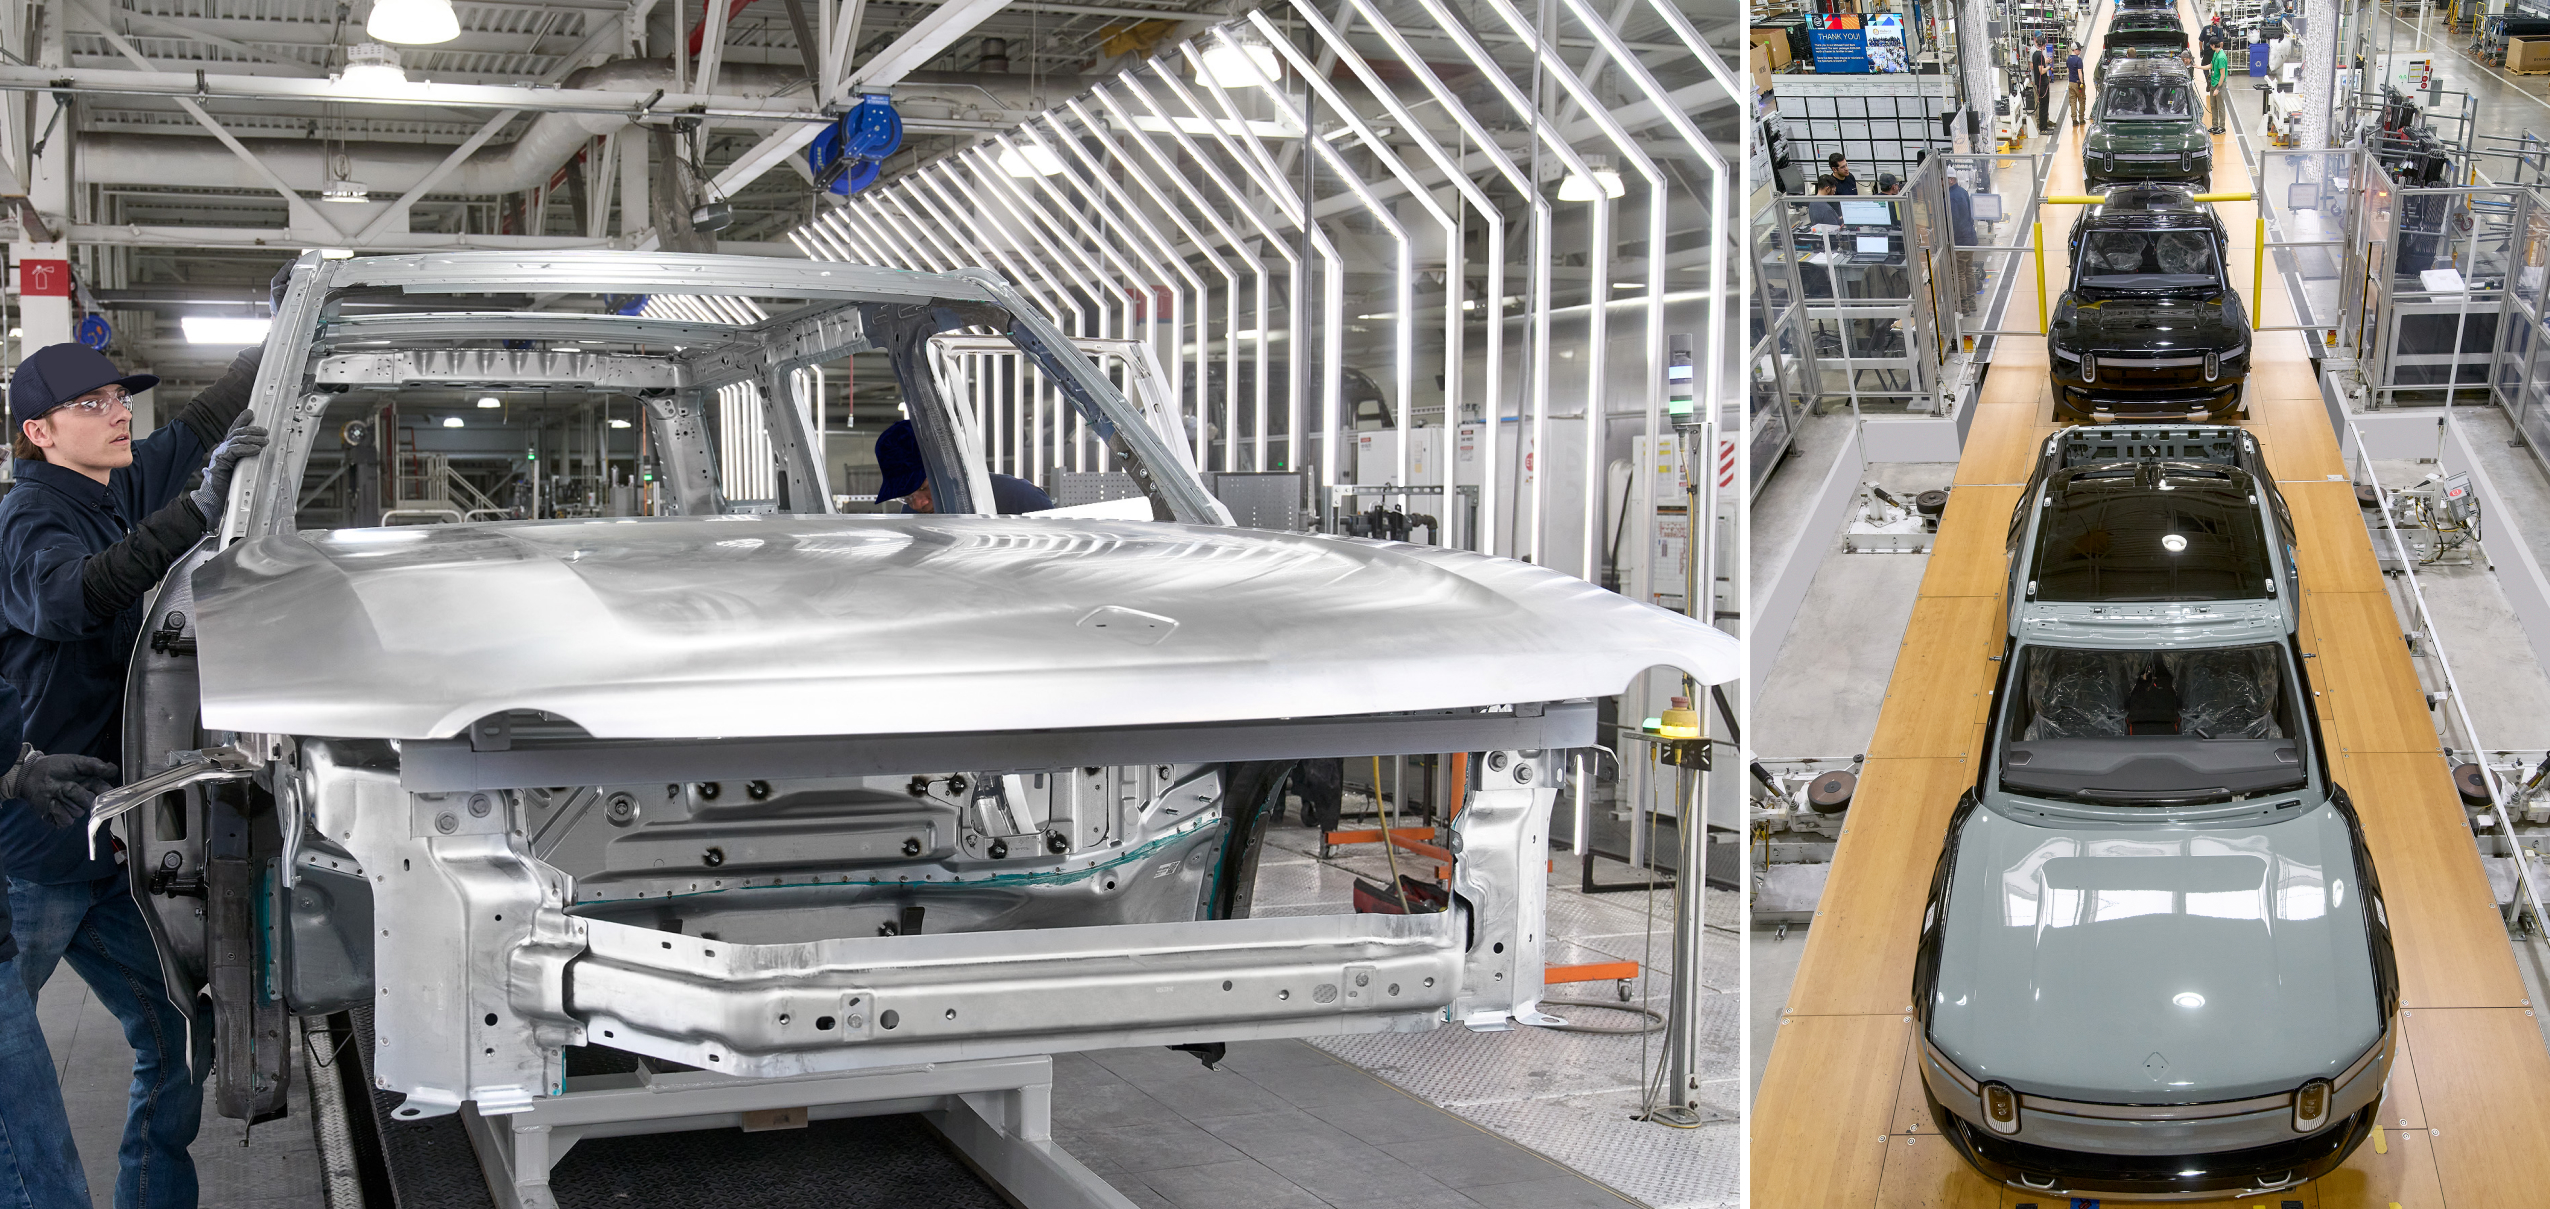
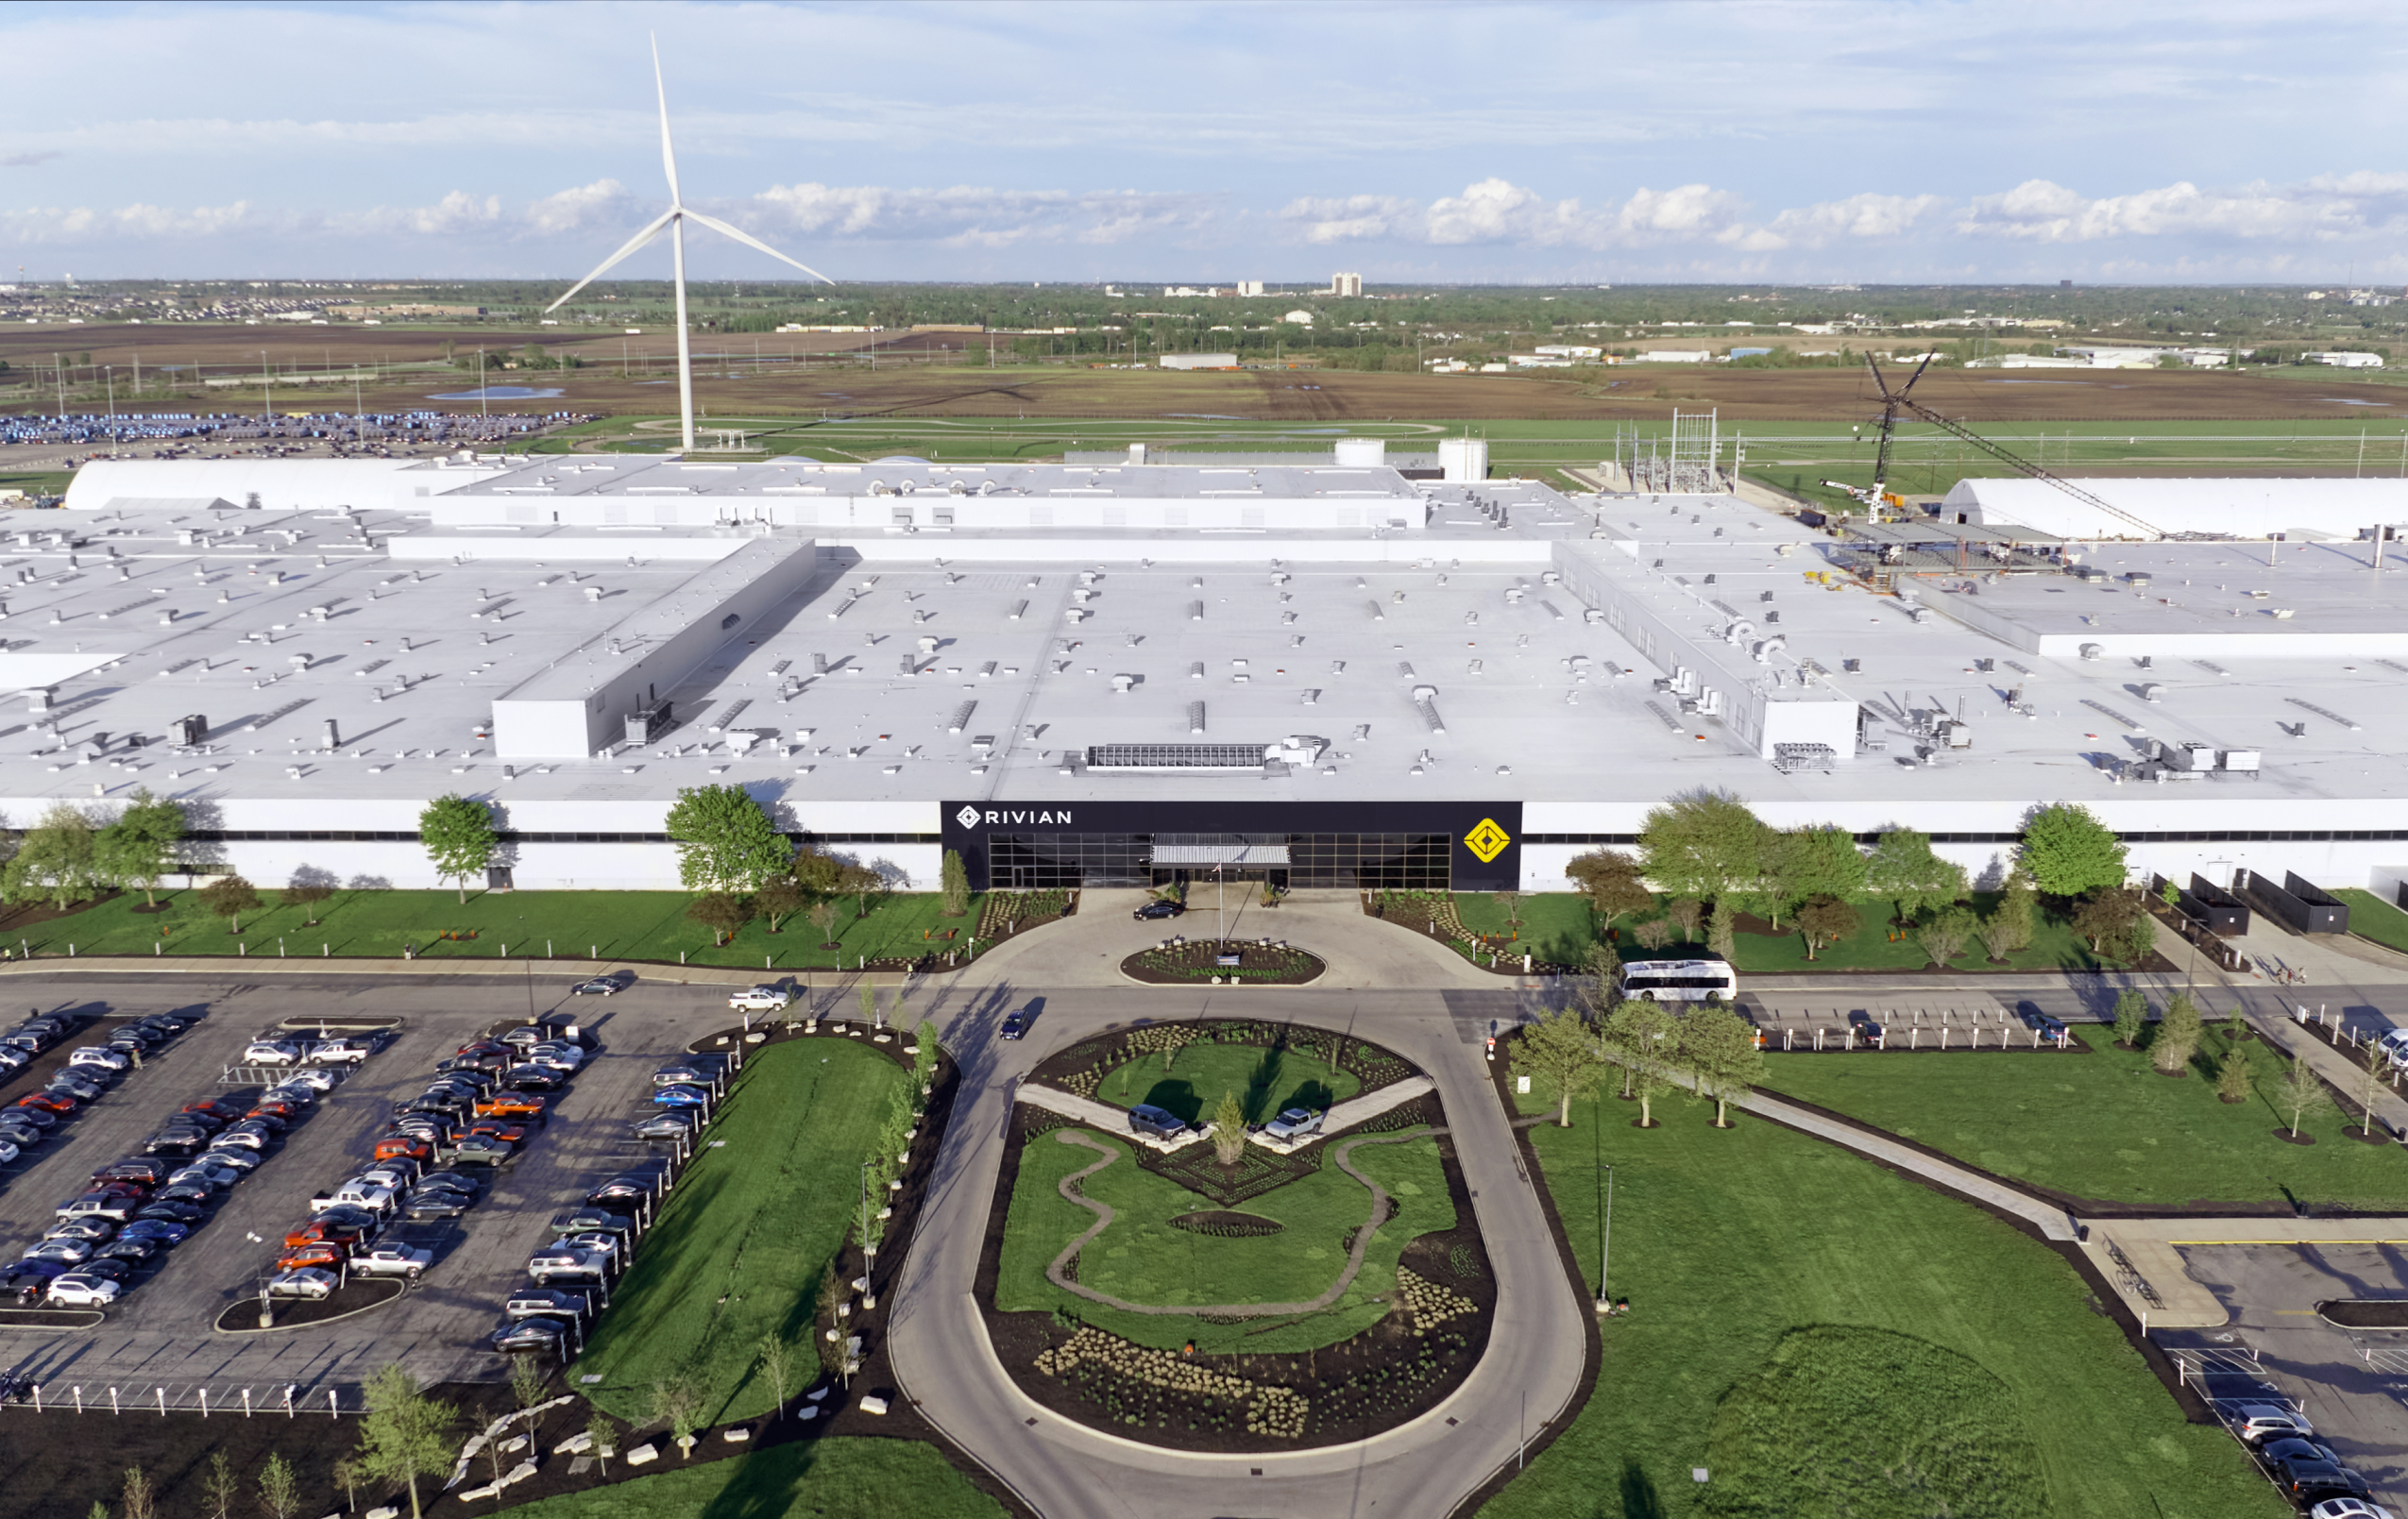
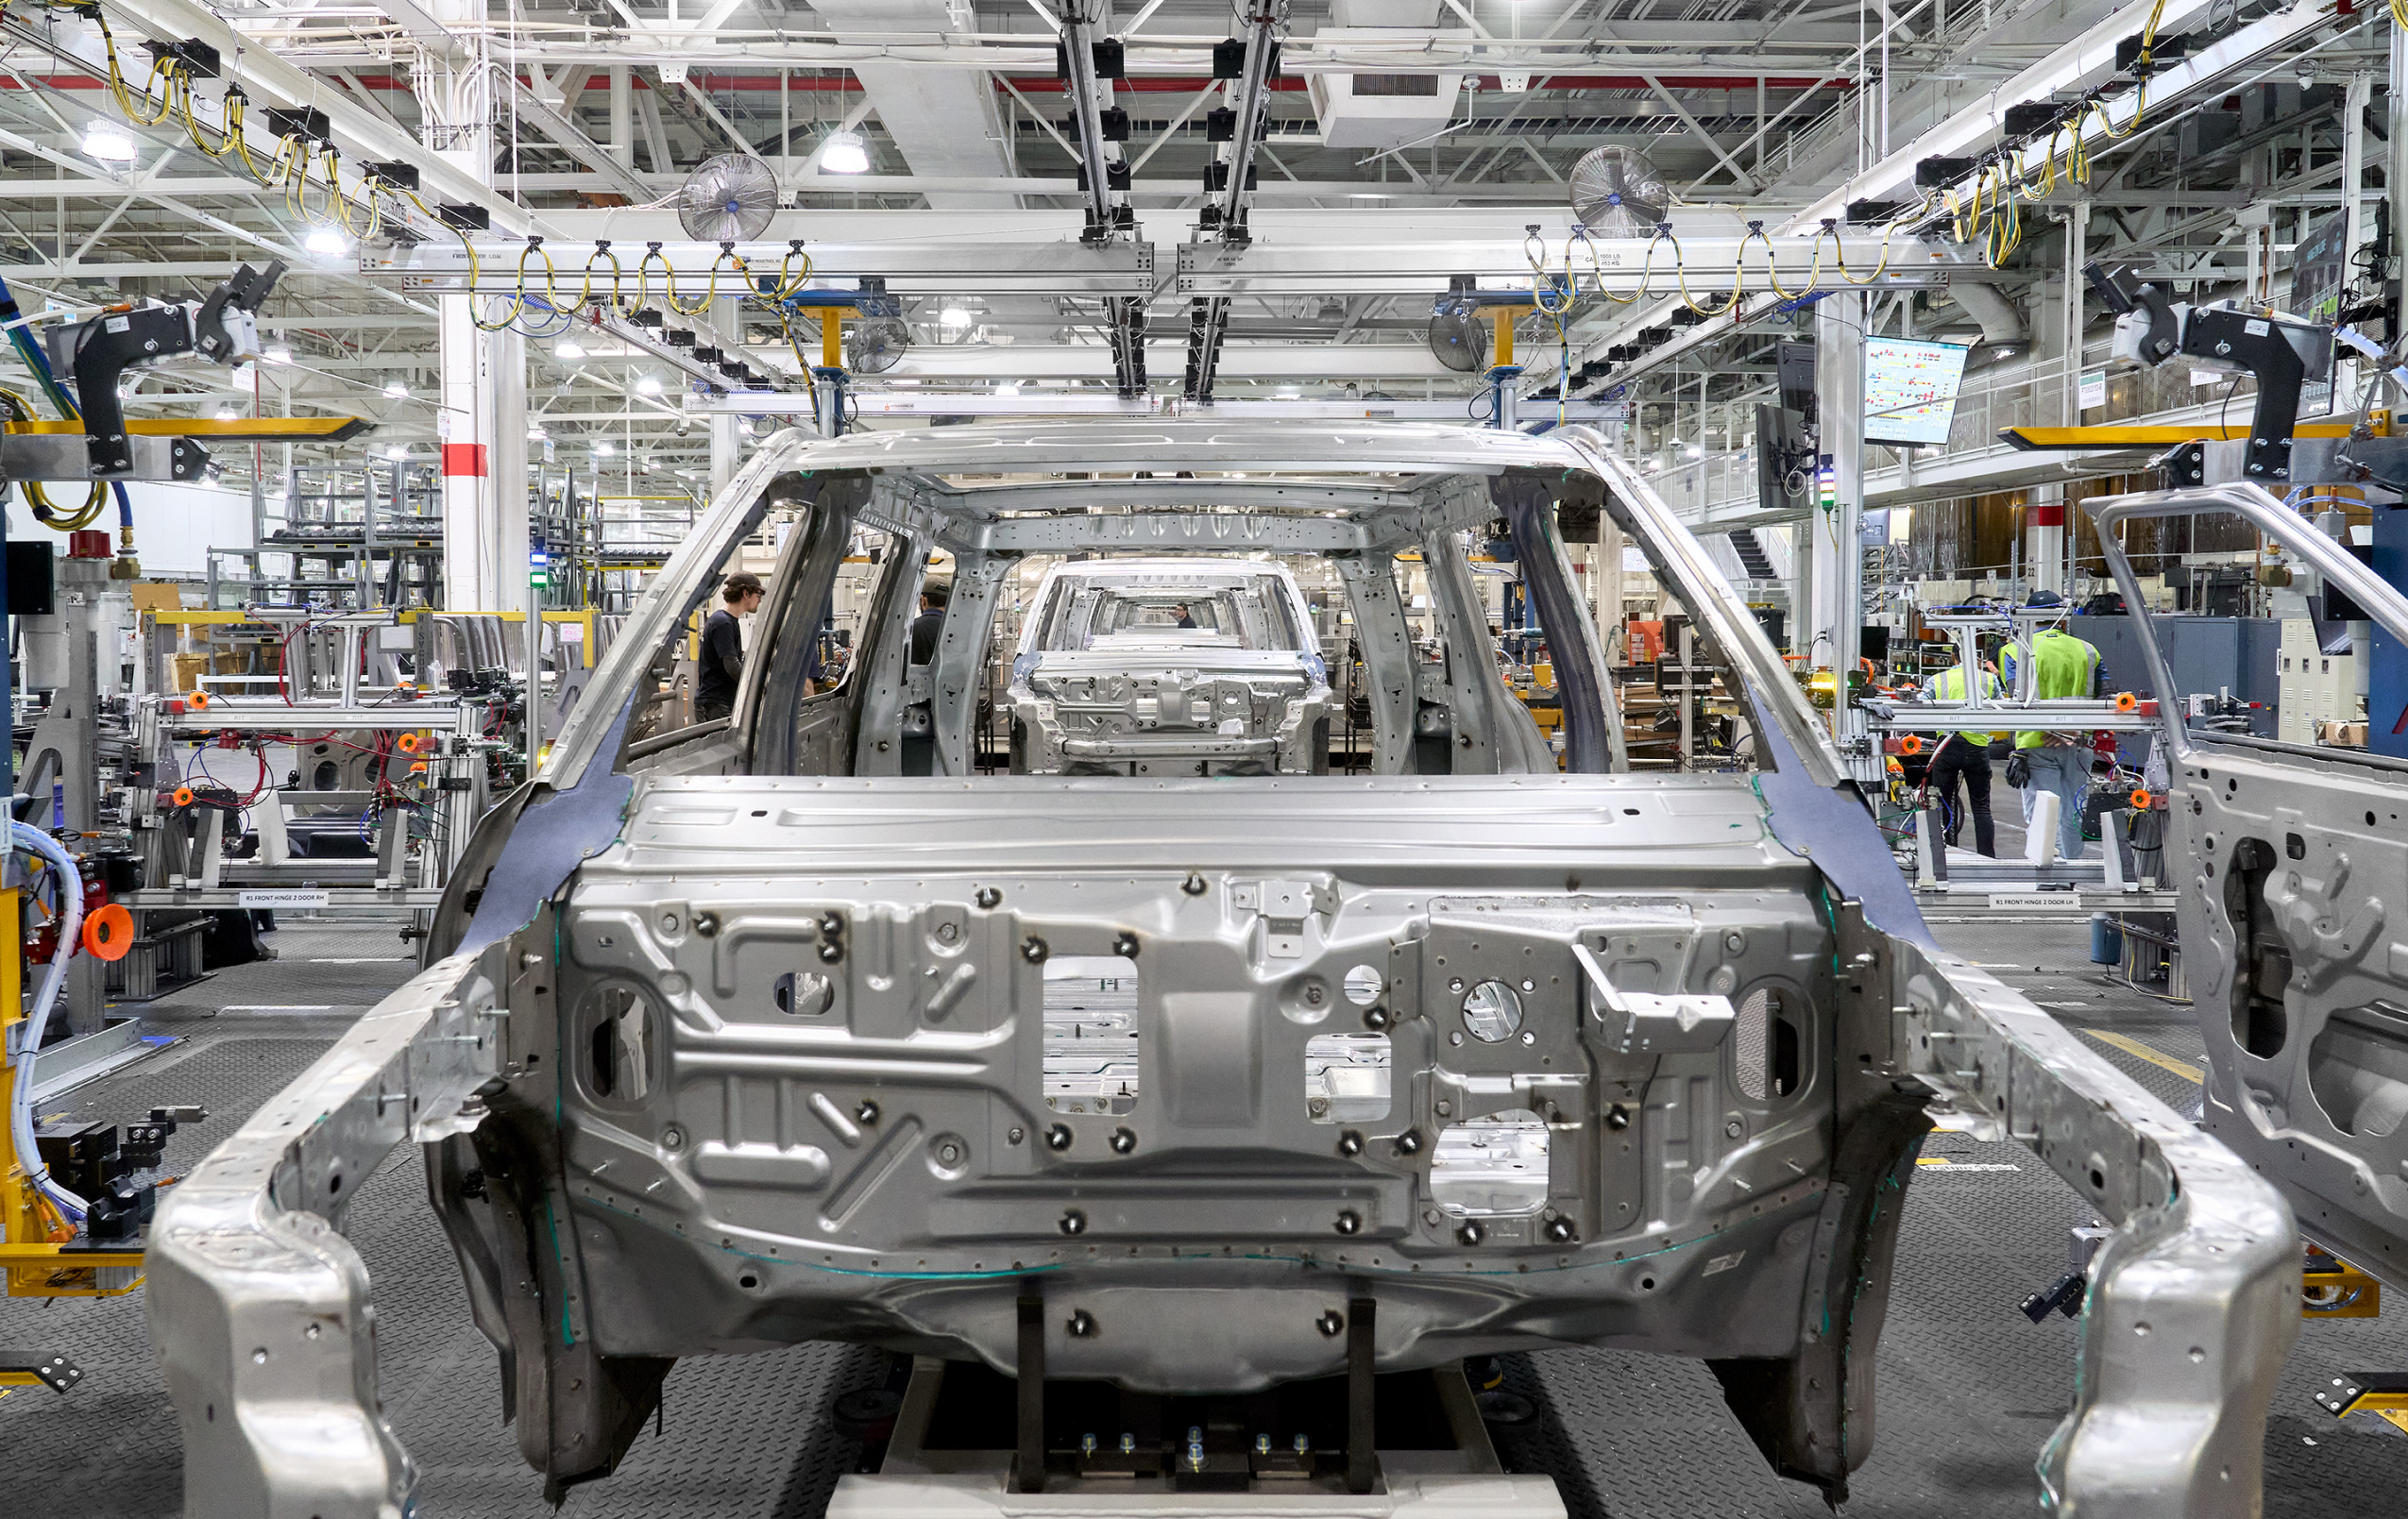
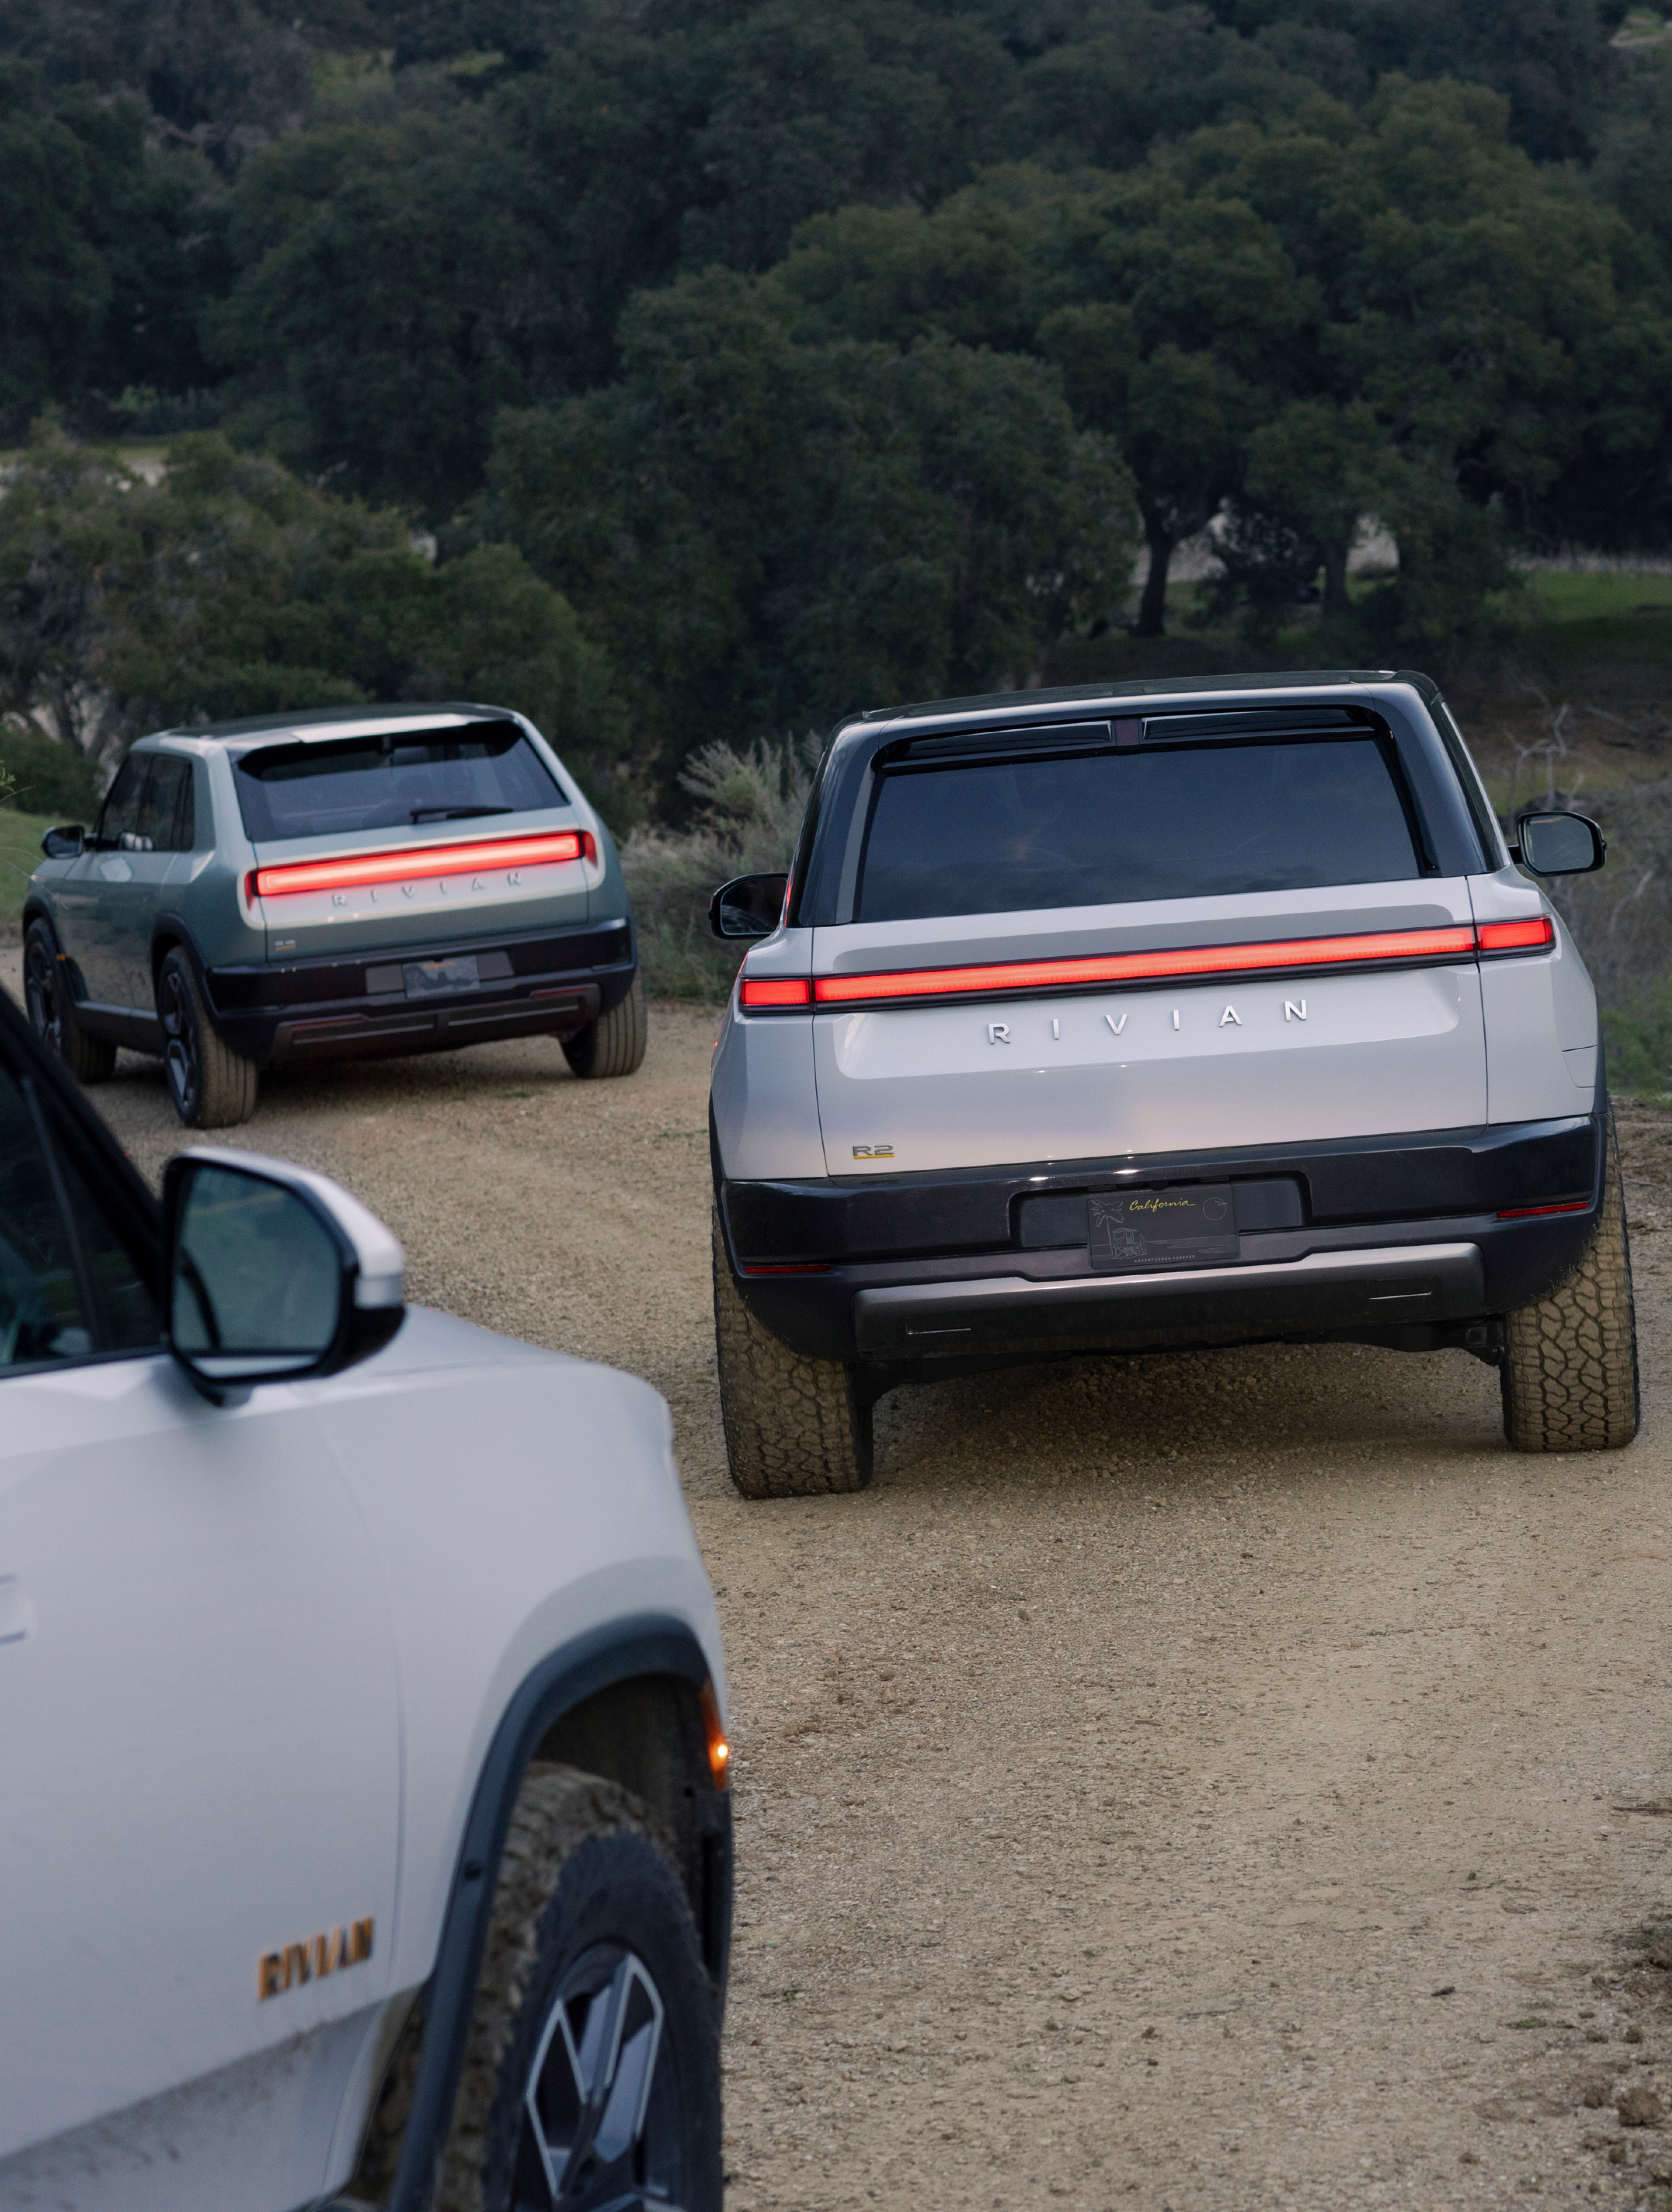
On March 7th, we unveiled our new midsized platform, which underpins our R2 and R3 product lines. Designed to bring more adventure to more people, R2, R3, and R3X are expected to deliver amazing performance, utility, and range at a significantly lower price point than our flagship R1. R2 is our versatile new midsize SUV with room for five people. R2 captures the essence of Rivian – it’s built for adventures as well as everyday use with its exceptional utility, performance, and capability. R2 features two battery sizes, with the larger pack achieving over 300 miles of range on a single charge while offering 0-60 mph acceleration in under 3 seconds for the quickest powertrain configuration. The price starts at around $45,000 with production slated to begin in the first half of 2026. R3 is our midsize crossover. This unique vehicle is tidy on dimensions but delivers big in terms of performance, off-road capability, passenger comfort, and storage. R3X is a performance variant of R3 offering even more dynamic abilities both on and off road. R3 demonstrates the scalability of Rivian’s brand across different form factors while continuing to be immediately recognizable. R3 and R3X will be priced below R2 and deliveries will start after R2 to ensure a smooth launch and rapid ramp of R2. As part of our MSP, R3 has been designed with a high level of commonality with R2. The R2, R3, and R3X are expected to be available internationally following its North American launch. We believe R2, R3, and R3X will be foundational to Rivian’s long-term growth and profit potential. It positions Rivian to address new, global market segments and is designed to build upon our industry-leading technology platform as well as our focus on driving down manufacturing complexity and cost efficiency. We expect MSP to benefit from the key vertically integrated technologies developed for R1 including our in-house software stack, propulsion technology, network architecture and vehicle electronics. In addition, the platform has been designed around cost efficiency, with a focus on part consolidation or elimination. This includes use of large, high pressure die castings, a structural battery pack, and simplified closure systems. |
Q1 2024 Shareholder Letter | © 2024 Rivian. All rights reserved. | 6 |
R2 Launch in Normal In March, we also announced the formative decision to start production of R2 in our existing Normal, Illinois manufacturing facility. This offers several important benefits including significant cost savings, acceleration of launch timeline, increase in Normal capacity, and improved visibility into cash-on-hand to fund operations. We believe launching R2 in Normal will create long-term value by driving greater capital efficiency and reducing risk to the R2 launch and associated ramp. Improved capital efficiency: Total savings expected to be over $2.25 billion as compared to the original forecast of launching the first line of R2 production at Rivian’s Georgia site. The savings are expected to come from capital expenditures, product development investment, and supplier sourcing opportunities. Improved cash visibility: Cash, cash equivalents, and short-term investments expected to be sufficient to fund operations through the start of R2 production. Reduced risk to launch: The R2 production ramp will leverage the core R1 technologies and the manufacturing and operations team in Normal responsible for the significant growth and improvement of the R1 platform. Total expected Normal capacity following R2 launch and plant changes: 215,000 units of total annual capacity across R1T, R1S, EDV, RCV, and R2. This includes up to 155,000 units of R2. Incremental to the over $2.25 billion in expected savings, we recently announced an incentive package from the state of Illinois with a value of up to $827 million. We are excited to grow our community in Normal and continue our partnership with the state of Illinois. |
Q1 2024 Shareholder Letter | © 2024 Rivian. All rights reserved. | 7 |
Update on Normal Plant Retooling Upgrade We successfully completed a several week plant shutdown to retool the Normal plant and introduce new technologies and cost-oriented material changes into our R1 vehicle platform. The plant retooling upgrade also made significant changes that are expected to optimize our manufacturing processes. We integrated nearly 600 new or modified robots, which we believe will enable the R1 line to run more efficiently. In addition, we improved the flow of materials and inventory within the plant. These changes are expected to improve cycle time and utilization. Based on early indications, we see significant progress on the R1 material cost optimization efforts following the plant retooling upgrade. |
Q1 2024 Shareholder Letter | © 2024 Rivian. All rights reserved. | 8 |
Charging Access to abundant, high-quality fast charging is pivotal for mass electric vehicle adoption. During the first quarter of 2024, we made notable progress improving the experience of owning a Rivian by growing the Rivian Adventure Network (“RAN”) and enabling access to over 15,000 Tesla Superchargers. As of the first quarter of 2024, we had over 470 RAN chargers across 77 locations. To date in 2024, RAN chargers have demonstrated an uptime of over 98%. We also recently shared more details about our upcoming open RAN charger which is built from the ground up to support nearly every electric vehicle sold in North America today. Opening the network later this year enables other electric vehicle drivers to benefit from our reliable charging sites, allows Rivian to benefit from the fixed costs associated with each charging site which we expect will turn our RAN into a profit center over time, and allows Rivian to meet one of the key requirements to apply to access the $7.5 billion available government grants associated with expanding domestically manufactured fast chargers across the country. In addition to RAN, existing owners will receive NACS DC adapters providing them access to over 15,000 Tesla Superchargers. We have provided a seamless digital experience on the Tesla Supercharger network. Owners can plug in and charge with automatic billing without opening an app. When planning trips in the Rivian mobile app or in-vehicle navigation, compatible Superchargers show up with live availability, price information, and charging speeds listed and incorporated into routing. This quarter we released an OTA software feature introducing the Rivian Charging Score. This industry-first feature enables peace of mind for Rivian drivers by routing them to the most reliable chargers. |
Q1 2024 Shareholder Letter | © 2024 Rivian. All rights reserved. | 9 |
2024 Outlook We remain focused on ramping production coming out of our plant retooling upgrade and R1 technology integration. Thus far, consistent with our expectations, we have hit all major milestones associated with the plant retooling upgrade, and we are reaffirming our 2024 annual guidance provided during our fourth quarter and fiscal year 2023 earnings call of 57,000 total units of production and $(2,700) million in adjusted EBITDA. Due to moving the start of R2 production to Normal, we expect to be able to significantly reduce the capital expenditures required to launch R2. Because of this we are lowering our capital expenditures guidance to $1,200 million, a reduction of $550 million. We also expect savings from moving the R2 launch to Normal to impact 2025 and 2026. |
Q1 2024 Shareholder Letter | © 2024 Rivian. All rights reserved. | 10 |
Revenues | Total revenues for the first quarter of 2024 were $1,204 million, primarily driven by the delivery of 13,588 vehicles. Total revenues from the sale of regulatory credits were de minimis for the quarter. | ||||
Gross Profit | We generated negative gross profit of $(527) million for the first quarter of 2024 as compared to $(535) million for the first quarter of 2023. Cost of revenues for the first quarter of 2024 includes $171 million of costs as part of our cost of revenue efficiency initiatives primarily related to liabilities incurred during the three months ended March 31, 2024 with suppliers and accelerated depreciation in advance of the updates being made to our Normal Factory during the plant retooling upgrade. Gross profit losses decreased year-over-year, primarily due to the increased vehicle production and deliveries, reductions in materials costs, and higher average selling prices. During April 2024, we shut down our Normal Factory to introduce new technologies into the R1 platform and retool the R1 production line. We expect these upgrades to further reduce the material and conversion cost of our vehicles as we exit 2024; however, in the near-term we expect the planned plant retooling upgrade to negatively impact our vehicle production and cost of revenues as a result of the direct downtime and less efficient absorption of labor, overhead, and depreciation associated with lower volume. The inventory as of March 31, 2024 was written down by $328 million for LCNRV. Additionally there were LCNRV losses related to firm purchase commitments of $45 million. We recorded a $150 million charge to reflect the LCNRV of inventory and losses on firm purchase commitments as of March 31, 2024. We expect the amount of LCNRV write-downs and losses on firm purchase commitments to decrease over time, which we anticipate will have the effect of increasing net inventory balances, and decreasing cost of revenues per vehicle. Furthermore, we forecast reaching positive gross profit in the fourth quarter of 2024 and therefore expect that by the end of 2024, we will not have material LCNRV inventory charges associated with goods manufactured at our Normal Factory. The key drivers of our path to positive gross profit include reducing material costs, conversion costs, and depreciation expenses, as well as increasing our revenues per delivered unit through the growth of regulatory credit, software and services, and remarketing revenues. |
Q1 2024 Shareholder Letter | © 2024 Rivian. All rights reserved. | 11 |
Operating Expenses and Operating Loss | Total operating expenses in the first quarter of 2024 grew to $957 million, as compared to $898 million in the same period last year. In the first quarter of 2024, we recognized non-cash, stock-based compensation expense within operating expenses of $210 million as compared to $165 million in the first quarter of 2023 and depreciation and amortization expense within operating expenses of $70 million as compared to $58 million in the first quarter of 2023. Research and development (“R&D”) expense in the first quarter of 2024 was $461 million, as compared to $496 million in the same period last year. The decrease was primarily due to a $52 million decrease in engineering, design, and development costs related to the R1 platform design and technology upgrades and $25 million decrease in payroll and related expenses for lower headcount and restructuring activities partially offset by a $40 million increase in stock-based compensation primarily related to increased grants in 2023. Selling, general, and administrative (“SG&A”) expense in the first quarter of 2024 was $496 million, as compared to $402 million in the same period last year. The increase was primarily due to a $32 million increase in payroll and related expenses resulting predominantly from an increase in service and sales headcount, $27 million increase in depreciation and amortization as well as other miscellaneous operating expenses to support go-to-market operations and corporate initiatives. We experienced a loss from operations in the first quarter of 2024 totaling $(1,484) million, as compared to $(1,433) million in the same period last year. | ||||
Adjusted Operating Expenses¹ | Adjusted R&D¹ for the first quarter of 2024 was $319 million as compared to $379 million for the same period last year. Adjusted SG&A¹ for the first quarter of 2024 was $358 million as compared to $296 million for the same period last year. Total adjusted operating expenses¹ for the first quarter of 2024 was $677 million as compared to $675 million for the same period last year. | ||||
Net Loss | Our net loss for the first quarter of 2024 was $(1,446) million as compared to $(1,349) million for the same period last year. | ||||
Adjusted EBITDA¹ | Adjusted EBITDA¹ for the first quarter of 2024 was $(798) million as compared to $(1,020) million for the same period last year. | ||||
Net Cash Used in Operating Activities | Net cash used in operating activities for the first quarter of 2024 was $(1,269) million as compared to $(1,521) million for the same period last year. | ||||
Capital Expenditures | Capital expenditures for the first quarter of 2024 were $254 million, flat as compared to $283 million for the same period last year. | ||||
Liquidity and Free Cash Flow¹ | We ended the first quarter of 2024 with $7,858 million in cash, cash equivalents, and short-term investments. Including the capacity under our asset-based revolving-credit facility, we ended the first quarter of 2024 with $9,053 million of total liquidity. We define free cash flow as net cash used in operating activities less capital expenditures. The smaller year-over-year net cash used in operating activities discussed above resulted in negative free cash flow¹ of $(1,523) million for the first quarter of 2024 as compared to $(1,804) million for the same period last year. We continued to take steps to further strengthen our balance sheet as we develop our next vehicle platform, R2, and begin long lead time equipment purchases for our plant in Normal. | ||||
¹A reconciliation of non-GAAP financial measures to the most comparable GAAP measure is provided later in this letter. |
Q1 2024 Shareholder Letter | © 2024 Rivian. All rights reserved. | 12 |
Webcast | We will host an audio webcast to discuss our results and provide a business update at 2:00pm PT / 5:00pm ET on Tuesday, May 7, 2024. The link to the webcast will be made available on our Investor Relations website at rivian.com/investors. After the call, a replay will be available at rivian.com/investors for four weeks. | ||||
Q1 2024 Shareholder Letter | © 2024 Rivian. All rights reserved. | 13 |
Quarterly Financial Performance | ||||||||||||||
(in millions, except production, delivery, gross margin, gross profit per unit delivered, and per share amounts) | ||||||||||||||
(unaudited) |
Three Months Ended | ||||||||||||||||||||||||||||||||
March 31, 2023 | June 30, 2023 | September 30, 2023 | December 31, 2023 | March 31, 2024 | ||||||||||||||||||||||||||||
Production | 9,395 | 13,992 | 16,304 | 17,541 | 13,980 | |||||||||||||||||||||||||||
Delivery | 7,946 | 12,640 | 15,564 | 13,972 | 13,588 | |||||||||||||||||||||||||||
Revenues | $ | 661 | $ | 1,121 | $ | 1,337 | $ | 1,315 | $ | 1,204 | ||||||||||||||||||||||
Gross profit | $ | (535) | $ | (412) | $ | (477) | $ | (606) | $ | (527) | ||||||||||||||||||||||
Gross margin | (81) | % | (37) | % | (36) | % | (46) | % | (44) | % | ||||||||||||||||||||||
Gross profit per unit delivered | $ | (67,329) | $ | (32,595) | $ | (30,648) | $ | (43,372) | $ | (38,784) | ||||||||||||||||||||||
Research and development | $ | 496 | $ | 444 | $ | 529 | $ | 526 | $ | 461 | ||||||||||||||||||||||
Selling, general, and administrative | 402 | 429 | 434 | 449 | 496 | |||||||||||||||||||||||||||
Total operating expenses | $ | 898 | $ | 873 | $ | 963 | $ | 975 | $ | 957 | ||||||||||||||||||||||
Loss from operations | $ | (1,433) | $ | (1,285) | $ | (1,440) | $ | (1,581) | $ | (1,484) | ||||||||||||||||||||||
Net loss attributable to common stockholders, basic and diluted | $ | (1,349) | $ | (1,195) | $ | (1,367) | $ | (1,521) | $ | (1,446) | ||||||||||||||||||||||
Net loss per share attributable to Class A and Class B common stockholders, basic and diluted | $ | (1.45) | $ | (1.27) | $ | (1.44) | $ | (1.58) | $ | (1.48) | ||||||||||||||||||||||
Adjusted research and development (non-GAAP)¹ | $ | 379 | $ | 336 | $ | 346 | $ | 388 | $ | 319 | ||||||||||||||||||||||
Adjusted selling, general, and administrative (non-GAAP)¹ | 296 | 316 | 318 | 318 | 358 | |||||||||||||||||||||||||||
Total adjusted operating expenses (non-GAAP)¹ | $ | 675 | $ | 652 | $ | 664 | $ | 706 | $ | 677 | ||||||||||||||||||||||
Adjusted EBITDA (non-GAAP)¹,2 | $ | (1,020) | $ | (861) | $ | (902) | $ | (1,006) | $ | (798) | ||||||||||||||||||||||
Cash, cash equivalents, short-term investments, and restricted cash 3 | $ | 11,780 | $ | 10,202 | $ | 9,133 | $ | 9,368 | $ | 7,858 | ||||||||||||||||||||||
Net cash used in operating activities | $ | (1,521) | $ | (1,361) | $ | (877) | $ | (1,107) | $ | (1,269) | ||||||||||||||||||||||
Capital expenditures | (283) | (255) | (190) | (298) | (254) | |||||||||||||||||||||||||||
Free cash flow (non-GAAP)¹ | $ | (1,804) | $ | (1,616) | $ | (1,067) | $ | (1,405) | $ | (1,523) | ||||||||||||||||||||||
Depreciation and amortization expense | ||||||||||||||||||||||||||||||||
Cost of revenues | $ | 130 | $ | 160 | $ | 176 | $ | 195 | $ | 210 | ||||||||||||||||||||||
Research and development | 33 | 36 | 50 | 19 | 18 | |||||||||||||||||||||||||||
Selling, general, and administrative | 25 | 27 | 30 | 56 | 52 | |||||||||||||||||||||||||||
Total depreciation and amortization expense | $ | 188 | $ | 223 | $ | 256 | $ | 270 | $ | 280 | ||||||||||||||||||||||
Stock-based compensation expense | ||||||||||||||||||||||||||||||||
Cost of revenues | $ | 18 | $ | 23 | $ | 23 | $ | 21 | $ | 23 | ||||||||||||||||||||||
Research and development | 84 | 72 | 133 | 119 | 124 | |||||||||||||||||||||||||||
Selling, general, and administrative | 81 | 86 | 86 | 75 | 86 | |||||||||||||||||||||||||||
Total stock-based compensation expense | $ | 183 | $ | 181 | $ | 242 | $ | 215 | $ | 233 | ||||||||||||||||||||||
Inventory LCNRV write-downs | ||||||||||||||||||||||||||||||||
Inventory LCNRV write-downs3 | $ | 561 | $ | 379 | $ | 292 | $ | 319 | $ | 328 | ||||||||||||||||||||||
Liabilities for losses on firm purchase commitments3 | 261 | 179 | 160 | 126 | 45 | |||||||||||||||||||||||||||
Total inventory write-downs and liabilities for losses on firm purchase commitments 3 | $ | 822 | $ | 558 | $ | 452 | $ | 445 | $ | 373 | ||||||||||||||||||||||
¹ A reconciliation of non-GAAP financial measures to the most comparable GAAP measure is provided later in this letter. | ||||||||||||||||||||||||||||||||
2 The prior periods have been recast to conform to current period presentation. | ||||||||||||||||||||||||||||||||
3 Amount as of date shown. |
Q1 2024 Shareholder Letter | © 2024 Rivian. All rights reserved. | 14 |
Condensed Consolidated Balance Sheets | ||||||||||||||
(in millions, except per share amounts) | ||||||||||||||
(unaudited) |
Assets | December 31, 2023 | March 31, 2024 | ||||||||||||
Current assets: | ||||||||||||||
Cash and cash equivalents | $ | 7,857 | $ | 5,979 | ||||||||||
Short-term investments | 1,511 | 1,879 | ||||||||||||
Accounts receivable, net | 161 | 389 | ||||||||||||
Inventory | 2,620 | 2,797 | ||||||||||||
Other current assets | 164 | 270 | ||||||||||||
Total current assets | 12,313 | 11,314 | ||||||||||||
Property, plant, and equipment, net | 3,874 | 3,830 | ||||||||||||
Operating lease assets, net | 356 | 379 | ||||||||||||
Other non-current assets | 235 | 211 | ||||||||||||
Total assets | $ | 16,778 | $ | 15,734 | ||||||||||
Liabilities and Stockholders’ Equity | ||||||||||||||
Current liabilities: | ||||||||||||||
Accounts payable | $ | 981 | $ | 1,019 | ||||||||||
Accrued liabilities | 1,145 | 1,018 | ||||||||||||
Current portion of lease liabilities and other current liabilities | 361 | 364 | ||||||||||||
Total current liabilities | 2,487 | 2,401 | ||||||||||||
Long-term debt | 4,431 | 4,433 | ||||||||||||
Non-current lease liabilities | 324 | 345 | ||||||||||||
Other non-current liabilities | 395 | 486 | ||||||||||||
Total liabilities | 7,637 | 7,665 | ||||||||||||
Commitments and contingencies | ||||||||||||||
Stockholders' equity: | ||||||||||||||
Preferred stock, $0.001 par value; 10 shares authorized and 0 shares issued and outstanding as of December 31, 2023 and March 31, 2024 | — | — | ||||||||||||
Common stock, $0.001 par value; 3,508 and 3,508 shares authorized and 968 and 994 shares issued and outstanding as of December 31, 2023 and March 31, 2024, respectively | 1 | 1 | ||||||||||||
Additional paid-in capital | 27,695 | 28,070 | ||||||||||||
Accumulated deficit | (18,558) | (20,004) | ||||||||||||
Accumulated other comprehensive income | 3 | 2 | ||||||||||||
Total stockholders' equity | 9,141 | 8,069 | ||||||||||||
Total liabilities and stockholders' equity | $ | 16,778 | $ | 15,734 |
Q1 2024 Shareholder Letter | © 2024 Rivian. All rights reserved. | 15 |
Condensed Consolidated Statements of Operations | ||||||||||||||
(in millions, except per share amounts) | ||||||||||||||
(unaudited) |
Three Months Ended March 31, | ||||||||||||||||||||||||||
2023 | 2024 | |||||||||||||||||||||||||
Revenues | $ | 661 | $ | 1,204 | ||||||||||||||||||||||
Cost of revenues | 1,196 | 1,731 | ||||||||||||||||||||||||
Gross profit | (535) | (527) | ||||||||||||||||||||||||
Operating expenses | ||||||||||||||||||||||||||
Research and development | 496 | 461 | ||||||||||||||||||||||||
Selling, general, and administrative | 402 | 496 | ||||||||||||||||||||||||
Total operating expenses | 898 | 957 | ||||||||||||||||||||||||
Loss from operations | (1,433) | (1,484) | ||||||||||||||||||||||||
Interest income | 124 | 112 | ||||||||||||||||||||||||
Interest expense | (38) | (75) | ||||||||||||||||||||||||
Other (expense) income, net | (1) | 2 | ||||||||||||||||||||||||
Loss before income taxes | (1,348) | (1,445) | ||||||||||||||||||||||||
Provision for income taxes | (1) | (1) | ||||||||||||||||||||||||
Net loss | $ | (1,349) | $ | (1,446) | ||||||||||||||||||||||
Net loss attributable to common stockholders, basic and diluted | $ | (1,349) | $ | (1,446) | ||||||||||||||||||||||
Net loss per share attributable to Class A and Class B common stockholders, basic and diluted | $ | (1.45) | $ | (1.48) | ||||||||||||||||||||||
Weighted-average common shares outstanding, basic and diluted | 930 | 978 | ||||||||||||||||||||||||
Q1 2024 Shareholder Letter | © 2024 Rivian. All rights reserved. | 16 |
Consolidated Statements of Cash Flows | ||||||||||||||
(in millions) | ||||||||||||||
(unaudited) |
Three Months Ended March 31, | ||||||||||||||
2023 | 2024 | |||||||||||||
Cash flows from operating activities: | ||||||||||||||
Net loss | $ | (1,349) | $ | (1,446) | ||||||||||
Depreciation and amortization | 188 | 280 | ||||||||||||
Stock-based compensation expense | 183 | 233 | ||||||||||||
Inventory LCNRV write-downs and losses on firm purchase commitments | 229 | 150 | ||||||||||||
Other non-cash activities | 2 | 53 | ||||||||||||
Changes in operating assets and liabilities: | ||||||||||||||
Accounts receivable, net | (55) | (228) | ||||||||||||
Inventory | (781) | (435) | ||||||||||||
Other assets | (29) | (81) | ||||||||||||
Accounts payable and accrued liabilities | 22 | 113 | ||||||||||||
Other liabilities | 69 | 92 | ||||||||||||
Net cash used in operating activities | (1,521) | (1,269) | ||||||||||||
Cash flows from investing activities: | ||||||||||||||
Purchases of short-term investments | — | (902) | ||||||||||||
Maturities of short-term investments | — | 550 | ||||||||||||
Capital expenditures | (283) | (254) | ||||||||||||
Net cash used in investing activities | (283) | (606) | ||||||||||||
Cash flows from financing activities: | ||||||||||||||
Proceeds from issuance of capital stock | 3 | 2 | ||||||||||||
Proceeds from issuance of convertible notes | 1,485 | — | ||||||||||||
Other financing activities | (3) | (4) | ||||||||||||
Net cash provided by (used in) financing activities | 1,485 | (2) | ||||||||||||
Effect of exchange rate changes on cash and cash equivalents | — | (1) | ||||||||||||
Net change in cash | (319) | (1,878) | ||||||||||||
Cash, cash equivalents, and restricted cash—Beginning of period | 12,099 | 7,857 | ||||||||||||
Cash, cash equivalents, and restricted cash—End of period | $ | 11,780 | $ | 5,979 | ||||||||||
Supplemental disclosure of non-cash investing and financing activities: | ||||||||||||||
Capital expenditures included in liabilities | $ | 333 | $ | 383 | ||||||||||
Capital stock issued to settle bonuses | $ | 137 | $ | 179 | ||||||||||
Right-of-use assets obtained in exchange for operating lease liabilities | $ | 11 | $ | 52 | ||||||||||
Q1 2024 Shareholder Letter | © 2024 Rivian. All rights reserved. | 17 |
Depreciation and Amortization | ||||||||||||||
(in millions) | ||||||||||||||
(unaudited) |
Three Months Ended March 31, | ||||||||||||||||||||||||||
2023 | 2024 | |||||||||||||||||||||||||
Cost of revenues | $ | 130 | $ | 210 | ||||||||||||||||||||||
Research and development | 33 | 18 | ||||||||||||||||||||||||
Selling, general, and administrative | 25 | 52 | ||||||||||||||||||||||||
Total depreciation and amortization expense | $ | 188 | $ | 280 |
Stock-Based Compensation Expense | ||||||||||||||
(in millions) | ||||||||||||||
(unaudited) |
Three Months Ended March 31, | ||||||||||||||||||||||||||
2023 | 2024 | |||||||||||||||||||||||||
Cost of revenues | $ | 18 | $ | 23 | ||||||||||||||||||||||
Research and development | 84 | 124 | ||||||||||||||||||||||||
Selling, general, and administrative | 81 | 86 | ||||||||||||||||||||||||
Total stock-based compensation expense | $ | 183 | $ | 233 | ||||||||||||||||||||||
Q1 2024 Shareholder Letter | © 2024 Rivian. All rights reserved. | 18 |
Reconciliation of Non-GAAP | ||||||||||||||
Financial Measures | ||||||||||||||
(in millions, except per share amounts) | ||||||||||||||
(unaudited) |
Adjusted Research and Development Expenses | Three Months Ended March 31, | |||||||||||||||||||||||||
2023 | 2024 | |||||||||||||||||||||||||
Total research and development expenses | $ | 496 | $ | 461 | ||||||||||||||||||||||
R&D depreciation and amortization expenses | (33) | (18) | ||||||||||||||||||||||||
R&D stock-based compensation expenses | (84) | (124) | ||||||||||||||||||||||||
Adjusted research and development (non-GAAP) | $ | 379 | $ | 319 |
Adjusted Selling, General, and Administrative Expenses | Three Months Ended March 31, | |||||||||||||||||||||||||
2023 | 2024 | |||||||||||||||||||||||||
Total selling, general, and administrative expenses | $ | 402 | $ | 496 | ||||||||||||||||||||||
SG&A depreciation and amortization expenses | (25) | (52) | ||||||||||||||||||||||||
SG&A stock-based compensation expenses | (81) | (86) | ||||||||||||||||||||||||
Adjusted selling, general, and administrative (non-GAAP) | $ | 296 | $ | 358 |
Adjusted Operating Expenses | Three Months Ended March 31, | |||||||||||||||||||||||||
2023 | 2024 | |||||||||||||||||||||||||
Total operating expenses | $ | 898 | $ | 957 | ||||||||||||||||||||||
R&D depreciation and amortization expenses | (33) | (18) | ||||||||||||||||||||||||
R&D stock-based compensation expenses | (84) | (124) | ||||||||||||||||||||||||
SG&A depreciation and amortization expenses | (25) | (52) | ||||||||||||||||||||||||
SG&A stock-based compensation expenses | (81) | (86) | ||||||||||||||||||||||||
Total adjusted operating expenses (non-GAAP) | $ | 675 | $ | 677 |
Adjusted EBITDA1 | Three Months Ended March 31, | |||||||||||||||||||||||||
2023 | 2024 | |||||||||||||||||||||||||
Net loss | $ | (1,349) | $ | (1,446) | ||||||||||||||||||||||
Interest income, net | (86) | (37) | ||||||||||||||||||||||||
Provision for income taxes | 1 | 1 | ||||||||||||||||||||||||
Depreciation and amortization | 188 | 280 | ||||||||||||||||||||||||
Stock-based compensation expense | 183 | 233 | ||||||||||||||||||||||||
Other expense (income), net | 1 | (2) | ||||||||||||||||||||||||
Cost of revenue efficiency initiatives | — | 127 | ||||||||||||||||||||||||
Restructuring expenses | 42 | 30 | ||||||||||||||||||||||||
Asset impairments and write-offs | — | 16 | ||||||||||||||||||||||||
Adjusted EBITDA (non-GAAP) | $ | (1,020) | $ | (798) | ||||||||||||||||||||||
1 The prior periods have been recast to conform to current period presentation. | ||||||||||||||||||||||||||
Q1 2024 Shareholder Letter | © 2024 Rivian. All rights reserved. | 19 |
Reconciliation of Non-GAAP | ||||||||||||||
Financial Measures Continued | ||||||||||||||
(in millions, except per share amounts) | ||||||||||||||
(unaudited) |
Adjusted Net Loss | Three Months Ended March 31, | |||||||||||||||||||||||||
2023 | 2024 | |||||||||||||||||||||||||
Net loss attributable to common stockholders, basic and diluted | $ | (1,349) | $ | (1,446) | ||||||||||||||||||||||
Stock-based compensation expense | 183 | 233 | ||||||||||||||||||||||||
Other expense (income), net | 1 | (2) | ||||||||||||||||||||||||
Adjusted net loss attributable to common stockholders, basic and diluted (non-GAAP) | $ | (1,165) | $ | (1,215) | ||||||||||||||||||||||
Adjusted Net Loss Per Share | Three Months Ended March 31, | |||||||||||||||||||||||||
2023 | 2024 | |||||||||||||||||||||||||
Net loss per share attributable to common stockholders, basic and diluted | $ | (1.45) | $ | (1.48) | ||||||||||||||||||||||
Stock-based compensation expense per share | 0.20 | 0.24 | ||||||||||||||||||||||||
Other income, net per share | — | — | ||||||||||||||||||||||||
Adjusted net loss per share attributable to common stockholders, basic and diluted (non-GAAP) | $ | (1.25) | $ | (1.24) | ||||||||||||||||||||||
Weighted-average common shares outstanding, basic and diluted (GAAP) | 930 | 978 | ||||||||||||||||||||||||
Free Cash Flow | Three Months Ended March 31, | |||||||||||||||||||||||||
2023 | 2024 | |||||||||||||||||||||||||
Net cash used in operating activities | $ | (1,521) | $ | (1,269) | ||||||||||||||||||||||
Capital expenditures | (283) | (254) | ||||||||||||||||||||||||
Free cash flow (non-GAAP) | $ | (1,804) | $ | (1,523) | ||||||||||||||||||||||
Q1 2024 Shareholder Letter | © 2024 Rivian. All rights reserved. | 20 |
Quarterly Financial Performance | ||||||||||||||
Reconciliation of Non-GAAP | ||||||||||||||
Financial Measures | ||||||||||||||
(in millions, except per share amounts) | ||||||||||||||
(unaudited) |
Three Months Ended | ||||||||||||||||||||||||||||||||
March 31, 2023 | June 30, 2023 | September 30, 2023 | December 31, 2023 | March 31, 2024 | ||||||||||||||||||||||||||||
Adjusted Research and Development Expenses | ||||||||||||||||||||||||||||||||
Total research and development expenses | $ | 496 | $ | 444 | $ | 529 | $ | 526 | $ | 461 | ||||||||||||||||||||||
R&D depreciation and amortization expenses | (33) | (36) | (50) | (19) | (18) | |||||||||||||||||||||||||||
R&D stock-based compensation expenses | (84) | (72) | (133) | (119) | (124) | |||||||||||||||||||||||||||
Adjusted research and development (non-GAAP) | $ | 379 | $ | 336 | $ | 346 | $ | 388 | $ | 319 | ||||||||||||||||||||||
Adjusted Selling, General, and Administrative Expenses | ||||||||||||||||||||||||||||||||
Total selling, general, and administrative expenses | $ | 402 | $ | 429 | $ | 434 | $ | 449 | $ | 496 | ||||||||||||||||||||||
SG&A depreciation and amortization expenses | (25) | (27) | (30) | (56) | (52) | |||||||||||||||||||||||||||
SG&A stock-based compensation expenses | (81) | (86) | (86) | (75) | (86) | |||||||||||||||||||||||||||
Adjusted selling, general, and administrative (non-GAAP) | $ | 296 | $ | 316 | $ | 318 | $ | 318 | $ | 358 | ||||||||||||||||||||||
Adjusted Operating Expenses | ||||||||||||||||||||||||||||||||
Total operating expenses | $ | 898 | $ | 873 | $ | 963 | $ | 975 | $ | 957 | ||||||||||||||||||||||
R&D depreciation and amortization expenses | (33) | (36) | (50) | (19) | (18) | |||||||||||||||||||||||||||
R&D stock-based compensation expenses | (84) | (72) | (133) | (119) | (124) | |||||||||||||||||||||||||||
SG&A depreciation and amortization expenses | (25) | (27) | (30) | (56) | (52) | |||||||||||||||||||||||||||
SG&A stock-based compensation expenses | (81) | (86) | (86) | (75) | (86) | |||||||||||||||||||||||||||
Total adjusted operating expenses (non-GAAP) | $ | 675 | $ | 652 | $ | 664 | $ | 706 | $ | 677 | ||||||||||||||||||||||
Adjusted EBITDA 1 | ||||||||||||||||||||||||||||||||
Net loss | $ | (1,349) | $ | (1,195) | $ | (1,367) | $ | (1,521) | $ | (1,446) | ||||||||||||||||||||||
Interest income, net | (86) | (87) | (71) | (58) | (37) | |||||||||||||||||||||||||||
Provision for income taxes | 1 | — | — | — | 1 | |||||||||||||||||||||||||||
Depreciation and amortization | 188 | 223 | 256 | 270 | 280 | |||||||||||||||||||||||||||
Stock-based compensation expense | 183 | 181 | 242 | 215 | 233 | |||||||||||||||||||||||||||
Other (income) expense, net | 1 | (3) | (2) | (2) | (2) | |||||||||||||||||||||||||||
Cost of revenue efficiency initiatives | — | 20 | 15 | 60 | 127 | |||||||||||||||||||||||||||
Restructuring expenses | 42 | — | — | — | 30 | |||||||||||||||||||||||||||
Asset impairments and write-offs | — | — | 25 | 30 | 16 | |||||||||||||||||||||||||||
Adjusted EBITDA (non-GAAP) | $ | (1,020) | $ | (861) | $ | (902) | $ | (1,006) | $ | (798) | ||||||||||||||||||||||
1 The prior periods have been recast to conform to current period presentation. |
Q1 2024 Shareholder Letter | © 2024 Rivian. All rights reserved. | 21 |
Quarterly Financial Performance | ||||||||||||||
Reconciliation of Non-GAAP | ||||||||||||||
Financial Measures Continued | ||||||||||||||
(in millions, except per share amounts) | ||||||||||||||
(unaudited) |
Three Months Ended | ||||||||||||||||||||||||||||||||
March 31, 2023 | June 30, 2023 | September 30, 2023 | December 31, 2023 | March 31, 2024 | ||||||||||||||||||||||||||||
Adjusted Net Loss | ||||||||||||||||||||||||||||||||
Net loss attributable to common stockholders, basic and diluted | $ | (1,349) | $ | (1,195) | $ | (1,367) | $ | (1,521) | $ | (1,446) | ||||||||||||||||||||||
Stock-based compensation expense | 183 | 181 | 242 | 215 | 233 | |||||||||||||||||||||||||||
Other (income) expense, net | 1 | (3) | (2) | (2) | (2) | |||||||||||||||||||||||||||
Adjusted net loss attributable to common stockholders, basic and diluted (non-GAAP) | $ | (1,165) | $ | (1,017) | $ | (1,127) | $ | (1,308) | $ | (1,215) | ||||||||||||||||||||||
Adjusted Net Loss Per Share | ||||||||||||||||||||||||||||||||
Net loss per share attributable to common stockholders, basic and diluted | $ | (1.45) | $ | (1.27) | $ | (1.44) | $ | (1.58) | $ | (1.48) | ||||||||||||||||||||||
Stock-based compensation expense per share | 0.20 | 0.19 | 0.25 | 0.22 | 0.24 | |||||||||||||||||||||||||||
Other income, net per share | — | — | — | — | — | |||||||||||||||||||||||||||
Adjusted net loss per share attributable to common stockholders, basic and diluted (non-GAAP) | $ | (1.25) | $ | (1.08) | $ | (1.19) | * | $ | (1.36) | $ | (1.24) | |||||||||||||||||||||
Weighted-average common shares outstanding, basic and diluted (GAAP) | 930 | 942 | 952 | 963 | 978 | |||||||||||||||||||||||||||
Free Cash Flow | ||||||||||||||||||||||||||||||||
Net cash used in operating activities | $ | (1,521) | $ | (1,361) | $ | (877) | $ | (1,107) | $ | (1,269) | ||||||||||||||||||||||
Capital expenditures | (283) | (255) | (190) | (298) | (254) | |||||||||||||||||||||||||||
Free cash flow (non-GAAP) | $ | (1,804) | $ | (1,616) | $ | (1,067) | $ | (1,405) | $ | (1,523) | ||||||||||||||||||||||
*Does not calculate due to rounding. |
Q1 2024 Shareholder Letter | © 2024 Rivian. All rights reserved. | 22 |
Forward-Looking Statements | This shareholder letter and statements that are made on our earnings call contain forward-looking statements within the meaning of the Private Securities Litigation Reform Act of 1995. All statements contained in this press release and made on our earnings call that do not relate to matters of historical fact should be considered forward-looking statements, including without limitation statements regarding our future operations, initiatives and business strategy, our cost reduction strategy and expectations regarding cost savings, our future financial results, vehicle profitability and future gross profits, our anticipated LCNRV charges, the planned use of our cash and cash equivalents, our future capital expenditures, the underlying trends in our business, our market opportunity, and our potential for growth, our production ramp and manufacturing capacity expansion and anticipated production levels, our expected future production and deliveries, our anticipated production and timing of launching the R2 platform in Normal, timing of construction at at our Georgia site, scaling our service infrastructure, our expected future products and technology and product enhancements (including R2, R3, and R3X, as well as our next generation RAN charger), and revenue opportunities. These statements are neither promises nor guarantees and involve known and unknown risks, uncertainties, and other important factors that may cause our actual results, performance, or achievements to be materially different from any future results, performance, or achievements expressed or implied by the forward-looking statements, including, but not limited to: our history of losses as a growth-stage company and our limited operating history; we may underestimate or not effectively manage our capital expenditures and costs; we will require additional financing and capital to support our business; our ability to maintain strong demand for our vehicles and attract and retain a large number of customers; risks relating to the highly competitive automotive market, including competitors that may take steps to compete more effectively against us, including with respect to pricing and features, and impact of competition and macroeconomic conditions on product demand; consumers’ willingness to adopt electric vehicles; we may experience significant delays in the manufacture and delivery of our vehicles; we have experienced and could continue to experience cost increases or disruptions in supply of raw materials or other components used in our vehicles; our dependence on suppliers and volatility in pricing of components and raw materials; our ability to accurately estimate the supply and demand for our vehicles and predict our manufacturing requirements; our ability to maintain our relationship with one customer that has generated a significant portion of our revenues; we are highly dependent on the services and reputation of our Founder and Chief Executive Officer; our inability to manage our future growth effectively; our long-term results depend on our ability to successfully introduce and market new products and services; we may not succeed in establishing, maintaining, and strengthening our brand; our focus on delivering a high-quality and engaging Rivian experience may not maximize short-term financial results; risks relating to our distribution model; we rely on complex machinery, and production involves a significant degree of risk and uncertainty; our vehicles rely on highly technical software and hardware that could contain errors or defects; we may not successfully develop the complex software and technology systems needed to produce our vehicles; inadequate access to charging stations and not being able to realize the benefits of our charging networks; risks related to our use of lithium-ion battery cells; we have limited experience servicing and repairing our vehicles; the automotive industry and its technology are rapidly evolving and may be subject to unforeseen changes, and upgrades and adaptations to our vehicles may increase our costs and capital expenditures and also require planned, temporary manufacturing shutdowns from time to time; risks associated with advanced driver assistance systems technology; the reduction or elimination of government and economic incentives for electric vehicles; we may not obtain government grants and other incentives for which we may apply; vehicle retail sales depend heavily on affordable interest rates and availability of credit; insufficient warranty reserves to cover warranty claims; future field actions, including product recalls, could harm our business; risks related to product liability claims; risks associated with international operations; our ability to attract and retain key employees and qualified personnel; our ability to maintain our culture; our business may be adversely affected by labor and union activities; risks associated with the ongoing military conflict between Russia and the Ukraine and in the Middle East; risks related to health epidemics, pandemics, and other outbreaks; our financial results may vary significantly from period to period; we have incurred a significant amount of debt and may incur additional indebtedness; our vehicles may not operate properly; risks related to third-party vendors for certain product and service offerings; potential conflicts of interest involving our principal stockholders or their affiliates; risks associated with exchange rate and interest rate fluctuations; breaches in data security, failure of information security systems, cyber-attacks or other security or privacy-related incidents could harm our business; risk of intellectual property infringement claims; our use of open source software in our applications could subject our proprietary software to general release; our ability to prevent unauthorized use of our intellectual property; risks related to governmental regulation and legal proceedings; delays, limitations and risks related to permits and approvals required to operate or |
Q1 2024 Shareholder Letter | © 2024 Rivian. All rights reserved. | 23 |
Forward-Looking Statements | expand operations; our internal control over financial reporting; and the other factors described in our filings with the SEC. These factors could cause actual results to differ materially from those indicated by the forward-looking statements made in this press release. Any such forward-looking statements represent management’s estimates as of the date of this press release. While we may elect to update such forward-looking statements at some point in the future, except as may be required by law, we disclaim any obligation to do so, even if subsequent events cause our views to change. |
Q1 2024 Shareholder Letter | © 2024 Rivian. All rights reserved. | 24 |
Non-GAAP Financial Measures | In addition to our results determined in accordance with generally accepted accounting principles in the United States (“GAAP”), we review financial measures that are not calculated and presented in accordance with GAAP (“non-GAAP financial measures”). We believe our non-GAAP financial measures are useful in evaluating our operating and cash performance. We use the following non-GAAP financial information, collectively, to evaluate our ongoing operations and for internal planning and forecasting purposes. We believe that non-GAAP financial information, when taken collectively, may be helpful to investors, because it focuses on underlying operating results and trends, provides consistency and comparability with past financial performance, and assists in comparisons with other companies, some of which use similar non-GAAP financial information to supplement their GAAP results. The non-GAAP financial information is presented for supplemental informational purposes only, should not be considered a substitute for financial information presented in accordance with GAAP, and may be different from similarly titled non-GAAP measures used by other companies. A reconciliation of each historical non-GAAP financial measure to the most directly comparable financial measure stated in accordance with GAAP is provided above. Reconciliations of forward-looking non-GAAP financial measures are not provided because we are unable to provide such reconciliations without unreasonable effort due to the uncertainty regarding, and potential variability of, certain items, such as stock-based compensation expense and other costs and expenses that may be incurred in the future. Investors are encouraged to review the related GAAP financial measures and the reconciliation of these non-GAAP financial measures to their most directly comparable GAAP financial measures. Our non-GAAP financial measures include adjusted research and development expenses, adjusted selling, general, and administrative expenses, total adjusted operating expenses, adjusted EBITDA, adjusted net loss, adjusted net loss per share, and free cash flow. Adjusted research and development expenses is defined as total research and development expenses, less R&D depreciation and amortization expenses and R&D stock-based compensation expenses. Adjusted selling, general, and administrative expenses is defined as total selling, general, and administrative expenses, less SG&A depreciation and amortization expenses and SG&A stock-based compensation expenses. Adjusted operating expenses is defined as total operating expenses, less R&D depreciation and amortization expenses, R&D stock-based compensation expenses, SG&A depreciation and amortization expenses, and SG&A stock-based compensation expenses. Adjusted EBITDA is defined as net loss before interest expense (income), net, provision for income taxes, depreciation and amortization, stock-based compensation, other expense (income), net, and special items. Our management team ordinarily excludes special items from its review of the results of the ongoing operations. Special items is comprised of (i) cost of revenue efficiency initiatives which include costs incurred as we transition between major vehicle programs, cost incurred for negotiations with major suppliers regarding changing demand forecasts or design modifications, and other costs for enhancing capital and cost optimization of the Company (ii) restructuring expenses for significant actions taken by the Company, (iii) significant asset impairments and write-offs, and (iv) other items that we do not necessarily consider to be indicative of earnings from ongoing operating activities. Adjusted net loss is defined as net loss before stock-based compensation expense and other (expense) income. Adjusted net loss per share is defined as adjusted net loss divided by the weighted-average common shares outstanding. Free cash flow is defined as net cash used in operating activities less capital expenditures. |
Q1 2024 Shareholder Letter | © 2024 Rivian. All rights reserved. | 25 |