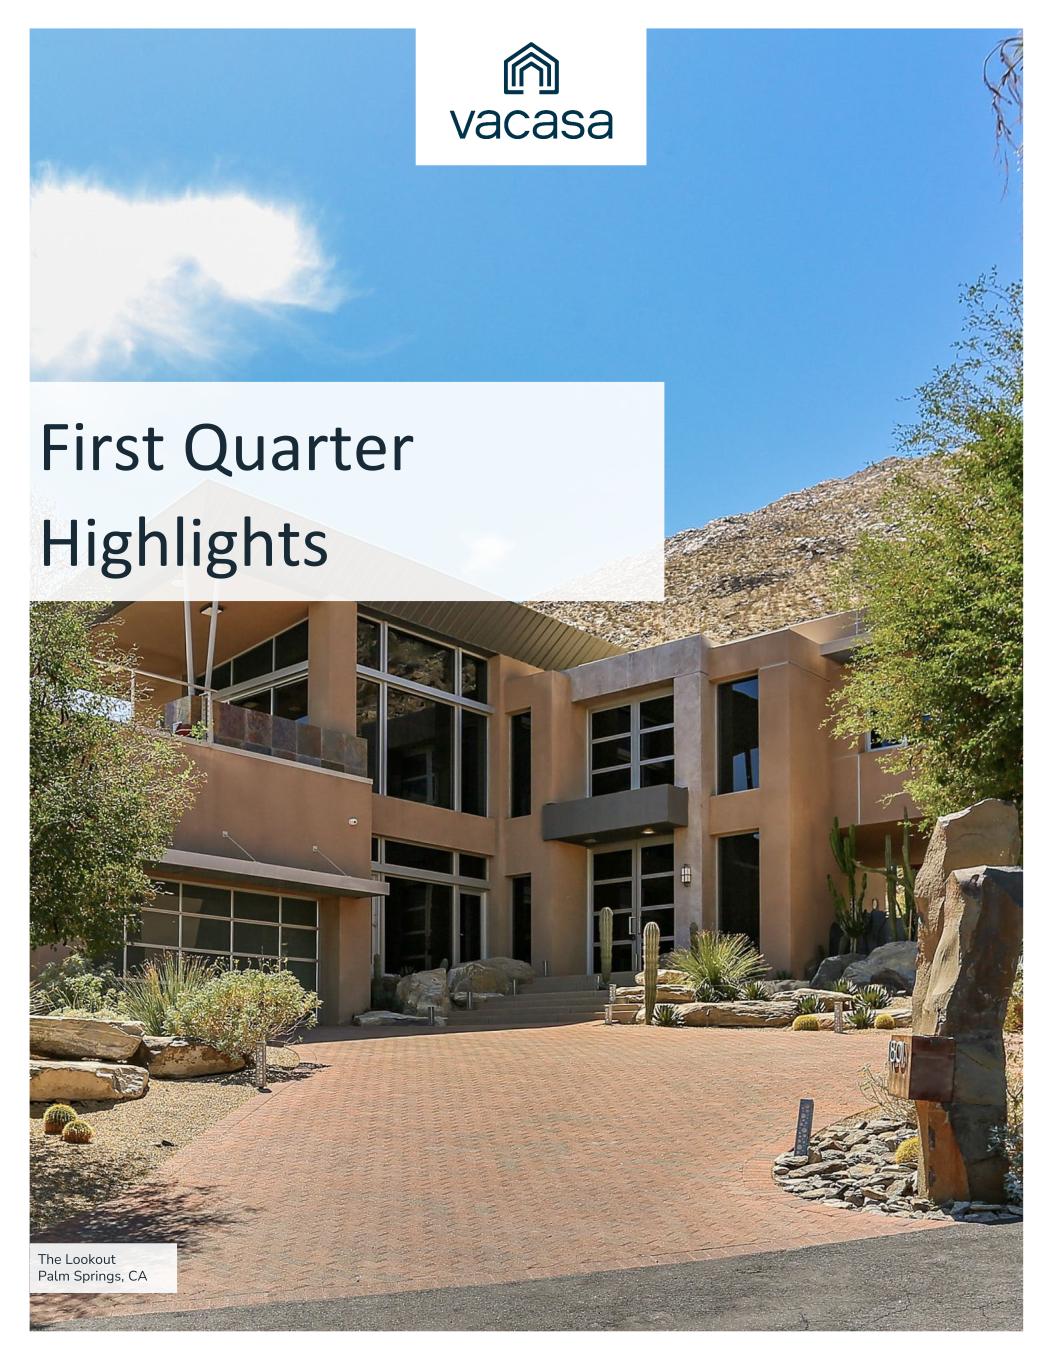
First Quarter Highlights The Lookout Palm Springs, CA

2First Quarter 2022 "Working with Vacasa, I don’t have to worry about anything. The local team is always on top of things and responds immediately when I reach out. They really pay attention to me because they care, which makes me feel connected. Through their service and advanced pricing capabilities, Vacasa has opened my eyes to what I can do with my property and future investments.” - Chris S., Vacasa homeowner in Daytona Beach, FL "We had a great experience with Vacasa. Everything was ready for us when we checked-in, and having the digital lock code to enter the home made it a very easy process. When we wanted to extend our stay by a few nights, the local team worked with us to find solutions and get everything coordinated quickly. I’ve never had that kind of experience or flexibility from other providers. I would definitely recommend working with Vacasa." - Kaylonn T., Vacasa guest in Jaco, Costa Rica

3 First Quarter Financial Results and Key Business Metrics First Quarter 2022

To Our Stakeholders, We had a strong first quarter at Vacasa, and the team is executing extremely well against our goal of reinventing the vacation rental industry by leveraging proprietary, purpose-built technology that is designed to improve all aspects of the vacation rental experience for guests, homeowners, and our channel partners. For the first quarter 2022, Nights Sold reached 1.3 million (up 64% year-over-year) and Gross Booking Value per Night Sold reached a first-quarter record of $367 (up 23% year-over-year), resulting in Gross Booking Value of $494 million (up 101% year-over-year). This drove Revenue of $247 million (up 91% year-over-year), Net Loss of $56 million, and Adjusted EBITDA of negative $22 million. We crossed an important milestone in January of 2022, delivering our homeowners over $1 billion of rental income over the preceding 12 months. Our success is predicated on our ability to inject technology into all aspects of the vacation rental experience. We believe we are the only vacation rental manager that has the scale to invest in truly differentiated technology solutions that are designed to provide an exceptional experience for homeowners and guests and drive efficiencies throughout our business. We believe our technology platform is already second to none, and our investments are extending our advantage. Our strong results have been driven by the ongoing shift in traveler preferences toward vacation rentals. This shift is evident in our own business, with occupancy in the first quarter of 2022 registering well ahead of first quarter 2019 levels, while Gross Booking Value per Night Sold is up over 30% from the first quarter of 2019. We believe travelers are choosing vacation rentals because they get better value for their money, more space, access to a wider set of amenities such as a kitchen or laundry room, and more privacy, among other reasons. 4First Quarter 2022

Ongoing strong traveler demand for our category has resulted in the overall industry being supply constrained. As the largest vacation rental management platform in North America, we are strategically positioned to create and distribute supply of available nights to travelers and our distribution partners. We provide critical, incremental capacity to the alternative accommodations ecosystem by offering second homeowners a full-service, end- to-end vacation rental management solution that makes it simple to turn their second home into a vacation rental home in as little as a week. Our business model continues to prove its strength, generating over $2 billion of Gross Booking Value over the 12 months ended March 31, 2022, and we still have an enormous opportunity ahead of us, as we currently manage less than 1% of the more than 5 million vacation homes in the United States. We also believe our technology-first approach can be scaled to international markets, and expand our total addressable market to about 20 million homes. As we near what we refer to as our “peak season,” which is the summer months where we typically see the strongest occupancy, we are reiterating our Revenue and Adjusted EBITDA expectations for full-year 2022. 5First Quarter 2022 The Lookout Palm Springs, CA

6 Home Additions We use two complementary playbooks to bring on new homes - an individual approach and portfolio approach. The individual approach, which accounts for the vast majority of our home additions, is a direct sales model where predominantly local sales representatives sign up individual homeowners, and the portfolio approach is where we buy local vacation rental managers bringing on multiple homes at once. The individual approach brought on a record number of homes during the first quarter of 2022, with gross home additions over 2.5 times greater compared to the same period last year. Our success was largely driven by the hundreds of sales representatives we hired in 2021 who we see follow a predictable, tenure-driven productivity ramp. In addition, new senior sales leadership hired within the past year have refreshed crucial aspects of the sales process, including the training, incentive programs, performance tracking and reporting, and go-to-market approach. As a result, we’ve seen productivity improvements across our tenure classes and a steepening of the productivity curve, as sales representatives reach higher productivity levels faster. With a strong, proven foundation in place for the individual approach, we are focused on hiring additional sales representatives in 2022. Our success in hiring and training new sales representatives over the past year gives us the confidence to further invest in our sales force, which generates a predictable lifetime value (“LTV”) to customer acquisition cost (“CAC”) between 4 times and 5 times. Encouragingly, we are pacing ahead of our 2022 sales representative hiring goals. We also use the portfolio approach to enter new markets or accelerate density in existing markets. Since 2014, we have executed our portfolio approach playbook more than 200 times, significantly more than anyone else in the industry. Our experience in evaluating, integrating, and tracking the post-integration performance of these portfolios provides us with an unmatched understanding of what constitutes an attractive opportunity, and its value to us. First Quarter 2022

7First Quarter 2022 We welcomed seven new portfolios onto our platform during the first quarter. We remain committed to our disciplined approach in evaluating portfolio opportunities. We continue to pursue and onboard opportunities that make strategic sense, and pass on those that do not, as we chose to in certain cases this quarter. Overall, we are pleased with the pace of home additions from our two complementary playbooks through the first quarter and remain on track to increase our homes under management by about 30% during 2022. Optimizing Extended Stays Opportunity While adding new homes to our platform remains our largest growth opportunity, we can also create growth by optimizing the existing inventory of homes on our platform. The way people live, work, and vacation has changed in recent years, potentially increasing traveler demand for extended stays, which we generally define as a reservation for more than 30 days. There are numerous requirements to meet before offering travelers a fully compliant extended stay product. For example, there are state and local regulations, legal entity requirements, and specific accounting treatments, among others. Our proprietary yield management system and pricing algorithms give us the opportunity to tactically apply this offering in a way that generates incremental income for homeowners. We have made substantial progress in these and other areas over the last year, with more than half the homes on our platform now optimized for extended stays with a goal of optimizing more homes throughout the balance of 2022.
8 Guidance For the second quarter 2022, we expect Revenue to be in the range of $280 million to $290 million and Adjusted EBITDA to be in the range of negative $20 million to negative $15 million. Relative to our expectations, second quarter bookings are pacing similar to last year. For full year 2022, we are reiterating our Revenue guidance range of $1,125 million to $1,175 million and Adjusted EBITDA guidance range of negative $21 million to negative $14 million. Our fiscal year 2022 guidance continues to assume that the combination of occupancy and Gross Booking Value per Night Sold takes a slight step back from the record levels we observed in 2021, especially in the second half of the year, but remains ahead of the pre-pandemic levels from 2019. We continue to make high return-on-investment growth investments in our business, specifically in sales and marketing and technology and development, as we are less than 1% penetrated against our domestic market opportunity of 5 million vacation homes. We remain focused on striking the right balance between growth and profitability, and are reiterating our expectation of reaching Adjusted EBITDA profitability for the full year 2023. As a reminder, our business does experience seasonality where we have historically generated our highest Revenue in the third quarter, followed by the second quarter, and relatively lower Revenue levels in the first and fourth quarters. First Quarter 2022
Financial Discussion Gross Booking Value Gross Booking Value reached $494 million in the first quarter, up 101% year-over-year, and our strongest first quarter to date. Nights Sold of 1.3 million were up 64% year- over-year, largely driven by the addition of homes to the platform. Gross Booking Value per Night Sold reached $367 in the first quarter, up 23% year-over-year. Revenue First quarter Revenue was $247 million, an increase of 91% year-over-year, driven by higher Nights Sold and higher Gross Booking Value per Night Sold. Cost of Revenue Cost of revenue was $122 million, or 49% of Revenue, in the first quarter, compared to $76 million, or 58% of Revenue, in the year ago period. Cost of revenue as a percentage of Revenue decreased by 900 basis points year-over-year due to improved operating leverage from the strong year-over-year growth of Gross Booking Value per Night Sold, increased density, and scale of the business. 9First Quarter 2022 The Lookout Palm Springs, CA
Financial Discussion (continued) Operations and Support Operations and support expense was $59 million in the first quarter compared to $30 million in the year ago period. Excluding equity-based compensation of $2.5 million in the first quarter of 2022, operations and support expense was $57 million, or 23% of Revenue, in the first quarter compared to $30 million, or 23% of Revenue, in the year ago period. Technology and Development Technology and development expense was $18 million in the first quarter compared to $7 million in the year ago period. Excluding equity-based compensation of $2.8 million in the first quarter of 2022 and $0.2 million in the first quarter of 2021, technology and development expense was $15 million, or 6% of Revenue, in the first quarter compared to $7 million, or 6% of Revenue, in the year ago period. The triple-digit growth of our technology and development expenses underscores our commitment to develop industry leading technology products and capabilities that transform all aspects of the vacation rental industry. Sales and Marketing Sales and marketing expense was $60 million in the first quarter compared to $26 million in the year ago period. Excluding equity-based compensation of $2.8 million in the first quarter of 2022 and $0.2 million in the first quarter of 2021, sales and marketing expense was $57 million, or 23% of Revenue, in the first quarter compared to $25 million, or 20% of Revenue, in the year ago period. Sales and marketing expense growth outpaced Revenue growth in the first quarter as we have significantly grown our sales force over the past year and, in-turn, increased our homeowner focused advertising spend to drive more leads for our larger sales force. 10First Quarter 2022
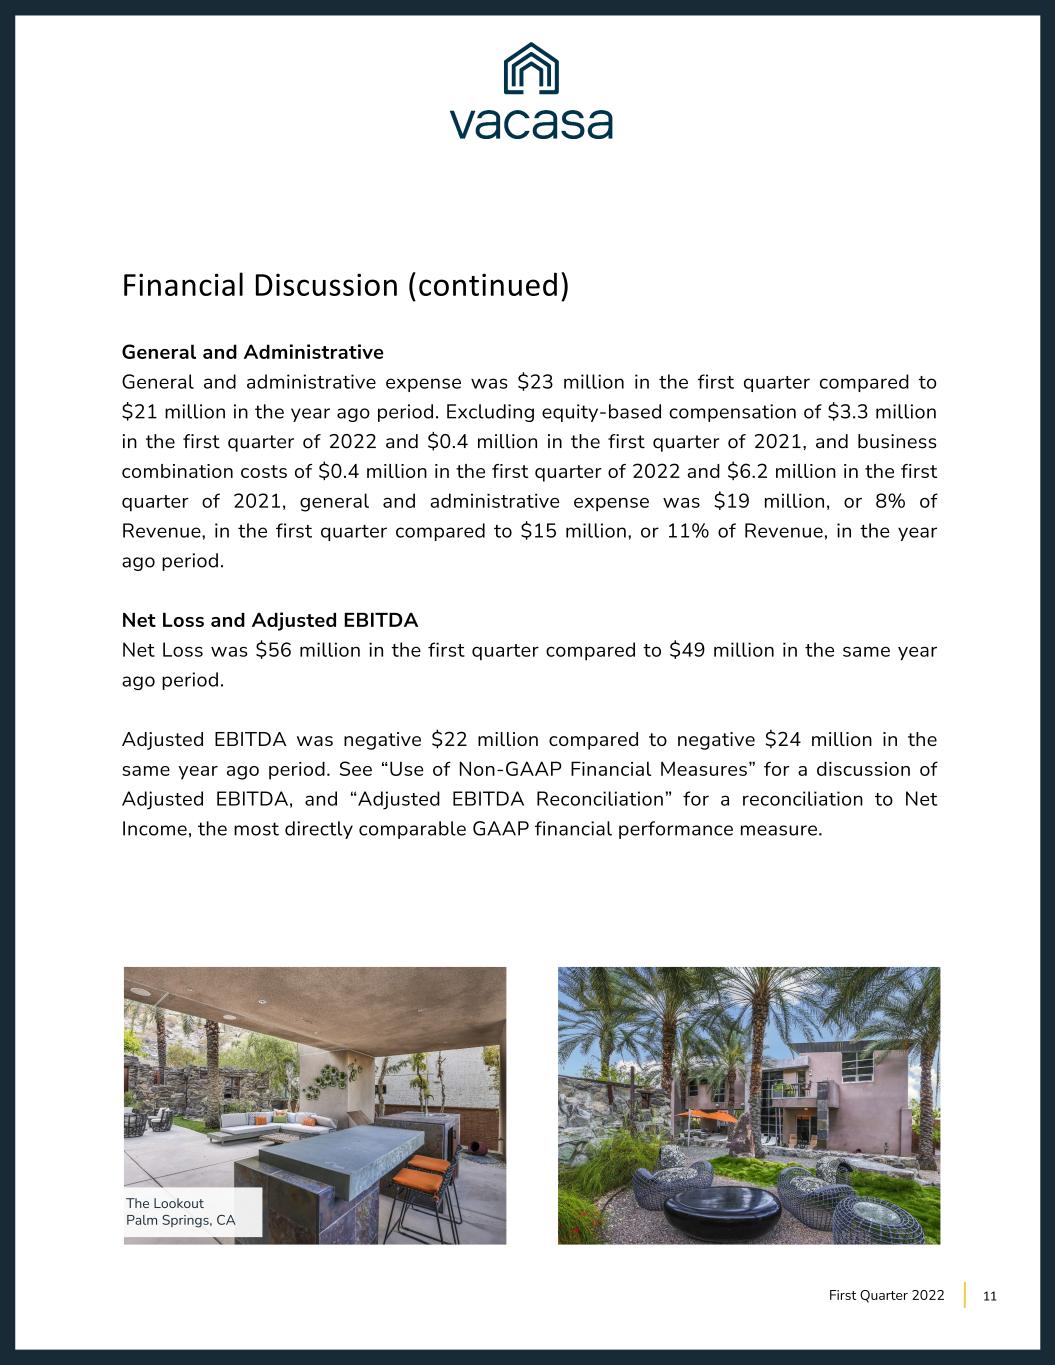
11 Financial Discussion (continued) General and Administrative General and administrative expense was $23 million in the first quarter compared to $21 million in the year ago period. Excluding equity-based compensation of $3.3 million in the first quarter of 2022 and $0.4 million in the first quarter of 2021, and business combination costs of $0.4 million in the first quarter of 2022 and $6.2 million in the first quarter of 2021, general and administrative expense was $19 million, or 8% of Revenue, in the first quarter compared to $15 million, or 11% of Revenue, in the year ago period. Net Loss and Adjusted EBITDA Net Loss was $56 million in the first quarter compared to $49 million in the same year ago period. Adjusted EBITDA was negative $22 million compared to negative $24 million in the same year ago period. See “Use of Non-GAAP Financial Measures” for a discussion of Adjusted EBITDA, and “Adjusted EBITDA Reconciliation” for a reconciliation to Net Income, the most directly comparable GAAP financial performance measure. First Quarter 2022 The Lookout Palm Springs, CA
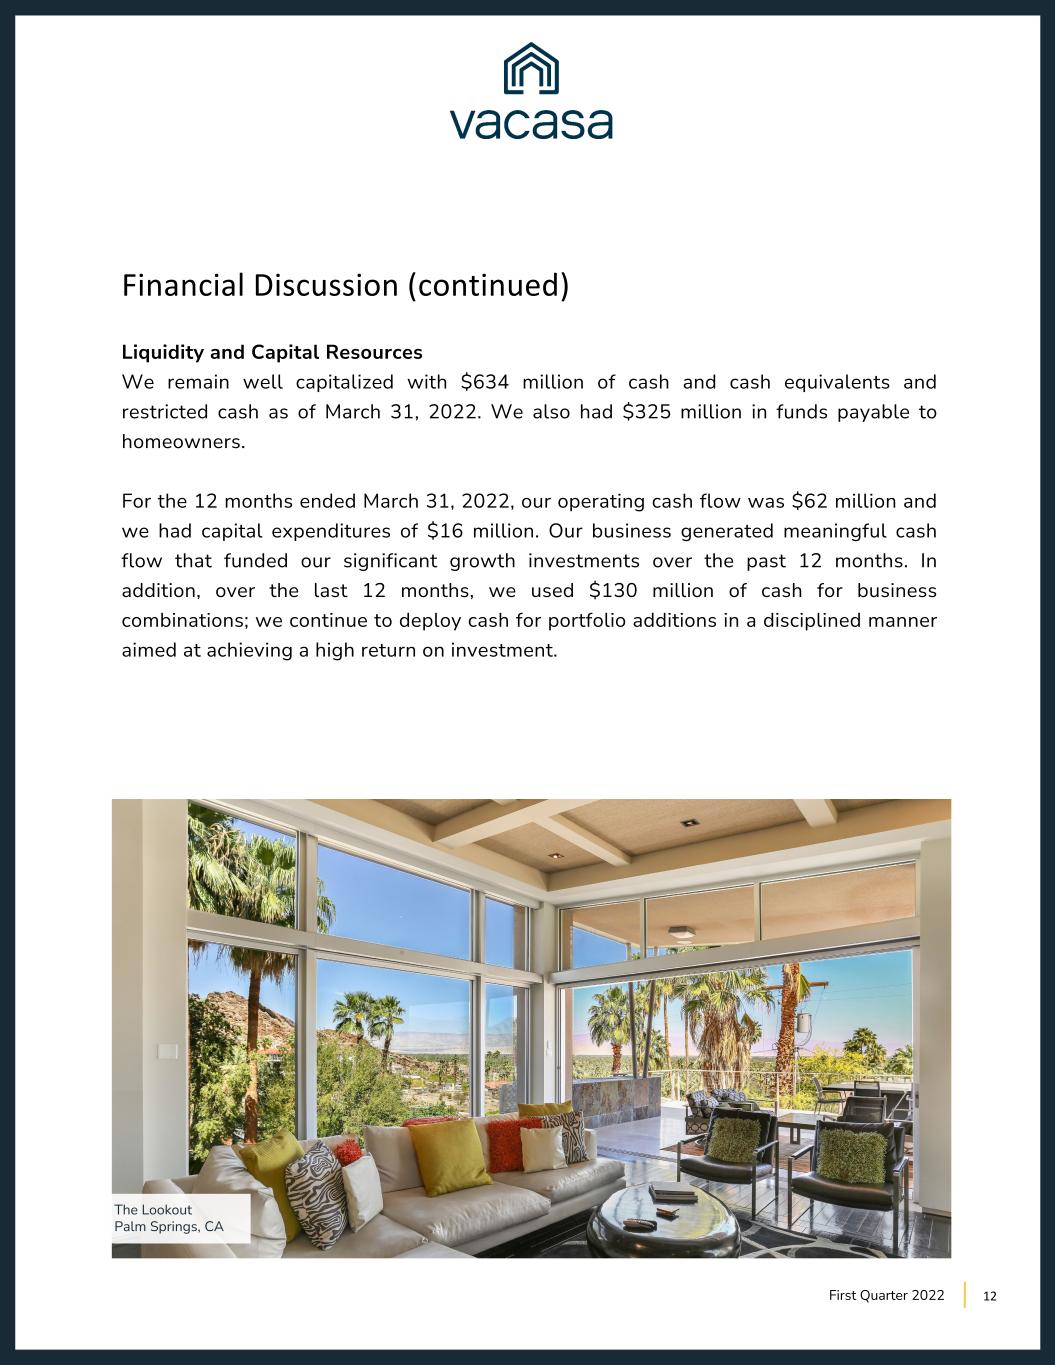
12 Financial Discussion (continued) Liquidity and Capital Resources We remain well capitalized with $634 million of cash and cash equivalents and restricted cash as of March 31, 2022. We also had $325 million in funds payable to homeowners. For the 12 months ended March 31, 2022, our operating cash flow was $62 million and we had capital expenditures of $16 million. Our business generated meaningful cash flow that funded our significant growth investments over the past 12 months. In addition, over the last 12 months, we used $130 million of cash for business combinations; we continue to deploy cash for portfolio additions in a disciplined manner aimed at achieving a high return on investment. First Quarter 2022 The Lookout Palm Springs, CA
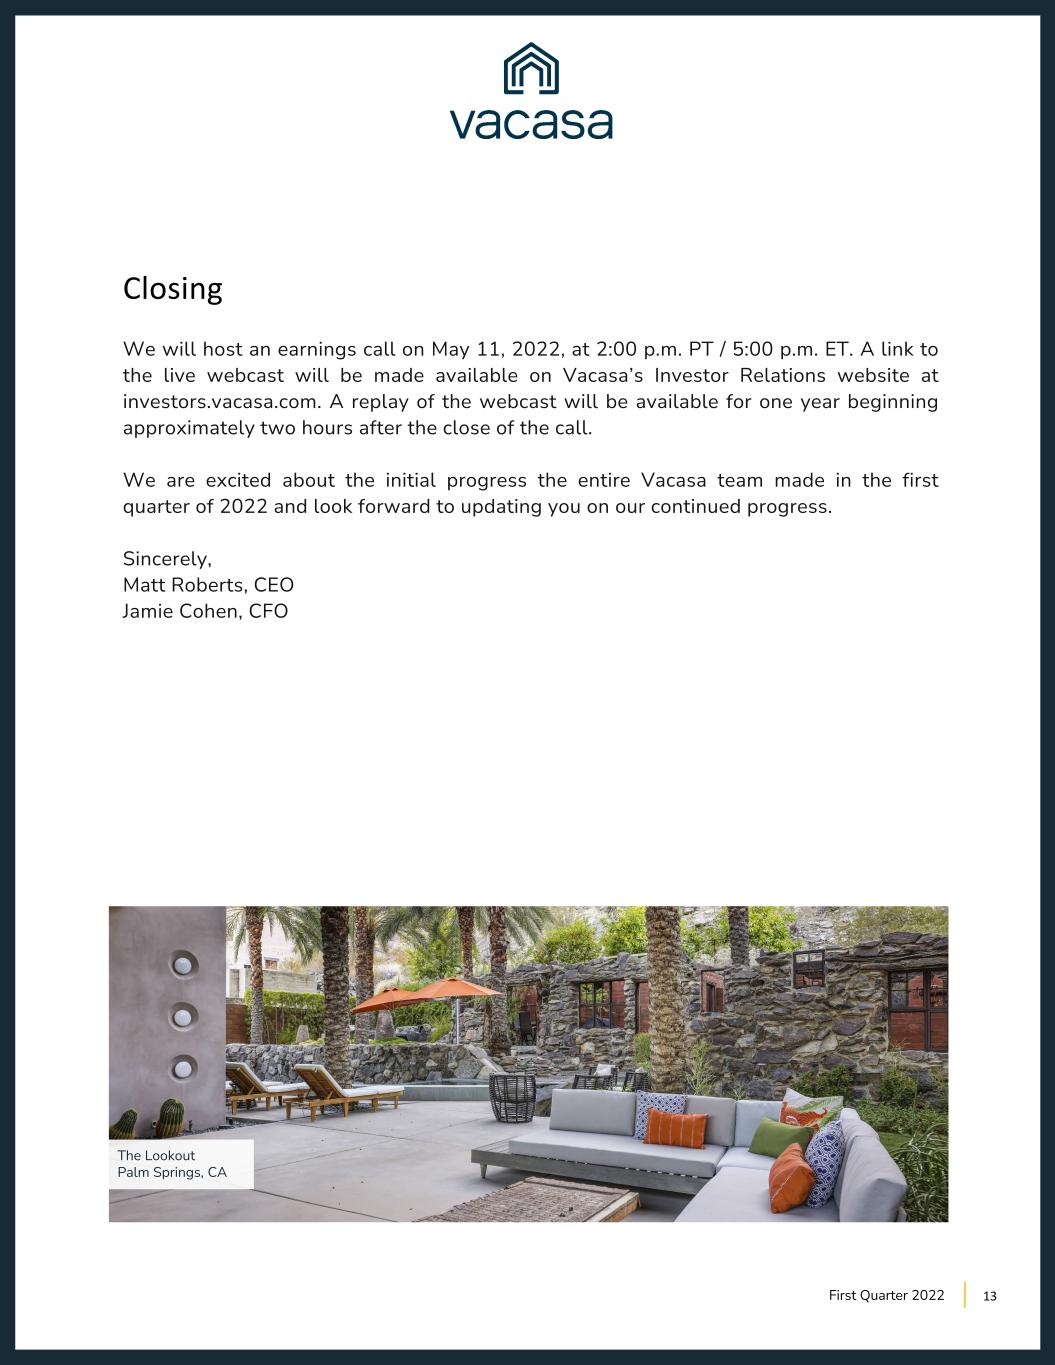
13 Closing We will host an earnings call on May 11, 2022, at 2:00 p.m. PT / 5:00 p.m. ET. A link to the live webcast will be made available on Vacasa’s Investor Relations website at investors.vacasa.com. A replay of the webcast will be available for one year beginning approximately two hours after the close of the call. We are excited about the initial progress the entire Vacasa team made in the first quarter of 2022 and look forward to updating you on our continued progress. Sincerely, Matt Roberts, CEO Jamie Cohen, CFO First Quarter 2022 The Lookout Palm Springs, CA

14 Condensed Consolidated Statements of Operations (in thousands, except per share data, unaudited) First Quarter 2022 Three Months Ended March 31, 2022 2021 Revenue $247,260 $129,418 Operating costs and expenses: Cost of revenue, exclusive of depreciation and amortization shown separately below(1) 121,759 75,626 Operations and support(1) 59,301 30,336 Technology and development(1) 17,565 7,496 Sales and marketing(1) 59,657 25,540 General and administrative(1) 23,201 21,423 Depreciation 4,919 4,065 Amortization of intangible assets 16,263 4,725 Total costs and expenses 302,665 169,211 Loss from operations (55,405) (39,793) Interest income 38 13 Interest expense (610) (2,831) Other income (expense), net 842 (6,721) Loss before income tax (55,135) (49,332) Income tax benefit (expense) (803) 39 Net loss ($55,938) ($49,293) Loss attributable to remeasurement of redeemable convertible preferred units - (426,101) Net loss including remeasurement of redeemable convertible preferred units (55,938) (475,394) Less: Net loss including remeasurement of redeemable convertible preferred units prior to Reverse Recapitalization - (475,394) Less: Net loss attributable to redeemable noncontrolling interests (27,856) - Net loss attributable to Class A Common Stockholders ($28,082) - Net loss per share of Class A Common Stock(2): Basic and diluted ($0.13) N/A Weighted-average shares of Class A Common Stock outstanding(2): Basic and diluted 214,940 N/A (1) Includes equity-based compensation expense as follows: Cost of revenue $298 $- Operations and support 2,454 31 Technology and development 2,761 167 Sales and marketing 2,773 239 General and administrative 3,344 406 Total equity-based compensation expense $11,630 $843 (2) Basic and diluted net loss per share of Class A Common Stock is applicable only for periods subsequent to December 6, 2021, which was the closing date of our business combination with TPG Pace Solutions Corp.
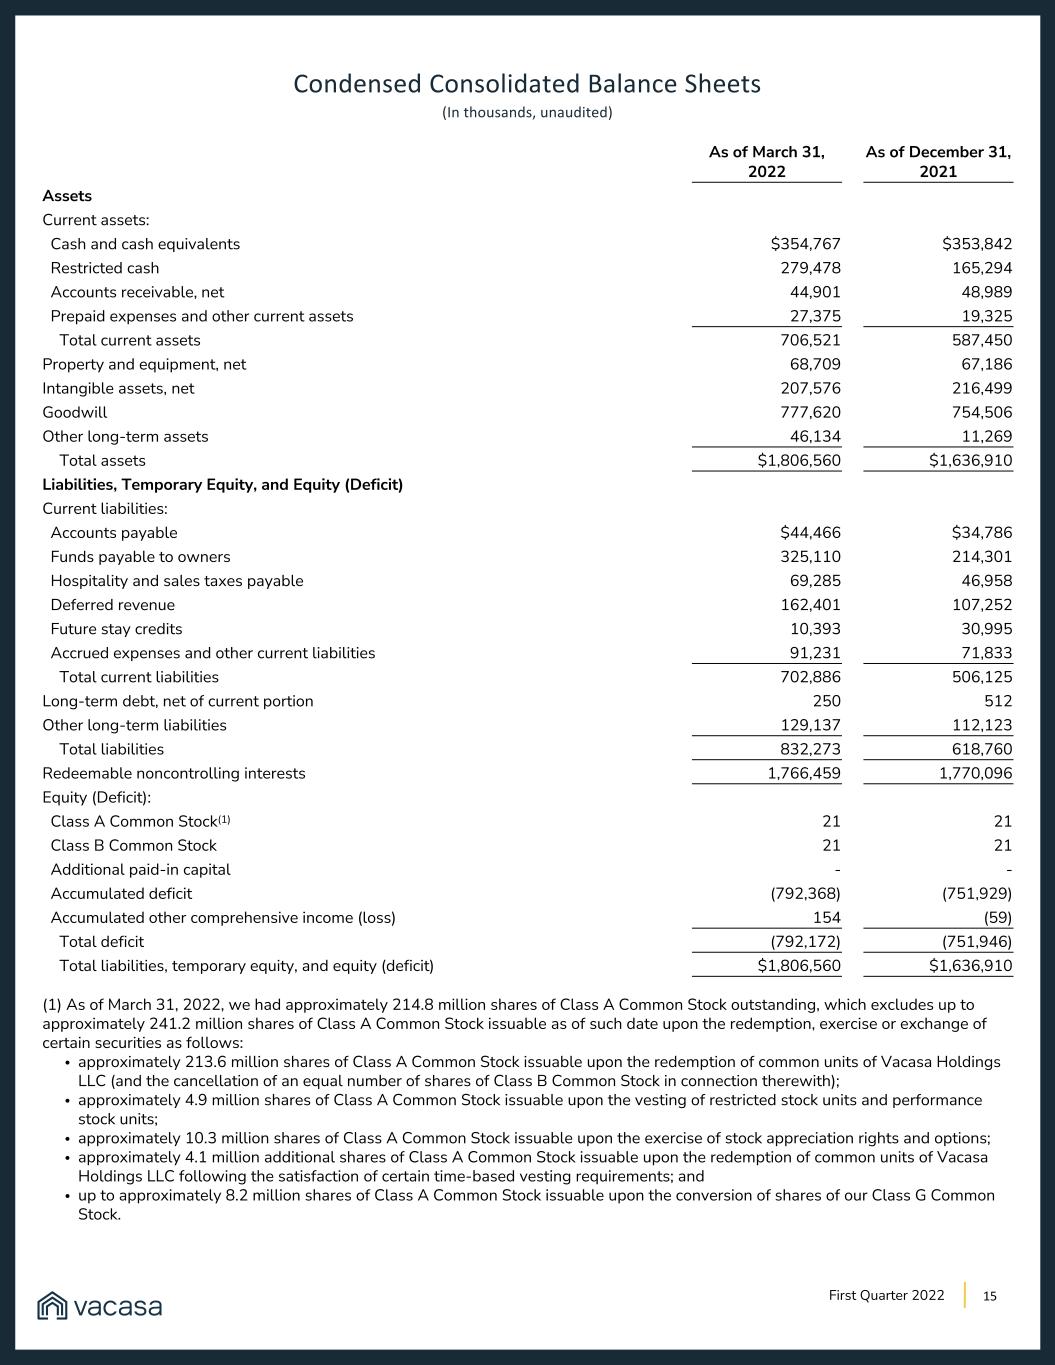
15 Condensed Consolidated Balance Sheets (In thousands, unaudited) First Quarter 2022 As of March 31, As of December 31, 2022 2021 Assets Current assets: Cash and cash equivalents $354,767 $353,842 Restricted cash 279,478 165,294 Accounts receivable, net 44,901 48,989 Prepaid expenses and other current assets 27,375 19,325 Total current assets 706,521 587,450 Property and equipment, net 68,709 67,186 Intangible assets, net 207,576 216,499 Goodwill 777,620 754,506 Other long-term assets 46,134 11,269 Total assets $1,806,560 $1,636,910 Liabilities, Temporary Equity, and Equity (Deficit) Current liabilities: Accounts payable $44,466 $34,786 Funds payable to owners 325,110 214,301 Hospitality and sales taxes payable 69,285 46,958 Deferred revenue 162,401 107,252 Future stay credits 10,393 30,995 Accrued expenses and other current liabilities 91,231 71,833 Total current liabilities 702,886 506,125 Long-term debt, net of current portion 250 512 Other long-term liabilities 129,137 112,123 Total liabilities 832,273 618,760 Redeemable noncontrolling interests 1,766,459 1,770,096 Equity (Deficit): Class A Common Stock(1) 21 21 Class B Common Stock 21 21 Additional paid-in capital - - Accumulated deficit (792,368) (751,929) Accumulated other comprehensive income (loss) 154 (59) Total deficit (792,172) (751,946) Total liabilities, temporary equity, and equity (deficit) $1,806,560 $1,636,910 (1) As of March 31, 2022, we had approximately 214.8 million shares of Class A Common Stock outstanding, which excludes up to approximately 241.2 million shares of Class A Common Stock issuable as of such date upon the redemption, exercise or exchange of certain securities as follows: • approximately 213.6 million shares of Class A Common Stock issuable upon the redemption of common units of Vacasa Holdings LLC (and the cancellation of an equal number of shares of Class B Common Stock in connection therewith); • approximately 4.9 million shares of Class A Common Stock issuable upon the vesting of restricted stock units and performance stock units; • approximately 10.3 million shares of Class A Common Stock issuable upon the exercise of stock appreciation rights and options; • approximately 4.1 million additional shares of Class A Common Stock issuable upon the redemption of common units of Vacasa Holdings LLC following the satisfaction of certain time-based vesting requirements; and • up to approximately 8.2 million shares of Class A Common Stock issuable upon the conversion of shares of our Class G Common Stock.
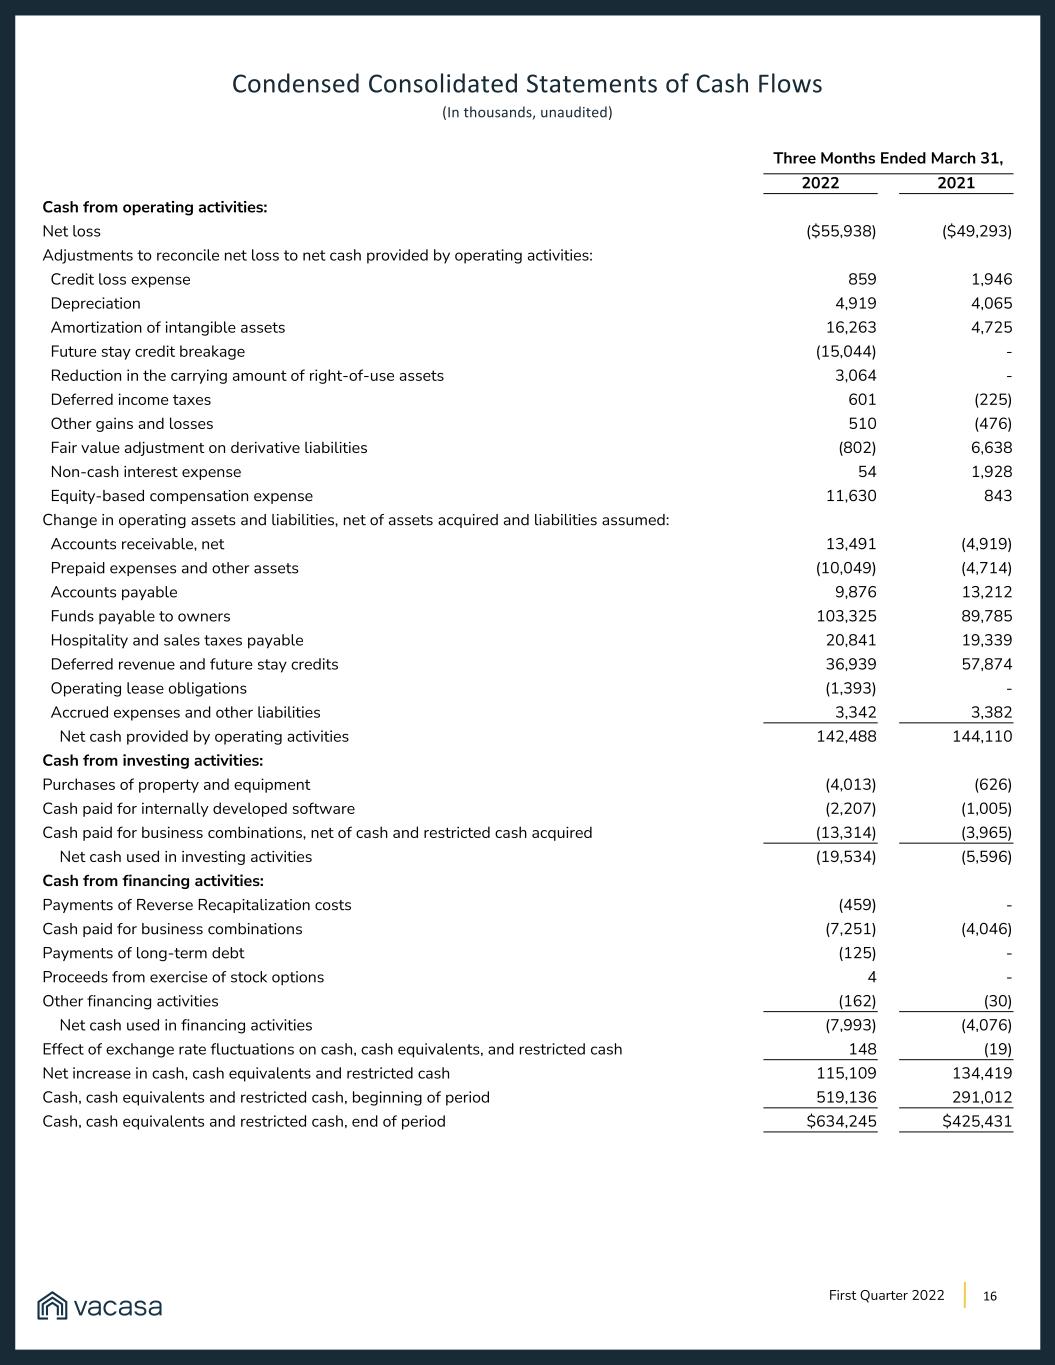
16 Condensed Consolidated Statements of Cash Flows (In thousands, unaudited) First Quarter 2022 Three Months Ended March 31, 2022 2021 Cash from operating activities: Net loss ($55,938) ($49,293) Adjustments to reconcile net loss to net cash provided by operating activities: Credit loss expense 859 1,946 Depreciation 4,919 4,065 Amortization of intangible assets 16,263 4,725 Future stay credit breakage (15,044) - Reduction in the carrying amount of right-of-use assets 3,064 - Deferred income taxes 601 (225) Other gains and losses 510 (476) Fair value adjustment on derivative liabilities (802) 6,638 Non-cash interest expense 54 1,928 Equity-based compensation expense 11,630 843 Change in operating assets and liabilities, net of assets acquired and liabilities assumed: Accounts receivable, net 13,491 (4,919) Prepaid expenses and other assets (10,049) (4,714) Accounts payable 9,876 13,212 Funds payable to owners 103,325 89,785 Hospitality and sales taxes payable 20,841 19,339 Deferred revenue and future stay credits 36,939 57,874 Operating lease obligations (1,393) - Accrued expenses and other liabilities 3,342 3,382 Net cash provided by operating activities 142,488 144,110 Cash from investing activities: Purchases of property and equipment (4,013) (626) Cash paid for internally developed software (2,207) (1,005) Cash paid for business combinations, net of cash and restricted cash acquired (13,314) (3,965) Net cash used in investing activities (19,534) (5,596) Cash from financing activities: Payments of Reverse Recapitalization costs (459) - Cash paid for business combinations (7,251) (4,046) Payments of long-term debt (125) - Proceeds from exercise of stock options 4 - Other financing activities (162) (30) Net cash used in financing activities (7,993) (4,076) Effect of exchange rate fluctuations on cash, cash equivalents, and restricted cash 148 (19) Net increase in cash, cash equivalents and restricted cash 115,109 134,419 Cash, cash equivalents and restricted cash, beginning of period 519,136 291,012 Cash, cash equivalents and restricted cash, end of period $634,245 $425,431

17First Quarter 2022 Key Business Metrics (In thousands, except GBV per Night Sold, unaudited) Three Months Ended March 31, 2022 2021 Gross Booking Value ("GBV")(1) $494,442 $245,877 Nights Sold(2) 1,349 824 GBV per Night Sold(3) $367 $298 (1) Gross Booking Value represents the dollar value of bookings from our distribution partners as well as those booked directly on our platform related to Nights Sold during the period and cancellation fees for bookings cancelled during the period (which may relate to bookings made during prior periods). GBV is inclusive of amounts charged to guests for rent, fees, and the estimated taxes a guest pays when we are responsible for collecting tax. (2) Nights Sold is defined as the total number of nights stayed by guests on our platform in a given period. (3) GBV per Night Sold represents the dollar value of each night stayed by guests on our platform in a given period. GBV per Night Sold reflects the pricing of rents, fees, and estimated taxes a guest pays. Reconciliations of Non-GAAP Financial Measures Adjusted EBITDA Reconciliation (In thousands, unaudited) Three Months Ended March 31, 2022 2021 Net Loss ($55,938) ($49,293) Add back: Depreciation and amortization of intangible assets 21,182 8,790 Interest income (38) (13) Interest expense 610 2,831 Other income (expense), net (842) 6,721 Income tax benefit (expense) 803 (39) Equity-based compensation 11,630 843 Business combination costs(1) 421 6,191 Restructuring costs(2) - 249 Adjusted EBITDA ($22,172) ($23,720) (1) Represents third party costs associated with the strategic acquisition of TurnKey and third party costs associated with our merger with TPG Pace Solutions Corp. (2) Represents costs associated with a costs associated with the wind-down of a significant portion of our international operations.

18 About Vacasa Vacasa is the leading vacation rental management platform in North America, transforming the vacation rental experience by integrating purpose-built technology with expert local and national teams. Homeowners enjoy earning significant incremental income on one of their most valuable assets, delivered by the company’s unmatched technology that adjusts rates in real time to maximize revenue. Guests can relax comfortably in Vacasa’s 35,000+ homes across more than 400 destinations in North America, Belize and Costa Rica, knowing that 24/7 support is just a phone call away. In addition to enabling guests to search, discover and book its properties on Vacasa.com and the Vacasa Guest App, Vacasa provides valuable, professionally managed inventory to top channel partners, including Airbnb, Booking.com and Vrbo. For more information, visit https://www.vacasa.com/press. First Quarter 2022
Forward Looking Statements Certain statements made in this shareholder letter are considered “forward-looking statements” within the meaning of the “safe harbor” provisions of the Private Securities Litigation Reform Act of 1995. Forward-looking statements may be identified by the use of words such as “anticipate,” “believe,” “expect,” “estimate,” “plan,” “outlook,” and “project” and other similar expressions that predict or indicate future events or trends or that are not statements of historical matters. These forward-looking statements reflect Vacasa’s current analysis of existing information and are subject to various risks and uncertainties. As a result, caution must be exercised in relying on forward-looking statements. Due to known and unknown risks, actual results may differ materially from Vacasa’s expectations and projections. The following factors, among others, could cause actual results to differ materially from those described in these forward-looking statements: Vacasa’s ability to achieve profitability; Vacasa’s ability to manage and sustain its growth; the effects of the novel coronavirus (COVID-19) pandemic, including as a result of new strains or variants of the virus, on Vacasa’s business, the travel industry, travel trends, and the global economy generally; Vacasa’s expectations regarding its financial performance, including its revenue, costs, and Adjusted EBITDA; Vacasa’s ability to attract and retain homeowners and guests; Vacasa’s ability to compete in its industry; Vacasa’s expectations regarding the resilience of its model, including in areas such as domestic travel, short-distance travel, and travel outside of top cities; the effects of seasonal trends on its results of operations; Vacasa’s ability to make required payments under its credit agreement and to comply with the various requirements of its indebtedness; Vacasa’s ability to effectively manage its exposure to fluctuations in foreign currency exchange rates; the anticipated increase in expenses associated with being a public company; anticipated trends, developments, and challenges in Vacasa’s industry, business, and the highly competitive markets in which it operates; the sufficiency of Vacasa’s cash and cash equivalents to meet its liquidity needs; Vacasa’s ability to anticipate market needs or develop new or enhanced offerings and services to meet those needs; Vacasa’s ability to expand into new markets and businesses, expand its range of homeowner services and pursue strategic acquisition and partnership opportunities; Vacasa’s ability to acquire and integrate companies and assets; Vacasa’s ability to manage expansion into international markets; Vacasa’s ability to stay in compliance with laws and regulations, including tax laws, that currently apply or may become applicable to its business both in the United States and internationally and its expectations regarding various laws and restrictions that relate to its business; Vacasa’s expectations regarding its tax liabilities and the adequacy of its reserves; Vacasa’s ability to effectively manage its growth and expand its infrastructure and maintain its corporate culture; Vacasa’s ability to identify, recruit, and retain skilled personnel, including key members of senior management; the effects of labor shortages and increases in wage and labor costs in its industry; the safety, affordability, and convenience of Vacasa’s platform and its offerings; Vacasa’s ability to keep pace with technological and competitive developments; Vacasa’s ability to maintain and enhance brand awareness; Vacasa’s ability to successfully defend litigation brought against it and its ability to secure adequate insurance coverage to protect the business and operations; and Vacasa’s ability to maintain, protect, and enhance its intellectual property. You should carefully consider the foregoing factors and the other risks and uncertainties described in the “Risk Factors” section of Vacasa’s Annual Report on Form 10-K for the fiscal year ended December 31, 2021 filed with the Securities and Exchange Commission (the “SEC”), as updated by its other reports filed with the SEC. These filings identify and address other important risks and uncertainties that could cause actual events and results to differ materially from those contained in the forward-looking statements. 19First Quarter 2022
Use of Non-GAAP Financial Measures This shareholder letter includes Adjusted EBITDA, which is a financial measure that is not defined by or presented in accordance with accounting principles generally accepted in the United States (“GAAP”). Adjusted EBITDA is defined as net loss excluding: (1) depreciation and acquisition-related items consisting of amortization of intangible assets and impairments of goodwill and intangible assets, if applicable; (2) interest income and expense; (3) any other income or expense not earned or incurred during our normal course of business; (4) any income tax benefit or expense; (5) equity-based compensation costs; (6) one-time costs related to strategic business combinations; and (7) restructuring costs. We believe this measure is useful for analysts and investors as this measure allows a more meaningful comparison between our performance and that of our competitors. The above items are excluded from our Adjusted EBITDA measure because these items are non-cash in nature or the amount and timing of these items is unpredictable or one-time in nature, not driven by the performance of our core business operations and renders comparisons with prior periods and competitors less meaningful. Adjusted EBITDA as a percentage of Revenue is calculated by dividing Adjusted EBITDA for a period by Revenue for the same period. Adjusted EBITDA is not defined by or presented in accordance with GAAP, has significant limitations as an analytical tool, should be considered as supplemental in nature, and is not meant as a substitute for net loss or any other financial information prepared in accordance with GAAP. We believe Adjusted EBITDA provides useful information to investors and others in understanding and evaluating our results of operations, is frequently used by these parties in evaluating companies in our industry, and provides a useful measure for period-to-period comparisons of our business performance. Moreover, we present Adjusted EBITDA in this shareholder letter because it is a key measurement used by our management internally to make operating decisions, including those related to analyzing operating expenses, evaluating performance, and performing strategic planning and annual budgeting. Although we use Adjusted EBITDA as described above, Adjusted EBITDA has significant limitations as an analytical tool, including that it: • does not reflect our cash expenditures, or future requirements for capital expenditures or contractual commitments; • does not reflect changes in, or cash requirements for, our working capital needs; • does not reflect the interest expense, or the cash required to service interest or principal payments, on our debt; • does not reflect our tax expense or the cash required to pay our taxes; and • although depreciation and amortization are non-cash charges, the assets being depreciated and amortized will often have to be replaced in the future and such measure does not reflect any cash requirements for such replacements. Due to these limitations, Adjusted EBITDA should not be considered as a measure of discretionary cash available to us to invest in the growth of our business. In addition, other companies in our industry may calculate this measure differently than we do, thereby further limiting its usefulness as a comparative measure. We compensate for these limitations by relying primarily on our GAAP results and using Adjusted EBITDA only on a supplemental basis. A reconciliation of the Company’s Adjusted EBITDA guidance to the most directly comparable GAAP financial measure cannot be provided without unreasonable efforts and is not provided herein because of the inherent difficulty in forecasting and quantifying certain amounts that are necessary for such reconciliations, including adjustments that are made for depreciation and amortization of intangible assets, equity-based compensation expense, business combination costs, restructuring charges and other adjustments reflected in our reconciliation of historical Adjusted EBITDA, the amounts of which could be material. 20First Quarter 2022


