
Second Quarter 2022 Highlights Saugatuck’s Crown Jewel Saugatuck, MI

2Second Quarter 2022 "Hands down, the Homeowner app is game-changing for me. The visibility, communication, and accounting has been so much better since moving over to Vacasa. It’s been easy to see financial reports and pull information for my own taxes at my convenience. I don’t have to wait for snail mail—it's about convenience and accuracy.” Lisa G., Vacasa homeowner in Park City, UT "This was our first time booking a large family trip and we really liked the options provided by Vacasa. Their app was also very easy to use, including all the information we needed about the home and our stay. From providing a really clean home to materials about the complex where we stayed that were easy to understand, Vacasa thought of everything.” - Jasmine R., Vacasa guest in Myrtle Beach, SC
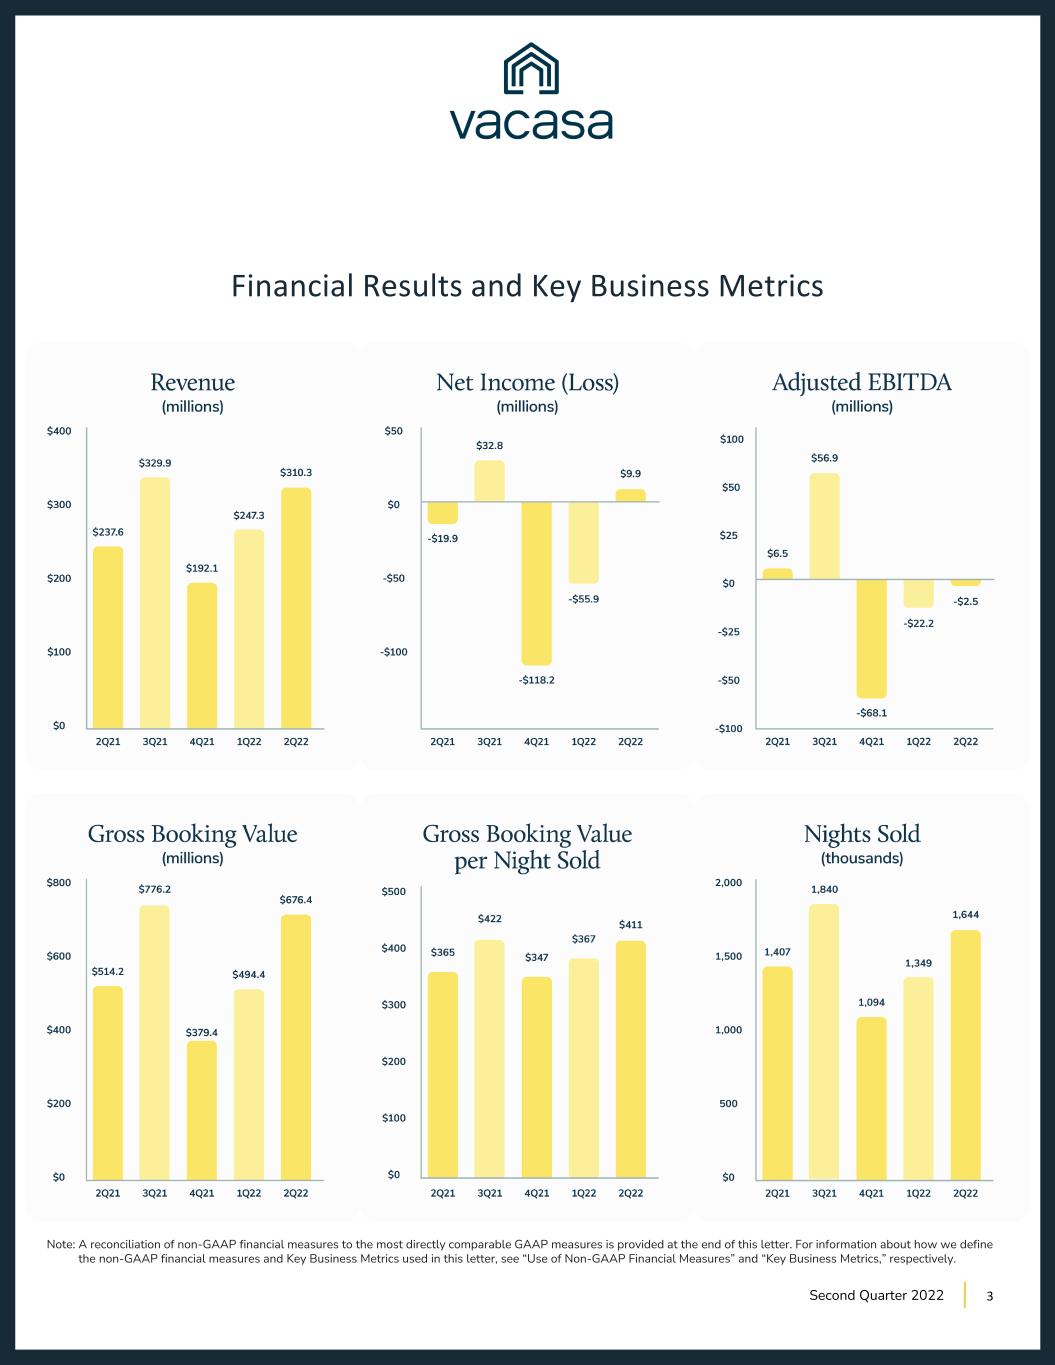
Financial Results and Key Business Metrics 3Second Quarter 2022 Note: A reconciliation of non-GAAP financial measures to the most directly comparable GAAP measures is provided at the end of this letter. For information about how we define the non-GAAP financial measures and Key Business Metrics used in this letter, see “Use of Non-GAAP Financial Measures” and “Key Business Metrics,” respectively.
To Our Stakeholders, We had an exceptional second quarter at Vacasa, reporting financial results ahead of expectations, increasing our industry-leading scale by adding thousands of new homeowners to our platform, and extending our technology advantage. We believe our technology-enabled local operations, proprietary yield optimization, and commitment to hospitality creates a truly differentiated value proposition for homeowners, making us the vacation rental manager of choice in the destinations where we operate. For the second quarter 2022, Gross Booking Value reached $676 million (up 32% year- over-year) driven by Nights Sold of 1.6 million (up 17% year-over-year) and Gross Booking Value per Night Sold of $411 (up 13% year-over-year). This drove Revenue of $310 million (up 31% year-over-year), ahead of our guidance range of $280 million to $290 million. Net Income was $10 million and Adjusted EBITDA was negative $2 million, ahead of our guidance range of negative $20 million to negative $15 million. Guest demand was strong throughout the quarter and, to date, the demand strength has continued into the third quarter, demonstrating that consumers are still prioritizing travel. While we haven’t seen signs of consumer weakness in our results or future bookings as of today, we are keenly aware of the changing macroeconomic environment and have spent time understanding how these changes could impact our business. It’s also important to consider that there are several factors that we believe insulate our business more from consumer uncertainty relative to other travel companies, including our focus on alternative accommodations that provides affordability to travelers, asset- light approach to growing available nights, diversified geographic footprint, and breadth of home types. 4Second Quarter 2022

5 Vacation rentals appeal to travelers for many reasons, including that it makes vacations more economical. A recent industry survey found that nearly 40% of travelers that stayed in a short term rental chose to because it offered a better value than other accommodation options. We also looked closely at several of our largest markets and found that vacation homes on our platform remain less expensive than hotels, on a per bedroom basis. Vacation home guests also have the option of sharing their home with friends, or cooking their own meals versus dining out, both of which can significantly lower overall travel costs. As opposed to other alternative accommodation business models, we do not rely on lease agreements to add vacation homes to our platform. Rather, we gain our supply of available nights by performing a valuable service to our homeowners. Our value proposition is focused on marketing vacation homes, leveraging internally built tools to optimize rental income, and servicing reservations with our locally staffed employees. Our homeowners then enjoy the benefits of owning their vacation home and earning rental income to help offset the cost of ownership. We maintain a diverse, national footprint managing homes in more than 400 destinations providing travelers drive-to and fly-to destinations. Within these destinations, we often offer a broad set of inventory, ranging from a one bedroom condo to a six bedroom home. We believe our expansive footprint combined with managing homes across a range of sizes and price points allows us to meet more travelers' budgets and needs. We believe our asset-light approach and solid value proposition positions us well for continued growth against the market opportunity of more than five million vacation homes in the United States. Second Quarter 2022
6 Home Additions We use two complementary playbooks to add new homes to our platform: an individual approach and portfolio approach. The individual approach is a direct sales model where predominantly local sales representatives sign up individual homeowners, and the portfolio approach is where we buy local vacation rental managers, bringing on multiple homes at once. The individual approach accounted for the majority of our home additions during the second quarter of 2022. The economics of the individual approach remain strong, with the lifetime value to customer acquisition cost above our target range of 4 times to 5 times on a trailing 12 months basis. Our customer acquisition cost remains stable compared to prior quarters, which combined with higher lifetime value, puts us above our target range. We added sales representatives on a net basis from the first quarter of 2022, reaching the ambitious sales force size target we set for ourselves at the beginning of the year. We will continue to hire new sales representatives in the second half of 2022 as needed to maintain the current size of our sales force. We also expect the sales force to see productivity improvements in the quarters ahead as sales representatives become more tenured, our new leaders implement further training and process improvements, and we gain actionable, data-driven insights from our recent transition to an enterprise-grade customer relationship management solution. Our individual approach is crucial to our success and truly unique in our industry. To our knowledge, no other vacation rental management company has a sales force of our size, nor one that’s led by a team of proven executives. The individual approach allows us to increase our homes under management in a capital-efficient manner and has the ability to scale with growing business. Second Quarter 2022
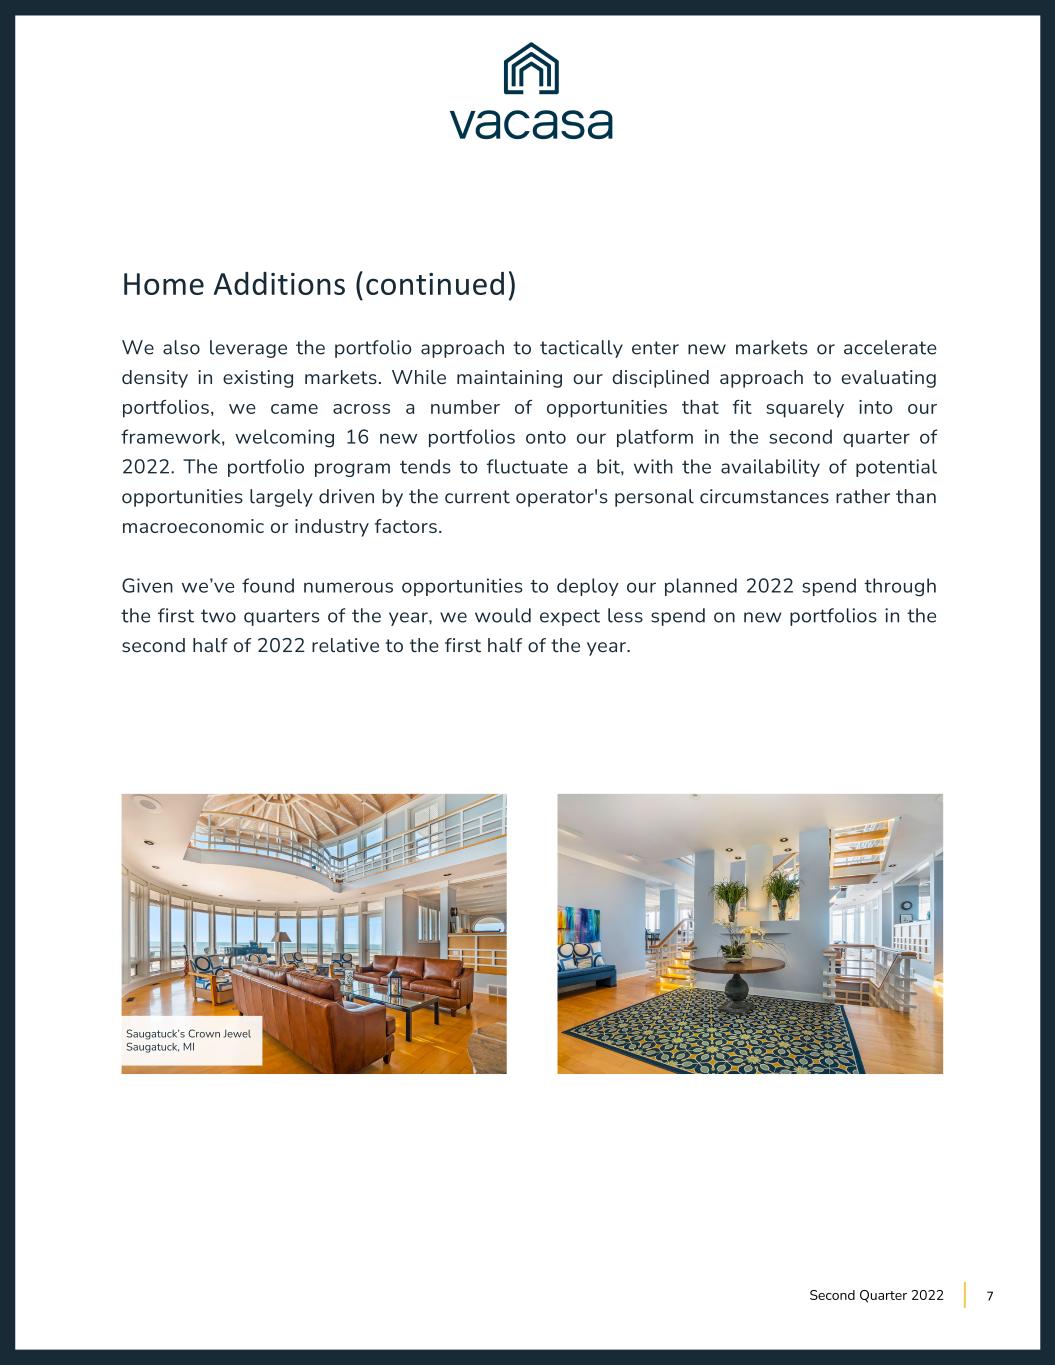
7 Home Additions (continued) We also leverage the portfolio approach to tactically enter new markets or accelerate density in existing markets. While maintaining our disciplined approach to evaluating portfolios, we came across a number of opportunities that fit squarely into our framework, welcoming 16 new portfolios onto our platform in the second quarter of 2022. The portfolio program tends to fluctuate a bit, with the availability of potential opportunities largely driven by the current operator's personal circumstances rather than macroeconomic or industry factors. Given we’ve found numerous opportunities to deploy our planned 2022 spend through the first two quarters of the year, we would expect less spend on new portfolios in the second half of 2022 relative to the first half of the year. Second Quarter 2022 Saugatuck’s Crown Jewel Saugatuck, MI
8 Extending Technology Advantage In addition to the internally developed, purpose-built products we’ve introduced—such as our pricing algorithms, the Homeowner App, and the Clean Inspection Tool, just to name a few—we’ve also been in the process of implementing several enterprise-grade systems over the past few months that improve various aspects of our business. These solutions complement and integrate with our internally built tools and data, and are used for more general functions many growing businesses require, as opposed to our proprietary tools that are designed to solve specific needs related to the vacation rental management industry. Importantly, these tools can support immense scale and our long-term ambitions of managing hundreds of thousands of vacation homes and facilitating tens of millions of Nights Sold on an annual basis. While there have been a number of implementations that improve local market and corporate functions, we want to highlight two specifically: one that streamlines our communications with guests and owners and another that helps power our individual approach growth engine. • Communications Platform. We’ve implemented a new communications platform that improves our ability to interact with guests and owners while streamlining our operations. We’ve customized the integration for our unique needs and it directly ties in with our Vacation Rental Management System, which houses all the information about owners and reservations. This connection enables our owner and guest experience teams to work in a single environment, with the right information displayed at the right time. It also allows us to funnel multiple communication sources—such as a phone call, SMS message, or message received through a channel partner—to a single point of contact. With the new system in place, we’ve been able to offer our guests and homeowners more ways to communicate with our support teams and resolve their questions more quickly which has resulted in operational efficiencies. Second Quarter 2022
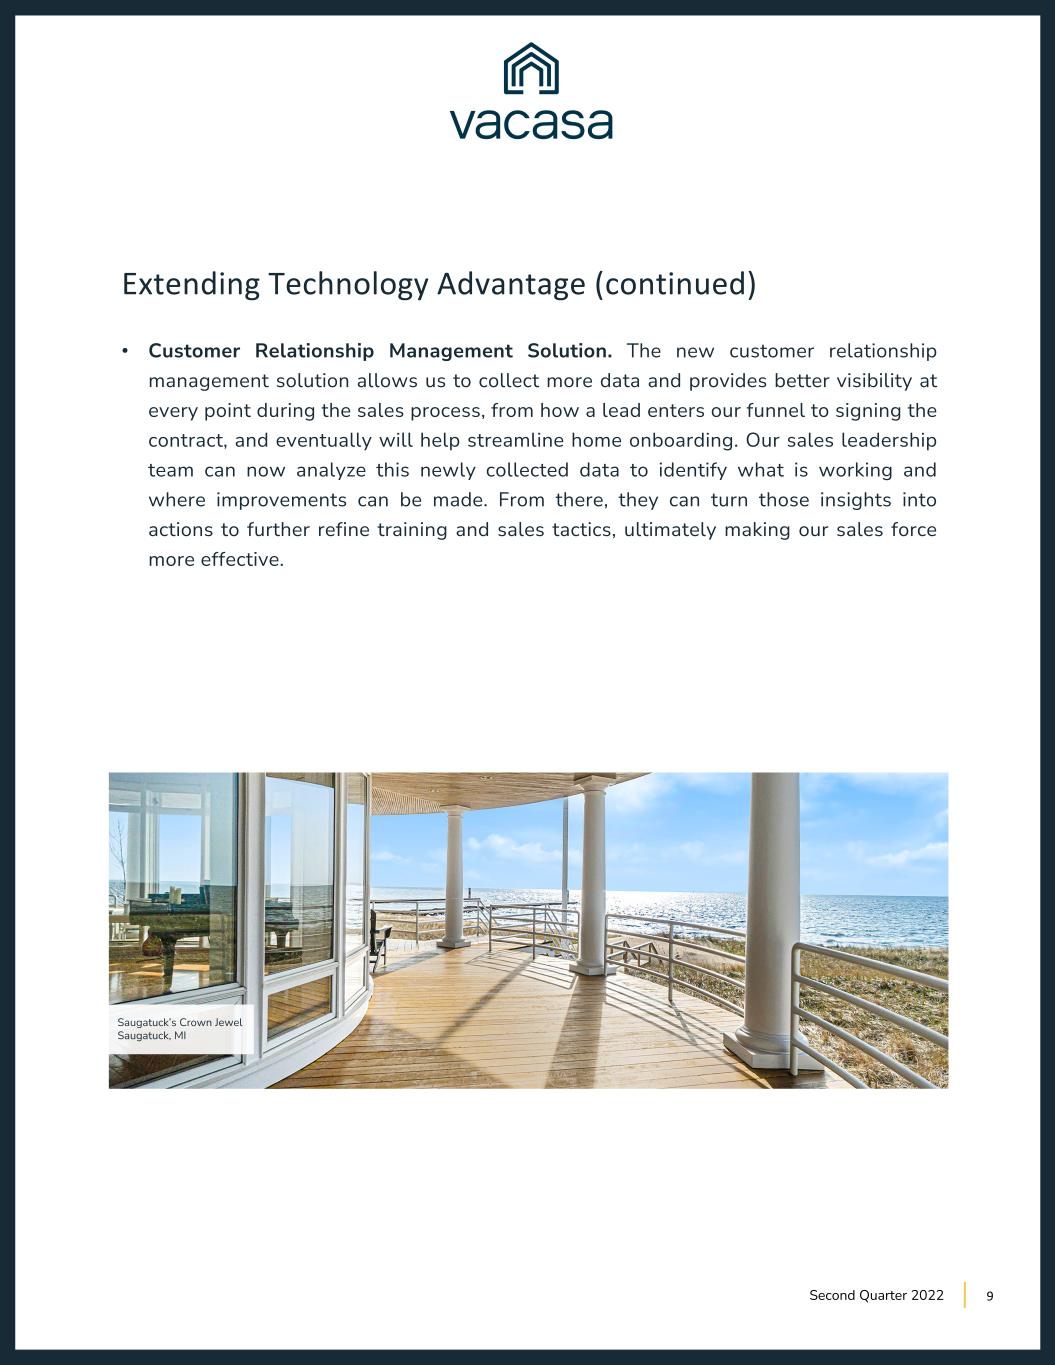
9 Extending Technology Advantage (continued) • Customer Relationship Management Solution. The new customer relationship management solution allows us to collect more data and provides better visibility at every point during the sales process, from how a lead enters our funnel to signing the contract, and eventually will help streamline home onboarding. Our sales leadership team can now analyze this newly collected data to identify what is working and where improvements can be made. From there, they can turn those insights into actions to further refine training and sales tactics, ultimately making our sales force more effective. Second Quarter 2022 Saugatuck’s Crown Jewel Saugatuck, MI

10 Guidance Based on our second-quarter performance and bookings to date, we are raising our full- year Revenue and Adjusted EBITDA guidance. We expect third-quarter Revenue to be in the range of $385 million to $395 million, and are raising our full-year Revenue guidance range to $1.165 billion to $1.185 billion. To provide a bit of additional context on our Revenue guidance, July has historically been our seasonally strongest month of the year, accounting for 40% to 50% of third- quarter Gross Booking Value and Revenue. We also have a high percentage of our expected August bookings confirmed at this point, which is our second strongest month of the year. With July complete and high visibility into August, we are confident in our third-quarter guidance. While we have less visibility into the fourth quarter given it’s only August, we are currently pacing well against our expectations. Our full-year guidance assumes that, for the second half of 2022, the combination of Gross Booking Value per Night Sold and occupancy takes a slight step back from the record levels reached in 2021, but remains above pre-pandemic levels. We expect third-quarter Adjusted EBITDA to be in the range of $55 million to $60 million, and are raising our full-year Adjusted EBITDA guidance range to negative $7 million to breakeven. We understand the importance of reaching Adjusted EBITDA profitability, especially given the broader macroeconomic environment and increased focus on balancing growth and profitability. With this in mind, rather than reinvesting our second-quarter Adjusted EBITDA outperformance to accelerate various discretionary investments as we have done in the past, we are instead letting that flow through, raising our full-year Adjusted EBITDA guidance. Second Quarter 2022
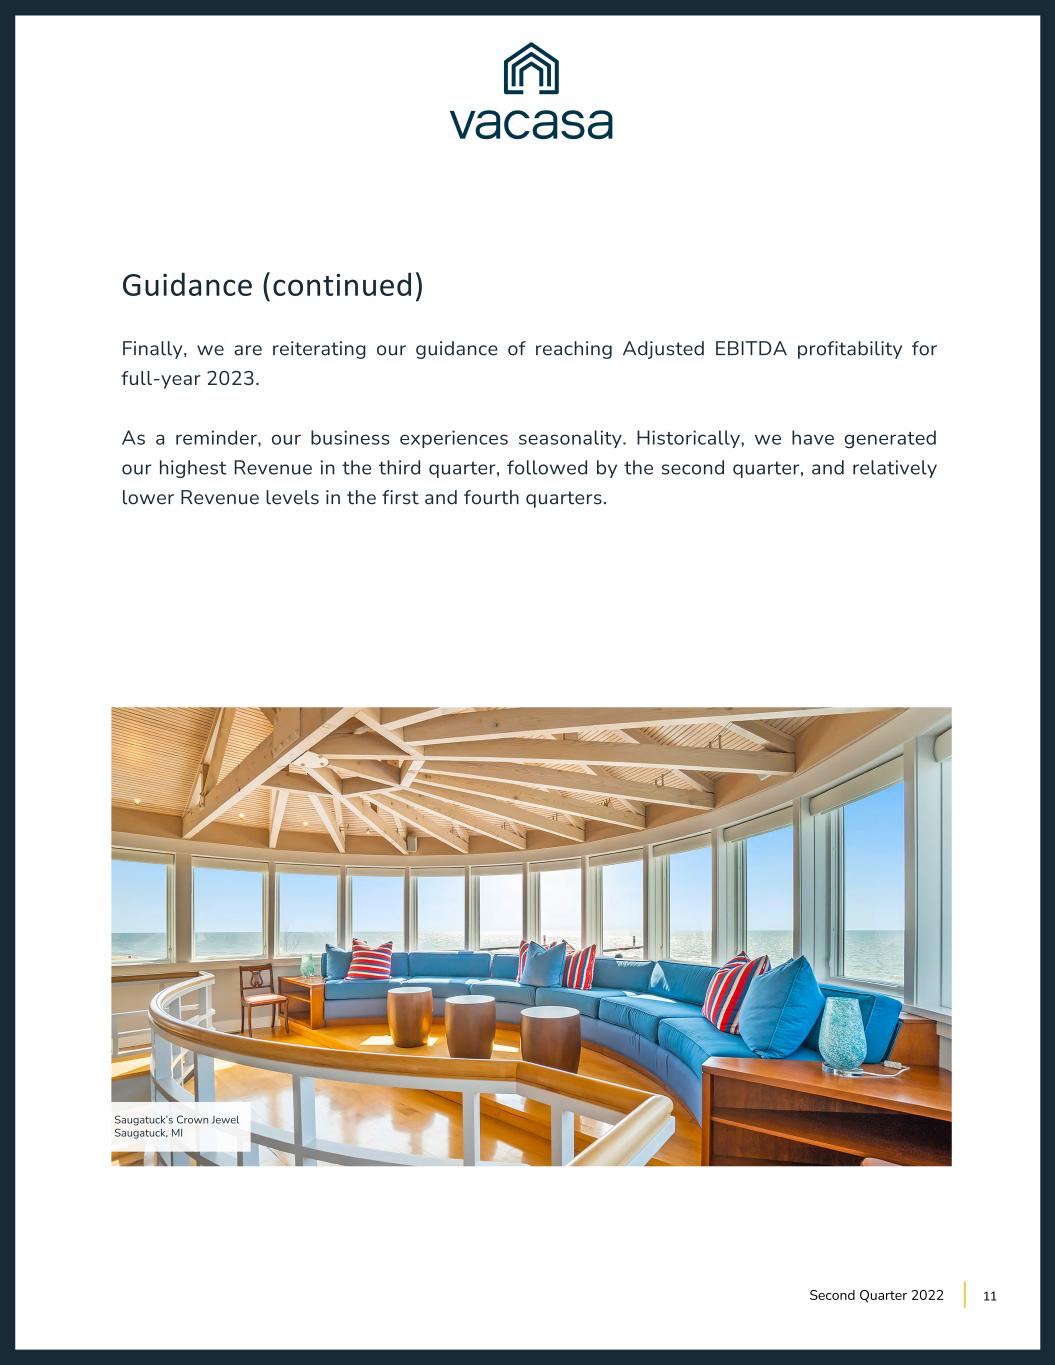
11 Guidance (continued) Finally, we are reiterating our guidance of reaching Adjusted EBITDA profitability for full-year 2023. As a reminder, our business experiences seasonality. Historically, we have generated our highest Revenue in the third quarter, followed by the second quarter, and relatively lower Revenue levels in the first and fourth quarters. Second Quarter 2022 Saugatuck’s Crown Jewel Saugatuck, MI
Financial Discussion Gross Booking Value Gross Booking Value reached $676 million in the second quarter, up 32% year-over- year. Nights Sold of 1.6 million were up 17% year-over-year, driven by the addition of homes to the platform. Gross Booking Value per Night Sold reached $411 in the second quarter, up 13% year-over-year. Revenue Second-quarter Revenue was $310 million, an increase of 31% year-over-year, driven by higher Nights Sold and higher Gross Booking Value per Night Sold. Cost of Revenue Cost of revenue was $152 million, or 49% of Revenue, in the second quarter, compared to $118 million, or 50% of Revenue, in the year ago period. Cost of revenue as a percentage of Revenue decreased by 80 basis points year-over-year due to improved operating leverage from the strong year-over-year growth of Gross Booking Value, somewhat offset by higher wage costs we implemented in the second half of 2021. Operations and Support Operations and support expense was $60 million in the second quarter, or 19% of Revenue, compared to $47 million, or 20% of Revenue, in the year ago period. Excluding equity-based compensation, operations and support expense was $59 million, or 19% of Revenue, in the second quarter compared to $47 million, or 20% of Revenue, in the year ago period. 12Second Quarter 2022
Financial Discussion (continued) Technology and Development Technology and development expense was $17 million in the second quarter, or 5% of Revenue, compared to $11 million, or 5% of Revenue, in the year ago period. Excluding equity-based compensation, technology and development expense was $15 million, or 5% of Revenue, in the second quarter compared to $11 million, or 5% of Revenue, in the year ago period. We aim to leverage technology to transform all aspects of the vacation rental industry, streamlining our local market operations and providing an exceptional experience to homeowners and guests. Sales and Marketing Sales and marketing expense was $62 million, or 20% of Revenue, in the second quarter compared to $39 million, or 16% of Revenue, in the year ago period. Excluding equity- based compensation, sales and marketing expense was $61 million, or 20% of Revenue, in the second quarter compared to $39 million, or 16% of Revenue, in the year ago period. Sales and marketing expense growth outpaced Revenue growth in the second quarter as we have significantly grown our sales force over the past year and, in-turn, increased our homeowner focused advertising spend to drive more leads for our larger sales force. Sales and marketing expense is also higher due to fees paid to distribution partners driven by the growth of Gross Booking Value. General and Administrative General and administrative expense was $29 million, or 9% of Revenue, in the second quarter compared to $19 million, or 8% of Revenue, in the year ago period. Excluding equity-based compensation and business combination costs, general and administrative expense was $26 million, or 8% of Revenue, in the second quarter compared to $16 million, or 7% of Revenue, in the year ago period. The year-over-year growth of general and administrative expense is due to higher expenses relative to last year now that we are a publicly traded company, and several non-recurring items including higher professional service fees. 13Second Quarter 2022
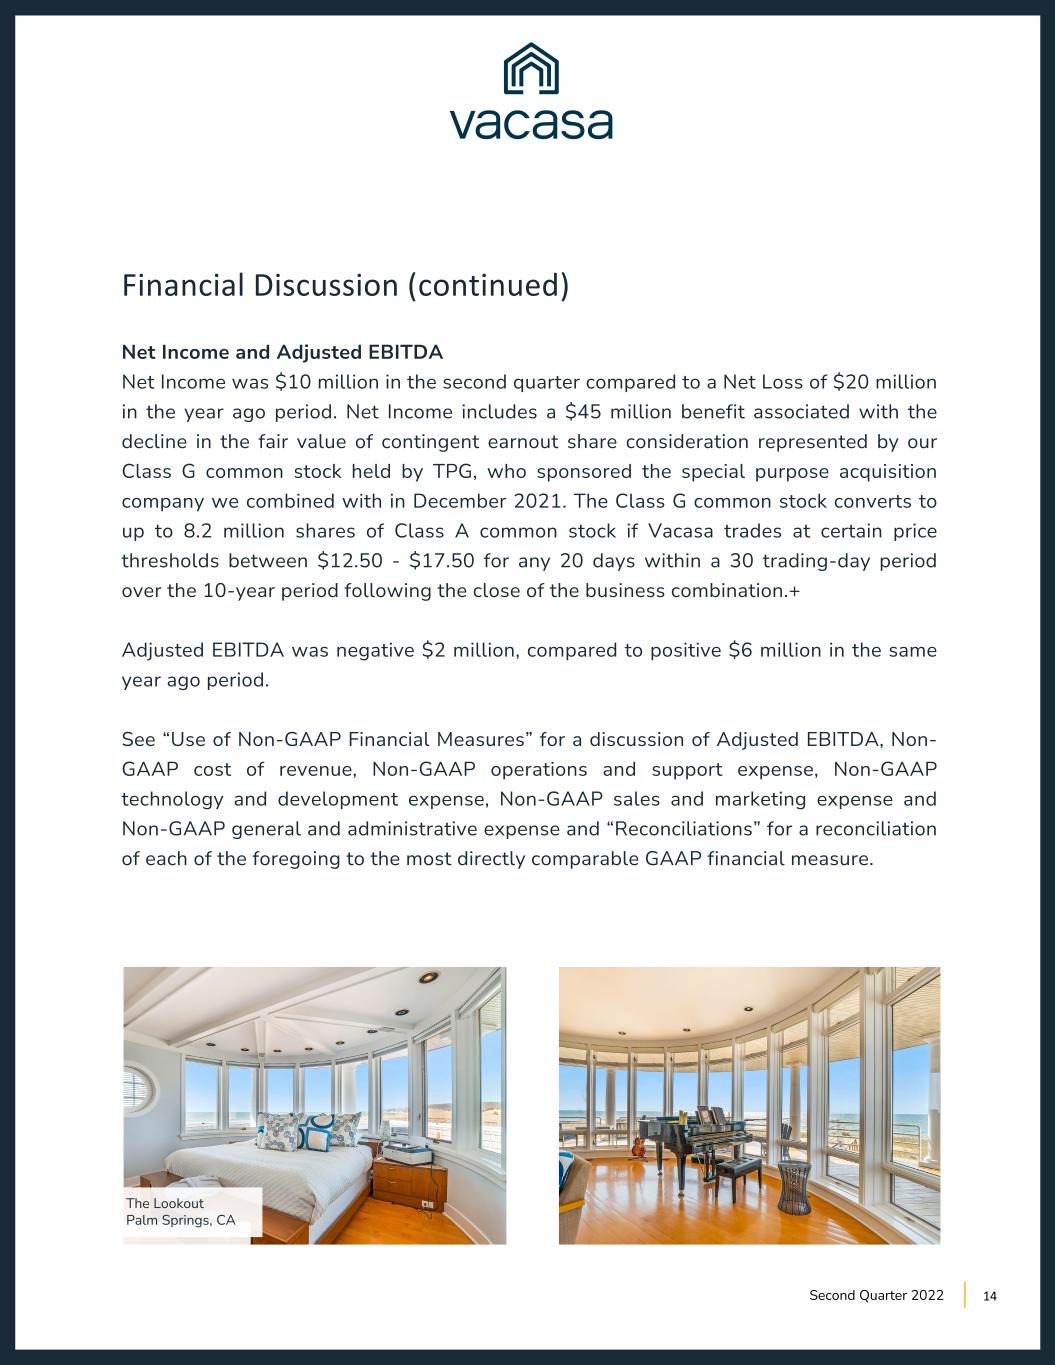
14 The Lookout Palm Springs, CA Financial Discussion (continued) Net Income and Adjusted EBITDA Net Income was $10 million in the second quarter compared to a Net Loss of $20 million in the year ago period. Net Income includes a $45 million benefit associated with the decline in the fair value of contingent earnout share consideration represented by our Class G common stock held by TPG, who sponsored the special purpose acquisition company we combined with in December 2021. The Class G common stock converts to up to 8.2 million shares of Class A common stock if Vacasa trades at certain price thresholds between $12.50 - $17.50 for any 20 days within a 30 trading-day period over the 10-year period following the close of the business combination.+ Adjusted EBITDA was negative $2 million, compared to positive $6 million in the same year ago period. See “Use of Non-GAAP Financial Measures” for a discussion of Adjusted EBITDA, Non- GAAP cost of revenue, Non-GAAP operations and support expense, Non-GAAP technology and development expense, Non-GAAP sales and marketing expense and Non-GAAP general and administrative expense and “Reconciliations” for a reconciliation of each of the foregoing to the most directly comparable GAAP financial measure. Second Quarter 2022
15 Financial Discussion (continued) Liquidity and Capital Resources For the 12 months ended June 30, 2022, our operating cash flow was $110 million and we had capital expenditures of $18 million. Though our operating cash flow in a given quarter has some variability due to the seasonal nature of our business, we have generated positive operating cash flow on a trailing 12 months basis for six consecutive quarters. We believe we remain well capitalized with $759 million of cash and cash equivalents and restricted cash as of June 30, 2022. We also have $102 million of borrowing capacity under our $105 million revolver, with the $3 million difference due to outstanding letters of credit as of June 30, 2022. In addition, over the last 12 months ended June 30, 2022, we used $202 million of cash for business combinations. We continue to deploy capital for portfolio additions in a disciplined manner aimed at achieving a high return on investment. Second Quarter 2022
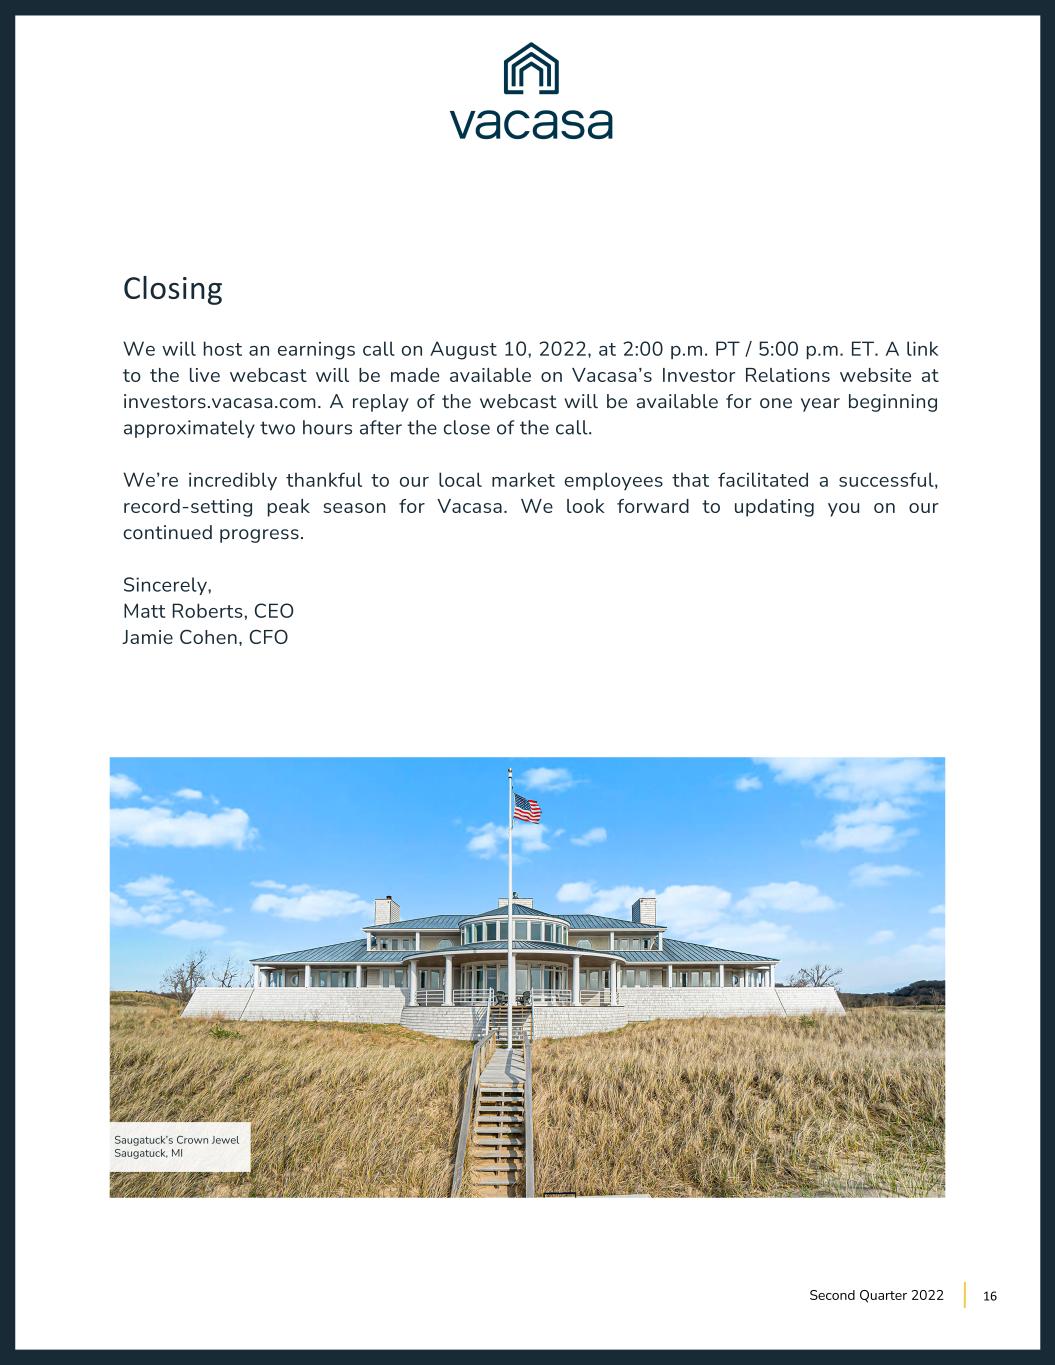
Saugatuck’s Crown Jewel Saugatuck, MI 16 Closing We will host an earnings call on August 10, 2022, at 2:00 p.m. PT / 5:00 p.m. ET. A link to the live webcast will be made available on Vacasa’s Investor Relations website at investors.vacasa.com. A replay of the webcast will be available for one year beginning approximately two hours after the close of the call. We’re incredibly thankful to our local market employees that facilitated a successful, record-setting peak season for Vacasa. We look forward to updating you on our continued progress. Sincerely, Matt Roberts, CEO Jamie Cohen, CFO Second Quarter 2022
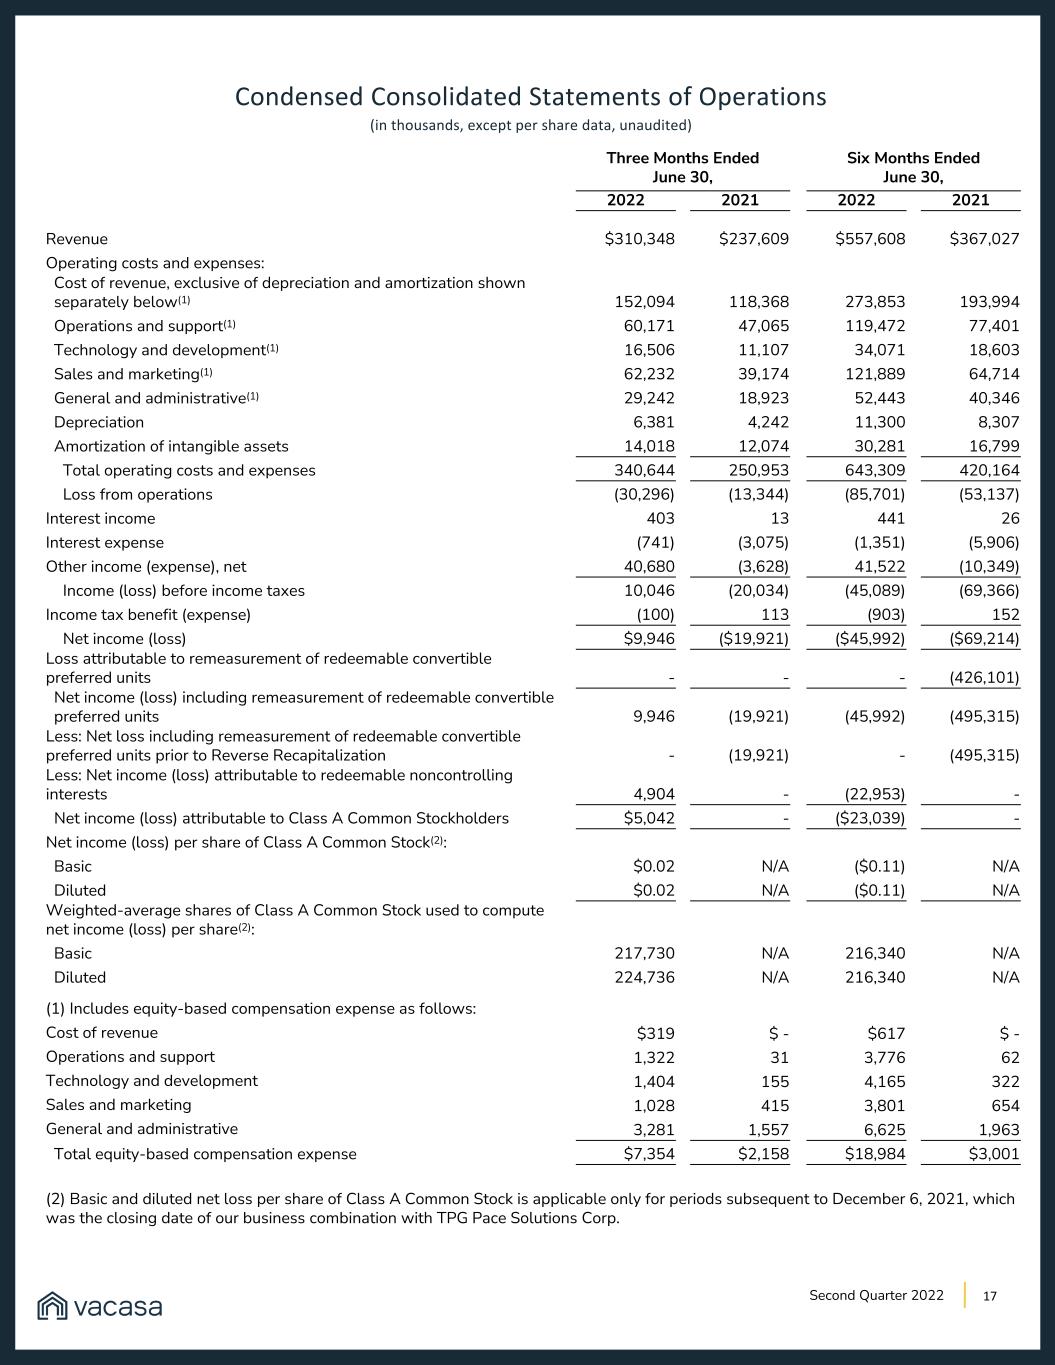
17Second Quarter 2022 Condensed Consolidated Statements of Operations (in thousands, except per share data, unaudited) Three Months Ended June 30, Six Months Ended June 30, 2022 2021 2022 2021 Revenue $310,348 $237,609 $557,608 $367,027 Operating costs and expenses: Cost of revenue, exclusive of depreciation and amortization shown separately below(1) 152,094 118,368 273,853 193,994 Operations and support(1) 60,171 47,065 119,472 77,401 Technology and development(1) 16,506 11,107 34,071 18,603 Sales and marketing(1) 62,232 39,174 121,889 64,714 General and administrative(1) 29,242 18,923 52,443 40,346 Depreciation 6,381 4,242 11,300 8,307 Amortization of intangible assets 14,018 12,074 30,281 16,799 Total operating costs and expenses 340,644 250,953 643,309 420,164 Loss from operations (30,296) (13,344) (85,701) (53,137) Interest income 403 13 441 26 Interest expense (741) (3,075) (1,351) (5,906) Other income (expense), net 40,680 (3,628) 41,522 (10,349) Income (loss) before income taxes 10,046 (20,034) (45,089) (69,366) Income tax benefit (expense) (100) 113 (903) 152 Net income (loss) $9,946 ($19,921) ($45,992) ($69,214) Loss attributable to remeasurement of redeemable convertible preferred units - - - (426,101) Net income (loss) including remeasurement of redeemable convertible preferred units 9,946 (19,921) (45,992) (495,315) Less: Net loss including remeasurement of redeemable convertible preferred units prior to Reverse Recapitalization - (19,921) - (495,315) Less: Net income (loss) attributable to redeemable noncontrolling interests 4,904 - (22,953) - Net income (loss) attributable to Class A Common Stockholders $5,042 - ($23,039) - Net income (loss) per share of Class A Common Stock(2): Basic $0.02 N/A ($0.11) N/A Diluted $0.02 N/A ($0.11) N/A Weighted-average shares of Class A Common Stock used to compute net income (loss) per share(2): Basic 217,730 N/A 216,340 N/A Diluted 224,736 N/A 216,340 N/A (1) Includes equity-based compensation expense as follows: Cost of revenue $319 $ - $617 $ - Operations and support 1,322 31 3,776 62 Technology and development 1,404 155 4,165 322 Sales and marketing 1,028 415 3,801 654 General and administrative 3,281 1,557 6,625 1,963 Total equity-based compensation expense $7,354 $2,158 $18,984 $3,001 (2) Basic and diluted net loss per share of Class A Common Stock is applicable only for periods subsequent to December 6, 2021, which was the closing date of our business combination with TPG Pace Solutions Corp.
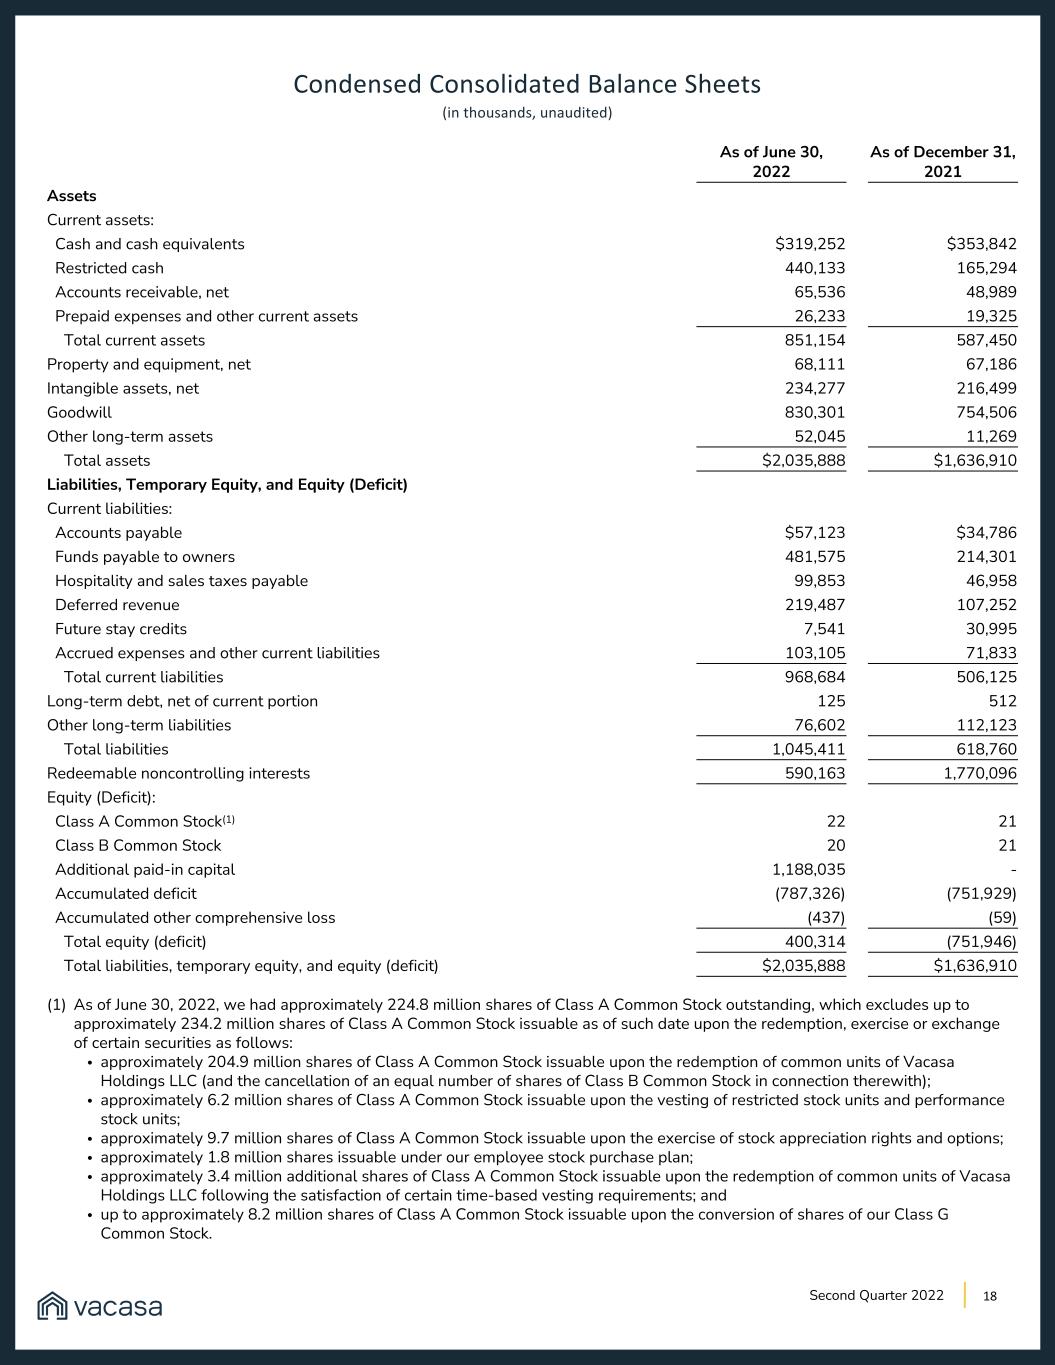
18Second Quarter 2022 Condensed Consolidated Balance Sheets (in thousands, unaudited) As of June 30, As of December 31, 2022 2021 Assets Current assets: Cash and cash equivalents $319,252 $353,842 Restricted cash 440,133 165,294 Accounts receivable, net 65,536 48,989 Prepaid expenses and other current assets 26,233 19,325 Total current assets 851,154 587,450 Property and equipment, net 68,111 67,186 Intangible assets, net 234,277 216,499 Goodwill 830,301 754,506 Other long-term assets 52,045 11,269 Total assets $2,035,888 $1,636,910 Liabilities, Temporary Equity, and Equity (Deficit) Current liabilities: Accounts payable $57,123 $34,786 Funds payable to owners 481,575 214,301 Hospitality and sales taxes payable 99,853 46,958 Deferred revenue 219,487 107,252 Future stay credits 7,541 30,995 Accrued expenses and other current liabilities 103,105 71,833 Total current liabilities 968,684 506,125 Long-term debt, net of current portion 125 512 Other long-term liabilities 76,602 112,123 Total liabilities 1,045,411 618,760 Redeemable noncontrolling interests 590,163 1,770,096 Equity (Deficit): Class A Common Stock(1) 22 21 Class B Common Stock 20 21 Additional paid-in capital 1,188,035 - Accumulated deficit (787,326) (751,929) Accumulated other comprehensive loss (437) (59) Total equity (deficit) 400,314 (751,946) Total liabilities, temporary equity, and equity (deficit) $2,035,888 $1,636,910 (1) As of June 30, 2022, we had approximately 224.8 million shares of Class A Common Stock outstanding, which excludes up to approximately 234.2 million shares of Class A Common Stock issuable as of such date upon the redemption, exercise or exchange of certain securities as follows: • approximately 204.9 million shares of Class A Common Stock issuable upon the redemption of common units of Vacasa Holdings LLC (and the cancellation of an equal number of shares of Class B Common Stock in connection therewith); • approximately 6.2 million shares of Class A Common Stock issuable upon the vesting of restricted stock units and performance stock units; • approximately 9.7 million shares of Class A Common Stock issuable upon the exercise of stock appreciation rights and options; • approximately 1.8 million shares issuable under our employee stock purchase plan; • approximately 3.4 million additional shares of Class A Common Stock issuable upon the redemption of common units of Vacasa Holdings LLC following the satisfaction of certain time-based vesting requirements; and • up to approximately 8.2 million shares of Class A Common Stock issuable upon the conversion of shares of our Class G Common Stock.
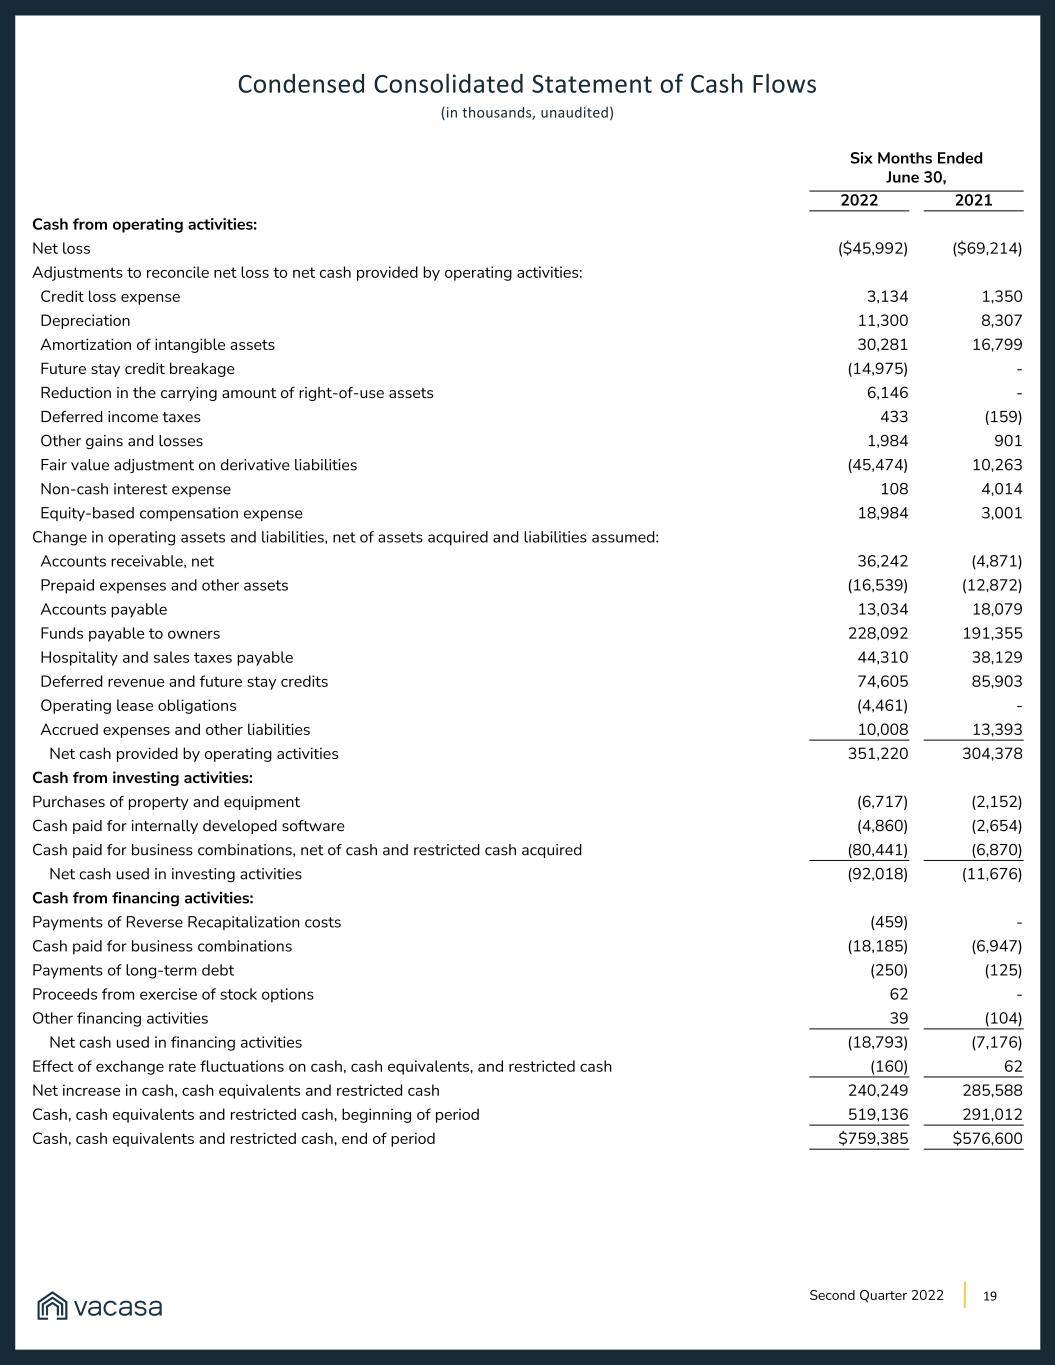
19Second Quarter 2022 Condensed Consolidated Statement of Cash Flows (in thousands, unaudited) Six Months Ended June 30, 2022 2021 Cash from operating activities: Net loss ($45,992) ($69,214) Adjustments to reconcile net loss to net cash provided by operating activities: Credit loss expense 3,134 1,350 Depreciation 11,300 8,307 Amortization of intangible assets 30,281 16,799 Future stay credit breakage (14,975) - Reduction in the carrying amount of right-of-use assets 6,146 - Deferred income taxes 433 (159) Other gains and losses 1,984 901 Fair value adjustment on derivative liabilities (45,474) 10,263 Non-cash interest expense 108 4,014 Equity-based compensation expense 18,984 3,001 Change in operating assets and liabilities, net of assets acquired and liabilities assumed: Accounts receivable, net 36,242 (4,871) Prepaid expenses and other assets (16,539) (12,872) Accounts payable 13,034 18,079 Funds payable to owners 228,092 191,355 Hospitality and sales taxes payable 44,310 38,129 Deferred revenue and future stay credits 74,605 85,903 Operating lease obligations (4,461) - Accrued expenses and other liabilities 10,008 13,393 Net cash provided by operating activities 351,220 304,378 Cash from investing activities: Purchases of property and equipment (6,717) (2,152) Cash paid for internally developed software (4,860) (2,654) Cash paid for business combinations, net of cash and restricted cash acquired (80,441) (6,870) Net cash used in investing activities (92,018) (11,676) Cash from financing activities: Payments of Reverse Recapitalization costs (459) - Cash paid for business combinations (18,185) (6,947) Payments of long-term debt (250) (125) Proceeds from exercise of stock options 62 - Other financing activities 39 (104) Net cash used in financing activities (18,793) (7,176) Effect of exchange rate fluctuations on cash, cash equivalents, and restricted cash (160) 62 Net increase in cash, cash equivalents and restricted cash 240,249 285,588 Cash, cash equivalents and restricted cash, beginning of period 519,136 291,012 Cash, cash equivalents and restricted cash, end of period $759,385 $576,600
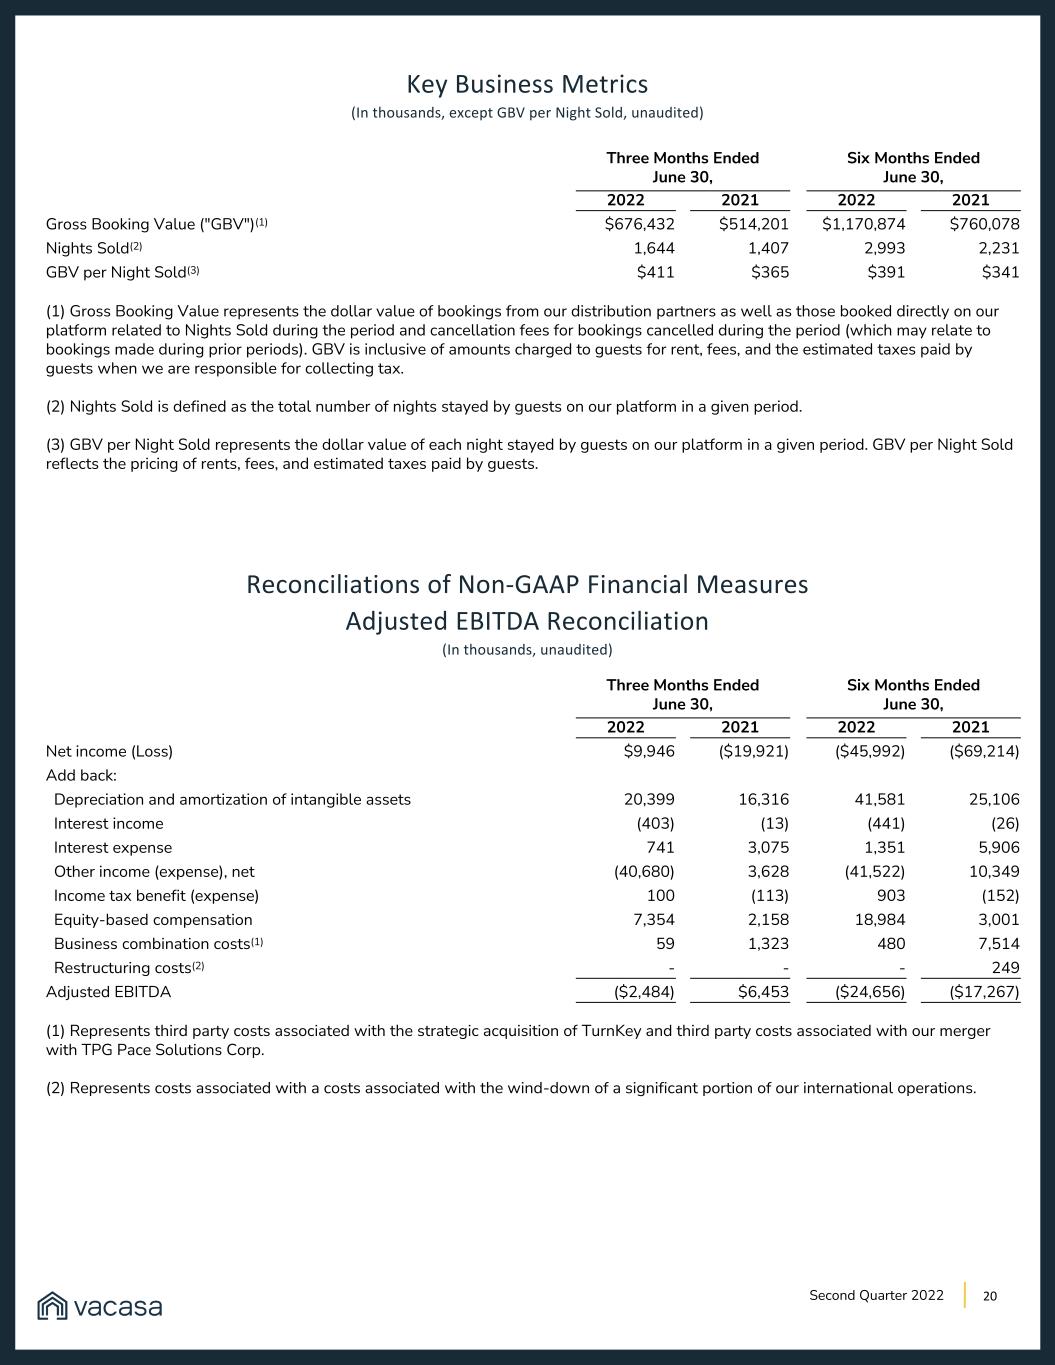
20Second Quarter 2022 Key Business Metrics (In thousands, except GBV per Night Sold, unaudited) Three Months Ended June 30, Six Months Ended June 30, 2022 2021 2022 2021 Gross Booking Value ("GBV")(1) $676,432 $514,201 $1,170,874 $760,078 Nights Sold(2) 1,644 1,407 2,993 2,231 GBV per Night Sold(3) $411 $365 $391 $341 (1) Gross Booking Value represents the dollar value of bookings from our distribution partners as well as those booked directly on our platform related to Nights Sold during the period and cancellation fees for bookings cancelled during the period (which may relate to bookings made during prior periods). GBV is inclusive of amounts charged to guests for rent, fees, and the estimated taxes paid by guests when we are responsible for collecting tax. (2) Nights Sold is defined as the total number of nights stayed by guests on our platform in a given period. (3) GBV per Night Sold represents the dollar value of each night stayed by guests on our platform in a given period. GBV per Night Sold reflects the pricing of rents, fees, and estimated taxes paid by guests. Reconciliations of Non-GAAP Financial Measures Adjusted EBITDA Reconciliation (In thousands, unaudited) Three Months Ended June 30, Six Months Ended June 30, 2022 2021 2022 2021 Net income (Loss) $9,946 ($19,921) ($45,992) ($69,214) Add back: Depreciation and amortization of intangible assets 20,399 16,316 41,581 25,106 Interest income (403) (13) (441) (26) Interest expense 741 3,075 1,351 5,906 Other income (expense), net (40,680) 3,628 (41,522) 10,349 Income tax benefit (expense) 100 (113) 903 (152) Equity-based compensation 7,354 2,158 18,984 3,001 Business combination costs(1) 59 1,323 480 7,514 Restructuring costs(2) - - - 249 Adjusted EBITDA ($2,484) $6,453 ($24,656) ($17,267) (1) Represents third party costs associated with the strategic acquisition of TurnKey and third party costs associated with our merger with TPG Pace Solutions Corp. (2) Represents costs associated with a costs associated with the wind-down of a significant portion of our international operations.
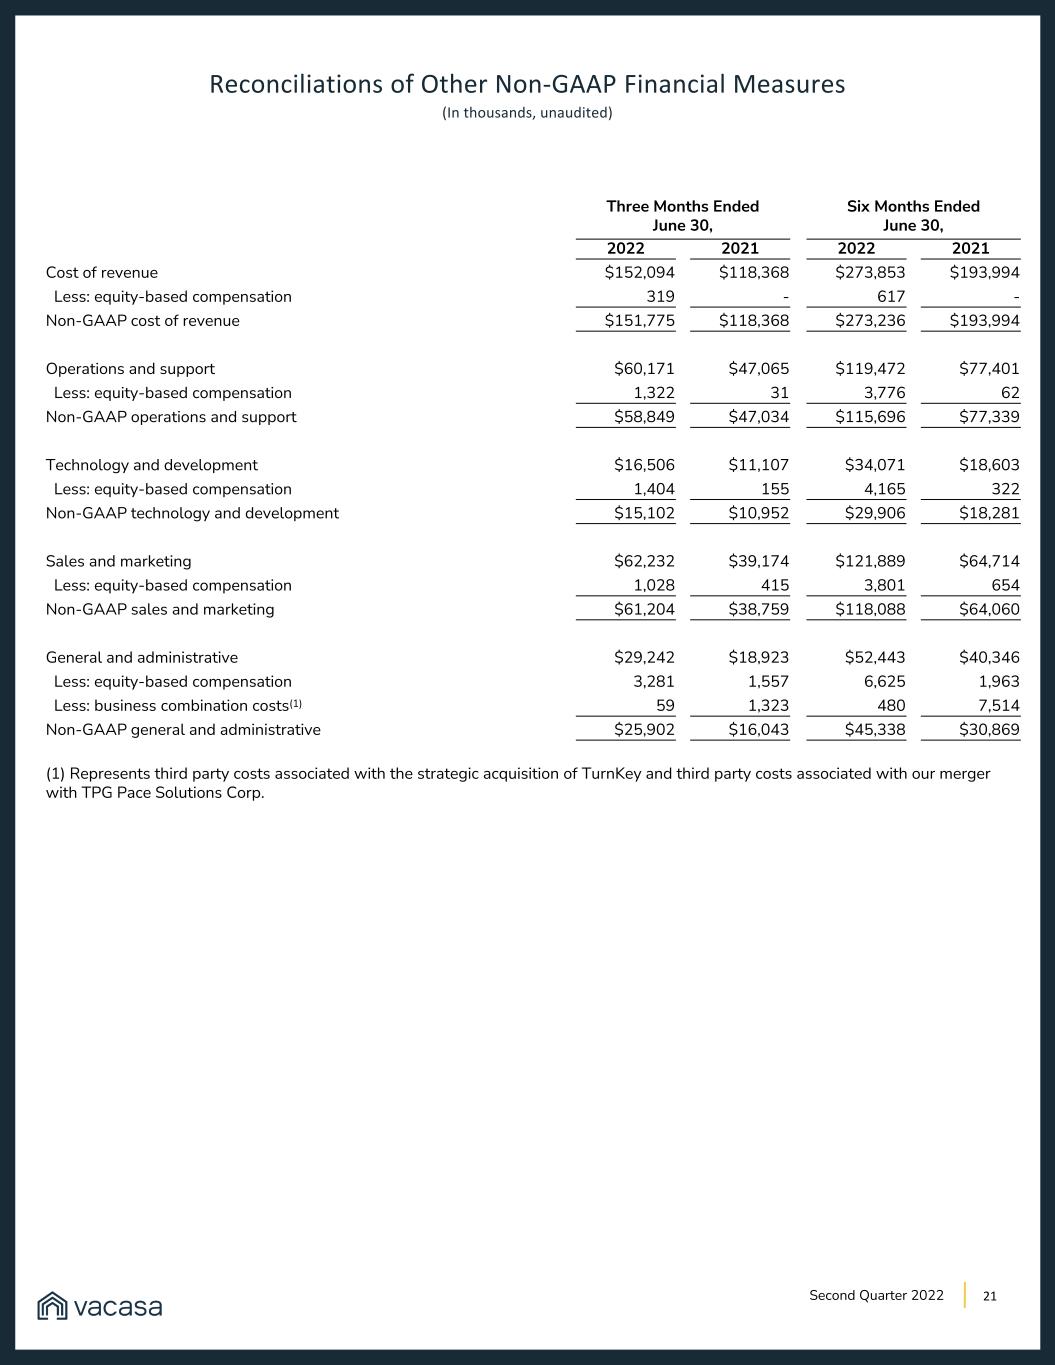
21Second Quarter 2022 Reconciliations of Other Non-GAAP Financial Measures (In thousands, unaudited) Three Months Ended June 30, Six Months Ended June 30, 2022 2021 2022 2021 Cost of revenue $152,094 $118,368 $273,853 $193,994 Less: equity-based compensation 319 - 617 - Non-GAAP cost of revenue $151,775 $118,368 $273,236 $193,994 Operations and support $60,171 $47,065 $119,472 $77,401 Less: equity-based compensation 1,322 31 3,776 62 Non-GAAP operations and support $58,849 $47,034 $115,696 $77,339 Technology and development $16,506 $11,107 $34,071 $18,603 Less: equity-based compensation 1,404 155 4,165 322 Non-GAAP technology and development $15,102 $10,952 $29,906 $18,281 Sales and marketing $62,232 $39,174 $121,889 $64,714 Less: equity-based compensation 1,028 415 3,801 654 Non-GAAP sales and marketing $61,204 $38,759 $118,088 $64,060 General and administrative $29,242 $18,923 $52,443 $40,346 Less: equity-based compensation 3,281 1,557 6,625 1,963 Less: business combination costs(1) 59 1,323 480 7,514 Non-GAAP general and administrative $25,902 $16,043 $45,338 $30,869 (1) Represents third party costs associated with the strategic acquisition of TurnKey and third party costs associated with our merger with TPG Pace Solutions Corp.
22 About Vacasa Vacasa is the leading vacation rental management platform in North America, transforming the vacation rental experience by integrating purpose-built technology with expert local and national teams. Homeowners enjoy earning significant incremental income on one of their most valuable assets, delivered by the company’s unmatched technology that adjusts rates in real time to maximize revenue. Guests can relax comfortably in Vacasa’s 35,000+ homes across more than 400 destinations in North America, Belize and Costa Rica, knowing that 24/7 support is just a phone call away. In addition to enabling guests to search, discover and book its properties on Vacasa.com and the Vacasa Guest App, Vacasa provides valuable, professionally managed inventory to top channel partners, including Airbnb, Booking.com and Vrbo. For more information, visit https://www.vacasa.com/press. Second Quarter 2022
Forward Looking Statements Certain statements made in this letter are considered “forward-looking statements” within the meaning of the “safe harbor” provisions of the Private Securities Litigation Reform Act of 1995. Forward-looking statements may be identified by the use of words such as “anticipate,” “believe,” “expect,” “estimate,” “plan,” “outlook,” and “project” and other similar expressions that predict or indicate future events or trends or that are not statements of historical matters. These forward-looking statements reflect Vacasa’s current analysis of existing information and are subject to various risks and uncertainties. As a result, caution must be exercised in relying on forward-looking statements. Due to known and unknown risks, actual results may differ materially from Vacasa’s expectations and projections. The following factors, among others, could cause actual results to differ materially from those described in these forward-looking statements: Vacasa’s ability to achieve profitability; Vacasa’s ability to manage and sustain its growth; the effects of the novel coronavirus (COVID-19) pandemic, including as a result of new strains or variants of the virus, on Vacasa’s business, the travel industry, travel trends, and the global economy generally; the effects of global economic and capital markets conditions, such as rising energy prices, inflation and interest rates, on Vacasa’s business, the travel industry, travel trends, and the global economy generally; Vacasa’s expectations regarding its financial performance, including its revenue, costs, and Adjusted EBITDA; Vacasa’s ability to attract and retain homeowners and guests; Vacasa’s ability to compete in its industry; Vacasa’s expectations regarding the resilience of its model, including in areas such as domestic travel, short-distance travel, and travel outside of top cities; the effects of seasonal trends on its results of operations; Vacasa’s ability to make required payments under its credit agreement and to comply with the various requirements of its indebtedness; Vacasa’s ability to effectively manage its exposure to fluctuations in foreign currency exchange rates; the anticipated increase in expenses associated with being a public company; anticipated trends, developments, and challenges in Vacasa’s industry, business, and the highly competitive markets in which it operates; the sufficiency of Vacasa’s cash and cash equivalents to meet its liquidity needs; Vacasa’s ability to anticipate market needs or develop new or enhanced offerings and services to meet those needs; Vacasa’s ability to expand into new markets and businesses, expand its range of homeowner services and pursue strategic acquisition and partnership opportunities; Vacasa’s ability to acquire and integrate companies and assets; Vacasa’s ability to manage expansion into international markets; Vacasa’s ability to stay in compliance with laws and regulations, including tax laws, that currently apply or may become applicable to its business both in the United States and internationally and its expectations regarding various laws and restrictions that relate to its business; Vacasa’s expectations regarding its tax liabilities and the adequacy of its reserves; Vacasa’s ability to effectively manage its growth and expand its infrastructure and maintain its corporate culture; Vacasa’s ability to identify, recruit, and retain skilled personnel, including key members of senior management; the effects of labor shortages and increases in wage and labor costs in its industry; the safety, affordability, and convenience of Vacasa’s platform and its offerings; Vacasa’s ability to keep pace with technological and competitive developments; Vacasa’s ability to maintain and enhance brand awareness; Vacasa’s ability to successfully defend litigation brought against it and its ability to secure adequate insurance coverage to protect the business and operations; and Vacasa’s ability to maintain, protect, and enhance its intellectual property. You should carefully consider the foregoing factors and the other risks and uncertainties described in the “Risk Factors” section of Vacasa’s Annual Report on Form 10-K for the fiscal year ended December 31, 2021 filed with the Securities and Exchange Commission (the “SEC”) and our Quarterly Report on Form 10-Q for the quarterly period ended March 31, 2022, as updated by its other reports filed with the SEC, including, but not limited to, its Quarterly Report on Form 10-Q for the quarterly period ended June 30, 2022. These filings identify and address other important risks and uncertainties that could cause actual events and results to differ materially from those contained in the forward-looking statements. 23Second Quarter 2022
Use of Non-GAAP Financial Measures This letter includes Adjusted EBITDA, Non-GAAP cost of revenue, Non-GAAP operations and support expense, Non-GAAP technology and development expense, Non-GAAP sales and marketing expense and Non-GAAP general and administrative expense (collectively, the “Non-GAAP Financial Measures”), which are financial measures that are not defined by or presented in accordance with accounting principles generally accepted in the United States (“GAAP”). Reconciliation of the Non-GAAP Financial Measures to their most directly comparable GAAP measure is contained in tabular format below. We use the Non-GAAP Financial Measures to evaluate our performance, identify trends, formulate financial projections, and make strategic decisions. Adjusted EBITDA is defined as net income (loss) excluding: (1) depreciation and acquisition-related items consisting of amortization of intangible assets and impairments of goodwill and intangible assets, if applicable; (2) interest income and expense; (3) any other income or expense not earned or incurred during our normal course of business; (4) any income tax benefit or expense; (5) equity-based compensation costs; (6) one-time costs related to strategic business combinations; and (7) restructuring costs. We calculate each of Non-GAAP costs of revenue, Non-GAAP operations and support expense, Non-GAAP technology and development expense, Non-GAAP sales and marketing expenses and Non-GAAP general and administrative expense by excluding, as applicable, the non-cash expenses arising from the grant of stock-based awards and one-time costs related to strategic business combinations. We believe these Non-GAAP Financial Measures, when taken together with their corresponding comparable GAAP financial measures, are useful for analysts and investors. These Non-GAAP Financial Measures allow for a more meaningful comparison between our performance and that of our competitors by excluding items that are non-cash in nature or the amount and timing of these items is unpredictable or one-time in nature, not driven by the performance of our core business operations and renders comparisons with prior periods and competitors less meaningful. The Non-GAAP Financial Measures have significant limitations as analytical tools, should be considered as supplemental in nature, and are not meant as a substitute for any financial information prepared in accordance with GAAP. We believe the Non-GAAP Financial Measures provide useful information to investors and others in understanding and evaluating our results of operations, are frequently used by these parties in evaluating companies in our industry, and provide useful measures for period-to-period comparisons of our business performance. Moreover, we present the Non-GAAP Financial Measures in this letter because they are key measurements used by our management internally to make operating decisions, including those related to analyzing operating expenses, evaluating performance, and performing strategic planning and annual budgeting. The Non-GAAP Financial Measures have significant limitations as analytical tools, including that: • these measures do not reflect our cash expenditures, or future requirements for capital expenditures or contractual commitments; • these measures do not reflect changes in, or cash requirements for, our working capital needs; • Adjusted EBITDA does not reflect the interest expense, or the cash required to service interest or principal payments, on our debt; • some of these measures exclude stock-based compensation expense, which has been, and will continue to be for the foreseeable future, a significant recurring expense in our business and an important part of our compensation strategy; • Adjusted EBITDA and Non-GAAP general and administrative expense do not include one-time costs related to strategic business combinations; • the measures do not reflect our tax expense or the cash required to pay our taxes; and • with respect to Adjusted EBITDA, although depreciation and amortization are non-cash charges, the assets being depreciated and amortized will often have to be replaced in the future and such measure does not reflect any cash requirements for such replacements. The Non-GAAP Financial Measures are supplemental measures of our performance that are neither required by, nor presented in accordance with, GAAP. These Non-GAAP Financial Measures should not be considered as substitutes for GAAP financial measures such as net income (loss), operating expenses or any other performance measures derived in accordance with GAAP. Also, in the future we may incur expenses or charges such as those being adjusted in the calculation of these Non-GAAP Financial Measures. Our presentation of these Non-GAAP Financial Measures should not be construed as an inference that future results will be unaffected by unusual or nonrecurring items and may be different from similarly titled metrics or measures presented by other companies. Our third quarter 2022 and full year 2022 guidance also includes Adjusted EBITDA. A reconciliation of the Company’s Adjusted EBITDA guidance to the most directly comparable GAAP financial measure cannot be provided without unreasonable efforts and is not provided herein because of the inherent difficulty in forecasting and quantifying certain amounts that are necessary for such reconciliations, including adjustments that are made for depreciation and amortization of intangible assets, equity-based compensation expense, business combination costs, restructuring charges and other adjustments reflected in our reconciliation of historical Adjusted EBITDA, the amounts of which could be material. 24Second Quarter 2022


