
Q2 FY25 Results Presentation NASDAQ: IREN February 12, 2025
2 DISCLAIMER Forwa rd-Looking Sta tements This investor update includes “forward-looking statements” within the meaning of the Private Securities Litigation Reform Act of 1995. Forward-looking statements generally relate to future events or IREN’s future financial or operating performance. For example, forward- looking statements include but are not limited to the Company’s business strategy, expected operational and financial results, and expected increase in power capacity and hashrate. In some cases, you can identify forward-looking statements by terminology such as “anticipate,” “believe,” “may,” “can,” “should,” “could,” “might,” “plan,” “possible,” “project,” “strive,” “budget,” “forecast,” “expect,” “intend,” “target”, “will,” “estimate,” “predict,” “potential,” “continue,” “scheduled” or the negatives of these terms or variations of them or similar terminology, but the absence of these words does not mean that statement is not forward-looking. Such forward-looking statements are subject to risks, uncertainties, and other factors which could cause actual results to differ materially from those expressed or implied by such forward-looking statements. In addition, any statements or information that refer to expectations, beliefs, plans, projections, objectives, performance or other characterizations of future events or circumstances, including any underlying assumptions, are forward-looking. These forward-looking statements are based on management’s current expectations and beliefs. These statements are neither promises nor guarantees, but involve known and unknown risks, uncertainties and other important factors that may cause IREN’s actual results, performance or achievements to be materially different from any future results performance or achievements expressed or implied by the forward looking statements, including, but not limited to: Bitcoin price and foreign currency exchange rate fluctuations; IREN’s ability to obtain additional capital on commercially reasonable terms and in a timely manner to meet its capital needs and facilitate its expansion plans; the terms of any future financing or any refinancing, restructuring or modification to the terms of any future financing, which could require IREN to comply with onerous covenants or restrictions, and its ability to service its debt obligations, any of which could restrict its business operations and adversely impact its financial condition, cash flows and results of operations; IREN’s ability to successfully execute on its growth strategies and operating plans, including its ability to continue to develop its existing data center sites, including to design and deploy direct-to-chip liquid cooling systems and to diversify and expand into the market for high performance computing (“HPC”) solutions it may offer (including the market for cloud services (“AI Cloud Services”) and potential colocation services; IREN’s limited experience with respect to new markets it has entered or may seek to enter, including the market for HPC solutions (including AI Cloud Services and potential colocation services); expectations with respect to the ongoing profitability, viability, operability, security, popularity and public perceptions of the Bitcoin network; expectations with respect to the profitability, viability, operability, security, popularity and public perceptions of any current and future HPC solutions (including AI Cloud Services and potential colocation services) that IREN offers; IREN’s ability to secure and retain customers on commercially reasonable terms or at all, particularly as it relates to its strategy to expand into markets for HPC solutions (including AI Cloud Services and potential colocation services); IREN’s ability to manage counterparty risk (including credit risk) associated with any current or future customers, including customers of its HPC solutions (including AI Cloud Services and potential colocation services) and other counterparties; the risk that any current or future customers, including customers of its HPC solutions (including AI Cloud Services and potential colocation services), or other counterparties may terminate, default on or underperform their contractual obligations; Bitcoin global hashrate fluctuations; IREN’s ability to secure renewable energy, renewable energy certificates, power capacity, facilities and sites on commercially reasonable terms or at all; delays associated with, or failure to obtain or complete, permitting approvals, grid connections and other development activities customary for greenfield or brownfield infrastructure projects; IREN’s reliance on power and utilities providers, third party mining pools, exchanges, banks, insurance providers and its ability to maintain relationships with such parties; expectations regarding availability and pricing of electricity; IREN’s participation and ability to successfully participate in demand response products and services and other load management programs run, operated or offered by electricity network operators, regulators or electricity market operators; the availability, reliability and/or cost of electricity supply, hardware and electrical and data center infrastructure, including with respect to any electricity outages and any laws and regulations that may restrict the electricity supply available to IREN; any variance between the actual operating performance of IREN’s miner hardware achieved compared to the nameplate performance including hashrate; IREN’s ability to curtail its electricity consumption and/or monetize electricity depending on market conditions, including changes in Bitcoin mining economics and prevailing electricity prices; actions undertaken by electricity network and market operators, regulators, governments or communities in the regions in which IREN operates; the availability, suitability, reliability and cost of internet connections at IREN’s facilities; IREN’s ability to secure additional hardware, including hardware for Bitcoin mining and any current or future HPC solutions (including AI Cloud Services and potential colocation services) it offers, on commercially reasonable terms or at all, and any delays or reductions in the supply of such hardware or increases in the cost of procuring such hardware; expectations with respect to the useful life and obsolescence of hardware (including hardware for Bitcoin mining as well as hardware for other applications, including any current or future HPC solutions (including AI Cloud Services and potential colocation services) IREN offers); delays, increases in costs or reductions in the supply of equipment used in IREN’s operations; IREN’s ability to operate in an evolving regulatory environment; IREN’s ability to successfully operate and maintain its property and infrastructure; reliability and performance of IREN’s infrastructure compared to expectations; malicious attacks on IREN’s property, infrastructure or IT systems; IREN’s ability to maintain in good standing the operating and other permits and licenses required for its operations and business; IREN’s ability to obtain, maintain, protect and enforce its intellectual property rights and confidential information; any intellectual property infringement and product liability claims; whether the secular trends IREN expects to drive growth in its business materialize to the degree it expects them to, or at all; any pending or future acquisitions, dispositions, joint ventures or other strategic transactions; the occurrence of any environmental, health and safety incidents at IREN’s sites, and any material costs relating to environmental, health and safety requirements or liabilities; damage to IREN’s property and infrastructure and the risk that any insurance IREN maintains may not fully cover all potential exposures; ongoing proceedings relating to the default by two of the Company’s wholly-owned special purpose vehicles under limited recourse equipment financing facilities; ongoing securities litigation relating in part to the default, and any future litigation, claims and/or regulatory investigations, and the costs, expenses, use of resources, diversion of management time and efforts, liability and damages that may result therefrom; IREN's failure to comply with any laws including the anti-corruption laws of the United States and various international jurisdictions; any failure of IREN's compliance and risk management methods; any laws, regulations and ethical standards that may relate to IREN’s business, including those that relate to Bitcoin and the Bitcoin mining industry and those that relate to any other services it offers, including laws and regulations related to data privacy, cybersecurity and the storage, use or processing of information and consumer laws; IREN’s ability to attract, motivate and retain senior management and qualified employees; increased risks to IREN’s global operations including, but not limited to, political instability, acts of terrorism, theft and vandalism, cyberattacks and other cybersecurity incidents and unexpected regulatory and economic sanctions changes, among other things; climate change, severe weather conditions and natural and man-made disasters that may materially adversely affect IREN’s business, financial condition and results of operations; public health crises, including an outbreak of an infectious disease and any governmental or industry measures taken in response; IREN’s ability to remain competitive in dynamic and rapidly evolving industries; damage to IREN’s brand and reputation; expectations relating to Environmental, Social or Governance issues or reporting; the costs of being a public company; the increased regulatory and compliance costs of IREN ceasing to be a foreign private issuer and an emerging growth company, as a result of which we will be required, among other things, to file periodic reports and registration statements on U.S. domestic issuer forms with the SEC commencing with our next fiscal year, and we will also be required to prepare our financial statements in accordance with U.S. GAAP rather than IFRS, and to modify certain of our policies to comply with corporate governance practices required of a U.S. domestic issuer; that we do not currently pay any cash dividends on our ordinary shares, and may not in the foreseeable future and, accordingly, your ability to achieve a return on your investment in our ordinary shares will depend on appreciation, if any, in the price of our ordinary shares; and other important factors discussed under the caption “Risk Factors” in IREN’s annual report on Form 20-F filed with the SEC on August 28, 2024 as such factors may be updated from time to time in its other filings with the SEC, accessible on the SEC’s website at www.sec.gov and the Investor Relations section of IREN’s website at https://investors.iren.com. These and other important factors could cause actual results to differ materially from those indicated by the forward-looking statements made in this investor update. Any forward-looking statement that IREN makes in this investor update speaks only as of the date of such statement. Except as required by law, IREN disclaims any obligation to update or revise, or to publicly announce any update or revision to, any of the forward-looking statements, whether as a result of new information, future events or otherwise. Non-IFRS Financ ial Mea sures This investor update includes non-IFRS financial measures, including Net electricity costs, hardware profit margin, Adjusted EBITDA and Adjusted EBITDA Margin. We provide these measures in addition to, and not as a substitute for, measures of financial performance prepared in accordance with IFRS. There are a number of limitations related to the use of Net electricity costs, Adjusted EBTIDA and Adjusted EBITDA Margin. For example, other companies, including companies in our industry, may calculate these measures differently. The Company believes that these measures are important and supplement discussions and analysis of its results of operations and enhances an understanding of its operating performance. EBITDA is calculated as our IFRS profit/(loss) after income tax expense, excluding interest income, finance expense, income tax expense and benefit and, depreciation, which are important components of our IFRS profit/(loss) after income tax expense. Further, “Adjusted EBITDA” also excludes share-based payments expense, which is an important component of our IFRS profit/(loss) after income tax expense, foreign exchange gains and losses, impairment of assets, reversal of impairment of assets, certain other non-recurring income, gain or loss on disposal of property, plant and equipment, gain on disposal of subsidiaries, unrealized fair value gains and losses on financial assets and certain other expense items. Net electricity costs is calculated as our IFRS Electricity charges net of Realized gain/(loss) on financial asset, reversal of unrealized loss (included in Realized gain/(loss) on financial asset), ERS revenue (included in Other income) and ERS fees (included in Other operating expenses), and excludes the cost of Renewable Energy Certificates (RECs). Hardware profit margin is calculated Bitcoin mining revenue less Bitcoin mining electricity costs, divided by Bitcoin mining revenue and excluding all other costs. Industry a nd Sta tistic a l Da ta This presentation includes industry data, statistical data, estimates and other forecasts that may have been obtained from periodic industry publications, third-party studies and surveys, filings of public companies in our industry, internal company surveys, and our review and analysis of market conditions, surveys and industry feedback. Our expectations regarding market and industry data, including expected growth rates, are subject to change based on our ongoing analysis of prevailing market and industry conditions and, as a result, assumptions based on such expectations may not be reliable indicators of future results. We undertake no obligation to update such figures in the future. These sources include government and industry sources, including third-party websites. Industry publications and surveys generally state that the information contained therein has been obtained from sources believed to be reliable. Although we believe the industry data to be reliable as of the date of this presentation, this information could prove to be inaccurate. Industry data could be wrong because of the method by which sources obtained their data and because information cannot always be verified with complete certainty due to the limits on the availability and reliability of raw data, the voluntary nature of the data gathering process, and other limitations and uncertainties. In addition, we do not know all of the assumptions regarding general economic conditions or growth that were used in preparing the forecasts from the sources relied upon or cited herein. Further, certain financial measures and statistical information in this document have been subject to rounding adjustments. Accordingly, the sum of certain data may not conform to the expressed total.
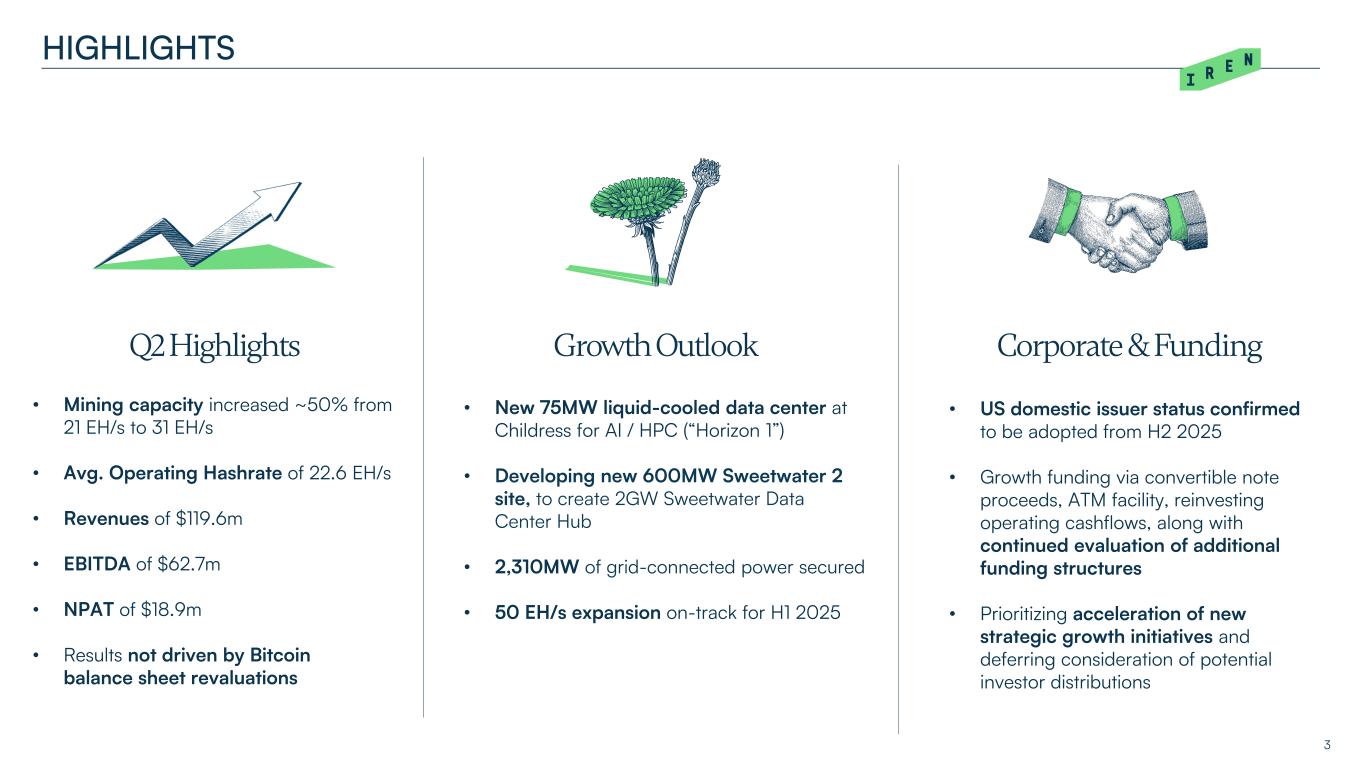
HIGHLIGHTS 3 Growth Outlook • New 75MW liquid-cooled data center at Childress for AI / HPC (“Horizon 1”) • Developing new 600MW Sweetwater 2 site, to create 2GW Sweetwater Data Center Hub • 2,310MW of grid-connected power secured • 50 EH/s expansion on-track for H1 2025 Q2 Highlights • Mining capacity increased ~50% from 21 EH/s to 31 EH/s • Avg. Operating Hashrate of 22.6 EH/s • Revenues of $119.6m • EBITDA of $62.7m • NPAT of $18.9m • Results not driven by Bitcoin balance sheet revaluations Corporate & Funding • US domestic issuer status confirmed to be adopted from H2 2025 • Growth funding via convertible note proceeds, ATM facility, reinvesting operating cashflows, along with continued evaluation of additional funding structures • Prioritizing acceleration of new strategic growth initiatives and deferring consideration of potential investor distributions

Horizon 1 HORIZON 1 - OVERVIEW 4 75MW gross (50MW IT load) Direct-to chip liquid cooling, power redundancy Designed to support NVIDIA Blackwell (200kW rack density) $300-350m illustrative capex (~$6-7m per IT MW) Target completion H2 2025 Childress Project (Feb 2025) 75MW Liquid-Cooled Childress Data Center
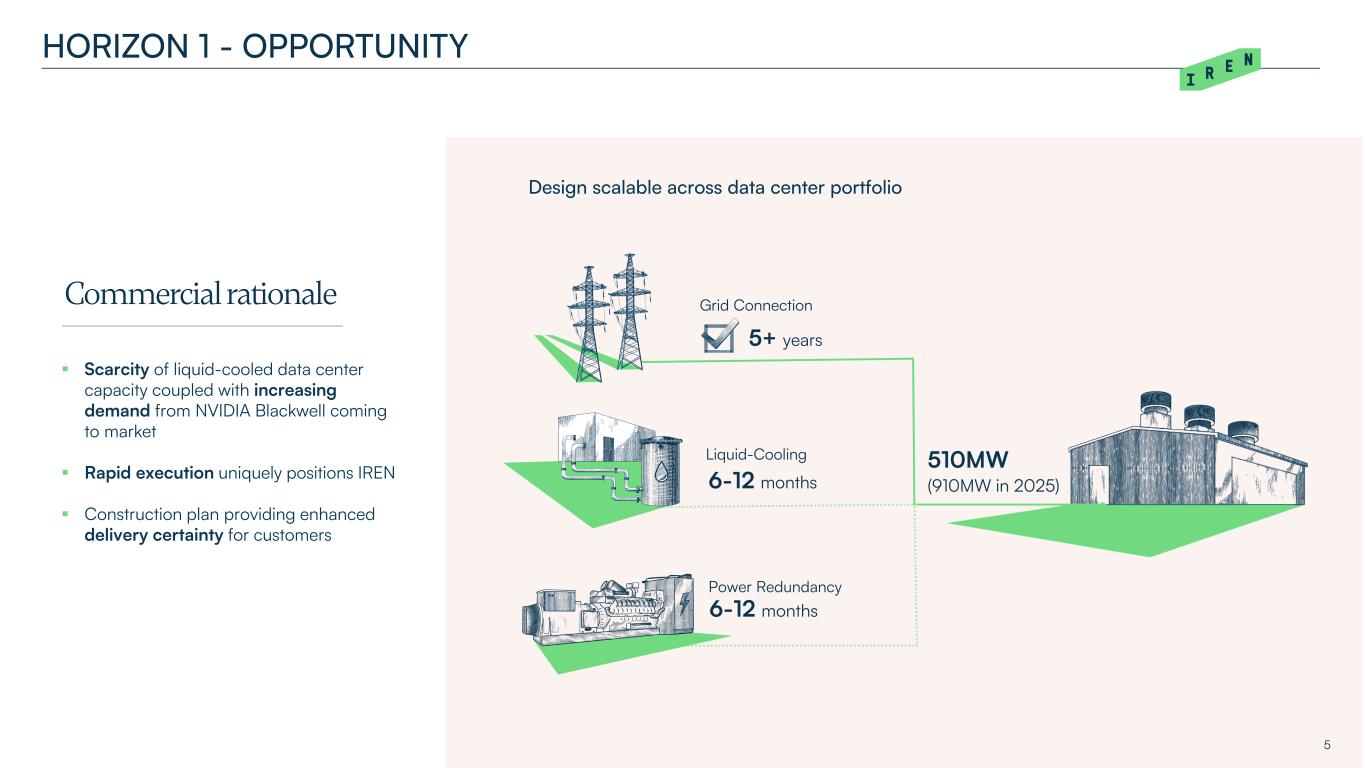
HORIZON 1 - OPPORTUNITY 5 Scarcity of liquid-cooled data center capacity coupled with increasing demand from NVIDIA Blackwell coming to market Rapid execution uniquely positions IREN Construction plan providing enhanced delivery certainty for customers Design scalable across data center portfolio Grid Connection Liquid-Cooling Power Redundancy 5+ years 6-12 months 510MW (910MW in 2025) 6-12 months Commercial rationale
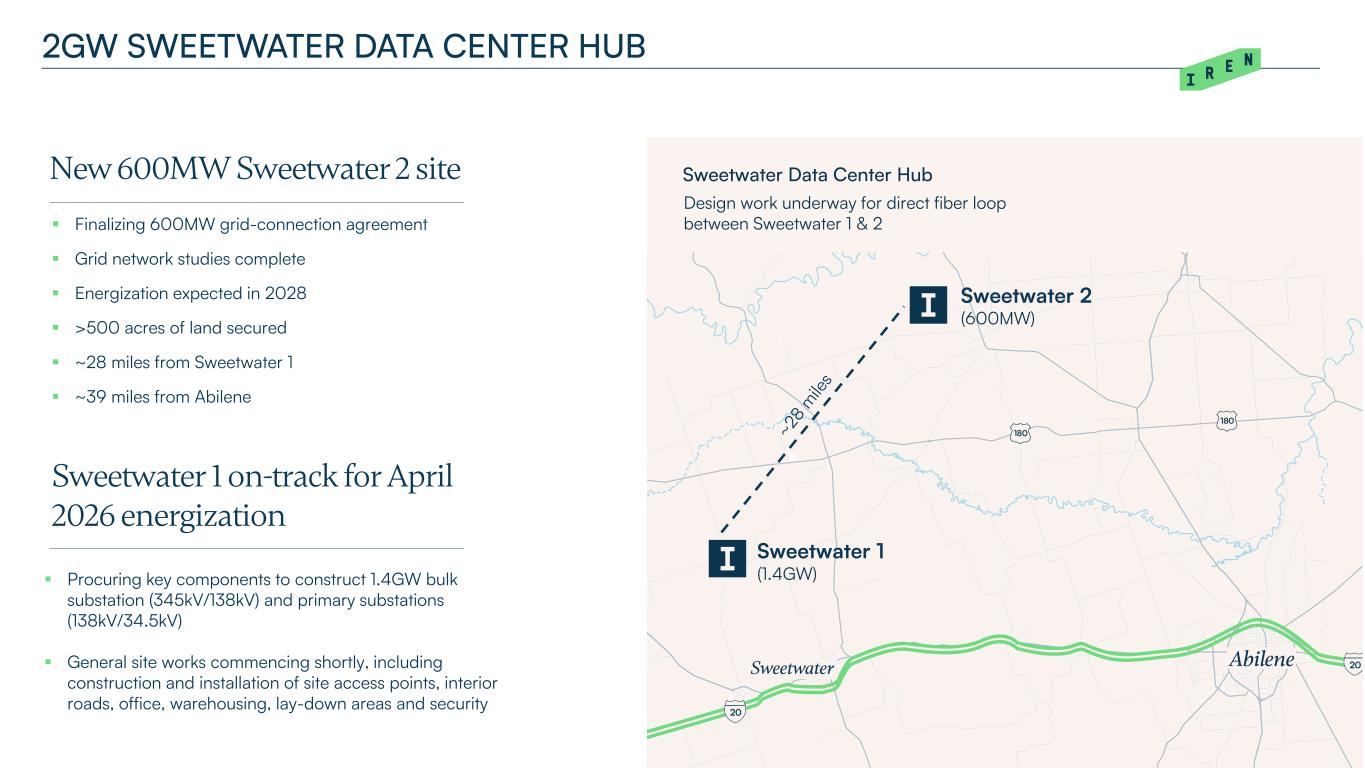
2GW SWEETWATER DATA CENTER HUB 6 New 600MW Sweetwater 2 site Finalizing 600MW grid-connection agreement Grid network studies complete Energization expected in 2028 >500 acres of land secured ~28 miles from Sweetwater 1 ~39 miles from Abilene Procuring key components to construct 1.4GW bulk substation (345kV/138kV) and primary substations (138kV/34.5kV) General site works commencing shortly, including construction and installation of site access points, interior roads, office, warehousing, lay-down areas and security Sweetwater Data Center Hub Design work underway for direct fiber loop between Sweetwater 1 & 2 Sweetwater 1 on-track for April 2026 energization Sweetwater 1 (1.4GW) Sweetwater 2 (600MW)
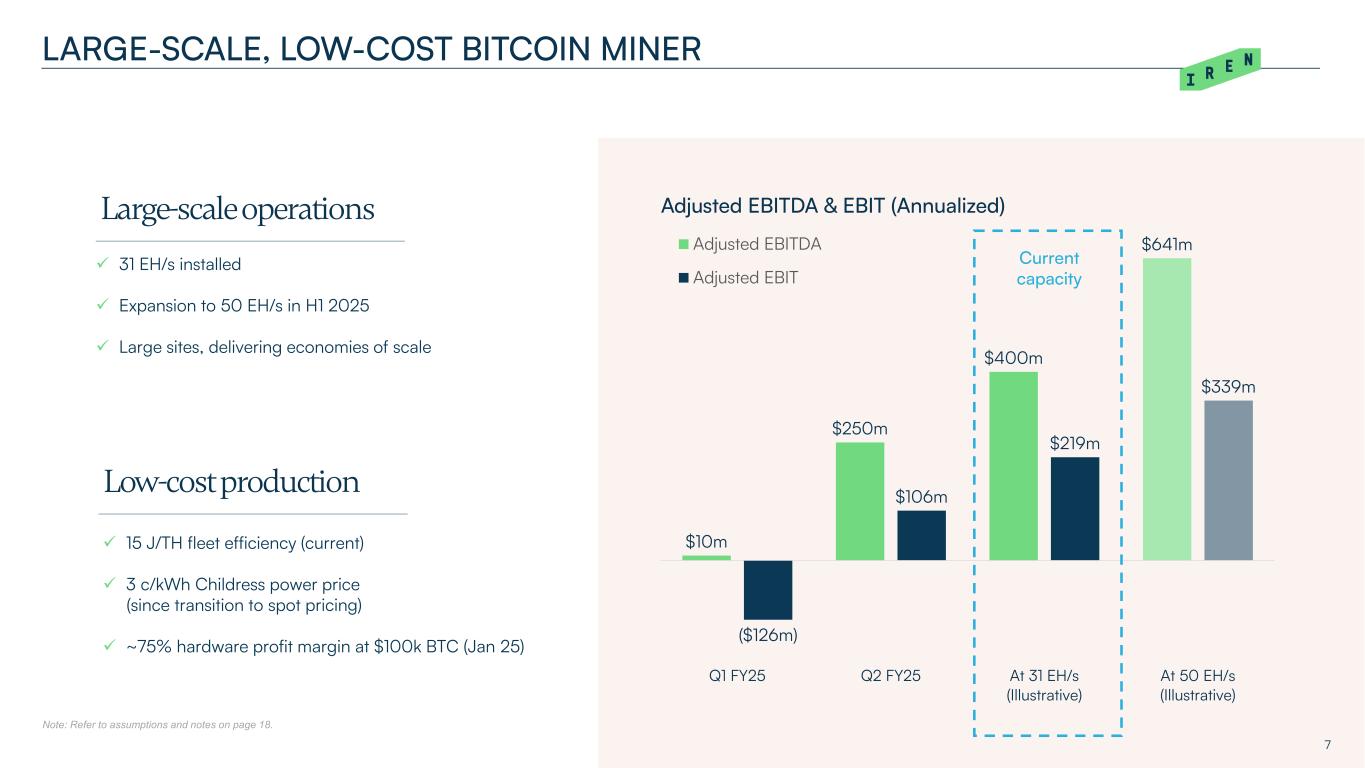
LARGE-SCALE, LOW-COST BITCOIN MINER Note: Refer to assumptions and notes on page 18. $10m $250m $400m $641m ($126m) $106m $219m $339m Q1 FY25 Q2 FY25 At 31 EH/s (Illustrative) At 50 EH/s (Illustrative) Adjusted EBITDA & EBIT (Annualized) Adjusted EBITDA Adjusted EBIT 31 EH/s installed Expansion to 50 EH/s in H1 2025 Large sites, delivering economies of scale 15 J/TH fleet efficiency (current) 3 c/kWh Childress power price (since transition to spot pricing) ~75% hardware profit margin at $100k BTC (Jan 25) 7 Current capacity Large-scale operations Low-cost production
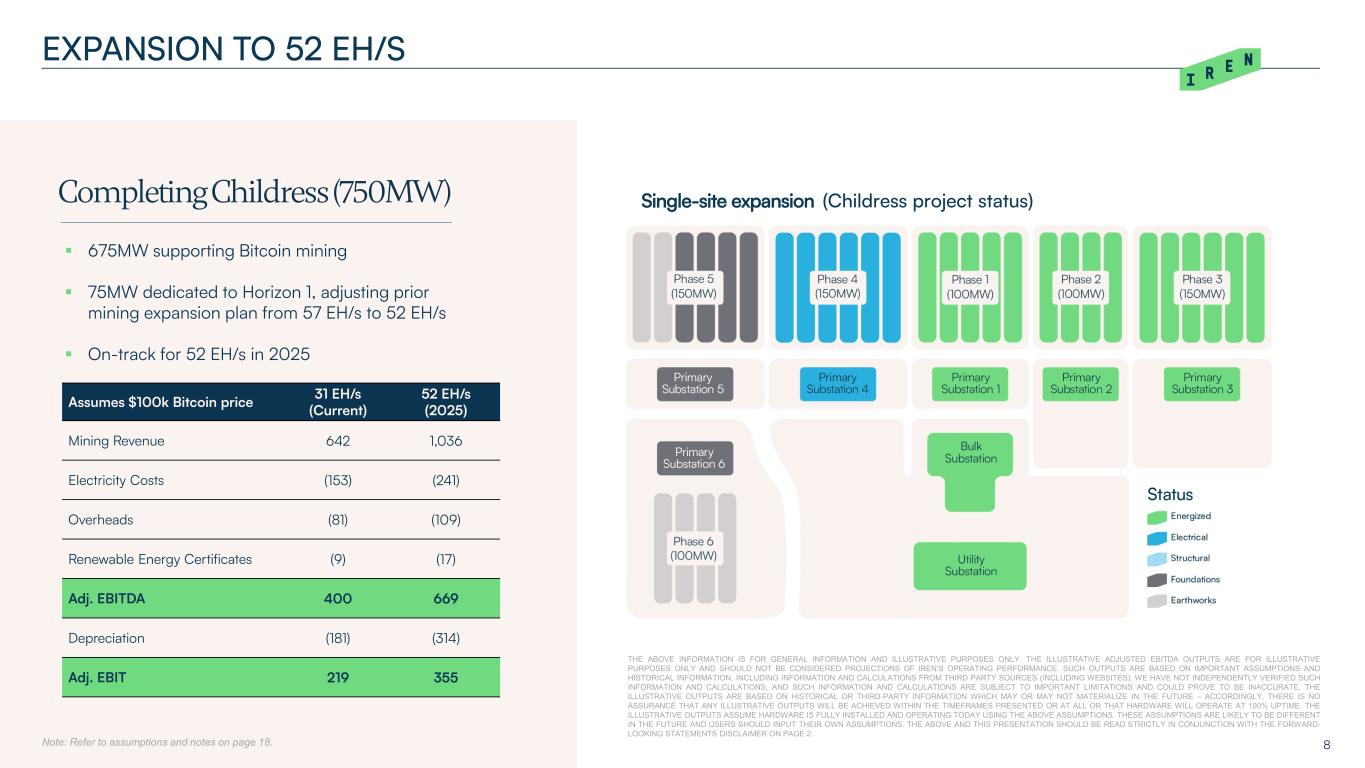
8 EXPANSION TO 52 EH/S Note: Refer to assumptions and notes on page 18. 675MW supporting Bitcoin mining 75MW dedicated to Horizon 1, adjusting prior mining expansion plan from 57 EH/s to 52 EH/s On-track for 52 EH/s in 2025 Single-site expansion (Childress project status) Assumes $100k Bitcoin price 31 EH/s (Current) 52 EH/s (2025) Mining Revenue 642 1,036 Electricity Costs (153) (241) Overheads (81) (109) Renewable Energy Certificates (9) (17) Adj. EBITDA 400 669 Depreciation (181) (314) Adj. EBIT 219 355 THE ABOVE INFORMATION IS FOR GENERAL INFORMATION AND ILLUSTRATIVE PURPOSES ONLY. THE ILLUSTRATIVE ADJUSTED EBITDA OUTPUTS ARE FOR ILLUSTRATIVE PURPOSES ONLY AND SHOULD NOT BE CONSIDERED PROJECTIONS OF IREN’S OPERATING PERFORMANCE. SUCH OUTPUTS ARE BASED ON IMPORTANT ASSUMPTIONS AND HISTORICAL INFORMATION, INCLUDING INFORMATION AND CALCULATIONS FROM THIRD PARTY SOURCES (INCLUDING WEBSITES). WE HAVE NOT INDEPENDENTLY VERIFIED SUCH INFORMATION AND CALCULATIONS, AND SUCH INFORMATION AND CALCULATIONS ARE SUBJECT TO IMPORTANT LIMITATIONS AND COULD PROVE TO BE INACCURATE. THE ILLUSTRATIVE OUTPUTS ARE BASED ON HISTORICAL OR THIRD-PARTY INFORMATION WHICH MAY OR MAY NOT MATERIALIZE IN THE FUTURE – ACCORDINGLY, THERE IS NO ASSURANCE THAT ANY ILLUSTRATIVE OUTPUTS WILL BE ACHIEVED WITHIN THE TIMEFRAMES PRESENTED OR AT ALL OR THAT HARDWARE WILL OPERATE AT 100% UPTIME. THE ILLUSTRATIVE OUTPUTS ASSUME HARDWARE IS FULLY INSTALLED AND OPERATING TODAY USING THE ABOVE ASSUMPTIONS. THESE ASSUMPTIONS ARE LIKELY TO BE DIFFERENT IN THE FUTURE AND USERS SHOULD INPUT THEIR OWN ASSUMPTIONS. THE ABOVE AND THIS PRESENTATION SHOULD BE READ STRICTLY IN CONJUNCTION WITH THE FORWARD- LOOKING STATEMENTS DISCLAIMER ON PAGE 2. Completing Childress (750MW)
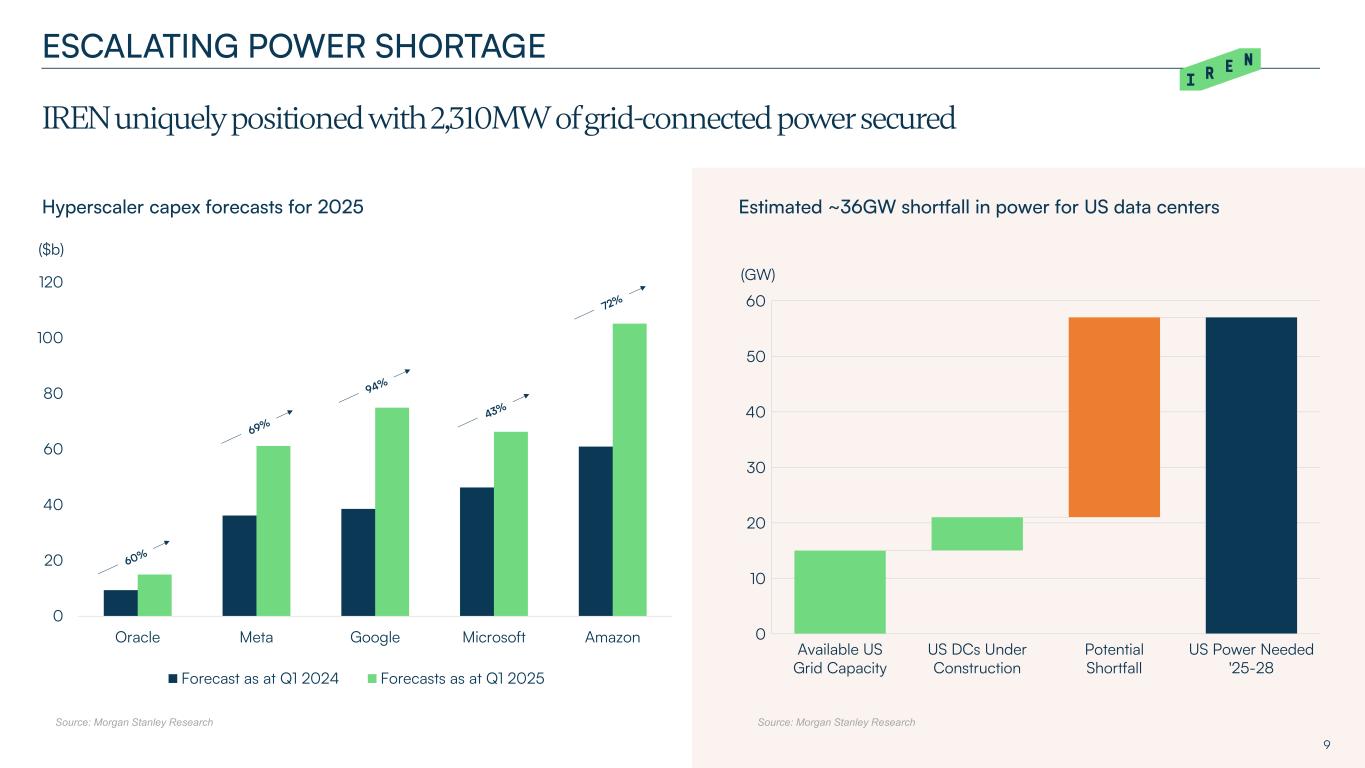
0 20 40 60 80 100 120 Oracle Meta Google Microsoft Amazon Forecast as at Q1 2024 Forecasts as at Q1 2025 ESCALATING POWER SHORTAGE 9 Source: Morgan Stanley Research Available US Grid Capacity US DCs Under Construction Potential Shortfall US Power Needed '25-28 0 10 20 30 40 50 60 Estimated ~36GW shortfall in power for US data centersHyperscaler capex forecasts for 2025 Source: Morgan Stanley Research ($b) (GW) IREN uniquely positioned with 2,310MW of grid-connected power secured
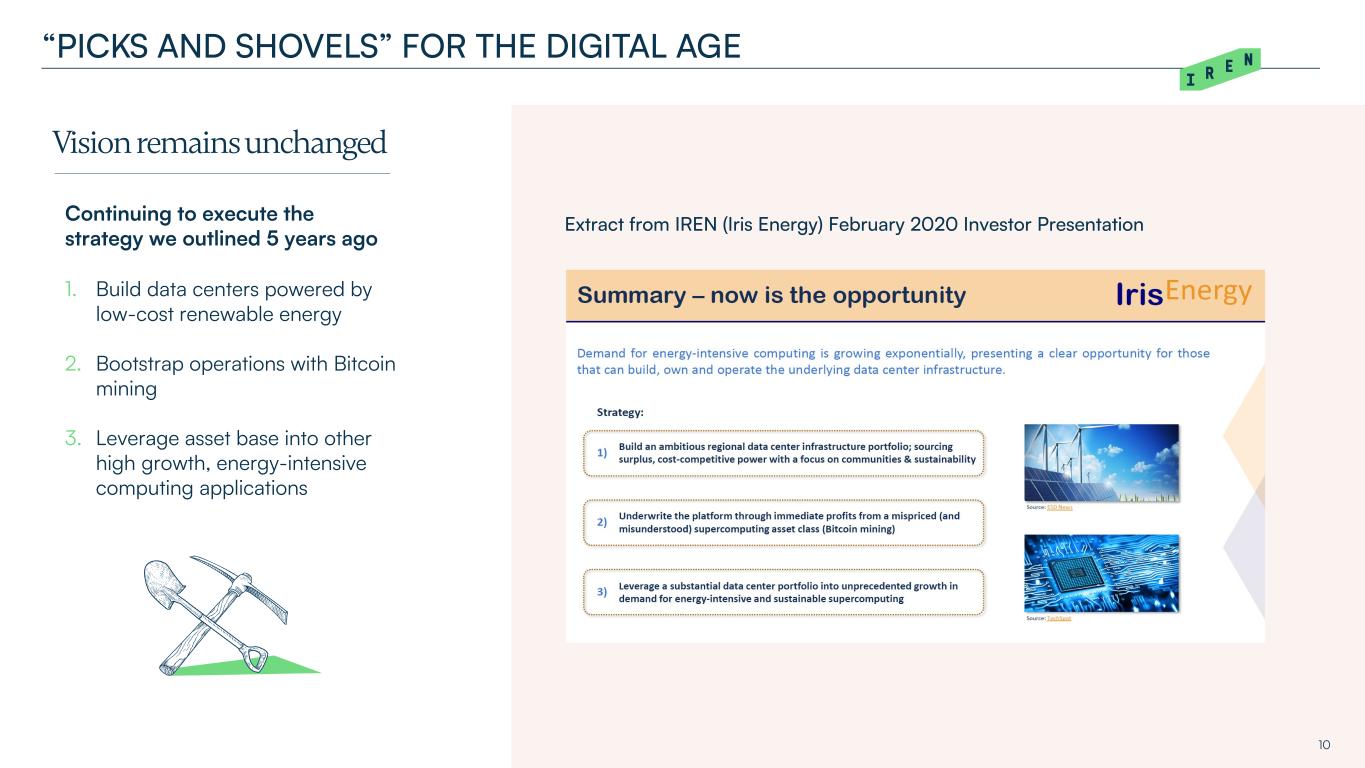
10 “PICKS AND SHOVELS” FOR THE DIGITAL AGE Continuing to execute the strategy we outlined 5 years ago 1. Build data centers powered by low-cost renewable energy 2. Bootstrap operations with Bitcoin mining 3. Leverage asset base into other high growth, energy-intensive computing applications Extract from IREN (Iris Energy) February 2020 Investor Presentation Vision remains unchanged
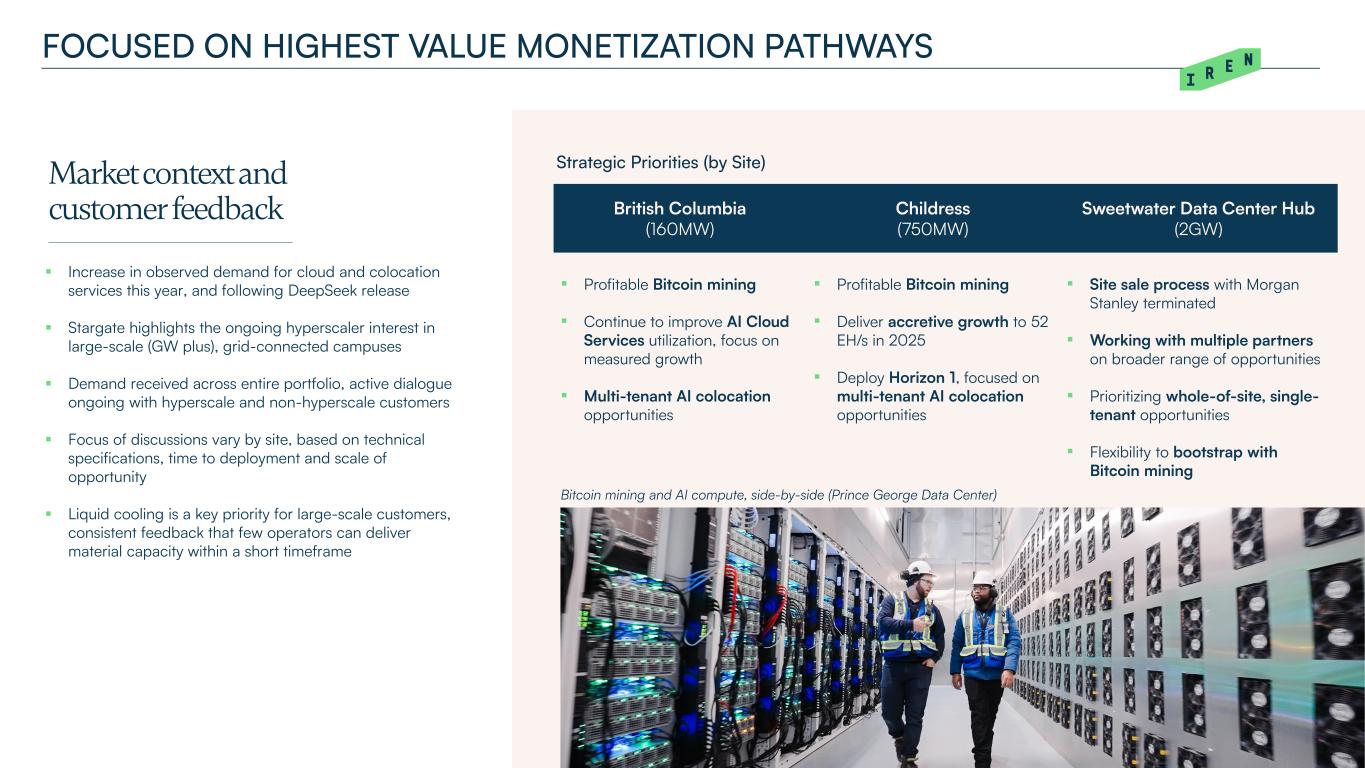
11 FOCUSED ON HIGHEST VALUE MONETIZATION PATHWAYS Increase in observed demand for cloud and colocation services this year, and following DeepSeek release Stargate highlights the ongoing hyperscaler interest in large-scale (GW plus), grid-connected campuses Demand received across entire portfolio, active dialogue ongoing with hyperscale and non-hyperscale customers Focus of discussions vary by site, based on technical specifications, time to deployment and scale of opportunity Liquid cooling is a key priority for large-scale customers, consistent feedback that few operators can deliver material capacity within a short timeframe Strategic Priorities (by Site) British Columbia (160MW) Childress (750MW) Sweetwater Data Center Hub (2GW) Profitable Bitcoin mining Continue to improve AI Cloud Services utilization, focus on measured growth Multi-tenant AI colocation opportunities Profitable Bitcoin mining Deliver accretive growth to 52 EH/s in 2025 Deploy Horizon 1, focused on multi-tenant AI colocation opportunities Site sale process with Morgan Stanley terminated Working with multiple partners on broader range of opportunities Prioritizing whole-of-site, single- tenant opportunities Flexibility to bootstrap with Bitcoin mining Bitcoin mining and AI compute, side-by-side (Prince George Data Center) Market context and customer feedback
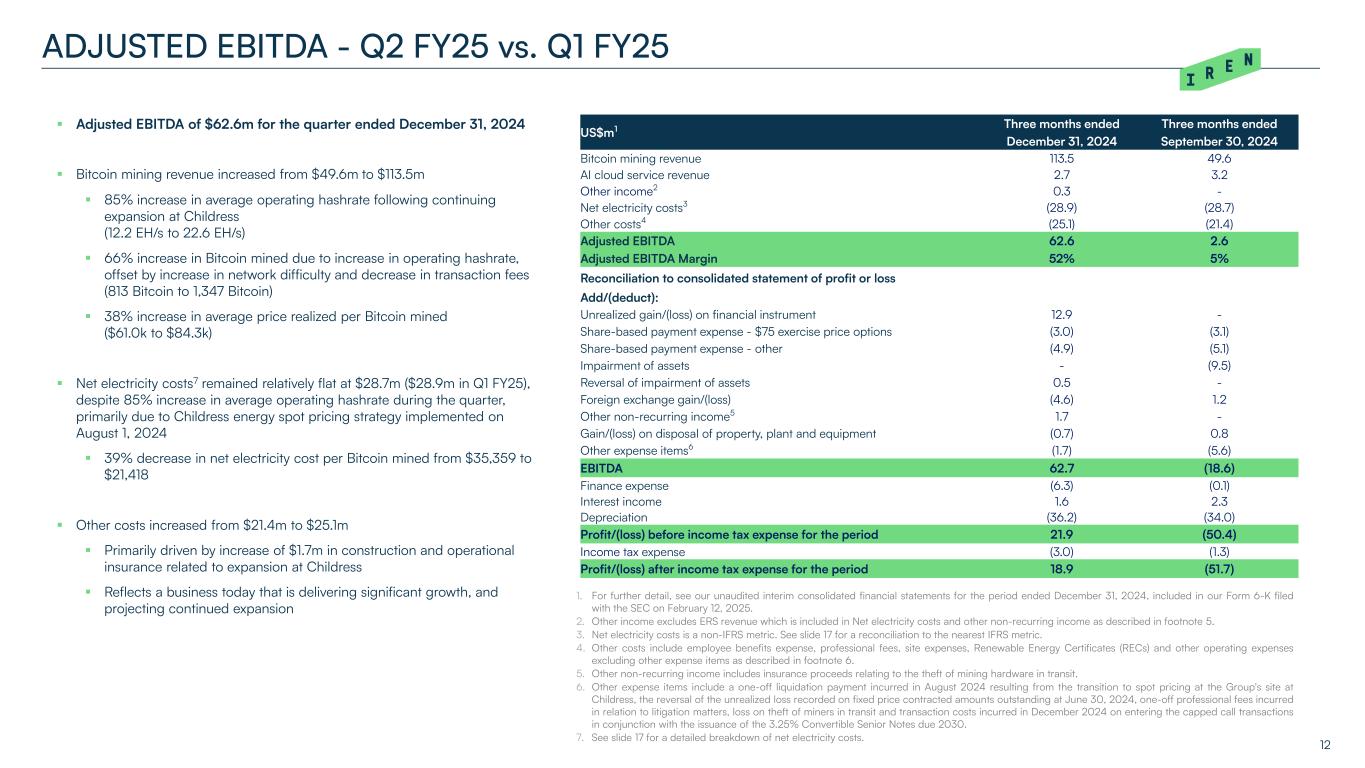
12 ADJUSTED EBITDA - Q2 FY25 vs. Q1 FY25 1. For further detail, see our unaudited interim consolidated financial statements for the period ended December 31, 2024, included in our Form 6-K filed with the SEC on February 12, 2025. 2. Other income excludes ERS revenue which is included in Net electricity costs and other non-recurring income as described in footnote 5. 3. Net electricity costs is a non-IFRS metric. See slide 17 for a reconciliation to the nearest IFRS metric. 4. Other costs include employee benefits expense, professional fees, site expenses, Renewable Energy Certificates (RECs) and other operating expenses excluding other expense items as described in footnote 6. 5. Other non-recurring income includes insurance proceeds relating to the theft of mining hardware in transit. 6. Other expense items include a one-off liquidation payment incurred in August 2024 resulting from the transition to spot pricing at the Group's site at Childress, the reversal of the unrealized loss recorded on fixed price contracted amounts outstanding at June 30, 2024, one-off professional fees incurred in relation to litigation matters, loss on theft of miners in transit and transaction costs incurred in December 2024 on entering the capped call transactions in conjunction with the issuance of the 3.25% Convertible Senior Notes due 2030. 7. See slide 17 for a detailed breakdown of net electricity costs. US$m1 Three months ended Three months ended December 31, 2024 September 30, 2024 Bitcoin mining revenue 113.5 49.6 AI cloud service revenue 2.7 3.2 Other income2 0.3 - Net electricity costs3 (28.9) (28.7) Other costs4 (25.1) (21.4) Adjusted EBITDA 62.6 2.6 Adjusted EBITDA Margin 52% 5% Reconciliation to consolidated statement of profit or loss Add/(deduct): Unrealized gain/(loss) on financial instrument 12.9 - Share-based payment expense - $75 exercise price options (3.0) (3.1) Share-based payment expense - other (4.9) (5.1) Impairment of assets - (9.5) Reversal of impairment of assets 0.5 - Foreign exchange gain/(loss) (4.6) 1.2 Other non-recurring income5 1.7 - Gain/(loss) on disposal of property, plant and equipment (0.7) 0.8 Other expense items6 (1.7) (5.6) EBITDA 62.7 (18.6) Finance expense (6.3) (0.1) Interest income 1.6 2.3 Depreciation (36.2) (34.0) Profit/(loss) before income tax expense for the period 21.9 (50.4) Income tax expense (3.0) (1.3) Profit/(loss) after income tax expense for the period 18.9 (51.7) Adjusted EBITDA of $62.6m for the quarter ended December 31, 2024 Bitcoin mining revenue increased from $49.6m to $113.5m 85% increase in average operating hashrate following continuing expansion at Childress (12.2 EH/s to 22.6 EH/s) 66% increase in Bitcoin mined due to increase in operating hashrate, offset by increase in network difficulty and decrease in transaction fees (813 Bitcoin to 1,347 Bitcoin) 38% increase in average price realized per Bitcoin mined ($61.0k to $84.3k) Net electricity costs7 remained relatively flat at $28.7m ($28.9m in Q1 FY25), despite 85% increase in average operating hashrate during the quarter, primarily due to Childress energy spot pricing strategy implemented on August 1, 2024 39% decrease in net electricity cost per Bitcoin mined from $35,359 to $21,418 Other costs increased from $21.4m to $25.1m Primarily driven by increase of $1.7m in construction and operational insurance related to expansion at Childress Reflects a business today that is delivering significant growth, and projecting continued expansion
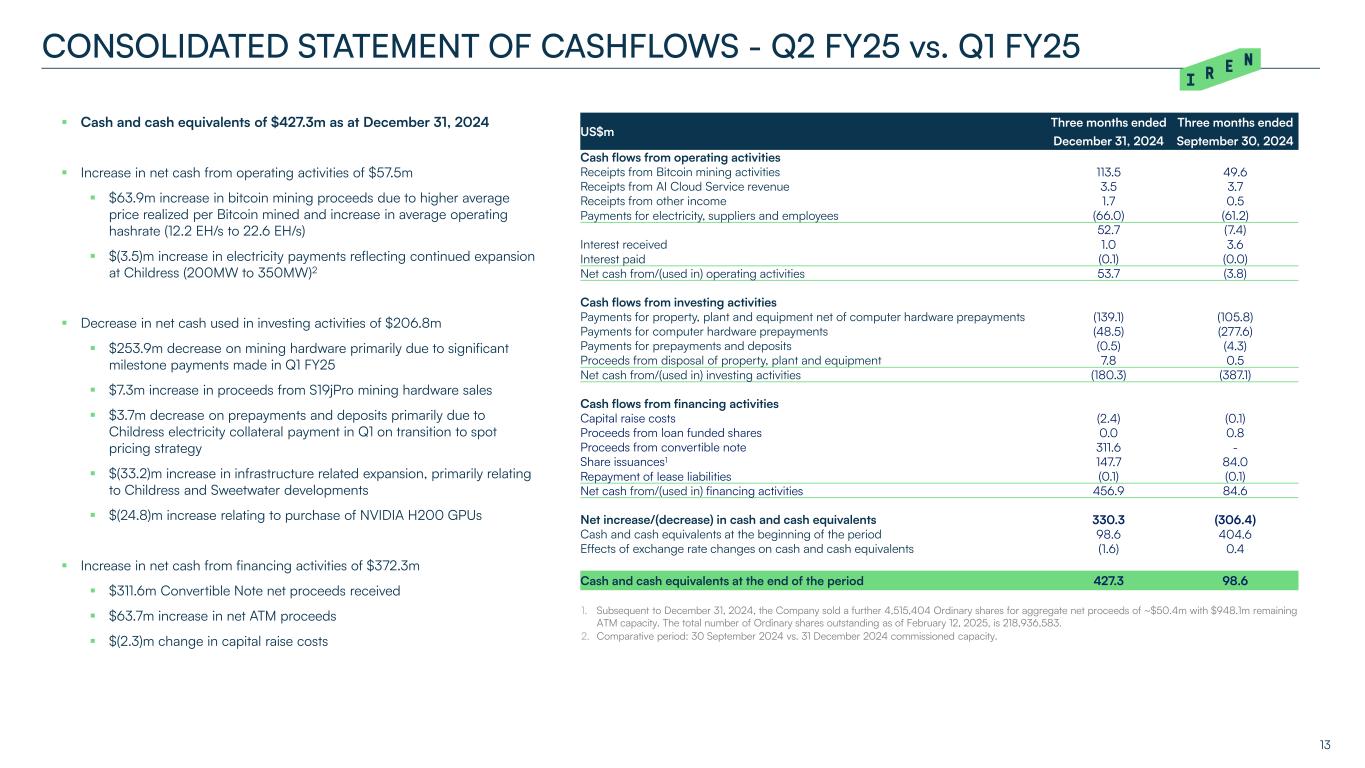
13 CONSOLIDATED STATEMENT OF CASHFLOWS - Q2 FY25 vs. Q1 FY25 1. Subsequent to December 31, 2024, the Company sold a further 4,515,404 Ordinary shares for aggregate net proceeds of ~$50.4m with $948.1m remaining ATM capacity. The total number of Ordinary shares outstanding as of February 12, 2025, is 218,936,583. 2. Comparative period: 30 September 2024 vs. 31 December 2024 commissioned capacity. Cash and cash equivalents of $427.3m as at December 31, 2024 Increase in net cash from operating activities of $57.5m $63.9m increase in bitcoin mining proceeds due to higher average price realized per Bitcoin mined and increase in average operating hashrate (12.2 EH/s to 22.6 EH/s) $(3.5)m increase in electricity payments reflecting continued expansion at Childress (200MW to 350MW)2 Decrease in net cash used in investing activities of $206.8m $253.9m decrease on mining hardware primarily due to significant milestone payments made in Q1 FY25 $7.3m increase in proceeds from S19jPro mining hardware sales $3.7m decrease on prepayments and deposits primarily due to Childress electricity collateral payment in Q1 on transition to spot pricing strategy $(33.2)m increase in infrastructure related expansion, primarily relating to Childress and Sweetwater developments $(24.8)m increase relating to purchase of NVIDIA H200 GPUs Increase in net cash from financing activities of $372.3m $311.6m Convertible Note net proceeds received $63.7m increase in net ATM proceeds $(2.3)m change in capital raise costs US$m Three months ended Three months ended December 31, 2024 September 30, 2024 Cash flows from operating activities Receipts from Bitcoin mining activities 113.5 49.6 Receipts from AI Cloud Service revenue 3.5 3.7 Receipts from other income 1.7 0.5 Payments for electricity, suppliers and employees (66.0) (61.2) 52.7 (7.4) Interest received 1.0 3.6 Interest paid (0.1) (0.0) Net cash from/(used in) operating activities 53.7 (3.8) Cash flows from investing activities Payments for property, plant and equipment net of computer hardware prepayments (139.1) (105.8) Payments for computer hardware prepayments (48.5) (277.6) Payments for prepayments and deposits (0.5) (4.3) Proceeds from disposal of property, plant and equipment 7.8 0.5 Net cash from/(used in) investing activities (180.3) (387.1) Cash flows from financing activities Capital raise costs (2.4) (0.1) Proceeds from loan funded shares 0.0 0.8 Proceeds from convertible note 311.6 - Share issuances1 147.7 84.0 Repayment of lease liabilities (0.1) (0.1) Net cash from/(used in) financing activities 456.9 84.6 Net increase/(decrease) in cash and cash equivalents 330.3 (306.4) Cash and cash equivalents at the beginning of the period 98.6 404.6 Effects of exchange rate changes on cash and cash equivalents (1.6) 0.4 Cash and cash equivalents at the end of the period 427.3 98.6
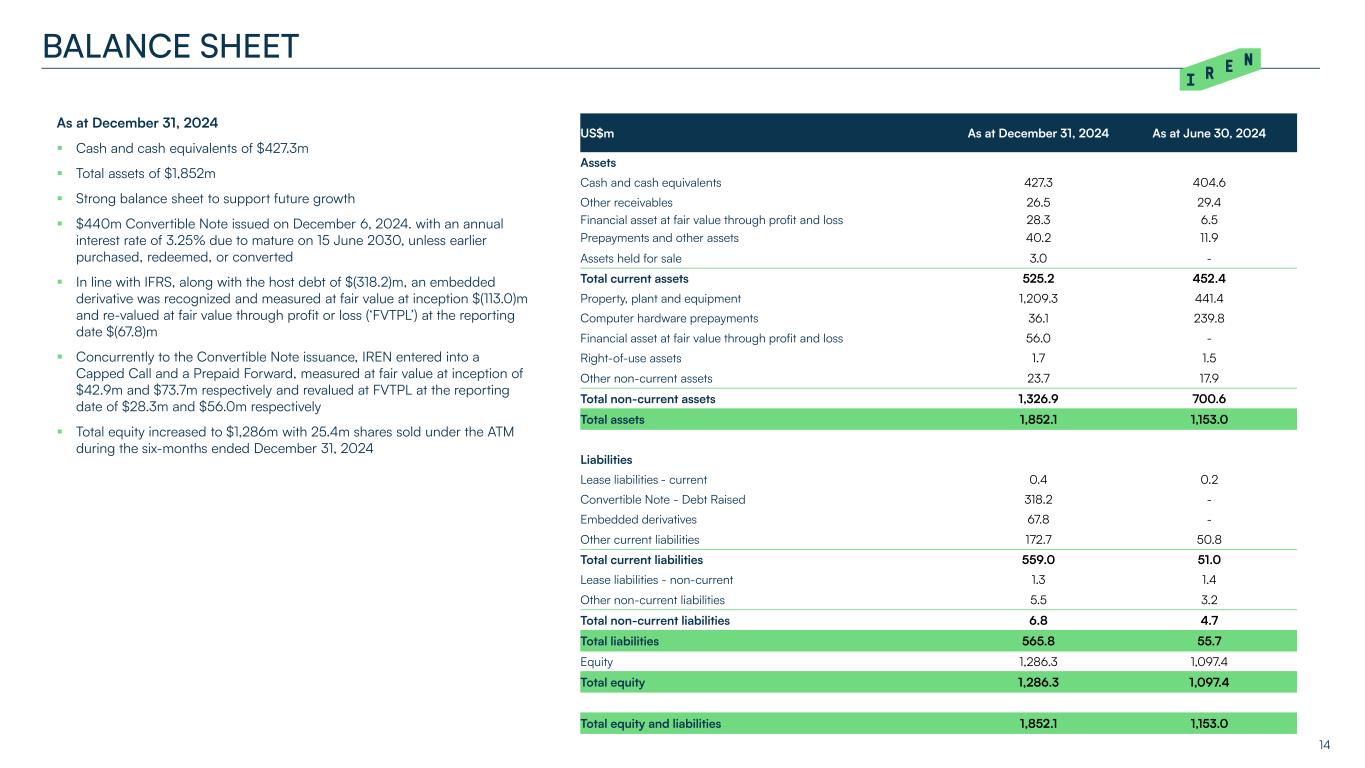
14 BALANCE SHEET US$m As at December 31, 2024 As at June 30, 2024 Assets Cash and cash equivalents 427.3 404.6 Other receivables 26.5 29.4 Financial asset at fair value through profit and loss 28.3 6.5 Prepayments and other assets 40.2 11.9 Assets held for sale 3.0 - Total current assets 525.2 452.4 Property, plant and equipment 1,209.3 441.4 Computer hardware prepayments 36.1 239.8 Financial asset at fair value through profit and loss 56.0 - Right-of-use assets 1.7 1.5 Other non-current assets 23.7 17.9 Total non-current assets 1,326.9 700.6 Total assets 1,852.1 1,153.0 Liabilities Lease liabilities - current 0.4 0.2 Convertible Note - Debt Raised 318.2 - Embedded derivatives 67.8 - Other current liabilities 172.7 50.8 Total current liabilities 559.0 51.0 Lease liabilities - non-current 1.3 1.4 Other non-current liabilities 5.5 3.2 Total non-current liabilities 6.8 4.7 Total liabilities 565.8 55.7 Equity 1,286.3 1,097.4 Total equity 1,286.3 1,097.4 Total equity and liabilities 1,852.1 1,153.0 As at December 31, 2024 Cash and cash equivalents of $427.3m Total assets of $1,852m Strong balance sheet to support future growth $440m Convertible Note issued on December 6, 2024. with an annual interest rate of 3.25% due to mature on 15 June 2030, unless earlier purchased, redeemed, or converted In line with IFRS, along with the host debt of $(318.2)m, an embedded derivative was recognized and measured at fair value at inception $(113.0)m and re-valued at fair value through profit or loss (‘FVTPL’) at the reporting date $(67.8)m Concurrently to the Convertible Note issuance, IREN entered into a Capped Call and a Prepaid Forward, measured at fair value at inception of $42.9m and $73.7m respectively and revalued at FVTPL at the reporting date of $28.3m and $56.0m respectively Total equity increased to $1,286m with 25.4m shares sold under the ATM during the six-months ended December 31, 2024
Additional Information
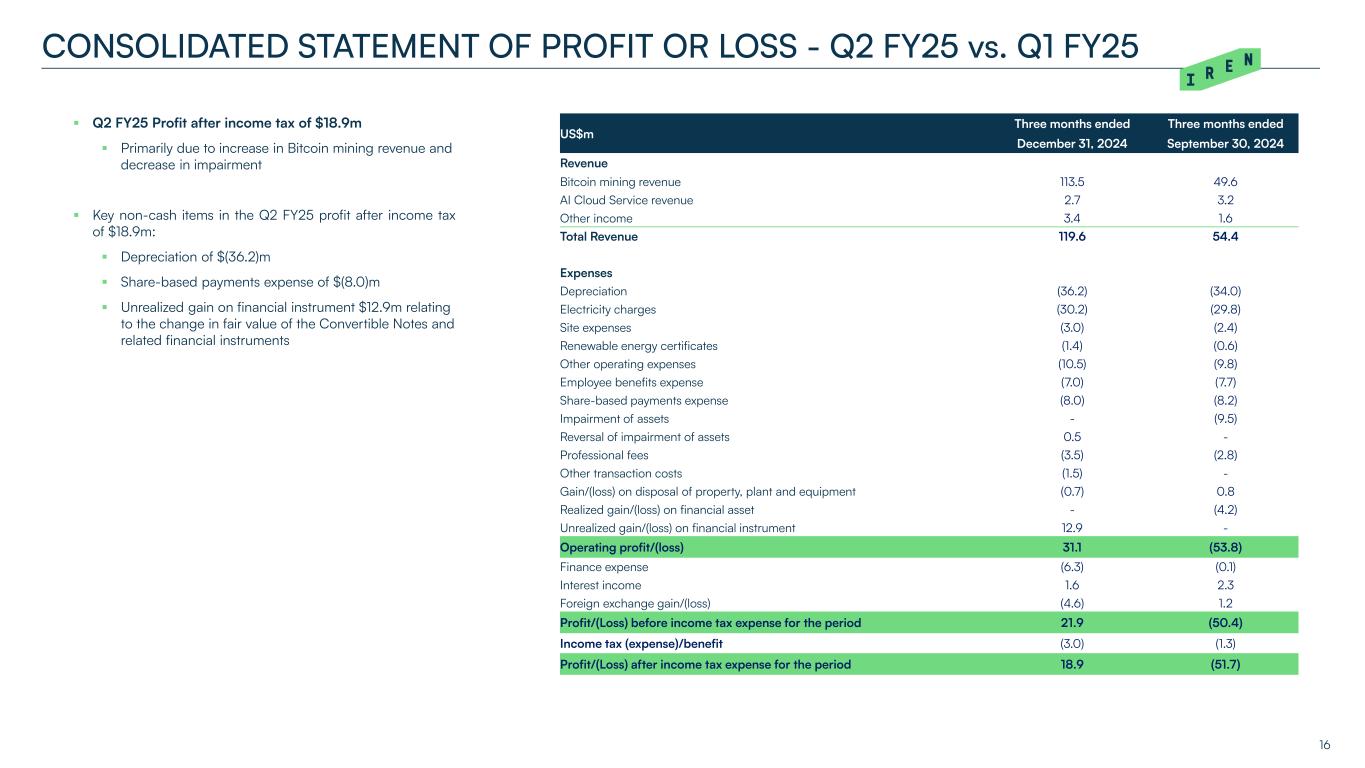
16 CONSOLIDATED STATEMENT OF PROFIT OR LOSS - Q2 FY25 vs. Q1 FY25 US$m Three months ended Three months ended December 31, 2024 September 30, 2024 Revenue Bitcoin mining revenue 113.5 49.6 AI Cloud Service revenue 2.7 3.2 Other income 3.4 1.6 Total Revenue 119.6 54.4 Expenses Depreciation (36.2) (34.0) Electricity charges (30.2) (29.8) Site expenses (3.0) (2.4) Renewable energy certificates (1.4) (0.6) Other operating expenses (10.5) (9.8) Employee benefits expense (7.0) (7.7) Share-based payments expense (8.0) (8.2) Impairment of assets - (9.5) Reversal of impairment of assets 0.5 - Professional fees (3.5) (2.8) Other transaction costs (1.5) - Gain/(loss) on disposal of property, plant and equipment (0.7) 0.8 Realized gain/(loss) on financial asset - (4.2) Unrealized gain/(loss) on financial instrument 12.9 - Operating profit/(loss) 31.1 (53.8) Finance expense (6.3) (0.1) Interest income 1.6 2.3 Foreign exchange gain/(loss) (4.6) 1.2 Profit/(Loss) before income tax expense for the period 21.9 (50.4) Income tax (expense)/benefit (3.0) (1.3) Profit/(Loss) after income tax expense for the period 18.9 (51.7) Q2 FY25 Profit after income tax of $18.9m Primarily due to increase in Bitcoin mining revenue and decrease in impairment Key non-cash items in the Q2 FY25 profit after income tax of $18.9m: Depreciation of $(36.2)m Share-based payments expense of $(8.0)m Unrealized gain on financial instrument $12.9m relating to the change in fair value of the Convertible Notes and related financial instruments
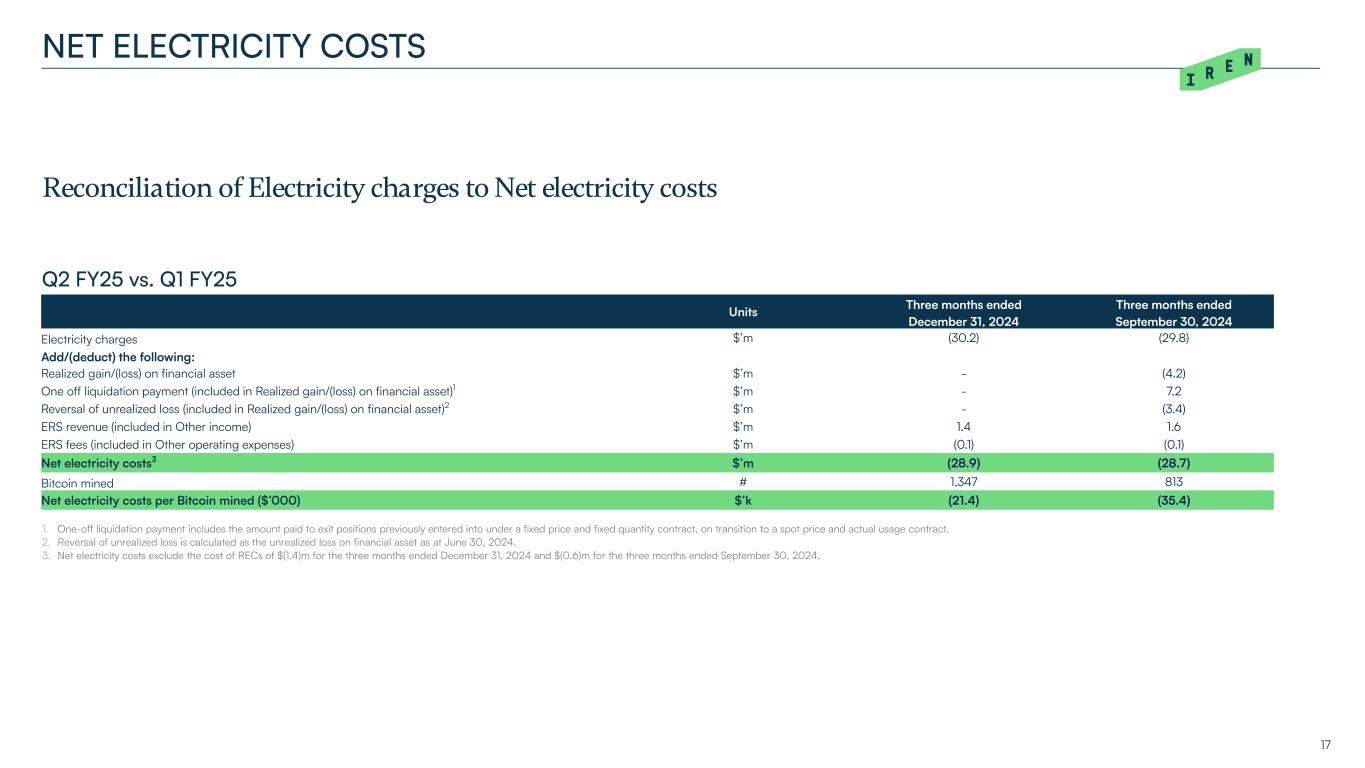
Reconciliation of Electricity charges to Net electricity costs 17 NET ELECTRICITY COSTS Units Three months ended Three months ended December 31, 2024 September 30, 2024 Electricity charges $’m (30.2) (29.8) Add/(deduct) the following: Realized gain/(loss) on financial asset $’m - (4.2) One off liquidation payment (included in Realized gain/(loss) on financial asset)1 $’m - 7.2 Reversal of unrealized loss (included in Realized gain/(loss) on financial asset)2 $’m - (3.4) ERS revenue (included in Other income) $’m 1.4 1.6 ERS fees (included in Other operating expenses) $’m (0.1) (0.1) Net electricity costs3 $’m (28.9) (28.7) Bitcoin mined # 1,347 813 Net electricity costs per Bitcoin mined ($’000) $’k (21.4) (35.4) Q2 FY25 vs. Q1 FY25 1. One-off liquidation payment includes the amount paid to exit positions previously entered into under a fixed price and fixed quantity contract, on transition to a spot price and actual usage contract. 2. Reversal of unrealized loss is calculated as the unrealized loss on financial asset as at June 30, 2024. 3. Net electricity costs exclude the cost of RECs of $(1.4)m for the three months ended December 31, 2024 and $(0.6)m for the three months ended September 30, 2024.
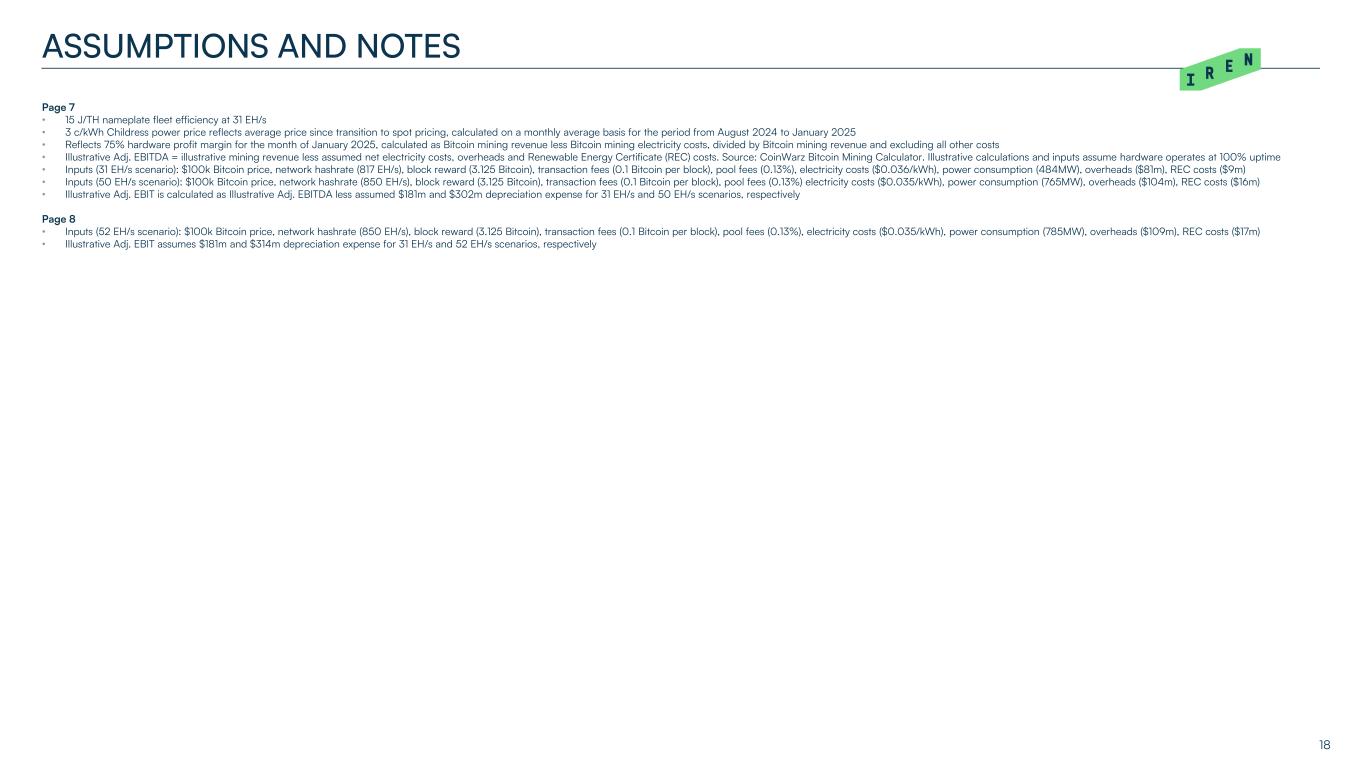
Page 7 • 15 J/TH nameplate fleet efficiency at 31 EH/s • 3 c/kWh Childress power price reflects average price since transition to spot pricing, calculated on a monthly average basis for the period from August 2024 to January 2025 • Reflects 75% hardware profit margin for the month of January 2025, calculated as Bitcoin mining revenue less Bitcoin mining electricity costs, divided by Bitcoin mining revenue and excluding all other costs • Illustrative Adj. EBITDA = illustrative mining revenue less assumed net electricity costs, overheads and Renewable Energy Certificate (REC) costs. Source: CoinWarz Bitcoin Mining Calculator. Illustrative calculations and inputs assume hardware operates at 100% uptime • Inputs (31 EH/s scenario): $100k Bitcoin price, network hashrate (817 EH/s), block reward (3.125 Bitcoin), transaction fees (0.1 Bitcoin per block), pool fees (0.13%), electricity costs ($0.036/kWh), power consumption (484MW), overheads ($81m), REC costs ($9m) • Inputs (50 EH/s scenario): $100k Bitcoin price, network hashrate (850 EH/s), block reward (3.125 Bitcoin), transaction fees (0.1 Bitcoin per block), pool fees (0.13%) electricity costs ($0.035/kWh), power consumption (765MW), overheads ($104m), REC costs ($16m) • Illustrative Adj. EBIT is calculated as Illustrative Adj. EBITDA less assumed $181m and $302m depreciation expense for 31 EH/s and 50 EH/s scenarios, respectively Page 8 • Inputs (52 EH/s scenario): $100k Bitcoin price, network hashrate (850 EH/s), block reward (3.125 Bitcoin), transaction fees (0.1 Bitcoin per block), pool fees (0.13%), electricity costs ($0.035/kWh), power consumption (785MW), overheads ($109m), REC costs ($17m) • Illustrative Adj. EBIT assumes $181m and $314m depreciation expense for 31 EH/s and 52 EH/s scenarios, respectively 18 ASSUMPTIONS AND NOTES

19 Q&A

Thank You 20


