Exhibit 96.1
The PPM-Sedibelo-Magazynskraal PGM Project, North West Province, South Africa Technical Report Summary |
Prepared for Sedibelo Platinum Mines Ltd |
|
 |
| |
Report Prepared by 
SRK Consulting (South Africa) (Pty) Ltd Project Number 576060_SPM_TRS_PSM Project_27may22.docx Report Date: 27 May 2022 (Effective Date: 31 December 2021) [§229.1302(b)(1); §229.1302(b)(4)(iv)] |
| SRK Consulting – 576060 SPM PSM Project TRS | Page i |
The PPM-Sedibelo-Magazynskraal PGM Project, North West Province, South Africa
Technical Report Summary
Prepared for
Sedibelo Platinum Mines Ltd
Oak House,
Hirzel Street,
St Peter Port,
Guernsey, GY1 3RH
Compiled by
SRK Consulting South Africa (Pty) Ltd
265 Oxford Road
Illovo
Johannesburg 2196
South Africa
P O Box 55291
Northlands
2116
South Africa
Tel: +27 11 441-1111
Fax: +27 86 555 0907
SRK Project Number 576060_SPM_TRS_PSM Project_27may22.docx
| | Issue Date of TRS: | 27 May 2022 |
| | (Effective Date of TRS: | 31 December 2021) [[§229.1302(b)(1); §229.1302(b)(4)(iv)] |
| SRK | Report date: 27 May 2022 |
| | Effective Date: 31 December 2021 |
| | |
| SRK Consulting – 576060 SPM PSM Project TRS | Page ii |
Important Notices
In this document, a point is used as the decimal marker and a space is used in the text for the thousand’s separator (for numbers larger than 999). In other words, 10 148.32 denotes ten thousand one hundred and forty-eight point three two.
The word ‘tonnes’ denotes a metric ton (1 000 kg).
Wherever mention is made of “P-S-M”, for the purposes of this Technical Report Summary (TRS), it encompasses all of the current and planned mining activities related to the West Open Pit (on the farm Tuschenkomst), East Open Pit and Central Underground Block (on the farm Wilgespruit) and East Underground Block (on the farms Wilgespruit and Magazynskraal) under Sedibelo Platinum Mines Limited’s control in the North West Province, Republic of South Africa, unless specifically mentioned differently.
This report contains statements of a forward-looking nature which are subject to several known and unknown risks, uncertainties and other factors that may cause the results to differ materially from those anticipated in this report.
This report includes technical information, which requires subsequent calculations to derive subtotals, totals and weighted averages. Such calculations may involve a degree of rounding and consequently introduce an error. Where such errors occur, SRK does not consider them to be material.
Mineral Resource and Mineral Reserve estimates presented in the TRS are estimated and classified according to the SAMREC Code (2016 edition) which is consistent with the CRIRSCO template.
The reader and any potential or existing shareholder or investor in the Company or SPM is cautioned that SPM is involved in exploration on the P-S-M Project and there is no guarantee that any unmodified part of the Mineral Resources will ever be converted into Mineral Reserves nor ultimately extracted at a profit,
The Mineral Reserve estimates contained in this report should not be interpreted as assurances of economic life of the P-S-M Project. As Mineral Reserves are only estimates based on various modifying factors and assumptions, future Mineral Reserve estimates may need to be revised. For example, if production costs increase or product prices decrease, a portion of the current Mineral Resources, from which the Mineral Reserves are derived, may become uneconomical to recover and would therefore result in lower estimated Mineral Reserves.
This report uses a shorthand notation to demonstrate compliance with Regulation SK1300 and disclosure requirements of the SAMREC Code, as follows:
| · | [[§229.601(b)(96)(iii)(B)(2)] represents sub-section (iii)(B)(2) of section 96 of CFR 229.601(b) (“Item 601 of Regulation S-K”); and |
| · | [SR1.1] represents item 1.1 - Property Description of Table 1 of the SAMREC Code. |
| SRK | Report date: 27 May 2022 |
| | Effective Date: 31 December 2021 |
| | |
| SRK Consulting – 576060 SPM PSM Project TRS | Page iii |
Executive Summary
[§229.601(b)(96)(iii)(B)(1)]
[SR1.1(i), SR5.1(i), SR7.1]
This Technical Report Summary (TRS) of the PPM-Sedibelo-Magazynskraal Project (the P-S-M Project) was compiled by SRK Consulting (South Africa) (Pty) Ltd (SRK) on behalf of Sedibelo Platinum Mines Ltd (SPM, also referred to as the Company) according to Item 601 of the United States Securities and Exchange Commission’s (SEC’s) Subpart 1300 of Regulation S-K (SK1300). SPM indirectly holds the mineral rights to a platinum group metal (PGM) operating mine and several PGM projects in the Republic of South Africa.
This report is the first TRS for SPM’s P-S-M Project and supports the disclosure of Mineral Resources and Mineral Reserves at 31 December 2021. The Mineral Resources and Mineral Reserves have been prepared and reported according to the requirements of the SAMREC Code (2016 Edition) which is consistent with CRIRSCO’s International Minerals Reporting Code Template adopted by SK1300. This TRS report is compiled to support SPM’s proposed filing of a F-1 prospectus with the SEC as part of a registration statement and a secondary listing on the JSE Limited in South Africa.
[§229.1302(b)(iii)(3)] [SR9.1(iii)]
The effective date of the TRS is 31 December 2021, which satisfies the SK1300 requirement of a current report.
The life-of-mine (LoM) plans and associated technical and economic parameters (TEPs) included in the techno-economic model (TEM) all commence on January 2022.
| ES3: | Property Description, Mineral Rights and Ownership |
[SR1.1(i), SR1.2(i)]
The P-S-M Project envisages the integrated production from an existing open pit mine (the West Pit) with planned production from an East Pit, Central Underground Block and East Underground Block within the contiguous properties of Tuschenkomst, Wilgespruit and Magazynskraal. The West Pit, which is operated by SPM’s subsidiary Pilanesberg Platinum Mines (Pty) Ltd (PPM), is located some 160 km northwest of Johannesburg and some 66 km north of Rustenburg. The P-S-M Project is situated within the boundaries of the Moses Kotane Municipality along the northern edge of the Pilanesberg Alkaline Complex in the North West Province of South Africa. The moderate climate means that exploration and mining operations can be undertaken throughout the year, with no extraordinary measures required.
The mineral rights to the P-S-M Project, which are held 100% by SPM via its subsidiaries, are summarized in Table ES-1.
Table ES-1: Summary Table of Mineral Rights for the P-S-M Project
| Asset | Mineral Rights and Properties | Minerals Included
in NOPR/NOMR | Status | Licence
Expiry
Date | Comments |
PPM (West Pit) | NOMR NW30/5/1/2/2/320MR: | PGMs, Au, Cu, Ni, Co, and associated minerals, and Cr (Section 102) | Production | 02/2038 | NOMR executed on 14 February 2008, registered on 24 June 2008. |
The farm Tuschenkomst 135JP |
Sedibelo West mining area (Section 102): A portion of the farm Wilgespruit 2JQ Ptn 1 of the farm Rooderand 46JQ | PGMs, Au, Cu, Ni, Co, Cr | Production | 02/2038 | Section 102 amendment to incorporate Sedibelo West properties into PPM NOMR |
Sedibelo (East Pit and Central Decline) (East Decline shared with Magazynskraal) | NOMR NW30/5/1/2/2/333MR awarded; The farm Wilgespruit 2JQ A portion of the farm Legkraal 45JQ A portion of the farm Koedoesfontein 42JQ Ptn 1 of the farm Rooderand 46JQ | PGMs, Au, Cu, Ni, Co, Cr | Development | 06/2038 | Section 11(2) transfer of controlling interest to PPM and cession of rights to PPM received on 13/02/2014. |
Magazynskraal (East Decline shared with Sedibelo) | NOPR NW30/5/1/1/2/10723PR (PGMs) and NOPR NW30/5/1/1/2/10947PR (Au, Ag, base metals): The farm Magazynskraal 3JQ MRA NW30/5/1/2/2/10029MR submitted in July 2012, granted by DMRE in Dec 2015. | Pt, Pd, Ir, Ru, Rh, Os Au, Ag, Cu, Ni, Co, Cr PGMs, Au, Ag, Cu, Ni, Co, Cr | Development | 06/2019 10/2018 12/2045 | Section 102 application in terms of MPRDA to incorporate the two NOPRs into the Sedibelo NOMR NW30/5/1/2/2/333MR submitted in May 2017. Grant still pending. Registration of NOMR on hold |
| NOPR | new order prospecting right | | | | |
| NOMR | new order mining right | | | | |
| SRK | Report date: 27 May 2022 |
| | Effective Date: 31 December 2021 |
| | |
| SRK Consulting – 576060 SPM PSM Project TRS | Page iv |
The P-S-M Project plan is based on a feasibility study completed in August 2020, including updated geological and estimation models. The P-S-M Project relies on the existing infrastructure and concentrators at the West Pit, supplemented by additional surface infrastructure to support the planned underground operations.
SPM has an investment in the Kell processing technology via a 50% stake in Kelltech Limited which was acquired in 2014. A subscription agreement signed in February 2016 (amended in October 2020) requires that Kelltechnology SA (RF) Pty Ltd (KTSA) construct and operate a Kell plant at the PPM operations. SPM advised that the Kell hydrometallurgical technology is seen as a cost-efficient alternative to the conventional smelting of PGM concentrates, giving expected energy and cost savings as well as reduced CO2 and SO2 emissions.
The Company has confirmed to SRK that there are currently no legal proceedings that might influence the integrity of the Project or the right to prospect or mine for minerals.
| ES4: | Geology and Mineralization |
[SR2.1(i)-(vii)]
The Bushveld Complex (BC) of South Africa is the world’s largest and hence the most important repository of the PGMs in the world with an exposed surface area of some 67 000 km2. The BC consists of a massive ultramafic-mafic layered intrusion and a suite of associated granitoid rocks intrusive into the early Proterozoic Transvaal Basin within the north central Kaapvaal Craton. The ultramafic-mafic layered rocks collectively referred to as the Rustenburg Layered Suite (RLS) are in five so-called lobes, namely the Western, Far Western, Eastern, Northern and Southern (Bethal) lobes. The magmatic layering of the RLS is remarkably consistent and can be correlated throughout most of the BC.
The RLS is divided into five major stratigraphic units, as follows:
| · | The lowermost Marginal Zone ranges in thickness from several metres to several hundred metres and comprises a heterogeneous succession of generally unlayered basic rocks dominated by norites; |
| · | Ultramafic rocks dominate the Lower Zone. These vary in thickness with the thinnest units developed over structural highs in the basin floor; |
| · | The Critical Zone contains the economic PGM resources of the BC: the Lower Critical Zone, Upper Critical Zone and the chromitite layers which occur in three distinct groupings i.e., the Lower Group (LG), the Middle Group (MG) and the Upper Group (UG); |
| · | The Main Zone is the thickest unit within the RLS and comprises approximately half the RLS stratigraphic interval. It consists of gabbro-norites with some anorthosite and pyroxenite layering. Banding or layering is not as well developed as in the Critical and Lower Zones; and |
| · | The Upper Zone is dominated by gabbros with some banded anorthosite and magnetite. There is no chilled contact with the overlying rhyolite and granophyres of the Lebowa Granite Suite. |
The two most economically significant PGM mineralized layers of the BC, namely the Merensky Reef and the UG2, are continuous over hundreds of kilometres. The PGMs include varying proportions of Pt, Pd, Rh, Ru, Ir and Os, as well as elevated concentrations of Ni, Cu and Co as base metal sulfides.
The Western Limb of the BC is subdivided into two sectors separated by the younger Pilanesberg alkaline intrusive complex: the northern ‘Swartklip’ sector and the southern ‘Rustenburg’ sector. In the Swartklip sector where the P-S-M Project is located, the Upper Critical Zone stratigraphy between the UG2 and Merensky Reef is significantly telescoped, ranging in thickness between 12 and 25 m, compared with a thickness of 120 m or more in other parts of the BC. In addition, the interval between the UG2 and the Merensky Reef contains the PGM bearing Pseudo Reef Package, which is not encountered elsewhere in the BC.
| ES5: | Status of Exploration, Development and Operations |
[SR3.1, SR3.2(i)-(v)]
West Pit (Tuschenkomst) (Operational)
The Environmental Management Plan (EMP) for the Tuschenkomst property (and surrounding farms of Rooderand, Witkleifontein, Ruighoek) was approved by the Department of Minerals (now Department of Mineral and Energy) in February 2008 and the New Order Mining Right (NOMR) NW30/5/1/2/2/320MR awarded.
Removal of overburden commenced in April 2008 with the first PGM concentrate was despatched in April 2009. The Sedibelo West mining area was incorporated into the PPM mining right in April 2012.
| SRK | Report date: 27 May 2022 |
| | Effective Date: 31 December 2021 |
| | |
| SRK Consulting – 576060 SPM PSM Project TRS | Page v |
The open pit mining operation delivers on average 300 ktpm of run-of-mine (RoM) ore to two conventional MF2 (mill-float mill-float) design concentrators, Merensky (silicate) and UG2 plants with 230 ktpm and 67 ktpm nameplate capacities respectively.
Sedibelo (Wilgespruit)
Anglo Platinum Limited conducted exploration on Wilgespruit between 1971 and 1999, completing more than 160 diamond drill holes and sinking an exploration shaft to a depth of 70 m to intersect the Merensky Reef. A 650 m long reef drive was developed along strike to establish the level of structural disturbance and test the grade variation.
Barrick Limited conducted exploration during 2004 and 2005 comprising soil sampling, aeromagnetic survey, seismic surveys, prospecting shaft investigations, exploration drilling and extraction of a bulk sample, which resulted in the declaration of an Inferred Mineral Resource estimate of 15.9 Moz in December 2005. Exploration comprising exploration/geotechnical drilling, metallurgical and pre-feasibility/feasibility studies continued from 2005 to 2008, with a NOMR NW30/5/1/2/2/333MR granted in June 2008. A section 102 application to incorporate the two Magazynskraal NOPRs into the Sedibelo NW30/5/1/2/2/333MR was submitted in May 2017.
An integrated feasibility study for the combined exploitation of the West Pit, East Pit and the Central Underground Block (Wilgespruit) and East Underground Block (Wilgespruit and Magazynskraal) was completed in August 2020 (the 2020 FS). While the engineering designs for the mining, surface infrastructure, underground infrastructure and ventilation were done to a feasibility study level of confidence, certain aspects do not satisfy the SK1300 requirements for a feasibility study, as follows:
| · | Capital estimates for modifications and/or additions to the processing plants include contingencies that are >10% [not at feasibility study status]; |
| · | Permitting requirements are identified but not finalized [pre-feasibility status]; |
| · | Geotechnical drilling is still required at the boxcuts and along the decline spines for detailed design purposes [pre-feasibility study status]; |
| · | Geotechnical assessment is required for foundation designs at the West Portal [pre-feasibility study status]; |
| · | Reclamation and mitigation plans are detailed but not finalized [pre-feasibility status]; and |
| · | Environmental impact studies for the Section 102 application which commenced in late 2020 are not finalized [not at feasibility study status]. |
| Since the level of confidence or accuracy in an engineering study is as good as the lowest common denominator, the above aspects indicate the P-S-M Project should be classified as a pre-feasibility study (PFS) in terms of Table 1 to Paragraph (d) in SK1300 [§229.1302(d)]. This implies Capital Cost Estimate (Capex) and Operating Cost Estimate (Opex) accuracy of ±25% and overall project contingency of ≤15% should be achieved. |
At the Effective Date of this TRS, a single family of farmer occupants still needs to sign the relocation agreement and discussions with the family are ongoing. SRK understands that relocation of this family should occur in the near future. This is not impacting on SPM’s ability to access the property and start mining at the East Pit.
Magazynskraal
Rustenburg Platinum Mines (a subsidiary of Anglo Platinum) conducted exploration drilling on Magazynskraal from 1994 to 2009, completing 31 diamond drill holes. Following cession of two New Order Prospecting Rights (NOPRs) to Richtrau in July 2008, a further 108 diamond drill holes and twelve 2D seismic traverses were completed between 2009 and 2011. A pre-feasibility study (PFS) for the Sedibelo East/Magazynskraal ore body was completed in October 2011.
A NOMR NW30/5/1/2/2/10029MR was granted in May 2016, but registration was put on hold.
A section 102 application to incorporate the two Magazynskraal NOPRs (as well as the Kruidfontein NOPR) into the Sedibelo NW30/5/1/2/2/333MR was submitted in May 2017. Completion of this section 102 process is dependent on a NOMR being granted for Kruidfontein, which in turn is dependent on a consolidated Environmental Management Programme Report (EMPr) for Wilgespruit, Magazynskraal and Kruidfontein being approved by the Department of Mineral Resources and Energy (DMRE). With the delays in accessing the Wilgespruit property, the EIA/EMP process only commenced in late 2020 and is still ongoing.
| SRK | Report date: 27 May 2022 |
| | Effective Date: 31 December 2021 |
| | |
| SRK Consulting – 576060 SPM PSM Project TRS | Page vi |
An integrated feasibility study for the combined exploitation of the West and East Pits and the Central and East Underground Blocks was completed in August 2020. This is considered to be at a PFS level (see discussion for Sedibelo above).
| ES6: | Mineral Resource and Mineral Reserve Estimates |
[SR4.1(vi), SR4.2(ii), SR4.5(i)(ii)(iv)(v)(vii), SR5.6(v), SR6.1(i)(ii), SR6.3(vi)]
The in situ PGM Mineral Resources exclusive of PGM Mineral Reserves at 31 December 2021 are summarized in Table ES-2.
| Table ES-2: | Summary of SRK Audited in situ PGM Mineral Resources for the P-S-M Project at 31 December 2021 (EXCLUSIVE of Mineral Reserves) (100% attributable to SPM) |
Resource Area (EXCLUSIVE of Mineral
Reserves) | Tonnage (Mt) | PGM Grade (g/t) | Contained PGM | Base Metal Grade (%) | Contained
Cu + Ni |
| 4E | 6E | (4E Moz) | (6E Moz) | Ni | Cu | (kt) |
| Measured Mineral Resources | | | | | | | | |
| West Pit | 0.001 | 3.89 | 4.79 | 0.0001 | 0.0001 | 0.002 | 0.001 | 0.00 |
| East Underground Block | 0.3 | 5.76 | 7.06 | 0.05 | 0.07 | 0.018 | 0.004 | 0.07 |
| Total Measured Resources | 0.3 | 5.76 | 7.06 | 0.05 | 0.07 | 0.018 | 0.004 | 0.07 |
| Indicated Mineral Resources | | | | | | | | |
| West Pit | 11.1 | 2.89 | 3.29 | 1.03 | 1.18 | 0.126 | 0.025 | 16.80 |
| Central Underground Block | 4.2 | 6.59 | 8.58 | 0.90 | 1.13 | 0.028 | 0.010 | 1.62 |
| East Underground Block | 42.7 | 3.70 | 4.33 | 5.07 | 5.81 | 0.089 | 0.027 | 49.45 |
| Total Indicated Resources | 58.0 | 3.75 | 4.44 | 7.00 | 8.12 | 0.092 | 0.025 | 67.87 |
| Total Measured Indicated Resources | 58.3 | 3.76 | 4.46 | 7.05 | 8.19 | 0.091 | 0.025 | 67.94 |
| Inferred Resources | | | | | | | | |
| Central Underground Block | 9.1 | 6.54 | 8.23 | 1.90 | 2.40 | 0.035 | 0.012 | 4.31 |
| East Underground Block | 96.9 | 4.59 | 5.41 | 14.29 | 16.85 | 0.080 | 0.025 | 102.37 |
| West Pit low grade stockpiles | 55.8 | 0.70 | 0.80 | 1.26 | 1.44 | - | - | - |
| Total Inferred Resources | 161.8 | 3.36 | 3.98 | 17.46 | 20.69 | 0.050 | 0.016 | 106.68 |
Notes:
| 1 | Mineral Resources are not Mineral Reserves and do not meet the threshold for reserve modifying factors, such as estimated economic viability, that would allow for the conversion to Mineral Reserves. There is no certainty that any part of the Mineral Resources will be converted to Mineral Reserves. |
| 2 | The in situ Mineral Resources are reported exclusive of Mineral Reserves. |
| 3 | Open pit optimization was based on an assumed 4E basket price of ZAR21 000/oz, assumed mining & processing cost of ZAR445/t and reported within a pit shell that is based on a 120% revenue factor. |
| 4 | The Central Underground in situ Mineral Resources are based on calculated 4E cut-off grades of 1.62 g/t and 1.15 g/t for the PUP and UG2 reefs, respectively. These are based on 4E basket prices of USD2 086/oz and USD3 037/oz, which include a 20% premium, and plant recoveries of 85% and 82% for the PUP and UG2, respectively. |
| 5 | The East Underground in-situ Mineral Resources are reported above 4E cut-off grades of 1.25 g/t (UG2), 1.69 g/t (MR PUP), 1.73 g/t (MRC) and 1.64 g/t (UPR). These are based on 4E basket prices of USD3 020/oz, USD2 230/oz, USD2 176/oz and USD2 292/oz respectively which include a 20% premium. A plant recovery of 82.8% was applied. |
| 6 | Numbers in the table have been rounded to reflect the accuracy of the estimate and may not sum due to rounding. |
| 7 | 1 Troy Ounce = 31.1034768g. |
The PGM Mineral Reserve estimates for the P-S-M Project at 31 December 2021 attributable to SPM are summarized in Table ES-3. Mineral Reserves are reported as run-of-mine (RoM) ore delivered to the RoM stockpile (open pits) or to surface (underground mines).
| Table ES-3: | Summary of SRK Audited RoM PGM Mineral Reserves for the P-S-M Project at 31 December 2021 (100% attributable to SPM) |
| Reserve Area | | Tonnage (Mt) | PGM Grade (g/t) | Contained PGM | Base Metal Grade (%) | Contained Cu + Ni |
| 4E | 6E | (4E Moz) | (6E Moz) | Ni | Cu | (kt) |
| West Pit | 13.1 | 1.62 | 1.88 | 0.69 | 0.79 | 0.062 | 0.019 | 9.9 |
| East Pit | 20.5 | 1.56 | 1.82 | 1.0 | 1.2 | 0.060 | 0.009 | 14.0 |
| Central Underground Block | 12.8 | 4.76 | 6.05 | 2.0 | 2.5 | 0.020 | 0.004 | 2.7 |
| East Underground Block | 31.4 | 4.21 | 5.06 | 4.3 | 5.1 | 0.040 | 0.020 | 18.0 |
| Total Probable Mineral Reserves | 77.8 | 3.17 | 3.83 | 8.0 | 9.6 | 0.046 | 0.014 | 44.6 |
Notes:
| 1 | Mineral Reserves are based on various modifying factors and assumptions and may need to be revised if any of these factors and assumptions change. |
| 2 | Mineral Reserves should not be interpreted as assurances of economic life. |
| 3 | Mineral Reserves (West and East Pits) are derived from an optimized pit using a 4E basket price of R21 000/oz without application of a cut-off grade. |
| 4 | Mineral Reserves (underground blocks) are reported at cut-off RoM grades of 2.32 g/t 4E and 2.67 g/t 4E for UG2 and PUP, respectively. These are based on 4E basket prices of USD1 587/oz and USD1 336/oz and plant recoveries of 79% and 81%% for the UG2 and PUP reefs, respectively. |
| 5 | Numbers in the table have been rounded to reflect the accuracy of the estimate and may not sum due to rounding. |
| SRK | Report date: 27 May 2022 |
| | Effective Date: 31 December 2021 |
| | |
| SRK Consulting – 576060 SPM PSM Project TRS | Page vii |
The in situ Chromite Mineral Resource estimates exclusive of Chromite Mineral Reserves and RoM Mineral Reserves for the P-S-M Project at 31 December 2021 are summarized in Table ES-4.
| Table ES-4: | SRK Audited in situ Chromite Mineral Resources Exclusive of Chromite Mineral Reserves and RoM Mineral Reserves for the P-S-M Project at 31 December 2021 (100% attributable to SPM) |
Mineral Resources (EXCLUSIVE) | Tonnage | Grade | Content | Mineral Reserves | Tonnage | Grade | Content |
| (Mt) | (%) | (kt) | (Mt) | (%) | (kt) |
| Indicated Mineral Resources | | | | Probable Mineral Reserves | | | |
| West Pit | 3.4 | 19.9 | 684 | West Pit | 4.8 | 11.9 | 574 |
| East Underground Block | 23.6 | 29.4 | 6 944 | East Underground Block | 24.3 | 23.1 | 5 613 |
| Total Indicated Resources | 27.0 | 28.2 | 7 628 | Probable Mineral Reserves | 29.1 | 21.3 | 6 187 |
| Inferred Resources | | | | | | | |
| Central Underground Block | 11.7 | 26.5 | 3 110 | | | | |
| East Underground Block | 47.5 | 29.4 | 13 974 | | | | |
| Total Inferred Resources | 59.2 | 28.9 | 17 084 | | | | |
Notes:
| 1 | Mineral Resources are not Mineral Reserves and do not meet the threshold for reserve modifying factors, such as estimated economic viability, that would allow for the conversion to Mineral Reserves. There is no certainty that any part of the Mineral Resources will be converted to Mineral Reserves. |
| 2 | The in situ Mineral Resources are reported exclusive of the RoM Mineral Reserves |
| 3 | Mineral Reserves are based on various modifying factors and assumptions and may need to be revised if any of these factors and assumptions change. |
| 4 | Mineral Reserves should not be interpreted as assurances of economic life. |
| 5 | Chromite grade and content refers to Cr2O3. |
Reconciliation of Mineral Resources and Mineral Reserves
[SR1.4(iii), SR4.2(v), SR4.5(vi), SR6.1(iii)]
The reported Mineral Resource tonnages and contained 4E PGMs (Inclusive of Mineral Reserves) on SPM’s website at December 2019 and per this TRS at December 2021 are compared in Table ES-5. All reporting of Mineral Resources previously was done on an inclusive basis. Reasons for the differences are provided under Comments.
Reporting of 6E PGM grades and contents was not done previously.
| Table ES-5: | PGM Summary Mineral Resource Comparison (INCLUSIVE of Mineral Reserves) |
| Reserve Area | Units | SPM website
(Dec’2019) | This TRS (Dec’2021) | Comments |
| West Pit | (Mt) | 25.92 | 18.97 | Difference due to mining depletion Merensky S1 package not practical to mine selectively and been excluded. |
| | (Moz 4E) | 2.41 | 1.79 |
| East Pit | (Mt) | 29.5 | 14.5 | Changes in the East Pit and Central Underground Block mine designs. East Pit Resources reported within the pit shell used to report Mineral Reserves. The 2019 figures were based on a 120% revenue factor resource pit shell. |
| | (Moz 4E) | 2.50 | 1.19 |
| Central Underground | (Mt) | 22.6 | 25.6 | All PUP was excluded in 2019 due to the thin middling between UG2 and PUP. Difference due to updated Reef Picks, grade estimation and updated Resource classification criteria |
| | (Moz 4E) | 4.5 | 5.49 |
| East Underground | (Mt) | 181.2 | 178.0 | Differences not material |
| | (Moz 4E) | 26.1 | 25.9 |
The reported Mineral Reserve tonnages and contained 4E PGMs on SPM’s website at December 2019 and per this TRS at December 2021 are compared in Table ES-6. Reasons for the differences are provided under Comments.
| SRK | Report date: 27 May 2022 |
| | Effective Date: 31 December 2021 |
| | |
| SRK Consulting – 576060 SPM PSM Project TRS | Page viii |
| Table ES-6: | PGM Summary Mineral Reserve Comparison |
| Reserve Area | Units | SPM website
(Dec 2019) | This TRS (Dec 2021) | Comments |
| West Pit | (Mt) | 22.9 | 13.1 | The differences relate to mining depletion over 24 months, plus a reduced pit footprint based on a lower 4E basket price. |
| | (Moz 4E) | 1.49 | 0.7 |
| East Pit | (Mt) | 19.0 | 20.6 | The East Pit footprint was reduced based on a lower 4E basket price, with increased mining dilution |
| | (Moz 4E) | 1.24 | 1.0 |
| Central Underground | (Mt) | 19.4 | 12.8 | Areas to the north excluded from the design due to severe faulting. Areas in the south and east moved from Indicated to Inferred. Isolated Merensky blocks that are above cut-off and the middling to UG2 >20m included. |
| | (Moz 4E) | 3.01 | 1.9 |
| East Underground | (Mt) | 28.5 | 31.4 | Decreased production rate from 140 ktpm to 80 ktpm reduced the effect from tail losses in the LoM production profile. (production rate <50 ktpm excluded) |
| | (Moz 4E) | 4.61 | 4.3 |
| ES7: | Mining Methods, Ore Processing and Infrastructure |
Mining Methods
[SR4.2(ii), SR4.3(ii), SR5.2(i)(iv)]
The West Pit ore body is mined by open pit methods by a mining contractor using conventional truck and shovel operations. The same mining method is planned for the East Pit. The mining sequence is driven by RoM annual targets and the backfilling of waste to mined out areas within the open pit. The designs and scheduling of the open pit mining in the West and East Pits were conducted on a combined basis as neither pit can by itself sustain the current production levels of 230 ktpm of silicates and 67 ktpm of UG2 ore to the plant.
Only the UG2 and PUP (Merensky potholed on to the UPR) reefs are of economic importance underground. The Central and East Underground Blocks are accessed via two triple-barrel declines, one per block. Construction for the boxcuts for the East and Central Portals is scheduled to commence in January 2022 and January 2024 respectively. Conventional breast mining with off-reef access was selected as the mining method, due to the dip of the ore body (12° to 14°), the narrow channel width of UG2 and PUP reefs and faulting on the reef plane. All footwall development is done using a trackless mechanised mining fleet. The East and Central Underground Blocks are designed to each produce 80 ktpm of RoM ore.
Underground infrastructure in both blocks consists of trucking to ore and waste silos, decline conventional conveyors, chairlifts, ventilation network and staged dewatering.
Ore Processing
[SR4.3(ii), SR5.3(iii)]
The 230 ktpm silicate and 67 ktpm UG2 concentrators are of conventional MF2 design located at the West Pit operation. Once open pit operations cease, the larger Merensky (silicate) circuit will be reconfigured to handle an underground ore feed of 160 ktpm which comprises predominantly UG2.
A chrome recovery plant (CRP) utilising a two-stage reverse classifier circuit which is installed at the inter-stage position (between the primary and secondary circuits) produces metallurgical grade chromite of 40.0% to 42.0% Cr2O3 grade. All chromite concentrate is sold in terms of an existing off-take agreement.
The tailings from the Merensky and UG2 circuits are combined and fed to a tailings scavenging plant (TSP). The tailings are disposed on an existing tailings storage facility (TSF).
The combined PGM concentrate is currently transported to Impala Platinum Limited’s Impala Refining Services (IRS) for toll-treating where the base metals and PGMs are extracted to final metal. The IRS contract terminates in September 2022, after which the PGM concentrate is expected to be toll-treated under similar conditions by a third-party smelter until December 2023.
SPM plans to implement a 110 ktpa capacity KELL plant at PPM to be able to treat all the concentrate from the SPM operations with effect from January 2024. The KELL involves a hydrometallurgical process which would replace the conventional smelting and refining process at IRS. Construction of the KELL plant is planned to occur during 2022 and 2023.
| SRK | Report date: 27 May 2022 |
| | Effective Date: 31 December 2021 |
| | |
| SRK Consulting – 576060 SPM PSM Project TRS | Page ix |
Infrastructure
[SR4.3(ii), SR5.4(i) (ii), SR5.6(viii)]
The P-S-M Project assumes surface trucking of ore and waste until each underground block reaches steady state production, at which time surface Doppelmayr RopeCon® systems will be commissioned. These will convey ore across to the RoM ore tip for the PPM concentrators and waste to the waste deposition points in the available pits.
The existing TSF at PPM’s West Pit operation has sufficient capacity to handle the tailings generated by the P-S-M Project over the scheduled LoM plan.
| ES8: | Summary Capital and Operating Cost Estimates |
Capital Cost Estimates
[SR4.3(vii), SR5.6(iii) (vi)]
The summary Capex for the P-S-M Project, based on the 2020 study and re-costed to be valid at 31 December 2021, is shown in Table ES-7. Foreign currency exposure accounts for 15% of the total project Capex, the majority being the RopeCon® conveyor equipment, the TMM equipment and the Kell Plant contribution. In terms of SPM’s accounting policy, Opex up to steady-state production levels in the underground operations is capitalized.
Table ES-7: P-S-M Project Capital Summary
| Item | Units | Project capital | Capitalised Opex | Total Capex |
| Exploration | (ZARm) | 118 | 0 | 118 |
| Pre-implementation | (ZARm) | 295 | 0 | 295 |
| Mining | (ZARm) | 1 555 | 9 239 | 10 795 |
| Surface Infrastructure | (ZARm) | 1 955 | 0 | 1 955 |
| Surface services, water, power, access | (ZARm) | 640 | 0 | 640 |
| Metallurgical Processing | (ZARm) | 1 467 | 527 | 1 993 |
| Contingency | (ZARm) | 604 | 488 | 1 093 |
| Total Capital including Contingency | (ZARm) | 6 635 | 10 254 | 16 889 |
Contingencies were added to the various items depending on the level of engineering confidence. The metallurgical capex includes contingencies of >10%. The contingency included in the capitalized Opex is 5%. The overall contingency averages 6.92%.
The P-S-M Project has been re-classified as a study at a PFS level as discussed in Section ES5 and Section 1.1. SRK considers that the accuracy of the Capex is ±25% with a contingency of <15% in keeping with Table 1 to Paragraph (d) in SK1300 [§229.1302(d)].
Operating Cost Estimates
[SR4.3(vii), SR5.6(iii) (vi), (ix)]
The summary Opex for the open pit and underground mining for the P-S-M Project is shown in Table ES-8. Year 2025 and Year 2031 are used to illustrate the unit operating cost for the combined open pits (West and East Pit) and combined Central and East Underground Blocks respectively.
Table ES-8: P-S-M Project Opex Summary
| Item | Units | Open Pits (Year 2025) | Underground (Year 2031) |
| RoM ore mined | (Mt) | 5.59 | 1.99 |
| Mining Opex | (ZAR/t RoM) | 370 | 950 |
| Processing Opex | (ZAR/t RoM) | 182 | 397 |
| G&A Opex | (ZAR/t RoM) | 114 | 377 |
| SIB Opex | (ZAR/t RoM) | 21 | 99 |
| Smelting and Refining Opex | (ZAR/t RoM) | 3 | 19 |
| Kell Opex (including net royalties) | (ZAR/t RoM) | 29 | 95 |
| Total | (ZAR/t RoM) | 720 | 1 936 |
The Opex for the open pits is based on the actual costs at PPM, whereas the Opex for the underground operations has been derived from first principles and zero-based budgeting processes. The Opex for the underground operations is seen to have an accuracy of ±25%.
A general contingency of 5% is included in the Opex in Table ES-8.
| SRK | Report date: 27 May 2022 |
| | Effective Date: 31 December 2021 |
| | |
| SRK Consulting – 576060 SPM PSM Project TRS | Page x |
| ES9: | Permitting Requirements |
[SR4.3(iv), SR5.6(ix)]
Environmental aspects of the Project are administered primarily under several EMPRs, two Water Use Licences (WULs) and a Waste management Licence (WML). Based on SRK’s understanding and review of the documentation provided by the Company, the following environmental authorizations and permits are pending and will be required for the project:
| • | An Environmental Authorization (EA) in terms of Section 24(2)(a) of the National Environmental Management Act, 1998, is not in place for the listed activities associated with the following approved EMPr: |
| o | EMPr Amendment amending PPM Closure Objectives – February 2012, approved on 16 January 2012. The February 2017 EMPr specifically states that prior to the undertaking of any possible listed activities associated with the said EMPr Closure Objectives, a separate EA application will be submitted to the Responsible Authority. The EA, WULA and supporting studies for pit closure activities are still to be undertaken. However, the current active pit is expected to operate for at least five years prior to closure; |
| • | An EMPr amendment, which was submitted to the Department of DMRE on 24 April 2020, is still pending a decision. A follow-up meeting was held with the DMRE on 19 January 2021. Although a formal Section 102 is still to be finalised, SRK understands that at the 19 January 2021 meeting, the DMRE conceded that activities under the issued EA can commence, although the DMRE still needs to issue a formal letter regarding this decision; |
| • | EA applications were submitted in terms of Section 24 of NEMA, 1998 to NWREAD (Rural Environment and Agricultural North West Provincial Department), to authorize a planned PPM housing project, the Magazynskraal project and the listed activities associated with the EMPr Amendment November 2011, which EA applications were refused by NWREAD in 2017. It must be noted that from 8 December 2014, DMRE and not DEA (NWREAD) is the competent authority to approve an EA application for listed activities in mining areas. The decisions on the aforesaid EA applications are at risk of being invalid. There are still no decisions in place regarding the housing project; and |
| • | Sedibelo Project was issued a WUL in 2015, and an amendment application was submitted to the authorities in December 2020. Although a formal Section 102 is still to be finalised, SRK understands that at the 19 January 2021 meeting, the DMRE conceded that activities under the issued EA can commence, although the DMRE still needs to issue a formal letter regarding this decision. |
All required environmental authorizations and permits will need to be in place prior to construction commencing. Furthermore, the Project will have to acquire the necessary permits and licences (as indicated above) to commence production.
The immediate closure liability for the operation has been assessed to be ZAR422m relative to a full insurance guarantee facility of ZAR700m. Some ZAR1 385m is the projected total to be spent on closure and rehabilitation activities through the life of the Project. Neither the immediate closure nor end of life closure liability is supported by a mine closure and rehabilitation plan as this has not yet been developed for the operation.
[SR4.3(viii), SR5.7(i)]
Key issues to the integrated P-S-M Project are:
| o | One family remained on the Wilgespruit farm after an agreement was brokered with the majority of the families represented by the Lesethleng Land Community (LLC). A delay in reaching an agreement with the remaining family could lead to a delay in project activities. SRK understands that management measures and ongoing communication are being deployed to ensure that planned construction activities can be undertaken. Currently only one family still needs to sign the relocation agreement. SPM therefore currently has access to the farm with 99% of the farmers having relocated to outside the mining area; |
| o | Potential disruption of projects and challenges in maintaining strong stakeholder relations may result from internal tensions within the Bakgatla Ba-Kgafela Tribe (BBKT) leadership and reported dissatisfaction about royalty benefits amongst some sectors of the community not aligned with the current leadership; |
| SRK | Report date: 27 May 2022 |
| | Effective Date: 31 December 2021 |
| | |
| SRK Consulting – 576060 SPM PSM Project TRS | Page xi |
| o | General high expectations of employment, procurement and development benefits remain in the communities within SPM’s zone of influence and stakeholder relations should be managed with care; |
| o | Environmental constraints may be realised if approval of environmental authorizations is not granted; |
| o | Water quality issues in general are regarded as a low risk but subject to a fair degree of uncertainty. This may extend to a requirement for post-closure water treatment; |
| o | Solids from the tailings slurry do not settle out during its residence time on the operational pool of the TSF. This presents a water management risk as well as a water resources contamination risk. PPM is also currently non-compliant with GN704 for a number of facilities; |
| o | The closure cost excludes provision for post-closure water treatment, based on the assumption that mitigation measures put in place during the operational phase will be adequate. While mitigation during the operational phase could take the form of ensuring that all standard measures are taken to prevent water quality deterioration, water treatment, if it is required, would involve either passive or active systems. In the event that active treatment is required this could represent a material liability, but this is considered a low risk. Modelling undertaken indicates that decant of water from the pit in the post-closure scenario is unlikely and that any contaminated plume from the tailings dam and WRD will flow beneath the Wilgespruit, making it unlikely to decant; |
| o | Escalating wage demands are not linked to inflation; |
| o | There is a lack of suitable accommodation in the area; and |
| o | Due to the factors described in Section ES5 and Section 1.1, the 2020 FS has been downgraded to a pre-feasibility level and Capex is seen to have an accuracy of ±25%. |
[SR5.6, SR5.8]
The Net Present Value (NPV) of the post-tax cash flows for the P-S-M Project at a range of discount values and other financial indicators, based on the CRU International Limited’s (CRU) forecast metal prices and ZAR:USD exchange rates as provided by the Company, are set out in Table ES-9. Similar results from the use of three-year trailing averages and spot values at 31 December 2021 are included for comparative purposes.
| SRK | Report date: 27 May 2022 |
| | Effective Date: 31 December 2021 |
| | |
| SRK Consulting – 576060 SPM PSM Project TRS | Page xii |
Table ES-9: Key Financial Results from P-S-M Project TEM Cash Flow
| Item | Units | CRU (2021) | Alternative Price Decks (Section 15) |
Three-year trailing average | Spot (31 Dec’21) |
| NPV | | | | |
| 8% | (ZARm) | 30 945 | 18 481 | 27 610 |
| 8.4% (WACC lower limit) | (ZARm) | 29 830 | 17 348 | 26 142 |
| 9.0% (SPM’s WACC) | (ZARm) | 28 276 | 15 778 | 24 109 |
| 10.7% (WACC upper limit) | (ZARm) | 24 540 | 12 048 | 19 268 |
| 11% | (ZARm) | 23 968 | 11 483 | 18 534 |
| 12% | (ZARm) | 22 220 | 9 772 | 16 305 |
| Other Financial Indicators | | | | |
| Operating margin | (%) | 57% | 54% | 60% |
| IRR | (%) | N/A | 25% | 39% |
| Total Capex | (ZARm) | 16 889 | 16 791 | 16 889 |
| SIB Capex (in Opex) | (ZARm) | 4 978 | 4 978 | 4 978 |
| Peak funding | (ZARm) | N/A | -6 685 | -3 343 |
| Payback period | (years) | 0 | 8 | 7 |
| Av. unit cost (incl. Royalty) | (ZAR/t RoM) | 436 | 436 | 436 |
| (Open Pit – average 2022-2025) | (ZAR/4E oz) | 29 046 | 29 046 | 29 046 |
| Av. unit cost (incl. Royalty) | (ZAR/t RoM) | 840 | 840 | 840 |
| (U/G – average 2032-2040) | (ZAR/4E oz) | 12 495 | 12 534 | 12 694 |
| N/A | not applicable. Cannot be calculated (first year positive) or capital injection not required |
The sensitivity of the P-S-M Project to changes in Revenue (grade, recovery, price/exchange rate) and Opex is shown in Table ES-10.
Table ES-10: P-S-M Project – variation in real NPV at 9.0% discount based on twin (Revenue and Opex) sensitivities
| NPV at 9.0% | 6E Basket Price | Revenue Sensitivity |
| All values in ZARm | (USD/oz) | 1 679 | 1 778 | 1 877 | 1 976 | 2 074 | 2 173 | 2 272 |
| | -15% | -10% | -5% | 0% | 5% | 10% | 15% |
| Opex Sensitivity | -15% | 22 540 | 25 763 | 28 986 | 32 198 | 35 405 | 38 613 | 41 820 |
| -10% | 21 223 | 24 452 | 27 675 | 30 894 | 34 101 | 37 308 | 40 516 |
| -5% | 19 901 | 23 141 | 26 364 | 29 587 | 32 797 | 36 004 | 39 211 |
| 0% | 18 564 | 21 827 | 25 053 | 28 276 | 31 492 | 34 700 | 37 907 |
| 5% | 17 190 | 20 506 | 23 742 | 26 965 | 30 188 | 33 395 | 36 603 |
| 10% | 15 800 | 19 172 | 22 431 | 25 654 | 28 878 | 32 091 | 35 298 |
| 15% | 14 409 | 17 804 | 21 110 | 24 343 | 27 566 | 30 787 | 33 994 |
Use of the CRU price deck (see Table 15.2 in Section 15 of the main report) yields a real terms post-tax net present value at 9.0% discount (NPV9.0%) of ZAR28.3bn and an operating margin of 57%. The IRR cannot be determined as the cash flows are positive in each period, i.e., the project is self-funding from the operating profit. The average steady-state underground operating costs of ZAR840/t RoM and ZAR12 495/oz 4E are comparable to those at Amandelbult (Table 19.4) for similar mining depths, and less than those at Northam (Table 19.6) (deeper operations).
With the use of the three-year trailing average price and exchange rate values, a real-terms NPV9.0% of ZAR15.8bn, an IRR of 25% and an operating margin of 54% result. Peak funding of ZAR6.68bn would be required under this price/exchange rate scenario and the pay-back period is shown to be eight years. The spot values at 31 December 2021 yield a real-terms NPV9.0% of ZAR24.1bn and an operating margin of 60%.
The average steady-state operating costs are largely unaffected by which price deck is used.
The twin-sensitivity tables show that the P-S-M Project is most sensitive to changes in Revenue and least sensitive to changes in Capex.
| SRK | Report date: 27 May 2022 |
| | Effective Date: 31 December 2021 |
| | |
| SRK Consulting – 576060 SPM PSM Project TRS | Page xiii |
| ES12: | Conclusions and Recommendations |
[SR7.1(ii)]
Mineral Resources
Mineral Resources have been estimated and classified in accordance with the requirements of the SAMREC Code (2016 Edition). The selected classifications of Measured, Indicated and Inferred reflect the confidence in the underlying data, the data validation and estimation methods applied.
Mining
The existing mining contractor, which is mining the West Pit, will be used to mine the East Pit together with some community contractors. Open pit operations utilize conventional drill, blast, load and haul processes with a fleet of large mining equipment.
The underground mining will use conventional breast stoping accessed from footwall development, which are tried and tested methods in use in South Africa.
Economic Analysis
The economic analysis of the P-S-M Project has been done at an effective level of a pre-feasibility study as defined by SK1300.
The economic analysis of the P-S-M Project is based on a detailed LoM plan which exploits Probable Mineral Reserves that are derived from Measured and Indicated Mineral Resources. SPM will only declare Proved Mineral Reserves for an underground operation when the required development to support a mining block has been established and the ore block has been sampled. No Inferred Mineral Resources were included in the LoM plan or the economic analysis.
The TRS contains statements of a forward-looking nature. The achievability of the projections, LoM plans, budgets and forecast TEPs as included in the TRS is neither warranted nor guaranteed by SRK. The projections cannot be assured as they are based on economic assumptions, many of which are beyond the control of the Company or SRK.
Implementation
There are some aspects of the project that need further investigation which SPM should undertake before project implementation commences, for example:
| • | Geotechnical drilling/assessment of the portals and decline spines (completed for East Portal); |
| • | Surface geotechnical assessment of the ground conditions at the East and West Portals; |
| • | Amendments to approved Environmental Impact Assessment (EIA)/EMPr reports, WULs and updating of relevant specialist studies; |
| • | Hydrogeological investigation to confirm groundwater inflow parameters. |
SPM has selected Worley Parsons South Africa (Worley) as the Engineering, Procurement and Construction Management (EPCM) contractor to build the portal and portal infrastructure for the East Underground Block. Worley has been issued with a letter of intent to enable them to start work on design and implementation of the East Portal while contract negotiations take place. SPM expects that the contract negotiations will be concluded by the end of March 2022, after which Worley will be appointed.
The first phase of the mining contractor selection process has been concluded, with two contractors selected for further capability discussions based on their tender submissions. Once the mining contractor has been selected, the contract negotiations will start. The mining contractor will also be issued with a letter of intent to enable them to start the mobilization process with the recruitment and training of their workforce. The mining contractor will be required to start work by the beginning of July 2022.
Processing
The technologies utilized in the PPM concentrators are standard in the South African PGM industry and represent very little risk in the extraction of the PGMs and base metals.
The Kell process is novel in that it applies well recognized technologies (e.g., pressure oxidation, leach, precipitation, solvent extraction, ion exchange, flash drying) in the processing of the flotation concentrate without the need of a smelter step. This is identical to what has been the common processing route for PGM concentrates, with the exception that power intensive smelting is not included. Should the Kell process not deliver the expected results, SPM can revert to the conventional smelting and refining process provided by IRS or other third-party smelter. The use of Kell technology therefore does not represent a risk that would prevent the declaration of the Mineral Reserves presented in this report.
Environment, Social and ESG
Prior to the further development of the P-S-M Project, SPM will have to acquire the necessary permits and licences to commence production, such as EMPrs, WULs and Waste Disposal licences (as required). Additionally, the relevant specialists studies should be updated.
| SRK | Report date: 27 May 2022 |
| | Effective Date: 31 December 2021 |
| | |
| SRK Consulting – 576060 SPM PSM Project TRS | Page xiv |
Completion of the Section 102 application to incorporate the two Magazynskraal NOPRs (as well as the Kruidfontein NOPR) into the Sedibelo NOMR is dependent on a NOMR being granted for Kruidfontein, which in turn is dependent on a consolidated EMPr for Wilgespruit, Magazynskraal and Kruidfontein being approved by the Department of Mineral Resources and Energy (DMRE). With the delays in accessing the Wilgespruit property, the EIA/EMP process only commenced in late 2020 and is still ongoing.
SPM needs to adopt an integrated and holistic approach supported by an adequately resourced social team to effectively manage the social risks associated with the high level of community expectations, legacy issues and local governance dynamics.
SPM appointed a Chief ESG Officer on 1 December 2021 responsible for spearheading the Company’s ESG programme including its work on environment, renewable energy, emission reduction, social programmes, inclusivity and ESG reporting.
In June 2021, PPM issued a Request for Proposal for renewable energy services to the mine. The Company signed a Memorandum of Understanding on 10 March 2022 with a consortium of Independent Power Producers that will use a combination of solar and wind renewable energy sources. The first 40 MW of energy supply to PPM is expected to flow from Q1 2024, with a further 35 MW of power from a solar plant at or adjacent to the mine to cater for the underground mine from Q2 2026. SPM expects to realise a saving of about 25% on its annual Eskom-based electricity cost from 2024 onwards, which has been incorporated into the economic evaluation.
| SRK | Report date: 27 May 2022 |
| | Effective Date: 31 December 2021 |
| | |
| SRK Consulting – 576060 SPM PSM Project TRS | Page xv |
Table of Contents
| 1.2 | Terms of reference and purpose of TRS | 1 |
| 1.3 | Sources of information | 3 |
| 1.4 | Details of personal inspection | 3 |
| 2.2 | South African Regulatory Environment | 7 |
| 2.2.1 | Constitution of the Republic of South Africa Act | 7 |
| 2.2.2 | The Mineral and Petroleum Resources Development Act | 7 |
| 2.2.3 | The Mineral and Petroleum Resources Development Amendment Bill | 8 |
| 2.2.5 | Mineral and Petroleum Resources Royalty Act | 8 |
| 2.2.8 | South African Environmental Legislation | 10 |
| 2.3.1 | B-BBEE Certification | 13 |
| 2.3.2 | BEE / HDSA Ownership of Rights | 14 |
| 2.3.4 | Prospecting Rights | 14 |
| 2.4 | Property encumbrances and permitting requirements | 19 |
| 2.4.1 | Environmental, water and waste authorizations, licences and permits | 19 |
| 2.5 | Significant Factors and Risks affecting access, title | 19 |
| 2.6 | Royalty interest in the property | 19 |
| 3 | ACCESSIBILITY, CLIMATE, LOCAL RESOURCES, INFRASTRUCTURE AND PHYSIOGRAPHY | 20 |
| 3.1 | Topography, elevation and vegetation | 20 |
| 3.4 | Infrastructure Availability, including bulk services, personnel and supplies | 20 |
| 4.1 | Previous Operations, Operators | 21 |
| 4.1.1 | West Pit (Tuschenkomst) (Operational) | 21 |
| 4.1.2 | Sedibelo (Wilgespruit) | 21 |
| 4.2 | Exploration and development work | 21 |
| 4.2.1 | West Pit (Tuschenkomst) | 21 |
| 4.2.3 | Magazynskraal Project | 24 |
| SRK | Report date: 27 May 2022 |
| | Effective Date: 31 December 2021 |
| | |
| SRK Consulting – 576060 SPM PSM Project TRS | Page xvi |
| 5 | GEOLOGICAL SETTING, MINERALIZATION AND DEPOSIT | 27 |
| 5.1 | Regional, local and project geology | 27 |
| 5.1.1 | The Merensky Reef Layer | 33 |
| 5.1.2 | The Pseudo Reef Layer | 33 |
| 5.1.3 | The UG2 Chromitite Layer | 33 |
| 5.1.4 | Geological Features | 33 |
| 6.1 | Non-drilling activities | 37 |
| 6.1.3 | Magazynskraal Project | 38 |
| 6.2 | Drilling, Logging and Sampling | 38 |
| 6.2.2 | Sampling Procedures | 42 |
| 6.3 | Hydrogeology Characterization | 43 |
| 6.3.1 | Water Quality Testing Quality Assurance | 44 |
| 6.4 | Geotechnical data, testing and analysis | 44 |
| 6.4.1 | East and West Open Pits | 44 |
| 6.4.2 | Central and East Underground Blocks | 49 |
| 7 | SAMPLE PREPARATION, ANALYSES AND SECURITY | 53 |
| 7.1 | Sample preparation methods and quality control measures | 53 |
| 7.2 | Sample preparation, assaying and laboratory procedures | 53 |
| 7.2.3 | Magazynskraal Project | 55 |
| 7.3 | Quality assurance and quality control measures | 55 |
| 7.3.3 | Magazynskraal Project | 58 |
| 7.4 | Adequacy of sample preparation, security and analytical procedures | 59 |
| 7.5 | Unconventional analytical procedures | 60 |
| 8.1 | Data verification procedures applied | 61 |
| 8.2 | Limitations in data verification | 61 |
| 9 | MINERAL PROCESSING AND METALLURGICAL TESTING | 62 |
| 9.1 | Nature of mineral processing, metallurgical testing and analytical procedures | 62 |
| 9.1.1 | Metallurgical Testwork – West Pit (Tuschenkomst) | 62 |
| 9.1.2 | Metallurgical Testwork - Sedibelo (Wilgespruit) | 62 |
| 9.1.3 | Metallurgical Testwork – Magazynskraal / Sedibelo East | 64 |
| 9.1.4 | Metallurgical test work – Kell Refining Process | 67 |
| 9.2 | Representivity of test samples | 68 |
| 9.2.1 | West Pit (Tuschenkomst) | 68 |
| 9.2.2 | Sedibelo (Wilgespruit) | 68 |
| 9.3 | Testing Laboratory and Certification | 68 |
| SRK | Report date: 27 May 2022 |
| | Effective Date: 31 December 2021 |
| | |
| SRK Consulting – 576060 SPM PSM Project TRS | Page xvii |
| 9.4 | Plant Recovery and deleterious factors/elements | 69 |
| 10 | MINERAL RESOURCE ESTIMATES | 70 |
| 10.1 | Key assumptions, parameters and methods used to estimate Mineral Resources | 70 |
| 10.1.3 | Central Underground Block | 75 |
| 10.1.4 | East Underground Block | 78 |
| 10.2 | Mineral Resource estimation | 87 |
| 10.2.3 | Central Underground Block | 89 |
| 10.2.4 | East Underground Block | 90 |
| 10.2.5 | Low grade stockpiles | 92 |
| 10.3 | Mineral Resource classification criteria and uncertainties | 93 |
| 10.3.3 | Central Underground Block | 96 |
| 10.3.4 | East Underground Block | 98 |
| 10.4 | Reasonable Prospects of Economic Extraction (RPEE) | 101 |
| 10.4.1 | West and East Pit | 102 |
| 10.4.2 | Central Underground Block | 102 |
| 10.4.3 | East Underground Block | 102 |
| 10.5 | Mineral Resource Statement | 103 |
| 10.5.1 | West and East Pits | 103 |
| 10.5.2 | Central Underground Block | 103 |
| 10.5.3 | East Underground Block | 104 |
| 10.5.4 | TSF, DMS and Scat | 104 |
| 10.5.5 | Reconciliation of Mineral Resources | 113 |
| 11 | MINERAL RESERVE ESTIMATES | 115 |
| 11.1 | Key assumptions, parameters and methods used to estimate Mineral Reserves | 115 |
| 11.1.1 | West Pit and East Pit | 115 |
| 11.1.2 | Central and East Underground Blocks | 118 |
| 11.2 | Mineral Reserve estimates | 119 |
| 11.2.1 | Reconciliation of Mineral Reserves | 122 |
| 11.3 | Mineral Reserve classification criteria | 122 |
| 11.3.1 | West Pit and East Pit | 122 |
| 11.3.2 | Central and East Underground Blocks | 122 |
| 11.4 | Cut-off grade calculation | 124 |
| 11.4.1 | West Pit and East Pit | 124 |
| 11.4.2 | Central and East Underground Blocks | 124 |
| 11.5 | Metal or mineral equivalents | 124 |
| 11.6 | Risk Factors to Mineral Reserve estimates and modifying factors | 125 |
| 11.6.3 | Central and East Underground Blocks | 125 |
| 12.1 | Geotechnical and hydrogeological parameters relevant to mine designs | 126 |
| 12.1.1 | West and East Pits - Geotechnical Parameters | 126 |
| 12.1.2 | Central and East Underground Blocks – Geotechnical Parameters | 127 |
| 12.1.3 | Hydrogeological Parameters | 132 |
| SRK | Report date: 27 May 2022 |
| | Effective Date: 31 December 2021 |
| | |
| SRK Consulting – 576060 SPM PSM Project TRS | Page xviii |
| 12.2 | Production rates, mine life, mining dimensions, mining dilution/recovery factors | 132 |
| 12.2.1 | West Pit and East Pit | 132 |
| 12.2.2 | Central and East Underground Blocks | 134 |
| 12.3 | Access, underground development and backfilling | 135 |
| 12.3.1 | West Pit and East Pit | 135 |
| 12.3.2 | Central and East Underground Blocks | 136 |
| 12.4 | Required Mining Fleet, Machinery and Personnel | 145 |
| 12.4.1 | Underground Blocks - Mining fleet and Machinery | 145 |
| 12.4.2 | Personnel requirements | 146 |
| 12.5 | Final Mine Outline | 147 |
| 12.5.1 | West Pit and East Pit | 147 |
| 12.5.2 | Central and East Underground Blocks | 147 |
| 12.6.3 | Central and East Underground Blocks | 149 |
| 13 | PROCESSING AND RECOVERY METHODS | 150 |
| 13.1 | Current and Proposed Operations at PPM | 150 |
| 13.1.1 | Current Concentrator Operations | 150 |
| 13.1.2 | Proposed Kell Refinery | 150 |
| 13.2 | Description of flowsheet | 150 |
| 13.2.1 | Merensky Concentrator | 150 |
| 13.2.4 | Chromite Recovery Plant | 151 |
| 13.2.5 | Kell Refining Circuit | 151 |
| 13.3 | Plant throughput and design, specifications | 154 |
| 13.3.1 | Metallurgical Accounting | 154 |
| 13.3.2 | Ore Milled, 4E Head Grade and Recovery | 155 |
| 13.3.3 | Concentrate 4E Grade and Recovery | 158 |
| 13.3.4 | Chromite Recovery Plant | 158 |
| 13.4 | Requirements for energy, water, consumables and personnel | 158 |
| 13.5 | Non-commercial process or plant design | 159 |
| 14.1 | General Infrastructure | 160 |
| 14.1.2 | Rock handling underground | 160 |
| 14.1.3 | Underground dewatering design | 164 |
| 14.1.4 | Underground Workshops and Mining Equipment | 164 |
| 14.2 | Electrical, Instrumentation and Communications Infrastructure | 164 |
| 14.2.1 | Bulk Power Supply | 164 |
| 14.2.2 | Control and Communications | 165 |
| 14.5 | Stormwater Management Infrastructure | 166 |
| 14.6 | Tailings Storage Facilities | 167 |
| 14.6.1 | Project Description | 167 |
| 14.6.2 | Proposed Sedibelo TSF Infrastructure | 169 |
| 14.6.3 | Current PPM TSF Infrastructure | 169 |
| 14.6.4 | PPM TSF Site Inspection Observations and Documentation | 169 |
| 14.6.5 | Risks Posed by the Current PPM TSF | 170 |
| 14.6.6 | Capital Expenditure | 171 |
| SRK | Report date: 27 May 2022 |
| | Effective Date: 31 December 2021 |
| | |
| SRK Consulting – 576060 SPM PSM Project TRS | Page xix |
| 15.2 | Uses for metals produced | 174 |
| 15.3 | Market – Supply and Demand | 175 |
| 15.4 | Agency relationships, commodity price projections | 176 |
| 15.4.1 | Agency relationships | 176 |
| 15.4.2 | Three-year trailing average and spot prices | 176 |
| 15.5 | Material contracts | 178 |
| 15.5.1 | Concentrate Refining/Smelting | 178 |
| | 15.5.2 | Third-Party Concentrate Offtake Agreement | 179 |
| | 15.5.3 | Kell Contracts | 179 |
| 15.5.4 | Chromite Concentrate Off-Take Agreement | 180 |
| 15.5.5 | Mining Contracts | 183 |
| | 15.5.6 | PPM Renewable Energy Project | 184 |
| 16 | ENVIRONMENTAL STUDIES, PERMITTING, COMMUNITY AGREEMENTS | 185 |
| 16.2 | Socio-economic Setting | 185 |
| 16.3 | Project Description | 186 |
| 16.4 | Results of environmental studies | 186 |
| 16.4.1 | Surface Water Quality Monitoring | 186 |
| 16.5 | Requirements and plans for waste and tailings disposal and water management | 187 |
| 16.5.1 | Compliance to Water Management Legislation at the P-S-M Project | 187 |
| 16.6 | Project permitting requirements and reclamation bonds | 188 |
| 16.6.1 | Existing approved environmental, water and waste authorizations, licences and permits | 189 |
| 16.6.2 | Existing Water Use Licences | 190 |
| 16.6.3 | Existing Waste Management Licences | 191 |
| 16.6.4 | Social and Labour Plan | 191 |
| 16.7 | Agreements with local communities | 192 |
| 16.8 | Mine closure plans and associated costs | 192 |
| 16.9 | Adequacy of plans to address compliance and permitting | 194 |
| 16.9.1 | Improvements on other Environmental Issues | 196 |
| 16.10 | Commitments for local procurement and hiring | 199 |
| 16.11.1 | Sustainability and ESG Framework | 200 |
| 16.11.2 | External factors potentially impacting platinum mining sustainability | 201 |
| 16.11.3 | Sustainability/ESG reporting practices | 201 |
| 16.11.4 | Internal factors impacting sustainability at SPM | 202 |
| 16.11.5 | ESG status assessment | 202 |
| 16.11.6 | Results and recommendations | 204 |
| 17 | CAPITAL AND OPERATING COSTS | 205 |
| 17.1.1 | Capex Contingencies | 209 |
| 17.2.2 | Underground Mining Blocks | 209 |
| 17.2.3 | Processing Plant Costs | 210 |
| 17.2.4 | General and Admin Costs | 211 |
| 17.2.5 | Corporate Overheads (Off-Mine G&A Costs) | 211 |
| 17.2.6 | Opex Contingency | 212 |
| 17.3 | Risks with engineering estimation methods | 212 |
| 17.3.1 | Capital costs Risks | 212 |
| 17.3.2 | Operating Costs Risks | 212 |
| SRK | Report date: 27 May 2022 |
| | Effective Date: 31 December 2021 |
| | |
| SRK Consulting – 576060 SPM PSM Project TRS | Page xx |
| 18.1 | Key assumptions, parameters and factors | 213 |
| 18.1.2 | Plant Recoveries | 213 |
| 18.1.3 | Commodity Prices and Exchange Rates | 213 |
| 18.1.6 | Taxation and Government Levies | 214 |
| 18.2 | Results of economic analysis | 215 |
| 18.2.1 | Annual cash flow forecasts | 215 |
| 18.2.2 | Economic Viability Measures | 224 |
| 18.3 | Sensitivity Analysis | 224 |
| 18.3.1 | Discussion of Results | 225 |
| 18.4 | Economic analysis in an initial assessment | 225 |
| 19.4.2 | Amandelbult Mine | 228 |
| 19.4.3 | Northam Platinum Mine | 229 |
| 20 | OTHER RELEVANT DATA AND INFORMATION | 231 |
| 20.1 | Project Implementation | 231 |
| 20.1.1 | Key Project Objectives | 231 |
| 20.1.2 | Execution methodology | 231 |
| 20.1.3 | Safety, Health and Environmental and Quality (SHEQ) | 232 |
| 20.1.4 | Organisation and Staffing | 232 |
| 20.1.5 | Preliminary Implementation schedule | 234 |
| 20.2 | Safety and Occupational Health | 236 |
| 20.2.2 | Occupational Hygiene/Health | 239 |
| 20.3.2 | Development of Understanding of Risk Profile | 245 |
| 20.3.3 | Risk Assessment Approach | 245 |
| 20.3.4 | Overview of Specific Risk Elements | 247 |
| 20.3.5 | Potential Economic Impact of COVID-19 | 251 |
| 20.3.6 | Risk Assessment Results | 251 |
| 21 | INTERPRETATION AND CONCLUSIONS | 253 |
| 21.1 | Geology and Mineral Resources | 253 |
| 21.2 | Geotechnical parameters relevant to mine designs | 254 |
| 21.3 | Mining and Mineral Reserves | 254 |
| 21.3.1 | West and East Pits | 254 |
| 21.3.2 | Central and East Underground Blocks | 254 |
| 21.5 | Mineral Processing | 255 |
| 21.7 | Safety and Occupational Health | 255 |
| 21.10 | Capital and Operating Cost Estimates | 256 |
| 21.11 | Project Implementation | 256 |
| 21.14 | Economic Analysis | 257 |
| SRK | Report date: 27 May 2022 |
| | Effective Date: 31 December 2021 |
| | |
| SRK Consulting – 576060 SPM PSM Project TRS | Page xxi |
| 22.3 | Geotechnical Design | 259 |
| 22.4 | Hydrogeological investigation | 260 |
| 22.5 | Surface geotechnical investigation | 260 |
| 22.6 | Mining and Mineral Reserves | 260 |
| 22.8 | Mineral Processing | 261 |
| 22.9 | Safety and Occupational Health | 261 |
| 22.9.2 | Occupational Health | 261 |
| 22.10 | Environmental and Social | 261 |
| 22.11 | Access on to Wilgespruit and Project Implementation | 261 |
| 23 | RELIANCE ON INFORMATION PROVIDED BY REGISTRANT | 262 |
| 24.2 | Public Domain Documents | 264 |
| 25 | DATE AND SIGNATURE PAGE | 266 |
| SRK | Report date: 27 May 2022 |
| | Effective Date: 31 December 2021 |
| | |
| SRK Consulting – 576060 SPM PSM Project TRS | Page xxii |
List of Tables
| Table 1.1: | Summary of Site Visit to PPM in February 2020 | 5 |
| Table 1.2: | Summary of Site Visit to PPM in March 2021 | 6 |
| Table 1.3: | Summary of Site Visit to P-S-M Project in February 2022 | 6 |
| Table 2.1: | Co-ordinates of the P-S-M Project | 7 |
| Table 2.2: | Carbon Tax | 9 |
| Table 2.3: | PPM – B-BBEE Status | 13 |
| Table 2.4: | P-S-M Project Summary Table of Mineral Rights and Surface Rights | 17 |
| Table 4.1: | West Pit – Historical Development | 22 |
| Table 4.2: | West Pit – Historical Operating Statistics (2018 to 2021) | 22 |
| Table 4.3: | Sedibelo Project – Historical Development | 23 |
| Table 4.4: | Magazynskraal Project – Historical Development | 24 |
| Table 4.5: | Drill hole density on SPM’s P-S-M Project | 25 |
| Table 6.1: | Central and East Underground Block Project – summary of Sedibelo drilling from 2004 to 2007 | 41 |
| Table 6.2: | Magazynskraal – summary of drilling from 1994/5 to 2009/10 | 42 |
| Table 6.3: | Rock mass ratings for the project area | 51 |
| Table 6.4: | Summary of strength test results – Sedibelo | 52 |
| Table 6.5: | Summary of strength test results – Magazynskraal | 52 |
| Table 6.6: | Data collection techniques and quality control measures | 52 |
| Table 7.1: | Primary assays (SGS Lakefield) vs check assays (Genalysis) | 56 |
| Table 7.2: | West Pit chrome CRM analysis | 56 |
| Table 7.3: | Sedibelo Project – Percentage of data analysed using various analytical techniques | 57 |
| Table 7.4: | Magazynskraal – percentage composition of QA/QC dataset | 58 |
| Table 7.5: | Magazynskraal chrome CRM analysis | 59 |
| Table 9.1: | Bond Ball Work Index Classifications | 63 |
| Table 9.2: | Magazynskraal/Sedibelo East – Merensky ore composite sample grades | 64 |
| Table 9.3: | Magazynskraal/Sedibelo East – UG2 ore composite sample grades | 64 |
| Table 9.4: | Magazynskraal/Sedibelo East – Bond Ball Work Index MR ore samples | 65 |
| Table 9.5: | Magazynskraal/Sedibelo East – Bond Ball Work Index UG2 ore samples | 65 |
| Table 10.1: | West Pit – Mean Grade statistics of the full width composites of the mining units | 71 |
| Table 10.2: | De-clustered composite data statistics | 73 |
| Table 10.3: | Capping values and the effect of these on the composites | 74 |
| Table 10.4: | Statistics of the estimated variables for the full width composites per seam | 77 |
| Table 10.5: | MR High Grade Cuts – Intercept Accumulations | 81 |
| Table 10.6: | Lower and upper caps enforced on the estimates | 89 |
| Table 10.7: | Percentage of estimates capped | 89 |
| Table 10.8: | East and West Pit – Optimization Parameters | 102 |
| Table 10.9: | Parameters for cut-off calculation for the Central Block PUP and UG2 Reefs | 102 |
| Table 10.10: | Parameters for cut-off calculation for the East Block UG2, UPR, PUP and MRC Reefs | 103 |
| Table 10.11: | West Pit – SRK Audited PGM Mineral Resources Statement (INCLUSIVE) at 31 December 2021 | 105 |
| Table 10.12: | West Pit – SRK Audited Chromite Mineral Resources (INCLUSIVE) and Mineral Reserves Statement at 31 December 2021 | 105 |
| Table 10.13: | West Pit – SRK Audited PGM Mineral Resources Statement (EXCLUSIVE) at 31 December 2021 | 106 |
| Table 10.14: | West Pit – SRK Audited Chromite Mineral Resources (EXCLUSIVE) at 31 December 2021 | 106 |
| Table 10.15: | East Pit – SRK Audited PGM Mineral Resource Statement (INCLUSIVE) at 31 December 2021 | 107 |
| Table 10.16: | East Pit – SRK Audited Chromite Mineral Resources Statement (INCLUSIVE) at 31 December 2021 | 107 |
| Table 10.17: | Central Underground – SRK Audited PGM Mineral Resource Statement (INCLUSIVE) at 31 December 2021 | 108 |
| Table 10.18: | Central Underground – SRK Audited Chromite Mineral Resources Statement at 31 December 2021 | 108 |
| Table 10.19: | Central Underground – SRK Audited PGM Mineral Resource Statement (EXCLUSIVE) at 31 December 2021 | 109 |
| Table 10.20: | East Underground – SRK Audited PGM Mineral Resources (INCLUSIVE) Statement at 31 December 2021 | 110 |
| SRK | Report date: 27 May 2022 |
| | Effective Date: 31 December 2021 |
| | |
| SRK Consulting – 576060 SPM PSM Project TRS | Page xxiii |
| Table 10.21: | East Underground – SRK Audited PGM Mineral Resources Statement (EXCLUSIVE) at 31 December 2021 | 111 |
| Table 10.22: | East Underground – SRK Audited Chromite Mineral Resources (INCLUSIVE) and Mineral Reserves Statement at 31 December 2021 | 112 |
| Table 10.23: | East Underground – SRK Audited Chromite Mineral Resources (EXCLUSIVE) Statement at 31 December 2021 | 112 |
| Table 10.24: | West Pit – SRK Audited Low-grade Mineral Resources Statement at 31 December 2021 | 112 |
| Table 10.25: | West Pit Mineral Resource comparison | 113 |
| Table 10.26: | East Pit Mineral Resource comparison | 113 |
| Table 10.27: | Central Underground Block Mineral Resource comparison | 113 |
| Table 10.28: | East Underground Block Mineral Resource comparison | 114 |
| Table 11.1: | Summary Open Pit Optimization Parameters | 115 |
| Table 11.2: | Selected pit shells for West Pit and East Pit | 116 |
| Table 11.3: | Slope design parameters | 117 |
| Table 11.4: | Modifying factors for the Central and East Underground Blocks | 119 |
| Table 11.5: | West Pit – SRK Audited PGM Mineral Reserves at 31 December 2021 | 120 |
| Table 11.6: | East Pit – SRK Audited PGM Mineral Reserves at 31 December 2021 | 120 |
| Table 11.7: | Mineral Reserves for Central and East Underground Blocks at 31 December 2021 | 121 |
| Table 11.8: | West Pit Mineral Reserve Comparison | 122 |
| Table 11.9: | East Pit Mineral Reserve Comparison | 122 |
| Table 11.10: | Central Underground Block Mineral Reserve Comparison | 122 |
| Table 11.11: | East Underground Block Mineral Reserve Comparison | 122 |
| Table 11.12: | Break-even calculation for Underground Blocks | 124 |
| Table 12.1: | West pit slope design parameters per slope sector | 126 |
| Table 12.2: | East Pit slope design parameters per geotechnical domain | 127 |
| Table 12.3: | Geotechnical design considerations | 128 |
| Table 12.4: | Support design for good ground conditions | 131 |
| Table 12.5: | Support design for poor ground conditions | 131 |
| Table 12.6: | Stope support functions for Central and East Underground Blocks | 132 |
| Table 12.7: | Mining Modifying Factors | 133 |
| Table 12.8: | Project advance rates | 134 |
| Table 12.9: | Access infrastructure dimensions | 134 |
| Table 12.10: | Stoping crew advance rates | 140 |
| Table 12.11: | Excavation dimensions (secondary access) | 141 |
| Table 12.12: | P-S-M Project ventilation design parameters | 142 |
| Table 12.13: | Central and East Underground Blocks ventilation infrastructure | 143 |
| Table 12.14: | LoM Ventilation Capex summary | 145 |
| Table 12.15: | Summary Mining Manpower for Central and East Underground Blocks | 147 |
| Table 13.1: | Average monthly concentrate production (Jan’17 to Dec’21) | 158 |
| Table 13.2: | Kell reagent consumption | 159 |
| Table 14.1: | Predicted load demands | 164 |
| Table 15.1: | P-S-M Project – three-year trailing average and spot values at 31 December 2021) | 176 |
| Table 15.2: | P-S-M Project – CRU Price deck (CRU, 2021; CRU, 2022; UBS, 2020) | 177 |
| Table 15.3 | Aggregate of Buyer’s treatment charges and penalties | 181 |
| Table 15.4 | Aggregate of Kell treatment charges, recovery and royalties | 182 |
| Table 15.5: | Open Pit – Mining contracts review | 183 |
| Table 16.1: | All approved EMPrs and subsequent amendments for PPM | 189 |
| Table 16.2: | All approved EMPrs and subsequent amendments for SPM | 190 |
| Table 16.3: | SPM – Environmental Liabilities and Provisions | 193 |
| Table 16.4: | Preferential Procurement at SPM for the period Jan’20 to Dec’20 | 199 |
| Table 16.5: | SPM’s corporate sustainability reporting practices | 202 |
| Table 16.6: | Issues that could affect the sustainability of SPM | 203 |
| Table 17.1: | P-S-M Project - Capital Summary | 205 |
| Table 17.2: | P-S-M Project – major capital sub-projects | 205 |
| SRK | Report date: 27 May 2022 |
| | Effective Date: 31 December 2021 |
| | |
| SRK Consulting – 576060 SPM PSM Project TRS | Page xxiv |
| Table 17.3: | West Pit Capital Requirements | 207 |
| Table 17.4: | East Pit Capital Requirements | 207 |
| Table 17.5: | P-S-M Project (Underground Operations including Kell) capital requirements | 207 |
| Table 17.6: | P-S-M Project (including Open Pits and Kell) capital requirements | 208 |
| Table 17.7: | Capex Contingencies | 209 |
| Table 17.8: | Mining Opex for West and East Pits (in 2025 for illustrative purposes) | 209 |
| Table 17.9: | Mining Opex for Central Block and East Block (in 2031 for illustrative purposes) | 210 |
| Table 17.10: | PPM Metallurgical Complex Opex (in 2031 for illustrative purposes) | 210 |
| Table 17.11: | DMS Plant Opex | 210 |
| Table 17.12: | CRP and TSP Circuits Opex | 211 |
| Table 17.13: | Merensky (160 ktpm) and UG2 (67 ktpm) Plant Opex | 211 |
| Table 17.14: | G&A Opex | 211 |
| Table 17.15: | Corporate Overheads (Off-mine G&A Costs) | 212 |
| Table 18.1: | Derivation of the USD-denominated WACC for SPM | 214 |
| Table 18.2: | P-S-M Project – Production Parameters (2022 to 2036) | 216 |
| Table 18.3: | P-S-M Project – Production Parameters (2037 to 2051) | 217 |
| Table 18.4: | P-S-M Project – Production Parameters (2052 to 2061) | 218 |
| Table 18.5: | P-S-M Project – Real Terms Revenue and Opex Parameters (2022 to 2036) | 219 |
| Table 18.6: | P-S-M Project – Real Terms Revenue and Opex Parameters (2037 to 2051) | 220 |
| Table 18.7: | P-S-M Project – Real terms Revenue and Opex Parameters (2052 to 2066) | 221 |
| Table 18.8: | P-S-M Project – Real Terms Cash Flow Parameters (2022 to 2036) | 222 |
| Table 18.9: | P-S-M Project – Real Terms Cash Flow Parameters (2037 to 2051) | 222 |
| Table 18.10: | P-S-M Project – Real terms Cash Flow Parameters (2052 to 2066) | 223 |
| Table 18.11: | Key Financial Results from P-S-M Project TEM Cash Flow | 224 |
| Table 18.12: | P-S-M TEM – variation in real NPV9.0% based on twin (6E basket price and exchange rate) sensitivities) | 224 |
| Table 18.13: | P-S-M TEM – variation in real NPV9.0% based on twin (Revenue and Opex) sensitivities | 225 |
| Table 18.14: | P-S-M TEM – variation in real NPV9.0% based on twin (Capex and Opex) sensitivities | 225 |
| Table 19.1: | Union Mine – Summary Ore Reserves and Mineral Resources at December 2017 (AAC, 2018b) | 227 |
| Table 19.2: | Union Mine – Key TEPs (AAC, 2018a; AAC, 2018b; AAP, 2018a; AAP, 2018b) | 228 |
| Table 19.3: | Amandelbult Mine – Summary Ore Reserves and Mineral Resources at December 2020 (AAC, 2021b) | 228 |
| Table 19.4: | Amandelbult – Key TEPs (AAC, 2021a; AAP, 2021a; AAP, 2021b) | 229 |
| Table 19.5: | Zondereinde Mine (Northam Mine) – Summary Mineral Resources and Mineral Reserves at June 2020 (Northam, 2021b) | 229 |
| Table 19.6: | Zondereinde Mine (Northam) – Key TEPs (Northam, 2021a; Northam, 2021b) | 230 |
| Table 20.1: | Preliminary Target Implementation Dates | 234 |
| Table 20.2: | Summary of safety aspects for the PPM operations | 237 |
| Table 20.3: | Key Performance Indicators (KPIs) | 238 |
| Table 20.4: | PPM mining and concentrator safety statistics | 238 |
| Table 20.5: | Reportable Dangerous Occurrences | 239 |
| Table 20.6: | DMRE stoppages 2014 to 2021 | 239 |
| Table 20.7: | Summary of occupational hygiene/health aspects for the proposed mine | 241 |
| Table 20.8: | Identified Occupational Health Risks | 242 |
| Table 20.9: | PPM – dust measurement results for opencast operations | 242 |
| Table 20.10: | Maximum and minimum recorded temperatures | 243 |
| Table 20.11: | Occupational health surveillance statistics | 244 |
| Table 20.12: | Likelihood of events occurring | 246 |
| Table 20.13: | Severity/Consequences of the risk | 246 |
| Table 20.14: | Risk ratings | 247 |
| Table 20.15: | P-S-M Project Risk Assessment Summary (before and after mitigation, as appropriate) | 252 |
| Table 22.1: | P-S-M Project – Summary of Exploration Budget (all amounts in ZARm) | 258 |
| Table 22.2: | Geotechnical drilling programme for detailed decline and portal design | 260 |
| Table 22.3: | Hydrogeology Capex budget | 260 |
| Table 22.4: | Geotechnical Investigations | 260 |
| SRK | Report date: 27 May 2022 |
| | Effective Date: 31 December 2021 |
| | |
| SRK Consulting – 576060 SPM PSM Project TRS | Page xxv |
Table of Figures
| Figure 1.1: | SPM – Simplified Corporate Structure and interests in PGM Assets | 2 |
| Figure 1.2: | Components of the P-S-M Project | 2 |
| Figure 2.1: | Locality Plan of SPM’s PGM Assets and PPM-Sedibelo-Magazynskraal Project in the RSA | 16 |
| Figure 2.2: | Extent of P-S-M Project Mineral Rights, also showing Kruidfontein | 18 |
| Figure 4.1: | Western Bushveld properties with aeromagnetic data | 24 |
| Figure 4.2: | Locations of 2D seismic lines on Sedibelo (Wilgespruit) | 25 |
| Figure 4.3: | 2D seismic traverses and section MGZ05 on Magazynskraal | 26 |
| Figure 4.4: | First blast at the East Pit on Sedibelo | 26 |
| Figure 5.1: | Regional Geology of the Bushveld Complex and its country rocks | 29 |
| Figure 5.2: | Upper Critical Zone stratigraphy between the UG2 and Merensky Reef of the Swartklip Sector, Western Limb of the BC | 30 |
| Figure 5.3: | Composite stratigraphic section comparing conventional Critical Zone stratigraphy to the local stratigraphy at P-S-M and Mphahlele Projects | 31 |
| Figure 5.4: | Local Geology of P-S-M Project | 32 |
| Figure 5.5: | Simplified Structural Geology of P-S-M Project | 32 |
| Figure 5.6: | Geological section through the PPM-Sedibelo-Magazynskraal Project | 35 |
| Figure 5.7: | Local Stratigraphy and grade distributions for normal and potholed reef at P-S-M Project | 36 |
| Figure 6.1: | West Pit – Drill hole collar locality Plan | 39 |
| Figure 6.2: | East Pit, Central and East Underground – Drill hole collar positions | 40 |
| Figure 6.3: | East Underground Drill Hole Collar Positions | 41 |
| Figure 6.4: | Geotechnical drill holes for the East Pit | 46 |
| Figure 6.5: | Plan of test pit locations for soil profiling and sampling | 48 |
| Figure 6.6: | Plan view of drill hole locations on Sedibelo and Magazynskraal | 50 |
| Figure 9.1: | PPM Plant Grade-Recovery Data – UG2 (left) and Merensky (right) | 69 |
| Figure 10.1: | West Pit – simplified geological section of Mineral Resource cuts | 70 |
| Figure 10.2: | Central Underground - Underground estimate Mineral Resource cut definition | 76 |
| Figure 10.3: | Mineral Resource cut as applicable to the Pothole and Contact Facies | 79 |
| Figure 10.4: | Mineral Resource cut as applicable to the UPR reef | 80 |
| Figure 10.5: | Mineral Resource cut as applicable to the UG2 Reef | 80 |
| Figure 10.6: | PUP Variogram and Cross-Variogram Models – 4E Metal Accumulation | 82 |
| Figure 10.7: | UPR Variogram and Cross-Variogram Models – 4E Metal Accumulation | 84 |
| Figure 10.8: | UG2 Variogram and Cross-Variogram Models – 4E Metal Accumulation | 86 |
| Figure 10.9: | UG2 Variogram – vertical width used for volume estimate search radius | 87 |
| Figure 10.10: | Correlation Between Chrome and Density (UG2) | 88 |
| Figure 10.11: | Plan view of the Pt grade estimates for the Mineral Resource cuts | 90 |
| Figure 10.12: | Classed post plot of chrome block estimate in the central portion of Magazynskraal | 92 |
| Figure 10.13: | West Pit – confidence classifications | 95 |
| Figure 10.14: | East Pit classification of the reefs | 96 |
| Figure 10.15: | Sedibelo Central - Classification of the PUP package | 97 |
| Figure 10.16: | Sedibelo Central - Classification of the PUP package declared as a Mineral Resource | 97 |
| Figure 10.17: | Sedibelo Central - Classification of the UG2 package | 98 |
| Figure 10.18: | East Underground Block - MR Geostatistical Confidence | 99 |
| Figure 10.19: | Magazynskraal / Sedibelo East – UG2 Mineral Resource Classification | 100 |
| Figure 10.20: | Magazynskraal / Sedibelo East - UPR Mineral Resource Classification | 100 |
| Figure 10.21: | Magazynskraal / Sedibelo East – MR Mineral Resource Classification | 101 |
| Figure 11.1: | Pit optimization results for West Pit (left) and East Pit (right) | 116 |
| Figure 11.2: | Selected pit shell vs. designed pit outlines and excluded areas | 117 |
| Figure 11.3: | Practical pit design, with schematic pit sequences for 2022 to 2026 for West Pit (left) and East Pit (right) | 118 |
| Figure 11.4: | Resource classification for UG2 (top) and PUP (bottom) | 123 |
| Figure 12.1: | Dykes (green) and major faults (orange) to 700 mbs | 129 |
| Figure 12.2: | Dykes confirmed by trenching relative to original boxcut and decline for East Portal with revised boxcut layout | 129 |
| SRK | Report date: 27 May 2022 |
| | Effective Date: 31 December 2021 |
| | |
| SRK Consulting – 576060 SPM PSM Project TRS | Page xxvi |
| Figure 12.3: | Geotechnical holes drilled along the revised layout boxcut and decline at East Portal | 130 |
| Figure 12.4: | Extent of mineable reef horizons | 131 |
| Figure 12.5: | Pillar and panel dimensions in design | 132 |
| Figure 12.6: | Simplified Schematic of Interburden Dilution from the Block Model | 133 |
| Figure 12.7: | LoM mining schedule for West Pit (top) and East Pit (bottom) | 134 |
| Figure 12.8: | Annual Reef tonnes mined from Central Block (left) and East Block (right) | 135 |
| Figure 12.9: | Pit layouts - West Pit (left) and East Pit (right) | 136 |
| Figure 12.10: | Portal and decline positions with primary access development for Central and East Blocks | 137 |
| Figure 12.11: | Primary access and main tip areas for Central and East Underground Blocks | 139 |
| Figure 12.12: | Stope layout for UG2 (left) and PUP (right) | 140 |
| Figure 12.13: | Crosscut section development for Central and East Blocks | 141 |
| Figure 12.14: | Isometric views of ventilation infrastructure for Central Block (left) and East Block (right) | 144 |
| Figure 12.15: | Truck demand over LoM vs total rock mined for Central Block (left) and East Block (right) | 146 |
| Figure 12.16: | High-level departmental structure for underground mining | 146 |
| Figure 12.17: | Final mine outline for Central and East Underground Blocks | 147 |
| Figure 13.1: | PPM plant simplified flow sheet | 152 |
| Figure 13.2: | Chromite Recovery Circuit | 153 |
| Figure 13.3: | Kell Process block flow diagram | 153 |
| Figure 13.4: | Overall 4E recovery Jan’17 to Dec’21 | 155 |
| Figure 13.5: | DMS Feed and Mass Yield (left) and DMS Feed Grade and Losses (right) - Jan’17 to Dec’21 | 155 |
| Figure 13.6: | Mill Feed Tonnes and Grade - UG2 (left) and Merensky (right) – Jan’17 to Dec’21 | 156 |
| Figure 13.7: | Flotation Feed Tonnes and Grade Jan’17 to Dec’21 | 156 |
| Figure 13.8: | Impact of Flotation Feed Grade on flotation recovery – UG2 (left) and Merensky (right) | 157 |
| Figure 13.9: | 4E Recovery in TSP Jan’17 to Dec’21 | 157 |
| Figure 13.10: | Impact of RoM Feed Grade on overall recovery Jan’17 to Dec’21 | 158 |
| Figure 14.1: | P-S-M Project – Surface General Arrangement Plan | 161 |
| Figure 14.2: | East Portal Surface Layout | 162 |
| Figure 14.3: | West Portal Surface Layout | 163 |
| Figure 14.4: | P-S-M Tailings Storage Facilities | 168 |
| Figure 15.1: | Five-year historical price graphs for 6E PGMs | 173 |
| Figure 15.2: | Five-year historical prices for Cu and Ni | 174 |
| Figure 15.3: | Five-year historical ZAR:USD exchange rate | 174 |
| Figure 15.4: | CRU’s Pt, Pd and Rh supply-demand outlook | 175 |
| Figure 16.1: | Framework for value creation through the six-capital model of sustainable development | 200 |
| Figure 16.2: | SPM’s consolidated ESG scores | 204 |
| Figure 17.1: | Annual Capital Cost and Cumulative Capital Cost | 206 |
| Figure 18.1: | Annual Mill Feed per Reef Type | 213 |
| Figure 19.1: | Adjacent properties | 226 |
| Figure 20.1: | Preliminary Organisation Chart | 232 |
| Figure 20.2: | P-S-M Project - Preliminary Project Schedule | 235 |
| Figure 22.1: | Central and East Underground Blocks existing and planned drill hole collars | 259 |
| SRK | Report date: 27 May 2022 |
| | Effective Date: 31 December 2021 |
| | |
| SRK Consulting – 576060 SPM PSM Project TRS | Page 1 |
[§229.601(b)(96)(iii)(B)(2)]
[§229.601(b)(96)(iii)(B)(2)(i)] [SR1.1(i), SR5.1(i)]
Sedibelo Platinum Mines Ltd (SPM), also referred to as the Company), a limited public company with its registered office in the Channel Island of Guernsey, is involved in the exploration, development, operation and processing of Platinum Group Metals (PGM) mineral deposits in the Bushveld Complex (BC) in South Africa. These include the operating Pilanesberg Platinum Mine (PPM) and the Sedibelo, Magazynskraal, Kruidfontein and Mphahlele Projects.
A simplified corporate structure for SPM, formerly Platmin Limited, with its various PGM deposits is shown in Figure 1.1. The shareholders and interests held in SPM are Bakgatla Ba-Kgafela Tribe (BBKT, 25.7%), Industrial Development Corporation of South Africa (IDC, 15.7%), NGPMR (Cayman) LP (6.9%), Pallinghurst EMG African Queen LP (6.7%), Gemfields Resources Fund LP (6.5%), AMCI ConsMin (Cayman) LP (5.5%), Smedvig G.P. Limited (5.5%), Rustenburg Platinum Mines Ltd (RPM, 5.4%), Telok Ayer Street VI Limited (5.2%) and Investec Bank Limited (4.6%), with the remaining 12.3% held by various minority shareholders.
Platmin Limited delisted from the Toronto Stock Exchange in Canada and requested that its shares be suspended on the JSE Limited (JSE) in South Africa in December 2011.
This Technical Report Summary (TRS) deals with SPM’s wholly-owned PPM-Sedibelo-Magazynskraal Project (P-S-M Project) which envisages the integrated production from an existing open pit mine (the West Pit operated by PPM) with planned production from an East Pit, Central Underground Block and East Underground Block within the contiguous properties of Tuschenkomst, Wilgespruit and Magazynskraal (Figure 1.2).
The P-S-M Project plan is based on a feasibility study completed in August 2020 (2020 FS), which relies on existing infrastructure and concentrators at PPM, supplemented by additional surface infrastructure to support the planned underground operations. While the engineering designs for the mining, surface infrastructure, underground infrastructure and ventilation for the P-S-M Project were done to a feasibility study level of confidence, certain aspects do not satisfy the SK1300 requirements of a feasibility study, as follows:
| • | Capital estimates for modifications and additions to the processing plants include contingencies that are >10% [not at feasibility study status]; |
| • | Permitting requirements are identified but not finalized [pre-feasibility status]; |
| • | Geotechnical drilling is still required at the boxcuts and along the decline spines for detailed design purposes [pre-feasibility study status] [drilling for East Portal completed in December 2021]; |
| • | Geotechnical assessment is required for foundation designs at the West Portal [pre-feasibility study status]; |
| • | Reclamation and mitigation plans are detailed but not finalized [pre-feasibility status]; and |
| • | Environmental impact studies for the Section 102 application which commenced in late 2020 are not finalized [not at feasibility study status]. |
| Since the level of confidence or accuracy in an engineering study is as good as the lowest common denominator, the above aspects indicate the P-S-M Project should be classified as a pre-feasibility study (PFS) in terms of Table 1 to Paragraph (d) in SK1300 [§229.1302(d)]. This implies capital cost estimate (Capex) and operating cost estimate (Opex) accuracy of ±25% and overall project contingency of ≤15% should be achieved. |
| 1.2 | Terms of reference and purpose of TRS |
[§229.601(b)(96)(iii)(B)(2)(ii)] [SR1.1(i)]
Terms of reference
SPM commissioned SRK Consulting (South Africa) (Pty) Ltd (SRK) to compile this TRS of the P-S-M Project according to Item 601 of the United States Securities and Exchange Commission’s (SEC’s) Subpart 1300 of Regulation S-K (SK1300), under the Securities Act of 1933 and the Securities Exchange Act of 1934.
| SRK | Report date: 27 May 2022 |
| | Effective Date: 31 December 2021 |
| | |
| SRK Consulting – 576060 SPM PSM Project TRS | Page 2 |

Figure 1.1: SPM – Simplified Corporate Structure and interests in PGM Assets
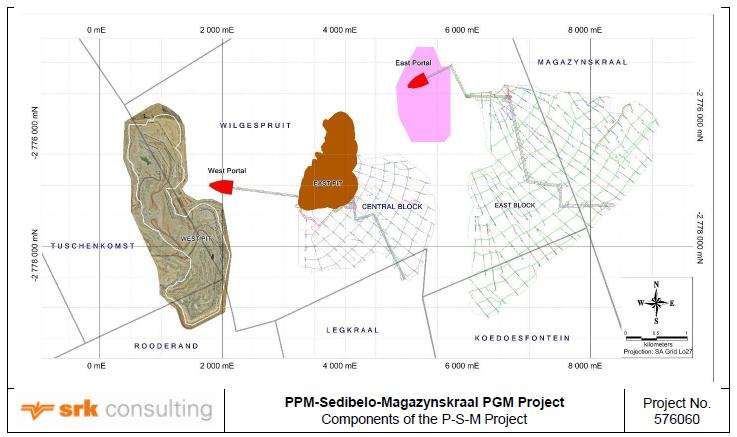
Figure 1.2: Components of the P-S-M Project
Purpose
This report is the first TRS for SPM’s P-S-M Project and supports the disclosure of Mineral Resources and Mineral Reserves at 31 December 2021. The Mineral Resources and Mineral Reserves have been prepared and reported according to the requirements of the SAMREC Code (2016 Edition) which is consistent with CRIRSCO’s International Minerals Reporting Code Template adopted by SK1300.
| SRK | Report date: 27 May 2022 |
| | Effective Date: 31 December 2021 |
| | |
| SRK Consulting – 576060 SPM PSM Project TRS | Page 3 |
This TRS report is compiled to support SPM’s proposed filing of a F-1 prospectus with the SEC as part of a registration statement and a secondary listing on the JSE Limited in South Africa.
Compliance
This report uses a shorthand notation to demonstrate compliance with Item 601 of Regulation SK1300 and disclosure requirements of the SAMREC Code, as follows:
| · | [[§229.601(b)(96)(iii)(B)(2)] represents sub-section (iii)(B)(2) of section 96 of CFR 229.601(b) (“Item 601 of Regulation S-K”); and |
| · | [SR1.1] represents item 1.1 - Property Description of Table 1 of the SAMREC Code (2016 Edition). |
| 1.3 | Sources of information |
[§229.601(b)(96)(iii)(B)(2)(iii)]
Sources of information and data used in the preparation of the TRS are included in Section 24.
SPM has confirmed in writing that to its knowledge, the information provided by it to SRK was complete and not incorrect, misleading or irrelevant in any material aspect. SRK has no reason to believe that any material facts have been withheld.
| 1.4 | Details of personal inspection |
[§229.601(b)(96)(iii)(B)(2)(iv)] [SR1.1(iii)]
Inspection visits of the P-S-M Project were conducted as follows:
| · | Extensive visit to PPM (see Table 1.1) | 19/20 February 2020; |
| | | | |
| · | Limited follow-up visit to PPM and Wilgespruit (see Table 1.2) | 9 March 2021; |
| | | | |
| · | Inspection of East Pit and West Pit (Table 1.3) | 24 February 2022. |
The visit of February 2020 focused mainly on matters associated with the operations at PPM. The March 2021 visit evaluated the extent to which the mine had addressed concerns raised in the February 2020 visit, inspected the surface areas on Wilgespruit where the East Pit and East Portal will be located, and conducted a sustainability (environmental, social and governance, ESG) interview with mine personnel. The February 2022 visit focused mainly on the start of mining operations in the East Pit and the West Pit.
[§229.1302(b)(1)(ii)] [SR7.1(i), SR9.1(i)(ii)]
This report was prepared by SRK Consulting (South Africa) (Pty) Ltd (SRK), a third-party consulting firm comprising mining experts in accordance with §229.1302(b)(1). SPM has determined that SRK meets the qualifications specified under the definition of Qualified Person in §229.1300.
References to the Qualified Person, or QP, in this report are references to SRK Consulting (South Africa) (Pty) Ltd (SRK) and not to any individual employed at SRK.
Neither SRK nor any of its employees or associates employed in compiling this TRS for the P-S-M Project, nor any directors of SRK, have at the date of this report, nor have had within the previous two years, any shareholding in the Company, SPM’s subsidiary companies, Kelltech Limited, BBKT, PPM, the PPM-Sedibelo-Magazynskraal, Mphahlele and Kruidfontein Projects, SPM’s other PGM assets, any of the Company’s Advisors, or any other pecuniary, economic or beneficial interest, or the right to subscribe for such interest, whether direct or indirect, in the Company, SPM’s subsidiary companies, Kelltech Limited, BBKT, PPM, the PPM-Sedibelo-Magazynskraal, Mphahlele and Kruidfontein Projects, SPM’s other PGM assets, any of the Company’s advisors or the outcome of the work.
Consequently, SRK considers itself to be independent of the Company, its directors, senior management and Advisors.
| SRK | | Report date: 27 May 2022
Effective Date: 31 December 2021 |
| | | |
| SRK Consulting – 576060 SPM PSM Project TRS | Page 4 |
SRK has given, and has not withdrawn, its written consent for the inclusion of this TRS report in any documentation in support of SPM’s proposed filing of a F-1 prospectus with the SEC as part of a registration statement and for a secondary listing on the JSE.
[§229.601(b)(96)(iii)(B)(2)(v)]
This is the first TRS for the P-S-M Project to be filed by SPM in support of the reporting of Mineral Resources and Mineral Reserves for the project.
No previous TRS for the P-S-M Project has been filed, so that no update of a previous TRS is applicable.
[§229.1302(b)(iii)(3)] [SR9.1(iii)]
The effective date of the TRS is 31 December 2021, which satisfies the SK1300 requirement of a current report.
The life-of-mine (LoM) plans and associated technical and economic parameters (TEPs) included in the techno-economic model (TEM) all commence on January 2022.
| SRK | | Report date: 27 May 2022
Effective Date: 31 December 2021 |
| | | |
| SRK Consulting – 576060 SPM PSM Project TRS | Page 5 |
Table 1.1: Summary of Site Visit to PPM in February 2020
| SRK Consultant | PPM Personnel | Date of Visit | Workplace visited and remarks | |
| Designation | Discipline | Designation | |
| Principal Resource Geologist | Geology and Mineral Resources | Chief Geologist | 19/20 Feb 2020 | Mine geology/resource offices, Geology/resource modelling | |
| Senior Resource Geologist | Consulting Geologist | 19/20 Feb 2020 | |
| Principal Mining Engineer | Mining and Mineral Reserve | Manager Technical Services | 19/20 Feb 2020 | Sites visited include: · North Pit look out; · Central Pit look out; · RoM Pad; · Rooderand Pit; · Central Pit; · North Pit. | |
| Principal Rock Engineer | Rock Engineering | |
| Mining Manager | |
| Geologist (Strata Control Officer) | |
| Associate Principal Metallurgist | Metallurgy and Mineral Processing | General Manager (Processing) | 19/20 Feb 2020 | Concentrator, chrome recovery circuit, TSP | |
| Principal Engineer (Infrastructure) | Engineering Infrastructure (Mechanical) and Capital | General Manager (Engineering) | 19/20 Feb 2020 | Sites visited include: Process Plant RoM Crushing; Process Plant Workshops; Main consumer substation; Emergency generator station; Maintenance Planning Department; Contractor (Load & Haul) maintenance workshop; and Contractor (Drilling) maintenance workshop. No risks were observed that would materially affect the business plan | |
| Senior Environmental Scientist | Environmental and Social | Environmental Coordinator | 19/20 Feb 2020 | Visited the general mine areas (predominately surface water infrastructure), plant area and tailings dam. | |
| Partner/ Principal Consultant | Human Resources Manager | 19/20 Feb 2020 | No areas visited. Discussions focussed on:
· 2015-2019 SLP compliance and implementation of community development projects · Status of 2020-2024 SLP preparation · Status of stakeholder relations and negotiations with Wilgespruit remaining households · Social management system and resourcing. | |
| General Manager: Stakeholder Relations | |
| Principal Engineer | Mineral Economics | Mining Manager | 19/20 Feb 2020 | North and central pit look out with mining team; | |
| Chief Operating Officer | Budget preparation, LoM projections | |
| Financial Manager | Clarifying aspects of historical results and five-year plan | |
| SRK | | Report date: 27 May 2022
Effective Date: 31 December 2021 |
| | | |
| SRK Consulting – 576060 SPM PSM Project TRS | Page 6 |
Table 1.2: Summary of Site Visit to PPM in March 2021
| SRK Consultant | PPM Personnel | Date of Visit | Workplace visited and remarks |
| Designation | Discipline | Designation |
| Principal Resource Geologist | Geology and Mineral Resources | Chief Geologist | 09/03/2021 | · Proposed drill sites for East Pit Inferred to Indicated conversion · 2020 reconciliations · Cut-off grade consideration for East Underground Block |
| Principal Rock Engineer | Rock Engineering | Manager Technical Services | 09/03/2021 | · Inspect open pit · Inspect face conditions, slope stability |
| Geologist (Strata Control Officer) |
| Senior Engineer | Hydrogeology and Hydrology | | 09/03/2021 | · Surface water control measures and impact of recent heavy rains · Tailings Storage facility – inspect issues for R McNeill, spillage control · Seepages or inflows into mine workings, general state of any groundwater infrastructure |
| Senior Environmental Scientist | Sustainability (Environmental, Social and Governance) | Chief Operating Officer | 09/03/2021 | · Overview of site and nearby communities · interview with Chief Operating Officer on Sustainability · Discuss SLP, Mine Community Development and LED implementation with site-based community development and stakeholder engagement staff |
| Executive Corporate Affairs and Human Capital |
| Principal Engineer | Mineral Economics, Project Management | Exploration Manager | 09/03/2021 | · Inspect planned portal positions and East Pit footprint on Wilgespruit, planned ore transport routes to PPM · Proposed drill sites for East Pit |
Table 1.3: Summary of Site Visit to P-S-M Project in February 2022
| SRK Consultant | PPM Personnel | Date of Visit | Workplace visited and remarks |
| Designation/Role | Discipline | Designation/Role |
| Principal Resource Geologist | Geology and Mineral Resources | Chief Geologist | 24/02/2022 | · Inspect start of mining operations in East Pit – drilling of the boxcut was underway · The East Portal optimised layout design was presented. Tenders for the development and construction of the East Portal were in the process of being adjudicated · Inspect mining operations in the West Pit |
| Principal Mining Engineer | Mining and Mineral Reserves (Open Pit) | Manager Technical Services |
| Principal Mining Engineer | Mining and Mineral Reserves (Underground) | Geologist (Strata Control Officer) |
| SRK | | Report date: 27 May 2022
Effective Date: 31 December 2021 |
| | | |
| SRK Consulting – 576060 SPM PSM Project TRS | Page 7 |
[§229.601(b)(96)(iii)(B)(3)]
[§229.601(b)(96)(iii)(B)(3)(i)] [SR1.2(i)]
The P-S-M Project is a brownfields development project which is located in the North West Province, some 160 km northwest of Johannesburg and some 66 km north of Rustenburg (Figure 2.1).The P-S-M Project is situated within the boundaries of the Moses Kotane Municipality along the northern edge of the Pilanesberg Alkaline Complex in the North West Province of South Africa.
The P-S-M Project envisages the integrated production from an existing open pit mine (the West Pit, which is operated by SPM’s subsidiary Pilanesberg Platinum Mines (Pty) Ltd) with planned production from an East Pit, Central Underground Block and East Underground Block within the contiguous properties of Tuschenkomst, Wilgespruit and Magazynskraal. All ore will be processed through PPM’s existing Merensky and UG2 concentrators.
The co-ordinates for the P-S-M Project, taken as the centre of the current eastern highwall of the West Pit, are shown in Table 2.1.
Table 2.1: Co-ordinates of the P-S-M Project
Projection: TM (WGS System) Ellipsoid: WGS 1984 LO 27 East |
| WGS27 Co-ordinates | Geographical Co-ordinates |
| Y | X | Latitude | Longitude |
| -1 050.132 | +2 777 366.661 | 25º06’07.64”S | 27º00’37.48”E |
| 2.2 | South African Regulatory Environment |
[§229.601(b)(96)(iii)(B)(2)(iv)] [SR1.2, SR1.5, SR1.6, SR4.3(iv), SR5.5]
A brief overview of the regulatory environment in South Africa within which SPM operates and which affects the P-S-M Project is summarized below.
| 2.2.1 | Constitution of the Republic of South Africa Act |
Section 24 of The Bill of Rights in the Constitution of the Republic of South Africa Act No. 108 of 1996 affords every citizen the right:
| · | To an environment that is not harmful to their health or well-being; |
| · | To have the environment protected, for the benefit of present and future generations, through reasonable legislative and other measures that; |
| o | Prevent pollution and ecological degradation; |
| o | Promote conservation; and |
| o | Secure ecologically sustainable development and use of natural resources while promoting justifiable economic and social development. |
The Constitution is the supreme law of the Land, all conduct and legislation inconsistent with its contents is unlawful and will be set aside.
| 2.2.2 | The Mineral and Petroleum Resources Development Act |
The Mineral and Petroleum Resources Development Act No 28 of 2002 (MPRDA) was promulgated by the South African Parliament during July 2002 and came into effect on 1 May 2004. The MPRDA is the key legislation in governing prospecting and mining activities within South Africa. It details the requirements and processes which need to be followed and adhered to by mining companies. The Department of Mineral Resources and Energy (DMRE) is the delegated authority to deal with all mining related applications and the designated authority to administer this act.
Under the MPRDA, new order prospecting rights (NOPRs) are initially granted for a maximum period of five years and can be renewed once upon application for a further period of up to three years. New order mining rights (NOMRs) are valid for a maximum period of 30 years and can be renewed on application for further periods, each of which may not exceed 30 years. A wide range of factors and principles, including proposals relating to black economic empowerment (BEE), social responsibility and evidence of an applicant’s ability to conduct mining optimally, will be pre-requisites for the approval of such applications.
| SRK | | Report date: 27 May 2022
Effective Date: 31 December 2021 |
| | | |
| SRK Consulting – 576060 SPM PSM Project TRS | Page 8 |
Key requirements under the MPRDA are:
| · | A social and labour plan (SLP) which sets out a company’s commitments relating to Human Resources (HR) and socio-economic development; |
| · | A mining work programme (MWP) which provides a summary of the mining operation; |
| · | Proof of technical and financial competence and |
| · | An Environmental Authorization (EA) granted, with an approved environmental management programme (EMP) in terms of National Environmental Management Act No. 107 of 1998 (NEMA). |
Holders of NOMRs could have these suspended or cancelled by the Minister of Mineral Resources and Energy if such holders are deemed to be non-compliant with the empowerment requirements of the MPRDA.
All mines are required to make financial provision for the rehabilitation, closure and ongoing post decommissioning management of negative environmental impacts. Environmental liability provisioning in the South African mining industry is a requirement of the NEMA and must be agreed with the relevant regulatory authorities (mainly DMRE and the Department of Human Settlements, Water and Sanitation, DHSWS). In general, the financial provision can be made up through one or more of an insurance policy, a bank guarantee or trust fund, based on the estimated environmental rehabilitation cost should the mine have to close immediately. The South African Revenue Service (SARS) approves contributions into a trust fund as a tax benefit. Guarantees may be required for the shortfall between the amount available in trust funds and the total estimated closure liability.
| 2.2.3 | The Mineral and Petroleum Resources Development Amendment Bill |
The Minister of Mineral Resources and Energy announced during August 2018 that he will propose to cabinet that the MPRDA amendment bill be scrapped.
To provide guidance to the mining industry regarding the fulfilment of the broad-based black economic empowerment requirements (B-BBEE), the Mining Charter was published by the DMRE on 1 May 2004 (Charter I). Charter I embraced a range of criteria against which prospecting and Mining Right Applications (MRAs) and conversion applications would be considered. These criteria included issues such as Human Resources Development (HRD), employment equity, procurement, community and rural development and ownership of mining assets by historically disadvantaged South Africans (HDSAs). Charter I required that mining companies achieve 26% HDSA ownership of mining assets by 1 May 2014.
The DMRE introduced the Amended Mining Charter (Charter II) in 2010 which contained guidelines which envisaged, inter alia, that mining companies should achieve 40% HDSA demographic representation at board level by 2014.
A third version of the Mining Charter was published in June 2017 (Charter III) but was challenged by the Chamber of Mines (now referred to as Minerals Council South Africa) and subsequently withdrawn. Following consultation by the DMRE with the Minerals Council South Africa, unions and interested parties, Charter III was issued for public comment in June 2018. Following a period of public comment, the Charter III was gazetted on 27 September 2018. General legal consensus is that Charter III is an improvement on the June 2017 version but there are far reaching changes and the compliance obligations are more onerous and stringent than set out in Charter II. Among the proposed changes are a minimum 30% HDSA ownership for a new mining right, comprising 5% for qualifying employees, 5% for host mine communities and 20% for a BEE partner, of which 5% should preferably be for women. There are also prescribed procurement targets to be phased in over a period of five years.
| 2.2.5 | Mineral and Petroleum Resources Royalty Act |
[SR1.6(i), SR5.6(vii)]
The Mineral and Petroleum Resources Royalty Act No 28 of 2008 was enacted on 1 May 2009 (Royalty Act) and came into effect on 1 May 2010. The Royalty Act embodies a formula-derived royalty rate regime since it provides necessary relief for mines during times of difficulties (low commodity prices or marginal mines) and allows the fiscus to share in the benefits during time of higher commodity prices. As the final product can be either refined or unrefined, two separate formulae are given. Both formulae calculate the royalty rate based on a company’s earnings before interest and taxes (referred to as EBIT) and its aggregate gross sales for the assessment period. While the gross sales figure used in the formulae excludes transportation and handling costs, these are considered in the determination of the EBIT figure. The mineral royalty percentage rates (Y%) are based on the following formulae:
| SRK | | Report date: 27 May 2022
Effective Date: 31 December 2021 |
| | | |
| SRK Consulting – 576060 SPM PSM Project TRS | Page 9 |
| · | Refined Minerals: |  |
| · | Unrefined Minerals: |  |
The maximum percentage rates for refined and unrefined minerals are 5.0% and 7.0% respectively. For PGMs to qualify as refined minerals, Schedule 1 of the Royalty Act requires that the PGMs are refined and smelted to a 99.9% purity. According to Schedule 2 of the Royalty Act, PGMs in concentrate at a grade of less than 150 ppm (150 g/t) are in an unrefined state.
[SR5.6(vii)]
The Company will be subject to income tax in South Africa according to standard corporate tax rates.
In the budget speech of 23 February 2022, the South African Minister of Finance announced that the company tax rate would be reduced to 27% in the 2023/24 tax year. At the same time, the treatment of Assessed Losses will change where only 80% of the assessed loss can be offset against taxable income in any tax year. There is no change in the treatment of Unredeemed Capital.
Tax rates of 28% for 2022 and 27% for 2023 onwards have been incorporated into the TEM.
The Carbon Tax Act (Act No. 15 of 2019) was gazetted on 23 May 2019 together with the Customs and Excise Amendment Act (Act No. 13 of 2019).
The carbon tax will play a role in achieving the objectives set out in the National Climate Change Response Policy of 2011 (NCCRP) and the National Development Plan (NDP) of 2012 and will contribute towards meeting South Africa’s commitments to reduce greenhouse gas (GHG) emissions. The first phase of the Act will be from 1 June 2019 to 31 December 2022, and the second phase will commence in 2023 and end in 2030 (Table 2.2).
A carbon taxpayer is classified as any person (including partnership, trust, municipal entity and public entity) that conducts an activity or activities in South Africa which result in GHG emissions (fuel combustion, industrial processes, and fugitive emissions) above the prescribed threshold.
Table 2.2: Carbon Tax
| Category | Phase 1 | Phase 2 |
| Applicable Period | 1 June 2019 – 31 December 2022 | 1 January 2023 - 2030 |
| Tax Rate | ZAR120/tCO2e (for emissions above the tax-free thresholds). Increased by the amount of the consumer price inflation plus 2% until 31 December 2022. | Revision of R120/tCO2e The effective tax rate will increase but the magnitude of the increase is not known at this stage Increased expected to be applied from 1 January 2023, by the amount of the consumer price inflation. |
| Emission scopes included | Scope 1 (direct emissions) only | Scope 1 and potential additions |
| Emission sources | Combustion emissions Fugitive emissions Industrial process emissions | Same as Phase 1, with possible additions |
| Excluded Sectors | Agriculture, Livestock, Forestry, Waste and Residential | Unknown, however it is anticipated that more sectors will be added. |
| Greenhouse gasses covered | GHG classes as defined under the Kyoto Protocol: carbon dioxide, methane, nitrous oxide, hydrofluorocarbons, perfluorocarbons and sulfur hexafluoride | Same as Phase 1 |
| Tax-free thresholds | Percentage based thresholds from 60% tax-free allowance to up to 95% (ZAR6.00 – ZAR48.00 per tCO2e) | The tax-free thresholds may be decreased progressively or be replaced by absolute emission thresholds. |
Based on the Carbon Tax Act and the proposed operational activities of the Project, a business should allow for the following financial impacts:
| · | Direct taxation on fuel combustion emission activities (stationary and mobile); |
| · | Increased cost of up-and downstream carbon intensive activities; and |
| · | In Phase 1, the carbon tax will not have an impact on the price of electricity (Scope 2 emissions). |
To provide sectors sufficient time and flexibility to transition their activities through investments in low carbon measures, the design of the carbon tax provides significant tax-free emission allowances for the first phase.
| SRK | | Report date: 27 May 2022
Effective Date: 31 December 2021 |
| | | |
| SRK Consulting – 576060 SPM PSM Project TRS | Page 10 |
| 2.2.8 | South African Environmental Legislation |
This section covers a high-level summary of selected aspects of legislation applicable to the mining industry in South Africa and relevant to SPM’s operations.
The lead agent in implementing environmental legislation in the mining industry is the DMRE.
Key environmental legislation, which is applicable to the South African mining industry, is as follows:
| · | NEMA, as regulated by the Department of Environment Forestry and Fisheries (DEFF). This Act over-arches South African environmental legislation and lays down basic environmental principles including duty of care, polluter pays and sustainability. NEMA provides for co-operative environmental governance based on the principles that everyone has the right to an environment that is not harmful to one’s health or well-being and enabling the administration and enforcement of other environmental management laws. Sections 28 (1) and (3) of NEMA set out the duty of care principle, which is applicable to all types of pollution and must consider any aspects of potential environmental degradation. Every person who causes, has caused or may cause significant pollution or degradation of the environment must take reasonable measures to prevent such pollution or degradation from occurring, continuing or recurring, or, in so far as such harm to the environment is authorized by law or cannot reasonably be avoided or stopped, to minimise and rectify such pollution or degradation of the environment. Responsibility for the implementation of NEMA, where the activities directly relate to prospecting, extraction or primary processing of a mineral resource is delegated to the relevant provincial DMRE office. A series of regulations have been promulgated in terms of NEMA including: |
| o | NEMA Environmental Impact Assessment (EIA) Regulations, 2014, as amended in 2017: These regulations were developed to regulate the preparation, evaluation, submission, processing and consideration of, and decision on, applications for environmental authorizations for the commencement of listed activities, in order to avoid or mitigate detrimental impacts on the environment, and to optimise positive environmental impacts. EIA Regulation Listing Notices (numbered 1, 2 and 3) identify activities that require Environmental Authorization from a competent authority prior to commencement. Section 23C of NEMA sets out the DMRE is the competent authority for Environmental Authorization where the activities directly relate to prospecting, extraction or primary processing of a mineral resource. Section 54A, introduced by the 2017 amendment, sets out that holders of EMPs and Environmental Authorizations approved prior to December 2014, and which are still in effect, must audit compliance and submit an environmental audit report to the relevant competent authority no later than 7 December 2019; |
| o | NEMA Regulations pertaining to the Financial Provision for Prospecting, Exploration, Mining or Production Operations, 2015, as amended in 2018: The purpose of these regulations is to regulate the determine and making of financial provision as contemplated in the Act for the costs associated with the undertaking of management, rehabilitation and remediation of environmental impacts from prospecting, exploration, mining or production operations through the lifespan of such operations and latent or residual environmental impacts that may become known in the future. The regulations also include detailed descriptions of the wording required in the documentation to support the provisioning for liability using Bank Guarantees and Trust Funds. It also provides detailed on the information to be contained in the following plans: annual rehabilitation plan; final rehabilitation, decommissioning and mine closure plan; environmental risk assessment report; and care and maintenance plan; |
| o | NEMA National Appeal Regulations, 2014, as amended: these regulate the procedure contemplated in section 43(4) of NEMA relating to the submission, processing and consideration of, a decision on an appeal on Environmental Authorizations and Waste Management Licences. The DEFF is competent with regards to appeals made on Environmental Authorizations issued by the DMRE for prospecting, extraction or primary processing of a mineral resource; |
| · | MPRDA: The MPRDA makes provision for equitable access to and sustainable development of South Africa’s mineral resources. The MPRDA requires that the environmental management principles set out in NEMA shall apply to all mining operations and serves as a guideline for the interpretation, administration and implementation of the environmental requirements at mines. Implementation of the “One Environmental System” from 8 December 2014 removed environmental provisions from the MPRDA and replaced them with the relevant provision in the NEMA. The Minister of Mineral Resources is empowered to issue Environmental Authorizations and Waste Management Licences in terms of the NEMA, and the National Environmental Management: Waste Act No. 59 of 2008 (NEM:WA), respectively, for mining and directly related activities. The amendment of any right, work programme, EMP or Environmental Authorization issued in terms of NEMA is subject to consent of the Minister of Mineral Resources and Energy; |
| SRK | | Report date: 27 May 2022
Effective Date: 31 December 2021 |
| | | |
| SRK Consulting – 576060 SPM PSM Project TRS | Page 11 |
| · | MPRDA Mineral and Petroleum Resources Development Regulations, 2004: the Regulations provide guidance and interpretation, as well the ‘prescribed manner’ of implementing and administering many requirements of the MPRDA. Although the environmental provisions of the Regulations have not been repealed, they are of no effect as the environmental requirements of the MPRDA were replaced by NEMA; |
| · | National Environmental Management: Biodiversity Act (10 of 2004) (NEM:BA): The NEM:BA seeks amongst other things, to manage and conserve biological diversity, to protect certain species and ecosystems, to ensure the sustainable use of biological resources and to promote the fair and equitable sharing of benefits arising from bio-prospecting involving those resources. The NEM:BA includes a regulation related to the management of threatened and protected species (2007). A similar regulation is applied to Threatened Ecosystems. NEM:BA has a set of norms and standards for the development of management plans for both species (e.g., Threatened or Migratory Species) and ecosystems (Endangered or Critically Endangered). Alien and Invasive Species Regulations were published in 2014 which identify categories of alien and invasive species and define restricted activities with respect to the different species categories; |
| · | National Environmental Management: Protected Areas Act (57 of 2003) (NEM:PAA): Protected areas such as nature reserves and special nature reserves are declared and managed in terms of NEM:PAA. Depending on the nature of the protected area, certain activities (such as mining) may require Ministerial consent or be prohibited outright. The Act also aims to promote the sustainable use of protected areas and the participation of local communities in such areas. In addition, it provides for the continued existence of the South African National Parks; |
| · | National Environmental Management: Air Quality Act (39 of 2004) (NEM:AQA): NEM:AQA regulates atmospheric pollution and repealed the Atmospheric Pollution Prevention Act. The Act came into full effect on 27 May 2010 and entrusts the DEFFA with the task of preventing pollution and ecological degradation, while at the same time promoting justifiable economic and social development. The Minister is the licensing authority where the listed activity relates to a prospecting, mining, exploration or production activity as contemplated in the MPRDA. Penalties and criminal sanctions are imposed for non-compliance with NEM:AQA; |
| · | A list of activities, which require atmospheric emission licenses, and the minimum emission standards for these listed activities has been published. These include the permissible amount, volume, emission rate or concentration of that substance or mixture of substances that may be emitted into the atmosphere and the manner in which measurements of such emissions must be carried out. The consequences of the listing of these activities are that no person may, without a provisional atmospheric emission licence or an atmospheric emission license, conduct an activity listed on the list anywhere in the Republic or listed on the list applicable in a province anywhere in that province. It must be shown that the best practical means are being employed to limit air pollution before these licences will be issued: |
| o | NEM:AQA National Atmospheric Emission Reporting Regulations, 2015: regulate the reporting of data and information from an identified point, non-point and mobile sources of atmospheric emissions to an internet-based National Atmospheric Emissions Inventory System towards the compilation of atmospheric emission inventories. Mines are listed as Group C emission sources and must provide data per the Regulations; |
| o | NEM:AQA National Greenhouse Gas Emission Reporting Regulations (NGER), under section 53(A), (o) and (p) of NEM:AQA, were instituted in 2017 (General Notice Regulation (GNR) 275 of 2017). The regulations provide a list in Annexure 1 of activities and operations that are required to report their GHG emissions through a national system. NGER classifies data providers as follows: |
| § | Category A: any person in control of or conducting an activity marked in the Category A column above the capacity given in the threshold column of the table in Annexure 1 to these Regulations; |
| § | Category B: any organ of state, research institution or academic institution, which holds GHG emission data or activity data relevant for calculating GHG emissions relating to a category identified in the table in Annexure 1 to these Regulations; |
| SRK | | Report date: 27 May 2022
Effective Date: 31 December 2021 |
| | | |
| SRK Consulting – 576060 SPM PSM Project TRS | Page 12 |
| o | NEM:AQA National Pollution Prevention Plans Regulations 2017: prescribe the requirements that pollution prevention plans of greenhouse gases declared as priority air pollutants need to comply with in terms of section 29(3) of the NEM:AQA. Coal mining is the only mining process currently detailed as a Production Process; |
| • | National Environmental Management: Waste Act (59 of 2008) (NEM:WA): NEM:WA came into effect on 1 July 2009 and seeks to encourage the prevention and minimization of waste generation, whilst promoting reuse and recycling of the waste and only consider disposal of waste as a last resort. It provides for the licensing of waste management activities. The NEM:WA was amended (with effect from 2 September 2014) to have jurisdiction over residue stockpiles and residue deposit at mines. The Minister of Mineral Resources is the licensing authority where a waste management activity is, or is directly related to prospecting, extraction, primary processing of a mineral resource or residue stockpiles and residue deposits. A series of regulations have been promulgated in terms of NEM:WA including: |
| o | NEM:WA Regulations regarding the Planning and Management of Residue Stockpiles and Residue Deposits (2015), as amended in 2018: These regulations were developed to regulate the planning and management of residue stockpiles and residue deposits from a prospecting, mining, exploration or production operation. The Regulations specify that a competent person must recommend the pollution control measures suitable for a specific RSRD based on a risk analysis; |
| o | NEM:WA Waste Classification and Management Regulations (2013): These regulations require that waste generators ensure that the waste they generate be classified in accordance with SANS 10234 within 180 days of generation (Chapter 2, 4(2)). If the waste is to be disposed of to landfill, the waste must be assessed in accordance with the Norms and Standards for Assessment of Waste for Landfill Disposal (Chapter 2 (8)1) (a); |
| o | NEM:WA National Norms and Standards for the Remediation of Contaminated Land and Soil Quality (2014): The purpose of these norms and standards is to: provide a uniform national approach to determine the contamination status of an investigation area; limit uncertainties about the most appropriate criteria and method to apply in the assessment of contaminated land; and provide minimum standards for assessing necessary environmental protection measures for remediation activities; |
| • | National Water Act (Act 36 of 1998) (NWA), as regulated by the DHSWS. Chapter 4 of the NWA stipulates that water uses (abstraction, storage, waste disposal, discharge, controlled activities, removal of underground water and alteration to watercourses) must be licensed, unless it is listed in Schedule 1, is an existing lawful use, is permissible under a general authorization, or if a responsible authority waives the need for a licence. There are transitional arrangements to enable permits under the former 1956 Water Act to be converted into water use licences (WULs). The competency for decisions on WULs for activities directly related to prospecting, extraction, primary processing of a mineral resource or RSRD remains with the DHSWS. The Act NWA also has requirements relating to duty of care, pollution control, protection of water resources (Regulation 704 relates to mines), dam safety (for dams with a capacity greater than 50 000 m3 and a dam wall higher than 5 m) and water-use tariffs; |
| o | NWA: Regulations on use of Water for Mining and Related Activities aimed at the Protection of Water Resources, 1999: The purpose of these Regulations is to regulate the use of water during mining and related activities to ensure the protection of water resources; |
| o | NWA Regulations Regarding the Procedural Requirements for Water Use Licence Applications and Appeals, 2017: The purpose of these Regulations is to prescribe the procedure and requirements for water use licence applications (WULAs) as contemplated in Section 41 of the NWA; |
| • | National Heritage Resources Act (Act 25 of 1999) (NHRA), regulated by South African Heritage Resource Agency (SAHRA) or relevant Provincial departments, where established. This Act controls sites of archaeological or cultural significance. Such sites must be investigated and, where necessary, protected for the nation. Procedures for the relocation of graves are also given; |
| • | Hazardous Substances Act (Act 15 of 1973), regulated by the Department of Health. This Act controls the declaration of hazardous substances and control of declared substances. It allows for regulations relating to the manufacturing, modification, importation, storage, transportation and disposal of any grouped hazardous substance; |
| • | Environmental Conservation Act (Act 73 of 1989) (ECA), as regulated by DEFFA and DHSWS. The environmental authorization sections of the Act (Section 21) were repealed by the NEMA EIA Regulations with effect from 3 July 2006. The waste sections of this Act (Section 20) were repealed and replaced by the NEM: WA, which came into effect on 1 July 2009; |
| SRK | | Report date: 27 May 2022
Effective Date: 31 December 2021 |
| | | |
| SRK Consulting – 576060 SPM PSM Project TRS | Page 13 |
| • | Mine Health and Safety Act (Act 29 of 1996) and amendments (MHSA), regulated by the DMRE. This Act deals with the protection of the health and safety of persons in the mining industry but has some implications for environmental issues due to the need for environmental-health monitoring within mine operations; and |
| • | National Forests Act (84 of 1998) (NFA): Enforced by DEFFA, the NFA supports sustainable forest management and the restructuring of the forestry sector, as well as protection of indigenous trees in general. |
The DEFF, and its provincial authorities, the DHSWS and DMRE departments are key stakeholders in the approvals process. The DMRE is ultimately responsible for decision making with regards Environmental Authorizations in terms of NEMA and Waste Management Licences in terms of the NEM:WA. The DHSWS remains responsible for Water Use Licensing and the DEFF (or the local municipality if capacity is available) is competent for Atmospheric Emissions Licences on mines.
Under the One Environmental System each of the Ministers of Environment, Forestry and Fisheries, Human Settlement, Water and Sanitation and Mineral Resources are empowered to designate Environmental Management Inspectors (EMI). EMI’s can be designated to apply NEMA and any of the specific environmental management Acts (including the NWA, NEM:WA, NEM:AQA etc). All these EMIs potentially have a mandate with respect to environmental matters at mines and thus the right to monitor and enforce compliance with the laws for which they have been designated. Offences are defined in each of NEMA and the specific environmental management Acts. A lack of compliance with the relevant legislation could lead to the closure of an operation, the suspension of authorizations or prosecution and ultimately the implementation of penalties. The penalties provided for in NEMA, and the specific environmental management Acts, generally include a fine not exceeding ZAR10 million or imprisonment for a period not exceeding ten years, or to both such fine and such imprisonment. It is generally considered more likely that the authorities would issue a directive possibly coupled with a fine. The directive indicates which legislation is being contravened and describes the time period in which the operation must comply. An operation would then be required to present a plan, including timing, to achieve compliance. Directives related to environmental issues, specifically WULs in terms of Section 21 of the NWA and authorization in terms of NEMA, are being issued more frequently than was historically the case, and legal action is being taken against individuals, including directors, responsible for non-compliance with legislative requirements.
[§229.601(b)(96)(iii)(B)(2)(ii)-(iv)] [SR1.1(ii), SR1.2(ii), SR1.5(iv), SR5.6(ix)]
SRK has reviewed the information provided by SPM and is satisfied that the extents of the properties described in the various rights are consistent with the maps and diagrams received from SPM.
SPM has confirmed to SRK that all legal information in this TRS is correct and its title to the mineral rights and surface rights for the P-S-M Project is valid.
| 2.3.1 | B-BBEE Certification |
PPM’s B-BBEE status was assessed in December 2020 in terms of the DTi Codes of Good Practice on Black Economic Empowerment and Section 9 of the B-BBEE Amendment Act 46 of 2013, achieving an overall score of 95.95 as set out in Table 2.3.
PPM was certified as a Level Two contributor to B-BBEE with a 125% B-BBEE procurement recognition level.
Table 2.3: PPM – B-BBEE Status
| Element | | Weighting | Score |
| Ownership | | 25 | 25.00 |
| Black Ownership | 42.3% | | |
| Black Women Ownership | 20.2% | | |
| Management Control | | 19 | 14.33 |
| Skills Development | | 20 | 15.48 |
| Enterprise & Supplier Development | | 42 | 36.14 |
| Socio-Economic Development | | 5 | 5.00 |
| Y.E.S. Initiative Bonus Points | | | 0.00 |
| Overall Score | | 111 | 95.95 |
| SRK | | Report date: 27 May 2022
Effective Date: 31 December 2021 |
| | | |
| SRK Consulting – 576060 SPM PSM Project TRS | Page 14 |
| 2.3.2 | BEE / HDSA Ownership of Rights |
The total percentage held by BBKT (the BEE partner) directly and indirectly in SPM is 30.55%. This shareholding satisfies the target requirements of BEE/HDSA ownership of mining assets as prescribed by the Charter III.
SPM is therefore fully compliant with the BEE ownership requirements of the Mining Charter.
[SR1.5(i)-(iii), (v)]
NOMRs have been awarded for the West Pit and the Sedibelo (Wilgespruit) project.
The DMRE granted both a NOMR and the renewal of the two NOPRs over the Magazynskraal property in 2016. SPM opted to execute the two NOPRs, done on 28 June 2016, and put the NOMR on hold. The pertinent information regarding these NOMRs is summarized in Table 2.4 and shown in Figure 2.2.
SPM advised that the Magazynskraal NOMR was executed on 31 March 2022 and is in the process of being registered at the Mineral and Petroleum Titles Registration Office (MPTRO) in Pretoria.
Influence of Kruidfontein Project
SPM submitted a Section 102 application in terms of the MPRDA to incorporate the two Magazynskraal NOPRs and the Kruidfontein NOPR into the Sedibelo NOMR NW30/5/1/2/2/333MR. The Section 102 application was submitted on 9 May 2017.
A MRA NW30/5/1/2/2/10120MR for the Kruidfontein Project was accepted by the Regional Manager of the DMRE on 13 July 2017. The MRA was lodged in addition to the Section 102 application. This was necessary because no more renewals of the underlying Kruidfontein NOPR could be granted and because a pending Section 102 application does not prevent the DMRE from accepting third party interloper applications in respect of the Kruidfontein Project. The MRA was the only way to ensure security of tenure to the mineral rights to the Kruidfontein Project in accordance with Sections 9, 19(1)(b) and 22(2) of the MPRDA.
Approval of the Section 102 application and granting of a NOMR for the Kruidfontein Project is dependent on completion of the environmental permitting process and approval of an Environmental Management Programme report (EMPr). Work on a consolidated EIA and EMPr for the Sedibelo, Magazynskraal and Kruidfontein properties commenced in late 2020.
[SR1.5(i)]
Prospecting Rights held by SPM are shown in Table 2.4.
SPM submitted a Section 102 application in terms of the MPRDA to incorporate the two Magazynskraal NOPRs and the Kruidfontein NOPR into the Sedibelo NOMR NW30/5/1/2/2/333MR. The Section 102 application was submitted on 9 May 2017.
This process is ongoing and dependent on the award of the NOMR for Kruidfontein.
[SR1.5(i)]
Surface access on farm Wilgespruit 2JQ
On 25 October 2018, the Constitutional Court ruled that Itereleng Bakgatla Mineral Resources (Pty) Ltd (IBMR, a subsidiary of SPM) was not entitled to an interdict to evict the farmers on Wilgespruit 2JQ because it had not exhausted the internal processes provided for in section 54 of the MPRDA. Further, one of the recommendations of the final report of the presidential advisory panel on land reform is that rights in terms of communal land must be vested in residents of communal areas rather than in traditional councils.
The Company continues to implement a settlement agreement and relocation plan agreed with the 37 occupiers on the farm. SPM has received Abandonment Undertakings signed by representatives of the Lesethleng Land Community (LLC) and most of the farmers. These had indicated their willingness to relocate to new farming areas, where kraals and dwellings were being built, with all but one having moved by end December 2021.
At the Effective Date of this TRS, a single family of farmer occupants still needs to sign the relocation agreement and discussions with the family are ongoing. SRK understands that relocation of this family should occur in the near future. This is not impacting on SPM’s ability to access the property and start mining at the East Pit.
Details of surface rights held or negotiated by SPM for the different projects are summarized in Table 2.4.
SPM is not aware of any servitude that needs to be negotiated with any surface owners outside of the property areas.
| SRK | | Report date: 27 May 2022
Effective Date: 31 December 2021 |
| | | |
| SRK Consulting – 576060 SPM PSM Project TRS | Page 15 |
[SR1.5(iv)]
SPM has advised that it is not aware of any current land claims over the P-S-M Project.
[SR1.5(iv)]
SPM has confirmed to SRK that there are currently no legal proceedings that might influence the integrity of the P-S-M Project, the right to prospect for or exploit minerals or the declaration of Mineral Resources and Mineral Reserves.
Diesel Rebate Matter
SPM advised that it is currently involved in negotiations regarding a diesel rebate matter with the South African Revenue Services (SARS).
SARS issued a letter of demand to PPM on 26 July 2012 to repay diesel refunds for the period April 2008 to March 2011 to the value of ZAR73m. Diesel refunds claimed by PPM for the period April 2011 to March 2018 amounting to ZAR301m were also disallowed. Despite numerous meetings with SARS and pursuing the matter through a process of administrative appeal, the matter has not been resolved. The matter remains ongoing.
| SRK | | Report date: 27 May 2022
Effective Date: 31 December 2021 |
| | | |
| SRK Consulting – 576060 SPM PSM Project TRS | Page 16 |
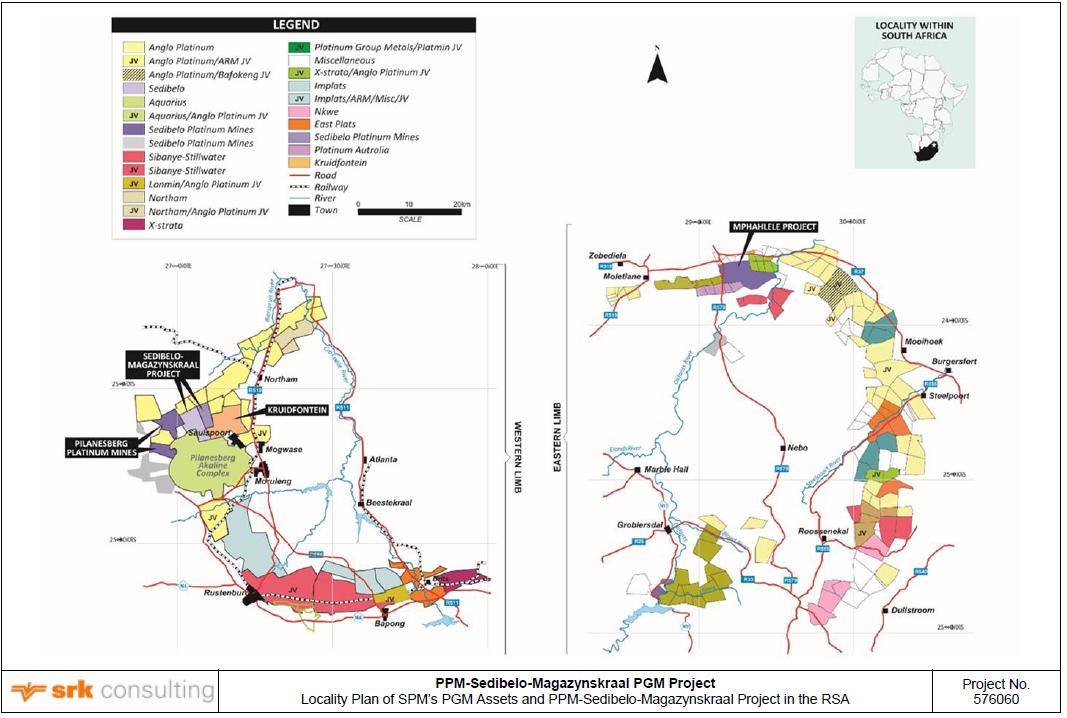
Figure 2.1: Locality Plan of SPM’s PGM Assets and PPM-Sedibelo-Magazynskraal Project in the RSA
| SRK | | Report date: 27 May 2022
Effective Date: 31 December 2021 |
| | | |
| SRK Consulting – 576060 SPM PSM Project TRS | Page 17 |
Table 2.4: P-S-M Project Summary Table of Mineral Rights and Surface Rights
| Asset | Mineral Rights and Properties | Minerals Included in
NOPR/NOMR | Holder of
Mineral
Rights | Interest
Held | Status | Licence
Expiry
Date | Licence
Area (ha) | Comments |
PPM (West Pit) | NOMR NW30/5/1/2/2/320MR: | | PPM | 100% | Production | 02/2038 | 5 453.7380 | NOMR executed on 14 February 2008. Registered at MPTRO Pretoria on 24 June 2008. Cr rights on Tuschenkomst were included via a Section 102 approval in July 2015. SURFACE RIGHTS: Farms are state-owned land held in trust for the BBKT. Ruighoek surface rights are held by the Batlhako Ba-Leema Tribe and the State |
| Ptn 3 of the farm Rooderand 46JQ | PGMs, Au, Cu, Ni, Co, Cr and associated minerals |
RE of Ptn 1, Ptns 2,3,4,6,9,13 and 15 of the farm Ruighoek 169JP (Ptns 10,11,12,14 excluded) | All minerals excluding Cr |
| The farm Tuschenkomst 135JP | PGMs, Au, Cu, Ni, Co, and associated minerals, and Cr (Section 102) |
| Ptn 1 and RE of the farm Witkleifontein 136JP | All minerals |
Sedibelo West mining area (Section 102): A portion of the farm Wilgespruit 2JQ Ptn 1 of the farm Rooderand 46JQ | PGMs, Au, Cu, Ni, Co, Cr | PPM | 100% | Production | 02/2038 | 439.7830 | Section 102 amendment to incorporate Sedibelo West properties. SURFACE RIGHTS: Farms are owned by the BBKT. IBMR has a registered lease agreement to access the farms. |
Sedibelo (East Pit and Central Decline) (East Decline shared with Magazynskraal) | NOMR NW30/5/1/2/2/333MR awarded; The farm Wilgespruit 2JQ A portion of the farm Legkraal 45JQ A portion of the farm Koedoesfontein 42JQ Ptn 1 of the farm Rooderand 46JQ | PGMs, Au, Cu, Ni, Co, Cr | PPM (IBMR) | 100% | Development | 06/2038 | 4 366.1270 (after transfer of Sedibelo West) | Section 11(2) transfer of controlling interest in IBMR to PPM and cession of rights to PPM received on 13/02/2014. Boxcut and initial clearing for East Pit started, but work stopped. Section 102 application in terms of MPRDA to incorporate the two Magazynskraal NOPRs into the IBMR NOMR NW30/5/1/2/2/333MR submitted in May 2017. SURFACE RIGHTS: Farms are owned by the BBKT. IBMR has a registered lease agreement to access the farms. |
Magazynskraal (East Decline shared with Sedibelo) | NOPR NW30/5/1/1/2/10723PR (PGMs) and NOPR NW30/5/1/1/2/10947PR (Au, Ag, base metals): The farm Magazynskraal 3JQ MRA NW30/5/1/2/2/10029MR submitted in July 2012, granted by DMRE in December 2015. Put on hold. | Pt, Pd, Ir, Ru, Rh, Os Au, Ag, Cu, Ni, Co, Cr PGMs, Au, Ag, Cu, Ni, Co, Cr | Richtrau | 100% | Development | 06/2019 10/2018 12/2045 | 2 801.6647 | Renewed NOPRs were executed on 28 June 2016 and registered in MPTRO: Pretoria on 26 August 2016. Section 102 application in terms of MPRDA to incorporate the two NOPRs into the IBMR NOMR NW30/5/1/2/2/333MR submitted in May 2017. SURFACE RIGHTS: Farm is state-owned land held in trust for the BBKT. Access agreement has been concluded. |
Notes:
| NOMR | new order mining right |
| NOPR | new order prospecting right |
| MRA | mining right application |
| SRK | | Report date: 27 May 2022
Effective Date: 31 December 2021 |
| | | |
| SRK Consulting – 576060 SPM PSM Project TRS | Page 18 |

Figure 2.2: Extent of P-S-M Project Mineral Rights, also showing Kruidfontein
| SRK | | Report date: 27 May 2022
Effective Date: 31 December 2021 |
| | | |
| SRK Consulting – 576060 SPM PSM Project TRS | Page 19 |
| 2.4 | Property encumbrances and permitting requirements |
[§229.601(b)(96)(iii)(B)(3)(v)]
| 2.4.1 | Environmental, water and waste authorizations, licences and permits |
Based on SRK’s understanding and review of the documentation provided, the following environmental authorizations and permits are pending and will be required for the project:
| • | An EA in terms of Section 24(2)(a) of the National Environmental Management Act, 1998, is not in place for the listed activities associated with the following approved EMPR: |
| o | EMPr Amendment amending PPM Closure Objectives – February 2012, approved on 16 January 2012. The February 2017 EMPr specifically states that prior to the undertaking of any possible listed activities associated with the said EMPr Closure Objectives, a separate EA application will be submitted to the Responsible Authority. The EA, WULA and supporting studies for pit closure activities are still to be undertaken. However, the current active pit is expected to operate for at least five years prior to closure; |
| • | An EMPr amendment which was submitted to the DMRE on 24 April 2020, is still pending a decision. A follow-up meeting was held with the DMRE on 19 January 2021. Although a formal Section 102 is still to be finalised, SRK understands that the DMRE at the 19 January 2021 meeting conceded that the activities under the issued EA can commence, although the DMRE still needs to issue a formal letter regarding this decision; |
| • | EA applications were submitted in terms of Section 24 of NEMA,1998 to NWREAD (Rural Environment and Agricultural North West Provincial Department), to authorize a planned PPM housing project, the Magazynskraal project and the listed activities associated with the EMPr Amendment November 2011, which EA applications were refused by NWREAD in 2017. It must be noted that from 8 December 2014, DMRE and not DEA (NWREAD) is the competent authority to approve an EA application for listed activities in mining areas. The decisions on the aforesaid EA applications are at risk of being invalid. There are still not decisions in place regarding the housing project; and |
| • | Sedibelo Project was issued a WUL in 2015, and an amendment application was submitted to the authorities in December 2020. Although a formal Section 102 is still to be finalised, SRK understands that the DMRE at the 19 January 2021 meeting conceded that the activities under the issued EA can commence, although the DMRE still needs to issue a formal letter regarding this decision. |
| 2.5 | Significant Factors and Risks affecting access, title |
[§229.601(b)(96)(iii)(B)(3)(vi)]
Mining companies in South Africa are exposed to typical mining industry risks associated with rising costs, labour wage demands, resource nationalisation and social licence to operate.
Additional country risk is raised through legislative uncertainty, political interference and bureaucratic ineptitude.
The Company has confirmed to SRK that there are currently no legal proceedings that might influence the integrity of the Project, the right to prospect or mine for minerals and the declaration of Mineral Resources and Mineral Reserves.
| 2.6 | Royalty interest in the property |
[§229.601(b)(96)(iii)(B)(3)(vii)] [SR1.6(i)]
As the Company has an indirect 100% interest in the P-S-M Project, there is no royalty interest attributable to a third party.
Royalties in terms of the Royalty Act are payable to the Government.
Based on information provided to SRK, royalties on PGM and base metal revenue for the P-S-M Project received by SPM are calculated according to the refined minerals formula.
Royalties on revenue derived from sales of chrome concentrates are calculated according to the unrefined minerals formula.
| SRK | | Report date: 27 May 2022
Effective Date: 31 December 2021 |
| | | |
| SRK Consulting – 576060 SPM PSM Project TRS | Page 20 |
| 3 | ACCESSIBILITY, CLIMATE, LOCAL RESOURCES, INFRASTRUCTURE AND PHYSIOGRAPHY |
[§229.601(b)(96)(iii)(B)(4)
| 3.1 | Topography, elevation and vegetation |
[§229.601(b)(96)(iii)(B)(4)(i)] [SR1.1(ii)]
Most of the project area is flat and featureless with an average altitude of 1 075 m above mean sea level (amsl), dipping gently to the north, with steep sloping hills of the Pilanesberg Complex forming the southern boundary (Figure 2.2).
The area is covered either by a layer of in-situ black turf soils (vertisols) or by Quaternary alluvium derived from the Pilanesberg. A few isolated hills are present on the western boundary of Sedibelo.
Vegetation is typically savannah grasslands mixed with thorn trees and scattered shrubs.
Land use on the Wilgespruit and Magazynskraal parts of the Project is almost exclusively agricultural (cattle grazing), with virtually no crops.
[§229.601(b)(96)(iii)(B)(4)(ii)] [SR1.1(ii), SR5.4(i)(ii)]
A sealed all-weather road from the R510 through the village of Moruleng (formerly Saulspoort) passes through the southern extremity of the project area, beyond which the property is accessed via gravel district roads and farm tracks.
[§229.601(b)(96)(iii)(B)(4)(iii)] [SR1.1(ii)]
The climate in the area is typical of the South African Highveld with maximum temperatures in summer between 28°C to 32°C and minimum temperatures during winters rarely reaching below −4°C. Winters are dry and sunny.
The average annual rainfall varies from 380 mm to 700 mm, usually in the form of short duration, high intensity thunderstorms during summer with the peak of the rainy season occurring in January. Strong gusty winds are associated with the thunderstorms.
The moderate climate means that exploration and mining operations can be undertaken throughout the year, with no extraordinary measures required.
| 3.4 | Infrastructure Availability, including bulk services, personnel and supplies |
[§229.601(b)(96)(iii)(B)(4)(iv)] [SR5.4(i)(ii)]
The area surrounding the Project is rural and is sparsely populated, with more dense settlements being located along the road running parallel to the northern boundary of the Pilanesberg Game Reserve. The main land uses include residential areas, subsistence dry land agriculture, small-scale commercial agriculture and livestock grazing, conservation and eco-tourism activities.
PPM is an established open pit mine and concentrator, and the West Portal of the Project is situated immediately adjacent to highwall of the West Pit. Existing infrastructure such as roads, change houses, offices, sewage and electrical supply situated at PPM are required for the Project and will be upgraded to accommodate the additional requirements. The East Portal of the Project however, which will commence first, will be equipped with dedicated roads, offices, change houses, lamp room, sewage and electrical supply from the existing PPM Substation and Magazynskraal Substation.
Bulk water and potable quality water for the P-S-M Project is obtained in adequate quantities from the existing West Pit Reservoir which is connected to the Magalies Water system.
Human resources are planned according to the approved SLPs for West Pit, East Pit, Central Underground Block and East Underground Block.
Platinum mining activities in the vicinity, as well as proximity to the Pilanesberg Game Reserve and Sun City complex, have ensured a comprehensive infrastructure of roads, power and telecommunications in the region.
Rustenburg to the south is a well-established mining centre due to more than 50 years’ of PGM and chrome mining in the area. Iron ore mining took place at Thabazimbi to the north of the project. The project is readily accessible from Johannesburg and Pretoria in Gauteng Province, the economic hub of South Africa.
There is a compact international airport located at Pilanesberg, serving Sun City and the Pilanesberg Game Reserve. There is also a municipal airport situated near Rustenburg, which is licensed according to South African Civil Aviation Authority standards.
| SRK | | Report date: 27 May 2022
Effective Date: 31 December 2021 |
| | | |
| SRK Consulting – 576060 SPM PSM Project TRS | Page 21 |
[§229.601(b)(96)(iii)(B)(5)]
| 4.1 | Previous Operations, Operators |
[§229.601(b)(96)(iii)(B)(5)(i)] [SR1.4(ii)(iii), SR3.8]
| 4.1.1 | West Pit (Tuschenkomst) (Operational) |
Johannesburg Consolidated Investment Ltd (JCI, now Anglo Platinum Limited, AngloPlats) conducted exploration for chromite and Ni deposits on Tuschenkomst and Rooderand in the 1960s to 1970s, drilling four diamond drill holes that intersected reef.
General Mining Corporation (Gencor, now Impala Platinum Limited) conducted exploration for PGMs including soil sampling, geological mapping, geophysical surveys and trenching on Ruighoek in late 1980s and early 1990s, drilling 15 drill holes.
Platmin (now SPM) acquired the precious and base metal rights to Tuschenkomst and Ruighoek and completed a feasibility study for an open pit mine in August 2007. Removal of overburden commenced in April 2008 with the first PGM concentrate was despatched in April 2009. The Sedibelo West mining area was incorporated into the PPM mining right in April 2012. The open pit mining operation delivers on average 300 ktpm of run-of-mine (RoM) ore to two conventional MF2 (mill-float mill-float) design concentrators, Merensky (silicate) and UG2 plants with 230 ktpm and 67 ktpm nameplate capacities respectively.
| 4.1.2 | Sedibelo (Wilgespruit) |
Anglo Platinum Limited conducted exploration on Wilgespruit between 1971 and 1999, completing more than 160 diamond drill holes and sinking an exploration shaft to a depth of 70 m to intersect the Merensky Reef. A 650 m long reef drive was developed along strike to establish the level of structural disturbance and test the grade variation.
Barrick Limited conducted exploration during 2004 and 2005 comprising soil sampling, aeromagnetic survey, seismic surveys, prospecting shaft investigations, exploration drilling and extraction of a bulk sample. Exploration comprising exploration/geotechnical drilling, metallurgical and engineering studies continued from 2005 to 2008, with a positive feasibility study issued in April 2008.
Rustenburg Platinum Mines (AngloPlats subsidiary at the time) drilled nine diamond drill holes in 1994 and a further 22 drill holes between 2001 and 2009.
Between 2009 and 2011, twelve 2D seismic traverses were completed and 108 diamond drill holes were drilled by a SPM subsidiary.
A pre-feasibility study for the Magazynskraal-Sedibelo East deposit (East Underground Block) was completed in October 2011.
Consolidation of the PPM, Sedibelo and Magazynskraal properties was approved by the DMRE in May 2012. The consolidated entity was renamed as Sedibelo Platinum Mines Ltd.
An integrated feasibility study for the combined exploitation of the West Pit, East Pit and the Central Underground Block (Wilgespruit) and East Underground Block (Wilgespruit and Magazynskraal) was completed for SPM in August 2020.
| 4.2 | Exploration and development work |
[§229.601(b)(96)(iii)(B)(5)(ii)] [SR1.4(iii)(iv), SR3.8]
| 4.2.1 | West Pit (Tuschenkomst) |
The historical development of the West Pit is summarized in Table 4.1.
The historical production statistics for the West Pit for 2018 to 2021 are set out in Table 4.2.
| SRK | | Report date: 27 May 2022
Effective Date: 31 December 2021 |
| | | |
| SRK Consulting – 576060 SPM PSM Project TRS | Page 22 |
Table 4.1: West Pit – Historical Development
| Date | Activity | Comments |
| 1960s – 1970s | Base and precious metal rights held by the State. Johannesburg Consolidated Investments (JCI), now AngloPlats, awarded prospecting rights over Tuschenkomst and Rooderand. Exploration conducted for chromite and Ni deposits. Four diamond drill holes that intersected reef. | No assay results available. JCI allowed options to lapse. |
| 1960s – 1970s | General Mining Corporation (“Gencor”), now Impala Platinum Limited (“Impala”), awarded prospecting rights over Ruighoek. Exploration for PGMs conducted, including geophysical surveys. | Gencor noted faulting but recognised open pit potential. Gencor allowed licences to lapse. |
| Late 1980s to early 1990s | Impala conducts soil sampling, geological mapping, geophysical surveys, trenching, drilled 15 drill holes. | Non-compliant Inferred Resource identified. |
| 1999 | Platmin acquired precious and base metal rights from State, exploration companies and private individuals. | |
| Sep 2005 | Converted Old Order Prospecting Rights awarded in terms of MPRDA over Tuschenkomst, Ruighoek | |
| Aug 2007 | Feasibility Study for the Pilanesberg PGM Project (covering the Ruighoek and Tuschenkomst properties) by SRK completed. | |
| Feb 2008 | EMP approved by DMRE, NOMR NW30/5/1/2/2/320MR awarded. | Encompasses the properties Tuschenkomst, Witkleifontein, Rooderand Ptn 3 and portions of Ruighoek. |
| Apr 2008 | Removal of overburden commenced. | |
| Mar 2009 | UG2 concentrator plant commissioned. | |
| Apr 2009 | First PGM concentrate was despatched. | |
| Jul 2009 | MR concentrator plant commissioned. | |
| Mar 2011 | Sedibelo West Mining Right Abandonment Agreement signed between IBMR, PPM and Platmin, in which IBMR abandoned the Sedibelo West mining area to PPM for an aggregate consideration of USD50m. | Sedibelo West mining area comprises portion of Ptn 1 of the farm Rooderand 45JQ and a portion of the farm Wilgespruit 2JQ, representing an area of 439.7830 ha. |
| Dec 2011 | Platmin delists from Toronto Stock Exchange, suspends shares on JSE. | |
| Mar 2012 | IDC agreed to acquire 16.2% interest in SPM | Conditional on consolidation of PPM, Sedibelo and Magazynskraal |
| Apr 2012 | Mining Right NW30/5/1/2/2/320MR amended to include Sedibelo West properties [Section 102 of MPRDA] | . |
| Jun 2012 | Concentrator operation contract terminated. Platmin took direct control of concentrator. | Management of beneficiation process improved. |
| Nov 2012 | Consolidation of PPM, Sedibelo and Magazynskraal completed. Consolidated entity renamed SPM. | |
| 2014 | Acquired Kruidfontein | |
| 2015 - 2016 | RADOS test work at Mintek, POC plant trials confirm laboratory results | |
Table 4.2: West Pit – Historical Operating Statistics (2018 to 2021)
| Item | Unit | 2018 | 2019 | 2020 | 2021 |
| Production | | | | | |
| Reef Ore mined/hauled | (kt) | 3 758 | 4 122 | 3 953 | 2 256 |
| Reef milled | (kt) | 3 688 | 3 518 | 3 089 | 2 978 |
| Mill feed grade | (4E g/t) | 1.69 | 1.57 | 1.79 | 1.42 |
| Plant recovery | (%) | 76% | 70% | 71% | 72% |
| PGM concentrate produced | (kt) | 52.6 | 51.7 | 45.4 | 43.8 |
| PGM despatches - Main plant | (4E koz) | 147.5 | 121.6 | 125.1 | 94.8 |
| PGM despatches - TSP | (4E koz) | 5.1 | 4.3 | 3.8 | 2.8 |
| Cr2O3 concentrate (40-42%) | (kt) | 34.4 | 35.0 | 33.6 | 9.7 |
| Revenue | | | | | |
| PGM revenue | (ZARm) | 2 267.1 | 2 635.6 | 4 518.8 | 3 951.1 |
| Chrome revenue | (ZARm) | 34.1 | 36.7 | 30.6 | 7.1 |
| Basket PGM price received | (ZAR/oz 4E in conc.) | 15 077 | 20 932 | 35 046 | 40 465 |
| Production Costs | (ZARm) | 2 196.1 | 2 359.4 | 2 092.7 | 2 881.5 |
| Mining (incl. RoM pad & Geology) | (ZARm) | 873.3 | 1 004.0 | 1 179.4 | 1 358.6 |
| Processing (incl. laboratory) | (ZARm) | 829.8 | 828.1 | 864.5 | 907.3 |
| Chrome removal, TSP | (ZARm) | 32.2 | 46.8 | 48.8 | 49.2 |
| Overheads | (ZARm) | 221.8 | 252.7 | 271.1 | 348.9 |
| Royalties | (ZARm) | 11.4 | 12.5 | 22.0 | 19.0 |
| Beneficiation costs (incl. concentrate transport) | (ZARm) | 227.8 | 215.4 | 241.5 | 197.5 |
| Unit Costs | (ZAR/t RoM) | 584 | 572 | 529 | 1 277 |
| Mining | (ZAR/t RoM) | 232 | 244 | 298 | 602 |
| Processing | (ZAR/t mill feed) | 225 | 235 | 283 | 305 |
| Beneficiation costs | (ZAR/t mill feed) | 62 | 61 | 78 | 66 |
| SRK | | Report date: 27 May 2022
Effective Date: 31 December 2021 |
| | | |
| SRK Consulting – 576060 SPM PSM Project TRS | Page 23 |
The historical development of the Sedibelo Project is summarized in Table 4.3.
There are no historical production statistics, as mining has yet to commence on the property.
Table 4.3: Sedibelo Project – Historical Development
| Date | Activity | Comments |
| 1971 - 1996 | Notarial prospecting contract with BBKT granted to AngloPlats | Registered in deeds registry in 1981. |
| More than 160 diamond drill holes completed on Wilgespruit | most intersect mineralization. |
| Exploration shaft sunk to a depth of 70 m, to reach MR. Reef drive developed for approximately 650 m along strike, north and south of shaft. | Purpose of reef drives was to establish degree of structural disturbance and test grade variation |
| 2002 | Placer Dome started negotiations with BBKT. | |
| Nov 2003 | Placer Dome /Bakgatla JV ratified at BBKT tribal council. | |
| Apr 2004 | Prospecting permit granted by DME (now DMRE), was awarded to IBMR, which made the agreements of the Placer Dome/Bakgatla JV effective. Project renamed the Sedibelo Platinum Project. | Able to obtain drill hole locations and depth information only from AngloPlats. Negotiations to obtain other exploration results unsuccessful. |
| Jan 2005 | Barrick takeover of Placer Dome, continues in JV with BBKT. | |
| 2004 to Dec 2005 | Exploration activities included soil sampling, aeromagnetic survey, 2D seismic surveys, prospecting shaft investigations, exploration drilling and extraction of bulk sample. | Focus of exploration activities directed at central up-throw block (the Central Block) and later to the eastern up-throw block (the Eastern Block). |
| Dec 2005 | Inferred Mineral Resource estimate of 15.9 Moz declared. | Western, Central and Eastern Blocks. |
| 2006 to 2007 | Exploration activities included exploration drilling, geotechnical drilling in open pit area and along planned declines. | |
| Nov 2006 | Bulk sample taken from the prospecting shaft, used for pilot scale metallurgical test work. | Produced favourable results. |
| Feb 2007 | New order converted prospecting right awarded. | |
| Apr 2007 | Second bulk sample extracted, to further enhance understanding of the orebody. | |
| Apr to Sep 2007 | Interim PFS completed, independent peer review conducted, PFS completed in September. | Provided motivation to progress to feasibility study and order long lead items. |
| Apr 2007 | Mining Right Application submitted, together with SLP. | |
| Oct 2007 | EIA/EMP submitted. | |
| Apr 2008 | Amended SLP containing the LED plan submitted. | |
| Apr 2008 | Barrick delivered positive feasibility study. (IRR of 10.6% and after-tax NPV5% of USD496m) | Study presented 6-year open pit (containing 1.19 Moz PGM), Central Block (3.35 Moz PGM) and Eastern Block (2.75 Moz PGM). |
| 2008 | Financial guarantee for the project lodged. | |
| Jun 2008 | NOMR NW30/5/1/2/2/333MR awarded | valid for 30 years |
| Mar 2011 | Sedibelo West Mining Right Abandonment Agreement signed between IBMR, PPM and Platmin, in which IBMR abandoned the Sedibelo West mining area to PPM for an aggregate consideration of USD50m. | Sedibelo West mining area comprises portion of Ptn 1 of the farm Rooderand 45JQ and a portion of the farm Wilgespruit 2JQ, representing an area of 439.7830 ha. |
| Aug 2011 | Amended MWP as part of section 102 amendment submitted to DMRE. | |
| Mar 2012 | IDC agreed to acquire 16.2% interest in SPM | |
| Apr 2012 | Mining Right NW30/5/1/2/2/333MR amended to exclude Sedibelo West properties [Section 102 of MPRDA] | |
| May 2017 | Section 102 to incorporate Magazynskraal NOPRs and Kruidfontein NOPR into IBMR’s NOMR was submitted. | |
| Aug 2020 | Integrated FS for West & East Pits and Central & East Underground Blocks completed. | |
| SRK | | Report date: 27 May 2022
Effective Date: 31 December 2021 |
| | | |
| SRK Consulting – 576060 SPM PSM Project TRS | Page 24 |
| 4.2.3 | Magazynskraal Project |
The historical development of the Magazynskraal Project is summarized in Table 4.4.
There are no historical production statistics, as mining has yet to commence on the property.
Table 4.4: Magazynskraal Project – Historical Development
| Date | Activity | Comments |
| 1994 to 1994 | RPM (AngloPlats subsidiary) drilled 9 diamond drill holes, 261 m to 948 m in depth | |
| 2001 to 2009 | RPM drilled 22 diamond drill holes, 351 m to 1 020 m in depth. | |
| July 2007 | New order converted prospecting right NW30/5/1/1/2/1334PR for PGMs awarded to RPM. | |
| Feb 2008 | NOPR NW30/5/1/1/2/1680PR for base metals and Au, Ag awarded to RPM. | |
| Jul 2008 | NOPRs 1334PR and 1680PR ceded to Richtrau | |
| Dec 2008 | Section 11 transfer of controlling interests in NOPRs 1334PR and 1680PR to subsidiaries of Pallinghurst and BBKT. RPM retains 20% interest. | |
| 2009 to 2010 | Drilling of 108 diamond drill holes, 279 m to 977 m below surface. | |
| 2010 to 2011 | Twelve 2D seismic traverses completed. | |
| Oct 2011 | PFS for Magazynskraal – Sedibelo East completed. | |
| Mar 2012 | IDC agreed to acquire 16.2% interest in SPM | Conditional on consolidation of PPM, Sedibelo and Magazynskraal |
| May 2012 | DMRE gives consent for the consolidation of PPM, Sedibelo and Magazynskraal. | |
| Jul 2012 | Application for mining right (MRA) submitted, reference number NW30/5/1/2/2/10029MR. Renewal application for two NOPRs submitted. | |
| Nov 2012 | Consolidation of PPM, Sedibelo and Magazynskraal completed. Consolidated entity renamed SPM. | |
| Jan 2013 | EMP submitted to DMRE. | |
| May 2016 | NOMR granted, but put on hold | Not registered at MPTRO |
| Aug 2016 | Renewed NOPRs were registered in MPTRO. | |
| May 2017 | Section 102 application submitted to DMRE to incorporate Magazynskraal NOPRs and Kruidfontein NOPR into IBMR’s NOMR. | |
| Aug 2020 | Integrated FS for West & East Pits and Central & East Underground Blocks completed. | |
A composite aeromagnetic image over SPM’s western Bushveld properties is shown in Figure 4.1.
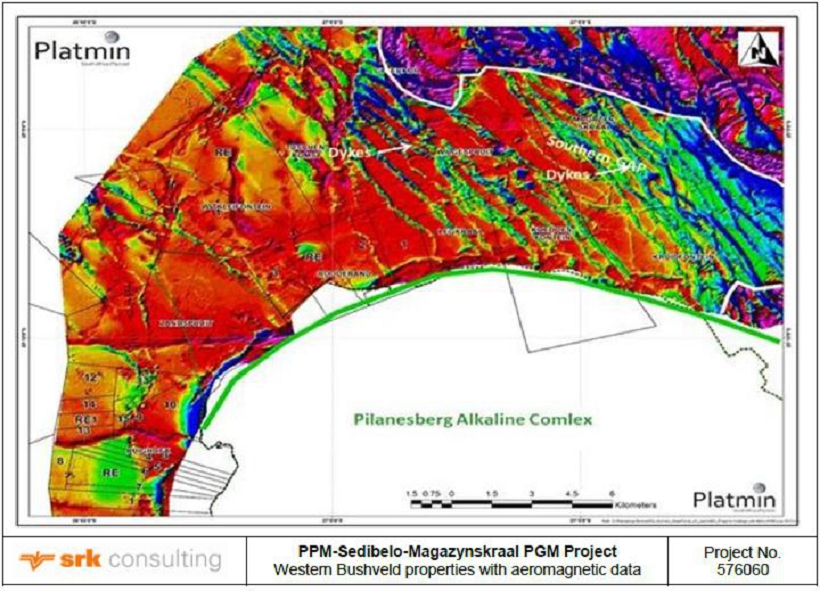
Figure 4.1: Western Bushveld properties with aeromagnetic data
| SRK | | Report date: 27 May 2022
Effective Date: 31 December 2021 |
| | | |
| SRK Consulting – 576060 SPM PSM Project TRS | Page 25 |
During the intrusion of the BC by the younger Pilanesberg Alkaline Complex, rocks of the BC were significantly faulted, displaced and intruded by numerous alkaline dykes, visible as blue NW-SE trending lineaments in Figure 4.1.
There has been extensive drilling done within SPM’s P-S-M Project as summarized in Table 4.5. Drill hole locality plans for the various mine areas are provided in Section 6.
Table 4.5: Drill hole density on SPM’s P-S-M Project
| Licence Area | Mine Area | Resource Area (ha) | No of Drill holes (DHs) | Drill hole density (ha/DH) (Resource Area) | Drill Hole Locality Plans |
| Tuschenkomst | Tuschenkomst Pit (West Pit) | 218 | 490 | 1.2 | Figure 6.1 |
| Sedibelo West Pit | 391 |
| Ruighoek | n/s | 180 | n/s | |
| Witkleifontein | n/s | 86 | n/s | Not shown |
| Rooderand | n/s | 94 | n/s | |
| Sedibelo | East Pit | 132 | 566 | 2.8 | Figure 6.2 |
| Central UG Block | 560 |
| East UG Block | 907 |
| Magazynskraal | 1 699 | 139 | 12.2 | Figure 6.3 |
Note:
n/s - not stated
The locations of the 2D seismic traverses that were conducted on Sedibelo and Magazynskraal are shown in Figure 4.2 and Figure 4.3 respectively.
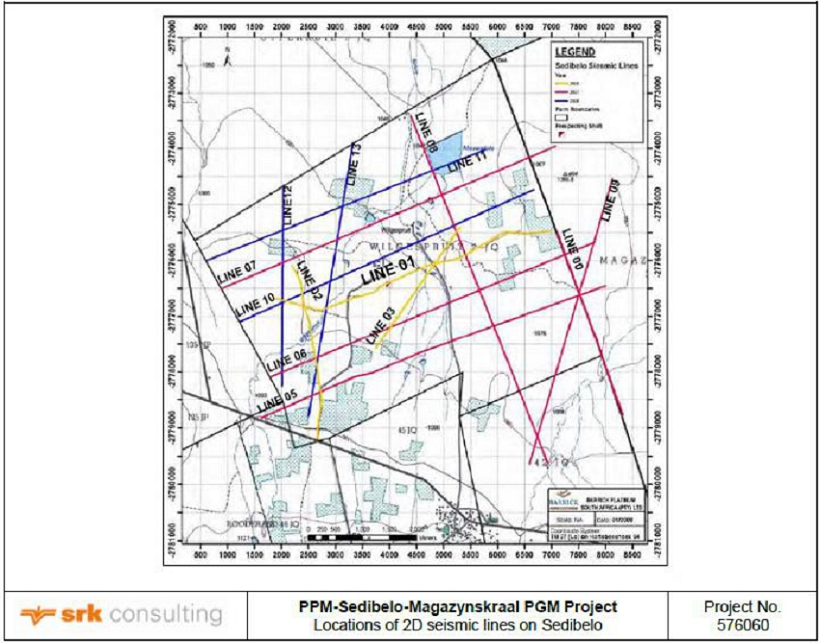
Figure 4.2: Locations of 2D seismic lines on Sedibelo (Wilgespruit)
An example of a seismic section along traverse MGZ05 on Magazynskraal is shown in Figure 4.3. Interpreted faults are shown in red, with drill hole traces shown in purple. The orange/purple lines at depth are interpreted to be Transvaal Supergroup sediments which form the footwall of the BC.
| SRK | | Report date: 27 May 2022
Effective Date: 31 December 2021 |
| | | |
| SRK Consulting – 576060 SPM PSM Project TRS | Page 26 |

Figure 4.3: 2D seismic traverses and section MGZ05 on Magazynskraal
The first blast to start the development of the East Pit on Sedibelo occurred on 3 December 2021 (Figure 4.4).
Figure 4.4: First blast at the East Pit on Sedibelo
| SRK | | Report date: 27 May 2022
Effective Date: 31 December 2021 |
| | | |
| SRK Consulting – 576060 SPM PSM Project TRS | Page 27 |
| 5 | GEOLOGICAL SETTING, MINERALIZATION AND DEPOSIT |
[§229.601(b)(96)(iii)(B)(6)
| 5.1 | Regional, local and project geology |
[§229.601(b)(96)(iii)(B)(6)(i) (ii)] [SR2.1(i)-(vii)]
The BC of South Africa (Figure 5.1) is the world’s largest and hence the most important repository of the PGMs in the world with an exposed surface area of some 67 000 km2. The sub-outcrop areal extent describes a broad ellipse and, when viewed in plan, measures approximately 200 km and 370 km along the north-south and east-west axes, respectively. This geological phenomenon consists of a massive ultramafic-mafic layered intrusion, or more likely a series of interconnected or overlapping intrusions, and a suite of associated granitoid rocks intruded into the early Proterozoic Transvaal Basin within the north central Kaapvaal Craton. This suite of associated granitoid rocks is a penecontemporaneous series of granitic rocks, termed the Lebowa Granite Suite (LGS) and felsic extrusive rocks of the Rooiberg Group (RG), which occur in the central area between the Eastern and Western Limbs of the BC. The ultramafic-mafic layered rocks collectively referred to as Rustenburg Layered Suite (RLS) is in five so-called lobes, namely the Western, Far Western, Eastern, Northern and Southern (Bethal) lobes. The mafic layered portion of the BC (i.e., the RLS) is 2 055 million years (Ma) old and is probably the largest layered mafic complex on earth. The magmatic layering of the RLS is remarkably consistent and can be correlated throughout most of the BC.
The RLS is divided into five major stratigraphic units, as follows:
| • | The lowermost Marginal Zone ranges in thickness from several metres to several hundred metres and comprises a heterogeneous succession of generally unlayered basic rocks dominated by norites; |
| • | Ultramafic rocks dominate the Lower Zone. The most complete exposures are in the north eastern part of the Eastern Limb where there are a series of cyclically layered units of dunite-harzburgite. These vary in thickness with the thinnest units developed over structural highs in the basin floor; |
| • | The Critical Zone contains the economic platinum resources of the BC. |
| o | The Lower Critical Zone is dominated by pyroxenite with interlayered harzburgite and chromitite seams and is restricted to the central part of the Eastern Limb; |
| o | The Upper Critical Zone is recognisable throughout the Eastern and Western Limbs and consists of layered pyroxenites, norites, anorthosites and chromitites. The layering occurs on a variety of scales and may be regular to highly irregular in aspect; |
| o | Chromitite layers occur in three distinct groupings; the Lower Group (LG) seams occur in the Lower Critical Zone, the Middle Group (MG) series straddle the contact between the Lower and Upper Critical Zones, and the Upper Group (UG) layers occur within the Upper Critical Zone. PGMs occur in sub-economic concentrations in association with chromitite layers in the Lower Critical Zone. The two most economically significant PGM mineralized layers of the BC, namely the Merensky Reef (MR) and the Upper Group Chromitite 2 (UG2) Reef, are continuous over hundreds of kilometres. The PGMs include varying proportions of Pt, Pd, Rh, Ru, Ir and Os, as well as elevated concentrations of Ni, Cu and Co as base metal sulfides; |
| • | The Main Zone is the thickest unit within the RLS and comprises approximately half the RLS stratigraphic interval. It consists of gabbro-norites with some anorthosite and pyroxenite layering. Banding or layering is not as well developed as in the Critical and Lower Zones; and |
| • | The Upper Zone is dominated by gabbros with some banded anorthosite and magnetite. There is no chilled contact with the overlying rhyolite and granophyres of the LGS. |
The true thickness of the RLS varies from 7 000 m to 12 000 m. The Marginal Zone is highly variable in thickness whilst the Lower Zone is restricted to isolated trough-like bodies located around the base of the RLS. The Main and Upper Zones are laterally more persistent, and these zones comprise more than 60% by volume of the RLS. The continuity of the Critical Zone is intermediate between that of the Lower Zone and Main/Upper Zones.
In the Swartklip sector, the Upper Critical Zone stratigraphy between the UG2 and MR is significantly telescoped, ranging in thickness between 12 and 25 m, compared with a thickness of 120 m or more in other parts of the BC (compare Figure 5.2 and Figure 5.3). In addition, the interval between the UG2 and the MR contains the PGM bearing Pseudo Reef Package, which is not encountered elsewhere in the BC.
| SRK | | Report date: 27 May 2022
Effective Date: 31 December 2021 |
| | | |
| SRK Consulting – 576060 SPM PSM Project TRS | Page 28 |
A composite stratigraphic section (Figure 5.3) compares the common stratigraphy of the RLS and the Critical Zone, to the local stratigraphy of the Swartklip facies (P-S-M Project) and Mphahlele Project.
The similarity of geology across large areas within each of the lobes, particularly the sequence of igneous layering that includes both the MR and the UG2 Reef is probably indicative of simultaneous differentiation and replenishment of a basaltic magma under essentially identical conditions. The dip of the igneous layering is generally shallow and towards the centre of the complex.
Post-BC sedimentary successions of the Waterberg Group and Karoo Supergroup, as well as more recent alluvial deposits of Holocene age, cover large parts of the BC.
The Western Limb of the BC is subdivided into two sectors separated by the younger Pilanesberg alkaline intrusive complex: the northern ‘Swartklip’ sector where the P-S-M Project is located and the southern ‘Rustenburg’ sector.
The PGMs are contained throughout the multi-layered sequence but are enriched (by factors of over 1 000) to economic concentrations within the Critical Zone and confined to certain horizons/layers commonly referred to as reefs. The Critical Zone is the host to all chrome and PGM mineralization within the BC.
The local geology around the P-S-M project area is shown in Figure 5.4, illustrating that the majority of the outcrop over the project area is of the Main Zone, and only in the far west do the Upper, Lower and the Critical Zone outcrop. The P-S-M project which is located north of the Pilanesberg Alkaline Complex is part of the Swartklip facies. The Pilanesberg Alkaline Complex shown in pale orange in Figure 5.5, and of age 1 300 Ma is an intrusion into the BC. The Swartklip facies extends broadly from the Pilanesberg in the south to the Crocodile River in the north. In this part of the BC, the stratigraphic succession from the Lower Zone up to the lower part of the Main Zone (i.e. including all the PGM enriched layers) is completely eliminated in two areas, known as the Northern and Southern “Gap” areas (Figure 5.4). North and east of the dashed green line in Figure 5.5 is the Southern Gap Area (interpreted from aeromagnetic data), where no Critical Zone rocks are anticipated. The zone shaded pink (Figure 5.5) immediately south of the Southern Gap Area is an area where severe structural complications and disruption of stratigraphy are anticipated. The lines striking approximately NE-SW in Figure 5.5 represent the depth contours to the MR. The pale blue shaded area represents the area where the MR, Pseudo reef package (unique to the Swartklip sector/facies) and UG2 reefs which are generally considered the mineralized unit of economic interest can be expected. These reef packages sub-outcrop within the project footprint as a result of the faulting. The stratigraphic interval between the MR and the UG2 is considerably attenuated relative to other parts of the BC. This is largely the result of the elimination or primary absence of plagioclase-rich lithologies (norite and anorthosite) that make up a considerable proportion of the Upper Critical Zone stratigraphy elsewhere in the Complex.
| SRK | | Report date: 27 May 2022
Effective Date: 31 December 2021 |
| | | |
| SRK Consulting – 576060 SPM PSM Project TRS | Page 29 |
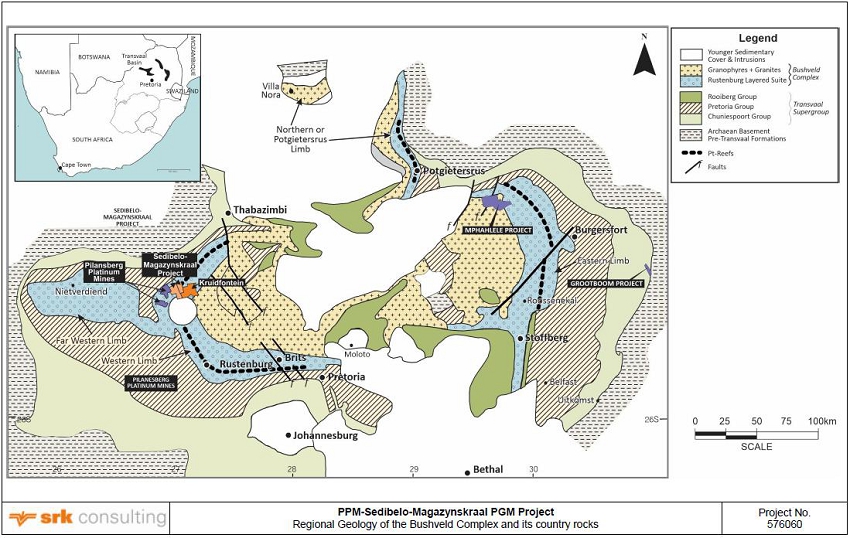
Figure 5.1: Regional Geology of the Bushveld Complex and its country rocks
| SRK | | Report date: 27 May 2022
Effective Date: 31 December 2021 |
| | | |
| SRK Consulting – 576060 SPM PSM Project TRS | Page 30 |

Figure 5.2: Upper Critical Zone stratigraphy between the UG2 and Merensky Reef of the Swartklip Sector, Western Limb of the BC
| SRK | | Report date: 27 May 2022
Effective Date: 31 December 2021 |
| | | |
| SRK Consulting – 576060 SPM PSM Project TRS | Page 31 |

Figure 5.3: Composite stratigraphic section comparing conventional Critical Zone stratigraphy to the local stratigraphy at P-S-M and Mphahlele Projects
| SRK | | Report date: 27 May 2022
Effective Date: 31 December 2021 |
| | | |
| SRK Consulting – 576060 SPM PSM Project TRS | Page 32 |
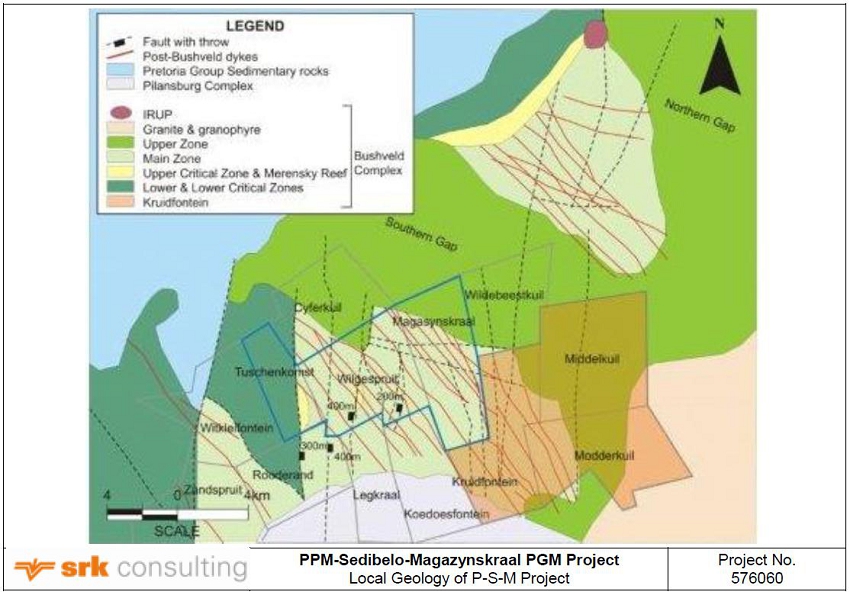
Figure 5.4: Local Geology of P-S-M Project

Figure 5.5: Simplified Structural Geology of P-S-M Project
| SRK | Report date: 27 May 2022 |
| | Effective Date: 31 December 2021 |
| | |
| SRK Consulting – 576060 SPM PSM Project TRS | Page 33 |
| 5.1.1 | The Merensky Reef Layer |
The MR has been traced over 150 km along strike in the eastern BC and over 110 km strike in the southern sector of the western Limb. There is also extensive mining on the western sector from Pilanesberg to Thabazimbi giving a total strike length of approximately 250 km. Within the Northern Limb the geological succession is unique with only the Upper Critical Zone present and the Platreef, developed near the floor of the complex, is the local equivalent to the MR. Generally, two types of MR exist; the normal and potholed reefs. Figure 5.2 schematically displays the formation of these two types of reefs in section view relative to the underlying stratigraphic units. Where fully developed within the P-S-M Project footprint, the MR consists of an orthopyroxenitic or harzburgitic pegmatoid, between 1 cm and 1 m thick, bounded top and bottom by thin (1 cm or less) chromitite stringers. The MR, where fully developed, is more olivine rich than in other parts of the BC.
Within the MR, the PGMs occur as small (<20 µm) grains, most commonly at the contact between the base metal sulfides and silicate minerals. Their composition varies considerably, from sulfides through tellurides to Pt-Fe alloys. Grade varies considerably over short distances in the MR. Where the pegmatoidal pyroxenite of the MR is greater than 50 cm, grade is concentrated at or near the upper chromitite with a smaller peak on the lower chromitite. PGM mineralization is generally low grade in the body of the pegmatoid itself.
| 5.1.2 | The Pseudo Reef Layer |
Pseudo Reef consists of two distinct portions; the Lower Pseudo Reef (LPR), a coarse-grained pegmatoidal feldspathic harzburgite, and the Upper Pseudo Reef (UPR), a finer grained feldspathic harzburgite. The Pseudo Reef may contain significant concentrations of PGMs. The lateral continuity of the Pseudo Reef is not as extensive in comparison to the MR and UG2 reefs.
| 5.1.3 | The UG2 Chromitite Layer |
The UG2 is hosted within pyroxenites and typically consists of a main chromitite band, typically 50 to 120 cm wide, often accompanied by a series of smaller chromitite stringers in the immediate hanging wall. These stringers range from 0.5 cm to several tens of cm in width. Additionally, pyroxenite stringers may be developed within the main chromitite layer. The footwall to the UG2 consists of a coarse-grained feldspathic, pegmatoidal pyroxenite or harzburgite unit of variable thickness. Discontinuous chromitite stringers and blebs are present within the pegmatoid footwall. Pyroxenite is developed beneath the pegmatoidal pyroxenite zone. The common signature of the UG2 reef within this ultramafic layer is the massive 1 m thick chromitite found within the package of alternating thin chromite seams. Overlying the UG2 is mostly norite or pyroxenite; the only exception is in the northern part of the Western Limb where the UG2 is overlain by harzburgite.
The PGM mineralogy of the UG2 is simpler than that of the MR, being dominated by PGE sulfides, although the grain size is smaller (<10 µm) than in the MR. The 4E grade tends to peak at the bottom and top contact of the main UG2 chromitite seam.
The UG2 is the most consistently developed mineralized horizon within the P-S-M Project footprint.
The BC reefs are generally affected by discontinuities including faults, dykes, potholes and Iron-Rich Ultramafic Pegmatoids (IRUPs).
Faults
Major faults of regional extent that bound and transect the BC are the Steelpoort fault, Laerdrift fault, the Vlakfontein fault (Pilanesberg) and the Brits Graben. The large fault zones which bound the BC are deep seated crustal lineaments of continental magnitudes, namely, the Johannesburg-Barberton Lineament, the Palala Fault/Shear zone, the Rustenburg Fault (Figure 5.1) and the Thabazimbi-Murchison Lineament. With the exception of the Rustenburg fault striking NW-SE, the bounding faults generally strike ENE-WNW. The transecting faults run nearly perpendicular to the bounding faults; the only exception is the Steelpoort fault striking NE-SW (Figure 5.1). The interlocking nature of these faults has resulted into structural blocks. The magnitudes of displacements on these structural blocks are significant and are therefore considered in mine planning.
| SRK | Report date: 27 May 2022 |
| | Effective Date: 31 December 2021 |
| | |
| SRK Consulting – 576060 SPM PSM Project TRS | Page 34 |
Faulting of the rocks of the BC in response to the intrusion of the Pilanesberg Complex is significant in the west but appears to be progressively less intense eastwards from Tuschenkomst across Sedibelo towards Magazynskraal (dashed red lines in Figure 5.5). The vertical displacement on these faults is variable giving rise to horst and graben structures (see section A-A’-A’’ in Figure 5.6). As a result of faulting, the reefs sub-outcrop in the Tuschenkomst and Sedibelo properties. The reefs in the eastern area of Sedibelo extend into the Magazynskraal property at a depth of some 300 m and continue to more than 1 000 m below surface at the Magazynskraal southern boundary.
Dykes and Sills
The BC is disrupted by several generations of post-BC dykes and sills, which range in the western Bushveld from a dominant suite of mafic dykes to less common alkaline lithologies (syenites, lamprophyres and kimberlites), with the latter posing particular problems because of their susceptibility to alteration. Within the P-S-M Project footprint, swarms of predominantly mafic dykes trend in a NNW direction across the BC, and are accompanied by a suite of associated sills, which may be disruptive to the mineralized sequences in places. The emplacement of the post-Bushveld intrusive suite is not necessarily accompanied by fault displacement.
Potholes
The ‘normal’ stratigraphy hosting the UG2 and, particularly, the MR, is disrupted in places by phenomena known as “potholes”, in which the reef-bearing lithological units eliminate their immediate footwall units, apparently by a process of magmatic thermal erosion, coming to rest on stratigraphically lower units than would normally be the case. They are circular to oval shaped depressions when encountered on the different reef horizons. Within the depression, the reef unit may crosscut the footwall stratigraphy at a high angle and ultimately lie at a lower stratigraphic elevation than the typical reef. Within the pothole, anomalous hanging wall, footwall and reef stratigraphy may be developed. In some instances, the reef within a pothole may have higher than average grades; in others it may be uneconomic. In extreme cases, reef is not recognisable within the pothole. The scale of potholing is extremely variable, ranging from gentle undulations, often termed “rolling reef” to deeply plunging features. The frequency of potholes varies and the presence of potholes on the UG2 does not imply similar pothole development within the overlying MR.
In the Swartklip sector, by contrast with the rest of the BC, MR potholes can erode up to 15 m of footwall anorthosite and leuconorite, ultimately coming to rest on an otherwise sub-economically mineralized package of ultramafic rocks; the Pseudo Reef package. Over much of the Swartklip facies, the MR directly overlies the Pseudo Reef over large (up to several km diameter) areas referred to as ‘regional potholes’ which can usually be profitably mined.
Pothole interruptions of the ‘normal’ MR, Pseudo and UG2 layers have important operational and hence financial implications in the viable exploitation of these layers. The majority of the smaller potholes are usually classified as ‘geological losses’ and accounted for in the declaration of Mineral Resources/Reserves. By contrast, ‘regional potholes’ can usually be mined successfully, provided the many variations of the ‘potholed reef’ are clearly understood.
Iron-Rich Ultramafic Pegmatoids (IRUPS)
Throughout the BC, the normal stratigraphy in the Upper Critical Zones, may be locally disrupted by a late-magmatic suite of coarse-grained transgressive lithologies, known as IRUPs. IRUPs in the form of pipes, dykes and sheets are common features of the RLS around the BC resulting from metasomatism by iron-rich fluids. The replacement pegmatoid is usually coarse-grained to pegmatoidal but is of variable texture. The degree of alteration is also variable and original mineralogies and textures may be partially preserved. Alteration zones are invariably transgressive across the igneous layering. These pegmatoids do not always result in loss of metal value but the altered ore minerals are not as amenable to flotation.
[§229.601(b)(96)(iii)(B)(6)(ii-iii)] [SR2.1(ii)-(vi)]
The BC is a magmatic layered ultramafic-mafic intrusion. As one of the largest known differentiated igneous bodies, it hosts world class deposits of PGMs, Ni, Cu, Cr and V.
The PGM, base metal and chrome mineralization targeted at the P-S-M Project is contained in three cumulate layers, the MR, Pseudo Reef and UG2. The mineralization in the UG2 is primarily constrained to the main seam and the underlying UG2 Pegmatite units.
The exploration programme in place follows the well-established model of targeting the respective stratigraphic units, which are readily identifiable in the drill core.
A simplified stratigraphic column of the reef packages specific the P-S-M Project footprint is shown in Figure 5.7.
| SRK | Report date: 27 May 2022 |
| | Effective Date: 31 December 2021 |
| | |
| SRK Consulting – 576060 SPM PSM Project TRS | Page 35 |

Figure 5.6: Geological section through the PPM-Sedibelo-Magazynskraal Project
| SRK | Report date: 27 May 2022 |
| | Effective Date: 31 December 2021 |
| | |
| SRK Consulting – 576060 SPM PSM Project TRS | Page 36 |

Figure 5.7: Local Stratigraphy and grade distributions for normal and potholed reef at P-S-M Project
| SRK | Report date: 27 May 2022 |
| | Effective Date: 31 December 2021 |
| | |
| SRK Consulting – 576060 SPM PSM Project TRS | Page 37 |
[§229.601(b)(96)(iii)(B)(7)
| 6.1 | Non-drilling activities |
[§229.601(b)(96)(iii)(B)(7)(i)] [SR2.1(iii), SR2.1(iv), SR3.1, SR3.2, SR3.8]
The historical exploration programme conducted on the West Pit involved a combination of geological mapping, remote imagery, regional soil geochemistry, airborne radiometric and aeromagnetic geophysical techniques, as well as trenching.
Platmin commenced with exploration activities in 2002. At the onset, these involved the compilation and capture of data into a GIS, which comprised the following:
| • | High resolution aerial photography; |
| • | Airborne radiometric data; |
| • | Regional soil geochemistry data (32 elements, 1 sample/km²); |
| • | Regional geological mapping; and |
Various manipulations of the above data aided and resulted in a detailed geophysical interpretation which refined previous geological interpretation and assisted greatly in understanding the geology of the project area.
Three trenching programmes have been conducted on Tuschenkomst – April 2004, November 2004 and March 2006. The first programme targeted PGM anomalies generated from the soil survey. Ten trenches totalling 2 422 m were excavated and 1 617 samples extracted and submitted for Pt, Pd and Au analysis. The trenching was undertaken over areas of anomalous soil geochemistry to confirm the sub-outcrop position of the UG2 and MR reefs. This provided early control for a Phase 1 drilling programme and geological model.
The second trenching programme focussed on further refining the sub-outcrop positions of the various reefs and determining the positions of interpreted faults. A further 29 trenches were excavated totalling 2 868 m; only limited sampling was undertaken. Data gathered allowed an accurate interpretation of the near surface geology of the reef package on Tuschenkomst which was then used in compiling the 3D model of the mineralization.
The third trenching (sterilisation) programme was used to investigate the possibility of the occurrence of the Middle or Lower Group chromitite layers to the west of the Tuschenkomst deposit in areas proposed for the plant and tailings sites. Ten trenches were excavated totalling 2 502 m. All significant chromitite layers exposed during trenching were sampled. Only Lower Group chromitites were intersected during this trenching.
In 2004 and 2005 selected areas were re-flown with extremely high-resolution aeromagnetic surveys. The surveys were flown using a fixed wing (crop sprayer) aircraft.
Airborne magnetic and radiometric data were used to interpret both structure and lithology. The magnetic data was very effective in the delineation of mafic dykes. A consistent, stratiform harzburgitic layer between the MR and the UG2 reefs gives a strong magnetic response, which is easily identifiable in the airborne magnetic data. Radiometric data allowed for the delineation of the felsic dyke suites but the response was subtle. An aeromagnetic image of the P-S-M Project area is as shown in Figure 4.1.
SRK has not reviewed the sample representativity and quality of the assay results from both the geochemistry and trenching exercise; likewise, for Sedibelo and Magazynskraal projects. As noted above these exercises were aimed largely to confirm the UG2 and MR sub-crop positions and the data is not used in the Mineral Resource estimation. SRK notes that subsequent information derived from drilling activities largely conforms to the structural interpretation deduced from the geophysical observations.
In the mid-1990s an exploration shaft was sunk on the farm by AngloPlats to a depth of 70 m to reach the MR. A reef drive on the MR was developed for approximately 650 m, running along strike to the north and south of the shaft. The principal purpose of the exploration reef drives was to establish the degree of structural disturbance and to test the grade variation.
| SRK | Report date: 27 May 2022 |
| | Effective Date: 31 December 2021 |
| | |
| SRK Consulting – 576060 SPM PSM Project TRS | Page 38 |
Subsequent to 2004, aerial photographic survey, soil sampling, aeromagnetic survey, seismic surveys, prospecting shaft investigations, and the extraction of a bulk sample were pursued as part of the different phases of exploration campaigns. Three seismic surveys comprising 12 traverses were conducted over the Sedibelo project area between 2005 and 2008 (see Figure 4.2). The resultant interpretation of all of these surveys forms the basis of the structural model at Sedibelo which has largely been confirmed by drill holes. It is worth mentioning that the assay results of the bulk samples do not contribute to the grade estimates.
| 6.1.3 | Magazynskraal Project |
Exploration at Magazynskraal has included soil sampling, aeromagnetic survey and seismic surveys. AngloPlats conducted an airborne magnetic survey over the Pilanesberg area as part of a larger survey during 2004. This survey also covered the Sedibelo-project area. A 2D seismic survey consisting of 12 traverses was conducted over the Magazynskraal project area in 2010. The resultant interpretation of all of these surveys forms the basis of the structural model which has largely been confirmed by drill holes.
| 6.2 | Drilling, Logging and Sampling |
[§229.601(b)(96)(iii)(B)(7)(ii) (v) (vi)] [SR2.1(iii), SR2.1(iv) SR3.2, SR3.3, SR3.8]
[SR3.1, SR3.2, SR3.3(vi)]
West Pit
Diamond core drilling is the main technique that has been employed for exploration and Mineral Resource definition. Reverse Circulation (RC) drilling is undertaken in the West Pit for geological/structural control. Since 2003 Platmin has used qualified contractors for core drilling programmes. Although the MR, Pseudo reef and UG2 drill core intercepts are analysed for PGMs, only a selection of UG2 intersections are analysed for chrome and iron grades across the property.
The West Pit mineral inventory footprint covers the Tuschenkomst, Sedibelo West and Rooderand farm boundaries. The drill hole locality plan shown in Figure 6.1 has the red and light blue dots representing drill hole collars constraint within the Tuschenkomst farm boundary. The green and deep blue dots to the east of Tuschenkomst are drill holes collared on Sedibelo West; to the south of Tuschenkomst is a display of the drill hole collars on Rooderand.
The Tuschenkomst drilling programme was conducted in three phases:
| • | Phase I (February of 2004 to July 2004) - 76 drill holes at 200 m x 200 m drill spacing were achieved; |
| • | Phase II - Infill drilling which included 86 additional drill-holes, reducing the spacing to 100 m x 100 m; and |
| • | Phase III - 31 holes on a 25 m x 25 m grid to evaluate the MR Footwall (MRFW) mineralization and 27 holes at the same spacing focused on the pseudo harzburgite mineralization. Infill drilling was completed in February 2005 resulting in a total of 220 drill holes and 22 deflections for all three phases. |
Summary information on additional holes are as follows:
| • | Drilling of trial mining site (2006) - 46 shallow holes were drilled in three lines on a 25 m x 25 m grid to test the area of the box cut and trial mining site. All holes intersected the PGM reef package; |
| • | Eight inclined and oriented geotechnical drill holes were drilled into the optimized pit high-wall and sidewall positions for pit wall design and stability studies; and |
| • | Nineteen sterilisation drill holes were drilled to the west of the West Pit optimized pit in order to investigate the possibility of the occurrence of economic chromitite horizons occurring in the areas being proposed for rock dumps, plant and tailings sites. |
With the exception of the geotechnical holes, all drill holes are vertical. Diamond drilling pre 2011 amounted to 266 holes (i.e., the ‘Tu’ prefix holes shown in red dots) for a total of 23 884 m. An additional 32 NQ-size holes (47.6 mm core diameter) (i.e., the ‘Tu’ prefix holes shown in light blue dots ) were drilled into the deeper parts of the West Pit during 2011 with a cumulative drill hole length of 3 794 m).
| SRK | Report date: 27 May 2022 |
| | Effective Date: 31 December 2021 |
| | |
| SRK Consulting – 576060 SPM PSM Project TRS | Page 39 |
The drill spacing on Sedibelo-West was in excess of 250 m. These holes comprised 107 diamond drill holes (75 187 m including deflections) previously drilled by Barrick; this drill spacing culminated into the declaration of an Inferred Mineral Resources. An infill drilling programme on Sedibelo West in 2011 resulted in reducing the drill hole spacing to 125m and further extending the Open pit Mineral Resource footprint. The 2011 drilling programme commenced in July 2011 and 108 NQ-size diamond drill holes (18 857 m) were completed by mid-September 2011. A total of 215 holes were drilled within the Sedibelo-West area (Figure 6.1).
A structural control drilling programme has been in place since the inception of the open pit operations which is earmarked to update the geological structures when necessary. No grade control drilling is undertaken to update the Mineral Resource estimate. Thus, since the original grade estimates were compiled in 2013 using the drill hole information reflected in Figure 6.1, there has been no update.
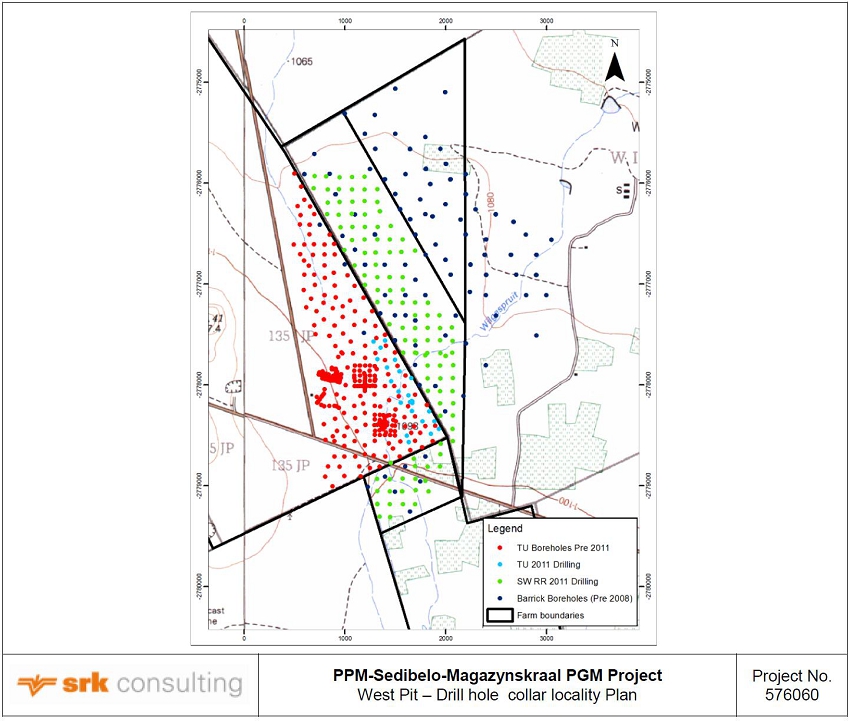
Figure 6.1: West Pit – Drill hole collar locality Plan
Sedibelo Project
The drilling information presented here is as extracted from the Barrick 2008 BFS report and relates to all drilling completed up to December 2007 on the entire Sedibelo Property.
All the holes were accomplished using diamond core drill technique. The holes underpinning the Mineral Resource estimates were drilled vertically; the inclined holes were orientated either for geotechnical or structural purposes. Except for geotechnical holes and metallurgical holes, which were drilled in HQ size (63.5 mm core diameter), all the other holes were drilled to NQ size.
Deflections were initially drilled on all holes (three to five deflections) to test for variability of the mineralization and to obtain additional core for metallurgical test work and for geotechnical studies. This practice was discontinued in 2005. Subsequent to 2005, only 2 non-directional deflection holes were drilled.
| SRK | Report date: 27 May 2022 |
| | Effective Date: 31 December 2021 |
| | |
| SRK Consulting – 576060 SPM PSM Project TRS | Page 40 |
Core runs were 6 m in non-mineralized intervals and 3 m in mineralized intervals. Core barrels were retrieved by wire line. Holes were stopped once they intersected the UG1 reef which is approximately 10 m into the footwall of the UG2 reef. The core was transferred into metal core boxes. Drill intervals were marked by plastic blocks showing depth and core loss/gain. Core recovery from Diamond drill holes is generally good across the BC rocks that host the mineralisation. The average recovery rate of the holes drilled was greater than 95%. Due to the high rate of the core recovery, it has not been necessary to ascertain the relationship between sample recovery and grade. Core boxes were transported to a central core processing facility where the core was photographed with a digital camera prior to logging and sampling. Ideally, the geotechnical logging should have been performed directly at the drill site to avoid any potential damage/break due to handing and transport.
Drilling started in June 2004 and was largely aimed at testing the preliminary 3D model of the reef surfaces based on AngloPlats’ information (collar co-ordinates and depths) and to establish stratigraphy, continuity of the reefs, grade and style of the mineralization. A few holes were also drilled in the Western Block (i.e., Sedibelo West), an area that was not drilled by AngloPlats, to test for mineralization and depth to mineralization. Spacing on the Central Underground is approximately 200 x 200 m, and the other areas were only tested by widely spaced holes. Table 6.1 summarises drilling undertaken on the Sedibelo property. The collars of these drill holes can be seen in Figure 6.2. In comparing Table 6.1 to Figure 6.2, the Eastern and Western Blocks refer to the area with X co-ordinates approximately greater than 5 000 and less than 3 000 respectively. Whereas the Central Block is host to the East Pit and Central Underground projects, the Eastern Block reflects a subsection of the Eastern Underground Block project (excluding the footprint of Magazynskraal); the Western Block largely conforms to the Sedibelo West footprint outside of the West Pit’s Mineral Resources.
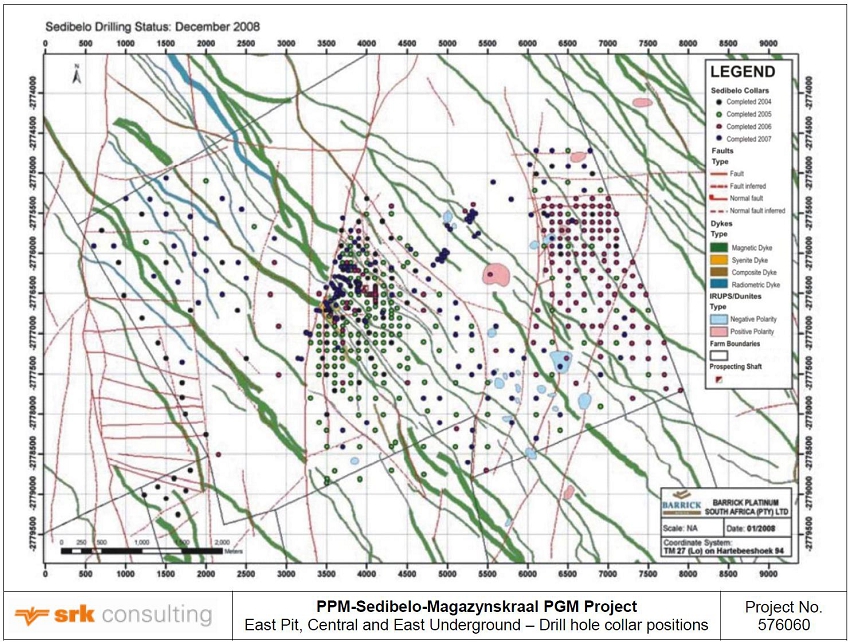
Figure 6.2: East Pit, Central and East Underground – Drill hole collar positions
| SRK | Report date: 27 May 2022 |
| | Effective Date: 31 December 2021 |
| | |
| SRK Consulting – 576060 SPM PSM Project TRS | Page 41 |
Table 6.1: Central and East Underground Block Project – summary of Sedibelo drilling from 2004 to 2007
| Barrick Holes | 2004 | 2005 | 2006 | 2007 | Total |
| Eastern Block (Sedibelo East) | 7 | 24 | 112 | 31 | 174 |
| Central Block | 39 | 146 | 40 | 134 | 359 |
| Western Block | 25 | 2 | 4 | 24 | 55 |
The collars were professionally surveyed on a regular basis. The surveyed X, Y and Z position was taken as the collar position into the acQuireTM data base. Only surveyed holes were used for resource estimation and construction of reef surfaces in the geological model. Downhole surveying was carried out by a commercial contractor on selected holes. A maximum deviation of approximately 1.5° was observed on a +300 m deep hole. In more shallow holes the deviation was negligible. For that reason, downhole surveying was not done routinely and vertical holes were given a -90° dip. Drilling wedges were designed to give a 1.5° deflection and each deflection was therefore given a nominal dip of -88.5°.
Magazynskraal Project
Drilling on the Magazynskraal property has been undertaken by two companies; namely AngloPlats and Richtrau. Richtrau’s initial drilling programme was conducted on a 500 x 500 m grid. This was followed up with an infill drilling programme on a 250 x 250 m grid. The AngloPlats holes are on a much wider spacing than that of Richtrau (Figure 6.3). The UG2 was the initial reef targeted at depths of less than 800 m. Drilling was carried out using NQ size and BQ size (36.5 mm core diameter) respectively by Richtrau and AngloPlats.

Figure 6.3: East Underground Drill Hole Collar Positions
Three or more deflections were drilled per hole whenever the mother hole intersected the reef package. Deflections were drilled from the mother-hole at depths of 5, 10, and 15 m above the MR and generally terminated approximately 3 m below the UG2. It is however noted that the Richtrau mother holes were drilled 40 m below the bottom contact of the UG2 intersection; on average, 15 m below the bottom contact of the UG1 reef package that underlies the UG2. This was done to obtain geological and geotechnical information in the areas where mine development (haulages) was likely to occur. Table 6.2 shows the breakdown of mother holes drilled on Magazynskraal up to date. It must be noted that information associated with the drill hole locality map of Figure 6.3 (excluding Afarak drill holes and Kruidfontein footprint) is what underpins the resource estimate for the East Underground project which comprises solely of data from Magazynskraal and Sedibelo East. The Sedibelo East drill holes (i.e., the Barrick holes) have been accounted for under Figure 6.2. The Afarak drill hole data on the Kruidfontein lease area do contribute to the grade estimates for the East Underground Block.
| SRK | Report date: 27 May 2022 |
| | Effective Date: 31 December 2021 |
| | |
| SRK Consulting – 576060 SPM PSM Project TRS | Page 42 |
Table 6.2: Magazynskraal – summary of drilling from 1994/5 to 2009/10
| Drilling | 1994/5 | 2001 | 2007/8 | 2009/10 | Total |
| AngloPlats - Magazynskraal | 9 | 7 | 8 | 7 | 31 |
| Richtrau - Magazynskraal | | | | 111 | 111 |
The approach adopted for surveying of drill holes is similar to the description above for the Sedibelo property. SRK notes that down hole surveys were completed on all the mother holes; a slight deviation from the practise at Sedibelo. This was done using EZ-BQ (EMS) survey tool immediately after the mother-hole drilling was completed. In addition, three holes were re-surveyed using gyro surveys and found to correspond reasonably well with original survey records. SRK notes that core recovery was in the order of 95% and above.
[SR3.3, SR3.4, SR3.5]
The description below is applicable to the West Pit operations and all the projects.
Drill Core Sampling Procedures
The MR, UG2 and the Pseudo Reef (i.e., the UPR, PRHZB and LPR) packages are identified for sampling to at least 1 m above and below the reef contacts in order to sample the entire mineralization zone. The Pseudo Reef package in a younging sequence comprises of the LPR, Pseudo Reef Harzburgite (PRHZB) and the UPR units. Where zones of erratic mineralization are notable, they are sampled.
Sampling of the reef is done at 20 cm sample intervals, increasing to 50 cm to ensure adequate sampling of the mineralization in the more erratically mineralized zones. Sample breaks are made based on geology and natural breaks in the core.
Mineralized zones are identified by the presence of disseminated sulfides and in the case of the mineralization in the MRFW anorthosite, by a distinct alteration. For a typical hole intersecting all the major reefs, approximately 100 samples are collected.
Drill core samples in the mineralized zone are marked, split by means of a 2 mm thick diamond saw blade and each sample is given a unique sample number. All logging and sampling data is electronically captured. Half core is submitted for analysis and the remaining half marked and stored for future reference or test work.
SRK notes that the core sampling methods are consistent with the conventional practice in the BC.
The general principles applicable to the drill core sampling are as provided below:
| • | Detailed sampling of the silicate reefs (MR and Pseudo Reefs) to allow for a finer resolution (down to 10 cm) of the potential mineable portion of the orebody in the areas where decisions regarding the mining cut is likely to be made; |
| • | Minimum allowable sample length must not be less than 10 cm. Samples that need to be sampled at a variable width must be less than 20 cm but more than 10 cm (except where wider samples are required); |
| • | Samples must be taken one cm above or below the top or bottom contacts of major sampled units and the logged Lithological / Stratigraphic intervals must be taken at the middle of the core intersection of the angled contact; |
| • | Where there is an intrusive in a mineralized interval, the mineralized unit must be capped (by the intrusive) in such a way that all the mineralized material is included in the sample. Where the intrusive is larger than 12 cm, it must be taken as a separate sample (the samples either side will overlap 1 cm into the intrusive on both ends. If intrusive is smaller than 12 cm, it must be sampled using the normal protocol (as if it is not there); |
| • | Sample information must be recorded either directly into the SABLE data base or on paper sample sheets. As much information as possible must be recorded but the drill hole number, sample “from / to” measurements and “Strat” Code (according to the Logging Dictionary) are critical. The strat code must be recorded along with other additional pertinent information (e.g., lithology, mineralization). One ticket must be placed inside the sample bag and one must be stapled onto the outside of the bag; and |
| SRK | Report date: 27 May 2022 |
| | Effective Date: 31 December 2021 |
| | |
| SRK Consulting – 576060 SPM PSM Project TRS | Page 43 |
| • | Once the core has been sampled and properly marked up, it must be photographed. |
RC chip sampling procedure
Sampling of the chips at West Pit commences 5 m above the MR and stops 2 m below the LPR, whilst the UG2 is sampled 1 m above the reef up to 3 m below. Each one-metre sample is riffle split four times to obtain a representative sample of 2.5 kg. Standards and blanks are inserted every 50th sample and the assays are conducted using PPM’s internal laboratory on site. The assay results are not used for grade control estimation.
Hard copies, as well as electronic records of surveyed hole positions, stratigraphy and sampling are kept, as well as chip tray samples. All data is stored electronically in the SABLE database and linked to grade modelling software (SURPAC).
SRK has reviewed the sampling procedures and notes its consistency to conventional practise in the BC.
| 6.3 | Hydrogeology Characterization |
[§229.601(b)(96)(iii)(B)(7)(iii)] [SR3.1(i)] [SR4.3(ii)]
The hydrogeology of the area is characterized by four key hydrostratigraphic units:
| 1. | A localised shallow aquifer, which is associated with a primary alluvial and weathered aquifer zone adjacent to the rivers and non-perennial streams. In some areas, this zone is underlain by a clay aquitard where it forms wetlands, which are not groundwater supported; |
| 2. | A weathered and fractured aquifer that is pronounced in topographically low-lying areas. This is an important aquifer zone for community water supply. The weathered norite/gabbro forms a low potential aquifer and is approximately 20-40 m thick and exhibits only secondary porosity, from the weathering and fracturing. Depths of weathering vary in the study area and increases towards the drainages and southwards; |
| 3. | Discrete sub-vertical fault and fracture zones that form major aquifers in the study area. Groundwater potential is enhanced along several north-south trending faults associated with major post intrusive faulting during the Pilanesberg volcanic emplacement; and |
| 4. | A fractured/solid bedrock (norite/gabbro) aquifer that underlies the weathered zone. |
The communities surrounding the mining area rely on groundwater as a source of potable supply; 59% of the area’s boreholes are utilised by the inhabitants for water supply purposes. Nine new boreholes will be handed over to the communities to augment their water supply (Moses Kotane Pilanesberg Bulk Water Supply Scheme):
Water levels measured at boreholes surrounding the proposed mining area ranging from 9.2 to 41.1 m below ground level (mbgl) and the hydraulic gradient slopes from the south-west to the north-east.
Field hydraulic parameters for the hydrogeological assessment and numerical modelling were acquired through pumping tests and packer testing, which are recognised methodologies. A 3D numerical groundwater flow model was developed using the FeFlow code to simulate the potential impacts on the groundwater quantity, to provide recommendations on monitoring and management measures. The flow model, based on the site information, simulated the groundwater flow direction and velocities, inflow rates and the radius of influence of the mine dewatering.
The 3D model predicted maximum unmitigated inflows of 1 300 m³/d (East Pit), and inflows of 3 300 m3/d and 8 000 m3/d for Central and East Underground Blocks respectively.
The assumptions which form the basis of the numerical model are, by and large, standard for such models. The hydraulic parameters used in the model (hydraulic conductivity, storage) are appropriate for the hydrostratigraphy, and within the ranges provided in literature. SRK opinion is that the recharge estimate (1-2.5% of mean annual precipitation) used in the model should be higher (7-10%), based on its work in adjacent and similar environments. There is no packer testing data for depths below 400 m, yet the model is based on the assumption that groundwater flow is largely controlled by structures at depth. Fault zones were defined as highly conductive within the structure but acting as barriers to flow in the direction perpendicular to the structure.
The gaps in direct data from the site may result in underestimation of the projected groundwater inflow rates and prediction of impacts on local groundwater resources. This should be investigated as part of the Company’s planned drilling programme.
| SRK | Report date: 27 May 2022 |
| | Effective Date: 31 December 2021 |
| | |
| SRK Consulting – 576060 SPM PSM Project TRS | Page 44 |
| 6.3.1 | Water Quality Testing Quality Assurance |
The water quality of the area was assessed (every quarter since 2016) by the collection of water samples, using best practice methodologies, for inorganic analysis, at Aquatico Laboratories which has been accredited for compliance to ISO 17025:2017 by South African National Accreditation System (SANAS). The facility reference number is T0685 and the laboratory has held accreditation since 2015. SRK’s opinion is that the data review and field data collection were carried out in line with industry standards. The interpretation of groundwater quality data used appropriate techniques (Piper diagrams) and classification (SANS241) to characterize the quality.
Part of the ISO 17025 requirements is participation in a relevant proficiency testing scheme (PTS). Aquatico partakes in the water check PTS facilitated by the South African Bureau of Standards (SABS). Samples are prepared by the SABS and analysed by the participating laboratories. For certain parameters as many as 170 laboratories partake on a regular basis. Results are compared by the SABS and reported on to the participants. The SABS is accredited as a PTS provider (reference PTS0003) by SANAS, according to requirements of ISO 17043:2010.
An extensive groundwater monitoring network, comprising 57 boreholes, is in place at PPM to identify any potential impacts from mining. SPM appointed an independent company to sample, analyse and interpret the water quality, in accordance with the WUL. Quarterly and annual reports are submitted to PPM.
The assessment of groundwater chemistry monitoring data showed the presence of elevated fluoride, nitrate and nickel concentrations. The elevated F originates from the fluoride-rich geological environment (rhyolite and foyaite), while the elevated NO3-N can be associated with mining activities at PPM. Ni is associated with the MR and to a lesser extent with the UG2 and is the source of the elevated Ni within the groundwater environment.
A water balance was compiled for PPM in 2017 and has been updated annually since. The 2021 water balance was submitted in September 2021, although there are some discrepancies between the collected data and what is actually occurring in the plant which still have to be resolved. The Sedibelo Project has been incorporated into the water balance; and the model will be calibrated during the next few years as data becomes available.
| 6.4 | Geotechnical data, testing and analysis |
[§229.601(b)(96)(iii)(B)(7)(iv)] [SR3.1(i)] [SR4.3(ii)]
| 6.4.1 | East and West Open Pits |
Drilling and logging
An orientated core drilling programme was carried out under supervision of a geotechnical field engineer, with HQ triple tube coring methods and applied, and core orientation via the EZY-mark® system. A total of nine orientated drill holes were recorded for geotechnical purposes, drilled from three locations in the north-east, east and west of the East Pit, as indicated in Figure 6.4. Further to this, eight inclined and orientated core holes were drilled in the Tuschenkomst area in 2007. These holes were geotechnically logged and sampled for Point Load Index Testing (PLT). Geotechnical core logging followed accepted standards with core logs produced for Bieniawski RMR classifications carried out. Core recoveries were on average good, but it should be noted that areas of poor recovery and core loss were logged, with 90% of the orientation measurements coming from good core. This is considered normal, as core orientation is often not possible in altered or fractured core zones.
Information recorded for each drill run includes:
| • | Rock Quality Designation (RQD); |
| • | Number of discontinuities; and |
Additionally, the following information was recorded for each geological segment/geotechnical zone:
| • | Lithological description; |
| • | Intact rock strength estimation (from field hardness classification); |
| SRK | Report date: 27 May 2022 |
| | Effective Date: 31 December 2021 |
| | |
| SRK Consulting – 576060 SPM PSM Project TRS | Page 45 |
| • | Number of discontinuities; |
| • | Depth (from/to) measurement for each discontinuity; |
| • | Orientation of each measured discontinuity (alpha and beta angles); |
| • | Type and general character of each measured discontinuity; |
| • | Joint conditions description (roughness, waviness, aperture, infilling, joint wall alteration, etc.); |
| • | Infill type and thickness; and |
Drill core was photographed after logging, and representative samples taken for laboratory rock strength testing.
| SRK | Report date: 27 May 2022 |
| | Effective Date: 31 December 2021 |
| | |
| SRK Consulting – 576060 SPM PSM Project TRS | Page 46 |
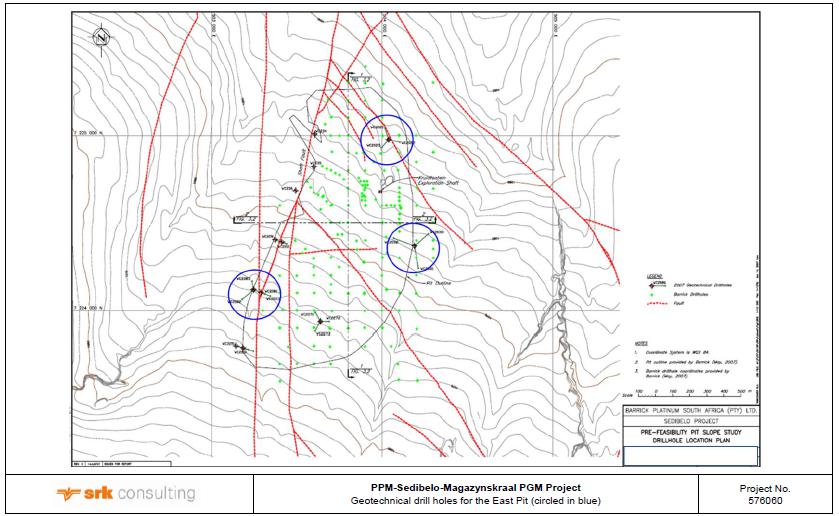
Figure 6.4: Geotechnical drill holes for the East Pit
| SRK | Report date: 27 May 2022 |
| | Effective Date: 31 December 2021 |
| | |
| SRK Consulting – 576060 SPM PSM Project TRS | Page 47 |
Soil Profiling
In the West (adjacent to the West Pit) and East Portal areas, soil profiling and sampling was carried out in test pits as part of the 2008 FS. Test pit locations are shown in Figure 6.5
At the West Portal, large volumes of overburden and waste material from the adjacent pit will have to be removed prior to excavation of the boxcut and portal and before any earthworks for the surface infrastructure are done. Test pit TP 4 was excavated at this position prior to material being dumped and this indicated that 1.2 m of black clay (turf) is present above highly weathered, soft rock norite.
in the East Portal area, test pits TP30, TP28, TP31 and TP29 are of relevance to the open pits. TP29 appears to be positioned in alluvial sandy clay, while the other three test pits indicate a 0.9 – 1.4 m layer of black clay overlying residual norite that is described as silty to gravelly sand in TP28. At TP30 and TP31 refusal occurred on rock immediately underlying the black clay. Over the area of the open pits, it is reported that refusal occurred at depths of 0.9 – 1.6 m.
It is not clear what testing (other than particle size analysis) was carried out or whether tests were successful on samples taken during the test pitting. However, it can be reasonably assumed that the soil profile is shallow, underlain by residual to unweathered norite/gabbro-norite at depths of 0.9 – 1.6 m in the area of the open pits. For the underground mining areas, the soil profile was not considered, other than in the portal areas, as discussed above.
Laboratory strength testing
Intact rock strength tests consisted of Unconfined Compressive Strength (UCS) tests carried out at the Rocklab (Pty) Ltd (Rocklab) rock mechanics laboratory in Pretoria, South Africa. Samples were also submitted to Rocklab for direct shear tests on joints, base friction angles tests, triaxial tests at appropriate confining stresses, and Brazilian tensile strength tests. It must be noted that only the UCS test results were available at the time of the mine design studies. Additionally, core samples were taken from the drill holes in the saprolite horizon for particle size analysis at Soillab (Pty) Ltd, of which Rocklab is a division. Both are fully accredited laboratories.
UCS testing
Samples were obtained from each of the main lithology units, and a total of 63 UCS tests successfully completed, with UCS values and deformation moduli determined for 57 tests. The remaining six tests only provided UCS values, without elastic properties.
The average UCS values ranged from 70 MPa to 170 MPa for unweathered rock, while the average value in the weathered rock was 25 MPa. The average Young’s Modulus secant values in the unweathered rock ranged from 50 GPa to 120 GPa, while average Poisson’s ratio values ranged from 0.21 to 0.28.
The UCS estimates from PLTs from the Tuschenkomst drill campaign varied from 92 MPa (strong rock) to 260 MPa (extremely strong rock) in the unweathered lithological units, correlated well with laboratory test results.
Particle size analysis
Particle size analysis was carried out on three saprolite samples, with particle size distributions, hydrometer limits and Atterberg limits determined for all three samples.
Soil material description
The black clay (turf) is described as an expansive clay occurring ubiquitously across the project area to depths of generally 1.2 to 1.7 m, although locally it may occur to 2.5 m. It should be noted that this material is not considered suitable for foundations, layer works or any other load bearing structures.
Where alluvial sandy clay occurs, it is described as variable between medium and high expansiveness and it is similarly considered unsuitable for any load bearing structures.
The residual gabbro-norite generally consists of sandy soils with varying amounts of clay and gravel present. The TLB reached refusal in this material very quickly and therefore it was not exposed to any great extent in the test pits. It is described as varying from soft to medium hard rock, with variable weathering on structure and containing unweathered core stones. For surface mining purposes, it is considered that once refusal is reached, normal drill and blast operations will be required, and that the limited extent of the free-dig profile (generally up to 1.7 m, locally up to 2.5 m) will have little impact on the overall slope stability.
| SRK | Report date: 27 May 2022 |
| | Effective Date: 31 December 2021 |
| | |
| SRK Consulting – 576060 SPM PSM Project TRS | Page 48 |
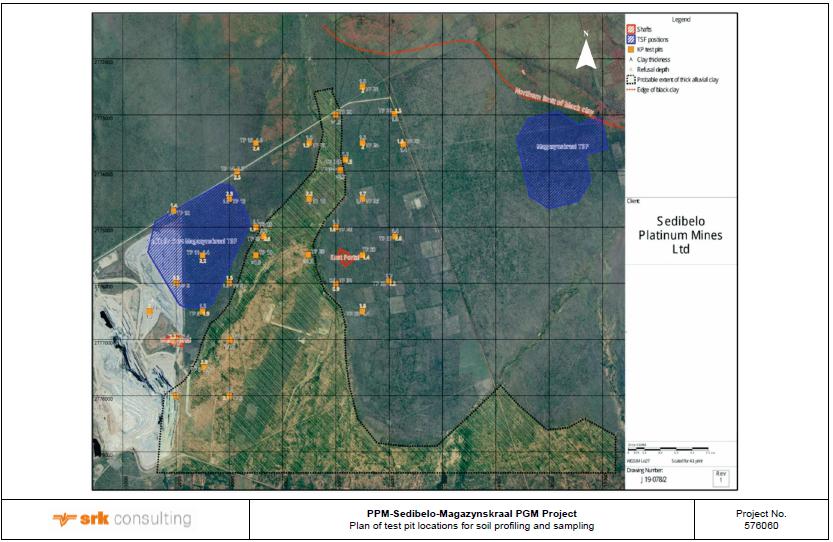
Figure 6.5: Plan of test pit locations for soil profiling and sampling
| SRK | Report date: 27 May 2022 |
| | Effective Date: 31 December 2021 |
| | |
| SRK Consulting – 576060 SPM PSM Project TRS | Page 49 |
Rock mass classification
Bieniawski rock mass ratings (RMRs) were applied to summarise the geomechanical characteristics of the Sedibelo rock masses, with groundwater conditions assumed as dry during the logging, to avoid double accounting for water conditions in the subsequent stability analyses.
The resulting overall rock mass classification for the unweathered rock was FAIR to GOOD, with RMR values ranging from 58 to 72, while the classification for the weathered rock was POOR, with an average RMR value of 27.
Rock mass fabric
The general structural character of the rock mass is extensively jointed, with small scale structural features (fabric) measured from the 2007 orientated drill core. Joint classifications by orientation were carried out by stereographic analysis and are well defined. Joint spacings were determined directly from the drill core, with mechanical core breaks ignored as far as possible, resulting in well define joint spacing and fracture frequency measurements.
Persistence of the discontinuities cannot be determined from drill hole data alone. Therefore, persistence was conservatively assumed at >20 m for all discontinuities. This should be validated against pit face exposures. Roughness, waviness and infilling were directly described from the drill core in accordance with the parameters and definitions considered in the Bieniawski classification system.
Joint shear strength results from laboratory testing were not available; thus, a mean residual friction angle of 35° was applied for the slope design study. This value should be validated against test results in the future, as it may have a significant effect on the results of slope stability, and underground stability and support design analyses.
| 6.4.2 | Central and East Underground Blocks |
Geotechnical data acquisition occurred between 2006 and 2011 which comprised logging of unoriented core, rock strength testing and downhole geophysical surveys, which is considered suitable for a PFS level of accuracy.
Drilling and logging
There were 125 drill holes drilled across the P-S-M Project area, with diameters of HQ size or NQ size as indicated. Figure 6.6 shows the drill hole locations (blue circles), faults (red lines) and dunite and IRUP intrusions (orange shaded areas). Core recoveries were above average and acceptable logging standards were followed by suitably qualified personnel.
Core was geotechnically logged from the Merensky hangingwall pyroxenite (10 m above MR) to the UG2 footwall pyroxenite (5 m – 10 m into the UG2 footwall). Basic parameters were recorded which allowed for the derivation of rock mass classifications, Q Index and RMR. Logging intervals generally ranged between 3 m and 6 m with minor instances (<8% of the data) where intervals were less than 2 m in length. The following parameters were recorded for each logging interval:
| • | Depth (from/to) measurement of each interval; |
| • | Lithological description; |
| • | Intact rock strength estimation (from field hardness classification); |
| • | Type of discontinuities; |
| • | Type and general character of each discontinuity, such as: |
| o | Infill type and thickness, and |
| SRK | Report date: 27 May 2022 |
| | Effective Date: 31 December 2021 |
| | |
| SRK Consulting – 576060 SPM PSM Project TRS | Page 50 |

Figure 6.6: Plan view of drill hole locations on Sedibelo and Magazynskraal
| SRK | Report date: 27 May 2022 |
| | Effective Date: 31 December 2021 |
| | |
| SRK Consulting – 576060 SPM PSM Project TRS | Page 51 |
Nineteen of the drill holes were surveyed using the Acoustic Televiewer Probe (ATV) to supplement the database with discontinuity orientation data. The hangingwall of the Pothole reef is traversed by four joint sets and the UG2 by five with the sporadic occurrence of a low angled joint set on both horizons.
From the rock mass rating results in Table 6.3, the following can be deduced:
| • | The data used for the rock mass classification was evenly distributed across the mining area; and |
| • | Ground conditions range from poor to good, which has been considered in the support design. |
Table 6.3: Rock mass ratings for the project area
| Lithological Unit | RMR89 | Q |
| Merensky HW | MRH2 | 71.72 | 5.06 |
| MRH1 | 70.18 | 3.51 |
| Merensky FW | MRF1 | 73.06 | 4.48 |
| MRF1BOUL | 75.87 | 5.56 |
| Pseudo Reef | UPR2 | 69.54 | 7.41 |
| PRHZB | 70.18 | 3.68 |
| LPR2 | 70.88 | 4.80 |
| UG2 HW | U2H4 | 70.93 | 3.39 |
| U2H3 | 73.23 | 4.91 |
| U2H2B | 74.30 | 5.71 |
| U2H2A | 72.86 | 5.55 |
| U2H1 | 70.31 | 5.49 |
| UG2 | U2L | 70.87 | 5.02 |
| U2P | 68.36 | 4.84 |
| U2 | 70.31 | 4.00 |
| U2PH | 71.56 | 4.10 |
| U2LP | 75.09 | 3.77 |
| UG2 FW | UG2PEG | 77.32 | 3.63 |
| U2F1PX | 71.07 | 3.15 |
| U2F1AN | 69.92 | 3.75 |
| U2F3 | 72.11 | 3.11 |
| UG1 | U1U | 71.96 | 3.41 |
| U1P | 72.92 | 3.32 |
| U1L | 69.04 | 4.98 |
| UG1 FW | U1F1 | 76.99 | 4.05 |
| U1F2 | 74.47 | 3.47 |
| U1F3 | 76.91 | 3.73 |
| U1F4 | 75.36 | 3.91 |
Laboratory strength testing
The rock testing programme consisted of 240 UCS tests and 25 Triaxial Compressive Strength (TCS) tests across the significant lithologies. Tests were performed by The University of Witwatersrand in 2006 and by Rocklab RSA in 2006, 2010 and 2011. Both facilities are accredited and reputable with tests being conducted according to the industry accepted International Society for Rock Mechanics (ISRM ) suggested methods. A summary of the UCS results for the Central and East Underground Blocks are provided in Table 6.4 and Table 6.5, respectively. The average Young’s Modulus secant values ranged from 40 GPa to 150 GPa, while average Poisson’s ratio secant values ranged from 0.21 to 0.33, depending on the rock type. The test results indicate values that are representative of typical rock strengths found in the BC.
| SRK | Report date: 27 May 2022 |
| | Effective Date: 31 December 2021 |
| | |
| SRK Consulting – 576060 SPM PSM Project TRS | Page 52 |
Table 6.4: Summary of strength test results – Sedibelo
| Lithological Unit | UCS Young’s Modulus (GPa) |
| Average | Min | Max | Standard Deviation |
| Merensky HW | 162.08 | 129.72 | 194.44 | 32.36 |
| Pseudo Reef | 77.95 | 46.10 | 109.80 | 31.85 |
| Tarentaal | 145.09 | 99.41 | 190.77 | 45.68 |
| Merensky FW | 173.02 | 141.21 | 204.83 | 31.81 |
| UG2 HW | 173.61 | 125.93 | 221.29 | 47.68 |
| UG2 | 87.61 | 61.18 | 114.04 | 26.43 |
| UG2 FW | 172.06 | 133.43 | 210.69 | 38.63 |
Table 6.5: Summary of strength test results – Magazynskraal
| Lithological Unit | Rock Type | UCS (GPa) |
| Average | Min | Max | Standard Deviation |
| BH1 | Norite | 202.68 | 133.51 | 250.79 | 41.40 |
| BH2 | Anorthosite | 156.55 | 102.40 | 210.43 | 40.66 |
| BH3 | Mottled Anorthosite | 185.53 | 114.06 | 243.96 | 45.23 |
| BR2 | Feldspathic Pyroxenite | 146.92 | 20.48 | 203.45 | 59.13 |
| MRH1 | Anorthosite | 122.68 | 49.57 | 201.41 | 44.57 |
| PRHZB | Harzburgite | 133.22 | 39.75 | 204.57 | 35.85 |
| LPR2 | Olivine Pyroxenite | 104.76 | 24.68 | 154.71 | 28.50 |
| U2H2 | Pyroxenite | 145.51 | 64.09 | 201.00 | 54.85 |
| U2H3 | Feldspathic Pyroxenite | 164.71 | 101.10 | 207.11 | 30.41 |
| U2H2A | Olivine Pyroxenite | 170.48 | 86.76 | 244.14 | 39.61 |
| U2 | Chromitite | 73.71 | 11.81 | 149.04 | 32.92 |
| U2PEG | Pegmatite | 140.91 | 123.53 | 168.72 | 19.09 |
| U1F2 | Norite | 181.14 | 95.47 | 223.79 | 36.82 |
A summary of the data collection techniques and quality control measures applied is shown in Table.
Table 6.6: Data collection techniques and quality control measures
| Date | Geotechnical task | QA/QC method | Used in
design | Qualifications of Responsible
Person |
| August 2006 | Scanline mapping | Cross check between Geologist & SCO | No | BSc (Hons) (Geology) |
| November 2006 | Laboratory rock tests - UCS | Completed by Rocklab RSA ISRM standards | Yes | PhD (Rock Mechanics), COM Cert Rock Eng |
| November 2006 | Laboratory rock tests – UCS, TCS | University of Witwatersrand ISRM standards | Yes |
| July 2007 | Drill hole camera logging of trial mining up holes | Completed by Rock Engineer | No | NHD (Mining), COM Cert Rock Eng |
| February 2008 | Geotechnical logging of unoriented core | Spot checks by Independent Consultant | Yes | COM Strata Control Certificate |
| November December 2010 | Laboratory rock tests - UCS, TCS | Completed by Rocklab RSA ISRM standards | Yes | PhD (Rock Mechanics), COM Cert Rock Eng |
| February 2011 | Point load testing | ISRM standards for point loads | No | COM Strata Control Certificate |
| February 2011 | Laboratory rock tests - UCS, TCS | Completed by Rocklab RSA ISRM standards | Yes | PhD (Rock Mechanics), COM Cert Rock Eng |
| SRK | Report date: 27 May 2022 |
| | Effective Date: 31 December 2021 |
| | |
| SRK Consulting – 576060 SPM PSM Project TRS | Page 53 |
| 7 | SAMPLE PREPARATION, ANALYSES AND SECURITY |
[§229.601(b)(96)(iii)(B)(8)] [SR3.4, SR3.6, SR4.1]
| 7.1 | Sample preparation methods and quality control measures |
[§229.601(b)(96)(iii)(B)(8)(i)] [SR3.4, SR3.5, SR3.6]
The approach to packaging of samples despatched for assay analysis was generally consistent across the projects, operations and the different periods under which they occurred:
| • | Each of the half core samples was placed in a separate plastic bag with an identity tag prior to it being heat-sealed; |
| • | A second identity tag was attached externally to the heat-sealed plastic having the corresponding primary identity tag; |
| • | Blanks, Certified Reference Materials (CRMs) and duplicates at varying rates were inserted into the sample stream following the same packaging guidelines/instructions as described in the previous two bullets; |
| • | The number of samples that constituted a batch also varied across projects and period. However, each batch of samples was then packed into separate large sacks/bags; |
| • | Each sack was subsequently strap-locked (in some instances using security tags) and transported from the site to the assay laboratory; and |
| • | The laboratory inspected the security tags and signed off on the submittal sheet, confirming the integrity of the tags. |
It is SRK’s opinion that the above approach is satisfactory and consistent with conventional benchmarks employed by most operating mines in the BC.
| 7.2 | Sample preparation, assaying and laboratory procedures |
[§229.601(b)(96)(iii)(B)(8)(ii)] [SR3.4, SR3.5]
This section should be read in conjunction with Section 6.2.1 and Figure 6.1.
Platmin – pre 2008 samples (Phase 1-Phase 3)
The sample preparation and analysis were completed at SGS Lakefield Laboratory Services (SGS Lakefield) in Johannesburg which was accredited by SANAS with accreditation number “T0169”. SGS Lakefield is independent of the Company, as is all the other external laboratories mentioned in this report.
The samples were received in SGS Lakefield’s sample preparation room in batches enclosed in cloth bags containing the individual samples in separate plastic bags. For the most part, no drying was required because the samples were all diamond core that had been dried in sunlight during the logging and sampling process.
The samples were then crushed with a jaw crusher. The equipment had good bottom extractor fans to prevent dust contamination. The crushers, rifflers and collectors were thoroughly cleaned with air between samples. The crushed sample was then pulverised in mills which were cleaned between each sample.
The milled sample was taken to the fluxing area and a known sample mass measured directly into a weighing bowl. The sample was then added to the flux in a numbered crucible that had been prepared before. The weighing bowl was cleaned with a brush between samples. The crucibles were laid out numerically on the transport trolley. Silver nitrate was then added, and a coppering agent according to a predetermined pattern.
The half cores were submitted for the following analysis at SGS Lakefield:
| • | Pt, Pd, Au: all samples determination using Pb-Ag collector and Inductively Coupled Plasma Optical Emissions Spectrometer (ICP-OES) and Inductively Coupled Plasma Mass Spectrometry (ICP-MS); |
| • | Rh (separate lead fusion fire assay using Pb-Pd as a collector): selected samples at reef horizons or erratic mineralization identified in core (e.g., mineralization in mottled anorthosite); |
| • | Ni, Cu (aqua regia leach with atomic absorption spectrometer (AAS) finish): MR, UPR and LPR; |
| • | Cr and Fe were determined for selected (25% - 50% of intersections) intersections of the UG2 Chromitite unit by X-Ray Fluorescence Spectroscopy (XRF); |
| • | Determination of Pt, Pd, Rh, Ru and Ir by Nickel Sulfide (NiS) fusion followed by ICP-OES; and |
| SRK | Report date: 27 May 2022 |
| | Effective Date: 31 December 2021 |
| | |
| SRK Consulting – 576060 SPM PSM Project TRS | Page 54 |
| • | NiS analyses on drill core (which included Ru and Ir) - Samples from a limited number of drill hole intersections were submitted to Genalysis Laboratory Services (Pty) Ltd (Genalysis) in Perth Australia for 5PGM+Gold (6E) analysis by fire assay with NiS collection. Genalysis is an accredited NATA (National Association of Testing Authorities, Australia) laboratory (Number 3244) and independent of SPM. The samples were also analysed for Ni and Cu using a sodium peroxide fusion with strong acid digestion (which effectively gives total values) and also a very weak leach known as the PA2 leach (a hydrogen peroxide and ascorbic acid leach intended to remove only sulfide Ni and Cu which were determined by ICP-OES). These numbers provided a check on the aqua regia digestions with AAS determination routinely done at Lakefield. Limited other elements, including Fe and Cr were also determined using the sodium peroxide fusion and strong acid digestion technique. |
These analyses confirmed the presence of other economically important metals, such as Ru and Ir in mineralized reefs and zones. Due to the historically low prices for the minor PGMs such as Ru and Ir and the high cost of NiS fire assay techniques, these were not routinely assayed during the exploration programme.
The general procedure used during soil sampling followed in this sequence:
| • | Soil is dried and sieved; |
| • | A -500 µm fraction is submitted for Pt, Pd, Au, Ni, Cu, Co and Cr analysis to Ultratrace; and |
| • | Pt, Pd, Au concentrations are determined by fire assay and ICP-MS finish whilst Ni, Cu, Co and Cr are determined by sodium peroxide fusion, strong acid digestion and ICP-OES finish. |
Sedibelo-West (Barrick) samples
The Sedibelo-West drill holes formed part of Barrick’s Sedibelo Project.
Half drill core samples were submitted to the Genalysis preparation laboratory in Johannesburg for sample preparation. The following approach was adopted:
| • | Dry total sample after crushing was pulverised in LM5 pulveriser for four minutes to a nominal 90% passing 75 μm; |
| • | Packaging of two laboratory assay pulps in paper sample envelopes; and |
| • | Storage of balance of bulk pulp separately in new plastic containers. |
One laboratory pulp was submitted to Genalysis (Perth) for Pt, Pd, Au, Cu and Ni assaying, the second pulp was submitted to SGS Lakefield for Rh fire assay.
Routine analysis was undertaken by Genalysis as follows:
| • | Nominal 25 g lead sulfide collection fire assay in new crucible and ICP-MS for Au (1 ppb detection limit), Pt (1 ppb) and Pd (1 ppb). Method code FA25MS; |
| • | 1 g aqua regia digest and flame AAS for Ni (1 ppm) and Cu (1 ppm); and |
| • | In addition, initially 10% of samples were analysed for all PGMs by nominal 25 g nickel sulfide collection fire assay in new crucible and ICP-MS finish, method code NiSMS. Lower detections limits for this method were Au (5 ppb), Pt (2 ppb), Pd (2 ppb), Rh (1 ppb), Ru (2 ppb), Ir (2 ppb) and Os (2 ppb). |
Pulp duplicate analysis was undertaken by SGS Lakefield for Pt, Pd, Rh and Au by 30 g fire assay lead collection with ICP-MS finish (method code FAM313).
PPM - 2011 samples
Half core submitted to the SGS Lakefield preparation laboratory in Rustenburg underwent the following routine:
| • | The entire dry total sample was crushed using a jaw crusher to 80% passing 2 mm. Extractor fans were in place to prevent dust contamination. The crushers, rifflers and collectors were cleaned with air between samples. Crushers were cleaned with compressed air and silica waste rock (Blank) after every sample. This Blank material was analysed and reported as part of the sample stream; |
| • | An assay sub-sample was split from the original crushed sample and pulverised to 90% passing 75 μm. The mill was cleaned with compressed air and cleaning sand after each sample; |
| SRK | Report date: 27 May 2022 |
| | Effective Date: 31 December 2021 |
| | |
| SRK Consulting – 576060 SPM PSM Project TRS | Page 55 |
| • | The pulp was then transferred by SGS Lakefield to its Johannesburg laboratory for PGM and base metals assay analysis; and |
| • | The remaining pulp was returned to PPM. This pulp was stored in paper bags in boxes per sampling batch in PPM’s core shed facility in Mogwase. |
The split half cores submitted to SGS Lakefield were routinely analysed for:
| • | Pt, Pd, Rh, Au by 30 g fire assay NiS Collection with ICP finish, (method code FAI363). Each batch of 24 samples contained one CRM or in-house standard, one reagent Blank and two Duplicates samples from the same batch; |
| • | Cr and Fe by XRF for selected UG2 chromitite unit intersections; and |
| • | Cu and Ni by aqua regia digestion with flame AAS analysis. A typical sample aliquot of 0.5 g was used with a lower detection limit of 5 ppm. |
Pulp duplicate analysis was undertaken by Genalysis using Pt, Pd, Rh and Au by 25 g fire assay NiS Collection with ICP MS finish (method code NiSMS).
The analytical process/method described for the Barrick samples under “Sedibelo West” (i.e., section 7.2 above) is applicable for all the samples within the footprint of the Sedibelo property.
| 7.2.3 | Magazynskraal Project |
Samples originating from the Richtrau drilling programme (Figure 6.3) followed the same routine as described under section 7.2 for the “PPM-2011” samples; the only notable difference is that the remaining pulp was returned to Richtrau and not PPM.
The AngloPlats samples were treated the same way as the Barrick samples.
| 7.3 | Quality assurance and quality control measures |
[§229.601(b)(96)(iii)(B)(8)(iii)] [SR3.5(i), SR3.6(i)]
PGM
SRK reviewed the Quality Assurance / Quality Control (QA/QC) dataset for PPM and Ruighoek in 2008.The QA/QC dataset for the West Pit was reviewed by an independent consultant in November 2010. A similar independent review was conducted in 2011.
The 2008 QA/QC dataset provided to SRK comprised CRMs and Blanks. Three CRMs, namely AMIS 0027, AMIS 0107 and AMIS 0074 constitute this dataset. SRK reviewed the Pt and Pd results, which were assayed using the NiS ICP-MS assay technique. SRK noted that the laboratory mean assay values for AMIS 0027 and AMIS 0107 are confined within the two standard deviation acceptable limits for Pt. AMIS 0074 shows a positive bias with the laboratory mean value outside the confines of the two standard deviation limits; SRK notes that it is only one outlier contributing to this failure. In total, three of the batch results for Pt show anomalies exceeding the acceptable limit of two standard deviations. In the case of Pd, the laboratory mean assay value of the CRMs falls within the two standard deviations limits of the expected value. The 2010 review associated these failures to mislabels rather than assay laboratory processes.
Duplicates
Subsequent to April 2007, there is no record of duplicate samples. Duplicate analysis of PPM (original pit) was compiled by SRK in April 2007. A summary of SRK’s findings in April 2007 is as follows:
| • | A statistical comparison of primary assay results from SGS Lakefield and their associated duplicate assay results from Genalysis showed a strongly positive correlation for the 3PGMs and Au (Table 7.1); |
| • | The ranked Half Absolute Relative Difference (HARD) plots showed that there is a high degree of precision for Pt with approximately 90% of the paired data showing HARD values of 6% or less; |
| • | The ranked HARD plots showed that there is a high degree of precision for Pd with approximately 90% of the paired data showing HARD values of 8% or less; and |
| SRK | Report date: 27 May 2022 |
| | Effective Date: 31 December 2021 |
| | |
| SRK Consulting – 576060 SPM PSM Project TRS | Page 56 |
| • | These HARD values are indicative of a high degree of assay repeatability. |
Table 7.1: Primary assays (SGS Lakefield) vs check assays (Genalysis)
| Statistic | Au | Au | Pt | Pt | Pd | Pd | Rh | Rh |
| (SGS-L) | (Genalysis) | (SGS-L) | (Genalysis) | (SGS-L) | (Genalysis) | (SGS-L) | (Genalysis) |
| Count | 150 | 150 | 150 | 150 | 150 | 150 | 141 | 141 |
| Average | 0.15 | 0.15 | 2.75 | 2.89 | 1.29 | 1.29 | 0.3 | 0.33 |
| Minimum | 0 | 0 | 0 | 0.02 | 0 | 0.01 | 0 | 0 |
| Maximum | 1.7 | 1.74 | 25.5 | 28.75 | 10.9 | 11.53 | 1.9 | 2.08 |
| Std Dev | 0.23 | 0.25 | 3.67 | 3.92 | 1.66 | 1.66 | 0.36 | 0.39 |
| CoV | 1.56 | 1.66 | 1.33 | 1.36 | 1.28 | 1.29 | 1.22 | 1.2 |
Blanks
The laboratory assay results for all the blanks analysed are reported at 0.005 ppb in the QA/QC dataset. SRK was notified via email that this result is subsequent to the rectification of anomalous (outliers) blank assay results, which was due to the swopping of sample numbers. The independent 2010 review showed the grade variability in the blank results. It can therefore be concluded that the tracking system in place in determining outliers or possible contamination is effective.
Chrome
Chrome was analysed using XRF spectrometry. Table 7.2 shows a summary of the CRM results. The “% within threshold” column is a measure of the percentage of CRM assay results falling within two standard deviations of the certified value. SRK expects that 95% of the samples analysed should fall within two standard deviations of the certified value in order to consider the assay repeatability acceptable. Any results not meeting this threshold are an indication of a lack of precision.
Bias is a measure of accuracy and is defined as the difference in value between the certified and assay mean values relative to the certified value as expressed in percentage. SRK considers any results with a bias greater than or equal to 5% (i.e. absolute value) to be material enough to impact on the accuracy of the assay dataset. It is SRK’s opinion that assay results in a certified grade range of AMIS0107 is associated with poor precision and inaccuracies.
Table 7.2: West Pit chrome CRM analysis
| CRM | No: of Samples | Certified value | Average analysis | % within threshold | % Bias |
| AMIS0107 | 33 | 0.42 | 0.45 | 34% | 7% |
| AMIS0074 | 22 | 7.12 | 7.28 | 76% | 0% |
| AMIS0006 | 14 | 7.89 | 8.19 | 92%% | 4% |
| AMIS0027 | 53 | 13.74 | 13.88 | 100% | 1% |
The detection limit of chrome using the XRF79V analysis is 0.01%. The industry norm for contamination is a threshold value of 0.1% which is 10 times the detection limit. It is noted that of the 23 Blank samples analysed (AMIS0166) only one exceeded the threshold. Although the sample population is relatively small, there is indication that cross contamination is generally minimal, and thus not a material issue.
There is no duplicate assay dataset available for review. SRK is therefore not able to comment on the repeatability of the dataset.
There are no base metal QA/QC data or report available for review.
PGM
SRK has reviewed the independent 2011 QA/QC report and is satisfied with the findings.
The dataset includes Sedibelo Central and Sedibelo West data which cannot be separated out easily. Focus is placed on the Pt and Pd results as these elements are the greatest contributors to the mineralization.
The PGM assay techniques applicable at the West Pit are the same as employed for the Sedibelo project.
The data is spatially integrated with no drill hole having primary samples assayed by more than one technique. The percentage of the data analysed using the different techniques is detailed in Table 7.3.
| SRK | Report date: 27 May 2022 |
| | Effective Date: 31 December 2021 |
| | |
| SRK Consulting – 576060 SPM PSM Project TRS | Page 57 |
Table 7.3: Sedibelo Project – Percentage of data analysed using various analytical techniques
| Variable | Total No of Records | Percentage of total number per technique |
| NISMS | FA25M | FAM31 | AAS13 | BTAAS | FAI35 |
| Pt | 1 244 | 3% | 87% | 10% | | | |
| Pd | 1 244 | 3% | 87% | 10% | | | |
| Rh | 4 889 | 8% | | | | | 92% |
| Au | 12 419 | 3% | 87% | 10% | | | |
| Cu | 12 162 | | | | 8% | 92% | |
| Ni | 12 178 | | | | 8% | 92% | |
Note:
FA25M - Pt, Pd and Au fire assay (FA) with Pb collection ICP-MS finish;
FAM31 - Pt, Pd and Au FA with Pb collection and ICP-OES finish;
FAI35 - Rh FA with Pd collection and ICP-OES finish;
NISMS- Pt, Pd and Au total acid digest with ICP-MS finish (Genalysis); and
BTAAS- Cu and Ni partial acid digest (Genalysis).
Most of the data was analyzed using the FA25M (for Pt, Pd and Au), BTAAS (for Cu and Ni) and FAI35 (for Rh) techniques.
Several CRMs were inserted with the primary core samples. All of the CRMs inserted were certified for both Pt and Pd using a fire assay technique. MR CRMs were submitted with the S1 (Merensky contact reef), UPR, PRHZB and LPR reef layers and UG2 CRMs.
SRK reviewed the CRM assay report for both Pt and Pd. Most of the CRMs used show accurate results with little or no bias relative to the certified values and standard deviations for both Pt and Pd. However, two CRMs (AMIS008 and AMIS0010) showed poor accuracy for Pt (but good accuracy for Pd) while a further two (AMIS0002 and SARM7B) showed poor accuracy for both Pt and Pd.
The following conclusions from the analysis of the CRM results were drawn:
| • | AMIS0002 is sourced from Platreef material (the local equivalent of the MR on the northern limb) which has a different composition to the MR. It is possible that the analytical method used in certifying the CRM is not the same as used for the analyses of the samples and this may be the reason for the poor accuracies; |
| • | The Pd results for MR CRM (SARM7B) reported poor accuracy but insignificant (1%) bias. MR CRM (AMIS0007) has a similar Pd grade to SARM7B which reported acceptably accurate values, so the poor accuracy seen in the SARM 7B Pd results is not considered significant; |
| • | The Pt results for MR CRM (SARM7B) report poor accuracy and a 6% bias towards lower than expected values. Unlike Pd, there is no other CRM in a similar grade range for Pt and therefore no conclusions regarding the CRM can be drawn. This CRM is the second highest grade MR CRM used; |
| • | The Pt results for MR CRM (AMIS0008) show poor accuracy and a bias towards lower (12%) results than expected from the certified value. This is the highest grade MR CRM used; and |
| • | The Pt results from UG2 CRM (AMIS010) reported poor accuracy and a bias towards results 3% lower than expected from the certified value. SARM71 is in a similar Pt grade range and, although the results for this CRM are slightly more accurate, also reports results -3% lower than expected from the certified value. |
It noted that the method for the characterization of the SARM standards statistically differs from the way the AMIS standards are characterized. SARM characterization is done on a mean of means, whereas AMIS represents the population of primary analyses.
The duplicate results were analyzed using HARD plots, duplicate plots, Q-Q plots and scatter plots. Pt and Pd show good correlation coefficients and little scatter on the duplicate plots. The HARD plot for Pt shows 83% of the data with a HARD value of less than 10% which is slightly lower than the 90% SRK expects for pulp duplicate samples. The Pd duplicates report more than 90% of the data with a HARD value of 10% of less. These results are backed up by the duplicate plots. The good pulp duplicate (Pt and Pd) precision is indicative of a low degree of error associated with the pulp sub sampling. SRK’s own analysis of the assay QA/QC results and compilation of the scatter plots (for Pt duplicates), HARD plots (for Pt) and Q-Q plots compare favourably with the reports provided by SPM. SRK considers that the degree of error associated with the pulp sub-sampling is immaterial.
| SRK | Report date: 27 May 2022 |
| | Effective Date: 31 December 2021 |
| | |
| SRK Consulting – 576060 SPM PSM Project TRS | Page 58 |
Blank samples were routinely submitted with the primary samples. Blank samples consisted of half core material from the Main Zone stratigraphic unit. Main Zone lithologies are generally not considered suitable for use as barren material as they often contain some background mineralization of both PGMs and base metals.
The blank sample results for both Pt and Pd were plotted, using a limit of 0.1 ppm as an upper acceptable limit for mineralization. For Pd, 2% of the blank sample analyses report grades in excess of 0.1 ppm indicating insignificant levels of contamination. For Pt, 10% of the blank sample analyzed report assay results in excess of 0.1 ppm; however, 2% report values in excess of 0.2 ppm. The Pt results could potentially indicate the presence of low levels of contamination for Pt but could also be reflecting background mineralization in the blank samples used. SRK does not consider the results of the blank samples submitted to be indicative of any significant cross contamination of samples.
QA/QC conclusions
The combined results for the two higher grade MR CRMs (SARM7B and AMIS0008) indicate a potential for the MR Pt results to be under-reported by between 6% and 12% at high grades. This should have been investigated because the bias observed in the CRM assay results is towards lower than expected results. The scale of this under-reporting for these specific CRMs relative to the accuracy for the other CRMs does not pose a significant risk to the overall Mineral Resource.
Chrome and base metals
There are no QA/QC records available for chrome since the drill hole samples were not analysed for chrome.
Table 7.3 does indicate data for Ni and Cu; however, the associated QA/QC results are not available.
| 7.3.3 | Magazynskraal Project |
PGM
The QA/QC dataset provided to SRK is made up of the following data:
| • | Assay results of blanks; |
| • | Assay results of duplicate samples: |
| • | Repeat assay results of blanks; and |
| • | Reports compiled by independent consultants. |
The measure of confidence in the assay dataset for resource estimation is informed by SRK’s independent review of the QA/QC dataset and the reports provided by SPM.
The QA/QC dataset is approximately 15% of the entire assay dataset of 15 796 records. Table 7.4 is a breakdown of the percentage composition of the QA/QC dataset.
Table 7.4: Magazynskraal – percentage composition of QA/QC dataset
| QA/QC composition | % composition with respect to Assay dataset |
| CRMs | 3% |
| Blanks | 5% |
| Duplicates | 6% |
SRK is of the opinion that for a green fields exploration project of this scale, the QA/QC dataset should constitute 30% of the assay dataset – 10% each for the CRMs, Blanks and Duplicates.
CRMs
AMIS 0027 and AMIS 0164 constitute the CRM dataset. SRK has analysed the results of only Pt and Pd, which are based on the NiS ICP-MS assay technique.
SRK noted that the mean assay results of each of the CRMs are confined within the two standard deviation acceptable limits. All the CRMs show a negative bias towards their expected CRM values with AMIS 0027 Pd showing the highest negative bias of 3%. It is also noted that three of the assayed results for AMIS 0027 exceed the acceptable limits.
| SRK | Report date: 27 May 2022 |
| | Effective Date: 31 December 2021 |
| | |
| SRK Consulting – 576060 SPM PSM Project TRS | Page 59 |
SRK notes similar trends in the reports by previous consultants for the CRMs under consideration and that no recommendations were made with respect to these CRMs. The reports indicate that the laboratory analytical accuracy appeared to be excellent for AMIS 0027 and AMIS 0164 certified grade ranges, for not only Pt and Pd but also for Au, Rh, Cu and Ni. Based on SRK’s independent review on Pt and Pd CRM analytical accuracy, SRK concurs with these findings. With the exception of AMIS 0034, SRK’s findings are similar to those arrived at by the previous consultants for all the other CRMs.
Duplicates
SRK’s scatter plots for Pt and Pd duplicate analyses shows a positive strong correlation between the pulp duplicate samples and the originals for Pt and Pd assay results. Most duplicate assays are within 10% of the results of the original samples and most duplicate assays that vary by more than 10% are at grades of less than 0.5 ppm.
It is SRK’s opinion that the laboratory precision is acceptable. The previous report arrived at the same conclusion for the duplicate analysis. Of all the PGMs + Au reviewed, the duplicate assays of Au show significantly greater variability beyond the 10% results of the original assays. This is because most samples reported values within the detection limit range.
SRK’s HARD plots for Pt and Pd shows 84% of the data with a HARD value of 10% or less which is slightly lower than the 90% SRK expects for pulp duplicate assays. However, by excluding data below 0.5 ppm, 90% of the data reports a HARD value of less than 5%.
Blanks
SRK notes that the Blank material was source from the Main Zone norite. The Blank control plots indicate poor accuracy with erratic and highly irregular results displayed for all PGMs. It is possible that the cross-contamination is likely due to the Main Zone norites having sporadic anomalous PGM metal concentrations; poor characterization of the blank material is more likely the cause of the erratic assay results. This conclusion is further supported by the following observation:
| • | Blank material inserted by the SGS laboratory for internal QA/QC checks consistently returned PGE and Au values below their respective detection limits; and |
| • | Cross checking of the assay data for the sample preceding the blank does not indicate any correlation between the grade of the preceding sample and the blank material, which is indicative of the fact that cross-contamination between samples is unlikely to be the issue. |
SRK’s opinion is based on interpretation from two QA/QC reports compiled by independent consultants, and not the underlying QA/QC data.
Chrome
Chrome was analysed using an XRF spectrometry. Table 7.5 summarises the CRM results.
Table 7.5: Magazynskraal chrome CRM analysis
| CRM | No: of Certified samples | Certified value | Average analysis | % within threshold | % Bias |
| AMIS0107 | 12 | 0.42 | 0.46 | 27% | 9% |
| AMIS0053 | 99 | 0.49 | 0.88 | 45% | 45% |
| AMIS0034 | 34 | 0.61 | 0.65 | 49% | 6% |
| AMIS0013 | 42 | 1.5 | 1.53 | 93% | 2% |
| AMIS0074 | 13 | 7.12 | 6.74 | 54% | -6% |
| AMIS0006 | 50 | 7.89 | 8.30 | 70%% | 5% |
| AMIS0027 | 242 | 13.74 | 13.96 | 99% | 2% |
Approximately 60% of the chrome blank assay results exceed the detection limit threshold as outlined under Section 7.3.1. The average grade of the blank assay data exceeding the threshold value is 0.55% (i.e., five times the threshold value). Considering that the average grade of the chrome raw assay dataset is approximately 14% (23% for the UG2), it is SRK’s opinion that the degree of contamination is immaterial.
There is no duplicate assay dataset available for review. SRK is therefore not able to comment on the repeatability of the dataset.
| 7.4 | Adequacy of sample preparation, security and analytical procedures |
[§229.601(b)(96)(iii)(B)(8)(iv)] [SR3.5(ii)]
The on-site sample preparation process described in Section 7.1 is a conventional approach adopted by operating mines in the BC and without any evidence of material flaws; likewise, for the analytical methods employed. The chain of custody of samples from the site to the assay laboratories is well documented. The validation process undertaken when the laboratory/ies receive the samples ensures that all samples intended for submission by the exploration team are accounted for.
| SRK | Report date: 27 May 2022 |
| | Effective Date: 31 December 2021 |
| | |
| SRK Consulting – 576060 SPM PSM Project TRS | Page 60 |
SRK is of the opinion that the above measures are adequate and contribute to the reliability of the assay data for grade estimation.
| 7.5 | Unconventional analytical procedures |
[§229.601(b)(96)(iii)(B)(8)(v)]
SRK does not consider any of the analytical methods employed for the assay analysis to be unconventional. These methods are tried and tested in the PGM industry.
| SRK | Report date: 27 May 2022 |
| | Effective Date: 31 December 2021 |
| | |
| SRK Consulting – 576060 SPM PSM Project TRS | Page 61 |
[§229.601(b)(96)(iii)(B)(9)
| 8.1 | Data verification procedures applied |
[§229.601(b)(96)(iii)(B)(9)(i)] [SR3.1(ii), SR3.6(i)]
A Principal Resource Geologist employed by SRK has undertaken five site visits since 2014, the most recent being February 2022. All the site visits were in partial fulfilment of the listing requirements for the public declaration of Mineral Resources.
The initial visit primarily focussed on validating drill hole collars in the field and inspecting of drill core at the core yard in Mogwase. With respect to all the drill hole collars randomly inspected, SRK noted that the casing and marker indicating drill hole identity were still intact. At the core yard, SRK randomly inspected the geological records of selected drill holes by ascertaining its correspondence to what is captured in the electronic database. Considering that half/split drill core within the mineralized zone exist, it was possible to determine the accuracy of the thickness of the different packages of the mineralized unit. Based on the observations made, SRK concluded that the geological record captured in the database is a fair representation of what is notable in the drill holes.
As part of the 2016 site visit, SRK visited the West Pit to appreciate the complexity of the geological structures in the pit and the extent to which it corresponded to what is coded in the grade model. Together with the RC drilling, pit mapping has contributed to the continuous update of geological losses. SRK revisited the pit in 2020 with the same objective in mind. SRK is of the opinion that updates to geological structures and reef elevations subsequent to the maiden model are sound. During the March 2021 site visit, SRK visited the grounds of the East Pit where it is earmarked to drill relatively short holes to intersect the projected subcrop positions of the shallow UG2 and MR. During the February 2022 visit, SRK inspected the ore exposures in the East Pit.
Based on the review of the assay QA/QC results/reports as outlined in section 7.3, SRK is of the general opinion that the respective assay datasets considered for the grade estimation are reasonably accurate. SRK understands that pulp-reject samples of some drill holes within the Sedibelo Central/East and Magazynskraal footprints are available and currently being processed for chrome analysis. Where there is adequate quantity of samples, 6E analysis using NiS ICP-MS assay technique is being considered. This will provide an additional dataset to confirm the repeatability of assay results.
| 8.2 | Limitations in data verification |
[§229.601(b)(96)(iii)(B)(9)(ii)] [SR3.1(ii), SR3.6(i)]
Chrome data for Sedibelo Central and a larger portion of Sedibelo East and Magazynskraal are based on inference; i.e., the regressed equation deduced from the density and chrome data outside of these footprints. Although the inference of chrome data results in an Inferred Mineral Resource classification, there are limitations on its accuracy. There is no chrome assay QA/QC data for the greater part of the Sedibelo property.
Where base metal QA/QC information is available, they are either statistically inadequate to make an informed decision or the underlying QA/QC data is not available for review.
[§229.601(b)(96)(iii)(B)(9)(iii)] [SR3.1(ii), SR3.6(i)]
Where the grade estimates have been kriged, SRK notes that the quantity of 4E data (i.e., Pt, Pd, Rh and Au) is adequate to demonstrate grade continuity. Where the Ru and Ir data/estimate is inferred (especially on the Sedibelo property), the regressed equations derived from available 6E data are robust. SRK is of the opinion that the categories of the respective Mineral Resources are also supported by the available data within their footprint. The reliability of the assay data for resource estimation is satisfactory based on the QA/QC results and percentage of QA/QC data that constitute the assay database.
| SRK | Report date: 27 May 2022 |
| | Effective Date: 31 December 2021 |
| | |
| SRK Consulting – 576060 SPM PSM Project TRS | Page 62 |
| 9 | MINERAL PROCESSING AND METALLURGICAL TESTING |
[§229.601(b)(96)(iii)(B)(10)] [SR4.5(iii), SR5.3]
| 9.1 | Nature of mineral processing, metallurgical testing and analytical procedures |
[§229.601(b)(96)(iii)(B)(10)(i)] [SR3.8, SR5.3(i)(ii)(iv)(v)(vi)]
All ore to be mined by the P-S-M Project will be processed through the current PPM concentrators.
| 9.1.1 | Metallurgical Testwork – West Pit (Tuschenkomst) |
Metallurgical test work was conducted during four separate phases, with phases I to III comprising bench scale tests performed between 2004 and 2006 and Phase IV involving pilot scale test work in 2006. In summary, the Testwork involved the following:
| · | Phase I: undertaken to determine flotation kinetics and the character of the flotation products by performing bench scale tests on Merensky Reef, UPR, LPR and UG2. The tests were conducted on drill hole core from Tuschenkomst and Ruighoek; |
| · | Phase II: undertaken to determine flotation kinetics and variability characterization test work by performing bench scale tests on cores from Tuschenkomst and Ruighoek, representing all silicate reefs and UG2 ore types, including all states of alteration (i.e., weathering and oxidation). The supplied cores had already been cut to allow for the predicted mining dilution; |
| · | Phase III: Tuschenkomst silicate reef cores were submitted for composited heavy liquid separation (HLS) test work to separate the chromite rich and silica rich portions which were floated separately to determine any potential recovery benefit. However, no significant recovery benefit was achieved; |
Since HLS test work indicated that a split was achievable on the silicate ores, further HLS evaluations were undertaken, using cores representing bulk silicate reef mining cuts from Tuschenkomst. Effective separation of the barren interstitial partings was achieved. Where mineralisation occurred in the interstitial wastes, the mineralisation was rejected, indicating the need for grade control, to prevent mineralisation losses through the Dense Media Separation (DMS) plant when treating the bulk mined reef; and
| · | Phase IV: consisted of pilot plant evaluation on selectively mined bulk samples (approximately 120 t each) extracted from a trial pit at Tuschenkomst and representing the different available ore types and oxidation states. |
The option of a fine grinding process was evaluated with samples drawn during the Mintek test work campaign to determine the appropriate mill size, type and power requirements. Selected ore and waste samples were submitted to determine Bond Ball Mill Index and Pennsylvania abrasion indices. The test work showed that provision of fine grinding in the UG2 process circuit improved recoveries for a feed of >95% passing 75 μm. Silicate ores showed limited recovery improvements but higher concentrate grades when exposed to fine grinding.
Both ore types were found to be amenable to an MF2 milling-flotation circuit. The bench flotation work confirmed the need to treat the UG2 and silicate streams through separate dedicated concentrators. Blending of the weathered and fresh UG2 ores showed no deleterious effect to the overall recovery. Test work indicated difficulty in UG2 PGM liberation using standard flotation methods and difficulty in achieving high recoveries at higher concentrate grades. Blending of the silicate ores resulted in a more unstable plant operation compared to the fresh silicate reefs.
It was proposed that a DMS be incorporated ahead of the silicate Merensky Reef concentrator to remove the barren interstitials from the MR.
| 9.1.2 | Metallurgical Testwork - Sedibelo (Wilgespruit) |
The discussion here relates to the East Pit, Central Underground Block and that part of the East Underground Block on the farm Wilgespruit.
The work was done as part of a feasibility study conducted in 2008.
Grind
The UG2 ore samples gave a Grind/Recovery relationship of 68% 4E recovery at a grind of 48% -38 µm and 78% 4E recovery at a grind of 100% -38 µm. A grind of 70% passing 38 µm (P80 of about 53 µm) was targeted for the UG2 ore as it was expected that increasing the grind further than this point would start to consume considerably more power with only a small increase in recovery.
| SRK | Report date: 27 May 2022 |
| | Effective Date: 31 December 2021 |
| | |
| SRK Consulting – 576060 SPM PSM Project TRS | Page 63 |
The Bond Ball Work Index (BBWI) results for the UG2 composite sample gave an average index of 15.2 kWh/t. This implies a “hard” ore type per the typical classification for BBWI depicted in Table 9.1.
Table 9.1: Bond Ball Work Index Classifications
| Bond Work Index (kWh/t) | 7 to 9 | 10 to 14 | 15 to 20 | >20 |
| Classification | Soft | Medium | Hard | Very hard |
Flotation Residence Times
The test work results suggested that UG2 reef ores from the Sedibelo deposit are slower floating than normal. Given this information, and the fact that retrofitting additional capacity would be costly, it was decided to design for longer residence times than conventional plants for both the rougher and cleaner stages as well as in the primary and secondary circuit. The residence times for the roughers (both primary and secondary) were fixed at 40 minutes with the residence time for the first cleaning stage being 1.5 times that of the roughers. Subsequent cleaning stages were taken at residence times of 0.5 times that of the first stage of cleaning.
Flotation Reagents
From pilot plant test work, recommended consumption rates for flotation reagents were as follows:
| · | Frother (XP200) 40 g/t to the primary rougher and 20 g/t to the secondary rougher flotation cells; |
| · | Collector (SIBX) 175 g/t to the rougher and 215 g/t to the cleaner flotation cells; and |
| · | Depressant (KU5) 110 g/t to the rougher and 300 g/t to the cleaner flotation cells. |
Frother, collector and depressant dosages are expected to be reduced primarily as a result of recycled water containing an excess of these reagents.
Mass Pull
The 4E recovery versus Mass Pull for the UG2 ore from the pilot plant runs was reported as very “flat” at a Mass Pull of 1% - 2% and a 4E recovery of 78%. What is interesting is that the Cr2O3 content in the concentrate was 4% at 1% Mass Pull and decreased to 2% at a 2% Mass Pull. This provides an additional degree of freedom in reducing the Cr2O3 grade of the concentrate without compromising PGM recovery. A mass-pull of 1.75% is suggested as the design case for the UG2 ore. The concentrate off-take agreements will ultimately have the biggest influence on mass-pull due to the 4E and Cr2O3 grade constraints.
Concentrate Grade and 4E Recovery
The pilot plant test work suggested that concentrate grades of 500 g/t 4E are possible but the recovery will decrease. A recommended mass-pull target would be between 1.7% and 2.3% for a concentrate grade of 200-240 g/t 4E at a Cr2O3 grade of between 2% and 2.5%. On the Concentrate grade - Recovery curves, this relates to a 78% 4E recovery.
Oxidised and Transition Zone Material 4E Recovery
Initial information suggested that the oxide zone in the orebody typically extends to a depth of about 30 m, but the actual depth in the vicinity of the East Pit is variable due to the number of faults and other geological structures traversing the area. In order to build in a degree of safety, a transition zone was included to extend from 30 m to 50 m. Following this, an attempt was made to get a reasonable recovery number for the oxide and transition zones of the UG2 ores by reviewing the results of all samples down to 50 m.
The 4E recovery was estimated to be 50% for the oxide layer, 64% for the transition zone and the 78% for the bottom layer as suggested by the test work.
4E Recovery Relationship to Head Grade
The plots indicated that for a head grade of 3 – 7 g/t 4E, any incremental variations in head grade will have no significant impact on recovery performance.
UG2 Reef Variability
Spatial variability test work on the UG2 ores was covered by 12 composite samples and 88 individual samples contained in the reports mentioned above.
| SRK | Report date: 27 May 2022 |
| | Effective Date: 31 December 2021 |
| | |
| SRK Consulting – 576060 SPM PSM Project TRS | Page 64 |
The results show that, on average (i.e., mining from multiple faces), the expected concentrate should be in the region of 200 - 220 g/t 4E at a recovery of 78%. In both test campaigns, the area in the south-eastern region of the Eastern Block and central region of the Central Block were identified as poor performers. When these areas are removed from the data sets, concentrate grades in the region of 240 – 260 g/t 4E at recoveries of 78% can be expected.
From a production point of view, concentrate grade and recovery are unlikely to be affected if some ore scheduling measures are adopted which avoid these two areas from being the sole contributors to the mine production. There is a possibility that during certain periods, the plant recovery may decrease to about 70% if mined ore comes predominantly from these areas.
| 9.1.3 | Metallurgical Testwork – Magazynskraal / Sedibelo East |
The discussion here relates to that part of the East Underground Block on the farm Magazynskraal.
The metallurgical test work was tailored to provide data on the silicate and UG2 ore types with a view to establish whether the two ore types could be batch treated through a single plant. All the metallurgical test work was done at Mintek in Randburg.
The mine delivered 24 MR ore core and 25 UG2 ore core samples of approximately 10 kg each to Mintek for the purpose of this study. The cores were each crushed to 6 mm and split into 1 kg representative samples. From each core, 4 kg was used for individual sample test work, 2 kg for bulk composite sample test work and 4 kg for area sample test work.
For the MR test work, three area composites were made up comprising the PUP (Merensky Reef Potholed to Upper Pseudo Reef), PTA (Potholed onto Tarentaal Reef) and TF (Thin Footwall Contact Reef). For the UG2 test work 4 area composites as advised by the client were made up.
Metallurgical Head Grades
The head grades of the Merensky and UG2 composites were reported to be as set out in Table 9.2 and Table 9.3, respectively.
Table 9.2: Magazynskraal/Sedibelo East – Merensky ore composite sample grades
| | Merensky Ore |
| Element | Pt | Pd | Rh | Au | Ru | Ir | 4E | Pt/Pd | 6E | Ni | Cu | S |
| Unit | g/t | g/t | g/t | g/t | g/t | g/t | g/t | | g/t | % | % | % |
| TF Composite | 2.48 | 1.19 | 0.20 | 0.18 | 0.36 | 0.05 | 4.05 | 2.08 | 4.46 | 0.19 | 0.09 | 0.29 |
| PTA Composite | 4.30 | 1.71 | 0.28 | 0.21 | 0.58 | 0.08 | 6.50 | 2.51 | 7.16 | 0.25 | 0.11 | 0.36 |
| PUP Composite | 5.44 | 2.53 | 0.51 | 0.35 | 0.79 | 0.11 | 8.83 | 2.15 | 9.73 | 0.30 | 0.14 | 0.49 |
| Mintek Average | 4.05 | 1.96 | 0.28 | 0.26 | 0.58 | 0.09 | 6.55 | 2.07 | 7.22 | 0.24 | 0.09 | 0.37 |
Table 9.3: Magazynskraal/Sedibelo East – UG2 ore composite sample grades
| | UG2 Ore |
| Element | Pt | Pd | Rh | Au | Ru | Ir | 4E | Pt/Pd | 6E | Cr2O3 |
| Unit | g/t | g/t | g/t | g/t | g/t | g/t | g/t | | g/t | % |
| Area Composite 1 | 2.85 | 1.39 | 0.46 | 0.02 | 1.13 | 0.15 | 4.72 | 2.05 | 6.00 | 27.22 |
| Area Composite 2 | 2.98 | 1.31 | 0.59 | 0.03 | 1.18 | 0.16 | 4.91 | 2.27 | 6.25 | 29.51 |
| Area Composite 3 | 3.31 | 1.49 | 0.63 | 0.04 | 1.31 | 0.18 | 5.47 | 2.22 | 6.96 | 29.20 |
| Area Composite 4 | 2.35 | 1.20 | 0.33 | 0.01 | 0.93 | 0.12 | 3.89 | 1.96 | 4.94 | 27.65 |
| Mintek Average | 2.80 | 1.32 | 0.54 | 0.05 | 1.13 | 0.15 | 4.71 | 2.12 | 5.99 | 28.70 |
Milling Test work
The BBWI test provides useful information for the design of grinding circuits and for estimating the energy requirements for closed circuit milling. The BBWI is also a basic measure of hardness. Tests were conducted at limiting screen sizes of 75 µm and 106 µm.
Table 9.4 and Table 9.5 reflect the BBWI results achieved for MR and UG2 ore samples respectively. In the tables, F80 and P80 are the 80% passing sizes in µm of the feed and the product, respectively.
| SRK | Report date: 27 May 2022 |
| | Effective Date: 31 December 2021 |
| | |
| SRK Consulting – 576060 SPM PSM Project TRS | Page 65 |
Table 9.4: Magazynskraal/Sedibelo East – Bond Ball Work Index MR ore samples
| Sample ID | Limiting Screen | F80 | P80 | Net Revolution | Work Index |
| (µm) | (µm) | (g/rev) | (kWh/t) |
| PUP Area | 106 µm | 2 640.32 | 92.71 | 0.93 | 21.02 |
| 75 µm | 2 424.76 | 60.73 | 0.63 | 24.56 |
| PTA Area | 106 µm | | | | |
| 75 µm | 2 417.60 | 55.67 | 0.63 | 23.23 |
| TF Area | 106 µm | 2 596.09 | 89.60 | 0.87 | 21.78 |
| 75 µm | 2 610.31 | 54.68 | 0.62 | 23.31 |
| Bulk Composite | 106 µm | 2 218.57 | 87.86 | 0.88 | 21.69 |
| 75 µm | 2 374.26 | 60.04 | 0.65 | 23.75 |
F80 and P80 are the 80% passing sizes in µm of the feed and the product, respectively
Table 9.5: Magazynskraal/Sedibelo East – Bond Ball Work Index UG2 ore samples
| Sample ID | Limiting Screen | F80 | P80 | Net Revolution | Work Index |
| (µm) | (µm) | (g/rev) | (kWh/t) |
| Area Composite | 106 µm | 1 797.89 | 85.70 | 1.31 | 15.97 |
| 1 + 2 | 75 µm | 1 783.64 | 61.98 | 0.94 | 18.52 |
| Area Composite | 106 µm | 2 067.64 | 86.63 | 1.27 | 16.14 |
| 3 + 4 | 75 µm | 1 766.91 | 54.39 | 0.83 | 19.03 |
| Bulk Composite | 106 µm | 1 842.74 | 86.08 | 1.32 | 15.83 |
| 75 µm | 1 801.78 | 61.00 | 0.94 | 18.35 |
F80 and P80 are the 80% passing sizes in µm of the feed and the product, respectively
The results of 21.69 to 23.75 kWh/t established that there was no significant variation in ore hardness within the MR composite areas investigated. The classification of the MR ore is thus “very hard”.
Based on the BBWI classification, the UG2 ore can be classified as “hard”. At a limiting screen of 75 µm, the index increased.
With the formula W = 10 x Wi x EF x (1/P80-1 – 1/F80-1) where EF is a correction factor, the predicted energy for a ball mill can be calculated.
The MR bulk composite is the “hardest” and rendered a specific energy requirement of 18.54 kWh/t for the 106 µm fraction, and 25.78 kWh/t for the 75 µm fraction.
Grind Mill Test Results
Batch Grind Mill tests were conducted on the Merensky and UG2 bulk ore samples with a feed size of -6.7 mm. The batch mill test data indicated that the milling kinetics could be described using the first order rate hypothesis since the modelled data fitted the measured data reasonably well.
The conclusion was that for the MR ore to achieve P80 -75 µm, the specific energy required was calculated to be 23.68 kWh/t. The UG2 ore rendered an equivalent figure of 19.34 kWh/t. In an open circuit, more energy will thus be required to mill the MR ore to P80 -75 µm.
Flotation Test Work
Four tests were conducted at varying primary grinds of 40, 50, 60 and 80% passing 75 µm. The objective was to see whether a MF1 flow sheet could be used to successfully recover all the metals without having to use a two-stage milling and flotation circuit. The results showed that at least 10% of the material is slow floating and that the MR ore would benefit from a two-stage milling and flotation circuit.
Secondary rougher test work was then conducted at three varying grinds of 70, 80 and 90% passing 75 µm. The results proved that processing the ore in a MF2 circuit improved the 4E recovery from about 80% to >90%. Based on the results it was established that a grind of 70% -75 µm was the optimum grind as finer grinds did not result in any significant benefits in terms of metal recovery.
| SRK | Report date: 27 May 2022 |
| | Effective Date: 31 December 2021 |
| | |
| SRK Consulting – 576060 SPM PSM Project TRS | Page 66 |
From the results obtained, flotation kinetic data were produced to enable recovery modelling predictions to be made according to the Kelsall model. The Kelsall Model characterizes the mineral species into two rate constants corresponding to slow and fast floating components. The model is of the form:

Where R is the recovery at time t, Φs is the mass fraction of the slow floating component, ks and kf are the rate constants for the slow and fast floating components respectively.
The ‘Φf’ figure from the Kelsall model indicates the minimum 4E recovery that could be expected with higher grade concentrates.
The Kelsall equation was fitted to the measured recovery data using the Solver Routine in Microsoft Excel. From the tests conducted on the MR ore bulk composite, the results that can be expected are:
| | % Recovery | Concentrate Grade |
| · 4E | 83% | 120 g/t and higher |
| · Ni | 60% | 3.0% and higher |
| · Cu | 86% | 1.7% and higher |
Variability test work on individual Merensky drill cores and area composites showed there was significant variability in upgrading response with expected recoveries ranging from 78% to 95%. The variability in flotation response was related to the head grades as the samples with the highest grades (PUP Area) rendered the highest concentrate grades and best recoveries.
Four tests were conducted at varying primary grinds of 40, 50 and 60% passing 75 µm. The main objective was to establish the grind best suited in a MF2 circuit for the 4E flotation kinetics and overall recovery. From this work it was concluded the 40% passing 75 µm would be used as the norm in for all subsequent tests.
Secondary rougher test work was then conducted at three varying grinds of 70, 80 and 90% passing 75 µm. Based on the results it was established that a grind of 70% -75 µm was the optimum grind as finer grinds did not result in any significant benefits in terms of metal recovery.
From the results obtained, flotation kinetic data was produced to enable recovery modelling predictions to be made according to the Kelsall model. Simulation of recovery versus time was performed by applying the Kelsall Model to the recovery data.
The Kelsall equation was fitted to the measured recovery data using the Solver Routine in Microsoft Excel. From the tests conducted on the UG2 ore bulk composite the results that can be expected are:
| | % Recovery | Concentrate Grade |
| · 4E | 80% | 150 g/t and higher |
The consumption of gangue depressant to achieve these grades was relatively high at 400 g/t.
A potential issue with the high chromite content of the final product was identified and would need to be addressed in the plant design. The test work gave 6 to 12% chromite content in the concentrate.
Mineralogical work on the UG2 ore revealed a complex ore type. A small proportion of the PGMs was liberated or was associated with base metal sulfides which constrained the primary circuit to a 60% recovery. The second milling stage is thus very important in liberating some of the PGMs from the gangue-sulfide mineral composites in lifting the overall recovery to 80%. The nature of the composites and the milling environment did not liberate all the PGM minerals from the gangue and about 10% of the PGM minerals were lost in the tails still locked in with the gangue. Attempts to reduce this loss with a finer grind did not show any promise.
Variability test work on individual UG2 drill cores showed that the samples were highly variable in their upgrading response with expected 4E recoveries ranging from 60 to 94%. The samples from composite areas 1, 2 and 3 all responded better than the samples from area number 4. The ideal would thus be that ore from area number 4 must be blended with the other three areas when the ore is processed through the plant. This might be difficult, because area 4 is at a deeper depth than the other three areas and as such additional test work is required on area 4 to understand this area and optimize the flotation design.
| SRK | Report date: 27 May 2022 |
| | Effective Date: 31 December 2021 |
| | |
| SRK Consulting – 576060 SPM PSM Project TRS | Page 67 |
| 9.1.4 | Metallurgical test work – Kell Refining Process |
Background to Kell
The Kell process provides a low-cost hydrometallurgical process alternative for treatment of PGM concentrate produced by SPM’s operations. The Kell process is not sensitive to the traditional impurity levels in the feed that impact smelters negatively.
The process recovers both base and precious metals into separate product streams. The process offers several advantages over traditional smelting including:
| · | Lower energy requirements and CO2 emissions; |
| · | Able to treat low grade concentrates as efficiently as high-grade concentrates; |
| · | Resistant to impurities, particularly chromite; and |
| · | High recoveries of both base and precious metals. |
Given the precarious power situation in South Africa and the expected high cost of power, the viability of smelters will be compromised and a process like the Kell process is very attractive.
The final products in the base metals flow sheet are copper cathode and nickel/cobalt sulphide concentrate. The final product in the PGM circuit is a high grade mixed PGM sponge product for sale to existing PGM refineries or PGM users around the world. The product is considered suitable for direct addition to existing PMRs or for further processing on site to individual metals if desired.
Metallurgical test work
A definitive feasibility study evaluating the use of the Kell process at PPM was undertaken by Simulus Engineers in Perth Australia in 2013. Based on a concentrate feed rate of 110 ktpa, the study demonstrated positive economics from a robust process.
A total of 3.7 t wet concentrate at a 6E grade of 105 g/t were sent to the laboratory in a number of consignments each of 15x200 litre drums. The laboratory work was done on this material. One drum was selected at random for every 15 drums of concentrate received for the laboratory test work. The balance was kept for the pilot plant run.
Extended pilot plant trials were undertaken between 2014 and 2016. The pilot plant was able to repeat the results achieved in the previous laboratory tests. The report on the pilot plant test work concluded:
“A six-week Kell pilot plant campaign was completed in July 2016 at the Laboratories in Welshpool, Australia. A total of 3.9 t of PGM concentrate (45% UG2, 55% Merensky blend, 3PGM 74 g/t, 11.7% moisture) from the Pilanesberg Platinum Mine was processed. Products from the campaign included high (13.4 kg) and low (12.1 kg) grade PGM sulphide intermediate products, copper cathode (17.9 kg) and a mixed, nickel/cobalt sulphide concentrate (101 kg) product. High overall PGM and base metal recoveries were demonstrated. The mass balance closed to within 3% for the front end of the plant and within 8% for the back end of the plant.”
A subsequent memorandum addressed to the developer of the Kell technology concluded:
“The bulk mineralogy of the POX [pressure oxidation] residue as determined by QEMSCAN was input into the model for both DFS 2013 and BFS 2016 pilot-plant samples. The quantitative mineralogy of the calcine kiln discharge products from both DFS 2013 and BFS 2016 pilot-plant samples was predicted by the model output and compared with QEMSCAN results. The outcomes show a good correlation in both cases.”
The study was reviewed and updated in 2016 when additional piloting was completed. A further review and adjustment of feed concentrate has been completed in 2020 to incorporate recent process improvements and the production of Ni, Co and Cu cathode as well as refined Pt, Pd, Rh and Au.
Test work was conducted to consider the impact of using only UG2 feedstock. An initial batch test work program was completed using the samples of UG2 concentrates from PPM and Union Mine (Siyanda Resources Ltd), provided by PPM for testing. The batch test work results were used to confirm operating conditions and compared with previous continuous pilot plant results from processing a blend of PPM UG2 and Merensky concentrates.
Standard equipment was used for the POX test work, solid liquid separation and atmospheric leach test work. Standard analytical analysis procedures were used for the intermediate samples to determine the valuable element content. Analysis of the final metal produced was done by determining the content of the contaminants.
| SRK | Report date: 27 May 2022 |
| | Effective Date: 31 December 2021 |
| | |
| SRK Consulting – 576060 SPM PSM Project TRS | Page 68 |
It is recommended in the report that that the following activities be undertaken as the project moves forward to gather final design information for detailed design:
| · | The circuits that are envisaged operate elsewhere in industry however, they do not form part of the flowsheet as previously piloted for SPM. This is a major shortcoming as both the Ni/Co solvent extraction circuit as well as the PGM Molecular Recognition Technology (MRT) circuits are critical to the operation; |
| · | Vendor Testwork be completed as part of detailed design to finalize equipment selection for key items such as filters, thickeners and the acid recovery system; |
| · | Nickel and cobalt solvent extraction circuits be demonstrated semi-continuously at bench/mini-pilot scale as part of detailed design; |
| · | PGM MRT/ion exchange circuits be demonstrated semi-continuously at bench/mini-pilot scale as part of detailed design; and |
| · | The acid recovery circuit be demonstrated semi-continuously at bench/mini-pilot scale as part of detailed design. The circuit configuration has been optimized and re-arranged since piloting was completed. |
It is however a concern of SRK that the amount of residue generated in the process has been underestimated e.g., the amount of PGM locked in the chlorine leach residue in the PGM refinery is historically a major contributor to the low first pass efficiency and requires further treatment, and in some cases has to be processed by specialist toll refiners. In addition, the first pass efficiency of the MRT processes used for the recovery of Pt, Pd and Rh result in significant amounts of metal being recycled through the refinery. This requires additional processing capacity, potentially calcining ovens, which will contribute significantly to the overall operating cost. No mention of the residue/recycle processing costs could be found in the feasibility study.
| 9.2 | Representivity of test samples |
[§229.601(b)(96)(iii)(B)(10)(ii)] [SR3.8, SR5.3(iv)]
The samples submitted for the test work were representative of the ore body and included the various ore types.
| 9.2.1 | West Pit (Tuschenkomst) |
The flotation kinetics and variability characterisation test work during Phase II was performed on cores from Tuschenkomst and Ruighoek, representing all silicate reefs and UG2 ore types, including all states of alteration (i.e., weathering and oxidation).
The pilot plant test work in Phase IV was performed on selectively mined bulk samples (approximately 120 t each) extracted from a trial pit at Tuschenkomst and representing the different available ore types and oxidation states.
| 9.2.2 | Sedibelo (Wilgespruit) |
Spatial variability test work on the UG2 ores was covered by 12 composite samples and 88 individual samples contained in the reports mentioned above.
The mine delivered 24 MR ore core and 25 UG2 ore core samples of approximately 10 kg each to Mintek for the purpose of this study. The cores were each crushed to 6 mm and split into 1 kg representative samples. From each core, 4 kg was used for individual sample test work, 2 kg for bulk composite sample test work and 4 kg for area sample test work.
For the MR test work, three area composites were made up comprising the PUP, PTA and TF. For the UG2 test work 4 area composites were made up.
Extensive test work has been done on various concentrates (UG2 only, various blends of UG2 and Merensky) from various ore bodies and a significant database of information was generated in the process.
| 9.3 | Testing Laboratory and Certification |
[§229.601(b)(96)(iii)(B)(10)(iii)] [SR5.3(i)(iii)]
The majority of the mineralogy and metallurgical test work was conducted at Mintek. Mintek is a well-respected research institution that is partly funded by the Department of Science and Technology. Mintek has no affiliation with PPM.
| SRK | Report date: 27 May 2022 |
| | Effective Date: 31 December 2021 |
| | |
| SRK Consulting – 576060 SPM PSM Project TRS | Page 69 |
The Mintek Assay Laboratory is accredited with ISO 17025 and has a laboratory specializing in the analysis of PGM and Au samples from the BC. It complies with all the QA/QC requirements according to its accreditation.
Test work for the Kell process was conducted at the Simulus Laboratories in Perth, Australia. At the time of compiling this report, no evidence of the laboratory accreditation could be found.
| 9.4 | Plant Recovery and deleterious factors/elements |
[§229.601(b)(96)(iii)(B)(10)(iv)] [SR5.3(iv)(v)]
Plant grade-recovery data for PPM’s UG2 and Merensky concentrators show that a range of recoveries for any given feed grade can be achieved (Figure 9.1). Application of a best-fit graph introduces a potential error due to this scatter.

Figure 9.1: PPM Plant Grade-Recovery Data – UG2 (left) and Merensky (right)
The refining contract with Impala (Section 15.5.1) and Heron Metals (Section 15.5.2) requires the concentrate to be of a specified minimum grade. The Two-Product formulae based on the targeted concentrate grade, feed grade and tailings grade are used to determine the mass pull and recovery into concentrate. Application of the formulae is described in Section 13.3.1.
This process results in the Cr2O3 content in the concentrate exceeding the accepted limit from time to time, depending on the plant feed mix, for which penalties on the excess chromite become payable.
The only deleterious material in the PGM concentrate is the Cr2O3 content, which presents problems for the refining process if the content is too high. The generally accepted maximum Cr2O3 content is 1.5%, above which the refinery will charge penalties for the excess chromite. The content in concentrate can be managed within accepted limits by adjusting the mass pull but this is achieved at the expense of 4E recovery.
The aggregate recoveries projected to be achieved by the Kell process are shown in Table 15.4.
[§229.601(b)(96)(iii)(B)(10)(v)] [SR5.3(v)(vi)]
Standard metallurgical test procedures were utilized in characterizing the ores. The institutions utilized are well versed in conducting such tests and the test programmes were well structured.
All aspects around milling, flotation, solid liquid separation and upgrading of the ores were considered. The information was adequate to provide design information for the engineers. Sufficient information was provided to assist in the prediction of future plant performance.
Extensive test work regarding the Kell process has been done on various ore bodies and a significant database of information was generated.
| SRK | Report date: 27 May 2022 |
| | Effective Date: 31 December 2021 |
| | |
| SRK Consulting – 576060 SPM PSM Project TRS | Page 70 |
| 10 | MINERAL RESOURCE ESTIMATES |
[§229.601(b)(96)(iii)(B)(11)
| 10.1 | Key assumptions, parameters and methods used to estimate Mineral Resources |
[§229.601(b)(96)(iii)(B)(11)(i)] [SR2.1(iii), SR4.1(i)-(v), SR4.2(i)(iii)(v)]
The PGM and base metal Mineral Resource estimates were compiled either by SPM or by independent consultants. SRK has acted in a review capacity and thus accepts responsibility as Qualified Person. With respect to the chrome estimates, SPM compiled the estimates for West Pit, and the central portion of Magazynskraal; the rest of the footprints have been compiled by SRK.
[SR3.7, SR4.2(i)-(iii)(v), SR4.3(i)]
Mineral Resource Cut
The geological modelling was undertaken using Geovia MinexTM version 6.5.6 (Minex) software package to generate top and bottom surfaces for each of the Mineral Resource cuts. This software uses an elevation grid system for modelling, rather than wireframes, where the thickness of a unit is modelled onto a grid, and combined with the stratigraphic sequence, a package thickness can be built for each elevation grid node. The PGM and base metal Mineral Resource estimation was outsourced whereas the UG2 Cr estimate was compiled internally by SPM . SRK has acted in a review capacity for both estimates.
The Mineral Resource cuts are practical mineable units that include the lithologies that contain the mineralization. Figure 10.1 shows the lithological units that constitute the Mineral Resource cuts and the range of expected thickness. The S1 and S2 (UPR, PRHZB and LPR) are collectively known as the “Silicate Reefs”. For the purposes of the resource estimation, a single composite sample is calculated over the full mineralized unit width.
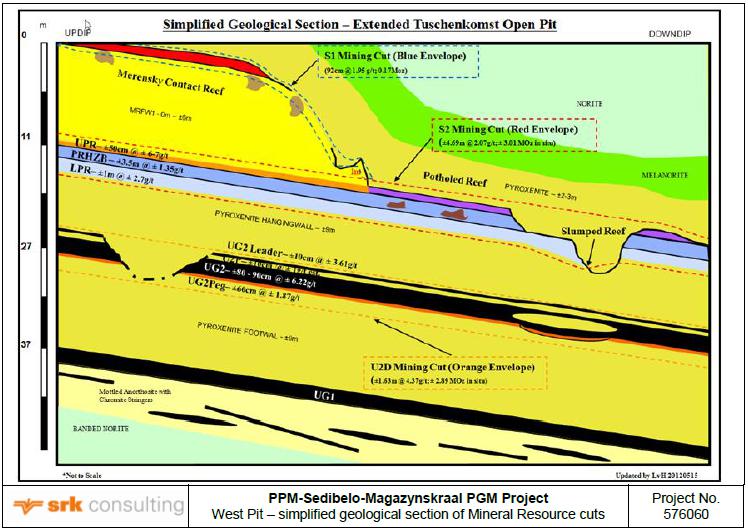
Figure 10.1: West Pit – simplified geological section of Mineral Resource cuts
| SRK | Report date: 27 May 2022 |
| | Effective Date: 31 December 2021 |
| | |
| SRK Consulting – 576060 SPM PSM Project TRS | Page 71 |
Below is a brief description of the individual lithological unit(s) constituting the respective resource cuts.
| • | The S1 encompasses a single chromitite stringer with a resource cut of 1 m incorporating both hanging and footwall units; |
| • | The S2 resource cut comprises: |
| o | The UPR which contains finely disseminated base metal sulfides comprising of a chromitite stringer hemmed in between an obvious Pegmatoidal Feldspathic Pyroxenite (PFP). This entire unit with hard boundaries at top and base is roughly 40 cm thick; |
| o | The PRHZB with an average thickness of 4.5 m, commonly referred to as the Tarentaal reef, ranges from 1 m to 8 m in thickness on this property. It has a distinctive feldspathic troctolite with disseminated base metal sulfides of varying mineralization; |
| o | The LPR lithological unit has an average thickness of 1.1 m. It comprises a chromitite stringer overlain by a PFP. Its contact with the underlying pyroxenite is gradational; and |
| • | The main chromitite layer (U2) of the UG2 which ranges from 0.8 m to 1 m on this property defines the resource cut. The underlying pegmatoid (U2PEG) is sporadically mineralized with an average thickness of 0.5 m. The U2L consists of chromitite stringers defined for an average thickness of 12 cm. The U2P which is a pyroxenite parting separates the U2L from the U2 and has an average thickness of 10 cm. This entire stacked matrix defines the U2D reef resource cut. Each of these four lithological units is estimated independently, using a single composite value for each unit. |
Each resource cut constitutes a mining cut.
Although different software could have been adopted for the geological modelling it is SRK’s opinion that any such approach will not materially impact on the mineralised volume. A different criteria could also have been adopted for the mining cut; however, the criteria adopted is consistent the mining method/design. This commentary is also applicable to the other assets.
Compositing
The drill holes are composited over the full width of each lithological unit, resulting in a single value for each unit per intersection. In the case of the S1, it is over the resource cut. The original samples were not density weighted during compositing; the only exception being the S1 and U2PEG which were considered to vary in density within their respective cuts. Checks were made to ensure the total sample length prior to compositing remained intact. Absent values within each stratigraphy were assigned a default grade prior to compositing of 0.001 g/t for each of the 4E elements. Not all samples were assayed for Rh, and therefore a Rh grade was calculated where absent, based on a linear regression using the Pt grades. A linear least squares regression line was calculated for each stratigraphic unit, where both Rh and Pt are assayed, and the relationship used to calculate for the absent Rh values. Similarly, default values were assigned based on de-clustered mean data values per resource cut.
All density measurements within the in-situ mineralised zone are based on Archimedes bath method undertaken on the drill core samples per mining cut. There was no need to wax or kiln wrap the drill core samples when the samples were fully submerged in water because of their non-porosity. There was no bulk sampling within the mineralised zone for bulk density measurements. The commentary here is also applicable to the other assets.
The Archimedes bath method was also used to determine the density of DMS and Scats discard materials.
Data Statistics
SRK has been able to replicate the grade statistics on the full width composites for all the resource units (Table 10.1). SRK has followed through the grade capping exercise done by Snowden and is of the opinion that the mean capped values are appropriate. No capping or cutting was undertaken for the Cr estimate. Isolated low grades in the U2 and U2L, and a high grade in the U2PEG, were retained in the estimation dataset.
Table 10.1: West Pit – Mean Grade statistics of the full width composites of the mining units
| Reef Name | Count PGE | Pt (g/t) | Pd (g/t) | Rh (g/t) | Au (g/t) | Ni (ppm) | Cu (ppm) | Count Cr | Cr (%) |
| S1 | 204 | 1.27 | 0.48 | 0.09 | 0.11 | 774 | 444 | - | - |
| S2UPR | 418 | 4.15 | 1.9 | 0.36 | 0.22 | 1 865 | 189 | - | - |
| S2HZB | 424 | 0.82 | 0.4 | 0.06 | 0.06 | 1 286 | 341 | - | - |
| S2LPR | 371 | 1.62 | 0.82 | 0.11 | 0.15 | 1 189 | 787 | - | - |
| U2L | 399 | 2.34 | 0.83 | 0.42 | 0.03 | 301 | 79 | 84 | 16.56 |
| U2P | 399 | 2.32 | 0.9 | 0.43 | 0.03 | 290 | 79 | - | - |
| U2 | 443 | 3.73 | 1.73 | 0.74 | 0.03 | 201 | 58 | 91 | 24.2 |
| U2PEG | 385 | 1.18 | 0.5 | 0.23 | 0.01 | 228 | 59 | 67 | 1.56 |
| SRK | Report date: 27 May 2022 |
| | Effective Date: 31 December 2021 |
| | |
| SRK Consulting – 576060 SPM PSM Project TRS | Page 72 |
Variography
Variography is a process of fitting smooth mathematical curves to the inherent spatial grade continuity modelled empirically (i.e., the experimental semi variogram) from composite data associated with the respective reef packages. Variography forms the geostatistical basis for the estimation process via the grade interpolation methods, i.e., kriging. Typically, with the PGMs on the BC, the variogram modelling (i.e., variography) uses either a stacked spherical or exponential components. Sample locations separated by distances closer than the range are spatially autocorrelated, whereas locations farther apart than the range are not. The nugget effect is modelled as a vertical offset at the origin of the fitted model.. The sill is defined by the value that the variogram model attains at the range (the value on the y-axis). In this case each of these stacked components has a partial sill, which together with the nugget effect make up the total sill, which by definition is equal to one for a correlogram. The variation in 3D orientation reflects differences in spatial continuity at different ranges. The semi-variogram range depicts the threshold distance (as reflected on the fitted mathematical curve) beyond which there is no grade continuity between pairs of composites.
The report detailing the grade estimation process does not show the plot of the experimental semi-variograms but rather the semi-variogram parameters used. SRK independently generated semi-variogram models and is satisfied that they compare reasonably with the semi-variogram parameters captured in the report. The semi-variograms are moderately to well-structured and the fitted models are adequately robust. SRK calculated an experimental semi-variogram for the U2 unit, which shows a reasonably well structured semi-variogram with a range of 900 m.
SRK thus finds the semi-variogram parameters used for the grade estimation to be satisfactory. The Cr estimate are not based on kriging, and therefore did not require a semi-variogram. SRK notes that the search ranges for the respective UG2 units are shorter than the semi-variogram range calculated by SRK.
Search Parameters
With respect to each of the PGM variables of the mineralized zones, a maximum of three different omnidirectional search passes were used to select samples for estimation. The first search was based on the short-range structure within each mining unit and it was restricted to a distance varying between 160 m and 190 m. The second search was restricted to 300 m. The third search was restricted to 500 m.
[SR3.7, SR4.2(i)-(iii)(v), SR4.3(i)]
The data preparation and modelling adopted for the PGMs and base metals are as outlined under Section 10.1.1. The lithological units that constitute the Mineral Resource cuts are also as defined under Section 10.1.1.
The top and bottom wireframe surfaces were cut by modelled faults and dykes. The Mineral Resource has been reported as everything below the surface topography.
Compositing
Refer to commentary on West Pit. The only deviation SRK notes is that, for the East Pit, all the samples were length and density weighted.
Data Statistics and Capping
The statistics of the capped composite data are presented in Table 10.2. SRK was able to reasonably replicate the statistics per the report. Where there are differences, they are minor and likely due to differences in software packages used. The impact of these differences on the grade and tonnages as captured in the resource model will not be material.
The need for capping of composites was assessed using histograms, mean and variance plots and log probability plots and the population coefficient of variation (CV). SRK reviewed the grade capping exercise and is of the opinion that the capped values are appropriate.
| SRK | Report date: 27 May 2022 |
| | Effective Date: 31 December 2021 |
| | |
| SRK Consulting – 576060 SPM PSM Project TRS | Page 73 |
Table 10.2: De-clustered composite data statistics
| Assay | Count | Min | Max | Mean | Std.Dev | CV | Assay | Count | Min | Max | Mean | Std.Dev | CV |
| S1 | UG2L |
| Density | 157 | 2.723 | 3.324 | 3.003 | 0.087 | 0.029 | Density | 250 | 2.227 | 4.528 | 3.739 | 0.230 | 0.061 |
| Length (m) | 157 | 0.580 | 1.000 | 0.997 | 0.037 | 0.038 | Length (m) | 250 | 0.040 | 0.620 | 0.124 | 0.053 | 0.427 |
| Pt (g/t) | 155 | 0.005 | 9.228 | 1.256 | 1.402 | 1.117 | Pt (g/t) | 246 | 0.090 | 7.330 | 2.369 | 0.619 | 0.261 |
| Pd (g/t) | 155 | 0.004 | 2.825 | 0.528 | 0.566 | 1.072 | Pd (g/t) | 246 | 0.068 | 3.510 | 0.888 | 0.313 | 0.352 |
| Rh (g/t) | 157 | 0.000 | 0.763 | 0.101 | 0.116 | 1.151 | Rh (g/t) | 250 | 0.005 | 1.340 | 0.430 | 0.098 | 0.227 |
| Au (g/t) | 155 | 0.001 | 0.443 | 0.113 | 0.084 | 0.738 | Au (g/t) | 246 | 0.001 | 0.473 | 0.024 | 0.038 | 1.620 |
| Cu (ppm) | 155 | 0.001 | 0.151 | 0.047 | 0.028 | 0.602 | Cu (ppm) | 223 | 0.000 | 0.061 | 0.007 | 0.009 | 1.253 |
| Ni (ppm) | 155 | 0.000 | 0.290 | 0.081 | 0.048 | 0.592 | Ni (ppm) | 223 | 0.007 | 0.140 | 0.027 | 0.017 | 0.624 |
| UPR | UG2P |
| Density | 247 | 2.715 | 3.975 | 3.083 | 0.165 | 0.053 | Density | 248 | 2.259 | 4.462 | 3.791 | 0.214 | 0.056 |
| Length (m) | 247 | 0.010 | 2.750 | 0.471 | 0.526 | 1.116 | Length (m) | 248 | 0.005 | 1.925 | 0.100 | 0.164 | 1.635 |
| Pt (g/t) | 242 | 0.030 | 27.961 | 4.508 | 4.333 | 0.961 | Pt (g/t) | 244 | 0.034 | 6.048 | 2.340 | 0.636 | 0.272 |
| Pd (g/t) | 242 | 0.026 | 9.038 | 2.13 | 1.674 | 0.786 | Pd (g/t) | 244 | 0.014 | 2.880 | 0.928 | 0.298 | 0.321 |
| Rh (g/t) | 247 | 0.003 | 2.630 | 0.423 | 0.404 | 0.954 | Rh (g/t) | 248 | 0.008 | 0.985 | 0.439 | 0.109 | 0.249 |
| Au (g/t) | 242 | 0.003 | 1.077 | 0.245 | 0.191 | 0.78 | Au (g/t) | 244 | 0.000 | 0.350 | 0.023 | 0.030 | 1.303 |
| Cu (ppm) | 242 | 0.001 | 0.596 | 0.082 | 0.071 | 0.859 | Cu (ppm) | 221 | 0.000 | 0.047 | 0.007 | 0.008 | 1.234 |
| Ni (ppm) | 242 | 0.004 | 0.628 | 0.188 | 0.108 | 0.573 | Ni (ppm) | 221 | 0.000 | 0.126 | 0.026 | 0.016 | 0.608 |
| PRH (G/T)ZB | UG2 |
| Density | 253 | 2.704 | 3.239 | 2.869 | 0.071 | 0.025 | Density | 276 | 3.514 | 4.335 | 4.119 | 0.123 | 0.030 |
| Length (m) | 253 | 1.310 | 8.530 | 4.522 | 1.238 | 0.274 | Length (m) | 276 | 0.190 | 10.820 | 1.009 | 0.795 | 0.787 |
| Pt (g/t) | 253 | 0.028 | 3.828 | 0.604 | 0.623 | 1.031 | Pt (g/t) | 271 | 0.461 | 8.076 | 3.903 | 0.846 | 0.217 |
| Pd (g/t) | 253 | 0.011 | 1.883 | 0.312 | 0.320 | 1.028 | Pd (g/t) | 271 | 0.063 | 7.068 | 1.931 | 0.848 | 0.439 |
| Rh (g/t) | 253 | 0.002 | 0.360 | 0.050 | 0.052 | 1.036 | Rh (g/t) | 276 | 0.147 | 1.370 | 0.789 | 0.162 | 0.205 |
| Au (g/t) | 253 | 0.001 | 0.336 | 0.054 | 0.059 | 1.089 | Au (g/t) | 271 | 0.004 | 0.158 | 0.024 | 0.020 | 0.843 |
| Cu (ppm) | 253 | 0.000 | 0.211 | 0.017 | 0.024 | 1.412 | Cu (ppm) | 248 | 0.000 | 0.048 | 0.005 | 0.006 | 1.144 |
| Ni (ppm) | 253 | 0.001 | 0.404 | 0.137 | 0.059 | 0.432 | Ni (ppm) | 248 | 0.000 | 0.139 | 0.017 | 0.014 | 0.819 |
| LPR | UG2PEG |
| Density | 247 | 2.282 | 3.526 | 3.029 | 0.134 | 0.044 | Density | 276 | 2.798 | 4.156 | 3.262 | 0.207 | 0.063 |
| Length (m) | 247 | 0.010 | 6.640 | 1.112 | 0.658 | 0.592 | Length (m) | 276 | 0.500 | 3.780 | 0.605 | 0.345 | 0.571 |
| Pt (g/t) | 243 | 0.056 | 9.771 | 1.555 | 1.254 | 0.806 | Pt (g/t) | 273 | 0.000 | 11.206 | 1.289 | 1.292 | 1.002 |
| Pd (g/t) | 243 | 0.022 | 5.558 | 0.848 | 0.695 | 0.819 | Pd (g/t) | 273 | 0.000 | 5.629 | 0.522 | 0.617 | 1.183 |
| Rh (g/t) | 247 | 0.004 | 0.727 | 0.115 | 0.096 | 0.835 | Rh (g/t) | 276 | 0.000 | 2.225 | 0.245 | 0.257 | 1.047 |
| Au (g/t) | 243 | 0.005 | 0.965 | 0.145 | 0.137 | 0.944 | Au (g/t) | 273 | 0.000 | 0.251 | 0.009 | 0.020 | 2.276 |
| Cu (ppm) | 243 | 0.001 | 0.235 | 0.030 | 0.026 | 0.865 | Cu (ppm) | 271 | 0.000 | 0.171 | 0.010 | 0.022 | 2.178 |
| Ni (ppm) | 243 | 0.012 | 0.514 | 0.121 | 0.059 | 0.484 | Ni (ppm) | 271 | 0.000 | 0.315 | 0.022 | 0.027 | 1.225 |
The top caps and the impact of capping on the mean and coefficient of CV are summarized in Table 10.3. Variables with a * indicate where a bottom cut has been applied.
| SRK | Report date: 27 May 2022 |
| | Effective Date: 31 December 2021 |
| | |
| SRK Consulting – 576060 SPM PSM Project TRS | Page 74 |
Table 10.3: Capping values and the effect of these on the composites
| Variable | Count | Composite Mean | Composite CV | Cap Value | Number
capped | Capped Mean | Capped CV |
| S1 |
| Pt (g/t) | 155 | 1.28 | 1.063 | 5.50 | 2 | 1.26 | 0.992 |
| Rh (g/t) | 157 | 0.10 | 1.106 | 0.55 | 1 | 0.10 | 1.053 |
| Cu (ppm) | 155 | 0.05 | 0.574 | 0.12 | 3 | 0.05 | 0.553 |
| UPR |
| Density | 247 | 3.10 | 0.054 | 3.47 | 3 | 3.09 | 0.051 |
| Length (m) | 247 | 0.47 | 1.060 | 2.00 | 8 | 0.44 | 0.888 |
| Pt (g/t) | 242 | 4.68 | 0.928 | 18.00 | 4 | 4.61 | 0.879 |
| Pd (g/t) | 242 | 2.21 | 0.776 | 7.50 | 1 | 2.20 | 0.767 |
| Rh (g/t) | 247 | 0.44 | 0.926 | 2.00 | 1 | 0.44 | 0.905 |
| Au (g/t) | 242 | 0.25 | 0.761 | 0.85 | 2 | 0.25 | 0.741 |
| Cu (ppm) | 242 | 0.09 | 0.802 | 0.30 | 2 | 0.08 | 0.732 |
| Ni (ppm) | 242 | 0.19 | 0.569 | 0.42 | 3 | 0.19 | 0.547 |
| PRH (G/T)ZB |
| Rh (g/t) | 253 | 0.05 | 1.070 | 0.26 | 2 | 0.05 | 1.029 |
| Cu (ppm) | 242 | 0.02 | 1.338 | 0.14 | 1 | 0.02 | 1.236 |
| LPR |
| Density* | 247 | 3.03 | 0.042 | 2.70 | 1 | 3.03 | 0.015 |
| Length (m) | 247 | 1.12 | 0.578 | 3.00 | 2 | 1.10 | 0.501 |
| Pt (g/t) | 243 | 1.59 | 0.835 | 7.00 | 4 | 1.55 | 0.746 |
| Pd (g/t) | 243 | 0.86 | 0.824 | 3.00 | 5 | 0.83 | 0.674 |
| Rh (g/t) | 247 | 0.12 | 0.855 | 0.45 | 5 | 0.11 | 0.722 |
| Au (g/t) | 243 | 0.15 | 0.961 | 0.70 | 5 | 0.14 | 0.895 |
| Cu (ppm) | 243 | 0.03 | 0.931 | 0.11 | 4 | 0.03 | 0.777 |
| Ni (ppm) | 243 | 0.12 | 0.508 | 0.30 | 4 | 0.12 | 0.460 |
| UG2L |
| Density | 250 | 3.75 | 0.056 | 2.90 | 1 | 3.76 | 0.052 |
| Length (m) | 250 | 0.12 | 0.401 | 0.21 | 6 | 0.12 | 0.231 |
| Pt (g/t) | 246 | 2.37 | 0.236 | 4.50 | 1 | 2.36 | 0.204 |
| Pd (g/t) | 246 | 0.89 | 0.332 | 2.00 | 2 | 0.88 | 0.274 |
| Rh (g/t) | 250 | 0.43 | 0.237 | 0.80 | 2 | 0.43 | 0.205 |
| Au (g/t) | 246 | 0.02 | 1.466 | 1.20 | 2 | 0.02 | 0.838 |
| UG2P |
| Density* | 248 | 3.80 | 0.052 | 3.00 | 1 | 3.81 | 0.047 |
| Length (m) | 248 | 0.10 | 1.476 | 0.30 | 4 | 0.08 | 0.440 |
| Pt (g/t) | 244 | 2.35 | 0.248 | 4.00 | 2 | 2.34 | 0.229 |
| Pd (g/t) | 244 | 0.93 | 0.302 | 1.70 | 2 | 0.92 | 0.269 |
| Au (g/t) | 244 | 0.02 | 1.188 | 0.10 | 2 | 0.02 | 0.778 |
| UG2 |
| Length (m) | 276 | 1.02 | 0.768 | 2.00 | 4 | 0.96 | 0.279 |
| Pt (g/t) | 271 | 3.88 | 0.210 | 6.50 | 1 | 3.88 | 0.203 |
| Pd (g/t) | 271 | 1.94 | 0.436 | 4.50 | 5 | 1.91 | 0.362 |
| Au (g/t) | 271 | 0.02 | 0.847 | 0.11 | 2 | 0.02 | 0.794 |
| Cu (ppm) | 248 | 0.01 | 1.120 | 0.03 | 2 | 0.01 | 1.003 |
| Ni (ppm) | 248 | 0.02 | 0.758 | 0.05 | 3 | 0.02 | 0.495 |
| UG2PEG |
| Density | 276 | 3.27 | 0.063 | 3.82 | 3 | 3.27 | 0.061 |
| Length (m) | 276 | 0.60 | 0.530 | 1.88 | 1 | 0.59 | 0.446 |
| Pt (g/t) | 273 | 1.32 | 1.022 | 6.50 | 4 | 1.30 | 0.944 |
| Pd (g/t) | 273 | 0.55 | 1.184 | 2.70 | 3 | 0.53 | 1.005 |
| Rh (g/t) | 276 | 0.25 | 1.059 | 1.50 | 2 | 0.25 | 1.002 |
| Au (g/t) | 273 | 0.01 | 2.405 | 0.04 | 5 | 0.01 | 0.954 |
| Ni (ppm) | 269 | 0.02 | 1.311 | 0.10 | 4 | 0.02 | 0.880 |
Note:
Variables with a * indicate where a bottom cut has been applied.
Variography
SRK has noted that the capped composite dataset used for the variography is restricted to data above 300 m depth below surface. SRK is of the opinion that data beyond the anticipated maximum open pit depth of 300 m should have been considered as they belong to the same geostatistical domain. Semi-variogram models generated by SRK compare reasonably to what underpins the grade estimation. At short ranges, the experimental semi variograms are well structured for almost all the variables under consideration.
| SRK | Report date: 27 May 2022 |
| | Effective Date: 31 December 2021 |
| | |
| SRK Consulting – 576060 SPM PSM Project TRS | Page 75 |
For the LPR mineralized zone, the variogram model of Ni was used for Pt and Pd due to the poorly structured experimental semi-variograms of Pt and Pd. SRK obtained moderately structured semi-experimental variograms for Pt and Pd after masking out a few data points. In SRK’s opinion, masking out a few data points does not materially impact the underlining grade distribution. A test run of randomly selected parent cells using SRK’s Pt and Pd variogram models does not materially differ from the grade estimates using the Ni variogram model. SRK considers the variogram parameters used in the resource estimation process a true reflection of the results from the variography.
A nugget and up to three spherical structures were used to model the experimental semi-variogram. Anisotropy was investigated but no strong preferred direction of continuity was identified and so laterally isotropic semi-variograms were modelled. The nugget was obtained by varying the lag and was modelled from either close spaced deflection data (omnidirectional variogram with a lag of approximately 1 m) or the variogram, whichever was lower. Semi-variograms were modelled for Pt, Pd, Rh, Au, Cu, Ni, Density and Length for each lithological unit or resource cut (S1).
Search Parameters
A maximum of three omnidirectional search passes were used to select samples for estimation for all the variables under consideration. The first search was restricted to the average spacing of 100 m. The second search was restricted to the variogram ranges of the individual variables. The third search populated the cells which had not been populated in the first and second pass. A minimum of eight and maximum of 20 samples were used in the first search, six and 20 respectively in the second and six and 40 respectively in the third search. SRK deems the minimum and maximum number of samples per search pass to be reasonable.
| 10.1.3 | Central Underground Block |
[SR3.7, SR4.2(i)-(iii)(v), SR4.3(i)]
Mineral Resource Cut
The definitions of the resource cut differ slightly from what is highlighted under section 10.1.1. The U2D resource cut under section 10.1.1 is the equivalent of the “UG2 Reef” resource cut defined here and as illustrated in Figure 10.2. Note that the combined U2P and U2L as defined above ( section 10.1.1) constitute the UG2L (Figure 10.2) with an average thickness of 20 cm. Here, the UPR resource cut comprises two facies, namely, the UPR lithological unit (as defined under section 10.1.1) and a lateral subset, the Potholed Upper Pseudo Reef (PUP) where the MR has either potholed onto or close to the UPR lithological unit as illustrated by the average thickness on Figure 10.2.
The primary target horizons are the UG2 Chromitite and the UG2 Leader Chromitite stringers which will be extracted in a single mining cut, and the PUP facies of the UPR resource cut. The UPR lithological unit itself is generally quite thin, and the mineralization is known to extend below the UPR in the PUP facies into the PRHZB (Figure 5.2). It is noted that outside of the PUP facies, neither the MR nor the UPR typically have sufficient mineralization on their own to justify extraction.
For the UG2 (equivalent of the U2), the main chromitite is easily distinguishable and is selected as the UG2 cut (refer to Figure 10.2). This cut is typically 1 m, but varies from as little as 4 cm, to as large as 10 m. The extremely large intersections are considered to be anomalous and are not used for modelling. Above this the UG2 Leader Chromitite is selected as the UG2L cut. The UG2L cut is taken from the top of the UG2 Chromitite to the top of the UG2 Leader Chromitite, a selection which is typically around 20 cm, but can be a small as 5 cm and as large as 67 cm. Above this is a waste cut selection (Inter-burden or INT2 cut) from the top of the UG2L to the base of the cuts around the UPR. This cut averages around 14 m, and varies between 8 and 20 m, and will typically include the UG2 leader hanging wall pyroxenite, the LPR and some portion of the PRHZB.
The next cuts are centred around the UPR lithological unit. The UPR cut, with a mean of 26 cm and varying from not developed at all to a maximum width of 1.33 m. Above this a ~20 cm cut of the pyroxenite or anorthosite (depending on the potholing of the Merensky) is selected as the TOP cut. If the Merensky Chromitite is identified the cut is extended to a maximum of 1 m above the top of the UPR lithological unit. This cut is 25 cm on average and varies from 15 cm to 100 cm. Below the UPR unit, a portion of the PRHZB is selected, making up the remainder of the PUP. This PRHZB component can vary from zero to 130 cm with an average of 70 cm. For the total UPR/PUP cut, an interval of 1.2 m is targeted. For the thickness modelling, only the mother hole thickness is used.
| SRK | Report date: 27 May 2022 |
| | Effective Date: 31 December 2021 |
| | |
| SRK Consulting – 576060 SPM PSM Project TRS | Page 76 |
The general stratigraphy in the UPR/PUP facies, cut definition and average thickness are illustrated in Figure 10.2.
A set of intersections was excluded from the modelling, as they were deemed to not be representative of the normal seam geology. There were eight holes intersecting the PUP and 23 holes intersecting the UG2. Each of the cuts in Figure 10.2 is estimated separately, but the UG2 and UG2L, and the PRHZB, UPR and TOP are aggregated into the UG2 Reef and PUP respectively for reporting purposes.

Figure 10.2: Central Underground - Underground estimate Mineral Resource cut definition
Wireframe modelling
Minex software described under section 10.1.1 was employed. SRK converted the elevation grids into conventional wireframes for the purposes of validation and visualisation outside of Minex. The Minex grids closely matched the mother hole intersection elevations and thicknesses. A 10 m grid was selected by SPM for the modelling, which is sufficient for the complexity of the orebodies observed and for the drill hole spacing over the project area.
Minex’s fault modelling is applied using strings digitized by SPM, which are based on assessing preliminary un-faulted grids. Once a fault has been added to the modelling process, it is treated as a hard boundary between data on either side, or in other words, the elevation grids are developed ignoring data across faults.
Compositing
The drill holes are composited over the full width of each mining cut, resulting in a single value per cut per intersection. The original samples are length weighted during compositing. There are instances, particularly with the UPR cut, where there are unsampled intervals, and in these instances, the unsampled interval is included in the composite, but contributes no metal or a grade calculated from the surrounding samples. SPM indicates that there are two instances where the interval may not have been sampled:
| • | One scenario is the sill that is part of the UPR cut at times, these sills are laterally extensive and will have to be mined; and |
| SRK | Report date: 27 May 2022 |
| | Effective Date: 31 December 2021 |
| | |
| SRK Consulting – 576060 SPM PSM Project TRS | Page 77 |
| • | In the second scenario the harzburgite itself was not sampled because there was no sign of visible mineralization. In this instance, the grade of the missing interval is defined based on the sample above or below, depending on which is expected to be of the same lithology. Typically, 10% of the value of the sample above is inserted as a dummy value; however, there were instances which differed, and 50%, 2%, and 100% of the value above or below was inserted, based on an assessment of the reason for the missing sample, and the surrounding grades and lithologies. |
SRK agrees that this is an appropriately conservative approach to treatment of the missing intervals. SRK has independently verified the compositing approach and is satisfied that it has been applied correctly.
Data statistics and Capping
The statistics of the full width composite data are presented in Table 10.4.
Table 10.4: Statistics of the estimated variables for the full width composites per seam
| Variable | Seam | Count | Minimum | Maximum | Mean | Std. Dev. | CoV |
| 4E (g/t) | TOP | 192 | 0.01 | 29.58 | 2.32 | 3.7 | 1.59 |
| 4E (g/t) | UPR | 205 | 0.1 | 48.58 | 9.58 | 8.91 | 0.93 |
| 4E (g/t) | PRH(G/T)ZB | 198 | 0.01 | 13.01 | 2.04 | 2.65 | 1.3 |
| 4E (g/t) | UG2L | 217 | 0.97 | 11.51 | 3.8 | 0.86 | 0.23 |
| 4E (g/t) | UG2 | 266 | 0.67 | 12.9 | 6.68 | 1.74 | 0.26 |
| Pt (g/t) | TOP | 192 | 0.01 | 24.29 | 1.47 | 2.63 | 1.79 |
| Pt (g/t) | UPR | 205 | 0.07 | 38.21 | 6.15 | 6.25 | 1.02 |
| Pt (g/t) | PRH(G/T)ZB | 198 | 0.01 | 7.91 | 1.22 | 1.61 | 1.32 |
| Pt (g/t) | UG2L | 217 | 0.61 | 7.33 | 2.37 | 0.56 | 0.24 |
| Pt (g/t) | UG2 | 266 | 0.46 | 7.37 | 3.91 | 0.95 | 0.24 |
| Pd (g/t) | TOP | 191 | 0.01 | 8 | 0.67 | 1 | 1.48 |
| Pd (g/t) | UPR | 205 | 0.03 | 13.1 | 2.82 | 2.27 | 0.81 |
| Pd (g/t) | PRH(G/T)ZB | 196 | 0.01 | 4 | 0.69 | 0.87 | 1.27 |
| Pd (g/t) | UG2L | 217 | 0.16 | 3.51 | 0.9 | 0.3 | 0.33 |
| Pd (g/t) | UG2 | 266 | 0.06 | 6.83 | 1.94 | 0.93 | 0.48 |
| Rh (g/t) | TOP | 48 | 0.05 | 0.79 | 0.16 | 0.14 | 0.87 |
| Rh (g/t) | UPR | 96 | 0.06 | 2.58 | 0.68 | 0.59 | 0.87 |
| Rh (g/t) | PRH(G/T)ZB | 51 | 0.05 | 0.72 | 0.17 | 0.13 | 0.76 |
| Rh (g/t) | UG2L | 217 | 0.12 | 1.34 | 0.47 | 0.1 | 0.22 |
| Rh (g/t) | UG2 | 266 | 0.13 | 1.38 | 0.79 | 0.17 | 0.22 |
| Au (g/t) | TOP | 155 | 0.01 | 1.44 | 0.18 | 0.18 | 0.99 |
| Au (g/t) | UPR | 204 | 0.01 | 1.67 | 0.29 | 0.23 | 0.79 |
| Au (g/t) | PRH(G/T)ZB | 175 | 0.01 | 0.57 | 0.11 | 0.13 | 1.14 |
| Au (g/t) | UG2L | 192 | 0.01 | 0.79 | 0.07 | 0.1 | 1.35 |
| Au (g/t) | UG2 | 230 | 0.01 | 0.48 | 0.05 | 0.05 | 1.06 |
| Cu (ppm) | TOP | 192 | 5 | 4 223 | 588 | 709 | 1.21 |
| Cu (ppm) | UPR | 205 | 12 | 6 384 | 958 | 755 | 0.79 |
| Cu (ppm) | PRH(G/T)ZB | 198 | 1.3 | 5 549 | 314 | 514 | 1.64 |
| Cu (ppm) | UG2L | 206 | 3 | 473 | 24 | 36 | 1.51 |
| Cu (ppm) | UG2 | 262 | 2.25 | 186 | 24 | 22 | 0.94 |
| Ni (ppm) | TOP | 192 | 21 | 6 449 | 1,007 | 1,150 | 1.14 |
| Ni (ppm) | UPR | 205 | 52 | 7 100 | 2,233 | 1,115 | 0.5 |
| Ni (ppm) | PRH(G/T)ZB | 198 | 35.38 | 5 565 | 1,513 | 987 | 0.65 |
| Ni (ppm) | UG2L | 194 | 67 | 1 399 | 250 | 130 | 0.52 |
| Ni (ppm) | UG2 | 237 | 40.23 | 487 | 154 | 68 | 0.44 |
| Density | TOP | 196 | 2.67 | 3.61 | 2.96 | 0.2 | 0.07 |
| Density | UPR | 205 | 2.66 | 3.71 | 3.07 | 0.2 | 0.06 |
| Density | PRH(G/T)ZB | 210 | 2.63 | 3.28 | 2.9 | 0.12 | 0.04 |
| Density | UG2L | 212 | 2.92 | 4.49 | 3.76 | 0.17 | 0.04 |
| Density | UG2 | 266 | 3.22 | 4.4 | 4.11 | 0.18 | 0.04 |
| Length (m) | TOP | 320 | 0 | 1.6 | 0.24 | 0.17 | 0.69 |
| Length (m) | UPR | 320 | 0 | 1.33 | 0.27 | 0.2 | 0.77 |
| Length (m) | PRH(G/T)ZB | 320 | -0.15 | 1.29 | 0.69 | 0.25 | 0.36 |
| Length (m) | UG2L | 333 | 0 | 0.67 | 0.19 | 0.09 | 0.47 |
| Length (m) | UG2 | 355 | 0 | 10.02 | 0.99 | 0.87 | 0.87 |
| SRK | Report date: 27 May 2022 |
| | Effective Date: 31 December 2021 |
| | |
| SRK Consulting – 576060 SPM PSM Project TRS | Page 78 |
SRK notes that the pattern of mineralization is consistent for the PGMs Pt, Pd, and Rh, with the highest grades in the UPR and UG2 cuts, followed by the UG2L, with the lowest grades in the TOP and PRHZB cuts. The gold and base metals distributions are also similar to one another, with the silicate cuts (UPR, TOP and PRHZB in that order) having the highest grades, while the UG2L and UG2 are significantly lower grade relative to the silicate reefs.
In the histograms it is observed that all the metals show a moderate to strong positively skewed distribution in the silicate reefs, and a similar distribution for gold and base metals in the UG2 package chromitite reefs. The PGMs in the UG2 reefs, however, have distributions that are not strongly skewed and are closer to a normal distribution, with a few isolated high-grade outliers.
The density is generally close to normally distributed, except for the TOP cut, which has a strongly bimodal distribution, likely due to the degree of potholing and the content of pyroxenite or anorthosite, and the PRHZB cut with has a less pronounced bimodal distribution.
SPM elected not to cap the composite grades but did cap the estimates. SRK undertook independent testing of the metal distribution of the composites, using a variety of tests based around the concept introduced by Parker (1991) of calculating cumulative population statistics, starting with the first two lowest value samples, and sequentially adding samples and recalculating the population statistics at each addition. Where addition of a sample results in a significant change in the population characteristics, this is an indication of a potential need for capping.
From SRK’s capping assessment some variables do not require any capping, and for some variables capping is recommended, dependent on the location of the high-grade values. Typically, if the high-grade value is in a well-informed area, it is preferable not to cap the value. However, if the high-grade value is on the periphery of the data, then it can potentially have a significant impact on the estimates.
SRK is of the opinion that capping is recommended for some of the silicate reef in the UPR cut, as there are some outliers on the periphery of the drilling data. The UG2 package however does not show such strongly positively skewed distributions, and the high-grade values that would be considered for capping are generally in well informed areas.
In the silicate cuts, the outliers are generally associated with the PUP facies. These should ideally be separately domained, assessed and estimated separately.
Variography
The grade estimates were generated in Minex using the Growth Algorithm (GA) and interpolated into 2D grids.
The Minex GA can simplistically be described as fitting a trend surface to a variable, treating the variable value as a Z elevation, although the details of the process are more sophisticated than this. Unlike kriging and inverse distance methods, the GA method can generate values that exceed the data values (Barber, 2011). The GA does not depend on an empirical assessment of the spatial continuity of a variable (such as the semi-variogram in linear geostatistics) but simply uses a scan distance defined by the user.
For all variables, SPM used a constant scan distance of 400 m. To assess the appropriateness of this, SRK generated experimental semi-variograms for some of the major variables and cuts. Based on a directionless and 2D directional experimental semi-variogram analysis undertaken for the UG2, UPR and TOP cuts for Pt and Ni, SRK concluded for standard linear geostatistical assessment the selected range of 400 m may be conservative for some variables, and optimistic for others. The validations conducted by SRK, however, show reasonable reproduction of the composite values in the estimates.
| 10.1.4 | East Underground Block |
[SR3.7, SR4.2(i)-(iii)(v), SR4.3(i)]
Mineral Resource Cut (MR)
Two lateral facies types are under consideration -the Pothole and Contact facies (see Figure 10.3). In both instances, the minimum vertical resource cut is 1.2 m. The distinction between the two facies is dependent on the vertical thickness of the MRFW anorthosite. Where the separation between the MR and UPR is less than or equal to 1 m, it is considered as Pothole facies. The converse holds for the Contact facies. The minimum resource cut for both facies is inclusive of 0.2 m of the MRHW. In effect, the UPR can directly underly the MR and thus be classified as a Pothole facies (Figure 10.3).
| SRK | Report date: 27 May 2022 |
| | Effective Date: 31 December 2021 |
| | |
| SRK Consulting – 576060 SPM PSM Project TRS | Page 79 |
With respect to the Pothole facies, when the combined cut of MRHW+MR+MRFW/UPR is less than 1.2 m, it is marked-up with additional samples from the underlying PRHZB – this is termed the MR-PUP in Figure 10.3. In the rare instance where the combined cut is exactly 1.2 m, it is capped with an additional sample from the PRHZB (i.e., termed MR-PUPTF in Figure 10.3), hence the likelihood of the Mineral Resource cut ranging from 1.2 m to 1.3 m. Both the resource cut for the MR-PUP and MR-PUPTF is hereafter referred as PUP; that of the MR Contact facies is MRC.
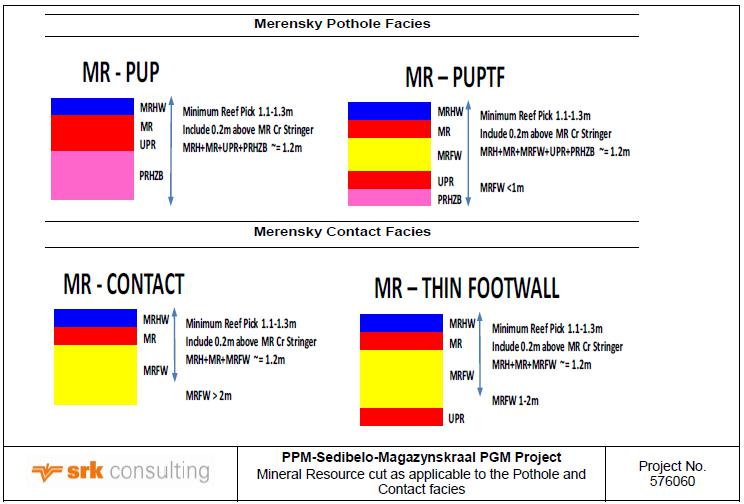
Figure 10.3: Mineral Resource cut as applicable to the Pothole and Contact Facies
In the opinion of SRK, the criteria used in differentiating the facies type is robust and eliminates all ambiguities. SRK has stepped through the composite assay dataset and is satisfied that the resource cuts of the individual samples meet the criteria as set out above.
Mineral Resource Cut (UPR)
The UPR resource area occurs outside the PUP, thus it acts as a lateral facies to the PUP. The distinction between the MRFW anorthosite as described for the MR above and that of the UPR is that the latter has a pegmatoidal pyroxenite (PPX) or pegmatoidal olivine pyroxenite (POOP) at the base of the MRFW anorthosite. Frequently, the top and bottom contact of the PPX or POOP has a chromitite stringer. Mineralization peaks on the lower chromitite stringer and occurs in the PPX above and extends 20-50 cm into the harzburgite below.
The minimum vertical resource cut applicable to the UPR is 1.2 m. The coded UPR zone extends from 0.2 m above the PPX or POOP (inclusive of the top chromitite stringer) into the overlying MRFW and downwards to the bottom of the PPX or POOP (inclusive of the lower chromitite stringer). The UPR resource cut extends into the underlying PRHZB when the combined MRFW+ UPR is less than 1.2 m. Whole PRHZB samples are added where the combined MRFW +UPR is less than 1.2 m. The Mineral Resource cut for the UPR reef ranges from 1.1 m and 1.2 m. The UPR is always capped with additional samples from the PRHZB to ensure a minimum vertical resource cut of 1.2 m. Figure 10.4 illustrates the stratigraphic components of the UPR Mineral Resource cut.
| SRK | Report date: 27 May 2022 |
| | Effective Date: 31 December 2021 |
| | |
| SRK Consulting – 576060 SPM PSM Project TRS | Page 80 |
SRK has stepped through the composite assay dataset and is satisfied that the resource cuts of the individual samples meet the criteria as described above.
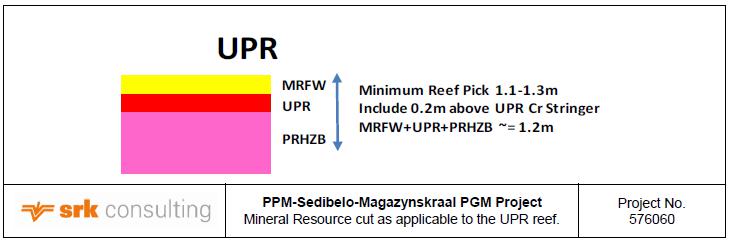
Figure 10.4: Mineral Resource cut as applicable to the UPR reef
Mineral Resource Cut (UG2)
The minimum vertical resource cut applicable to the UG2 is 1.2 m. The coded UG2 zone includes the U2L and U2P where present, together with U2. The UG2 resource cut extends into the underlying UG2 footwall (UG2FW, labelled as U2F in Figure 10.5 and the equivalent of UG2PEG elsewhere) when the combined U2L+U2P+U2 is less than 1.2 m. Whole UG2FW samples were added where the combined U2L+U2P+U2 was less than 1.2 m. The resource cut for the UG2 reef ranges from 1.1 m to 1.2 m; however, the resource cut does extend beyond this in instances where the U2 package is thicker. The UG2 is always capped with additional samples from the UG2FW to ensure a minimum vertical resource cut of 1.2 m. Figure 10.5 illustrates the stratigraphic components of the UG2 Mineral Resource cut.
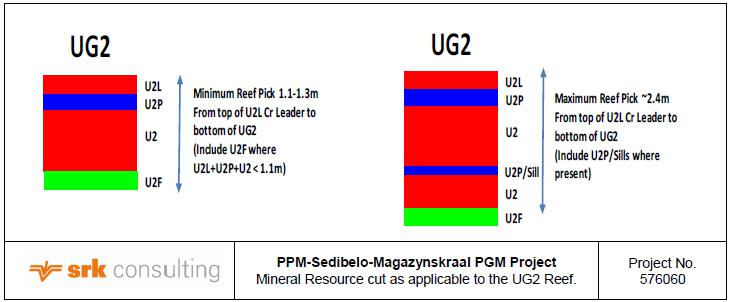
Figure 10.5: Mineral Resource cut as applicable to the UG2 Reef
SRK has stepped through the composite assay dataset and is satisfied that the resource cuts of the individual samples meet the criteria as described above.
Data Statistics and Capping
The raw datasets for both PUP and MRC show that there is a strong bivariate relationship amongst the five PGMs (Pd, Pt, Rh, Ru and Ir). Based on this strong relationship, a regression formula deduced and used as the basis for assigning regressed values to all PGM un-sampled intervals. A constant value is assigned to Ir because it was often below detection limit. SRK has reviewed the approach and is of the opinion that the methodology is appropriate. There are no regressed values for Au, Pd and Pt because values are available for all samples.
Full width composites were derived from the raw dataset after the regression analysis. The length and ‘triple accumulation’ (i.e., the product of thickness, grade and density) was estimated. Final block grade was calculated by dividing the estimated accumulation by the estimated thickness.
| SRK | Report date: 27 May 2022 |
| | Effective Date: 31 December 2021 |
| | |
| SRK Consulting – 576060 SPM PSM Project TRS | Page 81 |
SRK reviewed the outliers in the dataset and is satisfied that the capped values applied to each of the variables do not significantly impact on the global mean of the dataset as shown in Table 10.5. The UG2 metal grade and accumulation did not show any material anomaly to warrant cutting.
Table 10.5: MR High Grade Cuts – Intercept Accumulations
| | Au*VW*SG | Pt*VW*SG | Pd*VW*SG | Rh*VW*SG | Ru*VW*SG | Ir*VW*SG |
| | (mg/t) |
| PUP | | | | | | |
| Cut Value | Nil | Nil | 30 | 5 | 10 | 2 |
| # of Composites | | | 1 | 1 | 1 | 1 |
| Uncut Mean | 0.21 | 14.25 | 6.65 | 1.24 | 2.02 | 0.4 |
| Cut Mean | 0.21 | 14.25 | 6.47 | 1.23 | 2 | 0.39 |
| MRC | | | | | | |
| Cut Value | Nil | Nil | Nil | Nil | Nil | 2.5 |
| # of Composites | | | | | | 1 |
| Uncut Mean | 0.38 | 5.19 | 2.12 | 0.41 | 0.72 | 0.18 |
| Cut Mean | 0.38 | 5.19 | 2.12 | 0.41 | 0.72 | 0.17 |
| UPR | | | | | | |
| Cut Value | Nil | Nil | Nil | Nil | Nil | 2.5 |
| # of Composites | | | | | | 1 |
| Uncut Mean | 0.28 | 4.33 | 2.41 | 0.39 | 0.60 | 0.12 |
| Cut Mean | 0.28 | 4.33 | 2.41 | 0.39 | 0.60 | 0.118 |
Note:
VW is Vertical Width of composite.
Semi-variography (MRC & PUP)
The MR experimental semi variograms and cross-variograms for 4E accumulations show a similar structure to that of the PUP (Figure 10.6) which can be considered to be poorly to moderately structured. SRK is of the opinion that the structures observable in the MRC and PUP experimental semi-variograms are not robust.
| SRK | Report date: 27 May 2022 |
| | Effective Date: 31 December 2021 |
| | |
| SRK Consulting – 576060 SPM PSM Project TRS | Page 82 |

Figure 10.6: PUP Variogram and Cross-Variogram Models – 4E Metal Accumulation
| SRK | Report date: 27 May 2022 |
| | Effective Date: 31 December 2021 |
| | |
| SRK Consulting – 576060 SPM PSM Project TRS | Page 83 |
With respect to the PUP, a lag of 100 m was used to compute the experimental variograms (Figure 10.6). The PGM accumulations exhibit moderate to high relative nugget effects (50-60%) and demonstrate maximum continuity of around 750 m. A notable feature of the PUP variography is that a significant proportion of the total variance is accounted for at relatively short distances (150 to 200 m). This feature of the variogram indicates the presence of significant short scale variability of grades and widths within the pothole zone. In the case of MCR, a lag of 150 m was used to compute the experimental variograms. The PGM accumulations exhibit moderate to high relative nugget effects (50-60%) and demonstrate maximum continuity of around 1 400 m.
For the vertical width volume estimation, all the PUP and MRC vertical data were combined. The experimental variogram for the combined dataset is poorly structured up to 500 m with maximum continuity up to 1 400 m. The poorly structured component of the experimental variogram indicates the likelihood of significant spatial variability at a more local scale.
SRK has tested the suitability of the experimental variograms in different directions and using different lags and is of the opinion that the models are appropriate.
Semi-variography (UPR)
SRK is of the opinion that the experimental semi-variograms/cross-variograms for the variables under consideration are moderately to well structured (Figure 10.7).The accumulation cross-variograms confirm that a moderate to strong spatial correlation exists between the PGM variables. The relationship between the PGMs thus supports the application of a multivariate estimation method. A lag of 150 m was used to compute the experimental semi-variograms. The PGM accumulations exhibit moderate to high relative nugget effects (40-60%) and demonstrate maximum continuity of around 1 300 m.
The short scale structure (up to 300 m) notable in the vertical thickness variogram model is moderately to well-structured until 300 m. SRK finds the variogram models to be appropriate.
| SRK | Report date: 27 May 2022 |
| | Effective Date: 31 December 2021 |
| | |
| SRK Consulting – 576060 SPM PSM Project TRS | Page 84 |
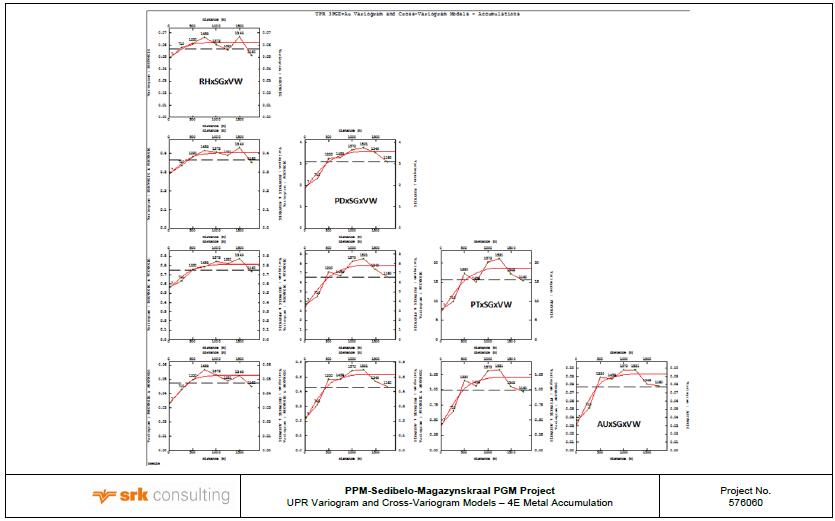
Figure 10.7: UPR Variogram and Cross-Variogram Models – 4E Metal Accumulation
| SRK | Report date: 27 May 2022 |
| | Effective Date: 31 December 2021 |
| | |
| SRK Consulting – 576060 SPM PSM Project TRS | Page 85 |
Semi-variography (UG2)
2D Variograms and cross-variograms were computed for all the PGMs and Au metal accumulations together with density weighted vertical width. The variograms and cross-variograms for 4E accumulations are shown in Figure 10.8 for UG2. Except for Au, the semi experimental variograms/cross variograms are moderately to well structured. The models fitted unto the experimental semi variograms for Rh, Pd, Pt are reasonably robust.
The simple and cross-variograms for the Pt, Pd and Rh share similar spatial structure and variance proportions (intrinsic correlation) and thus support the use of a simplified single variogram model for all variables. A lag of 100 m was used to compute the experimental semi variograms. The PGM accumulations exhibit low to moderate relative nugget effects (20-40%) and demonstrate maximum continuity of around 1 000 m. Au was estimated independently considering its poor spatial correlation with the other PGMs.
| SRK | Report date: 27 May 2022 |
| | Effective Date: 31 December 2021 |
| | |
| SRK Consulting – 576060 SPM PSM Project TRS | Page 86 |

Figure 10.8: UG2 Variogram and Cross-Variogram Models – 4E Metal Accumulation
| SRK | Report date: 27 May 2022 |
| | Effective Date: 31 December 2021 |
| | |
| SRK Consulting – 576060 SPM PSM Project TRS | Page 87 |
SRK has tested the suitability of the experimental variograms in different directions and using different lags and is of the opinion that they are appropriate.
Figure 10.9 shows the variogram model based on all available UG2 vertical thickness data. The resulting experimental variogram and fitted model demonstrates exceptional structure and continuity with a maximum range of 2 000 m.

Figure 10.9: UG2 Variogram – vertical width used for volume estimate search radius
Based on a Quantitative Kriging Neighbourhood Analysis (QKNA), a search radius of 1 500 m quadrant search was used with a minimum of three and maximum of 20 intercepts for both the PUP and MRC estimations. SRK deems the results satisfactory for this style of mineralization. The same search radius parameters were applied for the UPR and UG2. SRK is of the opinion that ideally, QKNA should have been carried out separately for each of the mineralized units.
| 10.2 | Mineral Resource estimation |
[§229.601(b)(96)(iii)(B)(11)(ii)] [SR2.1(iii), SR4.1(iv)(v)(vi), SR4.2(ii)(iv)(v)(vi), SR4.3(i), SR4.5(ii)(iv)(v)(vi)]
The PGM and base metal grade estimations were carried out in Minex software using a grid mesh size of 10 m x 10 m (2D) per mining unit across the entire project area for both structural and assay grids. With an average drill hole spacing of 50 m x 50 m, this grid mesh size is smaller than the generally recommended minimum mesh size of half the average drill hole spacing. The same configuration was used for the Cr estimates. Due to the wider spacing of Cr drill hole intersection, the estimation grid size is also smaller than justified.
The PGM and base metal resource estimations were carried out using ordinary kriging (OK). The experimental semi-variograms are noted to be reasonably structured for all the variables and hence the application of the kriging algorithm for estimation is appropriate. SRK has noted that the weathered zone is excluded from the resource model.
The UG2 Cr resources were estimated using the Minex growth algorithm, with a search distance of 300 m, and no constraints on the number of samples used. SRK generated an experimental semi-variogram with a short-range of approximately 150 m, and a long range of approximately 900 m.
The structures contributing to the geological loss are faults, dykes and potholes. The footprint of the “known” geological loss is informed by pit mapping and geophysics. In the final block models, it is observed that known areas of dykes, fault and pothole intersections have been excluded from the models.
| SRK | Report date: 27 May 2022 |
| | Effective Date: 31 December 2021 |
| | |
| SRK Consulting – 576060 SPM PSM Project TRS | Page 88 |
An additional 15% geological loss has been applied to all the block models (i.e., PGMs, base metal and chrome) to account for any unknown faulting, which is consistent with the practical experience gained since the open pit has been operational.
The PGM and base metal Mineral Resource estimation was carried out using OK. The attainment of structured experimental variograms justifies the use of OK. With an average drill hole spacing of 100 m within the optimised pit shell, the parent block size of 50 m x 50 m x 10 m per reef package is appropriate. Parent cell estimation was carried out using a cell discretisation of 6 m x 6 m x 1 m. The top capped composite data files were used for the resource estimation. Because the top and bottom contacts of each reef were modelled using wireframes, any areas where potholes exist is reflected in the geological models and resulting block models.
Known areas of dyke intersection (as delineated using geophysical surveys) are also excluded. A 5% geological loss has been applied to the Mineral Resource estimate to account for any unknown dyke and pothole losses.
The UG2 chrome grade estimate is purely based on classical statistics. Due to the paucity of chrome assays within the Sedibelo property in general (and none within the East Pit footprint), SRK carried out multi-variate analysis on the combined chrome and density sample data of the adjoining projects (i.e., Magazynskraal and West Pit). Based on regression analysis, SRK modelled the best-fit relationship between chrome and density for each of the UG2 subunits (i.e., U2, U2L, U2P and U2PEG). The sub-unit U2 demonstrated the strongest correlation between density and chrome, as shown Figure 10.10.
Considering that there are density data points at East Pit and Central Underground, SRK used the regression equations established for the different UG2 sub-units to calculate the chrome grades for each of the data points for both footprints. Because of the uncertainty in the actual chrome grades at the drill hole locations, SRK calculated a de-clustered mean value from the calculated chrome grades, and estimated an average chrome grade for each unit, based on the tonnage estimated for the PGM Mineral Resources.
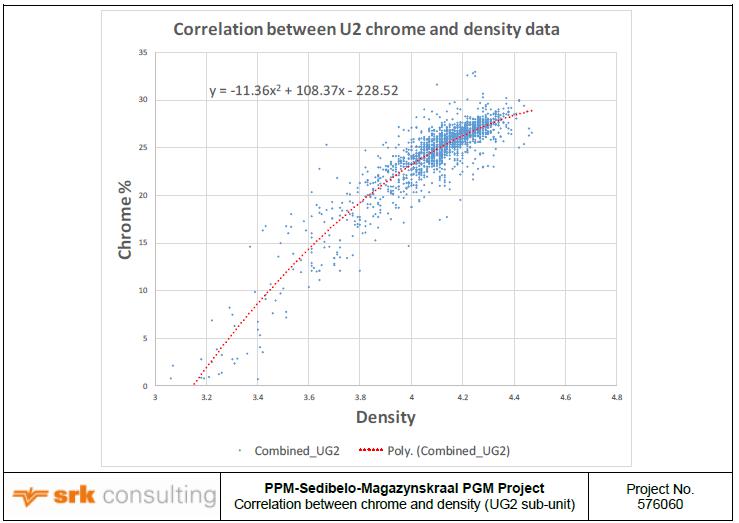
Figure 10.10: Correlation Between Chrome and Density (UG2)
| SRK | Report date: 27 May 2022 |
| | Effective Date: 31 December 2021 |
| | |
| SRK Consulting – 576060 SPM PSM Project TRS | Page 89 |
| 10.2.3 | Central Underground Block |
[SR2.1(iii),]
SPM did not define any estimation domains for the UG2 package cuts and SRK did not find any rationale for defining sub domains when assessing the UG2 package cuts data. While there are some higher and lower grade composites in many of the variables, the distributions are generally tightly constrained and approximately symmetrically distributed.
For the UPR and surrounding cuts, a set of polygons which outline the PUP facies where the units are potholed together was defined. SRK’s validations of the estimates indicate that it is advisable to estimate the PUP areas and non-potholed areas independently, as there are different population characteristics between the potholed and non-potholed areas in the TOP and UPR cuts. The differences are observed most strongly in the density, base metals and gold, but also in the PGM values, all of which are elevated in the potholed facies. Failing to constrain these higher value populations can result in over estimation, where these intersections are in poorly informed or peripheral areas.
SRK notes that future work would consider independent estimates using the PUP outlines as hard domain boundaries. The impact of the lack of domain boundaries is discussed in the validations. To address the impact of the skewed distribution and the location of the high values on the southern periphery of the deposit, these polygons were used to constrain the Mineral Resource reporting, and only the areas within these polygons are reported as a Mineral Resource. This is also consistent with the Mineral Reserve reporting, as only PUP facies areas are targeted for mining.
Because the GA can generate estimates that are greater than the input variables maximum values and lower than the minimum, a set of limits was imposed on the estimates during estimation. These are tabulated in Table 10.6, and the percentage of estimates which were affected by the top capping in Table 10.7. Only a small number of estimates required capping.
Table 10.6: Lower and upper caps enforced on the estimates
| Limit | Cut | Pt (g/t) | Pd (g/t) | Rh (g/t) | Au (g/t) | Ni (ppm) | Cu (ppm) | Density |
| Lower | TOP | 0.01 | 0.01 | 0.01 | 0.01 | 0.01 | 0.01 | 2.68 |
| UPR | 0.07 | 0.03 | 0.01 | 0.01 | 12.45 | 52.00 | 2.69 |
| PRHZB | 0.01 | 0.01 | 0.01 | 0.01 | 0.01 | 0.01 | 2.68 |
| UG2L | 0.01 | 0.01 | 0.01 | 0.01 | 0.01 | 0.01 | 3.12 |
| UG2 | 0.01 | 0.01 | 0.01 | 0.01 | 0.01 | 0.01 | 3.50 |
| Upper | TOP | 8.30 | 5.04 | 0.40 | 0.46 | 2 200 | 3 900 | 3.40 |
| UPR | 21.48 | 7.67 | 2.36 | 0.93 | 2 500 | 5 000 | 3.52 |
| PRHZB | 5.80 | 3.29 | 0.39 | 0.41 | 1 775 | 3 300 | 3.23 |
| UG2L | 3.72 | 1.84 | 0.73 | 0.36 | 80 | 651 | 4.49 |
| UG2 | 6.05 | 5.51 | 1.38 | 0.48 | 76 | 391 | 3.40 |
Table 10.7: Percentage of estimates capped
| Cut | Pt (g/t) | Pd (g/t) | Rh (g/t) | Au (g/t) | Ni (ppm) | Cu (ppm) | Density |
| TOP | 0.38% | 0.19% | 0.18% | 0.25% | 0.13% | 0.25% | 0.13% |
| UPR | 0.92% | 0.63% | 0.03% | 0.25% | 0.13% | 0.25% | 0.09% |
| PRHZB | 0.28% | 0.44% | 0.06% | 0.28% | 0.63% | 0.16% | 0.06% |
| UG2L | 0.13% | 0.13% | 0.00% | 0.27% | 0.13% | 0.54% | 0.13% |
| UG2 | 0.63% | 0.00% | 0.00% | 0.00% | 0.00% | 0.60% | 0.00% |
Figure 10.11 is a Pt post plot of the grade estimates; similar plots were undertaken for Ni, density and vertical thickness respectively. The Pt plot is generally representative of the PGM and Au distributions, while the Ni plot has similar patterns to and is representative of the distribution of grade for Cu. The highest grades for the PGMs and Au are the UPR and UG2, with the TOP and PRHZB cuts locally enriched due to potholing. It is clear from Figure 10.11 that the elevated grades are not limited to the potholed areas, as would be expected. In addition, the periphery of the UPR, particularly to the south and east shows very high grades, is not informed by densely-distributed data.
The density estimates indicate higher densities associated with the chromitite UG2 package cuts compared to the silicate cuts. The thickest units are the UG2 package cuts followed by the PRHZB cut.
| SRK | Report date: 27 May 2022 |
| | Effective Date: 31 December 2021 |
| | |
| SRK Consulting – 576060 SPM PSM Project TRS | Page 90 |

Figure 10.11: Plan view of the Pt grade estimates for the Mineral Resource cuts
UG2 Chromitite Resource estimation
The description of the East Pit chrome estimate process applies equally here.
| 10.2.4 | East Underground Block |
Pothole Boundary (MR & UPR)
With the understanding from the nearby deposits that the MR and UPR are generally enriched within the pothole areas, separate estimation treatment to the surrounding contact facies material was warranted. Indicator kriging was thus carried out to delineate the boundary between these facies. Based on the kriging outcome, it was observed that the PUP facies tends to become more discontinuous or 'broken up' where drill hole density is relatively high. The intent of the indicator kriging exercise was to ensure that MR estimation was carried out into blocks/locations identified by the different facies. This is only a representation and may not necessarily reflect the precise location of the boundary. The uncertainty with respect to the pothole boundary is aggravated where drill spacing is wider.
| SRK | Report date: 27 May 2022 |
| | Effective Date: 31 December 2021 |
| | |
| SRK Consulting – 576060 SPM PSM Project TRS | Page 91 |
SRK is satisfied with the methodology employed in delineating the ‘hard’ boundary.
Estimation Methodology
The estimation of the PUP and MRC is based on a 2D metal accumulation approach. The PUP and MRC accumulations and density weighted vertical width were estimated using both Ordinary Co-Kriging and univariate OK. In the case of univariate OK, the estimation of density weighted vertical width uses the same variogram model as for the accumulations. This simplification ensures no instability in the back calculated grades due to unstable or unexpected width estimations which may occur when a different variogram is used. The parent block size is 100 m x100 m in the X-Y plane. Block discretisation is on a 5 m x 5 m in the X-Y plane. SRK cannot confirm the basis of the choice of the block size. SRK has noted that the dataset is not on a regular grid - the average drill hole spacing increases from West to East and ranges from 100 m to 500 m.
The methodology and estimation parameters used for the UPR and UG2 are the same as for the PUP and MRC. The drill hole distribution is close to uniformity towards the central and western portion of the UPR lease boundary and has an average drill hole spacing of 100 m. On the eastern portion, the average drill hole spacing is in the range of 400 m to 500 m. SRK is of the opinion that the block size (100 m x 100 m) is sub-optimal in the eastern portion and notes that this is reflected in the resource classification.
Comparison between Multivariate Co-Kriging and Univariate OK (MR)
There is a strong correlation between the co-kriged and univariate OK estimates for the PUP; the correlation for MRC is less robust. The Mineral Resource statement is however based on univariate OK estimates. The local scale instability in the PUP multivariate results and misgivings with respect to the stability of MRC multivariate results is the primary reason for opting for the univariate OK estimates. Multivariate analysis works best in the determination of values for unsampled data points for certain variables and this was done when the raw data was transformed into intercept data. SRK is satisfied with the choice of univariate OK estimates.
Comparison between Multivariate Co-Kriging and Univariate OK (UPR)
The correlation between the co-kriged and univariate OK estimates for the UPR is also less robust in comparison with the PUP described above. The univariate OK estimates were preferred to the co-kriged estimates for the same reasons highlighted above for MR. SRK is satisfied with the choice.
Comparison between Multivariate Co-Kriging and Univariate OK (UG2)
Comments and choice of kriged estimate are the same as above.
Vertical Width for Volume Model
Volume estimates for all reefs were achieved by applying an OK vertical width estimate to the relevant structural surface. The PUP and MRC intercept composites were combined for the purposes of estimating the Merensky volume model.
The same process was followed for the UPR and UG2 reefs.
UG2 Chrome Estimates
It is noted that only a subset of the drill hole data within the central portion of Magazynskraal was analysed for chrome. A chromite Mineral Resource estimate was compiled to cover the lateral extent of the chrome data points (Figure 10.12). Resource estimation was carried out in Minex software using 2D grids. The UG2 chrome resources were estimated using the Minex growth algorithm, with a search distance of 300 m, and no constraints on the number of samples used. In the validation process, SRK’s variography indicated an experimental semi-variogram with a short-range of approximately 260 m, and a long range of approximately 600 m. SRK thus considers the search distance of 300 m to be appropriate. The block estimate is based on a mining cut dataset which encompasses a full width composite of the UG2.
Outside of the block model, SRK has extrapolated the average chrome grade (based on the block estimate) into the entire project footprint. The maximum distance of extrapolation is approximately 2 km.
| SRK | Report date: 27 May 2022 |
| | Effective Date: 31 December 2021 |
| | |
| SRK Consulting – 576060 SPM PSM Project TRS | Page 92 |
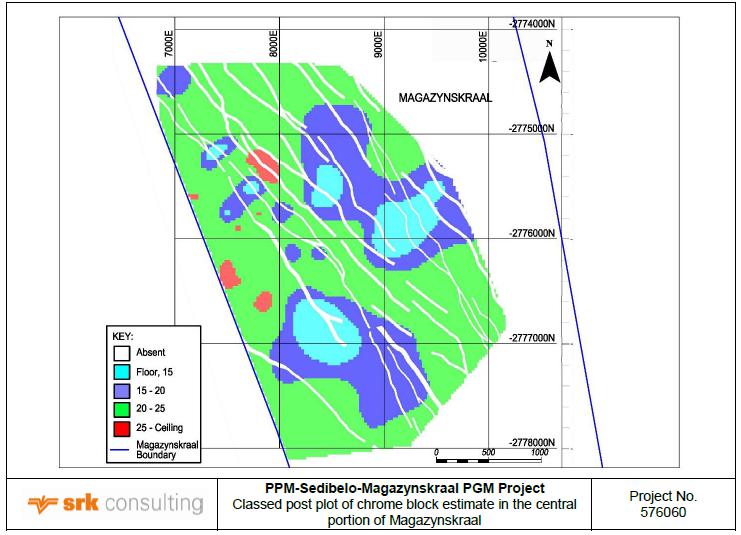
Figure 10.12: Classed post plot of chrome block estimate in the central portion of Magazynskraal
| 10.2.5 | Low grade stockpiles |
PGMs in Historic Tailings
PPM’s TSF PGM metal content and grade profile are based on back-calculated values from the concentrator plant mass balance up to December 2021. There has been no drilling activity on the TSF and hence no assay records exist for direct Mineral Resource estimation.
The surveyed volumes of the TSF as at December 2020 (in a form of solid wireframes) and records of monthly deposition from January 2021 to December 2021 are the fundamental data that underpin the TSF’s volume and tonnage calculation. This is complemented by the concentrator plant mass balance records in determining the grade profile and metal content. Differences in bulk density of the TSF material prior and subsequent to 2016 have resulted in using weighted averages in calculating tonnage. The difference noted with the density is primarily due to changes in the mineral composition of the TSF material. Prior to December 2016, chromite was not extracted as a by-product and thus ended up on the TSF. Subsequently, the chromite is extracted prior to deposition which thus result in a significant reduction in the bulk density of the TSF material.
Due to material differences in the bulk density of the TSF before and after the December 2016 declaration, the bulk density value is based on a weighted average calculated from the corrected 2016 tonnage and given density, and the tonnage difference between the two solid wireframes using an empirically determined density value (1.6 t/m3) subsequent to 2016.
DMS and Scats discards
The volume, tonnage and 4E grade of the DMS and scats discards as provided to SRK are also based on back-calculation from the concentrator plant mass balance up to December 2020. Similar to the TSF, surveyed volume in the form of solid wireframe was provided with effective date of December 2020. PPM provided empirical bulk density data/results that informs the tonnage calculation. SRK reviewed the methodology and is satisfied with the approach and the results.
| SRK | Report date: 27 May 2022 |
| | Effective Date: 31 December 2021 |
| | |
| SRK Consulting – 576060 SPM PSM Project TRS | Page 93 |
The estimation technique (i.e., kriging) for the in-situ PGM materials is the common technique applicable across the BC. With a robust geological model in place, SRK is of the opinion that any alternative estimation technique based on reasonable estimation methodology/processes will not yield results (i.e., grade and ounces) materially different from what SRK has stated.
| 10.3 | Mineral Resource classification criteria and uncertainties |
[§229.601(b)(96)(iii)(B)(11)(iv)] [SR4.2(ii), SR4.3(i), SR4.4(i)]
The classification of the resource estimate was based on the following criteria:
| 1. | The quality of the QA/QC results; |
| 2. | The geological confidence, which is dependent on the spacing and structural confidence; and |
| 3. | The geostatistical/estimation confidence, which amongst other factors such as estimation method, is also dependent on the search pass. |
The quality of the QA/QC results in SRK’s opinion is satisfactory and hence does not warrant a downgrade of any part of the Mineral Resource categories . With respect to the geological confidence, five different areas which were delineated within the resource area (Figure 10.13) based on the types, combinations and amount of structural data available, were scored from highest to lowest confidence as follows:
| • | Score 4 (green) - A high geological confidence refers to areas with structural control drilling, and in pit mapping; |
| • | Score 3 (yellow) - Areas where diamond drilling and pit mapping is available; |
| • | Score 2 (brown) - Areas where diamond drill holes are spaced less than 125 m apart; |
| • | Score 1 (red) - Areas where diamond drill holes are spaced wider than 125 m; and |
| • | A fifth area of highly faulted ground was defined (blue). A downgrading in the structural confidence was applied to this area. |
SRK is satisfied with the geological confidence classification.
The estimation confidence considered the search distance applied during grade estimation using OK. The highest confidence to lowest confidence for each unit was subsequently consolidated to get an overview of the entire area as shown in Figure 10.13:
| • | High confidence area (within green polygon). Kriging estimation using a 190 m search distance; |
| • | Intermediate confidence area (within blue polygon but excluding green polygon). Kriging estimation using a 300 m search distance beyond 190 m; and |
| • | Low confidence area (within red polygon but excluding blue and green polygons). Kriging estimation using a 500 m search distance beyond 300 m. |
Upon superimposition of all the confidence plots per modelled unit, the overall trend as observed in the superimposed plots was delineated and scored. It is based on these trends that the resource classification was done. The resource classification plot as shown in Figure 10.13 is for the U2 unit.
The classification of the Cr Mineral Resources is based on a combination of the above criteria, where the geological modelling confidence is the same as that of the PGMs but the grade estimates are based on a smaller, wider spaced dataset. However, the longer ranges of continuity in the Cr grades confer greater confidence in estimates at longer ranges. The U2 classification was thus adopted for the Cr estimate but downgraded the Measured Resource footprint to Indicated Resources due to the lack of QA/QC assays for Cr. SRK has noted that the Inferred Resources for Cr are less than the Inferred for the PGMs, due to lack of Cr assays in the Sedibelo West area drilled by Barrick. Note that the reporting is limited to the volumes within the optimised pit shell, and also excludes explicitly modelled geological losses (thin S1 reef areas, and modelled faults and dykes).
SRK has reviewed the resource classifications in all the models representing the reef packages and is satisfied with the assigned confidence categories.
The TSF DMS and Scat material are declared at an Inferred Mineral Resource category.
| SRK | Report date: 27 May 2022 |
| | Effective Date: 31 December 2021 |
| | |
| SRK Consulting – 576060 SPM PSM Project TRS | Page 94 |
The West Pit classification criteria is broadly applicable here.
The QA/QC data is satisfactory and hence it has not impacted on the classification footprints based on the remaining criteria.
The geological confidence is based on different search distance thresholds. The following confidence categories were delineated:
| • | A high geological confidence footprint with less than 200 m drill hole spacing; |
| • | A medium geological confidence footprint with approximately 200 m drill hole spacing ; and |
| • | A low geological confidence footprint with drill hole spacing greater than 200 m. |
Areas with high structural complexity were defined separately with a resulting down grade to their geological confidence. This ultimately resulted into two major footprints; medium and low geological confidence. SRK is satisfied with the exclusion of the high geological confidence category considering that it is premature at this stage of the project for grade control drilling and pit mapping.
The estimation confidence is informed by the search pass, with the first search pass being high estimation confidence, the second medium estimation confidence and the third search pass being low estimation confidence.
The Mineral Resource classification is the combination of the data confidence (which is considered high across the entire project area), the geological and the estimation confidence. The lower of the latter two was the accepted overall confidence. High, medium and low overall confidence translates to Measured, Indicated and Inferred classifications. A Measured Mineral Resource footprint was not declared due to the downgrade of the high geological confidence into a medium category. The classified Mineral Resources are illustrated in Figure 10.14 for each of the packages. The Cr Mineral Resources is reported at an Inferred category because the estimates are based on a regressed analysis. Note that the reporting is limited to the volumes within the optimised pit shell, and also excludes explicitly modelled geological losses (thin S1 reef areas, and modelled faults and dykes).
SRK has reviewed the resource classifications in all the models representing the reef packages and is satisfied with the assigned confidence categories.
| SRK | Report date: 27 May 2022 |
| | Effective Date: 31 December 2021 |
| | |
| SRK Consulting – 576060 SPM PSM Project TRS | Page 95 |

Figure 10.13: West Pit – confidence classifications
| SRK | Report date: 27 May 2022 |
| | Effective Date: 31 December 2021 |
| | |
| SRK Consulting – 576060 SPM PSM Project TRS | Page 96 |
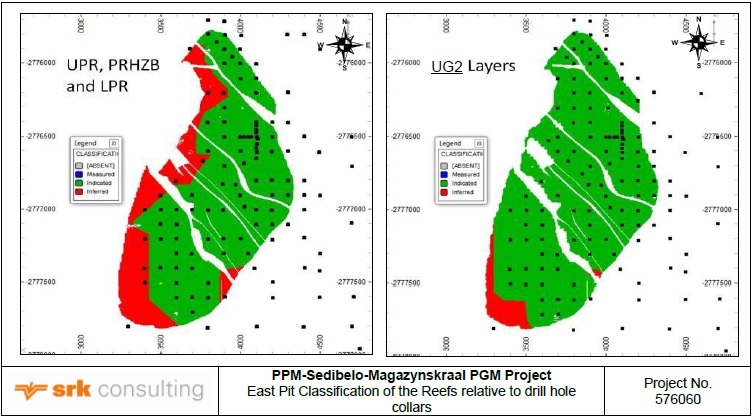
Figure 10.14: East Pit classification of the reefs
| 10.3.3 | Central Underground Block |
The classification of the Mineral Resources considers several aspects of the data quality and estimation. The quality of the data is considered to be high, due to the confidence in the location of the data, due to accurate surveys, detailed and appropriate geological logging, sampling procedures which are consistent with industry best practice, and confidence in the accuracy of the analytical results, as determined thought the comprehensive QA/QC programme. The geological modelling honours the location and distribution of data well, and the structural interpretation has resulted in a sensible model, which is consistent with the understanding of the orebody and structural environment in the area.
Although the Minex GA method does not output statistical indicators of the quality of the estimate, such as the Regression Slope (RS) and Kriging Efficiency of Kriging, previous studies and estimates over the deposit, as well as the widely accepted continuity of the orebodies of the BC, provide a background within which to consider the classification. SPM’s classification is primarily based on the data spacing, and on the experience of the Competent Person.
Where the drill hole spacing is approximately 250 to 300 m, SPM has classified the Mineral Resources as Indicated, and beyond that the Mineral Resource is classified as Inferred. Where there is lower confidence in the estimates due to a very wide grid, and extrapolation of distances greater than 400 m, or across faults with large throws which are poorly understood, no Mineral Resource is declared (the estimates remain unclassified). The classification of the Mineral Resources is illustrated in Figure 10.15 to Figure 10.17 for the PUP package, PUP package that is reported as a Mineral Resource (i.e., within the PUP facies) and the UG2 Package respectively.
The chromitite estimates are classified as an Inferred Mineral Resource. The data density is not sufficient to support Measured and Indicated Mineral Resources for the PGM volumes, tonnes and 4E grades; the regression relationship between the density and chrome grade is relatively robust for the U2 but not as strong for the U2L. However, the lack of assays to confirm the grades and enable a robust spatial estimate to be determined limit the confidence in the chromitite estimates to the Inferred category.
| SRK | Report date: 27 May 2022 |
| | Effective Date: 31 December 2021 |
| | |
| SRK Consulting – 576060 SPM PSM Project TRS | Page 97 |
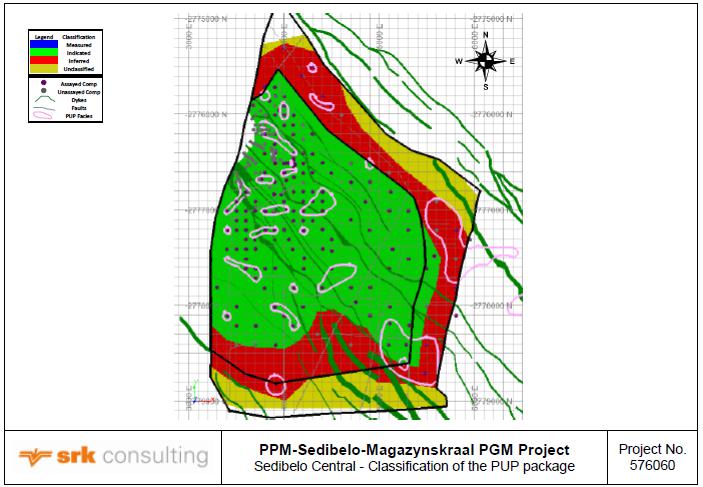
Figure 10.15: Sedibelo Central - Classification of the PUP package
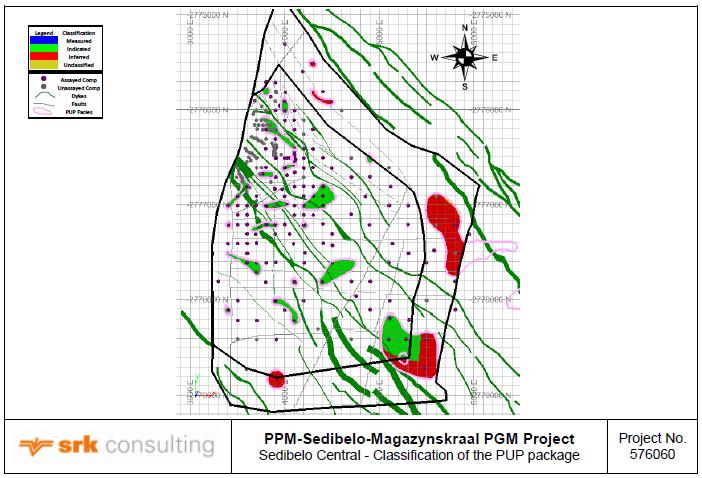
Figure 10.16: Sedibelo Central - Classification of the PUP package declared as a Mineral Resource
| SRK | Report date: 27 May 2022 |
| | Effective Date: 31 December 2021 |
| | |
| SRK Consulting – 576060 SPM PSM Project TRS | Page 98 |
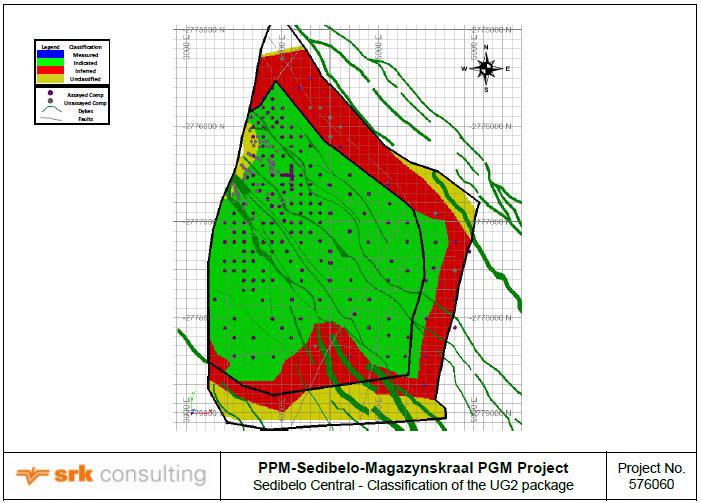
Figure 10.17: Sedibelo Central - Classification of the UG2 package
| 10.3.4 | East Underground Block |
The classification criteria considered the following:
| 2. | Structural complexity and geological continuity; and |
| 3. | Geostatistical confidence. |
Three categories were delineated with respect to geostatistical confidence; namely high, moderate and low. The geostatistical confidence is dependent solely on the RS output parameter from the kriging process. This was analysed via RS classed post plots for all the accumulation variables and vertical width estimated. Upon superimposition of the RS footprints for all the variables per reef type, representative footprints as per the three categories were delineated. Figure 10.18 provides a pictorial view of the overall geostatistical confidence for the MR; it is noted that the greater the drill hole density, the higher the RS which is an indication of a high confidence in the estimation results. This was done for the UPR and UG2 packages as well. Generally, the estimation confidence has a direct linear relation with the drill hole density and the RS. The RS for Au accumulation is generally weaker than the PGMs due to the higher nugget effect and poor spatial continuity as characterised by the variogram model. The RS is considerably lower around the periphery of the model (especially to the east) where the data spacing is sparse and irregular. SRK is satisfied with the methodology and final confidence ranking for the respective reefs.
| SRK | Report date: 27 May 2022 |
| | Effective Date: 31 December 2021 |
| | |
| SRK Consulting – 576060 SPM PSM Project TRS | Page 99 |
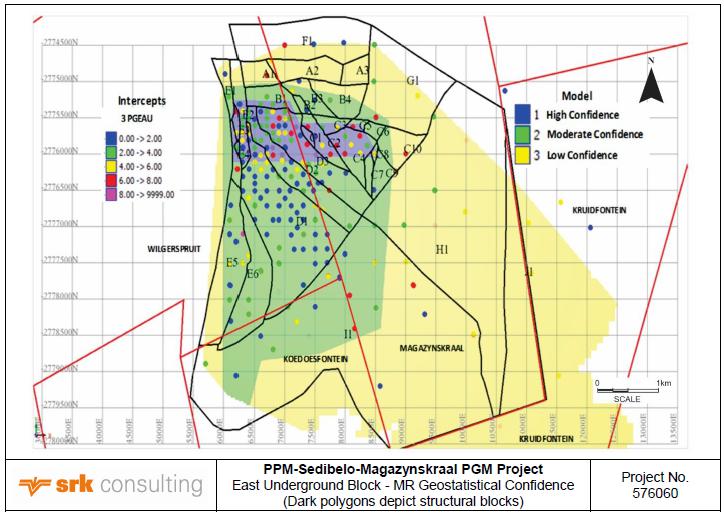
Figure 10.18: East Underground Block - MR Geostatistical Confidence
The structural complexity was based on a geotechnical assessment of the major structural blocks (dark outlines/polygons shown in Figure 10.18). For the UG2, the Measured Mineral Resource footprint coincided with areas with high geostatistical confidence and minimal disturbance within the structural blocks (i.e., Blocks D1, D1A, D2 and D3 as shown on Figure 10.19). Indicated Mineral Resources generally reflect areas with moderate to high geostatistical confidence categories and sufficient uncertainty with respect to geological continuity and structural complexity. Areas outside these two demarcations were considered as Inferred Mineral Resources. SRK concurs that the QA/QC results are satisfactory and hence must not warrant the downgrade of any part of the UG2 classification footprints. The UG2 Mineral Resource footprint is as shown in Figure 10.19.
The resource classification for MR and UPR followed a similar approach. However, the uncertainty associated with the exact nature and continuity of the PUP and MRC facies resulted in certain areas being considered as high resource risk. Thus, areas which under the current general criteria would have been earmarked as Measured Mineral Resources are downgraded when associated with the high resource risk footprint. Based on the above, a Measured Mineral Resource category for MR was not declared; likewise, the UPR, which also has high resource risk footprints. In the case of the UPR, the footprint of the high resource risk is based on uncertainty associated with the structural and geological complexity and elevated level of grade.
| SRK | Report date: 27 May 2022 |
| | Effective Date: 31 December 2021 |
| | |
| SRK Consulting – 576060 SPM PSM Project TRS | Page 100 |
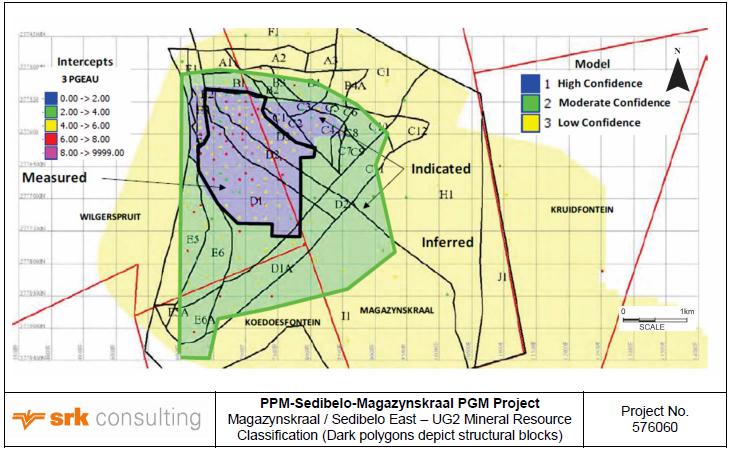
Figure 10.19: Magazynskraal / Sedibelo East – UG2 Mineral Resource Classification

Figure 10.20: Magazynskraal / Sedibelo East - UPR Mineral Resource Classification
| SRK | Report date: 27 May 2022 |
| | Effective Date: 31 December 2021 |
| | |
| SRK Consulting – 576060 SPM PSM Project TRS | Page 101 |

Figure 10.21: Magazynskraal / Sedibelo East – MR Mineral Resource Classification
UG2 Chromite Mineral Resource Classification
It is noted that the footprint of the UG2 chrome block estimate as compiled by Platmin (Figure 10.12) lies within the Measured and Indicated categories/footprint of the UG2 PGM classification; the larger portion of it conforms to the UG2 Indicated category. SRK has thus classified the chrome estimates as Indicated Mineral Resources. All the blocks beyond the Indicated Mineral Resource footprint, which have been assigned the global chrome mean grade, are classified as Inferred Mineral Resources.
| 10.4 | Reasonable Prospects of Economic Extraction (RPEE) |
[§229.601(b)(96)(iii)(B)(11)(iii) (vi) (vii)] [SR4.2(ii)(iii)(iv), SR4.3]
To assess the prospects of economic extraction, SRK calculated a cut-off grade based on the economic mining and processing assumptions incorporated in the 2020 FS supplied by SPM. The metal prices and exchange rate used in the calculation are the three-year trailing average prices as of 31 December 2021 in Table 15.1, which were provided by SPM.
A basket price was calculated by weighting each price by the metals’ contribution to the 4E value for each reef package cut (prill splits as shown in Table 10.11 to Table 10.23. The contribution of Ru, Ir and base metals has not been considered. Basket 4E prices were calculated for the different resource cuts. This includes a 20% premium over the actual basket prices for the cut-off calculation, as this is considered a reasonable price for the Mineral Resource use. The basket 4E price derived from the three-year trailing average values is generally lower than that derived from the spot and the long-term values (taken as projected prices in 2030) of the CRU projections detailed in Section 15. The economic analysis in Section 18 covers a period of 40 years and is done in real (constant money) terms. Using the three year trailing average will result in the most conservative cut off value. The UG2 estimated grades for all the assets under consideration are globally all higher than the cut off and using higher prices will have no impact on the reported UG2 Mineral Resource.
The Opex parameters are based on the 2020 FS, with the plant recovery and NSR values drawn from Section 9.4. SRK notes that if the updated Opex parameters as outlined in Table 17.8 and Table 17.9 are used, it will not materially impact on the cut-off grades determined for the Central and East Underground Blocks; likewise, the footprint of the resource pit shells for the East and West Pits.
| SRK | Report date: 27 May 2022 |
| | Effective Date: 31 December 2021 |
| | |
| SRK Consulting – 576060 SPM PSM Project TRS | Page 102 |
Optimization parameters considered for the delineation of the resource pit shells study are given in Table 10.8. The metal prices, exchange rate and costs are those at the time when the optimization was performed (August 2019) and are deemed valid for reporting purposes in this TRS.
Table 10.8: East and West Pit – Optimization Parameters
| Parameter | Unit | Input |
| Selling | | Prices | Prill |
| Pt | (ZAR/oz) | 870 | 59% |
| Pd | (ZAR/oz) | 1 700 | 30% |
| Rh | (ZAR/oz) | 5 500 | 5% |
| Au | (ZAR/oz) | 1 460 | 5% |
| Exchange Rate | (ZAR:USD) | 15.13 | - |
| 4E Basket Price | (ZAR/oz) | 21 000 |
| Plant Cost and Fixed Cost | (ZAR/t) | 328.00 |
| Mining Cost - Soft Overburden | (ZAR/t) | 16.53 |
| Overburden | (ZAR/t) | 26.07 |
| UG2 | (ZAR/t) | 25.32 |
| Silicates | (ZAR/t) | 23.05 |
| Inter-burden | (ZAR/t) | 25.54 |
| Incremental Bench Cost | (ZAR/bench/t) | 0.16 |
| Mining/Geological Loss | (%) | 5 |
| Mining Recovery | (%) | 95 |
| Pit Slope Angles | (°) | 55 |
| Bench Height | (m) | 15 |
| Dilution Silicates | (%) | 43 |
| Dilution UG2 | (%) | 93 |
| 10.4.2 | Central Underground Block |
Basket 4E prices of USD2 086/oz and USD3 037/oz (based on three-year trailing averages) were calculated for the PUP and UG2 respectively. This includes a 20% premium over the actual basket prices for the cut-off calculation, as this is considered a reasonable price for the Mineral Resource use.
The cut-off grade and the parameters assumed for the calculation of the PUP and UG2 packages are detailed in Table 10.9.
Table 10.9: Parameters for cut-off calculation for the Central Block PUP and UG2 Reefs
| Item | Units | 3-year trailing
Metal prices | Values in Calculation |
| PUP | UG2 |
| | | | Prill | Prill |
| Pt | (USD/oz) | 946 | 63% | 59% |
| Pd | (USD/oz) | 2 045 | 29% | 28% |
| Rh | (USD/oz) | 11 722 | 4% | 12% |
| Au | (USD/oz) | 1 654 | 4% | 0.6% |
| 4E Basket (20% premium) | (USD/oz) | | 2 086 | 3 037 |
| Exchange Rate | (ZAR:USD) | 15.24 | | |
| Mining Cost (incl G&A) | (ZAR/t) | | 900 | 900 |
| Concentrator | (ZAR/t) | | 221 | 221 |
| Smelter and Refining Opex | (ZAR/t) | | 101 | 101 |
| Total | (ZAR/t) | | 1 221 | 1 221 |
| Mining recovery | (%) | | 97% | 97% |
| Plant Recovery | (%) | | 85.0% | 82.0% |
| NSR | (%) | | 92.4% | 92.4% |
| Selling | (%) | | 0% | 0% |
| MCF | (%) | | 97% | 97% |
| Cut-off grade (g/t) | (4E g/t) | | 1.62 | 1.15 |
| 10.4.3 | East Underground Block |
The parameters considered for the cut-off grade calculation of the four resource cuts are detailed in Table 10.10. The 4E basket prices include a 20% premium over the cut-off calculation, as this is considered a reasonable price for the Mineral Resource use.
| SRK | Report date: 27 May 2022 |
| | Effective Date: 31 December 2021 |
| | |
| SRK Consulting – 576060 SPM PSM Project TRS | Page 103 |
Table 10.10: Parameters for cut-off calculation for the East Block UG2, UPR, PUP and MRC Reefs
| Parameters | Units | Values | UG2 | MR PUP | MRC | UPR |
| | | | Prill | Prill | Prill | Prill |
| Pt | (USD/oz) | 946 | 61% | 63% | 66% | 61% |
| Pd | (USD/oz) | 2 045 | 27% | 28% | 25% | 32% |
| Rh | (USD/oz) | 11 722 | 12% | 5% | 5% | 5% |
| Au | (USD/oz) | 1 654 | 0.4% | 4% | 4% | 4% |
| 4E Basket price (20% premium) | (USD/oz) | | 3 020 | 2 230 | 2 176 | 2 292 |
| Exchange Rate | (ZAR:USD) | 15.24 | | | | |
| Mining Cost | (ZAR/t) | 811 | | | | |
| Concentrator | (ZAR/t) | 221 | | | | |
| Subtotal | (ZAR/t) | 1 032 | | | | |
| G&A | (ZAR/t) | 119 | | | | |
| Total | (ZAR/t) | 1 151 | | | | |
| Mining recovery | (%) | 97% | | | | |
| Plant Recovery | (%) | 82.8% | | | | |
| NSR | (%) | 80% | | | | |
| Selling | (%) | 0% | | | | |
| MCF | (%) | 97% | | | | |
| Cut of grade | (4E g/t) | | 1.25 | 1.69 | 1.73 | 1.64 |
| 10.5 | Mineral Resource Statement |
[§229.601(b)(96)(iii)(B)(11)(ii)] )] [SR4.1(iv)(vi), SR4.5(i)(ii)(iv)(v)(vii), SR6.1(i), SR6.3(vi)]
The in situ PGM and chromite inclusive Mineral Resource statements for the West Pit as shown respectively in Table 10.11 and Table 10.12 include depletion (mined-out) for the projected face positions at end of year and are therefore deemed to be valid as at 31 December 2021.
The in situ West Pit Mineral Resources are stated using a 4E basket price of ZAR21 000/oz and reported within a pit shell that is based on 120% revenue factors.
The consideration of the East Pit’s pit shell (used for reporting) is largely constrained by the adjacent Central Underground Block mine design. There is no exclusive Mineral Resource reported for the East Pit although there is upside potential for this, as the resources outside the pit shell are classified as potentially extractable from underground. This would require a pit optimization which considers the economic viability of the silicate reefs above the UG2 (based on the open pit block model), excluding the PUP reef facies of the UPR, and the full reef package that is not currently planned for extraction by underground methods (based on the underground block model). The pit optimization will have to demonstrate that the remaining silicate reefs are both technically extractable following the underground extraction, as well as economically extractable without the UG2 and PUP contributions where this is mined from underground. SRK understands that the merits of such a study are under consideration.
No economic cut-off grade has been applied for the reporting of the in situ Mineral Resources constrained within the pit shell. The Mineral Resources are reported exclusive of explicit modelled dyke and fault losses, exclusive of S1 layer, and exclusive of an additional 15% and 5% unknown geological loss factor (West and East pits respectively) for all reefs. Mineral Resources include all material below the topography surface.
The PGM and chromite Mineral Resource statements outside of the Mineral Reserve footprint (i.e., exclusive Mineral Resource) for the West Pits are shown respectively from Table 10.13 to Table 10.14. The East Pit inclusive PGM and chromite Mineral Resources are as shown in Table 10.15 to Table 10.16. There is no exclusive Mineral Resource footprint for the East Pit.
| 10.5.2 | Central Underground Block |
The in situ Mineral Resources are reported by applying a geological loss factor of 15%; this is in addition to the modelled dykes which are explicitly excluded from the reporting. The in situ underground Mineral Resources are constrained to be outside the practical pit constraint applied in the East Pit reporting, and further beyond the crown pillar around the open pit highwall. The PGM and chromite Mineral Resource statements for the Central Underground are reported above an economic cut off, as shown respectively in Table 10.17 to Table 10.19 respectively; they are quoted inclusive and exclusive of the Mineral Reserves.
| SRK | Report date: 27 May 2022 |
| | Effective Date: 31 December 2021 |
| | |
| SRK Consulting – 576060 SPM PSM Project TRS | Page 104 |
| 10.5.3 | East Underground Block |
The geological loss considerations were based on the geotechnical assessment of the different blocks of ground as discussed under section 10.3.4. The geological losses range from 14% to 20% for the UG2 and 19% to 37% for the silicates.
The in situ Mineral Resources are quoted inclusive and exclusive of the Mineral Reserves (Table 10.20 to Table 10.23) and are reported using the economic cut-offs as stipulated in Table 10.10.
The Inferred Mineral Resource statement is as quoted in Table 10.24.
| SRK | Report date: 27 May 2022 |
| | Effective Date: 31 December 2021 |
| | |
| SRK Consulting – 576060 SPM PSM Project TRS | Page 105 |
Table 10.11: West Pit – SRK Audited PGM Mineral Resources Statement (INCLUSIVE) at 31 December 2021
| Resource Area | Reef | Tonnage (Mt) | Reef Width (m) | PGM Grade (g/t) | Contained 4E | Contained 6E | Base Metal Grade | Contained Base
Metal |
| (%) | (t) |
| 4E | 6E | Pt | Pd | Rh | Au | Ru | Ir | (Moz) | (Moz) | Ni | Cu | Ni | Cu |
| Measured Mineral Resource | | | | | | | | | | | | | | | | |
| West Pit | Upper Pseudo Reef (S2) | 0.004 | 0.42 | 11.42 | 12.39 | 7.17 | 3.51 | 0.48 | 0.27 | 0.81 | 0.16 | 0.002 | 0.002 | 0.25 | 0.12 | 11 | 5 |
| Lower Pseudo (S2) | 0.02 | 1.38 | 1.72 | 1.82 | 1.04 | 0.52 | 0.06 | 0.10 | 0.08 | 0.02 | 0.001 | 0.001 | 0.10 | 0.02 | 17 | 3 |
| U2D | 0.05 | 2.26 | 4.23 | 5.22 | 2.52 | 1.17 | 0.52 | 0.03 | 0.80 | 0.19 | 0.01 | 0.01 | 0.00 | 0.00 | 1 | 0 |
| Total Measured West Pit | 0.07 | 1.94 | 4.08 | 4.85 | 2.46 | 1.16 | 0.41 | 0.06 | 0.63 | 0.15 | 0.01 | 0.01 | 0.04 | 0.01 | 28 | 8 |
| | 6E prill | | | | | 50.6% | 23.8% | 8.4% | 1.3% | 12.9% | 3.0% | | | | | | |
| Indicated Mineral Resource | | | | | | | | | | | | | | | | |
| | Upper Pseudo Reef (S2) | 1.33 | 0.59 | 7.84 | 8.66 | 4.93 | 2.25 | 0.40 | 0.25 | 0.69 | 0.13 | 0.33 | 0.37 | 0.20 | 0.09 | 2 644 | 1 180 |
| Pseudo Reef HZB (S2) | 9.05 | 3.57 | 1.63 | 1.78 | 0.96 | 0.52 | 0.08 | 0.08 | 0.12 | 0.02 | 0.47 | 0.52 | 0.18 | 0.03 | 16 153 | 2 263 |
| Lower Pseudo (S2) | 2.68 | 1.07 | 2.60 | 2.76 | 1.56 | 0.79 | 0.10 | 0.15 | 0.13 | 0.03 | 0.22 | 0.24 | 0.12 | 0.03 | 3 342 | 921 |
| U2D | 5.84 | 2.17 | 3.95 | 4.84 | 2.37 | 1.09 | 0.46 | 0.02 | 0.72 | 0.17 | 0.74 | 0.91 | 0.02 | 0.00 | 982 | 239 |
| Total Indicated West Pit | 18.90 | 2.57 | 2.92 | 3.35 | 1.76 | 0.85 | 0.22 | 0.08 | 0.35 | 0.08 | 1.78 | 2.03 | 0.12 | 0.02 | 23 121 | 4 604 |
| | 6E prill | | | | | 52.6% | 25.6% | 6.6% | 2.5% | 10.3% | 2.3% | | | | | | |
Note:
| 1. | Mineral Resources are not Mineral Reserves and do not meet the threshold for reserve modifying factors, such as estimated economic viability, that would allow conversion to Mineral Reserves. There is no certainty that any part of the in-situ Mineral Resources will be converted into Mineral Reserves. |
| 2. | S1 package is excluded from Mineral Resource Statement because it is impractical to mine selectively |
| 3. | The in-situ Mineral Resources are reported inclusive of Mineral Reserves that may be derived from them. |
| 4. | Open pit optimisation was based on an assumed 4E basket price of ZAR21 000/oz, assumed mining & processing cost of ZAR445/t and reported within a pit shell that is based on a 120% revenue factor. |
| 5. | Numbers in the tables have been rounded to reflect the accuracy of the estimates, and may not sum due to rounding |
Table 10.12: West Pit – SRK Audited Chromite Mineral Resources (INCLUSIVE) and Mineral Reserves Statement at 31 December 2021
Mineral Resources (INCLUSIVE) | Reef | Reef Width (cm) | Tonnage (Mt) | Cr2O3 Grade (%) | Cr2O3 Content (kt) | Mineral Reserves | Tonnage (Mt) | Cr2O3 Grade (%) | Cr2O3 Content (kt) |
| Indicated Mineral Resources | | | | | | Probable Mineral Reserves | | | |
| West Pit | U2D | 217 | 5.89 | 21.6 | 1 272 | West Pit | 4.8 | 11.9 | 574 |
| Total Indicated Resources | | 217 | 5.89 | 21.6 | 1 272 | Total Probable Reserves | 4.8 | 11.9 | 574 |
Note:
| 1. | Conversion of Cr to Cr2O3 is 1:1.4616 |
| 2. | Mineral Resources are not Mineral Reserves and do not meet the threshold for reserve modifying factors, such as estimated economic viability, that would allow conversion to Mineral Reserves. There is no certainty that any part of the in-situ Mineral Resources will be converted into Mineral Reserves. |
| 3. | The in-situ Mineral Resources are reported inclusive of Mineral Reserves that may be derived from them. |
| 4. | Open pit optimisation was based on an assumed 4E basket price of ZAR21 000/oz, assumed mining & processing cost of ZAR445/t and reported within a pit shell that is based on a 120% revenue factor. |
| 5. | Numbers in the tables have been rounded to reflect the accuracy of the estimates, and may not sum due to rounding |
| SRK | Report date: 27 May 2022 |
| | Effective Date: 31 December 2021 |
| | |
| SRK Consulting – 576060 SPM PSM Project TRS | Page 106 |
Table 10.13: West Pit – SRK Audited PGM Mineral Resources Statement (EXCLUSIVE) at 31 December 2021
| Resource Area | Reef | Tonnage (Mt) | Reef Width (cm) | PGM Grade (g/t) | Contained 4E | Contained 6E | Base Metal Grade | Contained Base Metal |
| (%) | (t) |
| 4E | 6E | Pt | Pd | Rh | Au | Ru | Ir | (Moz) | (Moz) | Ni | Cu | Ni | Cu |
| Measured Mineral Resource | | | | | | | | | | | | | | | | |
| West Pit | Upper Pseudo Reef (S2) | | | | | | | | | | | | | | | | |
| Lower Pseudo (S2) | | | | | | | | | | | | | | | | |
| U2D | 0.001 | 177 | 3.89 | 4.79 | 2.33 | 1.06 | 0.47 | 0.03 | 0.73 | 0.17 | 0.0001 | 0.0001 | 0.002 | 0.001 | 0.016 | 0.004 |
| Total Measured West Pit | 0.001 | 177 | 3.89 | 4.79 | 2.33 | 1.06 | 0.47 | 0.03 | 0.73 | 0.17 | 0.0001 | 0.0001 | 0.002 | 0.001 | 0.016 | 0.004 |
| | 6E prill | | | | | 48.6% | 22.1% | 9.9% | 0.7% | 15.2% | 3.6% | | | | | | |
| Indicated Mineral Resource | | | | | | | | | | | | | | | | |
| West Pit | Upper Pseudo Reef (S2) | 0.75 | 57 | 8.00 | 8.81 | 5.03 | 2.32 | 0.40 | 0.25 | 0.68 | 0.13 | 0.19 | 0.21 | 0.200 | 0.089 | 1 504 | 669 |
| Pseudo Reef HZB (S2) | 5.49 | 362 | 1.68 | 1.82 | 0.98 | 0.53 | 0.08 | 0.08 | 0.12 | 0.03 | 0.30 | 0.32 | 0.182 | 0.025 | 10 012 | 1 374 |
| Lower Pseudo (S2) | 1.47 | 97 | 2.95 | 3.13 | 1.79 | 0.88 | 0.12 | 0.17 | 0.14 | 0.04 | 0.14 | 0.15 | 0.133 | 0.039 | 1 963 | 573 |
| U2D | 3.43 | 226 | 3.68 | 4.49 | 2.23 | 1.00 | 0.43 | 0.02 | 0.66 | 0.16 | 0.41 | 0.50 | 0.016 | 0.004 | 562 | 140 |
| Total Indicated West Pit | 11.14 | 264 | 2.89 | 3.29 | 1.75 | 0.84 | 0.21 | 0.09 | 0.33 | 0.07 | 1.03 | 1.18 | 0.126 | 0.025 | 14 041 | 2 756 |
| | 6E prill | | | | | 53.1% | 25.6% | 6.5% | 2.6% | 10.0% | 2.2% | | | | | | |
Note:
| 1. | Mineral Resources are not Mineral Reserves and do not meet the threshold for reserve modifying factors, such as estimated economic viability, that would allow conversion to Mineral Reserves. There is no certainty that any part of the in-situ Mineral Resources will be converted into Mineral Reserves. |
| 2. | S1 package is excluded from Mineral Resource Statement because it is impractical to mine selectively |
| 3. | The in-situ Mineral Resources are reported exclusive of Mineral Reserves that may be derived from them. |
| 4. | Open pit optimisation was based on an assumed 4E basket price of ZAR21 000/oz, assumed mining & processing cost of ZAR445/t and reported within a pit shell that is based on a 120% revenue factor. |
| 5. | Numbers in the tables have been rounded to reflect the accuracy of the estimates, and may not sum due to rounding |
| 6. | 1 troy ounce = 31.1034768 |
Table 10.14: West Pit – SRK Audited Chromite Mineral Resources (EXCLUSIVE) at 31 December 2021
Mineral Resources (EXCLUSIVE) | Reef | Reef Width (cm) | Tonnage (Mt) | Cr2O3 Grade (%) | Cr2O3 Content (kt) |
| Indicated Mineral Resources | | | | | |
| West Pit | U2D | 226 | 3.43 | 19.9 | 684 |
| Total Indicated Resources | | 226 | 3.43 | 19.9 | 684 |
Note:
| 1. | Conversion of Cr to Cr2O3 is 1:1.4616 |
| 2. | Mineral Resources are not Mineral Reserves and do not meet the threshold for reserve modifying factors., such as estimated economic viability, that would allow conversion to Mineral Reserves. There is no certainty that any part of the in-situ Mineral Resources will be converted into Mineral Reserves. |
| 3. | The in-situ Mineral Resources are reported exclusive of Mineral Reserves that may be derived from them. |
| 4. | Open pit optimisation was based on an assumed 4E basket price of ZAR21 000/oz, assumed mining & processing cost of ZAR445/t and reported within a pit shell that is based on a 120% revenue factor. |
| 5. | Numbers in the tables have been rounded to reflect the accuracy of the estimates, and may not sum due to rounding |
| SRK | Report date: 27 May 2022 |
| | Effective Date: 31 December 2021 |
| | |
| SRK Consulting – 576060 SPM PSM Project TRS | Page 107 |
Table 10.15: East Pit – SRK Audited PGM Mineral Resource Statement (INCLUSIVE) at 31 December 2021
| Resource Area | Reef | Tonnage (Mt) | PGM Grade (g/t) | Contained 4E | Contained 6E | Base Metal Grade(%) | Contained Base Metal |
| (t) |
| 4E | 6E | Pt | Pd | Rh | Au | Ru | Ir | (Moz) | (Moz) | Ni | Cu | Ni | Cu |
| Indicated Mineral Resource | | | | | | | | | | | | | | | |
| East Pit (Silicates) | UPR | 0.65 | 5.24 | 5.81 | 3.25 | 1.52 | 0.28 | 0.19 | 0.48 | 0.09 | 0.11 | 0.12 | 0.15 | 0.07 | 1 011 | 438 |
| PRHZB | 5.77 | 1.13 | 1.25 | 0.65 | 0.35 | 0.06 | 0.07 | 0.10 | 0.02 | 0.21 | 0.23 | 0.15 | 0.02 | 8 776 | 1 087 |
| LPR | 1.16 | 2.81 | 2.98 | 1.64 | 0.90 | 0.11 | 0.16 | 0.14 | 0.03 | 0.11 | 0.11 | 0.13 | 0.04 | 1 560 | 414 |
| Total Indicated East Pit silicates | 7.59 | 1.74 | 1.91 | 1.03 | 0.53 | 0.09 | 0.09 | 0.14 | 0.03 | 0.42 | 0.47 | 0.15 | 0.03 | 11 348 | 1 939 |
| | 6E prill | | | | 53.90% | 27.97% | 4.61% | 4.86% | 7.17% | 1.50% | | | | | | |
| Indicated Mineral Resource | | | | | | | | | | | | | | | |
| East Pit (UG2) | U2L | 0.25 | 3.84 | 4.61 | 2.46 | 0.92 | 0.44 | 0.03 | 0.62 | 0.15 | 0.03 | 0.04 | 0.02 | 0.01 | 59 | 14 |
| U2P | 0.18 | 3.90 | 4.75 | 2.44 | 0.99 | 0.44 | 0.03 | 0.69 | 0.16 | 0.02 | 0.03 | 0.02 | 0.01 | 40 | 9 |
| U2 | 2.37 | 6.35 | 7.71 | 3.77 | 1.85 | 0.71 | 0.02 | 1.11 | 0.26 | 0.48 | 0.59 | 0.02 | 0.00 | 368 | 107 |
| U2PEG | 1.10 | 2.20 | 2.69 | 1.38 | 0.54 | 0.27 | 0.01 | 0.39 | 0.10 | 0.08 | 0.09 | 0.01 | 0.02 | 103 | 247 |
| Total Indicated East Pit UG2 | 3.90 | 4.91 | 5.96 | 2.95 | 1.38 | 0.55 | 0.02 | 0.86 | 0.20 | 0.62 | 0.75 | 0.01 | 0.01 | 570 | 377 |
| | 6E prill | | | | 49.5% | 23.2% | 9.3% | 0.3% | 14.3% | 3.4% | | | | | | |
| Total Indicated East Pit | 11.49 | 2.82 | 3.28 | 1.68 | 0.82 | 0.25 | 0.07 | 0.38 | 0.09 | 1.04 | 1.21 | 0.10 | 0.02 | 11 917 | 2 317 |
| Inferred Mineral Resource | | | | | | | | | | | | | | | |
| East Pit (Silicates) | UPR | 0.13 | 6.78 | 7.73 | 4.11 | 1.96 | 0.47 | 0.25 | 0.79 | 0.15 | 0.03 | 0.03 | 0.17 | 0.07 | 223 | 93 |
| PRHZB | 2.30 | 1.00 | 1.11 | 0.58 | 0.31 | 0.06 | 0.06 | 0.09 | 0.02 | 0.07 | 0.08 | 0.14 | 0.02 | 3 238 | 350 |
| LPR | 0.58 | 2.48 | 2.60 | 1.51 | 0.73 | 0.08 | 0.16 | 0.10 | 0.02 | 0.05 | 0.05 | 0.13 | 0.03 | 736 | 188 |
| Total Inferred East Pit silicates | 3.01 | 1.54 | 1.69 | 0.92 | 0.46 | 0.08 | 0.08 | 0.12 | 0.03 | 0.15 | 0.16 | 0.14 | 0.02 | 4 196 | 632 |
| | 6E prill | | | | 54.33% | 27.30% | 4.65% | 4.97% | 7.24% | 1.51% | | | | | | |
| 1. | Mineral Resources are not Mineral Reserves and do not meet the threshold for reserve modifying factors, such as estimated economic viability, that would allow conversion to Mineral Reserves. There is no certainty that any part of the in-situ Mineral Resource estimated will be converted into Mineral Reserves |
| 2. | The in-situ Mineral Resources are reported inclusive of Mineral Reserves that may be derived from them. |
| 3. | S1 package is excluded from Mineral Resource Statement because it is impractical to mine selectively. |
| 4. | Open pit optimisation was based on an assumed 4E basket price of ZAR21 000/oz, assumed mining & processing cost of ZAR445/t and reported within a pit shell that is based on a 120% revenue factor. |
| 5. | Numbers in the tables have been rounded to reflect the accuracy of the estimates and may not sum due to rounding. |
| 6. | 1 troy ounce = 31.1034768 |
Table 10.16: East Pit – SRK Audited Chromite Mineral Resources Statement (INCLUSIVE) at 31 December 2021
| Mineral Resources | Reef | INCLUSIVE RESOURCES |
Tonnage (Mt) | Cr2O3 Grade (%) | Cr2O3 Content (kt) |
| Inferred Mineral Resources | | | | |
| East Pit | UG2 | 3.9 | 24.8 | 969 |
| Total Inferred Resources | | 3.9 | 24.8 | 969 |
| 1 | Cr to Cr2O3 conversion is 1:1.461. |
| 2 | The chromite resources are classified in the Inferred category due to the uncertainty in the grade which is derived from a regression analysis on a small sample of UG2 density and chrome grades. The UG2 is mined as part of the LoM plan for its PGM content. While a chromite concentrate is produced in the plant, the recovered chromite is excluded from the economic analysis. |
| SRK | Report date: 27 May 2022 |
| | Effective Date: 31 December 2021 |
| | |
| SRK Consulting – 576060 SPM PSM Project TRS | Page 108 |
Table 10.17: Central Underground – SRK Audited PGM Mineral Resource Statement (INCLUSIVE) at 31 December 2021
| Resource Area | Reef | Tonnage (Mt) | Reef
Width
(m) | PGM Grade (g/t) | Contained 4E | Contained 6E | Base Metal Grade | Contained
Base Metal |
| (%) | (t) |
| 4E | 6E | Pt | Pd | Rh | Au | Ru | Ir | (Moz) | (Moz) | Ni | Cu | Ni | Cu |
| Indicated Mineral Resource | | | | | | | | | | | | | | | | |
| Sedibelo Central UG | PUP | 1.04 | 1.20 | 6.05 | 6.52 | 3.82 | 1.75 | 0.25 | 0.23 | 0.41 | 0.07 | 0.20 | 0.22 | 0.19 | 0.08 | 1 967 | 847 |
| | UG2 | 15.42 | 1.15 | 6.79 | 8.71 | 4.03 | 1.93 | 0.80 | 0.04 | 1.31 | 0.61 | 3.37 | 4.32 | 0.01 | 0.00 | 1 913 | 376 |
| Total Indicated Sedibelo Central UG | 16.46 | | 6.75 | 8.58 | 4.01 | 1.92 | 0.77 | 0.05 | 1.26 | 0.58 | 3.57 | 4.53 | 0.02 | 0.01 | 3 880 | 1 222 |
| | 6E prill | | | | | 47% | 22% | 9% | 1% | 15% | 7% | | | | | | |
| Inferred Mineral Resource | | | | | | | | | | | | | | | | |
| Sedibelo Central UG | PUP | 1.14 | 1.20 | 7.03 | 7.78 | 4.52 | 1.90 | 0.40 | 0.22 | 0.64 | 0.11 | 0.26 | 0.29 | 0.21 | 0.08 | 2 399 | 939 |
| | UG2 | 7.99 | 1.11 | 6.46 | 8.29 | 3.97 | 1.70 | 0.76 | 0.03 | 1.25 | 0.58 | 1.66 | 2.13 | 0.01 | 0.00 | 822 | 162 |
| Total Inferred Sedibelo Central UG | 9.13 | | 6.54 | 8.23 | 4.04 | 1.73 | 0.72 | 0.06 | 1.17 | 0.52 | 1.92 | 2.41 | 0.04 | 0.01 | 3 221 | 1 101 |
| | 6E prill | | | | | 49% | 21% | 9% | 1% | 14% | 6% | | | | | | |
| 1. | Mineral Resource are not Mineral Reserves and do not meet the threshold for reserve modifying factors., such as estimated economic viability, that would allow conversion to Mineral Reserves. There is no certainty that any part of the in-situ Mineral Resources will be converted into Mineral Reserves. |
| 2. | The in situ Mineral Resources are reported inclusive of any Mineral Reserves that may be derived from them. |
| 3. | The in-situ Mineral Resources are reported above 4E cut-off grades of 1.15 g/t and 1.62 g/t for UG2 and PUP reefs, respectively. These are based on 4E basket prices of USD3 037/oz and USD2 086/oz, which include a 20% premium, and plant recoveries of 82% and 85% for UG2 and PUP, respectively. |
| 4. | Reef width represents the vertical thickness, and not true thickness. |
| 5. | Numbers in the tables have been rounded to reflect the accuracy of the estimates, and may not sum due to rounding |
| 6. | 1 troy ounce = 31.1034768 |
Table 10.18: Central Underground – SRK Audited Chromite Mineral Resources Statement at 31 December 2021
| Mineral Resources | Reef | Reef Width (m) | INCLUSIVE RESOURCES | EXCLUSIVE RESOURCES |
Tonnage (Mt) | Cr2O3 Grade (%) | Cr2O3 Content (kt) | Tonnage (Mt) | Cr2O3 Grade (%) | Cr2O3 Content (kt) |
| Inferred Mineral Resources | | | | | | | | |
| Central Underground | UG2 | 1.14 | 23.4 | 26.5 | 6 208 | 11.7 | 26.5 | 3 110 |
| Total Inferred Resources | | 1.14 | 23.4 | 26.5 | 6 208 | 11.7 | 26.5 | 3 110 |
| 1 | Cr to Cr2O3 conversion is 1:1.461. |
| 2 | The chromite resources are classified in the Inferred category due to the uncertainty in the grade which is derived from a regression analysis on a small sample of UG2 density and chrome grades. The UG2 is mined as part of the LoM plan for its PGM content. While a chromite concentrate is produced in the plant, the recovered chromite is excluded from the economic analysis. |
| SRK | Report date: 27 May 2022 |
| | Effective Date: 31 December 2021 |
| | |
| SRK Consulting – 576060 SPM PSM Project TRS | Page 109 |
Table 10.19: Central Underground – SRK Audited PGM Mineral Resource Statement (EXCLUSIVE) at 31 December 2021
| Resource Area | Reef | Tonnage (Mt) | Reef Width (cm) | PGM Grade (g/t) | Contained
4E | Contained
6E | Base Metal Grade | Contained
Base Metal |
| (%) | (t) |
| 4E | 6E | Pt | Pd | Rh | Au | Ru | Ir | (Moz) | (Moz) | Ni | Cu | Ni | Cu |
| Indicated Mineral Resource | | | | | | | | | | | | | | | | |
| Sedibelo Central UG | PUP | 0.43 | 1.22 | 5.90 | 6.45 | 3.68 | 1.71 | 0.29 | 0.22 | 0.47 | 0.08 | 0.08 | 0.09 | 0.19 | 0.08 | 808 | 343 |
| | UG2 | 3.81 | 1.12 | 6.67 | 8.51 | 3.98 | 1.89 | 0.77 | 0.03 | 1.26 | 0.59 | 0.82 | 1.04 | 0.01 | 0.00 | 377 | 92 |
| Total Indicated Sedibelo Central UG | 4.24 | | 6.59 | 8.58 | 3.95 | 1.87 | 0.72 | 0.05 | 1.26 | 0.58 | 0.90 | 1.13 | 0.03 | 0.01 | 1 185 | 435 |
| | 6E prill | | | | | 46% | 22% | 8% | 1% | 15% | 7% | | | | | | |
| Inferred Mineral Resource | | | | | | | | | | | | | | | | |
| Sedibelo Central UG | PUP | 1.14 | 1.20 | 7.03 | 7.78 | 4.52 | 1.90 | 0.40 | 0.22 | 0.64 | 0.11 | 0.26 | 0.29 | 0.21 | 0.08 | 2 399 | 939 |
| | UG2 | 7.92 | 1.12 | 6.47 | 8.30 | 3.97 | 1.70 | 0.76 | 0.03 | 1.25 | 0.58 | 1.65 | 2.11 | 0.01 | 0.00 | 812 | 161 |
| Total Inferred Sedibelo Central Crown Pillar | 9.06 | | 6.54 | 8.23 | 4.04 | 1.73 | 0.72 | 0.06 | 1.17 | 0.52 | 1.90 | 2.40 | 0.04 | 0.01 | 3 211 | 1 100 |
| | E prill | | | | | 49% | 21% | 9% | 1% | 14% | 6% | | | | | | |
| 1 | Mineral Resources are not Mineral Reserves and do not meet the threshold for reserve modifying factors, such as estimated economic viability, that would allow conversion to Mineral Reserves. There is no certainty that any part of the in-situ Mineral Resources will be converted into Mineral Reserves. |
| 2 | The in situ Mineral Resources are reported exclusive of any Mineral Reserves that may be derived from them. |
| 3 | The in-situ Mineral Resources are reported above 4E cut-off grades of 1.15 g/t and 1.62 g/t for UG2 and PUP reefs, respectively. These are based on 4E basket prices of USD3 037/oz and USD2 086/oz, which include a 20% premium, and plant recoveries of 82% and 85% for UG2 and PUP, respectively. |
| 4 | Numbers in the tables have been rounded to reflect the accuracy of the estimates and may not sum due to rounding. |
| 5 | Reef width represents the vertical thickness, and not true thickness. |
| 6 | 1 troy ounce = 31.1034768 g. |
| SRK | Report date: 27 May 2022 |
| | Effective Date: 31 December 2021 |
| | |
| SRK Consulting – 576060 SPM PSM Project TRS | Page 110 |
Table 10.20: East Underground – SRK Audited PGM Mineral Resources (INCLUSIVE) Statement at 31 December 2021
| Resource Area | Reef | Tonnage (Mt) | Reef
Width
(m) | PGM Grade (g/t) | Contained 4E | Contained 6E | Base Metal Grade | Contained Base Metal |
| (%) | (t) |
| 4E | 6E | Pt | Pd | Rh | Au | Ru | Ir | (Moz) | (Moz) | Ni | Cu | Ni | Cu |
| Measured Mineral Resource | | | | | | | | | | | | | | | | |
| Sedibelo East | UG2 | 9.37 | 1.40 | 5.61 | 6.90 | 3.36 | 1.53 | 0.68 | 0.02 | 1.04 | 0.27 | 1.69 | 2.08 | 0.01 | 0.00 | 1 402 | 307 |
| Magazynskraal | UG2 | 2.31 | 1.35 | 5.52 | 6.84 | 3.40 | 1.44 | 0.66 | 0.02 | 1.07 | 0.26 | 0.41 | 0.51 | 0.02 | 0.00 | 400 | 110 |
| Total Measured Resource | 11.68 | 1.39 | 5.59 | 6.89 | 3.37 | 1.52 | 0.68 | 0.02 | 1.05 | 0.26 | 2.10 | 2.59 | 0.02 | 0.00 | 1 803 | 416 |
| | 6E prill | | | | | 48.9% | 22.0% | 9.8% | 0.3% | 15.2% | 3.8% | | | | | | |
| Indicated Mineral Resource | | | | | | | | | | | | | | | | |
| Sedibelo East | MR PUP | 6.21 | 1.17 | 5.71 | 6.28 | 3.51 | 1.68 | 0.29 | 0.23 | 0.47 | 0.10 | 1.14 | 1.25 | 0.19 | 0.08 | 11 810 | 4 704 |
| MR Contact | 6.64 | 1.18 | 2.33 | 2.66 | 1.47 | 0.61 | 0.13 | 0.11 | 0.23 | 0.10 | 0.50 | 1.25 | 0.07 | 0.04 | 4 890 | 2 740 |
| UPR | 8.54 | 1.16 | 2.25 | 2.55 | 1.38 | 0.73 | 0.11 | 0.09 | 0.18 | 0.05 | 0.62 | 0.70 | 0.14 | 0.03 | 12 046 | 2 287 |
| UG2 | 16.02 | 1.42 | 5.45 | 6.66 | 3.28 | 1.49 | 0.64 | 0.02 | 0.98 | 0.25 | 2.81 | 3.43 | 0.01 | 0.00 | 2 380 | 524 |
| Magazynskraal | MR PUP | 4.51 | 1.18 | 6.53 | 7.22 | 4.17 | 1.78 | 0.37 | 0.20 | 0.59 | 0.11 | 0.95 | 1.05 | 0.22 | 0.08 | 9 864 | 3 765 |
| MR Contact | 4.26 | 1.17 | 4.37 | 4.84 | 2.99 | 1.02 | 0.21 | 0.14 | 0.36 | 0.11 | 0.60 | 0.66 | 0.09 | 0.05 | 3 913 | 2 214 |
| UPR | 5.55 | 1.18 | 2.18 | 2.40 | 1.29 | 0.68 | 0.12 | 0.08 | 0.18 | 0.04 | 0.39 | 0.43 | 0.16 | 0.03 | 8 768 | 1 503 |
| UG2 | 17.42 | 1.50 | 4.49 | 5.56 | 2.76 | 1.19 | 0.52 | 0.02 | 0.86 | 0.20 | 2.51 | 3.11 | 0.01 | 0.00 | 2 488 | 664 |
| Total Indicated Resource | 69.15 | 1.31 | 4.28 | 5.04 | 2.64 | 1.18 | 0.38 | 0.08 | 0.61 | 0.15 | 9.51 | 11.89 | 0.08 | 0.03 | 56 158 | 18 400 |
| | 6E prill | | | | | 52.4% | 23.4% | 7.5% | 1.6% | 12.0% | 3.0% | | | | | | |
| Inferred Mineral Resource | | | | | | | | | | | | | | | | |
| Sedibelo East | MR PUP | 0.87 | 1.24 | 4.60 | 5.06 | 2.78 | 1.39 | 0.24 | 0.19 | 0.39 | 0.08 | 0.13 | 0.14 | 0.18 | 0.07 | 1 560 | 596 |
| MR Contact | 3.64 | 1.12 | 2.41 | 2.81 | 1.59 | 0.58 | 0.14 | 0.09 | 0.24 | 0.17 | 0.28 | 0.33 | 0.07 | 0.04 | 2 669 | 1 465 |
| UPR | 3.93 | 1.15 | 2.26 | 2.55 | 1.35 | 0.71 | 0.12 | 0.09 | 0.18 | 0.10 | 0.29 | 0.32 | 0.15 | 0.03 | 5 785 | 1 051 |
| UG2 | 9.36 | 1.37 | 5.23 | 6.37 | 3.15 | 1.44 | 0.60 | 0.02 | 0.93 | 0.23 | 1.57 | 1.92 | 0.02 | 0.00 | 1 482 | 351 |
| Magazynskraal) | MR PUP | 18.75 | 1.16 | 6.68 | 7.35 | 4.29 | 1.82 | 0.34 | 0.23 | 0.56 | 0.10 | 4.03 | 4.43 | 0.23 | 0.08 | 42 409 | 14 471 |
| MR Contact | 7.80 | 1.18 | 2.99 | 3.35 | 2.03 | 0.71 | 0.15 | 0.09 | 0.26 | 0.10 | 0.75 | 0.84 | 0.10 | 0.05 | 7 434 | 3 647 |
| UPR | 6.83 | 1.18 | 1.65 | 1.86 | 0.97 | 0.54 | 0.09 | 0.06 | 0.13 | 0.07 | 0.36 | 0.41 | 0.15 | 0.02 | 10 303 | 1 350 |
| UG2 | 46.08 | 1.42 | 4.69 | 5.76 | 2.84 | 1.30 | 0.53 | 0.02 | 0.86 | 0.21 | 6.95 | 8.54 | 0.02 | 0.00 | 7 012 | 1 715 |
| Total Inferred Resource | 97.27 | 1.31 | 4.59 | 5.41 | 2.84 | 1.26 | 0.41 | 0.08 | 0.66 | 0.17 | 14.36 | 16.93 | 0.08 | 0.03 | 78 654 | 24 644 |
| | 6E prill | | | | | 52.6% | 23.3% | 7.5% | 1.4% | 12.1% | 3.1% | | | | | | |
| 1 | Mineral Resources are not Mineral Reserves and do not meet the threshold for reserve modifying factors, such as estimated economic viability, that would allow conversion to Mineral Reserves. There is no certainty that any part of the Mineral Resources will be converted into Mineral Reserves. |
| 2 | The in situ Mineral Resources are reported inclusive of any Mineral Reserves that may be derived from them. |
| 3 | The in-situ Mineral Resources are reported above 4E cut-off grades of 1.25 g/t (UG2), 1.69 g/t (MR PUP), 1.73 g/t (MRC) and 1.64 g/t (UPR). These are based on 4E basket prices of USD3 020/oz, USD2 230/oz, USD2 176/oz and USD2 292/oz respectively which include a 20% premium. A plant recovery of 82.8% was applied. |
| 4 | Numbers in the tables have been rounded to reflect the accuracy of the estimates and may not sum due to rounding. |
| 5 | Reef width represents the vertical thickness, and not true thickness. |
| 6 | 1 troy ounce = 31.1034768 g. |
| SRK | Report date: 27 May 2022 |
| | Effective Date: 31 December 2021 |
| | |
| SRK Consulting – 576060 SPM PSM Project TRS | Page 111 |
Table 10.21: East Underground – SRK Audited PGM Mineral Resources Statement (EXCLUSIVE) at 31 December 2021
| Resource Area | Reef | Tonnage
(Mt) | Reef
Width
(m) | PGM Grade (g/t) | Contained
4E | Contained
6E | Base Metal Grade | Contained Base
Metal |
| (%) | (t) |
| 4E | 6E | Pt | Pd | Rh | Au | Ru | Ir | (Moz) | (Moz) | Ni | Cu | Ni | Cu |
| Measured Mineral Resource | | | | | | | | | | | | | | | | |
| Sedibelo East | UG2 | 0.29 | 1.23 | 5.76 | 7.06 | 3.45 | 1.57 | 0.69 | 0.02 | 1.06 | 0.27 | 0.05 | 0.07 | 0.02 | 0.00 | 53 | 13 |
| Magazynskraal | UG2 | 0.00 | 1.38 | 5.31 | 6.55 | 3.18 | 1.47 | 0.64 | 0.02 | 1.00 | 0.24 | 0.00 | 0.00 | 0.02 | 0.00 | 0 | 0 |
| Total Measured Resource | 0.29 | 1.23 | 5.76 | 7.06 | 3.45 | 1.57 | 0.69 | 0.02 | 1.06 | 0.27 | 0.05 | 0.07 | 0.02 | 0.00 | 53 | 13 |
| | 6E prill | | | | | 48.9% | 22.3% | 9.8% | 0.3% | 14.9% | 3.8% | | | | | | |
| Indicated Mineral Resource | | | | | | | | | | | | | | | | |
| Sedibelo East | MR PUP | 2.25 | 1.17 | 5.35 | 5.85 | 3.25 | 1.62 | 0.25 | 0.23 | 0.41 | 0.09 | 0.39 | 0.42 | 0.19 | 0.07 | 4 249 | 1 679 |
| MR Contact | 6.46 | 1.18 | 2.33 | 2.67 | 1.47 | 0.61 | 0.13 | 0.11 | 0.23 | 0.11 | 0.48 | 0.42 | 0.07 | 0.04 | 4 744 | 2 657 |
| UPR | 8.54 | 1.16 | 2.25 | 2.55 | 1.38 | 0.73 | 0.11 | 0.09 | 0.18 | 0.05 | 0.62 | 0.70 | 0.14 | 0.03 | 12 046 | 2 287 |
| UG2 | 6.47 | 1.39 | 5.48 | 6.70 | 3.27 | 1.52 | 0.64 | 0.02 | 0.99 | 0.25 | 1.14 | 1.39 | 0.02 | 0.00 | 1 013 | 220 |
| Magazynskraal | MR PUP | 1.41 | 1.18 | 5.94 | 6.56 | 3.78 | 1.65 | 0.32 | 0.19 | 0.52 | 0.10 | 0.27 | 0.30 | 0.21 | 0.08 | 3 021 | 1 130 |
| MR Contact | 3.08 | 1.17 | 4.71 | 5.22 | 3.23 | 1.10 | 0.23 | 0.15 | 0.39 | 0.13 | 0.47 | 0.52 | 0.10 | 0.05 | 2 969 | 1 653 |
| UPR | 5.55 | 1.18 | 2.18 | 2.40 | 1.29 | 0.68 | 0.12 | 0.08 | 0.18 | 0.04 | 0.39 | 0.43 | 0.16 | 0.03 | 8 768 | 1 503 |
| UG2 | 8.90 | 1.51 | 4.61 | 5.70 | 2.80 | 1.25 | 0.54 | 0.02 | 0.87 | 0.21 | 1.32 | 1.63 | 0.01 | 0.00 | 1 208 | 307 |
| Total Indicated Resource | 42.66 | 1.28 | 3.70 | 4.33 | 2.28 | 1.04 | 0.31 | 0.08 | 0.49 | 0.13 | 5.07 | 5.81 | 0.09 | 0.03 | 38 018 | 11 436 |
| | 6E prill | | | | | 52.6% | 24.0% | 7.1% | 1.9% | 11.4% | 3.0% | | | | | | |
| Inferred Mineral Resource | | | | | | | | | | | | | | | | |
| Sedibelo East | MR PUP | 0.87 | 1.24 | 4.60 | 5.06 | 2.78 | 1.39 | 0.24 | 0.19 | 0.39 | 0.08 | 0.13 | 0.14 | 0.18 | 0.07 | 1 560 | 596 |
| MR Contact | 3.64 | 1.12 | 2.41 | 2.81 | 1.59 | 0.58 | 0.14 | 0.09 | 0.24 | 0.17 | 0.28 | 0.33 | 0.07 | 0.04 | 2 669 | 1 465 |
| UPR | 3.93 | 1.15 | 2.26 | 2.55 | 1.35 | 0.71 | 0.12 | 0.09 | 0.18 | 0.10 | 0.29 | 0.32 | 0.15 | 0.03 | 5 785 | 1 051 |
| UG2 | 9.36 | 1.37 | 5.23 | 6.37 | 3.15 | 1.44 | 0.60 | 0.02 | 0.93 | 0.23 | 1.57 | 1.92 | 0.02 | 0.00 | 1 482 | 351 |
| Magazynskraal) | MR PUP | 18.44 | 1.16 | 6.69 | 7.35 | 4.30 | 1.82 | 0.34 | 0.23 | 0.56 | 0.10 | 3.96 | 4.36 | 0.23 | 0.08 | 41 754 | 14 233 |
| MR Contact | 7.77 | 1.18 | 2.99 | 3.35 | 2.02 | 0.71 | 0.15 | 0.09 | 0.26 | 0.10 | 0.75 | 0.84 | 0.10 | 0.05 | 7 411 | 3 633 |
| UPR | 6.83 | 1.18 | 1.65 | 1.86 | 0.97 | 0.54 | 0.09 | 0.06 | 0.13 | 0.07 | 0.36 | 0.41 | 0.15 | 0.02 | 10 303 | 1 350 |
| UG2 | 46.08 | 1.42 | 4.69 | 5.76 | 2.84 | 1.30 | 0.53 | 0.02 | 0.86 | 0.21 | 6.95 | 8.54 | 0.02 | 0.00 | 7 012 | 1 715 |
| Total Inferred Resource | 96.94 | 1.31 | 4.59 | 5.41 | 2.84 | 1.26 | 0.41 | 0.08 | 0.66 | 0.17 | 14.29 | 16.85 | 0.08 | 0.03 | 77 976 | 24 392 |
| | 6E prill | | | | | 52.5% | 23.3% | 7.5% | 1.4% | 12.2% | 3.1% | | | | | | |
| 1 | Mineral Resources are not Mineral Reserves and do not meet the threshold for reserve modifying factors., such as estimated economic viability, that would allow conversion to Mineral Reserves. There is no certainty that any part of the Mineral Resources will be converted into Mineral Reserves. |
| 2 | The in situ Mineral Resources are reported exclusive of any Mineral Reserves that may be derived from them. |
| 3 | The in-situ Mineral Resources are reported above 4E cut-off grades of 1.25 g/t (UG2), 1.69 g/t (MR PUP), 1.73 g/t (MRC) and 1.64 g/t (UPR). These are based on 4E basket prices of USD3 020/oz, USD2 230/oz, USD2 176/oz and USD2 292/oz respectively which include a 20% premium. A plant recovery of 82.8% was applied. |
| 4 | Numbers in the tables have been rounded to reflect the accuracy of the estimates and may not sum due to rounding. |
| 5 | Reef width represents the vertical thickness, and not true thickness |
| 6 | 1 troy ounce = 31.1034768 g. |
| SRK | Report date: 27 May 2022 |
| | Effective Date: 31 December 2021 |
| | |
| SRK Consulting – 576060 SPM PSM Project TRS | Page 112 |
Table 10.22: East Underground – SRK Audited Chromite Mineral Resources (INCLUSIVE) and Mineral Reserves Statement at 31 December 2021
Mineral Resources (INCLUSIVE0 | Reef | Reef Width
(cm) | Tonnage
(Mt) | Cr3O8 grade (%) | Contained
Cr2O3 (kt) | Mineral Reserves | Tonnage
(Mt) | Cr3O8 grade (%) | Contained
Cr2O3 (kt) |
| Indicated Mineral Resources | | | | | | Probable Mineral Reserves | | | |
| Magazynskraal | UG2 | 150 | 34.4 | 29.4 | 10 117 | Magazynskraal | 24.3 | 23.1 | 5 613 |
| Total Indicated Resources | | 34.4 | 29.4 | 10 117 | Total Probable Reserves | 24.3 | 23.1 | 5 613 |
| Inferred Mineral Resources | | | | | | | | | |
| Magazynskraal | UG2 | | 31.4 | 29.4 | 9 231 | | | | |
| Sedibelo East | UG2 | | 34.8 | 29.4 | 10 216 | | | | |
| Total Inferred Resources | | 66.2 | 29.4 | 19 447 | | | | |
Note:
| 1 | Cr to Cr2O3 conversion is 1:1.461. |
| 2 | Geological losses applicable are consistent with that of Table 10.20. |
| 3 | The chromite resources on Sedibelo East are classified in the Inferred category due to the uncertainty in the grade which is derived from a regression analysis on a small sample of UG2 density and chrome grades. The UG2 is mined as part of the LoM plan for its PGM content. While a chromite concentrate is produced in the plant, the recovered chromite is excluded from the economic analysis. |
Table 10.23: East Underground – SRK Audited Chromite Mineral Resources (EXCLUSIVE) Statement at 31 December 2021
Mineral Resources (EXCLUSIVE) | Reef | Reef Width
(cm) | Tonnage
(Mt) | Cr3O8 grade (%) | Contained
Cr2O3 (kt) |
| Indicated Mineral Resources | | | | | |
| Magazynskraal | UG2 | 150 | 23.61 | 29.4 | 6 944 |
| Total Indicated Resources | | 23.6 | 29.4 | 6 944 |
| Inferred Mineral Resources | | | | | |
| Magazynskraal | UG2 | | 31.4 | 29.4 | 9 231 |
| Sedibelo East | UG2 | | 16.1 | 29.4 | 4 744 |
| Total Inferred Resources | | 47.5 | 29.4 | 13 974 |
Note:
| 1 | Cr to Cr2O3 conversion is 1:1.461. |
| 2 | Geological losses applicable are consistent with that of Table 10.20. |
| 3 | The chromite resources on Sedibelo East are classified in the Inferred category due to the uncertainty in the grade which is derived from a regression analysis on a small sample of UG2 density and chrome grades. The UG2 is mined as part of the LoM plan for its PGM content. While a chromite concentrate is produced in the plant, the recovered chromite from Sedibelo East is excluded from the economic analysis. |
Table 10.24: West Pit – SRK Audited Low-grade Mineral Resources Statement at 31 December 2021
| Resource Area | | Volume (Mm3) | Bulk Density | Tonnage (Mt) | 4E Grade (g/t) | 4E Content (Moz) |
| Inferred Mineral Resources | | | | | |
| TSF tailings for retreatment | | 28.2 | 2.0 | 55.24 | 0.70 | 1.25 |
| Low-grade stockpile (scats and DMS discards) | | | 1.8 | 0.53 | 0.54 | 0.009 |
| Total low-grade stockpiles | | | | 55.76 | 0.70 | 1.26 |
| 1 | Mineral Resources are not Mineral Reserves and do not meet the threshold for reserve modifying factors., such as estimated economic viability, that would allow conversion to Mineral Reserves. There is no certainty that any part of the Mineral Resources will be converted into Mineral Reserves. |
| 2 | Numbers in the tables have been rounded to reflect the accuracy of the estimates, and may not sum due to rounding |
| SRK | Report date: 27 May 2022 |
| | Effective Date: 31 December 2021 |
| | |
| SRK Consulting – 576060 SPM PSM Project TRS | Page 113 |
| 10.5.5 | Reconciliation of Mineral Resources |
[SR4.2(v), SR4.5(vi)]
The reported Mineral Resource tonnages and contained 4E PGMs on SPM’s website at December 2019 and per this TRS at December 2021 are compared as follows:
| • | Central Underground Block | Table 10.27; |
| • | East Underground Block | Table 10.28. |
All reporting of Mineral Resources previously was done on an inclusive basis. Reasons for the differences are provided under Comments. Reporting of 6E PGM grades and contents was not done previously.
Table 10.25: West Pit Mineral Resource comparison
| Item | Units | SPM website
(Dec’2019) | This TRS (Dec’2021) | Comments |
| Measured Resources | | | | |
| Silicates (S2) | (Mt) | - | 0.02 | Difference due to mining depletion |
| | (Moz 4E) | - | 0.003 |
| UG2 | (Mt) | 1.78 | 0.05 | Difference due to mining depletion |
| | (Moz 4E) | 0.3 | 0.01 |
| Indicated Resources | | | | |
| Silicates (S2) | (Mt) | 17.8 | 13.06 | Difference due to mining depletion |
| | (Moz 4E) | 1.3 | 1.03 |
| UG2 | (Mt) | 6.25 | 5.84 | Difference due to mining depletion |
| | (Moz 4E) | 0.8 | 0.74 |
| Inferred Resources | | | | |
| Silicates (S2) | (Mt) | 0.08 | - | Using Resource pit shell for 2021 reporting and not a polygon to represent the Resource pit shell |
| | (Moz 4E) | 0.01 | - |
| UG2 | (Mt) | 0.01 | - |
| | (Moz 4E) | 0.00 | - |
Table 10.26: East Pit Mineral Resource comparison
| Item | Units | SPM website
(Dec’2019) | This TRS (Dec’2021) | Comments |
| Indicated Resources | | | | |
| MR (Contact/PUP/UPR) | (Mt) | 16.4 | 7.6 | Changes in the East Pit and Central Underground Block mine designs. East Pit Resources reported within the pit shell used to report Mineral Reserves. The 2019 figures were based on a 120% revenue factor resource pit shell. |
| | (Moz 4E) | 0.9 | 0.42 |
| UG2 | (Mt) | 7.2 | 3.9 |
| | (Moz 4E) | 1.2 | 0.62 |
| Inferred Resources | | | |
| MR (Contact/PUP/UPR) | (Mt) | 5.5 | 3.0 |
| | (Moz 4E) | 0.3 | 0.15 |
| UG2 | (Mt) | 0.4 | - |
| | (Moz 4E) | 0.1 | - |
Table 10.27: Central Underground Block Mineral Resource comparison
| Item | Units | SPM website
(Dec’2019) | This TRS (Dec’2021) | Comments |
| Indicated Resources | | | | |
| MR (Contact/PUP/UPR) | (Mt) | - | 1.04 | All PUP was excluded in 2019 due to the thin middling between UG2 and PUP. |
| | (Moz 4E) | - | 0.2 |
| UG2 | (Mt) | 22.6 | 15.4 | Difference due to updated Reef Picks, grade estimation and updated Resource classification criteria |
| | (Moz 4E) | 4.5 | 3.37 |
| Inferred Resources | | | | Difference due to updated Reef Picks, grade estimation and updated Resource classification criteria |
| MR (Contact/PUP/UPR) | (Mt) | - | 1.14 |
| | (Moz 4E) | - | 0.26 |
| UG2 | (Mt) | - | 7.99 |
| | (Moz 4E) | - | 1.66 |
| SRK | Report date: 27 May 2022 |
| | Effective Date: 31 December 2021 |
| | |
| SRK Consulting – 576060 SPM PSM Project TRS | Page 114 |
Table 10.28: East Underground Block Mineral Resource comparison
| Item | Units | SPM website
(Dec’2019) | This TRS (Dec’2021) | Comments |
| Measured Resources | | | | |
| MR (Contact/PUP/UPR) | (Mt) | - | - | |
| | (Moz 4E) | - | - | |
| UG2 | (Mt) | 11.68 | 11.7 | No difference |
| | (Moz 4E) | 2.1 | 2.1 | |
| Indicated Resources | | | | |
| MR (Contact/PUP/UPR) | (Mt) | 38.2 | 35.7 | Difference due to updated Reef Picks, grade estimation and updated Resource classification criteria |
| (Moz 4E) | 4.3 | 4.2 |
| UG2 | (Mt) | 33.4 | 33.4 | No difference |
| | (Moz 4E) | 5.3 | 5.3 | |
| Inferred Resources | | | | |
| MR (Contact/PUP/UPR) | (Mt) | 42.44 | 41.8 | Difference <2% |
| | (Moz 4E) | 5.9 | 5.84 | Difference not material |
| UG2 | (Mt) | 55.44 | 55.4 | No difference |
| | (Moz 4E) | 8.5 | 8.5 | |
| 10.6 | Metal or mineral equivalents |
[§229.601(b)(96)(iii)(B)(11)(vi)] [SR4.5(ix)]
No metal equivalents are reported.
Summation of the Pt, Pd, Rh and Au is reported as 4E grades of metal quantities, and summation of Pt, Pd, Rh, Au, Ir, and Ru is reported as 6E.
In cut-off calculations the revenue from each of these is considered and summed to arrive at a composite grade cut-off value (ether 4E or 6E). The metal prices are detailed in Section 15.
| SRK | Report date: 27 May 2022 |
| | Effective Date: 31 December 2021 |
| | |
| SRK Consulting – 576060 SPM PSM Project TRS | Page 115 |
| 11 | MINERAL RESERVE ESTIMATES |
[§229.601(b)(96)(iii)(B)(12)
The data presented here is based on the 2020 FS for the P-S-M Project and revised to account for mining depletion in the West Pit up to December 2021.
The geological structure, grade models and Mineral Resource estimates for the West Pit, East Pit, Central Underground and East Underground were reviewed and signed off by SRK as part of the 2020 FS and expanded to include complete reporting of 6E PGM and base metal grades for this TRS.
| 11.1 | Key assumptions, parameters and methods used to estimate Mineral Reserves |
[§229.601(b)(96)(iii)(B)(12)(i)] [SR5.1(ii), SR5.2(i-ix)]
| 11.1.1 | West Pit and East Pit |
[SR5.2(ix)]
Pit Optimization
A pit analysis is conducted to determine the most profitable pit design, given a Mineral Resource and a set of economic and metallurgical parameters. The optimization process evaluates the tonnage that could be extracted and the related profit margin via a series of nested pits which are generated at different commodity prices. The profit margin is governed by the prices, mining parameters, metallurgical recoveries and overall operating costs.
The open pit optimization was undertaken using the NPV Scheduler Optimization software and applied to the combined West Pit and East Pit Mineral Resource models as defined at 31 March 2020. A long-term 4E basket price of ZAR21 000/oz was confirmed as input to the pit optimization with further parameters listed in Table 11.1.
Table 11.1: Summary Open Pit Optimization Parameters
| Parameter | Unit | Input Parameters |
| Selling | | | Prices | Prill |
| | Pt | (ZAR/oz) | 870 | 59% |
| | Pd | (ZAR/oz) | 1 700 | 30% |
| | Rh | (ZAR/oz) | 5 500 | 5% |
| | Au | (ZAR/oz) | 1 460 | 5% |
| | Exchange Rate | (ZAR:USD) | 15.13 | - |
| | 4E Basket Price | (ZAR/oz) | 21 000 |
| Discount rate |
| | Discount rate | (%) | 10 |
| Processing |
| | Planned steady state production | (tpm) | 340 000 |
| | Plant Cost | (ZAR/t ore) | 274.70 |
| | Silicate Recovery (<40 mbgl) | (%) | 20 - 54 |
| | Silicate recovery (>40 mbgl) | (%) | 58 - 74 |
| | UG2 recovery (<40 mbgl) | (%) | 30 - 57 |
| | UG2 Recovery (>40 mbgl) | (%) | 63 - 80 |
| Mining |
| | Mining Cost (SOB) | (ZAR/t) | 16.53 |
| | Mining Cost (Waste) | (ZAR/t) | 26.08 |
| | Mining Cost (UG2) | (ZAR/t ore) | 25.33 |
| | Mining Cost (Silicates) | (ZAR/t ore) | 23.06 |
| | Mining Cost (Interburden) | (ZAR/t) | 25.54 |
| | Fixed and O/H Cost | (ZAR/t ore) | 53.30 |
| | Incremental Bench Cost | (ZAR/bench/t) | 0.16 |
| | Mining / Geo Loss | (%) | 5 |
| | Mining recovery | (%) | 95 |
| | Mining dilution (silicates) | (%) | 64 |
| | Mining dilution (UG2) | (%) | 94 |
| Pit slope angles |
| | Waste and Ore | (°) | 55 |
| Pit Parameters |
| | Bench Height | (m) | 15 |
| | | | | |
The pit optimization process is applied to the entire defined Mineral Resource base, including Inferred Mineral Resources. No cut-off grade was applied during the optimization and scheduling process, as the entire S1, S2 and U2D packages are mined.
| SRK | Report date: 27 May 2022 |
| | Effective Date: 31 December 2021 |
| | |
| SRK Consulting – 576060 SPM PSM Project TRS | Page 116 |
The unit costs were sourced from SPM’s 2020 business plan and summarized for input into the pit optimization software (NPV Scheduler). The effect of oxidization on plant recoveries increases nearer to surface; therefore, lower plant recoveries were applied to shallow lying areas. The recoveries were imported into the grade model to accurately estimate the recoveries during the pit optimization process.
The outcome of pit optimization is to determine the ultimate pit shell that outputs the highest possible surplus between net revenue and overall operating costs, without considering scheduling constraints or discounting.
West Pit and East Pit – Optimization Results
The pit optimization results for West and East Pits are shown in Figure 11.1.
The pit optimization for the West Pit used exclusion boundaries for the area next to the access road to the south of the pit and mined out areas to constrain the search area of the pit optimiser. Pit 70 (shown in orange in the left-hand diagram in Figure 11.1) was selected from the nested pits based on the average profit margin of 52% and incremental profit margins of 17%. This provides a reasonable profit margin without the risk of a high waste strip ratio.
No exclusion boundaries were set for the East Pit and the optimiser was free to select the required blocks. Pit 38 (shown in orange in the right-hand diagram in Figure 11.1) was selected from the nested pits based on the average profit margin of 30% and incremental profit margin of 17%.

Figure 11.1: Pit optimization results for West Pit (left) and East Pit (right)
The results for the selected pits from the optimization for the West and East Pits are set out in Table 11.2. The West and East Pits are very similar in size in terms of total rock moved, strip ratio and incremental profit margin but the West Pit delivers a better average profit and profit margin. This is attributed to the higher metal content of the West Pit.
Table 11.2: Selected pit shells for West Pit and East Pit
| Description | Unit | West Pit | East Pit |
| Pit Number | | Pit 70 | Pit 38 |
| Profit (undiscounted) | (ZARm) | 6 827 | 3 930 |
| Profit Margin Average | (%) | 52.8 | 29.7 |
| Profit Margin Incremental | (%) | 17.4 | 17.4 |
| Total Rock | (Mt) | 227.2 | 227.1 |
| Total Waste/low grade ore | (Mt) | 205.4 | 203.3 |
| Strip Ratio | | 9.4 | 8.5 |
| Recovered Metal | | | |
| Silicates | (t) | 17.0 | 12.5 |
| UG2 | (t) | 14.2 | 14.3 |
| Ore In-situ | | | |
| Silicates | (Mt) | 14.4 | 17.6 |
| UG2 | (Mt) | 7.4 | 6.2 |
| Total | (Mt) | 21.8 | 23.8 |
| SRK | Report date: 27 May 2022 |
| | Effective Date: 31 December 2021 |
| | |
| SRK Consulting – 576060 SPM PSM Project TRS | Page 117 |
West and East Pit - Practical Pit Design
Two practical pit designs for the West Pit and East Pit were prepared as part of the 2020 FS using the NPV Scheduler pit shell 70 and 38, respectively, as templates for the final pit design (Figure 11.2). The slope design parameters used for the practical pit designs at the West and East Pits are shown in Table 11.3.
The West Pit practical pit has been designed with two permanent ramps, one on the north-western side and the other on the south-western side. No permanent ramps have been designed on the eastern high wall side of the pit. Access from working faces to the various destinations will be gained by a series of temporary ramps on the mined-out footwall.
Table 11.3: Slope design parameters
| Parameters | West / East Pit Values |
| Overall slope angle up to 100 m – Zone 1 | 56° |
| Overall slope angle up to 150 m – Zone 2 | 55° |
| Overall slope angle up to 200 m – Zone 3 | 54° |
| Overall slope angle up to 250 m – Zone 4 | 53° |
| Bench height | 15 m |
| Ramp Width | 50 m |
The West and East Pit practical pit design is illustrated in Figure 11.2. Comparison of the designed pit outlines and the optimised pit shells show that the designed shells are within acceptable limits of the selected shells.
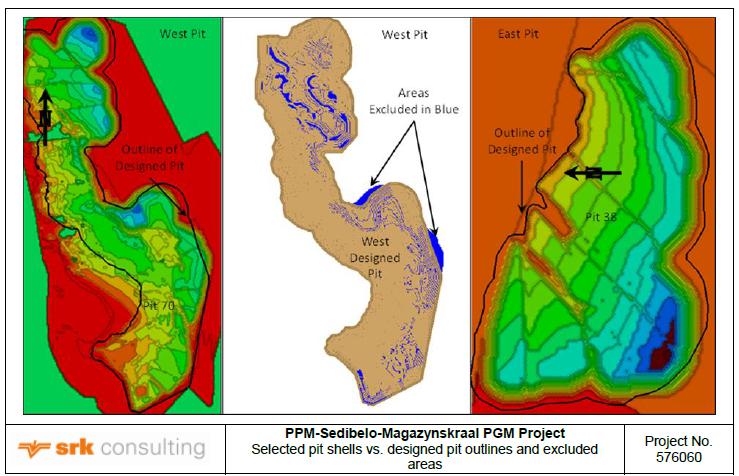
Figure 11.2: Selected pit shell vs. designed pit outlines and excluded areas
The designed West Pit delivered 17 Mt ore and 172 Mt of waste which is less than delivered by Pit 70. The difference is related to design changes made after the pit optimization. Some areas were excluded and some included due to practical mining reasons. The amount of rock outside of the designed shell was estimated to be 3.5 Mt ore and 44.2 Mt of waste, which compares well with the difference of 3.7 Mt ore and 34.5 Mt of waste.
The East Pit design and Pit 38 yields 22.6 Mt of ore and approximately 205 Mt of waste.
The practical pit designs with pit sequences for 2022 to 2026 for the West Pit and East Pit are shown schematically in Figure 11.3.
| SRK | Report date: 27 May 2022 |
| | Effective Date: 31 December 2021 |
| | |
| SRK Consulting – 576060 SPM PSM Project TRS | Page 118 |
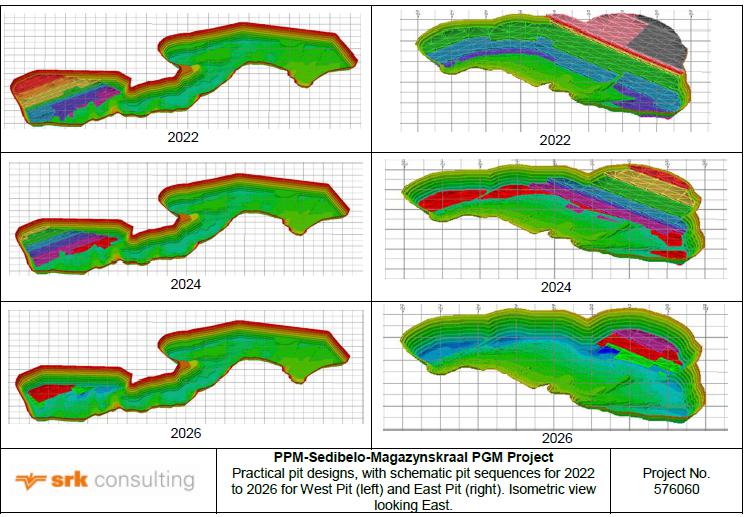
Figure 11.3: Practical pit design, with schematic pit sequences for 2022 to 2026 for West Pit (left) and East Pit (right)
The practical pit shells are draped across the current Mineral Resource models, correct as at 31 December 2021, and these Measured and Indicated Mineral Resource categories contained within the designed practical pits were scheduled in the LoM plan and are reported as Mineral Reserves. This process accounts for mining depletion in the West Pit up to 31 December 2021.
The estimated Mineral Reserves are based on a comprehensive LoM plan and represent what can be mined in practice.
| 11.1.2 | Central and East Underground Blocks |
The modifying factors applied in the Mineral Resource to Mineral Reserve conversion and incorporated into the mine design for the Central and East Underground Blocks are set out in Table 11.4. These parameters are in line with those used on similar mining operations within the BC.
The point of reference for the Mineral Reserves is RoM ore delivered to the RoM pad at PPM’s concentrator.
The frequency of dykes and faults (see Figure 12.3) results in the mining area being divided into several structural domains, with varying panel lengths ranging from 14 m to 25 m and extraction percentages.
Those PUP portions where the inter burden between the PUP footwall and UG2 hangingwall is greater than 12 m are available to be mined (see Figure 12.4 with the PUP reef in red and the UG2 in green). All other PUP material was excluded from the mine design.
A crown pillar of 25 m thick was left between the floor of the East Pit and the underground workings of the Central Underground Block.
Although all available material was scheduled, SPM applied a tail cut to the later periods of the LoM production schedule where production levels fell below 50 ktpm.
| SRK | Report date: 27 May 2022 |
| | Effective Date: 31 December 2021 |
| | |
| SRK Consulting – 576060 SPM PSM Project TRS | Page 119 |
Table 11.4: Modifying factors for the Central and East Underground Blocks
| Description | Units | PUP | UG2 |
| Final Planned Mining Cut | (m) | Channel width from model | Channel width from model |
| Density | (t/m3) | From model | From model |
| 4E Grade | (g/t) | From model | From model |
| Geological Losses Known | | From model and design | From model and design |
| Geological Losses Unknown | | As per geology | As per geology |
| Pillar Losses | | As per rock engineering | As per rock engineering |
| Mining losses | (%) | 11.9% | 16.5% |
| Stoping H/W dilution Density | (t/m3) | 3.1 | 3.1 |
| Stoping H/W dilution Grade | (g/t) | 0 | 0 |
| UG2 10 cm FW Density | (t/m3) | N/A | 3.1 |
| UG2 10 cm FW Grade 4E | (g/t) | N/A | 0 |
| Stoping F/W Dilution Density | (t/m3) | 2.75 | 3.0 to 3.1 |
| Stoping F/W Dilution Grade | (g/t) | 0 | 0 |
| F/W +1.5 m Density | (t/m3) | 2.75 | 3.0 to 3.1 |
| F/W +1.5 m Grade | (g/t) | 0 | 0 |
| F/W +30 m Density | (t/m3) | 2.8 | 2.8 |
| Stoping Overbreak | (%) | 10 | 7 |
| Stoping in Geological Structures (Waste) | (%) | 10% of geological losses | 10% of geological losses |
| Winch Beds etc. | (%) | 1.50 | 1.50 |
| Cross Tramming | (%) | 3 | 3 |
| Sub Development | | 230 m development in a raise line of 210 m by 245 m |
| Mining Recovery | (%) | 94% | 96% |
| Extraction Ratio | (%) | 61% | 60% |
| 11.2 | Mineral Reserve estimates |
[§229.601(b)(96)(iii)(B)(12)(ii)] [SR5.6(v), SR6.1(ii), SR6.2(i), SR6.3(i)-(iii)(v)(vi)]
The Mineral Reserves for the West Pit and East Pit at 31 December 2021 are set out in Table 11.5 and Table 11.6 respectively.
The combined Mineral Reserves for the Central and East Underground Blocks at 31 December 2021 are set out in Table 11.7.
The Mineral Reserves for the West and East Pits are defined as run-of-mine (RoM) as delivered to the RoM pad prior to crushing and screening. The Mineral Reserves for the Central and East Underground Blocks are defined as RoM ore delivered to surface.
Only Probable Mineral Reserves have been declared for the P-S-M Project. The Measured Mineral Resources for the underground operations were converted into Probable Mineral Reserves to reflect the mining confidence and concerns regarding the extent of the geological and structural complexities.
A Proved Reserve implies a very high level of certainty about the short-term mine planning (3-4 months) and any geological disturbances have been identified. For example, an unexpected pothole exposed during underground development or especially stoping throws the detailed planning schedule out significantly.
SPM has decided that it will only declare Proved Mineral Reserves for an underground operation when the required development to support a mining block has been established and the ore block has been sampled. This is in keeping with other underground mining operations in South Africa. SRK supports this view.
No Inferred Mineral Resources were included in the mine design.
| SRK | Report date: 27 May 2022 |
| | Effective Date: 31 December 2021 |
| | |
| SRK Consulting – 576060 SPM PSM Project TRS | Page 120 |
Table 11.5: West Pit – SRK Audited PGM Mineral Reserves at 31 December 2021
| Area | Reef | Tonnage
(Mt) | PGM Grade (g/t) (1) | Contained
4E | Contained
6E | Base Metal Grade (%) | Contained Base
Metal (kt) |
| 4E | 6E | Pt | Pd | Rh | Ru | Ir | Au | (Moz) | (Moz) | Ni | Cu | Ni | Cu |
| Probable Mineral Reserves | | | | | | | | | | | | | | |
| West Pit | Silicates | 8.3 | 1.32 | 1.44 | 0.80 | 0.40 | 0.06 | 0.10 | 0.02 | 0.06 | 0.35 | 0.38 | 0.093% | 0.019% | 7.7 | 1.6 |
| | UG2 | 4.8 | 2.15 | 2.63 | 1.27 | 0.61 | 0.26 | 0.40 | 0.09 | 0.01 | 0.33 | 0.41 | 0.009% | 0.002% | 0.5 | 0.1 |
| Total Probable Reserves West Pit | 13.1 | 1.62 | 1.88 | 0.97 | 0.48 | 0.13 | 0.21 | 0.05 | 0.04 | 0.69 | 0.79 | 0.062% | 0.013% | 8.2 | 1.7 |
| | 6E prill Silicates | | | 55.56% | 27.78% | 4.17% | 6.94% | 1.39% | 4.17% | | | | | | |
| | 6E prill UG2 | | | 48.29% | 23.19% | 9.89% | 15.21% | 3.42% | 0.38% | | | | | | |
Notes:
| 1. | Mineral Reserves are reported as RoM ore delivered to the RoM pad. |
| 2. | Mineral Reserves are based on various modifying factors and assumptions and may need to be revised if any of these factors and assumptions change. |
| 3. | Mineral Reserves should not be interpreted as assurances of economic life. |
| 4. | Mineral Reserves are derived from an optimized pit using a 4E basket price of ZAR21 000/oz without application of a cut-off grade. |
| 5. | 1 Troy Ounce = 31.1034768g. |
| 6. | Numbers in the table have been rounded to reflect the accuracy of the estimate and may not sum due to rounding. |
Table 11.6: East Pit – SRK Audited PGM Mineral Reserves at 31 December 2021
| Area | Reef | Tonnage
(Mt) | PGM Grade (g/t) (1) | Contained
4E | Contained
6E | Base Metal Grade (%) | Contained Base
Metal (kt) |
| 4E | 6E | Pt | Pd | Rh | Ru | Ir | Au | (Moz) | (Moz) | Ni | Cu | Ni | Cu |
| Probable Mineral Reserves | | | | | | | | | | | | | | |
| East Pit | Silicates | 12.9 | 1.01 | 1.11 | 0.60 | 0.31 | 0.05 | 0.08 | 0.02 | 0.05 | 0.42 | 0.46 | 0.09% | 0.01% | 11.1 | 1.9 |
| | UG2 | 7.7 | 2.47 | 3.00 | 1.49 | 0.69 | 0.28 | 0.43 | 0.10 | 0.01 | 0.61 | 0.74 | 0.01% | 0.00% | 0.6 | 0.4 |
| Total Probable Reserves East Pit | 20.5 | 1.56 | 1.82 | 0.93 | 0.45 | 0.14 | 0.21 | 0.05 | 0.04 | 1.03 | 1.20 | 0.06% | 0.01% | 11.7 | 2.3 |
| | 6E prill Silicates | | | 54.02% | 27.78% | 4.62% | 7.19% | 1.50% | 4.87% | | | | | | |
| | 6E prill UG2 | | | 49.50% | 23.11% | 9.31% | 14.40% | 3.37% | 0.31% | | | | | | |
| | | | | | | | | | | | | | | | | |
Notes:
| 1. | Mineral Reserves are reported as RoM ore delivered to the RoM pad. |
| 2. | Mineral Reserves are based on various modifying factors and assumptions and may need to be revised if any of these factors and assumptions change. |
| 3. | Mineral Reserves should not be interpreted as assurances of economic life. |
| 4. | Mineral Reserves are derived from an optimized pit using a 4E basket price of ZAR21 000/oz without application of a cut-off grade. |
| 5. | 1 Troy Ounce = 31.1034768g. |
| 6. | Numbers in the table have been rounded to reflect the accuracy of the estimate and may not sum due to rounding. |
| SRK | Report date: 27 May 2022 |
| | Effective Date: 31 December 2021 |
| | |
| SRK Consulting – 576060 SPM PSM Project TRS | Page 121 |
Table 11.7: Mineral Reserves for Central and East Underground Blocks at 31 December 2021
| Area | Reef | Tonnage
(Mt) | PGM Grade (g/t) (1) | Contained PGMs | Base Metal Grade (%) | Contained Base Metal (kt) |
| 4E | 6E | Pt | Pd | Rh | Ru | Ir | Au | (4E Moz) | (6E Moz) | Ni | Cu | Ni | Cu |
| Probable Mineral Reserves | | | | | | | | | | | | | | | | |
| Central Underground Block | PUP | 0.7 | 4.59 | 4.90 | 2.93 | 1.33 | 0.16 | 0.27 | 0.04 | 0.17 | 0.1 | 0.1 | 0.14% | 0.06% | 1.0 | 0.4 |
| | UG2 | 12.1 | 4.77 | 6.12 | 2.82 | 1.36 | 0.56 | 0.92 | 0.43 | 0.03 | 1.9 | 2.4 | 0.01% | 0.00% | 1.1 | 0.2 |
| Total Central Block | 12.8 | 4.76 | 6.05 | 2.83 | 1.35 | 0.54 | 0.89 | 0.41 | 0.04 | 2.0 | 2.5 | 0.02% | 0.00% | 2.1 | 0.6 |
| East Underground Block | PUP | 7.1 | 4.52 | 4.99 | 2.84 | 1.27 | 0.25 | 0.40 | 0.08 | 0.16 | 1.0 | 1.1 | 0.15% | 0.06% | 10.4 | 4.1 |
| | UG2 | 24.3 | 4.11 | 5.08 | 2.50 | 1.11 | 0.49 | 0.77 | 0.19 | 0.01 | 3.2 | 4.0 | 0.01% | 0.00% | 2.9 | 0.7 |
| Total East Block | 31.4 | 4.21 | 5.06 | 2.58 | 1.14 | 0.44 | 0.69 | 0.17 | 0.05 | 4.3 | 5.1 | 0.04% | 0.02% | 13.2 | 4.8 |
| Total Underground | PUP | 7.8 | 4.52 | 4.99 | 2.85 | 1.28 | 0.24 | 0.39 | 0.07 | 0.16 | 1.1 | 1.2 | 0.15% | 0.06% | 11.3 | 4.5 |
| | UG2 | 36.4 | 4.33 | 5.42 | 2.61 | 1.19 | 0.52 | 0.82 | 0.27 | 0.02 | 5.1 | 6.3 | 0.01% | 0.00% | 4.0 | 0.9 |
| Total Probable Mineral Reserves | 44.2 | 4.37 | 5.35 | 2.65 | 1.20 | 0.47 | 0.74 | 0.24 | 0.04 | 6.2 | 7.6 | 0.03% | 0.01% | 15.3 | 5.4 |
| | | | | | | | | | | | | | | | | | |
Notes:
| 1. | Mineral Reserves are reported as RoM ore delivered to the surface. |
| 2. | Mineral Reserves are based on various modifying factors and assumptions and may need to be revised if any of these factors and assumptions change. |
| 3. | Mineral Reserves should not be interpreted as assurances of economic life. |
| 4. | Mineral Reserves are reported at cut-off RoM grades of 2.32 g/t 4E and 2.67 g/t 4E for UG2 and PUP respectively. These are based on 4E basket prices of USD1 587/oz and USD1 336/oz and plant recoveries of 79% and 81%% for the UG2 and PUP reefs respectively. |
| 5. | 1 Troy Ounce = 31.1034768g. |
| 6. | Numbers in the table have been rounded to reflect the accuracy of the estimate and may not sum due to rounding. |
| SRK | Report date: 27 May 2022 |
| | Effective Date: 31 December 2021 |
| | |
| SRK Consulting – 576060 SPM PSM Project TRS | Page 122 |
| 11.2.1 | Reconciliation of Mineral Reserves |
[SR6.1(iii), SR6.3(iv)]
The reported Mineral Reserve tonnages and contained 4E PGMs on SPM’s website at December 2019 and per this TRS at December 2021 are compared as follows:
| • | Central Underground | Table 11.10; and |
| • | East Underground Block | Table 11.11. |
Table 11.8: West Pit Mineral Reserve Comparison
| Item | Units | SPM website (Dec’2019) | This TRS (Dec’2021) | Comments |
| Probable Reserves | | | | |
| MR (Contact/PUP/UPR) | (Mt) | 15.5 | 9.2 | The differences relate to mining depletion over 24 months, plus a reduced pit footprint based on a lower 4E basket price. |
| | (Moz 4E) | 0.85 | 0.40 |
| UG2 | (Mt) | 7.4 | 5.2 |
| | (Moz 4E) | 0.64 | 0.36 |
Table 11.9: East Pit Mineral Reserve Comparison
| Item | Units | SPM website (Dec’2019) | This TRS (Dec’2021) | Comments |
| Probable Reserves | | | | |
| MR (Contact/PUP/UPR) | (Mt) | 13.3 | 12.9 | Exclusion of Inferred silicates near subcrop |
| | (Moz 4E) | 0.56 | 0.42 |
| UG2 | (Mt) | 5.7 | 7.7 | The East Pit footprint was reduced based on a lower 4E basket price, with increased mining dilution |
| | (Moz 4E) | 0.68 | 0.61 |
Table 11.10: Central Underground Block Mineral Reserve Comparison
| Item | Units | SPM website (Dec’2019) | This TRS (Dec’2021) | Comments |
| Probable Reserves | | | | |
| MR (Contact/PUP/UPR) | (Mt) | - | 0.7 | Isolated blocks that are above cut-off and the middling to UG2 >20m. |
| | (Moz 4E) | - | 0.1 |
| UG2 | (Mt) | 19.4 | 12.1 | Areas to the north excluded from the design due to severe faulting. Areas in the south and east moved from Indicated to Inferred |
| | (Moz 4E) | 3.01 | 1.9 |
Table 11.11: East Underground Block Mineral Reserve Comparison
| Item | Units | SPM website (Dec’2019) | This TRS (Dec’2021) | Comments |
| Probable Reserves | | | | |
| MR (Contact/PUP/UPR) | (Mt) | 6.3 | 7.1 | Decreased production rate from 140 ktpm to 80 ktpm reduced the effect from tail losses in the LoM production profile. (production rate <50 ktpm excluded) |
| | (Moz 4E) | 1.15 | 1.0 |
| UG2 | (Mt) | 22.2 | 24.3 |
| | (Moz 4E) | 3.46 | 3.2 |
| 11.3 | Mineral Reserve classification criteria |
[§229.601(b)(96)(iii)(B)(12)(iv)] [SR6.2(i)]
| 11.3.1 | West Pit and East Pit |
Only Probable Mineral Reserves have been declared for the West and East Pits. The small quantity of Measured Mineral Resources in the West Pit was converted to the Probable Mineral Reserves due to mining confidence.
| 11.3.2 | Central and East Underground Blocks |
The UG2 and PUP Mineral Resource classification is presented in Figure 11.4. The dykes and fault losses are not shown but were taken into consideration during the mine design process.
No Inferred Mineral Resources were included in the mine design.
| SRK | Report date: 27 May 2022 |
| | Effective Date: 31 December 2021 |
| | |
| SRK Consulting – 576060 SPM PSM Project TRS | Page 123 |
The PUP resource in the Central Underground Block is limited to small, scattered areas throughout the block and is not as widespread and concentrated as in the East Underground Block.
Only Probable Mineral Reserves have been declared for the Central and East Underground Blocks. The Measured Mineral Resources in the East Underground Block were converted to Probable Mineral Reserves due to the uncertainty around short-term mine planning, the ability to achieve the production and development targets and concerns regarding the extent of sympathetic faults and dykes parallel to the major structural features identified in the geophysical surveys. Since a Proved Reserves classification implies a very high level of certainty, it is more appropriate to classify these reserves as Probable.
SPM has decided that it will only declare Proved Mineral Reserves for an underground operation when the required development to support a mining block has been established and the ore block has been sampled. This is in keeping with other underground mining operations in South Africa. SRK supports this view.

Figure 11.4: Resource classification for UG2 (top) and PUP (bottom)
| SRK | Report date: 27 May 2022 |
| | Effective Date: 31 December 2021 |
| | |
| SRK Consulting – 576060 SPM PSM Project TRS | Page 124 |
| 11.4 | Cut-off grade calculation |
[§229.601(b)(96)(iii)(B)(12)(iii)] [SR5.2(iv)]
| 11.4.1 | West Pit and East Pit |
There was no cut-off grade applied during the optimization and scheduling process.
Because of the nature of the ore body, a strategic decision was made to mine all reef material thus dilution of more than 64% and 94% has been applied to the silicates and UG2 material respectively (refer to Table 12.7).
| 11.4.2 | Central and East Underground Blocks |
The production schedule targeted material that is above the cut-off grade or breakeven grade for inclusion in the LoM plan. Only the UG2 and PUP (Merensky potholed on to the UPR) reefs are of economic importance underground. The average 4E grade for both reef horizons is above the break-even grade and it is therefore considered to be economical to mine where designed.
Break-even calculation
The break-even calculation for the 2020 FS was based on benchmarked operating costs, modifying factors from similar type mining operations in the BC and global economic parameters. The selected operating cost was that reported for the Amandelbult mine for 2019.
The prill split for each of the two horizons times the price forecasts were used to calculate a basket price per gram for each period of the LoM plan. The minimum basket prices for the UG2 and PUP over this period, respectively ZAR732.40/g 4E and ZAR616.44/g 4E, were selected to use in the break-even calculation.
Using the basket price and other factors presented in Table 11.12, a break-even grade over the planned mining cut (min. 1.15 m) of 2.32 g/t for the UG2 reef and 2.67 g/t for the PUP reef was calculated.
When the break-even grade is applied to the stoping panels, 18 PUP panels in the Central Block and two PUP panels in the East Block were found to be below the break-even grade. These small areas were included in the plan, as selective mining was considered impractical. The impact of these small areas on the plan is not material.
Table 11.12: Break-even calculation for Underground Blocks
| Parameter | Units | Factor |
| UG2 | PUP |
| | | (USD/oz) | Prill | (USD/oz) | Prill |
| Pt | | 931 | 60% | 831 | 63% |
| Pd | | 1 882 | 27% | 1 523 | 28% |
| Rh | | 4 411 | 12% | 6 093 | 5% |
| Au | | 1 520 | 0.5% | 1 527 | 4% |
| Exchange rate | (ZAR:USD) | 14.80 | 14.30 |
| Price | (ZAR/g 4E) | 732.40 | 616.44 |
| Dilution | (%) | 21 | 27 |
| Concentrator recovery | (%) | 79 | 81 |
| Mining Recovery | (%) | 96 | 94 |
| Royalties | (%) | 5 | 5 |
| Revenue | (ZAR/g 4E) | 321 | 299 |
| Bench Marked Operational Cost | (ZAR/t RoM) | 1 224 | 1 224 |
| Break Even (In-situ) | (g/t 4E) | 2.94 | 3.66 |
| Break Even (RoM) | (g/t 4E) | 2.32 | 2.67 |
| Average Mining Grade Central Block (RoM) | (g/t 4E) | 5.00 | 4.53 |
| Average Mining Grade East Block (RoM) | (g/t 4E) | 4.12 | 4.53 |
| 11.5 | Metal or mineral equivalents |
[§229.601(b)(96)(iii)(B)(12)(v)] [SR5.2(iv)]
The Mineral Reserves are not reported as a metal or mineral equivalent grade which is defined as, a single equivalent grade of one major metal.
Summation of the Pt, Pd, Rh and Au is reported as 4E grades of metal quantities, and summation of Pt, Pd, Rh, Au, Ir, and Ru is reported as 6E.
| SRK | Report date: 27 May 2022 |
| | Effective Date: 31 December 2021 |
| | |
| SRK Consulting – 576060 SPM PSM Project TRS | Page 125 |
| 11.6 | Risk Factors to Mineral Reserve estimates and modifying factors |
[§229.601(b)(96)(iii)(B)(12)(vi)] [SR4.3(viii)]
From the data received it has been shown that the open pit optimizations have been studied rigorously and accurately.
Both practical pit designs have been prepared based on the optimum pit shells defined in the optimization. The intermediate pit designs are based on the 5-year plan pit designs. The mining schedule was prepared using the EPS mining software package and the mineral reserves are estimated within the practical pit designs. This schedule was essentially driven by RoM targets and the need to backfill waste into the mined-out areas of the open pits.
The vertical advance rate is generally within accepted norms. In order to start backfilling as soon as possible, it has been necessary to mine out the northern areas of the pit where the vertical advance rate approaches the upper acceptable norm as quickly as possible.
The same comments regarding the West Pit made above pertain equally to the East Pit and are not repeated here.
One family at the Effective Date of this report had refused to relocate from the East Pit area (Wilgespruit). SPM advised SRK that this has been resolved and at the issue date of this report access on to Wilgespruit was possible.
Inferred Mineral Resources on the shallow western edges (see Figure 10.14) will be mined as part of the mine design but are excluded from the production schedule reported in this TRS. SPM’s drilling programme in 2021 and 2022 is planned to increase the drill coverage in these areas so that the resource category can be upgraded.
| 11.6.3 | Central and East Underground Blocks |
| • | Only the Indicated Resource categories have been scheduled in the LoM plan. The conversion of Mineral Resource categories scheduled to Mineral Reserves complies with the requirements of the SAMREC Code. The estimated Mineral Reserves are based on a comprehensive LoM plan and represent what can be mined in practice; |
| • | The mine design and scheduling have been conducted with reasonable care and conform to best practice standards; |
| • | SRK concurs with the conventional breast stoping mining method selected for the PUP and the UG2 reefs and believes it is appropriate for the orebody characteristics. The planned production rate is based on sound planning parameters and modifying factors which consider the characteristics of the orebody and operational constraints; |
| • | The trackless development in the haulages and crosscuts will enable achievement of the development rates and facilitate the opening up of the half levels on the levels; and |
| • | The ventilation design concludes that total ventilation quantities of 500 m3/s and 650 m3/s for the Central and East Underground Blocks respectively would be required, which is premised on a ventilation rate of 0.06 m3/s/kW. This assumes that Tier 4 diesel engines and 10 ppm fuel will be available to keep emission levels below 0.16 mg/m³ when the project commences. When mining is required at rock temperatures in excess of 35.0ºC, ventilation for removal of heat generated from diesel machinery is as important as ventilation for diesel emission dilution. |
| SRK | Report date: 27 May 2022 |
| | Effective Date: 31 December 2021 |
| | |
| SRK Consulting – 576060 SPM PSM Project TRS | Page 126 |
[§229.601(b)(96)(iii)(B)(13)
| 12.1 | Geotechnical and hydrogeological parameters relevant to mine designs |
[§229.601(b)(96)(iii)(B)(13)(i)] [SR3.1(i)]
| 12.1.1 | West and East Pits - Geotechnical Parameters |
[SR3.1(i), SR4.1(ii), SR5.2(ii)(vii)(viii)]
West Pit
Extensive studies have been carried out for the West Pit. The slope design parameters per geotechnical domain for the West Pit are given in Table 12.1. These design parameters are provided in the Mandatory Code of Practice to Combat Rock-fall and Slope Instability Related Accidents in Surface Mines (the CoP). It must be noted that these parameters are linked to the expected height of the highwalls.
Table 12.1: West pit slope design parameters per slope sector
| Design Sector | Weathered Rock/Saprolite Inter-ramp Slope (°) | Unweathered Rock Upper Slope Inter-ramp Slope (°) | Unweathered Rock Lower Slope Inter-ramp Slope (°) | Overall Slope (°) |
| East & south (125 m high) | 60 | 60 | 62 | 55 |
| West (70 m high) | 47 | 47 | | 40 |
SRK scrutinized several operational review reports which had been compiled by a rock engineering service company. The standard of the operational support and review reports was considered adequate to ensure good on-going risk management.
Key findings from existing studies are summarized as follows:
| • | Rock core testing has been carried out to obtain suitable rock mass parameters for the pit design. However, geotechnical data acquisition in required in all geological horizons, including the weathered material, dyke intrusion and orebodies (UG2 and Merensky Reef, where applicable). This will ensure continued adequacy of the geotechnical design and support potential for the optimization of the design slopes; |
| • | No laboratory strength results for the discontinuities within the rock mass were available at the time of the design analysis. Therefore, the design analyses were based on assumed average discontinuity shear strength values, benchmarked against similar lithologies, and although these values seem plausible, should be validated as soon as possible. It is considered that the discontinuity strengths in the rock mass fabric and major to intermediate geological structures will form the over-riding controls on slope stability; |
| • | Accepted design methods and standards have been applied in the design process and the designs are considered to be plausible, conforming to acceptable probability of failure and factor of safety design criteria. However, there is no clear definition of how the impact of blasting was considered during slope stability analyses; and |
| • | The effects of ground water have been included in the pit design and indicate that little influence is expected on the pit stability. Nevertheless, an appropriate water management and monitoring system should be put in place. |
Key observations from the site visit:
| • | Pit monitoring is currently carried out using visual observations. As recommended in design studies, routine instrument-based monitoring should be implemented to ensure long-term pit stability and verify the designs. This is considered critical as the pits expand towards their design capacity; |
| • | SRK concurs with the outcomes of the design studies, which suggest that the potential for wedge failure is high. Such failures were locally visible within the pit; |
| • | Localised bench failures were frequently observed resulting in an accumulation of failed material which has the potential to drive inter-bench pit failures if allowed to remain untreated. Cleaning operations combined with improved blasting efficiency should be managed effectively; and |
| • | Prevalence of coating on structures, i.e., slickensided serpentinite/talc, some 1 – 2 mm in thickness was evident on joint surfaces. The effect of such infill is susceptibility to swelling in moist conditions, producing a low friction angle and negligible cohesion across the joint surface. The design report references a 40° friction angle applied to all structures which SRK considers to be optimistic for serpentinized infill. This has been reduced in recent analyses, with no significant effect on the slope designs. |
| SRK | Report date: 27 May 2022 |
| | Effective Date: 31 December 2021 |
| | |
| SRK Consulting – 576060 SPM PSM Project TRS | Page 127 |
The overall design criteria for the pit and pit extension to a final depth of 170 m appear to be sound. There is though no clarity provided in the design reports as to whether the quoted angles refer to toe-to-crest or toe-to-toe/crest-to-crest slope angle measurements. Therefore, SRK has conservatively assumed that all quoted slope angles are defined as toe-to-crest measurements.
East Pit
The slope design parameters per geotechnical domain for the East Pit are given in Table 12.2.
Table 12.2: East Pit slope design parameters per geotechnical domain
| Design Sector | Weathered Rock/Saprolite Inter-ramp Slope (°) | Unweathered Rock Inter-ramp Slope (°) | Fault Zone Inter-ramp Slope (°) | Overall Slope (°) |
| North sector | 35 | 55 | | 49 |
| North-east sector | 35 | 45 | | 42 |
| East sector | 35 | 50 | | 45 |
| South-east sector | 35 | 55 | | 49 |
| South sector | 35 | 55 | | 49 |
| West sector | 35 | 55 | 42 | 45 |
| North-west sector | 35 | | 35 | 35 |
Geotechnical recommendations for the East Pit are summarized as follows:
| • | Structural data mapping from the exploratory shaft is of value to confirm stereographic results and should be incorporated into the study; |
| • | No laboratory strength results for the discontinuities within the rock mass were available at the time of the design analysis. Therefore, the design analyses were based on assumed average discontinuity shear strength values, benchmarked against similar lithologies, and although these values seem plausible, should be validated as soon as possible. It is considered that the discontinuity strengths in the rock mass fabric and major to intermediate geological structures will form the over-riding controls on slope stability; |
| • | Similar cognisance of reduced friction angles and joint contact condition from serpentinite/talc-infilled structures should be accounted for. This should consider the establishment of an on-going laboratory testing programme for both intact rock strength and discontinuity strength. This may introduce some additional conservativism into the design but the additional data will support the potential for a slope design optimization; |
| • | Some historic evidence of rotational shear failure was observed during the site visit. This appeared limited to the weathered horizon and should be considered during the slope design investigation, with appropriate design measures to minimise its influence on the pit operations; |
| • | Ground water influence is considered to be low; however, seasonal high rainfall effects should be suitably accounted for with groundwater management plans; and |
| • | The potential for structurally controlled pit slope failure is expected to be limited to single bench height, however the potential for structures to influence pit slope stability to stack height has been identified as a cause for further study. This should be considered during any potential pit slope design optimization studies. |
SRK’s findings for the West and East Pits relate to the need for design validation as mining continues and minor to moderate operational risks, that may result in only minor impacts to the Mineral Reserve (localised locking up of ore). No major geotechnical risks were found for the open pit operations.
| 12.1.2 | Central and East Underground Blocks – Geotechnical Parameters |
[SR3.1(i), SR4.1(ii), SR5.2(ii)(vii)(viii)]
The underground geotechnical aspects comprised designs of the mine accesses, crown pillar, stoping and support. The design process employed mainly empirical and analytical techniques, as well as numerical modelling investigations to a lesser extent, as summarised in Table 12.3.
| SRK | Report date: 27 May 2022 |
| | Effective Date: 31 December 2021 |
| | |
| SRK Consulting – 576060 SPM PSM Project TRS | Page 128 |
Table 12.3: Geotechnical design considerations
| Criteria description | Value or description | Design basis |
| East | Central |
| Decline maximum width | ≤ 6.3 m | ≤ 6.0 m | RMR stand-up time |
| Decline maximum height | ≤ 5.0 m | ≤ 5.0 m |
| Spacing between declines (skin to skin) | ≥ 15.0 m | ≥ 15.0 m | Pillar FoS >2 |
| Single reef mining spans (UG2) | 28.0 m | 28.0 m | Rock mass rating and stability number |
| Single reef mining spans (UPVZ) | 28.0 m | 28.0 m | Rock mass rating and stability number |
| Multi-reef mining spans (UG2) | 16.0 m | 16.0 m | Industry benchmarking and stability number |
| In-stope pillar losses, UG2, Single reef (average) | 12.81% | 9.29% | FOS ≥ 1.6 |
| In-stope pillar losses, UG2, Multi reef (average) | 18.93% | 16.49% | FOS ≥ 1.6 |
| In-stope pillar losses, UPVZ, Multi reef (average) | 11.93% | 11.93% | FOS ≥ 1.6 |
| Regional pillar losses (Single reef) | 4.76% | 4.76% | Width: height ratio ≥ 10 |
| Dominant pillar dimension, UG2 single reef | 6 m x 6 m | 6 m x 6 m | FOS ≥ 1.6 |
| Dominant pillar dimension, UG2 multi-reef | 5 m x 5 m | 5 m x 5 m | FOS ≥ 1.6 |
| Dominant pillar dimension, UPVZ | 4 m x 4 m | 4 m x 4 m | FOS ≥ 1.6 |
| Single reefs | Prestressed elongates and bolts | Analytical equations and industry practice |
| Multi-reefs | Prestressed elongates, bolts and grout packs |
Findings from the 2020 FS indicate that the project is robust and no significant concerns were identified. Areas where poor ground conditions occur in the declines have been identified and catered for in the support design. Stope design has catered for both single reef (UG2 only) and multi reef (UG2 and PUP) scenarios. However, no drill hole data was available for the West Portal design; therefore, the design should be viewed as a preliminary design with low confidence as data had to be inferred and contoured from the closest drill holes, which were over 2 km away from the site of the West Portal. Since construction of the West Portal is due to start in 2024, SPM has sufficient time to undertake the necessary investigations to enable the design to be confirmed.
Sufficient provision for ground control monitoring should be allowed for in the implementation plan.
Due to the complex influence that selective mining of the PUP will have on the UG2 horizon coupled with the extreme blockiness of the rock mass created by the intersection of a labyrinth of joints, rock related risks would dominate project risks.
Additional geotechnical work should be carried out before the implementation phase commences, which would include:
| • | Directional, orientated drilling along the line of the decline development to validate structural orientation and design rock mass data [completed for East Portal and decline, see below]; |
| • | Detailed portal slope engineering designs, with their associated risk management programmes, such as slope stability monitoring and depressurisation [detailed design for East Portal boxcut completed, see below]; |
| • | Review and optimization of spans and pillar designs by numerical modelling based on additional data gathered; |
| • | Update of detailed cost estimates to improve accuracy and source current cost quantities; and |
| • | Detailed numerical modelling for support of sills within the first 2-10 m into the hanging-wall of the UG2. |
The ore body is intersected by numerous dykes and major faults (Figure 12.1) which have been interpreted from the magnetics and drill hole database. SPM excavated three trenches across the centre-line trace of the boxcut and decline in November 2021. These confirmed the presence of dykes of various compositions (predominantly mafic) (Figure 12.2) which would intrude the original boxcut position per the 2020 FS. These dykes had orientations parallel to that of the boxcut and decline spine, with one dyke trace virtually overlying that of the first leg of the decline. If left unchanged, this would place the long-term stability of the decline and boxcut at major risk.
SPM decided to change the original position of the boxcut (as defined in the 2020 FS) so that major dyke intersections within the boxcut and the first leg of the decline would be avoided (shown in blue in Figure 12.2).
Between October and December 2021, SPM drilled fifteen geotechnical diamond drill holes (ca. 3 800 m) along the trace of the portal and decline for the East Underground Block (Figure 12.3). This included three inclined holes along the decline trace to investigate fault conditions. Downhole wireline surveys were conducted on nine of the holes, including three holes which had been drilled for the portal/boxcut.
| SRK | Report date: 27 May 2022 |
| | Effective Date: 31 December 2021 |
| | |
| SRK Consulting – 576060 SPM PSM Project TRS | Page 129 |

Figure 12.1: Dykes (green) and major faults (orange) to 700 mbs

Figure 12.2: Dykes confirmed by trenching relative to original boxcut and decline for East Portal with revised boxcut layout
| SRK | Report date: 27 May 2022 |
| | Effective Date: 31 December 2021 |
| | |
| SRK Consulting – 576060 SPM PSM Project TRS | Page 130 |
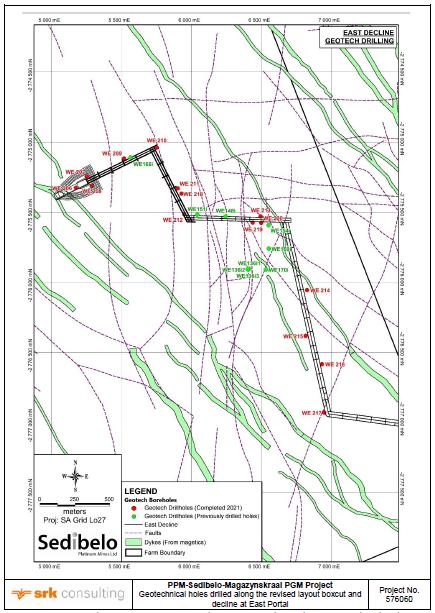
Figure 12.3: Geotechnical holes drilled along the revised layout boxcut and decline at East Portal
| SRK | Report date: 27 May 2022 |
| | Effective Date: 31 December 2021 |
| | |
| SRK Consulting – 576060 SPM PSM Project TRS | Page 131 |
Designs at a construction level of accuracy for the slope architecture and ground stabilisation for the revised boxcut position (Figure 12.3) were due to be completed in February 2022. The volume of material to be excavated at the East Portal boxcut has reduced considerably, from 480 000 m3 to 159 000 m3, a saving in both time and cost.
While the throw on these features appears to be minimal, the combined frequency of dykes and faults divides the mining area into smaller blocks complicating the mine design and access methodology to the reef horizons. These structural domains or ground control districts have varying panel lengths (14 m to 25 m) and extraction percentages (75% and 91%). Each district was assigned a specific geological loss percentage.The distance between the PUP footwall and UG2 hangingwall varies between 10 m and 24 m, with only those PUP portions where the inter burden is greater than 12 m being mineable. The areas available to be mined are shown in Figure 12.4 with the PUP reef in red and the UG2 in green.
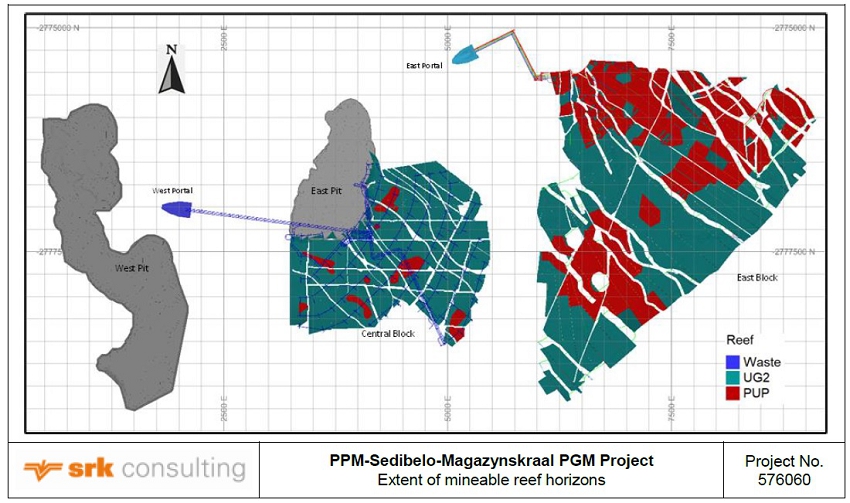
| Figure 12.4: | Extent of mineable reef horizons |
Mining of the PUP is restricted to areas where the interburden between the PUP and UG2 exceeds 12 m and pillars are superimposed to ensure the stability of the beam between the UG2 and PUP reefs (Figure 12.5). Multi-reef mining in areas where the interburden is less than 12 m will not be permissible without the use of backfill.
The support strategy for good ground conditions, poor ground conditions and stope support for the Central and East Underground Blocks are shown in Table 12.4 to Table 12.6, respectively.
| Table 12.4: | Support design for good ground conditions |
| Area | Q | ESR | Bolt length
sides (m) | Bolt length
roof (m) | Bolt spacing
(m) |
| Central | 2.87 | 1.60 | 1.77 | 1.50 | 1.46 |
| East | 2.45 | 1.60 | 1.77 | 1.61 | 1.41 |
| Average | 2.66 | 1.60 | 1.77 | 1.55 | 1.44 |
| Table 12.5: | Support design for poor ground conditions |
| Area | Q | ESR | Bolt length
sides (m) | Bolt length
roof (m) | Bolt spacing
(m) |
| Central | 0.40 | 1.60 | 1.77 | 2.88 | 1.05 |
| East | 0.40 | 1.60 | 1.77 | 2.88 | 1.05 |
| Average | 0.40 | 1.60 | 1.77 | 2.88 | 1.05 |
| SRK | Report date: 27 May 2022 |
| | Effective Date: 31 December 2021 |
| | |
| SRK Consulting – 576060 SPM PSM Project TRS | Page 132 |
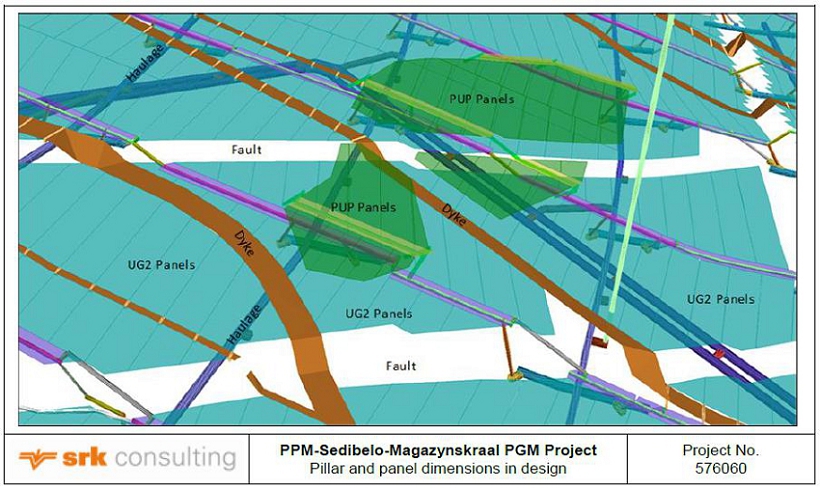
| Figure 12.5: | Pillar and panel dimensions in design |
| Table 12.6: | Stope support functions for Central and East Underground Blocks |
| Support type | Area of application | Purpose |
| Timber elongates | Stopes | Support 1.5-2.0 m of hangingwall and prevention of cantilever of feldspathic pyroxenite |
| Grout packs | Stopes | Support of total interburden between UG2 and PUP |
| 0.9 m hydrabolts | Stopes | Beam building of reef parallel parting in PUP and support of the Leader and sills in the UG2 |
| 2.2 m bolts | Gullies and drives | Pinning beyond layers to build self-supporting beam |
| W-straps and OSRO straps | Gullies and drives | Areal coverage in blocky ground conditions |
| 3.5 m cable anchors | Raises | Support of up to 3 m high wedges |
| 12.1.3 | Hydrogeological Parameters |
[SR5.2(ii) (vii) (viii)]
Experience at Amandelbult and Northam mines showed minimal water down to approximately 600 mbs. Below 600 mbs, a deep-seated water table coupled with water-bearing NW-SE running structures (faults, joints, dykes) were responsible for groundwater inflows into the workings. Flows tended to increase with depth.
Water in stopes was not a threat as long as these did not transgress any water-bearing fissure. These fissures were picked up in the footwall development and barrier pillars were left around these fissures in the stopes.
Cover drilling is crucial to identify any such fissures ahead of the development, so that the barrier pillars can be correctly planned.
The 3D model predicted maximum unmitigated inflows of 1 300 m³/d (East Pit), and inflows of 3 300 m3/d and 8 000 m3/d for Central and East Underground Blocks respectively.
| 12.2 | Production rates, mine life, mining dimensions, mining dilution/recovery factors |
[§229.601(b)(96)(iii)(B)(13)(ii)][ [SR3.1(i)], SR5.2(ii)(viii)]
| 12.2.1 | West Pit and East Pit |
Mining Dilution and Recovery Factors
The mining models for the open pit operations are divided into two ore horizons the silicates and the U2D. Silicates is the combination of S1, UPR, PRHZB and LPR. The U2D is the combination of chromitite stringers in the hangingwall, pyroxenite waste between stringers, UG2, and part of the footwall pegmatoid below the UG2 this is shown schematically in Figure 12.6. The dilution created by this combination is average 20% depending on the thickness of the different layers and is defined as model dilution.
| SRK | Report date: 27 May 2022 |
| | Effective Date: 31 December 2021 |
| | |
| SRK Consulting – 576060 SPM PSM Project TRS | Page 133 |
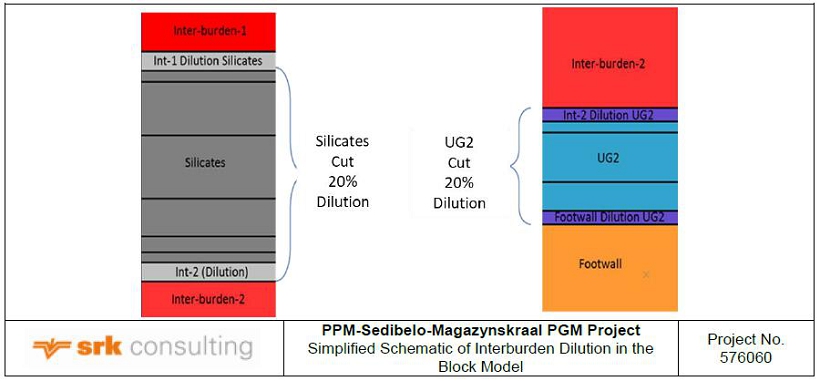
| Figure 12.6: | Simplified Schematic of Interburden Dilution from the Block Model |
After the mining optimisation (Table 12.7) was completed, a reconciliation was done between the mining model and the actual plant feed measured over 18 months of historical data, from July 2019 till December 2020, to determine new modifying factors. The results of this reconciliation showed that for the silicates an additional 47% dilution and mining recovery of 91.5% is realised in the processing feed. Based on this the modifying factors for mine scheduling was adjusted as indicated in Table 12.7. The total adjustment of 164% is the effect of total dilution and mining recovery for the Mineral Resource to Mineral Reserve conversion.
| Table 12.7: | Mining Modifying Factors |
| Reef | Original
Volume | Model
Dilution | New Volume | Second
Phase
Dilution | Mining
Recovery | Total
Adjustment |
| Silicates | 100% | 20.0% | 120.0% | 47.0% | 90.0% | 164% |
| UG2 | 100% | 20.0% | 120.0% | 70.2% | -91.5% | 194% |
The modifying factors applied in the pit optimisation shown in Table 11.1 was 5% geological loss, 95% mining recovery and 64% dilution. For 1 g/t of Pt in situ this will translate to plant feed of 0.55g/t of plant feed.
The modifying factors used for the mine production scheduling (Table 12.7) will translate to 0.61 g/t of plant feed, thus the pit optimisation modifying factors was more conservative than the modifying factors used for scheduling thus it was decided at that stage not to redo the pit optimisation.
Below is the calculation method of the Total Adjustment:

Mining Schedule
The open pit mining schedule is based on total maximum production RoM rates of 106 ktpm of U2D and 240 ktpm of silicates drawn simultaneously from both the West and East pits. Vertical advance rates per year for the mining schedule are generally acceptable at approximately 60 m/yr.
The open pit mining method used at the West Pit is a modified strip-mining approach with backfill following mined out areas. Several benches are in operation simultaneously to sustain production rates using operating bench widths of 100 m and blasting benches 50 m wide. On average, seven ore mining blocks are required to be in production to sustain the 240 ktpm silicate and 106 ktpm U2D ore requirement to the plant. The mining of ore and waste has been scheduled from the current mining faces / (sub-outcrop) to the final high wall on a multi-bench basis. Access from working faces to destinations (plant, surface waste dumps and backfill dumps) will be gained from multiple temporary ramps. This will require accurate and careful planning. Bench operating widths are to be planned to suit the equipment used by the mining contractors. No intermediate pits have been designed. The schedule is also driven by backfilling whereby open pit waste material is loaded and hauled to mined-out pit areas and dumped so as not to interfere with primary mining and hauling access to the plant. Backfilling of West Pit began in 2015.
| SRK | Report date: 27 May 2022 |
| | Effective Date: 31 December 2021 |
| | |
| SRK Consulting – 576060 SPM PSM Project TRS | Page 134 |
The annual mining schedules for ore mined from the West Pit and East Pit is given in Figure 12.7. These rates were achieved in 2020.
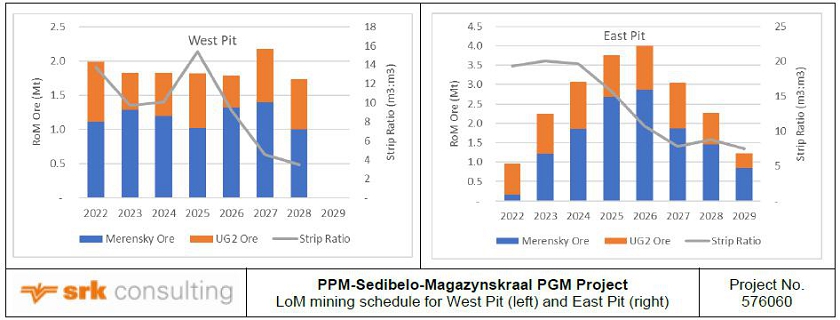
| Figure 12.7: | LoM mining schedule for West Pit (top) and East Pit (bottom) |
| 12.2.2 | Central and East Underground Blocks |
Approximately ten months is required to complete the development necessary to achieve steady state production per level. Three to four raise lines (630 m to 840 m on strike) are required to sustain steady state production.
When steady state production is achieved on a half level, the development reverts to a ‘just-in-time’ philosophy and only development required for stope replacement is undertaken.
The P-S-M Project used the advance rates presented in Table 12.8, with some minor adjustments on the rates in the faulted areas situated on the Western and Eastern extremities of the mining area.
| Table 12.8: | Project advance rates |
| Description | Units | Rate of Advance in Good
Conditions | Rate of Advance in Faulted
Areas |
| Decline | (m/month) | 60 | N/A |
| Level Access and Laterals | (m/month) | 55 | N/A |
| Infrastructure | (m/month) | 55 | 30 |
| Haulage | (m/month) | 55 | 40 |
| RAW (on-reef) | (m/month) | 35 | 30 |
| Vent Holes (Pilot and Ream) | (m/month) | 40 | |
| X-cut, Tip Cubbies, Cubbies etc. | (m/month) | 55 | 40 |
| Box Holes | (m/month) | 30 | 20 |
| Conventional Development | (m/month) | 22 | 15 |
| Stoping Crew UG2 | (m2/month) | 330 | 300 |
| Stoping Crew PUP | (m2/month) | 300 | 270 |
| Ledging Crew | (m2/month) | 300 | 270 |
| Equipping Delay before Ledging | | 1 month | |
| Equipping Delay before Stoping | | 2 months | |
The dimensions for each excavation associated with the primary access infrastructure are shown in Table 12.9.
| Table 12.9: | Access infrastructure dimensions |
| Excavation | Width (m) | Height (m) |
| Declines and Rail Haulage | 5.5 | 5.0 |
| Access Infrastructure | 5.0 | 4.5 |
| Workshop | 5.0 | 5.0 |
| Truck Tip | 5.0 | 6.0 |
The production profiles for the Central and East Underground Blocks are presented Figure 12.8.
| SRK | Report date: 27 May 2022 |
| | Effective Date: 31 December 2021 |
| | |
| SRK Consulting – 576060 SPM PSM Project TRS | Page 135 |
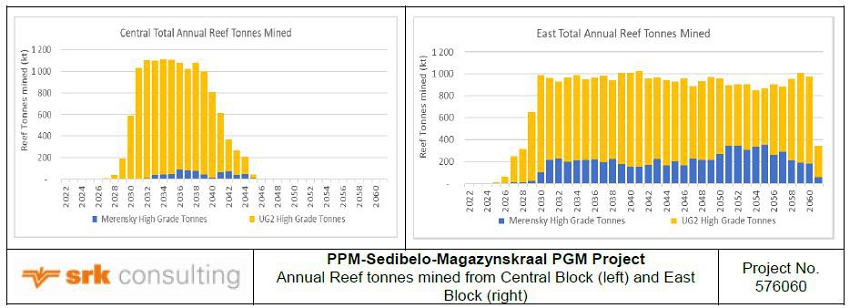
| Figure 12.8: | Annual Reef tonnes mined from Central Block (left) and East Block (right) |
| 12.3 | Access, underground development and backfilling |
[§229.601(b)(96)(iii)(B)(13)(iii)] [SR4.3(ii), SR4.5(iii), SR5.2(i)(v)(vii)(ix)]
| 12.3.1 | West Pit and East Pit |
The mining operations at West Pit have been underway since December 2008. The mining of the East Pit orebody is scheduled to start in January 2022. The East Pit is much smaller in size than the West Pit (Figure 12.9) and will not be able by itself to sustain the current production levels of 240 ktpm of silicates and 106 ktpm of U2D (UG2) ore to the plant. Its main purpose then is to extend the life of the current open pit operations by supplementing the ore production from the West Pit.
The designs and scheduling of the open pit mining in the West and East Pits were conducted on a combined basis.
The West Pit and East Pit ore bodies will be mined by open pit methods. Mining has been and will be carried out by contractors and managed by SPM personnel. The mining sequence is essentially driven by RoM annual targets and the backfilling of waste to mined out areas within the open pit.
Backfilling
The West Pit operations have been scheduled to backfill all waste material (133 Mt) going forward, with an average stripping ratio of 9.2 for the remaining mine life.
The East Pit has a stripping ratio of 12.3 with 229 Mt scheduled for the waste dumps.
| SRK | Report date: 27 May 2022 |
| | Effective Date: 31 December 2021 |
| | |
| SRK Consulting – 576060 SPM PSM Project TRS | Page 136 |
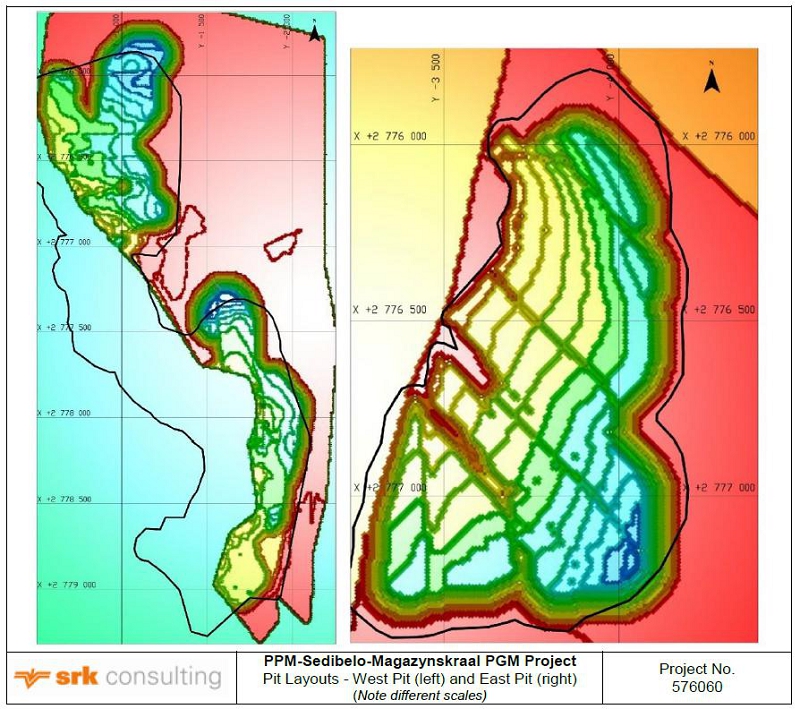
| Figure 12.9: | Pit layouts - West Pit (left) and East Pit (right) |
| 12.3.2 | Central and East Underground Blocks |
Underground Access
Access to the underground workings is through a three-barrel decline system.
The West Portal, located adjacent to the West Pit mining area, is close to the plant and the decline does not intersect the structurally complex Tarentaal Reef horizon. The East Portal position was placed in the area described in the current Wilgespruit mining right and approved EMPR, based on the 2008 Barrick FS. A layout of the mining areas is provided in Figure 12.10.
| SRK | Report date: 27 May 2022 |
| | Effective Date: 31 December 2021 |
| | |
| SRK Consulting – 576060 SPM PSM Project TRS | Page 137 |
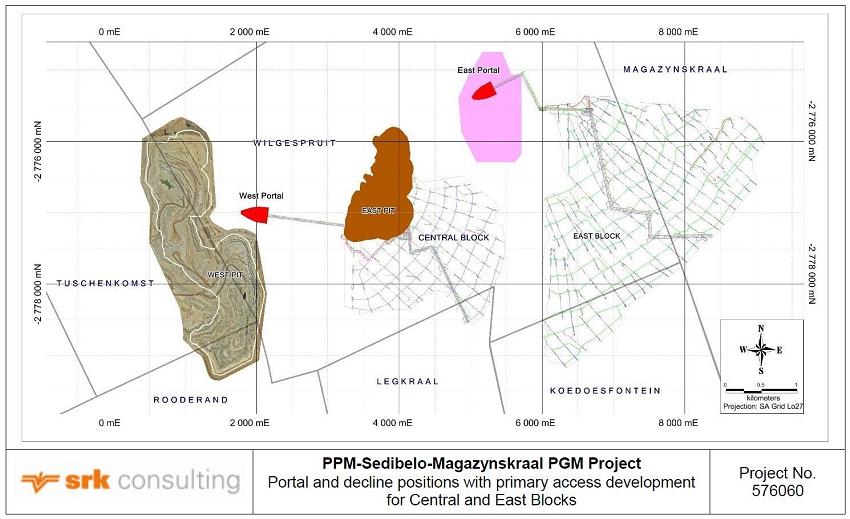
| Figure 12.10: | Portal and decline positions with primary access development for Central and East Blocks |
For each of the portals, a box-cut will be developed through the hanging wall units to intersect un-weathered ground. The depth of the boxcut will be such as to ensure that a minimum of 4.5 m of un-weathered rock is present above the brow of the decline entrances.
The declines will be developed at an initial gradient of approximately 9º to a final depth of 700 mbs and will maintain a depth of approximately 50 m below the UG2 reef horizon. The motivation for development of the declines in the footwall is to reduce technical challenges in accommodating faults and to provide a buffer capacity between the UG2 reef horizon for the ore handling system. Cover drilling will take place to ensure that water fissures are detected upfront and sealed to prevent ingress of water into the excavations.
The triangular shape of the mining blocks limits the strike extent on the first three levels to between 600 m and 1 800 m and results in the continuous access of new levels down-dip to sustain the required mine production rate. Conversely, the lower levels have increased strike distances of up to 5 km and can sustain production levels for a longer period before replacement is required. Due to the short life span of the upper levels, an increased decline sinking rate, within the project scheduling parameters, is required.
The excavation of the East Portal is planned to commence in January 2022, followed six months later by the three declines which will be developed to intersect the main infrastructure and truck tip area of the East Block. The decline cluster will consist of a main, conveyor and chair lift decline. The West Portal construction starts in January 2024 followed six months later by the decline development comprising main, conveyor and chair lift declines. Once the main rock handling facilities are established, two intake declines and a chair lift will continue downwards to the final depth of extraction in each block. The top two diagrams in Figure 12.11 are plan views of the primary access development and main tip areas associated with the Central and East Blocks, while the bottom two diagrams are isometric views. The main infrastructure and tipping areas are critical as the construction of the conveyor belt to surface cannot commence until they are established. Trucking of rock to surface will continue until the completion of tipping infrastructure and the conveyor belt.
Mining Method
The mining method selected for the mining of the reefs is conventional breast stoping. The reasons the mining method was selected are as follows:
| · | This mining method lends itself to selective mining and this enables focussed mining in the ground control districts selected for geotechnical considerations; |
| SRK | Report date: 27 May 2022 |
| | Effective Date: 31 December 2021 |
| | |
| SRK Consulting – 576060 SPM PSM Project TRS | Page 138 |
| · | The reef channel width is approximately 1.4 m for the UG2 reef and 1.2 m for the PUP reef. The narrow reef mining method reduces the amount of dilution of the ore; |
| · | The dip of the reefs ranges from 12° to 14° which is too steep for trackless mobile equipment to operate effectively; |
| · | Although the trackless layouts could have been designed on apparent dip, the reef mineralization is not developed consistently along the reef plane. Long hole or hybrid options were discarded; and |
| · | The reef is also faulted and is cut though by dykes. The throw is generally low and the variable strike direction of the reef from east (western boundary) to north-east (eastern boundary) would pose a challenge for trackless mining. |
Stoping Design Parameters
An eleven-day fortnight operation is planned, with fixed-time blasting at the end of each dayshift. The panels will be drilled and blasted during the dayshift and the bulk of the broken ore will be removed from the stopes during the night shift.
Panel advance rates will range between 11 m/month and 15 m/month, dependent on the reef type, panel length, and frequency of geological structures. Each raise line will accommodate three stoping crews and each crew will be allocated two equipped panels. Therefore, six panels per raise line will be active during the stoping operation.
Stoping crew planned production rates between 270 m2/month to 330 m²/month were applied per individual area in the scheduling program.
Conventional UG2 stoping operations on a half level (or one side of the decline suite), will generally comprise the following:
| · | A raise line being developed; |
| · | An equipping and ledging raise; |
| · | Two stoping raise lines; and |
| · | A vamping and reclamation raise line. |
Six half-levels are required to produce 80 ktpm of ore at steady state by each Block. This requires a total of twelve stoping and six ledging raise lines to be available. Stoping operations will make use of bolting, sticks and grout packs as support.
The basic layout for stoping of the UG2 and PUP reefs is shown in Figure 12.12.
| SRK | Report date: 27 May 2022 |
| | Effective Date: 31 December 2021 |
| | |
| SRK Consulting – 576060 SPM PSM Project TRS | Page 139 |
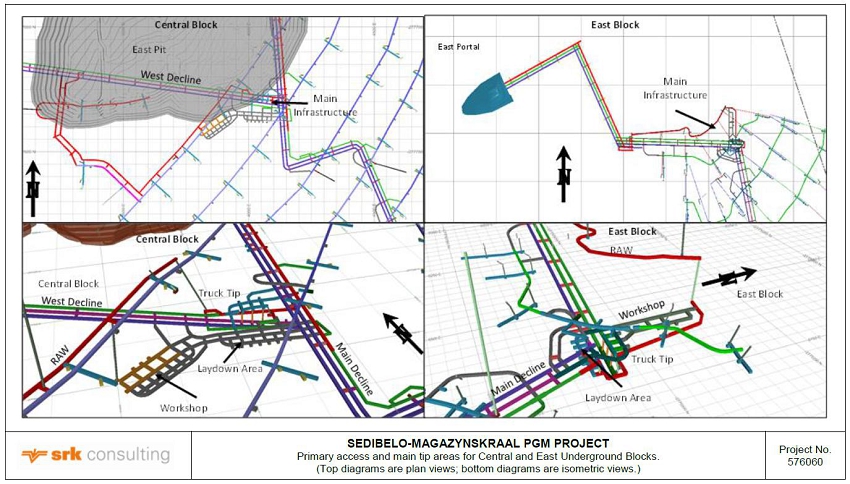
| Figure 12.11: | Primary access and main tip areas for Central and East Underground Blocks |
| SRK | Report date: 27 May 2022 |
| | Effective Date: 31 December 2021 |
| | |
| SRK Consulting – 576060 SPM PSM Project TRS | Page 140 |

| Figure 12.12: | Stope layout for UG2 (left) and PUP (right) |
Access to the reef horizon and ore removal from the PUP reef will be via a travelling way and passes extended from the UG2 horizon. Stoping of the PUP reef above the UG2 reef horizon will only commence once the UG2 stoping in that raise line has been completed.
The stoping panel advance rates for areas in good and poor mining conditions are presented in Table 12.10.
| Table 12.10: | Stoping crew advance rates |
| Description | Units | UG2 Good
Conditions | UG2 Poor
Conditions | PUP Good
Conditions | PUP Poor
Conditions |
| Panel Length | (m) | 25 | 17 | 25 | 25 |
| Effective Operating Panel Length | (m) | 25 | 25.5 | 25 | 25 |
| Panels per Crew | (/crew) | 2 | 2 | 2 | 2 |
| Drill Length | (m) | 1.2 | 1 | 1 | 1 |
| Effective Advance/Blast | (m) | 1 | 0.85 | 0.85 | 0.85 |
| Shifts/Month | (/month) | 22 | 22 | 22 | 22 |
| Blasting Rate | (%) | 70 | 62 | 70 | 62 |
| Advance/Month | (m) | 15.4 | 11.6 | 13.1 | 11.6 |
| Extraction | (%) | 85 | 90 | 92 | 92 |
| Crew Calculated | (m2/crew) | 328 | 266 | 301 | 267 |
| Crew Schedule applied | (m2/crew) | 330 | 270 | 300 | 270 |
The stoping panels were scheduled on square metres (m2). Subsequently the total quantity of ore produced will vary slightly as the planned stoping cut and densities fluctuate from area to area.
Underground Development
[§229.601(b)(96)(iii)(B)(13)(iii)]
Secondary development to access the ore body, starting from the declines, will be excavated using trackless equipment.
Single trackless haulages will be developed at a gradient of less than 5° to the horizontal and maintained approximately 25 m vertically below the reef, along strike. The haulage dimensions were designed to accommodate 45 t capacity haul trucks including ventilation columns and other services.
Crosscuts will be developed from the haulages to service both reef horizons. A travelling way equipped with a mono-winch will be developed at an angle of 34º to access the reef horizon.
Two ore passes (approximately 18 m and 14 m in length) will service production from the stope panels, as illustrated in Figure 12.13. The ore passes will not be equipped with box fronts as LHDs will collect the blasted rock from the footwall and load it directly into the trucks.
| SRK | Report date: 27 May 2022 |
| | Effective Date: 31 December 2021 |
| | |
| SRK Consulting – 576060 SPM PSM Project TRS | Page 141 |
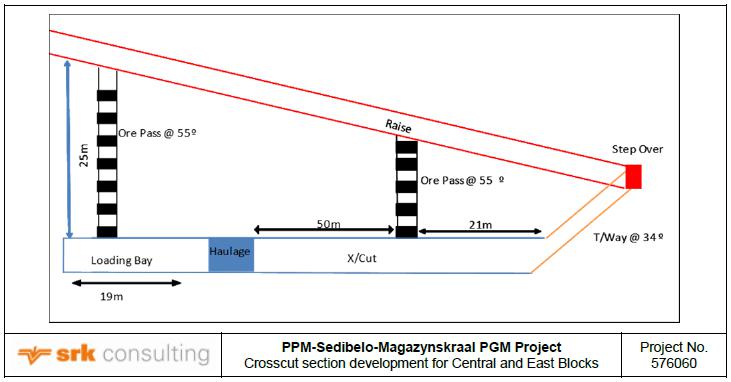
Figure 12.13: Crosscut section development for Central and East Blocks
The mining advance rates used for scheduling of waste development through highly faulted areas were reduced to 15 m per month to compensate for additional support and expected poor ground conditions.
The cross-sectional dimensions of each excavation associated with secondary development are presented in Table 12.11.
Table 12.11: Excavation dimensions (secondary access)
| Excavation | Length (m) | Width (m) | Height (m) |
| Haulage | | 5.0 | 4.5 |
| Crosscut | approx. 90.0 | 5.0 | 4.5 |
| Waiting Place | 6.0 | 5.0 | 4.5 |
| Stope Ore Pass UG2 | approx. 18.0 | 2.0 | 2.0 |
| Muck Bays | 5.0 | 4.5 | 4.5 |
Reef development consisting primarily of raises, advance strike gullies (ASGs) and winch cubbies will be developed using hand-held rock drills and cleaned with scraper winches.
The raise lengths average 252 m between levels. The back-length (raise length) changes according to the dip of the reef and the impact of faults. ASGs will be developed at a slight angle above the horizontal to assist with water drainage.
Once the trackless development section completes a cross-cut, the conventional crews will commence with the development of the travelling way to access the UG2 reef horizon. A single development crew consisting of a seven-man team will be assigned to each raise line.
Once the travelling way intersects the reef, a step-over will be developed on strike for 6 m to access the raise position. The raise will then continue up dip for approximately 252 m to establish through ventilation to the upper level. The raise will, however, stop briefly for the development of the two box holes necessary for tipping rock directly onto the footwall of the crosscut. The LHD will collect the ore and load the dump trucks. While construction of the tipping arrangement is in progress, a load-haul-dump (LHD) will load the blasted rock into the trucks utilising the top ore pass.
Ventilation
The mine ventilation design parameters prepared to support the mine design of the 2020 FS are summarized in Table 12.12.
| SRK | Report date: 27 May 2022 |
| | Effective Date: 31 December 2021 |
| | |
| SRK Consulting – 576060 SPM PSM Project TRS | Page 142 |
Table 12.12: P-S-M Project ventilation design parameters
| Item | Central Mine | East Mine |
| Steady state production | 80 ktpm | 80 ktpm |
| Number of active half levels | 6 | 7 |
| Typical half level production | 13 ktpm | 13 ktpm |
| Average stope height | 1.2 m | 1.55 m |
| Average dip of reef | 12° to 20° | 12.5° |
| Average stope back-length | 245 m | 250 m |
| Approximate strike of project | 2 200 m | 5 000 m |
| Approximate strike from breakaway | 1 100 m | 2 500 m |
| Crosscut spacing | 210 m | 210 m |
| Ventilation velocity | | |
| Intake airways (with personnel) | 6 m/s | 6 m/s |
| Return airways (without personnel) | 10 m/s | 10 m/s |
| Conveyor decline (ventilated directly to return) | 0.4 m/a | 0.4 m/a |
| Raise bore hole (Upcast) | 20 m/s | 20 m/s |
| RBH (downcast) | 12-15 m/s | 12-15 m/s |
| Diesel exhaust dilution | | |
| Ventilation rate | 0.06 m3/s/kW (1) | 0.06 m3/s/kW |
| Diesel heat load – for LHDs | 1.0 kW/rated kW | 1.0 kW/rated kW |
| Diesel heat load – for trucks | 1.5 kW/rated kW | 1.5 kW/rated kW |
| Diesel fleet air required per half level | 42.3 m3/s (2) | 42.3 m3/s |
| Each crosscut for LHD loading - minimum | 15.0 m3/s | 15.0 m3/s |
| Air requirements | | |
| Primary Declines | 75 m3/s (3) | 75 m3/s |
| Decline development | 42 m3/s (4) | 42 m3/s |
| Half level (typical) | 50 m3/s | 50 m3/s |
| Re-development | 12 m3/s | 12 m3/s |
| Workshop | 40 m3/s | 40 m3/s |
| Conveyor decline | 20 m3/s | 20 m3/s |
| Total air requirement | 500 m3/s | 650 m3/s |
| 1 | A ventilation rate of 0.06 m³/s/kW assumes Tier 4 engines with 10 ppm low-sulfur diesel fuel and catalytic converters are available for the project to satisfy point of use DPM emission limits of 0.16 mg/m3 . |
| 2 | With 20% leakage factor, increases to 52.5 m3/s. |
| 3 | Provides for two 45-tonne trucks and two 10-tonne LHDs. |
| 4 | Provides for a 45-tonne truck and a 10-tonne LHD. |
The planned ventilation and cooling designs are aimed at risk control measures and minimizing all occupational health exposures to below occupational exposure limits (OELs).
The overall airflow requirements were assessed in terms of airflow provision for diesel emission dilution, heat removal and clearance of blasting fumes, provision of a ventilation rate per tonne mined and ventilation requirements for conventional breast stoping (UG2 and PUP reefs) using handheld drills with face and gully scrapers supported by trackless development and waste/ore transport. Ore transport will be by means of trucks to the silo level and then conveyed in the primary decline with a conveyor system to surface.
The ventilation design for the 2020 FS was based on a tonnage of 80 ktpm RoM from each of the Central and East Underground Blocks. The intake ventilation system combines a decline cluster with strategically positioned downcast fresh air raise boreholes (RBHs). The decline cluster acts as the main intake ‘header’ to supply air to the active footwall drives (FWDs). As air is depleted from the decline, additional ‘make-up’ air is fed from surface via the downcast RBHs. Each decline system is ventilated as a separate district. Sufficient air is provided to stabilise the heat balance without refrigeration.
The strategy is to re-use air in a cascade system to ventilate stopes in series. Most of the air will be re-used with some leaking back through worked-out areas to be replaced with fresh air on the intermediate levels. To allow for leakage, sufficient fresh air will be supplied on the bottom level and regulated intermediate levels, to ventilate up to three back lengths in series (ledge, production stope and vamping stope), before being rejected in the worked-out stopes above the vamping stope. There is a limit as to how often the re-use of air can be repeated. Three back-lengths (750 m) will be ventilated in series with fresh air introduced in the intermediate levels. The re-use of air should make more air available for situations where mining both sides raise lines may be required.
| SRK | Report date: 27 May 2022 |
| | Effective Date: 31 December 2021 |
| | |
| SRK Consulting – 576060 SPM PSM Project TRS | Page 143 |
The overall airflow requirement is dominated by the provision of ventilation for diesel emission dilution. A maximum reject temperature of 29.0˚C has been designed for mining to 700 m below surface. The guideline for heat tolerance screening will have to be applied. The heat stress management programme would include a medical/physical examination including Heat Tolerance Screening (HTS) and safe work practices. These issues should be addressed in the CoP for an Occupational Health Programme (Occupational Hygiene and Medical Surveillance) on Thermal Stress as required by the DMRE.
Air quantities from the station cross-cut and stope crosscuts will be controlled with mechanized doors for trackless equipment, ledging raises will be controlled with brattices.
The ventilation infrastructure required for the Central and East Underground Blocks is summarized in Table 12.13 and shown schematically in Figure 12.14.
Table 12.13: Central and East Underground Blocks ventilation infrastructure
| Item | Central Block | East Block |
| Intake airways | | |
| Intake decline legs (chairlift and equipment) | 2 | 2 |
| Downcast RBHs (3.2 m Ø diameter) | 3 | 4 |
| Return airways | | |
| Upcast RBHs (3.2 m Ø diameter) on 0 Level | 4 | 2 |
| Upcast RBHs (3.2 m Ø diameter) on 4 Level | - | 2 |
| Upcast RBHs (3.2 m Ø diameter) on 8 Level | - | 1 |
| Main Fans | | |
| Fan stations air volume flow rate | 4 x 160 m3/s | 4 x 160 m3/s |
| Installed motor power | 4 x 550 kW | 4 x 550 kW |
| Refuge bays (self-sustaining) | Spaced at 500 m intervals | At 500 m intervals |
Detailed ventilation layouts were compiled for the decline and haulage development. The fans, column diameters and ventilation quantities are sufficient for diesel emission dilution and clearance of blasting fumes.
The major risk of fire will be from localised sources such as conveyors, mobile machines, bulk fuel, oil storage and electrical distribution equipment.
Mitigation measures will include ventilating the conveyor declines direct to return, dividing the mine into fire zones, permanent monitoring stations, fire suppression systems, prevention and emergency preparedness. If fires do occur, they will be localised; the conveyor decline will be isolated with fire doors. All vehicles and machines will be equipped with an approved on-board fire suppression system.
Flammable gas (methane) is one of the main hazards in underground mines. Most flammable gas intersections are associated with dykes and faults. The risk of intersecting methane cannot be discounted. The risk appears to increase as mines go deeper. A mandatory flammable gas CoP should be compiled and complied with before mining of the declines commence.
In the event of an emergency, the following has been planned:
| • | Self-Contained Self Rescuers; |
| • | Refuge bays (self-sustaining); and |
| SRK | | Report date: 27 May 2022
Effective Date: 31 December 2021 |
| | | |
| SRK Consulting – 576060 SPM PSM Project TRS | Page 144 |

Figure 12.14: Isometric views of ventilation infrastructure for Central Block (left) and East Block (right)
The capital footprint has been defined until steady state production is achieved. Primary ventilation infrastructure includes eight fan stations. Allowing for secondary ventilation equipment including fans, ducting, refuge bays, stoppings and other auxiliary equipment, the estimate for the capital footprint is ZAR538m (Table 12.14).
| SRK | | Report date: 27 May 2022
Effective Date: 31 December 2021 |
| | | |
| SRK Consulting – 576060 SPM PSM Project TRS | Page 145 |
Table 12.14: LoM Ventilation Capex summary
| Capital Footprint | Central Block (ZARm) | East Block (ZARm) | Total (ZARm) |
| Main Fans | 55.1 | 55.1 | 110.2 |
| Secondary Vent (1) | 90.4 | 127.1 | 217.4 |
| Auxiliary equipment (2) | 8.3 | 17.1 | 25.3 |
| Environmental monitoring system (3) | 5.1 | 12.3 | 17.4 |
| Emergency preparedness (4) | 60.3 | 107.1 | 167.4 |
| Total | 219.2 | 318.6 | 537.7 |
Note:
| 1. | Fans, ducts, doors, seals, brattices |
| 2. | Gas detection instruments, vent officers’ instruments |
| 3. | Flow, temperature, and pressure sensors and controllers, computer software, SCADA interface |
SRK Comments
The ventilation design was based on a diesel emission dilution rate of 0.06 m³/s/kW. However, some of the mechanised Pt mines ventilating at rates in excess of 0.06 m³/s/kW cannot maintain Diesel Particular Matter (DPM) emissions below the recommended OEL of 0.16 m³/kg. A ventilation rate of 0.06 m³/s/kW can only be considered if Tier 4 or 5 engines with 10 ppm fuel become available by the time the project commences.
The total ventilation quantity of ±500 m³/s per decline is sufficient for single-sided mining stopes. However, in the event of geological disturbances, for flexibility, most mines equip both sides of the raise lines and plan the ventilation quantities accordingly. If there are more geological disturbances than anticipated, the declines may be at risk of being under ventilated. Should this be the case, the ventilation quantity in certain areas of the mine can be increased by considering a ventilation on demand system (performance of fans can be adjusted). The above should be taken into consideration when doing the final ventilation design.
The design allows for the re-use of air in a cascade system to ventilate levels in series. There is a limit as to how often the re-use of air can be repeated. Three back-lengths (750 m) will be ventilated in series with fresh air introduced in the intermediate levels. The re-use of air should make more air available for situations where mining both sides raise lines may be required.
In a situation where two or three stopes need to be ventilated in series, the tramming crosscut (length 70 m) on the levels immediately above will need to be ventilated (±13.0 m³/s) during dump truck loading operations. Allowance has been made for 13.0 m³/s per tramming crosscut. The distribution of ventilation will have to be carefully managed to ensure sufficient ventilation is available for the planned production requirements.
The rock temperature will not exceed 37.0°C. The design confirms that no cooling will be required down to 700 m. The maximum wet bulb temperatures should not exceed 29.0°C.
| 12.4 | Required Mining Fleet, Machinery and Personnel |
[§229.601(b)(96)(iii)(B)(13)(iv)] [[SR3.1(i)], SR5.2(viii)]
| 12.4.1 | Underground Blocks - Mining fleet and Machinery |
All footwall access development and the on-reef return airway (RAW) situated on Level 0 will make use of trackless equipment.
The Central and East Underground Blocks will peak at five and four trackless crews respectively. Due to the odd shape and smaller size of the Central Block, the strike distance on the upper and lower levels is reduced which results in an increased development rate to achieve steady state.
On-reef mining equipment will utilise Hydropower Equipment except for the scraper winches. Two 55 kW power pack units each delivering 12 l/s at 18 MPa will be installed in the haulage cubbies to supply high pressure water for two stoping, one ledging and one development raise line. High pressure pipes will also be installed into every operating panel.
Winches and scrapers, 55 kW rated units for the raises and 22 kW rated units for the panels and ASGs, will be used on reef to remove rock to the central raise ore passes. From there, dump trucks in the footwall will haul the rock to main level passes that feed the decline conveyor belt.
| SRK | | Report date: 27 May 2022
Effective Date: 31 December 2021 |
| | | |
| SRK Consulting – 576060 SPM PSM Project TRS | Page 146 |
From the cross cuts, the rock will be loaded by LHDs into trucks and transported to the main tips situated on Level 5 for the Central Block and Level 1 for the East Block. The trucking operation is planned to take place on a double shift (day and night shift).
Trucking distances for the Central Block peak at 2.2 km in 2038 before production starts declining. A maximum trucking distance for East Block of just over 5 km (one way) is reached in 2065. However, by this time the production rate is reducing and the distance does not materially impact on the trucks required.
The truck demand for the Central Block increases as the production rate from deeper levels increases and peaks at six trucks. The longer distances and slightly higher production rate from the East Block increase the number of trucks required to a total of 14 during the latter stages of the life of the block (Figure 12.15).

Figure 12.15: Truck demand over LoM vs total rock mined for Central Block (left) and East Block (right)
| 12.4.2 | Personnel requirements |
The underground mine is planned to be staffed to meet the production requirements and to comply with legal requirements as a minimum standard. The departmental structure for the mining department is illustrated in Figure 12.16. The classification of the different posts as E4, E2, C1, etc is according to the Paterson job grading system. The summary for mining manpower for Central and East Underground Blocks is provided in Table 12.15.
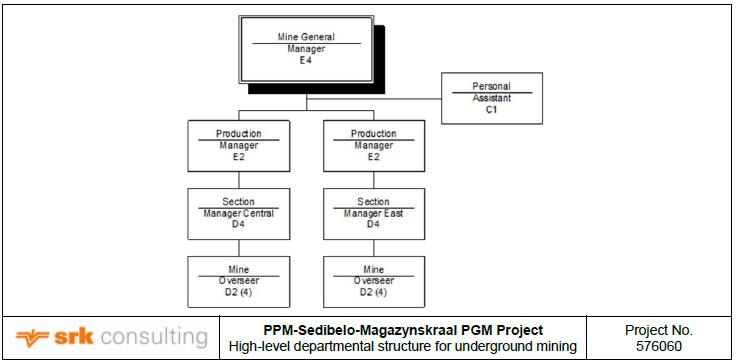
Figure 12.16: High-level departmental structure for underground mining
| SRK | | Report date: 27 May 2022
Effective Date: 31 December 2021 |
| | | |
| SRK Consulting – 576060 SPM PSM Project TRS | Page 147 |
Table 12.15: Summary Mining Manpower for Central and East Underground Blocks
| Designation | Central Block | East Block |
| At work Complement | In Service Complement | At work Complement | In Service Complement |
| Mining Management | 12 | 12 | 13 | 13 |
| Development | | | | |
| Mine Trackless Development | 74 | 77 | 108 | 122 |
| Conventional Development on Reef Contractor | shared | 7 | 12 |
| Total Development | 74 | 77 | 115 | 134 |
| Stoping & Ledging | | | | |
| Ledging | 104 | 108 | 104 | 117 |
| Stoping | 549 | 610 | 549 | 614 |
| Raise Bore & Drop Raise / contracting | 27 | 27 | 30 | 30 |
| Section Management | 28 | 28 | 28 | 28 |
| Construction per level | 18 | 24 | 18 | 24 |
| Total Stoping & Ledging | 726 | 792 | 729 | 808 |
| Conventional Development on Reef | 105 | 112 | 105 | 112 |
| Total UG Mining Complement at steady state | 917 | 993 | 962 | 1 067 |
| | | | | | |
[§229.601(b)(96)(iii)(B)(13)(v)]
| 12.5.1 | West Pit and East Pit |
The West and East Pit practical pit design is illustrated in Figure 11.2. Comparison of the designed pit outlines and the optimised pit shells show that the designed shells are within acceptable limits of the selected shells.
The practical pit designs with pit sequences for 2022 to 2026 for the West Pit and East Pit are shown schematically in Figure 11.3.
| 12.5.2 | Central and East Underground Blocks |
The final mine outline for Central and East Underground Blocks is illustrated in Figure 12.17. The coloured areas represent mining depths in 50 m vertical increments between level reef drives.
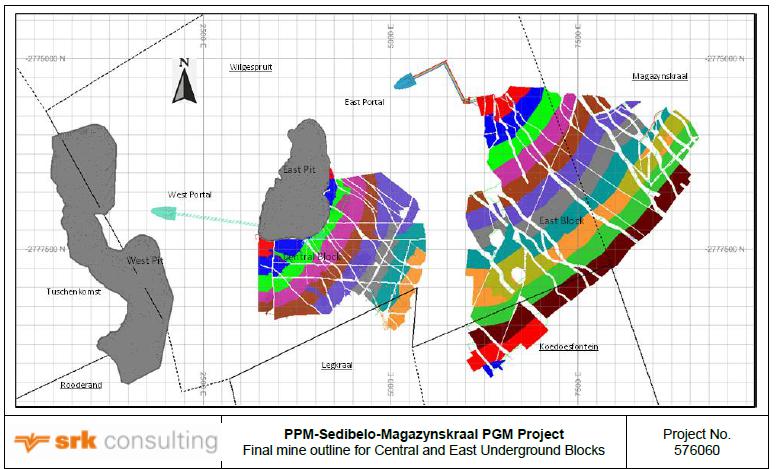
Figure 12.17: Final mine outline for Central and East Underground Blocks
| SRK | | Report date: 27 May 2022
Effective Date: 31 December 2021 |
| | | |
| SRK Consulting – 576060 SPM PSM Project TRS | Page 148 |
[SR2.1(iii), SR4.3(viii)]
There are minor to moderate operational risks with minor potential impact on the Mineral Reserve and these include the following:
| • | In general, there seems to be localized (but frequent) lapse of discipline with respect to limit blasting practice, making safe/bench clean-up and mining to the design line. This can result in two possible risks: |
| o | Loss of ore due to un-planned step-outs/safety benches; and |
| o | Increased rock-fall risk which can result in injury and equipment damage. Rock-fall hazards identified by geotechnical or DMRE inspections can result in work stoppages and therefore impact on production rates; |
| • | No systematic monitoring system is in place, while frequent visual inspections are made, not all mining areas are accessible for inspection, and not all slope movement may be identified by inspection. Any unanticipated slope movement will not be identified as a result; |
| • | No reference to stability assessment or hazard identification with respect to large scale geological structures. While a regular joint/small (bench) scale structural assessment is completed, there is no structural geological model that identifies large slope scale structures and assess the risk that they pose to stability; |
| • | At the time of the design study, no discontinuity strength data were available, resulting in the application of bench marked discontinuity shear strengths in the design analysis. Although the applied values appear plausible, site based variability is not considered in these values. Therefore, the assumed values should be validated as soon as possible; and |
| • | Not adhering to the design geometry/CoP, locally on pit benches and on a larger scale in the in-pit waste rock dumps. |
The following issues should be addressed to ensure that pit stability is adequately managed:
| • | Instrument-based pit slope monitoring should be implemented as a priority to ensure stability of inter-bench discontinuities. This should include automated survey prism monitoring and potentially radar slope monitoring; |
| • | Limit blast efficacy should be measured and reported on to facilitate the implementation of an improvement programme; |
| • | Review of large-scale structures and their impact on slope stability; |
| • | Review and validation of discontinuity strengths applied in the design analysis; |
| • | Improved adherence to the mine plan/slope design; and |
| • | Ground control districts should be updated based on the kinematic stability analyses conducted. |
The geotechnical risks identified are not considered to be fatal flaws, provided that normal mining practice and some flexibility in slope design are maintained. Review components refer to:
| • | Overburden/weathered zone strength testing and impact of variable depth of weathering across the site on pit wall designs; |
| • | Risks associated with poor joint surface condition and fault interactions with the haul roads and multiple bench stacks should be provided for during any further pit design studies; |
| • | At the time of the design study, no discontinuity strength data were available, resulting in the application of bench marked discontinuity shear strengths in the design analysis. Although the applied values appear plausible, site based variability is not considered in these values. Therefore, the assumed values should be validated as soon as possible; |
| • | Slope designs require detailed review in the pre-implementation stage; and |
| SRK | | Report date: 27 May 2022
Effective Date: 31 December 2021 |
| | | |
| SRK Consulting – 576060 SPM PSM Project TRS | Page 149 |
| • | Sufficient resources and costs associated with blasting, water management (drain holes for slope depressurisation) and continual monitoring should be allowed for in the implementation plan. |
| 12.6.3 | Central and East Underground Blocks |
Geotechnical risks have been identified and suitably mitigated through the following design criteria:
| • | A minimum 25 m thick crown pillar between pit floor and mine workings agrees with acceptable design criteria. Subsurface monitoring incorporating techniques such as prisms, radar, drill hole extensometers and stope back conditions should be implemented to monitor the crown pillar stability; |
| • | Declines are to be developed 50 m into the footwall of the UG2 reef in a norite rock type. The rock is heavily jointed and disturbed due to the proximity to the Pilanesberg Dome and appropriate ground support will be required to secure the long life access system; |
| • | Inter-pillar mining spans should be limited to 16-28 m in response to ground conditions and multiple extraction sequences, and an underhand stoping sequence should be implemented to avoid unwanted stress concentrations associated with remnant creation; |
| • | Fallout heights for in-stope support design are based on observations from drill hole scoping during UG2 cross-cut development and compared against operations from local platinum mines with similar geotechnical settings. Drill core assessments have not provided the necessary data for adequate fallout height estimation. It is recommended that during pit establishment and underground access development, detailed pit observations and intersections are benchmarked against core observations to validate the fallout height which in turn influences the tendon length for support requirements. A laboratory testing programme should be established in support of numerical modelling based on these empirical observations to confirm or adjust the support design as required; |
| • | The height of the tensile zone above access ways and between UG2 and PUP stoping has been suitably evaluated. Support designs and excavation layouts adequately account for the tensile height; and |
| • | The decision regarding single- or multi-reef mining depends on: |
| o | Where inter-burdens are less than 12 m only single reef mining is permitted. Multi-reef mining can occur if stiff backfill is introduced as a regional support measure, |
| o | Multi-reef mining is permitted where inter-burdens vary between 12-18 m, provided that permanent support consists of high strength grout packs integrated into the elongate support, |
| o | Mining on both reefs is permitted for interburden distances between 18 m -30 m provided breaker line grout pack support is introduced, and |
| o | Both reefs can be treated as separate non-influencing entities at inter-burdens greater than 30 m. |
| SRK | | Report date: 27 May 2022
Effective Date: 31 December 2021 |
| | | |
| SRK Consulting – 576060 SPM PSM Project TRS | Page 150 |
| 13 | PROCESSING AND RECOVERY METHODS |
[§229.601(b)(96)(iii)(B)(14)
| 13.1 | Current and Proposed Operations at PPM |
| 13.1.1 | Current Concentrator Operations |
The concentrator plant is divided in two main sections. The Merensky and UG2 concentrators have a nameplate mill feed capacity of 230 ktpm and 67 ktpm respectively. The concentrate is collected in a concentrate thickener, filtered and dispatched for toll treatment at Impala Platinum.
| 13.1.2 | Proposed Kell Refinery |
A new refinery utilizing a hydrometallurgical process will be constructed to process the concentrate from the concentrators into final product. The Kell plant will have a design capacity of 110 ktpa of concentrate.
Spare capacity in the Kell plant could be used to treat UG2 concentrates from other PGM mines.
| 13.2 | Description of flowsheet |
[§229.601(b)(96)(iii)(B)(14)(i)] [SR5.3(iv)]
The process flow sheet for both the Merensky and UG2 concentrators is the standard flow sheet that has been used for the extraction of PGMs from these ores. Utilization of the DMS stage for the upgrading of the UG2 is not common and is as a result of the lower head grade from excess dilution in the open pit operation. Use of a tailing scavenging plant (TSP) for the extraction of PGMs from the tailing streams at very low grades has become common practice in the industry.
Figure 13.1 contains a simplified Process Flow Diagram of the current process at the PPM concentrator.
| 13.2.1 | Merensky Concentrator |
Silicate (Merensky reef) is fed through the Merensky Primary RoM (MPR) tip via a static grizzly set at 300 mm, the oversize is crushed via the oversize crusher, is combined with the static grizzly undersize and gets transferred to the MPR primary jaw crusher. The material is then re-crushed via the secondary crusher arranged in closed circuit to provide the MPR silo with material crushed below 18 mm. The MPR silo can also be fed directly from the RoM tip via the MCR crushing circuit where the MCR is equipped with the exchange belt arrangement to direct the MCR dry screen product to the MPR silo feed belt as opposed to allowing the material to transfer to DMS silo feed belt. The Merensky plant is configured in a MF2 arrangement where the material in the MPR silo is fed to the primary mill. The material is then transferred to the primary roughers to recover any liberated PGM bearing particles that get liberated at coarser grind. The tails from the primary roughers are sent to the secondary mill for further milling. The fine ground material is sent to the secondary roughers to recover further PGM before the tails are combined with UG2 plant tailings and sent to the tailings scavenging plant (TSP). The material recovered at the primary and secondary roughers is directed to the primary and secondary cleaners respectively. The cleaner circuit is equipped with scavenger cells, the cleaner cells, the re-cleaner cells and the final re-re-cleaner cells. The final concentrate from the re-re-cleaner cells is directed to the final concentrate thickener to recover excess water and combined with the final concentrate from the UG2 circuit.
U2D ore (locally referred to as Orange Reef) is fed through the MCR tip via a static grizzly set at 300 mm, the oversize is crushed via the oversize crusher and get combined with the static grizzly undersize and get transferred to the MCR primary jaw crusher. The material is then re-crushed via the secondary crushing arranged in the closed circuit to provide the DMS silo with material crushed below 25 mm. This material is then fed to the DMS plant where the material is first classified by the screen to ensure only +2 mm and -25 mm gets treated by the DMS cyclones and the -2 mm is directed straight to the DMS thickener. The DMS cyclones reject lighter largely barren material at the yield of 68% via the overflow. The DMS underflow is directed to the UG2 mill feed silo. The UG2 silo can also be fed directly from the RoM tip via the UG2 crushing circuit which is used only when there is a need, either due to unavailability of the MCR or DMS plants, or even for special needs such as treating oxidised silicates via the UG2 plant. The UG2 plant is configured in an MF2 arrangement where the material in the UG2 silo is fed to the primary mill but also get combined with the DMS thickener underflow fines. The material is then transferred to the primary roughers to recover any liberated PGM bearing particles that get liberated at coarser grind and the tail from the primary roughers gets sent to the chrome recovery plant.
| SRK | | Report date: 27 May 2022
Effective Date: 31 December 2021 |
| | | |
| SRK Consulting – 576060 SPM PSM Project TRS | Page 151 |
The chrome recovery plant utilises a two-stage Reverse Classifier circuit for the recovery of chromite into a chromite concentrate. The first stage, or rougher stage, produces an intermediate concentrate. This rougher concentrate is then processed in a cleaner stage that upgrades the concentrate to a saleable product. The tailing from the first stage is then pumped to the secondary mill for further milling. The fine ground material is sent to the secondary roughers to recover further PGM before the tails is combined with silicate plant tailings and send to the TSP.
The material recovered at the primary and secondary roughers is directed to the primary and secondary cleaners respectively. The cleaner circuit is equipped with scavenger cells, the cleaner cells, the re-cleaner cells and the final re-re-cleaner cells. The final concentrate from the re-re-cleaner cell circuit is directed to the final concentrate thickener to recover excess water and combined with the final concentrate from the silicate circuit. The thickened final concentrate is transferred to the holding tanks in preparation for filtering via the Larox filter. The filtered concentrate is stored in the concentrate bunker ready for dispatch to the smelters.
Tailings from the Merensky circuit and UG2 circuit are combined and fed to the TSP plant. The TSP is made up of a rougher flotation circuit and cleaner cells with added box cell to maximize the concentrate grade. The cleaner concentrate is transferred to the low concentrate thickener and campaigned through the same final Larox filter to generate separate low-grade final concentrate, which then gets trucked separately to the smelters. Both the TSP rougher flotation tailings and cleaner flotation tailings are combined and directed to the main plant final tailings thickener to recover the water before sending the thickened slurry to the TSF.
| 13.2.4 | Chromite Recovery Plant |
SPM installed a chromite recovery plant (CRP) in the PPM UG2 concentrator in the inter-stage position between the primary and secondary circuits, instead of at the conventional position at the end of the circuit on the secondary rougher tailings position. The inter-stage circuit consists of a Reflux Classifier in a rougher configuration and then a second Reflux Classifier unit in a cleaner configuration with a Derrick Screen to remove the coarse +300 µm fraction from the feed to the plant as shown in Figure 13.2.
The inter-stage position was selected for two reasons:
| • | Remove the chromite before the ISA mill, so that the ISA mill would be able to grind the silicates that are associated with the PGMs finer for improved liberation of PGMs and plant recovery; and |
| • | Anticipated reduction in ISA Mill operating cost. |
The chromite recovery plant produces metallurgical grade chromite of 40.0% to 42.0% Cr2O3 grade.
| 13.2.5 | Kell Refining Circuit |
Once the Kell plant is commissioned, the combined concentrate from the concentrators and TSP will be fed to the Kell plant.
The hydrometallurgical process consists of three key stages:
| • | Pressure oxidation (POX) to leach base metal sulphides; |
| • | Reducing gas heat treatment of the sulfate leach residue in kilns up to 900°C to condition the PGM minerals; and |
| • | Atmospheric leaching of the precious metals in chloride media (chlorine gas and hydrochloric acid). |
Figure 13.3 sets out the block flow diagram of the Kell process.
A pre-leach is introduced to remove carbonaceous gangue mineral prior to the POX stage. The POX process uses standard autoclaves as used in the processing of base metals and refractory gold.
Copper extraction and electrowinning follow conventional process routes as used in other base metal refineries. Ni and Co are extracted using solvent extraction followed by electrowinning.
| SRK | | Report date: 27 May 2022
Effective Date: 31 December 2021 |
| | | |
| SRK Consulting – 576060 SPM PSM Project TRS | Page 152 |
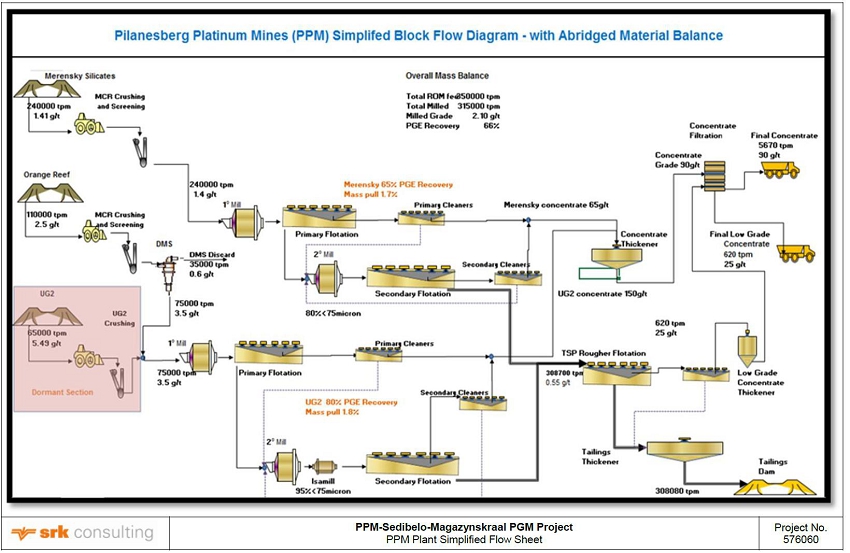
Figure 13.1: PPM plant simplified flow sheet
| SRK | | Report date: 27 May 2022
Effective Date: 31 December 2021 |
| | | |
| SRK Consulting – 576060 SPM PSM Project TRS | Page 153 |
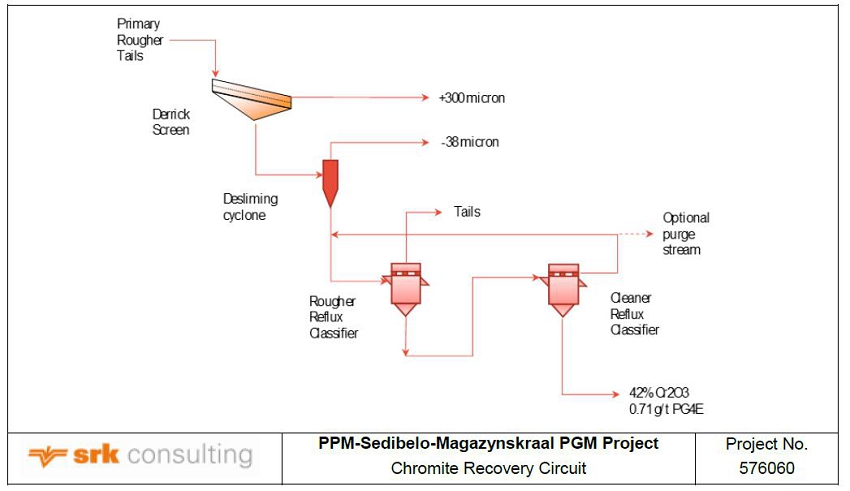
Figure 13.2: Chromite Recovery Circuit
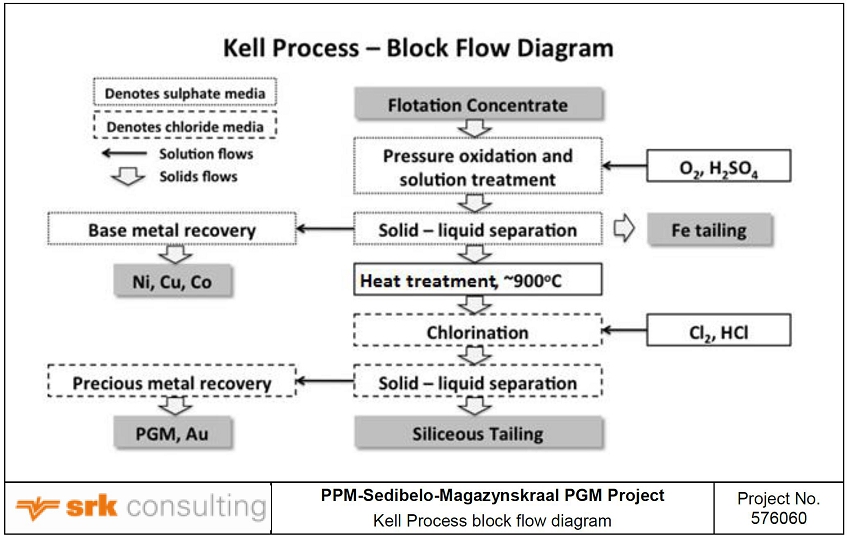
Figure 13.3: Kell Process block flow diagram
The remaining residue containing the PGMs is then treated in a flash dryer-rotary kiln combination at a temperature of circa 900°C to liberate and prepare the PGMs for a chloride leach to digest the precious metals. The rest of the process follows a similar path as used in some of the Precious Metals Refineries. The metals are leached using hydrochloric acid and chlorine gas. Gold is recovered first from solution to prevent it from following the Pd in the extraction process. MRT, using element specific ionic resins, is used to extract the Pd and Rh. Pt is precipitated and the remainder (Ru and Ir) is sent to toll refiners. The remaining liquor is then disposed of on the TSF after the recovery of the hydrochloric acid.
| SRK | | Report date: 27 May 2022
Effective Date: 31 December 2021 |
| | | |
| SRK Consulting – 576060 SPM PSM Project TRS | Page 154 |
There are two main acidic residue streams from the process:
| • | Barren solution from base metal sulphide precipitation; and |
| • | Final washed filter cake from chlorination. |
In addition, minor waste streams include:
| • | Metal hydroxides/gypsum solids from iron removal; |
| • | Low strength HCl pre-leach filter wash; and |
| • | Vent scrubber bleed solutions. |
The effluent streams are combined and are pumped to the main flotation plant tailings disposal system. The natural neutralising capacity of the flotation tailings is expected to be well in excess of any acid content of the slurry. The final pH and thus dissolved metals content are set to meet the site and local legislative requirements.
| 13.3 | Plant throughput and design, specifications |
[§229.601(b)(96)(iii)(B)(14)(ii)] [SR5.3(iii)]
The Merensky and UG2 concentrators have a mill feed capacity of 230 ktpm and 67 ktpm respectively. The actual average tonnage processed for the period January 2020 to December 2021 was 208 ktpm for the Merensky Concentrator and 57 ktpm for the UG2 Concentrator. Throughputs of up to 242 ktpm for the Merensky concentrator and 79 ktpm for the UG2 concentrator were achieved.
| 13.3.1 | Metallurgical Accounting |
Metal accounting within the concentrators is challenging for the following reasons:
| • | The production of a DMS discard; |
| • | The production of three flotation concentrates; and |
| • | Shipping of two concentrates: a high grade concentrate and a low grade concentrate. |
Historically the recovery in the concentrator is estimated using the following expression:
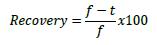
where : f is the feed grade; and
t is the tailing grade
This is a common expression used in daily operation on concentrators to estimate the recovery. It is however not commonly used to report the monthly production for metal accounting purposes.
A physical inspection of the weightometers and the sample cutters found that they were all in good order. Inspection registers and calibration certificates could be produced during the inspection.
The housekeeping standards in the laboratory are very good. The laboratory is being operated very well and the necessary checks and balances are in place. QA/QC procedures are in place and are reported.
Due to the quality of the sampling, sample preparation and assay laboratory SPM calculates mass pulls to concentrate and recovery using the Two-Product formula on the five distinct modules in the plant:
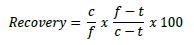
where : c is the concentrate grade;
f is the feed grade; and
t is the tailing grade.
The five modules considered are:
| • | The DMS circuit producing a flotation plant feed and DMS discards; |
| • | The two separate UG2 and Merensky flotation circuits each producing a flotation concentrate and tailings; |
| • | The TSP plant producing a flotation concentrate and tailings; and |
| SRK | | Report date: 27 May 2022
Effective Date: 31 December 2021 |
| | | |
| SRK Consulting – 576060 SPM PSM Project TRS | Page 155 |
| • | The entire plant from the RoM feed to the concentrate dispatch and final TSP tailing. |
| 13.3.2 | Ore Milled, 4E Head Grade and Recovery |
Data for the period January 2017 to December 2021 was analysed and is discussed in this section.
Head Grade and Recovery
Overall plant recovery for the two concentrators is illustrated in Figure 13.4. The decrease in overall recovery for the 2020 and 2021 financial years is attributed to the decrease in recovery in the Merensky plant due to a change in the mineralogy of the ore in the southern section of the orebody.
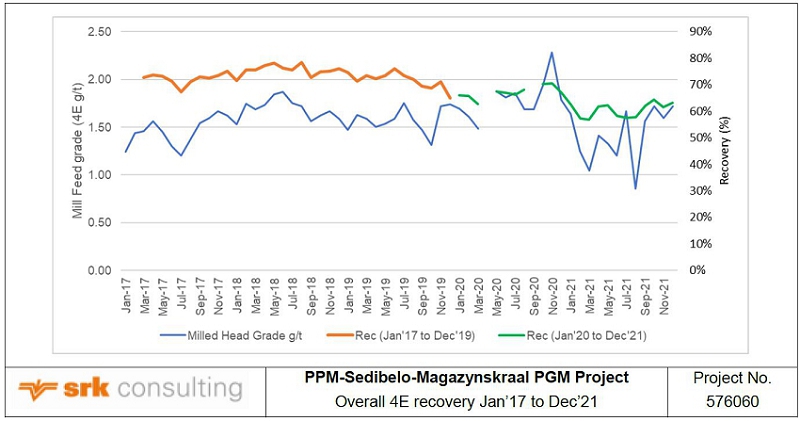
Figure 13.4: Overall 4E recovery Jan’17 to Dec’21
DMS Feed, Mass Yield and DMS Losses
Tonnage of UG2 to the DMS has varied significantly for the period in review as illustrated in Figure 13.5. The mass yield from the DMS was below 50% in 2020, after which it increased significantly. This was due to the reduction in the feed to the DMS artificially increasing the percentage mass yield.
The UG2 DMS feed grade was lower in 2021, in line with grades achieved in 2017 (Figure 13.5). The losses to the DMS discard during 2021 were generally well-controlled, averaging around 6% for the year.
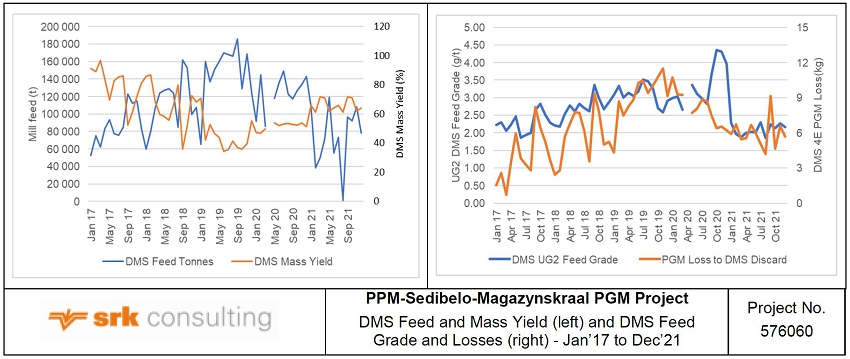
Figure 13.5: DMS Feed and Mass Yield (left) and DMS Feed Grade and Losses (right) - Jan’17 to Dec’21
| SRK | | Report date: 27 May 2022
Effective Date: 31 December 2021 |
| | | |
| SRK Consulting – 576060 SPM PSM Project TRS | Page 156 |
Mill Feed Tonnes and Grade
The UG2 grade to the mill was lower during 2021 in line with 2017 levels, as plotted in Figure 13.6. The UG2 mill feed tonnes have been somewhat erratic during 2021, with dips in feed related to ongoing Covid-19 restrictions.
Merensky tonnes to the flotation plant have been relatively consistent at circa 230 ktpm for Jan’17 to Dec’21 although a downward trend is evident. Figure 13.6 illustrates that the head grade since January 2021 reduced initially more in line with historical values with a slight improvement towards the end of the year.
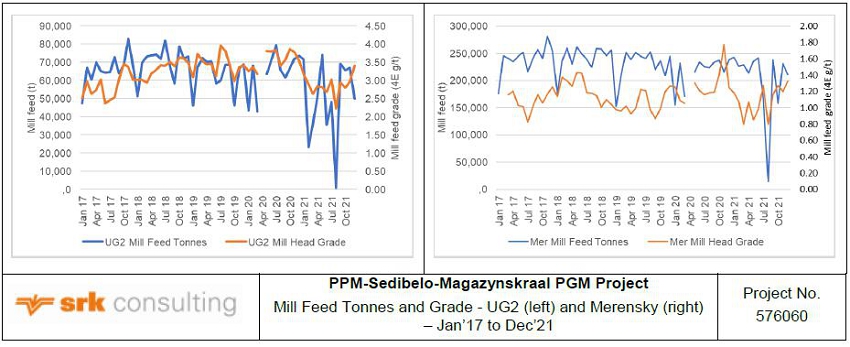
Figure 13.6: Mill Feed Tonnes and Grade - UG2 (left) and Merensky (right) – Jan’17 to Dec’21
Flotation Plant
The variability in both Flotation Plant feed grade and tonnes is illustrated in Figure 13.7 for the combined Merensky and UG2 feed to the plant. As mentioned earlier in this section, the decrease can be primarily attributed to the Merensky feed grade.
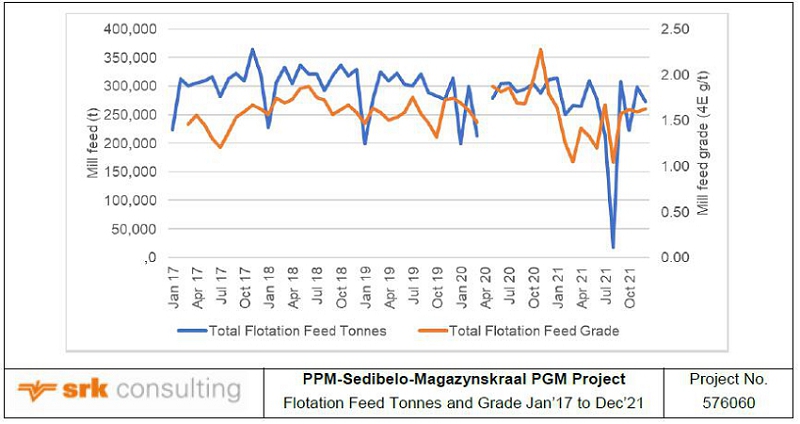
Figure 13.7: Flotation Feed Tonnes and Grade Jan’17 to Dec’21
The impact of the increase in feed grade on the flotation 4E recovery from the UG2 ore is evident in Figure 13.8. A similar plot for the Merensky ore revealed what appear to be two distinct relationships as illustrated in Figure 13.8.
| SRK | | Report date: 27 May 2022
Effective Date: 31 December 2021 |
| | | |
| SRK Consulting – 576060 SPM PSM Project TRS | Page 157 |
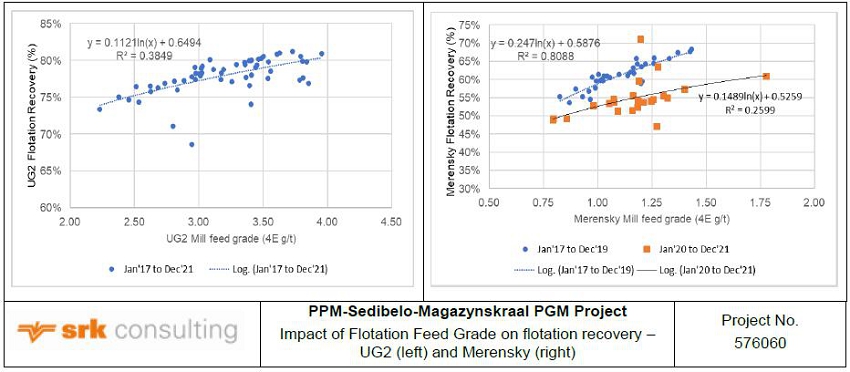
Figure 13.8: Impact of Flotation Feed Grade on flotation recovery – UG2 (left) and Merensky (right)
Despite higher head grades since December 2019, the reduction in the Merensky recovery is attributed to changed ore mineralogy and mode of occurrence of the PGMs in the southern region of the orebody.
TSP Recovery
From the plot in Figure 13.9 it is evident that the TSP recovery has been gradually dropping for the period in review. This may be due to an improvement in the main plant operation with less floatable feed reaching the TSP.
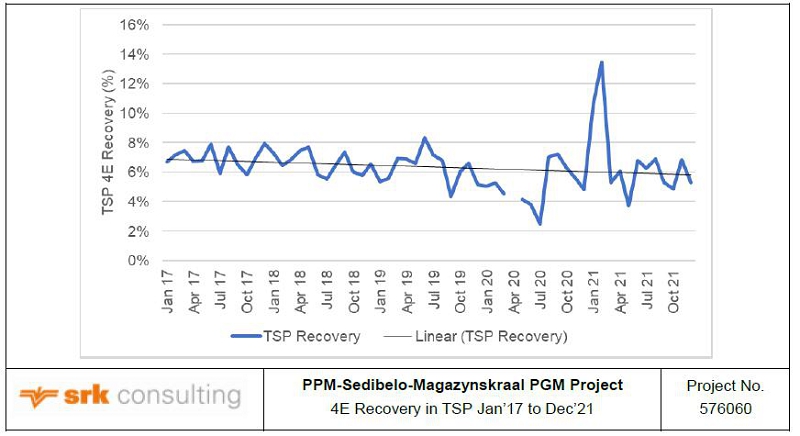
Figure 13.9: 4E Recovery in TSP Jan’17 to Dec’21
Overall Recovery
Combining the data for the two ores may for the period January 2017 to December 2021 yields two distinct relationships, as illustrated in Figure 13.10. The decrease in recovery is due to the change in the mode of occurrence of the PGMs in the Merensky ore in the southern region of the pit that was mined in the 2020-2021 financial years.
| SRK | | Report date: 27 May 2022
Effective Date: 31 December 2021 |
| | | |
| SRK Consulting – 576060 SPM PSM Project TRS | Page 158 |

Figure 13.10: Impact of RoM Feed Grade on overall recovery Jan’17 to Dec’21
| 13.3.3 | Concentrate 4E Grade and Recovery |
The average monthly 4E concentrate grade, recovery and dispatches for the period January 2017 to December 2021 are tabulated in Table 13.1.
Table 13.1: Average monthly concentrate production (Jan’17 to Dec’21)
| Item | Avg. Concentrate Grade (4E g/t) | Avg. Recovery (%) | Avg. Monthly
Dispatched (oz 4E) |
| Merensky concentrate | 65 | 58.2% | 5 008 |
| UG2 concentrate | 230 | 77.9% | 5 320 |
| TSP | 34 | 6.4% | 889 |
| 13.3.4 | Chromite Recovery Plant |
The chromite recovery plant produces metallurgical grade chromite of 40.0% to 42.0% Cr2O3 grade. All chromite concentrate produced is sold to Noble (see Section 15.5.4).
From March 2018 to 2019, dispatches of chromite concentrate averaged 3 150 tpm. From the latter half of 2019 the chromite concentrate was stockpiled and dispatched in 5 kt or 6 kt batches.
The Kell plant will have a capacity to process 110 ktpa of PGM concentrate.
| 13.4 | Requirements for energy, water, consumables and personnel |
[§229.601(b)(96)(iii)(B)(14)(iii)] [SR5.4(ii)]
Extraction of PGMs from Merensky and UG2 ores is relatively energy intensive with the majority of the energy being consumed in the milling section. Ore hardness varies and a Bond Work Index of circa 19 kWh/t is required to reduce the ore to the required particle size. The current energy shortage in South Africa means that such operations have to enter into agreements with Eskom, the local electricity supplier. These agreements may require the operation to voluntarily shut done operations to reduce the load on the network.
The primary motivation for the Kell Process is the lower power consumption compared to the conventional smelting-refinery route. Electricity consumption is estimated at 0.3 MWh/t of concentrate processed.
Water is normally consumed at a rate of 0.8 m3/t of RoM ore. No water consumption rate could be determined in the recent feasibility study for the Kell process. South Africa has a shortage of water and various schemes have been developed, with the assistance of the local government and central government bodies to find alternate sources of water.
| SRK | | Report date: 27 May 2022
Effective Date: 31 December 2021 |
| | | |
| SRK Consulting – 576060 SPM PSM Project TRS | Page 159 |
With the exception of the MRT resins, the reagents used in the extraction of the PGMs and base metals are readily available and are commonly used in the extraction of base metals. The chemicals are manufactured within South Africa and alternative reagents can be used in their stead.
The consumption rates of the chemicals used in the Kell process are set out in Table 13.2.
Table 13.2: Kell reagent consumption
| Reagent | Consumption per tonne of feed (kg/t feed) |
| H2SO4 (Sulphuric Acid) | 267 |
| NaOH (sodium hydroxide) | 36 |
| MRT resin | 0.011 |
| Coal | 193 |
| Limestone | 284 |
| Hydrochloric Acid | 46 |
Although the consumption rate of the MRT resin is relatively low, it still contributes 13% to the reagent cost. Reagent costs are the highest cost item and make up 42% of the overall operating cost per tonne of concentrate feed. The aggregated operating cost and refining charge is provided in Table 15.4.
PPM is located in an area that is home to a number of the largest platinum mines in South Africa. Recent closure/downsizing of some of the neighbouring operations has created a pool of employees that are skilled in operating and maintaining concentrator equipment.
| 13.5 | Non-commercial process or plant design |
[§229.601(b)(96)(iii)(B)(14)(iv)] [SR5.3(ii)]
None of the processes or technologies utilized on the PPM concentrators are novel. The technologies are standard in the South African PGM industry and have been in use for decades.
There is therefore very little risk in applying the process route in the extraction of the PGMs and base metals or the declaration of Mineral Reserves.
The Kell process is novel in that it applies well recognized technologies in the processing of the flotation concentrate without the need of a smelter step. The technologies include POX, atmospheric leach, precipitation, solvent extraction, ion exchange, flash drying and rotary kilns. Two distinctive leach processes are used, sulphuric and hydrochloric, to leach the base metals and PGMs respectively from the flotation concentrate. This is identical to what has been the common processing route for PGM concentrates, with the exception that power intensive smelting is not included.
Should the Kell process not deliver the expected results, SPM can revert to the conventional smelting and refining process currently provided by Impala Refining Services (IRS). There is thus no risk that would prevent the declaration of Mineral Reserves presented in this report.
| SRK | | Report date: 27 May 2022
Effective Date: 31 December 2021 |
| | | |
| SRK Consulting – 576060 SPM PSM Project TRS | Page 160 |
[§229.601(b)(96)(iii)(B)(14)(iv)] [SR4.3(iii), SR4.5(iii), SR5.4(i)(ii)(iii)]
| 14.1 | General Infrastructure |
Production currently arises from the existing West Pit, operated by PPM. Preliminary work has started at the East Pit, plus two separate underground mines being the East Underground Block and the Central Underground Block, with access from the East Portal and the West Portal respectively. The two blocks are autonomous and there will be no underground connection between the two mining blocks. The P-S-M Project assumes surface trucking of ore and waste until each underground mining block reaches steady state production, at which time surface Doppelmayr RopeCon® systems will be commissioned and will convey ore and waste across to the RoM ore tip for the PPM concentrator plant and the waste deposition points in the available pits respectively.
All ore from the two open pits and the underground operations will be fed to the existing PPM concentrators. The larger Merensky concentrator will be modified to meet the predominantly UG2 production from the underground mining operation.
The footprint envisaged for the P-S-M Project is given in Figure 14.1 which shows the location of the PPM RoM pad, the West Portal, the East Portal, Eskom yard, ventilation fans, ventilation holes, RopeCon alignments, service roads and haul roads.
The layout of the East Portal is given in Figure 14.2 which indicates the infrastructure items required, as the East Portal and East Underground Block mining is established some two years before the West Portal and the Central Underground Block. Offices, control room and septic tank are provided at the East Portal due to the distance from the PPM main offices. The East Portal is supported by expanded offices, change house and sewage plant at PPM.
The layout of the West Portal is given in Figure 14.3 which indicates the infrastructure items required. The West Portal has satellite facilities on surface and is supported by the expanded offices, change houses and sewage plant at PPM.
Underground infrastructure in both blocks consist of trucking to ore and waste silos, decline conventional conveyors, chairlifts, and run-of-mine staged dewatering.
The East Portal is situated on the farm Wilgespruit. Access to the orebody will be by means of a three-barrel decline system. The system comprises two barrels measuring 5.5 m wide by 5 m high. Of these, one barrel will house the decline conveyor system and the other barrel will be utilised as the service decline. The third barrel will measure 4.5 m high by 4.5 m wide and will house the chairlift system. The barrels will be developed at approximately 8° to 9° below the horizontal.
The West Portal is located on the current surface right, east of the West Pit and will be utilised for the transport of rock, material and personnel for the Central Underground Block. It will also be utilised for intake ventilation to the Central Underground Block. The portal infrastructure consists of three decline barrels, being a conveyor decline, a service decline and a chairlift decline.
| 14.1.2 | Rock handling underground |
Underground silos will be raisebored to a final diameter of 3.1 m as recommended by the Geotechnical Engineer. The two UG2 silos will each have a total storage capacity of approximately 900 tonnes providing 14 hours of storage at a mining rate of 80 ktpm. The Waste silo will have a storage capacity of approximately 784 tonnes providing two and a half days of storage at an average waste development rate of 8 ktpm.
To manage and control the rock size, the top of the silos will be equipped with 300 mm x 300 mm grizzlies together with hydraulic rock breakers. Dump Trucks rated at 30 tonne capacity will tip into the silos. There will be no underground crushers.
Prior to the installation of the first production conveyors, ore and waste will be transported by dump trucks from the stope ore passes up the production declines to underground rock silos below the truck tips. The main decline conveyor systems will be installed once steady state production levels are achieved. Until the main decline conveyor system is installed and commissioned, 45 tonne dump trucks will transport ore and waste to surface. Once the main decline conveyor systems are commissioned, the ore and waste will then be transferred from the silos onto the main decline conveyors and transported and discharged into the three rock silos on surface.
| SRK | | Report date: 27 May 2022
Effective Date: 31 December 2021 |
| | | |
| SRK Consulting – 576060 SPM PSM Project TRS | Page 161 |
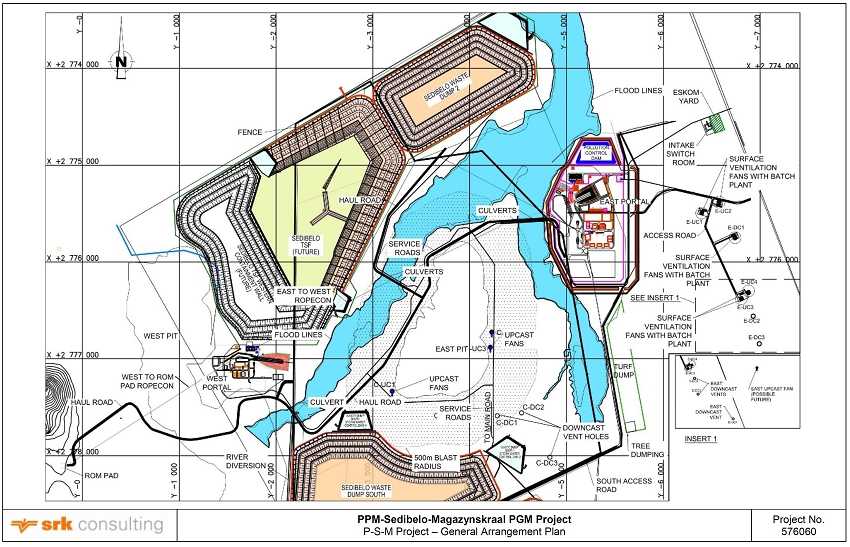
Figure 14.1: P-S-M Project – Surface General Arrangement Plan
| SRK | | Report date: 27 May 2022
Effective Date: 31 December 2021 |
| | | |
| SRK Consulting – 576060 SPM PSM Project TRS | Page 162 |
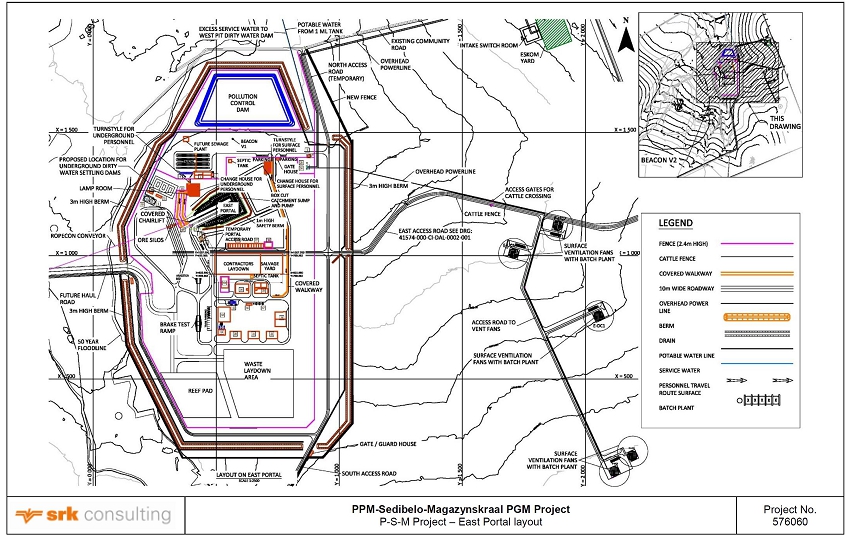
Figure 14.2: East Portal Surface Layout
| SRK | | Report date: 27 May 2022
Effective Date: 31 December 2021 |
| | | |
| SRK Consulting – 576060 SPM PSM Project TRS | Page 163 |
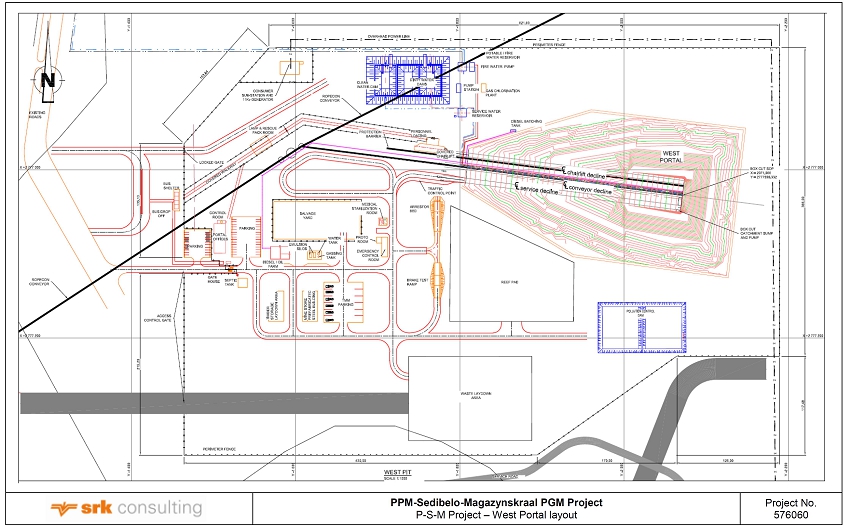
Figure 14.3: West Portal Surface Layout
| SRK | | Report date: 27 May 2022
Effective Date: 31 December 2021 |
| | | |
| SRK Consulting – 576060 SPM PSM Project TRS | Page 164 |
| 14.1.3 | Underground dewatering design |
A cascade pumping system has been designed to handle the dirty water returned from the mining face. Dirty water will be pumped using vertical spindle pumps from the stopes to a cascade pump station positioned on each level at the Central Block and East Block access declines. The production levels are spaced approximately 50 m vertically. Each cascade pumping system on the Central and East production declines is designed to handle a peak water inflow, including egress water of 628 m3/h.
Water from the Central and East Production declines (cascade pump stations) will be delivered to the main dewatering pump stations at the bottom of the Central and East access declines for transfer to surface.
Mobile cascade pump stations will be installed on alternate levels down the production declines.
| 14.1.4 | Underground Workshops and Mining Equipment |
The current West Pit mobile equipment service workshop and a new mobile equipment service workshop at the East Portal will be used for the maintenance of the underground trackless fleet until the Central and East Block underground maintenance workshops have been constructed and commissioned.
The surface workshops will then be used for trackless equipment major overhauls. Daily and weekly servicing of the mobile production fleet will be carried out in the underground service workshops, one at the Central Block and one at the East Block.
A conventional stoping method will be used underground with hand drilling and scraper cleaning. Scrapers will move the ore from the panels to the central raise rock passes via the advance strike gullies. From there, trucks in the footwall will haul the rock to main level passes that feed the decline conveyor belt.
| 14.2 | Electrical, Instrumentation and Communications Infrastructure |
PPM has an agreed Notified Maximum Demand (NMD) of 37 MVA with Eskom to supply the existing West Pit, MF2 concentrator plant and mine support infrastructure. Although the agreed NMD is 37 MVA, the installed bulk electrical infrastructure for PPM has the capacity to provide a power output of 40 MVA. The June, July, August 2020 (High Season) and November, December 2020 and January 2021 (Low Season) electricity bills were reviewed, and the average power demand was 32.5 MVA. The installed capacity and the agreed NMD is therefore enough to supply the current power requirements.
The average power consumption for the existing West Pit and its associated infrastructure from Eskom electricity bills was in the region of 32.5 MVA. The existing NMD at PPM substation is enough to supply the CRP Extension and the TSP.
The Sedibelo substation will mainly supply the East and Central Underground Blocks. Bulk power supply for the project will be from Eskom’s Spitskop substation via a 132 kV supply to the Sedibelo 132/11 kV substation. From the main incoming substation power will then be distributed to the East Portal surface consumer substation, then from the East Portal substation via dual overhead power line to the West Portal consumer substation. Each power line will have the capacity to transmit a total of 20 MVA. Each line has been sized to carry the full load plus a spare capacity of 30%.
From these two substations, power will then be distributed locally and underground as required. The Sedibelo substation has already been constructed to supply the required infrastructure. This substation has an installed capacity of 80 MVA (two 40 MVA transformers) with a current existing agreed NMD of 66 MVA. The predicted load demand for the new mine is 32.2 MVA. A summary of the predicted demand is shown in Table 14.1.
Table 14.1: Predicted load demands
| Description | Predicted Demand (kVA) |
| Surface Ventilation Fans | 3 100 |
| Secondary Ventilation Fans Underground | 4 300 |
| West Decline Conveyors | 1 120 |
| East Decline Conveyors | 1 120 |
| Dewatering Pumps and Production Equipment | 16 320 |
| Underground Lighting and Small Power | 1 227 |
| Surface Loads | 5 000 |
| Total | 32 187 |
| SRK | | Report date: 27 May 2022
Effective Date: 31 December 2021 |
| | | |
| SRK Consulting – 576060 SPM PSM Project TRS | Page 165 |
The total load that will be drawn from the West Portal Substation is approximately 16 MVA while the remainder will be fed from the East Portal substation. Ring feeds have been allowed for in the main reticulation to allow for redundancy for both underground and critical surface infrastructure. Two mine-site emergency generator sets have been allowed for at the West and East Portal substations to power up critical equipment during power failures.
PPM has a load curtailment agreement with Eskom, structured as follows:
| · | Stage 1 and Stage 2 Eskom load shedding – PPM to reduce power consumption by 10%; |
| · | Stage 3 Eskom load shedding – PPM to reduce power consumption by 20%; and |
| · | Stage 4 Eskom load shedding – PPM to reduce power consumption by 30%. |
PPM has a total of eight existing generators on site. Only seven generators are connected to the power supply network. Each of these seven generators is rated at 1.9 MVA, has an engine capacity of 1.45 MW and is connected to the power supply network via one 1.6 MVA 400V/11kV transformer. These generators, which run at a power factor of about 0.99, are normally run in such a way that they each produce a maximum output of about 1.3 MVA. The reason is due to the engine capacity of each genset and the allowable block load of each machine. The other generator, which is currently not connected to the power supply network, is rated for 2.05 MVA.
The following standard operating procedure for the generators has been adopted by the mine in the event of Eskom load shedding or total power outages:
| · | Stage 1 and Stage 2 Eskom load shedding – run three generators to supplement normal power requirements; |
| · | Stage 3 Eskom load shedding – run five generators to supplement normal power requirements; |
| · | Stage 4 Eskom load shedding – run all seven generators to supplement normal power requirements; and |
| · | Total Eskom power outages – run all seven generators and run only the UG2 section in the plant. |
The generators operating procedure has been well thought out to adequately supply power requirements of the mine at any particular stage of load shedding and during Eskom power outages.
Two mine site emergency generator sets have been allowed for at the West and East Portal substations to power up critical equipment in the Central and East Underground Blocks during power failures.
SPM undertook energy saving assessments in June/July 2019. A preliminary energy efficiency assessment report, dated August 2019, found that approximately 63% of the energy consumed in kWh in 2018 was from electricity and 37% was from diesel. Electricity costs accounted for about 52% (ZAR180 million) of the total energy cost. The highest consumer of electricity is the concentrator, which consumes about 90% of the total electrical energy. The potential energy savings opportunities that were identified during the audit are as follows:
| · | Installation of a maximum demand controller to reduce demand during each 30-minute period; |
| · | Moving the annual shutdown, which is normally one week in January, to one of the high demand season (June, July or August) months; |
| · | Optimization of pumping systems, with one example being the introduction of variable speed drives (VSD) where possible; |
| · | Optimization of compressed air systems; |
| · | Implementing low cost lighting control ideas such as limit switches on substation doors and day-night switches on outdoor lighting. and |
| · | Implementation of the Energy Management System to ensure continual improvement of energy performance which can result in the reduction of the cost of energy. |
The mine indicated that progress on implementing the above recommendations was severely compromised in 2020-2021 due to COVID-19 restrictions and manpower constraints.
| 14.2.2 | Control and Communications |
Underground communications for the P-S-M Project will be based on the leaky feeder system which allows for interaction between underground and surface personnel. The leaky feeder system will allow for underground as well as surface communications for personnel and will be catered for on the main fibre backbone communication infrastructure. Power coupler units have been allowed per level to power the leaky feeder system. Power supplied to the leaky feeder system shall be via uninterruptible power supply (UPS). As the leaky feeder communications system is critical in the event of an emergency, the UPS has been sized sufficiently to ensure continuous communication between surface and underground is achieved at least until such time that everyone is evacuated from underground during a power failure.
| SRK | | Report date: 27 May 2022
Effective Date: 31 December 2021 |
| | | |
| SRK Consulting – 576060 SPM PSM Project TRS | Page 166 |
The UPS responsible for the process control system as well as other ancillary systems will be connected to the emergency generators to ensure that all the systems are powered continuously during extended power failures. This will ensure than no communications are lost during generator switch-over (continuous on UPS), and so extended communications hours can be achieved during normal power failures.
The overall process control system provides for a fully automated control system that will allow plant operations personnel to monitor and control equipment throughout the surface and underground mining operations, as well as for visibility on the existing processing plant points of interface. The system will be supplied by UPS for up to one hour in the event of a power failure to ensure that all systems and equipment are visible and can be shut down in an orderly manner. The process control system at both the East and Central underground infrastructure will be identical in design.
The communications and control systems have been well designed and it adheres to what is currently being widely used in the mining industry.
Bulk water for the P-S-M Project is obtained in adequate quantities and potable quality from the existing West Pit Reservoir which is connected to the Magalies Water system. The current connection to the West Pit is operational and capital expenditure has been provided for future connections to East Pit and the Central and East Underground Blocks project areas.
SPM has entered into a supply agreement with the MWB, for the planned 15.2 Mℓ/day service water required for its operations. The MWB pipeline crosses Wilgespruit in an east-west orientation along the northern boundary of the property, therefore the capital required to establish a bulk water supply to the property will be relatively small. This allocation has subsequently been transferred to New-shelf 1101 (Pty) Ltd who will manage distribution of water to mining operations on the Central and East Underground Blocks project areas. No increase in water demand is expected as a result of the proposed changes to the mine.
Bulk water will be obtained from the existing West Pit Reservoir, where take-off piping arrangements have already been provided to supply the East Pit.
The mine’s approved EMP makes allowance for a sewage treatment plant with the capacity to treat approximately 761 m3/day. The capacity of this treatment plant will be increased to approximately 900 m3/day as required to address the additional staff anticipated for the expansion project.
Treated water from the sewage treatment plant will be fed back into the process water circuit during the operational phase. Every effort will be made to reuse this effluent during the construction phase, however, some of this effluent may need to be treated and used for irrigation. At this stage it is anticipated that this controlled activity could be "Generally Authorized" through DWS. Details regarding effluent use will be provided to DWS by means of the Water Use License amendment process.
| 14.5 | Stormwater Management Infrastructure |
Stormwater management on mines is governed by Government Notice Regulation 704 (GNR704). The main principles of GNR704 are to keep clean water clean, and to collect and contain dirty water. GNR704 requires stormwater management facilities to be designed to be capable of handling 1:50-year flood events on top of their mean operating levels.
A Stormwater Management Plan (SWMP) for the current PPM operation (including West Pit, plant, TSF, WRD, etc.) is in place, and has recently been updated for 2021. The stormwater management infrastructure on site includes clean water diversions around the pit and plant, as well as dirty water channels leading to several pollution control dams (PCDs). In general, stormwater is well-managed for the PPM operation; however, several non-compliances to GNR704 remain. These non-compliances, as well as recommendations to remedy the non-compliances are discussed in Section 16.5.
SPM plans to operate the P-S-M Project with no point source discharge and to re-use contaminated water as far as possible. A feasibility-level SWMP for the P-S-M Project was compiled during the 2020 FS. The design basis of the stormwater management infrastructure for Sedibelo and Magazynskraal follows the main principles of GNR704 (separation of clean and dirty water). The Sedibelo SWMP which is based on the 2020 FS designs, was compiled in 2021. The recommendations in the SWMP will need to be implemented to achieve compliance with GNR704 (refer to Section 16.5.1.
| SRK | | Report date: 27 May 2022
Effective Date: 31 December 2021 |
| | | |
| SRK Consulting – 576060 SPM PSM Project TRS | Page 167 |
The area to the north of the West Portal, north of the salvage yard and the planned parking areas, as well as the area south of the East Pit are designated clean water areas. Clean water diversion channels were designed to prevent clean stormwater from reaching the pit and the portal (and to discharge it into the natural environment).
The function of the diversion channels is two-fold: to maintain clean and dirty water separation; and to prevent stormwater run-off from reaching the pit and the portals. A trapezoidal channel was designed for stormwater.
All dirty water will be channelled via dirty water drains and/or collected in PCDs after passing through concrete silt traps.
Liners for stormwater dams have been included in the Capex and Opex estimates in the 2020 FS, to limit seepage from these dams.
Compliance to GNR704 is discussed in Section 16.5.1 and water risks are discussed in Section 20.3.6.
| 14.6 | Tailings Storage Facilities |
[SR1.1(ii), SR5.4(ii)]
| 14.6.1 | Project Description |
The PPM operation contains an existing 198 ha TSF and RWD complex which was commissioned in May 2009. The operation is located to the west of the existing process plant, immediately west of the heritage area that is approximately 2 km south east of the Motlhade community.
The TSF is underlain by low permeability soils consisting of Black Turf (Clay), Clayey Sands and Residual Pyroxenite, and the ground water is reported to be 22.5 m below natural ground level. The TSF site has a natural slope of approximately 1(v):90(h) that drains in a west-north-westerly direction and it is reported that there are no perennial streams in close proximity to the TSF.
The TSF design was based on 230 ktpm of Merensky tailings and 67 ktpm of UG2 material tailings (split 77%:23% Merensky:UG2, with a combined 90% passing the 75 micron sieve), all originating from an opencast mining operation. The TSF was designed for an annual deposition of 3.42 Mtpa, however the annualised 2020 deposition total of 3.08 Mt split 51%:49% Merensky:UG2 is considerably different to design.
Following the integration of the PPM, Magazynskraal and Sedibelo properties, three tailings storage facilities options were identified as a result of historic PFS and FS studies, namely the current PPM TSF, a proposed Sedibelo TSF and a proposed Magazynskraal TSF. Following a capacity assessment undertaken as part of the 2020 FS for the P-S-M Project, it was determined that the current PPM TSF (with a remaining storage capacity of 36.31 Mt as at December 2021), together with the proposed Sedibelo TSF (with a proposed storage capacity of 60 Mt), would provide sufficient tailings storage capacity to meet the estimated LoM requirements of 75.77 Mt.
The proposed layout of the current PPM TSF and proposed Sedibelo TSF is given in Figure 14.4.
| SRK | | Report date: 27 May 2022
Effective Date: 31 December 2021 |
| | | |
| SRK Consulting – 576060 SPM PSM Project TRS | Page 168 |
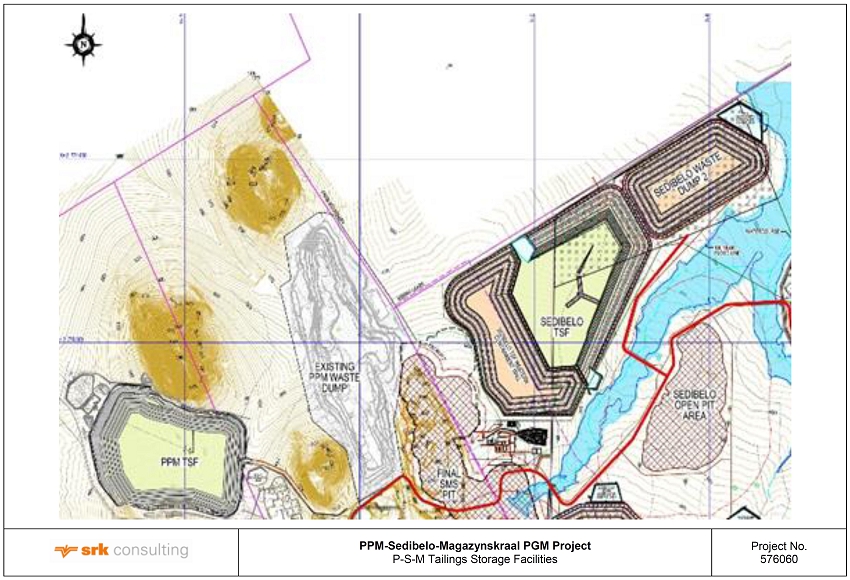
Figure 14.4: P-S-M Tailings Storage Facilities
| SRK | | Report date: 27 May 2022
Effective Date: 31 December 2021 |
| | | |
| SRK Consulting – 576060 SPM PSM Project TRS | Page 169 |
| 14.6.2 | Proposed Sedibelo TSF Infrastructure |
The proposed Sedibelo TSF is designed as a full containment facility using waste rock, to be sourced from either the East or West Pits and is to be constructed in a downstream manner until the capacity of the rock embankments is exceeded, at which point it will convert to an upstream self-raising facility. It has been designed to have a life span of 31.25 years at the current proposed deposition rate of 160 ktpm, although this may reduce to a life of 16.7 years should deposition increase to 300 ktpm.
Owing to the fact that the initial raises are dependent on waste rock from the open pits, planning and construction of the TSF would need to be undertaken as part of the overall mine planning, to ensure that adequate quantities of rock are available. The containment walls of the Sedibelo TSF are proposed for development of three lifts of 10 m, followed by a final lift of 5 m, equating to approximately 19.7 Mm3 of waste rock required over a 26.5 year period. The proposed depositional footprint would be approximately 150 ha.
It should be noted, however, that based on available information, SRK does not believe the design of the proposed Sedibelo TSF has been done to ensure adherence to all relevant Global Industry Standard on Tailings Management (GISTM) requirements (as of August 2020). Further studies will thus be required to satisfy these requirements in order to allow for Stage-Gate approvals to be given with respect to future TSF design studies.
| 14.6.3 | Current PPM TSF Infrastructure |
The PPM TSF and associated RWD complex consists of the following infrastructure:
| · | The TSF is operated currently as three separate compartments, identified as eastern, western and central (original/first operated) compartments; |
| · | The eastern and western waste rock starter/containment walls have both been fully formed to design elevations with evidence to support that the inner faces were lined with geofabric; |
| · | The decant system consists of a single gravity penstock pipeline with six single intermediate inlets along the pipeline, which have already been concrete sealed, and two double intakes which are currently in operation. The pool is located centrally around the existing operational penstock decants and the future decant tower. The TSF is now being operated with a pool wall and wing walls, therefore, access to the decant structures is initially via the pool wall, thereafter via an incrementally raised wooden catwalk structure, albeit its length is reduced to approximately 40 m due to the pool wall. As the pool wall is constructed using waste rock, vehicle access along the majority of the pool wall is possible; |
| · | The western compartment is equipped with barge mounted electrically operated return water pumps (two 20 ℓ/s pumps) and associated rising main into the central compartment; |
| · | Located to the west of the three compartment TSF complex is the return water complex consisting of a double compartment HDPE lined silt trap, a single compartment 132 000 m3 high-density polyethylene (HDPE) lined return water dam and an unlined dirty stormwater containment dam. The silt trap’s overflow cascades into the return water dam that ultimately cascades into the dirty stormwater containment dam; and |
| · | The return water pump station complex is located within a bunded area immediately downstream of the dirty stormwater containment dam. |
| 14.6.4 | PPM TSF Site Inspection Observations and Documentation |
A physical site inspection of the TSF, silt trap and RWD complexes conducted on 9 March 2021 confirmed the following:
| · | The TSF site is enclosed with a security fence, which is in good condition, and appropriate signage erected; |
| · | Deposition into the combined eastern/central and independent western compartments is practised via multiple spigots. Supernatant water in the combined eastern/central compartment gravitates directly to the central penstock decants, while the western compartments supernatant water gravitates towards the barge mounted return water pumps before being returned into the central compartment’s basin and gravitates to the central penstock decants; |
| · | The eastern and central compartments form a single combined compartment with freeboard reported compliance with GNR704 (Contain 1:50 year 24-hour duration storm event plus a further 800 mm freeboard); |
| · | With the introduction of the hybrid day-walls to the western compartment, the freeboard is reported compliant with GNR704 (1:50 year 24-hour storm event and a further 800 mm of vertical freeboard); |
| SRK | | Report date: 27 May 2022
Effective Date: 31 December 2021 |
| | | |
| SRK Consulting – 576060 SPM PSM Project TRS | Page 170 |
| · | The majority of the TSF perimeter contains well-formed outer catchment paddocks consisting of multiple individual paddocks and/or a single larger paddock/s; |
| · | The central compartment pool is operationally large in order to provide additional residence time to clarify the decant water; |
| · | Although the operational pool is large, the decanted water observed at the penstock pipeline outfall still contains suspended tailings solids. The decant water suspended tailings solids concentration is partly due to the fine grind and increases during periods when the concentrator plant processes DMS floats; |
| · | Desilting of the silt trap and return water dam complexes has recommenced and scheduled for completion towards the end of the third quarter of 2021. Regular desilting of the silt trap complex is planned; |
| · | The historical siltation of the silt trap and return water dam complexes has resulted in tailings being transported into the unlined stormwater containment dam. The removal of this tailings is not planned due to its thin layer; |
| · | The HDPE lined RWD and unlined naturally dirty stormwater dam walls visually appear in good condition and the emergency spillway is free of debris and also in good condition; |
| · | The return water pump station bunded area was waterlogged due to a leaking return water pump/s. Although this bunded area contains an earth lined outlet into which the excess water could flow off the property, no flow was observed. However, during high rainfall events, dirty water could exit the property into neighbouring downstream environs, potentially causing pollution; |
| · | The eastern and western compartments’ waste rock containment walls are reported as stable and well-shaped and the central compartment self-raised tailings walls are reported and observed as stable and well-formed; however, the northern downstream side slope contains a network of minor erosion gullies; |
| · | The western compartment’s waste rock containment wall has been capped with topsoil and vegetation growth has commenced; |
| · | Seepage was observed along portions of the eastern compartments waste rock containment wall. This seepage water is being contained within the northern outer paddocks and returned into the eastern compartment via a mobile pump and rising main pipeline; |
| · | The annualised 2020 rate of rise (RoR) was approximately 1.15 m/annum, well below the maximum design of 2.50 m/annum. The reviewed stage capacity curves indicate acceptable rates of rise until closure, based on the design deposition rate; |
| · | The 2016 stability assessments reviewed, report that the current factor of safety (FoS) for the waste rock containment wall and the self-raised tailings walls vary from 2.44 to 1.49 for final elevations of 1 120 mamsl and 1 150 mamsl respectively, which meet the recommended FoS of 1.30 and the more stringent 1.50 FoS; |
| · | The RWD was significantly silted up. In addition to this, it was observed that the decant from the tailings dam was milky as it contains ultra-fines and is indicative of tailings still being present in the decant. The mine is currently in ‘abnormal’ operational conditions with the filling of the western and eastern paddock as there is not enough storage space in these compartments to ensure complete settlement of solids before water is decanted; and |
| · | The pump station associated with the tailings dam was flooded and there is a risk that tails are being discharged to the natural environment. It was evident that one of the pumps was not operating efficiently as it was vibrating and emitting significant noise. |
| 14.6.5 | Risks Posed by the Current PPM TSF |
[SR4.3(viii)]
The following risks have been identified by SRK during the 2020 and 2021 site visits, on-site discussions and determined through the reviewed provided reports and other pertinent documentation:
| · | a third-party contractor operates the TSF on behalf of the Mine without a formalised works contract being signed; |
| · | Continued tailings overflow into the unlined dirty stormwater containment dam; |
| · | Dirty surface water, due to leaking return water pumps, exiting the property downstream of the return water complex could attract potential reputational risk; |
| SRK | | Report date: 27 May 2022
Effective Date: 31 December 2021 |
| | | |
| SRK Consulting – 576060 SPM PSM Project TRS | Page 171 |
| • | Continued decanting of tailings, possibly containing colloidal silica, into and/or through the silt trap and into the return water complex increases risk to the metallurgical plant as these suspended solids could become concentrated throughout the tailings circuit with time via returned water high in suspended/colloidal solids; |
| • | Installation of an emergency spillway to the western compartment will reduce the risk of overtopping this compartment during a major storm event/s; |
| • | The large volumes of waste rock being deposited into the central compartment’s basin, for vehicle access along the Pool Wall, may adversely affect the long-term tailings storage; |
| • | One historical risk that the Mine faces is the WUL, issued on 10 October 2013, that only permits the Mine to dispose of 3.18 Mtpa of tailings in the TSF; |
| • | Capacity for tailings disposal is a concern. Expansion of the current facility westwards (downstream development) is likely to be constrained by objections from the nearby Motlabi community; and |
| • | The facility is not being operated to full compliance with the GISTM requirements. |
To minimise/mitigate operational risks, the following should be considered/actioned by the Mine:
| • | Formalise the contract with the third-party; |
| • | Installation of a rising spillway to the western compartment; |
| • | Repair as planned the leaking return water pumps; |
| • | Determine the possible long-term negative effects of waste rock placement within the basin of the central compartment i.e., loss of LoM requirement capacity; |
| • | As planned, fast track the study to determine the cause of high concentrations of suspended solids/colloids in the decanted/return water. Should the high concentration of suspended/colloidal solids be ascribed to the near equal proportional tailings split between the Merensky and UG2 resulting in higher levels of suspended/colloidal solids levels, this may challenge the effectiveness of a new or extended silt trap complex; |
| • | Ensuring the disposal restriction of 3.18 Mtpa of tailings in the TSF (as per the WUL) is amended should higher annual deposition tonnages be considered; |
| • | Appropriate selection of future tailings disposal facilities, if required, taking water crossings for pipelines and/ or conveyor belts into consideration; |
| • | In addition to desilting the silt traps and RWD, SPM is planning to increase the size of the silt traps to allow for better solids handling capacity; |
| • | In order to find a solution to the high suspended/colloidal solids in the return water dam (and subsequently in the recycled process water), SPM have embarked on a process water clarification optimization project; and |
| • | A review and update of current operating procedures will need to be undertaken to ensure that all pertinent GISTM requirements are included within the management and operational undertakings of the current TSF. |
| 14.6.6 | Capital Expenditure |
No further extensions to the PPM TSF are anticipated, therefore no future capital cost provision is required.
It was reported that, over the planned life of the TSF, the western compartment will not combine with the central and eastern compartments basins, which provides gravitational decanting through the existing penstock pipeline. As this western compartment will continue operating on a standalone barge mounted return water pumping system, consideration should be given to installing a rising spillway to this compartment or increase the pumping capacity of the barge mounted return water pumps. The capital expenditure would be approximately ZAR0.2m and ZAR2.0m for the spillway and silt trap complex respectively.
In order to find a solution to the high suspended/colloidal solids in the return water dam (and subsequently in the process), SPM has embarked on a process water clarification optimization project, with a water treatment firm. An amount of ZAR5m has been earmarked for the project.
The TSF operating cost of the PPM facility is currently approximately ZAR3.00/t (dry) of tailings placed.
| SRK | | Report date: 27 May 2022
Effective Date: 31 December 2021 |
| | | |
| SRK Consulting – 576060 SPM PSM Project TRS | Page 172 |
The Capex requirement of the proposed Sedibelo TSF is approximately ZAR300m to ZAR450m, dependent on results of a waste classification assessment and requisite containment barrier system requirements. Excluded from this Capex requirement are the costs associated with the sourcing and placing of waste rock, as these were assumed to be reflected as an overhaul cost under the mining costs.
Operations of the PPM TSF are undertaken by Enviroserv, and operations are being monitored jointly by Enviroserv as well as the Mine’s operators and management. Daily inspections are performed, on-going and regular surveys are conducted, and monthly and annual reporting is completed and distributed to the relevant parties and Regulating Authorities. Quarterly inspections of the whole TSF complex are conducted in terms of the operational requirements. To demonstrate competency during the previous year, an independent third-party review was also undertaken of the TSF complex.
From the above stated observations, it can be concluded that the tailings disposal operations are being conducted in a responsible manner by suitably experienced contractors and mine personnel. To improve the current operations, the risks listed above need to be considered.
| SRK | | Report date: 27 May 2022
Effective Date: 31 December 2021 |
| | | |
| SRK Consulting – 576060 SPM PSM Project TRS | Page 173 |
[§229.601(b)(96)(iii)(B)(16)] [SR4.3(vi), SR4.5(viii), SR5.6]
[§229.1300]
In terms of the definitions for market studies in SK1300, historical prices for the preceding five or more years should be provided in a TRS. Five-year historical price graphs for the 6E PGMs and base metals (Cu and Ni) are set out in Figure 15.1 and Figure 15.2 respectively.
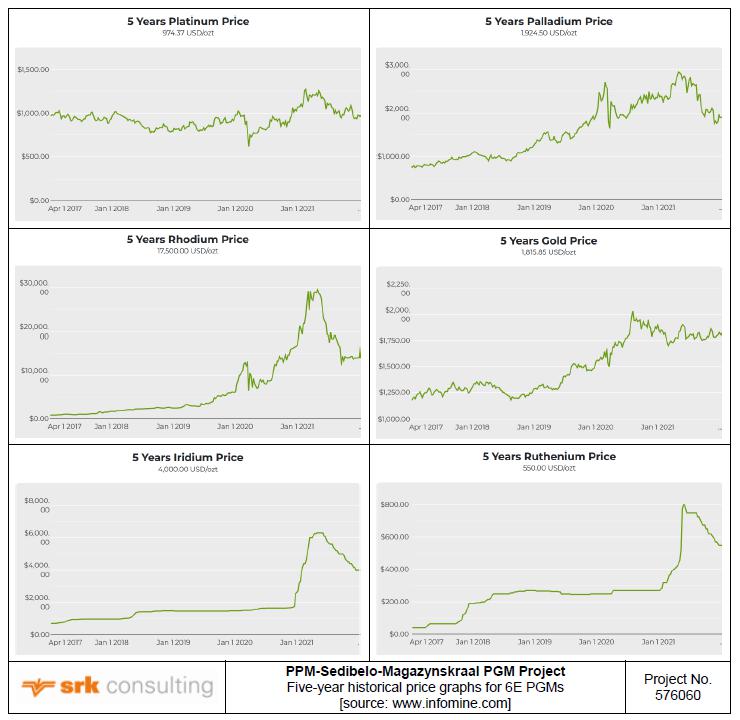
Figure 15.1: Five-year historical price graphs for 6E PGMs
For the South African context, the exchange rate between the US Dollar (USD) and South African Rand (ZAR) is important as all USD-based metal prices are converted to SA Rands at the ruling ZAR:USD exchange rate. The historical ZAR:USD exchange rate for the past five years is shown in Figure 15.3.
| SRK | | Report date: 27 May 2022
Effective Date: 31 December 2021 |
| | | |
| SRK Consulting – 576060 SPM PSM Project TRS | Page 174 |

Figure 15.2: Five-year historical prices for Cu and Ni
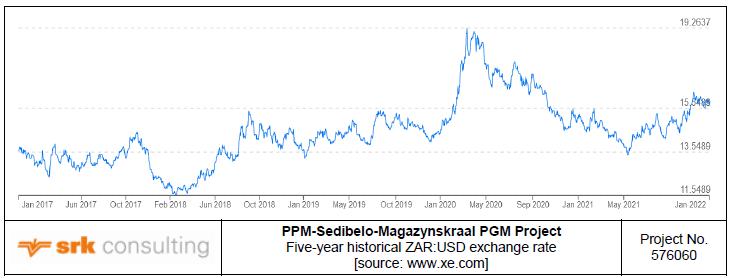
Figure 15.3: Five-year historical ZAR:USD exchange rate
| 15.2 | Uses for metals produced |
[§229.601(b)(96)(iii)(B)(16)(i)]
The primary uses for the PGMs and base metals that would be produced by the P-S-M Project are listed below:
| • | Pt – catalytic converters, laboratory equipment, electrical contacts and electrodes, platinum resistance thermometers, dentistry equipment, and jewellery; |
| • | Pd – primarily in catalytic converters, also used in jewellery, dentistry, watch making, blood sugar test strips, aircraft spark plugs, surgical instruments, and electrical contacts; |
| • | Rh – primarily in catalytic converters for cars (80%), also used as catalysts in the chemical industry, for making nitric acid, acetic acid and hydrogenation reactions; |
| • | Au – jewellery (78%), finances, electronics and computers, dentistry and medicine, aerospace and medals/awards; |
| • | Ir – the most corrosion-resistant material known and used in special alloys with Pt and Os, for pen tips and compass bearings, and contacts in spark plugs; |
| • | Ru – chip resistors and electrical contacts (electronics industry), anodes of electrochemical cells for chlorine production (chemical industry) and in catalysts for ammonia and acetic acid production; |
| • | Ni – mainly for production of ferronickel for stainless steel, rechargeable nickel-cadmium batteries and nickel-metal hydride batteries, and some other uses, such as kitchen wares, mobile phones, and medical equipment; and |
| SRK | | Report date: 27 May 2022
Effective Date: 31 December 2021 |
| | | |
| SRK Consulting – 576060 SPM PSM Project TRS | Page 175 |
| • | Cu - primary applications are in electrical wiring, construction (roofing and plumbing), and industrial machinery (e.g., heat exchangers). |
| 15.3 | Market – Supply and Demand |
[§229.601(b)(96)(iii)(B)(16)(i)]
SPM provided a market review by CRU International Limited (CRU, 2021), with key elements of CRU’s views on market supply/demand dynamics summarized below. The key contributors to the views taken by CRU (2021) regarding supply and demand for Pt, Pd and Rh together with the forecast supply-demand outlook for each of these PGMs through to 2030 are summarized in Figure 15.4
| Specific Comments related to supply-demand outlook | Supply-demand outlook |
Platinum: • Due to the nature of the basket problem, expansions seeking additional Pd and Rh units will fuel a prolonged oversupply of Pt (10-15% of demand); • A short term deficit in 2020, driven by supply disruptions (particularly at Anglo American’s converter facility), gives way to a multi-year surplus; • This will only be alleviated in the long term once: o Loadings in spent autocat tail off, reducing secondary supply; o Gasoline autocats (the ‘tri metal catalyst’, and replicas) manage to substitute a portion of the Pd content for Pt (noting that internal combustion engine (ICE) sales will continue to fall); and o Future applications in electrolysers and fuel cells for the hydrogen economy reach mass commercialization. |  |
Palladium: • In the aftermath of ‘ Dieselgate ’ that has boosted gasoline’s share of ICE, alongside rising emissions standards the world over, the PGM market’s demand splits have moved out of sync with its naturally occurring supply shares; • Deficits will need to draw down on any historical stockpiles; • This will only be alleviated in the long term once: o Loadings in spent autocat pick up, increasing secondary supply; Russian expansions come online; o Gasoline autocats (the ‘tri metal catalyst, and replicas) manage to substitute a portion of the Pd content for Pt; and o Overall ICE share of vehicle sales falls at a faster rate than autocat loadings are rising; Pd is not exposed to emergent technologies such as fuel cell electric vehicles (EVs). |  |
Rhodium: • High historical surpluses mean that there is likely to be significant above ground stock, so the current price run is on the basis of stockpile building for anticipated, prolonged future deficits; • Much of this will be strategic operational stockpiling; some will be investor speculation; • Rh is exceedingly difficult to thrift/substitute out of autocat while acceptable NOx emissions levels tighten; • This will only be alleviated in the long term once: o Loadings in spent autocat pick up, increasing secondary supply; and o The overall ICE share of vehicle sales falls at a faster rate than autocat loadings are rising; Rh is not exposed to emergent technologies such as fuel cell EVs. | 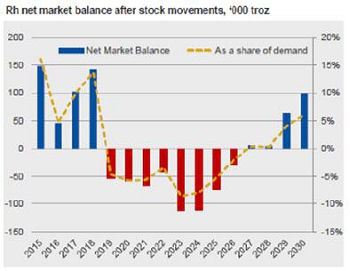 |
 | PPM-Sedibelo-Magazynskraal PGM Project CRU’s Pt, Pd and Rh supply-demand outlook [source: CRU, 2021] | Project No. 576060 |
Figure 15.4: CRU’s Pt, Pd and Rh supply-demand outlook
| SRK | | Report date: 27 May 2022
Effective Date: 31 December 2021 |
| | | |
| SRK Consulting – 576060 SPM PSM Project TRS | Page 176 |
| 15.4 | Agency relationships, commodity price projections |
[§229.601(b)(96)(iii)(B)(16)(i)]
| 15.4.1 | Agency relationships |
There are no agency relationships or technology licences in place or required for the P-S-M Project.
| 15.4.2 | Three-year trailing average and spot prices |
The three-year trailing average and spot values at 31 December 2021 for the 6E PGMs, Cu, Ni and ZAR:USD exchange rate are given in Table 15.1.
SRK has used the three-trailing average and spot values as comparative price decks in the economic analysis discussed in Section 18.
Table 15.1: P-S-M Project – three-year trailing average and spot values at 31 December 2021)
| Item | Units | Three-Year Trailing Average | Spot |
| Pt | (USD/oz) | 946 | 968 |
| Pd | (USD/oz) | 2 045 | 1 902 |
| Rh | (USD/oz) | 11 722 | 14 100 |
| Ru | (USD/oz) | 362 | 550 |
| Ir | (USD/oz) | 2 719 | 4 000 |
| Au | (USD/oz) | 1 654 | 1 829 |
| Ni | (USD/t) | 15 415 | 20 701 |
| Cu | (USD/t) | 7 160 | 9 722 |
| ZAR:USD | (ZAR) | 15.24 | 15.89 |
| 15.4.3 | CRU Price/Fx projections |
The Industry Overview in the Registration Statement on Form F-1 of SPM provides the basis for CRU’s price forecasts and is not discussed further here.
The CRU (2021) provides forecast prices for Pt, Pd, and Rh up to 2031 (Table 15.2). CRU (2022) issued a mid-term update on Pt and Pd prices to 2026, with prices beyond 2027 remaining the same as per its 2021 forecast. Table 15.2 reflects the mid-term Pt and Pd prices for 2022 to 2026 (CRU, 2022) and long-term Pt and Pd prices for 2027 to 2031 (CRU, 2021).
Price forecasts for Au, Cu and Ni for 2022 to 2024 are taken from Consensus Economics (supplied by UBS AG Investment Bank (UBS), 2021), with 2024 values kept constant to 2031. The Ir and Ru forecast prices are factored from the year on year change in the Pt price using the average Ir and Ru prices for calendar 2021 as the base. The CRU and Consensus Economics’ forecast prices in 2031 are taken as the long-term (LT) prices.
The ZAR:USD exchange rate forecasts for 2022 to 2030 are taken from Steve Forrest & Associates (SFA, 2021).
| SRK | | Report date: 27 May 2022
Effective Date: 31 December 2021 |
| | | |
| SRK Consulting – 576060 SPM PSM Project TRS | Page 177 |
Table 15.2: P-S-M Project – CRU Price deck (CRU, 2021; CRU, 2022; UBS, 2020)
| Item | Basis | Units | 2021 | 2022 | 2023 | 2024 | 2025 | 2026 | 2027 | 2028 | 2029 | 2030 | 2031 / LT |
| Pt | CRU (2022) | (USD/oz) | 1 091 | 1 065 | 1 100 | 1 150 | 1 190 | 1 170 | 680 | 625 | 585 | 569 | 569 |
| Pd | CRU (2022) | (USD/oz) | 2 400 | 2 050 | 2 375 | 2 550 | 2 350 | 1 750 | 1 853 | 1 718 | 1 559 | 1 426 | 1 426 |
| Rh | CRU (2021) | (USD/oz) | 20 113 | 38 341 | 41 635 | 37 647 | 32 067 | 27 561 | 23 049 | 19 250 | 15 932 | 13 256 | 13 256 |
| Ru | Factored | (USD/oz) | 567 | 553 | 571 | 597 | 618 | 608 | 353 | 325 | 304 | 296 | 296 |
| Ir | Factored | (USD/oz) | 5 083 | 4 961 | 5 125 | 5 357 | 5 544 | 5 451 | 3 168 | 2 912 | 2 725 | 2 651 | 2 651 |
| Au | Consensus | (USD/oz) | 1 799 | 1 739 | 1 600 | 1 549 | 1 488 | 1 488 | 1 488 | 1 488 | 1 488 | 1 488 | 1 488 |
| Ni | Consensus | (USD/t) | 18 458 | 18 073 | 16 833 | 15 944 | 15 724 | 15 724 | 15 724 | 15 724 | 15 724 | 15 724 | 15 724 |
| Cu | Consensus | (USD/t) | 9 292 | 8 614 | 7 690 | 7 801 | 8 057 | 8 057 | 8 057 | 8 057 | 8 057 | 8 057 | 8 057 |
| ZAR:USD | SFA | (ZAR) | 14.79 | 14.84 | 15.30 | 15.51 | 15.66 | 15.79 | 15.92 | 16.03 | 16.13 | 16.23 | 16.32 |
| 1. | CRU (2022) prices reflect CRU’s medium-term revised forecast, with prices from 2027 onwards per CRU’s 2021 forecast. |
| 2. | Rh price remains per CRU’s 2021 forecast. |
| 3. | Consensus price forecasts are presented in real (constant money) terms. |
| 4. | Values for 2021 are the average for calendar 2021. Projected values for Ir and Ru for 2022 onwards are factored by the year on year change in the Pt price, using 2021 as the base. |
| 5. | The values from 2022 onwards are used for the evaluation. |
| SRK | | Report date: 27 May 2022
Effective Date: 31 December 2021 |
| | | |
| SRK Consulting – 576060 SPM PSM Project TRS | Page 178 |
[§229.601(b)(96)(iii)(B)(16)(ii)] [SR1.5(ii), SR5.6(ii)]
| 15.5.1 | Concentrate Refining/Smelting |
SPM signed a Treatment of Concentrate and Sale of Metals Agreement with Impala Platinum Limited (Impala), which will terminate in September 2022. Impala advised SPM that the agreement cannot be extended. The principles embodied in the agreement are discussed in generic terms below, as the full agreement is provided as Exhibit 10.1 to the F-1 registration statement.
The agreement provides for the treatment of PGM concentrates at an agreed 6E grade, up to a set maximum grade. If the concentrate grade falls below a defined level, the parties would renegotiate the terms in the Agreement.
If the Cr2O3 content of the concentrate exceeds a defined percentage, Impala will impose a penalty of a set rate per tonne contained Cr2O3 in excess of this limit.
Smelting and refining charges are set at a fixed rate per dry tonne of concentrate processed. An additional charge is levied for each tonne of concentrate where the Ni plus Cu tenor exceeds a defined percentage.
Impala shall pay to SPM set percentages of the contained metal value in the concentrate. Payment due to SPM for the metals recovered will be made in two tranches, one relative to the date of concentrate delivery, with the balance paid later, less any deductions or adjustments that Impala may levy.
Ownership in the contained PGM and base metals in the concentrate remains with PPM until Impala has made final payment for the contained metals. Risk in the concentrate passes to Impala upon delivery acceptance at Impala’s refining works.
PPM also has a signed Treatment of Low-Grade Concentrate and Sale of Metals Agreement with Impala which is valid for three years from 2 May 2016 or until the agreed tonnage of concentrate has been delivered to Impala. The agreement provides for the treatment of low grade PGM concentrate with similar conditions as described above. SPM advised that Impala will continue to treat the low-grade concentrate tonnages produced by PPM for the LoM described in this report.
| SRK | | Report date: 27 May 2022
Effective Date: 31 December 2021 |
| | | |
| SRK Consulting – 576060 SPM PSM Project TRS | Page 179 |
| 15.5.2 | Third-Party Concentrate Offtake Agreement (the Offtake) |
SPM is negotiating with a third-party smelter (the Buyer) certain commercial offtake terms in respect of PPM’s PGM concentrate. The principles are discussed in generic terms below.
The duration of the Offtake is anticipated to be five years from the termination of the Impala agreement or until the Kellplant (see section 15.5.5) reaches commercial production, whichever is the earlier. A condition of the Offtake will be that the Buyer will undertake the marketing of the Kell production. Prior to expiry, volumes under the Offtake will also reduce as the Kellplant ramps up and concentrate deliveries to that plant from PPM commence.
The Buyer shall pay to PPM set payable percentages of the contained 4E metal value in the concentrate on a sliding scale dependent on the combined 4E grade (in g/t) in the concentrate. The Buyer shall pay a set payable percentage of the contained Ir and Ru in the concentrate if the combined grade of the Ir and Ru is >10 g/t in concentrate. The Buyer shall pay a fixed payable percentage of the contained Ni and Cu content in the concentrate.
Payment due to PPM for the payable metals will be made in two tranches, one (90% of value) relative to the date of concentrate delivery (the provisional payment), with the balance (as the final payment) paid upon receipt of final assays, weights and prices. A financing charge (linked to Johannesburg Interbank Average Rate, JIBAR) will be payable on the provisional payment. The price payable will be subject to deductions for treatment charges.
Deliveries will be made Delivered at Place (DAP) to the Buyer’s nominated receiving smelter located in South Africa within 450 km of the PPM mine.
Title in the contained PGM and base metals in the concentrate shall pass to the Buyer once PPM has received the provisional payment. Risk in the concentrate passes to the Buyer once the concentrate is delivered to receiving premises as determined by the Buyer.
Penalties:
| · | No penalty will be payable if the Cr2O3 content is <2.5% of the concentrate. If the Cr2O3 content of the concentrate exceeds 3%, the Buyer will have the option to refuse that concentrate delivery or impose a penalty (in USD/t) of contained chromite Cr2O3 on a sliding scale; |
| · | If the weighted monthly average 4E combined grade of concentrate is <80 g/t, the Buyer shall be entitled to refuse that concentrate delivery. |
Treatment charges are set at a fixed rate per dry tonne of concentrate (in ZAR/t) treated until January 2024, after which a new treatment rate will apply with further increases annually thereafter. The combination of treatment charges and payabilities indicates that the intent of the Offtake is for SPM to retain ownership of the refined metals.
The aggregate of the Buyer’s treatment costs and penalties for the LoM production are shown in Table 15.3.
The payabilities, penalties and toll-treatment costs are largely in line with those in the Impala contract, which are typical of the PGM industry in South Africa.
SPM’s investment in the Kell process technology is governed by a number of contracts, as summarised below. This is not a comprehensive discussion, but covers the salient features of the primary agreements.
Kelltech Limited (Kelltech) Shareholders Agreement
Kelltech is a private company incorporated pursuant to the laws of Mauritius, which holds a Global Business License Category 1 issued by the FSC and a tax residence certificate issued by the Mauritius Revenue Authority.
The shareholders agreement was signed on 16 April 2014, with three subsequent amendments in May 2014, May 2020 and June 2020. The issued share capital in Kelltech is held 50% by Orkid s.a.r.l. (Orkid) and 50% by Lifezone Limited (Lifezone). This agreement sets out the terms by which funding, rights issues, loan funding or share transactions are to be handled. It also defines the dividend policy. The full agreement is provided as Exhibit 10.9 to the F-1 registration statement.
| SRK | | Report date: 27 May 2022
Effective Date: 31 December 2021 |
| | | |
| SRK Consulting – 576060 SPM PSM Project TRS | Page 180 |
Kelltechnology SA (RF) Pty Ltd Shareholders Agreement
The Kelltech SA subscription and shareholders agreement Kelltechnology SA (RF) Pty Ltd Shareholders Agreement (KTSA) was entered into on 12 February 2016, as amended on 30 October 2020. The issued share capital is held 33.33% by the Industrial Development Corporation of South Africa (IDC) and 66.67% by Kelltech. The full agreement is provided as Exhibit 10.10 to the F-1 registration statement.
In terms of the Memorandum of Incorporation of KTSA which was passed on 23 February 2016, KTSA is required inter alia to:
| • | Promote, develop and implement the use of Kelltechnology within the Licensed Territory; |
| • | Procure the building and operating by Kellplant of the integrated processing plant that will use the Kelltechnology and produce platinum metal compounds (Plant); and |
| • | Procure the completion of a bankable feasibility study, the detailed funding plan for the Plant and detailed engineering study and submitting same to the KTSA board for approval. |
SPM’s 41.67% share of the capital cost to construct the Kell plant and associated infrastructure has been included in the capital cost summary (see Table 17.2) and the cash flow analysis (see Section 18). In turn, the royalty payments due to SPM per the Kelltech and KTSA agreements are incorporated in the revenue stream in the cash flow analysis (see for example Table 18.5).
Kellplant Pty Ltd (Kellplant) Licence Agreement
This licence agreement was entered into between KTSA and Kellplant on 12 February 2016, as amended in October 2020. KTSA granted to Kellplant a non-exclusive licence to use the processes and technologies and to construct and operate a plant using the Kelltechnology at the site of a SPM group mine in South Africa conducting the beneficiation of PGMs. The principles embodied in the agreement are summarised below, as the full agreement is provided as Exhibit 10.13 to the F-1 registration statement.
The finished products from the Kell process are sponge (Pt, Pd, Rh and Au) for sale to end users, an Ir/Ru-bearing concentrate that requires further refining and Ni and Cu as cathodes.
The aggregate of the Kell treatment costs, recovery and royalties payable to KTSA in terms of the Kellplant Licence Agreement at steady-state production level (using 2031 for illustrative purposes) are shown in Table 15.4. An average recovery is shown as the agreement provides for different recoveries for the various 6E metals (PGMs) and the base metals (Ni and Cu). The treatment charges include the actual operating cost of the Kell plant plus the cost to transport the Ir/Ru concentrate for further refining.
Technical Services Agreement
Lifezone and KTSA entered into an agreement whereby Lifezone would supply technical services for a period of three years commencing on 1 January 2020. The full agreement is provided as Exhibit 10.14 to the F-1 registration statement.
| 15.5.4 | Chromite Concentrate Off-Take Agreement |
SPM signed a Buyer Purchase Contract with Noble Resources International Pte. Ltd. (Noble, now called Kalon Resources Pte. Ltd.) for the supply of UG2 chrome concentrate, which is valid for three years from 21 September 2017. In terms of the agreement, Noble would purchase 100% of the UG2 chrome concentrate produced by SPM, subject to a minimum monthly quantity from the date SPM notified Noble that the chromite recovery circuit had been commissioned. The contract is still in force, as SPM has not supplied Noble (Kalon) with the contractual minimum quantity of 8 ktpm or 288 kt. SPM advised that at the Effective date of this TRS, approximately 25% of the contracted total had been supplied to Noble (Kalon). SRK understands that once the contracted total has been delivered in full, SPM plans to go out to tender for a new offtake agreement.
The chrome concentrate must conform to the standard specification for UG2 chrome concentrate containing 40.5% to 42.0% Cr2O3. Certain penalties will apply if the SiO2, Al2O3, MgO, P or S contents in the concentrate exceed specified maximums.
The provisional price for the concentrate is determined on an ex-works 42% Cr2O3 basis (place of delivery) according to a formula which comprises a fixed price, an upside trigger and an upside sharing percentage. The fixed price is governed by a sliding scale, linked to an indexed price which is the average of the cost, insurance, and freight (CIF) China price for the relevant month as published by Ferroalloynet, CRU and Metal Bulletin (www.ferroalloynet.com, www.crugroup.com, www.metalbulletin.com respectively).
A provisional payment of a percentage of the value of the product is made within seven business days based on provisional certificates of quality and weight. The final payment is made within seven business days of SPM’s final commercial invoice or Noble’s debit note (as applicable) based on the product value per the final price, which is dependent on the final certificates for quality and weight, less the provisional payment made.
Title to the chrome concentrate passes to Noble once the provisional payment has been made. Risk in the concentrate passes to Noble once the shipment leaves the PPM site.
| SRK | | Report date: 27 May 2022
Effective Date: 31 December 2021 |
| | | |
| SRK Consulting – 576060 SPM PSM Project TRS | Page 181 |
| Table 15.3 | Aggregate of Buyer’s treatment charges and penalties |
| Item | Units | Totals | 2022 | 2023 | 2024 | 2025 | 2026 | 2027 | 2028 | 2029 | 2030 | 2031 | 2032 | 2033 | 2034 | 2035 | 2036 |
| Contained Metal Value (1) | (ZARm) | 28 877 | 9 225 | 9 869 | 343 | 321 | 299 | 269 | 218 | 371 | 418 | 453 | 401 | 408 | 409 | 404 | 412 |
| Payable Metal Value (2) | (ZARm) | 24 781 | 8 099 | 8 435 | 288 | 268 | 248 | 225 | 182 | 315 | 359 | 389 | 345 | 351 | 352 | 345 | 343 |
| Less: | | | | | | | | | | | | | | | | | |
| Cr2O3 Penalties | (ZARm) | -0 | 0 | 0 | 0 | 0 | 0 | 0 | -0 | 0 | -0 | -0 | -0 | -0 | -0 | 0 | 0 |
| Smelting Royalties | (ZARm) | 0 | 0 | 0 | 0 | 0 | 0 | 0 | 0 | 0 | 0 | 0 | 0 | 0 | 0 | 0 | 0 |
| Concentrate Transport Cost | (ZARm) | -26 | -3 | -0 | -1 | -1 | -1 | -1 | -1 | -1 | -1 | -1 | -1 | -1 | -1 | -1 | -1 |
| Smelting and Refining Cost | (ZARm) | -1 059 | -164 | -111 | -17 | -18 | -20 | -21 | -19 | -27 | -33 | -36 | -32 | -33 | -33 | -33 | -35 |
| Net Revenue | (ZARm) | 23 695 | 7 931 | 8 324 | 270 | 249 | 228 | 203 | 162 | 287 | 325 | 352 | 312 | 317 | 318 | 312 | 307 |
| Effective payability | (%) | 82.05% | 85.97% | 84.35% | 78.65% | 77.73% | 76.35% | 75.58% | 74.29% | 77.39% | 77.86% | 77.73% | 77.61% | 77.72% | 77.78% | 77.14% | 74.72% |
| Item | Units | Totals | 2037 | 2038 | 2039 | 2040 | 2041 | 2042 | 2043 | 2044 | 2045 | 2046 | 2047 | 2048 | 2049 | 2050 | 2051 |
| Contained Metal Value (1) | (ZARm) | 28 877 | 411 | 406 | 408 | 374 | 336 | 277 | 221 | 191 | 159 | 158 | 145 | 154 | 160 | 156 | 140 |
| Payable Metal Value (2) | (ZARm) | 24 781 | 344 | 339 | 341 | 312 | 280 | 231 | 187 | 164 | 133 | 134 | 121 | 129 | 133 | 130 | 117 |
| Less: | | | | | | | | | | | | | | | | | |
| Cr2O3 Penalties | (ZARm) | -0 | 0 | 0 | 0 | 0 | 0 | 0 | 0 | 0 | 0 | 0 | 0 | 0 | 0 | 0 | 0 |
| Smelting Royalties | (ZARm) | 0 | 0 | 0 | 0 | 0 | 0 | 0 | 0 | 0 | 0 | 0 | 0 | 0 | 0 | 0 | 0 |
| Concentrate Transport Cost | (ZARm) | -26 | -1 | -1 | -1 | -1 | -1 | -1 | -1 | -0 | -0 | -0 | -0 | -0 | -0 | -0 | -0 |
| Smelting and Refining Cost | (ZARm) | -1 059 | -35 | -34 | -34 | -31 | -28 | -24 | -19 | -16 | -13 | -13 | -12 | -13 | -13 | -13 | -12 |
| Net Revenue | (ZARm) | 23 695 | 308 | 304 | 306 | 280 | 251 | 206 | 168 | 148 | 120 | 121 | 108 | 116 | 120 | 117 | 104 |
| Effective payability | (%) | 82.05% | 74.96% | 74.74% | 75.10% | 74.88% | 74.74% | 74.30% | 75.91% | 77.18% | 75.18% | 76.50% | 74.76% | 75.28% | 74.58% | 74.55% | 74.16% |
| Item | Units | Totals | 2052 | 2053 | 2054 | 2055 | 2056 | 2057 | 2058 | 2059 | 2060 | 2061 |
| Contained Metal Value (1) | (ZARm) | 28 877 | 141 | 140 | 129 | 134 | 144 | 137 | 153 | 165 | 159 | 56 |
| Payable Metal Values (2) | (ZARm) | 24 781 | 117 | 116 | 108 | 112 | 120 | 114 | 129 | 141 | 135 | 48 |
| Less: | | | | | | | | | | | | |
| Cr2O3 Penalties | (ZARm) | -0 | 0 | 0 | 0 | 0 | 0 | 0 | 0 | -0 | -0 | 0 |
| Smelting Royalties | (ZARm) | 0 | 0 | 0 | 0 | 0 | 0 | 0 | 0 | 0 | 0 | 0 |
| Concentrate Transport cost | (ZARm) | -26 | -0 | -0 | -0 | -0 | -0 | -0 | -0 | -0 | -0 | -0 |
| Smelting and Refining Cost | (ZARm) | -1 059 | -12 | -12 | -11 | -12 | -12 | -12 | -13 | -14 | -13 | -5 |
| Net Revenue | (ZARm) | 23 695 | 105 | 104 | 96 | 100 | 108 | 102 | 116 | 127 | 122 | 43 |
| Effective payability | (%) | 82.05% | 74.17% | 74.31% | 74.11% | 74.09% | 74.49% | 74.37% | 75.59% | 76.71% | 76.48% | 77.47% |
| 1 | Value of contained metal in concentrate as delivered to the smelter/refinery. |
| 2 | Value of recovered metal that is attributable to SPM after application of metal recoveries/payabilities per the Impala agreement (mostly 2022), the Offtake (2022 and 2023) and Impala low-grade concentrate agreement (2024 to 2061). |
| SRK | | Report date: 27 May 2022
Effective Date: 31 December 2021 |
| | | |
| SRK Consulting – 576060 SPM PSM Project TRS | Page 182 |
| Table 15.4 | Aggregate of Kell treatment charges, recovery and royalties |
| Item | Units | Totals | 2022 | 2023 | 2024 | 2025 | 2026 | 2027 | 2028 | 2029 | 2030 | 2031 | 2032 | 2033 | 2034 | 2035 | 2036 |
| Contained Metal Value (1) | (ZARm) | 246 734 | 0 | 0 | 8 948 | 7 828 | 7 514 | 7 544 | 7 191 | 8 041 | 10 497 | 11 588 | 10 699 | 10 973 | 10 770 | 10 629 | 10 280 |
| Recovered Metal Value (2) | (ZARm) | 231 105 | 0 | 0 | 8 452 | 7 375 | 7 065 | 7 123 | 6 776 | 7 561 | 9 826 | 10 821 | 9 978 | 10 237 | 10 049 | 9 916 | 9 593 |
| Payable Metal Value (3)(4) | (ZARm) | 217 983 | 0 | 0 | 7 641 | 6 714 | 6 683 | 6 721 | 6 420 | 7 131 | 9 281 | 10 222 | 9 425 | 9 672 | 9 495 | 9 372 | 9 075 |
| Less: | | | | | | | | | | | | | | | | | |
| Penalties | (ZARm) | 0 | 0 | 0 | 0 | 0 | 0 | 0 | 0 | 0 | 0 | 0 | 0 | 0 | 0 | 0 | 0 |
| Net Kell Royalties (4) | (ZARm) | 1 169 | 0 | 0 | 0 | 20 | 38 | 38 | 36 | 40 | 52 | 58 | 53 | 55 | 54 | 53 | 51 |
| Concentrate Transport Cost | (ZARm) | -85 | 0 | 0 | 0 | -2 | -2 | -2 | -2 | -2 | -2 | -2 | -2 | -2 | -2 | -2 | -2 |
| Smelting and Refining Cost | (ZARm) | -5 025 | 0 | 0 | -135 | -159 | -185 | -206 | -254 | -146 | -169 | -187 | -185 | -196 | -193 | -195 | -209 |
| Net Revenue | (ZARm) | 214 042 | 0 | 0 | 7 505 | 6 572 | 6 534 | 6 550 | 6 199 | 7 023 | 9 162 | 10 090 | 9 290 | 9 529 | 9 353 | 9 228 | 8 915 |
| Net payability | (%) | 86.75% | 0.00% | 0.00% | 83.88% | 83.96% | 86.96% | 86.82% | 86.21% | 87.34% | 87.28% | 87.07% | 86.84% | 86.84% | 86.84% | 86.82% | 86.72% |
| Item | Units | Totals | 2037 | 2038 | 2039 | 2040 | 2041 | 2042 | 2043 | 2044 | 2045 | 2046 | 2047 | 2048 | 2049 | 2050 | 2051 |
| Contained Metal Value (1) | (ZARm) | 246 734 | 10 446 | 10 379 | 10 440 | 9 528 | 8 104 | 6 162 | 5 272 | 4 874 | 4 016 | 3 754 | 3 534 | 3 754 | 4 026 | 3 966 | 3 337 |
| Recovered Metal Value (2) | (ZARm) | 231 105 | 9 749 | 9 681 | 9 742 | 8 895 | 7 575 | 5 769 | 4 939 | 4 567 | 3 768 | 3 525 | 3 317 | 3 524 | 3 780 | 3 724 | 3 133 |
| Payable Metal Value (3)(4) | (ZARm) | 217 983 | 9 224 | 9 157 | 9 210 | 8 407 | 7 167 | 5 464 | 4 677 | 4 322 | 3 569 | 3 333 | 3 141 | 3 335 | 3 578 | 3 527 | 2 973 |
| Less: | | | | | | | | | | | | | | | | | |
| Penalties | (ZARm) | 0 | 0 | 0 | 0 | 0 | 0 | 0 | 0 | 0 | 0 | 0 | 0 | 0 | 0 | 0 | 0 |
| Net Kell Royalties (4) | (ZARm) | 1 169 | 52 | 52 | 52 | 48 | 41 | 31 | 26 | 24 | 20 | 19 | 18 | 19 | 20 | 20 | 17 |
| Concentrate Transport Cost | (ZARm) | -85 | -2 | -2 | -2 | -2 | -2 | -2 | -2 | -2 | -2 | -2 | -2 | -2 | -2 | -2 | -2 |
| Smelting and Refining Cost | (ZARm) | -5 025 | -213 | -208 | -203 | -185 | -175 | -151 | -114 | -93 | -83 | -70 | -73 | -74 | -79 | -83 | -79 |
| Net Revenue | (ZARm) | 214 042 | 9 060 | 8 998 | 9 057 | 8 267 | 7 031 | 5 342 | 4 586 | 4 251 | 3 504 | 3 280 | 3 084 | 3 278 | 3 516 | 3 461 | 2 908 |
| Net payability | (%) | 86.75% | 86.73% | 86.70% | 86.75% | 86.76% | 86.76% | 86.69% | 86.98% | 87.22% | 87.25% | 87.36% | 87.28% | 87.32% | 87.33% | 87.28% | 87.14% |
| Item | Units | Totals | 2052 | 2053 | 2054 | 2055 | 2056 | 2057 | 2058 | 2059 | 2060 | 2061 |
| Contained Metal Value (1) | (ZARm) | 246 734 | 3 342 | 3 207 | 3 032 | 3 258 | 3 512 | 3 319 | 3 735 | 3 983 | 3 897 | 1 355 |
| Recovered Metal Value (2) | (ZARm) | 231 105 | 3 137 | 3 010 | 2 846 | 3 059 | 3 298 | 3 117 | 3 507 | 3 739 | 3 658 | 1 272 |
| Payable Metal Values (3)(4) | (ZARm) | 217 983 | 2 978 | 2 857 | 2 705 | 2 906 | 3 125 | 2 956 | 3 320 | 3 536 | 3 461 | 1 203 |
| Less: | | | | | | | | | | | | |
| Penalties | (ZARm) | 0 | 0 | 0 | 0 | 0 | 0 | 0 | 0 | 0 | 0 | 0 |
| Net Kell Royalties (4) | (ZARm) | 1 169 | 17 | 16 | 15 | 16 | 18 | 17 | 19 | 20 | 19 | 7 |
| Concentrate Transport cost | (ZARm) | -85 | -2 | -2 | -2 | -2 | -2 | -2 | -2 | -2 | -2 | -1 |
| Smelting and Refining Cost | (ZARm) | -5 025 | -80 | -76 | -79 | -82 | -77 | -78 | -75 | -73 | -74 | -25 |
| Net Revenue | (ZARm) | 214 042 | 2 912 | 2 794 | 2 639 | 2 837 | 3 063 | 2 893 | 3 261 | 3 481 | 3 404 | 1 184 |
| Net payability | (%) | 86.75% | 87.13% | 87.14% | 87.05% | 87.08% | 87.23% | 87.16% | 87.31% | 87.39% | 87.36% | 87.37% |
| 1 | Value of contained metal in concentrate as delivered to the Kellplant. |
| 2 | Value of recovered metal after application of the Kell process recoveries per the 2020 feasibility study for 4E/Ni/Cu and 2016 feasibility study for Ir/Ru. |
| 3 | Value of payable metal that is attributable to SPM after application of the payabilities per the Kell term sheet. |
| 4 | This reflects the royalties due to SPM arising from its equity interest in Kell. Royalties payable to Kellplant are included in the payable metal value (note 3). |
| SRK | | Report date: 27 May 2022
Effective Date: 31 December 2021 |
| | | |
| SRK Consulting – 576060 SPM PSM Project TRS | Page 183 |
Open Pits (West Pit and East Pit)
The open pit mining operations are conducted on a contract basis and several contractor companies are employed, with the salient points summarized in Table 15.5. Certain contracts are in the process of being renewed or awarded to new contractors, to handle mining at both the West and East Pits.
The companies are responsible for drilling, blasting, loading and hauling, environmental rehabilitation as well as road maintenance operations. The delivery of explosives, consumables and associated accessories is supplied by Bulk Mining Explosives (Pty) Ltd.
SRK reviewed the contracts and found the following:
| · | The required deliverables are outlined in detail; |
| · | The roles and responsibilities are clearly assigned in the schedule of responsibilities matrices drawn up. The joint responsibilities are also clearly detailed; |
| · | Termination conditions are stated clearly; |
| · | The contracts take cognisance of the PPM’s safety, occupational hygiene and environmental management policies and strategy; and |
| · | The contracts are conducive to and support a culture of performance. |
Table 15.5: Open Pit – Mining contracts review
| Company | Services supplied | Tenure and contract
period | General terms and remarks |
| Trollope Mining Services (2000) (Pty) Ltd | Load and haul contract All ore and waste for West and east Pit (target volume 8000 000 to 1 200 000 bcm) Will prioritize West Pit first. | 01/07/2017 to 30/06/2022 | The contractor must load and haul according to the mine plan prepared by PPM. All mining equipment to be provided and maintained by the contractor to achieve the required volumes under the mining plan. Payment is based on rates and surveyed volumes. |
Community-based contractor Equinox Engineering Solutions (Pty) Ltd, Matsinyane Mining and Projects (Pty) Ltd) | Load and haul contract of 200 000 bcm to 250 000 bcm ore and waste per month for East Pit | Contract for 5 years, contracts to be finalized by Q1 2022. | Same conditions as per Trollope Mining Services contract |
| E&M Tshwarango Joint Venture (Pty) Ltd | This is a drilling contract and requires that 60 000 m to 80 000 m be drilled per production month. To be deployed in West and East Pits. | Contract for 3 years to 01/06/2021. Extension for five years under review | PPM required to provide detailed drilling programme to contractor seven days before drilling due to commence. Adjusted for diesel supplied by PPM at a set rate per litre less a diesel efficiency variance according to a formula. Drilling of pre-splits and other irregular drilling to be negotiated between the parties. Variable rate depending on hole size |
| Sedibelo Kgabo Mining (Pty) Ltd | This is a drilling contract and requires that 20 000 m be drilled per production month. To be deployed both West and East Pits | Contract valid for 5 years. Signed 22/06/2021. |
| Pro Blast PS (Pty) Ltd | Provide blasting material and services | New contract valid for 5 years, 01/07/2020 to30/06/2025 | Fulfil a programme provided by PPM to blast not less than 645 000 bcm of rock per month |
| KGL Transport & Konstruksie | Transport of Pt concentrate | 01/09/2010, indefinite subject to 3 months’ notice | Transport of concentrate to Impala, thereafter to a third-party smelter (Buyer) Pay the contractor the minimum of one dedicated vehicle per month. Diesel to be supplied by PPM. |
SRK believes the contracts do not present any significant risk factors to the operations of the business and endorse the contracts as such.
Portal and Underground for East Underground Block
The selected EPCM contractor who will build the portal and portal infrastructure for the East Underground Block is Worley Parsons South Africa (Worley). Worley has been issued with a letter of intent to enable them to start work on design and implementation of the East Portal while contract negotiations take place. SPM expects that the contract negotiations will be concluded by the end of March 2022, after which Worley will be appointed.
The EPCM contractor will be responsible for the construction of the box cut and portal entrance.
| SRK | | Report date: 27 May 2022
Effective Date: 31 December 2021 |
| | | |
| SRK Consulting – 576060 SPM PSM Project TRS | Page 184 |
The first phase of the mining contractor selection process has been concluded, with two contractors selected for further capability discussions based on their tender submissions. Once the mining contractor has been selected, the contract negotiations will start. The mining contractor will also be issued with a letter of intent to enable them to start the mobilization process with the recruitment and training of their workforce. The mining contractor will be required to start work by the beginning of July 2022.
| 15.5.6 | PPM Renewable Energy Project |
PPM signed a Memorandum of Understanding (MoU) on 10 March 2022 with a consortium of Sturdee Energy Southern Africa (Pty) Ltd (Sturdee) and juwi Renewable Energies Pty Ltd (juwi) to provide the mine with renewable energy.
Sturdee is a project developer and Independent Power Producer (IPP) that is developing the Steenbok Solar Farm near Lephalale in the Limpopo Province. Juwi is a project developer, engineering, procurement and construction (EPC) and operation and maintenance (O&M) contractor that is developing the Hartebeest Wind Farm located near Moreesburg in the Western Cape Province of South Africa. The consortium companies wish to develop these projects further and make them available as a source of electricity supply to PPM.
Through the MoU, PPM appointed the consortium as the preferred bidder for the conclusion of two Power Purchase Agreements (PPAs) for the exclusive access to the sites offered in the tender, and to hold the offered price (with a carve-out allowing the price to rise by up to 15% under certain circumstances).
The MOU contemplates 3 phases, with phase 2 is an extension of phase 1, and phase 3 as a separate project, as follows:
Sturdee (acting as co-developer and Independent Power Producer, IPP) and juwi (acting as co-developer, EPC and O&M) will supply PPM with 40 MW electricity supply from the Hartebeest Project and 40 MW of electricity supply from the Steenbok Project which will be delivered to the mine via a wheeling arrangement in terms of a PPA to be concluded. This will provide energy to power the mine’s existing requirements plus the proposed Kell plant. The parties will work together to finalise the understanding of SPM’s load profile and to optimize the supply in line with the demand, so that PPM receives as it needs to meet its energy requirements over each 24 hour cycle, without having to pay for energy beyond its load requirements (for example when the wind and solar both produce at the same time). PPM is committed to proceeding with this phase.
This is effectively an option for PPM to access a further 35 MW of solar and an additional 17 MW of wind which may be required for an electroliser which is under consideration for the Kell plant.
Sturdee/ juwi will build a 35 MW solar plant at or adjacent to the Mine to meet the energy needs of the new underground operation. The consortium will assist PPM in all the development tasks and then act as EPC, O&M and IPP. However PPM will still need to identify the exact site and then get regulatory approvals.
Pricing and delivery dates can only be confirmed once PPM has signed the PPA, which is expected to occur by June 2022.
The first 40 MW of energy supply to PPM is expected to flow from Q1 2024, with a further 35 MW of power from a solar plant at or adjacent to the mine to cater for the underground mine from Q2 2026.
Based on the Megaflex 2021 tariffs and adjusted by published increases, SPM estimated the average 2022 Eskom power tariff to be ZAR1.41/kWh. Assuming that the renewable energy accounts for 55% of PPM’s electricity costs, SPM determined that a projected saving against Eskom-based electricity charges of 25% per annum could be realised from 2024.
| SRK | | Report date: 27 May 2022
Effective Date: 31 December 2021 |
| | | |
| SRK Consulting – 576060 SPM PSM Project TRS | Page 185 |
| 16 | ENVIRONMENTAL STUDIES, PERMITTING, COMMUNITY AGREEMENTS |
[§229.601(b)(96)(iii)(B)(17)] [SR5.5(i)-(iii)]
The P-S-M Project is located north of the Pilanesberg National Park in an area which is sensitive from a conservation point of view. In terms of vegetation, the Pilanesberg is significant because it is a transition zone between the arid savanna and the moist savanna biome. Owing to the complex substrate, there is a wide variety of landscapes and habitats for both fauna and flora.
The P-S-M Project is within the proposed (but not yet implemented) Heritage Park Corridor which is an initiative being put forward by the North West Parks and Tourism Board (NWPTB). It is proposed that over 167 000 ha will be incorporated into the corridor over a twenty-year period to allow the joining of the Madikwe Game reserve and the Pilanesberg National Park. This initiative forms part of a larger initiative to establish a significant conservation area in the province approaching 1 000 000 ha. Mining could co-exist in this park in the Phase 1 area of the corridor, which will exclude dangerous animals. However, an appeal was lodged against the SPM mining operation on the basis that it is located within the proposed corridor. SPM has submitted its response to the department for consideration which SRK understands was not successful. This remains an ongoing matter pending a decision by NWDREAD and NWPTB. There will also be a “Big Five” area in which mining will not be able to take place. There is reportedly some opposition to this initiative and given the emotive nature surrounding conservation issues, this opposition will have to be managed. In addition to this, an area known as the “Identified/Designated Area for Relocated Protected Plants” has been proposed to the south of the East Pit. This area will be used for replanting of various protected plant species which will be relocated from the Wilgespruit farm property where the proposed mining activities and infrastructure are earmarked to take place. This designated area will be fenced-off.
Apart from the proposed conservation initiatives, the area is characterized by farming and mining activities. Land capability is relatively low and the flow in surface water courses is unreliable for domestic use. From a ground water point of view, the area is classified as a minor aquifer. There is some borehole use in the area but this has reduced due to the supply of water by Magalies Water. Ground water usage includes domestic, stock watering (dominant) and irrigation (gardens and smallholdings).
The operations on West Pit are separated from any infrastructure which may be located on Sedibelo to the East by the Wilgespruit River.
| 16.2 | Socio-economic Setting |
[SR4.3(v), SR4.5(iii), SR5.5(iv)(v)]
The P-S-M Project includes a combination of an operating mine (West Pit) and planned development of the East Pit, Central Underground Block and East Underground Block mines. While these projects are separate entities according to their mining licences and approvals, the socio-economic setting is described for all Western Limb projects as they are all located within the same context.
The P-S-M Project is located within the Moses Kotane Local Municipality (MKLM), which is one of the municipalities forming the Bojanala District Municipality, and a small portion in the Rustenburg Local Municipality, in the North West Province. The project farms are largely on land that is owned by the state in trust for the BBKT. Based on information SRK has developed on other projects in the area, the project farms are also located on land that could be under the traditional ownership of the Batlhako Ba Leema Tribal Authority (farms Ruighoek 169 JP) and the Batlhalerwa Tribal Authority (farm Groenfontein 138 JP). The EIA undertaken for the Ruighoek Project in 2007/2012 also refers to the following tribal authorities as potential stakeholders in the project: Motlhabe tribal office, Ngweding tribal office, Legkraal/Bofule tribal office, and the Tlhatlhaganyane tribal office.
Most of the land governed by the MKLM is settled and controlled by the BBKT. The BBKT is administered by a traditional council, which includes a chief. The BBKT, unable to provide services to its residents, has developed a vision for the economic development of its communities which is reported in its Long-Term Master Plan. Without sustainable investment, and capacity development the BBKT is unlikely to realise its Master Plan which can reasonably be assumed will continue to place development expectations and pressure on companies such as SPM.
| SRK | | Report date: 27 May 2022
Effective Date: 31 December 2021 |
| | | |
| SRK Consulting – 576060 SPM PSM Project TRS | Page 186 |
Within a 50 km radius of the P-S-M Project there are several other platinum mines. Mining has an 80-year history on the Western Limb but has not necessarily translated into benefits that are tangibly experienced by ordinary people. The level of expectations and agitation in the mining sector, the time it has taken to get the Western Limb projects to operations phase and the low levels of social infrastructure, services and economic opportunities, combine to create a context of high levels of expectation and well as high levels of frustration in the lack of delivery to ordinary people. This resulted in four major disruptions between 2009 and 2013 to production at PPM due to industrial or community unrest. Since January 2016, when Lesethleng village youth barricaded the road leading to PPM, accusing the company of not hiring locals, major disruptions have reportedly diminished. A news-controversy search indicated that no new community unrest took place since 2016.
PPM is acutely aware that its relationships with stakeholders on the ground, i.e., employees, unions, communities, municipalities and state departments, has to be maintained at highly effective levels to secure industrial peace and consistent operations. In addition, ongoing internal tensions within the BBKT with regards legitimacy of leadership has already manifested in activism and tensions in the area.
On 8 June 2020, a landmark agreement was signed between SPM and LLC which represents many people descended from the 13 clans that acquired the Wilgespruit property 100 years ago. The agreement represented a significant milestone as the settlement was brokered with direct beneficiaries instead of tribal authorities. The settlement also provides for full disclosure of land valuation and a commitment from SPM to invest in a community development trust and ring-fencing employment and procurement opportunities from the mine for the Lesethleng community.
The conclusion of this agreement ended six years of dispute with the LLC and SPM currently views its relationship with the doorstep communities as strengthened and indicative of having obtained a social licence to operate (personal communication during onsite interview).
[SR1.1(i), SR1.2(i)]
The new surface infrastructure proposed for the P-S-M Project is as follows:
| · | PPM offices – expanded training centre, offices, sewage plant and change house facilities; |
| · | East Pit – uses existing infrastructure for West Pit; |
| · | Central Underground Block – satellite offices and support buildings for underground operations; and |
| · | East Underground Block – satellite offices and support buildings for underground operations. |
The Section 102 in terms of the MPRDA incorporation of the Magazynskraal NOPRs and the Kruidfontein NOPR into the IBMR NOMR will trigger the requirement for the IBMR EMP to be amended, which SPM plans to complete during 2022 for approval by the DMRE. It is SRK’s understanding based on the information received from SPM that project team meetings are undertaken and held weekly to discuss P-S-M Project plans (including Magazynskraal) and scheduled authorizations processes. Stakeholder engagement and relocation plan execution are at advanced stage with the BBKTA traditional council, appointed BBKTA administrator and DMRE assisting to resolve outstanding stakeholder and relocation issues. These engagements will assist initiating the public participation process for the P-S-M Project EIA/EMP amendment and other applicable licences.
| 16.4 | Results of environmental studies |
[§229.601(b)(96)(iii)(B)(17)(i)] [SR4.5(iii), SR5.5(i)]
The environmental and relevant specialist studies for PPM, Sedibelo and Magazynskraal permits will need to reflect the changed project description, which will require environmental authorization prior to construction commencing.
SPM is placing surface infrastructure as far as is possible within the footprints in the previously approved EIAs/EMPrs in order to limit, as far as it is practical, the need for additional environmental permits and licences.
| 16.4.1 | Surface Water Quality Monitoring |
According to the 2019 Annual Water Monitoring Report, no negative impact on the water quality of the Wilgespruit River or Manyedime River was observed as a result of PPM mining activities. Monitoring point SW13 located in the tributary of the Mothlabe that flows next to the West Pit WRD however displayed significantly deteriorated water quality in terms of sulfate and nitrate in April 2019. SW13 was sampled again during January and February 2020 and again displayed elevated sulfate and nitrate concentrations.
| SRK | | Report date: 27 May 2022
Effective Date: 31 December 2021 |
| | | |
| SRK Consulting – 576060 SPM PSM Project TRS | Page 187 |
An investigation to identify the cause of the elevated sulfates and nitrates was recommended. The elevated sulfate and nitrate levels are likely a result of seepage from the West Pit WRD since the groundwater monitoring boreholes near the WRD (PPMMON5 and PPMMON6) also show elevated sulfate and nitrate levels.
| 16.5 | Requirements and plans for waste and tailings disposal and water management |
[§229.601(b)(96)(iii)(B)(17)(ii)] [SR1.1(ii), SR4.5(iii), SR5.4(ii)]
| 16.5.1 | Compliance to Water Management Legislation at the P-S-M Project |
Water management on mines is governed by GNR704 of 4 June 1999 (GNR704; Regulations on the use of water for mining and related activities aimed at the protection of water resources). Infrastructure that does not comply to GNR704 includes:
| · | No written exemption from GNR704 has been granted for the following infrastructure located within 100 m or the 1:100 year flood line of the Manyedime, Wilgespruit and Mothlabe Rivers: |
| o | Storm Water Dams (Eskom, TSF SWD, North SWD); |
Although SPM has applied for exemptions, the exemptions were neither granted nor denied. Therefore, SPM will once again need to apply for exemptions from GNR704 for the remaining infrastructure that is located within the 1:100 floodline or within 100 m of a watercourse;
| · | Waste rock is used for road construction. As above, SPM has applied for an exemption from this activity. |
| · | The encroachment of the WRD on the un-named tributary of the Mothlabe River necessitates the construction of a river diversion. The diversion has been planned and designed; however, authorization still needs to be obtained; |
| · | The culverts carrying clean stormwater under the haul road and downstream to the un-named tributary of the Mothlabe River are undersized, which causes damming of clean water flows upstream of the road. A new culvert design has been developed and implementation is pending; |
| · | Dirty water channels are needed to contain dirty water draining from the DMS stockpile. The dirty water must be channelled and piped under the road back to the Plant SWD at the plant. Routing and sizing of these channels has been undertaken conceptually; |
| · | There is evidence of overflow from the lined RWD into the unlined SWD. This is due to silt build-up in the silt traps and RWD, which reduces their capacity. The finer solids in the tailings slurry settle out of solution slowly (due to the fine grind and likely presence of colloidal solids). As such, some of the solids do not settle out on the TSF and carry over into the RWD. SPM has embarked on a process water clarification optimization project, to ensure better separation of the solids from the tailings slurry; |
| · | The waste management area (solid waste) within the plant is within a fenced, concreted, and bunded area; however, several waste materials were found disposed outside the designated area. Procedures should be revised such that waste is disposed of correctly; |
| · | The Eskom SWD receives clean water runoff, and occasionally excess dirty water. This is a non-compliance to GNR704 (mixing of clean and dirty water). A clean water diversion has been recommended in the SWMP, to prevent clean water entering the Eskom SWD; and |
| · | The current diversion channels in the Sedibelo are are insufficiently sized and cannot handle a 1:50 year flood event. The recommendation in the Sedibelo SWMP is to increase the capacity of the channels. |
| SRK | | Report date: 27 May 2022
Effective Date: 31 December 2021 |
| | | |
| SRK Consulting – 576060 SPM PSM Project TRS | Page 188 |
As a result of the inability to extend the open pit operations due to protracted negotiations with adjacent community groups, SPM has not been able to develop the open pit water storage capacity that is required for closure planning. This, combined with higher than usual rainfall, has resulted in spillage of water from several SWDs into the environment. SPM is currently negotiating these emergency releases with the DWS. It is clear that there is insufficient water storage capacity in the mine water system. Additional water management measures have been proposed, such as additional storage facilities. These will be developed as part of ongoing water management studies.
The following key water-related issues have been identified (refer Section 20.3.6):
| · | Groundwater studies, monitoring and numerical modelling have shown that the tailings storage facility (TSF) and waste rock dump (WRD) are the major sources of contamination to groundwater. Stormwater dams 1, 2 and 3 and the return water dam (RWD) are also likely sources of secondary contamination due to possible spillages/leakages; |
| · | The current groundwater monitoring network is not adequate to identify and apportion the contribution of individual facilities and contaminant sources, nor determine the contribution from leakages at the various facilities; |
| · | Elevated nitrate concentrations are detected in community borehole AGES4 when there is a substantial increase in abstraction, indicating the possibility that the contaminant plume from the WRD and North SWD (unlined) has reached the borehole. PPM has advised the community on the maximum rate of abstraction, based on pumping test data. The community is earmarked to be relocated due to mine expansion, and the borehole will no longer be used for community water supply; and |
| · | There is insufficient storage capacity in the water system during periods of higher than average rainfall, which leads to spillage of excess mine water into the environment. |
The following work has been done or is in the process of being completed to assist the mine with water management in the last two years:
| · | Good progress has been made to further manage water on site by preparing a Goldsim® monthly water balance model for the site. The model simulates the impacts of changes to tonnages, slurry densities and climatic changes; on water use at the mine. The water balance is based on a block flow diagram that has been approved by the mine, to ensure that the flows in the water balance match the flows in the mine; |
| · | In order to address some of the non-compliance to GNR704, the 2017 stormwater plan has largely been implemented. It included: |
| o | the construction of a geocell-lined clean water diversion canal to divert clean water from upstream of the plant away from the plant and pit area; |
| o | an upgrade of the dirty water diversion canals through the plant; |
| o | the construction of a large silt trap in the plant area; |
| o | the construction of a diversion canal leading to the Eskom SWD; |
| · | SPM has continued to update the SWMP, and the 2021 updates are currently being finalised; |
| · | SPM has embarked on a process water clarification optimization project in order to improve separation of solids from the tailings slurry (and thereby minimise excessive siltation in the RWD). The Capex for this project is included in SPM’s sustaining Capex allowances; |
| · | SPM has planned to upgrade the silt traps at the RWD, in order to allow for removal of more solids and reduce siltation of the RWD. The Capex for this project is included in SPM’s sustaining Capex allowances; |
| · | SPM has completed the conceptual design of the clean water diversion at the Eskom SWD and nearby training centre. |
| 16.6 | Project permitting requirements and reclamation bonds |
[§229.601(b)(96)(iii)(B)(17)(iii)][SR1.5(ii)]
Certain environmental authorizations and permits required for the project are pending (see Section 2.4.1).
| SRK | | Report date: 27 May 2022
Effective Date: 31 December 2021 |
| | | |
| SRK Consulting – 576060 SPM PSM Project TRS | Page 189 |
| 16.6.1 | Existing approved environmental, water and waste authorizations, licences and permits |
[SR1.5(ii)(iii)(v), SR4.3(iv)(v), SR4.5(iii), SR5.5(ii)(iii), SR5.6(ix)]
A summary of the existing approved authorizations, licences and permits in terms of NEMA, NEM:WA and NWA for the P-S-M Project is given in Table 16.1.
With effect from 8 December 2014 mining EIA/EMPrs fall under NEMA but authorization is issued by DMRE (One Environmental System). PPM is operated under an approved EMPr. PPM’s EMPr was approved in 2008 by the DMRE. The PPM expansion will operate under a separate EMPr which was submitted by IBMR and approved in 2008 by the DMRE.
Amendments have been made to the original EMPr to incorporate and obtain approval for further mining related development and infrastructure. All approved EMPrs and subsequent amendments are included in Table 16.1 (for PPM) and Table 16.2 (for SPM).
Table 16.1: All approved EMPrs and subsequent amendments for PPM
| EA and EMPr Report | Purpose (as per EMPr Report) – As relevant at time of submission | Date of approval |
PPM EMPr for proposed Platinum Mine April 2007 | The existing approved EMPr, dated 2007 is applicable to the current operations undertaken at the Tuschenkomst pit and related activities. This includes (amongst others) open pit mining methods, waste rock disposal at the existing waste rock dump area, the use of haul roads, water management measures, topsoil stockpiles, plant operation, and support services (such as workshops and engineering services). | 14 February 2008 |
PPM EMPr Amendment for the proposed closure of a Provincial Road and changes to surface structure – April 2009 | An EMPr Addendum for the proposed closure of a provincial road and changes to certain components of its surface infrastructure. The EMPr authorized repositioning of the ROM Stockpile, Low Grade Stockpile, re-routing of the Magalies Water supply line, Re-positioning of the Tuschenkomst Waste Rock Dump, Expansion of the DMS Stockpile and re-positioning of the Sewage Plant, internal haul roads, closure of Z536 and a new road connecting Ngweding to D511, Diesel Generator and Tank Farm, construction of two (2) Storm Water Control Dams, Road crossings at Manyedime, Wilgespruit and Bofule Rivers, Explosive Magazine, Firebreak and additional Topsoil Stockpiles. | 8 November 2011 |
| PPM EMPr Amendment to Extend the Tuschenkomst Open Pit – November 2011 | An EMPr Amendment for the expansion of the Tuschenkomst open pit to the farms Wilgespruit 2JQ and Portion 1 of Rooderand 46JQ (onto the abandonment area located to the east of the current Tuschenkomst mining area) was compiled in November 2011 and subsequently approved by the DMRE in April 2012. This EMPr also covered the expansion of the footprint of the existing waste rock dump on the farm Tuschenkomst 136JP further to the west, the construction of a haul road network, a telecommunications tower, topsoil stockpiles, a portion of the storm water infrastructure, a storm water control dam and bridges over the Wilgespruit within the proposed project site. | 16 April 2012 |
EMPr PPM Chrome Project – July 2012 | Mining activities have not yet commenced; therefore, the commitments were not included in this report. The EMPr provides for the access and mining of chrome seams, specifically the PG2 and PG6 seems, by establishing an additional open pit, topsoil stockpiles, a waste rock dump, crushing and screening plan, a mining contractor’s camp and storm water dams within the existing mining right area on the farms, Witkleifontein 136 JP and Tuschenkomst 135 JP. Within the proposed chrome pit areas, there will be a number of separate chrome pits that will cover an area of approximately 85 ha. The crushed chrome will be sold to a third party for further processing. Concurrent rehabilitation of the open pit areas will be undertaken on the farm Witkleifontein 136 JP. The area where the Chrome Pit is located on the farm Tuschenkomst 135 JP is demarcated as a mine residue deposit for the PPM operations. Once the Pit has been backfilled, the waste rock from the platinum operation will be disposed of on top of this area. | According to PPM, the EMPr was approved – the final stamped document was received from DMRE dated October 2017. |
EMPr Amendment Amending PPM Closure Objectives – February 2012 | With the EMPr Amendment approval, the closure objectives of PPM were amended to provide for partial backfilling of the Tuschenkomst Open Pit, thereafter the flooding the Pit with the re-diversion of the Wilgespruit back into the Pit. Part of the amendment and in conjunction with the partial backfilling and flooding of the Pit, PPM also intends to divert potable water from boreholes and water from the flooded Pit to nearby communities for domestic and agricultural purposes. Although partial backfilling has commenced, the activities were done in accordance with the commitments provided for in the approved PPM EMPr Amendment to extend the Tuschenkomst Open Pit – November 2011 (approved 16 April 2012). The environmental audit on this approved EMPr is included in Part 2, No. 3 of this Report. The conceptual closure project phases as set out below will be phased in over a period of ten (10) years. Five (5) years prior to closure of the Pit, PPM needs to develop a Closure Plan for approval by DMRE. PPM has commenced with the compilation of a Conceptual Closure Plan, which will be submitted to DMRE for approval. | 16 April 2012 |
| SRK | | Report date: 27 May 2022
Effective Date: 31 December 2021 |
| | | |
| SRK Consulting – 576060 SPM PSM Project TRS | Page 190 |
| EA and EMPr Report | Purpose (as per EMPr Report) – As relevant at time of submission | Date of approval |
| EMPRs for the expansion of the processing facilities at PPM | EMPr approved for the expansion of the processing facilities at PPM in terms of GN 544 of the Environmental Impact Assessment Regulations of 18 June 2010 for the following activities: In terms of GN 544: The construction of facilities or infrastructure for the storage, or for the storage and handling, of a dangerous good, where such storage occurs in containers with a combined capacity of 80 but not exceeding 500 cubic metres. (listed activity· 13) The expansion of existing facilities for any process or activity where such expansion will result in the need for a new or amendment of, an existing permit or license in terms of national or provincial legislation governing the release of emissions or pollution, excluding where the facility, process or activity is included in the list of waste management activities published in terms of section 19 of the National Environmental Management: Waste Act, 2008 (Act No. 59 of 2008) in which case that Act will apply. (listed activity 28) In terms of GN 545: The construction of facilities or infrastructure for the storage, or for the storage and handling, of a dangerous good, where such storage occurs in containers with a combined capacity of more than 500 cubic meters (listed activity 3) The commencing of an activity, which requires an atmospheric emission license in terms of Section 21 of the National Environmental Management: Air Quality Act, 2004 (Act No. 39 of 2004), except where such commencement requires basic assessment in terms of Notice No. R544 of 2010 In terms of GN 546 The construction of facilities or infrastructure for the storage, or for the storage and handling, of a dangerous good, where such storage occurs in containers with a combined capacity of 30 but not exceeding 80 cubic metres. Outside urban areas i.e. areas within 10 kilometres from national parks or world heritage sites or 5 kilometres from any other protected area identified in terms of NEMPAA or from the core area of a biosphere reserve. [listed activity 10(i)(gg). | 21 July 2020 |
Table 16.2: All approved EMPrs and subsequent amendments for SPM
| EA and EMPr Report | Purpose (as per EMPr Report) – As relevant at time of submission | Date of approval |
Sedibelo Platinum Project EMPr – October 2007 | Pre-construction and construction phase: The following activities commenced, but mining activities temporarily ceased in 2014 – Fence around Sedibelo mining area 1.1 ML Concrete Reservoir Clearance of Topsoil Stockpile Area Clearance and widening of current access road for the main haul road Eskom Power Substation Open Pit area and removal of topsoil to some extent Clearance of area for Waste Rock disposal | 20 June 2008 |
| Sedibelo Amended EMPr – Changes to Surface Infrastructure at Sedibelo Platinum Mine – April 2015 | Changes to infrastructure at Sedibelo Mine which include – Enlarging of the Open Pit; re-positioning / redesigning of approved Surface Infrastructure; re-positioning of the Concentrator Plant and Shafts; and the re-design of the TSF and WRD to cater for additional mineralized waste; proposed additional surface infrastructure: including a Shaft Complex, WRD’s, Ventilation Shafts, Storm Water Management infrastructure including Storm Water Dams, Channels and Berms, Sewage Pump Stations, a Helipad and a Telecommunications Mast; increase in capacity of the approved Sewage Treatment Plant; and the exclusion of a portion of the IBMR mining right area (referred to as the “Mineral Rights Abandonment Area”). | Not yet approved by DMRE |
| 16.6.2 | Existing Water Use Licences |
PPM was issued with a WUL on 14 October 2020 (WUL No. 03/A24D/ACGU/2037 and File No. 16/2/7/A240/C161) (which supersedes the previous WUL under the same name issued in 2013).
| SRK | | Report date: 27 May 2022
Effective Date: 31 December 2021 |
| | | |
| SRK Consulting – 576060 SPM PSM Project TRS | Page 191 |
IBMR (SPM), under PPM operations, was issued a WUL (WUL No 03/A24D/ABCGIJ/2615 and File No. 27/2/2/A424/4/1) on 16 August 2015 for the Sedibelo Project by the DWA (now the Department of Water and Sanitation (DWS[1]) in terms of the NWA.
| 16.6.3 | Existing Waste Management Licences |
Existing authorizations related to waste include the Waste Management Licence, WML 12/96/11/L750/7 dated 14 February 2017 issued to PPM. The application process commenced in 2011 and was approved prior to the legal obligation date to obtain a WML for mine residue deposits and stockpiles, (24 July 2015) and authorizes the “extension of the Tuschenkomst Open Pit and Tuschenkomst Waste Rock Dump, establishment of 3 further Waste Rock Dumps and TSF on the farm Wilgespruit 2JQ, Tuschenkomst 135JP and portions 1 and 2 of the Farm Rooderand 46JQ”.
PPM was issued with an AEL on 1 August 2021 (BPDM/PAEL/4.17/July 2021) in terms of Section 40(1)(a) read with Section 42 of the National Environmental Management: Air Quality act 2004 (Act 39 of 2004) in respect of Listed Activities sub-category 4.17.
| 16.6.4 | Social and Labour Plan |
SPM indicated that the SLP for the 2015-2019 period aligned with the relevant district and local municipalities' respective industrial development plan (IDP) and SLP priority areas and strategic objectives, the BBKT Master Plan and the general community needs identified by SPM. SPM submitted its SLP close-out report for the period from 1 January 2015 to the 31 December 2019 to the DMRE in December 2020 and is doing revisions on its submitted 2020-2024 SLP in collaboration with the DMRE.
The SLP close-out report showed that whilst SPM overspent on Local Economic Development (LED) programmes (spent ZAR77.2m vs a budget of ZAR29.3m), the Company slightly underspent on HRD (retrenchment process in 2017). The priority areas in the LED section of the 2015-2019 SLP were education, health, enterprise development, poverty alleviation/food security, social and community development and infrastructure. Specific projects included:
| · | Enterprise incubator for entrepreneurial training with 186 beneficiaries which included support with registration on the PPM supplier database and general enterprise development support; |
| · | Motlhabe and Legkraal internal road construction and paving making use of local suppliers; |
| · | Thuso Ya Batho Moringa tree nursery for local job creation; |
| · | Establishment of a farmer support centre to support farmers affected by resettlement and other small-scale farmers; |
| · | Crusher plant establishment with a local business ownership; and |
| · | Hydroponic garden establishment with local ownership. |
Some of the mine’s targets in the 2015-2019 SLP were not met and are being carried over to the 2020-2024 SLP. These include the establishment of a feedlot and construction of local water infrastructure for communities. These projects require collaboration between several stakeholder groups and are described as long-lead items in the SLP close-out report.
In its 2020-2024 SLP which includes the East Pit and Central/East Underground Blocks, SPM commits to spend a total of ZAR66.3m on LED projects in the following broad categories – infrastructure, agriculture, education and social entrepreneurial business development. In addition, the mine commits a total of ZAR135.5m to HRD including provision for employee career development and community skills development. This indicates a significant ramp-up in skills development over the next five years which compliments the mine’s expansion plans.
In addition to commitments made in the PPM 2020-2024 SLP, the settlement reached with the LLC in June 2020 also includes the establishment of a Community Development Trust for LLC to which PPM will contribute ZAR15m. A total of 50% of employment opportunities will be reserved for Lesethleng community members and a procurement entity will be established through which 60% of preferential procurement opportunities will be directed to Lesethleng. In addition, ZAR9m of the 2020-2024 SLP provision will be reserved for development projects in the communities affected by mining on Wilgespruit and 50% of bursaries, internships and learnerships will be reserved for Lesethleng community. In 2021, the DMRE requested further information for the PPM SLP which PPM is in the process of compiling for submission.
1 DWS now falls under the ministry of the Department of Human Settlements, Water and Sanitation but is operating under DWS until further notice.
| SRK | | Report date: 27 May 2022
Effective Date: 31 December 2021 |
| | | |
| SRK Consulting – 576060 SPM PSM Project TRS | Page 192 |
| 16.7 | Agreements with local communities |
[§229.601(b)(96)(iii)(B)(17)(iv), SR5.6(ix)]
Formal access rights have been secured by SPM for access to the following:
| · | A portion of Portion 1 of the farm Rooderand 46 JQ – owned by Republic of Bophuthatswana (Republic of South Africa); |
| · | A portion of the farm Legkraal 45 JQ – owned by Bakgatla Bakgafela Communal Property Association; and |
| · | A portion of the farm Koedoesfontein 42 JQ – owned by 1/6th Tchinangoe Pilane, 1/6th Tilimane Samuel Pilane, 1/6th Noel Pilane and 1/2 Bakgatla Tribe. |
These agreements comprise:
| · | A notarial deed of lease entered into between IBMR, the Bakgatla and the Minister of Rural Development and Land Reform on 17 April 2012; |
| · | A sub-lease agreement (the Sedibelo West lease agreement) entered into between IBMR, PPM and Sedibelo on or about 24 April 2012, in terms of which IBMR sub-leases certain of the properties to PPM; and |
| · | A settlement agreement between PPM, IBMR and the LLC pursuant to which the LLC agreed to grant IBMR and PPM full and unhindered access to the farm Wilgespruit. |
| 16.8 | Mine closure plans and associated costs |
[§229.601(b)(96)(iii)(B)(17)(v)] [SR1.7(i), SR5.2(ii), SR5.6(ix)]
Up until November 2015, the determination of the expected closure liability and the provisioning of funds for closure was regulated by the MPRDA. On the 20th November 2015, regulations under NEMA (Financial Provision Regulations – GN1147) were promulgated and replaced certain sections of the MPRDA. The intent of the GN1147 was to require mining operations to undertake focussed closure planning and then actively implement rehabilitation measures during operations to reduce the liability at the end of the life of the mine. When GN1147 was promulgated, compliance with GN1147 was required by February 2017. However, as there are several technical issues with the regulations, various amendments to the regulations have been promulgated, extending the transitional arrangements to June 2022. The intent of the legislation is to improve the accuracy of calculations of Financial Assurance liability so that provisions raised against the calculation provide sufficient finances to the authorities in the event of unplanned closure.
As the regulations are still in a transition phase, closure liability estimates are currently regulated by the requirements of the MPRDA and its regulations. This regulation requires that operations undertake annual assessments of closure liability and make provision for the liability based on the assessment of the premature closure liability.
The approach followed by SPM is to use the DMRE Guideline Document for the Evaluation of the Quantum of Closure- Related Financial Provision Provided by a Mine (2005), where the immediate closure liability for the operations is determined, with only the infrastructure/disturbance in existence on the day of assessment included in the liability. The current liability at December 2021 has been assessed as ZAR397m for PPM and ZAR25m for Sedibelo (Wilgespruit) and Magazynskraal.
At the Effective Date of this TRS, there is a ZAR700m full guarantee facility with Lombard Insurance of which ZAR582m has been utilised to cover the expected closure liabilities of all of SPM’s projects (all mining and prospecting rights) (Table 16.3), including those of the P-S-M Project.
| SRK | | Report date: 27 May 2022
Effective Date: 31 December 2021 |
| | | |
| SRK Consulting – 576060 SPM PSM Project TRS | Page 193 |
Table 16.3: SPM – Environmental Liabilities and Provisions
| Description | Value (ZARm) |
| Liability | |
| West Pit (PPM) – MR320 | 397 |
| East Pit, Central and East Underground Blocks – MR333 | 25 |
| Total | 422 |
| Provisions | |
| Full Insurance Guarantee Facility | 700 |
| Amount of Guarantee Facility utilised for PSM Project | 466 |
| Amount of Guarantee Facility utilised for other SPM commitments | 116 |
| Balance of facility available for use | 118 |
The items that SRK believes are either not included in the liability assessed using the DMRE methodology or are underestimated by the approach, are discussed below:
| • | Approval has been obtained to partially backfill the West Pit and remove the diversion of the Wilgespruit to reroute the flow through the remaining void in the pit. This is a deviation from the original plan where full backfill of the pit was required. The operation does not view the partial backfilling of the pit as a closure liability, rather this is seen as an operational cost. Although a provision is included in the liability assessment for the area still requiring backfill, it is SRK’s opinion that this is a misapplication of the DMRE methodology as the rate only allows for “making safe” and does not include backfilling costs. Should the mine face imminent unplanned closure, SRK considers that the backfilling liability would remain irrespective whether backfilling sterilises resources or not; |
| • | Monitoring indicates that groundwater quality at the mine has been affected, as was anticipated by the water studies. No provision is made to address the contaminated groundwater and achieve water quality objectives that are likely to be required for closure. Insufficient work has been undertaken to determine what is required but SRK is of the opinion that water quality management could add in excess of ZAR100m to the liability; |
| • | In the original EMP, financial provisioning for project activities on the farm Wilgespruit (namely the East Portal and East Open Pit) formed part of the Sedibelo mining right application in 2008 and subsequent amendment in 2015. The current liability reported for Sedibelo does not include any of the future infrastructure, particularly the East Pit and associated waste rock dumps, nor the surface infrastructure. In terms of the DMRE requirements, this liability will only be included in the assessment and provisions required, once the disturbance has taken place; |
| • | Closure measures on mine residues may not meet authorities requirements and complex engineered covers may be required; and |
| • | Currently there is no mine closure and rehabilitation plan to support the closure estimates. SRK recognizes that because the DMRE methodology is prescriptive, there is limited scope to apply nuanced closure criteria irrespective of whether the closure criteria are included in a standalone closure plan or even those contained as closure obligations in authorization documents. |
SRK is of the view that the operation currently meets the legal obligations relating to making provision for immediate closure. Once Regulation GN1147 is finalised and comes into effect, there will be a requirement to revisit the methodology of determining liability and to account for liability that currently is viewed as operational costs. The effect of this is that the liability against which the operation has to make provision will be materially higher than currently reported to the DMRE. While the current operation is slightly underfunded through provisions in insurance guarantees, there is the potential that when the new regulations take effect additional provisions will be required.
SPM has made provision in its BP2021 for closure liability expenditures of ZAR1 385m over the LoM which includes rehabilitation on closure plus post-closure monitoring cost provisions, although there is no supporting estimate of how this quantum was derived for the LoM cost. Furthermore, as previously stated a closure plan has not yet been developed for the operation with it being SRK’s understanding that the figure of ZAR1 385m is based on SPM’s interpretation of the closure obligations that arise from authorization documentation.
| SRK | | Report date: 27 May 2022
Effective Date: 31 December 2021 |
| | | |
| SRK Consulting – 576060 SPM PSM Project TRS | Page 194 |
| 16.9 | Adequacy of plans to address compliance and permitting |
[§229.601(b)(96)(iii)(B)(17)(vi)] [SR1.5(ii)(iii)(v), SR4.3(iv)(v), SR5.5(ii), SR5.6(ix)]
The following potential material environmental risks have been identified for the P-S-M Project:
| • | Surface water quality in general is regarded as a low risk but subject to uncertainty in some cases. This may extend to a requirement for post-closure water treatment. Surface water risks include: |
| o | The nature of the tailings slurry is such that the solids do not settle out during its residence time on the operational pool of the TSF (especially when the plant is processing DMS floats). This presents a water management risk for the following two reasons (followed by the mitigation strategy): |
| § | If the solids are colloidal, it is possible that the water becomes increasingly concentrated with solids as it gets recycled, and when it does precipitate, it can lead to processing issues and/or blockages; |
| § | High solids in the RWD lead to excessive siltation, and therefore lower recovery of return water to the plant, which leads to a low water recycling ratio, which in turn presents a risk of discharge of contaminated water into the environment; |
| § | Mitigation: SPM has embarked on a process water clarification optimization project in order to minimise the suspended/colloidal solids in the process water; and has earmarked significant capital expenditure for this project. This intervention is deemed to be adequate as a mitigation strategy, however, its effectiveness can only be assessed on completion of the project; |
| o | SPM is non-compliant with GNR704 with a number of facilities, which may pose reputational, contamination, and legal risks; |
| o | Management of water within the pit, until new mining areas are developed, is a risk. An excess water management strategy, to manage this risk, is currently being developed; |
| • | No major surface water issues are anticipated for the P-S-M Project. All potential surface water impacts will be mitigated if the design of the FS-level SWMP is implemented; |
| • | Dust nuisance could pose an issue and if this is not actively managed by the mine, it can result in complaints from nearby communities and other sensitive receptors; |
| • | It is intended that the South Dam will provide water for communities and wildlife in the proposed Heritage Corridor Park. The groundwater study indicates that this will be feasible in terms of water quality, but the biodiversity specialist study recommends that if the flooding option is undertaken, the stated mitigation measures must be implemented. This must be seen against the background of sensitivity regarding mining in relation to the Heritage Park Corridor, noting that an appeal has been lodged regarding this already. Approval by the DMRE does not preclude the need for approvals by other departments, notably DWS( now DHSWS) and the environmental authorities; |
| • | The partial flooding of the West Pit on Tuschenkomst farm is a rehabilitation condition of the approved EMP, even though it has biodiversity impacts and may not be economically desirable unless the mitigating measures are implemented, as noted in the hydrology specialist study for the project; |
| • | From a biodiversity perspective, the specialist study appended to the EMP amendment, recommends that the proposed re-diversion of the Wilgespruit does not take place. The study recommends further studies in this regard, including a reserve determination of the Beerspruit catchment, which includes the Wilgespruit; |
| • | Further work is required to understand impacts on the biodiversity which is potentially significant in the light of the proposed Heritage Park Corridor. PPM has updated the BAP to mitigate biophysical impacts on the surrounding areas; and |
| • | The closure cost excludes provision for post-closure water treatment on the assumption that mitigation measures put in place will be adequate. While mitigation in the operational phase could take the form of ensuring that all standard measures are taken to prevent water quality deterioration, water treatment, if it is required, would involve either passive or active systems. In the event that active treatment is required this could represent a material liability but this is considered a low risk. Modelling undertaken indicates that decant of water from the pit in the post-closure scenario is unlikely and that any contaminated plume from the tailings dam and WRD will flow beneath the Wilgespruit, making it unlikely to decant. Despite its low probability of occurrence, the risk associated with ground water is mentioned under this heading in the light of the environmental significance should it occur. |
| SRK | | Report date: 27 May 2022
Effective Date: 31 December 2021 |
| | | |
| SRK Consulting – 576060 SPM PSM Project TRS | Page 195 |
The potential significance of all these risks is exacerbated by the environmental sensitivity in the area in general. The results of the 2021 compliance audit were not available at the time of compiling this report. The 2020 draft report is pending finalization due to the recently external audited amended WUL for PPM that is still under review.
From the information reviewed, several environmental issues related to the P-S-M Project have been identified. These are generally well-understood and hence can be managed. Some general considerations are:
| • | The need for appropriate selection of future tailings disposal facilities, taking water crossings for pipelines and/ or conveyor belts into consideration; |
| • | The RWD was significantly silted up. In addition to this, it was observed that the decant from the tailings dam was milky as it contains ultra-fines and is indicative of tailings still being present in the decant. The mine is currently in ‘abnormal’ operational conditions with the filling of the western and eastern paddock as there is not enough storage space in these compartments to ensure complete settlement of solids before water is decanted; |
| • | The pump station associated with the tailings dam was flooded and there is a risk that tails are being discharged to the natural environment. It was evident that one of the pumps was not operating efficiently as it was vibrating and emitting significant noise; |
| • | Security at South Dam remains a challenge due to the continuous theft of fences, which makes the erection of proper notice boards in official languages used in the area, of utmost importance. Weekly inspections of safety boards are conducted and replaced as required; |
| • | While backfilling has been addressed in the mine closure cost estimate using anticipated volumes of overburden to be removed, the estimate depends on ongoing backfilling taking place within operational budgets and the closure cost estimate excludes this operational liability (Section 16.8). Operations will have to be monitored to ensure that the benefits of this approach are realised; |
| • | There are some sensitivities in relation to ecological issues (Bullfrog pan). There is a “bullfrog buffer zone in the Motlabe River”. SPM does not monitor the bullfrogs on an annual basis as it is challenging. SPM has only undertaken one assessment. An ecologist undertook an assessment in February 2020. SPM should contact the DMRE and apply to amend this condition as well as other commitments in the EMP, specifically the Sedibelo EMP, since no activity is taking place in these areas; |
| • | Complaints have been received about the impact of air quality on cattle on adjacent properties as well as from the Black Rhino Lodge about the impact of trucks. SPM participates in environmental forums that include game farm owners in the area, which are held every second month; and |
| • | Capacity for tailings disposal is a concern. Expansion of the current facility westwards (downstream development) is likely to be constrained by objections from the nearby Motlabi community. |
The 2020 FS concluded that there are no residual risks after abatement. From the literature reviewed, SRK concurs with this view, subject to the notes made on potentially material risks above. This is, however, subject to the fact that there will be impacts typical of those associated with any mining operation, which can be managed using standard and proven mitigation measures. It is also noted that, as a new project, the time available during the LoM leaves the mine well placed to address liabilities as they arise.
The 2020 FS makes mention of the fact that the mine is being designed for zero discharge, but it is acknowledged that this may not be possible during the operational phase. It is SRK’s view that while this issue needs to be addressed, adequate engineering design can ensure that it does not result in a significant liability. Similarly, river crossings for roads and pipelines need to be adequately designed. This is significant as the Wilgespruit will have to be crossed.
It is proposed that some waste rock will be dumped in the pit and further that it will be used for rockwall construction for the TSF. As noted above, failure to ensure that adequate implementation of rehabilitation planning with respect to backfilling could result in an increased closure liability. This situation needs to be managed.
The project team has liaised with the authorities responsible for the Heritage Park Conservation area, and the required measures are that the mining area be fenced off for the operational phase but that the fences be removed on closure. The closure cost estimate provides for this and it is concluded that, despite the sensitivity associated with the heritage corridor, this issue is manageable although this situation could change as the Heritage Park proposal becomes more formalized. Heritage sites have been identified in the area and there is a provision in the EMP for any new sites to be reported. This may constrain the development of the TSF.
| SRK | | Report date: 27 May 2022
Effective Date: 31 December 2021 |
| | | |
| SRK Consulting – 576060 SPM PSM Project TRS | Page 196 |
| 16.9.1 | Improvements on other Environmental Issues |
Since the previous visit by SRK in 2020, the following improvements have been made:
| • | There has been some improvement in the general housekeeping within the plant area; however, this is still an issue requiring attention; |
| • | A Topsoil Management Plan for separate storage of topsoil, saprolite and waste rock at the new West Pit extension was developed and is adhered to on site. Berms have been constructed around the topsoil and saprolite areas and the slope angles are managed well. The historic mixed mine residue and topsoil dumps still pose a risk to the permeability of the pit to be flooded in future; |
| • | Waste management has improved onsite: |
| o | There are waste management procedures and plan. Additionally, there is a designated waste area with colour coded bins to separate the various waste material. Waste separation is undertaken at the source; |
| o | Recycling occurs off site; |
| o | PPM has set waste targets to reduce and minimise waste onsite; and |
| o | Quarterly internal waste audits are regularly undertaken by mine personnel, and annual external waste audits are conducted by an external consultant; |
| • | Archaeological assessments undertaken in 2012 and 2014 were submitted to SAHRA. SPM still needs to develop and implement a Cultural Heritage Management Plan based on the research findings at the site of MA14, a Late Iron Age site on the farm Tuschenkomst 135JP, collected during 2015 to 2018; |
| • | SPM undertakes bio-monitoring of alien invasive species according to a BAP. The BAP was recently updated; |
| • | Air Quality Impact Assessments were conducted in 2013 for Magazynskraal/Sedibelo as well as for the West Pit Expansion Project in 2014. An Air Quality Management Plan was then developed in 2016 to manage the impacts of the mining activities on air quality. Additional GHG Emission assessment was done in February 2019 for the proposed plant expansion and tailings reprocessing project. SPM plans to review and revise the Air Quality Management and reporting in 2022 by taking into consideration the recommended GHG Management Plan, updated National Greenhouse Gas Emission Reporting Regulations of 2017 and promulgated Carbon Tax, 2019; and |
| • | SPM plans to include the Kell hydrometallurgical process as a replacement for the smelting and refining of PGM concentrates. The amendment application was submitted to the Department: Economic Development, Environment, Conservation and Tourism (DEDECT) in February 2020 and April 2020. The EA under Section 24 of NEMA for the listed activities associated with the Kell process plant expansion project was granted in July 2020. The AEL for the plant was awarded in August 2021; |
| • | SPM has developed a web-based compliance management system to improve and ensure management of regulatory compliance, legal requirements, registers, appropriate actions and documents which are maintained and readily accessible. The system allows for the inclusion of the legal non-conformances on the system, with action plans, due dates and responsible person allocation. According to the SPM, the non-conformances recorded during the previous audit are reviewed and closed. If any have not been addressed in full, they are kept open and transferred to the new legal compliance action management system; and |
| • | Environmental compliance onsite has improved. The following compliance audits are undertaken: |
| o | Internal weekly environmental inspection; |
| o | Monthly Safety, Health, Environment and Quality (SHEQ) monitoring; |
| o | External environmental monitoring (linked to authorizations). Environment is annually and safety is every two years; |
| o | Every second year a performance assessment is done by external party; and |
| o | External audits by DMRE. |
It is noted that the fragmented nature of the infrastructure for the P-S-M Project is an intentional design as PPM chose sites that minimise the environmental impact on sensitive areas.
| SRK | | Report date: 27 May 2022
Effective Date: 31 December 2021 |
| | | |
| SRK Consulting – 576060 SPM PSM Project TRS | Page 197 |
[SR4.3(v), SR4.5(iii), SR5.5(iv)(v), SR5.6(ix)]
As a result of proximity of mining activity and established semi-urban areas and villages, the range of social issues to be addressed is more extensive than would be the case at a more remote mining site. To retain the necessary social licence to operate, SPM must address challenges and risks on an ongoing basis throughout the LoM, as follows:
| • | Community expectations, commitments and social license to operate |
Within the context of many tribal authorities on the Western Limb not seeing tangible benefits at the ground level, together with the poor local government service and delivery and reductions in employment levels in the mining industry, SPM like others in the mining sector is subject to high levels of stakeholder expectations and activism. While this is not directly within SPM’s control, it may have knock-on effects on its relationships with its own stakeholders if SPM is not seen to be transparent in its communications with stakeholders and proactive in delivering on SLP commitments.
SPM continues to contribute to the improvement of the surrounding areas through its SLP commitments and indicated that it will continue to do so in partnership with the BBKT, despite the challenging economic conditions. Development priorities in the area include education, health, agriculture, community infrastructure, social and cultural development, as well as enterprise development. The greatest challenge facing SPM in the next cycle of SLP implementation is to ramp-up its implementation capacity to deliver both on the 2020-2024 SLP commitments and the additional commitments to the Lesethleng communities.
| • | Variety of local governance structures and legitimacy |
Key local structures include the Bojanala District Municipality, the Moses Kotane and Rustenburg Local Municipalities and the BBKT. Internal tensions within the BBKT indicate there are ongoing struggles for legitimacy of leadership. Against this background, the mine will have to commit resources to securing and maintaining relationships with all three local governance structures as well as other structures that may believe they are not represented. Local government is a key partner for all the operations. It is often the case that local municipalities, especially in the rural areas are under resourced and poorly managed.
Over the years SPM has established and built good relations with the Bojanala District Municipality, the Moses Kotane and Rustenburg Local Municipalities and the BBKT. This is currently evident in the various collaborative initiatives and partnering on LED to meet the strategic objectives of the IDP and BBKT Master Plan.
The Corporate Affairs and Human Capital Executive cites the ongoing leadership struggles within the BBKT as a key social risk, which is beyond their control and impacts on the relationships between SPM and its communities. One of the challenges facing SPM is to appoint neutral stakeholder engagement employees on both management and junior level. The current team consists of three farmer extension officers who also serve as community relations officers. Plans to recruit a Social Performance Manager and three community liaison officers are underway and will relieve the pressure on the current team. In the long run, the SPM team might have to consider appointing a SLP/social commitment project manager to manage and track performance against social commitments. SRK understands that a Social Performance Manager has been appointed and will start on 1 March 2022.
| • | Resettlement and compensation associated with East Pit and East Portal |
In 2012, SPM acquired mining rights over the farm Wilgespruit, on which it leased the surface rights from the BBKT and assumed that the BBKT would be responsible for identifying and allocating new land to the affected farmers and land users. However, the land ownership was contested by the Lesethleng community, represented by the LLC. The LLC has since been engaged in a longstanding dispute and many court battles with SPM.
This, combined with the ongoing community leadership dynamics and internal conflict and refusal of some of the affected land users to participate in the initial consultations, has resulted in significant delays to the full implementation of the 2016 Resettlement Action Plan (RAP), as well as access to SPM for development of the East Pit and East Portal area on Wilgespruit. In accordance with the RAP, 28 households were successfully relocated to Syferkuil and Wachteenbeetjeslaagte.
A Constitutional Court judgement in October 2018 found that the consultation by SPM and the traditional leadership prior to attempted relocation and eviction orders, was inadequate. The remaining 19 families had organised themselves into 13 clans, jointly represented by the LLC and Lawyers for Human Rights. Discussions and negotiations including the identification of alternative areas for relocation of the clans culminated in the signing of a Settlement Agreement on 8 June 2020, granting access rights to SPM to the mining right area.
| SRK | | Report date: 27 May 2022
Effective Date: 31 December 2021 |
| | | |
| SRK Consulting – 576060 SPM PSM Project TRS | Page 198 |
Following the Settlement Agreement, 37 legal land occupiers of the farm Wilgespruit agreed to relocate to an interim relocation area on the same farm, not immediately affected by the mining activities. A baseline assessment was undertaken in November 2020 from which a Field Work Report and asset register was developed. In addition, a Draft Relocation Agreement aligned with the requirements of the IFC PS and DMRE Mine Community Resettlement Guidelines (December 2019) was developed in partnership with legal representation of the various clans and signed on 20 June 2020. A draft Terms of Reference (ToR) for the Wilgespruit Resettlement Monitoring and Evaluation Committee (RMEC) was also developed in accordance with the DMRE Mine Community Resettlement Guidelines requirements. The ToR cites the responsibilities and membership of the RMEC as well as SPM’s commitment to funding the financial and resourcing requirements of the Committee.
The 13 Clans were responsible for ensuring that the current occupiers, specifically those occupying the area of Wilgespruit required for mining operations would vacate the Mining Area and relocate their farming activities to the part of Wilgespruit not immediately required for mining operations, pending the acquisition of the alternative farming land provided for in the Settlement Agreement.
At the Effective Date of this TRS, a single family of farmer occupants still needs to sign the relocation agreement and discussions with the family are ongoing. SRK understands that relocation of this family will occur in the near future.
| • | Stakeholder engagement and capacity |
A draft Stakeholder Engagement Strategy was developed in October 2020 to understand the status of the stakeholder engagement function, identify gaps and the required actions to achieve a holistic and integrated approach to engaging all relevant stakeholder groups within its immediate area of influence.
The assessment noted that the stakeholder engagement administration system, folders and documents need to be structured and compiled in line with standard stakeholder engagement frameworks. In addition, the SPM Stakeholder Engagement function is currently inadequately resourced, with vacancies for a Social Performance Manager and three community liaison officers. A Social Performance Manager has since been appointed and will start on 1 March 2022. It is understood that the new Stakeholder Engagement organogram has been approved and the vacant positions will be filled during 2022.
A stakeholder needs analysis was also completed to inform the development of a Stakeholder Engagement Plan (SEP) with an understanding of stakeholders’ underlying motivations and the root causes of stakeholder concerns or aspirations. It is understood that refinement of the Stakeholder Engagement Strategy guiding the development of SPM’s stakeholder engagement frameworks, tools and templates as well as the development of the SEP is underway.
SPM has made great strides in building a trust relationship with the various stakeholder groups within its zone of influence. This social licence to operate needs careful management to maintain it in the presence of challenges, such as:
| o | Having 32 communities in their zone of influence; with over 700 000 individual stakeholders; |
| o | Even though most of these communities acknowledge the authority of the local Bakgatla chief, several sub-groupings pledge allegiance to the Bakgatla King residing in Botswana. These internal power dynamics should be monitored carefully by SPM; |
| o | Fairly distributing mine related opportunities amongst all affected communities especially in light of the additional benefits to the Lesethleng community as part of the Settlement Agreement; |
| o | Capacitating members of the stakeholder engagement function on the legacy issues and history associated with stakeholder relations at SPM; and |
| o | Future relocation could attract potential community unrest and legal proceedings in light of the precedent that has been set by the Lesethleng community. |
| SRK | | Report date: 27 May 2022
Effective Date: 31 December 2021 |
| | | |
| SRK Consulting – 576060 SPM PSM Project TRS | Page 199 |
SPM’s approach and procedure to internal grievance management appears to be well coordinated and managed, with no open employee grievances at the time of the site visit. There is an undocumented grievance procedure in place to register grievances from external stakeholders. The grievance register contains a record from 2009 to date and indicates that community members lodged grievances regarding a variety of issues such as vibration due to blasting, procurement queries and loss of access to land. All of the grievances related to the resettlement involving the Lesethleng community have been closed out. Pending grievances include complaints that necessitated independent investigations into water quality, the impact of vibrations due to blasting on housing structures and groundwater levels. SRK understands that the grievances were investigated, with respective reports shared and discussed with complainants. The complainants did not accept the outcome. SPM will explore additional processes to resolve the unaccepted outcomes.
| 16.10 | Commitments for local procurement and hiring |
[§229.601(b)(96)(iii)(B)(17)(vii)] [SR5.6(ix)]
SPM has a Preferential Procurement Policy in place to maximize opportunities for HDSAs to supply goods and services to the mine. SPM is committed to meeting the procurement targets as set out by the Mining Charter Scorecard: i.e., 70% procurement of South African manufactured mining goods (capital and consumables combined, 80% of services to be sourced from South African based companies, research and development (70%) and sample analysis (100%).
To this end, SPM has committed to the preferential procurement targets set out in Table 16.4 which also presents the actual percentage and procurement spend for the period January to December 2020.
Table 16.4: Preferential Procurement at SPM for the period Jan’20 to Dec’20
| Element | Target Group | Target (%) | Actual Score (%) | Procurement Value (ZARm) |
| Percentage of Mining goods procurement to be on South African manufactured goods (Capital and Consumables combined). | HDP | 21 | 28.44 | 101.9 |
| Women Owned/ Youth Owned | 5 | 2.17 | 7.8 |
| BEE | 44 | 69.39 | 248.6 |
| Percentage of Services to be sourced from a South African Based Company | HDP | 21 | 34.74 | 518.0 |
| Women Owned | 15 | 8.16 | 121.7 |
| Youth Owned | 5 | 0.14 | 2.2 |
| BEE | 10 | 56.9 | 849.0 |
| Research and development | Research and Dev budget to be spend on SA based entities | 70 | 100 | 0.9 |
| Sample | SA based companies to be used for mineral samples across the value chain | 100 | 100 | 5.0 |
| Total | | | | 1 855.1 |
SPM reports good progress in achieving procurement targets especially against the categories of mining goods and consumables. Although the achievement of preferential procurement against services fluctuates over the five-year period, the mine endeavours to procure its goods and services from HDSA companies especially those that are situated locally and within surrounding areas.
SPM has a strong focus on local recruitment as a mechanism to decrease the negative impact it may have on the local community. The target is to employ 30% of its workforce from the local community, 25% from the District Municipality and a further 25% of its workforce from the North West Province. Entry level positions will be filled from the local community with only positions that cannot be filled locally, advertised and filled from outside the local community. Highly skilled labour will be sought from other areas within South Africa, if not available in the local community. SPM’s skills development programmes have been aligned to enable unskilled employees (especially from the local communities) to gain access to skills and career development opportunities offered by the SPM.
The international investment landscape is increasingly aware of ESG matters (Freele, 2021). The shift from ESG as a corporate priority to investor priority highlights the importance of ensuring that corporate ESG reporting is a true reflection of what happens at site level. The ability of stakeholders in remote areas to distribute photos and video material in real time is enabling NGOs to flag alleged violations faster than before. Unchecked allegations could have far reaching effects for companies’ reputations regarding social and environmental performance.
When an event and/or decision triggers reputational damage, the biggest impact occurs on revenue, brand value and regulatory investigations (Deloitte, 2015). When a company’s performance falls short of the expectations of stakeholders, reputational damage ensues. Approximately 33% of mining executives who have experienced a reputational damage event, report a decline in stock exchange value as well as regulatory investigations, whereas 50% report a direct impact on revenue (Deloitte, 2015).
| SRK | | Report date: 27 May 2022
Effective Date: 31 December 2021 |
| | | |
| SRK Consulting – 576060 SPM PSM Project TRS | Page 200 |
An ESG assessment was performed to indicate SPM’s relative performance on ESG matters and public reporting.
| 16.11.1 | Sustainability and ESG Framework |
The sustainability of the Company was reviewed according to the six-capital model of sustainable development (IIRF, 2013) and assesses SPM’s performance according to established ESG good practice criteria whilst keeping the operation size, baseline data and funding model in mind. The IIRF six-capital model recognises that in order to be sustainable and create present and future value, each of the foundational capitals must be considered and be in balance throughout the life of the operation (Figure 16.1).
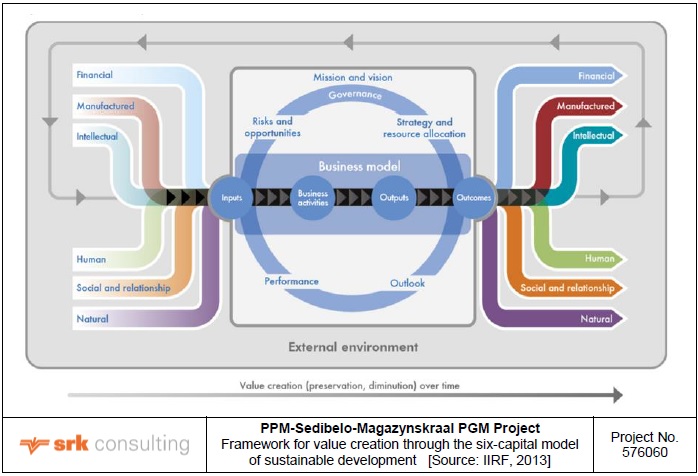
Figure 16.1: Framework for value creation through the six-capital model of sustainable development
The six foundational capitals and a short definition of each are provided below:
| • | Financial capital – refers to the pool of funds available to an organization either through making profits or through debt financing, equity, grants or investments; |
| • | Manufactured capital – refers to the physical assets that are available to an organisation for conducting business. These include both physical objects like buildings and equipment and infrastructure such as roads, ports, bridges, water services and electricity; |
| • | Intellectual capital – refers to knowledge-based intangibles such as intellectual property and organizational capital imbedded in systems, procedures and protocols; |
| • | Human capital – refers to people’s competencies, capabilities and experience and the organisation’s ability to create a healthy, safe and growth-oriented work environment; |
| • | Social and relational capital – refers to organizations’ focus on building strong relationships with various stakeholder groups to obtain and maintain social licence to operate as well as to create shared value with host communities; and |
| • | Natural capital refers to all renewable and non-renewable environmental resources that supports the current and future viability of operations. These include air, water, land, minerals, biodiversity. |
| SRK | | Report date: 27 May 2022
Effective Date: 31 December 2021 |
| | | |
| SRK Consulting – 576060 SPM PSM Project TRS | Page 201 |
Within this broad framework of sustainable development and based on the SAMESG Guidelines (2017), a review of the sustainability of the Company was done within three areas:
| • | External factors impacting sustainability (socio-political); |
| • | Sustainability reporting practices; and |
| • | Internal factors impacting sustainability (according to the six-capital model). |
The sources of information used to compile this section include:
| • | Information provided by SPM regarding overarching sustainability matters; |
| • | Information gathered from social media (regarding stakeholder sentiment), reputable news agencies and analyst reviews; and |
| • | The results reported in each of the sections in this report. |
In addition to the documentation review, SRK interviewed SPM’s Chief Operating Officer and PPM’s Executive Corporate Affairs and Human Capital.
| 16.11.2 | External factors potentially impacting platinum mining sustainability |
Several external factors could potentially impact the sustainability of PGM mining in South Africa. These range from macro-economic, global factors to pressure from labour unions to keep unskilled workers employed in the sector. A short description of some of these factors are provided below:
| • | COVID-19 and global macro-economic environment |
The global COVID-19 pandemic and the resulting macro- and micro economic volatility across markets influence both the current demand for PGMs and the market price for PGMs. The economic fallout associated with the pandemic brought the stark reality of the vulnerability of the unskilled and semiskilled workers at platinum mines in South Africa to the fore, as retrenchments affected this group across the board.
| • | Platinum’s status as a ‘green metal’ |
Platinum is part of a group of metals referred to as ’green metals’ which describes metals needed to achieve the transition away from fossil fuels to a renewable energy. Specifically, Pt is used as the key catalytic materials in hydrogen fuel cells supporting the transformation of the mobility and energy sectors to help reduce carbon emissions.
| • | Social and labour legacy issues in the platinum industry in South Africa |
Historically, the South African mining industry has been characterized by labour unrest and community volatility. These destabilizing factors are compounded in the current South African context with pre-existing legacy challenges in the platinum industry and the economic consequences of the global COVID-19 pandemic. The top two risks for the mining industry in 2021 are social licence to operate and the future of the workforce, with reducing carbon footprint entering the top ten risks at number four. This analysis indicates that mines whose social license to operate and workforce is threatened and who are unable to reduce their carbon footprint are at increased risk.
This list of external factors that could influence the sustainability of a mine in South Africa is not exhaustive, but rather indicative of the current context in which mining in South Africa is conducted.
| 16.11.3 | Sustainability/ESG reporting practices |
A high-level review of SPM’s sustainability reporting practices was undertaken. Corporate sustainability reporting practices give stakeholders the assurance that the reporting entity reports its ESG practices against international good practice standards. As an unlisted mining company SPM is still maturing in public reporting practices, and Table 16.5 indicates SMP’s progress against well-known international sustainability reporting frameworks.
The formation of the Social and Ethics Committee and publication of the Ethics policy in 2019 indicates intention to strengthen alignment with international good practice standards. Even though many of the good practice principles listed in the reporting standards in Table 16.5 might be imbedded in SPM’s operational procedures, the Company will have to publicly align reporting with at least some of these frameworks if it pursues compliance with international good practice standards. SPM’s intention to align with international good practice standards is demonstrated in the fact that the Company has commissioned a social and environmental gap analysis based on the International Finance Corporation Performance Standards (IFC PS). The results and recommendations of this gap analysis are not available yet but will include an action plan to address specific gaps.
| SRK | | Report date: 27 May 2022
Effective Date: 31 December 2021 |
| | | |
| SRK Consulting – 576060 SPM PSM Project TRS | Page 202 |
Table 16.5: SPM’s corporate sustainability reporting practices
| Reporting standard | Does SPM participate? | Aggregated or Standalone | Reference |
| Carbon Disclosure Project (CDP) – Climate Change | No | Not applicable | - |
| CDP – Water Stewardship | No | Not applicable | - |
| Sustainability reporting in line with Global Reporting Initiative Requirements | No | Not applicable | - |
| Extractive Industries Transparency Initiative (EITI) | No | Not applicable | - |
| Public policies and governance | Yes | Standalone for PPM | Various documents received during site visit and evidenced at http://www.sedibeloplatinum.com/compliance/corporate-governance |
| Alignment with the Sustainable Development Goals | No | Not applicable | - |
| United Nations Global Compact | No | Not applicable | - |
| Voluntary Principles on Security and Human Rights | No | Not applicable | - |
| UN Guiding Principles on Business and Human Rights | No | Not applicable | - |
| UK Modern Slavery Act Statement | No | Not applicable | - |
| 16.11.4 | Internal factors impacting sustainability at SPM |
Table 16.6 provides an overview of the six capitals of sustainable development and the risks highlighted by SRK as these pertain to SPM.
From a sustainability point of view, the following indicative sustainability risks are present:
| • | High risks are present in natural capital; |
| • | Moderate risks are present in social and relational capital and sustainability reporting capacity; and |
| • | Minor risks are present in intellectual, human and manufactured capital. |
| 16.11.5 | ESG status assessment |
SPM’s performance was assessed according to selected ESG performance indicators that are applicable for the phase in the lifecycle of the operation, the size of the operation, the type of mining method and metal extracted, the regulatory requirements of the country in which the Company operates as well as the ESG requirements of the Company’s shareholders and financing institutions.
A list of ESG good practice indicators (36 environmental, 56 social, 39 governance) was developed to assess SPM’s performance on ESG matters within the context of SPM’s operational and corporate reality. Performance against these indicators was assessed via interviews with SPM’s Chief Operating Officer and PPM’s Executive Corporate Affairs and Human Capital during the site visit, supplemented by document reviews.
| SRK | | Report date: 27 May 2022
Effective Date: 31 December 2021 |
| | | |
| SRK Consulting – 576060 SPM PSM Project TRS | Page 203 |
Table 16.6: Issues that could affect the sustainability of SPM
| | Sustainability Area | Issues identified that could potentially affect the sustainability of SPM | Section reference | SAMESG and other references |
| Internal Factors |  |  | - See section 20.3 for risks and opportunities for economic valuation | | |
| Financial Capital |
|  | - Significant developments needed for water infrastructure and road access to get the product to market; - Infrastructure provisioning for closure may not sufficient; - Unreliable bulk power supply due to load shedding | 5.13 | ESG 4.8 |
| Manufactured Capital |
|  | - Emerging stakeholder engagement and social development capacity, policies, procedures and systems, but should be bolstered if SPM plans listing; - Inadequate onsite capacity to develop reporting practices for alignment with international frameworks. | 5.17 | ESG 4.1 ESG 4.1 ESG 4.7 |
| Intellectual Capital |
|  | - Local employment targets met; - Local employment equity targets not met; - Human resources development spent is below target | 5.15; 5.16 | ESG 4.6 |
| Human Capital |
|  | - Local procurement targets set by Mining Charter not met; - Enterprise and supplier development initiatives in SLP not fully implemented; - Community skills development targets not met; - Self-sustainability of LED projects not considered (important with reference to relative short LoM); - Lack of prior planning for social transitioning during mine closure | 5.16 | ESG 4.3 ESG 4.9 ESG 4.8 |
| Social and Relational Capital |
|  | - 2020 audit reports and gap analysis for EMP, Waste licence still pending; - Some outstanding biodiversity impact management issues based on EMP internal reports; - Significant future costs to implement water related regulated and good practice water management systems; - Carbon tax registration not completed; | 5.16 | ESG 4.9 ESG 4.4 |
| Natural Capital |
| External Factors | | - Social licence to operate and labour legacy challenges might resurface and/or intensify during periods of economic and political uncertainty. | 8.3 | ESG 3.5.1 ESG 3.5.2 ESG 3.5.3 ESG 3.7 |
| Other Sustainability Considerations |

Sustainability Reporting practices | An emerging policy and reporting framework evident, but considerable effort required if SMP considers international good practice compliance | 8.4 | CDP CDP UNGC GRI GRI |
| SRK | | Report date: 27 May 2022
Effective Date: 31 December 2021 |
| | | |
| SRK Consulting – 576060 SPM PSM Project TRS | Page 204 |
The ESG performance indicators where scored on the following basis:
| · | 1 = Intention to comply and progress demonstrated; and |
For the purpose of this ESG assessment, the following assumptions were made:
| · | Only performance at SPM’s PPM asset was considered, as neither the P-S-M nor Mphahlele projects had significant changes in developmental status over the last year; |
| · | SPM was classified as an unlisted, medium-sized mining company with a LoM of over 30 years; |
| · | SPM wants to pursue a listing in the foreseeable future; |
| · | SMP has significant shareholders with a development focus and stated ESG; and |
| · | In each indicator, the baseline conditions recorded in SPM documentation were taken into consideration and documented in the notes section if they had an effect on the score allocated to an item. |
| 16.11.6 | Results and recommendations |
SPM has a solid ESG foundation, especially in social performance indicators (Figure 16.2). This is due to considerable effort that has been invested in obtaining and maintaining SPM’s social licence to operate at the PPM operations. SPM has several outstanding environmental matters to attend to at its PPM operations, and these are listed in the Environmental Issues and Hydrogeological sections of this report.
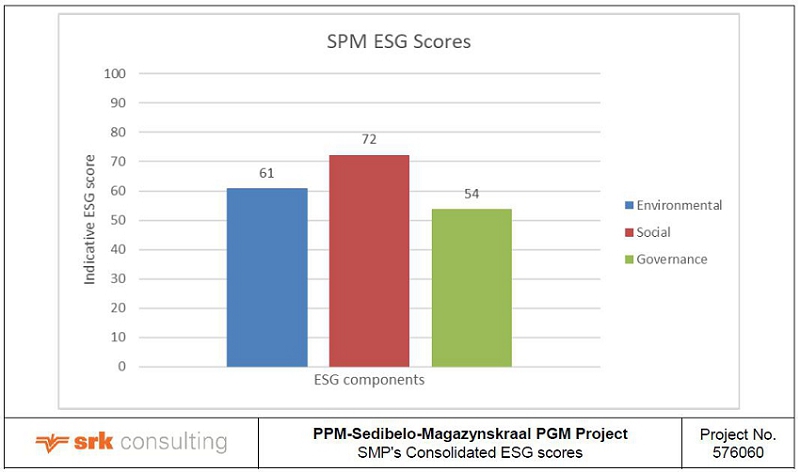
Figure 16.2: SPM’s consolidated ESG scores
SPM complies with the appropriate South African legislation for an unlisted company, but was scored against international good practice standards for governance which would apply should SPM list on any exchange. The relatively low governance score was mostly due to public reporting practices that need to mature, outstanding and/or potential costs relating to environmental management and staff capacity for corporate level ESG reporting.
This assessment indicates that whilst SPM performs well on social matters, environmental and water management pose risks to the sustainability of the operations at PPM. SPM should consider improving public ESG reporting as well as strengthening its policy framework.
SPM appointed Ms Lael Bethlehem as the Chief ESG Officer on 1 December 2021, responsible for spearheading the Company’s ESG programme. This would include SPM’s work on environment, renewable energy, emission reduction, social programmes, inclusivity and ESG reporting.
In June 2021, PPM issued a Request for Proposal for renewable energy services to the mine. The Company signed a Memorandum of Understanding on 10 March 2022 with a consortium of Independent Power Producers that will use a combination of solar and wind renewable energy sources. The first 40 MW of energy supply to PPM is expected to flow from Q1 2024, with a further 35 MW of power from a solar plant at or adjacent to the mine to cater for the underground mine from Q2 2026. SPM expects to realise a saving of about 25% on its annual Eskom-based electricity cost from 2024 onwards.
| SRK | | Report date: 27 May 2022
Effective Date: 31 December 2021 |
| | | |
| SRK Consulting – 576060 SPM PSM Project TRS | Page 205 |
| 17 | CAPITAL AND OPERATING COSTS |
[§229.601(b)(96)(iii)(B)(18)]
Estimation of capital and operating costs is inherently a forward-looking exercise. These estimates rely upon a range of assumptions and forecasts that are subject to change depending upon macro-economic conditions, operating strategy and new data collected through future operations. For this report, capital and operating costs are considered to be at a pre-feasibility level as defined by SK1300, with an expected accuracy of ±25%. However, this accuracy level is only applicable to the base case operating scenario and forward-looking assumptions outlined in this report. Therefore, changes in these forward-looking assumptions can result in capital and operating costs that deviate more than 25% from the costs forecast herein.
[§229.601(b)(96)(iii)(B)(18)(i)] [SR4.3(vii), SR5.6(iii) (vi)]
The capital estimates for the P-S M Project were derived from the 2020 study with an effective date of 31 March 2020. These costs were subsequently updated to the Effective Date of 31 December 2021 by re-costing individual items and rates used in building up the estimate (Table 17.1).
Foreign currency exposure accounts for 15% of the total project Capex, the majority being the RopeCon® conveyor equipment, the trackless mobile machinery (TMM) equipment and the Kell Plant. In terms of SPM’s accounting policy, Opex up to steady-state production levels in the underground operations is capitalized.
Metallurgical capital projects in the current PPM process plant include the Merensky circuit modification to treat UG2 ore, the TSP extension, the chromite plant extension and the Kell Plant.
Table 17.1: P-S-M Project - Capital Summary
| Item | Units | Project capital | Capitalised Opex | Total Capex |
| Exploration | (ZARm) | 118 | 0 | 118 |
| Pre-implementation | (ZARm) | 295 | 0 | 295 |
| Mining | (ZARm) | 1 555 | 9 239 | 10 795 |
| Surface Infrastructure | (ZARm) | 1 955 | 0 | 1 955 |
| Surface services, water, power, access | (ZARm) | 640 | 0 | 640 |
| Metallurgical Processing | (ZARm) | 1 467 | 527 | 1 993 |
| Contingency | (ZARm) | 604 | 488 | 1 093 |
| Total Capital including Contingency | (ZARm) | 6 635 | 10 254 | 16 889 |
Major capital sub-projects are shown in Table 17.2.
Table 17.2: P-S-M Project – major capital sub-projects
| Item | Units | Capex |
| Mining: | | |
| Capital development and fleet costs | (ZARm) | 4 439 |
| Mining and engineering capital labour | (ZARm) | 1 997 |
| Infrastructure | | |
| East Block surface infrastructure | (ZARm) | 1 636 |
| East Block underground infrastructure | (ZARm) | 928 |
| Central Block surface infrastructure | (ZARm) | 1 021 |
| Central Block underground infrastructure | (ZARm) | 823 |
| Metallurgical | | |
| PPM metallurgical plant upgrades | (ZARm) | 339 |
| Tailings scavenging plant extension | (ZARm) | 115 |
| Chromite plant extension | (ZARm) | 320 |
| Kell Plant (1) | (ZARm) | 708 |
| 1 | This represents SPM’s 41.67% share of the Capex of ZAR1.7bn for the Kell Plant excluding contingency, comprising 50% of the project debt funding (50% of total, the balance carried by IDC) and 33.3% of the project equity funding (50% of total, balance split equally between Lifezone and IDC). |
Stay-in-business (SIB) capital is provided in the cash flow model as 7.5% and 2.0% of total on-mine operating costs for underground operations and open pit operations respectively. These rates are reasonable for this level of study.
The Annual Capital cost and the Cumulative Capital cost for the P-S-M Project are shown in Figure 17.1.
| SRK | | Report date: 27 May 2022
Effective Date: 31 December 2021 |
| | | |
| SRK Consulting – 576060 SPM PSM Project TRS | Page 206 |

Figure 17.1: Annual Capital Cost and Cumulative Capital Cost
The phased capital requirements are summarized as follows:
| · | Underground Operations (including Kell) | Table 17.5; |
| · | P-S-M Project (including Open Pits and Kell) | Table 17.6. |
| SRK | | Report date: 27 May 2022
Effective Date: 31 December 2021 |
| | | |
| SRK Consulting – 576060 SPM PSM Project TRS | Page 207 |
Table 17.3: West Pit Capital Requirements
| West Pit Capital Requirements | Units | Total | 2022 |
| Exploration | (ZARm) | 2.3 | 2.3 |
| Pre-Implementation | (ZARm) | - | - |
| Mining | (ZARm) | 46.2 | 46.2 |
| Surface Infrastructure | (ZARm) | 8.0 | 8.0 |
| Services (Surface Infrastructure) | (ZARm) | 5.0 | 5.0 |
| Metallurgical Processing | (ZARm) | - | - |
| Contingency | (ZARm) | 6.1 | 6.1 |
| Total West Pit | (ZARm) | 67.6 | 67.6 |
Table 17.4: East Pit Capital Requirements
| East Pit Capital Requirements | Units | Total | 2022 | 2023 | 2024 | 2025 | 2026 | 2027 | 2028 | 2029 | 2030 |
| Exploration | (ZARm) | 2.3 | 2.3 | | | | | | | | |
| Pre-Implementation | (ZARm) | 29.9 | 24.9 | 0.7 | 0.7 | 0.7 | 0.7 | 0,7 | 0.7 | 0.7 | |
| Mining | (ZARm) | 97.4 | 97.4 | | | | | | | | |
| Surface Infrastructure | (ZARm) | 46.2 | 46.2 | | | | | | | | |
| Services (Surface Infrastructure) | (ZARm) | 71.8 | 71.8 | | | | | | | | |
| Metallurgical Processing | (ZARm) | - | - | | | | | | | | |
| Contingency | (ZARm) | 24.8 | 24.2 | 0.1 | 0.1 | 0.1 | 0.1 | 0.1 | 0.1 | 0,1 | |
| Total East Pit | (ZARm) | 272.3 | 266.7 | 0.8 | 0.8 | 0.8 | 0.8 | 0.8 | 0.8 | 0.8 | |
Table 17.5: P-S-M Project (Underground Operations including Kell) capital requirements
| P-S-M Project CAPEX | Units | Total | 2022 | 2023 | 2024 | 2025 | 2026 | 2027 | 2028 | 2029 | 2030 |
| Exploration | (ZARm) | 113.7 | 21.1 | 36.6 | 14.2 | 22.6 | 19.2 | 0.0 | 0.0 | 0.0 | 0.0 |
| Pre-Implementation | (ZARm) | 265.0 | 82.9 | 31.2 | 25.4 | 25.1 | 25.1 | 25.1 | 25.1 | 25.1 | 0.0 |
| Mining | (ZARm) | 10 651.0 | 441.1 | 324.0 | 979.0 | 1 083.0 | 1 347.8 | 2 017.5 | 1 860.9 | 2 165.6 | 432.1 |
| Surface Infrastructure | (ZARm) | 1 901.0 | 291.7 | 154.8 | 98.4 | 98.1 | 167.9 | 169.0 | 297.6 | 569.1 | 54.4 |
| Services (Surface Infrastructure) | (ZARm) | 563.5 | 114.8 | 228.0 | 23.7 | 19.1 | 99.2 | 71.7 | 3.4 | 3.1 | 0.5 |
| Metallurgical Processing | (ZARm) | 1 993.4 | 603.0 | 89.5 | 0.1 | 2.0 | 15.7 | 242.6 | 686.6 | 283.2 | 70.7 |
| Contingency | (ZARm) | 1 061.7 | 123.7 | 63.1 | 65.8 | 76.5 | 101.2 | 174.5 | 251.4 | 175.8 | 29.7 |
| Total Underground Operations | (ZARm) | 16 549.3 | 1 678.2 | 927.2 | 1 206.5 | 1 326.5 | 1 776.0 | 2 700.5 | 3 125.0 | 3 222.0 | 587.4 |
| SRK | | Report date: 27 May 2022
Effective Date: 31 December 2021 |
| | | |
| SRK Consulting – 576060 SPM PSM Project TRS | Page 208 |
Table 17.6: P-S-M Project (including Open Pits and Kell) capital requirements
| P-S-M Project CAPEX | Units | Total | 2022 | 2023 | 2024 | 2025 | 2026 | 2027 | 2028 | 2029 | 2030 |
| Exploration | (ZARm) | 118.3 | 25.7 | 36.6 | 14.2 | 22.6 | 19.2 | 0.0 | 0.0 | 0.0 | 0.0 |
| Pre-Implementation | (ZARm) | 294.9 | 107.8 | 31.9 | 26.1 | 25.8 | 25.8 | 25.8 | 25.8 | 25.8 | 0.0 |
| Mining | (ZARm) | 10 794.6 | 584.6 | 324.0 | 979.0 | 1 083.0 | 1 347.8 | 2 017.5 | 1 860.9 | 2 165.6 | 432.1 |
| Surface Infrastructure | (ZARm) | 1 955.2 | 345.8 | 154.8 | 98.4 | 98.1 | 167.9 | 169.0 | 297.6 | 569.1 | 54.4 |
| Services (Surface Infrastructure) | (ZARm) | 640.3 | 191.5 | 228.0 | 23.7 | 19.1 | 99.2 | 71.7 | 3.4 | 3.1 | 0.5 |
| Metallurgical Processing | (ZARm) | 1 993.4 | 603.0 | 89.5 | 0.1 | 2.0 | 15.7 | 242.6 | 686.6 | 283.2 | 70.7 |
| Contingency | (ZARm) | 1 092.6 | 154.1 | 63.2 | 65.8 | 76.6 | 101.3 | 174.6 | 251.5 | 175.9 | 29.7 |
| Total P-S-M Project | (ZARm) | 16 889.2 | 2 012.5 | 928.0 | 1 207.3 | 1 327.3 | 1 776.8 | 2 701.3 | 3 125.8 | 3 222.8 | 587.4 |
| SRK | | Report date: 27 May 2022
Effective Date: 31 December 2021 |
| | | |
| SRK Consulting – 576060 SPM PSM Project TRS | Page 209 |
| 17.1.1 | Capex Contingencies |
The capital estimates include contingencies, added at appropriate rates to all capital costs, are as shown in Table 17.7. The Capex for the metallurgical plant modifications and additions included contingencies at 9.48% to 25%. The overall contingency on the Capex is 6.92% (Table 17.7).
| Table 17.7: | Capex Contingencies |
| Capital Item | | Contingency Applied |
| Exploration | | 10.00% |
| Pre Implementation | | 10.00% |
| Mining OP | | 5.00% |
| Mining TMM | | 5.00% |
| Mining Primary development | | 8.18% |
| Stormwater management, TSF walls, earthworks etc. | | 10.00% |
| Surface infrastructure | | 8.08% |
| Surface services, water, power and access | | 8.24% |
| Underground infrastructure | | 8.18% |
| Capitalised Opex | | 5.00% |
| Metallurgical Processing | | 5.61% |
| Metallurgical Plant Upgrades | 20.00% | |
| Chromite Plant Extension | 25.00% | |
| Kell Plant | 9.48% | |
| Tailings Plant | 10.00% | |
| Metallurgical Capitalised Opex | 5.00% | |
| Overall Capital contingency | | 6.92% |
[§229.601(b)(96)(iii)(B)(18)(i)] [SR5.6(iii)(vi)(ix)]
The current mining costs and rates per the existing mining contract for the West Pit form the basis for the mining Opex for the West and East Pits (Table 17.8). Year 2025 has been selected for illustrative purposes to show the steady-state Opex when both West and East Pits are being mined.
Table 17.8: Mining Opex for West and East Pits (in 2025 for illustrative purposes)
| Item | Annual
Fixed Cost
(ZARm) | Variable
Cost (ZAR/t
rock moved) | West Pit (ZARm) | East Pit
(ZARm) | Total Open
Pit (ZARm) |
| Labour Cost | 21.7 | | 8.7 | 13.1 | 21.7 |
| Drilling | | 4.55 | 118.8 | 178.9 | 297.8 |
| Blasting | | 3.17 | 82.7 | 124.6 | 207.3 |
| Waste Mining | | 16.66 | 435.5 | 655.6 | 1 091.1 |
| Ore Mining | | 2.13 | 55.7 | 83.8 | 139.5 |
| Overhaul | | 0.92 | 24.0 | 36.1 | 60.0 |
| P&Gs | 38.5 | | 15.3 | 23.1 | 38.5 |
| Ore transport - East Pit to RoM pad | | | - | 132.6 | 132.6 |
| Mining Overheads | 59.4 | | 23.7 | 35.7 | 59.4 |
| Diesel rebate | | -1.22 | -31.9 | -48.0 | -79.8 |
Total Open Pit Mining Cost (excluding contingency) | 119.5 | 26.21 | 732.5 | 1 235.5 | 1 968.0 |
| 17.2.2 | Underground Mining Blocks |
The mining Opex for the Central and East Underground Blocks was developed according to a zero-based budgeting process, using the mine design criteria, quotes or OEM suppliers’ costs for specific activities, benchmarked labour costs, priced bills of quantity and experience of the PGM industry (Table 17.9). Year 2031 has been selected for illustrative purposes to show the steady-state Opex when both Central and East Underground Blocks are being mined.
| SRK | | Report date: 27 May 2022
Effective Date: 31 December 2021 |
| | | |
| SRK Consulting – 576060 SPM PSM Project TRS | Page 210 |
Table 17.9: Mining Opex for Central Block and East Block (in 2031 for illustrative purposes)
| Item | Central Block (2031) | East Block (2031) |
Fixed Cost
(ZARm) | Variable
Cost
(ZARm) | Total Cost
(ZAR/t ore) | Fixed Cost
(ZARm) | Variable
Cost
(ZARm) | Total Cost
(ZAR/t ore) |
| RoM ore (silicates) | | (Mt) | 0.002 | | (Mt) | 0.21 |
| RoM ore (UG2) | | (Mt) | 1.03 | | (Mt) | 0.75 |
| Labour | 326.7 | | 316.59 | 359.7 | | 374.18 |
| Declines/Connections Infrastructure | | 21.1 | 20.44 | | 111.1 | 115.58 |
| Other: | | | | | | |
| Haulages | | 7.3 | 7.05 | | 20.1 | 20.95 |
| Panels/ledges | | 258.7 | 250.70 | | 281.4 | 292.72 |
| Ore passes | | 10.9 | 10.57 | | 11.3 | 11.78 |
| Ventilation | | 0.0 | 0.00 | | 20.0 | 20.79 |
| Other development | | 48.6 | 47.10 | | 27.6 | 28.67 |
| Cover drilling | 3.4 | | 3.34 | 4.5 | | 4.63 |
Total Underground Mining Cost (excluding contingency) | 330.1 | 346.6 | 655.78 | 364.1 | 471.5 | 869.31 |
| SIB (total) | | | | | | |
| HPE Replacement | 23.7 | | 22.96 | 0.0 | | 0.00 |
| TMM Replacement/Rebuild | 41.0 | | 39.71 | 36.0 | | 37.42 |
| 17.2.3 | Processing Plant Costs |
The processing plant Opex based on the actual costs for the entire metallurgical complex at the PPM mine, adjusted to 31 December 2021 terms, are shown in Table 17.10.
Table 17.10: PPM Metallurgical Complex Opex (in 2031 for illustrative purposes)
| Item | Annual Fixed Cost (ZARm) | Variable Cost (ZAR/t milled) | |
| |
| Merensky Mill Feed | (Mt) | 0.18 | |
| UG2 Mill Feed | (Mt) | 2.59 | |
| Utilities - power | 12.6 | 66.20 | |
| Utilities - Water | | 6.83 | |
| Labour | 205.6 | - | |
| Engineering Maintenance | 85.6 | 30.91 | |
| Grinding Media | | 35.46 | |
| Reagents | | 45.61 | |
| Process Maintenance | 29.9 | 10.82 | |
| Planning Fixed | 2.1 | | |
Total Metallurgical Complex Opex (excluding contingency) | 335.8 | 195.83 | |
Note: Variable costs based on total concentrator tonnes milled.
The DMS plant is only required for as long as the open pits are in production and is used to remove dilution in the U2D ore stream. The Opex for the DMS plant, adjusted to 31 December 2021 terms, are shown in Table 17.11.
Table 17.11: DMS Plant Opex
| Item | Annual Fixed Cost (ZARm) | Variable Cost (ZAR/t milled) | |
| |
| Utilities - power | 0.5 | 9.67 | |
| Labour | 6.2 | - | |
| Engineering Maintenance | 5.6 | 6.98 | |
| Reagents variable | - | 46.33 | |
| Total DMS Opex (excluding contingency) | 12.4 | 62.98 | |
Note: Variable costs based on UG2 tonnes milled.
The Opex for the CRP and TSP circuits, which are extracted from the metallurgical complex costs in Table 17.10, are shown in Table 17.12.
The Opex for the reconfigured Merensky plant (160 ktpm) and the UG2 plant, after removal of the DMS, CRP and TSP plant costs and allocated from the overall plant Opex based on throughput, are shown in Table 17.13.
| SRK | | Report date: 27 May 2022
Effective Date: 31 December 2021 |
| | | |
| SRK Consulting – 576060 SPM PSM Project TRS | Page 211 |
Table 17.12: CRP and TSP Circuits Opex
| | CRP Circuit | TSP Circuit | |
| Item | Annual Fixed Cost (ZARm) | Variable Cost (ZAR/t milled) | Annual Fixed Cost (ZARm) | Variable Cost (ZAR/t milled) | |
| |
| Utilities - power | 0.1 | 2.04 | 0.3 | 1.35 | |
| Labour | 3.1 | | 3.9 | | |
| Engineering Maintenance | 1.4 | 1.69 | 3.5 | 0.97 | |
| Reagents variable | | - | | 6.45 | |
Total CRP / TSP Opex (excluding contingency) | 4.5 | 3.74 | 7.8 | 8.76 | |
Note: CRP variable costs based on UG2 tonnes milled. TSP variable costs based on total concentrator tonnes milled.
Table 17.13: Merensky (160 ktpm) and UG2 (67 ktpm) Plant Opex
| Item | Merensky Plant (160 ktpm) | UG2 Plant (67 ktpm) | |
Annual Fixed Cost (ZARm) | Variable Cost (ZAR/t milled) | Annual Fixed Cost (ZARm) | Variable Cost (ZAR/t milled) | |
| |
| Utilities - power | 9.3 | 36.26 | 9.3 | 36.28 | |
| Utilities - Water | | 4.84 | | 4.84 | |
| Labour | 148.5 | 0.00 | 45.1 | 0.00 | |
| Engineering Maintenance | 34.7 | 16.87 | 14.5 | 16.87 | |
| Grinding Media | | 25.10 | | 25.10 | |
| Reagents | | 32.28 | | 32.280 | |
| Process Maintenance | 12.2 | 5.90 | 5.1 | 5.90 | |
| Planning Fixed | 2.1 | 0.00 | 2.1 | 0.00 | |
Total Merensky / UG2 Opex (excluding contingency) | 206.8 | 121.27 | 76.1 | 121.27 | |
Note: Variable costs based on design tonnes milled per concentrator.
The Opex for the on-site laboratory, based on actual costs at the PPM mine adjusted to 31 December 2021, is ZAR33.5m per annum.
The aggregated Opex and refining charges for the Kell plant are provided in Table 15.4.
| 17.2.4 | General and Admin Costs |
The general and administration (G&A) Opex for the P-S-M Project is based on the actual annual costs for SPM, adjusted to 31 December 2021 terms, as shown in Table 17.14.
Table 17.14: G&A Opex
| Item | Annual Cost (ZARm) |
| Human Resources | 103.4 |
| Finance | | 71.8 |
| Aux Services & Security | 33.6 |
| SHEQ | | 39.3 |
| IT | | 12.5 |
| Stores | | 1.6 |
| Community Relations | 5.9 |
| MRM | | 175.0 |
| Rock breaking | | 133.7 |
| Labour / other | | 41.2 |
Total G&A Opex (excluding contingency) | | 443.1 |
The rock breaking cost in the MRM department is only required for as long as the open pits are in production. A contractor is used to crush the RoM ore before this is fed into the primary crushers.
The SHEQ Opex includes environmental Opex of ZAR18.4m per year to cover annual rehabilitation guarantee fees, environmental services (monitoring) and other environmental charges.
| 17.2.5 | Corporate Overheads (Off-Mine G&A Costs) |
SPM has provided ZAR131.5m per year (ZAR10.96m per month) to cater for corporate overheads (off-mine G&A costs), as summarised in Table 17.15. The SPM corporate cost centre includes budget provisions for the additional costs associated with being a listed entity and related extra reporting obligations.
| SRK | | Report date: 27 May 2022
Effective Date: 31 December 2021 |
| | | |
| SRK Consulting – 576060 SPM PSM Project TRS | Page 212 |
Table 17.15: Corporate Overheads (Off-mine G&A Costs)
| Item | Annual Cost (ZARm) |
| SGS shared services | 45.5 |
| SPM corporate | | 84.0 |
| Other foreign entities | 0.8 |
| Other South African entities | | 1.2 |
Total Corporate Overheads (excluding contingency) | | 131.5 |
A contingency of 5% was applied to all Opex.
| 17.3 | Risks with engineering estimation methods |
[§229.601(b)(96)(iii)(B)(18)(ii)] [SR4.3(viii), SR5.7(i)]
| 17.3.1 | Capital costs Risks |
As a PFS level study, SRK considers that the accuracy of the Capex is ±25%, with a contingency of <15%, in keeping with Table 1 to Paragraph (d) in SK1300 [§229.1302(d)]. The overall Capex contingency of 6.92% satisfies this requirement.
The capital costs were re-estimated in detail in June 2021 by SPM with the assistance of the consultants involved in the 2020 FS and escalated to December 2021 terms by SA Stats CPI data. The metallurgical project Capex, however, was escalated by SPM from the 2020 study estimate based on SA Stats CPI data.
The risk that the Capex accuracy will not fall within the range required of a PFS is not considered material.
| 17.3.2 | Operating Costs Risks |
The Opex associated with the West and East Pits, metallurgical complex and G&A is based on actual costs at the PPM operation and is considered to have an accuracy of better than ±25%. The risk of these being materially wrong is low.
The Opex for the underground mining operations was developed using a zero-based budgeting process based on quotes and experience of the PGM mining industry. Typical development and mining rates achieved in the South African PGM industry were reduced to cater for expected ground conditions and structural complexities. The underground Opex is considered to have an accuracy of better than ±25%. The risk that the derived costs are too low is considered to be moderate.
A blanket contingency of 5% was applied across all Opex which is within the <15% required per Table 1 to Paragraph (d) in §229.1302.
| SRK | | Report date: 27 May 2022
Effective Date: 31 December 2021 |
| | | |
| SRK Consulting – 576060 SPM PSM Project TRS | Page 213 |
[§229.601(b)(96)(iii)(B)(19)] [SR5.6(iii)(iv)(ix), SR5.8(i)-(iv)]
The economic analysis is inherently a forward-looking exercise.
These estimates rely upon a range of assumptions and forecasts that are subject to change depending upon macro-economic conditions, operating strategy and new data collected through future operations. The economic assessment described here is premised on a prefeasibility study with a LoM plan that exploits only Mineral Reserves. There is no certainty that this economic assessment will be realized.
| 18.1 | Key assumptions, parameters and factors |
[§229.601(b)(96)(iii)(B)(19)(i)]
The discussion in this section relates to the TEM compiled by SPM (2022b) for the P-S-M Project in a MS Workbook WP - EP - SCD - SEMD - Sedibelo Model Rev 36 v5 - Kell Scenario - 20220323 - 16.24 x 20220411 - 19.12.xlsb. SRK has reviewed this TEM and confirms that the calculation processes from input TEPs to final economic results are correct.
The annual mill feed per reef type is shown in Figure 18.1. Once the Merensky plant has been reconfigured to process the underground UG2 ore, the 67 ktpm UG2 plant is used to process DMS discard material followed by low-grade Merensky ore.

Figure 18.1: Annual Mill Feed per Reef Type
The plant recovery is calculated via the Two Product formulae described in Section 13.3.1.
This process results in the Cr2O3 content in the concentrate exceeding the accepted limit from time to time, depending on the plant feed mix, for which penalties on the excess chromite would be payable if treated at IRS or Heron Metals. With the introduction of the Kell process from 2024, the penalties will no longer apply.
| 18.1.3 | Commodity Prices and Exchange Rates |
The projected commodity prices and exchange rates per the CRU price deck (Table 15.2) are used as the base case for evaluation purposes.
Economic results using three-year trailing average values and spot values at 31 December 2021 (Table 15.1) are provided for comparative purposes.
The Opex incorporated into the TEM is based on the following:
| • | Open pit operations - current contracts in force at the West Pit; |
| • | Underground operations - zero-based budget from first principles, benchmarked against similar operations; |
| SRK | | Report date: 27 May 2022
Effective Date: 31 December 2021 |
| | | |
| SRK Consulting – 576060 SPM PSM Project TRS | Page 214 |
| • | Plant costs – actual costs for PPM’s concentrators in 2021; |
| • | Refining costs – current contracts with IRS to September 2022, followed by the terms of the Offtake to end 2023; |
| • | Kell costs for 2024 onwards per the 2020 feasibility study; and |
| • | Admin/G&A costs – actual costs for PPM/SPM in 2021. |
The MPRDA Royalty is calculated according to the refined formula as set out in Section 2.2.5. The maximum royalty is 5% of gross revenue.
The aggregated royalty payable in terms of the various Kell licence agreements is provided in Table 15.4.
| 18.1.6 | Taxation and Government Levies |
Taxes and government levies that are applicable to the P-S-M Project are as follows:
| • | Company Tax | 28% (in 2022), 27% (2023 and onwards); |
| o | Housing Compliance | 1% of Annual Labour Cost; |
| o | Human resource Development | 5% of Annual Labour Cost; |
| o | Enterprise/Supplier Development | 3% of Net Profit After Tax (NPAT); |
| o | Local Economic Development Projects | 1% of NPAT. |
Capex in any year is deductible in full against operating profit in any given year. Operating losses or Capex not redeemed in full in any year can be carried forward into subsequent years. Unredeemed Capex (ZAR3 950m) and Assessed Loss (ZAR1 962m) for SPM provide a tax shield for the cash flows in the TEM. Since the Assessed Loss will be fully utilised in 2022, the 80% of assessed loss in 2023 onwards does not apply to SPM.
Tax rates of 28% for 2022 and 27% for 2023 onwards have been incorporated into the TEM.
SPM (2022b) provided the parameters set out in Table 18.1 which are used to determine the weighted average cost of capital (WACC) for SPM . As SPM reports its results in US Dollars and is based in Guernsey, the WACC was calculated according to parameters ruling in the United States of America.
The ruling tax rate in Guernsey is 0%.
Table 18.1: Derivation of the USD-denominated WACC for SPM
| Parameter | Low Value | High Value | Comment |
| Re-levered beta | 1.82 | 2.12 | Unlevered beta mean of PGM peers (Norilsk, Amplats, Impala, Northam, Sibanye Stillwater), re-levered for SPM’s target debt/equity ratio |
| Market risk premium | 5.5% | 7.3% | Supply side vs observed |
| Risk free rate | -0.55% | -0.55% | United States 20-year Government TIPS rate |
| Cost of equity | 9.5% | 14.8% | Risk free rate + [(re-levered beta) x (market risk premium)] |
| Tax rate (RSA) | 27% | 27% | South African corporate tax rate with effect from 1 April 2023 (previously 28%) |
| After tax cost of debt | 4.4% | 4.6% | Mean and median values of PGM Peers (Norilsk, Amplats, Impala, Northam, Sibanye Stillwater) |
| Net Debt/Equity | 20% | 40% | SPM targeted net debt/equity |
| WACC (nominal) | 13.3% | 15.7% | |
| WACC (real) | 8.4% | 10.7% | Deflated at long-term SA inflation rate of 4.5% |
The real WACC was calculated to be in the range of 8.4% to 10.7%. SPM decided that the real WACC to apply to cash flows for the P-S-M Project would be set at 9.0%.
| SRK | | Report date: 27 May 2022
Effective Date: 31 December 2021 |
| | | |
| SRK Consulting – 576060 SPM PSM Project TRS | Page 215 |
| 18.2 | Results of economic analysis |
[§229.601(b)(96)(iii)(B)(19)(ii)]
| 18.2.1 | Annual cash flow forecasts |
Summaries of annual real terms cash flow forecasts for the P-S-M Project are set out as follows:
| • | P-S-M Production Parameters (2022 to 2036) | Table 18.2; |
| • | P-S-M Production Parameters (2037 to 2051) | Table 18.3; |
| • | P-S-M Production Parameters (2052 to 2061) | Table 18.4; |
| • | P-S-M Revenue and Opex Parameters (2022 to 2036) | Table 18.5; |
| • | P-S-M Revenue and Opex Parameters (2037 to 2051) | Table 18.6; |
| • | P-S-M Revenue and Opex Parameters (2052 to 2066) | Table 18.7; |
| • | P-S-M Cash Flow Parameters (2022 to 2036) | Table 18.8; |
| • | P-S-M Cash Flow Parameters (2037 to 2051) | Table 18.9; |
| • | P-S-M Cash Flow Parameters (2052 to 2066) | Table 18.10. |
During the period 2030 to 2040, steady-state production averages 278 koz 4E per annum.
| SRK | | Report date: 27 May 2022
Effective Date: 31 December 2021 |
| | | |
| SRK Consulting – 576060 SPM PSM Project TRS | Page 216 |
Table 18.2: P-S-M Project – Production Parameters (2022 to 2036)
| Item | Units | Total/ Average | 2022 | 2023 | 2024 | 2025 | 2026 | 2027 | 2028 | 2029 | 2030 | 2031 | 2032 | 2033 | 2034 | 2035 | 2036 |
| Production | | | | | | | | | | | | | | | | | |
| East Pit Merensky RoM | (Mt) | 12.9 | 0.2 | 1.2 | 1.8 | 2.7 | 2.9 | 1.9 | 1.5 | 0.8 | 0.0 | 0.0 | 0.0 | 0.0 | 0.0 | 0.0 | 0.0 |
| East Pit UG2 RoM | (Mt) | 7.7 | 0.8 | 1.0 | 1.2 | 1.1 | 1.1 | 1.2 | 0.8 | 0.4 | 0.0 | 0.0 | 0.0 | 0.0 | 0.0 | 0.0 | 0.0 |
| West Pit Merensky RoM | (Mt) | 8.3 | 1.1 | 1.3 | 1.2 | 1.0 | 1.3 | 1.4 | 1.0 | 0.0 | 0.0 | 0.0 | 0.0 | 0.0 | 0.0 | 0.0 | 0.0 |
| West Pit UG2 RoM | (Mt) | 4.8 | 0.9 | 0.5 | 0.6 | 0.8 | 0.5 | 0.8 | 0.7 | 0.0 | 0.0 | 0.0 | 0.0 | 0.0 | 0.0 | 0.0 | 0.0 |
| East Block Merensky RoM | (Mt) | 7.0 | 0.0 | 0.0 | 0.0 | 0.0 | 0.0 | 0.0 | 0.0 | 0.0 | 0.1 | 0.2 | 0.2 | 0.2 | 0.2 | 0.2 | 0.2 |
| East Block UG2 RoM | (Mt) | 24.0 | 0.0 | 0.0 | 0.0 | 0.0 | 0.1 | 0.2 | 0.3 | 0.6 | 0.9 | 0.8 | 0.7 | 0.8 | 0.8 | 0.7 | 0.7 |
| Central Block Merensky RoM | (Mt) | 0.7 | 0.0 | 0.0 | 0.0 | 0.0 | 0.0 | 0.0 | 0.0 | 0.0 | 0.0 | 0.0 | 0.0 | 0.0 | 0.0 | 0.0 | 0.1 |
| Central Block UG2 RoM | (Mt) | 12.1 | 0.0 | 0.0 | 0.0 | 0.0 | 0.0 | 0.0 | 0.0 | 0.2 | 0.6 | 1.0 | 1.1 | 1.1 | 1.1 | 1.1 | 1.0 |
| Total RoM ore | (Mt) | 77.5 | 3.0 | 4.1 | 4.9 | 5.6 | 5.8 | 5.5 | 4.4 | 2.1 | 1.6 | 2.0 | 2.0 | 2.1 | 2.1 | 2.1 | 2.0 |
| East Pit Merensky RoM grade | (g/t 4E) | 1.01 | 0.52 | 0.81 | 0.97 | 0.92 | 0.99 | 1.07 | 1.07 | 1.54 | 0.00 | 0.00 | 0.00 | 0.00 | 0.00 | 0.00 | 0.00 |
| East Pit UG2 RoM grade | (g/t 4E) | 2.47 | 2.44 | 2.35 | 2.40 | 2.45 | 2.55 | 2.46 | 2.49 | 2.80 | 0.00 | 0.00 | 0.00 | 0.00 | 0.00 | 0.00 | 0.00 |
| West Pit Merensky RoM grade | (g/t 4E) | 1.32 | 1.42 | 0.96 | 0.82 | 1.20 | 1.03 | 1.33 | 2.75 | 0.00 | 0.00 | 0.00 | 0.00 | 0.00 | 0.00 | 0.00 | 0.00 |
| West Pit UG2 RoM grade | (g/t 4E) | 2.15 | 2.50 | 2.19 | 2.10 | 1.95 | 2.18 | 2.14 | 1.92 | 0.00 | 0.00 | 0.00 | 0.00 | 0.00 | 0.00 | 0.00 | 0.00 |
| East Block Merensky RoM grade | (g/t 4E) | 4.52 | 0.00 | 0.00 | 0.00 | 0.00 | 1.36 | 1.06 | 1.30 | 1.25 | 3.48 | 3.99 | 3.74 | 4.92 | 4.93 | 4.67 | 4.48 |
| East Block UG2 RoM grade | (g/t 4E) | 4.12 | 0.00 | 0.00 | 2.28 | 2.29 | 3.64 | 3.82 | 4.11 | 4.55 | 4.69 | 4.64 | 4.62 | 4.57 | 4.58 | 4.49 | 4.39 |
| Central Block Merensky RoM grade | (g/t 4E) | 4.59 | 0.00 | 0.00 | 0.00 | 0.00 | 0.00 | 0.00 | 0.00 | 0.00 | 0.00 | 0.68 | 3.29 | 3.70 | 4.66 | 4.10 | 4.29 |
| Central Block UG2 RoM grade | (g/t 4E) | 4.77 | 0.00 | 0.00 | 0.00 | 0.00 | 0.00 | 2.21 | 2.73 | 3.79 | 4.44 | 4.68 | 4.87 | 4.88 | 4.66 | 4.76 | 4.74 |
| Total RoM ore grade | (g/t 4E) | 3.16 | 1.98 | 1.43 | 1.44 | 1.42 | 1.43 | 1.71 | 2.09 | 2.90 | 4.52 | 4.59 | 4.65 | 4.75 | 4.66 | 4.64 | 4.56 |
| Total Merensky RoM content | (koz 4E) | 1 888.2 | 53.2 | 71.2 | 89.2 | 119.1 | 135.1 | 124.2 | 138.2 | 42.6 | 11.6 | 27.1 | 28.7 | 35.5 | 38.8 | 38.2 | 43.8 |
| Total UG2 RoM content | (koz 4E) | 5 978.2 | 134.3 | 116.3 | 138.1 | 136.5 | 133.0 | 177.0 | 155.1 | 150.2 | 217.5 | 267.0 | 276.1 | 279.9 | 275.9 | 268.9 | 255.6 |
| Merensky Mill feed | (Mt) | 28.9 | 1.2 | 1.9 | 2.1 | 2.4 | 2.7 | 2.3 | 1.7 | 0.4 | 0.1 | 0.2 | 0.2 | 0.2 | 0.2 | 0.4 | 1.2 |
| UG2 Mill Feed | (Mt) | 48.8 | 1.2 | 1.2 | 1.1 | 1.0 | 0.9 | 1.2 | 1.1 | 1.7 | 2.3 | 2.6 | 2.7 | 2.7 | 2.7 | 2.5 | 1.7 |
| Merensky Mill feed content | (koz 4E) | 1 888.2 | 52.3 | 60.5 | 66.9 | 84.7 | 99.4 | 97.9 | 120.4 | 25.5 | 11.6 | 23.0 | 29.3 | 33.6 | 32.0 | 42.5 | 69.1 |
| UG2 Mill Feed content | (koz 4E) | 5 980.6 | 114.1 | 106.7 | 100.9 | 86.7 | 87.5 | 118.2 | 111.1 | 207.5 | 310.6 | 327.0 | 290.0 | 295.5 | 291.9 | 280.5 | 255.6 |
| Merensky Recovered 4E into concentrate | (koz 4E) | 1 415.7 | 34.1 | 36.3 | 40.0 | 51.8 | 61.2 | 62.6 | 87.7 | 17.3 | 9.1 | 18.6 | 23.4 | 28.2 | 27.2 | 34.6 | 51.4 |
| UG2 Recovered 4E into concentrate | (koz 4E) | 4 904.4 | 89.6 | 83.1 | 78.3 | 67.0 | 69.1 | 93.0 | 88.1 | 169.1 | 255.9 | 269.5 | 240.3 | 244.5 | 240.5 | 232.1 | 213.5 |
| Merensky concentrator recovery | (%) | 75.0% | 65.2% | 60.1% | 59.7% | 61.1% | 61.6% | 63.9% | 72.8% | 67.8% | 78.5% | 80.8% | 79.9% | 84.0% | 84.8% | 81.4% | 74.5% |
| UG2 concentrator recovery | (%) | 82.0% | 78.5% | 78.0% | 77.6% | 77.3% | 79.0% | 78.7% | 79.3% | 81.5% | 82.4% | 82.4% | 82.9% | 82.8% | 82.4% | 82.7% | 83.5% |
| Concentrate produced | (kt) | 1 147.2 | 31.4 | 31.3 | 32.0 | 35.5 | 39.9 | 44.6 | 55.1 | 31.5 | 36.5 | 40.4 | 40.1 | 42.4 | 41.8 | 42.2 | 45.3 |
| Concentrate grade | (g/t 4E) | 170.4 | 122.7 | 118.9 | 114.8 | 104.0 | 101.7 | 108.4 | 99.2 | 184.3 | 225.8 | 221.6 | 204.7 | 199.9 | 199.1 | 196.4 | 181.9 |
| TSP concentrate produced | (kt) | 196.1 | 3.8 | 4.2 | 4.4 | 4.7 | 5.0 | 5.4 | 4.9 | 6.4 | 7.9 | 8.6 | 7.7 | 7.8 | 7.8 | 7.8 | 8.3 |
| TSP concentrate grade | (g/t 4E) | 43.1 | 35.0 | 35.0 | 35.0 | 35.0 | 35.0 | 35.0 | 35.0 | 45.0 | 45.0 | 45.0 | 45.0 | 45.0 | 45.0 | 45.0 | 45.0 |
| Total concentrate | (kt) | 1 343.3 | 35.2 | 35.5 | 36.4 | 40.2 | 44.9 | 50.0 | 60.1 | 37.9 | 44.4 | 49.0 | 47.8 | 50.2 | 49.6 | 50.0 | 53.6 |
| Chromite concentrate produced | (kt) | 895.1 | 30.1 | 18.6 | 22.1 | 30.6 | 16.9 | 11.5 | 11.2 | 0.2 | 0.3 | 36.0 | 1.7 | 4.2 | 5.3 | 8.5 | 15.6 |
| Payable Metal | | | | | | | | | | | | | | | | | |
| 6E | (koz) | 7 967.7 | 148.9 | 144.2 | 142.5 | 142.2 | 155.6 | 186.8 | 208.1 | 236.2 | 339.5 | 372.0 | 342.0 | 352.5 | 346.0 | 343.9 | 339.6 |
| 4E | (koz) | 6 593.3 | 127.9 | 124.3 | 123.2 | 124.1 | 136.0 | 161.7 | 181.4 | 195.7 | 276.4 | 300.5 | 274.8 | 284.1 | 278.9 | 277.9 | 276.9 |
| Pt | (koz) | 4 054.4 | 81.7 | 79.5 | 78.9 | 79.8 | 87.5 | 103.2 | 116.0 | 121.1 | 168.4 | 181.6 | 165.1 | 170.9 | 167.9 | 167.5 | 168.0 |
| Pd | (koz) | 1 791.1 | 33.0 | 32.1 | 31.8 | 31.9 | 35.0 | 41.9 | 47.1 | 52.2 | 75.3 | 83.0 | 76.8 | 79.2 | 77.7 | 77.5 | 76.8 |
| Rh | (koz) | 667.6 | 11.2 | 10.6 | 10.3 | 9.6 | 10.4 | 13.3 | 14.0 | 20.7 | 31.0 | 33.6 | 30.8 | 31.5 | 31.0 | 30.3 | 28.8 |
| Ru | (koz) | 1 053.8 | 16.9 | 16.1 | 15.6 | 14.6 | 15.7 | 20.2 | 21.4 | 31.8 | 48.3 | 53.0 | 49.0 | 50.1 | 49.3 | 48.4 | 46.1 |
| Ir | (koz) | 320.7 | 4.1 | 3.9 | 3.7 | 3.5 | 3.8 | 5.0 | 5.4 | 8.7 | 14.9 | 18.5 | 18.2 | 18.3 | 17.8 | 17.6 | 16.5 |
| Au | (koz) | 80.2 | 2.0 | 2.1 | 2.3 | 2.7 | 3.1 | 3.3 | 4.3 | 1.6 | 1.6 | 2.2 | 2.2 | 2.4 | 2.3 | 2.6 | 3.3 |
| Ni | (kt) | 6.8 | 0.2 | 0.3 | 0.4 | 0.4 | 0.5 | 0.4 | 0.4 | 0.1 | 0.1 | 0.1 | 0.1 | 0.1 | 0.1 | 0.1 | 0.2 |
| Cu | (kt) | 6.7 | 0.2 | 0.3 | 0.3 | 0.3 | 0.4 | 0.4 | 0.5 | 0.1 | 0.1 | 0.1 | 0.1 | 0.1 | 0.1 | 0.2 | 0.2 |
| Chromite (40% to 42% Cr2O3) | (kt) | 895.1 | 30.1 | 18.6 | 22.1 | 30.6 | 16.9 | 11.5 | 11.2 | 0.2 | 0.3 | 36.0 | 1.7 | 4.2 | 5.3 | 8.5 | 15.6 |
| SRK | | Report date: 27 May 2022
Effective Date: 31 December 2021 |
| | | |
| SRK Consulting – 576060 SPM PSM Project TRS | Page 217 |
Table 18.3: P-S-M Project – Production Parameters (2037 to 2051)
| Item | Units | Total/ Average | 2037 | 2038 | 2039 | 2040 | 2041 | 2042 | 2043 | 2044 | 2045 | 2046 | 2047 | 2048 | 2049 | 2050 | 2051 |
| Production | | | | | | | | | | | | | | | | | |
| East Pit Merensky RoM | (Mt) | 12.9 | 0.0 | 0.0 | 0.0 | 0.0 | 0.0 | 0.0 | 0.0 | 0.0 | 0.0 | 0.0 | 0.0 | 0.0 | 0.0 | 0.0 | 0.0 |
| East Pit UG2 RoM | (Mt) | 7.7 | 0.0 | 0.0 | 0.0 | 0.0 | 0.0 | 0.0 | 0.0 | 0.0 | 0.0 | 0.0 | 0.0 | 0.0 | 0.0 | 0.0 | 0.0 |
| West Pit Merensky RoM | (Mt) | 8.3 | 0.0 | 0.0 | 0.0 | 0.0 | 0.0 | 0.0 | 0.0 | 0.0 | 0.0 | 0.0 | 0.0 | 0.0 | 0.0 | 0.0 | 0.0 |
| West Pit UG2 RoM | (Mt) | 4.8 | 0.0 | 0.0 | 0.0 | 0.0 | 0.0 | 0.0 | 0.0 | 0.0 | 0.0 | 0.0 | 0.0 | 0.0 | 0.0 | 0.0 | 0.0 |
| East Block Merensky RoM | (Mt) | 7.0 | 0.2 | 0.2 | 0.2 | 0.1 | 0.2 | 0.2 | 0.2 | 0.2 | 0.2 | 0.2 | 0.2 | 0.2 | 0.2 | 0.3 | 0.3 |
| East Block UG2 RoM | (Mt) | 24.0 | 0.8 | 0.7 | 0.8 | 0.9 | 0.9 | 0.8 | 0.7 | 0.8 | 0.7 | 0.8 | 0.7 | 0.7 | 0.8 | 0.7 | 0.6 |
| Central Block Merensky RoM | (Mt) | 0.7 | 0.1 | 0.1 | 0.0 | 0.0 | 0.1 | 0.1 | 0.0 | 0.0 | 0.0 | 0.0 | 0.0 | 0.0 | 0.0 | 0.0 | 0.0 |
| Central Block UG2 RoM | (Mt) | 12.1 | 0.9 | 1.0 | 1.0 | 0.8 | 0.5 | 0.3 | 0.2 | 0.2 | 0.0 | 0.0 | 0.0 | 0.0 | 0.0 | 0.0 | 0.0 |
| Total RoM ore | (Mt) | 77.5 | 2.0 | 2.0 | 2.0 | 1.8 | 1.6 | 1.3 | 1.2 | 1.2 | 1.0 | 1.0 | 0.9 | 0.9 | 1.0 | 1.0 | 0.9 |
| East Pit Merensky RoM grade | (g/t 4E) | 1.01 | 0.00 | 0.00 | 0.00 | 0.00 | 0.00 | 0.00 | 0.00 | 0.00 | 0.00 | 0.00 | 0.00 | 0.00 | 0.00 | 0.00 | 0.00 |
| East Pit UG2 RoM grade | (g/t 4E) | 2.47 | 0.00 | 0.00 | 0.00 | 0.00 | 0.00 | 0.00 | 0.00 | 0.00 | 0.00 | 0.00 | 0.00 | 0.00 | 0.00 | 0.00 | 0.00 |
| West Pit Merensky RoM grade | (g/t 4E) | 1.32 | 0.00 | 0.00 | 0.00 | 0.00 | 0.00 | 0.00 | 0.00 | 0.00 | 0.00 | 0.00 | 0.00 | 0.00 | 0.00 | 0.00 | 0.00 |
| West Pit UG2 RoM grade | (g/t 4E) | 2.15 | 0.00 | 0.00 | 0.00 | 0.00 | 0.00 | 0.00 | 0.00 | 0.00 | 0.00 | 0.00 | 0.00 | 0.00 | 0.00 | 0.00 | 0.00 |
| East Block Merensky RoM grade | (g/t 4E) | 4.52 | 4.84 | 4.77 | 5.05 | 4.70 | 4.82 | 4.98 | 5.02 | 5.08 | 5.05 | 4.35 | 4.28 | 4.28 | 4.57 | 4.51 | 4.15 |
| East Block UG2 RoM grade | (g/t 4E) | 4.12 | 4.33 | 4.28 | 4.27 | 4.25 | 4.13 | 4.07 | 3.97 | 3.96 | 3.88 | 3.82 | 4.01 | 4.02 | 4.05 | 4.12 | 3.90 |
| Central Block Merensky RoM grade | (g/t 4E) | 4.59 | 4.31 | 3.84 | 4.40 | 7.13 | 6.30 | 5.37 | 3.76 | 4.48 | 6.50 | 0.00 | 0.00 | 0.00 | 0.00 | 0.00 | 0.00 |
| Central Block UG2 RoM grade | (g/t 4E) | 4.77 | 4.93 | 4.96 | 4.93 | 5.06 | 4.88 | 4.50 | 4.17 | 4.34 | 4.98 | 0.00 | 0.00 | 0.00 | 0.00 | 0.00 | 0.00 |
| Total RoM ore grade | (g/t 4E) | 3.16 | 4.66 | 4.65 | 4.65 | 4.66 | 4.53 | 4.36 | 4.19 | 4.20 | 4.19 | 3.91 | 4.08 | 4.08 | 4.17 | 4.23 | 3.99 |
| Total Merensky RoM content | (koz 4E) | 1 888.2 | 41.5 | 43.5 | 34.1 | 26.0 | 36.7 | 40.0 | 40.6 | 33.8 | 35.3 | 22.8 | 31.6 | 29.4 | 31.1 | 38.4 | 45.8 |
| Total UG2 RoM content | (koz 4E) | 5 978.2 | 259.0 | 258.7 | 266.8 | 246.5 | 201.9 | 145.9 | 125.9 | 122.1 | 95.9 | 97.8 | 84.8 | 93.0 | 99.1 | 91.9 | 69.5 |
| Merensky Mill feed | (Mt) | 28.9 | 1.2 | 1.2 | 1.1 | 1.0 | 1.1 | 1.1 | 0.5 | 0.2 | 0.2 | 0.2 | 0.2 | 0.2 | 0.2 | 0.3 | 0.3 |
| UG2 Mill Feed | (Mt) | 48.8 | 1.7 | 1.7 | 1.8 | 1.7 | 1.4 | 1.1 | 1.0 | 0.9 | 0.8 | 0.8 | 0.7 | 0.7 | 0.8 | 0.7 | 0.6 |
| Merensky Mill feed content | (koz 4E) | 1 888.2 | 70.9 | 66.1 | 56.6 | 48.1 | 58.7 | 62.0 | 47.7 | 33.8 | 35.3 | 22.8 | 31.6 | 29.4 | 31.1 | 38.4 | 45.8 |
| UG2 Mill Feed content | (koz 4E) | 5 980.6 | 259.0 | 258.7 | 266.8 | 246.5 | 201.9 | 145.9 | 125.9 | 122.1 | 95.9 | 97.8 | 84.8 | 93.0 | 99.1 | 91.9 | 69.5 |
| Merensky Recovered 4E into concentrate | (koz 4E) | 1 415.7 | 53.3 | 49.2 | 41.8 | 34.6 | 44.1 | 46.8 | 38.5 | 28.9 | 30.3 | 18.9 | 25.9 | 24.1 | 25.9 | 32.0 | 37.4 |
| UG2 Recovered 4E into concentrate | (koz 4E) | 4 904.4 | 216.9 | 216.8 | 223.2 | 206.4 | 167.8 | 120.2 | 103.1 | 100.0 | 78.3 | 79.5 | 69.4 | 76.1 | 81.3 | 75.5 | 56.7 |
| Merensky concentrator recovery | (%) | 75.0% | 75.2% | 74.4% | 73.8% | 72.0% | 75.2% | 75.4% | 80.8% | 85.4% | 85.7% | 82.7% | 82.2% | 82.2% | 83.4% | 83.3% | 81.7% |
| UG2 concentrator recovery | (%) | 82.0% | 83.8% | 83.8% | 83.7% | 83.7% | 83.1% | 82.4% | 81.8% | 81.9% | 81.6% | 81.2% | 81.8% | 81.9% | 82.0% | 82.2% | 81.6% |
| Concentrate produced | (kt) | 1 147.2 | 46.2 | 45.1 | 44.0 | 40.1 | 37.7 | 32.5 | 24.5 | 19.9 | 17.6 | 14.8 | 15.4 | 15.7 | 16.8 | 17.7 | 16.8 |
| Concentrate grade | (g/t 4E) | 170.4 | 181.9 | 183.4 | 187.4 | 187.2 | 174.8 | 160.0 | 179.5 | 201.1 | 192.0 | 207.0 | 193.1 | 198.3 | 198.1 | 189.1 | 174.7 |
| TSP concentrate produced | (kt) | 196.1 | 8.2 | 8.1 | 8.1 | 7.4 | 6.7 | 5.7 | 4.4 | 3.7 | 3.1 | 3.1 | 2.9 | 3.1 | 3.2 | 3.1 | 2.9 |
| TSP concentrate grade | (g/t 4E) | 43.1 | 45.0 | 45.0 | 45.0 | 45.0 | 45.0 | 45.0 | 45.0 | 45.0 | 45.0 | 45.0 | 45.0 | 45.0 | 45.0 | 45.0 | 45.0 |
| Total concentrate | (kt) | 1 343.3 | 54.4 | 53.2 | 52.1 | 47.5 | 44.4 | 38.1 | 29.0 | 23.7 | 20.7 | 17.9 | 18.3 | 18.8 | 20.0 | 20.8 | 19.7 |
| Chromite concentrate produced | (kt) | 895.1 | 21.0 | 20.2 | 24.7 | 31.6 | 37.0 | 43.2 | 37.9 | 30.9 | 30.0 | 31.9 | 27.4 | 29.9 | 25.3 | 22.0 | 26.0 |
| Payable Metal | | | | | | | | | | | | | | | | | |
| 6E | (koz) | 7 967.7 | 345.8 | 341.5 | 341.1 | 310.5 | 270.1 | 210.8 | 178.4 | 162.5 | 135.6 | 124.2 | 119.2 | 125.8 | 134.3 | 133.8 | 116.3 |
| 4E | (koz) | 6 593.3 | 282.2 | 277.7 | 276.7 | 251.7 | 221.6 | 175.1 | 148.0 | 134.3 | 113.1 | 102.8 | 99.5 | 104.7 | 111.8 | 112.1 | 98.4 |
| Pt | (koz) | 4 054.4 | 171.4 | 168.4 | 167.9 | 153.1 | 135.8 | 108.4 | 91.4 | 82.6 | 69.9 | 63.4 | 61.4 | 64.6 | 68.8 | 69.1 | 60.9 |
| Pd | (koz) | 1 791.1 | 78.1 | 77.0 | 76.3 | 69.0 | 60.4 | 47.2 | 40.0 | 36.4 | 30.5 | 27.5 | 26.8 | 28.1 | 30.2 | 30.4 | 26.8 |
| Rh | (koz) | 667.6 | 29.2 | 29.1 | 29.6 | 27.2 | 22.9 | 17.2 | 14.8 | 13.9 | 11.4 | 11.0 | 10.1 | 10.8 | 11.6 | 11.2 | 9.2 |
| Ru | (koz) | 1 053.8 | 46.9 | 46.8 | 47.5 | 43.6 | 36.6 | 27.6 | 23.8 | 22.1 | 18.1 | 17.3 | 15.9 | 17.1 | 18.1 | 17.5 | 14.5 |
| Ir | (koz) | 320.7 | 16.7 | 17.0 | 16.9 | 15.2 | 11.8 | 8.0 | 6.7 | 6.1 | 4.5 | 4.1 | 3.8 | 4.1 | 4.4 | 4.2 | 3.4 |
| Au | (koz) | 80.2 | 3.4 | 3.2 | 2.9 | 2.4 | 2.5 | 2.4 | 1.8 | 1.4 | 1.4 | 0.9 | 1.2 | 1.2 | 1.2 | 1.4 | 1.6 |
| Ni | (kt) | 6.8 | 0.3 | 0.2 | 0.2 | 0.2 | 0.2 | 0.2 | 0.1 | 0.1 | 0.1 | 0.1 | 0.1 | 0.1 | 0.1 | 0.1 | 0.1 |
| Cu | (kt) | 6.7 | 0.2 | 0.2 | 0.2 | 0.1 | 0.2 | 0.2 | 0.1 | 0.1 | 0.1 | 0.1 | 0.1 | 0.1 | 0.1 | 0.1 | 0.2 |
| Chromite (40% to 42% Cr2O3) | (kt) | 895.1 | 21.0 | 20.2 | 24.7 | 31.6 | 37.0 | 43.2 | 37.9 | 30.9 | 30.0 | 31.9 | 27.4 | 29.9 | 25.3 | 22.0 | 26.0 |
| SRK | | Report date: 27 May 2022
Effective Date: 31 December 2021 |
| | | |
| SRK Consulting – 576060 SPM PSM Project TRS | Page 218 |
Table 18.4: P-S-M Project – Production Parameters (2052 to 2061)
| Item | Units | Total/ Average | 2052 | 2053 | 2054 | 2055 | 2056 | 2057 | 2058 | 2059 | 2060 | 2061 |
| Production | | | | | | | | | | | | |
| East Pit Merensky RoM | (Mt) | 12.9 | 0.0 | 0.0 | 0.0 | 0.0 | 0.0 | 0.0 | 0.0 | 0.0 | 0.0 | 0.0 |
| East Pit UG2 RoM | (Mt) | 7.7 | 0.0 | 0.0 | 0.0 | 0.0 | 0.0 | 0.0 | 0.0 | 0.0 | 0.0 | 0.0 |
| West Pit Merensky RoM | (Mt) | 8.3 | 0.0 | 0.0 | 0.0 | 0.0 | 0.0 | 0.0 | 0.0 | 0.0 | 0.0 | 0.0 |
| West Pit UG2 RoM | (Mt) | 4.8 | 0.0 | 0.0 | 0.0 | 0.0 | 0.0 | 0.0 | 0.0 | 0.0 | 0.0 | 0.0 |
| East Block Merensky RoM | (Mt) | 7.0 | 0.3 | 0.3 | 0.3 | 0.4 | 0.3 | 0.3 | 0.2 | 0.2 | 0.2 | 0.1 |
| East Block UG2 RoM | (Mt) | 24.0 | 0.6 | 0.6 | 0.5 | 0.5 | 0.6 | 0.6 | 0.7 | 0.8 | 0.8 | 0.3 |
| Central Block Merensky RoM | (Mt) | 0.7 | 0.0 | 0.0 | 0.0 | 0.0 | 0.0 | 0.0 | 0.0 | 0.0 | 0.0 | 0.0 |
| Central Block UG2 RoM | (Mt) | 12.1 | 0.0 | 0.0 | 0.0 | 0.0 | 0.0 | 0.0 | 0.0 | 0.0 | 0.0 | 0.0 |
| Total RoM ore | (Mt) | 77.5 | 0.9 | 0.9 | 0.8 | 0.9 | 0.9 | 0.9 | 1.0 | 1.0 | 1.0 | 0.3 |
| East Pit Merensky RoM grade | (g/t 4E) | 1.01 | 0.00 | 0.00 | 0.00 | 0.00 | 0.00 | 0.00 | 0.00 | 0.00 | 0.00 | 0.00 |
| East Pit UG2 RoM grade | (g/t 4E) | 2.47 | 0.00 | 0.00 | 0.00 | 0.00 | 0.00 | 0.00 | 0.00 | 0.00 | 0.00 | 0.00 |
| West Pit Merensky RoM grade | (g/t 4E) | 1.32 | 0.00 | 0.00 | 0.00 | 0.00 | 0.00 | 0.00 | 0.00 | 0.00 | 0.00 | 0.00 |
| West Pit UG2 RoM grade | (g/t 4E) | 2.15 | 0.00 | 0.00 | 0.00 | 0.00 | 0.00 | 0.00 | 0.00 | 0.00 | 0.00 | 0.00 |
| East Block Merensky RoM grade | (g/t 4E) | 4.52 | 4.32 | 4.48 | 4.71 | 4.59 | 4.54 | 4.62 | 4.62 | 3.88 | 4.46 | 4.26 |
| East Block UG2 RoM grade | (g/t 4E) | 4.12 | 3.78 | 3.53 | 3.51 | 3.78 | 3.84 | 3.71 | 3.80 | 3.92 | 3.87 | 3.85 |
| Central Block Merensky RoM grade | (g/t 4E) | 4.59 | 0.00 | 0.00 | 0.00 | 0.00 | 0.00 | 0.00 | 0.00 | 0.00 | 0.00 | 0.00 |
| Central Block UG2 RoM grade | (g/t 4E) | 4.77 | 0.00 | 0.00 | 0.00 | 0.00 | 0.00 | 0.00 | 0.00 | 0.00 | 0.00 | 0.00 |
| Total RoM ore grade | (g/t 4E) | 3.16 | 3.98 | 3.85 | 3.98 | 4.10 | 4.04 | 4.01 | 3.98 | 3.91 | 3.98 | 3.91 |
| Total Merensky RoM content | (koz 4E) | 1 888.2 | 47.6 | 43.6 | 50.1 | 51.6 | 38.2 | 42.9 | 30.8 | 23.4 | 25.8 | 7.3 |
| Total UG2 RoM content | (koz 4E) | 5 978.2 | 68.6 | 68.3 | 58.1 | 62.8 | 79.5 | 70.5 | 91.2 | 103.8 | 99.3 | 35.8 |
| Merensky Mill feed | (Mt) | 28.9 | 0.3 | 0.3 | 0.3 | 0.4 | 0.3 | 0.3 | 0.2 | 0.2 | 0.2 | 0.1 |
| UG2 Mill Feed | (Mt) | 48.8 | 0.6 | 0.6 | 0.5 | 0.5 | 0.6 | 0.6 | 0.7 | 0.8 | 0.8 | 0.3 |
| Merensky Mill feed content | (koz 4E) | 1 888.2 | 47.6 | 43.6 | 50.1 | 51.6 | 38.2 | 42.9 | 30.8 | 23.4 | 25.8 | 7.3 |
| UG2 Mill Feed content | (koz 4E) | 5 980.6 | 68.6 | 68.3 | 58.1 | 62.8 | 79.5 | 70.5 | 91.2 | 103.8 | 99.3 | 35.8 |
| Merensky Recovered 4E into concentrate | (koz 4E) | 1 415.7 | 39.2 | 36.2 | 42.0 | 43.1 | 31.8 | 36.0 | 25.7 | 18.8 | 21.4 | 6.0 |
| UG2 Recovered 4E into concentrate | (koz 4E) | 4 904.4 | 55.8 | 54.8 | 46.6 | 51.0 | 64.7 | 57.2 | 74.2 | 84.9 | 81.1 | 29.2 |
| Merensky concentrator recovery | (%) | 75.0% | 82.4% | 83.0% | 83.9% | 83.5% | 83.5% | 83.8% | 83.6% | 80.5% | 83.0% | 82.2% |
| UG2 concentrator recovery | (%) | 82.0% | 81.3% | 80.3% | 80.2% | 81.2% | 81.4% | 81.1% | 81.4% | 81.8% | 81.7% | 81.6% |
| Concentrate produced | (kt) | 1 147.2 | 17.1 | 16.2 | 16.7 | 17.5 | 16.3 | 16.4 | 15.9 | 15.4 | 15.7 | 5.2 |
| Concentrate grade | (g/t 4E) | 170.4 | 172.8 | 174.7 | 165.1 | 167.1 | 184.2 | 176.3 | 195.5 | 208.9 | 203.8 | 211.0 |
| TSP concentrate produced | (kt) | 196.1 | 2.9 | 2.9 | 2.7 | 2.8 | 2.9 | 2.8 | 3.0 | 3.2 | 3.1 | 1.1 |
| TSP concentrate grade | (g/t 4E) | 43.1 | 45.0 | 45.0 | 45.0 | 45.0 | 45.0 | 45.0 | 45.0 | 45.0 | 45.0 | 45.0 |
| Total concentrate | (kt) | 1 343.3 | 20.0 | 19.1 | 19.4 | 20.3 | 19.2 | 19.2 | 18.9 | 18.7 | 18.8 | 6.3 |
| Chromite concentrate produced | (kt) | 895.1 | 24.4 | 32.4 | 31.5 | 24.5 | 24.2 | 28.4 | 26.9 | 21.4 | 22.1 | 7.1 |
| Payable Metal | | | | | | | | | | | | |
| 6E | (koz) | 7 967.7 | 117.0 | 112.5 | 108.5 | 115.3 | 119.9 | 115.1 | 125.2 | 131.0 | 129.0 | 44.5 |
| 4E | (koz) | 6 593.3 | 99.2 | 95.2 | 92.5 | 98.2 | 100.7 | 97.2 | 104.4 | 108.4 | 107.1 | 36.8 |
| Pt | (koz) | 4 054.4 | 61.3 | 59.0 | 57.6 | 60.9 | 62.2 | 60.3 | 64.3 | 66.4 | 65.6 | 22.5 |
| Pd | (koz) | 1 791.1 | 27.1 | 25.8 | 25.1 | 26.8 | 27.3 | 26.3 | 28.2 | 29.4 | 29.1 | 10.0 |
| Rh | (koz) | 667.6 | 9.1 | 8.8 | 8.1 | 8.8 | 9.9 | 9.2 | 10.7 | 11.6 | 11.3 | 4.0 |
| Ru | (koz) | 1 053.8 | 14.4 | 14.1 | 13.0 | 13.8 | 15.5 | 14.4 | 16.8 | 18.1 | 17.6 | 6.2 |
| Ir | (koz) | 320.7 | 3.4 | 3.3 | 3.0 | 3.2 | 3.7 | 3.4 | 4.0 | 4.4 | 4.3 | 1.5 |
| Au | (koz) | 80.2 | 1.7 | 1.6 | 1.7 | 1.7 | 1.4 | 1.5 | 1.2 | 1.0 | 1.1 | 0.3 |
| Ni | (kt) | 6.8 | 0.1 | 0.1 | 0.1 | 0.1 | 0.1 | 0.1 | 0.1 | 0.1 | 0.1 | 0.0 |
| Cu | (kt) | 6.7 | 0.2 | 0.2 | 0.2 | 0.2 | 0.1 | 0.1 | 0.1 | 0.1 | 0.1 | 0.0 |
| Chromite (40% to 42% Cr2O3) | (kt) | 895.1 | 24.4 | 32.4 | 31.5 | 24.5 | 24.2 | 28.4 | 26.9 | 21.4 | 22.1 | 7.1 |
| SRK | | Report date: 27 May 2022
Effective Date: 31 December 2021 |
| | | |
| SRK Consulting – 576060 SPM PSM Project TRS | Page 219 |
Table 18.5: P-S-M Project – Real Terms Revenue and Opex Parameters (2022 to 2036)
| Item | Units | Totals/ Averages | 2022 | 2023 | 2024 | 2025 | 2026 | 2027 | 2028 | 2029 | 2030 | 2031 | 2032 | 2033 | 2034 | 2035 | 2036 |
| Revenue | | | | | | | | | | | | | | | | | |
| PGM (6E) Revenue (smelting& refining) | (ZARm) | 23 319 | 7 861 | 8 233 | 263 | 241 | 219 | 195 | 154 | 282 | 323 | 348 | 308 | 313 | 314 | 306 | 295 |
| Base Metal Revenue (smelting & refining) | (ZARm) | 376 | 70 | 91 | 7 | 8 | 9 | 8 | 8 | 5 | 2 | 4 | 4 | 4 | 4 | 6 | 12 |
| PGM (6E) Revenue (Kell refining) | (ZARm) | 212 413 | 0 | 0 | 7 415 | 6 469 | 6 414 | 6 439 | 6 083 | 6 989 | 9 144 | 10 063 | 9 261 | 9 500 | 9 325 | 9 190 | 8 856 |
| Base Metal Revenue (Kell refining) | (ZARm) | 1 630 | 0 | 0 | 90 | 103 | 120 | 111 | 117 | 34 | 17 | 27 | 30 | 29 | 28 | 37 | 59 |
| Chromite Revenue | (ZARm) | 1 168 | 25 | 16 | 19 | 38 | 21 | 15 | 15 | 0 | 0 | 49 | 2 | 6 | 7 | 11 | 21 |
| Smelting and Refining | | | | | | | | | | | | | | | | | |
| Contained Metal Value | (ZARm) | 28 877 | 9 225 | 9 869 | 343 | 321 | 299 | 269 | 218 | 371 | 418 | 453 | 401 | 408 | 409 | 404 | 412 |
| Payable Metal Value | (ZARm) | 24 780 | 8 099 | 8 435 | 288 | 268 | 248 | 225 | 182 | 315 | 359 | 389 | 345 | 351 | 352 | 345 | 343 |
| Smelting Royalties | (ZARm) | 0 | 0 | 0 | 0 | 0 | 0 | 0 | 0 | 0 | 0 | 0 | 0 | 0 | 0 | 0 | 0 |
| Smelting Treatment Charges | (ZARm) | 1 085 | 168 | 111 | 18 | 19 | 20 | 22 | 20 | 28 | 34 | 37 | 33 | 34 | 34 | 34 | 36 |
| Smelting & Refining Net Revenue | (ZARm) | 23 695 | 7 931 | 8 324 | 270 | 249 | 228 | 203 | 162 | 287 | 325 | 352 | 312 | 317 | 318 | 312 | 307 |
| Kell and Refining | | | | | | | | | | | | | | | | | |
| Contained Metal Value | (ZARm) | 246 734 | 0 | 0 | 8 948 | 7 828 | 7 514 | 7 544 | 7 191 | 8 041 | 10 497 | 11 588 | 10 699 | 10 973 | 10 770 | 10 629 | 10 280 |
| Payable Metal Value | (ZARm) | 217 983 | 0 | 0 | 7 641 | 6 714 | 6 683 | 6 721 | 6 420 | 7 131 | 9 281 | 10 222 | 9 425 | 9 672 | 9 495 | 9 372 | 9 075 |
| Kell Royalties | (ZARm) | 1 169 | 0 | 0 | 0 | 20 | 38 | 38 | 36 | 40 | 52 | 58 | 53 | 55 | 54 | 53 | 51 |
| Kell Treatment Charges | (ZARm) | 5 110 | 0 | 0 | 136 | 162 | 187 | 209 | 257 | 148 | 171 | 189 | 188 | 198 | 196 | 197 | 212 |
| Kell & Refining Net Revenue | (ZARm) | 214 042 | 0 | 0 | 7 505 | 6 572 | 6 534 | 6 550 | 6 199 | 7 023 | 9 162 | 10 090 | 9 290 | 9 529 | 9 353 | 9 228 | 8 915 |
| Net Revenue | (ZARm) | 238 905 | 7 957 | 8 340 | 7 795 | 6 860 | 6 784 | 6 768 | 6 376 | 7 310 | 9 488 | 10 491 | 9 604 | 9 852 | 9 678 | 9 551 | 9 243 |
| Operating Costs | (ZARm) | 103 260 | 3 212 | 3 673 | 3 765 | 3 841 | 3 235 | 2 460 | 2 325 | 1 416 | 3 166 | 3 633 | 3 748 | 3 749 | 3 697 | 3 323 | 3 353 |
| Mining | (ZARm) | 43 070 | 1 549 | 1 794 | 1 827 | 1 835 | 1 244 | 641 | 689 | 288 | 1 385 | 1 622 | 1 724 | 1 731 | 1 713 | 1 505 | 1 428 |
| Engineering | (ZARm) | 4 297 | 0 | 0 | 0 | 0 | 0 | 0 | 0 | 0 | 137 | 168 | 169 | 169 | 169 | 169 | 169 |
| Processing - concentrator & laboratory | (ZARm) | 21 427 | 758 | 857 | 874 | 890 | 899 | 843 | 725 | 429 | 662 | 686 | 704 | 705 | 706 | 697 | 707 |
| Processing - TSP | (ZARm) | 1 799 | 54 | 67 | 70 | 73 | 76 | 71 | 54 | 24 | 47 | 61 | 64 | 64 | 64 | 63 | 64 |
| Processing - Chromite | (ZARm) | 156 | 5 | 3 | 4 | 5 | 3 | 2 | 2 | 0 | 0 | 6 | 0 | 1 | 1 | 1 | 3 |
| Ore transport costs | (ZARm) | 994 | 34 | 79 | 108 | 133 | 141 | 107 | 80 | 43 | 10 | 13 | 13 | 13 | 13 | 12 | 12 |
| On-mine G&A costs | (ZARm) | 9 471 | 175 | 179 | 134 | 134 | 134 | 134 | 127 | 67 | 224 | 268 | 268 | 268 | 268 | 268 | 268 |
| SLP/Mining Charter III | (ZARm) | 4 226 | 55 | 55 | 55 | 55 | 55 | 55 | 55 | 41 | 167 | 230 | 205 | 212 | 208 | 215 | 205 |
| Environmental | (ZARm) | 473 | 9 | 9 | 7 | 7 | 7 | 7 | 6 | 3 | 11 | 13 | 13 | 13 | 13 | 13 | 13 |
| Closure liability | (ZARm) | 1 385 | 100 | 87 | 108 | 105 | 110 | 117 | 177 | 328 | 92 | 62 | 70 | 55 | 27 | -103 | 6 |
| Corporate Overheads | (ZARm) | 5 025 | 132 | 132 | 132 | 131 | 128 | 118 | 98 | 45 | 110 | 132 | 132 | 132 | 132 | 132 | 132 |
| MRM G&A Costs | (ZARm) | 1 279 | 93 | 128 | 155 | 176 | 183 | 165 | 127 | 39 | 7 | 10 | 10 | 10 | 11 | 10 | 10 |
| SIB costs | (ZARm) | 4 978 | 99 | 114 | 117 | 119 | 107 | 88 | 78 | 43 | 174 | 198 | 207 | 208 | 207 | 190 | 185 |
| Contingency | (ZARm) | 4 680 | 148 | 169 | 174 | 177 | 149 | 113 | 107 | 65 | 142 | 164 | 169 | 169 | 166 | 149 | 151 |
| Unit cost (cash cost) | (ZAR/t RoM) | 624 | 536 | 461 | 394 | 352 | 237 | 137 | 176 | 160 | 970 | 905 | 935 | 926 | 901 | 819 | 789 |
| | (ZAR/oz 4E payable) | 15 661 | 25 109 | 29 557 | 30 559 | 30 961 | 23 779 | 15 220 | 12 816 | 7 233 | 11 453 | 12 091 | 13 637 | 13 198 | 13 255 | 11 957 | 12 108 |
| SRK | | Report date: 27 May 2022
Effective Date: 31 December 2021 |
| | | |
| SRK Consulting – 576060 SPM PSM Project TRS | Page 220 |
Table 18.6: P-S-M Project – Real Terms Revenue and Opex Parameters (2037 to 2051)
| Item | Units | Totals/ Averages | 2037 | 2038 | 2039 | 2040 | 2041 | 2042 | 2043 | 2044 | 2045 | 2046 | 2047 | 2048 | 2049 | 2050 | 2051 |
| Revenue | | | | | | | | | | | | | | | | | |
| PGM (6E) Revenue (smelting& refining) | (ZARm) | 23 319 | 296 | 292 | 295 | 270 | 240 | 195 | 162 | 145 | 116 | 118 | 105 | 113 | 117 | 113 | 100 |
| Base Metal Revenue (smelting & refining) | (ZARm) | 376 | 12 | 12 | 11 | 10 | 11 | 11 | 6 | 3 | 3 | 2 | 3 | 3 | 3 | 4 | 4 |
| PGM (6E) Revenue (Kell refining) | (ZARm) | 212 413 | 9 000 | 8 940 | 9 007 | 8 225 | 6 983 | 5 291 | 4 549 | 4 226 | 3 477 | 3 260 | 3 059 | 3 254 | 3 492 | 3 432 | 2 872 |
| Base Metal Revenue (Kell refining) | (ZARm) | 1 630 | 60 | 58 | 50 | 42 | 48 | 51 | 37 | 25 | 26 | 19 | 25 | 24 | 24 | 29 | 36 |
| Chromite Revenue | (ZARm) | 1 168 | 28 | 27 | 33 | 43 | 50 | 58 | 51 | 42 | 41 | 43 | 37 | 40 | 34 | 30 | 35 |
| Smelting and Refining | | | | | | | | | | | | | | | | | |
| Contained Metal Value | (ZARm) | 28 877 | 411 | 406 | 408 | 374 | 336 | 277 | 221 | 191 | 159 | 158 | 145 | 154 | 160 | 156 | 140 |
| Payable Metal Value | (ZARm) | 24 780 | 344 | 339 | 341 | 312 | 280 | 231 | 187 | 164 | 133 | 134 | 121 | 129 | 133 | 130 | 117 |
| Smelting Royalties | (ZARm) | 0 | 0 | 0 | 0 | 0 | 0 | 0 | 0 | 0 | 0 | 0 | 0 | 0 | 0 | 0 | 0 |
| Smelting Treatment Charges | (ZARm) | 1 085 | 36 | 35 | 35 | 32 | 29 | 25 | 19 | 16 | 14 | 13 | 13 | 13 | 14 | 14 | 13 |
| Smelting & Refining Net Revenue | (ZARm) | 23 695 | 308 | 304 | 306 | 280 | 251 | 206 | 168 | 148 | 120 | 121 | 108 | 116 | 120 | 117 | 104 |
| Kell and Refining | | | | | | | | | | | | | | | | | |
| Contained Metal Value | (ZARm) | 246 734 | 10 446 | 10 379 | 10 440 | 9 528 | 8 104 | 6 162 | 5 272 | 4 874 | 4 016 | 3 754 | 3 534 | 3 754 | 4 026 | 3 966 | 3 337 |
| Payable Metal Value | (ZARm) | 217 983 | 9 224 | 9 157 | 9 210 | 8 407 | 7 167 | 5 464 | 4 677 | 4 322 | 3 569 | 3 333 | 3 141 | 3 335 | 3 578 | 3 527 | 2 973 |
| Kell Royalties | (ZARm) | 1 169 | 52 | 52 | 52 | 48 | 41 | 31 | 26 | 24 | 20 | 19 | 18 | 19 | 20 | 20 | 17 |
| Kell Treatment Charges | (ZARm) | 5 110 | 216 | 211 | 206 | 188 | 177 | 153 | 117 | 96 | 85 | 72 | 75 | 77 | 82 | 85 | 81 |
| Kell & Refining Net Revenue | (ZARm) | 214 042 | 9 060 | 8 998 | 9 057 | 8 267 | 7 031 | 5 342 | 4 586 | 4 251 | 3 504 | 3 280 | 3 084 | 3 278 | 3 516 | 3 461 | 2 908 |
| Net Revenue | (ZARm) | 238 905 | 9 397 | 9 329 | 9 396 | 8 590 | 7 332 | 5 607 | 4 805 | 4 440 | 3 664 | 3 444 | 3 229 | 3 434 | 3 670 | 3 608 | 3 047 |
| Operating Costs | (ZARm) | 103 260 | 3 343 | 3 339 | 3 293 | 3 154 | 2 953 | 2 690 | 2 421 | 2 212 | 2 115 | 2 035 | 1 936 | 1 938 | 1 992 | 1 987 | 1 937 |
| Mining | (ZARm) | 43 070 | 1 418 | 1 422 | 1 380 | 1 303 | 1 180 | 1 030 | 990 | 917 | 884 | 845 | 797 | 787 | 826 | 826 | 802 |
| Engineering | (ZARm) | 4 297 | 171 | 171 | 171 | 171 | 171 | 171 | 173 | 160 | 154 | 129 | 105 | 105 | 105 | 105 | 105 |
| Processing - concentrator & laboratory | (ZARm) | 21 427 | 706 | 701 | 700 | 677 | 655 | 617 | 446 | 359 | 337 | 335 | 326 | 332 | 336 | 335 | 327 |
| Processing - TSP | (ZARm) | 1 799 | 64 | 63 | 63 | 60 | 56 | 51 | 38 | 32 | 29 | 28 | 27 | 28 | 29 | 28 | 27 |
| Processing - Chromite | (ZARm) | 156 | 4 | 4 | 4 | 6 | 6 | 8 | 7 | 5 | 5 | 6 | 5 | 5 | 4 | 4 | 5 |
| Ore transport costs | (ZARm) | 994 | 12 | 12 | 12 | 11 | 10 | 8 | 8 | 7 | 7 | 7 | 6 | 6 | 7 | 7 | 6 |
| On-mine G&A costs | (ZARm) | 9 471 | 268 | 268 | 268 | 268 | 268 | 268 | 268 | 268 | 268 | 268 | 268 | 268 | 268 | 268 | 268 |
| SLP/Mining Charter III | (ZARm) | 4 226 | 209 | 206 | 208 | 188 | 158 | 117 | 100 | 96 | 75 | 70 | 66 | 70 | 75 | 73 | 61 |
| Environmental | (ZARm) | 473 | 13 | 13 | 13 | 13 | 13 | 13 | 13 | 13 | 13 | 13 | 13 | 13 | 13 | 13 | 13 |
| Closure liability | (ZARm) | 1 385 | 2 | 2 | 2 | 2 | 1 | 1 | 1 | 1 | 1 | 1 | 1 | 1 | 1 | 1 | 1 |
| Corporate Overheads | (ZARm) | 5 025 | 132 | 132 | 132 | 132 | 132 | 132 | 132 | 132 | 132 | 132 | 132 | 132 | 132 | 132 | 132 |
| MRM G&A Costs | (ZARm) | 1 279 | 10 | 10 | 10 | 9 | 8 | 7 | 6 | 6 | 5 | 5 | 5 | 5 | 5 | 5 | 5 |
| SIB costs | (ZARm) | 4 978 | 184 | 184 | 181 | 173 | 161 | 146 | 129 | 115 | 110 | 105 | 98 | 98 | 101 | 101 | 99 |
| Contingency | (ZARm) | 4 680 | 150 | 150 | 148 | 142 | 133 | 121 | 109 | 100 | 95 | 92 | 88 | 88 | 90 | 90 | 88 |
| Unit cost (cash cost) | (ZAR/t RoM) | 624 | 799 | 794 | 777 | 817 | 831 | 911 | 947 | 940 | 1 073 | 1 022 | 1 023 | 962 | 965 | 977 | 1 016 |
| | (ZAR/oz 4E payable) | 15 661 | 11 847 | 12 025 | 11 902 | 12 528 | 13 327 | 15 358 | 16 357 | 16 464 | 18 694 | 19 795 | 19 454 | 18 513 | 17 817 | 17 733 | 19 686 |
| SRK | | Report date: 27 May 2022
Effective Date: 31 December 2021 |
| | | |
| SRK Consulting – 576060 SPM PSM Project TRS | Page 221 |
Table 18.7: P-S-M Project – Real terms Revenue and Opex Parameters (2052 to 2066)
| Item | Units | Totals/ Averages | 2052 | 2053 | 2054 | 2055 | 2056 | 2057 | 2058 | 2059 | 2060 | 2061 | 2062 | 2063 | 2064 | 2065 | 2066 |
| Revenue | | | | | | | | | | | | | | | | | |
| PGM (6E) Revenue (smelting& refining) | (ZARm) | 23 319 | 100 | 100 | 92 | 95 | 104 | 98 | 113 | 124 | 119 | 43 | 0 | 0 | 0 | 0 | 7 |
| Base Metal Revenue (smelting & refining) | (ZARm) | 376 | 4 | 4 | 4 | 5 | 4 | 4 | 3 | 2 | 3 | 1 | 0 | 0 | 0 | 0 | 0 |
| PGM (6E) Revenue (Kell refining) | (ZARm) | 212 413 | 2 876 | 2 762 | 2 603 | 2 800 | 3 035 | 2 862 | 3 237 | 3 461 | 3 384 | 1 178 | 0 | 0 | 0 | 0 | 0 |
| Base Metal Revenue (Kell refining) | (ZARm) | 1 630 | 36 | 32 | 36 | 37 | 28 | 32 | 24 | 20 | 21 | 6 | 0 | 0 | 0 | 0 | 0 |
| Chromite Revenue | (ZARm) | 1 168 | 33 | 44 | 43 | 33 | 33 | 38 | 36 | 29 | 30 | 10 | 0 | 0 | 0 | 0 | 0 |
| Smelting and Refining | | | | | | | | | | | | | | | | | |
| Contained Metal Value | (ZARm) | 28 877 | 141 | 140 | 129 | 134 | 144 | 137 | 153 | 165 | 159 | 56 | 0 | 0 | 0 | 0 | 0 |
| Payable Metal Value | (ZARm) | 24 780 | 117 | 116 | 108 | 112 | 120 | 114 | 129 | 141 | 135 | 48 | 0 | 0 | 0 | 0 | 0 |
| Smelting Royalties | (ZARm) | 0 | 0 | 0 | 0 | 0 | 0 | 0 | 0 | 0 | 0 | 0 | 0 | 0 | 0 | 0 | 0 |
| Smelting Treatment Charges | (ZARm) | 1 085 | 13 | 12 | 12 | 12 | 13 | 12 | 13 | 14 | 13 | 5 | 0 | 0 | 0 | 0 | 0 |
| Smelting & Refining Net Revenue | (ZARm) | 23 695 | 105 | 104 | 96 | 100 | 108 | 102 | 116 | 127 | 122 | 43 | 0 | 0 | 0 | 0 | 0 |
| Kell and Refining | | | | | | | | | | | | | | | | | |
| Contained Metal Value | (ZARm) | 246 734 | 3 342 | 3 207 | 3 032 | 3 258 | 3 512 | 3 319 | 3 735 | 3 983 | 3 897 | 1 355 | 0 | 0 | 0 | 0 | 0 |
| Payable Metal Value | (ZARm) | 217 983 | 2 978 | 2 857 | 2 705 | 2 906 | 3 125 | 2 956 | 3 320 | 3 536 | 3 461 | 1 203 | 0 | 0 | 0 | 0 | 0 |
| Kell Royalties | (ZARm) | 1 169 | 17 | 16 | 15 | 16 | 18 | 17 | 19 | 20 | 19 | 7 | 0 | 0 | 0 | 0 | 0 |
| Kell Treatment Charges | (ZARm) | 5 110 | 83 | 79 | 81 | 85 | 79 | 80 | 77 | 75 | 76 | 26 | 0 | 0 | 0 | 0 | 0 |
| Kell & Refining Net Revenue | (ZARm) | 214 042 | 2 912 | 2 794 | 2 639 | 2 837 | 3 063 | 2 893 | 3 261 | 3 481 | 3 404 | 1 184 | 0 | 0 | 0 | 0 | 0 |
| Net Revenue | (ZARm) | 238 905 | 3 049 | 2 942 | 2 778 | 2 970 | 3 204 | 3 034 | 3 413 | 3 636 | 3 556 | 1 237 | 0 | 0 | 0 | 0 | 0 |
| Operating Costs | (ZARm) | 103 260 | 1 932 | 1 902 | 1 859 | 1 858 | 1 920 | 1 817 | 1 851 | 1 808 | 1 709 | 806 | 81 | -68 | -77 | -86 | 2 |
| Mining | (ZARm) | 43 070 | 796 | 771 | 745 | 739 | 784 | 698 | 709 | 660 | 580 | 206 | 0 | 0 | 0 | 0 | 0 |
| Engineering | (ZARm) | 4 297 | 105 | 105 | 105 | 105 | 105 | 105 | 105 | 105 | 105 | 38 | 0 | 0 | 0 | 0 | 0 |
| Processing - concentrator & laboratory | (ZARm) | 21 427 | 329 | 328 | 321 | 324 | 328 | 325 | 334 | 341 | 337 | 133 | 0 | 0 | 0 | 0 | 0 |
| Processing - TSP | (ZARm) | 1 799 | 27 | 27 | 26 | 27 | 27 | 27 | 28 | 29 | 29 | 11 | 0 | 0 | 0 | 0 | 0 |
| Processing - Chromite | (ZARm) | 156 | 4 | 6 | 6 | 4 | 4 | 5 | 5 | 4 | 4 | 1 | 0 | 0 | 0 | 0 | 0 |
| Ore transport costs | (ZARm) | 994 | 6 | 6 | 6 | 6 | 6 | 6 | 6 | 7 | 6 | 2 | 0 | 0 | 0 | 0 | 0 |
| On-mine G&A costs | (ZARm) | 9 471 | 268 | 268 | 268 | 268 | 268 | 268 | 268 | 268 | 268 | 112 | 0 | 0 | 0 | 0 | 0 |
| SLP/Mining Charter III | (ZARm) | 4 226 | 60 | 58 | 55 | 58 | 62 | 60 | 69 | 72 | 69 | 22 | 0 | 0 | 0 | 0 | 0 |
| Environmental | (ZARm) | 473 | 13 | 13 | 13 | 13 | 13 | 13 | 13 | 13 | 13 | 6 | 0 | 0 | 0 | 0 | 0 |
| Closure liability | (ZARm) | 1 385 | 1 | 1 | 1 | 1 | 1 | 1 | 1 | 1 | 1 | 152 | 77 | -65 | -74 | -82 | 2 |
| Corporate Overheads | (ZARm) | 5 025 | 132 | 132 | 132 | 132 | 132 | 132 | 132 | 132 | 132 | 55 | 0 | 0 | 0 | 0 | 0 |
| MRM G&A Costs | (ZARm) | 1 279 | 5 | 5 | 4 | 4 | 5 | 4 | 5 | 5 | 5 | 2 | 0 | 0 | 0 | 0 | 0 |
| SIB costs | (ZARm) | 4 978 | 98 | 96 | 94 | 93 | 97 | 90 | 92 | 89 | 82 | 30 | 0 | 0 | 0 | 0 | 0 |
| Contingency | (ZARm) | 4 680 | 87 | 86 | 84 | 84 | 87 | 82 | 84 | 82 | 77 | 37 | 4 | -3 | -4 | -4 | 0 |
| Unit cost (cash cost) | (ZAR/t RoM) | 624 | 999 | 975 | 1 011 | 978 | 988 | 919 | 861 | 763 | 707 | 718 | 0 | 0 | 0 | 0 | 0 |
| | (ZAR/oz 4E payable) | 15 661 | 19 477 | 19 984 | 20 095 | 18 923 | 19 057 | 18 688 | 17 734 | 16 676 | 15 960 | 21 916 | 0 | 0 | 0 | 0 | 0 |
| SRK | | Report date: 27 May 2022
Effective Date: 31 December 2021 |
| | | |
| SRK Consulting – 576060 SPM PSM Project TRS | Page 222 |
Table 18.8: P-S-M Project – Real Terms Cash Flow Parameters (2022 to 2036)
| Item | Units | Totals/ Averages | 2022 | 2023 | 2024 | 2025 | 2026 | 2027 | 2028 | 2029 | 2030 | 2031 | 2032 | 2033 | 2034 | 2035 | 2036 |
| Net Revenue | (ZARm) | 238 905 | 7 957 | 8 340 | 7 795 | 6 860 | 6 784 | 6 768 | 6 376 | 7 310 | 9 488 | 10 491 | 9 604 | 9 852 | 9 678 | 9 551 | 9 243 |
| Operating Costs | (ZARm) | 103 260 | 3 212 | 3 673 | 3 765 | 3 841 | 3 235 | 2 460 | 2 325 | 1 416 | 3 166 | 3 633 | 3 748 | 3 749 | 3 697 | 3 323 | 3 353 |
| Capital Cost | (ZARm) | 16 889 | 2 013 | 928 | 1 207 | 1 327 | 1 777 | 2 701 | 3 126 | 3 223 | 587 | 0 | 0 | 0 | 0 | 0 | 0 |
| Exploration | (ZARm) | 118 | 26 | 37 | 14 | 23 | 19 | 0 | 0 | 0 | 0 | 0 | 0 | 0 | 0 | 0 | 0 |
| Pre Implementation | (ZARm) | 295 | 108 | 32 | 26 | 26 | 26 | 26 | 26 | 26 | 0 | 0 | 0 | 0 | 0 | 0 | 0 |
| Mining | (ZARm) | 10 795 | 585 | 324 | 979 | 1 083 | 1 348 | 2 017 | 1 861 | 2 166 | 432 | 0 | 0 | 0 | 0 | 0 | 0 |
| Surface Infrastructure | (ZARm) | 1 955 | 346 | 155 | 98 | 98 | 168 | 169 | 298 | 569 | 54 | 0 | 0 | 0 | 0 | 0 | 0 |
| Surface services, water, power, access | (ZARm) | 640 | 192 | 228 | 24 | 19 | 99 | 72 | 3 | 3 | 1 | 0 | 0 | 0 | 0 | 0 | 0 |
| Metallurgical Processing | (ZARm) | 1 993 | 603 | 90 | 0 | 2 | 16 | 243 | 687 | 283 | 71 | 0 | 0 | 0 | 0 | 0 | 0 |
| Closure Liability | (ZARm) | 0 | 0 | 0 | 0 | 0 | 0 | 0 | 0 | 0 | 0 | 0 | 0 | 0 | 0 | 0 | 0 |
| Contingency | (ZARm) | 1 093 | 154 | 63 | 66 | 77 | 101 | 175 | 251 | 176 | 30 | 0 | 0 | 0 | 0 | 0 | 0 |
| Cash Flow | | | | | | | | | | | | | | | | | |
| Operating Profit | (ZARm) | 135 645 | 4 744 | 4 668 | 4 030 | 3 019 | 3 549 | 4 308 | 4 051 | 5 895 | 6 322 | 6 858 | 5 856 | 6 103 | 5 981 | 6 228 | 5 891 |
| MPRDA Royalty | (ZARm) | 10 074 | 260 | 341 | 265 | 170 | 176 | 162 | 106 | 250 | 474 | 525 | 480 | 493 | 484 | 478 | 462 |
| Capital Expenditure | (ZARm) | 16 889 | 2 013 | 928 | 1 207 | 1 327 | 1 777 | 2 701 | 3 126 | 3 223 | 587 | 0 | 0 | 0 | 0 | 0 | 0 |
| Change in working capital | (ZARm) | 0 | 395 | -6 | -53 | -84 | 44 | 63 | -21 | 154 | 36 | 45 | -83 | 21 | -10 | 21 | -28 |
| Taxable income | (ZARm) | 108 682 | 2 076 | 3 405 | 2 611 | 1 606 | 1 552 | 1 381 | 841 | 2 268 | 5 224 | 6 289 | 5 459 | 5 590 | 5 507 | 5 730 | 5 456 |
| Income tax payable | (ZARm) | 27 748 | 0 | 0 | 589 | 434 | 419 | 373 | 227 | 612 | 1 411 | 1 698 | 1 474 | 1 509 | 1 487 | 1 547 | 1 473 |
| After-tax Cash Flow | (ZARm) | 80 934 | 2 076 | 3 405 | 2 022 | 1 172 | 1 133 | 1 008 | 614 | 1 656 | 3 814 | 4 591 | 3 985 | 4 080 | 4 020 | 4 183 | 3 983 |
Table 18.9: P-S-M Project – Real Terms Cash Flow Parameters (2037 to 2051)
| Item | Units | Totals/ Averages | 2037 | 2038 | 2039 | 2040 | 2041 | 2042 | 2043 | 2044 | 2045 | 2046 | 2047 | 2048 | 2049 | 2050 | 2051 |
| Net Revenue | (ZARm) | 238 905 | 9 397 | 9 329 | 9 396 | 8 590 | 7 332 | 5 607 | 4 805 | 4 440 | 3 664 | 3 444 | 3 229 | 3 434 | 3 670 | 3 608 | 3 047 |
| Operating Costs | (ZARm) | 103 260 | 3 343 | 3 339 | 3 293 | 3 154 | 2 953 | 2 690 | 2 421 | 2 212 | 2 115 | 2 035 | 1 936 | 1 938 | 1 992 | 1 987 | 1 937 |
| Capital Cost | (ZARm) | 16 889 | 0 | 0 | 0 | 0 | 0 | 0 | 0 | 0 | 0 | 0 | 0 | 0 | 0 | 0 | 0 |
| Exploration | (ZARm) | 118 | 0 | 0 | 0 | 0 | 0 | 0 | 0 | 0 | 0 | 0 | 0 | 0 | 0 | 0 | 0 |
| Pre Implementation | (ZARm) | 295 | 0 | 0 | 0 | 0 | 0 | 0 | 0 | 0 | 0 | 0 | 0 | 0 | 0 | 0 | 0 |
| Mining | (ZARm) | 10 795 | 0 | 0 | 0 | 0 | 0 | 0 | 0 | 0 | 0 | 0 | 0 | 0 | 0 | 0 | 0 |
| Surface Infrastructure | (ZARm) | 1 955 | 0 | 0 | 0 | 0 | 0 | 0 | 0 | 0 | 0 | 0 | 0 | 0 | 0 | 0 | 0 |
| Surface services, water, power, access | (ZARm) | 640 | 0 | 0 | 0 | 0 | 0 | 0 | 0 | 0 | 0 | 0 | 0 | 0 | 0 | 0 | 0 |
| Metallurgical Processing | (ZARm) | 1 993 | 0 | 0 | 0 | 0 | 0 | 0 | 0 | 0 | 0 | 0 | 0 | 0 | 0 | 0 | 0 |
| Closure Liability | (ZARm) | 0 | 0 | 0 | 0 | 0 | 0 | 0 | 0 | 0 | 0 | 0 | 0 | 0 | 0 | 0 | 0 |
| Contingency | (ZARm) | 1 093 | 0 | 0 | 0 | 0 | 0 | 0 | 0 | 0 | 0 | 0 | 0 | 0 | 0 | 0 | 0 |
| Cash Flow | | 0 | | | | | | | | | | | | | | | |
| Operating Profit | (ZARm) | 135 645 | 6 054 | 5 990 | 6 103 | 5 436 | 4 379 | 2 917 | 2 384 | 2 229 | 1 549 | 1 409 | 1 293 | 1 496 | 1 678 | 1 621 | 1 110 |
| MPRDA Royalty | (ZARm) | 10 074 | 470 | 466 | 470 | 429 | 367 | 261 | 215 | 200 | 142 | 130 | 120 | 137 | 153 | 148 | 104 |
| Capital Expenditure | (ZARm) | 16 889 | 0 | 0 | 0 | 0 | 0 | 0 | 0 | 0 | 0 | 0 | 0 | 0 | 0 | 0 | 0 |
| Change in working capital | (ZARm) | 0 | 14 | -5 | 9 | -56 | -88 | -122 | -44 | -13 | -57 | -12 | -10 | 17 | 15 | -5 | -43 |
| Taxable income | (ZARm) | 108 682 | 5 570 | 5 529 | 5 624 | 5 062 | 4 100 | 2 777 | 2 213 | 2 041 | 1 463 | 1 291 | 1 183 | 1 342 | 1 510 | 1 478 | 1 048 |
| Income tax payable | (ZARm) | 27 748 | 1 504 | 1 493 | 1 518 | 1 367 | 1 107 | 750 | 598 | 551 | 395 | 348 | 319 | 362 | 408 | 399 | 283 |
| After-tax Cash Flow | (ZARm) | 80 934 | 4 066 | 4 036 | 4 105 | 3 696 | 2 993 | 2 027 | 1 616 | 1 490 | 1 068 | 942 | 864 | 980 | 1 102 | 1 079 | 765 |
| SRK | | Report date: 27 May 2022
Effective Date: 31 December 2021 |
| | | |
| SRK Consulting – 576060 SPM PSM Project TRS | Page 223 |
Table 18.10: P-S-M Project – Real terms Cash Flow Parameters (2052 to 2066)
| Item | Units | Totals/ Averages | 2052 | 2053 | 2054 | 2055 | 2056 | 2057 | 2058 | 2059 | 2060 | 2061 | 2062 | 2063 | 2064 | 2065 | 2066 |
| Net Revenue | (ZARm) | 238 905 | 3 049 | 2 942 | 2 778 | 2 970 | 3 204 | 3 034 | 3 413 | 3 636 | 3 556 | 1 237 | 0 | 0 | 0 | 0 | 0 |
| Operating Costs | (ZARm) | 103 260 | 1 932 | 1 902 | 1 859 | 1 858 | 1 920 | 1 817 | 1 851 | 1 808 | 1 709 | 806 | 81 | -68 | -77 | -86 | 2 |
| Capital Cost | (ZARm) | 16 889 | 0 | 0 | 0 | 0 | 0 | 0 | 0 | 0 | 0 | 0 | 0 | 0 | 0 | 0 | 0 |
| Exploration | (ZARm) | 118 | 0 | 0 | 0 | 0 | 0 | 0 | 0 | 0 | 0 | 0 | 0 | 0 | 0 | 0 | 0 |
| Pre Implementation | (ZARm) | 295 | 0 | 0 | 0 | 0 | 0 | 0 | 0 | 0 | 0 | 0 | 0 | 0 | 0 | 0 | 0 |
| Mining | (ZARm) | 10 795 | 0 | 0 | 0 | 0 | 0 | 0 | 0 | 0 | 0 | 0 | 0 | 0 | 0 | 0 | 0 |
| Surface Infrastructure | (ZARm) | 1 955 | 0 | 0 | 0 | 0 | 0 | 0 | 0 | 0 | 0 | 0 | 0 | 0 | 0 | 0 | 0 |
| Surface services, water, power, access | (ZARm) | 640 | 0 | 0 | 0 | 0 | 0 | 0 | 0 | 0 | 0 | 0 | 0 | 0 | 0 | 0 | 0 |
| Metallurgical Processing | (ZARm) | 1 993 | 0 | 0 | 0 | 0 | 0 | 0 | 0 | 0 | 0 | 0 | 0 | 0 | 0 | 0 | 0 |
| Closure Liability | (ZARm) | 0 | 0 | 0 | 0 | 0 | 0 | 0 | 0 | 0 | 0 | 0 | 0 | 0 | 0 | 0 | 0 |
| Contingency | (ZARm) | 1 093 | 0 | 0 | 0 | 0 | 0 | 0 | 0 | 0 | 0 | 0 | 0 | 0 | 0 | 0 | 0 |
| Cash Flow | | 0 | | | | | | | | | | | | | | | |
| Operating Profit | (ZARm) | 135 645 | 1 117 | 1 040 | 918 | 1 112 | 1 284 | 1 217 | 1 562 | 1 828 | 1 847 | 430 | -81 | 68 | 77 | 86 | -2 |
| Capital Expenditure | (ZARm) | 10 074 | 105 | 98 | 87 | 104 | 119 | 112 | 142 | 164 | 166 | 41 | 0 | 0 | 0 | 0 | 0 |
| MPRDA Royalty | (ZARm) | 16 889 | 0 | 0 | 0 | 0 | 0 | 0 | 0 | 0 | 0 | 0 | 0 | 0 | 0 | 0 | 0 |
| Change in working capital | (ZARm) | 0 | 1 | -6 | -10 | 16 | 14 | -6 | 29 | 22 | 2 | -118 | -43 | 12 | 1 | 1 | -7 |
| Taxable income | (ZARm) | 108 682 | 1 012 | 949 | 841 | 992 | 1 151 | 1 110 | 1 392 | 1 641 | 1 680 | 508 | -38 | 56 | 76 | 85 | 6 |
| Income tax payable | (ZARm) | 27 748 | 273 | 256 | 227 | 268 | 311 | 300 | 376 | 443 | 453 | 137 | -10 | 15 | 21 | 23 | 2 |
| After-tax Cash Flow | (ZARm) | 80 934 | 739 | 693 | 614 | 724 | 840 | 810 | 1 016 | 1 198 | 1 226 | 371 | -28 | 41 | 56 | 62 | 4 |
| SRK | | Report date: 27 May 2022
Effective Date: 31 December 2021 |
| | | |
| SRK Consulting – 576060 SPM PSM Project TRS | Page 224 |
| 18.2.2 | Economic Viability Measures |
The Net Present Value (NPV) of the real terms post-tax cash flows in the P-S-M TEM (Table 18.8 to Table 18.10) at a range of discount values and other financial indicators, based on the CRU (2021) prices and ZAR:USD exchange rate, are set out in Table 18.11. Similar results from the use of three-year trailing averages and spot values at 31 December 2021 are included in Table 18.11 for comparative purposes.
Table 18.11: Key Financial Results from P-S-M Project TEM Cash Flow
| Item | Units | CRU (2021) | Alternative Price Decks (Section 15) |
Three-year trailing average | Spot (31 Dec’21) |
| NPV | | | | |
| 8% | (ZARm) | 30 945 | 18 481 | 27 610 |
| 8.4% (WACC lower limit) | (ZARm) | 29 830 | 17 348 | 26 142 |
| 9.0% (SPM’s WACC) | (ZARm) | 28 276 | 15 778 | 24 109 |
| 10.7% (WACC upper limit) | (ZARm) | 24 540 | 12 048 | 19 268 |
| 11% | (ZARm) | 23 968 | 11 483 | 18 534 |
| 12% | (ZARm) | 22 220 | 9 772 | 16 305 |
| Other Financial Indicators | | | | |
| Operating margin | (%) | 57% | 54% | 60% |
| IRR | (%) | N/A | 25% | 39% |
| Total Capex | (ZARm) | 16 889 | 16 791 | 16 889 |
| SIB Capex (in Opex) | (ZARm) | 4 978 | 4 978 | 4 978 |
| Peak funding | (ZARm) | N/A | -6 685 | -3 343 |
| Payback period | (years) | 0 | 8 | 7 |
| Av. unit cost (incl. Royalty) | (ZAR/t RoM) | 436 | 436 | 436 |
| (Open Pit – average 2022-2025) | (ZAR/4E oz) | 29 046 | 29 046 | 29 046 |
| Av. unit cost (incl. Royalty) | (ZAR/t RoM) | 840 | 840 | 840 |
| (U/G – average 2032-2040) | (ZAR/4E oz) | 12 495 | 12 534 | 12 694 |
| N/A | not applicable. Cannot be calculated (first year positive) or capital injection not required |
[§229.601(b)(96)(iii)(B)(19)(ii) (iii)] [SR5.8(iv)]
The sensitivities of the NPV of the real post-tax UG2 TEM cash flows are evaluated as follows:
| · | The variation in the real NPV at 9.0% (NPV9.0%) based on twin (6E basket price and exchange rate) sensitivities (Table 18.12); |
| · | The variation in real NPV9.0% based on twin (revenue and operating expenditure) sensitivities (Table 18.13); and |
| · | The variation in real NPV9.0% based on twin (capital and operating expenditure) sensitivities (Table 18.14). |
Table 18.12: P-S-M TEM – variation in real NPV9.0% based on twin (6E basket price and exchange rate) sensitivities)
| | | 6E Basket | LT 6E Price Sensitivity |
| NPV at 9.0% | | Price (USD/oz) | 1 679 | 1 778 | 1 877 | 1 976 | 2 074 | 2 173 | 2 272 |
| All values in ZARm | | | | -15% | -10% | -5% | 0% | 5% | 10% | 15% |
LT ZAR:USD
Exchange Rate
Sensitivity | | 13.80 | -15% | 11 389 | 14 057 | 16 712 | 19 329 | 21 858 | 24 384 | 26 909 |
| | 14.61 | -10% | 14 067 | 16 878 | 19 641 | 22 314 | 24 988 | 27 662 | 30 333 |
| | 15.42 | -5% | 16 732 | 19 651 | 22 473 | 25 295 | 28 118 | 30 935 | 33 743 |
| | 16.23 | 0% | 19 359 | 22 334 | 25 305 | 28 276 | 31 241 | 34 196 | 37 152 |
| | 17.04 | 5% | 21 896 | 25 018 | 28 138 | 31 251 | 34 355 | 37 459 | 40 564 |
| | 17.85 | 10% | 24 434 | 27 702 | 30 966 | 34 217 | 37 469 | 40 723 | 43 977 |
| | 18.67 | 15% | 26 969 | 30 386 | 33 784 | 37 184 | 40 585 | 43 987 | 47 400 |
| SRK | | Report date: 27 May 2022
Effective Date: 31 December 2021 |
| | | |
| SRK Consulting – 576060 SPM PSM Project TRS | Page 225 |
Table 18.13: P-S-M TEM – variation in real NPV9.0% based on twin (Revenue and Opex) sensitivities
| NPV at 9.0% | 6E Basket Price | Revenue Sensitivity |
| All values in ZARm | (USD/oz) | 1 679 | 1 778 | 1 877 | 1 976 | 2 074 | 2 173 | 2 272 |
| | -15% | -10% | -5% | 0% | 5% | 10% | 15% |
| Opex Sensitivity | -15% | 22 540 | 25 763 | 28 986 | 32 198 | 35 405 | 38 613 | 41 820 |
| -10% | 21 223 | 24 452 | 27 675 | 30 894 | 34 101 | 37 308 | 40 516 |
| -5% | 19 901 | 23 141 | 26 364 | 29 587 | 32 797 | 36 004 | 39 211 |
| 0% | 18 564 | 21 827 | 25 053 | 28 276 | 31 492 | 34 700 | 37 907 |
| 5% | 17 190 | 20 506 | 23 742 | 26 965 | 30 188 | 33 395 | 36 603 |
| 10% | 15 800 | 19 172 | 22 431 | 25 654 | 28 878 | 32 091 | 35 298 |
| 15% | 14 409 | 17 804 | 21 110 | 24 343 | 27 566 | 30 787 | 33 994 |
Table 18.14: P-S-M TEM – variation in real NPV9.0% based on twin (Capex and Opex) sensitivities
| NPV at 9.0% | | Capex Sensitivity |
| All values in ZARm | -15% | -10% | -5% | 0% | 5% | 10% | 15% |
Opex Sensitivity | -15% | 33 501 | 33 067 | 32 632 | 32 198 | 31 764 | 31 329 | 30 895 |
| -10% | 32 197 | 31 763 | 31 328 | 30 894 | 30 459 | 30 023 | 29 586 |
| -5% | 30 893 | 30 458 | 30 024 | 29 587 | 29 150 | 28 712 | 28 275 |
| 0% | 29 588 | 29 151 | 28 714 | 28 276 | 27 839 | 27 401 | 26 964 |
| 5% | 28 278 | 27 840 | 27 403 | 26 965 | 26 528 | 26 090 | 25 653 |
| 10% | 26 967 | 26 529 | 26 092 | 25 654 | 25 217 | 24 779 | 24 342 |
| 15% | 25 656 | 25 218 | 24 781 | 24 343 | 23 906 | 23 468 | 23 031 |
| 18.3.1 | Discussion of Results |
Use of the CRU price deck (Table 15.2) yields a real-terms post-tax NPV9.0% of ZAR28.3bn and an operating margin of 57%. The IRR cannot be determined as the cash flows are positive in each period, i.e., the project is self-funding from the operating profit. The average steady-state underground operating costs of ZAR840/t RoM and ZAR12 495/oz 4E are comparable to those at Amandelbult (Table 19.4) for similar mining depths.
With the use of the three-year trailing average price and exchange rate values, a real-terms NPV9.0% of ZAR15.8bn, an IRR of 25% and an operating margin of 54% result. Peak funding of ZAR6.68bn would be required under this price/exchange rate scenario and the pay-back period is shown to be eight years. The spot values at 31 December 2021 yield a real-terms NPV9.0% of ZAR24.1bn and an operating margin of 60%.
The average steady-state operating costs are largely unaffected by which price deck is used.
Table 18.12 shows that for a ±15% change in the 6E basket price or the ZAR:USD exchange rate based on the CRU price deck, the NPV9.0% varies between ZAR19.3bn and ZAR37.2bn.
The twin-sensitivity tables show that the P-S-M Project is most sensitive to changes in Revenue and least sensitive to changes in Capex.
| 18.4 | Economic analysis in an initial assessment |
[§229.601(b)(96)(iii)(B)(19)(iv)] [§229.1302(d)(4)(ii)]
The economic analysis of the P-S-M Project has been done at an effective level of a pre-feasibility study as defined by SK1300, which is more advanced than an initial assessment.
The economic analysis of the P-S-M Project is based on a detailed LoM plan which exploits Probable Mineral Reserves that are derived from Measured and Indicated Mineral Resources. Measured Mineral Reserves at the East Underground Block are converted to Probable Mineral Reserves since SPM will only declare Proved Mineral Reserves for an underground operation when the required development to support a mining block has been established and the ore block has been sampled. SRK supports this view.
No Inferred Mineral Resources have been included in the LoM plan nor the cash flow analysis.
The TRS contains statements of a forward-looking nature. The achievability of the projections, LoM plans, budgets and forecast TEPs as included in the TRS is neither warranted nor guaranteed by SRK. The projections cannot be assured as they are based on economic assumptions, many of which are beyond the control of the Company or SRK.
| SRK | | Report date: 27 May 2022
Effective Date: 31 December 2021 |
| | | |
| SRK Consulting – 576060 SPM PSM Project TRS | Page 226 |
[§229.601(b)(96)(iii)(B)(20)] [SR1.3(i)]
Adjacent properties to the P-S-M Project are shown in Figure 19.1. The Kruidfontein Project is described in a separate TRS prepared for SPM and not discussed further here.
The discussion in this section focuses on the Union Mine, Amandelbult Mine and Northam Platinum Mine.
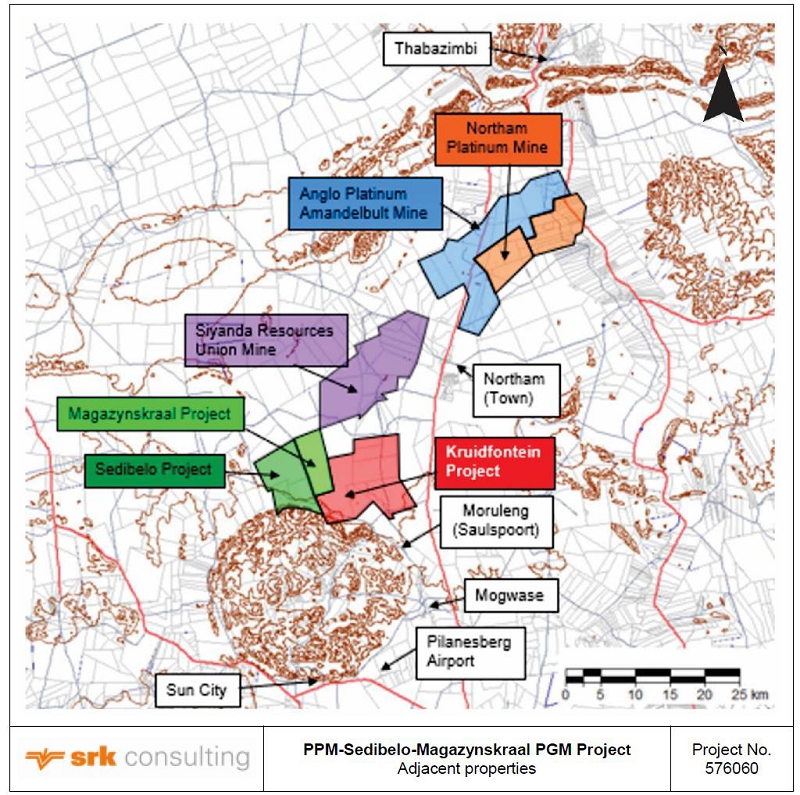
Figure 19.1: Adjacent properties
| 19.1 | Public disclosure of adjacent property |
[§229.601(b)(96)(iii)(B)(20)(i)]
There is no information on the Union Mine on the Siyanda Resources website. Since Anglo American Platinum (AAP) sold its 85% interest in the Union Mine to a subsidiary of Siyanda Resources in January 2018, reference has been made to the Integrated Annual Report (IAR) and Ore Reserves and Mineral Resources Report (ORMR) for 2017 which are publicly available on the AAP and Anglo American PLC (AAC) website.
The information related to the Amandelbult Mine and Northam Platinum Mine presented in this section is extracted from the IARs and ORMRs for 2020 which are publicly available on the respective websites of AAP/AAC and Northam Platinum Ltd (Northam).
| SRK | | Report date: 27 May 2022
Effective Date: 31 December 2021 |
| | | |
| SRK Consulting – 576060 SPM PSM Project TRS | Page 227 |
| 19.2 | Source of information |
[§229.601(b)(96)(iii)(B)(20)(ii)]
The descriptions of the three adjacent properties have been extracted from the IARs and ORMRs of AAP and/or AAC (for 2017 and 2020) and Northam (for 2020). Details are provided in Section 24 – References.
| 19.3 | Non-verified information |
[§229.601(b)(96)(iii)(B)(20)(iii)]
The information contained in an ORMR is prepared by or under the supervision of Competent Persons as defined by the SAMREC Code (2016 Edition). These Competent Persons are industry professionals with more than five years’ of relevant experience in the type of mineralization and type of activity, and thereby satisfy the requirements of Qualified Persons in terms of SK1300.
The ORMR includes a statement by the Competent Persons that they “consent to the inclusion in this report of the information in the form and context in which it appears”. As such, they take responsibility for the correctness of the disclosure and would be subject to disciplinary action from their Recognised Professional Organization in the event of material misinformation or errors.
The information contained in the IARs is prepared by or under the supervision of the directors of the company, who have a fiduciary responsibility to the shareholders. Further, financial results contained in the IARs have been audited and signed off by an independent auditing company, Deloitte LLP for AAC’s 2017 IAR, PwC LLP for AAC’s 2020 IAR and Ernst and Young Inc for Northam’s 2020 IAR.
SRK as the qualified person states that it has been unable to verify the information in the ORMR and/or IAR reports and that the information presented here is not necessarily indicative of the mineralization on the respective properties.
| 19.4 | Adjacent property information |
[§229.601(b)(96)(iii)(B)(20)(iv)]
The Union Mine was acquired by Siyanda Bakgatla Platinum Mine (Pty) Ltd, a joint venture between Siyanda Resources Ltd and the Bakgatla-Ba-Kgafela, from AAP effective 1 February 2018. The only information regarding Union Mine on the Siyanda Resources website is that it is a platinum producing mine and also produces palladium, rhodium, gold and chrome as by-products.
Access is via a number of vertical shafts and decline systems. Mining runs from surface to 1 500 m below surface using conventional breast mining with strike pillars. Hybrid mining occurs in the declines. Mining extracts mainly UG2 ore, with limited amounts of Merensky Reef ore. Union mine operates under a NOMR that covers 119 km2.
The summarized Ore Reserves and Mineral Resources for Union Mine at December 2017 is set out in Table 19.1 (AAC, 2018b). Mineral Resources are reported as additional to Ore Reserves (i.e., exclusive reporting).
Table 19.1: Union Mine – Summary Ore Reserves and Mineral Resources at December 2017 (AAC, 2018b)
| Mineral Resources | Tonnes | Grade | 4E Metal | Ore Reserves | Tonnes | Grade | 4E Metal |
| (Mt) | (4E g/t) | (Moz) | (Mt) | (4E g/t) | (Moz) |
| Merensky | | | | Merensky | | | |
| Measured | 27.0 | 6.38 | 5.5 | Proved | 1.4 | 4.68 | 0.2 |
| Indicated | 39.2 | 5.98 | 7.5 | Probable | 1.1 | 5.67 | 0.2 |
| Total Meas/Ind Merensky | 66.2 | 6.14 | 13.1 | Total Merensky | 2.5 | 5.13 | 0.4 |
| UG2 | | | | UG2 | | | |
| Measured | 47.2 | 5.10 | 7.7 | Proved | 34.2 | 4.39 | 3.8 |
| Indicated | 43.5 | 5.51 | 7.7 | Probable | 6.1 | 3.79 | 0.7 |
| Total Meas/Ind UG2 | 90.7 | 5.30 | 15.4 | Total UG2 | 40.2 | 4.30 | 5.6 |
| Tailings | | | | Tailings | | | |
| Measured | | | | Proved | | | |
| Indicated | n/s | | | Probable | 0.8 | 1.24 | 0 |
| Total Meas/Ind Tailings | n/s | | | Total Tailings | 0.8 | 1.24 | 0 |
| Inferred | | | | | | | |
| Merensky | 20.8 | 5.76 | 3.9 | | | | |
| UG2 | 39.9 | 5.44 | 7.0 | | | | |
Note:
Mineral Resources are reported as additional to Ore Reserves.
A summary of the key TEPs for Union Mine in 2017 is set out in Table 19.2.
| SRK | | Report date: 27 May 2022
Effective Date: 31 December 2021 |
| | | |
| SRK Consulting – 576060 SPM PSM Project TRS | Page 228 |
Table 19.2: Union Mine – Key TEPs (AAC, 2018a; AAC, 2018b; AAP, 2018a; AAP, 2018b)
| Description | Units | Value | Source |
| Resource cut Prill Split | | Merensky | UG2 | |
| Pt | (%) | 63.0 | 58.8 | ORMR (AAP, 2018b) |
| Pd | (%) | 28.6 | 29.4 | ORMR (AAP, 2018b) |
| Rh | (%) | 5.2 | 11,4 | ORMR (AAP, 2018b) |
| Au | (%) | 3.2 | 0.5 | ORMR (AAP, 2018b) |
| 4E Plant Recoveries | (%) | 85% - 87% | 75% - 86% | ORMR (AAC, 2018b) |
| Planned stoping width | (cm) | 156 | 153 | ORMR (AAC, 2018b) |
| Pay limit | (4E g/t) | 4.8 | ORMR (AAC, 2018b) |
| Mine Life | (years) | 18 | ORMR (AAP, 2018b) |
| Recovered PGMs | (koz Pt + Pd) | 226 | IAR (AAC, 2018a) |
| Total PGM production | (koz) | 309 | IAR (AAP, 2018a) |
| Unit Cost (1) | (USD/oz Pt) | 1 443 | IAR (AAC, 2018a) |
| Cash cost | (ZAR/PGM oz) | 10 567 | IAR (AAP, 2018a) |
| | | | | |
Note:
Total cash operating costs (includes on-mine, smelting and refining costs only) per Pt ounce of production
Amandelbult Mine consists of two mines, Tumela and Dishaba, with three concentrators and a chrome plant located between the towns of Northam and Thabazimbi in Limpopo Province, South Africa. The mines exploit both the Merensky and UG2 Reefs.
Mining has been underway since March 1976. The NOMR covers an area of 12 504 ha and is valid to July 2040 (AAP, 2021b).
Access is via five vertical shafts and seven decline systems. Mining runs from surface to 1.3 km below surface using conventional breast mining with strike pillars (AAP, 2018a). Short-life, high-value open-pit mining supplements underground production as production transitions from Tumela Upper to Dishaba Lower UG2.
The summarized Ore Reserves and Mineral Resources for Amandelbult Mine at December 2020 is set out in Table 19.3 (AAC, 2021b). Mineral Resources are reported as additional to Ore Reserves.
Table 19.3: Amandelbult Mine – Summary Ore Reserves and Mineral Resources at December 2020 (AAC, 2021b)
| Mineral Resources | Tonnes | Grade | 4E Metal | Ore Reserves | Tonnes | Grade | 4E Metal |
| (Mt) | (4E g/t) | (Moz) | (Mt) | (4E g/t) | (Moz) |
| Merensky | | | | Merensky | | | |
| Measured | 31.0 | 6.84 | 6.8 | Proved | 5.4 | 5.19 | 0.9 |
| Indicated | 56.8 | 7.02 | 12.9 | Probable | 5.4 | 4.85 | 0.9 |
| Total Meas/Ind Merensky | 87.8 | 6.95 | 19.7 | Total Merensky | 10.8 | 5.02 | 1.8 |
| UG2 | | | | UG2 | | | |
| Measured | 121.6 | 5.38 | 21.0 | Proved | 91.4 | 4.45 | 13.0 |
| Indicated | 66.9 | 5.61 | 12.0 | Probable | 8.6 | 4.34 | 1.2 |
| Total Meas/Ind UG2 | 188.5 | 5.46 | 33.1 | Total UG2 | 100.0 | 4.44 | 14.2 |
| Tailings | | | | Tailings | | | |
| Measured | 63.0 | 0.79 | 1.6 | Proved | 0 | | |
| Indicated | 8.1 | 0.82 | 0.2 | Probable | 0 | | |
| Total Meas/Ind Tailings | 71.1 | 0.79 | 1.8 | Total Tailings | 0.0 | | |
| Inferred | | | | | | | |
| Merensky | 57.2 | 6.87 | 12.7 | | | | |
| UG2 | 56.3 | 5.73 | 10.4 | | | | |
| Tailings | 1.2 | 0.91 | 0 | | | | |
Note:
Mineral Resources are reported as additional to Ore Reserves
A summary of the key TEPs for the Amandelbult Mine in 2020 is set out in Table 19.4.
| SRK | | Report date: 27 May 2022
Effective Date: 31 December 2021 |
| | | |
| SRK Consulting – 576060 SPM PSM Project TRS | Page 229 |
Table 19.4: Amandelbult – Key TEPs (AAC, 2021a; AAP, 2021a; AAP, 2021b)
| Description | Units | Value | Source |
| Modifying Factors - Tumela | | Merensky | UG2 | |
| Mining loss | (%) | 5% | 26% | ORMR (AAP, 2021b) |
| Mining dilution | (%) | 15% | 18% | ORMR (AAP, 2021b) |
| Planned stoping width | (cm) | 146 | 151 | ORMR (AAP, 2021b) |
| 4E concentrator recoveries | (%) | 83.6% | 85.4% | ORMR (AAP, 2021b) |
| Paylimit | (4E g/t) | 3.62 | 3.62 | ORMR (AAP, 2021b) |
| Modifying Factors - Dishaba | | Merensky | UG2 | |
| Mining loss | (%) | 35% | 36% | ORMR (AAP, 2021b) |
| Mining dilution | (%) | 37% | 21% | ORMR (AAP, 2021b) |
| Planned stoping width | (cm) | 147 | 158 | ORMR (AAP, 2021b) |
| 4E concentrator recoveries | (%) | 83% | 85% | ORMR (AAP, 2021b) |
| Paylimit | (4E g/t) | 3.96 | 3.96 | ORMR (AAP, 2021b) |
| RoM Production - Tumela | (Mt) | 0 | 2.5 | ORMR (AAP, 2021b) |
| RoM Production - Dishaba | (Mt) | 0.3 | 1.9 | ORMR (AAP, 2021b) |
| Mine Life | (years) | >14 | ORMR (AAC, 2021a) |
| Recovered PGMs | (koz 6E) | 608 | IAR (AAC, 2021a) |
| Unit Cost (1) | (USD/oz 6E) | 876 | IAR (AAC, 2021a) |
| On-mine cost | (ZAR/t milled) | 2 109 | IAR (AAP, 2021a) |
| Cash cost | (ZAR/PGM oz) | 16 979 | IAR (AAP, 2021a) |
| | | | | | | | |
Note:
Total cash operating costs (includes on-mine, smelting and refining costs only) per own mined PGM ounce of production
| 19.4.3 | Northam Platinum Mine |
Northam’s Zondereinde Mine (including Middeldrift and Western sections) lies southeast of AAP’s Amandelbult Mine located between the towns of Northam and Thabazimbi in Limpopo Province, South Africa.
The Merensky and UG2 Reefs are accessed via a twin vertical shaft system, where mining occurs between depths of 1 100 m and 2 000 m below surface, with deeper access via a decline system to a depth of 2 400 m. Mine development started in 1986, with ore production commencing in the early 1990s.
The NOMR covers 9 257 ha and is valid until July 2041.
The mining layout is a breast configuration on both the Merensky and UG2 Reefs. Surface infrastructure comprises two concentrator plants for Merensky and UG2 ore, a recently expanded smelter which houses two furnaces and a base metals removal plant (Northam, 2021a).
The summarized Mineral Resources and Mineral Reserves (MRMR) for Zondereinde Mine at June 2020 is set out in Table 19.3 (Northam, 2021b). Mineral Resources are reported inclusive of Mineral Reserves.
Table 19.5: Zondereinde Mine (Northam Mine) – Summary Mineral Resources and Mineral Reserves at June 2020 (Northam, 2021b)
| Mineral Resources | Tonnes | Grade | 4E Metal | Mineral Reserves | Tonnes | Grade | 4E Metal |
| (Mt) | (4E g/t) | (Moz) | (Mt) | (4E g/t) | (Moz) |
| Merensky | | | | Merensky | | | |
| Measured | 3.2 | 7.85 | 0.8 | Proved | 3.8 | 6.00 | 0.7 |
| Indicated | 38.2 | 7.78 | 9.6 | Probable | 22.6 | 5.69 | 4.1 |
| Total Meas/Ind Merensky | 41.4 | 7.79 | 10.4 | Total Merensky | 26.4 | 5.74 | 4.9 |
| UG2 | | | | UG2 | | | |
| Measured | 7.7 | 4.98 | 1.2 | Proved | 8.0 | 4.27 | 1.1 |
| Indicated | 78.6 | 4.98 | 12.6 | Probable | 53.6 | 4.27 | 7.4 |
| Total Meas/Ind UG2 | 86.2 | 4.98 | 13.8 | Total UG2 | 61.6 | 4.27 | 8.5 |
| Inferred | | | | | | | |
| Merensky | 165.6 | 7.42 | 39.5 | | | | |
| UG2 | 247.7 | 5.06 | 40.3 | | | | |
Note:
Mineral Resources are reported inclusive of Mineral Reserves.
A summary of the key TEPs for the Zondereinde Mine (Northam) in 2020 is set out in Table 19.6.
| SRK | | Report date: 27 May 2022
Effective Date: 31 December 2021 |
| | | |
| SRK Consulting – 576060 SPM PSM Project TRS | Page 230 |
Table 19.6: Zondereinde Mine (Northam) – Key TEPs (Northam, 2021a; Northam, 2021b)
| Description | Units | Value | Source |
| Resource cut Prill Split | | Merensky | UG2 | |
| Pt | (%) | 63.0 | 61.4 | MRMR (Northam, 2021b) |
| Pd | (%) | 29.2 | 27.0 | MRMR (Northam, 2021b) |
| Rh | (%) | 5.2 | 9.6 | MRMR (Northam, 2021b) |
| Au | (%) | 2.6 | 2.0 | MRMR (Northam, 2021b) |
| Modifying Factors | | Merensky | UG2 | |
| Geological/pillar/extraction losses | (%) | 29% | 36% | MRMR (Northam, 2021b) |
| Stope dilution | (%) | 2% / 9% | 1% | MRMR (Northam, 2021b) |
| Resource Channel width | (cm) | 120 / 160 | 146 | MRMR (Northam, 2021b) |
| Planned stoping width | (cm) | 147 | 140 - 160 | MRMR (Northam, 2021b) |
| RoM Production | (Mt) | 0.9 | 1.1 | MRMR (Northam, 2021b) |
| Mine life | (years) | >30 | IAR (Northam, 2021a) |
| Recovered PGMs | (koz 4E) | 249 | IAR (Northam, 2021a) |
| On-mine cost | (ZAR/t mined) | 2 253 | IAR (Northam, 2021a) |
| On-mine cost | (ZAR/t milled) | 2 629 | IAR (Northam, 2021a) |
| Cash cost | (ZAR/4E oz) | 19 498 | IAR (Northam, 2021a) |
| | | | | | | | |
| SRK | | Report date: 27 May 2022
Effective Date: 31 December 2021 |
| | | |
| SRK Consulting – 576060 SPM PSM Project TRS | Page 231 |
| 20 | OTHER RELEVANT DATA AND INFORMATION |
[§229.601(b)(96)(iii)(B)(21)] [SR8.1(i)]
| 20.1 | Project Implementation |
| 20.1.1 | Key Project Objectives |
The key project objective is to complete the construction and commissioning of the new underground mine and associated infrastructure for the Project and commence production according to the implementation programme envisaged in this chapter. Particular attention will be paid to achieving:
| · | Minimum time and cost overruns; |
| · | Minimum operational costs; |
| · | Minimum environmental impact; |
| · | Best possible safety; and |
| · | Maximum local employment opportunities. |
| 20.1.2 | Execution methodology |
Execution philosophy
The execution philosophy considers the best-fit for the Project and for SPM as an organisation. This has required that the following be considered:
| · | The trends, successes and failures of various execution strategies globally and in South Africa; |
| · | Selecting service providers and suppliers who share SPM’s vision; |
| · | SPM will work with all stakeholders such as national, regional and local government, communities; organised labour, investors and shareholders, to ensure that the Project creates sustainable value; and |
| · | Specifically, SPM will engage with DMRE’s Mining Inspectors regarding the designs and mining philosophies planned for the Project. This interaction will ensure that the Inspectorate is fully on board with the Project and any technical or safety issues raised can be dealt with prior to construction and mining activities starting. |
Project structure
The Project Owner’s Team aims to carry out all activities required to minimise cash flow and restrict long-term binding commitments until the Project is fully funded and approved for construction. These activities will be office based and therefore low cost, such as detailed design and procurement on firm items that are needed for the initial stages of the construction phase up to the appointment of the EPCM contractor, as currently envisaged.
Once the Project has been approved by the SPM Board to progress into execution, the following Project structure is envisaged, the details of which will be finalised before project implementation commences:
| · | The SPM Chief Operating Officer (COO) would have ultimate authority for the Project working with a small corporate executive team; |
| · | Staff members in the corporate team would ensure that all required permits, land ownership and licences are in place for the construction and operational phase of the Project; |
| · | A SPM Project Manager would be appointed with control of the day to day running of the Project and would report to the COO. The Project Manager would be supported by a Project Owner’s Team consisting of various technical personnel, either as in-house personnel or external consultants; |
| · | An EPCM contractor would be appointed to report to the Project Manager and into the Project Owner’s team, to carry out detailed design, preparation and negotiation of the individual contracts with the various sub-contractors and supervise the construction of the Project. The EPCM contractor would also manage the commissioning of the various Project work packages. The Project would be sub-divided into work packages that can be ring-fenced and managed with specific focus; |
| SRK | | Report date: 27 May 2022
Effective Date: 31 December 2021 |
| | | |
| SRK Consulting – 576060 SPM PSM Project TRS | Page 232 |
| • | Selected sub-contractors would be managed by the EPCM contractor. These contractors would include specialist earthworks, civils, electrical, steel fabrication and piping companies working across the various work packages; and |
| • | A quantity survey company independent from the EPCM contractor and reporting to the SPM Project Manager and Owner’s Team would be appointed to assist with updating Bills of Quantities (BOQS) and enquiry documents and certifying payment certificates from the various sub-contractors, amongst other activities. |
The EPCM contractor
The preliminary execution methodology has been structured on an Owner’s Team and EPCM basis. The Project will be executed such that the EPCM contractor takes overall responsibility for project and construction management, contract administration, procurement, cost control, planning, site management, SHEQ, site supervision and reporting, with the monitoring, review and decision functions provided by the Owner’s Team. The majority of the EPCM team will be site based with design engineers and drafting office staff located at the Contractor’s head office.
The permitting activities, design, engineering, specification, expediting, procurement input and quality control input will be performed by specialist consultants recommended by the owner.
| 20.1.3 | Safety, Health and Environmental and Quality (SHEQ) |
The project will be executed within the Company’s existing SHEQ guidelines, which will be developed and adapted by the Project Manager in conjunction with the existing management to suit the underground operations, so that the guidelines align across the company.
| 20.1.4 | Organisation and Staffing |
SPM envisages that the project organisation will consist of a SPM appointed Project Manager and support team. The Project Manager will be responsible for the implementation of the Project and for achieving the project objectives.
A preliminary organisation chart is shown in Figure 20.1. This will be adjusted and finalized during the Optimization Value Engineering Phase prior to EPCM contract finalization.
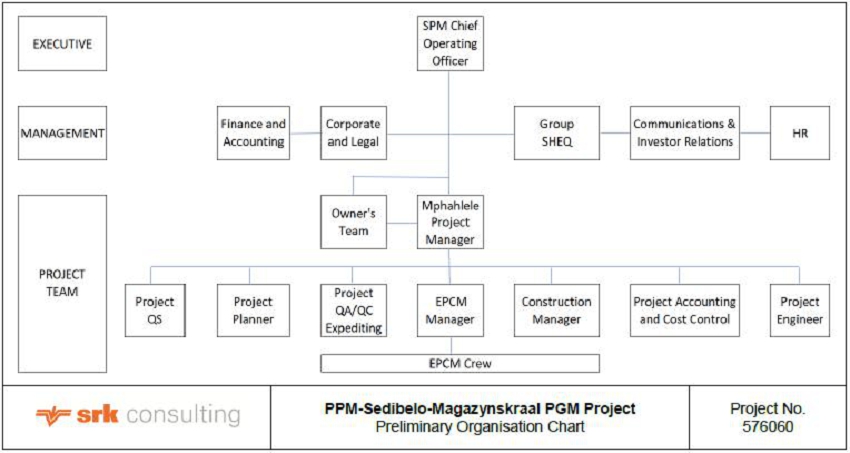
| Figure 20.1: | Preliminary Organisation Chart |
The Project Manager’s support team will be made up of the respective parties as per the Project Team Organisation Chart. This team will be based at the project site offices. The exception will be the engineering/design consultants who will function from their own premises where they will perform their required project functions and interface with the rest of the team for co-ordination and project review.
| SRK | | Report date: 27 May 2022
Effective Date: 31 December 2021 |
| | | |
| SRK Consulting – 576060 SPM PSM Project TRS | Page 233 |
The envisaged structure for the Project Team is as follows:
| • | Project Manager – Responsible for the entire Project and reporting to SPM Management. The Project Manager will be responsible for the project management, the procurement, quality management, construction and commissioning interfaces/inputs as well as the Engineering and Design Consultants. His duties will include the project management related to the cost, time, quality, resource, risk, communication and administration management to ensure that all work is completed safely on time, within budget and to prescribed Engineering Standards, Quality Standards and Codes of Practice; |
| • | Project Engineer – Responsible for the engineering and design effort performed by the Engineering and Design Consultants. His duties will include monitoring of deliverables, schedule, project cost control and co-ordination of design reviews with the team and SPM. He will also ensure that the project procedures and the best engineering principles, statutory regulations, statutory acts, codes of practice, industry norms, specifications and procedures applicable are utilised; |
| • | Project Planner – The project Planner will be responsible for generating and maintaining the overall Project Plan in accordance with the set guidelines. Responsible directly to the Project Manager, the Project Planner will obtain, review and incorporate the various disciplines’ planning information into the overall plan and provide the Project Team with weekly updates on progress. The Project Planner will also be responsible for the review of tender programmes submitted by suppliers and contractors at tender stage, and monitoring and reporting thereon; |
| • | Project Accounting/Cost Control Team – Responsible for the operation of the complete cost control system and the cost reporting for the Project. This will include the cost control of all areas, by consolidating the respective information provided by the various Project Team disciplines/ sectors and other Contractors/Consultants. The management of all cost control information will occur using the SPM financial system. Costs will be controlled in the currency of the orders. Reporting will be summarized in ZAR with separate detailed reports being available in each currency; |
| • | Construction Manager – Responsible for the construction function of the project, reporting directly to the Project Manager. The Construction Manager will be directly responsible for site safety, health, environmental and quality issues. The Construction Manager is responsible for the administration and management of the site construction efforts. He will be assisted by the discipline supervision team. The Construction Manager will support the Project Manager in performing co-ordination and technical management functions associated with the fabricators and construction contractors. The Construction Manager will engage the services of an underground surveyor who will be responsible for maintaining the underground plans and issuing development and stoping survey instructions; |
| • | Project Quantity Surveyor (QS) – Responsible for the Project Contracts Administration and QS services and reporting to the Project Manager. The responsibilities of the project QS will include: |
| o | Input into the enquiry documentation, BOQs, re-measurement and monthly certification and preliminary assessment, and cost control of all re-measurable contracts. These include the bulk earthworks, the civil contract, the structural steel, mechanical, platework, piping fabrication and erection contracts and the electrical and instrumentation installation contracts; |
| o | Compilation of monthly financial and cost related forecast data reports in a format to be agreed. The monthly cost reports will be subject to detailed review by other disciplines; |
| o | Perform the required contract administration of the contracts between SPM and the respective Engineering Contractors/Consultants as well as any of the fabrication and/ or construction contracts. The contract administration will include approving milestone progress certificates, evaluation of the cost control of Engineering Contractors/ Consultants contracts/ packages, including the verification of change orders submitted by the Engineering Contractors/ Consultants, checking progress measurement on site and finalising final accounts of all contracts; and |
| • | Project QA/QC and Expediting – As detailed in the Project Organisation Chart, during the manufacture and fabrication stage, this function will be the responsibility of the consultants. The Consultants’ Project QA/QC managers will be responsible for the setting up of the Project Quality Control Plan in consultation with the Company. The Quality Control Plan will be structured to cover the required activities for the inspection, release and expediting. Construction QA/QC will be the responsibility of the construction team. |
| SRK | | Report date: 27 May 2022
Effective Date: 31 December 2021 |
| | | |
| SRK Consulting – 576060 SPM PSM Project TRS | Page 234 |
| 20.1.5 | Preliminary Implementation schedule |
The preliminary implementation schedule compiled for the project includes the pre-implementation requirements, design, engineering, procurement and construction of the P-S-M Project with its associated surface and underground infrastructure facilities. The scheduled activities are per the 2020 FS adjusted for the delayed start of the project. Preliminary target dates for the implementation of the Project are shown in Table 20.1 and shown graphically in Figure 20.2.
The confidence in the accuracy of the schedule dates is not to the level required to implement the project. These schedules were determined as part of a study that is considered to be at pre-feasibility level due to incomplete information or omissions that are described earlier in this report (Section 1.1). The durations of the various activities are reasonable for a project of this nature.
| Table 20.1: | Preliminary Target Implementation Dates |
| Phase | Start
Date | Completion Date | Item |
| Pre-Implementation | Dec-21 | Dec-29 | EPCM Design and Implementation |
| Aug-21 | Dec-21 | Exploration Technical Drilling |
| Jan-22 | Dec-26 | Exploration Resource Drilling |
| Jan-22 | Sep-22 | Implementation Study |
| Jan-22 | Oct-22 | Operational Readiness Study |
| Jan-22 | Feb-23 | Optimisation Study |
| East Pit Mining | Apr-22 | First UG2 ore from East Pit |
| Jun-22 | First MR ore from East Pit |
| Construction and Ramp-up | Jan-22 | Jun-22 | East Boxcut Construction (Excavation and support) |
| Jul-22 | Jan-25 | East Decline Sinking |
| Jan-24 | Jun-24 | West Boxcut Construction (Excavation and support) |
| Jul-24 | Aug-27 | West Decline Sinking |
| Nov-24 | First UG2 ore from East Block |
| Aug-26 | First MR ore from East Block |
| Mar-27 | First UG2 ore from Central Block |
| Sep-30 | First MR ore from Central Block |
| Nov-30 | Steady State ore production achieved |
| SRK | | Report date: 27 May 2022
Effective Date: 31 December 2021 |
| | | |
| SRK Consulting – 576060 SPM PSM Project TRS | Page 235 |
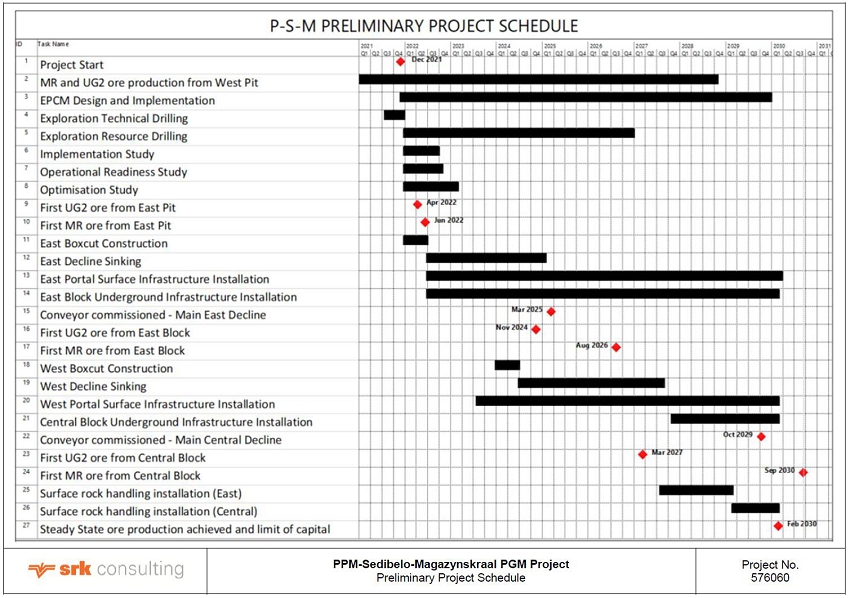
| Figure 20.2: | P-S-M Project - Preliminary Project Schedule |
| SRK | | Report date: 27 May 2022
Effective Date: 31 December 2021 |
| | | |
| SRK Consulting – 576060 SPM PSM Project TRS | Page 236 |
| 20.2 | Safety and Occupational Health |
Due to the nature of mining operations, exposure exists for possible harm to employees and contractors. The prime responsibility for health and safety rests with the management. The MHSA requires that the employer must be able to prove risk reduction and risk control using various forms of risk assessments (baseline risk, issue-based risk, continuous risk assessments, etc.). While significant progress has been made in improving safety performance in the South African platinum industry in recent years, additional safety improvement plans are required to achieve an environment of zero harm.
The Health, Safety and Environment (HSE) risk assessment processes implemented by PPM consist of four layers: baseline risk assessment, issue-based layer, task layer and continuous risk assessments. These layers are interlinked, with appropriate feedback loops. The baseline risk assessment considers the Codes of Practice, the baseline hygiene risk assessment, the plant HAZOP, the environmental management program and the integrated water use licence application; the resulting standards are aligned with the standard operational procedures, which are implemented during operations. The issue-based layer focuses on change management and incidents/ non-conformances and results in input to HSE monitoring and reporting and the standard operational procedures. The task layer addresses those tasks associated with an identified significant HSE risk and also provides input to the standard operational procedures. The continuous risk assessments involve conducting pre-task evaluations, considering any changing condition and/or environment as well as continuous risk assessments of the workplace, people and equipment. This final layer of the assessment results in either a safe-to-work situation or the withdrawal of employees until such time as all risks have been removed and a follow-up risk assessment indicates that it is safe to commence work.
The Company has a SHEQ policy in place at its PPM Mine and gained OSHAS 18001 and ISO 14001 certification. SRK understands that the Company has embraced all the key aspects that would be needed to ensure that the operations at PPM’s West Pit are operated and managed effectively in these areas. The safety aspects and requirements for the Mine are summarized in Table 20.2.
| SRK | | Report date: 27 May 2022
Effective Date: 31 December 2021 |
| | | |
| SRK Consulting – 576060 SPM PSM Project TRS | Page 237 |
| Table 20.2: | Summary of safety aspects for the PPM operations |
| Aspect | Requirements | Status |
| Regulatory requirements | Legal compliance necessary for managing risk, developing trust with government and other stakeholders Mine Manager is responsible for observance and enforcement of all safety and health regulations. Non-compliance can result in Section 54 temporary closure, penalties or loss of licence. | In terms of the most recent legal audit, PPM complies with the legal requirements. |
| Legal appointments | In terms of the MHSA, the following main legal appointments should be in place: Sect. 2A(1) - CEO; Sect. 4(1) and 2A(2) - General Manager; Sect. 3(1) - Mine/Operational Manager; Sect 2.17.4 - Chief Safety Officer; Sect. 2.13.1- Engineer; Sect. 2.6.1- Site Manager; Sect. 2.6.1- Plant Manager; Sect. 17.2 - Chief Surveyor; Sect. 2.9.2 - Chief Geologist; Sect. 14.1(8) - Rock Engineer; Sect. 12(1) - Occupational Hygienist; Sect. 5.1(a) & (b) - Occ. Hygienist; Sect. 16.1(1) - Occ. Hygienist; and Sect. 13 (3) - Occ. Medical Practitioner | The legal appointments also include appointments for underground operations. The legal appointments for the current opencast operations are in place. |
| Health and Safety Policy | MHSA Section 8(1)(a-d) Every manager must prepare a document that describes the organization of work, establishes a policy concerning the protection of employees' health and safety at work, establishes a policy concerning the protection of persons who are not employees but who are directly affected by mining activities and outline the arrangements for carrying out and reviewing policies. Management’s commitment towards zero harm. | A Health and Safety policy is in place. The policy has to be revised before underground operations commence. |
| Health and Safety Committee | MHSA Section 8(2) and 8(3)(b) The manager must consult with the health and safety committee on the preparation or revision of the document and policies referred to in Section 8(1), prominently and conspicuously display a copy of the document referred to in Section 8(1) for employees to read. Each health and safety representative has to be supplied with a copy of the document | The mine has the required health and safety committee in place. |
| Risk management, risk identification and controls | MHSA Section 11(1-4) The employer must be able to prove risk reduction and risk control. The risk management standard should determine how risks are identified and managed | Baseline risk assessments for the surface operations have been completed. The risk assessments will have to be adapted to cater for underground operations. From the baseline risk assessments, risk registers would be revised whereby risks are listed in order of severity. Additional controls: OSHAS 18001 safety and health audits (external); and ISO 14001 environmental audits (external). |
| Mandatory Codes of Practice | MHSA Section 9(1-6)(7a and b) A manager must prepare and implement a code of practice on any matter affecting the health and safety of employees and other persons who may be directly affected by activities at the mine if the Chief Inspector requires it. Required CoPs: The prevention of mine fires; Emergency preparedness and response; Occupational health programme on personal exposure to airborne pollutants; Thermal stress; Fatigue Management; Noise exposure; Medical incapacitation to work; Combat rock falls and slope instability in surface mines; Right to refuse unsafe work; Minimum standard for fitness to perform work at a mine; Women in mining PPE; Trackless mobile machinery; Safe use of conveyor belt installations; Safe operation of draw and tipping points; Isolation, lockout and clearance to work; and Mine residue deposits | The required mandatory CoPs for the surface operations are in place. However, they will have to be revised for the proposed underground operations. |
| Safety training | MHSA Section 10(1-3) An employer must provide employees with any information, instruction, training or supervision that is necessary to enable them to perform their work safely and without risk to health. | A comprehensive training procedure is provided for all new appointments. Refresher training will be provided annually. |
| SRK | | Report date: 27 May 2022
Effective Date: 31 December 2021 |
| | | |
| SRK Consulting – 576060 SPM PSM Project TRS | Page 238 |
Safety Performance Monitoring
PPM recorded a commendable 6.5 million progressive fatality free shifts (FFS) at the end of December 2021. In terms of the available statistics, there have been no fatalities from 2011 to 2021. The lost time injury frequency rate (LTIFR) also decreased from a high of 3.8 in 2016 to 1.1 in 2021. Key Performance Indicators (KPIs) for the PPM operations are set out in Table 20.3.
| Table 20.3: | Key Performance Indicators (KPIs) |
| Safety | Mine Targets | Performance against KPIs to Dec’21 |
| Work related fatal injuries (2017 to 2021) | 0 | 0 |
| LTIFR rate per million-man hours (progressive from 2017 to 2021) | 1.04 | 1.1 |
| DMRE mine stoppages (2017 to 2021) | 0 | 1 (2019) |
| Number of days lost to work stoppages | 0 | 5 |
The number of recordable injuries and lost-time injuries per million man-hours for PPM for 2014 to 2021 is set out in Table 20.4. The total recordable injury frequency rate (TRIFR) and LTIFR per million man-hours per year are also shown.
Table 20.4: PPM mining and concentrator safety statistics
| Category | Total Recordable Injuries (per million man-hours) | Lost Time Injuries (per million man-hours) |
| Injuries | Number | TRIFR | Number | LTIFR |
| 2014 | 28 | - | 9 | 1.8 |
| 2015 | 56 | - | 6 | 1.4 |
| 2016 | 32 | 10.86 | 12 | 3.8 |
| 2017 | 21 | 6.7 | 4 | 1.1 |
| 2018 | 14 | 4.8 | 4 | 1.1 |
| 2019 | 14 | 3.7 | 6 | 1.3 |
| 2020 | 16 | 4.3 | 3 | 1.0 |
| 2021 | 19 | 5.3 | 4 | 1.1 |
| Fatalities | Number | | | |
| 2014 | 0 | | | |
| 2015 | 0 | | | |
| 2016 | 0 | | | |
| 2017 | 0 | | | |
| 2018 | 0 | | | |
| 2019 | 0 | | | |
| 2020 | 0 | | | |
| 2021 | 0 | | | |
The main causes of the lost time injuries were that six out of ten Lost Time Injuries (LTIs) reported from 2019 to 2021 were a result of slip/trip and fall accidents and the nipping/pinching of fingers.
Reportable Dangerous Occurrences
In terms of Regulation 23.4 and 24 (b), incidents endangering the health or safety of any person must be reported to the DMRE. Two Reportable Dangerous Occurrences (RDO) were recorded during 2017, one in 2018, none in 2019, two in 2020 and seven in 2021. The causes of the RDOs are presented in Table 20.5.
| SRK | | Report date: 27 May 2022
Effective Date: 31 December 2021 |
| | | |
| SRK Consulting – 576060 SPM PSM Project TRS | Page 239 |
| Table 20.5: | Reportable Dangerous Occurrences |
| Date | Number of RDOs | Causes of RDOs |
| 2017 | 1 | To avoid a run-away truck situation in the access ramp, a water truck driver drove into the side of a berm causing the vehicle to overturn. No injuries. |
| 2018 | 1 | A boulder of ±10 t dislodged from the high wall of the pit and came to rest close to a drilling machine. No injuries or damage. |
| 2019 | 0 | |
| 2020 | 2 | (1) An RDT burned out due to a burst hydraulic pipe. No injuries were sustained. (2) A section of saprolite high wall failed, causing a rock to dislodge from the sidewall directly onto a catchment berm. The hazard was identified through previous inspections and an increased berm width was provided for the incident. Due to efficient and proactive management of the hazard not injuries or damage occurred. |
| 2021 | 7 | (1) A rockfall incident occurred due to heavy rainfall. The potential rockfall was identified during previous inspections and the necessary precautionary measures were implemented. No injuries / damage to property was recorded. (2) A rockfall incident occurred due to the intersection of vertical joints striking into the slope face with steep dipping joints striking parallel to the slope face creating an unstable block. No injuries / damage to property was recorded. (3) A RDT operator was traveling down central ramp and lost control of the RDT after taking a corner. The RDT drove up a safety berm and toppled over onto its right side. The RDT operator sustained injuries to the hand and minor lacerations to the head. (4) A wedge failure occurred while an excavator operator was busy scaling the high wall. Dislodged rocks fell on the cab of the excavator causing minor injuries to the operator. (5) A rock fall incident occurred on a bench face. The debris from the fall was accommodated within the catchment berm of an inactive mining block. No injuries, damage to property or adverse impacts on production were reported. (6) A rock fall incident occurred on a bench face. The debris from the fall was arrested within the catchment bench and the catchment berm. The condition of the high wall was previously identified as potentially hazardous and additional measures were implemented. As a result, the fall was fully arrested on the wider berm. The strategy proved to be effective in mitigating the risk. (7) A rock fall incident occurred on a bench face. The debris from the fall was accommodated within the catchment berm of an inactive mining block. No injuries, damage to property or adverse impacts on production were reported. |
DMRE Safety Stoppages
Table 20.6 sets out the number of stoppages imposed by the DMRE on PPM from 2014 to 2021. These Section 54 stoppages are generally implemented for fatalities and where in the opinion of the DMRE there is non-compliance with the MHSA and mine procedures.
| Table 20.6: | DMRE stoppages 2014 to 2021 |
| Year | Number | Total production days Lost |
| 2014 | 1 | 3 |
| 2015 | 6 | 12 |
| 2016 | 1 | 3 |
| 2017 | 0 | 0 |
| 2018 | 0 | 0 |
| 2019 | 1 | 5 |
| 2020 | 0 | 0 |
| 2021 | 0 | 0 |
Safety improvement plan
Based on a review of the safety accidents, PPM identified focal areas for 2021 as part of a safety improvement plan to enhance PPM’s HSE compliance and maturity culture. These 2021 HSE focal points are still aligned with the 2016-2020 HSE milestones, as well as other HSE interventions launched to reduce the LTIFR and work-related incidents and accidents. They will be achieved through the following:
| • | Skills and competence: Enhance supervisory, technical and SHEQ skills; |
| • | Close out of actions: Improve on the close-out of actions to reduce liability and to learn from incidents and non-conformances; |
| • | SHEQ KPI’s: Define SHEQ KPI’s, monitor compliance and report on performance; |
| • | Behavioural based safety: Focus on transformation culture and behavioural based safety; and |
| • | Performance monitoring: Performance monitoring and measurement via a self-auditing process. |
| 20.2.2 | Occupational Hygiene/Health |
Occupational health is aimed at the protection and promotion of the health of workers by preventing and controlling occupational diseases and accidents by eliminating conditions hazardous to health at work. The aim is to minimize all occupational hygiene exposures to below OELs as contemplated in all mandatory CoPs and Regulation 9.2 of the MHSA.
| SRK | | Report date: 27 May 2022
Effective Date: 31 December 2021 |
| | | |
| SRK Consulting – 576060 SPM PSM Project TRS | Page 240 |
The working environment for the mine is similar to all opencast PGM operations and the identified occupational health risks are also similar. Identified occupational health risks include airborne pollutants (dust), noise induced hearing loss (NIHL) and heat related illnesses.
Occupational Risk Management and Controls
The HSE risk assessment processes described in Section 20.2 are applied equally to matters of occupational hygiene and health. In addition to the risk assessment procedures, the Company has all the HSE management system documentation in place for PPM with respect to:
| • | Hazards to health to which employees may be exposed to be identified and recorded; |
| • | The risks to health to be identified and assessed; |
| • | Control measures are required to eliminate or control any recorded risks at the source; |
| • | In so far as the risk remains, the following should be in place; |
| o | Where possible personal protective equipment is provided; and |
| o | A programme to monitor the risk to which employees may be exposed has been instituted. |
Occupational Hygiene/Health system for mines
The Company will implement occupational health control systems for the East and Central Underground Blocks as set out in Table 20.7.
| SRK | | Report date: 27 May 2022
Effective Date: 31 December 2021 |
| | | |
| SRK Consulting – 576060 SPM PSM Project TRS | Page 241 |
Table 20.7: Summary of occupational hygiene/health aspects for the proposed mine
| Aspect | Requirements | Status |
Pollution sources: Drilling, blasting, loading, hauling, crushing and process plant. | MHSA Section 11(1) requires: Hazards to health to which employees may be exposed to be identified and recorded; The risks to health to be identified and assessed; Control measures are required to eliminate or control any recorded risks at the source; and in so far as the risk remains, the following is required: Where possible personal protective equipment to be provided; and A programme to monitor the risk to which employees may be exposed has to be instituted. | Employees continuously exposed to dust containing Silica concentration in excess of 18% are at risk of contracting the lung disease silicosis. PGM Silica content: ˂2%. The Occupational Hygiene Baseline Risk Assessment will have to be reviewed for the proposed underground operations and the required controls identified. |
| Irrespirable atmospheres | MHSA Section 16.2(2) If the risk assessment in terms of Section 11 shows that there is a significant risk that employees may be exposed to irrespirable atmospheres at any area of the mine, the employer must ensure that no person goes into such area without a body-worn self-contained self-rescuer which complies with the SABS 1737 specifications. | No surface operations identified with irrespirable atmospheres. All the underground employees at the proposed underground operations will be issued with approved self-contained self-rescuers. |
| Occupational hygiene measurements | MHSA Section 12(1-3) The manager must engage the part-time or full time services of a person qualified in occupational hygiene techniques to measure exposure of health hazards at the mine. | The mine has appointed a part - time Occupational Hygienist. |
| Mandatory reports to the Regional Principal Inspector (DMRE) | MHSA Section 9.2(7) The employer must submit to the Regional Principal Inspector of Mines the following reports on occupational measurement results: 21.9(2)(a) – Airborne pollutants personal exposure; 21.9(2)(b) – Heat stress exposure; 21.9(2)(c) – Cold stress exposure; and 21.9(2)(d) – Personal noise exposure. | These reports are compiled and submitted to the Principal Inspector on a quarterly basis. |
| System of medical surveillance | MHSA Section 13(1-8) The manager must establish and maintain a system of medical surveillance of employees exposed to health hazards. A record of medical surveillance for each employee exposed to health hazards must be kept; The records are to be retained until the mine closes; The medical surveillance programme should ensure that the baseline health of every employee entering the workforce is recorded, that their state of health is monitored throughout the duration of their employment. The program should diagnose early signs of ill health, which have to be treated and investigated; All diagnosed cases are thoroughly investigated to determine if the illnesses are worked related or inherited cases before the cases are certified; and Certified cases are referred to the certification board for possible compensation. | The Mine makes use of Union Hospital to conduct medical surveillance of employees. |
| Annual Medical report | MHSA Section 16(1)(2) Every occupational medical practitioner at a mine must compile an annual report covering employees at that mine, giving an analysis of the employees’ health based on the employees’ records of medical surveillance, without disclosing the names of the employees. | Annual reports are compiled by the Union Hospital occupational medical practitioner (OMP). |
Occupational health risks to which employees at the Mine may be exposed are summarized in Table 20.8.
| SRK | | Report date: 27 May 2022
Effective Date: 31 December 2021 |
| | | |
| SRK Consulting – 576060 SPM PSM Project TRS | Page 242 |
Table 20.8: Identified Occupational Health Risks
| Source | Health hazard | Occupational Exposure Limit (OEL) | Risk |
| Platinum Dust | Inhalable ≥10 µm Respirable ≤10 µm | 10 mg/m³ 3.0 mg/m³ | Upper respiratory diseases Asthma, Dermatitis Compensation claims |
| Platinum Dust | Crystalline Silica | 0.10 mg/m³ (New milestone 0.05 mg/m³) | Silicosis Compensation claims |
| Assay Laboratory | Lead fumes | 0.15 mg/m³ | Brain disorders Kidney damage |
| Welding | Metal fumes | 5.0 mg/m³ | Lung diseases Kidney damage |
Diesel exhaust emissions (Enclosed areas, workshops etc.) | Gases | | |
| Carbon Monoxide | 30 ppm | Poisonous |
| Nitrogen Oxide | 25 ppm | Poisonous |
| | Nitrogen Dioxide | 3 ppm | Poisonous |
| | Particulate Matter | | |
| | Diesel Particulate Matter (DPM) | DMRE milestone: 0.16 mg/m³ | Carcinogenic (Cancer) Compensation claims |
| Mine fires | Gases | | |
| | Carbon Dioxide | 5 000 ppm | Asphyxiation/toxic |
| | Carbon Monoxide | 30 ppm | Poisonous |
| Thermal | Heat Cold | WB> 27.5°C DB > 37.0°C ECT ≤ 5.0 > - 30 | Heat stress Heat stress Cold stress |
| Noise | >85 dB for duration of 8 hours | 85 dB | Noise induced hearing loss (NIHL) Compensation claims |
| Radiation (weightometers) | Ionizing radiation | 20 mSv per annum | Cancer |
| UV radiation (environment) | Sun burn | - | Skin disorders |
| Power tools and TMM vehicles | Vibration | - | Musculoskeletal disorders and neurological effects |
| TMM vehicles | Ergonomics | - | Discomfort, fatigue and musculoskeletal disorders |
Note:
WB: wet bulb temperature; DB: dry bulb temperature; ECT: equivalent chill temperature.
Occupational Hygiene measurements
Airborne Pollutants – Dust
Platinum dust is one of the main airborne pollutants in PGM mines and if not controlled, can cause upper respiratory diseases and chronic obstructive airway disease (COAD). The Silica content in platinum dust is less than one percent. The employees should not be at risk of contracting Silicosis.
The main sources of dust and Pt dust at opencast operations are the removal of overburden, drilling, blasting, transport of ore via roadways and crushing. The dust measurement results for 2016 to the end of December 2021 for the opencast operations at PPM are set out in Table 20.9.
Table 20.9: PPM – dust measurement results for opencast operations
| Reporting Area | 2016 | 2017 | 2018 | 2019 | 2020 | 2021 |
| Total samples | 192 | 123 | 135 | 87 | 86 | 100 |
| Total samples exceeding the OEL (OEL: 3.0 mg/m³) | 3* | 1 | 0 | 0 | 3* | 0 |
| Total samples | 192 | 123 | 135 | 87 | 86 | 100 |
| Total samples exceeding the OEL (OEL:0.10 mg/m³) | 0 | 0 | 0 | 0 | 0 | 0 |
Note:
* Individual measurements exceeding the OEL.
Crystalline silica results are well below the OEL limit. Compared to gold mine dust, the platinum dust can be classified as a low health risk (no silicosis cases recorded).
Dust Management Plan
The proposed dust prevention programmes include the following:
| • | Entry examinations are followed by watering down of all access roads; |
| • | Tipping points equipped with water sprays; and |
| SRK | | Report date: 27 May 2022
Effective Date: 31 December 2021 |
| | | |
| SRK Consulting – 576060 SPM PSM Project TRS | Page 243 |
| • | Extraction fans in specific areas. |
Airborne Pollutants - Diesel Particulate Matter
DPM in enclosed areas (workshops, etc.) have been proven to be carcinogenic. Exposure above the defined OEL can result in employees contracting certain types of cancer.
The diesel machinery does not operate in enclosed areas. Workshops are open ended in through ventilation. There should be no risk of employee exposure to diesel fumes.
However, the P-S-M Project will make extensive use of diesel machinery in the proposed underground operations. The Mine will need to conduct a full baseline sampling campaign and revise the risk evaluation and baseline health risk assessment once underground operations commence.
The DPM quantities must be monitored against the defined OELs on a regular basis and recorded in the monthly and annual management reports. Where the measurements are found to exceed the defined OELs, supplementary ventilation via booster fans or replacement of diesel engines with the latest low emission Euro specification engines may be required.
Airborne Pollutants - Organic Lead (Assay Laboratories)
Metallic Pb in the form of a fine dust does pose a high health risk. In terms of the Occupational Medical Surveillance results, no employees had blood Pb levels above the biological exposure index (BEI) level.
Noise Exposure
The Company routinely monitors noise exposure at the PPM open pit operations. Most of the open pit and plant employees are exposed to noise levels in excess of 85 dB(A) over an 8-hour time weighted average (TWA).
The mine will extend the routine noise exposure measurements to the proposed underground working areas and report these in the monthly management reports.
The following controls are in place to prevent employees from contracting NIHL:
| • | All areas with noise levels in excess of 85 dB(A), have been demarcated as noise zones; |
| • | Employees must wear hearing protection devices (HPD) in noise zones. The HPDs can reduce noise levels from a maximum of 103 dB(A) to below 85 dB(A); and |
| • | All mining equipment noise levels will not exceed the DMRE milestone limit of 107 dB(A). |
Radiation
The weightometers (Troxler gauge etc.) in the process operations are nuclear sourced. In terms of the Occupational Hygiene reports, radiation is not included in the measurement results nor is it recorded in the annual medical reports. Although weightometer radiation is a low risk, radiation levels should be monitored on a quarterly basis. Radiation levels should not exceed the maximum permissible level of 20 mSv per annum.
Heat and Cold Stress
The maximum and minimum recorded temperatures at the operations are presented in Table 20.10.
Table 20.10: Maximum and minimum recorded temperatures
| Reporting Area | 2018 | 2019 | 2020 | 2021 |
| Maximum dry bulb temperatures (OEL ˂ 37.0°C) | 37.2°C | 40.4°C | 40.5°C | 40.1°C |
| Minimum dry bulb temperatures (OEL ˃ 10.0°C) | 2.1°C | 1.8°C | 2.3°C | -2.0°C |
Heat and cold stress control measures
| • | Heat stress - Mid-summer temperatures can exceed 40˚C which can cause heat disorders and fatigue. |
Control measures:
| o | Driver cabins for trucks and drill rigs are equipped with air conditioners; |
| o | Additional drinking water is made available to employees. |
| • | Cold stress - Mid-winter temperatures in the area can decrease to as low as -4°C. |
Control measure:
| SRK | | Report date: 27 May 2022
Effective Date: 31 December 2021 |
| | | |
| SRK Consulting – 576060 SPM PSM Project TRS | Page 244 |
| o | Thermal clothing is provided to employees when the temperature approaches the minimum action level. |
Occupational Health Surveillance
The Company compiles annual health surveillance statistics as shown in Table 20.11.
Table 20.11: Occupational health surveillance statistics
| Item | 2016 | 2017 | 2018 | 2019 | 2020 | 2021 |
| NIHL Diagnosed cases | 59 | 10 | 2 | 0 | 0 | 1 |
| NIHL Certified cases | 17 | | 0 | 0 | 0 | 0 |
| Silicosis Diagnosed cases | 0 | | 0 | 0 | 0 | 0 |
| Silicosis certified cases | 0 | | 0 | 0 | 0 | 0 |
| Diagnosed Organic Lead poisoning cases | 0 | | 0 | 0 | 0 | 0 |
Compared to 2016, the low number of diagnosed NIHL cases from 2018 to 2021 is an indication that the programme for the prevention of NIHL is reducing the number of NIHL cases at the mine.
It is possible to record occupational tuberculosis cases in the health surveillance statistics (though none are recorded in Table 20.11). However, from an occupational health point of view, Tuberculosis should not be classified as an occupational health illness. Pulmonary Tuberculosis is caused by bacteria. Platinum dust or any dust for that matter cannot cause tuberculosis. Most employees contract Tuberculosis when they have low immune systems, due to underlying illnesses such as HIV/AIDS and Silicosis. Due to the low Silica content in PGM orebodies, there should be no risk of any Silicosis related Tuberculosis cases.
All diagnosed occupational health disease cases will be thoroughly investigated to determine if the illnesses are work related, inherited or non-occupational illnesses before the cases are submitted for certification and compensation.
The annual Occupational Health Surveillance statistics do not indicate if all possible occupational health diseases are monitored. The Mine may need to expand the monitoring system (or include in the annual results) to record health surveillance statistics on an annual basis on the following additional aspects:
| • | Diagnosed Occupational Tuberculosis (TB) cases; |
| • | Occupational Dermatitis; |
| • | Obstructive airway disease (OAD); |
Identified risks
Although the number of lost time injuries has decreased, continued harm to employees can have the following implications:
| • | Impact on production and profits; |
| • | Increased involvement of DMRE with the possibility of additional Section 54 stoppages; |
| • | Noise, which remains a health risk until there is proven zero exposure to this health hazard for an extended period of five years. |
SRK comments
PPM has a good SHEQ system in place, which is actively followed by all levels of management. The systems and procedures are commendable, with prompt investigation of LTIs and necessary remedial actions being implemented.
There was an abnormal increase in the LTIFR to 3.8 in 2016, when normalized for a full reporting period. However, since the implementation of safety improvement plans, the LTIFR has decreased to 1.1 in 2021.
The decrease in certified NIHL cases from 17 in 2016 to zero in 2021 is a commendable improvement.
| SRK | | Report date: 27 May 2022
Effective Date: 31 December 2021 |
| | | |
| SRK Consulting – 576060 SPM PSM Project TRS | Page 245 |
In the quest towards zero harm, the comprehensive safety improvement plans for 2020/2021 should further reduce the number of injuries at the operations. This improvement plan can only be effective if the safety initiatives are consistently applied by all, from the management leadership teams, and supervisors down to employee level on the working faces.
[SR4.3(viii), SR5.7(i)]
The following section presents the key findings from the risk assessment for the P-S-M Project and is generally limited to a qualitative assessment only, so no direct financial impact is considered.
It is possible that many of the identified risks and/or opportunities will have an impact on the cash flows for the P-S-M Project. SRK has provided sensitivity tables for simultaneous (twin) parameters, which cover the anticipated range of accuracy in respect of commodity prices, operating expenditures and capital expenditures. SRK is of the view that the general risks and opportunities are adequately covered by these sensitivity tables, as these address fluctuations in operating expenditure and commodity prices.
In addition to those identified above, the P-S-M Project is subject to specific risks and opportunities, which independently may not have a material impact but in combination may do so.
The risk profiles contain several indicators that will be useful to guide the stakeholders as to the appropriate actions that need to be taken in any action plan.
| 20.3.2 | Development of Understanding of Risk Profile |
The Company has consistently worked to identify potential risks and understand their impact during the development of the project components. Risk assessments of components of the project were carried out in 2008, 2011, 2013, 2016, 2019 and as part of the 2020 FS.
| 20.3.3 | Risk Assessment Approach |
The risk assessment followed a ‘likelihood and consequence’ approach, where:
| • | Likelihood is considered a qualitative measure of the chance of a risk occurring; and the relevant descriptions are provided in Table 20.12; and |
| • | Consequence was considered in terms of the degree or magnitude of consequences/impacts that are associated with the risk; and the relevant descriptions are shown in Table 20.13. |
The correlation of likelihood and consequence produces a risk rating – through the combination of Table 20.12 and Table 20.13 to produce the risk rating matrix shown in Table 20.14. The matrix indicates the significance of each risk the project is faced with.
| • | Using the risk rating matrix, the first pass produced the inherent risk rating (i.e., the risk considered without any mitigation). The resultant ratings of risks as ‘very low’, ‘low’, ‘tolerable’, ‘high’ or ‘very high’ were then considered in context of the Company’s risk appetite and tolerance. |
| o | Risks that produced ‘very low’, ‘low’ and ‘tolerable’ ratings did not undergo further rigorous evaluation given that their inherent rating was acceptable to the risk appetite of the Company. |
| o | Prioritisation was made of those risks with highest exposures (i.e., ‘high’ and ‘very high’ risk ratings) by identifying potential mitigatory actions. The mitigation aimed to reduce the likelihood, reduce the consequence, or reduce both the likelihood and consequence in order lower the risk rating. |
| • | The second pass produced the residual risk rating (i.e., the risk considered with mitigation). |
| • | It is noted that classification of a risk as ‘very high’ or ‘high’ does not necessarily constitute a scenario which leads to project failure. |
| SRK | | Report date: 27 May 2022
Effective Date: 31 December 2021 |
| | | |
| SRK Consulting – 576060 SPM PSM Project TRS | Page 246 |
Table 20.12: Likelihood of events occurring
| Description | Chance | Frequency | Probability |
| Rare | May occur only in exceptional circumstances | Has occurred or can reasonably be considered to occur once in 30-50 years | 10% (0% - 20%) |
| Unlikely | Could occur at some time | Has occurred or can reasonably be considered to occur once in 10-30 years | 30% (21% - 40%) |
| Possible | Might occur at some time | Has occurred or can reasonably be considered to occur once in 1 - 10 years | 50% (41% - 60%) |
| Likely | Will probably occur in most cases | Has occurred or can reasonably be considered to occur once in 6 months - 1 year | 70% (61% - 80%) |
| Almost certain | Is expected to occur in most circumstances | Has occurred or can reasonably be considered to occur once in 6 months or less | 90% (81% - 100%) |
Table 20.13: Severity/Consequences of the risk
| Rating | Financial /
Economic | Operational /
Business
Interruption | Health and safety | Skills | Natural environment | Social | Corporate Image /
Reputation | Legal |
| Minor | 1% of Net Asset Value (0% - 1%) | 2.5% of project schedule overrun | Medical treatment case, dressing station, no impairment | 5% unavailability of critical skills | Natural processes are affected but with impacts being reversible immediately | Issue of no political and community concern | Issue of no public concern | Low-level legal issue |
| Moderate | 10% of Net Asset Value (1% - 20%) | 5% of project schedule overrun | Reversible impairment or Lost Time Injury | 10% unavailability of critical skills | Natural processes are affected, but continued in a modified way with impacts being reversible within lifetime of operation | Local concern consisting of repeated complaints | Local press interest and Local political concerns | Non-compliance and breach of regulations |
| Major | 30% of Net Asset Value (20% - 40%) | 10% of project schedule overrun | Lost Time Injury - Reportable | 30% unavailability of critical skills | Natural processes are notably altered but continued in a modified way with impacts being reversible within lifetime of operation. | Declared Provincial Concerns and serious inflow of community complaints. | Limited damage to reputation
Extended local press interest/ Provincial press interest. | Breach of regulation.
Investigation or report to authority with prosecution and/or moderate fine possible. |
| Severe | 50% of Net Asset Value (40% - 70%) | 20% of project schedule overrun | Single fatality
Multiple Injuries
Permanent Disability | 50% unavailability of critical skills | Natural processes are disrupted for the duration of the activity but resume functioning after the operation has been terminated. | Loss of credibility and confidence. Criticism by National Government | National press coverage. Independent External Enquiry. | Breach of regulation.
Severe litigation. |
| Catastrophic | >70% of Net Asset Value (70% - 100%) | .>30% of project schedule overrun | Multiple fatalities or health impact of similar nature affecting multiple persons | >70% unavailability of critical skills | Natural processes are permanently disrupted to the extent that these processes could permanently cease. | Widespread social riots & work blockages, Declared National Political Concerns and Investigations. | Declared National political concerns, International and Local Media Coverage. | Prosecution and fines.
Litigation including class actions. |
| SRK | | Report date: 27 May 2022
Effective Date: 31 December 2021 |
| | | |
| SRK Consulting – 576060 SPM PSM Project TRS | Page 247 |
Table 20.14: Risk ratings
| | Likelihood |
| Rare | Unlikely | Possible | Likely | Almost Certain |
| Consequence | Catastrophic | Tolerable | High | High | Very High | Very High |
| Severe | Tolerable | Tolerable | High | High | Very High |
| Major | Low | Tolerable | Tolerable | High | High |
| Moderate | Low | Low | Tolerable | Tolerable | High |
| Minor | Very Low | Low | Low | Tolerable | Tolerable |
| 20.3.4 | Overview of Specific Risk Elements |
Specific risk elements are described in the sub-sections below.
Geology Risks
Potential risks associated with geology and the general understanding of the orebodies relate to the extent of weathering associated with faulting and fracture being greater than expected (West and East Pits); head grade being lower than declared reserve grade (West and East Pits); and underestimating the effect of geological structure on the underground operations.
Additionally, if the continuity of silicate reefs is not as expected, it may require a [upward or downward] reclassification of the resource estimates.
Water Management Risk
Water management risks include:
| • | Excess water in West Pit adversely affecting production |
Excess water in the West Pit from high rainfall and high influx of groundwater since November 2021 is hampering reef mining in the north and south mining areas.
Excess water is also causing blast hole collapsing resulting in poor fragmentation.
Water storage space is used to capacity so there is no place to pump excess water.
| • | Impact on local boreholes |
Previous environmental reports show that adjacent communities make use of boreholes to get water for drinking, cooking and washing. Seepage from TSFs is likely to reduce the quality of the potable water, the consequences of which may include increased public pressure from NGOs and civil society organisations.
To address the matter, SPM should comply with the requirements of the EMP, i.e., regularly monitor water quality and ensure that the content of TSFs do not seep into the surface and underground water courses; and/or provide alternative water supply where degradation of the water quality has occurred.
Until new mining areas are developed, there is a potential for discharge of excess mine water into the environment. Additionally, the suspended/colloidal solids in the tailings slurry (and subsequently process water) present a water management risk, because they lead to a low water recycling ratio, which in turn presents a risk of discharge of contaminated water into the environment.
| • | Compliance to legislation |
PPM is currently non-compliant with GN704 for a number of facilities, which may present reputational, environmental, and/or legal consequences.
Mineral Resource Estimation Risk
The Mineral Resource estimates for the P-S-M Project have gone through several iterations of review during the past two to three years. In general, SRK is satisfied with the veracity and acceptability of the estimation process and the classification criteria. Accordingly, the risk that the Mineral Resource estimates are materially wrong is seen to be Low.
| SRK | | Report date: 27 May 2022
Effective Date: 31 December 2021 |
| | | |
| SRK Consulting – 576060 SPM PSM Project TRS | Page 248 |
Rock Engineering Risks
Potential risks from a rock engineering point of view that may impact on mining are seen to be associated with:
| • | Reduced tonnage profile from the silicate reefs due to superimposed pillars (underground components of P-S-M Project); |
| • | Poor hanging wall conditions on the UG2 for the underground operations of the P-S-M Project, which could result in increased support costs, increased dilution and health and safety issues; and |
| • | The above translate into the mine(s) not achieving their mine call factor, which means that recovered ounces of PGMs will be below budget. This can be managed via judicious alteration to the mining cut thickness and ground support programmes. However, this will result in cost implications that need to be accounted for in the mine plan and business plan. |
Mining Risk
The community-based mining contractors, Equinox Engineering Solutions (Pty) Ltd and Matsinyane Mining and Projects (Pty) Ltd, are struggling to achieve the required mining productivities at the East Pit. Their understanding of mining is poor and their fleet of mining equipment is too small for the waste stripping required. Equipment from the Trollope fleet at West Pit provides additional capacity in the short term.
Potential falls of ground in the underground operations, failure of high walls in the open pits and/or localised bench scale and rockfall are identified as inherent risks, all of which are subject to ongoing monitoring, and rely on adherence to legislation and approved Codes of Practice and standard procedures, validation of the designs and active training and development of staff to mitigate.
The underground mining productivity factors and production rates may be too optimistic, but the risk rating of tolerable imparts that the estimation falls within the Company’s risk appetite and tolerance.
Safety and Health Risks
Conveyor belt fires, which are mitigated using inter alia early warning fire detection systems, automatic fire suppression systems and where possible locating conveyor belts in return airways.
Diesel exhaust emissions as a form of airborne pollutant, which are mitigated using – amongst others – low emission engines, improved exhaust catalyst converter systems and increased ventilation at the points of operation.
Metallurgical Processing Risk
The potential risks associated with metallurgical processing are that the forecast recoveries are not achieved.
Tailings Risk
“Ratholing” and seepage may occur along the western and eastern waste rock containment walls respectively, and, if not managed adequately, could result in dirty or polluted water exiting the TSF site.
Repairs to leaking pipes/return water pumps and preventing polluted/dirty water exiting the property by bunding and pumping are required to mitigate the risk of dirty water exiting the Mine property.
Potential overtopping of individual compartments, especially eastern and western sides, is considered to have a high inherent risk status should legal freeboard requirements be non-compliant. SPM has increased free board surveys to meet the requirements; and operation of the western side will return to normality once the accelerated filling of the western paddock has reached the same level as the main dam.
Limitations on disposal through the WUL, issued on 10 October 2013, only permits PPM to dispose of 3.18 Mtpa in the TSF. Since production generally exceeds this allowable permitted tonnage, amendment to the permit be sought by engaging with the Regulating Authorities to mitigate the WUL non-compliant risk.
Power Supply Reliability and Power Cost Risk
Eskom, the South African power supply authority, introduced periods of load shedding from 2019 to 2021, mainly due to Eskom generation plant breakdowns due to poor maintenance and some nearing the end of their design life. The generation fleet remains unstable and load shedding is expected to continue for up to two years. High power consumers such as the mines are generally required to have load curtailment agreements with Eskom, whereby Eskom will ask the mines to reduce their loads during load shedding. The lack of continuous power supply reliability has resulted in production losses at most of the mines, due to load curtailment.
Eskom’s power costs have increased by more than 350% since 2010, and this is considered to be one of the main contributing factors to mines’ increased operating costs. The National Energy Regulator of South Africa (Nersa) approved an Eskom electricity increase of 15.63% with effect from 27 May 2021 and a further 9.8% from 27 May 2022 . This came on the back of a 9.8% increase in 2020 which included the first ZAR23bn recoupment of an additional ZAR69bn that Eskom was allowed to claw back.
| SRK | | Report date: 27 May 2022
Effective Date: 31 December 2021 |
| | | |
| SRK Consulting – 576060 SPM PSM Project TRS | Page 249 |
Human Resources Risks
Inherent human resources issues relate to escalating wage demands above inflation not linked to productivity, and lack of suitable accommodation in the area (gate wage concept).
Environmental Risks
Potential environmental risks are related to increased environmental constraints, increased environmental complaints, and blasting vibration impacts on local communities and livestock.
| • | Increased environmental constraints |
Mining inherently damages the environment, the severity of which is dependent on the type of material mined and the mining method used. The risk is currently being mitigated by a combination of controls, including:
| o | Continued implementation of the BAP that contains measures to mitigate damage to the biophysical environment; |
| o | Continued dust monitoring around PPM and dust monitoring reports submitted to the DMRE annually; |
| o | Carefully considering the siting of mine infrastructure to mitigate and minimise the likelihood of negative responses and opposition from conservation interest groups. The specific commitments as per the EMPs and amendments on slopes and angles to coincide with planning of the Heritage Corridor, involvement of landscape architects in development of plans and compliance to biodiversity commitments also need to be attended to. As required in terms of the approved original EMPr, PPM should ensure that all current updated designs are included in an EMP amendment and approved; |
| o | Ensuring that all environmental, water, waste and air quality authorizations, licences and permits for the respectively assets/ properties are in place prior to commencing construction activities; and |
| o | Ensuring increased compliance with the EMP commitments. |
| • | Increased environmental complaints |
There is a risk that environmental complaints could increase from surrounding stakeholders in the area. Possible impacts may include negative media coverage; and/ or increased costs. The risk is currently being mitigated by a combination of controls, including:
| o | Participation by PPM in bi-monthly environmental forums that include the game farm owners in the area; |
| o | Development of a register that logs risks, complaints and issues; and |
| o | Ensuring increased compliance with the EMP commitments. |
| • | Blasting vibration impacts on local communities and livestock |
Blasting is an integral part of mining, both for open pit and underground operations. However, this activity could damage private property and/or social infrastructure (households, schools and hospitals), and/or result in increased noise levels, especially when undertaken close to adjacent communities. The risk is currently being mitigated by:
| o | PPM continues to send out SMS notifications to the relevant surrounding communities and stakeholders prior to blasting activities taking place; |
| o | Ensuring that blasting activities only take place during the day; and |
| o | Ensuring increased compliance with the EMP commitments. |
Blasting vibrations are measured by PPM using seismographs – there are two seismographs in Nweding and one in Legkraal village. There have been no exceedances in the standards in the blasting reports. A complaint was received from the Maglabe village around dust and vibrations causing cracks to their houses. A crack survey has been undertaken on closest structures; however, there are challenges around this, as cracks can be caused due to the actual structure or foundations not been constructed properly. The mine has, however, conducted a project which involved the repair to a few of the houses in the Legkraal village.
Social Risks
Several inherent risks with higher ratings were identified. These risks are based on the current mine designs and SPM’s envisaged standard operating procedures and fall into three broad categories:
| SRK | | Report date: 27 May 2022
Effective Date: 31 December 2021 |
| | | |
| SRK Consulting – 576060 SPM PSM Project TRS | Page 250 |
| • | Disruption of the project due to power struggle within project communities |
There are several traditional authorities in the project areas, many of which have not been officially recognised since the beginning of the project. This may potentially be a source of conflict, particularly if leaders of some villages are seen to be more favoured than others.
The fact that many low skilled jobs will be filled by people coming from adjacent communities means that the escalation of tensions between rival communities would disrupt production schedules and targets. Increased union activity could also be anticipated ahead of the upcoming wage negotiations in 2021/2022.
SPM needs to ensure that interaction meetings are organised regularly with all relevant traditional authorities, unions and other stakeholders. Continued communication, expectation management and effective sectoral management, were identified by SPM as suitable control mechanisms.
| • | High level of community expectations |
The perception exists amongst community members that not enough is being done to improve people’s livelihood as per the recommendations in the Mining Charter and published/approved SLPs. This may lead to protests in the communities. This is particularly true with respect to the Sedibelo SLP which was approved by the DMRE, and where not all commitments were met due to the company’s prevailing financial constraints.
SPM should seek to conduct a detailed stakeholder analysis as part of updating its Stakeholder Engagement Strategy, and continuously engage with sectoral stakeholders with the view to managing community expectations. Continued proactive lobbying with the DMRE supported by the conducting of feasibility studies for LED projects should be undertaken.
| • | Loss of social licence to operate |
The loss of social licence to operate is likely to occur if adjacent communities’ levels of expectation remain high with regards employment opportunities and socio-economic development, and if they do not realise these benefits from the mine. SPM should seek to continuously engage with adjacent communities and their leaders, to examine ways of building capacity within the communities and opportunities for local procurement of goods and services.
Cost of Production Risk
As the West Pit is an operating mine with historical data to support its cost inputs, the risk of the operating cost being materially wrong is considered to be low. The same applies to the projected costs for the East Pit, as these are based on those of the West Pit. The potential impact of changes in the Opex can be assessed from the sensitivity tables in Section 18.3.
The budgeted costs for Central and East Underground Blocks are all based on engineering studies. While these have been developed largely from first principles using recognised productivity indices, factors and some quotes, and have been escalated to December 2021 terms, they have not been confirmed in practice. There is therefore a risk that the underground mining costs for these projects may be higher than forecast.
Commodity Price Risk
The commodity price for PGMs is largely linked to the state of the economy in the developed countries (North America, European Union and Far East – Japan and China), with particular reference to the manufacture of autocatalytic converters for new cars. Many market commentators remain bullish regarding the commodity super cycle, yet the economies of the developed countries continue to disappoint in terms of improved growth.
There is a risk that the metal price projections of Section 15 may not materialise, which would impact negatively on SPM’s ability to fund the implementation of the additional projects discussed above. SPM has informed SRK that to remain cash generative during extreme pricing conditions, it will consider delaying the implementation of additional projects, curtailing production or price hedging aimed at locking in favourable price points.
Foreign Exchange and CPI Risk
The CPI rate in South Africa is affected by the relationship between exchange rates and the differential in inflation between the respective currencies of its major trading partners. As the prices for PGMs and base metals derived from the PGM Assets are given in USD, it is South Africa’s relationship with the USA which has the greatest impact on revenue flows.
| SRK | | Report date: 27 May 2022
Effective Date: 31 December 2021 |
| | | |
| SRK Consulting – 576060 SPM PSM Project TRS | Page 251 |
Economic Performance Risk
The concentrate treatment agreement with IRS terminates in September 2022. This is expected to be replaced with a treatment agreement with a third-party smelter (Buyer) which will last for five years or until the Kell plant is operational.
Both agreements refer to the volumes of concentrate that can be handled per year. If these volumes increase due to additional production by the P-S-M Project, there is a risk that IRS or the third-party smelter will not be able to process the concentrate that is surplus to the volumes given in the agreements. SPM believes that securing treatment capacity for the surplus concentrate does not pose a risk.
There is a risk that the Kell technology will not perform as planned, so that the expected benefits are not realized. SPM can revert to processing the PGM concentrates at the third-party smelter. If the third-party smelter does not have capacity, there are other refining/smelting facilities available in South Africa.
Implementation Schedule Risk
Section 20.1.5 provides detail of the risks associated with the implementation schedule for the project.
| 20.3.5 | Potential Economic Impact of COVID-19 |
The COVID-19 pandemic has led to significant volatility and uncertainty in the global economy. The potential impact of the evolving COVID-19 situation on consumers, supply chains, commercial agreements, geopolitical outcomes and future decisions that the Company may have to make, means that the financial forecasts may differ materially from those set out in this report.
The potential economic impact of the COVID-19 pandemic may manifest in many ways, for example: a slowdown in the global economy; unknown effect on the ZAR exchange rate against the major currencies; unknown effect on the metal prices; unknown effect on Capital costs; unknown effect on the demand of PGMs; and/or unknown effect on working costs.
There may also be practical outcomes required of social distancing, for example designs of buildings, offices and change houses to provide more space (and requiring increased capital cost); the transportation time of shift workers in and out of the mine; and numbers of personnel required to cater for extra shift rotation and/or isolation of infected employees.
| 20.3.6 | Risk Assessment Results |
The results of the risk assessment as considered applicable to the P-S-M Project are summarized in Table 20.15.
P-S-M Project Extension
The UG2 and silicate reefs targeted by the P-S-M Project extend onto the deeper portions of Magazynskraal (the Magazynskraal Deeps) and Kruidfontein. Sinking of vertical shafts with necessary support infrastructure and refrigeration will enable the deeper UG2 and silicate reefs in these areas to be exploited, thereby extending the mine life of the P-S-M Project.
Self-generation of Renewable Energy
South Africa’s Electricity Regulation Act was amended on 13 August 2021 (ESI Africa, 2021), allowing the self-generation of 100 MW of power from embedded renewable energy technologies without the need for a generation licence. This is an opportunity to manage the risk of cost increases as a result of increases in power costs, as well as potential carbon taxes, which may also increase.
The Company signed a Memorandum of Understanding with an Independent Power Producer for at least 40 MW of renewable power in March 2022.
Additional Kell Plants
Based on an initial assessment of projected PGM production in South Africa from new projects, and the potential benefits from electricity cost saving with the use of the Kell process, SPM considers that there is the opportunity to construct two extra 200 ktpa Kell plants in South Africa.
| SRK | | Report date: 27 May 2022
Effective Date: 31 December 2021 |
| | | |
| SRK Consulting – 576060 SPM PSM Project TRS | Page 252 |
Table 20.15: P-S-M Project Risk Assessment Summary (before and after mitigation, as appropriate)
| Hazard / Risk | Likelihood | Consequence | Overall Inherent Risk | Residual Risk |
| Geology | | | | |
| Amount of weathering associated with faulting and fracture greater than expected (West and East Pits) | Possible | Moderate | Tolerable | - |
| Head grade lower than declared reserve grade (West and East Pits); | Possible | Major | Tolerable | - |
| Effect of geological structure on the underground operations is underestimated (P-S-M Project) | Possible | Moderate | Tolerable | - |
| Water Management | | | | |
| Impact on local drill holes | Likely | Major | High | Low |
| Excess water in West Pit impacting on production | Certain | Major | High | Tolerable |
| Discharge of excess mine water into the environment | Likely | Moderate | Tolerable | - |
| Rock Engineering | | | | |
| Poor hanging wall conditions on the UG2 for the underground operations of the P-S-M Project | Likely | Moderate | Tolerable | - |
| Mine does not achieve MCF | Likely | Moderate | Tolerable | - |
| Mining | | | | |
| Community-based contractors have poor understanding of mining | Certain | Major | High | Tolerable |
| Community-based contractors’ fleet not sufficient for waste stripping required | Certain | Major | High | Low |
| Falls of ground | Possible | Catastrophic | High | Tolerable |
| High wall failure | Unlikely | Catastrophic | High | Tolerable |
| Underground mining productivity factors and production rates too optimistic | Possible | Moderate | Tolerable | - |
| Metallurgical | | | | |
| Forecast recovery overstated | Possible | Major | Tolerable | - |
| Tailings | | | | |
| “Ratholing” and seepage occur along the western and eastern waste rock containment walls, respectively | Certain | Moderate | High | Tolerable |
| Dirty water exits the mine property | Certain | Severe | High | Low |
| Returned water carry high load of suspended solids to the metallurgical plant | Certain | Moderate | High | Tolerable |
| Legal freeboard requirements, if utilised, non-compliant | Likely | Moderate | High | Low |
| Limitations on disposal through the WUL | Possible | Moderate | Tolerable | Low |
| Logistics | | | | |
| Selected ore transport method is not optimum | Possible | Moderate | Tolerable | - |
| Human Resources | | | | |
| Escalating wage demands above inflation not linked to productivity | Likely | Major | High | Tolerable |
| Lack of suitable accommodation in the area | Likely | Severe | High | Tolerable |
| Lack of skills in nearby communities | Possible | Major | Tolerable | - |
| Safety and Health | | | | |
| Conveyor belt fires | Possible | Catastrophic | Very High | Tolerable |
| Diesel emissions (underground) | Likely | Major | High | Tolerable |
| Environmental | | | | |
| Increased environmental constraints | Likely | Major | High | Tolerable |
| Increased environmental complaints | Likely | Major | High | Low |
| Blasting vibration impacts on local communities and livestock | Likely | Major | High | Low |
| Social | | | | |
| Disruption of the project due to power struggle within project communities | Almost certain | Severe | Very High | High |
| Social expectations not met (Loss of social licence to operate) | Almost certain | Severe | Very High | High |
| Economic Performance | | | | |
| Treatment capacity for surplus concentrates not available | Possible | Major | Tolerable | - |
| Kell process does not achieve expected performance | Possible | Major | Tolerable | - |
| Loss of toll treatment allocation | Possible | Moderate | Tolerable | - |
| Forecast commodity prices too optimistic | Possible | Major | Tolerable | - |
Note:
Risks that produced a ‘High’ and ‘Very High’ inherent risk rating were considered further to identify and assign controls for the purpose of risk mitigation. Risks that produced ‘Very Low’, ‘Low’ and ‘Tolerable’ ratings did not undergo further rigorous evaluation given that their inherent rating was acceptable to the risk appetite of the Company. In so doing, those risks retained their inherent rating in Table 20.15.
| SRK | | Report date: 27 May 2022
Effective Date: 31 December 2021 |
| | | |
| SRK Consulting – 576060 SPM PSM Project TRS | Page 253 |
| 21 | INTERPRETATION AND CONCLUSIONS |
[§229.601(b)(96)(iii)(B)(22)] [SR4.2(v), SR7.1(ii)]
SRK has conducted a review and assessment of all material technical issues likely to influence the future performance of the P-S-M Project and the resulting TEM and TEPs, which included the following:
| · | Inspection visits to the P-S-M Project were conducted, as follows: |
| | o | Extensive visit to PPM (see Table 1.1) | 19/20 February 2020; | |
| | o | Limited follow-up visit to PPM and Wilgespruit (see Table 1.2) | 9 March 2021; | |
| | o | Inspection visit of East Pit and West Pit (Table 1.3) | 24 February 2022; | |
| | o | PPM, Sedibelo and Magazynskraal | 14/15 October 2013; | |
| · | Enquiry of key mine management and head office personnel during February to August 2021 and January to April 2022 in respect of the P-S-M Project, the LoM plans, the TEPs and other related matters; |
| · | Review of historical information for PPM for January 2017 to December 2021; |
| · | For the Mineral Resource and Mineral Reserve statements for the P-S-M Project: |
| o | The Mineral Resource and Mineral Reserve estimates for West Pit are based on the face positions of the open pit at end December 2021; |
| o | SRK compiled a revised geological model and mineral resource estimate for the Central Mining Block in 2020 as part of the 2020 FS; |
| o | SRK performed all necessary validation and verification procedures deemed appropriate to report and sign-off the Mineral Resources statements for the P-S-M Project; |
| o | SRK considers that all the modifying factors, mining/development rates and productivity indices incorporated in the mine design and production schedule in the LoM plan are appropriate and valid, and has reported and signed-off the Mineral Reserve Statement at 31 December 2021; |
| · | Examination and review of the TEPs in the LoM plans for the P-S-M Project, and all conclusions and recommendations drawn therefrom; and |
| · | Reviewed the economic and commodity price assumptions incorporated into the Mineral Resource and Mineral Reserve Statements, the TEPs and TEM for the P-S-M Project, which are based on an independent market report compiled by CRU (2021) with amended Pt/Pd prices from CRU (2022). |
SRK confirms that it has performed all validation and verification procedures deemed necessary to present signed off Mineral Resource and Mineral Reserve statements for the P-S-M Project.
SRK has reviewed the information provided by SPM and is satisfied that the extents of the properties described in the various rights are consistent with the maps and diagrams received from SPM.
SPM has confirmed to SRK that all legal information in this TRS is correct and its title to the mineral rights and surface rights for the P-S-M Project is valid.
SPM has confirmed in writing that to its knowledge, the information provided by it to SRK was complete and not incorrect, misleading or irrelevant in any material aspect. SRK has no reason to believe that any material facts have been withheld.
| 21.1 | Geology and Mineral Resources |
The following are noteworthy:
| · | Validation of drill hole collar positions indicates good correspondence to what is captured in the electronic data base; |
| · | SRK’s review of geological records of randomly selected drill core at the core yard relative to what is captured in the electronic database does reflect a good correspondence; |
| · | Protocols governing the chain of custody of samples from the site to the assay laboratories is adequate and ensures accountability of samples despatched. This contributes to the reliability of the assay data for grade estimation; |
| SRK | | Report date: 27 May 2022
Effective Date: 31 December 2021 |
| | | |
| SRK Consulting – 576060 SPM PSM Project TRS | Page 254 |
| · | The varying degree of assay QA/QC results observed is reflected in the Mineral Resource categories imposed across the different projects and mining operations. Lack of chrome assay QA/QC data is pronounced on the Sedibelo property and contributes significantly to the assignment of Inferred Mineral Resource category largely across this property; |
| · | Chrome, Ir and Ru assay data are non-existent on a large portion of the Sedibelo property. However, the regressed equation used as inference for Ir and Ru at West Pit, East Pit and Central Underground is robust and hence does not result in a downgrade of the Mineral Resource estimates for these two PGM elements. On the contrary, the regressed equation used to infer chrome data (for East Pit, Central Underground and part of East Underground) is not relatively robust and thus contributes to the chrome estimate within this footprint being downgraded to Inferred Mineral Resource; and |
| · | Where the grade estimates have been kriged, SRK notes that the quantity of 4E data (i.e., Pt, Pd, Rh and Au) adequately demonstrates grade continuity. SRK deems the estimation technique thus appropriate. The classification criteria adopted for the respective assets are sound and yield appropriate classification footprints. |
| 21.2 | Geotechnical parameters relevant to mine designs |
A review of the Central Underground Block and East Underground Block found no major risks or flaws.
No major stope blocks were identified in the geotechnical investigations. Cognisance needs to be taken concerning possible major falls of ground that may occur due to the poor rock mass quality of the hanging wall of the UG2. Support designs should take this into consideration, along with the development schedules.
Monitoring of all excavations is critical to verify the design and cater for possible optimization. To this end, provision should be made for the installation of a detailed monitoring programme utilising Smart Anchors.
Joint shear strength results from laboratory testing were not available; thus, a mean residual friction angle of 35° was applied for the slope design study. This value should be validated against test results in the future, as it may have a significant effect on the results of slope stability, and underground stability and support design analyses.
| 21.3 | Mining and Mineral Reserves |
From the data received it has been shown that the open pit optimizations have been studied rigorously and accurately.
Both practical pit designs have been prepared based on the optimum pit shells defined in the optimization. The intermediate pit designs are based on the 5-year plan pit designs. The mining schedule was prepared using the EPS mining software package and the mineral reserves are estimated within the practical pit designs. This schedule was essentially driven by RoM targets and the need to backfill waste into the mined-out areas of the open pits.
The vertical advance rate is generally within accepted norms. In order to start backfilling as soon as possible, it has been necessary to mine out the northern areas of the pits where the vertical advance rate approaches the upper acceptable norm as quickly as possible.
| 21.3.2 | Central and East Underground Blocks |
SRK considers that the mining method selected for the mining of the reefs is appropriate for the orebody characteristics.
The modifying factors applied in the Mineral Resource to Mineral Reserve conversion are derived from parameters used on similar mining operations within the BC.
The break-even calculation was based on benchmarked operating costs, modifying factors from similar type mining operations in the BC and global economic parameters. The mine scheduling targeted ground that is above the break-even grade. A small portion of the reef that is below the break-even has been included as selective mining is not practical. The portion that is below break-even is however not material.
No Inferred Mineral Resources were included in the mine design.
Only Probable Mineral Reserves have been declared for the Central and East Underground Blocks. Measured Mineral Reserves at the East Underground Block are converted to Probable Mineral Reserves since SPM will only declare Proved Mineral Reserves for an underground operation when the required development to support a mining block has been established and the ore block has been sampled. SRK supports this view.
| SRK | | Report date: 27 May 2022
Effective Date: 31 December 2021 |
| | | |
| SRK Consulting – 576060 SPM PSM Project TRS | Page 255 |
On 12 June 2012, the WHO classified diesel exhaust emissions as a Class 1 carcinogenic (cancer forming).
The ventilation design was based on a diesel emission dilution rate of 0.06 m³/s/kW. However, some mechanised PGM mines ventilating at rates in excess of 0.06 m³/s/kW cannot maintain DPM emissions below the recommended limit of 0.16 m³/kg. A ventilation rate of 0.06 m³/s/kW can only be considered if Tier 4 or 5 engines with 10 ppm fuel becomes available by the time the project commences.
The total ventilation quantity of ±500 m³/s per decline has been planned for single sided mining stopes. However, in the event of geological disturbances, for flexibility, most mines equip both sides of the raise lines and plan the ventilation quantities accordingly. If there are more geological disturbances than anticipated, the consequences can be insufficient ventilation for stopes mining at the extremities of the footprint. Should this be the case, the ventilation quantity in certain areas of the mine can be increased by considering a ventilation on demand system (performance of fans can be adjusted). The above should be taken into consideration when doing the final ventilation design.
The rock temperature will not exceed 37.0°C. The design confirms that no cooling will be required down to 700 m. Maximum wet bulb temperatures should not exceed 29.0°C.
The technologies utilized in the PPM concentrators are standard in the South African PGM industry and represent very little risk in the extraction of the PGMs and base metals.
The Kell process is novel in that it applies well recognized technologies (e.g., pressure oxidation, leach, precipitation, solvent extraction, ion exchange, flash drying) in the processing of the flotation concentrate without the need of a smelter step. This is identical to what has been the common processing route for PGM concentrates, with the exception that power intensive smelting is not included. Should the Kell process not deliver the expected results, SPM can revert to the conventional smelting and refining process currently provided by IRS. The use of Kell technology therefore does not represent a risk that would prevent the declaration of the Mineral Reserves presented in this report.
SRK is concerned that the amount of PGM locked in the residue generated in the Kell process has been underestimated e.g., a major contributor to the low first pass efficiency. In addition, the first pass efficiency of the MRT processes used for the recovery of Pt, Pd and Rh result in significant amounts of metal being recycled through the refinery. This requires additional processing capacity, which will contribute significantly to the overall operating cost. No mention of the residue/recycle processing costs could be found in the feasibility study.
The infrastructure required for the project comprises existing infrastructure at PPM and new infrastructure on Wilgespruit to support the underground operations.
In SRK’s opinion, the infrastructure described in this report is appropriate and adequate to support the requirements of the project and the LoM plan.
| 21.7 | Safety and Occupational Health |
PPM has a good SHEQ system in place, which is actively followed by all levels of management. The SHE system will have to be adapted to suit the mining operations for the Central and East Underground Blocks.
PPM recorded a commendable 6.273 million progressive fatality free shifts at the end of December 2021. In terms of the available statistics, there have been no fatalities from 2011 to 2021.
The LTIFR also decreased from a high of 3.8 in 2016 to 1.1 at the end of December 2021.
While significant progress has been made in improving the safety and health performance at PPM in recent years, additional safety improvement plans are required to achieve an environment of zero harm.
Although the number of lost time injuries has decreased, continued harm to employees can have the following implications:
| · | Impact on production and profits; |
| · | Increased involvement of DMRE with the possibility of additional Section 54 stoppages; and |
| SRK | | Report date: 27 May 2022
Effective Date: 31 December 2021 |
| | | |
| SRK Consulting – 576060 SPM PSM Project TRS | Page 256 |
The annual Occupational Medical Reports indicate a significant decrease in the number of certified NIHL cases as well as zero occupational diseases. Noise remains a health risk until there is proven zero NIHL cases for an extended period of five years. Compared to gold mines, the P-S-M Project should not be at risk of having to pay large sums of compensation to employees.
Prior to the further development of the P-S-M Project, SPM will have to acquire the necessary permits and licences to commence production, such as EMPr, WULs and Waste disposal licences (if required).
In addition, the relevant specialists studies should be updated.
PPM signed a MoU on 10 March 2022 with a consortium of IPPs to provide the mine with renewable energy. This is expected to deliver savings around 25% in annual power costs for PPM.
At the Effective Date of this TRS, a single family of farmer occupants still needs to sign the relocation agreement and discussions with the family are ongoing. SRK understands that relocation of this family should occur in the near future. This is not impacting on SPM’s ability to access the property and start mining at the East Pit
SPM’s social licence to operate could be affected by increased awareness of the rights of mining affected communities in SPM’s area of influence. Challenges to fairly distribute mine related opportunities amongst all affected communities may occur due to additional benefits allocated to the Lesethleng community as part of the Settlement Agreement. In addition, potential disruption of projects and challenges in maintaining strong stakeholder relations may result from internal tensions within the BBKT leadership and reported dissatisfaction about royalty benefits amongst some sectors of the community not aligned with the current leadership.
Currently, the capacity of SPM’s social team to deliver on commitments and engage with communities on a large scale is limited.
SPM appointed a Chief ESG Officer in December 2021 responsible for spearheading the Company’s ESG programme including its work on environment, renewable energy, emission reduction, social programmes, inclusivity and ESG reporting.
| 21.10 | Capital and Operating Cost Estimates |
SRK considers that the Capex for the P-S-M Project has an overall accuracy of ±25% and overall project contingency of <15%, in keeping with Table 1 to Paragraph (d) in §229.1302(d). The Capex was re-estimated in December 2021 terms, whereas portions of the metallurgical project Capex were escalated from the 2020 FS estimate by SPM in 2021 based on SA Stats CPI data.
SRK considers that the Opex for the P-S-M Project has an overall accuracy of ±25% or better. A contingency on Opex of 5% was applied which is within the <15% per Table 1 to Paragraph (d) in §229.1302(d).
| 21.11 | Project Implementation |
The confidence in the accuracy of the schedule dates is not to the level required to implement the project. These schedules were determined as part of a study that is considered to be at pre-feasibility level due to incomplete information or omissions that are described earlier in this report (Section 1.1). The durations of the various activities are reasonable for a project of this nature.
Key issues for the integrated P-S-M Project are:
| · | Human resources issues – relating to escalating wage demands and lack of suitable accommodation in the area; |
| · | Environmental constraints – stemming from potential failure to secure authorizations; |
| o | stemming from access to land; |
| o | relating to potential disruptions to- and challenges in- maintaining strong stakeholder relations, as well as high expectations various socio-economic benefits; and |
| · | Water-related issues – relating to water management aspects, and regulatory non-compliance with GN704 for a number of facilities. |
| SRK | | Report date: 27 May 2022
Effective Date: 31 December 2021 |
| | | |
| SRK Consulting – 576060 SPM PSM Project TRS | Page 257 |
Inferred Mineral Resources in the mining schedule for the East Pit, excluded from the current schedules, can increase the current Mineral Reserves by approximately 30% for the East Pit, if targeted by the exploration programme discussed in Section 22.1. This represents an upside to the project.
The economic analysis of the P-S-M Project has been done at an effective level of a pre-feasibility study as defined by SK1300, which is more advanced than an initial assessment.
The economic analysis of the P-S-M Project is based on a detailed LoM plan which exploits Probable Mineral Reserves. No Inferred Mineral Resources have been included in the LoM plan nor the cash flow analysis.
The average steady-state underground operating cost for the P-S-M Project of ZAR12 495/oz 4E is comparable to that at Amandelbult (Table 19.4) for similar mining depths.
The real-terms economic analysis using the CRU price deck and three-year trailing average prices yields positive results (post-tax NPV9.0% of ZAR28.3bn and ZAR15.8bn respectively) that support the declaration of Mineral Reserves. Operating margins of >50% are in line with similar PGM operations in South Africa.
The IRR with use of the CRU price deck cannot be determined as the cash flows are positive in each period, i.e., the project is self-funding from the operating profit. Peak funding of ZAR6.68bn would be required with use of the three-year trailing average price and exchange rate values and the pay-back period is shown to be eight years.
The average steady-state operating costs are largely unaffected by which price deck is used.
The twin-sensitivity tables show that the P-S-M Project is most sensitive to changes in Revenue and least sensitive to changes in Capex.
The TRS contains statements of a forward-looking nature. The achievability of the projections, LoM plans, budgets and forecast TEPs as included in the TRS is neither warranted nor guaranteed by SRK. The projections cannot be assured as they are based on economic assumptions, many of which are beyond the control of the Company or SRK.
| SRK | | Report date: 27 May 2022
Effective Date: 31 December 2021 |
| | | |
| SRK Consulting – 576060 SPM PSM Project TRS | Page 258 |
[§229.601(b)(96)(iii)(B)(23)
Exploration Programme and Budget
SPM’s consolidated exploration budget for 2022 to 2026 for the P-S-M Project is as presented in Table 22.1.
Table 22.1: P-S-M Project – Summary of Exploration Budget (all amounts in ZARm)
| Item | Total | 2022 | 2023 | 2024 | 2025 | 2026 |
| East Pit | 4.6 | 4.6 | 0.0 | 0.0 | 0.0 | 0.0 |
| Diamond Drilling | 3.6 | 3.6 | - | - | - | - |
| Assays | 1.0 | 1.0 | - | - | - | - |
| East Decline Geotech | 7.0 | 0.0 | 7.0 | 0.0 | 0.0 | 0.0 |
| Sedibelo/Wilgespruit (resampling of core for 6E analyses) | 15.0 | 7.3 | 7.3 | 0.4 | - | - |
| Central Underground | 91.8 | 13.8 | 22.4 | 13.8 | 22.6 | 19.2 |
| Diamond Drilling (South) | 76.8 | 12.5 | 13.9 | 12.2 | 20.7 | 17.4 |
| Diamond Drilling (Geotech) | 7.0 | 0.0 | 7.0 | - | - | - |
| Assays | 8.0 | 1.3 | 1.4 | 1.6 | 1.9 | 1.8 |
| Total | 118.3 | 25.7 | 36.6 | 14.2 | 22.6 | 19.2 |
SPM’s exploration programmes for the East Pit, Central and East Underground Blocks comprise the following:
| o | Year 1 (2022) – nine diamond drill holes, drilled with triple-tube drilling in shallower areas, total ca. 650 m, to target the silicate reefs. |
| o | Year 2 (2023) – five diamond drill holes for geotechnical investigations including wireline logging; |
| · | Sedibelo/Wilgespruit – re-sampling of core for 6E PGM analyses; |
| · | Central Underground Block: |
| o | Drilling of diamond drill holes in the southern part of the property, with nine holes (in 2022) and seven holes (in 2023), to extend the resources in the south and infill drilling as required in the current planned mining area; |
| o | Geotech diamond drill holes in Year 2 (2023), comprising five drill holes for the boxcut and along the line of the portal and decline; |
| o | Downhole geophysics included in 25% of holes (for geotechnical and structural information). |
A large portion of the above exploration information is required at least two years before the final shaft layouts are required to complete the feasibility and mining studies. Most of the planned holes are located within the planned LoM areas.
Figure 22.1 highlights the close spaced drilling in the shallower areas and the sparsely drilled deeper areas (black dots). The planned drill holes cover mostly the deeper areas (green dots).
SPM is considering additional exploration drilling in the deeper areas of the West Pit to assist detailed mine planning, however no budget has been provided for this at this stage.
| SRK | | Report date: 27 May 2022
Effective Date: 31 December 2021 |
| | | |
| SRK Consulting – 576060 SPM PSM Project TRS | Page 259 |
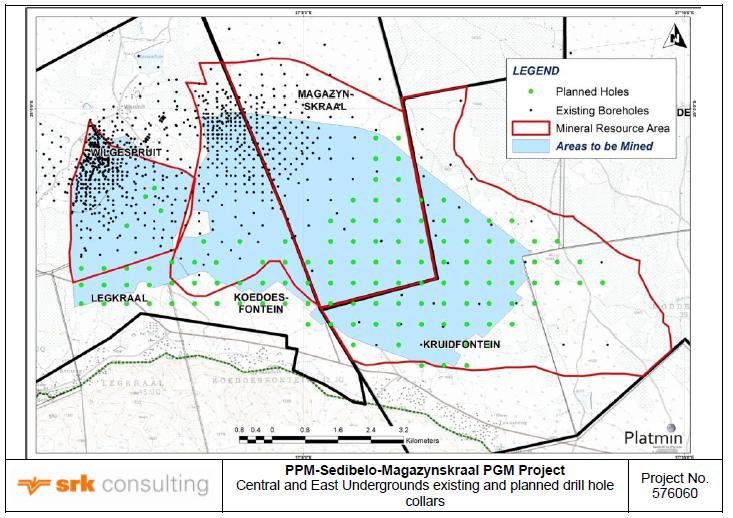
Figure 22.1: Central and East Underground Blocks existing and planned drill hole collars
Drilling related costs includes drilling, site establishment, inter-hole movement, down-hole directional surveys, rehabilitation, core boxes, transport, water and casing.
SPM’s total exploration budget for the P-S-M Project of ZAR118.3m per Table 22.1 is catered for in the LoM cash flow evaluation.
SRK has reviewed SPM’s exploration budget and considers it reasonable for the planned activities set out in the exploration programme.
The chromite Mineral Resource estimates are classified in the Inferred category due to the lack of chrome assays to confirm the grades and enable a robust spatial estimate to be determined.
Available pulps of UG2 material from the Wilgespruit drill core should be submitted for chrome assays, which would increase the sample size and enable the Inferred Chromite Resources to be upgraded to an Indicated classification. SRK considers there is sufficient budget in Table 22.1 to handle this assay work.
Additional geotechnical work should be carried out before the implementation phase commences, which would include:
| · | Directional, orientated drilling along the line of the decline development to validate structural orientation and design rock mass data (Table 22.2; included in the exploration budget in Section 22.1); |
| · | Detailed portal slope engineering designs, with their associated risk management programmes, such as slope stability monitoring and depressurisation; |
| · | Review and optimization of spans and pillar designs by numerical modelling based on additional data gathered; |
| · | Update of detailed cost estimates to improve accuracy and source current cost quantities; and |
| · | Detailed numerical modelling for support of sills within the first 2-10 m into the hanging-wall of the UG2. |
| SRK | | Report date: 27 May 2022
Effective Date: 31 December 2021 |
| | | |
| SRK Consulting – 576060 SPM PSM Project TRS | Page 260 |
Table 22.2: Geotechnical drilling programme for detailed decline and portal design
| Primary Access development | Number of holes to be scheduled | Comments |
| Portal positions | 8 holes in total | Four holes to be planned for the West and East portal. The holes need only be to the planned depth of the portal ~30-40 m |
| West Decline | 8 holes (2 per decline leg) | Two holes per leg for legs 1 to 4 will be required as insufficient data exists for the new decline position. |
| 22.4 | Hydrogeological investigation |
The recommended hydrogeological investigations per the 2020 FS are set out in Table 22.3. The Capex, which has been escalated to December 2021 terms, is included in the pre-implementation Capex in Table 17.6.
Table 22.3: Hydrogeology Capex budget
| Action | Total (ZARm) |
| Drilling of 5 additional monitoring boreholes (80 m) with supervision | 0.74 |
| Testing (12h max flow) of newly drilled monitoring boreholes (5) and existing local monitoring (6) boreholes with supervision | 0.48 |
| Packer testing (5 drill holes; 15 packer tests per hole) of geological drill holes (HQ diameter) | 1.80 |
| Updated hydrocensus; Model update with packer data and calculated parameters; Geochemical assessment; and Reporting | 0.30 |
| Total hydrogeology Capex | 3.65 |
| 22.5 | Surface geotechnical investigation |
The 2020 FS made provision for surface geotechnical investigations at the West and East Portal sites, as well as within the areas on Wilgespruit and Magazynskraal where TSFs may be constructed, as shown in Table 22.4.
Table 22.4: Geotechnical Investigations
| Item | West Portal | East Portal | Sedibelo TSF site (Wilgespruit) | Magazynskraal TSF site |
| Test Pits | 12 | 12 | 30 | 30 |
| Rotary cored drill holes (one orientated) | 3 | 3 | 3 | 3 |
| Geotechnical tests: | | | | |
| Foundation indicator (grading and Atterberg Limits) | 10 | 10 | 20 | 20 |
| Oedometer | 2 | 2 | 2 | 2 |
| Corrosiveness | 2 | 2 | 2 | 2 |
| Compaction (Mod & CBR) | 3 | 3 | 5 | 5 |
| Uniaxial Compressive Strength (UCS) | 6 | 6 | 4 | 4 |
| Triaxial Compressive Strength (TCS) | 6 | 6 | 4 | 4 |
A Capex budget for these geotechnical investigations of ZAR2.7m, in December 2021 terms, is included in the pre-implementation Capex in Table 17.6.
| 22.6 | Mining and Mineral Reserves |
The planned exploration drilling and down-hole and ground magnetic surveys in Section 22.1 may assist in delineating any additional structural features.
The geological models should be updated with this additional data and the mine design re-evaluated against the updated geological and structural information.
Infill drilling may enable the extent of the PUP in Mineral Reserves to be increased.
In order to mitigate the risk of diesel emission related occupational diseases, the following should be provided:
| · | The latest low emission Tier 4 engines; |
| · | Improved exhaust catalyst converter systems; |
| · | Sufficient ventilation at the points of operation; and |
| · | In the event of geological disturbances which may impact on production, a ventilation on demand system (performance of fans can be increased or decreased) can be considered. |
The cost of the above has been catered for in the ventilation design and Capex budget.
| SRK | | Report date: 27 May 2022
Effective Date: 31 December 2021 |
| | | |
| SRK Consulting – 576060 SPM PSM Project TRS | Page 261 |
The 2020 Kell feasibility study recommended that certain activities be undertaken to support final detailed design.
The Ni/Co solvent extraction and the MRT circuits did not form part of the flowsheet as previously piloted for SPM and are critical to the operation.
Vendor test work is required to finalize equipment selection for key items such as filters, thickeners and the acid recovery system.
Semi-continuous bench/mini-pilot scale tests are required to demonstrate the efficacy of the Ni/Co solvent exchange circuit, the PGM MRT/ion exchange circuit and the acid recovery circuit.
| 22.9 | Safety and Occupational Health |
In order to have an effective safety improvement plan, the improvement plan can only be effective if the safety initiatives are consistently applied by all, from the management leadership teams, and supervisors down to employee level on the working faces.
| 22.9.2 | Occupational Health |
The annual Occupational Health Surveillance statistics do not indicate if all possible occupational health diseases are monitored. The mine may need to expand the monitoring system (or include in the annual results) to record health surveillance statistics on an annual basis on the following additional aspects:
| · | Diagnosed Occupational TB cases; |
| · | Occupational Dermatitis; |
| 22.10 | Environmental and Social |
SPM has to ensure that the necessary permits and licences to commence production are in place. Additionally, the relevant specialists studies should be updated.
A budget of ZAR4.8m has been included in the project Capex to enable SPM to acquire the required environmental authorizations, licences and permits.
The additional closure liability associated with the P-S-M Project is ZAR69m for the West Portal infrastructure and the East Portal Rope Conveyor, since financial provisioning for project activities on the farm Wilgespruit (viz. the East Portal and East Pit) formed part of the Sedibelo mining right application in 2008 and subsequent amendment in 2015 and are already in place.
SPM needs to adopt an integrated and holistic approach supported by an adequately resourced social team to effectively manage the social risks associated with the high level of community expectations, legacy issues and local governance dynamics.
| 22.11 | Access on to Wilgespruit and Project Implementation |
Despite SPM having signed a settlement agreement with the LLC, one family at the Effective Date of this report had refused to relocate from Wilgespruit. SPM advised SRK that this has been resolved and at the issue date of this report access on to Wilgespruit was possible. Access to Wilgespruit is though later than planned by SPM, which could impact on the planned implementation schedule.
This could result in production from the East Pit being available later than planned with reduced ore feed for the concentrators.
SPM should expedite the finalisation of the EPCM and mining contracts for the East Portal and East Underground Block, so that any delays in the target implementation dates are minimised.
| SRK | | Report date: 27 May 2022
Effective Date: 31 December 2021 |
| | | |
| SRK Consulting – 576060 SPM PSM Project TRS | Page 262 |
| 23 | RELIANCE ON INFORMATION PROVIDED BY REGISTRANT |
[§229.601(b)(96)(iii)(B)(25)] [SR4.5(viii)]
SRK has relied on information provided by SPM (the registrant) and its advisors in preparing this TRS regarding the following aspects of the modifying factors which are outside of the QP’s expertise:
| • | Economic trends, data, assumptions and commodity price forecasts (Sections 15); |
| • | Marketing information (Section 15); |
| • | Legal matters, tenure and permitting/authorization status (Section 2.3). |
| • | Agreements with local communities (Section 16). |
SRK believes it is reasonable to rely upon the registrant for the above information, for the following reasons:
| • | Commodity prices and exchange rates – SRK does not have in-house expertise in forecasting commodity prices and exchange rates and would defer to industry experts, such as CRU, for such information which came via the Company; |
| • | Annual inflation indices as incorporated into the Company’s techno-economic models are the consumer price indices (CPI) which the Company had extracted from Statistics South Africa at http://www.statssa.gov.za; |
| • | Legal matters – SRK does not have in-house expertise to confirm that all mineral rights and environmental authorisations/permits have been legally granted and correctly registered. SRK would defer to a written legal opinion on the validity of such rights and authorisations, which came via the Company. |
SPM has confirmed in writing that to its knowledge, the information provided by it to SRK was complete and not incorrect, misleading or irrelevant in any material aspect. SRK has no reason to believe that any material facts have been withheld.
| SRK | | Report date: 27 May 2022
Effective Date: 31 December 2021 |
| | | |
| SRK Consulting – 576060 SPM PSM Project TRS | Page 263 |
[§229.601(b)(96)(iii)(B)(24)] [SR4.5(viii)]
| 24.1 | Documents Provided by the Company |
Adams M. (2016). Kell Process Development – “Mineralogy Process Model for PPM”, a memorandum from Mike Adams To: Keith Liddell, Lisa Smith Copy: Date: 20 October, compiled by Simulus Engineers, Perth, Australia.
Amax BEE Verifications (Pty) Ltd (Amax) (2020). Broad-Based Black Economic Empowerment Verification Certificate, issued to Pilanesberg Platinum Mines (Pty) Ltd, by Amax BEE Verifications (Pty) Ltd, December 2020.
Barrick Gold Limited (Barrick) (2008). Feasibility Study for the Sedibelo PGM Project, compiled by Barrick Gold Limited.
CRU International Limited (CRU) (2021). PGMs & Chrome Market Study – Sedibelo, prepared for Sedibelo as part of their NYSE IPO support process by CRU International Limited, 5 July 2021.
CRU International Limited (CRU) (2022). Email Update confirmation CRU Price Forecast, provided by Sedibelo, 21 January 2022.
Digby Wells Environmental (Pty) Ltd (2021). Memorandum: Pilanesberg Platinum DMRE Costing-2020 and IBMR - Sedibelo Mining Project DMRE Closure Costing-2020, addressed to Sedibelo Platinum Mines Ltd, February 2021.
ENSafrica (ENS) (2021). Status of Sedibelo Platinum Mines Limited’s (SPM) Mining and Environmental Licences, Permits and Consents, memorandum compiled by Lloyd Christie and Dalit Anstey of ENSafrica for SPM, July 2021.
Itereleng Bakgatla Minerals Resources (Pty) Ltd (IBMR) (2017). Mining Work Programme, submitted for a Mining Right Application by Itereleng Bakgatla Minerals Resources (Pty) Ltd in support of the Section 102 application to consolidate the existing IBMR NOMR NW30/5/1/2/2/333MR with the NOPRs on Magazynskraal (NW30/5/1/1/2/1334PR and NW30/5/1/1/2/1680PR) and Kruidfontein (NW30/5/1/1/2/10259PR), dated May 2017.
Mbonambi, M., Pillay, K., Marape, G. and Govender, V. (2011). Characterisation Testwork on the Magazynskraal Ore, Managed By Boyton on behalf of Richtrau 123, Mintek report dated 19 August 2011.
Middindi Consulting (Pty) Ltd (2022). MDI2021-0050 Magazynskraal East Decline Boxcut Position Memo, memorandum received from Mr Trevor Rangasamy, 23 February 2022.
Mitchell, A., Denner, N. and Preston, P., (2010). Kruidfontein Platinum Project CPR presentation, PowerPoint presentation, prepared for Afarak Holdings (Pty) Ltd, June 2010, 32 slides.
SFA Oxford Limited (SFA) (2021). Provision of PGM market intelligence and long-term metal price forecasts, prepared for Sedibelo Platinum by SFA Oxford Limited, March 2021.
Sedibelo Platinum Mines Limited (SPM) (2022a). MS Excel file WACC Analysis_Febr2022._FINAL.xlsx, received by email from Ms Elmarie Maritz, CFO for Sedibelo Platinum Mines, 7 February 2022.
Sedibelo Platinum Mines Limited (SPM) (2022b). Techno-economic model for the P-S-M Project, MS Workbook WP - EP - SCD - SEMD - Sedibelo Model Rev 36 v5 - Kell Scenario - 20220323 - 16.24 x 20220411 - 19.12.xlsb, compiled by Mr Dean Riley of Sedibelo Platinum Mines, received via electronic file transfer 11 April 2022.
Simulus Engineers (Simulus) (2013). Platmin LTD – Platmin Kell Process – Feasibility Study, Report Reference number PILP-000-EGR-001 dated 17 December 2013, report submitted to Pilanesberg Platinum Mines (Pty) Ltd, compiled by Simulus Engineers, Perth, Australia.
Simulus Engineers (Simulus) (2016). Kelltech Ltd KTL PILP EXTENDED PILOTING FINAL REPORT, Report reference PILP-000-EGR-013 Revision D dated 26 September 2016, report submitted to Pilanesberg Platinum Mines (Pty) Ltd, compiled by Simulus Engineers, Perth, Australia.
Simulus Engineers (Simulus) (2020). Sedibelo Kell Plant 2020 Feasibility Study Update, Project Report, Report Reference PILP-000-EGR-101 Revision B dated 11 December 2020, report submitted to Kelltechnology South Africa (RF) (Pty) Ltd, compiled by Simulus Engineers, Welshpool, Western Australia.
SRK Consulting (South Africa) (Pty) Limited (SRK) (2017). A Competent Person’s Report of the PGM Assets of Sedibelo Platinum Mines Ltd in the Republic of South Africa, compiled by SRK Consulting (South Africa) (Pty) Ltd for Sedibelo Platinum Mines Ltd, issued February 2017.
SRK Consulting (South Africa) (Pty) Ltd (SRK) (2020). Updated Feasibility Study for Sedibelo-Magazynskraal PGM Project (Wilgespruit Access), compiled for Sedibelo Platinum Mines Ltd by SRK Consulting (South Africa) (Pty) Ltd (as Lead Consultant), with input from Middindi Consulting (Rock Engineering), Sound Mining Solutions (Mining), DRA Projects (Pty) Ltd (Metallurgy), Worley (RSA) Ltd (Surface/Underground Infrastructure), BBE Consulting (Ventilation) and SLR Consulting (Pty) Ltd (Environment, Closure) in 28 chapters, issued in July 2020.
| SRK | | Report date: 27 May 2022
Effective Date: 31 December 2021 |
| | | |
| SRK Consulting – 576060 SPM PSM Project TRS | Page 264 |
SRK Consulting (South Africa) (Pty) Ltd (SRK) (2021). Competent Persons Report on SPM’s PGM Assets in South Africa (CRU Price Deck), compiled by SRK Consulting (South Africa) (Pty) Ltd for Sedibelo Platinum Mines Ltd, June 2021.
Van der Merwe, J. (2021). Summary of the Mineral Resources and Future Exploration for Sedibelo Platinum Mines (SPM) in the Western & Eastern Bushveld, prepared for Sedibelo Platinum Mines, March 2021.
Van der Merwe, J. (2022). Email exchange regarding the geotechnical drilling at the East Portal and the revised exploration budget for the PSM Project, 23 February 2022.
Venmyn Rand (Pty) Ltd (Venmyn) (2011). A Pre-Feasibility Study on Richtrau No 123 (Pty) Limited’s Magazynskraal-Sedibelo East Project, in the form of a National Instrument 43-101 Technical Report and Valuation Statement, compiled by Venmyn Rand (Pty) Ltd for Richtrau No 123 (Pty) Ltd and Boynton Investments (Pty) Ltd, 1 October 2011.
Viring, R. (undated). Note for the Record (Potential Water Bearing Fissures), Sedibelo East / Magazynskraal Platinum Project, compiled for Richtrau 123 (Pty) Ltd and Boynton Investments Ltd, undated report as part of the pre-feasibility study (ca. 2010).
Viring, R. (2021). Personal communication. Email exchange regarding groundwater on 27 July 2021, with attachments 'water faults.pdf' and 'NFTR_Potential Water Bearing Fissures v2.pdf'.
| 24.2 | Public Domain Documents |
Anglo American PLC (2018a). Integrated Annual Report 2017, downloaded on 8 July 2021, https://www.angloamerican.com/~/media/Files/A/Anglo-American-Group/PLC/investors/annual-reporting.
Anglo American PLC (2018b). Ore Reserves and Mineral Resources Report 2017, downloaded on 8 July 2021, https://www.angloamericanplatinum.com/~/media/Files/A/Anglo-American-Group/Platinum/investors/annual-reporting/2018/aap-ore-reserves-and-mineral-resources-report-2018.pdf.
Anglo American PLC (2021a). Integrated Annual Report 2020, downloaded on 8 July 2021, https://www.angloamerican.com/~/media/Files/A/Anglo-American-Group/PLC/investors/annual-reporting.
Anglo American PLC (2021b). Ore Reserves and Mineral Resources Report 2020, downloaded on 8 July 2021, https://www.angloamericanplatinum.com/~/media/Files/A/Anglo-American-Group/Platinum/investors/annual-reporting/2021/aap-ore-reserves-and-mineral-resources-report-2020.pdf.
Deloitte (2015). Reputation risk survey report, compiled by Deloitte Inc. https://www2.deloitte.com/content/dam/Deloitte/za/Documents/risk/NEWReputationRiskSurveyReport_25FEB.pdf, downloaded on 15 March 2021.
Ernst & Young (2021). Top 10 business risks and opportunities for mining and metals in 2021. https://www.ey.com/en_gl/mining-metals/top-10-business-risks-and-opportunities-for-mining-and-metals-in-2021 downloaded on 15 March 2021.
ESI Africa (2021). Legal firm comments on South Africa’s embedded generation changes, 18 August 2021. Accessed https://www.esi-africa.com/industry-sectors/transmission-and-distribution/legal-firm-comments-on-south-africas-embedded-generation-changes/; date of access 14 September 2021.
Freele, E. (2021). The top ten ‘S’ trends in ESG to watch in 2021. The Northern Miner. 13 January 2021, downloaded on 15 March 2021.
International Integrated Reporting Framework (IIRF) (2021). The International Integrated Reporting Council. https://integratedreporting.org/resource/international-ir-framework/, downloaded on 15 March 2021.
Northam Platinum Ltd (2020a). Integrated Annual Report 2020, downloaded on 8 July 2021, https://www.northam.co.za/investors-and-media/publications/annual-reports.
Northam Platinum Ltd (2020b). Mineral Resources and Mineral Reserves Statement 2020, downloaded on 8 July 2021, https://www.northam.co.za/investors-and-media/publications/annual-reports.
SAMESG (2017). The South African Guideline for the reporting of Environmental, Social and Governance Parameters within the Solid Minerals and Oil and Gas Industries, prepared by the South African Environmental, Social and Governance (SAMESG) Committee under the auspices of the SAIMM and GSSA, June 2017. Available https://www.samcode.co.za/
| SRK | | Report date: 27 May 2022
Effective Date: 31 December 2021 |
| | | |
| SRK Consulting – 576060 SPM PSM Project TRS | Page 265 |
SAMREC (2016), The South African Code for the Reporting of Exploration Results, Mineral Resources and Mineral Reserves (The SAMREC Code): prepared by The South African Mineral Resource Committee under the joint auspices of the Southern African Institute for Mining and Metallurgy and the Geological Society of South Africa, released May 2016. Available https://www.samcode.co.za/
Sedibelo Platinum Mines Ltd (SPM) (2019). Mineral Resources and Reserves as at Dec 2019, https://www.sedibeloplatinum.com/documents/SPM_Mineral_Resources_Reserves_December_2019_Website.pdf, downloaded 31 December 2021.
UBS Switzerland AG (UBS) (2021). Consensus Economics’ price and ZAR:USD exchange rate forecasts given in real terms for four years from 2021 to 2024, downloaded 31 December 2020, https://financialservicesinc.ubs.com/wealth/Ourresearchadvantage/ForeignExchangeOurresearchadvantage.html.
XE.com Inc. (previously known as Xenon Laboratories Incorporated) (2021). Historical ZAR:USD exchange rates, downloaded on 17 January 2022, www.xe.com.
| SRK | | Report date: 27 May 2022
Effective Date: 31 December 2021 |
| | | |
| SRK Consulting – 576060 SPM PSM Project TRS | Page 266 |
| 25 | DATE AND SIGNATURE PAGE |
[SR9.1 (i) (ii)]
This TRS documents the Mineral Resource and Mineral Reserve statements for SPM’s P-S-M Project located in the Republic of South Africa as prepared by SRK in accordance with the requirements of SK1300 and the SAMREC Code (2016).
The opinions expressed in this TRS are correct at the Effective Date of 31 December 2021.
SRK Consulting (South Africa) (Pty) Ltd
| |
| /s/ SRK Consulting (South Africa) (Pty) Ltd |
| Authorized Signatory |
[SR9.1(iii)]
| (Report Date: | 27 May 2022) |
| (Effective Date: | 31 December 2021) |
| SRK | | Report date: 27 May 2022
Effective Date: 31 December 2021 |
| | | |
| SRK Consulting – 576060 SPM PSM Project TRS | Page 267 |
GLOSSARY OF TERMS, ABBREVIATIONS, CHEMICAL ELEMENTS, UNITS
TERMS
| Term | Description |
| alluvial | derived from alluvium |
| alluvial fan | an accumulation of sediments shaped like a section of a shallow cone with its apex at a point source of sediments, such as a narrow canyon emerging from an escarpment |
| alluvium | loose clay, silt, sand, or gravel that has been deposited by running water |
| anorthosite | an intrusive igneous rock composed mainly of calcium-rich plagioclase feldspar |
| anticline | rock strata folded to give a convex upward structure |
| apophysis(es) | a tapering offshoot(s) from a larger igneous intrusive mass |
| artisanal | a term describing an informal miner using unsophisticated recovery methods |
| assay | the chemical analysis of ore samples to determine their metal content. |
| basalt | an extrusive igneous rock formed from the rapid cooling of low-viscosity lava rich in magnesium and iron (mafic lava) exposed at or very near the surface; more than 90% of all volcanic rock on Earth is basalt |
| Bushveld Complex | The BC is a magmatic layered mafic intrusion. As one of the largest known differentiated igneous bodies, it hosts world class deposits of PGMs, nickel, copper, chrome and vanadium. |
| chalcopyrite | an important copper mineral commonly called ‘fool’s gold’ – Cu2S.Fe2S2 |
| chalcopyrite | a copper iron sulfide mineral with the chemical formula CuFeS2 |
| chromitite | an oxide mineral composed primarily of iron(II) oxide and chromium(III) oxide compounds with the chemical formula of FeCr2O4 |
| dip | the angle of inclination from the horizontal of a geological feature. |
| dunite | an igneous, plutonic rock, of ultramafic composition, with coarse-grained or phaneritic texture. The mineral assemblage is greater than 90% olivine, with minor amounts of other minerals such as pyroxene, chromite, magnetite, and pyrope |
| fault | a break in the continuity of a body of rock, usually accompanied by movement on one side of the break or the other so that what were once parts of one continuous rock stratum or vein are now separated |
| felsic | an adjective describing igneous rocks that are relatively rich in elements that form feldspar and quartz |
| footwall | the underlying side of a fault, orebody, or mine working |
| granite | a coarse-grained intrusive igneous rock composed mostly of quartz, alkali feldspar, and plagioclase |
| granitoid | a generic term for a diverse category of coarse-grained igneous rocks that consist predominantly of quartz, plagioclase, and alkali feldspar |
| hangingwall | the overlying side of an orebody, fault, or mine working, |
| harzburgite | an ultramafic, igneous rock consisting mostly of olivine and low-calcium pyroxene |
| Holocene | the current geological epoch, which began after the last glacial period (approximately 11 650 years before present) |
| Indicated Mineral Resource | that part of a Mineral Resource for which quantity, grade or quality, densities, shape and physical characteristics are estimated with sufficient confidence to allow the application of Modifying Factors in sufficient detail to support mine planning and evaluation of the economic viability of the deposit. Geological evidence is derived from adequately detailed and reliable exploration, sampling and testing which is sufficient to assume geological and grade or quality continuity between points of observation. |
| Inferred Mineral Resource | that part of a Mineral Resource for which quantity and grade or quality are estimated on the basis of limited geological evidence and sampling. Geological evidence is sufficient to imply but not verify geological and grade or quality continuity. An Inferred Mineral Resource has a lower level of confidence than that applying to an Indicated Mineral Resource and must not be converted to a Mineral Reserve. |
| Iron-rich ultramafic pegmatoid | resulting from metasomatism by iron-rich fluids. The replacement pegmatoid is usually coarse-grained to pegmatoidal but is of variable texture |
| Karoo Supergroup | a sequence of mostly nonmarine units, deposited between the Late Carboniferous and Early Jurassic periods |
| Kriging | an interpolation method that minimizes the estimation error in the determination of a mineral resource. |
| layered intrusion | a large sill-like body of igneous rock which exhibits vertical layering or differences in composition and texture |
| lopolith | a large igneous intrusion which is lenticular in shape with a depressed central region. Lopoliths are generally concordant with the intruded strata with dike or funnel-shaped feeder bodies below the body. The |
| mafic | a silicate mineral or igneous rock rich in magnesium and iron |
| magma | the molten or semi-molten natural material from which all igneous rocks are formed |
| Measured Mineral Resource | that part of a Mineral Resource for which quantity, grade or quality, densities, shape and physical characteristics are estimated with confidence sufficient to allow the application of Modifying Factors to support detailed mine planning and final evaluation of the economic viability of the deposit.. Geological evidence is derived from detailed and reliable exploration, sampling and testing which is sufficient to confirm geological and grade or quality continuity between points of observation. A Measured Mineral Resource has a higher level of confidence than that applying to either an Indicated Mineral Resource or an Inferred Mineral Resource. It may be converted to a Proved Mineral Reserve or a Probable Mineral Reserve. |
| metasedimentary | originally a sedimentary rock which has undergone a degree of metamorphism but the physical characteristics of the original material is not destroyed |
| SRK | | Report date: 27 May 2022
Effective Date: 31 December 2021 |
| | | |
| SRK Consulting – 576060 SPM PSM Project TRS | Page 268 |
| Term | Description |
| Mineral Reserve | the economically mineable part of a Measured and/or Indicated Mineral Resource. It includes diluting materials and allowances for losses, which may occur when the material is mined or extracted and is defined by studies at Pre-Feasibility or Feasibility level as appropriate that include applications of Modifying Factors. Such studies demonstrate that, at the time of reporting, extraction could reasonably be justified. The reference point at which Mineral Reserves are defined, usually the point where the ore is delivered to the processing plant, must be stated. It is important that, in all situations where the reference point is different, such as for saleable product, a clarifying statement is included to ensure that the reader is fully informed as to what is being reported. |
| Mineral Resource | a concentration or occurrence of solid material of economic interest in or on the Earth’s crust in such a form, grade or quality, and quantity that there are reasonable prospects for eventual economic extraction. The location, quantity, grade, continuity and other geological characteristics of a Mineral Resource are known, estimated or interpreted from specific geological evidence and knowledge, including sampling. |
| norite | a mafic intrusive igneous rock composed largely of the calcium-rich plagioclase labradorite, orthopyroxene, and olivine |
| oikocrysts | in poikilitic fabric, the enclosing crystal |
| olivine | the name of a group of rock-forming minerals that are typically found in mafic and ultramafic igneous rocks such as basalt, gabbro, dunite, diabase, and peridotite |
| outcrop | a visible exposure of bedrock or ancient superficial deposits on the surface of the Earth |
| overburden | material, usually barren rock overlying a useful mineral deposit. |
| pegmatite | a coarsely crystalline igneous rock with crystals several centimetres in length |
| pegmatoid | a rock resembling or similar in structure to pegmatite, but usually lacking a graphic appearance |
| pentlandite | an iron–nickel sulfide with the chemical formula (Fe,Ni)9S8 |
| plagioclase feldspar | a group of feldspar minerals that form a solid solution series ranging from pure albite, Na(AlSi3O8), to pure anorthite, Ca(Al2Si2O8). |
| poikilitic | a texture of igneous rocks in which numerous smaller grains of various minerals in random orientation are completely enclosed within a large, optically continuous crystal of different composition |
| pothole | circular to oval-shaped depressions within the Merensky Reef and UG2 Reef. Within the depression, the reef unit may crosscut the footwall stratigraphy at a high angle and ultimately lie at a lower stratigraphic elevation than the typical reef. Within the pothole, anomalous hangingwall, footwall and reef stratigraphy may be developed. In some instances, the reef within a pothole may have higher than average grades; in others it may be uneconomic. In extreme cases, reef is not recognisable within the pothole. |
| Probable Mineral Reserve | the economically mineable part of an Indicated, and in some circumstances, a Measured Mineral Resource. The confidence in the Modifying Factors applying to a Probable Mineral Reserve is lower than that applying to a Proved Mineral Reserve. |
| Proterozoic | of or relating to the later of the two divisions of Precambrian time, from approximately 2.5 billion to 570 million years ago, marked by the build-up of oxygen and the appearance of the first multicellular eukaryotic life forms |
| Proved Mineral Reserve | the economically mineable part of a Measured Mineral Resource. A Proved Mineral Reserve implies a high degree of confidence in the Modifying Factors. |
| pyrite | an iron sulfide mineral with the chemical formula FeS2 (iron (II) disulfide); pyrite is the most abundant sulfide mineral |
| pyroxenite | an ultramafic igneous rock consisting essentially of minerals of the pyroxene group |
| pyrrhotite | an iron sulfide mineral with the formula Fe(1-x)S (x = 0 to 0.2) |
| reef | a thin, continuous layer of ore-bearing rock |
| RoM | Run-of-Mine – usually ore produced from the mine for delivery to the process plant. |
| SAMESG Guidelines | The South African Guideline for the Reporting of Environmental, Social and Governance Parameters within the Solid Minerals and Oils and Gas Industries (The SAMESG Guideline, 2017) prepared by the South African Environmental, Social and Governance (SAMESG) Committee under the joint auspices of the Southern African Institute of Mining and Metallurgy (SAIMM) and the Geological Society of South Africa (GSSA). |
| SAMREC Code | The South African Code for the Reporting of Exploration Results, Mineral Resources and Mineral Reserves (The SAMREC Code), 2016 Edition, compiled by the Working Group of the SSC Committee under the joint auspices of the Southern African Institute of Mining and Metallurgy (SAIMM) and the Geological Society of South Africa (GSSA). |
| Serpentine | a name used for a large group of minerals that fit the generalized formula (Mg,Fe,Ni, Mn,Zn)2-3(Si,Al,Fe)2O5(OH)4 |
| serpentinize | to convert into serpentine |
| stratigraphic column | a grouping of sequences of strata onto systems |
| Stipping ratio | ratio of waste rock to ore in an open pit mining operation |
| sulfide | an inorganic anion of sulfur with the chemical formula S2− or a compound containing one or more S2− ions |
| tailings | refuse or dross remaining after the mineral has been removed from the ore - metallurgical plant waste product |
| ultramafic | igneous and meta-igneous rocks with a very low silica content (<45%), generally >18% MgO, high FeO, low potassium, and are composed of usually >90% mafic minerals (dark colored minerals with high magnesium and iron content) |
| variogram | a measure of the average variance between sample locations as a function of sample separation |
| volcanics | rocks formed from lava erupted from a volcano |
| Waterberg Group | a clastic sedimentary succession of coarse siliclastic rocks preserved across the northern part of the Kaapvaal Craton |
| SRK | | Report date: 27 May 2022
Effective Date: 31 December 2021 |
| | | |
| SRK Consulting – 576060 SPM PSM Project TRS | Page 269 |
ABBREVIATIONS
| Acronym | Definition |
| 2D | two dimensional |
| 4E | shorthand for Pt + Pd + Rh + Au |
| 6E | shorthand for 4E + Ir + Ru |
| AAS | Atomic Absorption Spectrometry |
| AG | autogenous grinding |
| AMD | Acid Mine Drainage |
| AMIS | African Mineral Standards |
| BAP | Biodiversity Action Plan |
| BEE | black economic empowerment |
| B-BBEE | Broad-Based Black Economic Empowerment |
| BBKT | Bakgatla Ba-Kgafela Tribe |
| BC | Bushveld Complex |
| BEE | Black Economic Empowerment |
| BOQ | Bills of Quantities |
| Boynton | Boynton Investments (Pty) Ltd |
| BWI | Bond Ball Mill Work Indices |
| Capex | Capital expenditure |
| Charter I | Mining Charter, 1 May 2004 |
| Charter II | Amended Mining Charter, 2010 |
| Charter III | Amended Mining Charter, June 2017, now withdrawn |
| CoG | cut-off grade |
| CoP | Codes of Practice |
| COO | Chief Operating Officer |
| CPI | consumer price indices |
| CRM | certified reference material |
| CRP | chromite recovery plant |
| CRU | CRU International Ltd |
DAP | Delivered at Place |
| DEFF | Department of Environment, Forestry and Fisheries |
| DHSWS | Department of Human Settlements, Water and Sanitation |
| DMRE | Department of Mineral Resources and Energy |
| DMS | Dense Media Separation |
| DPM | diesel particulate matter |
| E | Young’s modulus |
| EBIT | earnings before interest and taxes |
| ECA | Environmental Conservation Act (Act 73 of 1989) |
| ED | Enterprose Development |
| EIA | Environmental Impact Assessment |
| EMI | Environmental Management Inspectors |
| EMP | Environmental Management Programme |
| EMPr | Environmental Management Programme Report |
| EPCM | Engineering, Procurement and Construction Management |
| FAR | fresh air raise |
| FS | Feasibility Study |
| FW | Footwall |
| G&A | general and administration |
| GHG | Green House Gas |
| GISTM | Global Industry Standard on Tailings Management |
| GNR | Government Notice Regulation |
| GPS | global positioning system |
| HARD | Half Absolute Relative Difference |
| HDSA | Historically Disadvantaged South Africans |
| HR | Human resources |
| HRD | Human Resources Development |
| ICE | internal combustion engine |
| ICP-MS | Inductively Coupled Plasma - Mass Spectroscopy |
| ICP-OES | Inductively Coupled Plasma - Optical Emission Spectroscopy |
| ID2 | Inverse Distance Squared |
| IDC | Industrial Development Corporation of South Africa |
| Impala | Impala Platinum Ltd |
| IRS | Impala Refining Services |
| SRK | | Report date: 27 May 2022
Effective Date: 31 December 2021 |
| | | |
| SRK Consulting – 576060 SPM PSM Project TRS | Page 270 |
| Acronym | Definition |
| IRUP | Iron-Rich Ultramafic Pegmatoids |
| JCI | Johannesburg Consolidated Investments |
JIBAR | Johannesburg Interbank Average Rate |
| JSE | JSE Limited |
| Lakefield | Lakefield laboratory |
| LED | local economic development |
| LG | Lower Group |
| LGS | Lebowa Granite Suite |
| LHD | load-haul-dump |
| LHOS | long hole open stoping |
| LoM | Life-of-mine |
| LT | long term |
| LWUA | Lebalelo Water Users Association |
| M&I | Measured and Indicated (Measured and Indicated Mineral Resources) |
| MCDT | Mphahlele Community Development Trust |
| MF2 | mill-float-mill-float |
| MG | Middle Group |
| MHSA | Mine Health and Safety Act (Act No 29 of 1996) |
| Mphahlele | Mphahlele PGM Project |
| MPRDA | Mineral and Petroleum Resources Development Act No 28 of 2002 |
| MPTRO | Mineral and Petroleum Titles Registration Office |
| MR | Merensky Reef |
| MRA | Mining Right Application |
| MRMR | Laubscher’s Mining Rock Mass System |
| MTS | Managing Transformation Systems |
| MWP | Mine Works Programme |
| N’ | Stability Number |
| NCCRP | National Climate Change Response Policy |
| NDC | National Determined Contribution |
| NDP | National Development Plan |
| NEM:AQA | National Environmental Management: Air Quality Act (Act 39 of 2004) |
| NEM:BA | National Environmental Management: Biodiversity Act (10 of 2004) |
| NEM:PAA | National Environmental Management: Protected Areas Act (57 of 2003) |
| NEM:WA | National Environmental Management: Waste Act (Act 59 of 2008) |
| NEMA | National Environmental Management Act (Act 107 of 1998) |
| NERSA | National Energy Regulator of South Africa |
| NFA | National Forests Act (Act 84 of 1998) |
| NGER | National Greenhouse Gas Emission Reporting Regulations |
| NHRA | National Heritage Resources Act (Act 25 of 1999) |
| NOMR | New order mining right |
| NOPR | New order prospecting right |
| NPAT | net profit after tax |
| NPV | Net Present Value |
| NWA | National Water Act (Act 36 of 1998) |
| OEL | occupational exposure limits |
| OK | Ordinary Kriging |
| Opex | Operating expenditure |
| ORJWF | Olifants River Joint Water Forum |
| ORWRDP | Oliphant’s River Water Resources Development Project |
| PCD | Pollution Control Dam |
| PFS | Prefeasibility Study |
| PGM | platinum group metal |
| Platmin | Platmin Limited |
| PoC | proof of concept |
| PPM | Pilanesberg Platinum Mine |
| PSA | pool-and-share arrangement |
| Q | Barton’s Q Rock Mass Rating System |
| QA/QC | Quality Assurance / Quality Control |
| QP | Qualified Person |
| QS | Quantity Surveyor |
| RAR | return air raise |
| RAW | return airway |
| SRK | | Report date: 27 May 2022
Effective Date: 31 December 2021 |
| | | |
| SRK Consulting – 576060 SPM PSM Project TRS | Page 271 |
| Acronym | Definition |
| RBH | raise bore hole |
| RG | Rooiberg Group |
| RLS | Rustenburg Layered Suite |
| RoM | Run of Mine |
| RPEE | Reasonable Prospects of Economic Extraction |
| RPM | Rustenburg Platinum Mines Ltd |
| RQD | Rock Quality Designation |
| RWD | return water dam |
| RWI | Bond Rod Mill Work Indices |
| SARM | South African Reference Material |
| SARS | South African Revenue Services |
| SD | Supplier Development |
| SEC | Securities and Exchange Commission |
| SEP | Stakeholder Engagement Plan |
| SFA | Steve Forrest & Associates |
| SGS | SGS Lakefield Research Africa (Pty) Ltd |
| SHEQ | safety, health, environment and quality |
| SK1300 | Subpart 1300 of Regulation S-K |
| SLP | Social and Labour Plan |
| SPM | Sedibelo Platinum Mines Ltd |
| SRK | SRK Consulting (South Africa) (Pty) Ltd |
| SWMP | Stormwater Management Plan |
| Tameng | Tameng Mining & Exploration Holdings (Pty) Ltd |
| TCR | Total Core Recovery |
| TEM | Technical-economic model |
| TEP | Technical-economic parameter |
| TMM | trackless mobile machinery |
| TRS | Technical Report Summary |
| TSF | tailings storage facility |
| TSP | tailings scavenging plant |
| U/G | underground |
| UBS | UBS AG Investment Bank |
| UCS | Uniaxial Compressive Strength |
| UG | Upper Group |
| UG2 | UG2 Reef |
| UV | utility vehicle |
| v | Poisson’s ratio |
| WACC | weighted average cost of capital |
| WHO | World Health Organization |
| WUL | Water Use Licence |
| WULA | Water Use Licence Application |
CHEMICAL ELEMENTS
| Symbol | Element |
| Au | gold |
| Co | cobalt |
| Cr | chromium |
| Cr2O3 | chromite |
| Cu | copper |
| Ir | iridium |
| Ni | nickel |
| Pd | palladium |
| Pt | platinum |
| Rh | rhodium |
| Ru | ruthenium |
| S | sulfur |
| V | vanadium |
| SRK | | Report date: 27 May 2022
Effective Date: 31 December 2021 |
| | | |
| SRK Consulting – 576060 SPM PSM Project TRS | Page 272 |
UNITS
| Acronym | Definition |
| A | ampere |
| cm | a centimetre |
| g | grammes |
| g/t | grammes per metric tonne – metal concentration |
| ha | a hectare |
| kg | one thousand grammes |
| km | a kilometre |
| koz | a thousand ounces |
| kt | a thousand metric tonnes |
| ktpa | a thousand tonnes per annum |
| ktpm | a thousand tonnes per month |
| kV | one thousand volts |
| kVA | one thousand volt-amperes |
| kWh | kilo watt hours |
| m | a metre |
| m3 | cubic metre |
| mm | millimetre |
| Ma | a million years before present |
| Moz | a million ounces |
| MPa | a million pascals |
| Mt | a million metric tonnes |
| Mtpa | a million tonnes per annum |
| MVA | a million volt-amperes |
| MW | a million watts |
| oz | ounce |
| t | a metric tonne (1 000 kg) |
| t/m3 / tm-3 | density measured as metric tonnes per cubic metre |
| tpa | tonnes per annum |
| USD | United States Dollar |
| USD/oz | US Dollars per ounce |
| USDm | million US Dollars |
| USD/t | US Dollars per tonne |
| V | volt |
| ZAR | South African Rand |
| ZARbn | billion SA Rands |
| ZARm | million SA Rands |
| ZAR/oz | SA Rand per ounce |
| ZAR/t | SA Rand per tonne |
| ° | degrees |
| ‘ | minutes |
| % | percentage |
| SRK | | Report date: 27 May 2022
Effective Date: 31 December 2021 |
| | | |
| SRK Consulting – 576060 SPM PSM Project TRS | Page 273 |
COMPLIANCE WITH TABLE 1 OF SAMREC CODE (2016)
| SAMREC TABLE 1 | Section in the TRS where this is
located |
| | Exploration Results | Mineral Resources | Mineral Reserves | P-S-M Project |
| Section 1: Project Outline | |
| 1.1 | Property Description | (i) | Brief description of the scope of project (i.e. whether in preliminary sampling, advanced exploration, scoping, pre-feasibility, or feasibility phase, LoM plan for an ongoing mining operation or closure). | ES1 ES3 1.1, 1.2 16.3 |
| (ii) | Describe (noting any conditions that may affect possible prospecting/mining activities) topography, elevation, drainage, fauna and flora, the means and ease of access to the property, the proximity of the property to a population centre, and the nature of transport, the climate, known associated climatic risks and the length of the operating season and to the extent relevant to the mineral project, the sufficiency of surface rights for mining operations including the availability and sources of power, water, mining personnel, potential tailings storage areas, potential waste disposal areas, heap leach pad areas, and potential processing plant sites. | 2.3 3.1, 3.2, 3.3 14.6 16.5 |
| (iii) | Specify the details of the personal inspection on the property by each CP or, if applicable, the reason why a personal inspection has not been completed. | 1.4 Table 1.1 Table 1.2 |
| 1.2 | Location | (i) | Description of location and map (country, province, and closest town/city, coordinate systems and ranges, etc.). | ES3 2.1 |
| (ii) | Country Profile: describe information pertaining to the project host country that is pertinent to the project, including relevant applicable legislation, environmental and social context etc. Assess, at a high level, relevant technical, environmental, social, economic, political and other key risks. | 2.2 2.3 |
| (iii) | Provide a general topocadastral map. | Provide a Topo-cadastral map in sufficient detail to support the assessment of eventual economics. State the known associated climatic risks. | Provide a detailed topo-cadastral map. Confirm that applicable aerial surveys have been checked with ground controls and surveys, particularly in areas of rugged terrain, dense vegetation or high altitude. | Figure 2.1 |
| 1.3 | Adjacent Properties | (i) | Discuss details of relevant adjacent properties If adjacent or nearby properties have an important bearing on the report, then their location and common mineralized structures should be included on the maps. Reference all information used from other sources. | 19 |
| 1.4 | History | (i) | State historical background to the project and adjacent areas concerned, including known results of previous exploration and mining activities (type, amount, quantity and development work), previous ownership and changes thereto. | 4.1 4.2 |
| (ii) | Present details of previous successes or failures with reasons why the project may now be considered potentially economic. | 4.1 4.2 |
| (iii) | | Discuss known or existing historical Mineral Resource estimates and performance statistics on actual production for past and current operations. | ES6 |
| (iv) | | | Discuss known or existing historical Mineral Reserve estimates and performance statistics on actual production for past and current operations. | ES6 |
| 1.5 | Legal Aspects and Permitting | Confirm the legal tenure to the satisfaction of the CP, including a description of the following: | |
| (i) | Discuss the nature of the issuer’s rights (e.g. prospecting and/or mining) and the right to use the surface of the properties to which these rights relate. Disclose the date of expiry and other relevant details. | 2.2 2.3.3, 2.3.4, 2.3.5 Table 2.4 |
| (ii) | Present the principal terms and conditions of all existing agreements, and details of those still to be obtained, (such as, but not limited to, concessions, partnerships, joint ventures, access rights, leases, historical and cultural sites, wilderness or national park and environmental settings, royalties, consents, permission, permits or authorisations). | 2.3 15.5 16.6 0 |
| (iii) | Present the security of the tenure held at the time of reporting or that is reasonably expected to be granted in the future along with any known impediments to obtaining the right to operate in the area. State details of applications that have been made. | 2.3.3 16.6.1 0 |
| (iv) | Provide a statement of any legal proceedings for example; land claims, that may have an influence on the rights to prospect or mine for minerals, or an appropriate negative statement. | 2.3 2.3.6 2.3.7 |
| (v) | Provide a statement relating to governmental/statutory requirements and permits as may be required, have been applied for, approved or can be reasonably be expected to be obtained. | 2.3.3 2.3.6 2.4 16.6.1 0 |
| 1.6 | Royalties | (i) | Describe the royalties that are payable in respect of each property. | 2.2.5 2.6 |
| 1.7 | Liabilities | (i) | Describe any liabilities, including rehabilitation guarantees that are pertinent to the project. Provide a description of the rehabilitation liability, including, but not limited to, legislative requirements, assumptions and limitations. | 16.8 16.10 |
| SRK | | Report date: 27 May 2022
Effective Date: 31 December 2021 |
| | | |
| SRK Consulting – 576060 SPM PSM Project TRS | Page 274 |
| SAMREC TABLE 1 | Section in the TRS where this is
located |
| | Exploration Results | Mineral Resources | Mineral Reserves | P-S-M Project |
| Section 2: Geological Setting, Deposit, Mineralisation | |
| 2.1 | Geological Setting, Deposit, Mineralisation | (i) | Describe the regional geology. | 5.1 |
| (ii) | Describe the project geology including deposit type, geological setting and style of mineralisation. | 5.1 5.2 |
| (iii) | Discuss the geological model or concepts being applied in the investigation and on the basis of which the exploration program is planned. Describe the inferences made from this model. | 6.1, 6.2 10.1, 10.2, 10.3 12.6 |
| (iv) | Discuss data density, distribution and reliability and whether the quality and quantity of information are sufficient to support statements, made or inferred, concerning the Exploration Target or Mineralisation. | 6.1 6.2 |
| (v) | Discuss the significant minerals present in the deposit, their frequency, size and other characteristics. Includes minor and gangue minerals where these will have an effect on the processing steps. Indicate the variability of each important mineral within the deposit. | 5.1 5.2 |
| (vi) | Describe the significant mineralised zones encountered on the property, including a summary of the surrounding rock types, relevant geological controls, and the length, width, depth, and continuity of the mineralisation, together with a description of the type, character, and distribution of the mineralisation. | 5.1 5.2 |
| (vii) | Confirm that reliable geological models and / or maps and cross sections that support interpretations exist. | 5.1 |
| Section 3: Exploration and Drilling, Sampling Techniques and Data | |
| 3.1 | Exploration | (i) | Describe the data acquisition or exploration techniques and the nature, level of detail, and confidence in the geological data used (i.e. geological observations, remote sensing results, stratigraphy, lithology, structure, alteration, mineralisation, hydrology, geophysical, geochemical, petrography, mineralogy, geochronology, bulk density, potential deleterious or contaminating substances, geotechnical and rock characteristics, moisture content, bulk samples etc.). Confirm that data sets include all relevant metadata, such as unique sample number, sample mass, collection date, spatial location etc. | 6.1 6.2.1 6.3, 6.4 12.1 12.1.1, 12.1.3 |
| (ii) | Identify and comment on the primary data elements (observation and measurements) used for the project and describe the management and verification of these data or the database. This should describe the following relevant processes: acquisition (capture or transfer), validation, integration, control, storage, retrieval and backup processes. It is assumed that data are stored digitally but hand-printed tables with well-organized data and information may also constitute a database. | 6.1 6.2.1 8.1, 8.2, 8.3 |
| (iii) | Acknowledge and appraise data from other parties and reference all data and information used from other sources. | 6.1 6.2.1 |
| (iv) | Clearly distinguish between data / information from the property under discussion and that derived from surrounding properties. | 6.1 6.2.1 |
| (v) | Describe the survey methods, techniques and expected accuracies of data. Specify the grid system used. | 6.1 6.2.1 |
| (vi) | Discuss whether the data spacing and distribution is sufficient to establish the degree of geological and grade continuity appropriate for the estimation procedure(s) and classifications applied. | 6.1 6.2.1 |
| (vii) | Present representative models and / or maps and cross sections or other two or three dimensional illustrations of results, showing location of samples, accurate drill-hole collar positions, down-hole surveys, exploration pits, underground workings, relevant geological data, etc. | 6.1 6.2.1 |
| (viii) | Report the relationships between mineralisation widths and intercept lengths are particularly important, the geometry of the mineralisation with respect to the drill hole angle. If it is not known and only the down-hole lengths are reported, confirm it with a clear statement to this effect (e.g. ‘down-hole length, true width not known’). | 6.1 6.2.1 |
| 3.2 | Drilling Techniques | (i) | Present the type of drilling undertaken (e.g. core, reverse circulation, open-hole hammer, rotary air blast, auger, Banka, sonic, etc.) and details (e.g. core diameter, triple or standard tube, depth of diamond tails, face-sampling bit or other type, whether core is oriented and if so, by what method, etc.). | 6.1 6.2.1 |
| (ii) | Describe whether core and chip samples have been geologically and geotechnically logged to a level of detail to support appropriate Mineral Resource estimation, technical studies, mining studies and metallurgical studies. | 6.1 6.2.1 |
| (iii) | Describe whether logging is qualitative or quantitative in nature; indicate if core photography. (or costean, channel, etc.) was undertaken. | 6.1 6.2.1 |
| (iv) | Present the total length and percentage of the relevant intersections logged. | 6.1 6.2.1 |
| (v) | Results of any downhole surveys of the drill hole to be discussed. | 6.1 6.2.1 |
| 3.3 | Sample method, collection, capture and storage | (i) | Describe the nature and quality of sampling (e.g. cut channels, random chips, or specific specialised industry standard measurement tools appropriate to the minerals under investigation, such as down hole gamma sondes, or handheld XRF instruments, etc.). These examples should not be taken as limiting the broad meaning of sampling. | 6.2.1 6.2.2 |
| (ii) | Describe the sampling processes, including sub-sampling stages to maximize representivity of samples. This should include whether sample sizes are appropriate to the grain size of the material being sampled. Indicate whether sample compositing has been applied. | 6.2.1 6.2.2 |
| (iii) | Appropriately describe each data set (e.g. geology, grade, density, quality, diamond breakage, geo-metallurgical characteristics etc.), sample type, sample-size selection and collection methods. | 6.2.1 6.2.2 |
| (iv) | Report the geometry of the mineralisation with respect to the drill-hole angle. State whether the orientation of sampling achieves unbiased sampling of possible structures and the extent to which this is known, considering the deposit type. State if the intersection angle is not known and only the downhole lengths are reported. | 6.2.1 6.2.2 |
| (v) | Describe retention policy and storage of physical samples (e.g. core, sample reject, etc.). | 6.2.1 6.2.2 |
| (vi) | Describe the method of recording and assessing core and chip sample recoveries and results assessed, measures taken to maximise sample recovery and ensure representative nature of the samples and whether a relationship exists between sample recovery and grade and whether sample bias may have occurred due to preferential loss/gain of fine/coarse material. | 6.2.1 6.2.2 |
| (vii) | If a drill-core sample is taken, state whether it was split or sawn and whether quarter, half or full core was submitted for analysis. If a non-core sample, state whether the sample was riffled, tube sampled, rotary split etc. and whether it was sampled wet or dry. | 6.2.1 6.2.2 |
| SRK | | Report date: 27 May 2022
Effective Date: 31 December 2021 |
| | | |
| SRK Consulting – 576060 SPM PSM Project TRS | Page 275 |
| SAMREC TABLE 1 | Section in the TRS where this is
located |
| | Exploration Results | Mineral Resources | Mineral Reserves | P-S-M Project |
| 3.4 | Sample Preparation and Analysis | (i) | Identify the laboratory(s) and state the accreditation status and Registration Number of the laboratory or provide a statement that the laboratories are not accredited. | 6.2.2 7.1 7.2 |
| (ii) | Identify the analytical method. Discuss the nature, quality and appropriateness of the assaying and laboratory processes and procedures used and whether the technique is considered partial or total. | 6.2.2 7.1 7.2 |
| (iii) | Describe the process and method used for sample preparation, sub-sampling and size reduction, and likelihood of inadequate or non representative samples (i.e. improper size reduction, contamination, screen sizes, granulometry, mass balance, etc.). | 6.2.2 7.1 7.2 |
| 3.5 | Sampling Governance | (i) | Discuss the governance of the sampling campaign and process, to ensure quality and representivity of samples and data, such as sample recovery, high grading, selective losses or contamination, core/hole diameter, internal and external QA/QC, and any other factors that may have resulted in or identified sample bias. | 6.2.2 7.1 7.2 7.3 |
| (ii) | Describe the measures taken to ensure sample security and the Chain of Custody. | 6.2.2 7.1 7.2 7.4 |
| (iii) | Describe the validation procedures used to ensure the integrity of the data, e.g. transcription, input or other errors, between its initial collection and its future use for modelling (e.g. geology, grade, density, etc.). | 6.2.2 7.1 7.2 |
| (iv) | Describe the audit process and frequency (including dates of these audits) and disclose any material risks identified. | 6.2.2 7.1 7.2 |
| 3.6 | Quality Control/Quality Assurance | (i) | Demonstrate that adequate field sampling process verification techniques (QA/QC) have been applied, e.g. the level of duplicates, blanks, reference material standards, process audits, analysis, etc. If indirect methods of measurement were used (e.g. geophysical methods), these should be described, with attention given to the confidence of interpretation. | 7.1 7.3 8.1 8.2 8.3 |
| 3.7 | Bulk Density | (i) | Describe the method of bulk density determination with reference to the frequency of measurements, the size, nature and representativeness of the samples. | 10.1.1 10.1.2 10.1.3 10.1.4 |
| (ii) | If target tonnage ranges are reported state the preliminary estimates or basis of assumptions made for bulk density. | 10.1.1 10.1.2 10.1.3 10.1.4 |
| (iii) | Discuss the representivity of bulk density samples of the material for which a grade range is reported. | 10.1.1 10.1.2 10.1.3 10.1.4 |
| (iv) | Discuss the adequacy of the methods of bulk density determination for bulk material with special reference to accounting for void spaces (vugs, porosity etc.), moisture and differences between rock and alteration zones within the deposit. | 10.1.1 10.1.2 10.1.3 10.1.4 |
| 3.8 | Bulk-Sampling and/or trial-mining | (i) | Indicate the location of individual samples (including map). | 4.1 Table 4.5 6.1 9.1 No maps available |
| (ii) | Describe the size of samples, spacing/density of samples recovered and whether sample sizes and distribution are appropriate to the grain size of the material being sampled. | 9.1, 9.1.1 9.2, 9.2.1 |
| (iii) | Describe the method of mining and treatment. | 4.2 6.2 Table 4.5 Table 6.1 Table 6.6 |
| (iv) | Indicate the degree to which the samples are representative of the various types and styles of mineralisation and the mineral deposit as a whole. | 9.2, 9.2.1, 9.2.4 |
| Section 4: Estimation and Reporting of Exploration Results and Mineral Resources | |
| 4.1 | Geological model and interpretation | (i) | Describe the geological model, construction technique and assumptions that forms the basis for the Exploration Results or Mineral Resource estimate. Discuss the sufficiency of data density to assure continuity of mineralisation and geology and provide an adequate basis for the estimation and classification procedures applied. | 10.1 |
| (ii) | Describe the nature, detail and reliability of geological information with which lithological, structural, mineralogical, alteration or other geological, geotechnical and geo-metallurgical characteristics were recorded. | 10.1 12.1.1 12.1.3 9.1 |
| (iii) | Describe any obvious geological, mining, metallurgical, environmental, social, infrastructural, legal and economic factors that could have a significant effect on the prospects of any possible exploration target or deposit. | | | 10.1 |
| (iv) | | Discuss all known geological data that could materially influence the estimated quantity and quality of the Mineral Resource. | 10.1 10.2 10.5 |
| (v) | | Discuss whether consideration was given to alternative interpretations or models and their possible effect (or potential risk) if any, on the Mineral Resource estimate. | 10.1.1 10.1.3 10.2 |
| (vi) | | Discuss geological discounts (e.g. magnitude, per reef, domain, etc.), applied in the model, whether applied to mineralized and / or un-mineralized material (e.g. potholes, faults, dykes, etc.). | 10.2 10.5 |
| SRK | | Report date: 27 May 2022
Effective Date: 31 December 2021 |
| | | |
| SRK Consulting – 576060 SPM PSM Project TRS | Page 276 |
| SAMREC TABLE 1 | Section in the TRS where this is
located |
| | Exploration Results | Mineral Resources | Mineral Reserves | P-S-M Project |
| 4.2 | Estimation and modelling techniques | (i) | Describe in detail the estimation techniques and assumptions used to determine the grade and tonnage ranges. | | | 10.1.1 10.1.2 10.1.3 10.1.4 |
| (ii) | | Discuss the nature and appropriateness of the estimation technique(s) applied and key assumptions, including treatment of extreme grade values (cutting or capping), compositing (including by length and/or density), domaining, sample spacing, estimation unit size (block size), selective mining units, interpolation parameters and maximum distance of extrapolation from data points. | 10.1.1 10.1.2 10.1.3 10.1.4 10.2, 10.3, 10.4 |
| (iii) | | Describe assumptions and justification of correlations made between variables. | 10.1.1 10.1.2 10.1.3 10.1.4 10.4 |
| (iv) | | Provide details of any relevant specialized computer program (software) used, with the version number, together with the estimation parameters used. | 10.2 |
| (v) | | State the processes of checking and validation, the comparison of model information to sample data and use of reconciliation data, and whether the Mineral Resource estimate takes account of such information. | 10.1 10.2 21.1 |
| (vi) | | Describe the assumptions made regarding the estimation of any co-products, by-products or deleterious elements. | 10.2 |
| 4.3 | Reasonable prospects for eventual economic extraction | (i) | | Disclose and discuss the geological parameters. These would include (but not be limited to) volume / tonnage, grade and value / quality estimates, cut-off grades, strip ratios, upper- and lower- screen sizes. | 10.1 10.2 10.3 10.4 |
| (ii) | | Disclose and discuss the engineering parameters. These would include mining method, dilution, processing, geotechnical, geohydraulic and metallurgical) parameters. | 6.3, 6.4 9.1 12.1, 12.2, 12.3, 12.4 |
| (iii) | | Disclose and discuss the infrastructural including, but not limited to, power, water, site-access. | 14 |
| (iv) | | Disclose and discuss the legal, governmental, permitting, statutory parameters. | 2.2 10.4 16.6.1 0 |
| (v) | | Disclose and discuss the environmental and social (or community) parameters. | 10.4 16.2 0 0 |
| (vi) | | Disclose and discuss the marketing parameters. | 10.4 15 |
| (vii) | | Disclose and discuss the economic assumptions and parameters. These factors will include, but not limited to, commodity prices and potential capital and operating costs. | 10.4 15.4 17.1 17.2 |
| (viii) | | Discuss any material risks. | ES10 10.4 0 12.6 14.6.5 17.3 20.3 Table 20.15 |
| (ix) | | Discuss the parameters used to support the concept of "eventual". | 10.4 |
| 4.4 | Classification Criteria | (i) | | Describe criteria and methods used as the basis for the classification of the Mineral Resources into varying confidence categories. | | 10.3 |
| SRK | | Report date: 27 May 2022
Effective Date: 31 December 2021 |
| | | |
| SRK Consulting – 576060 SPM PSM Project TRS | Page 277 |
| SAMREC TABLE 1 | Section in the TRS where this is
located |
| | Exploration Results | Mineral Resources | Mineral Reserves | P-S-M Project |
| 4.5 | Reporting | (i) | Discuss the reported low and high-grades and widths together with their spatial location to avoid misleading the reporting of Exploration Results, Mineral Resources or Mineral Reserves. | 10.5 |
| (ii) | Discuss whether the reported grades are regional averages or if they are selected individual samples taken from the property under discussion. | 10.2 10.5 |
| (iii) | State assumptions regarding mining methods, infrastructure, metallurgy, environmental and social parameters. State and discuss where no mining related assumptions have been made. | | | 9 12.2, 12.3 13 14 16.2, 16.4, 16.5, 16.6.1 0 |
| (iv) | State the specific quantities and grades / qualities which are being reported in ranges and/or widths, and explain the basis of the reporting. | | | 10.2 10.5 |
| (v) | | Present the detail for example open pit, underground, residue stockpile, remnants, tailings, and existing pillars or other sources in the Mineral Resource statement. | | 10.2 10.5 |
| (vi) | | Present a reconciliation with any previous Mineral Resource estimates. Where appropriate, report and comment on any historic trends (e.g. global bias). | | 10.2 10.5 10.5.5 |
| (vii) | | Present the defined reference point for the tonnages and grades reported as Mineral Resources. State the reference point if the point is where the run of mine material is delivered to the processing plant. It is important that, in all situations where the reference point is different, such as for a saleable product, a clarifying statement is included to ensure that the reader is fully informed as to what is being reported. | 10.5 |
| (viii) | If the CP is relying on a report, opinion, or statement of another expert who is not a CP, disclose the date, title, and author of the report, opinion, or statement, the qualifications of the other expert and why it is reasonable for the CP to rely on the other expert, any significant risks and any steps the CP took to verify the information provided. | 15 23 24 |
| (ix) | State the basis of equivalent metal formulae, if applied. | Not applicable 10.6 |
| Section 5: Technical Studies | |
| 5.1 | Introduction | (i) | Technical Studies are not applicable to Exploration Results. | State the level of study – whether scoping, prefeasibility, feasibility or ongoing LoM. | State the level of study – whether prefeasibility, feasibility or ongoing LoM. The Code requires that a study to at least a Pre-Feasibility level has been undertaken to convert Mineral Resource to Mineral Reserve. Such studies will have been carried out and will include a mine plan or production schedule that is technically achievable and economically viable, and that all Modifying Factors have been considered. | 1.1 |
| (ii) | | Provide a summary table of the Modifying Factors used to convert the Mineral Resource to Mineral Reserve for Pre-feasibility, Feasibility or on-going LoM studies. | 11.1 |
| 5.2 | Mining Design | (i) | Technical Studies are not applicable to Exploration Results. | State assumptions regarding mining methods and parameters when estimating Mineral Resources or explain where no mining assumptions have been made. | | ES7 11.1 12.3 |
| (ii) | | State and justify all modifying factors and assumptions made regarding mining methods, minimum mining dimensions (or pit shell) and internal and, if applicable, external) mining dilution and mining losses used for the techno-economic study and signed-off, such as mining method, mine design criteria, infrastructure, capacities, production schedule, mining efficiencies, grade control, geotechnical and hydrological considerations, closure plans, and personnel requirements. | 11.1 12.1.1 12.1.2 12.1.3 12.2 16.8 |
| (iii) | | State what mineral resource models have been used in the study. | 11.1 |
| (iv) | | Explain the basis of (the adopted) cut-off grade(s) or quality parameters applied. Include metal equivalents if relevant. | ES7 11.1 11.4 11.5 |
| (v) | | Description and justification of mining method(s) to be used. | 11.1 12.3 |
| (vi) | | For open-pit mines, include a discussion of pit slopes, slope stability, and strip ratio. | 11.1 |
| (vii) | | For underground mines, discussion of mining method, geotechnical considerations, mine design characteristics, and ventilation/cooling requirements. | 11.1 12.1.1 12.1.2 12.1.3 12.3 |
| (viii) | | Discussion of mining rate, equipment selected, grade control methods, geotechnical and hydrogeological considerations, health and safety of the workforce, staffing requirements, dilution, and recovery. | 11.1 12.1.1 12.1.2 12.1.3 12.2 12.4 |
| (ix) | | State the optimisation methods used in planning, list of constraints (practicality, plant, access, exposed Mineral Reserves, stripped Mineral Reserves, bottlenecks, draw control). | 11.1 12.3 |
| SRK | | Report date: 27 May 2022
Effective Date: 31 December 2021 |
| | | |
| SRK Consulting – 576060 SPM PSM Project TRS | Page 278 |
| SAMREC TABLE 1 | Section in the TRS where this is
located |
| | Exploration Results | Mineral Resources | Mineral Reserves | P-S-M Project |
| 5.3 | Metallurgical and Testwork | (i) | Technical Studies are not applicable to Exploration Results. | | Discuss the source of the sample and the techniques to obtain the sample, laboratory and metallurgical testing techniques. | 9.1 9.3 |
| (ii) | | Explain the basis for assumptions or predictions regarding metallurgical amenability and any preliminary mineralogical test work already carried out. | 9.1 9.5 13.3 13.5 |
| (iii) | Discuss the possible processing methods and any processing factors that could have a material effect on the likelihood of eventual economic extraction. Discuss the appropriateness of the processing methods to the style of mineralisation. | Describe and justify the processing method(s) to be used, equipment, plant capacity, efficiencies, and personnel requirements. | 9.1 9.3 13.3 |
| (iv) | | Discuss the nature, amount and representativeness of metallurgical test work undertaken and the recovery factors used. A detailed flow sheet / diagram and a mass balance should exist ,especially for multi-product operations from which the saleable materials are priced for different chemical and physical characteristics. | 9.1 9.2 9.4 13.2 |
| (v) | | State what assumptions or allowances have been made for deleterious elements and the existence of any bulk-sample or pilot-scale test work and the degree to which such samples are representative of the ore body as a whole. | 9.1 9.2 9.4 9.5 |
| (vi) | | State whether the metallurgical process is well-tested technology or novel in nature. | 9.1 13.5 |
| 5.4 | Infrastructure | (i) | Technical Studies are not applicable to Exploration Results. | Comment regarding the current state of infrastructure or the ease with which the infrastructure can be provided or accessed. | | ES7 3.2 3.4 14 |
| (ii) | | Report in sufficient detail to demonstrate that the necessary facilities have been allowed for (which may include, but not be limited to, processing plant, tailings dam, leaching facilities, waste dumps, road, rail or port facilities, water and power supply, offices, housing, security, resource sterilisation testing etc.). Provide detailed maps showing locations of facilities. | ES7 3.2 3.4 13.4 14 16.5 |
| (iii) | | Statement showing that all necessary logistics have been considered. | 14 14.1 |
| 5.5 | Environmental and Social | (i) | Technical Studies are not applicable to Exploration Results. | Confirm that the company holding the tenement has addressed the host country environmental legal compliance requirements and any mandatory and/or voluntary standards or guidelines to which it subscribes. | 2.2 2.3.2 2.4 16.4 |
| (ii) | Identify the necessary permits that will be required and their status and where not yet obtained, confirm that there is a reasonable basis to believe that all permits required for the project will be obtained. | 2.2 16.6.1 0 |
| (iii) | Identify and discuss any sensitive areas that may affect the project as well as any other environmental factors including I&AP and/or studies that could have a material effect on the likelihood of eventual economic extraction. Discuss possible means of mitigation. | 2.2 16.1 16.6.1 0 |
| (iv) | Identify any legislated social management programmes that may be required and discuss the content and status of these. | 2.2 2.4 16.2 0 |
| (v) | Outline and quantify the material socio-economic and cultural impacts that need to be mitigated, and their mitigation measures and where appropriate the associated costs. | 2.2 2.4 16.2 0 |
| SRK | | Report date: 27 May 2022
Effective Date: 31 December 2021 |
| | | |
| SRK Consulting – 576060 SPM PSM Project TRS | Page 279 |
| SAMREC TABLE 1 | Section in the TRS where this is
located |
| | Exploration Results | Mineral Resources | Mineral Reserves | P-S-M Project |
| 5.6 | Market Studies and Economic criteria | (i) | Technical Studies are not applicable to Exploration Results. | | Describe the valuable and potentially valuable product(s) including suitability of products, co-products and by products to market. | ES11 15 |
| (ii) | | Describe product to be sold, customer specifications, testing, and acceptance requirements. Discuss whether there exists a ready market for the product and whether contracts for the sale of the product are in place or expected to be readily obtained. Present price and volume forecasts and the basis for the forecast. | ES11 15 15.4 15.5 |
| (iii) | | State and describe all economic criteria that have been used for the study such as capital and operating costs, exchange rates, revenue / price curves, royalties, cut-off grades, reserve pay limits. | ES8 ES11 15 17.1 17.2 18 |
| (iv) | | Summary description, source and confidence of method used to estimate the commodity price/value profiles used for cut-off grade calculation, economic analysis and project valuation, including applicable taxes, inflation indices, discount rate and exchange rates. | ES11 15 18 |
| (v) | | Present the details of the point of reference for the tonnages and grades reported as Mineral Reserves (e.g. material delivered to the processing facility or saleable product(s)). It is important that, in any situation where the reference point is different, a clarifying statement is included to ensure that the reader is fully informed as to what is being reported. | ES6 ES11 11.2 15 |
| (vi) | | Justify assumptions made concerning production cost including transportation, treatment, penalties, exchange rates, marketing and other costs. Provide details of allowances that are made for the content of deleterious elements and the cost of penalties. | ES8 ES11 15 15.5 17.1 17.2 |
| (vii) | | Provide details of allowances made for royalties payable, both to Government and private. | ES11 2.2.5, 2.2.6 15.5.3 18.1.5, 18.1.6 |
| (viii) | | State type, extent and condition of plant and equipment that is significant to the existing operation(s). | ES7 ES11 13 14 15.5 |
| (ix) | | Provide details of all environmental, social and labour costs considered. | ES8, ES9 2.4 16.6, 16.7, 16.8, 0, 16.10 17.2 18 |
| 5.7 | Risk Analysis | (i) | Technical Studies are not applicable to Exploration Results. | Report an assessment of technical, environmental, social, economic, political and other key risks to the project. Describe actions that will be taken to mitigate and/or manage the identified risks. | ES10 20.3 Table 20.8 Table 20.15 |
| 5.8 | Economic Analysis | (i) | Technical Studies are not applicable to Exploration Results. | At the relevant level (Scoping Study, Pre-feasibility, Feasibility or on-going LoM), provide an economic analysis for the project that includes: | ES11 18 |
| (ii) | Cash Flow forecast on an annual basis using Mineral Reserves or an annual production schedule for the life of the project. | ES11 18 |
| (iii) | A discussion of net present value (NPV), internal rate of return (IRR) and payback period of capital. | ES11 18 |
| (iv) | Sensitivity or other analysis using variants in commodity price, grade, capital and operating costs, or other significant parameters, as appropriate and discuss the impact of the results. | ES11 18 18.2 18.3 |
| Section 6: Estimation and Reporting of Mineral Reserves | |
| 6.1 | Estimation and modelling techniques | (i) | | Describe the Mineral Resource estimate used as a basis for the conversion to a Mineral Reserve. | ES6 10.5 |
| (ii) | | Report the Mineral Reserve Statement with sufficient detail indicating if the mining is open pit or underground plus the source and type of mineralisation, domain or ore body, surface dumps, stockpiles and all other sources. | ES6 11.2 |
| (iii) | | | Provide a reconciliation reporting historic reliability of the performance parameters, assumptions and modifying factors including a comparison with the previous Reserve quantity and qualities, if available. Where appropriate, report and comment on any historic trends (e.g. global bias). | ES6 11.2.1 Table 11.8 Table 11.9 Table 11.10 Table 11.11 |
| SRK | | Report date: 27 May 2022
Effective Date: 31 December 2021 |
| | | |
| SRK Consulting – 576060 SPM PSM Project TRS | Page 280 |
| SAMREC TABLE 1 | Section in the TRS where this is
located |
| | Exploration Results | Mineral Resources | Mineral Reserves | P-S-M Project |
| 6.2 | Classification Criteria | (i) | | | Describe and justify criteria and methods used as the basis for the classification of the Mineral Reserves into varying confidence categories, based on the Mineral Resource category, and including consideration of the confidence in all the modifying factors. | 11.2 11.3 11.4 |
| 6.3 | Reporting | (i) | | | Discuss the proportion of Probable Mineral Reserves, which have been derived from Measured Mineral Resources (if any), including the reason(s) therefore. | 11.2 |
| (ii) | | | Present details of for example open pit, underground, residue stockpile, remnants, tailings, and existing pillars or other sources in respect of the Mineral Reserve statement. | 11.2 |
| (iii) | | | Present the details of the defined reference point for the Mineral Reserves. State where the reference point is the point where the run of mine material is delivered to the processing plant. It is important that, in all situations where the reference point is different, such as for a saleable product, a clarifying statement is included to ensure that the reader is fully informed as to what is being reported. State clearly whether the tonnages and grades reported for Mineral Reserves are in respect of material delivered to the plant or after recovery. | 11.2 |
| (iv) | | | Present a reconciliation with the previous Mineral Reserve estimates. Where appropriate, report and comment on any historic trends (e.g. global bias). | 11.2.1 |
| (v) | | | Only Measured and Indicated Mineral Resources can be considered for inclusion in the Mineral Reserve. | 11.2 |
| (vi) | | | State whether the Mineral Resources are inclusive or exclusive of Mineral Reserves. | ES6 10.5 11.2 |
| Section 7: Audits and Reviews | |
| 7.1 | Audits and Reviews | (i) | State type of review/audit (e.g. independent, external), area (e.g. laboratory, drilling, data, environmental compliance etc.), date and name of the reviewer(s) together with their recognized professional qualifications. | ES1 1.5 |
| (ii) | Disclose the conclusions of relevant audits or reviews. Note where significant deficiencies and remedial actions are required. | ES12 21 |
| Section 8: Other Relevant Information | |
| 8.1 | | (i) | Discuss all other relevant and material information not discussed elsewhere. | 20 |
| Section 9: Qualification of CP(s) and other key technical staff. Date and Signature Page | |
| 9.1 | | (i) | State the full name, registration number and name of the professional body or RPO, for all the CP(s). State the relevant experience of the CP(s) and other key technical staff who prepared and are responsible for the Public Report. | Not included in the report as permitted by Rule §229.1302(b)(1)(ii) of SK1300. |
| (ii) | State the CP’s relationship to the issuer of the report. | 1.5.1 |
| (iii) | Provide the Certificate of the CP (Appendix 2), including the date of sign-off and the effective date, in the Public Report. | Not included in the report as permitted by Rule §229.1302(b)(1)(ii) of SK1300 Cover Page, Footers Section 25 |
| SRK | | Report date: 27 May 2022
Effective Date: 31 December 2021 |
| | | |