1 Q1 2024 Q3 2024 Q4 2024 Q2 2024 Q 4 Letter to Shareholders PAGAYA TECHNOLOGIES LTD. DATE ISSUED February 13, 2025

2 Q4 Financial Highlights Gal Krubiner | Co-founder and CEO We delivered another quarter of strong operating and financial results, with all key metrics ahead of guidance and enter 2025 on the strongest footing in our history, while addressing legacy issues. We have bolstered our balance sheet flexibility, cash flow generation and operating leverage and are positioned to demonstrate our earnings power and sustainable revenue growth in 2025 and onward. We have re-marked our investments in loans & securities including the 2021 - 2023 vintages, and no longer expect them to have a material impact on our performance going forward. Pagaya is fully self-funded, with inaugural GAAP profitability guidance, and we look forward to demonstrating long-term value for our shareholders, our lending and funding partners, and US consumers.” “ $2.6B Network volume of $2.6 billion was at the high-end of our outlook of ~$2.4B - $2.6B and grew 9% year-over-year, driven primarily by personal loans. $279M Record total revenue and other income of $279 million exceeded our outlook of ~$257M - $272M and grew 28% year-over-year, driven primarily by 31% growth in revenue from fees. $117M Record revenue from fees less production costs (“FRLPC”) of $117 million increased 55% year-over-year. FRLPC as a percentage of network volume (“FRLPC %”) improved 132 basis points year-over-year to 4.5%, at the high-end of our target range of 3.5% to 4.5%. $64M Record adjusted EBITDA of $64 million exceeded our outlook of ~$49M - $59M and grew 88% year-over-year with adjusted EBITDA margin up 729 basis points to 23.0%. GAAP operating income was $32 million. ($156M) Fair market value of investment portfolio marked down by $156 million net of what is attributable to non-controlling interests, and a reclassification of $79 million accumulated losses to Other Expense, along with a $6 million of whole loan impairments recognized in G&A, with a total of $229 million of credit-related impairments. The company does not expect investments from 2021-2023 vintages to have a material impact on its performance going forward. $13M Adjusted net income of $13 million excludes the impact of non-cash items such as share-based compensation expense and fair value adjustments. $32M Cash flow from operating activities of $32 million was impacted by one-item items. ($238M) Net loss attributable to Pagaya of $238 million was impacted by non-cash items such as fair value adjustments and share-based compensation.

3 Record originations fueled by existing partners, POS grows >170% sequentially We continue our product-led growth strategy, while our pipeline progress continues. Volumes remain robust at record $2.6 billion, with existing partners across ourPersonal Loan, Auto, and Point-of-Sale verticals. POS volumes, led by Klarna, increased by >170% sequentially versus the third quarter of 2024. Record high fees and record operating leverage demonstrate Pagaya’s earnings power Our FRLPC % reached its highest historical level at 4.5%, as our platform matures and demand for our product gets stronger. Our highest-earning and most mature vertical – Personal Loan – delivered an FRLPC % of 6.3% in the fourth quarter. Core operating expenses as a % of FRLPC reached 49%, the lowest level in the Company’s history. Strengthened balance sheet and liquidity profile, setting Pagaya up for profitable self-funded growth We completed a series of opportunistic transactions, including our $100 million upsized term loan with improved terms and additional corporate lending partners, to reduce interest expense and unlock additional balance sheet liquidity. Q4 Business Highlights Recent Blue Owl Forward Flow further underscores strong, diversified funding sources, lower required net risk retention With AAA-rated personal loan and AA-rated auto loan ABS programs, we’re executing at a lower cost of capital and with more efficient structures, significantly reducing our risk retention levels. With our expanded forward flow program, which recently added up to $2.4 billion with Blue Owl over 24-months, pass-throughs, and other capital-efficient structures, we expect non-ABS funding channels to contribute 25 - 50% of our 2025 funding. Credit performance showing strong and stable trends Continued enhancements to our underwriting model over the last 24 months are driving stable credit performance. Cumulative net losses (“CNLs”) for our 2023 personal loan vintages are 20 - 35% lower than peak levels in 2021, while CNLs for our 2023 auto vintages are 35 - 50% lower than those peak levels we saw in 2022. GAAP profitability guidance for 2Q’25 underscores confidence and commitment With successful execution of our 2024 financial strategy – to deliver improved fee generation, operating leverage and capital efficiency – the business is positioned to reach GAAP profitability in the second quarter of 2025.

4 Gal Krubiner Co-founder and CEO Dear Fellow Shareholder, We delivered another set of strong operating results to close out 2024, with record annual revenue of over $1 billion, Fee Revenue Less Production Costs (“FRLPC”) of $407 million and adjusted EBITDA of $210 million. GAAP results were materially impacted by sizable impairments related to our historical risk retention vintages. As we closed out 2024, we reduced the fair market value of our risk retention securities including the 2023 vintage, with a $145 million reduction to the $275 million fair value mark we referenced in our third quarter 2024 results. We believe we have now taken the vast majority of potential impairment charges for the 2021-2023 vintages, positioning us to sustainably achieve positive GAAP net income in Q2 2025. We believe that we have now refined our business, after a challenging market environment in the last few years, in such a way that our operating model and high-impact products will generate consistent, profitable growth as more people use Pagaya-enabled financial products. Pagaya’s strong and differentiated value proposition is resonating with the biggest consumer lenders across the US financial ecosystem. Our products enable lenders to provide more credit alternatives and services to more customers. These lenders keep more customers, and protect valuable deposit accounts, while simultaneously maximizing lifetime value and return on marketing spend. In this quarter, several partners started expanding their application of the Pagaya solution to their existing customers as a cross-sell solution designed to drive additional customer lifetime value. Given heightened competition for customers and growing focus on financial inclusion, the time could not be better for our solutions. In fact, we are deeply engaged in advanced discussions with regional banks, automotive lenders and major point of sale originators that are seeing the value of the Pagaya products. Our Network connects our products to our partners. It is deeply embedded within the origination platforms of many of the largest lending partners across the US, seamlessly enabling the addition of customers to their ecosystems. This value proposition has driven our network to become one of the most in-demand lending solutions in the US market. To date, our Network has seen over $2.6 trillion of loan applications and provided $28 billion of loans to over 2 million people - creditworthy borrowers that may traditionally be overlooked. Pagaya is a leader in enabling credit for mainstream Americans.
5 Our ethos aligns with that of all of our lending partners and we are proud to bridge the “gap” between Wall Street and Main Street. With each application that flows through our network our flywheel strengthens, gaining additional data and insights, enhancing the power of our technology. The combination of the tremendous amount of data we obtain across the market and our direct integrations to proprietary bank lending origination and servicing systems of leading lenders such as U.S. Bank, results in a large and growing competitive moat. This solidifies our market position and sets Pagaya up to capture the opportunity ahead to grow our network. Following are three key points, which summarize how we are set up to successfully leverage our unique value proposition in 2025: 1. In 2024, we diversified and strengthened the efficiency of our funding mechanism, our balance sheet liquidity and operating model, due to the tireless work of our team. Funding momentum among major institutional investors is underscored by last week’s forward flow agreement with Blue Owl Capital for up to $2.4 billion over two years (the second forward flow in 6 months), our 6th AAA-rated ABS transaction and 3rd pass-through securitization in the fourth quarter. Our increasingly diversified funding mechanism allows us to fund network volume with 2-3% net cash requirement for personal loans, and 1.5-2.5% for overall network volume. Our operating model requires little to no investment to generate incremental growth. We are self-funded and do not need to raise equity capital in the foreseeable future. This is in part due to a highly-experienced management team that has navigated challenging credit businesses through various cycles. 2. We have reached a clear inflection point in our business efficiency and visibility, with GAAP net income guidance for the first time. Our business is now at scale with meaningful operating leverage and a de- risked balance sheet. Our growth momentum and commitment to financial and operating discipline gives us confidence to deliver on our 2025 guidance. This commitment is underscored by our first-ever positive GAAP net income guidance, and we look forward to being measured against this goal. 3. Our strong future growth and differentiated value proposition is resonating with the biggest consumer lenders across the US financial ecosystem. Pagaya’s product- led approach enables lenders to acquire and maintain more customer relationships. Major financial institutions’ use of our deeply embedded technology is expanding and includes additional cross-sell opportunities, bolstering retention, return on marketing spend and ultimately lifetime value. Our growth is built on our strong pipeline of major prospective partners, which accelerated further, with advanced discussions across Auto, PL and POS verticals. In summary, I could not be more excited and encouraged by what lies ahead. I am grateful for the team’s relentless focus and execution to achieve our operational and financial goals over the past several years. Our key priorities for the year are to drive consistent profitable growth, execute our enterprise growth strategy and advance our product roadmap.
6 Update on our Operating Business As we wrap up the fourth quarter, having exceeded all of our guided operating metrics, and look ahead, our existing partner growth and new partner pipeline remain extremely robust with leading institutions across all asset classes. We continue to make significant progress in monetizing existing partnerships, adding new products to long-standing relationships and ramping those that are newer to our network. In fact, we anticipate at least 8 lending partners will each generate $500 million or more of network volume during 2025. Within personal loans, our most mature market, the demand from our partners remains strong, a trend we expect to continue through 2025. Our personal loans growth strategy remains disciplined, as we continue to see strong and stable consumer performance among loan vintages that have seasoned over the last 12-18 months. And both volumes and monetization remain robust, with personal loan network volume at $1.6B in the fourth quarter, up 24% year-over-year on an organic basis and FRLPC as a percent of volume at 6.3%. In Auto Lending, we focused on improved credit underwriting in 2024. This was the right strategy in an uncertain macroeconomic backdrop. We completed the onboarding of OneMain Financial and expanded our outreach to key captive auto financing players. We also expect to start generating more volume from recently onboarded partners. With substantially better funding efficiency, we have significant improvement in returns and margins in our Auto franchise and remain disciplined as we ramp back up to leverage improving sector trends. Our year-end Auto volume annualized run-rate was nearly $1 billion, with fourth quarter sequential growth of just under 40%. Point-of-sale network volumes accelerating >$1B annual run-rate as of YE24 +176% sequentially Demand for Pagaya in the Point-of-Sale space remains exceptionally high. We are pushing forward with our Klarna partnership and continue to scale with Elavon’s Avvance POS product. At the same time, we are in discussions with many major money center banks and global payment brands to serve their POS financing needs. This market remains the greatest medium-term contributor to growth. In fact we had 176% organic sequential growth in our POS volumes in 4Q. Our year-end exit-rate represents an annualized run-rate of more than $1 billion in network volume, with strong returns. Our new partner pipeline remains strong. We are currently in late stage discussions with several regional US banks and expect to be at the term sheet stage with a few of them in 2025.

7 Our product strategy—to better serve the end- customers of our existing personal loan partners outside of our second look product—is gaining traction. We have now started testing our Prescreen product with three existing partners and all are seeing substantially lower customer acquisition costs and better conversion resulting in higher lifetime value. We expect to continue scaling this product in the remainder of 2025. Our additional product strategy also helps our partners to add new consumers through connection of the Pagaya product to Affiliate channels such as Credit Karma, LendingTree and others. We are currently testing Affiliate expansion with several partners and seeing a corresponding increase in new customer acquisition trends. We expect that these customers will not only generate revenue growth for both Pagaya and its partners, but also longer-term value as they expand their relationships with our partners across asset classes. The best evidence of Pagaya’s strong overall product value proposition is our FRLPC growth of 55% year-over-year in the fourth quarter to 4.5% of network volume. We remain extremely prudent in our underwriting standards, converting under 1% of applications into funded loans. As we look forward, we remain as focused as ever on balanced and disciplined growth across new and existing partners. Our value proposition for both lending and investing partners is very strong and the business is performing extremely well. Now that we have addressed our balance sheet and operating risk, we are turning our full focus to driving consistent growth that is profitable and cash flow generative. Our growth will be product-led with existing partners, while our pipeline is increasingly focused on strong partners with enterprise-wide relationship potential.
8 Evangelos Perros Chief Financial Officer Fourth Quarter 2024 Results In the beginning of 2024, we laid out our financial strategy with two simple but aggressive goals: to become cash flow positive and to set ourselves up to become GAAP Net Income positive in 2025. Our fourth quarter and full-year results demonstrate relentless execution across all main pillars of that strategy: (i) higher fees, (ii) strong operating leverage, (iii) improved capital structure and (iv) derisking the financial profile of the business. Let me remind everyone that we have operated through a series of macro and exogenous factors that have tested Pagaya, our shareholders and employees, our lending and funding partners and more broadly, US consumers and our sector. And we are coming out of that cycle stronger and wiser as we continue to build a disruptive business that can withstand cycles for the long run. Total fourth quarter revenue of $279 million, FRLPC of $117 million, and adjusted EBITDA of $64 million demonstrate consistent monetization of our network volume and increasingly profitable incremental revenue generation. GAAP Net Loss of $238 million reflects the impact of our historical vintages. Going forward we will provide guidance for GAAP profitability, which we expect to achieve in the 2nd quarter of 2025. I will provide specific details later in the guidance section. Among notable 2024 accomplishments, I would highlight the following: • Achieved record FRLPC as a % of network volume of 4.5% in the fourth quarter as we demonstrated our value across multiple partners and channels; 4.5% Reached a record FRLPC as a % of network volume of in 4Q’24 • Actioned core operating expense savings of ~$25 million annually in the 2nd quarter, with core operating expenses as a percentage of FRLPC at its lowest level since going public, at 49%. This level of core opex allows us to continue innovating, setting up the company for sustained operating leverage; • Optimized and diversified our funding program to lower our risk retention requirements - we can now fund our network volume effectively with ~2-3% net cash requirement for personal loans, and ~1.5-2.5% for overall network volume - while reducing our exposure to potential future impairments on our risk retention portfolio. We announced a forward flow agreement with funds managed by Blue Owl Capital last week, to purchase up to $2.4 billion in loans over 24-months, a testament to the demand for the high quality consumer loans originated on our network. We closed our 6th AAA-rated ABS transaction in the fourth quarter, and executed our 3rd pass-through securitization of the year in December for $100 million with one of the largest multi-trillion dollar asset managers in the world. • Completed our previously-announced refinancing transactions to reduce interest expense and unlock additional balance sheet liquidity. Our book of older vintages, spanning 2023, 2022 and 2021, which have adversely impacted profitability over the past few quarters, are no longer expected to materially impact our performance. This lifts our level of visibility with the expected reduction in future impairments going forward, and allows us to demonstrate the power of our business model and deliver what we expect to be sustainable, profitable growth.

9 Core Opex as % FRLPC Core Opex % of FRLPC Trends 117% 113% 84% 72% 67% 66% 57% 52% 49% 4Q’22 1Q’23 2Q’23 3Q’23 4Q’23 1Q’24 2Q’24 3Q’24 4Q’24 119% 3Q’22 NETWORK VOLUME Network volume grew by 9% year-over-year to $2.6 billion. Our personal loan business, which grew 24% year-over-year on an organic basis (i.e., excluding the volume contribution from Theorem), remained the largest contributor of network volume in 4Q’24 at approximately 60% of the total. While volume growth over the past few years has been critical to building a network of scale and reaching the inflection where we turn to profit, going forward our strategic focus is to optimize for profitable growth. TOTAL REVENUE AND OTHER INCOME Total revenue and other income grew 28% year- over-year to a record $279 million. Revenue from fees grew 31% year-over-year to $276 million, driven by higher fees in our personal loan business. Interest and investment income decreased by $4 million to approximately $4 million. FEE REVENUE LESS PRODUCTION COSTS FRLPC grew 55% year-over-year in the third quarter to a record $117 million and continued to meaningfully outpace network volume and revenue growth. FRLPC as a % of network volume (“FRLPC %”) expanded 130 basis points year-over-year to a record 4.5%, at the high end of our 2nd half of 2024 target range of 3.5% to 4.5%. In 2025, we expect to remain in that same 3.5% to 4.5% range and closer to the mid-point. Lending product fees made up 71% of our total FRLPC in the quarter, compared to 63% in 4Q’23. Investor fees made up 29% of our total FRLPC, compared to 37% in 4Q’23. As a reminder, FRLPC % may fluctuate in any given quarter as a result of product, partner and funding mix. In 4Q’24, our personal loan business generated an FRLPC % of 6.3% and our Auto loan business is now on the path to reaching similar levels. ADJUSTED EBITDA In the fourth quarter, core operating expenses (which we define as total operating expenses excluding share-based compensation expense, one-time expenses, and depreciation) were up 13% year-over- year, which was heavily skewed by the addition of expenses from Theorem and one-time year-end accruals. Excluding the Theorem impact and these accruals, core operating expenses were down 6% year-over-year and 3% sequentially. FRLPC grew 55%. Notably, core operating expenses as a percentage of FRLPC, including the impact of Theorem, is now at its lowest level since going public, at 49%, down from 67% in the prior year quarter. Total operating expenses increased by $17 million compared to the prior year, primarily due to higher ABS set-up costs, whole loan purchases and Theorem expenses. Adjusted EBITDA increased by 88%, or $30 million year- over-year to a record $64 million, equating to an adjusted EBITDA margin of 23%, up 730 basis points year-over-year.
10 Continued operating leverage is enhancing flow- through of higher fees to our bottom-line, with a 49% incremental adjusted EBITDA margin in the fourth quarter. Operating income was $32 million in the quarter, while operating cash flow of $32 million was impacted by one-time items. NET INCOME Net loss attributable to Pagaya was $238 million in the fourth quarter, compared to a net loss of $14 million in 4Q’23, driven primarily by fair value adjustments. We believe we have now taken the majority of our losses related to historical vintages in the last quarter and do not expect them to have a material impact, if any, to our performance in the future. These losses had a significant impact on our profitability in the past few years and were the result of challenging credit and funding environments. We have taken significant actions in the last twelve months to be better equipped to manage similar environments in the future, identify prospective impact under different scenarios early and mitigate such outcomes. The learnings for all of us from our execution over the challenging 2021-2023 period, which was disappointing, are instructive and we are committed to providing continued visibility to all our constituents going forward and do everything in our power to not have history repeat itself. Providing GAAP profitability guidance is a critical step towards that commitment. Credit-related fair value adjustments, reported in Other Expense, net, amounted to a loss of $229 million in the quarter vs. $70 million in the prior quarter. In addition, there was $6 million of whole loan impairments recognized in G&A expenses vs. $12 million in the prior quarter. Of the $229 million fair value adjustments, $79 million were related to a reclassification of previously recorded unrealized losses reported in Other Comprehensive Income into Other Expense, Net. The value of some of the securities that we hold on our balance sheet is driven by certain structural attributes, such as early redemption rights, which drove this reclassification this quarter. Recent declines in cost of capital have increased the value of these optional redemption rights relative to other scenarios. Interest expense of $26 million reflects the cost of our term loan, revolving credit facility, and our secured borrowings. We expect interest expense savings in the 1st quarter of 2025 as we realize the full quarter impact of previously-disclosed savings and continue to pay down high cost secured borrowings. Share-based compensation expense of $16 million was toward the lower end of our expected range of $15 million to $20 million per quarter, primarily due to lower vesting of RSUs associated with previously-announced workforce reductions along with the value of newer grants. Adjusted net income was positive for the sixth consecutive quarter at $13 million, which excludes share-based compensation and other non-cash items such as fair value adjustments.

11 2023 Personal Loan CNLs Relative to Peak 2021 Levels 2023 Auto Loan CNLs Relative to Peak 2022 Levels 4Q21 (peak MOB 14 level) 3Q23 (latest MOB 14 data) 3Q22 (peak MOB 13 level) 3Q23 (latest MOB 13 data) 4Q21 (peak MOB 20 level) 1Q23 (latest MOB 20 data) Peak CNL levels Latest data for 2023 vintages at same Month on Book (“MOB”) 1Q22 (peak MOB 19 level) 1Q23 (latest MOB 19 data) 20% improvement 35% improvement 50% improvement 35% improvement CREDIT PERFORMANCE Our credit performance is strong and continues to meaningfully improve over the past two years as we have continuously leveraged our data advantage and analytics to enhance our underwriting models. For personal loans, third quarter 2023 vintage cumulative net losses (“CNLs”) are trending approximately 35% lower than peak levels in the fourth quarter of 2021 at month-on-book (“MOB”) 14. Our first quarter 2023 vintage CNLs are trending 20% lower than those peak levels (at MOB 20). For auto loans, CNLs for our third quarter 2023 vintages are trending approximately 50% lower than the peak levels we saw in the third quarter of 2022 (at MOB 13). Our first quarter 2023 vintage CNLs are trending 35% lower than those peak levels (at MOB 19). This also speaks to the fact that the losses related to the 2023 vintages were driven by funding challenges.

12 Funding and Balance Sheet Efficiency Funding We made tremendous progress enhancing capital efficiency in 2024. We substantially optimized our ABS program, including the attainment of a AAA rating for our personal loan and AA rating for our Auto securitizations, while notably diversifying our funding sources. This cascades through the capital structure of our securitizations, lowering the cost of capital on each tranche. These steps, coupled with significant strengthening of demand for consumer loan assets has driven a meaningful improvement in our overall funding. As of year-to-date December 31, 2024, we’ve issued over $26 billion in our ABS program across 64 transactions, marketed to our network of more than 130 institutional funding partners. We closed our 6th AAA-rated ABS transaction in the fourth quarter. Barring material changes to the broader funding environment, we expect ABS net risk retention levels to continue to range at 4-5% of the notional size of our personal loan ABS deals. The forward flow agreement with funds managed by Blue Owl Capital referenced earlier is yet another step forward in diversified funding with outstanding partners, with lower risk-retention for Pagaya. We also executed our 3rd pass-through securitization of the year in December for $100 million. The structure of pass-through transactions require net risk retention levels of a minimal 1% of the notional size. We expect to continue to scale the program heading into 2025, as we see significant demand from our investors. Based on our current outlook, we expect all non-ABS funding channels to contribute 25-50% of our funding in 2025, driving total net risk retention requirements lower. We may choose to hold more securities at times when it makes economic sense, driving cost of capital lower and future profitability higher. Finally, to reiterate Gal’s comments, based on the current outlook, our business plan is self-funded, we do not need, nor do we plan to raise equity capital in the foreseeable future. Access to diverse sources of funding, limiting Pagaya’s use of capital to fund volume ~$6-7B annual Average risk retention of 0% to 1% Pre-funded ABS issuance ~$3B AUM Privately managed funds ~$1B annual Pass-through securitizations ~$2B annual Forward flow Net risk retention of ~4% to 5% *All figures above are based on current pace of network volumes funded and are not indicative of historical or expected future results. Risk retention refers to upfront use of Pagaya’s capital for each funding source as a % of notional size.

13 Balance sheet In December, we announced the closing of the previously-announced series of opportunistic transactions to refinance high-cost debt and unlock additional access to liquidity. Details were included in a company press release dated December 3, 2024. As of December 31, 2024, our balance sheet primarily consisted of $227 million in Cash and Cash Equivalents and $764 million of Investments in Loans and Securities (primarily risk retention assets from our sponsored ABS transactions). Please refer to our 4Q’24 earnings supplement, published on our Investor Relations website, for more detail on portfolio composition and fair value changes. Overall, the quality and mix of our assets on our balance sheet has improved materially over the last twelve months, which provides us with access to potential liquidity, which we expect to utilize over the course of the year and not rely on other sources of capital such as equity, equity-linked or expensive secured borrowings. In the fourth quarter, the fair value of the overall investment portfolio, net of non-controlling interest and prior to any new additions in the quarter, was adjusted downward by $156 million vs. $101 million last quarter. These fair value adjustments are mainly the result of the meaningfully higher cost of capital at which our 2023 transactions were executed. Additionally, we reported a change in net unrealized loss of positive $79 million in Other Comprehensive Income in Shareholder’s Equity, which was a reclassification to Other Expense, net, as explained above. We also added $17 million of new investments in loans & securities, net of paydowns from prior investments inclusive of an $8 million gain on sale. As noted last quarter, we believe we have now taken the vast majority of any potential impairments associated with 2021, 2022 and 2023 risk-retention assets.
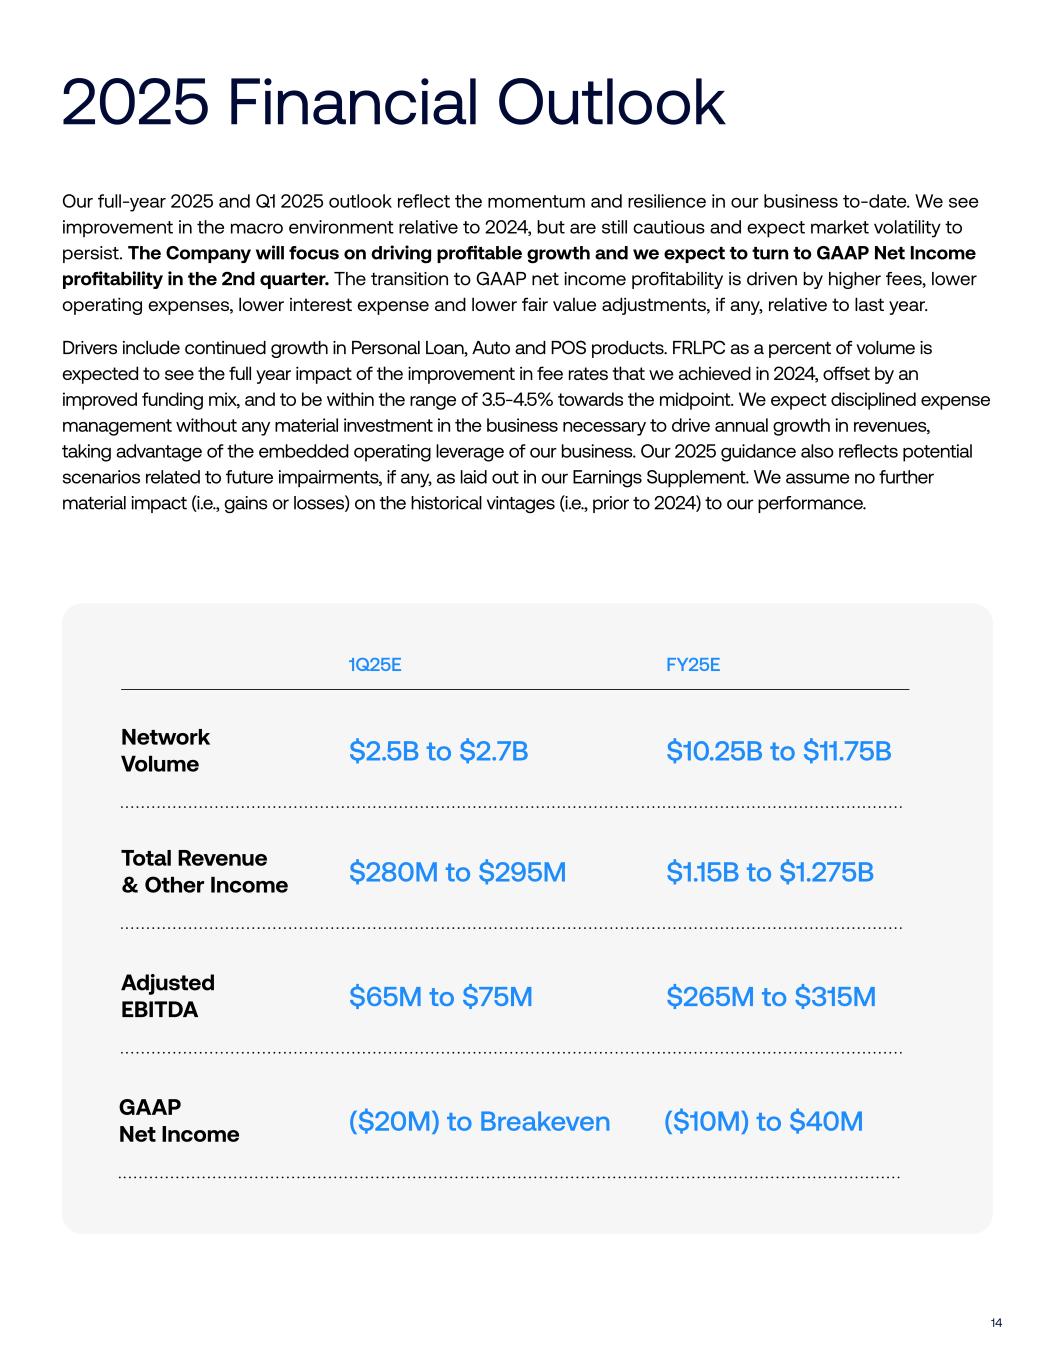
14 2025 Financial Outlook Network Volume $10.25B to $11.75B$2.5B to $2.7B 1Q25E FY25E Total Revenue & Other Income $1.15B to $1.275B$280M to $295M Adjusted EBITDA $265M to $315M$65M to $75M Our full-year 2025 and Q1 2025 outlook reflect the momentum and resilience in our business to-date. We see improvement in the macro environment relative to 2024, but are still cautious and expect market volatility to persist. The Company will focus on driving profitable growth and we expect to turn to GAAP Net Income profitability in the 2nd quarter. The transition to GAAP net income profitability is driven by higher fees, lower operating expenses, lower interest expense and lower fair value adjustments, if any, relative to last year. Drivers include continued growth in Personal Loan, Auto and POS products. FRLPC as a percent of volume is expected to see the full year impact of the improvement in fee rates that we achieved in 2024, offset by an improved funding mix, and to be within the range of 3.5-4.5% towards the midpoint. We expect disciplined expense management without any material investment in the business necessary to drive annual growth in revenues, taking advantage of the embedded operating leverage of our business. Our 2025 guidance also reflects potential scenarios related to future impairments, if any, as laid out in our Earnings Supplement. We assume no further material impact (i.e., gains or losses) on the historical vintages (i.e., prior to 2024) to our performance. GAAP Net Income ($10M) to $40M($20M) to Breakeven

15 Conference Call and Webcast Information The Company will hold a webcast and conference call today, February 13th, 2025, at 8:30 a.m. Eastern Time. A live webcast of the call will be available via the Investor Relations section of the Company’s website at investor.pagaya.com. To listen to the live webcast, please go to the site at least five minutes prior to the scheduled start time in order to register, download and install any necessary audio software. Shortly before the call, the accompanying materials will be made available on the Company’s website. Shortly after the call, a replay of the webcast will be available for 90 days on the Company’s website. The conference call can also be accessed by dialing 1-877-407-9208 or 1-201-493-6784. The telephone replay can be accessed by dialing 1-844- 512-2921 or 1-412-317-6671 and providing the conference ID# 13749063. The telephone replay will be available starting shortly after the call until Tuesday, November 26, 2024. A replay will also be available on the Investor Relations website following the call. About Pagaya Technologies Pagaya (NASDAQ: PGY) is a global technology company making life-changing financial products and services available to more people nationwide, as it reshapes the financial services ecosystem. By using machine learning, a vast data network and an AI-driven approach, Pagaya provides comprehensive consumer credit and residential real estate solutions for its partners, their customers, and investors. Its proprietary API and capital solutions integrate into its network of partners to deliver seamless user experiences and greater access to the mainstream economy. Pagaya has offices in New York and Tel Aviv. For more information, visit pagaya.com. INVESTORS & ANALYSTS Joshua Fagen Head of Investor Relations ir@pagaya.com MEDIA & PRESS Emily Passer Head of PR & External Communications press@pagaya.com

16 Cautionary Note About Forward-Looking Statements This document contains forward-looking statements within the meaning of Section 27A of the Securities Act of 1933, as amended, and Section 21E of the Securities Exchange Act of 1934, as amended, that involve risks and uncertainties. These forward-looking statements generally are identified by the words “anticipate,” “believe,” “continue,” “can,” “could,” “estimate,” “expect,” “intend,” “may,” “opportunity,” “future,” “strategy,” “might,” “outlook,” “plan,” “possible,” “potential,” “predict,” “project,” “should,” “strive,” “will,” “would,” “will be,” “will continue,” “will likely result,” and similar expressions. All statements other than statements of historical fact are forward- looking statements, including statements regarding: The Company’s strategy and future operations, including the Company’s expectations regarding sustainable revenue growth and the Company’s ability to deliver consistent results for its lending partners and investors; the Company’s ability to continue to drive sustainable gains in profitability; the Company’s ability to achieve continued momentum in its business; the Company’s ability to achieve positive net cash flow in 2025; the Company’s ability to achieve GAAP net income profitability in the second quarter of 2025; the Company’s financial outlook for Network Volume, Total Revenue and Other Income and Adjusted EBITDA for the first quarter of 2025 and the Company’s financial outlook for Network Volume, Total Revenue and Other Income, Adjusted EBITDA and GAAP net income for the full year 2025. These forward-looking statements involve known and unknown risks, uncertainties and other important factors that may cause the Company’s actual results, performance or achievements to be materially different from any future results, performance or achievements expressed or implied by the forward-looking statements. Risks, uncertainties and assumptions include factors relating to: the Company’s ability to attract new partners and to retain and grow its relationships with existing partners to support the underlying investment needs for its securitizations and funds products; the need to maintain a consistently high level of trust in its brand; the concentration of a large percentage of its investment revenue with a small number of partners and platforms; its ability to sustain its revenue growth rate or the growth rate of its related key operating metrics; its ability to improve, operate and implement its technology, its existing funding arrangements for the Company and its affiliates that may not be renewed or replaced or its existing funding sources that may be unwilling or unable to provide funding to it on terms acceptable to it, or at all; the performance of loans facilitated through its model; changes in market interest rates; its securitizations, warehouse credit facility agreements; the impact on its business of general economic conditions, including, but not limited to rising interest rates, inflation, supply chain disruptions, exchange rate fluctuations and labor shortages; its ability to realize the potential benefits of past or future acquisitions; anticipated benefits and savings from our recently announced reduction in workforce; changes in the political, legal and regulatory framework for AI technology, machine learning, financial institutions and consumer protection; the ability to maintain the listing of our securities on Nasdaq; the financial performance of its partners, and fluctuations in the U.S. consumer credit and housing market; its ability to grow effectively through strategic alliances; seasonal fluctuations in our revenue as a result of consumer spending and saving patterns; pending and future litigation, regulatory actions and/or compliance issues and other risks that are described in and the Company’s Form 10-K filed on April 25, 2024 and subsequent filings with the U.S. Securities and Exchange Commission. These forward-looking statements reflect the Company’s views with respect to future events as of the date hereof and are based on assumptions and subject to risks and uncertainties. Given these uncertainties, investors should not place undue reliance on these forward-looking statements. The forward- looking statements are made as of the date hereof, reflect the Company’s current beliefs and are based on information currently available as of the date they are made, and the Company assumes no obligation and does not intend to update these forward-looking statements. Financial Information; Non-GAAP Financial Measures Some of the unaudited financial information and data contained in this shareholder letter, our earnings press release and Form 8-K, such as Fee Revenue Less Production Costs (“FRLPC”), FRLPC as a % of volume, Adjusted EBITDA and Adjusted Net Income (Loss), have not been prepared in accordance with United States generally accepted accounting principles (“U.S. GAAP”). To supplement the unaudited consolidated financial
17 statements prepared and presented in accordance with U.S. GAAP, management uses the non-GAAP financial measures FRLPC, FRLPC as a % of volume, Adjusted Net Income (Loss) and Adjusted EBITDA to provide investors with additional information about our financial performance and to enhance the overall understanding of the results of operations by highlighting the results from ongoing operations and the underlying profitability of our business. Management believes these non-GAAP measures provide an additional tool for investors to use in comparing our core financial performance over multiple periods. However, non-GAAP financial measures have limitations in their usefulness to investors because they have no standardized meaning prescribed by U.S. GAAP and are not prepared under any comprehensive set of accounting rules or principles. In addition, non-GAAP financial measures may be calculated differently from, and therefore may not be directly comparable to, similarly titled measures used by other companies. As a result, non-GAAP financial measures should be viewed as supplementing, and not as an alternative or substitute for, our unaudited consolidated financial statements prepared and presented in accordance with U.S. GAAP. To address these limitations, management provides a reconciliation of Adjusted Net Income (Loss) and Adjusted EBITDA to net income (loss) attributable to Pagaya’s shareholders and a calculation of FRLPC and FRLPC as a % of volume. Management encourages investors and others to review our financial information in its entirety, not to rely on any single financial measure and to view Adjusted Net Income (Loss) and Adjusted EBITDA in conjunction with its respective related GAAP financial measures. Non-GAAP financial measures include the following items: Fee Revenue Less Production Costs (“FRLPC”) is defined as revenue from fees less production costs. FRLPC as a % of volume is defined as FRLPC divided by Network Volume. Adjusted Net Income (Loss) is defined as net income (loss) attributable to Pagaya Technologies Ltd.’s shareholders excluding share-based compensation expense, change in fair value of warrant liability, impairment, including credit- related charges, restructuring expenses, transaction-related expenses, and non-recurring expenses associated with mergers and acquisitions. Adjusted EBITDA is defined as net income (loss) attributable to Pagaya Technologies Ltd.’s shareholders excluding share-based compensation expense, change in fair value of warrant liability, impairment, including credit-related charges, restructuring expenses, transaction-related expenses, non-recurring expenses associated with mergers and acquisitions, interest expense, depreciation expense, and income tax expense (benefit). The foregoing items are excluded from our Adjusted Net Income (Loss) and Adjusted EBITDA measures because they are noncash in nature, or because the amount and timing of these items is unpredictable, is not driven by core results of operations and renders comparisons with prior periods and competitors less meaningful. We believe FRLPC, FRLPC as a % of volume, Adjusted Net Income (Loss) and Adjusted EBITDA provide useful information to investors and others in understanding and evaluating our results of operations, as well as providing a useful measure for period-to-period comparisons of our business performance. Moreover, we have included FRLPC, FRLPC as a % of volume, Adjusted Net Income (Loss) and Adjusted EBITDA because these are key measurements used by our management internally to make operating decisions, including those related to operating expenses, evaluate performance, and perform strategic planning and annual budgeting. However, this non-GAAP financial information is presented for supplemental informational purposes only, should not be considered a substitute for or superior to financial information presented in accordance with U.S. GAAP and may be different from similarly titled non-GAAP financial measures used by other companies. The tables below provide reconciliations of Adjusted EBITDA to Net Loss Attributable to Pagaya Technologies Ltd., its most directly comparable U.S. GAAP amount. In addition, Pagaya provides outlook for the first quarter and full year 2025 on a non-GAAP basis. The Company cannot reconcile its expected Adjusted EBITDA to expected Net Loss Attributable to Pagaya under “Full-Year 2025 Outlook” without unreasonable effort because certain items that impact net income (loss) and other reconciling items are out of the Company’s control and/or cannot be reasonably predicted at this time, which unavailable information could have a significant impact on the Company’s U.S. GAAP financial results.

18 Three Months Ended December 31, Year Ended December 31, (In thousands, except share and per share data) 2024 2023 2024 2023 Revenue Revenue from fees $ 275,669 $ 210,428 $ 1,004,550 $ 772,814 Other Income Interest income 7,619 7,783 32,291 38,748 Investment (loss) income (3,894) (167) (4,593) 489 Total Revenue and Other Income 279,394 218,044 1,032,248 812,051 Production costs 158,204 134,482 597,652 508,944 Technology, data and product development1 18,601 17,550 76,571 74,383 Sales and marketing1 15,376 9,576 50,404 49,773 General and administrative1 55,474 45,784 240,781 203,351 Total Costs and Operating Expenses 247,655 207,392 965,408 836,451 Operating Income (Loss) 31,739 10,652 66,840 (24,400) Other expense, net (272,280) (25,633) (487,962) (156,768) Loss Before Income Taxes (240,541) (14,981) (421,122) (181,168) Income tax expense (benefit) 16,585 5,056 24,576 15,571 Net Loss Including Noncontrolling Interests (257,126) (20,037) (445,698) (196,739) Less: Net loss attributable to noncontrolling interests (19,204) (5,619) (44,292) (68,301) Net Loss Attributable to Pagaya Technologies Ltd. $ (237,922) $ (14,418) $ (401,406) $ (128,438) Per share data: Net loss per share: Basic and Diluted3 $ (3.20) $ (0.24) $ (5.66) $ (2.14) Non-GAAP adjusted net income 2 $ 13,225 $ 12,389 $ 66,866 $ 16,556 Non-GAAP adjusted net income per share: Basic3 $ 0.18 $ 0.20 $ 0.94 $ 0.28 Diluted3 $ 0.17 $ 0.20 $ 0.83 $ 0.27 Weighted average shares outstanding: Basic3 74,334,181 61,292,498 70,879,807 60,038,893 Diluted3 75,914,852 63,133,967 83,929,801 61,693,526 Three Months Ended December 31, Year Ended December31, 2024 2023 2024 2023 Technology, data and product development $ 1,710 $ 3,460 $ 8,695 $ 12,375 Selling and marketing 5,072 2,237 14,666 13,216 General and administrative 8,863 8,046 38,136 45,464 Total $ 15,645 $ 13,743 $ 61,497 $ 71,055 Consolidated Statements of Operations (Unaudited) (2) See “Reconciliation of Non-GAAP Financial Measures.” (3) Share amounts have been retroactively adjusted to reflect the 1-for-12 reverse share split effected on March 8, 2024. (1) The following table sets forth share-based compensation for the periods indicated below:

19 (In thousands) December 31, 2024 December 31, 2023 Assets Current assets: Cash and cash equivalents $ 187,921 $ 186,478 Restricted cash 18,595 16,874 Fees and other receivables 112,222 79,526 Investments in loans and securities 7,797 2,490 Prepaid expenses and other current assets 24,944 18,034 Total current assets 351,479 303,402 Restricted cash 20,002 19,189 Fees and other receivables 29,182 34,181 Investments in loans and securities 756,322 714,303 Equity method and other investments 21,933 26,383 Right-of-use assets 36,876 55,729 Property and equipment, net 37,974 41,557 Goodwill 23,062 10,945 Intangible assets 12,821 2,550 Prepaid expenses and other assets 1,421 137 Total non-current assets 939,593 904,974 Total Assets $ 1,291,072 $ 1,208,376 Liabilities and Shareholders’ Equity Current liabilities: Accounts payable 6,992 1,286 Accrued expenses and other liabilities 45,362 28,562 Current maturities of operating lease liabilities 6,453 6,931 Current portion of long-term debt 17,750 — Secured borrowing 109,079 37,685 Income taxes payable 9,858 461 Total current liabilities 195,494 74,925 Non-current liabilities: Warrant liability 893 3,242 Revolving credit facility — 90,000 Long-term debt 303,567 — Exchangeable notes 146,342 — Secured borrowing 67,010 234,028 Operating lease liabilities 30,611 43,940 Long-term tax and deferred tax liabilities, net 31,359 22,242 Total non-current liabilities 579,782 393,452 Total Liabilities 775,276 468,377 Redeemable convertible preferred shares 74,250 74,250 Shareholders’ equity: Ordinary shares — — Additional paid-in capital 1,282,022 1,101,914 Accumulated other comprehensive (loss) income (11,488) 444 Accumulated deficit (944,043) (542,637) Total Pagaya Technologies Ltd. shareholders’ equity 326,491 559,721 Noncontrolling interests 115,055 106,028 Total shareholders’ equity 441,546 665,749 Total Liabilities, Redeemable Convertible Preferred Shares, and Shareholders’ Equity $ 1,291,072 $ 1,208,376 Consolidated Statements of Financial Position

20 Year Ended December 31, (In thousands) 2024 2023 Cash flows from operating activities Net loss including noncontrolling interests $ (445,698) $ (196,739) Adjustments to reconcile net income (loss) to net cash used in operating activities: Equity method loss (income) 4,593 (488) Depreciation and amortization 28,753 19,127 Share-based compensation 61,497 71,055 Fair value adjustment to warrant liability (2,349) 1,842 Impairment loss on investments in loans and securities 414,014 134,510 Gain on sale of investment in loans and securities (7,922) — Write-off of capitalized software 3,245 2,475 Debt issuance costs amortization 3,739 — Loss (gain) on foreign exchange 4,189 (1,320) Other non-cash items 367 — Change in operating assets and liabilities: Fees and other receivables (24,004) (20,740) Prepaid expenses and other assets (9,239) 12,912 Right-of-use assets 1,115 3,854 Accounts payable 5,678 (448) Accrued expenses and other liabilities 6,861 (17,770) Operating lease liability 522 (3,712) Income taxes 21,159 5,019 Net cash provided by operating activities 66,520 9,577 Cash flows from investing activities Proceeds from the sale/maturity/prepayment of: Investments in loans and securities 227,771 172,061 Equity method and other investments 31 — Cash and restricted cash acquired from Darwin Homes, Inc. — 1,608 Payments for the purchase of: Investments in loans and securities (693,941) (566,173) Intangible assets (5,500) — Property and equipment (17,737) (20,189) Equity method and other investments (175) — Acquisition of Theorem Technology, Inc., net of cash acquired (9,094) — Net cash used in investing activities (498,645) (412,693) Cash flows from financing activities Proceeds from sale of ordinary shares, net of issuance costs 89,956 — Proceeds from issuance of redeemable convertible preferred shares, net — 74,250 Proceeds from long-term debt 341,845 — Proceeds from exchangeable notes 152,000 — Proceeds from secured borrowing 265,656 338,472 Proceeds received from noncontrolling interests 63,960 19,955 Proceeds from revolving credit facility 59,000 130,000 Proceeds from exercise of stock options 3,305 4,334 Proceeds from issuance of ordinary shares from the Equity Financing Purchase Agreement 11,865 27,892 Distributions made to noncontrolling interests (9,820) (43,767) Payments made to revolving credit facility (149,000) (55,000) Payments made to secured borrowing (361,428) (206,390) Payments made to long-term debt (14,000) — Debt issuance costs (16,651) — Consolidated Statements of Cash Flows Settlement of share-based compensation in satisfaction of tax withholding requirements — (650) Net cash provided by financing activities 436,688 289,096 Effect of exchange rate changes on cash, cash equivalents and restricted cash (586) (515) Net increase (decrease) in cash, cash equivalents and restricted cash 3,977 (114,535) Cash, cash equivalents and restricted cash, beginning of period 222,541 337,076 Cash, cash equivalents and restricted cash, end of period $ 226,518 $ 222,541
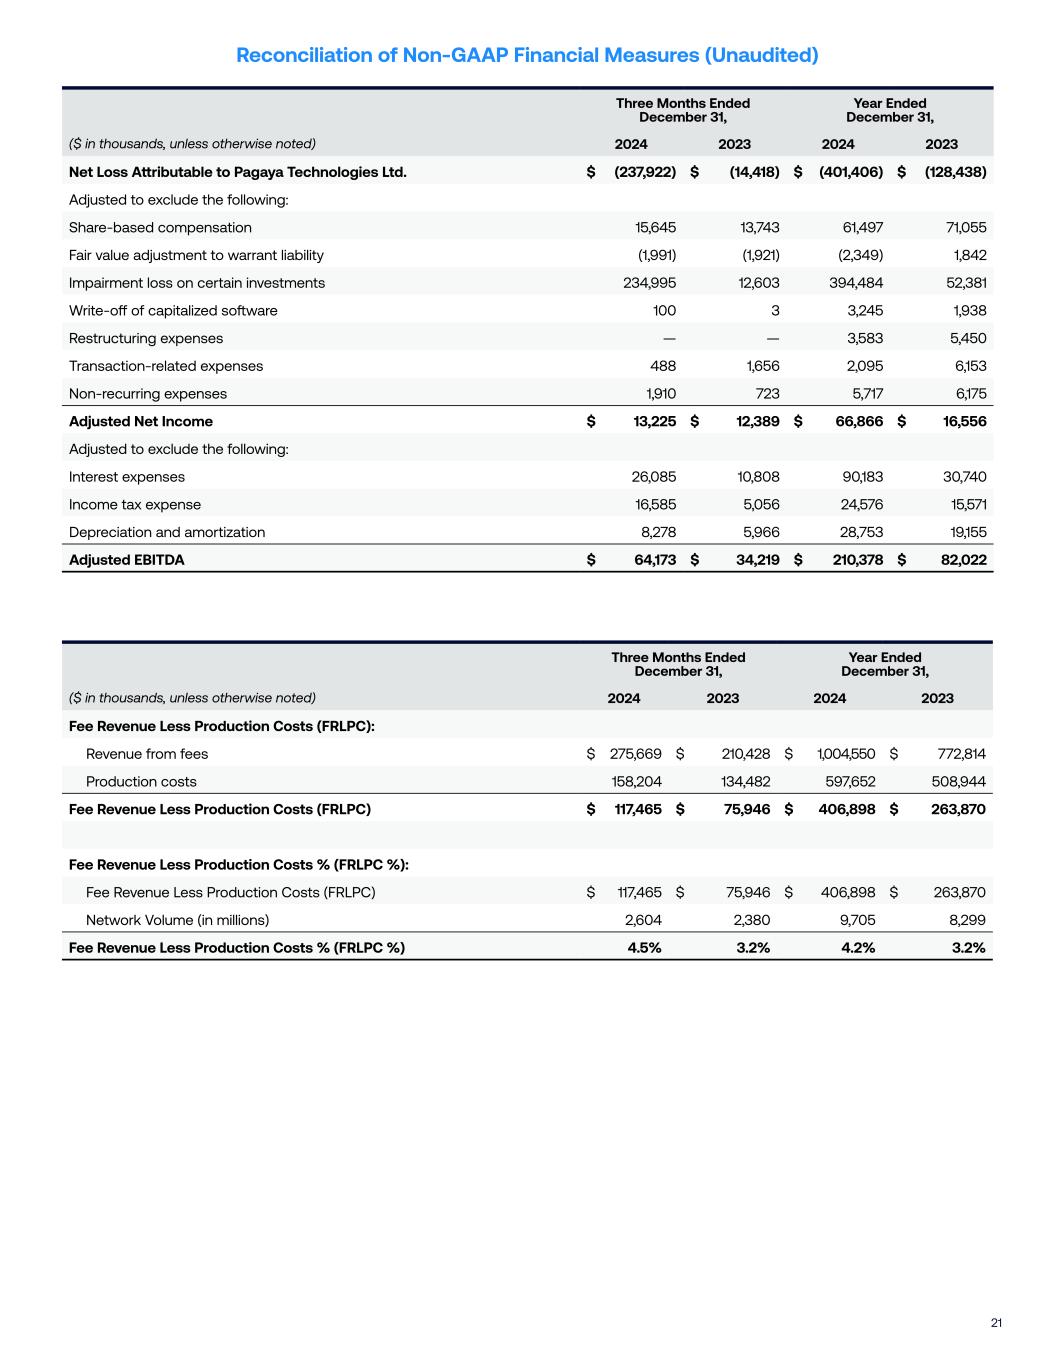
21 Reconciliation of Non-GAAP Financial Measures (Unaudited) Three Months Ended December 31, Year Ended December 31, ($ in thousands, unless otherwise noted) 2024 2023 2024 2023 Net Loss Attributable to Pagaya Technologies Ltd. $ (237,922) $ (14,418) $ (401,406) $ (128,438) Adjusted to exclude the following: Share-based compensation 15,645 13,743 61,497 71,055 Fair value adjustment to warrant liability (1,991) (1,921) (2,349) 1,842 Impairment loss on certain investments 234,995 12,603 394,484 52,381 Write-off of capitalized software 100 3 3,245 1,938 Restructuring expenses — — 3,583 5,450 Transaction-related expenses 488 1,656 2,095 6,153 Non-recurring expenses 1,910 723 5,717 6,175 Adjusted Net Income $ 13,225 $ 12,389 $ 66,866 $ 16,556 Adjusted to exclude the following: Interest expenses 26,085 10,808 90,183 30,740 Income tax expense 16,585 5,056 24,576 15,571 Depreciation and amortization 8,278 5,966 28,753 19,155 Adjusted EBITDA $ 64,173 $ 34,219 $ 210,378 $ 82,022 Three Months Ended December 31, Year Ended December 31, ($ in thousands, unless otherwise noted) 2024 2023 2024 2023 Fee Revenue Less Production Costs (FRLPC): Revenue from fees $ 275,669 $ 210,428 $ 1,004,550 $ 772,814 Production costs 158,204 134,482 597,652 508,944 Fee Revenue Less Production Costs (FRLPC) $ 117,465 $ 75,946 $ 406,898 $ 263,870 Fee Revenue Less Production Costs % (FRLPC %): Fee Revenue Less Production Costs (FRLPC) $ 117,465 $ 75,946 $ 406,898 $ 263,870 Network Volume (in millions) 2,604 2,380 9,705 8,299 Fee Revenue Less Production Costs % (FRLPC %) 4.5% 3.2% 4.2% 3.2%


