As filed with the U.S. Securities and Exchange Commission on June 3, 2022.
Registration No. 333-264363
UNITED STATES
SECURITIES AND EXCHANGE COMMISSION
Washington, D.C. 20549
Amendment No. 1
to
FORM
S-1
REGISTRATION STATEMENT
UNDER
THE SECURITIES ACT OF 1933
STARRY GROUP HOLDINGS, INC.
(Exact name of registrant as specified in
its
charter)Delaware | 4813 | 87-4759355 | ||
(State or other jurisdiction of incorporation or organization) | (Primary Standard Industrial Classification Code Number) | (I.R.S. Employer Identification Number) |
38 Chauncy Street, Suite 200
Boston, MA 02111
(617)
861-8300
(Address, including zip code, and telephone number, including area code, of registrant’s principal executive offices)
William J. Lundregan
Executive Vice President, Chief Legal Officer and Secretary
38 Chauncy Street, Suite 200
Boston, MA 02111
(617)
861-8300
(Name, address, including zip code, and telephone number, including area code, of agent for service)
Copies to:
Rachel W. Sheridan
Shagufa R. Hossain
Latham & Watkins LLP
555 Eleventh Street NW, Suite 1000
Washington, DC 20004
(202)
637-2200
Approximate date of commencement of proposed sale to the public:
If any of the securities being registered on this Form are to be offered on a delayed or continuous basis pursuant to Rule 415 under the Securities Act of 1933 check the following box: ☒
If this Form is filed to register additional securities for an offering pursuant to Rule 462(b) under the Securities Act, please check the following box and list the Securities Act registration statement number of the earlier effective registration statement for the same offering: ☐
If this Form is a post-effective amendment filed pursuant to Rule 462(c) under the Securities Act, check the following box and list the Securities Act registration statement number of the earlier effective registration statement for the same offering: ☐
If this Form is a post-effective amendment filed pursuant to Rule 462(d) under the Securities Act, check the following box and list the Securities Act registration statement number of the earlier effective registration statement for the same offering: ☐
Indicate by check mark whether the registrant is a large accelerated filer, an accelerated filer, a
non-accelerated
filer, a smaller reporting company, or an emerging growth company. See the definitions of “large accelerated filer,” “accelerated filer,” “smaller reporting company,” and “emerging growth company” in Rule12b-2
of the Exchange Act:| Large accelerated filer | ☐ | Accelerated filer | ☐ | |||
| Non-accelerated filer | ☒ | Smaller reporting company | ☒ | |||
| Emerging growth company | ☒ | |||||
If an emerging growth company, indicate by check mark if the registrant has elected not to use the extended transition period for complying with any new or revised financial accounting standards provided pursuant to Section 7(a)(2)(B) of the Securities Act: ☐
The registrant hereby amends this registration statement on such date or dates as may be necessary to delay its effective date until the registrant shall file a further amendment which specifically states that this registration statement shall thereafter become effective in accordance with Section 8(a) of the Securities Act or until this registration statement shall become effective on such date as the U.S. Securities and Exchange Commission, acting pursuant to said Section 8(a), may determine.
The information in this preliminary prospectus is not complete and may be changed. These securities may not be sold until the registration statement filed with the U.S. Securities and Exchange Commission is effective. The preliminary prospectus is not an offer to sell these securities and does not constitute the solicitation of offers to buy these securities in any jurisdiction where the offer or sale is not permitted.
SUBJECT TO COMPLETION, DATED JUNE
3
, 2022
STARRY GROUP HOLDINGS, INC.
135,998,658 SHARES OF CLASS A COMMON STOCK
6,853,333 WARRANTS TO PURCHASE SHARES OF CLASS A COMMON STOCK
25,641,113 SHARES OF CLASS A COMMON STOCK UNDERLYING WARRANTS
This prospectus relates to the resale from time to time by the selling securityholders (including their transferees, donees, pledgees and other successors-in-interest) named in this prospectus (the “selling securityholders”) of up to (A) 133,303,864 shares of Class A common stock, par value $0.0001 per share (the “Class A Common Stock”), of Starry Group Holdings, Inc., a Delaware corporation (“Starry Group”), which includes (i) 99,896,582 shares of Class A Common Stock issued to securityholders of Starry, Inc., a Delaware corporation (“Starry”), pursuant to the Acquisition Merger (as defined below) at an equity consideration value of $10.00 per share, (ii) 9,268,335 shares of Class A Common Stock issuable upon the conversion of Class X Common Stock (as defined below) issued to Chaitanya Kanojia, Starry Group’s Chief Executive Officer, pursuant to the Acquisition Merger at an equity consideration value of $10.00 per share, (iii) 2,800,000 shares of Class A Common Stock, issued in exchange for the Starry Series Z Preferred Stock issued in the Series Z Investment (as defined below) at a price of $7.50 per share, pursuant to the Acquisition Merger, (iv) 14,533,334 shares of Class A Common Stock issued in the PIPE Investment (as defined below) at a price of $7.50 per share and (v) 6,805,613 shares of Class A Common Stock issued to the Sponsor (as defined below) and the Initial Stockholders (as defined below) pursuant to the SPAC Merger (as defined below) and (B) 6,853,333 warrants to purchase 1.2415 shares of Class A Common Stock per warrant at an exercise price of $9.13 per 1.2415 shares of Class A Common Stock (the “private placement warrants”) issued to the Sponsor and the Initial Stockholders pursuant to the SPAC Merger.
Prior to the consummation of the initial public offering of units of FirstMark Horizon Acquisition Corp., a Delaware corporation (“FirstMark”), the Sponsor purchased 8,625,000 shares of Class B Common Stock, par value $0.0001 per share, of FirstMark (“FirstMark Class B Common Stock”) for an aggregate purchase price of $25,000, or approximately $0.003 per share. FirstMark subsequently transferred an aggregate of 120,000 shares of FirstMark Class B Common Stock, held by the Sponsor to certain members of the board of directors of FirstMark. FirstMark subsequently effected a 1:1.2 stock split of the FirstMark Class B Common Stock, resulting in an aggregate of 10,350,000 shares of FirstMark Class B Common Stock outstanding. Pursuant to the Sponsor Support Agreement (as defined below) such shares were converted into an aggregate of 5,481,767 shares of Class A Common Stock, par value $0.0001 per share, of FirstMark (the “FirstMark Class A Common Stock”) immediately prior to the closing of the SPAC Merger, which shares were then converted into an aggregate of 6,805,613 shares of Class A Common Stock (including 4,128,113 Earnout Shares (as defined below) subject to forfeiture) pursuant to and upon the closing of the SPAC Merger. This resulted in an approximate price of $0.004 per share for each of the shares received pursuant to the SPAC Merger.
This prospectus also relates to the issuance by us and resale by certain selling securityholders of up to (A) 2,271,414 shares of Class A Common Stock reserved for issuance upon the exercise of options to purchase Class A Common Stock that were issued in exchange for options to purchase shares of Starry Common Stock (as defined below) pursuant to the Acquisition Merger at an equity consideration value of $10.00 per share and (B) 423,380 shares of Class A Common Stock reserved for issuance upon the settlement of restricted stock units that were issued in exchange for Starry restricted stock units pursuant to the Acquisition Merger at an equity consideration value of $10.00 per share. Such shares of Class A Common Stock will be issued pursuant to the terms of the Starry, Inc. 2014 Stock Option and Grant Plan (the “Starry Stock Plan”) and the applicable award agreement, at the applicable exercise prices established upon the grants of the awards, as adjusted in connection with the Acquisition Merger.
This prospectus also relates to the issuance by us of up to 25,641,113 shares of Class A Common Stock upon the exercise of outstanding private placement warrants and public warrants (the “public warrants” and, together with the private placement warrants, the “warrants”). In connection with the Business Combination, the public warrants were issued in exchange for warrants that were originally issued in the initial public offering of units of FirstMark, at a price of $10.00 per unit, with each unit consisting of one share of FirstMark Class A Common Stock and one-third of one warrant to purchase one share of FirstMark Class A Common Stock, and the private placement warrants were issued in exchange for warrants that were originally issued in a private placement at a price of $1.50 per warrant to purchase one share of FirstMark Class A Common Stock, in connection with the initial public offering of FirstMark. No fractional shares of Class A Common Stock will be issued upon exercise of the warrants. If, upon exercise, a holder would be entitled to receive a fractional interest in a share, we will round down to the nearest whole number the number of shares of Class A Common Stock to be issued to the holder.
Pursuant to that certain Merger Agreement, dated as of October 6, 2021, by and among FirstMark, Sirius Merger Sub, Inc., a Delaware corporation and wholly owned direct subsidiary of FirstMark (“Merger Sub), Starry and Starry Group (as amended from time to time, the “Merger Agreement”), we consummated the merger transactions contemplated by the Merger Agreement in two steps: (1) on March 28, 2022 (the “SPAC Merger Effective Time”), FirstMark merged with and into Starry Group, with Starry Group surviving as a publicly traded entity and the sole owner of Merger Sub (the “SPAC Merger”) and (2) on March 29, 2022 (the “Acquisition Merger Effective Date”), Merger Sub merged with and into Starry, with Starry continuing as the surviving entity and a wholly owned subsidiary of Starry Group (the “Acquisition Merger” and, together with the SPAC Merger and all other transactions contemplated by the Merger Agreement, the “Business Combination”).
We are registering the resale of shares of Class A Common Stock and private placement warrants as required by (i) that certain Amended and Restated Registration Rights Agreement, dated as of the SPAC Merger Effective Time (as amended from time to time, the “Registration Rights Agreement”), by and among us, FirstMark, FirstMark Horizon Sponsor LLC, a Delaware limited liability company (the “Sponsor”), certain equityholders of FirstMark and certain equityholders of Starry, (ii) those certain subscription agreements, each dated as of October 6, 2021 (as amended from time to time, the “PIPE Subscription Agreements”), entered into by and among us, FirstMark and certain qualified institutional buyers and accredited investors (collectively, the “PIPE Investors”) that purchased shares of Class A Common Stock at a price of $7.50 per share in private placements consummated in connection with the Business Combination (the “PIPE Investment”), (iii) that certain subscription agreement, dated as of October 6, 2021 (as amended from time to time, the “FirstMark Series Z Subscription Agreement” and, together with the PIPE Subscription Agreements, the “Subscription Agreements”) by and among Starry and certain accredited investors affiliated with the Sponsor (the “FirstMark Series Z Investors”) that purchased shares of Series Z Preferred Stock, par value $0.001 per share (“Starry Series Z Preferred Stock”), of Starry at a price of $7.50 per share in connection with the Business Combination (the “FirstMark Series Z Investment”), (iv) that certain subscription agreement, dated as of March 25, 2022 (as amended from time to time, the “Tiger Series Z Subscription Agreement” and, together with the FirstMark Series Z Subscription Agreement, the “Series Z Subscription Agreements”) by and between Starry and Tiger Global Private Investment Partners IX, LP (the “Tiger Series Z Investor” and, together with the FirstMark Series Z Investors, the “Series Z Investors”) that purchased shares of Starry Series Z Preferred Stock at a price of $7.50 per share in connection with the Business Combination (the “Tiger Investment” and, together with the FirstMark Series Z Investment, the “Series Z Investment”) and (v) those certain
Non-Redemption
Agreements, each dated as of March 9, 2022 (as amended from time to time, the“Non-Redemption
Agreements”), by and among us, FirstMark and certain accredited investors (each, a“Non-Redemption
Investor” and, collectively, the“Non-Redemption
Investors”).We are registering the issuance of shares of Class A Common Stock upon exercise of warrants as required by that certain Warrant Agreement, dated as of October 8, 2020, between FirstMark and Continental Stock Transfer & Trust Company, as warrant agent (the “Warrant Agreement”).
We will receive the proceeds from any exercise of the warrants or stock options for cash, but not from the resale of any shares of Class A Common Stock or private placement warrants by the selling securityholders covered by this prospectus. Assuming the exercise of all outstanding warrants for cash, we would receive aggregate proceeds of approximately $188.6 million. There is no assurance that the warrants will be in the money prior to their expiration or that the warrant holders will exercise their warrants. The Sponsor and its permitted transferees have the option to exercise the private placement warrants on a cashless basis, and the public warrants are exercisable on a cashless basis under the circumstances specified in the Warrant Agreement. To the extent that any warrants are exercised on a cashless basis, the amount of cash we would receive from the exercise of the warrants will decrease. We believe that the likelihood that warrant holders will exercise their warrants, and therefore the amount of cash proceeds that we would receive, is dependent upon the market price of our Class A Common Stock. If the market price for our Class A Common Stock is less than the exercise price of the warrants (on a per share basis), we believe warrant holders will be unlikely to exercise the warrants.
Our shares of Class A Common Stock are listed on The New York Stock Exchange (the “NYSE”) under the symbol “STRY.” On June 2, 2022, the closing sale price of our Class A Common Stock was $10.26 per share. Our public warrants are listed on the NYSE under the symbol “STRY WS.” On June 2, 2022, the closing sale price of our public warrants was $2.26 per warrant.
In connection with the Business Combination, holders of 37,775,801 shares of FirstMark Class A Common Stock exercised their right to redeem their shares for cash at a price of approximately $10.00 per share, for an aggregate price of $377.8 million, which represented approximately 91.2% of the total FirstMark Class A Common Stock then outstanding. The shares of Class A Common Stock being offered for resale pursuant to this prospectus represent approximately 86.6% of the current total outstanding Class A Common Stock, and the warrants being offered for resale pursuant to this prospectus represent approximately 33.2% of our outstanding warrants. Additionally, if all of the private placement warrants are exercised, the selling securityholders would own an additional 8,508,413 shares of Class A Common Stock, representing an additional 5.4% of the total outstanding Class A Common Stock. The sale of all securities being offered in this prospectus could result in a significant decline in the public trading price of the Class A Common Stock. Even though the current trading price of the Class A Common Stock is close to the price at which the units were issued in FirstMark’s initial public offering, the Sponsor and other selling securityholders have an incentive to sell because they will still profit on sales due to the lower price at which they purchased their shares compared to the public investors in FirstMark’s initial public offering. Public investors may not experience a similar rate of return on the securities they purchase due to differences in the purchase prices and the current trading price. Based on the closing prices of our Class A Common Stock and warrants referenced above, (i) the selling securityholders that were formerly securityholders of Starry may experience profit of up to $0.26 per share, (ii) the Series Z Investors and the PIPE Investors may experience profit of up to $2.76 per share, (iii) the Sponsor may experience profit of up to $10.26 per share and (iv) the holders of private placement warrants may experience profit of up to $0.76 per warrant or up to $2.11 upon the exercise of a warrant and sale of the underlying Class A Common Stock (without giving effect to the rounding down of fractional shares).
We will bear all costs, expenses and fees in connection with the registration of the shares of Class A Common Stock and private placement warrants. The selling securityholders will bear all commissions and discounts, if any, attributable to their respective sales of the shares of Class A Common Stock and private placement warrants.
We are an “emerging growth company” and a “smaller reporting company” under the federal securities laws and will be subject to reduced disclosure and public reporting requirements. See “Summary—Implications of Being an Emerging Growth Company and a Smaller Reporting Company.”
Investing in shares of our Class A Common Stock or warrants involves risks that are described in the “Risk Factors” section beginning on page 9 of this prospectus.
Neither the U.S. Securities and Exchange Commission (the “SEC”) nor any state securities commission has approved or disapproved of the securities to be issued under this prospectus or determined if this prospectus is truthful or complete. Any representation to the contrary is a criminal offense.
The date of this prospectus is , 2022.
TABLE OF CONTENTS
Page | ||||
| ii | ||||
| ii | ||||
| iii | ||||
| iv | ||||
| 1 | ||||
| 9 | ||||
| 33 | ||||
| 34 | ||||
| 35 | ||||
| 47 | ||||
| 60 | ||||
| 65 | ||||
| 68 | ||||
| 71 | ||||
| 79 | ||||
| 84 | ||||
| 94 | ||||
| 96 | ||||
| 99 | ||||
| 99 | ||||
| 100 | ||||
| F-1 | ||||
You should rely only on the information contained in this prospectus or any amendment or supplement to this prospectus. This prospectus is an offer to sell only the securities offered hereby, but only under the circumstances and in jurisdictions where it is lawful to do so. Neither we nor the selling securityholders have authorized anyone to provide you with information different from that contained in this prospectus or any amendment or supplement to this prospectus. Neither we nor the selling securityholders take any responsibility for, or can provide any assurance as to the reliability of, any information other than the information in this prospectus or any amendment or supplement to this prospectus. The information in this prospectus or any amendment or supplement to this prospectus is accurate only as of its date, regardless of the time of delivery of this prospectus or any amendment or supplement to this prospectus, as applicable, or any sale of the securities offered by this prospectus. Our business, financial condition, results of operations and prospects may have changed since that date.
For Investors Outside the United States
i
ABOUT THIS PROSPECTUS
This prospectus is part of a registration statement on Form
S-1
that we filed with the SEC using the “shelf” registration process. Under the shelf registration process, the selling securityholders may, from time to time, sell the securities offered by them described in this prospectus through any means described in the section titled “Plan of Distribution.” More specific terms of any securities that the selling securityholders and their permitted transferees offer and sell may be provided in a prospectus supplement that describes, among other things, the specific amounts and prices of the securities being offered and the terms of the offering. This prospectus also relates to the issuance by us of shares of Class A Common Stock from time to time upon the occurrence of the events described in this prospectus.We may also provide a prospectus supplement or post-effective amendment to the registration statement of which this prospectus forms a part to add information to, or update or change information contained in, this prospectus. Any statement contained in this prospectus will be deemed to be modified or superseded for purposes of this prospectus to the extent that a statement contained in such prospectus supplement or post-effective amendment modifies or supersedes such statement. Any statement so modified will be deemed to constitute a part of this prospectus only as so modified, and any statement so superseded will be deemed not to constitute a part of this prospectus. You should read both this prospectus and any applicable prospectus supplement or post-effective amendment to the registration statement of which this prospectus forms a part together with the additional information to which we refer you in the section of this prospectus titled “Where You Can Find More Information.”
This prospectus contains summaries of certain provisions contained in some of the documents described herein, but reference is made to the actual documents for complete information. All of the summaries are qualified in their entirety by the actual documents. Copies of some of the documents referred to herein have been filed, will be filed, or will be incorporated by reference as exhibits to the registration statement of which this prospectus forms a part, and you may obtain copies of those documents as described below under “Where You Can Find More Information.”
BASIS OF PRESENTATION
Starry Group was incorporated on September 17, 2021 as a Delaware corporation and then wholly-owned subsidiary of Starry for the purpose of effecting the SPAC Merger. At the SPAC Merger Effective Time, FirstMark, a Delaware corporation formed on August 13, 2020 for the purpose of effecting a merger, capital stock exchange, asset acquisition, stock purchase, reorganization or similar business combination, merged with and into Starry Group, with Starry Group surviving the SPAC Merger as a publicly traded entity and the sole owner of Merger Sub. On the Acquisition Merger Effective Date, Merger Sub merged with and into Starry, with Starry surviving the Acquisition Merger as a wholly owned subsidiary of Starry Group.
References to a year refer to our fiscal year ended on December 31 of the specified year.
Certain monetary amounts, percentages and other figures included herein have been subject to rounding adjustments. Accordingly, figures shown as totals in certain tables and charts may not be the arithmetic aggregation of the figures that precede them, and figures expressed as percentages in the text may not total 100% or, as applicable, when aggregated may not be the arithmetic aggregation of the percentages that precede them.
Unless the context otherwise requires, references in this prospectus to “we,” “us,” “our,” “Starry Group” and the “Company” refer to the business of Starry, Inc., which became the business of Starry Group and its subsidiaries following the consummation of the Business Combination.
ii
MARKET AND INDUSTRY DATA
This prospectus includes, and any amendment or supplement to this prospectus may include, estimates regarding market and industry data and forecasts, which are based on our own estimates utilizing our management’s knowledge of and experience in, as well as information obtained from our subscribers, trade and business organizations, and other contacts in the market sectors in which we compete, and from statistical information obtained from publicly available information, industry publications and surveys, reports from government agencies and reports by market research firms. We confirm that, where such information is reproduced herein, such information has been accurately reproduced and that, so far as we are aware and are able to ascertain from information published by publicly available sources and other publications, no facts have been omitted that would render the reproduced information inaccurate or misleading. Industry publications, reports and other published data generally state that the information contained therein has been obtained from sources believed to be reliable, but we cannot assure you that the information contained in these reports, and therefore the information contained in this prospectus or any amendment or supplement to this prospectus that is derived therefrom, is accurate or complete. Our estimates of our market position may prove to be inaccurate because of the method by which we obtain some of the data for our estimates or because this information cannot always be verified with complete certainty due to the limits on the availability and reliability of raw data, the voluntary nature of the data gathering process and other limitations and uncertainties. As a result, although we believe our sources are reliable, we have not independently verified the information and cannot guarantee its accuracy and completeness.
iii
CAUTIONARY STATEMENT REGARDING FORWARD-LOOKING STATEMENTS
This prospectus includes forward-looking statements. We based these forward-looking statements on our current expectations and projections about future events. All statements, other than statements of present or historical fact included in this prospectus, regarding our future financial performance and our strategy, expansion plans, future operations, future operating results, estimated revenues, losses, projected costs, prospects, plans and objectives of our management are forward-looking statements. In some cases, you can identify forward- looking statements by terminology such as “may,” “should,” “could,” “would,” “expect,” “plan,” “anticipate,” “intend,” “believe,” “estimate,” “continue,” “project” or the negative of such terms or other similar expressions. These forward-looking statements are subject to known and unknown risks, uncertainties and assumptions that may cause actual results, levels of activity, performance, or achievements to be materially different from any future results, levels of activity, performance, or achievements expressed or implied by such forward-looking statements. Except as otherwise required by applicable law, we disclaim any duty to update any forward-looking statements, all of which are expressly qualified by the statements in this section, to reflect events or circumstances after the date of this prospectus. We caution you that these forward-looking statements are subject to numerous risks and uncertainties, most of which are difficult to predict and many of which are beyond our control. Many factors could cause actual future events to differ materially from the forward-looking statements in this prospectus, including, but not limited to:
| • | our ability to realize the benefits expected from the Business Combination; |
| • | our ability to maintain the listing of our Class A Common Stock and warrants on the NYSE; |
| • | the limited liquidity and trading of our securities; |
| • | the costs related to being a public company; |
| • | our ability to raise additional capital in the future and our ability to comply with restrictive covenants related to our existing long-term indebtedness or any new debt we incur; |
| • | the fact that we have incurred significant operating losses in the past and may not be able to achieve or maintain profitability in the future; |
| • | our limited operating history; |
| • | our ability to expand existing product and service offerings into new markets or to launch new product or service offerings; |
| • | our ability to effectively compete in the competitive broadband industry; |
| • | our ability to maintain or obtain rights to use licensed spectrum in markets in which we provide or intend to provide service and any declines in the value of our Federal Communications Commission (“FCC”) licenses; |
| • | our ability to maintain or obtain rights to provide our services in apartment buildings and to install our equipment on vertical assets; |
| • | the unavailability, reduction, elimination or adverse application of government subsidies, including through the Rural Digital Opportunity Fund and Emergency Broadband Benefit program; |
| • | the success of our marketing efforts and ability to attract customers in a cost-effective manner; |
| • | our ability to maintain and enhance our reputation and brand and differentiate our offerings from our competitors; |
| • | the success of our strategic relationships with third parties; |
| • | our dependence on a limited number of third-party suppliers, manufacturers and licensors to supply some of the hardware and software necessary to provide some of our services, and any disruption in our relationships with these parties; |
| • | any failure by suppliers to deliver components according to schedules, prices, quality and volumes that are acceptable to us; |
| • | our ability to comply with extensive governmental legislation and regulation and the cost of doing so; |
| • | any disruption or failure of, or defects in, the network and information systems on which our business relies; |
| • | the enforceability of our intellectual property, including our patents, and our potential infringement on the intellectual property rights of others, cybersecurity risks or potential breaches of data security; |
| • | our ability to maintain an effective system of internal controls over financial reporting; |
iv
| • | our ability to retain or recruit, or adapt to changes required in, our founders, executive officers, key personnel or directors; |
| • | the impact of the COVID-19 pandemic; and |
| • | other factors detailed under the section of this prospectus entitled “Risk Factors.” |
These forward-looking statements are based on information available as of the date of this prospectus and current expectations, forecasts and assumptions, and involve a number of judgments, risks and uncertainties. Accordingly, forward-looking statements should not be relied upon as representing our views as of any subsequent date, and we do not undertake any obligation to update forward-looking statements to reflect events or circumstances after the date they were made, whether as a result of new information, future events, or otherwise, except as may be required under applicable securities laws.
As a result of a number of known and unknown risks and uncertainties, our actual results or performance may be materially different from those expressed or implied by these forward-looking statements. You should not place undue reliance on these forward-looking statements.
v
SUMMARY
This summary highlights selected information from this prospectus and may not contain all of the information that is important to you in making an investment decision. Before investing in our securities, you should read this entire document carefully, including our financial statements and the related notes included in this prospectus and the information set forth under the headings “Risk Factors” and “Management’s Discussion and Analysis of Financial Condition and Results of Operations.” Some of the statements in this prospectus constitute forward-looking statements. See “Cautionary Statement Regarding Forward-Looking Statements.”
Overview
Our Business
We have developed a unique solution to provide last mile fixed broadband using a proprietary fixed wireless technology stack operating in licensed spectrum. We design and build our own fixed wireless equipment, cloud- based network control plane and billing and operations support systems. We then deploy this technology across a variety of markets to provide broadband service to end users for a fee. The integration of our own technology development and service delivery allows us to efficiently deploy new competitive broadband networks to connect communities across the country.
Since our inception, we have developed the technology, optimized the unit economics, acquired spectrum and deployed our network and acquired subscribers in Boston, Los Angeles, New York City, Denver, Washington, D.C. and Columbus.
The Business Combination
Merger Transactions
Pursuant to the Merger Agreement, the Business Combination was consummated in two steps: (i) at the SPAC Merger Effective Time, FirstMark merged with and into Starry Group, with Starry Group surviving the SPAC Merger as a publicly traded entity and the sole owner of Merger Sub, and (ii) on the Acquisition Merger Effective Date, Merger Sub merged with and into Starry, with Starry surviving the Acquisition Merger as a wholly owned subsidiary of Starry Group.
Immediately prior to the SPAC Merger Effective Time, pursuant to the Sponsor Support Agreement (as defined below), (a) each then-outstanding share of Class B Common Stock, par value $0.0001 per share, of FirstMark (the “FirstMark Class B Common Stock” and, together with the FirstMark Class A Common Stock, the “FirstMark Common Stock”) held by the Sponsor was exchanged for shares of FirstMark Class A Common Stock equal to (i) 9,230,000 divided by (ii) the Class A Exchange Ratio (as defined in the Merger Agreement) and (b) all 30,000 outstanding shares of FirstMark Class B Common Stock held by each independent director was exchanged and converted into the number of shares of FirstMark Class A Common Stock equal to: (i) 30,000 divided by (ii) the Class A Exchange Ratio (as defined in the Merger Agreement).
At the SPAC Merger Effective Time, pursuant to the SPAC Merger: (a) each then-outstanding share of Starry Group’s common stock, par value $0.01 per share, was redeemed for par value; (b) each unit of FirstMark (the “FirstMark Units”) that was outstanding immediately prior to the SPAC Merger Effective Time was separated into its underlying one share of FirstMark Class A Common Stock and
one-third
of one warrant to purchase FirstMark Class A Common Stock (a “FirstMark Warrant”); (c) each then-outstanding share of FirstMark Class A Common Stock (including, for the avoidance of doubt, shares of FirstMark Class A Common Stock issued upon the exchange of the FirstMark Class B Common Stock described in the preceding paragraph and the separation of the FirstMark Units described in (b) above, but excluding any shares of FirstMark Class A Common Stock subject to a proper exercise of appraisal rights under the Merger Agreement and applicable law) was canceled and converted into shares of Class A Common Stock equal to 1.2415 shares of Class A Common Stock per share of FirstMark Class A Common Stock; (d) each then-outstanding FirstMark Warrant (including, for the avoidance of doubt, FirstMark Warrants following the separation of FirstMark Units as described in clause (b)) was assumed and converted automatically into a warrant to purchase 1.2415 shares of Class A Common Stock, pursuant to the Warrant Agreement (as amended by that certain Warrant Assignment, Assumption and Amendment Agreement, entered into by and among us, FirstMark and Continental Stock Transfer & Trust Company, as warrant agent in connection with the closing of the SPAC Merger); and (e) each share of FirstMark Common Stock held by FirstMark or its subsidiaries as treasury stock was canceled for no payment or consideration.Immediately prior to the effective time of the Acquisition Merger (the “Acquisition Merger Effective Time”), (a) each then-outstanding share of Starry Preferred Stock (as defined below, and excluding the Starry Series Z Preferred Stock) converted automatically into a number of shares of common stock, par value $0.001 per share, of Starry (“Starry Common Stock”) at the then-effective conversion rate as calculated pursuant to the certificate of incorporation of Starry (the “Conversion”); and (b) each then-outstanding and unexercised warrant of Starry (the “Starry Warrants”) automatically was exercised in exchange for shares of Starry Common Stock pursuant to the terms of such Starry Warrant and was automatically canceled, extinguished and retired and cease to exist.
1
At the Acquisition Merger Effective Time, pursuant to the Acquisition Merger: (a) each then-outstanding share of Starry Common Stock, including shares of Starry Common Stock resulting from the Conversion, were canceled and automatically converted into the right to receive (i) with respect to Chaitanya Kanojia, the number of shares of Class X Common Stock, par value $0.0001 per share, of Starry Group (the “Class X Common Stock” and, together with the Class A Common Stock, the “Common Stock”) and (ii) with respect to any other persons who held Starry Common Stock, the number of shares of Class A Common Stock, in each case, equal to 0.1841 shares of Class A Common Stock for each share of Starry Common Stock (the “Acquisition Merger Exchange Ratio”); (b) each share of then-outstanding Starry Series Z Preferred Stock converted automatically into the right to receive shares of Class A Common Stock on abasis; (c) each then-outstanding and unexercised option exercisable for shares of Starry Common Stock (a “Starry Option”) was converted into an option exercisable for shares of Class A Common Stock (a “Starry Group Option”), on the same terms and conditions as were applicable to such Starry Option, based on the Acquisition Merger Exchange Ratio; and (d) each then-outstanding award of restricted stock units (“RSUs”) covering shares of Starry Common Stock (a “Starry RSU Award”) was converted into an award covering shares of Class A Common Stock (a “Starry Group RSU Award”), on the same terms and conditions as were applicable to such Starry RSU Award, based on the Acquisition Merger Exchange Ratio.
one-to-one
PIPE Investment and Series Z Investment
On October 6, 2021, concurrently with the execution of the Merger Agreement, Starry Group and FirstMark entered into the PIPE Subscription Agreements with the PIPE Investors, pursuant to which the PIPE Investors agreed to purchase 10,900,000 shares of Class A Common Stock (the “PIPE Shares”) for a price of $10.00 per share and an aggregate purchase price of $109.0 million. Also on October 6, 2021, concurrently with the execution of the Merger Agreement, Starry entered into the FirstMark Series Z Subscription Agreement with the FirstMark Series Z Investors, pursuant to which the FirstMark Series Z Investors agreed to purchase an aggregate of 2,100,000 shares of Starry Series Z Preferred Stock (the “FirstMark Series Z Shares”) for a price of $10.00 per share and an aggregate purchase price of $21.0 million. In connection with the consummation of the Business Combination, the PIPE Investors and the FirstMark Series Z Investors entered into (as applicable) a Waiver and Amendment No. 1 to the PIPE Subscription Agreements and Waiver and Amendment No. 1 to the Series Z Subscription Agreement, each dated on or around March 25, 2022, pursuant to which they agreed to waive, among other things, the Minimum Cash Condition (as defined in the Merger Agreement), certain conditions to closing of the Business Combination and certain other terms and conditions to each of the Merger Agreement, the PIPE Subscription Agreements and the FirstMark Series Z Subscription Agreement, including the closing of the offering of the Convertible Notes (as defined in the PIPE Subscription Agreements). The parties to the PIPE Subscription Agreements also agreed to reduce the purchase price per share of each PIPE Share from $10.00 per share to $7.50 per share and to increase the aggregate number of PIPE Shares issuable pursuant to the PIPE Subscription Agreements from 10,900,000 to 14,533,334. Similarly, the FirstMark Series Z Investors agreed to reduce the purchase price per share of each FirstMark Series Z Share from $10.00 per share to $7.50 per share and to increase the aggregate number of FirstMark Series Z Shares issuable pursuant to the FirstMark Series Z Subscription Agreement from 2,100,000 to 2,800,000.
On March 25, 2022, Starry and the Tiger Series Z Investor entered into the Tiger Series Z Subscription Agreement, agreeing to purchase 1,333,333 shares of Starry Series Z Preferred Stock (the “Tiger Series Z Shares”) for a price of $7.50 per share and a purchase price of approximately $10.0 million. The FirstMark Series Z Shares and the Tiger Series Z Shares are referred to collectively herein as the “Series Z Shares.”
On March 29, 2022, in conjunction with the Business Combination, the PIPE Investors purchased an aggregate of 14,533,334 shares of Class A Common Stock at a price of $7.50 per share and an aggregate purchase price of $109.0 million pursuant to the PIPE Subscription Agreements, and the Series Z Investors purchased an aggregate of 4,133,333 shares of Series Z Preferred Stock at a price of $7.50 per share and an aggregate purchase price of $31.0 million pursuant to the Series Z Subscription Agreements. At the Acquisition Merger Effective Time, each share of the then-outstanding Starry Series Z Preferred Stock converted automatically into the right to receive shares of Class A Common Stock on abasis.
one-to-one
On October 6, 2021, FirstMark entered into a Support Agreement (the “Sponsor Support Agreement”), by and among FirstMark, the holders of FirstMark Class B Common Stock (the “Initial Stockholders”), Starry Group and Starry. In connection with the consummation of the Business Combination, on March 28, 2022, the parties to the Sponsor Support Agreement entered into an amendment to the Sponsor Support Agreement, dated as of March 28, 2022 (the “Sponsor Support Agreement Amendment”), pursuant to which they agreed that, during the five-year period ending on March 29, 2027 (the “Earnout Period”), they will subject 4,128,113 shares of Class A Common Stock received pursuant to the SPAC Merger (the “Earnout Shares”), comprised of (a) one tranche of 2,224,167 shares subject to Earnout Trigger Event I and (b) two tranches of 951,973 shares of which (i) one tranche subject to Earnout Trigger Event II and (ii) one tranche subject to Earnout Trigger Event III, to potential forfeiture to Starry Group for no consideration until the occurrence of the applicable Earnout Triggering Event(s) (each as defined below). If one or more of the Earnout Triggering Events has not occurred by the end of the Earnout Period, the applicable tranche of Earnout Shares will be forfeited to Starry Group.
2
Immediately after giving effect to the Business Combination, there were 157,054,774 shares of Class A Common Stock outstanding, 9,268,335 shares of Class X Common Stock outstanding and 20,653,333 warrants to purchase 25,641,113 shares of Class A Common Stock outstanding. Upon the consummation of the Business Combination, the shares of FirstMark Class A Common Stock, the FirstMark Warrants and the FirstMark Units ceased trading on the NYSE, and the Class A Common Stock and public warrants began trading on the NYSE under the symbols “STRY” and “STRY WS,” respectively. Immediately upon the consummation of the Business Combination, Starry Group’s ownership was as follows (without taking into account any shares such persons may have purchased or sold in the open market prior to the consummation of the Business Combination):
| • | Starry’s former stockholders (“Starry Public Stockholders”) owned 126,660,943 shares of Class A Common Stock or approximately 80.6% of the shares of outstanding Class A Common Stock, which represented approximately 37.0% of the voting power of Starry Group (excluding, for the avoidance of doubt, shares of Class X Common Stock and shares of Class A Common Stock issued in connection with the PIPE Investment or the Series Z Investment, which are reflected in the second, fourth and fifth bullets below, respectively); |
| • | Chaitanya Kanojia owned 9,268,335 shares of Class X Common Stock, or 100% of the outstanding Class X Common Stock, and after taking into account all shares of Class A Common Stock beneficially owned by Mr. Kanojia, Mr. Kanojia beneficially owned approximately 13.8% of the outstanding shares of Common Stock representing approximately 58.1% of the voting power of Starry Group; |
| • | FirstMark’s former public stockholders (“FirstMark Public Stockholders”) owned 4,499,443 shares of Class A Common Stock, or approximately 2.9% of the outstanding shares of Class A Common Stock, which represented approximately 1.3% of the voting power of Starry Group (excluding the 422,108 shares of Class A Common Stock issued pursuant to the Non-Redemption Agreements); |
| • | the PIPE Investors owned 14,533,334 shares of Class A Common Stock, issued in the PIPE Investment, representing approximately 9.3% of the outstanding shares of Class A Common Stock, or approximately 4.2% of the voting power of Starry Group; |
| • | the Series Z Investors owned 4,133,333 shares of Class A Common Stock, issued in the Series Z Investment, representing approximately 2.6% of the outstanding shares of Class A Common Stock, or approximately 1.2% of the voting power of Starry Group; and |
| • | the Sponsor and the Initial Stockholders owned 6,805,613 shares of Class A Common Stock (including 4,128,113 Earnout Shares), or approximately 4.3% of the outstanding Class A Common Stock, which represented approximately 2.0% of the voting power of Starry Group. |
Summary Risk Factors
Our business is subject to numerous risks and uncertainties, including those highlighted in the section entitled “Risk Factors” immediately following this prospectus summary, that represent challenges that we face in connection with the successful implementation of our strategy and the growth of our business. In particular, the following considerations, among others, may offset our competitive strengths or have a negative effect on our business strategy, which could cause a decline in the price of shares of our Class A Common Stock or warrants and result in a loss of all or a portion of your investment:
| • | We have a history of losses, and may not achieve or maintain profitability in the future. |
| • | We have experienced rapid growth since inception, which may not be indicative of our future growth, and, if we continue to grow rapidly, we may not be able to manage our growth effectively. |
| • | Our limited operating history makes it difficult to evaluate our current business and future prospects. |
| • | Our financial projections may not prove accurate. |
| • | Our decision to expand existing product and service offerings into new markets or to launch new product or service offerings may consume significant financial and other resources and may not achieve the desired results. |
| • | We operate in a highly competitive business environment, which could materially adversely affect our business, financial condition, results of operations and liquidity. |
| • | If we do not maintain or obtain rights to use licensed spectrum in markets in which we provide or intend to provide service, we may be unable to operate in these markets, which could harm our business and our ability to execute our business strategy. |
| • | Our business is dependent on successfully maintaining or obtaining rights to provide our services in apartment buildings and to install our equipment on vertical assets. |
3
| • | The value of our spectrum licenses could decline, which could materially affect our ability to raise capital, and could have a material adverse effect on our business and results of operations. |
| • | The unavailability, reduction, elimination or adverse application of government subsidies, including through the Rural Digital Opportunity Fund and Emergency Broadband Benefit program, could have a material adverse effect on our business and results of operations. |
| • | Our business model and growth strategy depends on our marketing efforts and ability to attract customers in a cost-effective manner. |
| • | Our reputation, brand and ability to differentiate our offerings from our competitors is important to our success, and if we are not able to maintain and enhance our reputation and brand and differentiate our offerings from our competitors, our business, financial condition and results of operations may be adversely affected. |
| • | Our growth depends in part on the success of our strategic relationships with third parties. |
| • | A significant portion of our expenses are fixed, and we may not be able to adapt our cross structure to offset declines in revenue. |
| • | Our business is subject to extensive governmental legislation and regulation, which could adversely affect our business, increase our operational and administrative expenses and limit our revenues. |
| • | Increasing regulation of our internet-based products and services could adversely affect our ability to provide new products and services. |
| • | We rely on network and information systems for our operations and a disruption or failure of, or defects in, those systems may disrupt our operations, damage our reputation with customers and adversely affect our results of operations. |
| • | Cyber security risks, data loss or other breaches of our network security could materially harm our business and results of operations, and the processing, storage, use and disclosure of personal or sensitive information could give rise to liabilities and additional costs as a result of governmental regulation, litigation and conflicting legal requirements relating to personal privacy rights. |
| • | Our management has limited experience operating as a public company. |
| • | We have identified material weaknesses in our internal control over financial reporting and may identify additional material weaknesses in the future or fail to maintain an effective system of internal control over financial reporting, which may result in material misstatements of our consolidated financial statements or cause us to fail to meet our periodic reporting obligations. |
| • | We may need additional capital to pursue our business objectives and respond to business opportunities, challenges or unforeseen circumstances, and we cannot be sure that additional financing will be available. |
| • | For the year ended December 31, 2021, our independent registered public accounting firm included an explanatory paragraph relating to our ability to continue as a going concern in its report on our audited financial statements included elsewhere in this prospectus, and there can be no guarantee that we will continue as a going concern absent the ability to raise additional capital within the next 12 months. |
| • | The Starry Credit Agreement (as defined below) contains restrictive and financial covenants that may limit our operating flexibility. |
| • | Our co-founder and Chief Executive Officer controls a significant percentage of our voting power and is able to exert significant control over the direction of our business. |
| • | Because we are a “controlled company” within the meaning of the NYSE rules, our stockholders may not have certain corporate governance protections that are available to stockholders of companies that are not controlled companies. |
| • | Other risks and uncertainties described in this prospectus, including those under the section entitled “Risk Factors.” |
Corporate Information
Starry Group was incorporated on September 17, 2021 as a Delaware corporation and then wholly-owned subsidiary of Starry for the purpose of effecting the SPAC Merger. At the SPAC Merger Effective Time, Starry Group consummated the SPAC Merger, pursuant to which it became a publicly traded company. On the Acquisition Merger Effective Date, Starry Group consummated the Acquisition Merger and is the direct parent of Starry.
4
Our principal executive offices are located at 38 Chauncy Street, Suite 200, Boston, MA 02111 and our telephone number is (617)
861-8300.
Our website address is www.starry.com. Information contained on our website is not a part of this prospectus, and the inclusion of our website address in this prospectus is an inactive textual reference only.This prospectus contains references to trademarks and service marks belonging to other entities. Solely for convenience, trademarks and trade names referred to in this prospectus may appear without the
®
or TM symbols, but such references are not intended to indicate, in any way, that the applicable licensor will not assert, to the fullest extent under applicable law, its rights to these trademarks and trade names. We do not intend our use or display of other companies’ trade names, trademarks or service marks to imply a relationship with, or endorsement or sponsorship of it by, any other companies.Implications of Being an Emerging Growth Company and a Smaller Reporting Company
We qualify as an “emerging growth company” as defined in the Jumpstart Our Business Startups Act of 2012 (the “JOBS Act”). For so long as we remain an emerging growth company, we are permitted, and currently intend, to rely on the following provisions of the JOBS Act that contain exceptions from disclosure and other requirements that otherwise are applicable to public companies and file periodic reports with the SEC. These provisions include, but are not limited to:
| • | being permitted to present only two years of audited financial statements and selected financial data and only two years of related “Management’s Discussion and Analysis of Financial Condition and Results of Operations” in our periodic reports and registration statements, including this prospectus, subject to certain exceptions; |
| • | not being required to comply with the auditor attestation requirements of Section 404 of the Sarbanes-Oxley Act of 2002, as amended (the “Sarbanes-Oxley Act”); |
| • | reduced disclosure obligations regarding executive compensation in our periodic reports, proxy statements, and registration statements, including in this prospectus; |
| • | not being required to comply with any requirement that may be adopted by the Public Company Accounting Oversight Board (the “PCAOB”) regarding mandatory audit firm rotation or a supplement to the auditor’s report providing additional information about the audit and the financial statements; and |
| • | exemptions from the requirements of holding a nonbinding advisory vote on executive compensation and stockholder approval of any golden parachute payments not previously approved. |
We will remain an emerging growth company until the earliest to occur of:
| • | December 31, 2027 (the last day of the fiscal year that follows the fifth anniversary of the effectiveness of our Registration Statement on Form S-4 in connection with the Business Combination); |
| • | the last day of the fiscal year in which we have total annual gross revenue of at least $1.07 billion; |
| • | the date on which we are deemed to be a large accelerated filer, which means the market value of our common equity that is held by non-affiliates exceeds $700 million as of the end of the prior fiscal year’s second fiscal quarter; and |
| • | the date on which we have issued more than $1 billion in non-convertible debt securities during the prior three-year period. |
We have elected to take advantage of certain of the reduced disclosure obligations in this prospectus and may elect to take advantage of other reduced reporting requirements in our future filings with the SEC. As a result, the information that we provide to our securityholders may be different than what you might receive from other public reporting companies in which you hold equity interests.
We have elected to avail ourselves of the provision of the JOBS Act that permits emerging growth companies to take advantage of an extended transition period to comply with new or revised accounting standards applicable to public companies. As a result, we will not be subject to new or revised accounting standards at the same time as other public companies that are not emerging growth companies.
We are also a “smaller reporting company” as defined in Item 10(f)(1) of Regulation
S-K.
Smaller reporting companies may take advantage of certain reduced disclosure obligations, including, among other things, providing only two years of audited financial statements. We will remain a smaller reporting company until the last day of the fiscal year in which either (a)(i) the market value of the shares of our Class A Common Stock held bynon-affiliates
exceeds $250 million as of the prior June 30, and (ii) our annual revenue exceeded $100 million during such completed fiscal year or (b) the market value of the shares of our Class A Common Stock held bynon-affiliates
exceeds $700 million as of the prior June 30.5
For additional information, see the section titled “Risk Factors—Risks Related to Our Financial Reporting—We are currently an “emerging growth company” and a “smaller reporting company” under the Securities Act, and to the extent we have taken advantage of certain exemptions from disclosure requirements available to emerging growth companies or smaller reporting companies, this could make our securities less attractive to investors and may make it more difficult to compare our performance with other public companies.”
6
THE OFFERING
Issuer | Starry Group Holdings, Inc. | |
Securities Being Registered | We are registering the resale by the selling securityholders of an aggregate of 133,303,864 shares of Class A Common Stock and 6,853,333 private placement warrants. | |
| We are also registering (i) the issuance by us and resale of up to 2,271,414 shares of Class A Common Stock reserved for issuance upon the exercise of options to purchase Class A Common Stock, (ii) the issuance by us and resale of up to 423,380 shares of Class A Common Stock reserved for issuance upon the settlement of RSUs and (iii) the issuance by us of up to 25,641,113 shares of Class A Common Stock upon the exercise of outstanding warrants. | ||
Terms of the Offering | The selling securityholders will determine when and how they will dispose of any shares of Class A Common Stock or private placement warrants registered under this prospectus for resale. | |
We will issue shares of Class A Common Stock (i) upon exercise of options to purchase Class A Common Stock pursuant to the terms of the Starry Stock Plan and the applicable award agreement, (ii) upon settlement of RSUs pursuant to the terms of the Starry Stock Plan and the applicable award agreement and (iii) upon exercise of warrants pursuant to the terms of the Warrant Agreement. No fractional shares of Class A Common Stock will be issued upon exercise of the warrants. If, upon exercise, a holder would be entitled to receive a fractional interest in a share, we will round down to the nearest whole number the number of shares of Class A Common Stock to be issued to the holder. | ||
Securities Outstanding Before this Offering | • 157,054,931 shares of Class A Common Stock, representing approximately 45.9% of the combined voting power of all of our Common Stock; | |
• 9,268,335 shares of Class X Common Stock, representing approximately 54.1% of the voting power of all of our Common Stock; and • 20,653,333 warrants (including 6,853,333 private placement warrants), each exercisable for 1.2415 shares of Class A Common Stock at a price of $9.13 per 1.2415 shares, subject to adjustment as described under “Description of Capital Stock—Warrants—Public Warrants”. | ||
Securities Outstanding After this Offering | 194,659,173 shares of Class A Common Stock (assuming the exercise for cash of all warrants and outstanding stock-based awards covered by this registration statement and the conversion of all shares of Class X Common Stock into shares of Class A Common Stock). | |
Use of Proceeds | All of the shares of Class A Common Stock and private placement warrants offered by the selling securityholders will be sold by them for their respective accounts. We will not receive any of the proceeds from these sales. | |
| The selling securityholders will pay any underwriting fees, discounts, selling commissions, stock transfer taxes, and certain legal expenses incurred by such selling securityholders in disposing of their shares of Class A Common Stock and private placement warrants, and we will bear all other costs, fees, and expenses incurred in effecting the registration of such securities covered by this prospectus, including, without limitation, all registration and filing fees, NYSE listing fees, and fees and expenses of our counsel and our independent registered public accountants. | ||
We will receive any proceeds from the exercise of the warrants or stock options for cash, but not from the resale of the shares of Class A Common Stock issuable upon such exercise. Assuming the exercise of all outstanding warrants for cash, we would receive aggregate proceeds of approximately $188.6 million. There is no assurance that the warrants will be in the money prior to their expiration or that the warrant holders will exercise their warrants. The Sponsor and its permitted transferees have the option to exercise the private placement warrants on a cashless basis, and the public warrants are exercisable on a cashless basis under the circumstances specified in the Warrant Agreement. To the extent that any warrants are exercised on a cashless basis, the amount of cash we would receive from the exercise of the warrants will decrease. We believe that the likelihood that warrant holders will exercise their warrants, and therefore the amount of cash proceeds that we would receive, is dependent upon the market price of our Class A Common Stock. If the market price for our Class A Common Stock is less than the exercise price, we believe warrant holders will be unlikely to exercise the warrants. We intend to use the proceeds received from the exercise of the warrants or stock options, if any, for general corporate purposes, which may include capital expenditures, potential acquisitions, growth opportunities, strategic transactions and stock repurchases. However, we have not designated any specific uses and have no current agreement with respect to any acquisition or strategic transaction. See “Use of Proceeds.” | ||
7
Risk Factors | See “Risk Factors” beginning on page 9 and other information included in this prospectus for a discussion of factors you should carefully consider before deciding to invest in the securities being offered by this prospectus. | |
Trading Symbols | Our Class A Common Stock and public warrants are listed and traded on the NYSE under the symbols “STRY” and “STRY WS,” respectively. | |
In this prospectus, unless otherwise indicated, the number of shares of Class A Common Stock outstanding and the other information based thereon reflects 157,054,931 shares of Class A Common Stock outstanding as of May 20, 2022 and does not reflect:
| • | 25,641,113 shares of Class A Common Stock issuable upon exercise of outstanding warrants at an exercise price of $9.13 per 1.2415 shares, subject to adjustment as described under “Description of Capital Stock—Warrants—Public Warrants”; |
| • | 9,268,335 shares of Class A Common Stock issuable upon conversion of outstanding shares of Class X Common Stock; |
| • | 8,426,913 shares of Class A Common Stock reserved for issuance under the Starry Stock Plan; |
| • | 22,775,288 shares of Class A Common Stock reserved for issuance under the 2022 Incentive Award Plan (which number does not include a possible annual increase on January 1 of each year beginning in 2023 and ending in 2031 by an amount equal to up to 5.0% of the total number of shares of Common Stock outstanding on the final day of the immediately preceding calendar year); or |
| • | 4,555,058 shares of Class A Common Stock initially reserved for future issuance under the Starry Group Holdings, Inc. 2022 Employee Stock Purchase Plan (the “ESPP”) (which number does not include a possible annual increase on January 1 of each year beginning in 2023 and ending in 2031 by an amount equal to up to 1.0% of the total number of shares of common stock outstanding on the final day of the immediately preceding calendar year, up to a maximum of 45,550,580 shares). |
8
RISK FACTORS
An investment in our securities involves a high degree of risk. You should consider carefully the risks and uncertainties described below, together with all of the other information contained in this prospectus, before deciding to invest in our securities. If any of the following events occur, our business, financial condition and operating results may be materially adversely affected. In that event, the trading price of our securities could decline, and you could lose all or part of your investment. The risks and uncertainties described below are not the only ones we face. Additional risks and uncertainties that we are unaware of, or that we currently believe are not material, may also become important factors that adversely affect our business or results of operations.
Risks Related to Our Business and Industry
We have a history of losses, and we may not achieve or maintain profitability in the future.
We have experienced net losses in each year since our inception. We incurred net losses of $166.5 million and $125.1 million for the years ended December 31, 2021 and 2020, respectively. We had an accumulated deficit of $501.4 million and $334.8 million as of December 31, 2021 and 2020, respectively. We expect to continue to make future investments in developing and expanding our business. In particular, we expect to invest approximately $350 million to expand our network and acquire subscribers to drive revenue growth. In order to fund this investment, we may be required to raise additional equity or debt capital, which we may not be able to do on favorable terms or at all. These investments may not result in the projected increased revenue or growth in our business, which would impact our ability to turn EBITDA positive within the time frame we project or at all. If we fail to manage our losses or to grow our revenue sufficiently to keep pace with our investments and other expenses, our business will not become cash-flow positive in the time frame we project or at all, we may be required to raise additional funding and our business be harmed.
We have experienced rapid growth since inception, which may not be indicative of our future growth, and, if we continue to grow rapidly, we may not be able to manage our growth effectively.
We have experienced rapid growth and demand for our products since inception. We expect that, in the future, even if our revenue increases, our rate of growth may decline. In any event, we will not be able to grow as fast or at all if we do not, among other things:
| • | increase the number of customers using our service; |
| • | increase our market share within existing markets and expand into new markets; |
| • | expand our service offerings, including offering service to small and medium sized businesses; |
| • | increase our brand awareness; |
| • | retain our spectrum licenses; |
| • | retain adequate availability of financing sources if necessary; and |
| • | obtain any additional necessary capital to meet our business objectives. |
Furthermore, in order to preserve our market position, we will expand into new markets and launch new products and services in existing and new markets. Expanding into new markets may prove to be challenging as some markets may have very different characteristics than the markets in which we currently operate, and these different characteristics may be unanticipated or unknown to us. These differences may result in slower network deployment, poor network coverage performance, slower subscriber growth or slower subscriber penetration than we project.
Our limited operating history makes it difficult to evaluate our current business and future prospects.
Our business model and technology are still nascent compared to the business models of the large incumbents in the fixed U.S. broadband industry. We launched our first market in 2018 and do not have a long history operating as a commercial company. Our operating results are not predictable and our historical results may not be indicative of our future results. While there are several established and well-performing broadband providers, few peer companies with our model exist and none have yet established long-term track records at scale that might assist us in predicting whether our business model and strategy can be implemented and sustained over an extended period of time. It may be difficult for you to evaluate our potential future performance without the benefit of established long-term track records from companies implementing a similar business model. We may encounter unanticipated problems as we continue to refine our business model and technology and may be forced to make significant changes to our anticipated sales and revenue models to compete with our competitors’ offerings, which may adversely affect our results of operations and profitability.
9
Our financial projections may not prove accurate.
In connection with the Business Combination, we presented certain forecasted financial information for our business following the Business Combination. The forecasts were based on numerous potential variables identified and assumptions made by us at the time of preparation. Such variables and assumptions are inherently uncertain and many are beyond our control, and actual events and results may differ materially from what was projected. Important factors that may affect actual results and cause the forecasts to not be achieved include, but are not limited to, risks and uncertainties relating to our business (including our ability to achieve strategic goals, objectives and targets over applicable periods), industry performance, the competitive environment, changes in technology and general business and economic conditions. Various assumptions underlying the forecasts may prove to not have been, or may no longer be, accurate. The forecasts may not be realized, and actual results may be significantly higher or lower than projected in the forecasts. The forecasts also reflect assumptions as to certain business strategies or plans that are subject to change. As a result, such forecasts should not be relied on as “guidance” or otherwise predictive of actual future events, and actual results may differ materially from the forecasts.
Our decision to expand existing product and service offerings into new markets or to launch new product or service offerings may consume significant financial and other resources and may not achieve the desired results.
We regularly evaluate expanding our services into new markets or launching new product offerings in existing or new markets. Any expansion or new offering requires significant expenses and the time of our key personnel, particularly at the outset of the process. We typically experience increased losses in new markets as we invest to build our network and brand presence within those markets before we have any customers within those markets. Our plans to expand and deepen our market share in our existing markets and possibly expand into additional markets is subject to a variety of risks and challenges. These risks and challenges include execution, the varying economic and demographic conditions of each market, competition from national and regional providers of broadband services, our ability to obtain and retain new customers and pricing pressures. We cannot assure you that we will be able to build our network in a timely or cost-effective manner, efficiently acquire customers or achieve target subscriber penetration rates, better than or as well as in our more mature existing markets.
New markets and new product offerings may also subject us to new regulatory environments, which could increase our costs as we evaluate and implement compliance with new regulations. Notwithstanding the expenses and time devoted to expanding an existing product offering into a new market or launching a new product offering, we may fail to achieve the financial and market share goals associated with the expansion. If we cannot manage our expansion efforts efficiently, our market share gains could take longer than planned and our related costs could exceed our expectations. In addition, we could incur significant costs to seek to expand our market share, and still not succeed in attracting sufficient customers to offset such costs.
We operate in a highly competitive business environment which could materially adversely affect our business, financial condition, results of operations and liquidity.
We operate in a highly competitive, consumer-driven industry and we compete against providers that offer a variety of fixed broadband services, including cable, terrestrial fixed wireless service, DSL, fiber and fixed satellite. We also compete against providers of mobile broadband service to the extent that a consumer considers mobile broadband service a substitute for fixed broadband service. Our competitors include large national and regional providers of fixed broadband services such as AT&T, Comcast, Charter, CableOne, Verizon, CenturyLink, Frontier, TDS Cox, RCN and Altice, providers of mobile broadband services such as AT&T,
T-Mobile,
US Cellular and Verizon, and numerous small fixed broadband providers in local areas.Most incumbent broadband communications companies, which already have wired networks and an existing customer base and other operational functions in place, offer broadband over DSL, cable or FTTH/FTTP. These services may be offered at promotional prices comparable to or lower than our services. In addition, to the extent that these providers’ networks are more ubiquitously deployed, such as traditional telephone networks, they may be in a better position to offer internet services to consumers and businesses passed by their networks on a more economic or timely basis than we can, even if the services they offer are arguably inferior. They may also increasingly have the ability to offer a combination of video services, mobile services and telephone and internet services to their customers as a bundle, either directly or through
co-marketing
agreements with other service providers. As an internet-only company, we do not currently offer any bundled services that could compete with these offerings.10
Mobile broadband providers may be able to provide services that substitute for our fixed broadband service. Current and future fixed and mobile internet services, such as services provided on LTE and 5G networks (and variants), other unlicensed fixed wireless broadband networks and devices such as mobile hot spots, tablets and smartphones, and mobile wireless routers that connect to such devices, may also compete with our broadband services both for
in-premises
broadband service and mobile broadband. All major wireless carriers offer various kinds of unlimited data plans, which could, in some cases, become a substitute for the fixed broadband services we provide. In addition, the FCC is likely to continue to make additional radio frequency spectrum available for these wireless internet access services, which in time could expand the quality and reach of these services.In some instances, our competitors have easier access to financing, greater resources, greater operating capabilities and efficiencies of scale, stronger brand-name recognition, longstanding relationships with regulatory authorities and customers, and more customers. This provides these competitors with certain advantages in competing against us, including the ability to aggressively promote and price their services in markets in which we may compete. This competition creates pressure on our pricing and may affect our ability to add and retain customers, which in turn adversely affects our business, financial condition and results of operations.
Our competitive risks are heightened by the rapid technological change inherent in our business, evolving consumer preferences and the need to acquire, develop and adopt new technology to differentiate our products and services from those of our competitors, and to meet consumer demand. We may need to anticipate far in advance which technology we should use for the development of new products and services or the enhancement of existing products and services. The failure to accurately anticipate such changes may adversely affect our ability to attract and retain customers, which in turn could adversely affect our business, financial condition and results of operations.
Consolidation and cooperation in our industry may allow our competitors to acquire service capabilities or offer products that are not available to us or offer similar products and services at prices lower than ours.
New emerging technologies, including low earth orbit satellite, may impact a portion of our potential network expansion, to the extent such technologies come to fruition and are adopted in the marketplace.
If we do not maintain or obtain rights to use licensed spectrum in markets in which we provide or intend to provide service, we may be unable to operate in these markets, which could harm our business and our ability to execute our business strategy.
We offer our services using spectrum licensed by the FCC in the 24 GHz band and lower 37 GHz band. As a result, we depend on our ability to acquire and maintain sufficient rights to use spectrum in each of the markets in which we operate or intend to operate. While our future projections are based on spectrum for which we currently hold licensed rights, we may not be able to maintain the spectrum necessary to execute our business strategy, including the spectrum we hold rights to today. In addition, we have in the past and may continue to spend significant resources to acquire spectrum in additional or existing markets.
Using licensed spectrum, whether owned today or in the future or leased in the future poses additional risks to our business, including:
| • | our inability to satisfy build-out or service deployment requirements on which some of our spectrum licenses or leases are, or may be, conditioned, which may result in the loss of our rights to the spectrum subject to the requirements; |
| • | changes to regulations governing our spectrum rights that could adversely affect our ability to utilize the spectrum as required in our business; |
| • | our inability to use a portion of the spectrum we have acquired or leased or to acquire additional spectrum due to interference from licensed or unlicensed operators in the spectrum bands in which we have rights or in adjacent bands; |
| • | the refusal by the FCC to recognize our acquisition or lease of spectrum licenses from others or our investments in other license holders, to the extent we enter into future agreements to acquire or lease spectrum; |
| • | our inability to offer new services or to expand existing services to take advantage of new capabilities of our network resulting from advancements in technology due to regulations governing our spectrum rights; |
| • | our inability to obtain or lease more spectrum in the future due to the possible imposition of limits or caps on our spectrum holdings, which could prevent us from expanding our service in existing or new markets; |
11
| • | our inability to control or retain leased spectrum due to contractual disputes with, or the bankruptcy or other reorganization of, the license holders, or third parties; |
| • | the failure of the FCC to renew our spectrum licenses or those held by the parties from whom we lease spectrum as they expire; |
| • | our failure to obtain extensions or renewals of spectrum leases, or our inability to renegotiate those leases, on terms acceptable to us before they expire, which may result in the loss of spectrum we need to operate our network in the market covered by the spectrum leases; |
| • | increases in spectrum prices, because of increased competition for the limited supply of licensed spectrum in the United States, which could limit our ability to acquire new spectrum rights, and could in turn prevent us from expanding our service in existing or new markets; and |
| • | the invalidation of our authorization to use all or a significant portion of our spectrum, resulting in, among other things, impairment charges related to assets recorded for such spectrum. |
We operate using spectrum in the lower 37 GHz band in all of our current markets and have rights to use that spectrum band in other markets in which we intend to expand under an experimental license issued by the FCC while the FCC finalizes the regulations that will dictate the ultimate use of this spectrum band. This experimental license must be renewed by the FCC for us to continue to operate on the same basis in which we operate today. In the future, the FCC may not renew our experimental license for all or some of the markets in which we currently have rights to operate. The FCC may also adopt final regulations for this spectrum band that remove or limit our ability to continue to operate in this spectrum band. If the FCC does not renew our experimental license for some or all of our existing and expansion markets or adopts final regulations that adversely impacts our ability to operate in the lower 37 GHz band, and we are unable to acquire rights to use other spectrum in those markets, it would have a material adverse effect on our ability to continue to operate our business in those markets, our ability to grow our network and subscribers in those markets, and our results of operations and financial condition.
If we do not maintain or obtain rights to provide our services in apartment buildings, it will harm our business.
We enter into access agreements with owners of multi-dwelling properties pursuant to which the owner grants us permission to install our receiving equipment on the roof and provide services to residents in the property. In many instances, the owner may terminate the agreement on short notice. If an owner of a property terminates the access agreement or it expires and is not renewed, we would lose the ability to service customers in that building, which would negatively impact our business.
If we do not maintain or obtain rights to vertical asset and communications infrastructure used in the operation of our network, such as access to rooftops, towers, and fiber or wireless backhaul, it could have a material adverse effect on our business and results of operations.
We lease space on vertical assets like buildings and towers to attach our transmitting equipment. This transmitting equipment delivers our service wirelessly to properties in which we have customers. In the event that a lease for a vertical asset is terminated or expires at the end of the term, there is no guarantee that we will be able to find another vertical asset to continue servicing the properties currently served by the existing vertical asset. In this case, we would lose the ability to service some customers in the market, which would negatively impact our business.
Each unit of our transmitting equipment that serves customer premises is connected to fiber backhaul or fixed wireless backhaul, or both, which routes our network traffic back to a local internetis the network interface point, typically located in a data center, housing servers, routers, switches, and other networking equipment that enables connectivity between networks. These are the locations to which our network traffic in a region is routed and consolidated, and from where we connect with other networks to exchange data traffic, either through direct connections or through Internet exchange points. We require backhaul from our transmission sites, therefore, in order to provide access to the Internet to customers served by our transmission sites.
point-of
presence in the market. An internetpoint-of-presence
We generally design our transmitting sites to have diverse backhaul paths, which means that we typically have in place an alternative backhaul method for routing our network traffic if we lose access to fiber backhaul for any reason. Where we use fixed wireless backhaul, we build and operate the necessary equipment ourselves. However, at some transmitting sites where we use fiber backhaul, we may not have an alternative backhaul method in place. We generally contract with between two and four different third-party fiber providers in a market depending on the conditions in that market and the design of our network. In most markets, while we use multiple fiber providers, we lease the majority of our fiber from one provider. In the event that one of our fiber providers decided to no longer lease access to fiber to us and we rely on that fiber as the exclusive method for backhaul at a transmission site, we would be required to find an alternative fiber provider for backhaul to the affected transmission site. Because in most markets we lease the majority of our fiber from one provider, in the event that primary provider in a market decided to no longer lease access to fiber to us, the potential number of transmission sites impacted in the relevant market could be significant.
12
In some cases, the fiber providers from which we lease access to fiber are our competitors, such as AT&T, Comcast, Verizon and RCN. In some of our markets, such as Boston and Washington, D.C., the majority of fiber we lease is provided by our competitors. It is possible that in the future these competitors will decide not to continue to lease access to fiber to us. In that event, we would be required to find alternative fiber providers for backhaul.
While most markets in which we operate have alternative fiber providers, and we have the ability to use fixed wireless backhaul as an alternative backhaul solution, there is no guarantee that we will be able to come to terms with a new provider on terms that are as beneficial as our existing arrangements or at all, or that we would be able to build fixed wireless backhaul. In these events, we would no longer be able to operate the transmission site and would not be able to service our customers that are served by that transmission site. In the event that the terms with a new provider are not as beneficial as the terms of our existing fiber leases in the market, it would have an adverse effect on our financial results from that market. In addition, even if we were able to find another provider to replace an existing fiber provider or utilize fixed wireless backhaul, there is no guarantee that we would be able to redesign our network to utilize fiber from this new provider or deploy a fixed wireless backhaul in a timely manner, in which case our existing customers served by the affected transmission site would likely cancel service, which would have an adverse impact on our financial result from that market.
The value of our spectrum licenses could decline, which could materially affect our ability to raise capital, and could have a material adverse effect on our business and results of operations.
While spectrum license values have historically not declined, a future decline in the value of our 24 GHz band spectrum licenses could negatively impact our ability to raise capital both privately and in the public markets and could significantly reduce the value of our spectrum assets. The value of any or all of our spectrum licenses could decrease as a result of many factors, including:
| • | increases in supply of spectrum that provides similar functionality; |
| • | new technology in unlicensed bands that provides the same capability as our network; |
| • | a decrease in the demand for services offered with any of our spectrum licenses; |
| • | lower values placed on similar spectrum licenses in future FCC spectrum auctions; |
| • | regulatory limitations on the use, leases, transfer or sale of rights in any of our spectrum licenses; |
| • | changes to the licensing, service or technical rules to the spectrum bands covered by our spectrum licenses; or |
| • | bankruptcy or liquidation of any comparable companies. |
Many of these factors depend on circumstances beyond our control. The occurrence of any of these events could have a material adverse effect on our ability to generate revenues and on our business, prospects, results of operations and financial condition.
The unavailability, reduction, elimination or adverse application of government subsidies, including through the Rural Digital Opportunity Fund and Emergency Broadband Benefit program, could have a material adverse effect on our business and results of operations.
The FCC’s efforts in recent years to expand broadband access to unserved and underserved communities across the United States have included the provision of federal subsidies and other incentives to broadband providers. For example, in 2020, we participated in the FCC’s Rural Digital Opportunity Fund (“RDOF”) auction, which provides a federal subsidy for the support of high-speed fixed broadband and voice networks in unserved areas across the United States. In that auction, we won $268 million in funding, payable over 10 years, to provide gigabit fixed internet and voice services to unserved locations in nine states. As a winner in the auction, we had to file with the FCC a long-form application that includes information about our qualifications, funding and the network that we intend to use to meet our obligations to provide service to the locations for which we will receive subsidy payments. Our long-form application is currently pending before the FCC. The FCC may find all or part of our application insufficient, or we may in the future fail to meet the necessary service obligations on which the receipt of the subsidy is conditioned, which would result
13
in the loss of some or all of the subsidy that we won in the RDOF auction. In addition, even if we retain some or all of the subsidy that we won, the construction of the network that we will be required to build to meet our service obligations may significantly exceed our modeled costs that were the basis for our bidding in the auction, which would materially and adversely affect our financial condition and operating results.
In addition, we are a participant in the FCC’s Emergency Broadband Benefit (“EBB”) program, a program to help families and households struggling to afford internet service during the
COVID-19
pandemic. As a participant in EBB, we receive reimbursement from the federal government for up to $50 in subscriber fees per month per qualifying subscriber during the course of the program. These repayments could be delayed, the government may find that some or all of our qualifying subscribers no longer qualify, or the government may audit our participation and find deficiencies that could result in fines or other adverse outcomes. If that occurs, we may lose customers that rely on this program to pay for our service, which could have a material adverse effect on our growth, results of operations and financial condition. Because we intend to participate in future government subsidy and benefit programs, any reduction, elimination or discriminatory application of future government subsidies and economic incentives resulting from policy changes, the reduced need for such subsidies or other reasons such as our inability to satisfy the compliance requirements of the subsidy or benefit program, could materially and adversely affect the growth of expansion of the broadband market and our business, prospects, financial condition and operating results.Our business model and growth strategy depend on our marketing efforts and ability to attract customers in a cost-effective manner.
Our long-term success depends in part on our ability to continue to attract more customers in each of our markets to our service. Our marketing efforts may not succeed for a variety of reasons, including but not limited to, changes to search engine algorithms, ineffective campaigns across marketing channels and limited experience in certain marketing channels, like traditional media. External factors beyond our control may also affect the success of our marketing initiatives, such as filtering of our targeted communications by email servers, potential customers failing to respond to our marketing initiatives and competition from third parties. Any of these factors could reduce the number of customers choosing us as their internet provider.
Our business model relies on our ability to scale rapidly and to decrease incremental customer acquisition costs as we grow. If we are unable to recover our marketing costs or if our marketing campaigns are not successful or are terminated, it could have a material adverse effect on our growth, results of operations and financial condition.
Our reputation, brand and ability to differentiate ourselves from our competitors is important to our success, and if we are not able to maintain and enhance our reputation and brand and differentiate ourselves from our competitors, our business, financial condition and results of operations may be adversely affected.
Maintaining a positive reputation and brand image are important factors impacting our ability to sell our products and services. The speed at which negative publicity is disseminated has increased dramatically through the use of electronic communication, including social media, websites and blogs. Our success in maintaining our brand image depends on our ability to adapt to this rapidly changing media environment. Adverse publicity or negative commentary in any media outlet could damage our reputation and reduce the demand for our products and services, which would adversely affect our business. Our reputation or brand image could be adversely impacted by negative publicity, commentary or communications (whether or not valid), particularly if we are unable to maintain service levels expected by our customers or to timely and adequately respond to network failures that negatively impact our customers’ ability to access the internet. In addition, our reputation and brand image could be further adversely impacted by: our failure to maintain high ethical and social practices in all of our operations and activities; our failure to be perceived as appropriately addressing matters of social responsibility; our use of social media; or public perception of statements or positions made or taken by us, including our executives and associates.
We rely on the experience and expertise of our senior management team, key technical employees and other highly skilled personnel and the failure to retain, motivate or integrate any of these individuals could have an adverse effect on our business, financial condition or results of operation.
Our operational results have depended, and our future results will depend, upon the retention and continued performance of our management team, in particular Chaitanya Kanojia, one of our
co-founders
and our Chief Executive Officer. The competitive environment for management talent in the broadband communications industry could adversely impact our ability to retain and hire new key employees for management positions. The loss of the services of key members of management and the inability or delay in hiring new key employees could adversely affect our ability to manage our business and our future operational and financial results.14
Our business is concentrated in certain geographic markets. Exposure to local economies, regional downturns or severe weather or catastrophic occurrences or other disruptions or events could have a material adverse effect on our business and results of operations.
Today, we operate in six markets across the United States. Local and regional conditions in these markets may differ significantly from prevailing conditions in the United States or other parts of the country. As a result, our business is currently more susceptible to regional conditions than the operations of more geographically diversified competitors, and we are vulnerable to economic downturns in the markets in which we operate. Any events or circumstances that negatively affect these areas could materially adversely affect our revenues and profitability.
We depend on a limited number of third-party suppliers, manufacturers and licensors to supply some of the hardware and software necessary to provide some of our services, and any disruption in our relationships with these parties could have a material adverse effect on our business and results of operations.
We depend on a limited number of third-party service providers, suppliers and licensors to supply some of the services, hardware, software and operational support necessary to provide some of our services. Some of our hardware, software and operational support vendors, and service providers represent our sole source of supply or have, either through contract or as a result of intellectual property rights, a position of some exclusivity. If any of these parties breach or terminate or elect not to renew their agreements with us or otherwise fail to perform their obligations in a timely manner, demand exceeds these vendors’ capacity, tariffs are imposed that impact vendors’ ability to perform their obligations or significantly increase the amount we pay, they experience operating or financial difficulties, they significantly increase the amount we are required to pay for necessary products or services, or they cease production of any necessary product due to lack of demand, profitability or a change in ownership or are otherwise unable to provide the equipment or services we need in a timely manner, at our specifications and at reasonable prices, our ability to provide some services might be materially adversely affected, or the need to procure or develop alternative sources of the affected materials or services might interrupt or delay our ability to serve our customers. In addition, the existence of only a limited number of vendors of key technologies can lead to less product innovation and higher costs. These events could materially and adversely affect our ability to retain and attract customers and our operations, business, financial results and financial condition.
Our growth depends in part on the success of our strategic relationships with third parties.
We have certain strategic relationships and intend to establish additional strategic relationships in the future. in connection with the expansion of our business. In 2020, we entered into a commercial arrangement with AEP Ventures, LLC (“AEPV”), a wholly-owned subsidiary of American Electric Power Company, Inc., a major investor-owned electric utility in the United States, to deploy our network in Columbus, Ohio. Under our arrangement, AEPV absorbs the capital expenditures necessary to construct and maintain our coverage network and the capital expenditures for customer installations, while we operate the network, market our service, acquire subscribers and manage subscriber relationships. In exchange for this collaborative approach, we pay AEPV a portion of the revenue we receive from customers in the Columbus market. Under our arrangement, AEPV has the ability to terminate our agreement after a period of time for any reason. In the event AEPV terminates our arrangement, our ability to continue to expand our business the Columbus market and other markets in Ohio may be adversely impacted. Moreover, our ability to develop similar relationship with other electric utilities may be harmed.
Our ability to control our expenses and grow our business in a cost-effective manner depends in part on our ability to partner with electric utilities or other new strategic partners to build out our network in new markets.
We intend to pursue strategic relationships with electric utilities and other new strategic partners to help us build out our network in certain of the markets in which we intend to expand. We are seeking to structure these relationships to be similar to our arrangement with AEPV, which means that we would seek to have our partners absorb the capital expenditures necessary to construct and maintain our coverage network and the capital expenditures for customer installations in the relevant markets. We would in turn operate the network, market our service, acquire subscribers and manage subscriber relationships. If we are not able to partner with electric utilities or other new strategic partners to build out our network in this way, our capital expenditures will be significantly higher as we expand because we will incur some or all of the expenses to construct our coverage network and install customers in our new markets, which would have a material adverse effect on our results of operations and financial condition. In addition, if our expenses are higher than we expect, we may be required to reduce the number of new markets into which we expand and/or raise new capital to fund our planned expansion into new markets, which will have a material adverse effect on our growth, results of operations and financial condition.
15
Our suppliers may fail to deliver components according to schedules, prices, quality and volumes that are acceptable to us, or we may be unable to manage these components effectively.
Our equipment contain hundreds of parts that we purchase globally from suppliers, some of which are single-source direct suppliers, generally without long-term supply agreements. This exposes us to multiple potential sources of component shortages. Unexpected changes in business conditions, materials pricing, labor issues, wars, governmental changes, tariffs, natural disasters, health epidemics such as the global
COVID-19
pandemic, trade and shipping disruptions and other factors beyond our or our suppliers’ control could also affect these suppliers’ ability to deliver components to us or to remain solvent and operational. For example, a global shortage of microchips has been reported since early 2021, which has forced us in some instances to redesign certain of our equipment to omit the chips that we cannot source cost effectively. Other impacts of this microchip shortage are as yet unknown. The unavailability of any component or supplier could result in production delays, idle manufacturing facilities, product design changes and loss of access to important technology and tools for producing and supporting our equipment. Moreover, significant increases in our production or product design changes by us have required and may in the future require us to procure additional components in a short amount of time. Our suppliers may not be willing or able to sustainably meet our timelines or our cost, quality and volume needs, or to do so may cost us more, which may require us to replace them with other sources. While we believe that we will be able to secure additional or alternate sources or develop our own replacements for most of our components, there is no assurance that we will be able to do so quickly or at all. Additionally, we may be unsuccessful in our efforts to negotiate with existing suppliers to obtain cost reductions and avoid unfavorable changes to terms, source less expensive suppliers for certain parts and redesign certain parts to make them less expensive to produce. Any of these occurrences would harm our business, prospects, financial condition and operating results.As the scale of our equipment production increases, we will also need to accurately forecast, purchase, warehouse and transport components to our manufacturing facilities. If we are unable to accurately match the timing and quantities of component purchases to our actual needs or successfully implement inventory management and other systems to accommodate the increased complexity in our supply chain and parts management, we may incur unexpected production disruption, storage, transportation and
write-off
costs, which would harm our business and operating results.In 2021, we entered into a commercial arrangement with Quanta, a leading specialized contracting services company with one of the largest skilled labor forces in North America. We intend to utilize Quanta as our construction partner in certain markets, either to build all or a portion of the network in those markets directly or to project manage the network construction. To date, we have only utilized Quanta in the Columbus market. As a result, we do not know whether we will achieve some or all of the benefits of leveraging Quanta’s expertise in our future market expansion. If our arrangement with Quanta does not yield the benefits that we anticipate, it could negatively impact our ability to expand our services to new markets in a cost-effective and efficient manner, which could have a material adverse effect on our growth, results of operations and financial condition.
If we are unsuccessful in maintaining successful relationships with AEPV, Quanta or any of our other strategic commercial partners, or if we are unable to develop similar relationship with new strategic commercial partners, our ability to grow our existing business, expand to new markets or to grow our revenues could be impaired and our operating results may suffer. Even if we are successful, we cannot assure you that these relationships will result in increased customer usage of our services or increased revenues.
Our exposure to the economic conditions of our current and potential customers, vendors and third parties could adversely affect our cash flow, results of operations and financial condition.
We are exposed to risks associated with the economic conditions of our current and potential customers, the potential financial instability of our customers and their financial ability to pay for our service. If there were a general economic downturn, we may experience increased cancelations or
non-payment
by our customers. In addition, our ability to gain new customers is dependent to some extent on growth in occupied housing in our service areas, which is influenced by both national and local economic conditions. These events may adversely affect our cash flow, results of operations and financial condition if a downturn were to occur.In addition, we are susceptible to risks associated with the potential financial instability of the vendors and third parties on which we rely to provide products and services or to which we outsource certain functions. The same economic conditions that may affect our customers, as well as volatility and disruption in the capital and credit markets, also could adversely affect vendors and third parties and lead to significant increases in prices, reduction in output or the bankruptcy of our vendors or third parties upon which we rely. Any interruption in the services provided by our vendors or by third parties could adversely affect our cash flow, results of operation and financial condition.
16
A significant portion of our costs and expenses are fixed, and we may not be able to adapt our cost structure to offset declines in our revenue.
A significant portion of our expenses are fixed and do not vary proportionately with fluctuations in revenues. In markets in which we provide our service we lease space on vertical assets like buildings and towers to attach our operating equipment under long-term leases that, with very limited exceptions, do not contain early termination provisions. Our leases generally provide for fixed monthly payments. In addition, to provide our service we lease access to fiber to connect our equipment to the internet. These leases require us to pay for access to the leased fiber regardless of whether we use the fiber or not. As a result, if we do not have sufficient customers in a market, our fixed costs in a market may exceed our revenue in that market.
International expansion of our business would expose us to business, regulatory, political, operational, financial and economic risks associated with doing business outside of the United States.
Our financial and operational projections do not anticipate international expansion. However, if we do expand internationally, we will become subject to the laws and regulations of the foreign jurisdictions in which we operate. The varying laws and rapidly changing regulations may impact our operations and ability to ensure compliance. Failure by us to comply with the evolving regulatory framework in any jurisdiction could have a material adverse effect on our business, financial condition and results of operations.
Seasonality may cause fluctuations in our sales and results of operations.
Our business is subject to some seasonal and cyclical variations. Our results are impacted by the velocity of residential moving, and there may be seasonality of such velocity for certain market segments, including college students living in off campus housing. Our capital expenditures and working capital may also be subject to seasonality based on regional weather and natural events that may impact our ability to construct the network in certain circumstances.
The ongoing
COVID-19
pandemic could materially affect our financial condition and results of operations.COVID-19
and measures to prevent its spread, may have a material adverse impact on our business, financial condition and results of operations. The severity and timing of the impact will depend on a number of factors, including the level and rapidity of infection, duration of containment measures, changes in consumer spending patterns, measures imposed or taken by governmental authorities in response to the pandemic, macroeconomic conditions in our markets and negative effects on the financial condition of our customers.Under difficult economic conditions, including prolonged unemployment and employment furloughs, demand for our products and services could decline and some customers may be unable or unwilling to pay for our products and services, especially when or if not otherwise offset by federal government support. The occupancy rates in some apartment buildings may decline significantly, particularly in buildings where the population has an alternative housing location such as a second home or parental housing. Additionally, in order to prioritize the demands of the business, we may delay certain capital investments or in other new initiatives, products or services, which may adversely affect our business in the future. If these events occur and were to continue, our revenue may be reduced materially which could result in reduced operating margins and a reduction in cash flows.
Governmental and
non-governmental
initiatives to reduce the transmission ofCOVID-19,
such as the imposition of restrictions on work and public gatherings and the promotion of social distancing, along with new government service, collection, have impacted and could continue to impact our operations and financial results. Our suppliers and vendors also may be affected by such measures in their ability to provide products and services to us and these measures could also make it more difficult for us to serve our customers. During 2019 and 2020, some vertical asset owners implemented restrictions on our ability to enter their buildings to perform construction work to install our equipment on their premises in an attempt to limit the transmission ofCOVID-19.
Similarly, some owners and property managers of apartment buildings implemented restrictions on our ability to enter their buildings to market our service to residents of the buildings. If these restrictions are implemented in the future, our network deployment, network coverage, subscriber growth and subscriber penetration could be lower than we project.Also, the impact that the
COVID-19
pandemic may have on our business, financial condition and results of operations could exacerbate the other risks identified in this section.17
We rely on network and information systems and other technology, and a disruption or failure of such networks, systems or technology as a result of cybersecurity incidents, as well as outages, natural disasters (including extreme weather), terrorist attacks, accidental releases of information or similar events, may disrupt our business.
Physical and electronic networks and information systems and other technologies are critical to our operating activities, both to internal uses and in supplying services to our customers. Network or information system shutdowns or other service disruptions caused by cyber-attacks, such as distributed denial of service attacks, ransomware, dissemination of malware and other malicious activity, pose increasing risks. Both unsuccessful and successful cyber-attacks on companies, including ours, have continued to increase in frequency, scope and potential harm in recent years and, because the techniques used in such attacks have become more sophisticated and change frequently, we may be unable to anticipate these techniques or implement adequate preventative measures. From time to time, third parties make malicious attempts to access our network or the networks of third-party vendors we use. Cyber-attacks could result in an unauthorized release of information, degradation to our network and information systems or disruption to our services, all of which could adversely affect our reputation and results of operations.
Our network and information systems are also vulnerable to damage or interruption from power outages, natural disasters (including extreme weather arising from short-term weather patterns or any long-term changes), pandemics, terrorist attacks and similar events, and the individuals responsible for such systems may also be imperiled by certain such events. Any of these events could have an adverse impact on us or our customers in the future, including degradation of service, service disruption, excessive call volume to call centers and damage to our or our customers’ equipment and data. Large expenditures may be necessary to repair or replace damaged property, networks or information systems or to protect them from similar events in the future.
Risks Related to Government Regulation and Litigation
Our business is subject to extensive governmental legislation and regulation, which could adversely affect our business, increase our operational and administrative expenses and limit our revenues.
Regulation of the broadband industry can increase broadband providers’ operational and administrative expenses and limit their revenues. Broadband providers are subject to numerous laws and regulations including those covering net neutrality and transparency, data protection and customer and employee privacy, and infrastructure siting and permitting.
Many aspects of these regulations are currently the subject of judicial proceedings and administrative or legislative proposals. There are also efforts to amend or expand the federal, state and local regulation of broadband, which may compound the regulatory risks we already face, and proposals that might make it easier for our employees to unionize. The Permanent Internet Tax Freedom Act prohibits many taxes on internet access service, but certain states and localities are considering new taxes and fees on cable, broadband and telecommunications services that could increase operating expenses. Certain states are also considering adopting energy efficiency regulations governing the operation of equipment that we use, which could constrain innovation. Congress periodically considers whether to rewrite the entire Communications Act to account for changes in the communications marketplace or to adopt more focused changes. Congress has in the past considered, and continues to consider, additional regulations on broadband providers to address specific consumer or customer issues. In response to recent data breaches and increasing concerns regarding the protection of consumers’ personal information, Congress, states and regulatory agencies are considering the adoption of new privacy and data security laws and regulations that could result in additional privacy, as well as network and information security, requirements for our business. These new laws, as well as existing legal and regulatory obligations, could require significant expenditures.
As a winner in the RDOF auction, we have a long form application currently pending before the FCC. The FCC may deny the application in whole or in part, which will reduce the amount of regulatory revenue we project over the next decade. In addition, if the long-form application is granted, we will be subject to significant state and federal regulations governing the construction of our required network and the services that we must offer; there is a risk that these rules and requirements may change, and a risk that we fail to construct the required network within the required time frames.
Increasing regulation of our internet-based products and services could adversely affect our ability to provide new products and services.
On February 26, 2015, the FCC adopted a new “net neutrality” or open internet order (the “2015 Order”) that: (1) reclassified broadband internet access service from an information service to a Title II common carrier service, (2) applied certain existing Title II provisions and associated regulations to broadband internet access services; (3) forbore from applying a range of other existing Title II provisions and associated regulations, but to varying degrees indicated that this forbearance may be only temporary and (4) issued new rules expanding disclosure requirements and prohibiting blocking, throttling, paid prioritization and unreasonable interference or disadvantage with the ability of end users and edge providers to reach each other. The 2015 Order also subjected broadband providers’ internet traffic exchange rates and practices to potential FCC oversight and created a mechanism for third parties to file complaints regarding these matters. While we strive to comply with the measures adopted in the 2015 Order, to the extent they are still applicable or are reintroduced in the future, the 2015 Order could have had a material adverse impact on our business by limiting our ability to
18
manage our systems beyond what we do today. In December 2017, the FCC adopted an order (the “2017 Order”) that in large part reversed the 2015 Order and reestablished the “information service” classification for broadband services. The 2017 Order was affirmed in part on appeal in October 2019 insofar as it classified broadband internet access services as information services subject to lesser federal regulation. However, the 2017 Order was also vacated in part on appeal insofar as it preempted states from subjecting broadband internet access services to any requirements more stringent than the federal requirements. As a result, the precise extent to which state rules may impose such requirements on broadband internet access service providers is not fully settled. Additionally, Congress and some states are considering legislation that may codify “net neutrality” rules, which could include prohibitions on blocking, throttling and prioritizing internet traffic. A number of states, including California, have adopted legislation and/or executive orders that apply “net neutrality” rules to internet service providers. The California legislation is currently being challenged in court. Additionally, the FCC may revisit the appropriate regulatory classification of broadband in 2022.
While regulatory reclassification by itself would not materially harm our ability to provide broadband service, it may restrict our unplanned ability to enter new market segments or offer new services that may be permitted today.
Offering telephone services will subject us to additional federal and state regulatory burdens, causing us to incur additional costs, and changes may require us to modify existing services, potentially increase our costs or prices we charge customers and otherwise harm our business.
We will offer interconnected Voice over Internet Protocol (“VoIP”) telephone services over our broadband network through a third party. The FCC has ruled that competitive telephone companies that support VoIP services, such as those that we will offer to our customers, are entitled to interconnect with incumbent providers of traditional telecommunications services, which ensures that our VoIP services can operate in the market. However, the scope of these interconnection rights is being reviewed in a current FCC proceeding, which may affect our ability to compete in the provision of telephony services or result in additional costs.
The FCC has already extended certain traditional telecommunications requirements, such as
E-911,
Universal Service Fund (“USF”) contributions, Communications Assistance for Law Enforcement Act (“CALEA”) compliance, measures to protect Customer Proprietary Network Information, certain levels of access users with disabilities, number porting, batteryback-up,
network outage reporting, rural call completion reporting, illegal robocall mitigation and other regulatory requirements. If additional telecommunications regulations are applied to our VoIP service, it could cause us to incur additional costs and may otherwise materially adversely impact our operations with respect to our VoIP service. Expanding our offering of these services may require us to obtain certain authorizations, including federal and state authorizations. We may not be able to obtain such authorizations in a timely manner, or conditions could be imposed upon such authorizations that may not be favorable to us. Furthermore, state regulations and federal regulations may require us to contribute to state universal service and related programs, payE-911
surcharges and pay other surcharges and fees that fund various programs. We may pass USF fees,E-911
fees and Telecommunications Relay Services and other surcharges through to our customers, which may result in our subscriptions becoming more expensive or require that we absorb these costs. Furthermore, in the future, state public utility commissions may expand their jurisdiction over interconnected VoIP services to regulate the rates that we may charge, which may materially impact our ability to economically provide VoIP service.The failure of our platform and products to comply, or delays in compliance, with various existing and evolving regulations could delay or interrupt our introduction of new products, subject us to fines or other imposed penalties, or harm our reputation, any of which would have a material adverse effect on our business, financial condition or operating results.
We may be materially adversely affected by regulatory, legal and economic changes relating to our physical facilities.
Our systems depend on physical facilities, including transmitting equipment that we install on vertical assets and transceiving equipment that we install on customer premises. The placement of the transmitting equipment is subject to federal, state and local regulations. In some cases, portions of our physical facilities occupy publicand are subject to local ordinances and governmental regulations. Other portions occupy private property under express or implied easements. No assurances can be given that we will be able to maintain and use our facilities in their current locations and at their current costs. Changes in governmental regulations or changes in these relationships could have a material adverse effect on our business and our results of operations.
rights-of-way
We may be liable for the material that content providers distribute over our networks.
The law in most cases limits the liability of private network operators for information carried on, stored on or disseminated through their networks. However, these limitations on liability are subject to certain exceptions and the contours of those exceptions are not fully settled. Among other things, the limitation of copyright liability for network operators with respect to materials transmitted over their networks is conditioned upon the network operators’ terminating the accounts of repeat infringers in certain
19
circumstances, and the law is unsettled as to the circumstances in which such termination is required to maintain the operator’s limitation of liability. As such, we could be exposed to legal claims relating to content disseminated on our networks and/or asserting that we are not eligible for statutory limitations on liability for network operators with respect to such content. Claims could involve matters such as defamation, invasion of privacy or copyright infringement. If we need to take costly measures to reduce our exposure to these risks or are required to defend ourselves against such claims, our business, reputation, financial condition and results of operations could be materially adversely affected.
Unfavorable outcomes in legal proceedings in which we may be involved may adversely affect our business and operating results.
We may become involved in legal proceedings such as intellectual property, consumer, employment, contractual and other litigation that may arise from time to time in the course of our business. We may also be affected by legal proceedings between third parties (such as challenges to spectrum auctions, subsidy programs or intellectual property disputes between third parties). Litigation is inherently unpredictable, and the outcome of some of these proceedings and other contingencies could require us to take or refrain from taking actions which could adversely impact our business or could result in excessive verdicts. Additionally, involvement in these lawsuits and related inquiries and other proceedings may involve significant expense, divert management’s attention and resources from other matters and negatively affect our reputation.
Unfavorable legislative outcomes may adversely affect our industry, our business and our operating results.
Generally as a new entrant competitive provider, legislative outcomes are likely to have a positive or neutral impact, however, there may be circumstances where legislative outcomes at the federal or state level may adversely affect our business or operating results. For example, while unlikely, a federal law that requires the regulation of our rates. Legislation that provides federal or state subsidies for new broadband networks could adversely affect our business to the extent we do not capture such subsidies and they are instead awarded to a competing provider for an area in which we are, or will be, operating a portion of our network.
Risks Related to Information Technology, Cybersecurity and Intellectual Property
We rely on network and information systems for our operations and a disruption or failure of, or defects in, those systems may disrupt our operations, damage our reputation with customers and adversely affect our results of operations.
Network and information systems are essential to our ability to conduct our business and deliver our services to our customers. While we, and our vendors, have in place multiple security systems designed to protect against intentional or unintentional disruption, failure, misappropriation or corruption of our network and information systems, there can be no assurance that our efforts, or our vendors’ efforts, to protect our network and information systems will prevent any of the problems identified above. A problem of this type might be caused by events such as computer hacking, computer viruses, worms and other destructive or disruptive software, “cyber-attacks,” phishing attacks and other malicious activity, defects in the hardware and software comprising our network and information systems, as well as natural disasters, power outages, terrorist attacks and similar events. Such events could have an adverse impact on us and our customers, including degradation of service, service disruption, excessive call volume to call centers, theft and damage to our plant, equipment and data, costs associated with remediation, notification and potential damages to third parties affected by such malicious activities. Operational or business delays may result from the disruption of network or information systems and the subsequent remediation activities. Moreover, these events may create negative publicity resulting in reputation or brand damage with customers and our results of operations could suffer.
We also use certain vendors to supply some of the hardware, software and support of our network, some of which have been customized or altered to fit our business needs. Certain of these vendors and suppliers may have leverage over us considering that there are limited suppliers of certain products and services, or that there is a long lead time and/or significant expense required to transition to another provider. In addition, some of these vendors and suppliers do not have a long operating history or may not be able to continue to supply the equipment and services we desire. Some of our hardware, software and operational support vendors and some of our service providers represent our sole source of supply or have, either through contract or as a result of intellectual property rights, a position of some exclusivity. In addition, because of the pace at which technological innovations occur in our industry, we may not be able to obtain access to the latest technology on reasonable terms. Any delays or the termination or disruption in these relationships as a result of contractual disagreements, operational or financial failures on the part of our vendors and suppliers, or other adverse events that prevent such vendors and suppliers from providing the equipment or services we need, with the level of quality we require, in a timely manner and at reasonable prices, could result in significant costs to us and have a negative effect on our ability to provide services and rollout advanced services. Our ability to replace such vendors and suppliers may be limited and, as a result, our business, financial condition, results of operations and liquidity could be materially adversely affected.
20
Cyber security risks, data loss or other breaches of our network security could materially harm our business and results of operations, and the processing, storage, use and disclosure of personal or sensitive information could give rise to liabilities and additional costs as a result of governmental regulation, litigation and conflicting legal requirements relating to personal privacy rights.
Network and information systems technologies are critical to our operating activities, both for our internal uses, such as network management and supplying services to our customers, including customer service operations and programming delivery. Network or information system shutdowns or other service disruptions caused by events such as computer hacking, phishing, dissemination of computer viruses, worms and other destructive or disruptive software, “cyber-attacks,” process breakdowns, denial of service attacks and other malicious activity pose increasing risks. Both unsuccessful and successful “cyber-attacks” on companies have continued to increase in frequency, scope and potential harm in recent years. While we develop and maintain systems seeking to prevent systems-related events and security breaches from occurring, the development and maintenance of these systems is costly and requires ongoing monitoring and updating as techniques used in such attacks become more sophisticated and change frequently. We, and the third parties on which we rely, may be unable to anticipate these techniques or implement adequate preventive measures. While from time to time attempts have been made to access our network, these attempts have not as yet resulted in any material release of information, degradation or disruption to our network and information systems.
Our network and information systems are also vulnerable to damage or interruption from power outages, telecommunications failures, accidents, natural disasters (including extreme weather arising from short-term or any long-term changes in weather patterns), terrorist attacks and similar events. Our system redundancy may be ineffective or inadequate, and our disaster recovery planning may not be sufficient for all eventualities.
Any of these events, if directed at, or experienced by, us or technologies upon which we depend, could have adverse consequences on our network, our customers and our business, including degradation of service, service disruption, excessive call volume to call centers and damage to our or our customers’ equipment and data. Large expenditures may be necessary to repair or replace damaged property, networks or information systems or to protect them from similar events in the future. Moreover, the amount and scope of insurance that we maintain against losses resulting from any such events or security breaches may not be sufficient to cover our losses or otherwise adequately compensate us for any disruptions to our business that may result. Any such significant service disruption could result in damage to our reputation and credibility, customer dissatisfaction and ultimately a loss of customers or revenue. Any significant loss of customers or revenue, or significant increase in costs of serving those customers, could adversely affect our growth, financial condition and results of operations.
Furthermore, our operating activities could be subject to risks caused by misappropriation, misuse, leakage, falsification or accidental release or loss of information maintained in our information technology systems and networks and those of our third-party vendors, including customer, personnel and vendor data. We provide certain confidential, proprietary and personal information to third parties in connection with our business, and there is a risk that this information may be compromised.
We process, store and transmit large amounts of data, including the personal information of our customers. Ongoing increases in the potential for misuse of personal information, the public’s awareness of the importance of safeguarding personal information, and the volume of legislation that has been adopted or is being considered regarding the protection, privacy and security of personal information have resulted in increases to our information-related risks. We could be exposed to significant costs if such risks were to materialize, and such events could damage our reputation, credibility and business and have a negative impact on our revenue. We could be subject to regulatory actions and claims made by consumers in private litigations involving privacy issues related to consumer data collection and use practices. We also could be required to expend significant capital and other resources to remedy any such security breach.
If we experience a significant data security breach or fail to detect and appropriately respond to a significant data security breach, our results of operations and reputation could suffer.
In the ordinary course of our business, we electronically maintain confidential, proprietary and personal information in our information technology systems and networks and those of third-party vendors, including customer, personnel and vendor data. These systems may be targets of attack by cyber criminals or other wrongdoers seeking to steal such information for financial gain or to harm our business operations or reputation. The loss, misuse, compromise, leakage, falsification or accidental release of such information has resulted, and may in the future result, in costly investigations, remediation efforts and notification to affected consumers, personnel and/or vendors. Cyber-attacks may in the future consume internal resources, and they could also adversely affect our operating results and result in government investigations, fines and penalties, litigation or potential liability for us and otherwise harm our business.
21
Various federal, state and international laws and regulations govern the collection, use, retention, sharing and security of consumer data and sensitive personal information that could be used to commit identity theft. This area of the law is evolving, and interpretations of applicable laws and regulations differ. Legislative and regulatory activity in the privacy area may result in new laws that are relevant to our operations, for example, use of consumer data for marketing or advertising. Claims of failure to comply with our privacy policies or applicable laws or regulations could form the basis of governmental or private-party actions against us. Such claims and actions may cause damage to our reputation and could have an adverse effect on our business.
We also are subject to stringent data security and data retention requirements that apply to website operators and online services directed to children under 13 years of age, or that knowingly collect or post personal information from children under 13 years of age. Other privacy-oriented laws have been extended by courts to online video providers and are increasingly being used in privacy lawsuits, including class actions, against providers of video materials online. Most states have security breach notification laws that generally require a business to give notice to consumers and government agencies when certain information has been disclosed due to a security breach, and the FCC has adopted security breach rules for voice services. Several states have also enacted general data security requirements to safeguard consumer information, including the proper disposal of consumer information. We cannot predict whether, when or to what extent these obligations may impose costs on or otherwise adversely affect our business.
Our fraud detection processes and information security systems may not successfully detect all fraudulent activity by third parties aimed at our employees or customers, which could adversely affect our reputation and business results.
Third-party actors have attempted in the past, and may attempt in the future, to conduct fraudulent activity by engaging with our customers. Though we have sophisticated fraud detection processes and have taken other measures to identify fraudulent activity on our mobile applications, websites and internal systems, we may not be able to detect and prevent all such activity. Similarly, the third parties we use to effectuate these transactions may fail to maintain adequate controls or systems to detect and prevent fraudulent activity. Persistent or pervasive fraudulent activity may cause customers and partners to lose trust in us and decrease or terminate their usage of our products, or could result in financial loss, thereby harming our business and results of operations.
We may fail to adequately protect our intellectual property rights or may be accused of infringing upon intellectual property rights of third parties.
We rely on our patents, copyrights, trademarks and trade secrets, as well as licenses and other agreements with our vendors and other parties, to use our technologies, conduct our operations and sell our products and services. Our intellectual property rights may be challenged and invalidated by third parties and may not be strong enough to provide meaningful commercial competitive advantage. Third parties have in the past, and may in the future, assert claims or initiate litigation related to exclusive patent, copyright, trademark and other intellectual property rights to technologies and related standards that are relevant to us. Because of the existence of a large number of patents in the networking field, the secrecy of some pending patents and the rapid rate of issuance of new patents, we believe it is not possible to determine in advance whether a product or any of its components infringes or will infringe on the patent rights of others. Asserted claims and/or initiated litigation can include claims against us or our manufacturers, suppliers or customers, alleging infringement of their proprietary rights with respect to our existing or future products and/or services or components of those products and/or services.
Regardless of the merit of these claims, they can be time-consuming, result in costly litigation and diversion of technical and management personnel, or require us to modify our business, develop a
non-infringing
technology, be enjoined from use of certain intellectual property, use alternate technology or enter into license and royalty agreements. There can be no assurance that licenses will be available on acceptable terms and conditions, if at all, or that our indemnification by our suppliers will be adequate to cover our costs if a claim were brought directly against us or our customers. Furthermore, because of the potential for high court awards that are not necessarily predictable, it is not unusual to find even arguably unmeritorious claims settled for significant amounts. If any infringement or other intellectual property claim made against us by any third party is successful, if we are required to indemnify a customer with respect to a claim against the customer, or if we fail to modify our business, developnon-infringing
technology, use alternate technology or license the proprietary rights on commercially reasonable terms and conditions, our business, financial condition and results of operations could be materially adversely affected.Intellectual property and proprietary rights of others could prevent us from using necessary technology to provide our services or subject us to expensive intellectual property litigation.
We have in the past received claims from third parties alleging that our network technology infrastructure infringes the intellectual property rights of others. We may continue to be subject to similar claims as they relate to our business. Addressing these
22
claims is a time-consuming and expensive endeavor, regardless of the merits of the claims. In order to resolve such a claim, we could determine the need to change our method of doing business, enter into a licensing agreement or incur substantial monetary liability. It is also possible that our business could be enjoined from using the intellectual property at issue, causing us to significantly alter our operations. If any such claims are successful, then the outcome would likely affect our services utilizing the intellectual property at issue and could have a material adverse effect on our operating results.
Risks Related to Our Financial Reporting
Our management has limited experience in operating a public company.
Our executive officers have some, but relatively limited experience in the management of a publicly traded company. Our management team may not successfully or effectively manage our transition to a public company that will be subject to significant regulatory oversight and reporting obligations under federal securities laws. Their limited experience in dealing with the increasingly complex laws pertaining to public companies could be a significant disadvantage in that it is likely that an increasing amount of their time may be devoted to these activities which will result in less time being devoted to the management and growth of the post-combination company. We may not have adequate personnel with the appropriate level of knowledge, experience and training in the accounting policies, practices or internal control over financial reporting required of public companies. Our management will need to continually assess our staffing and training procedures to improve our internal control over financial reporting. Further, the development, implementation, documentation and assessment of appropriate processes, in addition to the need to remediate any potential deficiencies, will require substantial time and attention from management. The development and implementation of the standards and controls necessary for us to achieve the level of accounting standards required of a public company may require costs greater than expected. It is possible that we will be required to expand our employee base and hire additional employees to support our operations as a public company which will increase its operating costs in future periods.
We rely on assumptions, estimates and business data to calculate our key performance indicators and other business metrics, and real or perceived inaccuracies in these metrics may harm our reputation and negatively affect our business.
We use tools and manual processes to determine the households covered and households that are serviceable by our deployed network, and the related amount of capital expenditure necessary to cover the target households and provide service to the projected subscribers. This analysis involves estimates in some circumstances that, if inaccurate could affect the profitability of deployed network assets because they may provide service to fewer households than anticipated or require more capital expenditures than expected. Inaccuracies in network design may also result in fewer subscribers overall, and associated lower financial performance indicators. Our forward projections are based on an analysis of the total addressable market and include estimates on the amount of network coverage, network serviceability and subscriber penetration and churn rates that we may achieve. They also include estimates on the average revenue per user over time. Combined, inaccuracies in this data can affect our subscribers, revenue and associated financial metrics.
Our results of operations and financial condition are subject to management’s accounting judgments and estimates, as well as changes in accounting policies.
The preparation of our financial statements requires us to make estimates and assumptions affecting the reported amounts of our assets, liabilities, revenues and expenses. If these estimates or assumptions are incorrect, it could have a material adverse effect on our results of operations or financial condition. Generally accepted accounting principles in the United States are subject to interpretation by the Financial Accounting Standards Board (the “FASB”), the American Institute of Certified Public Accountants, the SEC and various bodies formed to promulgate and interpret appropriate accounting principles. A change in these principles or interpretations could have a significant effect on our reported financial results, and could affect the reporting of transactions completed before the announcement of a change.
We have identified material weaknesses in our internal control over financial reporting and may identify additional material weaknesses in the future or fail to maintain an effective system of internal control over financial reporting, which may result in material misstatements of our consolidated financial statements or cause us to fail to meet our periodic reporting obligations.
We have identified material weaknesses in our internal control over financial reporting. A material weakness is a deficiency, or a combination of deficiencies, in internal control over financial reporting such that there is a reasonable possibility that a material misstatement of our annual or interim financial statements will not be prevented or detected on a timely basis. The material weaknesses relate to (i) the lack of maintaining a sufficient complement of accounting and financial reporting resources commensurate with our financial reporting requirements, (ii) the lack of maintaining an effective risk assessment process, which led to improperly designed controls, (iii) the lack of maintaining appropriate control activities to support the appropriate segregation of duties over the review of account reconciliations, manual journal entries and rights over access administrative controls and (iv) the failure to document, thoroughly communicate and monitor control processes and relevant accounting policies and procedures.
23
We have engaged a third-party consultant to assist us in the process of designing and implementing measures to improve our internal control over financial reporting to remediate these material weaknesses. Our remediation efforts are focused on (i) hiring of personnel with technical accounting and financial reporting experience; (ii) implementation of improved accounting and financial reporting processes; and (iii) implementation of systems to improve the completeness, timeliness and accuracy of our financial reporting. We believe the measures described above should remediate the material weaknesses identified and strengthen our internal control over financial reporting. The remediation initiatives outlined above are estimated to take place over the next 12 to 18 months. While we continue the challenging and costly process to implement our plan to remediate the material weaknesses, we cannot predict the success of such plan or the outcome of our assessment of this plan until the remediation initiatives have been completed and have been operating effectively for a sufficient period of time. We can give no assurance that these measures will remediate the deficiencies in internal control or that additional material weaknesses or significant deficiencies in our internal control over financial reporting will not be identified in the future. Our failure to implement and maintain effective internal control over financial reporting could result in errors in our financial statements that may lead to a restatement of our financial statements or cause us to fail to meet our reporting obligations.
As a public company, we are required, pursuant to Section 404 of the Sarbanes-Oxley Act, to furnish a report by management on, among other things, the effectiveness of our internal control over financial reporting for future annual reports on Form
10-K
to be filed with the SEC. This assessment will need to include disclosure of any material weaknesses identified by our management in our internal control over financial reporting. Additionally, once we no longer qualify as an “emerging growth company,” our independent registered public accounting firm will be required to attest to the effectiveness of our internal control over financial reporting in future annual reports on Form10-K
to be filed with the SEC. We are required to disclose changes made in our internal controls and procedures on a quarterly basis. Failure to comply with the Sarbanes-Oxley Act could potentially subject us to sanctions or investigations by the SEC, the applicable stock exchange or other regulatory authorities, which would require additional financial and management resources. We have begun the process of compiling the system and processing documentation necessary to perform the evaluation needed to comply with Section 404 in the future, but we may not be able to complete our evaluation, testing and any required remediation in a timely fashion.We are currently an “emerging growth company” and a “smaller reporting company” under the Securities Act, and to the extent we have taken advantage of certain exemptions from disclosure requirements available to emerging growth companies or smaller reporting companies, this could make our securities less attractive to investors and may make it more difficult to compare our performance with other public companies.
We are an “emerging growth company,” as defined in Section 2(a) of the Securities Act of 1933, as amended (the “Securities Act”), as modified by the JOBS Act, and we may take advantage of certain exemptions from various reporting requirements that are applicable to other public companies that are not emerging growth companies, including, but not limited to, not being required to comply with the auditor attestation requirements of Section 404 of the Sarbanes-Oxley Act, reduced disclosure obligations regarding executive compensation in their periodic reports and proxy statements, and exemptions from the requirements of holding a nonbinding advisory vote on executive compensation and stockholder approval of any golden parachute payments not previously approved.
Further, Section 102(b)(1) of the JOBS Act exempts emerging growth companies from being required to comply with new or revised financial accounting standards until private companies (that is, those that have not had a registration statement under the Securities Act declared effective or do not have a class of securities registered under the Securities Exchange Act of 1934, as amended (the “Exchange Act”)) are required to comply with the new or revised financial accounting standards. The JOBS Act provides that a company can elect to opt out of the extended transition period and comply with the requirements that apply to
non-emerging
growth companies but any such election to opt out is irrevocable. We have elected not to opt out of such extended transition period which means that when a standard is issued or revised and it has different application dates for public or private companies, we, as an emerging growth company, can adopt the new or revised standard at the time private companies adopt the new or revised standard. This may make comparability of our financial statements with another public company which is neither an emerging growth company nor an emerging growth company which has opted out of using the extended transition period difficult or impossible because of the potential differences in accounting standards used.Additionally, we are a “smaller reporting company” as defined in Item 10(f)(1) of Regulation
S-K.
Smaller reporting companies may take advantage of certain reduced disclosure obligations, including, among other things, providing only two years of audited financial statements. We will remain a smaller reporting company until the last day of the fiscal year in which either (a)(i) the market value of the shares of our Class A Common Stock held bynon-affiliates
exceeds $250 million as of the prior June 30, and (ii) our annual revenue exceeded $100 million during such completed fiscal year, or (b) the market value of the shares of our Class A Common Stock held bynon-affiliates
exceeds $700 million as of the prior June 30. To the extent we take advantage of such reduced disclosure obligations, it may also make comparison of our financial statements with other public companies difficult or impossible24
Our ability to use our net operating loss carryforwards and certain other tax attributes may be limited.
We have incurred net losses since our inception and we may never achieve or sustain profitability. Generally, for U.S. federal income tax purposes, net operating losses incurred will carry forward. Net operating loss carryforwards generated prior to January 1, 2018, however, are subject to expiration for U.S. federal income tax purposes. As of December 31, 2021, we had federal net operating loss carryforwards of approximately $485.1 million, of which $49.5 million will begin to expire in 2034 and $435.6 million can be carried forward indefinitely. As of December 31, 2021, we had a total state net operating loss carryforward of $488.8 million, which will begin to expire in 2034.
Under Sections 382 and 383 of the Internal Revenue Code of 1986, as amended (the “Code”), if a corporation undergoes an “ownership change,” generally defined as a greater than 50% change by value in its equity ownership by certain shareholders over a three-year period, the corporation’s ability to use its
pre-ownership
change net operating loss carryforwards and otherpre-ownership
change tax attributes to offset its post-ownership change income or taxes may be limited. Similar provisions of state tax law may also apply to limit the use of our state net operating loss carryforwards and other state tax attributes. We have not performed an analysis to determine whether our past issuances of equity and other changes in our ownership may have resulted in one or more ownership changes. If it is determined that we have in the past experienced an ownership change, or if we undergo one or more ownership changes as a result of the transactions contemplated in connection with the Business Combination or future transactions in our stock, which may be outside our control, then our ability to use our net operating loss carryforwards and other tax attributes may be materially limited. As a result, even if we earn taxable income, we may be unable to use a material portion of our net operating loss carryforwards and other tax attributes, which could adversely affect our future cash flows. There is also a risk that regulatory changes, such as suspensions on the use of net operating losses or other unforeseen reasons, may result in our existing net operating loss carryforwards expiring or otherwise becoming unavailable to offset future taxable income. For these reasons, we may not be able to use a material portion of our net operating loss carryforwards and other tax attributes even if we attain profitability.Risks Related to Our Liquidity and Capital Resources
We may need additional capital to pursue our business objectives and respond to business opportunities, challenges or unforeseen circumstances, and we cannot be sure that additional financing will be available.
Our business is capital intensive. Operating and maintaining our network requires significant amounts of cash payments to third parties. Capital expenditures were $68.9 million and $35.9 million for the years ended December 31, 2021 and 2020, respectively, and primarily included payments for customer premise equipment, network infrastructure, support and other costs.
The amount of capital raised through the Business Combination may not be enough to fund our anticipated network expansion and customer acquisition costs. As a result, we may be required to raise additional equity or debt capital, which we may not be able to do on favorable terms or at all. If we raise additional equity capital it would dilute the ownership of our existing shareholders. If we raise additional debt capital it may place significant restrictions on our ability to operate in the manner we would like and require
on-going
interest payments that could place a strain on our liquidity. We expect our future capital expenditures to continue to be significant as we further expand our network and enhance our service offerings. We may have substantial future capital commitments in the form of long-term contracts that require substantial payments over a period of time. In the longer term, our ability to fund our operations, make planned capital expenditures, make scheduled payments on our indebtedness and repay our indebtedness (to the extent any remains) depends on our future operating performance and cash flows and our ability to access the capital markets, which, in turn, are subject to prevailing economic conditions and to financial, business and other factors, some of which are beyond our control. Competition, market disruptions or deterioration in economic conditions could lead to lower demand for our products, as well as lower levels of advertising, and increased incidence of customers’ inability to pay for the services we provide. These events would adversely impact our results of operations, cash flows and financial position. As such, we may not be able to generate sufficient cash internally to fund anticipated capital expenditures, make ongoing interest payments and repay our indebtedness at maturity. Accordingly, we may have to do one or more of the following:| • | refinance existing obligations to extend maturities; |
| • | raise additional capital, through bank loans, debt or equity issuances or a combination thereof; |
| • | cancel or scale back current and future spending programs; or |
| • | sell assets or interests in one or more of our businesses. |
25
However, we may not be able to refinance existing obligations or raise any required additional capital on terms acceptable to us or at all. Borrowing costs related to future capital raising activities may be significantly higher than our current borrowing costs and we may not be able to raise additional capital on favorable terms, or at all, if financial markets experience volatility. If we are unable to pursue our current and future spending programs, we may be forced to cancel or scale back those programs. Our choice of which spending programs to cancel or reduce may be limited. Failure to successfully pursue our capital expenditure and other spending plans could materially and adversely affect our ability to compete effectively. It is possible that in the future we may also engage in extraordinary transactions and such transactions could result in the incurrence of substantial additional indebtedness.
For the year ended December 31, 2021, our independent registered public accounting firm included an explanatory paragraph relating to our ability to continue as a going concern in its report on our audited financial statements included elsewhere in this prospectus , and there can be no guarantee that we will continue as a going concern absent the ability to raise additional capital within the next 12 months.
The report from our independent registered public accounting firm for the year ended December 31, 2021 includes an explanatory paragraph stating that our losses and negative cash flows from operating activities since inception and the fact that we may be unable to remain in compliance with certain financial covenants required by the Starry Credit Agreement, raise substantial doubt about our ability to continue as a going concern. Our consolidated financial statements do not include any adjustments that may result from the outcome of this uncertainty. If we are unable to obtain sufficient funding, our business, prospects, financial condition and results of operations will be materially and adversely affected and we may be unable to continue as a going concern. If we are unable to continue as a going concern, we may have to liquidate our assets and may receive less than the value at which those assets are carried on our audited financial statements, and it is likely that investors would lose part or all of their investment. Future reports from our independent registered public accounting firm may also contain statements expressing substantial doubt about our ability to continue as a going concern. If there remains substantial doubt about our ability to continue as a going concern, investors or other financing sources may be unwilling to provide additional funding to us on commercially reasonable terms, or at all, and our business may be harmed.
The Starry Credit Agreement contains restrictive and financial covenants that may limit our operating flexibility.
The Starry Credit Agreement contains certain restrictive covenants that either limit our ability to, or require a mandatory prepayment in the event we, among other things, incur additional indebtedness, issue guarantees, create liens on assets, make certain investments, merge with or acquire other companies, change business activities, pay dividends or make certain other restricted payments, transfer or dispose of assets, enter into transactions with affiliates and enter into various specified transactions. The Starry Credit Agreement also contains a financial covenant that requires us to maintain a minimum cash balance of $15 million at all times and certain financial reporting requirements. Our obligations under the Starry Credit Agreement are secured by all of our assets, with certain exceptions. We may not be able to generate sufficient liquidity or revenue to meet the financial covenant or pay the principal and interest when due. Furthermore, future working capital, borrowings or equity financing could be unavailable to repay or refinance the amounts outstanding under the Starry Credit Agreement. In the event of a liquidation, all outstanding principal and interest would have to be repaid prior to distribution of assets to unsecured creditors, and the holders of our Class A Common Stock.
If we are unable to comply with the restrictive and financial covenants in the Starry Credit Agreement, there would be a default under the terms of that agreement, and this could result in an acceleration of payment of funds that have been borrowed.
If we were unable to comply with the restrictive and financial covenants in the Starry Credit Agreement, there would be a default under the terms of that agreement. As a result, any borrowings under other instruments that contain cross-acceleration or cross default provisions may also be accelerated and become due and payable. If any of these events occur, there can be no assurance that we would be able to make necessary payments to the lenders or that we would be able to find alternative financing. Even if we were able to obtain alternative financing, there can be no assurance that it would be on terms that are acceptable.
26
Risks Related to Ownership of Our Securities
The price of our securities may be volatile.
The market price of our Class A Common Stock and warrants may fluctuate significantly, depending on many factors, some of which may be beyond our control, including:
| • | actual or anticipated fluctuations in our operating results due to factors related to our business; |
| • | failure to meet or exceed financial estimates and projections of the investment community or that we provide to the public; |
| • | the failure of securities analysts to cover, or maintain coverage of, our Class A Common Stock; |
| • | issuance of new or updated research or reports by securities analysts or changed recommendations for the industry in general; |
| • | operating and share price performance of other companies in the industry or related markets; |
| • | the timing and magnitude of investments in the growth of the business; |
| • | success or failure of our business strategies; |
| • | our ability to obtain financing as needed; |
| • | announcements by us or our competitors of significant acquisitions, dispositions or strategic investments; |
| • | additions or departures of our key management or other personnel; |
| • | sales of substantial amounts of our Common Stock by our directors, executive officers or significant stockholders or the perception that such sales could occur; |
| • | changes in capital structure, including future issuances of securities or the incurrence of deb |
| • | changes in accounting standards, policies, guidance, interpretations or principles; |
| • | investor perception of us and our industry; |
| • | overall market fluctuations; |
| • | results from any material litigation or government investigation; |
| • | changes in laws and regulations (including tax laws and regulations) affecting our business; |
| • | changes in capital gains taxes and taxes on dividends affecting stockholders; and |
| • | general economic conditions and other external factors. |
Low trading volume for our Class A Common Stock, which may occur if an active trading market is not sustained, among other reasons, would amplify the effect of the above factors on our stock price volatility.
Stock markets in general can experience volatility that is unrelated to the operating performance of a particular company. These broad market fluctuations could adversely affect the trading price of our Class A Common Stock and our warrants.
An active, liquid trading market for our securities may not develop or be sustained.
There can be no assurance that an active trading market for our Class A Common Stock and warrants will develop, or, if such a market develops, that we will be able to maintain an active trading market for those securities on the NYSE, The Nasdaq Stock Market LLC or any other exchange in the future. If an active market for our securities does not develop or is not maintained, or if we fail to satisfy the continued listing standards of the NYSE for any reason and our securities are delisted, it may be difficult for our securityholders to sell their securities without depressing the market price for the securities or at all. An inactive trading market may also impair our ability to both raise capital by selling shares of capital stock, attract and motivate employees through equity incentive awards and acquire other companies, products or technologies by using shares of capital stock as consideration.
27
We do not intend to pay cash dividends for the foreseeable future.
The timing, declaration, amount and payment of future dividends to stockholders falls within the discretion of our board of directors and will depend on many factors, including our financial condition, earnings, capital requirements of our business and covenants associated with debt obligations, as well as legal requirements, regulatory constraints, industry practice and other factors that our board of directors deems relevant. There can be no assurance that we will continue to pay any dividend in the future.
The securities being offered in this prospectus represent a substantial percentage of our outstanding Class A Common Stock and warrants, and the sales of such securities could cause the market price of our Class A Common Stock and warrants to decline significantly.
This prospectus relates to, among other things, the resale from time to time by the selling securityholders of up to (A) 133,303,864 shares of Class A Common Stock, which includes (i) 99,896,582 shares of Class A Common Stock issued to securityholders of Starry pursuant to the Acquisition Merger at an equity consideration value of $10.00 per share, (ii) 9,268,335 shares of Class A Common Stock issuable upon the conversion of Class X Common Stock issued to Chaitanya Kanojia, Starry Group’s Chief Executive Officer, pursuant to the Acquisition Merger at an equity consideration value of $10.00 per share, (iii) 2,800,000 shares of Class A Common Stock, issued in exchange for the Starry Series Z Preferred Stock issued in the Series Z Investment at a price of $7.50 per share, pursuant to the Acquisition Merger, (iv) 14,533,334 shares of Class A Common Stock issued in the PIPE Investment at a price of $7.50 per share and (v) 6,805,613 shares of Class A Common Stock issued to the Sponsor and the Initial Stockholders pursuant to the SPAC Merger and (B) 6,853,333 warrants to purchase 1.2415 shares of Class A Common Stock per warrant at an exercise price of $9.13 per 1.2415 shares of Class A Common Stock issued to the Sponsor and the Initial Stockholders pursuant to the SPAC Merger.
Prior to the consummation of FirstMark’s initial public offering, the Sponsor purchased 8,625,000 shares of FirstMark Class B Common Stock for an aggregate purchase price of $25,000, or approximately $0.003 per share. FirstMark subsequently transferred an aggregate of 120,000 shares of FirstMark Class B Common Stock, held by the Sponsor to certain members of the board of directors of FirstMark. FirstMark subsequently effected a 1:1.2 stock split of the FirstMark Class B Common Stock, resulting in an aggregate of 10,350,000 shares of FirstMark Class B Common Stock outstanding. Pursuant to the Sponsor Support Agreement such shares were converted into an aggregate of 5,481,767 shares of FirstMark Class A Common Stock immediately prior to the closing of the SPAC Merger, which shares were then converted into an aggregate of 6,805,613 shares of Class A Common Stock (including 4,128,113 Earnout Shares subject to forfeiture) pursuant to and upon closing of the SPAC Merger. This resulted in an approximate price of $0.004 per share for each of the shares received pursuant to the SPAC Merger.
This prospectus also relates to the issuance by us and resale by certain selling securityholders of up to (A) 2,271,414 shares of Class A Common Stock reserved for issuance upon the exercise of options to purchase Class A Common Stock that were issued in exchange for options to purchase shares of Starry Common Stock (as defined below) pursuant to the Acquisition Merger at an equity consideration value of $10.00 per share and (B) 423,380 shares of Class A Common Stock reserved for issuance upon the settlement of restricted stock units that were issued in exchange for Starry restricted stock units pursuant to the Acquisition Merger at an equity consideration value of $10.00 per share. Such shares of Class A Common Stock will be issued pursuant to the terms of the Starry Stock Plan and the applicable award agreement, at the applicable exercise prices established upon the grants of the awards, as adjusted in connection with the Acquisition Merger.
In connection with the Business Combination, holders of 37,775,801 shares of FirstMark Class A Common Stock exercised their right to redeem their shares for cash at a price of approximately $10.00 per share, for an aggregate price of $377.8 million, which represented approximately 91.2% of the total FirstMark Class A Common Stock then outstanding. The shares of Class A Common Stock being offered for resale pursuant to this prospectus represent approximately 86.6% of the current total outstanding Class A Common Stock, and the warrants being offered for resale pursuant to this prospectus represent approximately 33.2% of our outstanding warrants. Additionally, if all of the private placement warrants are exercised, the selling securityholders would own an additional 8,508,413 shares of Class A Common Stock, representing an additional 5.4% of the total outstanding Class A Common Stock. The sale of all securities being offered in this prospectus could result in a significant decline in the public trading price of the Class A Common Stock. Even though the current trading price of the Class A Common Stock is close to the price at which the units were issued in FirstMark’s initial public offering, the Sponsor and other selling securityholders have an incentive to sell because they will still profit on sales due to the lower price at which they purchased their shares compared to the public investors in FirstMark’s initial public offering. Public investors may not experience a similar rate of return on the securities they purchase due to differences in the purchase prices and the current trading price. Based on the closing prices of our Class A Common Stock and warrants referenced on the cover of this prospectus, (i) the selling securityholders that were formerly securityholders of Starry may experience profit of up to $0.26 per share, (ii) the Series Z Investors and the PIPE Investors may experience profit of up to $2.76 per share, (iii) the Sponsor may experience profit of up to $10.26 per share and (iv) the holders of private placement warrants may experience profit of up to $0.76 per warrant or up to $2.11 upon the exercise of a warrant and sale of the underlying Class A Common Stock (without giving effect to the rounding down of fractional shares).
Future sales, or the perception of future sales, of our Class A Common Stock and warrants being offered in this prospectus by us or our existing securityholders could cause the market price for our Class A Common Stock and warrants to decline significantly.
The sale of substantial amounts of shares of our Class A Common Stock or warrants being offered in this prospectus, or the perception that such sales could occur, could harm the prevailing market price of shares of our Class A Common Stock and warrants. These sales, or the possibility that these sales may occur, also might make it more difficult for us to sell equity securities in the future at a time and at a price that we deem appropriate. We believe that the likelihood that warrant holders will exercise their warrants, and therefore the amount of cash proceeds that we would receive, is dependent upon the market price of our Class A Common Stock. If the market price for our Class A Common Stock is less than the exercise price of the warrants (on a per share basis), we believe warrant holders will be unlikely to exercise the warrants.
28
Subject to certain exceptions, the Sponsor, those who received shares of our Class A Common Stock as consideration pursuant to the Merger Agreement and our directors, officers and employees receiving our Class A Common Stock upon the settlement or exercise of warrants, stock options or other equity awards outstanding immediately following the closing of the Business Combination, will be restricted from selling or transferring any of their respective shares of our Class A Common Stock (not including the shares of our Class A Common Stock issued in the sale of the PIPE Shares or the shares of Class A Common Stock issued in exchange for the Series Z Shares pursuant to the terms of their respective subscription agreements). In the case of the shares that are restricted pursuant to our bylaws (our “Bylaws”), such restrictions end on the date that is 180 days after the closing of the Business Combination. In the case of the shares restricted pursuant to the Sponsor Support Agreement, each Initial Stockholder agreed that such Initial Stockholder shall not transfer any shares of our Common Stock during the period commencing immediately after the Acquisition Merger Effective Date and ending upon the earlier to occur of (x) 8:00 a.m. Eastern Time on the date that is 12 months after (and excluding) the Acquisition Merger Effective Date and (y) the occurrence of an Earnout Triggering Event, without our prior written consent, subject to certain permitted transfers as provided in the Sponsor Support Agreement.
However, following the expiration of the applicable
lock-up
period, such equity holders will not be restricted from selling shares of our Class A Common Stock held by them, other than by applicable securities laws. Additionally, the purchasers of the PIPE Shares and the shares of Class A Common Stock issued in exchange for the Series Z Shares will not be restricted from selling any of their shares of our Class A Common Stock, other than by applicable securities laws. As such, sales of a substantial number of shares of our Class A Common Stock in the public market could occur at any time. These sales, or the perception in the market that the holders of a large number of shares intend to sell shares, could reduce the market price of our Class A Common Stock. As restrictions on resale end and registration statements (to provide for the resale of such shares from time to time) are available for use, the sale or possibility of sale of these shares could have the effect of increasing the volatility in the market price of our Class A Common Stock, and the market price of our Class A Common Stock could decline if the holders of currently restricted shares sell them or are perceived by the market as intending to sell them.In addition, the shares of our Class A Common Stock reserved for future issuance under the Starry Stock Plan, the 2022 Incentive Award Plan and the ESPP will become eligible for sale in the public market once those shares are issued, subject to provisions relating to various vesting agreements, lock-up provisions and, in some cases, limitations on volume and manner of sale applicable to affiliates under Rule 144, as applicable. As of May 20, 2022, there were options to purchase 7,299,338 shares of Class A Common stock and 809,002 RSUs outstanding under the Starry Stock Plan. The aggregate number of shares of Class A Common Stock available for issuance under the 2022 Incentive Award Plan is equal to the sum of (i) 22,775,288 shares of Class A Common Stock and (ii) an annual increase on the first day of each calendar year beginning January 1, 2023 and ending on and including January 1, 2031, equal to the lesser or (A) 5.0% of the aggregate number of shares of Common Stock outstanding on the final day of the immediately preceding calendar year and (B) such smaller number of Class A Common Stock as determined by Starry Group’s board of directors. The aggregate number of shares of Class A Common Stock available for issuance under the ESPP is equal to the sum of (i) 4,555,058 shares of Class A Common Stock and (ii) an annual increase on the first day of each calendar year beginning January 1, 2023 and ending on and including January 1, 2031, equal to the lesser or (A) 1.0% of the aggregate number of shares of Common Stock outstanding on the final day of the immediately preceding calendar year and (B) such smaller number of Class A Common Stock as determined by Starry Group’s board of directors.
We expect to file one or more registration statements on Form S-8 under the Securities Act to register shares of our Class A Common Stock or securities convertible into or exchangeable for shares of our Class A Common Stock issued pursuant to our equity incentive plans. Any such Form S-8 registration statements will automatically become effective upon filing. Accordingly, shares registered under such registration statements will be available for sale in the open market.
The provisions of our Charter requiring exclusive forum in the Court of Chancery of the State of Delaware and the federal district courts of the United States for certain types of lawsuits may have the effect of discouraging lawsuits against our directors and officers.
Our Amended and Restated Certificate of Incorporation (our “Charter”) provides that, to the fullest extent permitted by law, and unless we consent in writing to the selection of an alternative forum, the Court of Chancery of the State of Delaware (or, in the event that the Chancery Court does not have jurisdiction, the federal district court for the District of Delaware or other state courts of the State of Delaware) and any appellate court thereof will be the sole and exclusive forum for (i) any derivative action, suit or proceeding brought on behalf of us, (ii) any action, suit or proceeding asserting a claim of breach of a fiduciary duty owed by any current or former director, officer, stockholder or employee of ours to us or our stockholders, (iii) any action, suit or proceeding arising pursuant to any provision of the Delaware General Corporation Law, as amended (the “DGCL”) or our Bylaws or Charter of (as each may be amended from time to time), (iv) any action, suit or proceeding as to which the DGCL confers jurisdiction on the Court of Chancery of the State of Delaware or (v) any action, suit or proceeding asserting a claim against us or any current or former director, officer or stockholder governed by the internal affairs doctrine.
29
Section 22 of the Securities Act creates concurrent jurisdiction for federal and state courts over all suits brought to enforce any duty or liability created by the Securities Act or the rules and regulations thereunder. Accordingly, both state and federal courts have jurisdiction to entertain such Securities Act claims. To prevent having to litigate claims in multiple jurisdictions and the threat of inconsistent or contrary rulings by different courts, among other considerations, our Charter provides that, unless we consent in writing to the selection of an alternative forum, to the fullest extent permitted by law, the federal district courts of the United States of America shall be the exclusive forum for the resolution of any complaint asserting a cause of action arising under the Securities Act; however, there is uncertainty as to whether a court would enforce such provision, and investors cannot waive compliance with federal securities laws and the rules and regulations thereunder. Notwithstanding the foregoing, our Charter provides that the exclusive forum provision will not apply to suits brought to enforce any cause of action arising under the Securities Act, any duty or liability created by the Exchange Act or any other claim for which the federal courts have exclusive jurisdiction.
Section 27 of the Exchange Act creates exclusive federal jurisdiction over all suits brought to enforce any duty or liability created by the Exchange Act or the rules and regulations thereunder.
These provisions may have the effect of discouraging lawsuits against our directors and officers. The enforceability of similar choice of forum provisions in other companies’ certificates of incorporation has been challenged in legal proceedings, and it is possible that, in connection with any applicable action brought against us, a court could find the choice of forum provisions contained in our Charter to be inapplicable or unenforceable in such action.
We cannot predict the impact our multi-class structure may have on the stock price of our Class A Common Stock.
We cannot predict whether our multi-class structure will result in a lower or more volatile market price of our Class A Common Stock or in adverse publicity or other adverse consequences. For example, certain index providers have announced restrictions on including companies with multiple-class share structures in certain of their indexes. S&P Dow Jones and FTSE Russell have announced changes to their eligibility criteria for inclusion of shares of public companies on certain indices, including the S&P 500, pursuant to which companies with multiple classes of shares of common stock are excluded. In addition, several stockholder advisory firms have announced their opposition to the use of multiple class structures. As a result, the multi-class structure of our Common Stock may cause stockholder advisory firms to publish negative commentary about our corporate governance practices or otherwise seek to cause us to change our capital structure. Any such exclusion from indices or any actions or publications by stockholder advisory firms critical of our corporate governance practices or capital structure could adversely affect the value and trading market of our Class A Common Stock.
Our
co-founder
and Chief Executive Officer controls a significant percentage of our voting power and will be able to exert significant control over the direction of our business.Chaitanya Kanojia, our
co-founder
and Chief Executive Officer holds shares of our Class A Common Stock that entitle him to one vote per share and shares of our Class X Common Stock that entitle him to 20 votes per share of our Class X Common Stock until the Sunset Date (as defined in our Charter). Immediately following the Acquisition Merger Effective Date, he beneficially owned shares representing approximately 58.1% of the voting power of Starry Group despite holding only approximately 13.8% of our total Common Stock.Accordingly, for so long as Mr. Kanojia continues to control a significant percentage of the voting power of our Common Stock, he will be able to significantly influence the composition of our board of directors and management and the approval of actions requiring stockholder approval. The concentration of ownership could also deprive you of an opportunity to receive a premium for your shares of our Class A Common Stock as part of a sale of us and ultimately might affect the market price of our Class A Common Stock.
Because we are a “controlled company” within the meaning of the NYSE rules, our stockholders may not have certain corporate governance protections that are available to stockholders of companies that are not controlled companies.
So long as more than 50% of the voting power for the election of our directors is held by an individual, a group or another company, we qualify as a “controlled company” within the meaning of the NYSE corporate governance standards. Chaitanya Kanojia controls more than 50% of the voting power of our Common Stock. As a result, we are a “controlled company” within the meaning of the NYSE corporate governance standards and are not subject to the requirements of the applicable exchange that would otherwise require us to have: (i) a majority of independent directors; (ii) a compensation committee comprised solely of independent directors; (iii) a nominating committee comprised solely of independent directors; and (iv) director nominees selected, or recommended for selection by our board of directors, by the nominating committee. To the extent we rely on any of these exemptions, holders of our Class A Common Stock will not have the same protections afforded to stockholders of companies that are subject to all of the corporate governance requirements of the NYSE. Mr. Kanojia may have his interest in us diluted due to future equity issuances or his own actions in selling shares of our Common Stock, in each case, which could result in a loss of the “controlled company” exemption under the NYSE listing rules. We would then be required to comply with those provisions of the NYSE listing requirements.
30
Delaware law and our Charter and Bylaws contain certain provisions, including anti-takeover provisions that limit the ability of stockholders to take certain actions and could delay or discourage takeover attempts that stockholders may consider favorable.
Our Charter and Bylaws, and the DGCL, contain provisions that could have the effect of rendering more difficult, delaying or preventing an acquisition that stockholders may consider favorable, including transactions in which stockholders might otherwise receive a premium for their shares. These provisions could also limit the price that investors might be willing to pay in the future for shares of our Class A Common Stock, and therefore depress the trading price. These provisions could also make it difficult for stockholders to take certain actions, including electing directors who are not nominated by the incumbent members of our board of directors or taking other corporate actions, including effecting changes in our management. Among other things, our Charter and Bylaws include provisions that:
| • | authorize our Class X Common Stock that entitle Chaitanya Kanojia, our Chief Executive Officer and founder, to 20 votes per share of such stock until the Sunset Date (as defined in our Charter); |
| • | provide or a classified board of directors with staggered, three-year terms; |
| • | permit our board of directors to issue shares of preferred stock, including “blank check” preferred stock and to determine the price and other terms of those shares, including preferences and voting rights, without stockholder approval, which could be used to significantly dilute the ownership of a hostile acquire; |
| • | prohibit cumulative voting in the election of directors, which limits the ability of minority stockholders to elect director candidates; |
| • | limit the liability of, and provide for the indemnification of, our directors and officers; |
| • | permit our board of directors to amend our Bylaws, which may allow our board of directors to take additional actions to prevent an unsolicited takeover and inhibit the ability of an acquirer to amend our Bylaws to facilitate an unsolicited takeover attempt; |
| • | require a supermajority vote of stockholders to amend certain provisions of our Charter and a supermajority vote of stockholders in order to amend our Bylaws; |
| • | limit our ability to engage in business combinations with certain interested stockholders without certain approvals; and |
| • | mandate advance notice procedures with which stockholders must comply in order to nominate candidates to our board of directors or to propose matters to be acted upon at a stockholders’ meeting, which could preclude stockholders from bringing matters before annual or special meetings of stockholders and delay changes in our board of directors and also may discourage or deter a potential acquirer from conducting a solicitation of proxies to elect the acquirer’s own slate of directors or otherwise attempting to obtain control of our company. |
These provisions, alone or together, could delay or prevent hostile takeovers and changes in control or changes in our board of directors or management.
If analysts do not publish research about our business or if they publish inaccurate or unfavorable research, the price and trading volume of our securities could decline.
The trading market for our securities depends in part on the research and reports that analysts publish about our business. We do not have any control over these analysts, and the analysts who publish information about us may have relatively little experience with us or our industry, which could affect their ability to accurately forecast our results and could make it more likely that we fail to meet their estimates. If few or no securities or industry analysts cover us, the trading price for our securities would be negatively impacted. If one or more of the analysts who covers us downgrades our securities, publishes incorrect or unfavorable research about us, ceases coverage of us, or fails to publish reports on us regularly, demand for and visibility of our securities could decrease, which could cause the price or trading volumes of our securities to decline.
We may be subject to securities class action litigation, which may harm our business and operating results.
Companies that have experienced volatility in the market price of their stock have been subject to securities class action litigation. We may be the target of this type of litigation in the future. Securities litigation against us could result in substantial costs and damages and divert our management’s attention from other business concerns, which could seriously harm our business, results of operations, financial condition or cash flows.
We may also be called on to defend ourselves against lawsuits relating to our business operations. Some of these claims may seek significant damages amounts. Due to the inherent uncertainties of litigation, the ultimate outcome of any such proceedings cannot be accurately predicted. A future unfavorable outcome in a legal proceeding could have an adverse impact on our business, financial condition and results of operations. In addition, current and future litigation, regardless of its merits, could result in substantial legal fees, settlements or judgment costs and a diversion of our management’s attention and resources that are needed to successfully run our business.
31
We may amend the terms of the warrants in a manner that may be adverse to holders of public warrants with the approval by the holders of at least 65% of the then outstanding public warrants. As a result, the exercise price of the warrants could be increased, the exercise period could be shortened and the number of shares of Class A Common Stock purchasable upon exercise of a warrant could be decreased, all without approval of each warrant affected.
The warrants were issued in registered form under the Warrant Agreement. The Warrant Agreement provides that the terms of the warrants may be amended without the consent of any holder to cure any ambiguity or correct any defective provision, but requires the approval by the holders of at least 65% of the then outstanding public warrants to make any change that adversely affects the interests of the registered holders of public warrants. Accordingly, we may amend the terms of the public warrants in a manner adverse to a holder if holders of at least 65% of the then outstanding public warrants approve of such amendment. Although our ability to amend the terms of the public warrants with the consent of at least 65% of the then outstanding public warrants is unlimited, examples of such amendments could be amendments to, among other things, increase the exercise price of the warrants, convert the warrants into cash, shorten the exercise period or decrease the number of Class A Common Stock purchasable upon exercise of a warrant.
We may redeem unexpired public warrants prior to their exercise at a time that is disadvantageous to you, thereby making such warrants worthless.
We have the ability to redeem our outstanding public warrants at any time after they become exercisable and prior to their expiration, at a price of $0.01 per warrant; that the last sale price of our Class A Common Stock equals or exceeds $14.29 per share (as adjusted for share splits, share capitalizations, reorganizations, recapitalizations and the like) on each of 20 trading days within a
provided
30 trading-day period
ending on the third trading day prior to the date on which notice of such redemption is given. We will not redeem the public warrants unless an effective registration statement under the Securities Act covering our Class A Common Stock issuable upon exercise of the public warrants is effective and a current proxy statement/prospectus relating to those Class A Common Stock is available throughoutthe 30-day redemption
period, except if the public warrants may be exercised on a cashless basis and such cashless exercise is exempt from registration under the Securities Act. If and when the public warrants become redeemable by us, we may exercise our redemption right even if we are unable to register or qualify the underlying securities for sale under all applicable state securities laws. Redemption of the outstanding public warrants could force holders thereof to (i) exercise public warrants and pay the exercise price therefor at a time when it may be disadvantageous for such holder to do so, (ii) sell public warrants at the then-current market price when such holder might otherwise wish to hold public warrants or (iii) accept the nominal redemption price which, at the time the outstanding public warrants are called for redemption, is likely to be substantially less than the market value of such public warrants. None of the private placement warrants will be redeemable by us so long as they are held by their initial purchasers or their permitted transferees.In addition, we may redeem warrants after they become exercisable for a number of our Class A Common Stock determined based on the redemption date and the fair market value of our Class A Common Stock. Any such redemption may have similar consequences to a cash redemption described above. In addition, such redemption may occur at a time when the warrantswhich case holders thereof would lose any potential embedded value from a subsequent increase in the value of our Class A Common Stock had such warrants remained outstanding.
are “out-of-the-money,” in
Although each warrant is exercisable for 1.2415 shares of Class A Common Stock, pursuant to the terms of the Warrant Agreement, the Company will not issue any fractional shares of Class A Common Stock upon exercise of the warrants.
In connection with the Business Combination, each outstanding warrant to purchase one share of FirstMark Class A Common Stock was canceled and converted into a warrant to purchase 1.2415 shares of Class A Common Stock. If, upon exercise, a holder would be entitled to receive a fractional interest in a share, we will, upon exercise, round down to the nearest whole number the number of shares of Class A Common Stock to be issued to the holder. As a result, a holder of a number of warrants that would not convert into a whole number of shares of Class A Common Stock must sell any excess warrants in order to obtain full value from the fractional interest that will not be issued.
32
USE OF PROCEEDS
All of the shares of Class A Common Stock and private placement warrants offered by the selling securityholders will be sold by them for their respective accounts. We will not receive any of the proceeds from these sales.
The selling securityholders will pay any underwriting fees, discounts, selling commissions, stock transfer taxes and certain legal expenses incurred by such selling securityholders in disposing of their shares of Class A Common Stock and private placement warrants, and we will bear all other costs, fees and expenses incurred in effecting the registration of such securities covered by this prospectus, including, without limitation, all registration and filing fees, NYSE listing fees, and fees and expenses of our counsel and our independent registered public accountants.
We will receive any proceeds from the exercise of the warrants or stock options for cash, but not from the resale of the shares of Class A Common Stock issuable upon such exercise. Assuming the exercise of all outstanding warrants for cash, we would receive aggregate proceeds of approximately $188.6 million. There is no assurance that the warrants will be in the money prior to their expiration or that the warrant holders will exercise their warrants. The Sponsor and its permitted transferees have the option to exercise the private placement warrants on a cashless basis, and the public warrants are exercisable on a cashless basis under the circumstances specified in the Warrant Agreement. To the extent that any warrants are exercised on a cashless basis, the amount of cash we would receive from the exercise of the warrants would decrease. We believe that the likelihood that warrant holders will exercise their warrants, and therefore the amount of cash proceeds that we would receive, is dependent upon the market price of our Class A Common Stock. If the market price for our Class A Common Stock is less than the exercise specified in the Warrant Agreement, we believe warrant holders will be unlikely to exercise the warrants.
We intend to use the proceeds received from the exercise of the warrants or stock options, if any, for general corporate purposes, which may include capital expenditures, potential acquisitions, growth opportunities and strategic transactions. However, we have not designated any specific uses and have no current agreement with respect to any acquisition or strategic transaction.
33
DIVIDEND POLICY
We have not paid any cash dividend on our Common Stock to date, and have no current plans to pay dividends on our Common Stock. The declaration, amount and payment of any future dividends on shares of Common Stock is at the sole discretion of our board of directors, and we may reduce or discontinue entirely the payment of such dividends at any time. Our board of directors may take into account general and economic conditions, our financial condition and operating results, our available cash and current and anticipated cash needs, capital requirements, contractual, legal, tax, and regulatory restrictions, and implications on the payment of dividends by us to our stockholders or by our subsidiaries to us, and such other factors as our board of directors may deem relevant. Any financing arrangements that we or our subsidiaries enter into may include restrictive covenants that limit our ability to pay dividends.
34
MANAGEMENT’S DISCUSSION AND ANALYSIS OF FINANCIAL CONDITION AND RESULTS OF OPERATIONS
Unless the context otherwise requires, all references in this section to the “Company,” “we,” “us,” or “our” refer to the business of Starry and its subsidiaries prior to the consummation of the Business Combination, and to Starry Group and its subsidiaries following the consummation of the Business Combination.
You should read the following discussion and analysis of our financial condition and results of operations together with our consolidated financial statements and related notes included elsewhere in this prospectus. This discussion contains forward-looking statements based upon current plans, expectations and beliefs involving risks and uncertainties. Our actual results may differ materially from those anticipated in these forward-looking statements as a result of various factors, including those set forth under the “Risk Factors” and “Cautionary Statement Regarding Forward-Looking Statements” sections and elsewhere in this prospectus, our actual results may differ materially from those anticipated in these forward-looking statements.
Overview
We have developed a unique and innovative solution to provide last mile fixed broadband using a proprietary fixed wireless technology stack operating in licensed spectrum. We design and build our own fixed wireless equipment, cloud-based network control plane and billing and operations support systems to run our network and provide our service. We deploy this technology across a variety of markets to provide a robust and competitively-priced broadband service to customers. The integration of our own technology and service delivery allows us to efficiently deploy new competitive broadband networks to connect communities across the country with a tailored cost structure and a focus on the customer experience.
Since our inception, we have developed the technology, optimized the unit economics, acquired spectrum and deployed our network and acquired subscribers in Boston, Los Angeles, New York City, Denver, Washington, D.C. and Columbus.
Business Combination and Public Company Costs
Pursuant to the Merger Agreement, the Business Combination was consummated in two steps: (i) at the SPAC Merger Effective Time, FirstMark merged with and into Starry Group, with Starry Group surviving the SPAC Merger as a publicly traded entity and the sole owner of Merger Sub, and (ii) on the Acquisition Merger Effective Date, Merger Sub merged with and into Starry, with Starry surviving the Acquisition Merger as a wholly owned subsidiary of Starry Group.
Notwithstanding the legal form of the Business Combination pursuant to the Merger Agreement, the Business Combination is accounted for as a reverse recapitalization in accordance with the United States generally accepted accounting principles (“GAAP”). Under this method of accounting, FirstMark is treated as the acquired company and Starry is treated as the accounting acquirer and the Business Combination is treated as the equivalent of Starry issuing stock for the net assets of FirstMark, accompanied by a recapitalization. The net assets of FirstMark are stated at historical cost, with no goodwill or other intangible assets recorded. The financial statements of the combined entity represent the continuation of the consolidated financial statements of Starry in many respects and the financial statements of the combined entity represent the continuation of the consolidated financial statements of Starry in many respects.
The most significant change in our reported financial position and results was an increase in cash from gross proceeds of approximately $176.3 million, including $109.0 million from the sale of the PIPE Shares and $31.0 million from the sale of the Series Z Shares consummated substantially simultaneously with the Business Combination. Such gross proceeds were offset by $18.5 million of direct and incremental combined company transaction costs consisting of banking, legal and other professional fees. See “Note 1—Description of business” in the notes to our unaudited condensed consolidated financial statements included elsewhere in this prospectus.
As a consequence of the Business Combination, we became
an SEC-registered
and NYSE-listed company, which has required and will continue to require us to hire additional personnel and implement procedures and processes to address public company regulatory requirements and customary practices. We expect to incur additional annual expenses as a public company for, among other things, directors’ and officers’ liability insurance, director fees and additional internal and external accounting, legal and administrative resources, including increased audit and legal fees.Additionally, we expect our capital expenditures will increase significantly in connection with our ongoing activities, with a commensurate increase in our operating expenses as we:
| • | continue to invest in our technology to improve capacity and reduce cost; |
| • | deploy our network technology and capital equipment in additional domestic markets; |
| • | sign up new subscribers; |
35
| • | hire additional personnel; |
| • | obtain, maintain, expand, and protect our intellectual property and FCC spectrum license portfolio; and |
| • | operate as a public company. |
Key Factors Affecting Operating Results
We believe that our performance and future success depend on several factors that present significant opportunities for us but also pose risks and challenges, including those discussed below and in the section entitled “Risk Factors.”
Network Deployment
We have deployed our fixed wireless network in six markets to date, covering approximately 5.5 million households by the end of the first quarter of 2022. The number of markets that we anticipate launching per year is variable and depends on our capital allocation strategy; the competitive environment for internet services nationally, regionally, and locally at a point in time; government obligations, including our obligations under RDOF and any additional subsidy programs in which we might participate; new partnerships and other factors. We anticipate launching our network in one to six or more markets per year over the near to medium term.
The deployment of fixed wireless networks involves installing our base stations on tall vertical assets, which are connected to the internet through backhaul connections to the base stations, routed throughthe market. These networks serve the end customer locations, at which we install a transceiver to receive the signal, and
a point-of-presence in
a Wi-Fi router
in the premises to deliver the service. We then use these networks to provide service to our customers for a fee. The speed and scale of these deployments impact the universe of customers that we can serve, and therefore our revenues.In order to effectively manage supply chain to help meet product demand, we had $3.5 million in prepaid inventory parts and equipment as of March 31, 2022 recorded in prepaid expenses and other current assets on the condensed consolidated balance sheet.
Customer Demand
We currently sell a stand-alone broadband product for a flat monthly fee. Broadband demand continues to grow, and broadband plays an essential role in society—it is used for education, work, healthcare and entertainment. Consumer demand for broadband is incredibly robust—it has become a necessity—and we expect it to continue to grow into the future. However, to the extent consumer sentiment towards broadband services changes, it would impact our customer penetration and therefore our revenues.
Customer Acquisition
We acquire customers through three primary sales strategies. First, for larger apartment and condominium buildings, we enter into simple access agreements with the building owners or associations, as applicable, giving us permission to install our transceiver and use the buildings’ wiring to provide the service to their residents. Then, we sell the service directly to the residents. We use a variety of marketing techniques for these sales and acquisition efforts, including in person events, email and traditional mail. Second, for small apartment and condominium buildings and single-family homes we sell the service directly to the consumer through digital marketing channels, email, traditional mail and outdoor media. We then obtain permission from the resident to install our transceiver at the building or single-family home as part of the account creation process. Third, for apartment and condominium buildings of various sizes, we enter into bulk billing agreements where the building owner, association or other third party (e.g., a management company or short-term rental company) purchases the service for a specified number of units at the building and pays us directly for such services. We use a variety of marketing techniques for these sales and acquisition efforts, including in person meetings and email. To the extent that these efforts are unsuccessful, it would impact our customer penetration and therefore our revenue.
Seasonality and Housing Trends
Our customers today are all residential subscribers, and the majority of our customers in the future will continue to be residential subscribers. There are some seasonal trends that affect our customer acquisition activities, and they can vary by market. We expect these season variations to offset as we expand to additional markets, thereby minimizing their impact. Examples include markets with larger college and university student populations, which tend to move in and move out of residences within the same time frame. In addition, consumers naturally consider their broadband provider at the time at which they move to a new residence. To the extent that the velocity of moving changes over time, it would impact our subscriber acquisition and revenues.
36
Incumbent Competition
We compete with several large incumbent fixed wireline providers, which can vary by market. In some instances, we also compete with mobile providers to the extent that an individual consumer considers a mobile service a substitute for a fixed service. We have built our business to allow us to compete effectively with very low penetration rates in any market, and by offering very competitive pricing. In any market, an incumbent provider may engage in promotional activities or price competition, which would impact our subscriber acquisition and revenues.
Basis of Presentation
We conduct business through one operating segment. See “Note 2—Summary of significant accounting policies” in the notes to our audited consolidated financial statements included elsewhere in this prospectus.
Key Components of Statements of Operations
Revenues
We deliver high speed and competitively priced broadband service and related support on a subscription basis to our customers in the Boston, Los Angeles, New York City, Denver, Washington, D.C. and Columbus markets using innovative and proprietary wireless technology. Our subscription rate for such services issubscribers who do not have long-term contracts with us, but a small number are building owners or property management companies who have a commercial arrangement with us whereby they compensate us directly for providing our internet services in their buildings.
a per-month fixed
price, without data caps. Most of our customersare month-to-month individual
We expect our revenues to continue to increase as we acquire new subscribers in existing markets and new markets we plan to enter, and as we introduce new products and services.
Cost of revenues
Cost of revenues includes, but is not limited to, costs incurred supporting national network service costs, fiber backhaul costs, site rent and utilities, customer care and national operations personnel, freight charges, deployed equipment costs, associated depreciation, vehicle-related expenses, repairs and maintenance costs and unabsorbed direct labor associated with our equipment assembly operation among other costs.
We expect our cost of revenues to continue to increase in absolute dollar terms for the foreseeable future as we continue to grow in our existing markets as well as expand into new markets.
Selling, general and administrative expenses
Selling, general and administrative expenses primarily consist of personnel costs that include salaries and wages, commissions, payroll taxes, employee benefits and certain employee expenses along with software and equipment expenses, recruiting expenses, professional fees, depreciation, facilities related expenses, marketing expenses and other fees.
We expect our selling, general and administrative expenses to increase in absolute dollar terms for the foreseeable future as we scale headcount to keep pace with the growth of our business, and as a result of operating as a public company, including the incremental costs associated with SEC compliance, legal, audit, insurance and investor relations activities and other administrative and professional services, including one-time transaction related expenses.
Research and development expenses
Research and development activities help to increase our network capacity over time and further improve our unit economics by reducing the cost of network elements.
Research and development expenses include, but are not limited to, costs incurred in performing engineering and prototype manufacturing activities relating to our products and services, including salaries, benefits, facilities, rent, software, depreciation, research-related overhead expenses, contracted services, license fees and other external costs. Such expenses are critical to supporting our
innovative low-cost hardware
and cloud-based software solutions, including increasing capacity and decreasing cost over time.37
We expect our research and development expenses to increase in absolute dollar terms for the foreseeable future as we invest in new technologies to achieve our operational and commercial goals of expanding our capacity and lowering costs.
Interest expense
Interest expense consists primarily of interest (both cash and
non-cash)
incurred on our debt obligations.Other income (expense), net
Other income (expense), net consists primarily of the fair value adjustments related to our derivative liabilities, earnout liabilities, warrant liabilities, losses on extinguishment of debt and distributions to certain shareholders, partially offset by interest income earned on our interest-bearing accounts.
Results of Operations
Comparison of the three months ended March 31, 2022 and 2021
The following table summarizes our results of operations on a consolidated basis for the three months ended March 31, 2022 and 2021 (in thousands, except shares and per share data):
Three Months Ended March 31, | $ | % | ||||||||||||||
2022 | 2021 | Change | Change | |||||||||||||
Revenues | $ | 7,370 | $ | 4,523 | $ | 2,847 | 62.9 | % | ||||||||
Cost of revenues | (18,191 | ) | (12,504 | ) | (5,687 | ) | 45.5 | % | ||||||||
Gross loss | (10,821 | ) | (7,981 | ) | (2,840 | ) | 35.6 | % | ||||||||
Operating expenses: | ||||||||||||||||
Selling, general and administrative expenses | (25,090 | ) | (14,210 | ) | (10,880 | ) | 76.6 | % | ||||||||
Research and development | (8,227 | ) | (5,942 | ) | (2,285 | ) | 38.5 | % | ||||||||
Total operating expenses | (33,317 | ) | (20,152 | ) | (13,165 | ) | 65.3 | % | ||||||||
Loss from operations | (44,138 | ) | (28,133 | ) | (16,005 | ) | 56.9 | % | ||||||||
Other income (expense): | ||||||||||||||||
Interest expense | (7,530 | ) | (7,655 | ) | 125 | (1.6 | )% | |||||||||
Other income (expense), net | (1,965 | ) | (5,258 | ) | 3,293 | (62.6 | )% | |||||||||
Total other expense | (9,495 | ) | (12,913 | ) | 3,418 | (26.5 | )% | |||||||||
Net loss | $ | (53,633 | ) | $ | (41,046 | ) | $ | (12,587 | ) | 30.7 | % | |||||
Net loss per share of common stock, basic and diluted | $ | (1.29 | ) | $ | (1.13 | ) | $ | (0.16 | ) | 14.2 | % | |||||
Weighted-average shares outstanding, basic and diluted | 41,633,152 | 36,239,733 | 5,393,419 | 14.9 | % | |||||||||||
Revenues
Revenues grew by $2.8 million, or 62.9%, for the three months ended March 31, 2022 compared to the three months ended March 31, 2021, as a result of an increase in our customer relationships from 41,532 to 71,247. The increase in our customer relationships is primarily driven by customer acquisition on our deployed network and incremental network expansion, partially offset by a decline in ARPU.
Cost of revenues
Cost of revenues increased by $5.7 million, or 45.5%, for the three months ended March 31, 2022 compared to the three months ended March 31, 2021, primarily due to an increase of $3.1 million in deployed equipment depreciation related to our network expansion, with the remainder predominantly due to headcount related expenses and network service costs.
Selling, general and administrative expenses
Selling, general and administrative expenses increased by $10.9 million, or 76.6%, for the three months ended March 31, 2022 compared to the three months ended March 31, 2021, primarily driven by increases of $6.6 million in headcount related expenses including $2.7 million in one-time deal incentive payments related to the Business Combination and $2.4 in stock-based compensation predominantly due to RSUs for which the related performance condition was met upon consummation of the Business Combination, and $1.1 million in software subscription expenses.
Research and development expenses
Research and development expenses increased by $2.3 million, or 38.5%, for the three months ended March 31, 2022, compared to the three months ended March 31, 2021, primarily driven by increases of $1.9 million in headcount related expenses to support the development of our network and development of next generation equipment, including $1.1 million in stock-based compensation predominantly due to RSUs for which the related performance condition was met upon consummation of the Business Combination.
Interest expense
Interest expense decreased by $0.1 million, or 1.6%, for the three months ended March 31, 2022, compared to the three months ended March 31, 2021, primarily driven by an increase in paid-in-kind interest expense of $1.8 million incurred on the Starry Credit Agreement (as defined below) and amortization of debt discounts of $1.0 million, offset by a decrease in amortization of $2.7 million and interest expense of $0.2 million related to the beneficial conversion feature on the 2020 Notes and the 2021 Notes (each as defined in “Note 4—Debt” in the notes to our unaudited condensed consolidated financial statements included elsewhere in this prospectus) that settled in the first quarter 2021.
Other income (expense), net
Total other income (expense), net decreased by $3.3 million, or 62.6%, for the three months ended March 31, 2022, compared to the three months ended March 31, 2021, primarily driven by the loss on extinguishment of debt during the three months ended March 31, 2021 with no corresponding debt extinguishment during the three months ended March 31, 2022, the recognition of $3.9 million in distributions to Non-Redeeming Shareholders, and the fair value adjustments related to derivative liabilities. Such adjustments included a $5.2 million gain on change in fair value of Earnout Shares and a $2.2 million gain on change in fair value of liability-classified Starry Warrants, partially offset by a $2.5 million loss on change in fair value of Common Stock Warrants, a $2.0 million loss on the recognition of the Junior Debt Exchange and a $1.0 million loss on change in fair value of the Prepayment Penalty. See “Note 2—Basis of presentation and summary of significant accounting policies” and “Note 4—Warrants and earnout shares” in the notes to our unaudited condensed consolidated financial statements included elsewhere in this prospectus.
Net loss
Net loss increased by $12.6 million, or 30.7%, for the three months ended March 31, 2022, compared to the three months ended March 31, 2021, primarily driven by the factors described above
Comparison for the years ended December 31, 2021 and 2020
The following table summarizes our results of operations on a consolidated basis for the years ended December 31, 2021 and 2020 (in thousands, except shares):
Years Ended December 31, | $ | % | ||||||||||||||
2021 | 2020 | Change | Change | |||||||||||||
Revenues | $ | 22,263 | $ | 12,826 | $ | 9,437 | 73.6 | % | ||||||||
Cost of revenues | (58,363 | ) | (38,529 | ) | (19,834 | ) | 51.5 | % | ||||||||
Gross loss | (36,100 | ) | (25,703 | ) | (10,397 | ) | 40.5 | % | ||||||||
Operating expenses: | ||||||||||||||||
Selling, general and administrative expenses | (67,129 | ) | (55,240 | ) | (11,889 | ) | 21.5 | % | ||||||||
Research and development | (26,308 | ) | (22,957 | ) | (3,351 | ) | 14.6 | % | ||||||||
Total operating expenses | (93,437 | ) | (78,197 | ) | (15,240 | ) | 19.5 | % | ||||||||
Loss from operations | (129,537 | ) | (103,900 | ) | (25,637 | ) | 24.7 | % | ||||||||
Other income (expense): | ||||||||||||||||
Interest expense | (24,739 | ) | (19,382 | ) | (5,357 | ) | 27.6 | % | ||||||||
Other income (expense), net | (12,269 | ) | (1,811 | ) | (10,458 | ) | 577.5 | % | ||||||||
Total other expense | (37,008 | ) | (21,193 | ) | (15,815 | ) | 74.6 | % | ||||||||
Net loss | $ | (166,545 | ) | $ | (125,093 | ) | $ | (41,452 | ) | 33.1 | % | |||||
Net loss per share of voting and non-voting common stock, basic and diluted | $ | (4.55 | ) | $ | (3.50 | ) | $ | (1.05 | ) | 30.1 | % | |||||
Weighted-average shares outstanding, basic and diluted | 36,569,966 | 35,743,961 | 826,005 | 2.3 | % | |||||||||||
38
Revenues
Revenues grew by $9.4 million, or 73.6%, for the year ended December 31, 2021 compared to the year ended December 31, 2020, as a result of an increase in our customer relationships primarily driven by further network expansion in the markets we serve (i.e., an increase in homes serviceable) and increased penetration.
Cost of revenues
Cost of revenues increased by $19.8 million, or 51.5%, for the year ended December 31, 2021 compared to the year ended December 31, 2020, primarily due to increases of $9.7 million in deployed equipment depreciation related to our network expansion, $1.6 million in rental payments related to our base stations and revenue share payments to our building owners, $2.8 million related to headcount growth in customer service and national network operations, $2.4 million in fiber costs, $1.1 million in inventory reserves and write-offs and $0.6 million of incremental expenses related to additional fleet vehicles needed to expand our service capabilities in the markets we serve.
Selling, general and administrative expenses
Selling, general and administrative expenses increased by $11.9 million, or 21.5%, for the year ended December 31, 2021 compared to the year ended December 31, 2020, primarily driven by increases of $5.9 million in salaries and benefits, $2.3 million in marketing costs, $0.9 million in software subscriptions, $0.7 million in outside consulting professional fees, $0.4 million in employee travel costs, $0.4 million in rent expense, $0.3 million in business insurance and $0.3 million in stock-based compensation expense.
Research and development expenses
Research and development expenses increased by $3.4 million, or 14.6%, for the year ended December 31, 2021 compared to the year ended December 31, 2020, primarily driven by increases of $1.7 million in salaries and benefits, $0.6 million in engineering related costs and $0.4 million in consulting services.
Interest expense
Interest expense increased by $5.4 million, or 27.6%, for the year ended December 31, 2021 compared to the year ended December 31, 2020, primarily driven by an increaseexpense of $2.7 million incurred on the Starry Credit Agreement and amortization of debt discounts of $1.1 million and $1.1 million, respectively, related to the beneficial conversion feature associated with the issuance of $31.2 million of the 2020 Notes (as defined below) in September 2020 and the detachable warrants issued with the Starry Credit Agreement. Such increase also included the amortization of deferred financing costs of $0.4 million.
in paid-in-kind interest
Other income (expense), net
Total other income (expense), net increased by $10.5 million, or 577.5%, for the year ended December 31, 2021 compared to the year ended December 31, 2020. This increase was primarily driven by the loss on extinguishment of debt and the fair value adjustment of the derivative liability recorded for the accelerated repayment feature on the Term Loans (as defined below). See “Note 4—Debt” in the notes to our audited consolidated financial statements included elsewhere in this prospectus.
Net loss
Net loss attributable to our shareholders increased by $41.5 million, or 33.1%, for the year ended December 31, 2021, compared to the year ended December 31, 2020, primarily driven by the factors described above.
Key Business Metrics and
Non-GAAP Financial
MeasuresWe use the following metrics to evaluate our performance, identify trends, formulate financial projections, and make strategic decisions. We believe that these metrics provide useful information to investors and others in understanding and evaluating our results of operations in the same manner as our management team.
39
The following table summarizes our key business metrics
and non-GAAP financial
measures for the periods indicated:Three Months Ended March 31, | Years Ended December 31, | |||||||||||||||
2022 | 2021 | 2021 | 2020 | |||||||||||||
Addressable Households | 9,691,029 | 9,691,029 | 9,691,029 | 9,691,029 | ||||||||||||
Homes Serviceable | 5,473,341 | 4,544,723 | 5,307,453 | 4,162,009 | ||||||||||||
Customer Relationships | 71,247 | 41,532 | 63,230 | 34,495 | ||||||||||||
Penetration of Homes Serviceable | 1.30 | % | 0.91 | % | 1.19 | % | 0.83 | % | ||||||||
Revenue (000s) | $ | 7,370 | $ | 4,523 | $ | 22,263 | $ | 12,826 | ||||||||
Average Revenue Per User (“ARPU”) | $ | 36.54 | $ | 39.66 | $ | 37.97 | $ | 39.68 | ||||||||
Net Loss (000s) | $ | (53,633 | ) | $ | (41,046 | ) | $ | (166,545 | ) | $ | (125,093 | ) | ||||
Adjusted EBITDA (000s) | $ | (27,812 | ) | $ | (21,818 | ) | $ | (98,745 | ) | $ | (83,590 | ) | ||||
Addressable Households
Addressable Households are the estimated total number of households within our service territory that we could serve in the markets where we intend to deploy or have deployed a network, assuming the network was fully built and we could serve every household. We calculate the Addressable Households by counting the total households within our spectrum license areas meeting a specified threshold of household density. Addressable Households grows as we begin to execute plans to expand our network in new markets or in new parts of existing markets, and will follow a growth trend as we expand the network. Growth in Addressable Households precedes growth in Homes Serviceable.
Addressable Households remained unchanged from December 31, 2020 to December 31, 2021 and from March 31, 2021 to March 31, 2022, because we did not add new markets during such period and continued to expand within the existing markets we serve by deploying incremental network assets.
Homes Serviceable
Homes Serviceable are the estimated households that we could serve using the network that we have deployed in our markets at a given date. This is a subset of the Addressable Households and reflects the size of the network we have deployed as well as the households that we can technologically and commercially serve. Homes Serviceable is a count of all of the households that fall within the coverage area of our deployed network, and will grow as we continue to deploy our network in existing markets and as we deploy in new markets as we expand our Addressable Households.
Homes Serviceable increased by 1.1 million, or 27.5%, for the year ended December 31, 2021 in comparison to the year ended December 31, 2020, and by 0.9 million, or 20.4%, for the three months ended March 31, 2022 in comparison to the three months ended March 31, 2021. Such increases were primarily due to the deployment of incremental network assets within the markets that we serve.
Customer Relationships
Customer Relationships include customers who have signed up for a service and all units that are billed under our bulk billing arrangements where a building owner, association, or other third-party is invoiced for a specific number of units within multiple dwelling unit buildings. Customer Relationships include Starry internet service, currently our only service, and will include unique relationships for small and medium size business service, voice service, and potentially other services in the future.
Customer Relationships increased by 28.7 thousand, or 83.3%, for the year ended December 31, 2021 in comparison to the year ended December 31, 2020 and by 29.7 thousand, or 71.5%, for the three months ended March 31, 2022 in comparison to the three months ended March 31, 2021. Such increases were primarily due to new customers signing up for our services and to a lesser extent additional bulk billing arrangements for such services sold to third parties who manage or own multifamily dwelling unit buildings.
Penetration of Homes Serviceable
Penetration of Homes Serviceable is the ratio of the total number of Customer Relationships to the total number of Homes Serviceable and represents the percentage of households that can receive service with which we have developed a Customer Relationship. Penetration of Homes Serviceable grows as markets mature, but may fluctuate depending on the pace of our network expansion if growth in the denominator (Homes Serviceable) significantly outpaces the numerator (Customer Relationships).
Average revenue per user (“ARPU”)
We use ARPU to evaluate and monitor the amount of revenue generated by customers and analyze growth patterns. ARPU values represent total revenue divided by the average number of customer relationships at the beginning and end of each period, divided by the number of months in the period.
40
We believe ARPU is useful to investors in evaluating our operating performance. ARPU and similar measures with similar titles are common measures used by investors, analysts and peers to compare performance in our industry, although our measure of ARPU may not be directly comparable to similarly titled measures reported by other companies.
ARPU decreased by $1.71, or 4.3%, for the year ended December 31, 2021 in comparison to the year ended December 31, 2020 and by $3.12, or 7.9%, for the three months ended March 31, 2022 in comparison to the three months ended March 31, 2021, primarily due to the use of customer promotional plans to increase penetration in the markets that we serve.
Adjusted EBITDA
Adjusted EBITDA is
a non-GAAP financial
measure and is determined based on EBITDA (Earnings Before Interest, Taxes, Depreciation and Amortization), adjusted to exclude certain unusualor non-recurring items,
certain non-cash items
and other items that are not indicative of ongoing operations (including stock-based compensation expenses, loss on extinguishment of debt and the fair value adjustment of derivative liabilities). Adjusted EBITDA is frequently used by management, research analysts, investors and other interested parties to evaluate companies. We believe that this measure is helpful in highlighting trends in our operating results, because it excludes the impact of items that are outside the control of management or not reflective of our ongoing operations and performance.Adjusted EBITDA is a measure not defined under GAAP. It has limitations, because it excludes certain types of expenses and it does not reflect changes in working capital needs. Furthermore, other companies may calculate adjusted EBITDA or similarly entitled measures differently, limiting their usefulness as comparative measures.
Adjusted EBITDA is presented here as a supplemental measure only. You are encouraged to evaluate each adjustment.
For a historical reconciliation of Adjusted EBITDA to its most directly comparable GAAP measure, net loss, please refer to the table below.
(in thousands) | Three months ended March 31, 2022 | Three months ended March 31, 2021 | Year ended December 31, 2021 | Year ended December 31, 2020 | ||||||||||||
GAAP Net Loss | $ | (53,633 | ) | $ | (41,046 | ) | $ | (166,545 | ) | $ | (125,093 | ) | ||||
Adjustments: | ||||||||||||||||
Add: Interest expense, net | 7,530 | 7,654 | 24,738 | 19,343 | ||||||||||||
Add: Depreciation and amortization | 9,332 | 6,095 | 29,463 | 19,350 | ||||||||||||
Add: Non-recurring transaction related expenses (1) | 3,287 | — | — | — | ||||||||||||
(Subtract)/Add: (Gain)/loss on fair value adjustment of derivative liabilities | (1,923 | ) | 2,898 | 8,562 | 1,850 | |||||||||||
Add: Recognition of distribution to non-redeeming shareholders | 3,888 | — | — | — | ||||||||||||
Add: Loss on extinguishment of debt | — | 2,361 | 3,727 | — | ||||||||||||
Add: Share-based compensation | 3,707 | 220 | 1,310 | 960 | ||||||||||||
Adjusted EBITDA | $ | (27,812 | ) | $ | (21,818 | ) | $ | (98,745 | ) | $ | (83,590 | ) | ||||
| (1) | We add back expenses that are related to transactions that occurred during the period that are expected to be non-recurring, including mergers and acquisitions and financings. Generally these expenses are included within selling, general and administrative expense in the condensed consolidated statements of operations. For the three months ended March 31, 2022, such transactions comprised of the Business Combination, the sale of the PIPE shares and the sale of the Series Z Preferred Stock shares. |
Liquidity and Capital Resources
Overview
We are an early-stage growth company and have generated losses and negative cash flows from operating activities since inception. Our principal sources of liquidity have been generated through a combination of cash flows from borrowings and the issuances equity. We expect that our primary ongoing requirements for cash will be used to execute on our strategic initiatives through (i) investing in our technology, (ii) expanding our domestic footprint and (iii) hiring personnel. We require additional capital investment to execute the strategic business plan to grow our subscriber base in existing markets from already-deployed network assets and launch services in new markets. Management plans to raise additional capital through a combination of potential options, including but not limited to, equity and debt financings.
41
At December 31, 2021 our principal sources of liquidity were cash and cash equivalents of $29.4 million and consist of checking and interest-bearing accounts, of which $15.0 million cannot be accessed in accordance with the Starry Credit Agreement. At March 31, 2022 our principal sources of liquidity were cash and cash equivalents of $166.7 million and consist of checking and interest-bearing accounts, of which $15.0 million cannot be accessed in accordance with the Starry Credit Agreement
Upon consummation of the Business Combination on March 29, 2022, we raised gross proceeds of approximately $176.3 million, including $109.0 million from the sale of the PIPE Shares, $36.3 million from the contribution of cash held in FirstMark’s trust account from its initial public offering, and $31.0 million from the sale of the Series Z Shares. Such proceeds were used to pay $18.5 million of transaction fees and resulted in net cash proceeds of $157.8 million that went to the balance sheet.
Due to higher redemptions, such net cash proceeds of $157.8 million were lower than the $196.9 million and $483.4 million range we reflected in our minimum and maximum cash scenarios, as referenced in the section entitled “Summary—The Business Combination—Sources and Uses of Funds” in our proxy statement/prospectus filed with the SEC and dated February 11, 2022. As a result, we did not pay down the outstanding balance on the Starry Credit Agreement as previously contemplated and we will continue to seek additional funding from a variety of sources, as well as a potential refinancing of the Starry Credit Agreement. Additional equity financing may not be available, and if it is available, it may not be on terms favorable to the Company and could be dilutive to current stockholders. Debt financing, if available, may involve restrictive covenants and dilutive financing instruments.
As of March 31, 2022, we were in compliance with the financial covenants required by the Starry Credit Agreement. However, the inherent uncertainties, which include the fact that we are an early-stage growth company that has generated losses and negative cash flows from operating activities since inception and we will require additional capital investment to execute the strategic business plan to grow our subscriber base in existing markets from already-deployed network assets and launch services in new markets, may impact our ability to remain in compliance with these covenants over the next twelve months. If we breach our financial covenants and fail to secure a waiver or forbearance from the third-party lender, such breach or failure could accelerate the repayment of the outstanding borrowing under the Starry Credit Agreement or the exercise of other rights or remedies the third-party lender may have under applicable law. No assurance can be provided that a waiver or forbearance will be granted or the outstanding borrowing under the Starry Credit Agreement will be successfully refinanced on terms that are acceptable to us.
Our ability to access capital when needed is not assured and, if capital is not available to us when, and in the amounts needed, we could be required to delay, scale back or abandon some or all of our expansion efforts and other operations, which could materially harm our business, financial condition and results of operations. Because of this uncertainty, there is substantial doubt about our ability to continue as a going concern for at least one year from the date that the accompanying audited consolidated financial statements and unaudited condensed consolidated financial statements included elsewhere in this prospectus are issued, and therefore, whether we realize our assets and settle our liabilities in the normal course of business and at the amounts stated in the accompanying consolidated financial statements. The accompanying consolidated financial statements do not include any adjustments that might result from the outcome of this uncertainty, nor do they include adjustments to reflect the future effects of the recoverability or classification of recorded asset amounts and classification of liabilities that might be necessary should we be unable to continue as a going concern.
The sale of substantial amounts of shares of our Class A Common Stock or warrants being offered in this prospectus, or the perception that such sales could occur, could harm the prevailing market price of shares of our Class A Common Stock and warrants. These sales, or the possibility that these sales may occur, also might make it more difficult for us to sell equity securities in the future at a time and at a price that we deem appropriate. See “Risk Factors—Risks Related to Ownership of Our Securities—Future sales, or the perception of future sales, of our Class A Common Stock and warrants being offered in this prospectus by us or our existing securityholders could cause the market price for our Class A Common Stock and warrants to decline significantly.”.
Starry Credit Agreement
In February 2019, we entered into a credit agreement among Starry, Starry Spectrum Holdings LLC, Starry (MA), Inc., Starry Spectrum LLC, Testco LLC, Widmo Holdings LLC and Vibrant Composites Inc., as borrowers, the lenders party thereto from time to time and ArrowMark Agency Services, LLC, as administrative agent, as amended, restated, amended and restated, supplemented or otherwise modified from time to time (the “Starry Credit Agreement”) to provide a total of $50.0 million in two separate loan tranches, $27.5 million and $22.5 million, and drew on the full amount of each tranche in February 2019 and June 2019, respectively. In December 2019, we amended the Starry Credit Agreement with a syndicate of lenders, providing for an additional loan tranche of $75.0 million, which we immediately drew upon in full (collectively, the “2019 Term Loans”).
In June 2021, we entered into a Third Amendment and Waiver to the Starry Credit Agreement (the “Third Amendment and Waiver”). The Third Amendment and Waiver amended and restated two affirmative covenants that we were not in compliance with as of December 31, 2020, including extending the time period in which we are required to deliver audited financial statements without a “going concern” or like qualification, exception or emphasis and extending the time period in which we are required to deliver a budget for fiscal year 2021.
The non-compliance with
covenants is an event of default which would have required the outstanding long-term debt balance to be payable upon demand. In addition to the amendment and restatement, the Third Amendment and Waiver waived any events of default in existence on the Third Amendment and Waiver effective date. The lender retained all other covenant requirements.In conjunction with entering into the 2019 Term Loans, we issued warrants to the lender in two tranches in February 2019 and December 2019 of 3.2 million and 2.8 million, respectively.
In October 2021, we entered into the Fifth Amendment to the Starry Credit Agreement (the “Fifth Amendment”) with a syndicate of lenders, providing for an additional tranche of $40.0 million which we immediately drew upon in full (“Tranche C Term Loan”) and up to an additional $10.0 million in delayed draw loans which we fully drew upon in January 2022 (“Delayed Draw Tranche C Loan”) (collectively, with the Tranche C Term Loan and 2019 Term Loans, the “Term Loans”).
In conjunction with entering into the Tranche C Term Loan, we entered into a Warrant Purchase Agreement as of October 6, 2021 (the “Warrant Purchase Agreement”), and issued to the lenders warrants to purchase 2.1 million shares (the “Initial Tranche C Warrants”). Warrants to purchase an additional 0.5 million shares are contingently issuable subject to our drawing down on the Delayed Draw Tranche C Loan (the “Delayed Draw Tranche C Warrants,” and together with the Initial Tranche C Warrants, the “Tranche C Warrants”). Upon issuance of such warrants, 25% immediately vested and became exercisable. As the Business Combination closed prior to April 15, 2022, the Tranche C Warrants are exercisable solely with respect to the 25% of the warrant shares that vested immediately upon issuance, whereas the remaining 75% of unvested warrants were forfeited. We determined the fair value per share of our underlying Common Stock of the Warrant Purchase Agreement to be $9.83 per the terms of the Business Combination.
The loans incur interest at a rate equal to the London Interbank Offered Rate (“LIBOR”), subject to a floor of 2.0% plus an applicable margin of 9.0%, capped at 13.25% annually. Pursuant to the Starry Credit Agreement, we elected to pay the accrued interest on
an in-kind basis
by increasing the principal balance outstanding, payable in its entirety at maturity in February 2024. Outstanding borrowings plus accrued paid-in-kind interest were $218.5 million as of March 31, 2022. As of March 31, 2022, we had deferred financing costs and discounts on warrants on these loans in the amount of $2.2 million and $15.1 million, respectively.On March 26, 2022, we entered into a Seventh Amendment to the Starry Credit Agreement (the “Seventh Amendment”). The Seventh Amendment amended and restated an affirmative covenant requiring us to provide annual audited financial statements without a “going concern” or like qualification, exception or emphasis. In addition, the Seventh Amendment redefined the term “Change in Control” to exclude the aforementioned Business Combination with respect to contemplating the prepayment penalty. As a result of such amendments, we were in compliance with all bank covenants as of December 31, 2021. Without such amendments we would have been in default and the outstanding long-term debt balance would be payable upon demand. The lender retained all other covenant requirements.
42
Capital lease obligations
Throughout the period we entered into capital leases for vehicles and equipment with various vendors with payments due monthly extending through 2025. As of March 31, 2022, we owed $2.5 million under such lease obligations.
Strategic partner arrangement
In June 2020, we entered into
a 10-year arrangement
with AEPV (the “Strategic Partner Arrangement”) to jointly deploy a fixed wireless broadband network in a new market. AEPV has agreed to fund the equipment necessary to deliver the service in exchange for a revenue sharing arrangement whereby they will be entitled to a percentage of revenue earned by us in the new market. Pursuant to the arrangement, we will sell in exchange for cash consideration the equipment to AEPV and lease the equipment back. The seller-financing portion of the transaction created a form of continuing involvement which precludes sale-leaseback accounting until the related amounts due are paid in full. Accordingly, we accounted for the sale-leaseback as a financing transaction with AEPV, with the equipment remaining on our books at its then carrying value, the net cash proceeds received being reflected as a financing obligation and the expected future payments under the revenue sharing agreement to the third party being treated as debt service applied to interest and principal over theinitial 10-year term.
The discount rate is calculated based on expected future payments under the revenue sharing agreement. AEPV has the right to terminate the arrangement for any reason no earlier than June 2023. In the event of an early termination, we are required to repurchase the equipment at a repurchase price equal to the net book value of the equipment as reflected on the third party’s balance sheet at the time of termination. We have made an accounting policy election to use the prospective method to account for changes in actual or estimated cash flows related to the debt service. See “Note 12—Commitments and contingencies” in the notes to our audited consolidated financial statements and “Note 12—Commitments and contingencies” in the notes to our unaudited condensed consolidated financial statements included elsewhere in this prospectus.Purchase commitments
Throughout the period we entered
into non-cancelable purchase
commitments with various contract manufacturers to purchase materials and associated support to maintain and improve our existing distribution system as well as build out new networks and distribution systems. As of March 31, 2022, we had non-cancelable commitments totaling $41.4 million.Convertible notes payable
In September 2020, we issued convertible notes (the “2020 Notes”) payable in exchange for cash totaling $31.2 million. The 2020 Notes bear interest of 3.0% annually and matured in June 2021. In 2021 and 2020, such notesof $0.3 million and $0.3 million, respectively. Such proceeds were used for building out the network and general working capital purposes.
accrued paid-in-kind interest
One current shareholder who is a related party purchased approximately $2.3 million of the 2020 Notes. See “Note 4—Debt” in the notes to our audited consolidated financial statements included elsewhere in this prospectus for more information.
In January 2021, we issued convertible notes (the “January 2021 Notes”) payable in exchange for cash totaling $6.0 million. The January 2021 Notes bear interest of 3.0% annually and mature in October 2021. In 2021, the January 2021 Notesof less than $0.1 million.
accrued paid-in-kind interest
In March 2021, we issued convertible notes (the “March 2021 Notes” and, together with the January 2021 Notes, the “2021 Notes”) payable in exchange for cash totaling $5.0 million. The March 2021 Notes bear interest of 3.0% annually and mature in October 2021. In 2021, the March 2021 Notesof less than $0.1 million.
accrued paid-in-kind interest
Two current shareholders who are related parties purchased $3.0 million and $5.0 million, respectively of the 2021 Notes. See “Note 4—Debt” in the notes to our audited consolidated financial statements included elsewhere in this prospectus for more information.
In March 2021, we closed on an issuance of Starry Series E Preferred Stock (inclusive of Starry
Series E-1 Preferred
Stock, StarrySeries E-2 Preferred
Stock and StarrySeries E-3 Preferred
Stock), generating cash proceeds, net of issuance costs, of approximately $119.9 million and converted all $42.8 million of our outstanding 2020 Notes and 2021 Notes into shares of StarrySeries E-1 Preferred
Stock and StarrySeries E-2 Preferred
Stock, respectively.Short term liquidity requirements
As a growth company, the net losses we have incurred since inception are in accordance with our strategy and forecast. We will continue to incur net losses in accordance with our operating plan as we continue to expand our platform development to improve our existing technology and expand into new markets.
43
We incurred a net loss of $166.5 million for the year ended December 31, 2021 and a net loss of $125.1 million for the year ended December 31, 2020. As of December 31, 2021, our current assets were $43.9 million, consisting primarily of cash and cash equivalents of $29.4 million, which are primarily deposited with financial institutions, prepaid expenses and other current assets of $7.1 million and deferred costs of $7.0 million, and our current liabilities were $33.1 million, consisting of accounts payable totaling $6.8 million, accrued expenses and other current liabilities totaling $23.2 million, unearned revenue totaling $1.6 million, and the current portion of our debt totaling $1.5 million.
We incurred a net loss of $53.6 million and $41.0 million for the three months ended March 31, 2022 and 2021. As of March 31, 2022, our current assets were $173.4 million, consisting primarily of cash and cash equivalents of $166.7 million, which are primarily deposited with financial institutions, and our current liabilities were $40.6 million, consisting of accounts payable totaling $7.4 million, accrued expenses and other current liabilities totaling $30.1 million, unearned revenue totaling $1.6 million, and the current portion of our debt totaling $1.5 million.
Long term liquidity requirements
As a result of the consummation of the Business Combination, the sale of the PIPE Shares and the sale of the Series Z Shares, we successfully raised gross proceeds of $36.2 million, $109.0 million and $31.0 million, respectively. However, our existing capital resources may be insufficient to meet our long-term liquidity requirements. We may be required to raise additional capital to meet our long-term liquidity requirements through either further equity or debt financing. If we raise funds by issuing equity securities, dilution to existing stockholders may result. Any equity securities issued may also provide for rights, preferences or privileges senior to those of existing holders of our Common Stock, as applicable. If we raise funds by issuing debt securities, these debt securities would have rights, preferences and privileges senior to those of holders of our Common Stock, as applicable. The terms of additional debt securities or borrowings could impose significant restrictions on our operations. The credit market and financial services industry have in the past, and may in the future, experience periods of upheaval that could impact the availability and cost of equity and debt financing.
Cash Flows
The following table summarizes our net cash provided by or used in operating activities, investing activities, and financing activities for the periods indicated and should be read in conjunction with our consolidated financial statements and the notes thereto:
Three Months Ended March 31, | ||||||||
2022 | 2021 | |||||||
(unaudited) (in thousands) | ||||||||
Net cash provided by (used in) | ||||||||
Operating activities | $ | (22,390 | ) | $ | (17,267 | ) | ||
Investing activities | (16,750 | ) | (10,016 | ) | ||||
Financing activities | 176,449 | 132,190 | ||||||
Net change in cash and cash equivalents | $ | 137,309 | $ | 104,907 | ||||
Years Ended December 31, | ||||||||
2021 | 2020 | |||||||
(in thousands) | ||||||||
Net cash provided by (used in) | ||||||||
Operating activities | $ | (98,583 | ) | $ | (78,945 | ) | ||
Investing activities | (68,903 | ) | (35,906 | ) | ||||
Financing activities | 171,417 | 63,316 | ||||||
Net change in cash and cash equivalents | $ | 3,931 | $ | (51,535 | ) | |||
Net cash used in operating activities
For the three months ended March 31, 2022, cash flows used in operating activities was $22.4 million. Such cash used primarily related to our net loss of $53.6 million, adjusted for non-cash expenses of $23.6 million, and changes in our working capital accounts of $7.6 million. The adjustments for non-cash expenses primarily include (i) $9.3 million in depreciation, (ii) paid-in-kind interest on the Term Loans, the 2020 Notes, the 2021 Notes and the Strategic Partner Arrangement of $5.9 million, (iii) amortization of debt discount of $1.6 million, (iv) $3.7 million in share-based compensation expense, (v) loss on disposal of property and equipment of $0.7 million, (vi) $0.3 million in transaction costs allocated to derivative liabilities, (vi) accretion of asset retirement obligations of $0.1 million and (vii) $3.9 million in distributions to non-redeeming shareholders, offset by fair value adjustments to derivative liabilities of $1.9 million. The changes in our working capital accounts primarily include increases of (i) $7.0 million in accrued expenses and other current liabilities and (ii) $0.4 million in accounts payable and a decrease of (iii) $0.7 million in prepaid expenses and other current assets, offset by a decrease of (i) $0.3 million in other assets and (ii) $0.2 million in deferred costs.
For the three months ended March 31, 2021, cash flows used in operating activities was $17.3 million. Such cash used primarily related to our net loss of $41.0 million, adjusted for non-cash expenses of $19.7 million, and changes in our working capital accounts of $4.0 million. The adjustments for non-cash expenses primarily include (i) $6.1 million in depreciation, (ii) paid-in-kind interest on the Term Loans, the 2020 Notes, the 2021 Notes and the Strategic Partner Arrangement of $4.2 million, (iii) amortization of debt discount of $2.4 million, (iv) conversion of the convertible debt discount of $1.0 million, (v) loss on extinguishment of debt of $2.4 million, (vi) fair value adjustment of the derivative liability of $2.9 million, (vii) loss on disposal of property and equipment of $0.5 million and (viii) $0.2 million in share-based compensation expense. The changes in our working capital accounts primarily include increases of (i) $2.7 million in accounts payable, (ii) $1.4 million in accrued expenses and other current liabilities and (iii) $0.5 million in unearned revenue, offset by increases of (i) $0.5 million in prepaid expenses and other current assets and (ii) $0.1 million in accounts receivable.
For the year ended December 31, 2021, cash flows used in operating activities was $98.6 million. Such cash used primarily related to our net loss of $166.5 million, adjusted forinterest on Term Loans, the 2020 Notes and 2021 Notes and the Strategic Partner Arrangement of $18.2 million, (iii) amortization of debt discounts and deferred charges of $5.4 million, (iv) conversion of the convertible debt discount of $1.0 million, (v) loss on extinguishment of debt of $3.7 million, (vi) fair value adjustment of the derivative liability of $8.6 million, (vii) loss on disposal of property and equipment of $2.2 million, (viii) $1.3 million in share-based compensation expense, (ix) accretion of asset retirement obligations of $0.2 million and (x) provision for doubtful accounts of less than $0.2 million. The changes in our working capital accounts include increases of (i) $3.5 million in accrued expenses and other current liabilities, (ii) $0.8 million in other liabilities and (iii) $0.5 million in unearned revenue, offset by decreases of (i) $5.2 million in prepaid expenses and other current assets, (ii) $1.2 million in accounts payable, (iii) $0.3 million in accounts receivable and (iv) $0.2 million in other assets.
non-cash
expenses of $70.2 million, and changes in our working capital accounts of $2.3 million. The adjustments fornon-cash
expenses include (i) $29.5 million in depreciation,(ii) paid-in-kind
For the year ended December 31, 2020, cash flows used in operating activities was $78.9 million. Such cash used primarily related to our net loss of $125.1 million, adjusted for certaininterest on Term Loans and the 2020 Notes of $15.4 million, (iii) amortization of debt discount of $3.8 million, (iv) loss on disposal of property and equipment of $1.5 million, (v) fair value adjustment to a derivative liability of $1.9 million, (vi) $1.0 million in share-based compensation expense, (vii) accretion of asset retirement obligations of $0.1 million and (viii) provision for doubtful accounts of $0.1 million. The changes in our working capital accounts include increases of (i) $1.2 million in other liabilities, (ii) $0.4 million in accrued expenses and other current liabilities, (iii) $0.7 million in accounts payable, (iv) $0.8 million in unearned revenue, (v) and $0.2 million in prepaid expenses and other current assets, offset by decreases of (i) $0.3 million in accounts receivable and (ii) less than $0.1 million in other assets.
non-cash
expenses of $43.2 million, and changes in our working capital accounts and certainnon-cash
expenses of $3.0 million. The adjustments fornon-cash
expenses include (i) $19.4 million in depreciation,(ii) paid-in-kind
44
Net cash used in investing activities
Net cash used in investing activities during the three months ended March 31, 2022 totaled $16.8 million, related to capital expenditures for our distribution system.
Net cash used in investing activities during the three months ended March 31, 2021 totaled $10.0 million, related to capital expenditures for our distribution system.
Net cash used in investing activities during the year ended December 31, 2021 totaled $68.9 million, primarily related to capital expenditures for our distribution system.
Net cash used in investing activities during the year ended December 31, 2020 totaled $35.9 million, primarily related to capital expenditures for our distribution system.
Net cash provided by financing activities
Net cash provided by financing activities during the three months ended March 31, 2022 totaled $176.4 million, which was primarily driven by $163.8 million in proceeds from the Business Combination, net of transaction costs, $10.0 million in proceeds from the issuance of Term Loans, net of issuance costs, $3.7 million in proceeds from the Strategic Partner Arrangement and $0.5 million in proceeds from the exercise of stock options, offset by $1.2 million in repayments of notes assumed in the Business Combination, $0.3 million in repayments of capital lease obligations and less than $0.1 million in payments of third-party issuance costs.
Net cash provided by financing activities during the three months ended March 31, 2021 totaled $132.2 million, which was driven primarily by the proceeds raised from the issuance of Starry Series E Preferred Stock (inclusive of Starry Series E-1 Preferred Stock, Starry Series E-2 Preferred Stock and Starry Series E-3 Preferred Stock), net of issuance costs, of $119.9 million, issuance of $11.0 million of the 2021 Notes, proceeds from the Strategic Partner Arrangement of $1.4 million and exercise of stock options of $0.1 million, offset by repayments of capital lease obligations of $0.2 million.
Net cash provided by financing activities during the year ended December 31, 2021 totaled $171.4 million, which was driven primarily by the proceeds raised from the issuance of Starry Series E Preferred Stock (inclusive of Starry Series
E-1
Preferred Stock, Starry SeriesE-2
Preferred Stock and Starry SeriesE-3
Preferred Stock), net of issuance costs, of $119.9 million, proceeds from Term Loans, net of issuance costs, of $38.5 million, proceeds from the issuance of $11.0 million of the 2021 Notes, proceeds from the Strategic Partner Arrangement of $3.3 million and proceeds from the exercise of Starry Options (as defined below) of $0.8 million, offset by repayments of capital lease obligations of $0.8 million, payments of deferred transaction costs of $1.0 million and payments of third-party issuance costs of $0.3 million in connection with the Term Loans.Net cash provided by financing activities during the year ended December 31, 2020 totaled $63.3 million, which was driven primarily by the proceeds raised from the (i) issuance of Starry Series D Preferred Stock, net of issuance costs, of $30.7 million, (ii) issuance of convertible notes of $31.2 million, (iii) proceeds from the Strategic Partner Arrangement of $1.7 million and (iv) exercise of Starry Options of $0.2 million, partially offset by the repayment of capital lease obligations of $0.6 million.
Critical Accounting Policies and Estimates
The preparation of our consolidated financial statements requires us to make estimates and assumptions that affect the reported amounts of assets and liabilities and the disclosure of contingent assets and liabilities as of the balance sheet date, as well as the reported expenses incurred during the reporting period. We evaluate our estimates and judgments on an ongoing basis. We base our estimates on historical experience and on various other assumptions believed to be reasonable, the results of which form the basis for making judgments about the carrying values of assets and liabilities. Actual results could differ from those estimates, and such differences could be material to our consolidated financial statements.
Other than policies outlined throughout the notes to the audited consolidated financial statements and unaudited condensed consolidated financial statements contained elsewhere in this prospectus, and as described below, there have been no significant changes from the critical accounting policies and estimates disclosed in our Annual Report on Form 10-K filed with the SEC on March 31, 2022.
Earnout shares
Following the Business Combination, 4,128,113 shares of Class A common stock held by certain former equity holders of FirstMark are subject to vesting and forfeiture conditions. Earnout Shares subject to vesting that do not vest in accordance with such terms shall be forfeited and cancelled for no consideration. The Earnout Shares are not redeemable. The Earnout Shares will be considered outstanding for legal purposes prior to the achievement of the vesting conditions but will not be considered outstanding for accounting purposes until such vesting conditions are achieved. See “Note 9—Warrants and earnout shares” in the notes to our unaudited condensed consolidated financial statements for more information regarding such Earnout Shares.
The Company evaluated the Earnout Shares and concluded that they do not meet the criteria to be classified within stockholders’ equity. The Earnout Shares contain settlement provisions that preclude them from meeting the derivative exception of being indexed to the Company’s stock. As such, the Company has recorded these Earnout Shares as liabilities on the condensed consolidated balance sheet at fair value, with subsequent changes in their respective fair values recognized in the condensed consolidated statements of operations at each reporting date.
The fair value of the Earnout Shares was derived utilizing a Monte Carlo Simulation Method (“MCSM”) to assess the likelihood of a triggering event occurring in the specified time frame. Under each scenario, the occurrence of a triggering event is tracked. If one of the thresholds is reached, then the underlying fair value of the common stock at the time of the trigger event is utilized to determine the fair value of the Earnout Shares that would be issued. The mean value of the shares estimated over the course of numerous iterations are calculated to arrive at the fair value of the Earnout shares. The MCSM utilizes a number of inputs which include the trading price and volatility of the underlying common stock, the expected term and risk-free interest rates. The determination of the fair value of these financial instruments is complex and highly judgmental due to the significant estimation required. In particular, the fair value estimate was sensitive to certain assumptions, such as the trading price and volatility of the underlying common stock.
Redeemable shares
On March 31, 2022, the Company entered into an agreement with certain debt holders who are also shareholders of 1,209,029 shares of Class A common stock. The Company assessed the embedded conversion features and determined that the Junior Debt Exchange met the definition of a derivative under ASC 815 and would require separate accounting from the redeemable shares. The Company estimated the fair value of the Junior Debt Exchange based on a Black-Scholes option pricing model for a European put option and recorded $1,986 in other liabilities on the condensed consolidated balance sheet with the offset recorded in other income (expense), net on the condensed consolidated statement of operations. The key inputs used in the determination of the fair value included current stock price, volatility and expected term. —Summary of significant accounting policies” and “Note 15— Redeemable shares” in the notes to our unaudited condensed consolidated financial statements for more information regarding the valuation of the Junior Debt Exchange and the redeemable shares.
45
New and Recently Adopted Accounting Pronouncements
From time to time, new accounting pronouncements are issued by the FASB or other standard setting bodies that are adopted by us as of the specified effective date. Unless otherwise discussed, we believe that the impact of recently issued standards that are not yet effective will not have a material impact on our financial position or results of operations.
See “Note 2—Summary of significant accounting policies—Recent Accounting Pronouncements issued, not yet adopted” in the notes to our audited consolidated financial statements and “Note 2—Basis of presentation and summary of significant accounting policies—Recent accounting pronouncements issued, not yet adopted” in the notes to our unaudited condensed consolidated financial statements included elsewhere in this prospectus for more information about recent accounting pronouncements, the timing of their adoption and our assessment, to the extent we made one, of their potential impact on our financial condition and results of operations.
JOBS Act Accounting Election
Section 107 of the JOBS Act allows emerging growth companies to take advantage of the extended transition period for complying with new or revised accounting standards. Under Section 107, an emerging growth company can delay the adoption of certain accounting standards until those standards would otherwise apply to private companies. Any decision to opt out of the extended transition period for complying with new or revised accounting standards is irrevocable. We have elected to use the extended transition period available under the JOBS Act.
46
BUSINESS
Overview
We have developed a unique solution to provide last mile fixed broadband using a proprietary fixed wireless technology stack operating in licensed spectrum. We design and build our own fixed wireless equipment, cloud-based network control plane and billing and operations support systems. We then deploy this technology across a variety of markets to provide broadband service to end users for a fee. The integration of our own technology development and service delivery allows us to efficiently deploy new competitive broadband networks to connect communities across the country.
Since our inception, we have developed the technology, optimized the unit economics, acquired spectrum and deployed our network and acquired subscribers in Boston, Los Angeles, New York City, Denver, Washington, D.C. and Columbus.
We are Solving Hard and Important Problems
Our founders came together with a simple but ambitious goal to fundamentally change the broadband experience. They knew that if they could make broadband more accessible and affordable it would meaningfully improve people’s lives and have a transformative effect on society. The broadband industry is uncompetitive and internet infrastructure deployment is slow, resulting in legacy infrastructure that cannot keep pace with rapid technological change, and leaving millions of people unconnected or under-connected to the internet. Our founders knew that they could build something better, and they understood that there is a significant market opportunity if they solve these key issues: speed of deployment, cost of deployment and customer experience.
Solving these problems requires new technology and a new broadband economic model with an intense focus on the customer. And this is what we deliver—our solution is to build a
low-cost
gigabit broadband platform that can be deployed rapidly, and with the highest customer satisfaction among the major broadband providers.Our ability to dramatically reduce the cost of gigabit connectivity is a result of our unique vertical integration. We are an innovative wireless equipment and software developer, investingof dollars in research and development; a network operator, deploying gigabit digital infrastructure to communities across the country; and a service provider, with the goal of bringing broadband to millions of consumers and small businesses. This is an incredibly unique strategy that few providers have attempted, especially at a national scale, but we believe this is the only path to a generational change in broadband.
tens-of-millions
As a research and development company, we created our own technology stack for gigabit, last-mile, fixed wireless connectivity, including smart antennas, phased arrays, transceivers, low noise amplifiers, monolithic microwave integrated circuits and a cloud-based network control plane. As a digital infrastructure owner and deployer, we have built a gigabit network that covered approximately 5.5 million households as of March 31, 2022. And as a service provider, we are bringing a new kind of consumer-oriented broadband service toof subscribers.
tens-of-thousands
This new platform is not just technical and physical—it’s an entirely new approach to building digital infrastructure. We work with communities directly to meet their needs; we find new partners that have an interest in improving people’s lives; we put digital equity at the center of our mission; and we deploy a technology that blankets communities in gigabit broadband within months, not years.
This transformation of physical and virtual connectivity infrastructure makes people’s lives better and fulfills our mission to solve large societal problems. And although transforming broadband from the ground up with a new technological solution is incredibly hard, we are already making an impact and are just getting started.
Broadband Is Essential
The world changed when Vint Cerf and Bob Khan developed transmission control protocol and internet protocol, enabling data communications over wire, and when Tim Berners Lee opened the world to the power of the internet through the World Wide Web. Ever since, humanity, economics and global power have become digitized and physically and virtually interconnected in almost every way.
Robust internet access is now essential to participating in modern society. This is not just about streaming content, it is about accessing education, health care and work. Broadband’s criticality has been obvious for years, but it was made clearer during the
COVID-19
pandemic.Connectivity empowers people. It provides economic freedom, connects us with friends and families, and is the gateway to culture and entertainment. Despite this, existing providers offer most people extremely poor broadband, and millions of people still lack any access to broadband.
47
We believe competition, especially from new and rapidly growing providers, is the solution. Giving people new choices helps connect the unconnected, forces new investment in infrastructure and drives down prices. Without competition, the broadband industry will continue to trend towards consolidation, and the unconnected and under-connected will be left behind forever.
This is what motivates us to constantly be better.
The Need for a New Platform
Broadband economics are largely static. Deploying a new fiber broadband network at scale with incumbent technology requires a generational investment. So, when we decided to tackle the problem of building a new competitive gigabit broadband network, we knew we had to transform the economic dynamics. Competing with incumbent cable and telecommunications companies at scale using traditional wired delivery solutions like fiber or coaxial cable would require a massive capital investment. It would also take far too long to deploy—potentially decades. And even if time and capital were solved, it would be hard to achieve the subscriber penetration necessary to pay back the investment. We knew we needed a different solution. We needed to go wireless.
A wireless solution could leverage billions of dollars in investment from others, could leverage existing baseband radio technologies with broad adoption and
low-cost
profiles, and would allow us to control the majority of the cost structure. We also needed to recoup our investment within a reasonable time but with relatively low penetration. And for our customers, we needed a new service model that was designed to genuinely put them first.And we wanted to bring our innovations to as much of the market as possible, improving digital equity for everyone.
The Starry Platform
Our platform is a hybrid network that leverages our own fixed wireless technologies to provide gigabit coverage across a wide area, while keeping costs low and customer satisfaction high. Here is how we do it:
| • | Use Licensed Millimeter Wave Spectrum. tens-of-millions |
| • | Employ 802.11 Radios in Licensed Spectrum. Wi-Fi is one of the world’s most prevalent wireless technologies. It is based on a robust and frequently upgraded industry standard that enables high capacity andlow-latency wireless connections. So instead of building a new radio technology or using the expensive mobile industry 5G ecosystem, we built our technology stack on top ofWi-Fi’s 802.11 standard. We then developed key intellectual property around the use of this radio technology in licensed spectrum domains with a combination of ultra-high spectral-efficiency smart-antenna technologies. The combination of proprietary front ends and global volume ofWi-Fi-based |
| • | Design and Build the Fixed Wireless Technology and Deploy it on Telecommunications Infrastructure. |
| • | Control the Network with a Natively Cloud-Based Core. |
| • | Create a Unique Partner Ecosystem. |
48
This is our platform, which allows us to build our network in a community with very low
up-front
capital investment, scale the customer network and our capital expenditures on a success basis as new customers come online, become EBITDA breakeven with only a projected four percent penetration rate across our network footprint and provide a service that consumers use hours a day with a net promoter score unrivaled by any broadband provider today.Starry’s Service
Transforming broadband requires providing customers with better technology and ensuring our service truly meets their needs.
We were frustrated broadband customers. Our intense customer focus is informed by decades of our own personal experiences. We believe in no more wait times, no more hidden fees and no more pricing games or anti-consumer service bundling. Our service is simple, straightforward, affordable and designed for our customers.

We also take our customers’ privacy very seriously and have a modern and customer-oriented privacy policy that protects customer data rather than monetizes it. We are not a big data company or a digital ad platform. We collect as little data as we feel is necessary and use it only to offer and market our service. We feel the same way about net neutrality; our customers should have access to the entire legal internet, so we do not block or prioritize any content and do not cap the amount of data our consumers use.
And our customers love the service and experience.
Customer Response
Our intense focus on the customer experience leads to very happy customers. Our historic net promoter score (NPS) taken across all customers who have responded to our NPS survey since 2018 is 61. Our NPS through the end of 2021 was 69. This is dramatically better than other broadband providers, which have an average NPS of 0. In fact, it puts us on par with some of the most beloved consumer brands in the world.
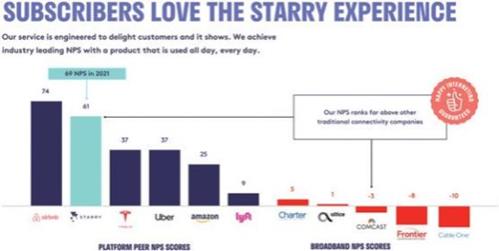
49
This is a point of incredible pride in Starry across our entire workforce. From the beginning, our mission has been about delivering a new broadband experience that is designed around the customer. Not surprisingly, focusing on the customer, delivering a great experience and being transparent and honest leads to a very positive relationship with customers.
Digital Equity and Inclusion
We believe that broadband is transformational, and that it should be available to everyone. But across both urban and rural America, entire communities have been left unserved or underserved, written off by incumbent providers as too expensive to connect or not profitable enough to serve. We take a different view and incorporate digital equity into our mission in two principal ways.
First, we built a program specifically for people living in public and affordable housing: Starry Connect. Historically, lower income individuals have been subjected to unreasonable examinations of their personal finances in order to participate in
low-income
broadband programs. With Starry Connect we work with these communities, which are largely underserved and ignored, to better meet their digital connectivity needs. We lowered cost barriers and removed qualification barriers, such as credit checks and requirements that residents qualify for other federal welfare subsidy programs in order to participate. Our goal is to get people the broadband access they needed without stripping them of their dignity. Existinglow-cost
programs often require credit checks and lengthy application processes that are cumbersome at best and demeaning at worst. We knew we could do better.By partnering with public and affordable housing owners, Starry Connect ties eligibility to the premise and not an individual, which enables blanket eligibility across a qualified housing community. Persons living in eligible communities do not need to apply to qualify for Starry Connect service because our
low-cost
service plan option is automatically available to anyone living in these communities.Since launching Starry Connect in 2018 we have signed agreements with 85 public and private affordable housing owners and managers representing more than 63,000 apartment units.
As part of our effort, we also partner with other organizations focused on digital equity including Microsoft and PCs for People to improve connectivity and lower barriers to device access and digital literacy programs. For example, we have worked with Microsoft to help fund our network deployment in several public housing communities in Los Angeles and New York City. We work creatively with our partners to devise connectivity solutions that meet the needs of its residents. In Colorado, for example, we are partnering with Aurora Public Schools to make our Starry Connect program available to students identified as unconnected or under-connected in select neighborhoods.
Second, we participate in targeted programs to expand broadband access and improve broadband affordability. In 2020, we participated in the FCC’s RDOF auction to help accelerate our service delivery to locations that lack service today. We won $268 million in federal subsidies over ten years to deploy service to more than 100,000 locations in nine states. This is an integral part of our mission to connect all communities to better broadband, in both urban and rural areas. The FCC is currently reviewing our long-form applications prior to its final approval of the subsidy.
We were also a participating provider in the FCC’s legacy EBB program since 2021, which provided a subsidy of up to $50 per month to qualifying households to cover the cost of broadband during the COVID-19 pandemic. Starry also currently participates in the FCC’s Affordable Connectivity Program (“ACP”) that launched on December 31, 2021, as the successor program to the EBB program. The ACP provides a subsidy of up to $30 per month to help subsidize the cost of broadband for qualifying households. We were approved to participate in the EBB and ACP programs through our Starry Connect program, making all current and future customers living in these Starry Connect communities in our existing markets eligible for the benefit across all available speed tiers. Even though our Starry Connect service is low cost, we believe every bit of savings helps households in need. For the year ended December 31, 2021 and the three months ended March 31, 2022, we have recognized approximately $0.6 million and $0.5 million in revenue, respectively, related to subsidies through the FCC’s EBB and ACP programs.
Digital equity and inclusion are at the core of our mission, and we will continue to pursue strategies that align with those values as we scale our network to more communities nationwide, including expansion of our Starry Connect program and continued participation in targeted government programs and partnerships that extend broadband access and affordability to more communities across the country.
Our Technology Stack and Intellectual Property
Our network technology is fundamental to our unique and disruptive network economics. In 2015, we set out to build a new kind of wireless technology specifically designed for gigabit fixed wireless service using licensed millimeter wave spectrum. Since our founding, we have spent nearly $200 million on research and development and commercialization of our technology. This investment serves the dual goals of increasing our network capacity and improving our unit economics.
Broadband has historically been immune to technological disruption because it is complicated and requires an extensive investment of capital and time. Historically, broadband companies tried to use technology before it was mature or tried to innovate in the wrong places. We believe that true broadband disruption requires a technological solution that reduces the cost of the coverage network that require less capital and lower customer penetration.
50

| * | Based on average Starry passing cost and fiber passing costs of up to $1,250 |
We began developing our technology on the front edge of the global 5G evolution because the compute power and core wireless components were developed enough to make it economically and technically feasible to build high-capacity,
low-cost
equipment that uses millimeter wave spectrum.But we did not want to rely on the global 5G ecosystem for two reasons. First, we wanted to control our own technical and economic destiny. We did not want to become beholden to specific vendors or a technology stack controlled by mobile providers. Instead, we use design and contract manufacturing partners to control our costs. Second, the 5G ecosystem was not evolved enough to support our use case. This is still true today. Mobile carrier equipment that operates in millimeter wave spectrum under the mobile 5G standard (called 5G NR) does not support standalone
two-way
connections in millimeter wave spectrum.For these reasons, we built our own technology stack from the ground up. We use 802.11 standard radios, which are supported by a robust global supply chain and research and development cycle that is focused on continually increased capacity and lower cost. These radios have similar characteristics of mobile 5G chips, most importantly multi-user MIMO, which is a technology that allows the radio to serve multiple end points simultaneously. We take these radios and upconvert the signal from unlicensed 5 GHz spectrum (spectrum in which
Wi-Fi
operates) to the licensed millimeter wave bands in which we operate. This is one of the most unique parts of the Starry technical stack—using a powerful off the shelf baseband radio and combining it with our own proprietary technology to convert the signal into licensed millimeter wave spectrum. From there, we build our own antenna systems for beamforming and beamsteering to direct our gigabit signal to end user locations. Combined, this technology stack allows us to transmit a gigabit signal over one mile and we believe creates a robust protective intellectual property moat.Network Architecture
Below is a simplistic diagram of our network architecture.
51
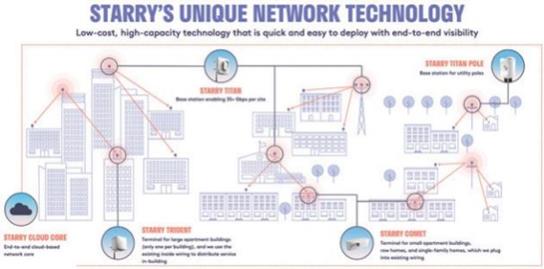
We deploy our base stations, called Titans, at high elevations above the clutter of the physical environment. We use whatever vertical infrastructure is available, including building rooftops, cell towers and utility poles, which we rent from the asset owners or managers, including the large tower companies. These are the transmitting sites that serve customer premises. Each Titan is connected to fiber backhaul or fixed wireless backhaul, which routes our network traffic back to a local internetin the market.
point-of-presence
An internetis the network interface point, typically located in a data center, housing servers, routers, switches and other networking equipment that enables connectivity between networks, and is a common network element of communications networks. These are the locations to which our network traffic in a region is routed and consolidated, and from where we connect with other networks to exchange data traffic, either through direct connections or through Internet exchange points. Internet exchange points are generallyare located are operated by third parties with whom we contract for access and use. In certain large markets we utilize more than one internetprimarily to ensure redundancy in the case of power outages that may affect a data center.
point-of-presence
not-
for-profit
neutral associations through which networks exchange traffic. The data centers in which these internetpoints-of-presence
point-of-presence,
We primarily lease dark fiber from third parties and occasionally build our own fixed wireless links. In some instances, these fiber providers are companies that solely provide communications infrastructure services to internet service providers like us and in some instances these providers offer these services in addition to providing their own internet access services to retail and business customers. The number of available fiber backhaul providers varies by market. We generally contract with between two and four different providers in a market depending on the conditions in that market and the design of our network. In most markets, while we use multiple fiber providers, we lease the majority of our fiber from one provider. However, the fiber backhaul market is relatively competitive in urban areas, which is where we target our network deployment today. For example, there are at least seven fiber providers each in Boston, Denver and Los Angeles; eight providers in Columbus; and ten providers each in New York City and Washington, D.C. Accordingly, we believe that if any current fiber backhaul provider in a market terminated or did not renew our leases with them, we would be able to find one or more alternative providers to ensure adequate access to fiber backhaul in that market. Because fiber providers generally lease fiber backhaul to customers like us on market-based terms and conditions, we do not believe that the terms and conditions for leasing fiber from a new provider would be materially worse than the terms and conditions of our current contracts. In most instances, we lease fiber for a set period of time, typically between 36 and 60 months, in exchange for a monthly fee. At the end of the term of a lease, we seek to renew the lease or let the lease terminate depending on the specific needs of the network at that time and our access to other fiber and the costs associated with it.
We generally design our transmitting sites to have diverse backhaul paths, which means that we typically have in place an alternative backhaul method for routing our network traffic if we lose access to fiber backhaul for any reason. The last mile network is Starry owned, and we primarily lease dark fiber for backhaul and site our Titans on rooftops and towers managed by third parties under commercial agreements with those infrastructure owners.
The Titan base stations serve our two kinds of customer terminals, which we call Trident and Comet. We install Tridents on larger apartment buildings (usually 60 units and greater). We install one Trident on the roof of the building, and then use the existing building wiring to distribute our service to subscribers within the building. We typically deploy our service without building out any of our own wiring in a building. Comet is our terminal for smaller buildings and single-family homes. A Comet has the same capacity as a Trident, but in a smaller form factor. We designed Comet to be easy to install—it requires only a single coax cable—and can serve up to 16 customers.
52
And we provide customers with a
Wi-Fi
router that runs our own network software. We believe this enhances the customer experience because the custom router provides us with network visibility all the way into the home network. Among other things, this allows us to monitor network uptime as a function of router uptime, which is a measure of actual customer experience and troubleshoot any issues in a more comprehensive way than simply asking what lights are blinking or asking the customer to unplug and reboot the router.Finally, we have a mobile application that provides each customer with a suite of data self-help tools to help enhance their own control over their
Wi-Fi
network and help resolve any issues that arise.The entire network is run on our own cloud-based core. Unlike traditional broadband providers, we do not have complicated and expensive
vendor-run
or legacy billing and operating systems. We built our entire control plane from the ground up. It is natively cloud-based and highly scalable. This system runs customer billing, network management, customer care and network operations. As a result, we do not have to maintain traditional network operations centers. Our network operations can access the entire network from their mobile devices with appropriate authentication and other access controls.Network Capacity
We invest heavily in research and development to both drive down the cost of our network and improve its capacity over time. While our current network technology is already gigabit, we are continuing to expand and upgrade our network with the maximum capacity improvements to meet expected future consumer demand.
Importantly, unlike traditional coax networks, our network is designed to be high capacity in both the downstream and upstream directions. As many consumers experienced through the
COVID-19
pandemic when working from home, upstream capacity is important for live video streaming, large file transfers and cloud applications.As the chart below shows, our network is designed to be high capacity today, with an upgrade path to multiples of today’s capacity over the next five years. While the amount of bandwidth we may use is fixed (160 megahertz or 200 megahertz) we take advantage of the ability to operate simultaneous spatial streams, which allows us to reuse the same spectrum six, eight or fourteen times, effectively multiplying our bandwidth without requiring additional spectrum.
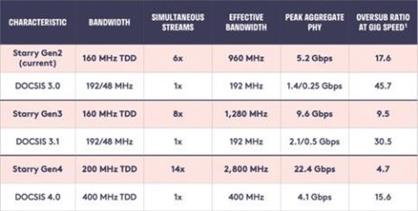
1
Assumes 64 subscribers per sector
Starry Today
We spent approximately three years building our initial commercial technology stack and developing intellectual property, while creating and testing our business model and executing our spectrum strategy. This created a
two-track
trajectory where our network and subscriber base expanded, while we reduced our unit economics through additional investments in research and development. As a result, we now have a large and growing broadband platform with differentiated and improving economics.Our company is a unique combination—we are an equipment developer, network owner and service provider. This structure is a key component of our new broadband economics. By developing our own equipment, owning our own network and offering our own service we believe we generate significant cost advantages relative to incumbent networks.
Network Coverage
We build out our network at high elevations to maximize the coverage from each base station location. The area that a base station or group of base stations at the same location covers is our “Homes Serviceable,” which is the total number of households that we could potentially technologically and commercially serve from any base station or site. Within that universe, we either have single family homes or smaller apartment buildings that we can directly serve, or for larger MDUs, we have “Large MDU Units” and “Activated MDU Units” which are larger apartments to which we can market our service because the building is addressable, serviceable and has one of our transceivers installed. And from that universe we derive our customer relationship.
53
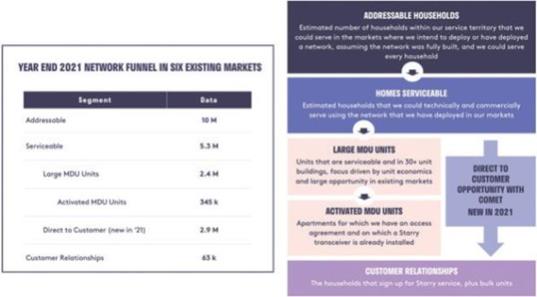
As of March 31, 2022, we had approximately 5.5 million homes serviceable under our network across six live markets: Boston, Massachusetts; Columbus, Ohio; Denver, Colorado; Los Angeles, California; New York, New York; and Washington, D.C.
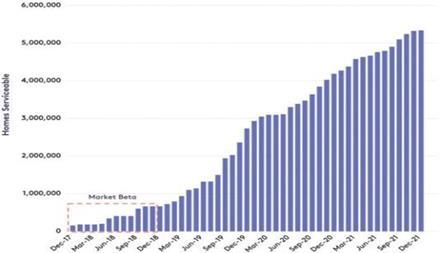
In all of our markets except Columbus, Ohio, we built our network incrementally while we shifted from a pure research and development function as we finalized our technology, to the active deployment of our network, to the acquisition of subscribers and provision of services. We iteratively deployed our network, designed operational systems, built teams and injected our learnings back into this process. We conceptualize this as applying iterative software development techniques to network deployment. This had inefficiencies early on, but ultimately resulted in an accelerated learning curve. We applied these learnings to our Columbus network, where we built our entire initial network within a
12-month
period.Going forward, we intend to build every new market in the same manner as Columbus—build the coverage network first and then launch service.
Between 2018 and 2021, we focused aggressively on continuing to reduce the network coverage capital expenditure allocation per subscriber by driving down the cost of our base stations and on developing our low cost customer terminal with a unit cost that allows us to target smaller multifamily dwelling units and single family homes while preserving our unique cost advantage.
Comet, our new customer terminal for medium and small multifamily dwelling units and single-family homes, now allows us to efficiently serve households of all types, dramatically changing our ability to acquire subscribers within our existing network coverage and within the footprint of every new transmitting site we build.
54
Subscribers
While we have built significant network coverage since beginning operations, until recently we have purposefully constrained our subscriber acquisition generally to only larger apartment buildings. We did this to optimize unit economics and efficiently deploy capital. Our technology development roadmap was focused on building our base stations and reducing their cost, while launching a customer terminal that would allow us to serve the largest number of customers at a location at the lowest unit cost. As a result, our unit economics were optimized for larger apartment buildings within our network footprint.
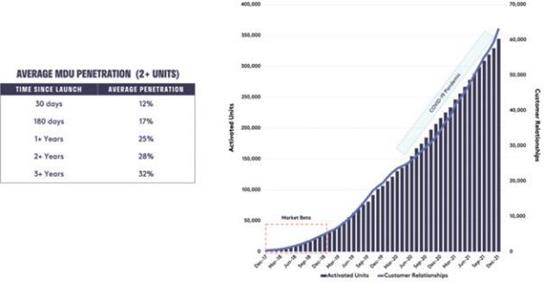
We ended 2021 with 63,230 customer relationships. Within the MDUs that we provided service to as of the end of 2021, we achieved significant penetration with a steady penetration ramp as the buildings matured. We achieved 12% penetration in MDUs on average within thirty days of launching a building, 25% on average for buildings that were launched one or more years ago, and 32% on average for buildings that were launched three or more years ago.
As our operations in a market mature, our penetration rate across the entire market grows. Prior to launching Comet in 2021, which as described in more detail below allows us to target all serviceable households, we targeted our deployment and sales at MDUs that were thirty units or larger. As an example of how our penetration of a market matures over time within the serviceable footprint that we target our sales, and even as the denominator—homes serviceable—continues to grow, the graph below shows the penetration of buildings that are thirty units or larger in a single market over time.
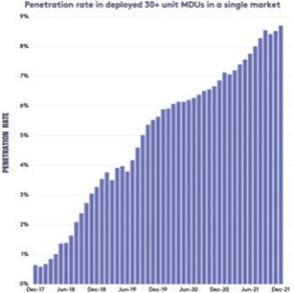
55
In the second quarter of 2021, we launched Comet. This new customer terminal now enables us to serve every serviceable household. As a result, we are no longer constraining our subscriber acquisition to large apartment buildings.
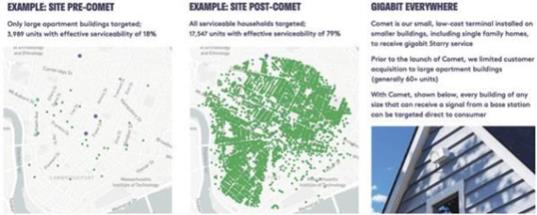
Partners
We are developing unique and highly accretive partnerships that we believe will help us build and scale our network while reducing our capital expenditure intensity.
As part of our expansion strategy, we are identifying partners that are aligned with our goal of improving connectivity in communities and have infrastructure experience and the ability to help finance our network expansion. In 2020, we entered into a strategic alliance agreement with AEPV to deploy our network in Columbus, Ohio. Under our arrangement, AEPV absorbs the capital expenditures necessary to construct and maintain our coverage network and the capital expenditures for customer installations, while we operate the network, market our service, acquire subscribers and manage subscriber relationships. In exchange for this collaborative approach, we pay AEPV a portion of the revenue we receive from customers in the Columbus market.
In 2021, we entered into a strategic alliance with Quanta Services, Inc. (“Quanta”), a specialized contracting services company, delivering comprehensive infrastructure solutions for the communications, utility, renewable energy and underground industries Quanta has a wealth of expertise, a large, trained workforce and project management expertise built around large-scale infrastructure partnerships. Under our arrangement, Quanta will be our preferred partner in building and/or project managing the expansion of our network in portions of our network footprint.
In addition, we work collaboratively with residential and commercial property owners to deploy our network and acquire subscribers. These arrangements take the form of agreements with individual building owners to install our service in their buildings, agreements with large real estate portfolio owners to install our service across their portfolios, and agreements to allow us to install and operate our base stations on their building rooftops. Most notably, we have a commercial relationship with Related Companies, a global real estate and lifestyle company with over $60 billion in assets owned or under development, to deploy our network and service within their communities, including their affordable communities within our Starry Connect program.
Our Growth Strategy
Spectrum
We hold spectrum licenses in the 24 GHz band. We won licenses in the 24 GHz band in FCC Auction 102, spending approximately $48 million to acquire 200 megahertz of spectrum in 49 Partial Economic Areas (“PEAs”), the geographic unit used by the FCC and 300 megahertz in two PEAs. The 24 GHz band is the lowest frequency licensed millimeter wave spectrum that the FCC has made available through auction. This is important because the lower frequency achieves better propagation with the same power. Technically, this allows us to cover more area with fewer base station sites. These license rights were granted for an initial
10-year
term with an expectation of renewal subject to network buildout requirements, consistent with typical FCC rules for licensed spectrum bands.We also have spectrum rights to the lower 37 GHz band. In 2016, the FCC established a lower 37 GHz band as a licensed coordinated shared band. At the time the FCC sought to create a millimeter wave band on a license basis that could be used with low barriers to entry in order to stimulate new innovation in 5G and other technologies. The fact that the band is licensed, but not auctioned, means that equipment can operate at higher transmit power—the same as mobile 5G—but the spectrum is not reserved only for those with deep pockets at auction. While the FCC finalizes its rules for the use of this band, it has authorized us to deploy our technology and operate our network in a number of markets under an experimental license. Upon promulgation of final rules by the FCC for use of the lower 37 GHz band, we will pursue permanent licensed rights through the FCC’s process.
56
Growth
We intend to scale our network and subscriber base in coordination with residential property owners, affordable housing owners and managers, and digital equity partners. We intend to establish additional utility partnerships like our AEPV arrangement within additional markets in our footprint in order to continue to accelerate our network deployment and reduce our capital expenditure intensity. In addition, we intend to leverage our Quanta arrangement by building Quanta’s teams into our planning, design and deployment process as we build out our entire network footprint.
Competition
We competeagainst other fixed broadband providers, including cable, terrestrial fixed wireless service, DSL, fiber and fixed satellite. We also compete against providers of mobile broadband service to the extent that a consumer considers mobile broadband service a substitute for fixed broadband service. Our competitors include large national and regional providers of fixed broadband services such as AT&T, Comcast, Charter, CableOne, Verizon, CenturyLink, Frontier, TDS Cox, RCN and Altice, providers of mobile broadband services such as AT&T,
head-to-head
T-Mobile,
US Cellular and Verizon, and numerous small fixed broadband providers in local areas. In any market, we may face one or more competitive providers. In some instances, our competitors have easier access to financing, greater resources, greater operating capabilities and efficiencies of scale, stronger brand-name recognition, longstanding relationships with regulatory authorities and customers, and more customers. This provides these competitors with certain advantages in competing against us, including the ability to aggressively promote and price their services in markets in which we may compete. This competition creates pressure on our pricing and may affect our ability to add and retain customers.We believe our technology and business model enables us to compete effectively against incumbent providers on price, service quality and customer experience. Our service is offered at a price point that is generally at or below the promotional price of an incumbent, and in almost every case is below the “rack rate” price for an incumbent service. We also focus on price transparency. When a customer signs up for our service, the price they pay each month is what we quote to them. There are no hidden fees or charges. We charge our customers on a monthly basis, do not require long-term contracts and do not impose early termination fees. Our service speeds are better than existing cable incumbents in upload and can compete with fiber providers in most cases. On average, we provide our customers with speeds that are at or above their speed plans. Price and service are ultimately components of customer experience. We focus relentlessly on the customer experience and we have an industry-leading NPS as a result.
While we believe our service to be highly competitive, most incumbent broadband communications companies, which already have wired networks and an existing customer base and other operational functions in place, may offer their services at promotional prices comparable to or lower than our services. In addition, to the extent that these providers’ networks are more ubiquitously deployed, such as traditional telephone networks, they may be in a better position to offer internet services to consumers and businesses passed by their networks on a more economic or timely basis than we can, even if the services they offer are arguably inferior. They may also increasingly have the ability to offer a combination of video services, mobile services and telephone and internet services to their customers as a bundle, either directly or through
co-marketing
agreements with other service providers. As an internet-only company, we do not currently offer any bundled services that could compete with these offerings.Mobile broadband providers may be able to provide services that substitute for our fixed broadband service. Current and future fixed and mobile internet services, such as services provided on LTE and 5G networks (and variants), other unlicensed fixed wireless broadband networks and devices such as mobile hot spots, tablets and smartphones, and mobile wireless routers that connect to such devices, may also compete with our broadband services both for
in-premises
broadband service and mobile broadband. All major wireless carriers offer various kinds of unlimited data plans, which could, in some cases, become a substitute for the fixed broadband services we provide. In addition, the FCC is likely to continue to make additional radio frequency spectrum available for these wireless internet access services, which in time could expand the quality and reach of these services.Our competitive risks are heightened by the rapid technological change inherent in our business, evolving consumer preferences and the need to acquire, develop and adopt new technology to differentiate our products and services from those of our competitors, and to meet consumer demand. We may need to anticipate far in advance which technology we should use for the development of new products and services or the enhancement of existing products and services. New emerging technologies, including low earth orbit satellite, may impact a portion of our potential network expansion, to the extent such technologies come to fruition and are adopted in the marketplace. Consolidation and cooperation in our industry may allow our competitors to acquire service capabilities or offer products that are not available to us or offer similar products and services at prices lower than ours.
Government Regulation
We are a wireless technology developer, wireless service provider, broadband internet service provider and will be an interconnected VoIP service provider in the future. As a result, we are subject to various federal telecommunications regulations that govern the spectrum that we utilize, the certification of our wireless equipment and the placement of our wireless facilities. In the future, we will be subject to additional federal and state telecommunications regulations governing voice service, including and participation in Universal Service Fund programs as a result of our participation in the FCC’s RDOF program.
57
In addition, as an eligible telecommunications carrier in areas of certain states, we are subject to state regulations, particularly regarding the provision of voice services and billing. We are also subject to local and state regulations governing the construction and installation of wireless facilities in some circumstances where not preempted by federal regulations.
Furthermore, because we receive, store and use personally identifiable information received from or generated by our customers, we are also subject to federal and state laws and regulations governing data privacy, use of personal data and cybersecurity.
Legal Proceedings
From time to time, we may become involved in legal or regulatory proceedings arising in the ordinary course of our business, including intellectual property claims and commercial contract disputes. In addition, with respect to employees and others, we face and could in the future face a wide variety of claims, including discrimination (for example, based on gender, age, race or religious affiliation), sexual harassment, privacy, labor and employment, ERISA and disability claims. Often these cases raise complex factual and legal issues, which are subject to risks and uncertainties and could require significant management time and corporate resources to defend, could result in significant media coverage and negative publicity, and could be harmful to our reputation and our brand. Although the outcome of these and other claims cannot be predicted with certainty, we are not currently a party to any litigation or regulatory proceeding that we expect to have a material adverse effect on our business, results of operations, financial conditions or cash flows.
Intellectual Property
We rely on trademarks, domain names, patents, copyrights, trade secrets, contractual provisions and restrictions on access and use to establish and protect our proprietary rights.
As of March 31, 2022, we had 19 U.S. and foreign trademark registrations and applications, including registrations for “Starry” and the Starry logo. As of March 31, 2022, we had 14 U.S. pending
non-provisional
patent applications and nine U.S. granted patent applications covering various technologies. In addition, as of March 31, 2022, we had two Patent Cooperation Treaty international patent applications pending and 14 foreign patent applications and three foreign granted patent application covering various technologies.We are the registered holder of a variety of domestic domain names, including “starry.com.”
In addition to the protection provided by our intellectual property rights, we enter into confidentiality and proprietary rights agreements with certain of our employees, consultants, contractors and business partners. Certain of our employees and contractors are also subject to invention assignment agreements.
Facilities and Office Space
We lease 20,620 square feet of office space at our corporate headquarters in Boston, MA. We lease an additional 14,184 square feet of space in Boston, MA and 11,784 square feet of space in Lowell, MA used for manufacturing, warehousing and operations management. We also lease office and warehouse space for our local market teams in New York, NY (10,933 square feet); Secaucus, NJ (13,703 square feet); Arlington, VA (8,513 square feet); Columbus, OH (11,984 square feet); Centennial, CO (11,935 square feet); and Los Angeles, CA (10,700 square feet).
Human Capital Resources
Our People
Solving hard problems requires committed and dedicated teams with a shared vision and passion. Our team takes tremendous pride in building networks and providing a quality broadband service that improves people’s lives. Our management is focused on creating a work environment that leads to employee satisfaction and retention, and strives to build a culture around trust, honesty and entrepreneurial spirit.
As of March 31, 2022, we had a total of 796 employees located in the United States. Our installation team, which consisted of 79 employees as of March 31, 2022, works directly with our customers to install our service in their premises. Our construction team, which consisted of 73 employees as of March 31, 2022, works to install and maintain our equipment in multiple dwelling units, on rooftops, towers and utility poles to build out and maintain our network. Our field teams are backed by our central team employees who work in our offices or remotely. This group, which consisted of
304 employees as of March 31, 2022, is composed of engineers, product managers, marketers, operations leads, customer care representatives, finance professionals, human resources and legal personnel.
304 employees as of March 31, 2022, is composed of engineers, product managers, marketers, operations leads, customer care representatives, finance professionals, human resources and legal personnel.
58
We have 265 employees in Boston (including corporate and field staff), 55 in Columbus, 57 in Denver, 91 in Los Angeles, 105 in New York (including corporate and field staff), 58 in D.C. and 127 remote employees. We have a fluctuating number of part time employees, most of which serve as field sales representatives. Our employees are not currently represented by a union.
Our Culture
Our culture has grown and evolved along with our people. We started in 2016 as a research and development company working on designing our own technology to transform how broadband is delivered. Today we operate across six markets and both coasts. We continue to run a large research and development operation, we run a large and growing field operation, we have an effective sales and marketing team, and we are aggressively signing up subscribers. Even with all this scale, we still maintain the entrepreneurial spirit that drove us in our early days. We hold ourselves accountable to the values we’ve grown into as a company, which guide our decision making as we work towards our shared culture:
| • | First and foremost, we are driven by delivering a great service at a fair price, and are obsessed with customer satisfaction. We push ourselves to go above and beyond because doing the bare minimum is an anathema to our culture. |
| • | We have a bias for action; we empower all employees at every level of our company to make smart and quick decisions when confronted with problems or opportunities. |
| • | We trust that our colleagues make decisions that are anchored in a customer-first focus, and that those decisions are thoughtful and help drive us towards achieving our shared goals. |
| • | We use data and analytics to help make smart and strategic decisions, but we do not let data and analytics overwhelm us and create paralysis or inaction. |
| • | We have a passion for innovation and encourage intellectual curiosity. Innovation in the pursuit of solving hard problems is our motivation and we bring a conscientious and intentional approach to our solutions. |
Diversity, Equity & Inclusion
Our culture is also one of inclusion. We actively work to dismantle inequities within our policies, systems, programs and services to ensure that Starry Group is a space where no one feels the need to edit their identity. We continuously aspire to be a more equitable, safe and welcoming work environment for all of our team members, and a better advocate to the communities we serve. We provide equal opportunities for growth, promotion, learning and development to all employees. We encourage employee engagement through LGBTQ and women employee resource groups, along with opportunities to discuss gender, race and LGBTQ issues.
59
MANAGEMENT
Executive Officers and Directors
The following table lists the names, ages as of May 20, 2022, and positions of the individuals who currently serve as our executive officers and directors:
Name | Age | Position | ||
| Executive Officers | ||||
| Chaitanya Kanojia | 52 | Chief Executive Officer and Director | ||
| Komal Misra | 54 | Executive Vice President and Chief Financial Officer | ||
| Joseph Lipowski | 64 | Executive Vice President and Chief Technology Officer | ||
| Alex Moulle-Berteaux | 50 | Executive Vice President and Chief Operating Officer | ||
| Virginia Lam Abrams | 43 | Executive Vice President, Government Affairs and Strategic Advancement | ||
| William Lundregan | 51 | Executive Vice President, Chief Legal Officer and Secretary | ||
| Jeremy MacKechnie | 36 | Executive Vice President, Head of People and Customer Experience | ||
| Brian Regan | 39 | Executive Vice President, Strategy and Chief of Staff | ||
Non-Employee Directors | ||||
| James Chiddix (1)(3) | 76 | Director | ||
| Amish Jani (1)(2)(3) | 44 | Director | ||
| Elizabeth A. Graham (1)(2)(3) | 52 | Director | ||
| Robert L. Nabors II (2)(3) | 51 | Director |
| (1) | Member of the audit committee. |
| (2) | Member of the nominating and corporate governance committee. |
| (3) | Member of the compensation committee. |
Executive Officers
Chaitanya Kanojia.
co-founded
Starry and has served as our Chief Executive Officer, Starry’s President and as a member of our Board since June 2015. Prior to Starry, Mr. Kanojia founded and served as the Chief Executive Officer of Aereo, Inc., an internet streaming service that allowed subscribers to record and watch live high-definition broadcast television on connected devices via a cloud-basedover-the-air
Mr. Kanojia is qualified to serve on our board of directors because of his experience founding Starry and serving as our Chief Executive Officer.
Komal Misra.
Joseph Lipowski.
co-founded
Starry and has served as our Chief Technology Officer since March 2015. Prior to Starry, Mr. Lipowski served as the Chief Technology officer for Aereo, Inc., an Internet streaming service that allowed subscribers to record and watch live high-definition broadcast television on connected devices via a cloud-basedover-the-air
60
Alex Moulle-Berteaux.
co-founded
Starry and has served as our Chief Operating Officer since October 2018 and as Chief Marketing Officer from March 2015 to October 2018. Prior to Starry, Mr. Moulle-Berteaux served as Chief Commercial Officer for Aereo, Inc. Mr. Moulle-Berteaux previously served as Global Head of Marketing and Public Relations for Rockstar Games, the leading development and publishing label of publicly traded Take Two Interactive, a maker of video game franchises. Mr. Moulle-Berteaux holds a B.A. in Philosophy from Boston College. In 2014, Aereo, Inc. filed a petition for voluntary reorganization under Chapter 11 of the U.S. Bankruptcy Code.Virginia Lam Abrams.
co-founder
of Starry and has served as our Senior Vice President Government Affairs and Strategic Advancement since 2020 and as our Senior Vice President, Communications and Government Relations from June 2015 to February 2020. Prior to Starry, Ms. Abrams served as Senior Vice President of Communications and Government Relations at Aereo, Inc. Ms. Abrams previously was Senior Vice President of Public Affairs at Rubenstein Communications and served as deputy press secretary and spokesperson for New York City Mayor Michael R. Bloomberg during his second term. Ms. Abrams holds a B.S. in Journalism and Political Science from Northwestern University. Ms. Abrams was Senior Vice President of Communications and Government Relations of Aereo, Inc. In 2014, Aereo, Inc. filed a petition for voluntary reorganization under Chapter 11 of the U.S. Bankruptcy Code.William Lundregan.
Jeremy MacKechnie.
on-demand
streaming service for international content, subtitled and made available in North America. The company was acquired by SoftBank in 2014. Mr. MacKechnie also served as the Senior Support Specialist at Aereo, Inc. in 2012. Mr. MacKechnie holds a B.A. in International Political Economy and Spanish Literature with a minor in Business Administration at Fordham University.Brian Regan
.
Non-Employee
DirectorsAmish Jani.
Mr. Jani is qualified to serve on our board of directors because of his experience with Starry and his extensive experience as an investor, director and officer of a number of technology companies.
James Chiddix.
Mr. Chiddix is qualified to serve on our board of directors because of his experience with Starry and his extensive experience as a leader in the broadband industry and with public companies.
Elizabeth A. Graham
Ms. Graham is qualified to serve on our board of directors because of her experience with company leadership roles in technology companies.
61
Robert L. Nabors II
Mr. Nabors is qualified to serve on our board of directors because of his experience in policy development, government relations, regulatory work and financial reporting.
Family Relationships
There are no familial relationships among our directors and executive officers.
Board Composition
Our board of directors comprises five directors and is divided into three classes with staggered three-year terms. Our directors are divided among the three classes as follows:
| • | the Class I director is Elizabeth Graham and her term will expire at the annual meeting of stockholders to be held in 2023; |
| • | the Class II directors are James Chiddix and Robert Nabors and their terms will expire at the annual meeting of stockholders to be held in 2024; and |
| • | the Class III directors are Chaitanya Kanojia and Amish Jani and their terms will expire at the annual meeting of stockholders to be held in 2025. |
Directors in a particular class will be elected for three-year terms at the annual meeting of stockholders in the year in which their terms expire. As a result, only one class of directors will be elected at each annual meeting of our stockholders, with the other classes continuing for the remainder of their respective three-year terms. Each director’s term continues until the election and qualification of his or her successor, or the earlier of his or her death, resignation or removal.
Our Charter and Bylaws provide that only our board of directors can fill vacant directorships, including newly created seats. Any additional directorships resulting from an increase in the authorized number of directors would be distributed pro rata among the three classes so that, as nearly as possible, each class would consist of
one-third
of the authorized number of directors.Controlled Company Exemption
Mr. Kanojia beneficially owns more than 50% of the combined voting power for the election of our directors. As a result, we are a “controlled company” within the meaning of the corporate governance standards of the NYSE and may elect not to comply with certain corporate governance standards, including, but not limited to, the following requirements:
| • | that a majority of our board of directors consist of directors who qualify as “independent” as defined under the rules of the NYSE; |
| • | that we have a nominating and corporate governance committee composed entirely of independent directors; and |
| • | that we have a compensation committee composed entirely of independent directors. |
Although we do not currently do so, we may elect to utilize one or more of these exemptions for so long as we remain a “controlled company.” Accordingly, you may not have the same protections afforded to stockholders of companies that are subject to all of these corporate governance requirements. In the event that we cease to be a “controlled company” and our shares continue to be listed on the NYSE, we will be required to comply with these provisions within the applicable transition periods.See “Risk Factors—Risks Related to Ownership of Our Securities—Because we are a “controlled company” within the meaning of the NYSE rules, our stockholders may not have certain corporate governance protections that are available to stockholders of companies that are not controlled companies.”
Director Independence
We undertook a review of the independence of the directors named above and have determined that each member of our board of directors, other than Mr. Kanojia, qualifies as independent, as defined under the listing rules of the NYSE. In addition, we are subject to the rules of the SEC and NYSE relating to the memberships, qualifications, and operations of the audit committee, as discussed below.
62
Board Oversight of Risk
One of the key functions of our board of directors is the informed oversight of our risk management process. Our board of directors does not have a standing risk management committee, but rather administers this oversight function directly through our board of directors as a whole, as well as through various standing committees of our board of directors that address risks inherent in their respective areas of oversight. For example, our audit committee is responsible for overseeing the management of risks associated with our financial reporting, accounting, and auditing matters, and our compensation committee oversees the management of risks associated with our compensation policies and programs.
Board Committees
Our board of directors has established an audit committee, a compensation committee and a nominating and corporate governance committee. Our board of directors may establish other committees to facilitate the management of our business. Our board of directors and its committees meet throughout the year and can also hold special meetings and act by written consent from time to time, as appropriate. Our board of directors delegates various responsibilities and authority to its committees as generally described below. The committees regularly report on their activities and actions to our full board of directors. Each member of each committee qualifies as an independent director in accordance with the listing standards of the NYSE. Each committee has a written charter approved by our board of directors. Copies of each charter are posted on our website at www.starry.com/investors. The inclusion of our website address in this prospectus does not include or incorporate by reference the information on our website into this prospectus. Members will serve on these committees until their resignation or until otherwise determined by our board of directors.
Audit Committee
The members of our audit committee are James Chiddix, Elizabeth Graham and Amish Jani, each of whom can read and understand fundamental financial statements. Each of Mr. Chiddix and Ms. Graham is independent under the rules and regulations of the SEC and the listing standards of the NYSE applicable to audit committee members. Our board of directors determined that Mr. Jani does not satisfy the independence criteria set forth in Rule
10A-3.
Accordingly, we are relying on the exemption from the independence requirements under Rule10A-3(b)(1)(iv)(A)
that permits a minority of the members of our audit committee to be exempt from the independence requirements for a period of time. Mr. Chiddix is chair of the audit committee. Mr. Chiddix qualifies as an audit committee financial expert within the meaning of SEC regulations and meets the financial sophistication requirements of the NYSE.Our audit committee assists our board of directors with its oversight of the following: the integrity of our financial statements; our compliance with legal and regulatory requirements; the qualifications, independence and performance of our independent registered public accounting firm; and the design and implementation of our internal audit function and risk assessment and risk management. Among other things, our audit committee is responsible for reviewing and discussing with our management the adequacy and effectiveness of our disclosure controls and procedures. The audit committee also discusses with our management and independent registered public accounting firm the annual audit plan and scope of audit activities, scope and timing of the annual audit of our financial statements, and the results of the audit, and quarterly reviews of our financial statements and, as appropriate, initiates inquiries into certain aspects of our financial affairs. Our audit committee is responsible for establishing and overseeing procedures for the receipt, retention, and treatment of any complaints regarding accounting, internal accounting controls or auditing matters, as well as for the confidential and anonymous submissions by our employees of concerns regarding questionable accounting or auditing matters. In addition, our audit committee has direct responsibility for the appointment, compensation, retention and oversight of the work of our independent registered public accounting firm. Our audit committee has sole authority to approve the hiring and discharging of our independent registered public accounting firm, all audit engagement terms and fees, and all permissible
non-audit
engagements with the independent auditor. Our audit committee reviews and oversees all related-person transactions in accordance with our policies and procedures.Compensation Committee
The members of our compensation committee are Amish Jani, James Chiddix, Elizabeth Graham and Robert Nabors. Ms. Graham is the chair of the compensation committee. Each member of our compensation committee is considered independent under the rules and regulations of the SEC and the listing standards of the NYSE applicable to compensation committee members.
Our compensation committee assists our board of directors in discharging certain of our responsibilities with respect to compensating our executive officers, and the administration and review of our incentive plans for employees and other service providers, including our equity incentive plans, and certain other matters related to our compensation programs.
Nominating and Corporate Governance Committee
The members of our nominating and corporate governance committee are Elizabeth Graham, Amish Jani and Robert Nabors. Mr. Jani is the chair of the nominating and corporate governance committee.
63
Our nominating and corporate governance committee assists our board of directors with its oversight of and identification of individuals qualified to become directors, consistent with criteria approved by our board of directors, and selects, or recommends that our board of directors selects, director nominees, develops and recommends to our board of directors a set of corporate governance guidelines, and oversees the evaluation of our board of directors.
Code of Conduct and Ethics
We have adopted a Code of Conduct and Ethics that applies to all of our employees, officers and directors, including our principal executive officer, principal financial officer, principal accounting officer or controller or persons performing similar functions, as well as all of our contractors, consultants, suppliers and agents in connection with their work for us. The full text of our Code of Conduct and Ethics is posted on our website at www.starry.com/investors. We intend to disclose future amendments to, or waivers of, our Code of Conduct and Ethics, as and to the extent required by SEC regulations, at the same location on our website identified above or in public filings. Information contained on our website is not incorporated by reference into this prospectus, and you should not consider information contained on our website to be part of this prospectus.
64
EXECUTIVE COMPENSATION
Throughout this section, unless otherwise noted, the “Company,” “Starry,” “we,” “us,” “our,” and similar terms refer to Starry and its subsidiaries prior to the consummation of the Business Combination, and to Starry Group and its subsidiaries after the Business Combination. All share counts in this section are shown as of December 31, 2021, on a
pre-Business
Combination basis, other than in “—Securities Authorized for Issuance Under Equity Compensation Plans” as indicated therein. In addition, this section provides compensation information pursuant to the scaled SEC disclosure rules applicable to “emerging growth companies.”This section discusses the material components of the executive compensation program for our executive officers who are named in the “2021 Summary Compensation Table” below. In 2021, the “” and their positions with Starry were as follows:
named executive officers
| • | Chaitanya Kanojia, President and Chief Executive Officer; |
| • | Alex Moulle-Berteaux, Executive Vice President and Chief Operating Officer; and |
| • | Joseph Lipowski, Executive Vice President and Chief Technology Officer. |
Following the Business Combination, our named executive officers have continued in their current positions.
This discussion may contain forward-looking statements that are based on our current plans, expectations and determinations regarding future compensation programs. Actual compensation programs that we adopt following the completion of the Business Combination may differ materially from the currently planned programs summarized in this discussion.
2021 Summary Compensation Table
The table below shows compensation of our named executive officers for the years ended December 31, 2021 and December 31, 2020.
Name and Principal Position | Year | Salary ($) | Bonus ($) | Total ($) | ||||||||||||
Chaitanya Kanojia President and Chief Executive Officer | | 2021 2020 | | | 300,861 311,538 | | | 100,000 50,000 | | | 400,861 361,538 | | ||||
Alex Moulle-Berteaux Executive Vice President and Chief Operating Officer | | 2021 2020 | | | 300,000 311,538 | | | 89,977 99,573 | | | 389,977 411,111 | | ||||
Joseph Lipowski Executive Vice President and Chief Technology Officer | | 2021 2020 | | | 250,809 309,615 | | | 50,025 50,000 | | | 300,834 359,615 | | ||||
2021 Salaries
The named executive officers receive a base salary to compensate them for services rendered to the Company. The base salary payable to each named executive officer is intended to provide a fixed component of compensation reflecting the executive’s skill set, experience, role and responsibilities.
2021 Bonuses
For 2021, the cash bonuses for our named executive officers were determined by our board of directors on a discretionary basis based on the board’s assessment of our overall performance and the individual executive’s contributions. The named executive officers other than Mr. Moulle-Berteaux received an annual bonus, paid in cash. For Mr. Moulle-Berteaux, the 2021 bonus amount was also discretionary but our board paid the bonus quarterly after reviewing the number of net subscribers as a percentage of a target for each quarter, which served as a reference point for our board in determining the discretionary amount to pay. The actual bonuses paid to each named executive officer for 2021 are set forth above in the Summary Compensation Table in the column entitled “Bonus.”
Equity Compensation
Mr. Moulle-Berteaux currently holds stock options, which were granted pursuant to the Starry Stock Plan, which is summarized below. None of our named executive officers received any equity grants in 2021.
We adopted the 2022 Incentive Award Plan to facilitate the grant of cash and equity incentives to directors, employees (including our named executive officers) and consultants of our company and certain of its affiliates and to enable our company and certain of its affiliates to obtain and retain services of these individuals, which is essential to our long-term success. For additional information about the 2022 Incentive Award Plan, please see the section entitled “” below.
2022 Incentive Award Plan
65
Outstanding Equity Awards at 2021 Fiscal
Year-End
The figures in the table below show outstanding equity awards as of December 31, 2021, all of which were granted under the Starry Stock Plan. The number of shares subject to the awards, and the exercise prices for the options, reflect the actual shares and exercise prices as of December 31, 2021. The number of shares subject to Starry Options and Starry RSU Awards that are outstanding at the Acquisition Merger Effective Date, and the exercise price of such Starry Options, were subsequently adjusted to reflect the Business Combination.
Option Awards | ||||||||||||||||||||
Name | Grant Date | Number of Securities Underlying Unexercised Options (#) Exercisable | Number of Securities Underlying Unexercised Options (#) Unexercisable | Option Exercise Price ($) | Option Expiration Date | |||||||||||||||
Alex Moulle-Berteaux | 07/31/2015 | 360,000 | (1) | — | 0.077 | 07/30/2025 | ||||||||||||||
| 10/23/2018 | 2,086,241 | (1) | 481,441 | 0.32 | 10/22/2028 | |||||||||||||||
| (1) | The options are subject to a four-year vesting schedule, with 25% of the shares subject to each stock option vesting on the first anniversary of the grant date and the remainder vesting in equal quarterly installments thereafter, subject to continued employment through each vesting date. The stock options granted to our named executive officers may be subject to accelerated vesting in the event of a Sale Event (as defined in the Starry Stock Plan) of the Company. |
Executive Compensation Arrangements — Existing Agreements
We have entered into offer letters with each of our named executive officers.
Chaitanya Kanojia
On June 10, 2015, we entered into an offer letter with Mr. Kanojia, providing for his position as Chief Executive Officer (the “Kanojia Offer Letter”). Mr. Kanojia’s employment with the Company is
at-will
and either party may terminate the Kanojia Offer Letter without notice. The Kanojia Offer Letter provides that Mr. Kanojia is entitled to a base salary of $300,000 per year. Mr. Kanojia has the opportunity to earn an annual bonus, determined in the sole discretion of our board of directors. Mr. Kanojia is also entitled to participate in our health and welfare plans.Joseph Lipowski
On February 24, 2015, we entered into an offer letter with Mr. Lipowski, providing for his position as Chief Technology Officer (the “Lipowski Offer Letter”). Mr. Lipowski’s employment with the Company is
at-will
and either party may terminate the Lipowski Offer Letter without notice. The Lipowski Offer Letter provides that Mr. Lipowski is entitled to a base salary of $170,000 per year. Mr. Lipowski is also entitled to participate in our health and welfare plans.Alex Moulle-Berteaux
On February 24, 2015, we entered into an offer letter with Mr. Moulle-Berteaux, providing for his position as Head of Products and Marketing (the “Moulle-Berteaux Offer Letter”). Mr. Moulle-Berteaux’s employment with the Company is
at-will
and either party may terminate the Moulle-Berteaux Offer Letter without notice. The Moulle-Berteaux Offer Letter provides that Mr. Moulle-Berteaux is entitled to a base salary of $250,000 per year. Mr. Moulle-Berteaux has the opportunity to earn an annual bonus up to $50,000, determined in our sole discretion. Mr. Moulle-Berteaux is also entitled to participate in our health and welfare plans.Retirement Plans
We maintain a 401(k) retirement savings plan for our employees, including our named executive officers, who satisfy certain eligibility requirements. Our named executive officers are eligible to participate in the 401(k) plan on the same terms as other full-time employees. The Internal Revenue Code allows eligible employees to defer a portion of their compensation, within prescribed limits, on a
pre-tax
basis through contributions to the 401(k) plan. We believe that providing a vehicle fortax-deferred
retirement savings though our 401(k) plan adds to the overall desirability of our executive compensation package and further incentivizes our employees, including our named executive officers, in accordance with our compensation policies. We have not provided a match under our 401(k) plan.66
Termination and Change in Control Arrangements
The only rights our named executives have in connection with a termination or change in control arrangements relate to the acceleration of stock options as set forth in the “—Outstanding Equity Awards at 2021 Fiscal Year End”.
Equity Compensation Plans
Starry Stock Plan
We currently maintain the Starry Stock Plan. The Starry Stock Plan provides our employees (including the named executive officers), consultants,
non-employee
directors and other key persons and those of our any subsidiary the opportunity to participate in the equity appreciation of our business through the receipt of stock options to purchase shares of our Common Stock, restricted stock and RSUs. We believe that such awards encourage a sense of proprietorship and stimulate interest in our development and financial success. The Starry Stock Plan is no longer available for use for the grant of future awards, but will continue to govern the terms of awards that were previously granted and that remain outstanding.2022 Incentive Award Plan
In connection with the Business Combination, our board of directors adopted the 2022 Incentive Award Plan, under which we may grant cash and equity incentive awards to directors, employees (including our named executive officers) and consultants in order to attract, motivate and retain the talent for which we compete. The 2022 Incentive Award Plan became effective on March 29, 2022 and replaced the Starry Stock Plan.
ESPP
In connection with the Business Combination, our board adopted the ESPP, under which employees (including our named executive officers) may purchase our Common Stock through payroll deductions of up to 20% of their eligible compensation. The ESPP became effective on March 29, 2022.
Executive Compensation
We intend to develop an executive compensation program that is designed to align compensation with our business objectives and the creation of shareholder value, while enabling us to attract, retain, incentivize and reward individuals who contribute to our long-term success. Decisions regarding the executive compensation program will be made by our compensation committee.
Certain of our executive officers are eligible to receive a
one-time
lump sum cash bonus following the successful completion of the Business Combination. Mr. Kanojia is eligible to receive $500,000, Messrs. Lundregan and Regan are each eligible to receive $400,000 and Mr. Moulle-Berteaux and Mmes. Misra and Lam Abrams are each eligible to receive $325,000.Director Compensation
None of our directors for our fiscal year ended December 31, 2021 or any prior fiscal years have received any compensation for their services as a director. We are evaluating our compensation program for
non-employee
directors and we intend to adopt anon-employee
compensation program consistent with market practices to the extent appropriate. The compensation of Chaitanya Kanojia as named executive officer is set forth above under “Executive Compensation—2021 Summary Compensation Table.”Compensation Committee Interlocks and Insider Participation
None of the members of our compensation committee has ever been a member of the board of directors or compensation committee of any other entity that has or has had one or more executive officers serving as a member of our board of directors or compensation committee.
Securities Authorized for Issuance Under Equity Compensation Plans
The following table provides information as of March 31, 2022 with respect to the shares of our Common Stock that may be issued under the Starry Stock Plan:
Plan category: | Number of Securities to be Issued Upon Exercise of Outstanding Options and RSUs (1) | Weighted-Average Exercise Price of Outstanding Options (2) | Number of Securities Available for Future Issuance Under Equity Compensation Plans (excludes securities reflected in first column) (3) | |||||||||
Equity compensation plans approved by security holders | 8,449,059 | $ | 2.63 | | | — | | |||||
Equity compensation plans not approved by security holders | — | — | — | |||||||||
Total | | 8,449,059 | | $ | 2.63 | | | — | | |||
| (1) | As of March 31, 2022, there were 7,635,318 options outstanding and 813,741 RSUs outstanding under the Starry Stock Plan. |
| (2) | As of March 31, 2022, the weighted-average exercise price of outstanding options under the Starry Stock Plan was $2.63. The weighted average exercise price is calculated based solely on the exercise prices of the outstanding options and does not reflect the shares that will be issued upon the vesting of outstanding RSUs, which have no exercise price. |
| (3) | The Starry Stock Plan was terminated on March 29, 2022, upon which date the 2022 Incentive Award Plan and ESPP became effective. |
The number of shares initially available for issuance under awards granted pursuant to the 2022 Incentive Award Plan is 22,775,288 shares of our common stock. The number of shares initially available for issuance will be increased on January 1st of each calendar year beginning in 2023 and ending on and including January 1, 2031, by an amount equal to the lesser of (a) 5% of the aggregate number of shares of our Class A Common Stock and our Class X Common Stock outstanding on the final day of the immediately preceding calendar year and (b) such smaller number of shares as determined by our board of directors.
A total of 4,555,058 shares of our Common Stock were initially reserved for issuance under the ESPP. In addition, the number of shares available for issuance under the ESPP will be annually increased on January 1st of each calendar year beginning in 2023 and ending on and including January 31, 2031, by an amount equal to the lesser of (A) 1% of the aggregate number of shares of our Class A Common Stock and our Class X Common Stock outstanding on the final day of the immediately preceding calendar year and (B) such smaller number of shares as is determined by our board of directors.
67
BENEFICIAL OWNERSHIP OF SECURITIES
The following table sets forth information known to us regarding the beneficial ownership of our Common Stock by:
| • | each person who is our named executive officer or director; |
| • | all of our executive officers and directors as a group; and |
| • | each person who is a beneficial owner of more than 5% of our Class A Common Stock or our Class X Common Stock. |
Beneficial ownership is determined according to the rules of the SEC, which generally provide that a person has beneficial ownership of a security if he, she, or it possesses sole or shared voting or investment power over that security, including options and warrants that are currently exercisable or exercisable within 60 days and RSUs that may be settled within 60 days. Unless otherwise indicated, we believe that all persons named in the table below have sole voting and investment power with respect to the voting securities beneficially owned by them.
The beneficial ownership of our Common Stock is based on 157,054,931 shares of Class A Common Stock and 9,268,335 shares of Class X Common Stock issued and outstanding as of May 20, 2022. Unless otherwise noted, the business address of those listed in the table below is c/o Starry Group Holdings, Inc., 38 Chauncy Street, Suite 200, Boston, MA.
Name and Address of Beneficial Owners | Number of Shares of Class A Common Stock | % of Shares of Class A Common Stock | Number of Shares of Class X Common Stock | % of Shares of Class X Common Stock | % of Total Voting Power** | |||||||||||||||
Five Percent Holders | ||||||||||||||||||||
Entities affiliated with FirstMark (1) | 24,565,818 | 15.6 | % | — | — | 7.2 | % | |||||||||||||
Entities affiliated with FMR LLC (2) | 22,691,403 | 14.4 | % | — | — | 6.6 | % | |||||||||||||
Affiliates of Tiger Global Management, LLC (3) | 21,036,738 | 13.4 | % | — | — | 6.1 | % | |||||||||||||
FirstMark Horizon Sponsor LLC (4) | 15,194,025 | 9.2 | % | — | — | 4.3 | % | |||||||||||||
Entities affiliated with ArrowMark (5) | 12,604,020 | 8.0 | % | — | — | 3.7 | % | |||||||||||||
QSI, Inc. (6) | 10,061,363 | 6.4 | % | — | — | 2.9 | % | |||||||||||||
Directors and Named Executive Officers | ||||||||||||||||||||
Chaitanya Kanojia (7) | 13,621,830 | 8.7 | % | 9,268,335 | 100.0 | % | 58.1 | % | ||||||||||||
Komal Misra (8) | 115,049 | * | — | — | * | |||||||||||||||
Joseph Lipowski | 5,522,363 | 3.5 | % | — | — | 1.6 | % | |||||||||||||
Alex Moulle-Bertreux (9) | 1,897,248 | 1.2 | % | — | — | * | ||||||||||||||
Amish Jani (1)(4) | 39,759,843 | 24.0 | % | — | — | 11.3 | % | |||||||||||||
James Chiddix (10) | 125,996 | * | — | — | * | |||||||||||||||
Elizabeth Graham | — | — | — | — | — | |||||||||||||||
Robert Nabors | — | — | — | — | — | |||||||||||||||
All Directors and Executive Officers as a Group (12 Individuals) | 64,416,176 | 38.5 | % | 9,268,335 | 100.0 | % | 70.8 | % | ||||||||||||
| * | Less than one percent. |
| ** | Percentage of total voting power represents the combined voting power with respect to all shares of Class A Common Stock and Class X Common Stock, voting as a single class. Each share of Class X Common Stock is entitled to 20 votes per share, subject to certain limitations described in this prospectus and each share of Class A Common Stock is entitled to one vote per share. |
| (1) | Consists of (i) 9,565,341 shares of Class A Common Stock owned by FirstMark Capital III, L.P., for itself and as nominee for FirstMark Capital III Entrepreneurs Fund, L.P.; (ii) 4,548,440 shares of Class A Common Stock owned by FirstMark Capital OF I L.P.; (iii) 2,695,372 shares of Class A Common Stock owned by FirstMark Capital OF II, L.P., for itself and as nominee for FirstMark Capital OF II-F, L.P.; (iv) 2,582,691 shares of Class A Common Stock owned by FirstMark Capital OF III, L.P., for itself and as nominee for FirstMark Capital OFIII-F, L.P.; (v) 3,893,974 shares of Class A Common Stock owned by FirstMark Capital S1, L.P.; and (vi) 1,280,000 shares of Class A Common Stock owned by FirstMark Capital S2, L.P. Richard Heitzmann and Amish Jani are the managing members of FirstMark Capital III GP, LLC, the general partner of FirstMark Capital III, L.P., the managing members of FirstMark Capital OF I GP, LLC, the general partner of FirstMark Capital OF I, L.P., the managing members of FirstMark Capital OF II GP, LLC, the general partner of FirstMark Capital OF II, L.P., the managing members of FirstMark Capital OF III GP, LLC, the general partner of FirstMark Capital OF III, L.P., the managing members of FirstMark Capital S1 GP, LLC, the general partner of FirstMark Capital S1, L.P. and the managing members of FirstMark Capital S2 GP, LLC, the general partner of FirstMark Capital S2, L.P. The address of each of the entities in this footnote is 100 Fifth Ave, 3rd Floor, New York, NY 10011. |
68
| (2) | Consists of (i) 225,690 shares of Class A Common Stock owned by Booth & Co FBO Fidelity Securities Fund: Fidelity Blue Chip Growth K6 Fund; (ii) 3,860 shares of Class A Common Stock owned by Booth & Co FBO Fidelity Securities Fund: Fidelity Flex Large Cap Growth Fund; (iii) 333,389 shares of Class A Common Stock owned by Booth & Co FBO Fidelity Securities Fund: Fidelity OTC Portfolio; (iv) 210,621 shares of Class A Common Stock owned by Booth & Co., LLC FBO Variable Insurance Products Fund III: Growth Opportunities Portfolio; (v) 276,049 shares of Class A Common Stock owned by FLAPPER CO FBO FIAM Target Date Blue Chip Growth Commingled Fund; (vi) 1,433,321 shares of Class A Common Stock owned by Mag & Co FBO Fidelity Advisor Series I: Fidelity Advisor Growth Opportunities Fund; (vii) 121,296 shares of Class A Common Stock owned by Mag & Co FBO Fidelity Blue Chip Growth Commingled Pool; (viii) 7,059,820 shares of Class A Common Stock owned by Mag & Co FBO Fidelity Growth Company Commingled Pool; (ix) 1,218,562 shares of Class A Common Stock owned by Mag & Co FBO Fidelity Mt. Vernon Street Trust: Fidelity Series Growth Company Fund; (x) 6,868 shares of Class A Common Stock owned by Mag & Co FBO Fidelity OTC Commingled Pool; (xi) 3,163,204 shares of Class A Common Stock owned by Mag & Co FBO Fidelity Securities Fund: Fidelity Blue Chip Growth Fund; (xii) 6,890,907 shares of Class A Common Stock owned by Powhatan & Co, LLC FBO Fidelity Mt. Vernon Street Trust: Fidelity Growth Company Fund; (xiii) 1,338,789 shares of Class A Common Stock owned by Powhatan & Co., LLC FBO Fidelity Mt. Vernon Street Trust: Fidelity Growth Company K6 Fund; (xiv) 3,882 shares of Class A Common Stock owned by THISBE & Co: FBO Fidelity Blue Chip Growth Institutional Trust; (xv) 54,022 shares of Class A Common Stock owned by WARMWIND + CO FBO Fidelity Advisor Series I: Fidelity Advisor Series Growth Opportunities Fund; (xvi) 346,148 shares of Class A Common Stock owned by WAVECHART + CO FBO Fidelity Securities Fund: Fidelity Series Blue Chip Growth Fund; and (xvii) 4,975 shares of Class A Common Stock owned by THISBE & CO FBO Fidelity U.S. Growth Opportunities Investment Trust. These accounts are managed by direct or indirect subsidiaries of FMR LLC. Abigail P. Johnson is a Director, the Chairman, the Chief Executive Officer and the President of FMR LLC. Members of the Johnson family, including Abigail P. Johnson, are the predominant owners, directly or through trusts, of Series B voting common shares of FMR LLC, representing 49% of the voting power of FMR LLC. The Johnson family group and all other Series B shareholders have entered into a shareholders’ voting agreement under which all Series B voting common shares will be voted in accordance with the majority vote of Series B voting common shares. Accordingly, through their ownership of voting common shares and the execution of the shareholders’ voting agreement, members of the Johnson family may be deemed, under the Investment Company Act of 1940 (the “Investment Company Act”), to form a controlling group with respect to FMR LLC. Neither FMR LLC nor Abigail P. Johnson has the sole power to vote or direct the voting of the shares owned directly by the various investment companies registered under the Investment Company Act (the “Fidelity Funds”) advised by Fidelity Management & Research Company (“FMR Co”), a wholly owned subsidiary of FMR LLC, which power resides with the Fidelity Funds’ Boards of Trustees. Fidelity Management & Research Company carries out the voting of the shares under written guidelines established by the Fidelity Funds’ Boards of Trustees. The address for each of the Fidelity entities identified in this footnote is 245 Summer Street, Boston, Massachusetts 02210. |
| (3) | Consists of 21,036,738 shares of Class A Common Stock held by Tiger Global Long Opportunities Master Fund, L.P. and other entities and/or persons affiliated with Tiger Global Management, LLC, including 1,333,333 shares of Class A Common Stock held by Tiger Global Long Opportunities Master Fund, L.P. Tiger Global Management, LLC is controlled by Chase Coleman and Scott Shleifer. The business address for each of these entities is c/o Tiger Global Management, LLC, 9 West 57th Street, 35th Floor, New York, New York 10019. |
| (4) | Consists of (i) 2,557,500 shares of Class A Common Stock held by the Sponsor; (ii) 4,128,113 Earnout Shares; and (iii) 8,508,413 shares of Class A Common Stock issuable upon the exercise of warrants. The managers of the Sponsor, Messrs. Heitzmann and Jani, by virtue of their shared control over the Sponsor, may be deemed to beneficially own shares held by the Sponsor. Messrs. Heitzmann and Jani are also the managers of the entities affiliated with FirstMark, and by virtue of their shared control over such entities, may be deemed to beneficially own shares held by such entities. The address of the Sponsor is c/o FirstMark Horizon Acquisition Corp., 100 5th Ave, 3rd Floor, New York, New York 10011. |
| (5) | Consists of 246,128 shares of Class A Common Stock owned by ArrowMark Colorado Holdings LLC (“ArrowMark”) and 12,357,892 shares of Class A Common Stock held by various entities and persons for which ArrowMark acts as the investment advisor with respect to such shares. None of the various entities and persons holding shares through accounts managed by ArrowMark is individually a beneficial owner of more than 5% of our Class A Common Stock. Mr. Corkins is the managing member of ArrowMark. The address for Arrow Colorado and Mr. Corkins is c/o ArrowMark Partners, 100 Fillmore St, Suite 325, Denver, CO 80206. |
| (6) | Consists of 10,061,363 shares of Class A Common Stock owned by QSI, Inc. (“QSI”). QSI is a wholly owned subsidiary of Quanta Services, Inc. (“Quanta”). Quanta, a publicly traded company, holds ultimate voting and investment power over the shares of Class A Common Stock held by QSI. The address for QSI and Quanta is 2800 Post Oak Boulevard, Suite 2600, Houston, TX 77056. |
| (7) | Consists of (i) 9,268,335 shares of Class X Common Stock held by Mr. Kanojia; (ii) 368,158 shares of Class A Common Stock held by Chaitanya Kanojia Qualified Annuity Interest Trust, of which Mr. Kanojia serves as trustee; (iii) 12,885,514 shares of Class A Common Stock held by Tracie Longman, Mr. Kanojia’s spouse; and (iv) 368,158 shares of Class A Common Stock held by the Tracie L. Longman Qualified Annuity Interest Trust, of which Ms. Longman serves as trustee. |
69
| (8) | Consists of 115,049 shares of Class A Common Stock issuable upon exercise of options within 60 days. |
| (9) | Includes 479,841 shares of Class A Common Stock issuable upon exercise of options within 60 days. |
| (10) | Includes 55,223 shares of Class A Common Stock issuable upon exercise of options within 60 days. |
70
SELLING SECURITYHOLDERS
This prospectus relates to the resale from time to time of (i) the resale from time to time of an aggregate of 133,303,864 shares of our Class A Common Stock, (ii) the resale from time to time of 6,853,333 private placement warrants, (iii) the issuance by us and resale of up to 2,271,414 shares of Class A Common Stock reserved for issuance upon the exercise of options to purchase Class A Common Stock and (iv) the issuance by us and resale of up to 423,380 shares of Class A Common Stock reserved for issuance upon the settlement of RSUs. The selling securityholders may from time to time offer and sell any or all of the shares of Class A Common Stock and warrants set forth below pursuant to this prospectus and any accompanying prospectus supplement. When we refer to the “selling securityholders” in this prospectus, we mean the persons listed in the table below, and the pledgees, donees, transferees, assignees, successors, designees, and others who later come to hold any of the selling securityholders’ interest in the Class A Common Stock or warrants other than through a public sale.
The following table sets forth, as of the date of this prospectus, (i) the names of the selling securityholders, (ii) the number of shares of Common Stock and warrants held by such selling securityholders prior to this offering, (iii) the percentage ownership by each selling securityholder of our Common Stock and warrants prior to this offering, (iv) the aggregate number of shares of Common Stock and warrants that the selling securityholders may offer pursuant to this prospectus, (v) the number of shares of Common Stock and warrants held by such selling securityholders following this offering and (vi) the percentage ownership by each selling securityholder of our Common Stock and warrants following this offering. The table does not include the issuance by us of up to 25,641,113 shares of Class A Common Stock issuable upon the exercise of outstanding warrants, each of which is also covered by this prospectus. The percentage ownership of shares of Class A Common Stock and warrants is based on 157,054,931 shares of Class A Common Stock, 9,268,335 shares of Class X Common Stock and 20,653,333 warrants issued and outstanding as of May 20, 2022.
Unless otherwise noted, the business address of each of those listed in the table above is 38 Chauncy Street, Suite 200, Boston, MA 02111.
Beneficially Owned Before the Offering | Beneficially Owned After the Offering (1) | |||||||||||||||||||||||||||||||||||||||
Name of Selling Securityholder | Number of Shares of Common Stock | Percentage of Outstanding Shares of Common Stock | Number of Warrants | Percentage of Outstanding Warrants | Number of Shares of Class A Common Stock Being Offered | Number of Warrants Being Offered | Number of Shares of Common Stock | Percentage of Outstanding Shares of Common Stock | Number of Warrants | Percentage of Outstanding Warrants | ||||||||||||||||||||||||||||||
FirstMark Horizon Sponsor LLC (2) | 15,194,025 | 8.7 | % | 6,853,333 | 33.2 | % | 15,194,025 | 6,853,333 | — | — | — | — | ||||||||||||||||||||||||||||
FirstMark Capital III, LP, for itself and as nominee for FirstMark Capital III Entrepreneurs Fund, LP (3) | 9,565,341 | 5.8 | % | — | — | 9,565,341 | — | — | — | — | — | |||||||||||||||||||||||||||||
FirstMark Capital of I LP (3) | 4,548,440 | 2.7 | % | — | — | 4,548,440 | — | — | — | — | — | |||||||||||||||||||||||||||||
FirstMark Capital of II, L.P. (3) | 2,695,372 | 1.6 | % | — | — | 2,695,372 | — | — | — | — | — | |||||||||||||||||||||||||||||
FirstMark Capital S1, L.P. (3) | 3,893,974 | 2.3 | % | — | — | 3,893,974 | — | — | — | — | — | |||||||||||||||||||||||||||||
FirstMark Capital S2, L.P. (3) | 1,280,000 | * | — | — | 1,280,000 | — | — | — | — | — | ||||||||||||||||||||||||||||||
FirstMark Capital of III, L.P. (3) | 2,582,691 | 1.6 | % | — | — | 2,582,691 | — | — | — | — | — | |||||||||||||||||||||||||||||
1992 Larsen Grandchildren’s Trust (4) | 3,700 | * | — | — | 3,700 | — | — | — | — | — | ||||||||||||||||||||||||||||||
ArrowMark Colorado Holdings (5) | 246,128 | * | — | — | 246,128 | — | — | — | — | — | ||||||||||||||||||||||||||||||
ArrowMark Equity Opportunity Fund (6) | 7,633 | * | — | — | 6,392 | — | 1,241 | * | — | — | ||||||||||||||||||||||||||||||
ArrowMark Colorado Holdings LLC – Large Cap Growth (6) | 6,000 | * | — | — | 6,000 | — | — | — | — | — | ||||||||||||||||||||||||||||||
ArrowMark Fundamental Opportunity Fund, L.P. (4) | 3,251,377 | 2.0 | % | — | — | 3,251,377 | — | — | — | — | — | |||||||||||||||||||||||||||||
CF Ascent, LLC (7) | 85,633 | * | 666 | * | 71,772 | — | 13,862 | * | 666 | * | ||||||||||||||||||||||||||||||
Charles F. Urschel 1970 Trust FBO Wendy U. Larsen (4) | 8,499 | * | — | — | 8,499 | — | — | — | — | — | ||||||||||||||||||||||||||||||
Corkins Family Foundation (4) | 21,549 | * | — | — | 20,308 | — | 1,241 | * | — | — | ||||||||||||||||||||||||||||||
Fred H. Bartlit Jr. (8) | 84,247 | * | 333 | * | 54,038 | — | 30,209 | * | 333 | * | ||||||||||||||||||||||||||||||
Intrepid Production Company (4) | 24,266 | * | — | — | 24,266 | — | — | — | — | — | ||||||||||||||||||||||||||||||
Iron Horse Investments LLC (4) | 2,705,851 | 1.6 | % | — | — | 2,705,851 | — | — | — | — | — | |||||||||||||||||||||||||||||
Kathleen Kay Corkins 2013 Revocable Trust (9) | 50,276 | * | 166 | * | 49,450 | — | 826 | * | 166 | * | ||||||||||||||||||||||||||||||
Kathleen Kay Corkins 2014 Irrevocable Trust (10) | 20,693 | * | 33 | — | 20,569 | — | 124 | * | 33 | * | ||||||||||||||||||||||||||||||
Larsen Family, LP (4) | 18,004 | * | — | — | 18,004 | — | — | — | — | — | ||||||||||||||||||||||||||||||
Lookfar Investments, LLC (11) | 289,677 | * | 1,000 | * | 273,538 | — | 16,139 | * | 1,000 | * | ||||||||||||||||||||||||||||||
Meridian Enhanced Equity Fund (6) | 166,667 | * | — | — | 166,667 | — | — | — | — | — | ||||||||||||||||||||||||||||||
Meridian Growth Fund (12) | 1,425,410 | * | — | — | 1,425,410 | — | — | — | — | — | ||||||||||||||||||||||||||||||
71
Meridian Small Cap Growth Fund (12) | 1,289,013 | * | — | — | 1,289,013 | — | — | — | — | — | ||||||||||||||||||||||||||||||
Michael E. Herman Revocable Trust (4) | 21,979 | * | — | — | 18,255 | — | 3,724 | * | — | — | ||||||||||||||||||||||||||||||
THB Iron Rose, LLC (4) | 1,678,308 | 1.0 | % | — | — | 1,678,308 | — | — | — | — | — | |||||||||||||||||||||||||||||
The 2008 Miranda Bailey Irrevocable Trust (13) | 53,785 | * | 1,610 | * | 33,642 | — | 20,143 | * | 1,610 | * | ||||||||||||||||||||||||||||||
The 2008 Ryan Tanner Bailey Irrevocable Trust (14) | 51,170 | * | 400 | * | 37,035 | — | 14,135 | * | 400 | * | ||||||||||||||||||||||||||||||
The Michael Stolper Living Trust #2 (4) | 16,751 | * | — | — | 13,648 | — | 3,103 | * | — | — | ||||||||||||||||||||||||||||||
Stolper Family Trust (4) | 50,773 | * | — | — | 44,194 | — | 6,579 | * | — | — | ||||||||||||||||||||||||||||||
Fidelity Securities Fund: Fidelity Blue Chip Growth Fund (15) | 3,163,204 | 1.9 | % | — | — | 3,163,204 | — | — | — | — | — | |||||||||||||||||||||||||||||
Fidelity Blue Chip Growth Commingled Pool By: Fidelity Management Trust Company, as Trustee (15) | 121,296 | * | — | — | 121,296 | — | — | — | — | — | ||||||||||||||||||||||||||||||
Fidelity Securities Fund: Fidelity Flex Large Cap Growth Fund (15) | 3,860 | * | — | — | 3,860 | — | — | — | — | — | ||||||||||||||||||||||||||||||
Fidelity Securities Fund: Fidelity Blue Chip Growth K6 Fund (15) | 225,690 | * | — | — | 225,690 | — | — | — | — | — | ||||||||||||||||||||||||||||||
Fidelity Blue Chip Growth Institutional Trust By its manager Fidelity Investments Canada ULC (15) | 3,882 | * | — | — | 3,882 | — | — | — | — | — | ||||||||||||||||||||||||||||||
Fidelity Securities Fund: Fidelity Series Blue Chip Growth Fund (15) | 346,148 | * | — | — | 346,148 | — | — | — | — | — | ||||||||||||||||||||||||||||||
FIAM Target Date Blue Chip Growth Commingled Pool By: Fidelity Institutional Asset Management Trust Company as Trustee (15) | 276,049 | * | — | — | 276,049 | — | — | — | — | — | ||||||||||||||||||||||||||||||
Fidelity Securities Fund: Fidelity OTC Portfolio (15) | 333,389 | * | — | — | 333,389 | — | — | — | — | — | ||||||||||||||||||||||||||||||
Fidelity OTC Commingled Pool By: Fidelity Management Trust Company, as Trustee (15) | 6,868 | * | — | — | 6,868 | — | — | — | — | — | ||||||||||||||||||||||||||||||
Variable Insurance Products Fund III: VIP Growth Opportunities Portfolio (15) | 210,621 | * | — | — | 210,621 | — | — | — | — | — | ||||||||||||||||||||||||||||||
Fidelity Advisor Series I: Fidelity Advisor Growth Opportunities Fund (15) | 1,433,321 | * | — | — | 1,433,321 | — | — | — | — | — | ||||||||||||||||||||||||||||||
Fidelity Advisor Series I: Fidelity Advisor Series Growth Opportunities Fund (15) | 54,022 | * | — | — | 54,022 | — | — | — | — | — |
72
Fidelity U.S. Growth Opportunities Investment Trust by its manager Fidelity Investments Canada ULC (15) | 4,975 | * | — | — | 4,975 | — | — | — | — | — | ||||||||||||||||||||||||||||||
Fidelity Mt. Vernon Street Trust: Fidelity Series Growth Company Fund (15) | 1,218,562 | * | — | — | 1,218,562 | — | — | — | — | — | ||||||||||||||||||||||||||||||
Fidelity Mt. Vernon Street Trust: Fidelity Growth Company Fund (15) | 6,890,907 | 4.1 | % | — | — | 6,890,907 | — | — | — | — | — | |||||||||||||||||||||||||||||
Fidelity Growth Company Commingled Pool By: Fidelity Management Trust Company, as Trustee (15) | 7,059,820 | 4.2 | % | — | — | 7,059,820 | — | — | — | — | — | |||||||||||||||||||||||||||||
Fidelity Mt. Vernon Street Trust : Fidelity Growth Company K6 Fund (15) | 1,338,789 | * | — | — | 1,338,789 | — | — | — | — | — | ||||||||||||||||||||||||||||||
Affiliates of Tiger Global Management, LLC (16) | 21,036,738 | 12.6 | % | — | — | 1,333,333 | — | 19,703,405 | 11.8 | % | — | — | ||||||||||||||||||||||||||||
Chaitanya Kanojia (17) | 9,268,335 | 5.6 | % | — | — | 9,268,335 | — | — | — | — | — | |||||||||||||||||||||||||||||
Chaitanya Kanojia Qualified Annuity Interest Trust (18) | 368,158 | * | — | — | 368,158 | — | — | — | — | — | ||||||||||||||||||||||||||||||
Tracie Longman (19) | 12,885,514 | 7.8 | % | — | — | 12,885,514 | — | — | — | — | — | |||||||||||||||||||||||||||||
Tracie L. Longman Qualified Annuity Interest Trust (20) | 368,158 | * | — | — | 368,158 | — | — | — | — | — | ||||||||||||||||||||||||||||||
Komal Misra (21) | 736,314 | * | — | — | 736,314 | — | — | — | — | — | ||||||||||||||||||||||||||||||
Joseph Lipowski | 5,522,363 | 3.3 | % | — | — | 5,522,363 | — | — | — | — | — | |||||||||||||||||||||||||||||
Alex Moulle-Berteaux (22) | 1,956,330 | 1.2 | % | — | — | 1,956,330 | — | — | — | — | — | |||||||||||||||||||||||||||||
Virginia Lam Abrams (23) | 736,314 | * | — | — | 736,314 | — | — | — | — | — | ||||||||||||||||||||||||||||||
Kanojia Family GST Exempt 2021 Trust (24) | 1,657,068 | 1.0 | % | — | — | 1,657,068 | — | — | 1.0 | % | — | — | ||||||||||||||||||||||||||||
William Lundregan (25) | 752,463 | * | — | — | 752,463 | — | — | — | — | — | ||||||||||||||||||||||||||||||
Jeremy MacKechnie (26) | 184,075 | * | — | — | 184,075 | — | — | — | — | — | ||||||||||||||||||||||||||||||
Brian Regan (27) | 331,339 | * | — | — | 331,339 | — | — | — | — | — | ||||||||||||||||||||||||||||||
James Chiddix (28) | 125,996 | * | — | — | 125,996 | — | — | — | — | — | ||||||||||||||||||||||||||||||
Addition Ventures Partners, LLC (29) | 925,210 | * | — | — | 925,210 | — | — | — | — | — | ||||||||||||||||||||||||||||||
AEP Investments, Inc. (30) | 547,853 | * | — | — | 547,853 | — | — | — | — | — | ||||||||||||||||||||||||||||||
Allison Goldberg (31) | 30,000 | * | — | — | 30,000 | — | — | — | — | — | ||||||||||||||||||||||||||||||
Aneesh Chopra (32) | 34,863 | * | — | — | 34,863 | — | — | — | — | — | ||||||||||||||||||||||||||||||
Atreides Foundation Master Fund LP (33) | 866,667 | * | — | — | 866,667 | — | — | — | — | — | ||||||||||||||||||||||||||||||
CC Strategic Investments Corp. (34) | 666,667 | * | — | — | 666,667 | — | — | — | — | — | ||||||||||||||||||||||||||||||
Chandler Reedy (35) | 34,863 | * | — | — | 34,863 | — | — | — | — | — | ||||||||||||||||||||||||||||||
Decibel Holdings, LLC (36) | 491,974 | * | — | — | 491,974 | — | — | — | — | — |
73
Eversource Retirement Plan Master Trust (37) | 1,333,333 | * | — | — | 1,333,333 | — | — | — | — | — | ||||||||||||||||||||||||||||||
Frederick Ball (38) | 30,000 | * | — | — | 30,000 | — | — | — | — | — | ||||||||||||||||||||||||||||||
HB Fund LLC (39) | 1,175,350 | * | — | — | 175,980 | — | 999,370 | 0.6 | % | — | — | |||||||||||||||||||||||||||||
IAC/InterActiveCorp (40) | 5,982,562 | 3.6 | % | — | — | 5,982,562 | — | — | — | — | — | |||||||||||||||||||||||||||||
Jason Robins (41) | 30,000 | * | — | — | 30,000 | — | — | — | — | — | ||||||||||||||||||||||||||||||
Joseph G. Houston (42) | 69,725 | * | — | — | 69,725 | — | — | — | — | — | ||||||||||||||||||||||||||||||
JS Capital LLC (43) | 29,943 | * | — | — | 29,943 | — | — | — | — | — | ||||||||||||||||||||||||||||||
Julius Genachowski (44) | 9.983 | * | — | — | 9,983 | — | — | — | — | — | ||||||||||||||||||||||||||||||
Kicking Horse Investment Holdings L.P. (45) | 3,607,666 | 2.2 | % | — | — | 3,607,666 | — | — | — | — | — | |||||||||||||||||||||||||||||
Levance LLC (46) | 69,725 | * | — | — | 69,725 | — | — | — | — | — | ||||||||||||||||||||||||||||||
LFX Capital LLC (47) | 524,112 | * | — | — | 524,112 | — | — | — | — | — | ||||||||||||||||||||||||||||||
Luis Ubinas (48) | 30,000 | * | — | — | 30,000 | — | — | — | — | — | ||||||||||||||||||||||||||||||
OldSlip Inv Holdings, LLC (49) | 864,157 | * | — | — | 864,157 | — | — | — | — | — | ||||||||||||||||||||||||||||||
Palantir Technologies Inc. (50) | 2,133,333 | 1.3 | % | — | — | 2,133,333 | — | — | — | — | — | |||||||||||||||||||||||||||||
QSI, Inc. (51) | 10,061,363 | 6.1 | % | — | — | 10,061,363 | — | — | — | — | — | |||||||||||||||||||||||||||||
Quantum Strategic Partners Ltd. (52) | 1,419,431 | * | — | — | 1,419,431 | — | — | — | — | — | ||||||||||||||||||||||||||||||
SMR Starry LLC (53) | 2,182,628 | 1.3 | % | — | — | 2,182,628 | — | — | — | — | — | |||||||||||||||||||||||||||||
SMRS-TOPE LLC (54) | 666,667 | * | — | — | 666,667 | — | — | — | — | — | ||||||||||||||||||||||||||||||
The Gary M. Lauder Revocable Trust (55) | 1,545,296 | * | — | — | 1,545,296 | — | — | — | — | — |
| * | Less than one percent. |
| (1) | Assumes that the selling securityholders sell all of their shares of Class A Common Stock or warrants offered pursuant to this prospectus. The percentage ownership is determined for each selling securityholder by taking into account the sale of shares of Class A Common Stock or warrants of only such selling securityholder. Also assumes that no transactions with respect to shares of Class A Common Stock occur other than conversion of shares of Class X Common Stock, where applicable. |
| (2) | Includes 4,128,113 Earnout Shares and 8,508,413 shares of Class A Common Stock issuable upon exercise of warrants within 60 days. The Sponsor is the record holder of the securities reported herein. The managers of the Sponsor, Richard Heitzmann and Amish Jani, by virtue of their shared control over the Sponsor, may be deemed to beneficially own shares held by the Sponsor. Messrs. Heitzmann and Jani are also the managers of the entities affiliated with FirstMark, and by virtue of their shared control over such entities, may be deemed to beneficially own shares held by such entities. The address for the Sponsor is 100 Fifth Avenue, 3rd Floor, New York, NY 10011. |
| (3) | Richard Heitzmann and Amish Jani are the managing members of FirstMark Capital III GP, LLC, the general partner of FirstMark Capital III, L.P., the managing members of FirstMark Capital OF I GP, LLC, the general partner of FirstMark Capital OF I, L.P., the managing members of FirstMark Capital OF II GP, LLC, the general partner of FirstMark Capital OF II, L.P., the managing members of FirstMark Capital OF III GP, LLC, the general partner of FirstMark Capital OF III, L.P., the managing members of FirstMark Capital S1 GP, LLC, the general partner of FirstMark Capital S1, L.P. and the managing members of FirstMark Capital S2 GP, LLC, the general partner of FirstMark Capital S2, L.P. The address of each of the entities in this footnote is 100 Fifth Ave, 3rd Floor, New York, NY 10011. |
74
| (4) | David Corkins and Clay Freeman are the portfolio managers of the 1992 Larsen Grandchildren’s Trust, ArrowMark Fundamental Opportunity Fund, L.P., Charles F. Urschel 1970 Trust FBO Wendy U. Larsen, Corkins Family Foundation, Intrepid Production Company, Iron Horse Investments LLC, Larsen Family, LP, Michael E. Herman Revocable Trust, THB Iron Rose, LLC, Michael Stolper Living Trust #2 and Stolper Family Trust. ArrowMark acts as the investment advisor with respect to Class A Common Stock held by the various entities and persons identified in this footnote. The address for each of the entities in this footnote is c/o ArrowMark Partners, 100 Fillmore St, Suite 325, Denver, CO 80206. |
| (5) | David Corkins is the managing member of ArrowMark. The address for ArrowMark and Mr. Corkins is c/o ArrowMark Partners, 100 Fillmore St, Suite 325, Denver, CO 80206. |
| (6) | Clay Freeman is the portfolio manager of ArrowMark Equity Opportunity Fund, ArrowMark Colorado Holdings LLC – Large Cap Growth and Meridian Enhanced Equity Fund: ArrowMark acts as the investment advisor with respect to Class A Common Stock held by the various entities and persons identified in this footnote. The address for each of the entities in this footnote is c/o ArrowMark Partners, 100 Fillmore St, Suite 325, Denver, CO 80206. |
| (7) | Number of shares of Common Stock includes 826 shares of Class A Common Stock issuable upon exercise of warrants within 60 days. Mr. Corkins and Mr. Freeman are the portfolio managers of CF Ascent, LLC. The address for this entity is c/o ArrowMark Partners, 100 Fillmore St, Suite 325, Denver, CO 80206. |
| (8) | Number of shares of Common Stock includes 413 shares of Class A Common Stock issuable upon exercise of warrants within 60 days. Mr. Corkins and Mr. Freeman are the portfolio managers for Fred H. Bartlit Jr. The address for this holder is c/o ArrowMark Partners, 100 Fillmore St, Suite 325, Denver, CO 80206. |
| (9) | Number of shares of Common Stock includes 206 shares of Class A Common Stock issuable upon exercise of warrants within 60 days. Mr. Corkins and Mr. Freeman are the portfolio managers for the Kathleen Kay Corkins 2013 Revocable Trust. The address for this holder is c/o ArrowMark Partners, 100 Fillmore St, Suite 325, Denver, CO 80206. |
| (10) | Number of shares of Common Stock includes 40 shares of Class A Common Stock issuable upon exercise of warrants within 60 days. Mr. Corkins and Mr. Freeman are the portfolio managers for the Kathleen Kay Corkins 2014 Irrevocable Trust. The address for this holder is c/o ArrowMark Partners, 100 Fillmore St, Suite 325, Denver, CO 80206. |
| (11) | Number of shares of Common Stock includes 1,241 shares of Class A Common Stock issuable upon exercise of warrants within 60 days. Mr. Corkins and Mr. Freeman are the portfolio managers for the Lookfar Investments, LLC, and as such may be deemed to be the beneficial owners of the Class A Common Stock. The address for this holder is c/o ArrowMark Partners, 100 Fillmore St, Suite 325, Denver, CO 80206. |
| (12) | DaBrian Schaub and Chad Meade are the portfolio managers for the Meridian Growth Fund and the Meridian Small Cap Growth Fund. The address for each entity identified in this footnote is c/o ArrowMark Partners, 100 Fillmore St, Suite 325, Denver, CO 80206. |
| (13) | Number of shares of Common Stock includes 1,998 shares of Class A Common Stock issuable upon exercise of warrants within 60 days. Mr. Corkins and Mr. Freeman are the portfolio managers for the 2008 Miranda Bailey Irrevocable Trust. The address for this holder is c/o ArrowMark Partners, 100 Fillmore St, Suite 325, Denver, CO 80206. |
| (14) | Number of shares of Common Stock includes 496 shares of Class A Common Stock issuable upon exercise of warrants within 60 days. Mr. Corkins and Mr. Freeman are the portfolio managers for the 2008 Ryan Tanner Bailey Irrevocable Trust. The address for this entity is c/o ArrowMark Partners, 100 Fillmore St, Suite 325, Denver, CO 80206. |
| (15) | These accounts are managed by direct or indirect subsidiaries of FMR LLC. Abigail P. Johnson is a Director, the Chairman, the Chief Executive Officer and the President of FMR LLC. Members of the Johnson family, including Abigail P. Johnson, are the predominant owners, directly or through trusts, of Series B voting common shares of FMR LLC, representing 49% of the voting power of FMR LLC. The Johnson family group and all other Series B shareholders have entered into a shareholders’ voting agreement under which all Series B voting common shares will be voted in accordance with the majority vote of Series B voting common shares. Accordingly, through their ownership of voting common shares and the execution of the shareholders’ voting agreement, members of the Johnson family may be deemed, under the Investment Company Act, to form a controlling group with respect to FMR LLC. Neither FMR LLC nor Abigail P. Johnson has the sole power to vote or direct the voting of the shares owned directly by the Fidelity Funds advised by FMR Co, a wholly owned subsidiary of FMR LLC, which power resides with the Fidelity Funds’ Boards of Trustees. Fidelity Management & Research Company carries out the voting of the shares under written guidelines established by the Fidelity Funds’ Boards of Trustees. The address for each of the Fidelity entities identified by this footnote is 245 Summer Street, Boston, Massachusetts 02210. |
75
| (16) | Consists of 21,036,738 shares of Class A Common Stock held by Tiger Global Long Opportunities Master Fund, L.P. and other entities and/or persons affiliated with Tiger Global Management, LLC, including 1,333,333 shares of Class A Common Stock held by Tiger Global Long Opportunities Master Fund, L.P. Tiger Global Management, LLC is controlled by Chase Coleman and Scott Shleifer. The business address for each of these entities is c/o Tiger Global Management, LLC, 9 West 57th Street, 35th Floor, New York, New York 10019. |
| (17) | Reflects 9,268,335 shares of Class X Common Stock, which are convertible on a one-to-one |
| (18) | Mr. Kanojia serves as trustee of the Chaitanya Kanojia Qualified Annuity Interest Trust. |
| (19) | Reflects 12,885,514 shares of Class A Common Stock held by Ms. Longman, the spouse of Mr. Kanojia. |
| (20) | Ms. Longman, the spouse of Mr. Kanojia, serves as trustee of the Tracie L. Longman Qualified Annuity Interest Trust. |
| (21) | Consists of 368,157 shares of Class A Common Stock issuable upon the settlement of RSUs and 368,157 shares of Class A Common Stock issuable upon the exercise of options. |
| (22) | Consists of 1,417,407 shares of Class A Common Stock and 538,923 shares of Class A Common Stock issuable upon the exercise of options. |
| (23) | Consists of 552,236 shares of Class A Common Stock and 184,078 shares of Class A Common Stock issuable upon the exercise of options. |
| (24) | Virginia Lam Abrams serves as an investment advisor and has voting and dispositive control over the shares of Class A Common Stock held by the Kanojia Family GST Exempt 2021 Trust. |
| (25) | Consists of 87,621 shares of Class A Common Stock and 664,842 shares of Class A Common Stock issuable upon the exercise of options. |
| (26) | Consists of 184,075 shares of Class A Common Stock issuable upon the exercise of options. |
| (27) | Consists of 55,223 shares of Class A Common Stock issuable upon the settlement of RSUs and 276,116 shares of Class A Common Stock issuable upon the exercise of options. |
| (28) | Consists of 70,773 shares of Class A Common Stock and 55,223 shares of Class A Common Stock issuable upon the exercise of options. |
| (29) | The address for this entity is 65 East 55th Street, 36th FL, New York, NY 10022. |
| (30) | The address of this holder is 1 Riverside Plaza, Columbus, Ohio 43215. |
| (31) | The address for this holder is 333 E 91st Street, Apt. 8A, New York, NY 10128. |
76
| (32) | The address for this holder is c/o Albright Stonebridge Group, 1900 K Street NW, 5th floor, Washington, D.C., 20006. |
| (33) | Gavin Baker is the Managing Partner & CIO of Atreides Management, LP, the investment manager for Atreides Foundation Master Fund LP. The address of Atreides Foundation Master Fund LP is One International Place, Suite 4410, Boston, MA 02110. |
| (34) | Holder is a wholly owned indirect subsidiary of Crown Castle International Corp., a public Delaware corporation listed on the NYSE (“CCI”). Kenneth J. Simon and Daniel K. Schlanger, who are individuals who can decide to vote or dispose of the shares, are directors of the Holder and also serve as executive officers of CCI. Other executive officers of CCI may also have influence over the voting or disposition of the shares of Class A Common Stock. The address of CC Strategic Investments Corp. is 8020 Katy Freeway, Houston, Texas 77024-1908. |
| (35) | The address for this holder is 277 Marinero Ct, Coral Gables, FL 33143. |
| (36) | The address for this entity is c/o Aurura Management Services LLC, 35 Center Street, PO Box 961, Wolfeboro Falls, NH 03896. Hari Ravichandran is the manager of Decibel Holdings, LLC, and as such may be deemed to be the beneficial owner of the Class A Common Stock. |
| (37) | The address for this entity is c/o Eversource Energy Service Company, 100 Pearl Street, Hartford, CT 06103. |
| (38) | The address for this holder is 18950 Ansley Place, Saratoga, CA 95070. |
| (39) | Hudson Bay Capital Management LP, the investment manager of HB Fund LLC, has voting and investment power over these securities. Sander Gerber is the managing member of Hudson Bay Capital GP LLC, which is the general partner of Hudson Bay Capital Management LP. Each of HB Fund LLC and Sander Gerber disclaims beneficial ownership over these securities. The address of HB Fund LLC is c/o Hudson Bay Capital Management LP, 28 Havemeyer Pl, 2nd Floor, Greenwich, CT 06830. |
| (40) | The address for IAC/InterActiveCorp is 555 W. 18th Street, New York, NY 10011. |
| (41) | The address for this holder is c/o DraftKings, Inc., 222 Berkley Street, Boston, MA 02116 USA. |
| (42) | The address for this holder is 10 Oakmount Cir., Lexington, MA 02420. |
| (43) | The address for this entity is 888 Seventh Avenue, Floor 40, New York, NY 10106. |
| (44) | The address for this holder is 3154 Highland Place NW, Washington, DC 20008. |
| (45) | The address for this entity is 6959 Lebanon Road, Suite 214, Frisco, Texas 75034. |
| (46) | The address for this entity is 660 4th Street, Unit 243, San Francisco, CA 94107. |
| (47) | The address for this entity is 65 East 55th Street, 36th FL, New York, NY 10022. Lee Fixel is a manager of LFX Capital LLC, and as such may be deemed to be the beneficial owner of the Class A Common Stock. |
| (48) | The address for this holder is c/o AT&T Inc., 208 S. Akard Street, Dallas, TX 75202. |
| (49) | The address for this entity is 1 State Street Plaza, Floor 29, New York, NY 10004. Daniel Wolfson is a managing member of OldSlip Inv Holdings, LLC, and as such may be deemed to be the beneficial owner of the Class A Common Stock. |
| (50) | Palantir Technologies Inc. is currently controlled by its seven-member board of directors. For more information, please see Palantir Technologies Inc.’s public filings with the SEC. The address of Palantir Technologies Inc. is 1555 Blake Street, Suite 250, Denver, CO 80202. |
77
| (51) | QSI is a wholly owned subsidiary of Quanta. Quanta, a publicly traded company, holds ultimate voting and investment power over the shares of Class A Common Stock held by QSI. The address for QSI and Quanta is 2800 Post Oak Boulevard, Suite 2600, Houston, TX 77056. |
| (52) | The Class A Common Stock listed herein are held for the account of Quantum Strategic Partners Ltd., a Cayman Islands limited company (“QSP”). Certain of the shares of Class A Common Stock are beneficially owned by Palindrome Master Fund LP, a Delaware limited partnership (“PL”). Soros Fund Management LLC (“SFM LLC”) serves as principal investment manager to QSP and PL. As such, SFM LLC has been granted investment discretion over portfolio investments, including the shares of Class A Common Stock, held for the account of QSP and PL. George Soros serves as Chairman of SFM LLC and has sole discretion to replace FPR Manager LLC, the manager of SFM LLC. The address for QSP and PL is c/o Soros Fund Management LLC, 250 West 55th Street, New York, NY 10019. |
| (53) | Each of HarbourVest Partners, LLC, HarbourVest Partners L.P. and HVST-TOPE LLC may be deemed to have a beneficial interest in the securities held by SMRSTOPE LLC. HarbourVest Partners, LLC is the general partner of HarbourVest Partners L.P., which is the manager of HVST-TOPE LLC, which is the managing member of SMRS-TOPE LLC. The principal business address of SMRS-TOPE LLC is 30 Hudson Yards, Floor 72, New York, NY 10001. Stephen M. Ross is a managing member of SMR Starry LLC, and as such may be deemed to be the beneficial owner of the Class A Common Stock. |
| (54) | The address for this entity is c/o HarbourVest Partners LLC, One Financial Center, Boston, MA 02111. |
| (55) | The address for this entity is 88 Mercedes Lane, Atherton, CA 94027. Gary M. Lauder is the trustee of The Gary M. Lauder Revocable Trust, and as such may be deemed to be the beneficial owner of the Class A Common Stock. |
We cannot advise you as to whether the selling securityholders will in fact sell any or all of such shares of Class A Common Stock or private placement warrants.
Selling securityholder information for each additional selling securityholder, if any, will be set forth by prospectus supplement to the extent required prior to the time of any offer or sale of such selling securityholder’s securities pursuant to this prospectus. To the extent permitted by law, a prospectus supplement may add, update, substitute, or change the information contained in this prospectus, including the identity of each selling securityholder and the number of securities registered on its behalf. A selling securityholder may sell or otherwise transfer all, some, or none of such securities in this offering. See “Plan of Distribution.”
For information regarding transactions between us and the selling securityholders, see the section entitled “Certain Relationships and Related Person Transactions.”
78
CERTAIN RELATIONSHIPS AND RELATED PERSON TRANSACTIONS
Merger Agreement and Related Agreements
Certain Sponsor affiliates held ownership interests in Starry and participated in the sale of the Series Z Shares. In addition to serving as FirstMark’s President and Chairman of FirstMark’s board of directors, Mr. Jani is affiliated with and/or possesses a financial interest in such investment entities and is a member of our board of directors.
Pursuant to the Merger Agreement, the Business Combination was consummated in two steps: (i) at the SPAC Merger Effective Time, FirstMark merged with and into Starry Group, with Starry Group surviving the SPAC Merger as a publicly traded entity and the sole owner of Merger Sub, and (ii) on the Acquisition Merger Effective Date, Merger Sub merged with and into Starry, with Starry surviving the Acquisition Merger as a wholly owned subsidiary of Starry Group.
In connection with the Merger Agreement, we, FirstMark, and entities affiliated with ArrowMark (which are affiliated with entities that collectively held more than 5% of Starry’s capital stock prior to the Business Combination) entered into a
Non-Redemption
Agreement, pursuant to which (1) such entities affiliated with ArrowMark agreed to not redeem a certain number of shares of FirstMark Class A Common Stock beneficially owned by such entities, and (2) we agreed to issue to such entities with a number of shares of our Class A Common Stock equal to (i) the number of shares of FirstMark Class A Common Stock beneficially owned by such entities multiplied by (ii) (a) 1.33 less (b) the Class A Exchange Ratio (as defined in the Merger Agreement); subject to a minimum amount of our Class A Common Stock.PIPE Investment
Certain PIPE Investors related to Starry entered into PIPE Subscription Agreements with FirstMark and us, pursuant to which they have subscribed for shares of our Class A Common Stock in connection with the PIPE Investment. Such PIPE Investors include (i) entities affiliated with ArrowMark (2,666,667 shares), which are affiliated with entities that collectively held more than 5% of Starry’s capital stock prior to the Business Combination, (ii) Tiger Global Long Opportunities Master Fund, L.P. (1,333,333 shares), which is affiliated with entities that collectively held more than 5% of Starry’s capital stock prior to the Business Combination, (iii) entities affiliated with FMR LLC (4,000,000 shares), which are affiliated with entities that collectively held more than 5% of Starry’s capital stock prior to the Business Combination and (iv) QSI, Inc. (200,000 shares), which held more than 5% of Starry’s capital stock prior to the Business Combination.
In connection with the execution of the Merger Agreement, we and FirstMark entered into PIPE Subscription Agreements, pursuant to which the PIPE Investors agreed to purchase, in the aggregate, 14,533,334 shares of our Common Stock at $7.50 per share for an aggregate commitment amount of $109.0 million. The PIPE Investment was consummated on the Acquisition Merger Effective Date.
The PIPE Subscription Agreements provide that no later than 15 business days after the consummation of the Business Combination, we shall file a shelf registration statement covering the resale of the shares of our Common Stock issued to the PIPE Investors and we shall use our commercially reasonable efforts to have such registration statement declared effective as soon as practicable after the filing thereof but no later than the earlier of (i) 60 calendar days after the filing thereof (or 90 calendar days after the filing date thereof if the SEC notifies FirstMark that it will “review” such registration statement) and (ii) the 10th business day after the date FirstMark is notified (orally or in writing, whichever is earlier) by the SEC that such registration statement will not be “reviewed” or will not be subject to further review.
The PIPE Subscription Agreements will terminate, and be of no further force and effect, upon the earlier to occur of (i) such date and time as the Merger Agreement is terminated in accordance with its terms, (ii) upon the mutual written agreement of FirstMark and the applicable PIPE Investor, (iii) if the conditions set forth therein are not satisfied or are not capable of being satisfied prior to the closing of the transactions contemplated by the PIPE Subscription Agreements and, as a result thereof, the transactions contemplated therein will not be or are not consummated at the closing of the transactions contemplated by the PIPE Subscription Agreements) or (iv) July 6, 2022.
Series Z Investment
Certain Series Z Investors affiliated with the Sponsor entered into the FirstMark Series Z Subscription Agreement and the Series Z Subscription Agreement Amendment, each with Starry, pursuant to which they subscribed for shares of Starry Series Z Preferred Stock in connection with the Series Z Investment. Such purchasers of the Series Z Shares include entities affiliated with FirstMark Capital (2,800,000 shares), which are affiliated with entities that collectively held more than 5% of Starry’s capital stock prior to the Business Combination.
79
The Tiger Series Z Investor, which is affiliated with entities that collectively held more than 5% of Starry’s capital stock prior to the Business Combination, entered into the Tiger Series Z Subscription Agreement with Starry, pursuant to which it subscribed for 1,333,333 shares of Starry Series Z Preferred Stock in connection with the Series Z Investment.
Collectively, the Series Z Investors agreed to purchase, in the aggregate, 4,133,333 shares of Starry Series Z Preferred Stock at $7.50 per share for an aggregate commitment amount of $31.0 million. The Series Z Investment was consummated on the Acquisition Merger Effective Date.
Registration Rights Agreement
Pursuant to the Merger Agreement, we entered into the Registration Rights Agreement with FirstMark, the Sponsor, certain equity holders of FirstMark (“FirstMark Equity holders”) and certain equity holders of Starry (“Starry Equity holders,” and together with FirstMark Equity holders, the “Equity holders”) immediately prior to the Acquisition Merger Effective Date, pursuant to which we agreed to, within 30 days of the Acquisition Merger Effective Date, register for resale, pursuant to Rule 415 under the Securities Act, certain shares of our Common Stock and our other equity securities that are held by the parties thereto from time to time.
Under the Registration Rights Agreement, in connection with any underwritten offering of our equity securities each Equity holder that participates in the underwritten offering pursuant to the terms of the Registration Rights Agreement agrees that it shall not transfer any shares of our Common Stock or our other equity securities (other than those included in such offering pursuant to the Registration Rights Agreement), without our prior written consent, during
the 90-day period
beginning on the date of pricing of such offering or such shorter period during which we agree not to conduct an underwritten primary offering of our Common Stock, except in the event the underwriters managing the offering otherwise agree by written consent. Each such Equity holder agrees to execute acustomary lock-up agreement
in favor of the underwriters to such effect (in each case on substantially the same terms and conditions as all such Equity holders).The Registration Rights Agreement will terminate with respect to any Equity holder on the date that such Equity holder no longer holds our equity securities.
Starry Warrants
In connection with entering into the Starry Credit Agreement in February 2019, its subsequent amendment and restatement in December 2019 and the Fifth Amendment in October 2021, Starry issued 18,446,845 Starry Warrants to persons and entities affiliated with ArrowMark. The Starry Warrants that were vested automatically converted into our Common Stock immediately prior to the Acquisition Merger Effective Date.
Commercial Agreements and Partnerships
QSI, Inc., a beneficial owner of more than 5% of Starry’s voting stock, prior to the Business Combination, is a wholly owned subsidiary of Quanta. QSI and Starry are party to a Strategic Alliance Agreement dated as of March 30, 2021 pursuant to which Starry agreed to retain QSI and its affiliates as a preferred service provider to perform professional services and construction services on behalf of Starry.
Indemnification Agreements
We entered into indemnification agreements with each of our directors and executive officers. The indemnification agreements and our Charter and Bylaws require us to indemnify our directors and executive officers to the fullest extent permitted by law.
Earnout
Pursuant to the Sponsor Support Agreement Amendment, during the Earnout Period, the Sponsor has agreed to subject 4,128,113 Earnout Shares to potential forfeiture to Starry Group for no consideration until the occurrence of the applicable Earnout Triggering Event(s). The Earnout Shares are comprised of (a) one tranche of 2,224,167 shares subject to Earnout Triggering Event I and (b) two tranches of 951,973 shares of which (i) one tranche is subject to Earnout Triggering Event II and (ii) one tranche is subject to Earnout Triggering Event III. If one or more of the Earnout Triggering Events has not occurred by the end of the Earnout Period, the applicable tranche of Earnout Shares will be forfeited to Starry Group.
80
For purposes of the foregoing:
“Earnout Triggering Event I” refers to any time during the Earnout Period when the last reported sale price of Class A Common Stock on the principal national securities exchange on which the Class A Common Stock is then listed equals or exceeds $12.50 per share for 20 out of any 30 consecutive trading day period;
“Earnout Triggering Event II” refers to any time during the Earnout Period when the last reported sale price of Class A Common Stock on the principal national securities exchange on which the Class A Common Stock is then listed equals or exceeds $15.00 per share for 20 out of any 30 consecutive trading day period;
“Earnout Triggering Event III” refers to any time during the Earnout Period when the last reported sale price of Class A Common Stock on the principal national securities exchange on which the Class A Common Stock is then listed equals or exceeds $17.50 per share for 20 out of any 30 consecutive trading day period; and
“Earnout Triggering Events” refers collectively to Earnout Triggering Event I, Earnout Triggering Event II and Earnout Triggering Event III.
Executive Officer and Director Compensation Arrangements
See the section entitled “Executive Compensation” for information regarding compensation arrangements with our executive officers and directors, which include, among other things, employment, termination of employment and change in control arrangements, stock awards and certain other benefits.
Prior Starry Financings
All share counts in “—Prior Starry Financings” are shown on a pre-Business Combination basis.
Starry Series E Preferred Stock Financing
In March 2021, Starry sold an aggregate of (1) 18,700,445 shares of Starry
Series E-1 Preferred
Stock at the conversion price described below with respect to the conversion of convertible promissory notes; (2) 7,121,417 shares of StarrySeries E-2 Preferred
Stock at the conversion price described below with respect to the conversion of convertible promissory notes; and (3) 68,452,380 shares of StarrySeries E-3 Preferred
Stock at a purchase price of $1.68, in each case to the related persons listed below. The following table summarizes these purchases by such related persons:Name | Shares of Starry Series E-1 Preferred Stock | Total Purchase Price | ||||||
Entities affiliated with ArrowMark (1) | 2,003,357 | $ | 2,864,814 | |||||
Entities affiliated with FirstMark Capital (2) | 1,670,162 | $ | 2,349,138 | |||||
Entities affiliated with FMR LLC (3) | 15,026,926 | $ | 21,140,327 | |||||
Name | Shares of Starry Series E-2 Preferred Stock | Total Purchase Price | ||||||
Entities affiliated with ArrowMark (1) | 1,124,555 | $ | 1,506,904 | |||||
Entities affiliated with FirstMark Capital (2) | 2,249,110 | $ | 3,000,000 | |||||
Tiger Global Private Investment Partners IX, LP (4) | 3,747,752 | $ | 5,021,988 | |||||
Name | Shares of Starry Series E-3 Preferred Stock | Total Purchase Price | ||||||
QSI, Inc. (5) | 53,571,428 | $ | 90,000,000 | |||||
Entities affiliated with FMR LLC (3) | 14,880,952 | $ | 25,000,000 | |||||
| (1) | Entities affiliated with ArrowMark held more than 5% of Starry’s outstanding capital stock. |
| (2) | Entities affiliated with FirstMark Capital held more than 5% of Starry’s outstanding capital stock. |
| (3) | Entities affiliated with FMR LLC held more than 5% of Starry’s outstanding capital stock. |
| (4) | Tiger Global Private Investment Partners IX, LP held more than 5% of Starry’s outstanding capital stock. |
| (5) | QSI, Inc., a wholly owned affiliate of Quanta, held more than 5% of Starry’s outstanding capital stock. |
81
Convertible Note Financing
In certain cases, the payment of the total purchase price for shares of Starry
Series E-1 Preferred
Stock and StarrySeries E-2 Preferred
Stock listed above consisted of, or included, the conversion of convertible promissory notes held by the related persons. In September 2020, Starry sold an aggregate of approximately $26.3 million in principal amount of convertible promissory notes to the related persons listed below. Interest on the principal amount of the convertible promissory notes accrued at the rate of 3% per year. The outstanding principal and accrued interest of such convertible promissory notes converted into shares of StarrySeries E-1 Preferred
Stock at a discounted purchase price of $1.43 per share and are reflected in the above table. From January 2021 to March 2021, Starry sold an aggregate of approximately $9.5 million principal amount of convertible promissory notes to the related persons listed below. Interest on the principal amount of the convertible promissory notes accrued at the rate of 3% per year. The outstanding principal and accrued interest of such convertible promissory notes converted into shares of StarrySeries E-2 Preferred
Stock at a discounted purchase price of $1.34 per share and are reflected in the above table. The following table summarizes the convertible promissory notes issued by Starry to such related persons:Name | Principal Amount | Security Converted Into | ||||||
Entities affiliated with ArrowMark (1) | $ | 2,818,710 | Starry Series E-1 Preferred Stock | |||||
Entities affiliated with ArrowMark (1) | $ | 1,500,000 | Starry Series E-2 Preferred Stock | |||||
Entities affiliated with FirstMark Capital (2) | $ | 2,349,138 | Starry Series E-1 Preferred Stock | |||||
Entities affiliated with FirstMark Capital (2) | $ | 3,000,000 | Starry Series E-2 Preferred Stock | |||||
Entities affiliated with FMR LLC (3) | $ | 21,140,327 | Starry Series E-1 Preferred Stock | |||||
Tiger Global Private Investment Partners IX, LP (4) | $ | 5,021,988 | Starry Series E-2 Preferred Stock | |||||
| (1) | Entities affiliated with ArrowMark held more than 5% of Starry’s outstanding capital stock. |
| (2) | Entities affiliated with FirstMark Capital held more than 5% of Starry’s outstanding capital stock. |
| (3) | Entities affiliated with FMR LLC held more than 5% of Starry’s outstanding capital stock. |
| (4) | Tiger Global Private Investment Partners IX, LP held more than 5% of Starry’s outstanding capital stock. |
Starry Series D Preferred Stock Financing
From March 2019 to July 2020, Starry sold 82,280,095 shares of Starry Series D Preferred Stock at a purchase price of $1.43 to the related persons listed below. The following table summarizes these purchases by such related persons:
Name | Shares of Series D Preferred Stock | Total Purchase Price | ||||||
Entities affiliated with ArrowMark (1) | 6,993,008 | $ | 10,000,001 | |||||
Entities affiliated with FirstMark Capital (2) | 26,504,099 | $ | 37,900,862 | |||||
Entities affiliated with FMR LLC (3) | 34,167,603 | $ | 48,859,672 | |||||
Tiger Global Private Investment Partners IX, LP (4) | 14,615,385 | $ | 20,900,001 | |||||
| (1) | Entities affiliated with ArrowMark held more than 5% of Starry’s outstanding capital stock. |
| (2) | Entities affiliated with FirstMark Capital held more than 5% of Starry’s outstanding capital stock. |
| (3) | Entities affiliated with FMR LLC held more than 5% of Starry’s outstanding capital stock. |
| (4) | Tiger Global Private Investment Partners IX, LP held more than 5% of Starry’s outstanding capital stock. |
Starry Series C Preferred Stock Financing
From December 2017 to June 2018, Starry sold 93,614,426 shares of Starry Series C Preferred Stock at a purchase price of $0.922 to the related persons listed below. The following table summarizes these purchases by such related persons:
Name | Shares of Series C Preferred Stock | Total Purchase Price | ||||||
Entities affiliated with ArrowMark (1) | 13,015,185 | $ | 12,000,001 | |||||
Entities affiliated with FirstMark Capital (2) | 21,691,974 | $ | 20,000,000 | |||||
Entities affiliated with FMR LLC (3) | 18,980,477 | $ | 17,500,000 | |||||
Tiger Global Private Investment Partners IX, LP (4) | 39,926,790 | $ | 36,812,500 | |||||
| (1) | Entities affiliated with ArrowMark held more than 5% of Starry’s outstanding capital stock. |
82
| (2) | Entities affiliated with FirstMark Capital held more than 5% of Starry’s outstanding capital stock. |
| (3) | Entities affiliated with FMR LLC held more than 5% of Starry’s outstanding capital stock. |
| (4) | Tiger Global Private Investment Partners IX, LP held more than 5% of Starry’s outstanding capital stock. |
Policies and Procedures for Approval of Related Person Transactions
Our board of directors has adopted a written related person transaction policy that sets forth the following policies and procedures for the review and approval or ratification of related person transactions.
A “Related Person Transaction” is a transaction, arrangement or relationship in which we or any of our subsidiaries was, is or will be a participant, the amount of which involved exceeds $120,000, and in which any related person had, has or will have a direct or indirect material interest. A “Related Person” means:
| • | any person who is, or at any time during the applicable period was, one of our executive officers or a member of our board of directors; |
| • | any person who is known by us to be the beneficial owner of more than 5% of our voting stock; |
| • | any immediate family member of any of the foregoing persons, which means any child, stepchild, parent, stepparent, spouse, sibling, mother-in-law, father-in-law, daughter-in-law, brother-in-law or sister-in-law of |
| • | any firm, corporation or other entity in which any of the foregoing persons is a partner or principal or in a similar position or in which such person has a 10% or greater beneficial ownership interest. |
We have policies and procedures designed to minimize potential conflicts of interest arising from any dealings it may have with its affiliates and to provide appropriate procedures for the disclosure of any real or potential conflicts of interest that may exist from time to time. Specifically, the audit committee will have the responsibility to review related person transactions.
83
DESCRIPTION OF CAPITAL STOCK
The following summary of the material terms of our capital stock is not intended to be a complete summary of the rights and preferences of such securities. The full text of the Charter and Bylaws are included as exhibits to the registration statement of which this prospectus forms a part. You are encouraged to read the applicable provisions of Delaware law, the Charter and the Bylaws in their entirety for a complete description of the rights and preferences of our securities.
Authorized Capital Stock
The Charter authorizes the issuance of 860,000,000 shares of capital stock, of which 800,000,000 shares of Class A Common Stock, 50,000,000 shares of Class X common stock and 10,000,000 shares are shares of preferred stock, par value $0.0001 per share (“Preferred Stock”).
Common Stock
Class A Common Stock
Voting Rights
Holders of Class A Common Stock are entitled to cast one vote per share. Generally, holders of all classes of our Common Stock vote together as a single class, and an action is approved by our stockholders if the number of votes cast in favor of the action exceeds the number of votes cast in opposition to the action. Holders of Class A Common Stock will not be entitled to cumulate their votes in the election of directors.
The Charter further provides that our board of directors (other than any directors elected by holders of any series of Preferred Stock) are divided into three classes, Class I, Class II and Class III, with each class serving staggered terms.
The Charter further provides that the affirmative vote of at
least two-thirds of
the total voting power of all then outstanding shares of our stock, voting as a single class, are required to amend, alter, repeal or rescind certain provisions of the Charter, including provisions relating to voting and dividend rights, the size and classifications of our board of directors, special meetings, director and officer indemnification, forum selection and amendments to the Charter. The affirmative vote of the holders of atleast two-thirds of
the voting power of all the then-outstanding shares of our voting stock, voting as a single class, are required to amend or repeal the Bylaws, although the Bylaws may be amended by a simple majority vote of our board of directors.Dividend Rights
Each holder of Class A Common Stock will share ratably (based on the number of shares of Class A Common Stock held) if and when any dividend is declared by our board of directors out of funds legally available therefor, subject to restrictions, whether statutory or contractual (including with respect to any outstanding indebtedness), on the declaration and payment of dividends and to any restrictions on the payment of dividends imposed by the terms of any outstanding our Preferred Stock or any class or series of stock having a preference over, or the right to participate with, Class A Common Stock with respect to the payment of dividends.
Liquidation, Dissolution and Winding Up
In the event of any liquidation, dissolution or winding up of the Company, whether voluntary or involuntary, each holder of Class A Common Stock then outstanding will participate pro rata in our funds and assets that may be legally distributed to our stockholders, subject to the designations, preferences, limitations, restrictions and relative rights of any class or series of our Preferred Stock then outstanding.
Other Matters
No shares of Class A Common Stock are subject to redemption or have preemptive rights to purchase additional shares of Class A Common Stock. Holders of shares of Class A Common Stock do not have subscription, redemption or conversion rights.
Class X Common Stock
Voting Rights
Prior to the Sunset Date (defined below), holders of Class X Common Stock are entitled to cast 20 votes per share of Class X Common Stock. On the Sunset Date, each share of Class X Common Stock will automatically convert into one share of Class A Common Stock, and from and after the Sunset Date, holders thereof are entitled to one vote per share on all matters on which
84
stockholders generally are entitled to vote. Generally, holders of all classes of our Common Stock vote together as a single class, and an action is approved by our stockholders if the number of votes cast in favor of the action exceeds the number of votes cast in opposition to the action. Holders of the Class X Common Stock will not be entitled to cumulate their votes in the election of directors.
“” refers to the earlier of (a) the date that is nine months following the first date after the Acquisition Merger Effective Date on which Chaitanya Kanojia (1) is no longer providing services, whether upon death, resignation, removal or otherwise, to the Company as a member of the senior leadership team, officer or director and (2) has not provided any such services for the duration of such nine-month period; and (b) the first date after the Acquisition Merger Effective Date as of which the Qualified Stockholders (as defined in the Charter) have Transferred (as defined in the Charter), in the aggregate, more than 75% of the shares of Class X Common Stock that were held by Chaitanya Kanojia and other registered holders of Class X Common Stock immediately following the Acquisition Merger Effective Date.
Sunset Date
Dividend Rights
Each holder of Class X Common Stock will share ratably (based on the number of shares of Class X Common Stock held) if and when any dividend is declared by our Board out of funds legally available therefor, subject to restrictions, whether statutory or contractual (including with respect to any outstanding indebtedness), on the declaration and payment of dividends and to any restrictions on the payment of dividends imposed by the terms of any outstanding Preferred Stock or any class or series of stock having a preference over, or the right to participate with, Class X Common Stock with respect to the payment of dividends.
Liquidation Rights
In the event of any liquidation, dissolution or winding up of the Company, whether voluntary or involuntary, each holder of Class X Common Stock then outstanding will participate pro rata in our funds and assets that may be legally distributed to our stockholders, subject to the designations, preferences, limitations, restrictions and relative rights of any class or series of our Preferred Stock then outstanding.
Transfers
Pursuant to the Charter, shares of Class X Common Stock are fully transferable to any transferee;, that such shares of Class X Common Stock will automatically convert into shares of Class A Common Stock upon certain transfers of such shares, subject to certain exceptions set forth in the Charter, and upon the Sunset Date.
provided, however
Other Matters
No shares of Class X Common Stock are subject to redemption or have preemptive rights to purchase additional shares of Class X Common Stock. Each share of Class X Common Stock is convertible into one share of Class A Common Stock at the option of the holder thereof at any time upon written notice to our transfer agent. Each share of Class X Common Stock will automatically convert into one share of Class A Common Stock (a) upon certain transfers of such shares, subject to exceptions set forth in the Charter or (b) on the Sunset Date.
Preferred Stock
The Charter provides that our board of directors has the authority, without action by the stockholders, to designate and issue shares of Preferred Stock in one or more classes or series, and the number of shares constituting any such class or series, and to fix the voting powers, designations, preferences, limitations, restrictions and relative rights of each class or series of Preferred Stock, including, without limitation, dividend rights, conversion rights, redemption privileges and liquidation preferences, which rights may be greater than the rights of the holders of our Common Stock.
The purpose of authorizing our board of directors to issue Preferred Stock and determine the rights and preferences of any classes or series of Preferred Stock is to eliminate delays associated with a stockholder vote on specific issuances. The simplified issuance of Preferred Stock, while providing flexibility in connection with possible acquisitions, future financings and other corporate purposes, could have the effect of making it more difficult for a third party to acquire, or could discourage a third party from seeking to acquire, a majority of our outstanding voting stock. Additionally, the issuance of Preferred Stock may adversely affect the holders of Class A Common Stock by restricting dividends on the Class A Common Stock, diluting the voting power of Class A Common Stock or subordinating the dividend or liquidation rights of Class A Common Stock. As a result of these or other factors, the issuance of our Preferred Stock could have an adverse impact on the market price of Class A Common Stock.
85
Warrants
Public Warrants
FirstMark assigned to us all of FirstMark’s right, title and interest in and to the Warrant Agreement and we assumed, and agreed to pay, perform, satisfy and discharge in full, all of FirstMark’s liabilities and obligations under the Warrant Agreement arising from and after the SPAC Merger Effective Time. In addition, at the SPAC Merger Effective Time, each warrant was adjusted to entitle the holder to purchase 1.2415 shares of Class A Common Stock at a price of $11.50 per 1.2415 shares (such adjustment, the “Initial Warrant Adjustment”).
On April 25, 2022, the Company issued a notice to holders of its warrants, notifying holders of the following adjustments (the “Subsequent Warrant Adjustments” and, together with the “Initial Warrant Adjustment,” the “Warrant Adjustments”) to the terms of the warrants, effective after the close of trading on April 22, 2022:
| • | the adjustment to the warrant price of the warrants from $11.50 per 1.2415 shares to $9.13 per 1.2415 shares of Class A Common Stock (representing 115% of the Market Value (as defined below)); |
| • | the adjustment of the $18.00 per share redemption trigger price described in Sections 6.1 and 6.2 of the Warrant Agreement to $14.29 per share of Class A Common Stock (representing 180% of the Market Value); and |
| • | the adjustment of the $10.00 per share redemption trigger price described in Section 6.2 of the Warrant Agreement to $7.94 per share of Class A Common Stock (representing the Market Value). |
The Subsequent Warrant Adjustments were required pursuant to Section 4.4 of the Warrant Agreement, as a result of (i) the Company issuing shares of its Class A Common Stock and securities exchangeable for shares of Class A Common Stock at an issue price of $7.50 per share (the “Newly Issued Price”) for capital raising purposes in connection with the closing of the Business Combination, (ii) the aggregate gross proceeds from such issuances representing more than 60% of the total equity proceeds, and interest thereon, available for the funding of the Business Combination on the date of the completion of the Business Combination (net of redemptions) and (iii) the volume-weighted average trading price of the Class A Common Stock during the twenty (20) trading day period starting on the trading day prior to the day on which the Company consummated the Business Combination (such price, the “Market Value”) being below $9.20 per share. The Market Value was determined to be $7.94 per share.
After giving effect to the Warrant Adjustments, each whole warrant entitled the registered holder to purchase 1.2415 shares of Class A Common Stock at a price of $9.13 per 1.2415 shares, subject to adjustment as discussed below, at any time commencing 30 days after the completion of the Business Combination, except as described below. Pursuant to the Warrant Agreement, only a whole warrant may be exercised at a given time by a warrant holder. The warrants will expire five years after the completion of the Business Combination, at 5:00 p.m., New York City time, or earlier upon redemption or liquidation.
We are not obligated to deliver any Class A Common Stock pursuant to the exercise of a warrant and have no obligation to settle such warrant exercise unless a registration statement under the Securities Act covering the issuance of the shares of Class A Common Stock issuable upon exercise of the warrants is then effective and a current prospectus relating thereto is current, subject to our satisfying our obligations described below with respect to registration, or a valid exemption from registration is available, including in connection with a cashless exercise permitted as a result of a notice of redemption described below under “—Redemption of warrants when the price per share of Class A Common Stock equals or exceeds $7.94.” No warrant is exercisable for cash or on a cashless basis, and we are not obligated to issue any shares to holders seeking to exercise their warrants, unless the issuance of the shares upon such exercise is registered or qualified under the securities laws of the state of the exercising holder, or an exemption is available. In the event that the conditions in the two immediately preceding sentences are not satisfied with respect to a warrant, the holder of such warrant is not entitled to exercise such warrant and such warrant may have no value and expire worthless. In the event that a registration statement is not effective for the exercised warrants, the purchaser of a unit containing such warrant will have paid the full purchase price for the unit solely for the share of Class A Common Stock underlying such unit.
We have agreed that as soon as practicable, but in no event later than 15 business days after the closing of the Business Combination, we will use our commercially reasonable efforts to file with the SEC a registration statement covering the issuance, under the Securities Act, of the Class A Common Stock issuable upon exercise of the warrants, and we will use our commercially reasonable efforts to cause the same to become effective within 60 business days after the closing of the Business Combination and to maintain the effectiveness of such registration statement, and a current prospectus relating thereto, until the expiration of the warrants in accordance with the provisions of the Warrant Agreement. Notwithstanding the above, if our shares of Class A Common Stock are, at the time of any exercise of a warrant, not listed on a national securities exchange such that they satisfy the definition of a “covered security” under Section 18(b)(1) of the Securities Act, we may, at our option, require holders of public warrants who exercise their warrants to do so on a “cashless basis” in accordance with Section 3(a)(9) of the Securities Act and, in the event we so elect, we will not be required to file or maintain in effect a registration statement, but will use our commercially reasonable efforts to register or qualify the shares under applicable blue sky laws to the extent an exemption is not available. In such event, each holder would pay the exercise price by surrendering the warrants for that number of shares of Class A Common Stock equal to the lesser of (A) the quotient obtained by dividing (x) the product of the number of shares of Class A Common Stock underlying the warrants, the excess of the “fair market value” (defined below) less the exercise price of the warrants by (y) the fair market value and (B) 0.4481815. The “fair market value” as used in the preceding sentence shall mean the volume weighted average price of the shares of Class A Common Stock for the 10 trading days ending on the trading day prior to the date on which the notice of exercise is received by the warrant agent.
multiplied by
Redemption of warrants when the price per share of Class A Common Stock equals or exceeds $14.29
Once the warrants become exercisable, we may redeem the warrants (except as described herein with respect to the private placement warrants):
| • | in whole and not in part; |
| • | at a price of $0.01 per warrant; |
| • | upon not less than 30 days’ prior written notice of redemption to each warrant holder; |
| • | if, and only if, the last reported sale price of our Class A Common Stock for any 20-trading days withina 30-trading day period ending on the third trading day prior to the date on which we send the notice of redemption to the warrant holders (which we refer to as the “Reference Value”) equals or exceeds $14.29 per share (as adjusted for adjustments to the number of shares issuable upon exercise or the exercise price of a warrant as described under the heading “—Warrants— Public Stockholders’ Warrants—Anti-dilution Adjustments”). |
86
We will not redeem the warrants as described above unless a registration statement under the Securities Act covering the issuance of the shares of Class A Common Stock issuable upon exercise of the warrants is then effective and a current prospectus relating to those shares of Class A Common Stock is available throughout
the 30-day redemption
period. If and when the warrants become redeemable by us, we may exercise our redemption right even if we are unable to register or qualify the underlying securities for sale under all applicable state securities laws.We have established the last of the redemption criterion discussed above to prevent a redemption call unless there is at the time of the call a significant premium to the warrant exercise price. If the foregoing conditions are satisfied and we issue a notice of redemption of the warrants, each warrant holder will be entitled to exercise his, her or its warrant prior to the scheduled redemption date. However, the price of the Class A Common Stock may fall below the $14.29 redemption trigger price (as adjusted for adjustments to the number of shares issuable upon exercise or the exercise price of a warrant as described under the heading “— Warrants—Public Stockholders’ Warrants—Anti-dilution Adjustments”) as well as the $9.13 (for whole shares) warrant exercise price after the redemption notice is issued.
Redemption of warrants when the price per share of Class A Common Stock equals or exceeds $7.94
Once the warrants become exercisable, we may redeem the outstanding warrants:
| • | in whole and not in part; |
| • | at $0.10 per warrant upon a minimum of 30 days’ prior written notice of redemption provided that holders will be able to exercise their warrants on a cashless basis prior to redemption and receive that number of shares determined by reference to the table below, based on the redemption date and the “fair market value” of our Class A Common Stock (as defined below) except as otherwise described below; |
| • | if, and only if, the Reference Value (as defined above under “Redemption of warrants when the price per share of Class A Common Stock equals or exceeds $14.29”) equals or exceeds $7.94 per share (as adjusted for adjustments to the number of shares issuable upon exercise or the exercise price of a warrant as described under the heading “—Warrants—Public Stockholders’ Warrants—Anti-dilution Adjustments”); and |
| • | if the Reference Value is less than $14.29 per share (as adjusted for adjustments to the number of shares issuable upon exercise or the exercise price of a warrant as described under the heading “—Warrants — Public Stockholders’ Warrants — Anti-dilution Adjustments”), the private placement warrants must also be concurrently called for redemption on the same terms as the outstanding public warrants, as described above. |
During the period beginning on the date the notice of redemption is given, holders may elect to exercise their warrants on a cashless basis. The numbers in the table below represent the number of shares of Class A Common Stock that a warrant holder will receive upon such cashless exercise in connection with a redemption by us pursuant to this redemption feature, based on the “fair market value” of Class A Common Stock on the corresponding redemption date (assuming holders elect to exercise their warrants and such warrants are not redeemed for $0.10 per warrant), determined for these purposes based on volume weighted average price of Class A Common Stock during the ten trading days immediately following the date on which the notice of redemption is sent to the holders of warrants, and the number of months that the corresponding redemption date precedes the expiration date of the warrants, each as set forth in the table below. We will provide our warrant holders with the final fair market value no later than one business day after
the 10-trading day
period described above ends.The share prices set forth in the column headings of the table below will be adjusted as of any date on which the number of shares issuable upon exercise of a warrant or the exercise price of a warrant is adjusted as set forth under the heading “— Anti-dilution Adjustments” below. If the number of shares issuable upon exercise of a warrant is adjusted, the adjusted share prices in the column headings will equal the share prices immediately prior to such adjustment, a fraction, the numerator of which is the number of shares deliverable upon exercise of a warrant immediately prior to such adjustment and the denominator of which is the number of shares deliverable upon exercise of a warrant as so adjusted. The number of shares in the table below shall be adjusted in the same manner and at the same time as the number of shares issuable upon exercise of a warrant. If the exercise price of a warrant is adjusted pursuant to the second paragraph under the heading “—Anti-dilution Adjustments” below, the adjusted share prices in the column headings will equal the unadjusted share price less the decrease in the exercise price of a warrant pursuant to such exercise price adjustment.
multiplied by
The values provided in the table below, including in the column headings, give effect to the Warrant Adjustments.
87
Redemption Date (period to expiration of warrants) | Fair Market Value of Class A Common Stock | |||||||||||||||||||||||||||||||||||
| ≤ 7.94 | 8.73 | 9.53 | 10.32 | 11.12 | 11.91 | 12.70 | 13.50 | ≥ 14.29 | ||||||||||||||||||||||||||||
60 months | 0.3240315 | 0.3488615 | 0.3687255 | 0.3861065 | 0.4022460 | 0.4183855 | 0.4320420 | 0.4444570 | 0.4481815 | |||||||||||||||||||||||||||
57 months | 0.3190655 | 0.3438955 | 0.3650010 | 0.3848650 | 0.4022460 | 0.4183855 | 0.4320420 | 0.4444570 | 0.4481815 | |||||||||||||||||||||||||||
54 months | 0.3128580 | 0.3376880 | 0.3612765 | 0.3811405 | 0.3997630 | 0.4159025 | 0.4308005 | 0.4432155 | 0.4481815 | |||||||||||||||||||||||||||
51 months | 0.3054090 | 0.3327220 | 0.3563105 | 0.3774160 | 0.3972800 | 0.4134195 | 0.4295590 | 0.4432155 | 0.4481815 | |||||||||||||||||||||||||||
48 months | 0.2992015 | 0.3265145 | 0.3513445 | 0.3736915 | 0.3935555 | 0.4121780 | 0.4270760 | 0.4419740 | 0.4481815 | |||||||||||||||||||||||||||
45 months | 0.2917525 | 0.3203070 | 0.3463785 | 0.3699670 | 0.3910725 | 0.4096950 | 0.4258345 | 0.4419740 | 0.4481815 | |||||||||||||||||||||||||||
42 months | 0.2830620 | 0.3128580 | 0.3401710 | 0.3650010 | 0.3873480 | 0.4072120 | 0.4245930 | 0.4407325 | 0.4481815 | |||||||||||||||||||||||||||
39 months | 0.2743715 | 0.3054090 | 0.3339635 | 0.3600350 | 0.3836235 | 0.4034875 | 0.4221100 | 0.4394910 | 0.4481815 | |||||||||||||||||||||||||||
36 months | 0.2644395 | 0.2967185 | 0.3265145 | 0.3538275 | 0.3786575 | 0.4010045 | 0.4208685 | 0.4382495 | 0.4481815 | |||||||||||||||||||||||||||
33 months | 0.2545075 | 0.2880280 | 0.3190655 | 0.3476200 | 0.3736915 | 0.3972800 | 0.4183855 | 0.4370080 | 0.4481815 | |||||||||||||||||||||||||||
30 months | 0.2433340 | 0.2780960 | 0.3103750 | 0.3401710 | 0.3687255 | 0.3923140 | 0.4159025 | 0.4357665 | 0.4481815 | |||||||||||||||||||||||||||
27 months | 0.2296775 | 0.2656810 | 0.3004430 | 0.3327220 | 0.3612765 | 0.3885895 | 0.4121780 | 0.4345250 | 0.4481815 | |||||||||||||||||||||||||||
24 months | 0.2147795 | 0.2532660 | 0.2892695 | 0.3227900 | 0.3538275 | 0.3823820 | 0.4084535 | 0.4320420 | 0.4481815 | |||||||||||||||||||||||||||
21 months | 0.1998815 | 0.2396095 | 0.2768545 | 0.3128580 | 0.3463785 | 0.3774160 | 0.4047290 | 0.4308005 | 0.4481815 | |||||||||||||||||||||||||||
18 months | 0.1812590 | 0.2222285 | 0.2619565 | 0.3004430 | 0.3364465 | 0.3699670 | 0.3997630 | 0.4283175 | 0.4481815 | |||||||||||||||||||||||||||
15 months | 0.1613950 | 0.2036060 | 0.2445755 | 0.2855450 | 0.3252730 | 0.3612765 | 0.3935555 | 0.4245930 | 0.4481815 | |||||||||||||||||||||||||||
12 months | 0.1378065 | 0.1812590 | 0.2247115 | 0.2681640 | 0.3103750 | 0.3501030 | 0.3873480 | 0.4208685 | 0.4481815 | |||||||||||||||||||||||||||
9 months | 0.1117350 | 0.1551875 | 0.2011230 | 0.2470585 | 0.2942355 | 0.3376880 | 0.3786575 | 0.4171440 | 0.4481815 | |||||||||||||||||||||||||||
6 months | 0.0806975 | 0.1229085 | 0.1700855 | 0.2209870 | 0.2718885 | 0.3215485 | 0.3674840 | 0.4109365 | 0.4481815 | |||||||||||||||||||||||||||
3 months | 0.0422110 | 0.0806975 | 0.1291160 | 0.1862250 | 0.2445755 | 0.3016845 | 0.3550690 | 0.4047290 | 0.4481815 | |||||||||||||||||||||||||||
0 months | — | — | 0.0521430 | 0.1427725 | 0.2222285 | 0.2892695 | 0.3488615 | 0.4010045 | 0.4481815 | |||||||||||||||||||||||||||
The exact fair market value and redemption date may not be set forth in the table above, in which case, if the fair market value is between two values in the table or the redemption date is between two redemption dates in the table, the number of shares of Class A Common Stock to be issued for each warrant exercised will be determined by a straight-line interpolation between the number of shares set forth for the higher and lower fair market values and the earlier and later redemption dates, as applicable, based on a 365
or 366-day year,
as applicable. For example, if the volume weighted average price of Class A Common Stock during the 10 trading days immediately following the date on which the notice of redemption is sent to the holders of the warrants is $8.73 per share, and at such time there are 57 months until the expiration of the warrants, holders may choose to, in connection with this redemption feature, exercise their warrants for 0.3438955 shares of Class A Common Stock for each whole warrant. For an example where the exact fair market value and redemption date are not as set forth in the table above, if the volume weighted average price of Class A Common Stock during the 10 trading days immediately following the date on which the notice of redemption is sent to the holders of the warrants is $10.72 per share, and at such time there are 38 months until the expiration of the warrants, holders may choose to, in connection with this redemption feature, exercise their warrants for 0.3699670 shares of Class A Common Stock for each whole warrant. In no event will the warrants be exercisable in connection with this redemption feature for more than 0.4481815 shares of Class A Common Stock per warrant (subject to adjustment). Finally, as reflected in the table above, if the warrants are out of the money and about to expire, they cannot be exercised on a cashless basis in connection with a redemption by us pursuant to this redemption feature, since they will not be exercisable for any shares of Class A Common Stock.88
This redemption feature differs from the typical warrant redemption features, which typically only provide for a redemption of warrants for cash (other than the private placement warrants) when the trading price for the applicable common stock exceeds $14.29 per share for a specified period of time. This redemption feature is structured to allow for all of the outstanding warrants to be redeemed when the shares of Class A Common Stock are trading at or above $7.94 per share, which may be at a time when the trading price of Class A Common Stock is below the exercise price of the warrants. We have established this redemption feature to provide us with the flexibility to redeem the warrants without the warrants having to reach the $14.29 per share threshold set forth above under “— Redemption of warrants when the price per share of Class A Common Stock equals or exceeds $14.29.” Holders choosing to exercise their warrants in connection with a redemption pursuant to this feature will, in effect, receive a number of shares for their warrants based on an option pricing model with a fixed volatility input. This redemption right provides us with an additional mechanism by which to redeem all of the outstanding warrants, and therefore have certainty as to our capital structure as the warrants would no longer be outstanding and would have been exercised or redeemed. We will be required to pay the applicable redemption price to warrant holders if we choose to exercise this redemption right and it will allow us to quickly proceed with a redemption of the warrants if we determine it is in our best interest to do so. As such, we would redeem the warrants in this manner when we believe it is in our best interest to update our capital structure to remove the warrants and pay the redemption price to the warrant holders.
As stated above, we can redeem the warrants when the Class A Common Stock are trading at a price starting at $7.94, which is below the exercise price of $9.13, because it will provide certainty with respect to our capital structure and cash position while providing warrant holders with the opportunity to exercise their warrants on a cashless basis for the applicable number of shares. If we choose to redeem the warrants when the shares of Class A Common Stock are trading at a price below the exercise price of the warrants, this could result in the warrant holders receiving fewer shares of Class A Common Stock than they would have received if they had chosen to exercise their warrants for shares of Class A Common Stock if and when such shares of Class A Common Stock were trading at a price higher than the exercise price of $9.13.
No fractional shares of Class A Common Stock will be issued upon exercise. If, upon exercise, a holder would be entitled to receive a fractional interest in a share, we will round down to the nearest whole number of the number of shares of Class A Common Stock to be issued to the holder. If, at the time of redemption, the warrants are exercisable for a security other than the shares of Class A Common Stock pursuant to the Warrant Agreement, the warrants may be exercised for such security. At such time as the warrants become exercisable for a security other than the shares of Class A Common Stock, we will use our commercially reasonable efforts to register under the Securities Act the security issuable upon the exercise of the warrants.
Redemption Procedures
A holder of a warrant may notify us in writing in the event it elects to be subject to a requirement that such holder will not have the right to exercise such warrant, to the extent that after giving effect to such exercise, such person (together with such person’s affiliates), to the warrant agent’s actual knowledge, would beneficially own in excess of 9.8% (or such other amount as a holder may specify) of the shares of Class A Common Stock issued and outstanding immediately after giving effect to such exercise.
Anti-dilution Adjustments
If the number of issued and outstanding shares of Class A Common Stock is increased by a stock dividend payable in shares of Class A Common Stock, or by the quotient of (x) the price per share of Class A Common Stock paid in such rights offering and (y) the historical fair market value. For these purposes, (1) if the rights offering is for securities convertible into or exercisable for shares of Class A Common Stock, in determining the price payable for Class A Common Stock, there will be taken into account any consideration received for such rights, as well as any additional amount payable upon exercise or conversion and (2) “historical fair market value” means the volume weighted average price of Class A Common Stock during
a split-up of
shares of Class A Common Stock or other similar event, then, on the effective date of such stockdividend, split-up or
similar event, the number of shares of Class A Common Stock issuable on exercise of each warrant will be increased in proportion to such increase in the issued and outstanding shares of Class A Common Stock. A rights offering made to all or substantially all holders of Class A Common Stock entitling holders to purchase shares of Class A Common Stock at a price less than the “historical fair market value” (as defined below) will be deemed a share dividend of a number of shares of Class A Common Stock equal to the product of (1) the number of shares of Class A Common Stock actually sold in such rights offering (or issuable under any other equity securities sold in such rights offering that are convertible into or exercisable for shares of Class A Common Stock) and (2) one minus
the 10-trading day
period ending on the trading day prior to the first date on which the shares of Class A Common Stock trade on the applicable exchange or in the applicable market, regular way, without the right to receive such rights.89
In addition, if we, at any time while the warrants are outstanding and unexpired, pay to all or substantially all of the holders of Class A Common Stock a dividend or make a distribution in cash, securities or other assets to the holders of Class A Common Stock on account of such shares of Class A Common Stock (or other securities into which the warrants are convertible), other than (a) as described above, (b) any cash dividends or cash distributions which, when combined on a per share basis with all other cash dividends and cash distributions paid on the Class A Common Stock during
the 365-day period
ending on the date of declaration of such dividend or distribution does not exceed $0.50 (as adjusted for stock splits, stock dividends, reorganizations, recapitalizations and the like) but only with respect to the amount of the aggregate cash dividends or cash distributions equal to or less than $0.50 per share or (c) to satisfy the redemption rights of the holders of Class A Common Stock in connection with a stockholder vote to amend our Charter with respect to any provision relating to stockholders’ rights, then the warrant exercise price will be decreased, effective immediately after the effective date of such event, by the amount of cash and/or the fair market value of any securities or other assets paid on each shares of Class A Common Stock in respect of such event.If the number of issued and outstanding shares of Class A Common Stock is decreased by a consolidation, combination, reverse stock split or reclassification of shares of Class A Common Stock or other similar event, then, on the effective date of such consolidation, combination, reverse stock split, reclassification or similar event, the number of shares of Class A Common Stock issuable on exercise of each warrant will be decreased in proportion to such decrease in issued and outstanding shares of Class A Common Stock.
Whenever the number of shares of Class A Common Stock purchasable upon the exercise of the warrants is adjusted, as described above, the warrant exercise price will be adjusted by multiplying the warrant exercise price immediately prior to such adjustment by a fraction (x) the numerator of which will be the number of shares of Class A Common Stock purchasable upon the exercise of the warrants immediately prior to such adjustment and (y) the denominator of which will be the number of shares of Class A Common Stock so purchasable immediately thereafter.
In case of any reclassification or reorganization of the issued and outstanding shares of Class A Common Stock (other than those that solely affects the par value of such shares of Class A Common Stock), or in the case of any merger or consolidation of us with or into another corporation (other than a merger or consolidation in which we are the continuing corporation and that does not result in any reclassification or reorganization of our issued and outstanding shares of Class A Common Stock), or in the case of any sale or conveyance to another corporation or entity of the assets or other property of us as an entirety or substantially as an entirety in connection with which we are dissolved, the holders of the warrants will thereafter have the right to purchase and receive, upon the basis and upon the terms and conditions specified in the warrants and in lieu of the shares of our Class A Common Stock immediately theretofore purchasable and receivable upon the exercise of the rights represented thereby, the kind and amount of shares, stock or other equity securities or property (including cash) receivable upon such reclassification, reorganization, merger or consolidation, or upon a dissolution following any such sale or transfer, that the holder of the warrants would have received if such holder had exercised their warrants immediately prior to such event. However, if such holders were entitled to exercise a right of election as to the kind or amount of securities, cash or other assets receivable upon such merger or consolidation, then the kind and amount of securities, cash or other assets for which each warrant will become exercisable will be deemed to be the weighted average of the kind and amount received per share by such holders in such merger or consolidation that affirmatively make such election, and if a tender, exchange or redemption offer has been made to and accepted by such holders (other than a tender, exchange or redemption offer made by the company in connection with redemption rights held by stockholders of the company as provided for in the Company’s Charter) under circumstances in which, upon completion of such tender or exchange offer, the maker thereof, together with members of any group (within the meaning of
Rule 13d-5(b)(1) under
the Exchange Act) of which such maker is a part, and together with any affiliate or associate of such maker (within the meaning ofRule 12b-2 under
the Exchange Act) and any members of any such group of which any such affiliate or associate is a part, own beneficially (within the meaning ofRule 13d-3 under
the Exchange Act) more than 50% of the issued and outstanding shares of Class A Common Stock, the holder of a warrant will be entitled to receive the highest amount90
of cash, securities or other property to which such holder would actually have been entitled as a stockholder if such warrant holder had exercised the warrant prior to the expiration of such tender or exchange offer, accepted such offer and all of the shares of Class A Common Stock held by such holder had been purchased pursuant to such tender or exchange offer, subject to adjustment (from and after the consummation of such tender or exchange offer) as nearly equivalent as possible to the adjustments provided for in the Warrant Agreement. Additionally, if less than 70% of the consideration receivable by the holders of Class A Common Stock in such a transaction is payable in the form of Class A Common Stock in the successor entity that is listed for trading on a national securities exchange or is quoted in anor is to be so listed for trading or quoted immediately following such event, and if the registered holder of the warrant properly exercises the warrant within 30 days following public disclosure of such transaction, the warrant exercise price will be reduced as specified in the warrant agreement based on the per share consideration Black-Scholes Warrant Value (as defined in the Warrant Agreement) of the warrant.
established over-the-counter market,
minus
The warrants are issued in registered form under a Warrant Agreement between Continental Stock Transfer & Trust Company, as warrant agent, and us. The Warrant Agreement provides that (a) the terms of the warrants may be amended without the consent of any holder for the purpose of (i) curing any ambiguity or correcting any mistake or defective provision or (ii) adding or changing any provisions with respect to matters or questions arising under the Warrant Agreement as the parties to the Warrant Agreement may deem necessary or desirable and that the parties deem to not adversely affect the rights of the registered holders of the warrants and (b) all other modifications or amendments require the vote or written consent of at least 65% of the then outstanding public warrants and, solely with respect to any amendment to the terms of the private placement warrants or any provision of the Warrant Agreement with respect to the private placement warrants, at least 65% of the then outstanding private placement warrants. You should review a copy of the Warrant Agreement, as well as a copy of the Warrant Assumption Agreement for a complete description of the terms and conditions applicable to the warrants.
The warrant holders do not have the rights or privileges of holders of Common Stock and any voting rights until they exercise their warrants and receive shares of Class A Common Stock. After the issuance of shares of Class A Common Stock upon exercise of the warrants, each holder will be entitled to one vote for each share held of record on all matters to be voted on by stockholders.
No fractional warrants will be issued upon separation of the units and only whole warrants will trade.
Private Placement Warrants
The private placement warrants (including the shares of Class A Common Stock issuable upon exercise of the private placement warrants) will not be transferable, assignable or salable until 30 days after the completion of the Business Combination (except, among other limited exceptions to our directors and officers and other persons or entities affiliated with the Sponsor) and they will not be redeemable by us (except as described under “— Warrants—Public Warrants—Redemption of warrants when the price per share of Class A Common Stock equals or exceeds $7.94”) so long as they are held by the Sponsor or its permitted transferees. The Sponsor, or its permitted transferees, has the option to exercise the private placement warrants on a cashless basis and have certain registration rights described herein. Otherwise, the private placement warrants have terms and provisions that are identical to those of the public warrants. If the private placement warrants are held by holders other than the Sponsor or its permitted transferees, the private placement warrants will be redeemable by us in all redemption scenarios and exercisable by the holders on the same basis as the public warrants.
Except as described under “—Warrants—Public Warrants—Redemption of warrants when the price per share of Class A Common Stock equals or exceeds $7.94,” if holders of the private placement warrants elect to exercise them on a cashless basis, they would pay the exercise price by surrendering his, her or its warrants for that number of shares of Class A Common Stock equal to the quotient obtained by dividing (x) the product of the number of shares of Class A Common Stock underlying the warrants, the excess of the “historical fair market value” (defined below) less the exercise price of the warrants by (y) the historical fair market value. For these purposes, the “historical fair market value” shall mean the average last reported sale price of the Class A Common Stock for the 10 trading days ending on the third trading day prior to the date on which the notice of warrant exercise is sent to the warrant agent. We have policies in place that restrict insiders from selling our securities except during specific periods of time. Even during such periods of time when insiders will be permitted to sell our securities, an insider cannot trade in our securities if he or she is in possession of
multiplied by
material non-public information.
Accordingly, unlike FirstMark Public Stockholders who could exercise their warrants and sell the shares of Class A Common Stock received upon such exercise freely in the open market in order to recoup the cost of such exercise, the insiders could be significantly restricted from selling such securities. As a result, we believe that allowing the holders to exercise such warrants on a cashless basis is appropriate.91
Exclusive Forum
The Charter provides that, unless we consent in writing to the selection of an alternative forum, the Court of Chancery (the “”) of the State of Delaware (or, in the event that the Chancery Court does not have jurisdiction, the federal district court for the District of Delaware or other state courts of the State of Delaware) and any appellate court thereof shall, to the fullest extent permitted by law, be the sole and exclusive forum for: (1) any derivative action, suit or proceeding brought on our behalf; (2) any action, suit or proceeding asserting a claim of breach of a fiduciary duty owed by any of our current or former directors, officers, stockholders or employees of ours or our stockholders; (3) any action, suit or proceeding asserting a claim against us arising pursuant to any provision of the DGCL, the Bylaws or the Charter (as either may be amended from time to time); or (4) any action, suit or proceeding asserting a claim against us or any current or former director, officer or stockholder governed by the internal affairs doctrine.
Chancery Court
The Charter provides that the federal district courts of the United States of America shall be the exclusive forum for the resolution of any complaint asserting a cause of action arising under the Securities Act. If any such foreign action is filed in a court other than the courts in the State of Delaware in the name of any stockholder, such stockholder shall be deemed to have consented to (a) the personal jurisdiction of the state and federal courts in the State of Delaware in connection with any action brought in any such court to enforce such actions and (b) having service of process made upon such stockholder in any such action by service upon such stockholder’s counsel in the foreign action as agent for such stockholder. The Charter also provides that any person or entity purchasing or otherwise acquiring any interest in any of our securities shall be deemed to have notice of and consented to this choice of forum provision. It is possible that a court of law could rule that the choice of forum provision contained in our Charter is inapplicable or unenforceable if it is challenged in a proceeding or otherwise. This choice of forum provision has important consequences for our stockholders.
Certain Anti-Takeover Provisions of Delaware Law and the Charter and Bylaws
We have opted out of Section 203 of the DGCL under the Charter and Bylaws, but the Charter and Bylaws have protections similar to those afforded by Section 203 of the DGCL, which prohibit us from engaging in any business combination with any stockholder for a period of three years following the time that such stockholder (the “interested stockholder”) came to own at least 15% of our outstanding voting stock (the “acquisition”), except if:
| • | our board of directors approved the acquisition prior to its consummation; |
| • | the interested stockholder owned at least 85% of the outstanding voting stock upon consummation of the acquisition; or |
| • | the business combination is approved by our board of directors, and by a two-thirds vote of the other stockholders in a meeting. |
Generally, a “business combination” includes any merger, consolidation, asset or stock sale, or certain other transactions resulting in a financial benefit to the interested stockholder. Subject to certain exceptions, an “interested stockholder” is a person who, together with that person’s affiliates and associates, owns, or within the previous three years owned, 15% or more of our voting stock.
Under certain circumstances, these anti-takeover provisions will make it more difficult for a person who would be an “interested stockholder” to effect various business combinations with us for a three-year period. This may encourage companies interested in acquiring us to negotiate in advance with our board of directors because the stockholder approval requirement would be avoided if our board of directors approves the acquisition that results in the stockholder becoming an interested stockholder.
This may also have the effect of preventing changes in our board of directors and may make it more difficult to accomplish transactions that stockholders may otherwise deem to be in their best interests.
Written Consent by Stockholders
Under the Charter and Bylaws, subject to the rights of any series of Preferred Stock then outstanding, any action required or permitted to be taken by our stockholders (a) may be effected by a consent in writing by such stockholders until the Sunset Date and (b) following the Sunset Date, must be effected at a duly called annual or special meeting of our stockholders and may not be effected by any consent in writing by such stockholders.
Special Meeting of Stockholders
Under the Charter and Bylaws, special meetings of our stockholders may be called only by our board of directors, the chairperson of our board of directors or our chief executive officer, or, until the Sunset Date, our secretary upon a written request of any holder of record of at least 25% of the voting power of the issued and outstanding shares of our capital stock, and may not be called by any other person or persons. Only such business shall be considered at a special meeting of stockholders as shall have been stated in the notice for such meeting.
92
Advance Notice Requirements for Stockholder Proposals and Director Nominations
Under the Bylaws, advance notice of stockholder nominations for the election of directors and of business to be brought by stockholders before any meeting of our stockholders shall be given in the manner and to the extent provided in the Bylaws.
Transfer Agent and Warrant Agent
The transfer agent for our Common Stock and the warrant agent for our warrants is Continental Stock Transfer & Trust Company.
Listing of Class A Common Stock and Warrants
Our Class A Common Stock and public warrants are listed on the NYSE under the symbols “STRY” and “STRY WS,” respectively.
93
SECURITIES ACT RESTRICTIONS ON RESALE OF SECURITIES
Lock-Up
AgreementsSubject to certain exceptions, the Sponsor, those receiving our Class A Common Stock as consideration pursuant to the Merger Agreement and our directors, officers and employees receiving our Class A Common Stock upon the settlement or exercise of warrants, stock options or other equity awards outstanding immediately following the closing of the Business Combination, will be restricted from selling or transferring any of their respective shares of our Class A Common Stock (not including the shares of our Class A Common Stock issued in the sale of the PIPE Shares or the shares of Class A Common Stock issued in exchange for the Series Z Shares pursuant to the terms of their respective subscription agreements). In the case of the shares that are restricted pursuant to our Bylaws, such restrictions end on the date that is 180 days after the closing of the Business Combination. In the case of the shares restricted pursuant to the Sponsor Support Agreement, each Initial Stockholder agreed that such Initial Stockholder shall not transfer any shares of our Common Stock during the period commencing immediately after the Acquisition Merger Effective Date and ending upon the earlier to occur of (x) 8:00 a.m. Eastern Time on the date that is 12 months after (and excluding) the Acquisition Merger Effective Date and (y) the occurrence of an Earnout Triggering Event (as defined therein) without our prior written consent, subject to certain permitted transfers as provided in the Sponsor Support Agreement.
Following the expiration of the applicable
lock-up
period, such equity holders will not be restricted from selling shares of our Class A Common Stock held by them, other than by applicable securities laws. Additionally, the PIPE Investors and the holders of the shares of Class A Common Stock issued in exchange for the Series Z Shares will not be restricted from selling any of their PIPE Shares or shares of Class A Common Stock issued in exchange for the Series Z Shares, respectively, other than by applicable securities laws.Rule 144
Pursuant to Rule 144 under the Securities Act (“Rule 144”), a person who has beneficially owned restricted our Common Stock or our warrants for at least six months would be entitled to sell their securities provided that (i) such person is not deemed to have been our affiliate at the time of, or at any time during the three months preceding, a sale and (ii) we are subject to the Exchange Act periodic reporting requirements for at least three months before the sale and have filed all required reports under Section 13 or 15(d) of the Exchange Act during the 12 months (or such shorter period as we were required to file reports) preceding the sale.
Persons who have beneficially owned restricted shares of our Common Stock or our warrants for at least six months but who are our affiliates at the time of, or at any time during the three months preceding, a sale, would be subject to additional restrictions, by which such person would be entitled to sell within any three-month period only a number of securities that does not exceed the greater of:
| • | 1% of the total number of shares of our Common Stock then outstanding; and |
| • | the average weekly reported trading volume of our Common Stock during the four calendar weeks preceding the filing of a notice on Form 144 with respect to the sale. |
Sales by our affiliates under Rule 144 are also limited by manner of sale provisions and notice requirements and to the availability of current public information about us.
Restrictions on the Use of Rule 144 by Shell Companies or Former Shell Companies
Rule 144 is not available for the resale of securities initially issued by shell companies (other than business combination related shell companies) or issuers that have been at any time previously a shell company. However, Rule 144 also includes an important exception to this prohibition if the following conditions are met:
| • | the issuer of the securities that was formerly a shell company has ceased to be a shell company; |
| • | the issuer of the securities is subject to the reporting requirements of Section 13 or 15(d) of the Exchange Act; |
| • | the issuer of the securities has filed all Exchange Act reports and material required to be filed, as applicable, during the preceding 12 months (or such shorter period that the issuer was required to file such reports and materials), other than Form 8-K reports; and |
| • | at least one year has elapsed from the time that the issuer filed current Form 10 type information with the SEC reflecting its status as an entity that is not a shell company. |
94
Once the conditions set forth in the exceptions listed above are satisfied, Rule 144 will become available for the resale of the above noted restricted securities.
95
PLAN OF DISTRIBUTION
The selling securityholders, which, as used herein, includes donees, pledgees, transferees, distributees or otherselling shares of our Class A Common Stock or private placement warrants or interests in our Class A Common Stock or private placement warrants received after the date of this prospectus from the selling securityholders as a gift, pledge, distribution or other transfer, may, from time to time, sell, transfer, distribute or otherwise dispose of certain of their shares of Class A Common Stock or private placement warrants or interests in our Class A Common Stock or private placement warrants on any stock exchange, market or trading facility on which shares of our Class A Common Stock or private placement warrants, as applicable, are traded or in private transactions. These dispositions may be at fixed prices, at prevailing market prices at the time of sale, at prices related to the prevailing market prices, at varying prices determined at the time of sale, or at negotiated prices.
successors-in-interest
The selling securityholders may use any one or more of the following methods when disposing of their securities or interests therein:
| • | ordinary brokerage transactions and transactions in which the broker-dealer solicits purchasers; |
| • | one or more underwritten offerings; |
| • | block trades in which the broker-dealer will attempt to sell the securities as agent, but may position and resell a portion of the block as principal to facilitate the transaction; |
| • | purchases by a broker-dealer as principal and resale by the broker-dealer for its accounts; |
| • | an exchange distribution in accordance with the rules of the applicable exchange; |
| • | privately negotiated transactions; |
| • | distributions to their members, partners, or stockholders; |
| • | short sales effected after the date of the registration statement of which this prospectus forms a part is declared effective by the SEC; |
| • | through the writing or settlement of options or other hedging transactions, whether through an options exchange or otherwise; |
| • | in market transactions, including transactions on a national securities exchange or quotations service or over-the-counter |
| • | directly to one or more purchasers; |
| • | through agents; |
| • | broker-dealers who may agree with the selling securityholders to sell a specified number of such securities at a stipulated price per share or warrant; or |
| • | a combination of any such methods of sale. |
The selling securityholders may, from time to time, pledge or grant a security interest in some shares of our Class A Common Stock or private placement warrants owned by them and, if a selling securityholder defaults in the performance of its secured obligations, the pledgees or secured parties may offer and sell such securities, from time to time, under this prospectus, or under an amendment or supplement to this prospectus amending the list of the selling securityholders to include the pledgee, transferee, or otheras the selling securityholders under this prospectus. The selling securityholders also may transfer securities in other circumstances, in which case the transferees, pledgees, or otherwill be the selling beneficial owners for purposes of this prospectus.
successors-in-interest
successors-in-interest
In connection with the sale of shares of our Class A Common Stock or private placement warrants or interests therein, the selling securityholders may enter into hedging transactions with broker-dealers or other financial institutions, which may in turn engage in short sales of such securities in the course of hedging the positions they assume. The selling securityholders may also sell shares of our Class A Common Stock or private placement warrants short and deliver these securities to close out their short positions, or loan or pledge shares of our Class A Common Stock or private placement warrants to broker-dealers that in turn may sell these securities. The selling securityholders may also enter into option or other transactions with broker-dealers or other financial institutions or the creation of one or more derivative securities that require the delivery to such broker-dealer or other financial institution of shares of our Class A Common Stock or private placement warrants offered by this prospectus, which shares or warrants such broker-dealer or other financial institution may resell pursuant to this prospectus (as supplemented or amended to reflect such transaction).
96
The aggregate proceeds to the selling securityholders from the sale of shares of our Class A Common Stock or private placement warrants offered by them will be the purchase price of such securities, less discounts or commissions, if any. The selling securityholders reserve the right to accept and, together with their agents from time to time, to reject, in whole or in part, any proposed purchase of shares of our Class A Common Stock or private placement warrants to be made directly or through agents. We will not receive any of the proceeds from any offering by the selling securityholders.
The selling securityholders also may in the future resell a portion of our Class A Common Stock or private placement warrants in open-market transactions in reliance upon Rule 144 under the Securities Act (provided that they meet the criteria and conform to the requirements of that rule), or pursuant to other available exemptions from the registration requirements of the Securities Act.
The selling securityholders and any underwriters, broker-dealers, or agents that participate in the sale of shares of our Class A Common Stock or private placement warrants or interests therein may be “underwriters” within the meaning of Section 2(11) of the Securities Act. Any discounts, commissions, concessions, or profit they earn on any resale of such securities may be underwriting discounts and commissions under the Securities Act. If any selling securityholder is an “underwriter” within the meaning of Section 2(11) of the Securities Act, then the selling securityholder will be subject to the prospectus delivery requirements of the Securities Act. Underwriters and their controlling persons, dealers, and agents may be entitled, under agreements entered into with us and the selling securityholders, to indemnification against and contribution toward specific civil liabilities, including liabilities under the Securities Act.
To the extent required, the number of shares of our Class A Common Stock or private placement warrants to be sold, the respective purchase prices and public offering prices, the names of any agent, dealer, or underwriter, and any applicable discounts, commissions, concessions, or other compensation with respect to a particular offer will be set forth in an accompanying prospectus supplement or, if appropriate, a post-effective amendment to the registration statement that includes this prospectus.
To facilitate the offering of securities offered by the selling securityholders, certain persons participating in the offering may engage in transactions that stabilize, maintain, or otherwise affect the price of our Class A Common Stock or warrants. This may include over-allotments or short sales, which involve the sale by persons participating in the offering of more shares of Class A Common Stock or warrants than were sold to them. In these circumstances, these persons would cover such over-allotments or short positions by making purchases in the open market or by exercising their over-allotment option, if any. In addition, these persons may stabilize or maintain the price of our Class A Common Stock or warrants by bidding for or purchasing shares of Class A Common Stock or warrants in the open market or by imposing penalty bids, whereby selling concessions allowed to dealers participating in the offering may be reclaimed if shares of Class A Common Stock or warrants sold by them are repurchased in connection with stabilization transactions. The effect of these transactions may be to stabilize or maintain the market price of our Class A Common Stock or warrants at a level above that which might otherwise prevail in the open market. These transactions may be discontinued at any time.
Under the Registration Rights Agreement and the PIPE Subscription Agreements, we have agreed to indemnify the selling securityholders party thereto against certain liabilities that they may incur in connection with the sale of the securities registered hereunder, including liabilities under the Securities Act, and to contribute to payments that the selling securityholders may be required to make with respect thereto. In addition, we and the selling securityholders may agree to indemnify any underwriter, broker-dealer, or agent against certain liabilities related to the selling of the securities, including liabilities arising under the Securities Act.
We have agreed to maintain the effectiveness of the registration statement of which this prospectus forms a part until all such securities have been sold under such registration statement or under Rule 144 under the Securities Act or are no longer outstanding, or under other circumstances as described in the Registration Rights Agreement and the PIPE Subscription Agreements. We have agreed to pay all expenses in connection with this offering, other than underwriting fees, discounts, selling commissions, stock transfer taxes, and certain legal expenses. The selling securityholders will pay, on a pro rata basis, any underwriting fees, discounts, selling commissions, stock transfer taxes and certain legal expenses relating to the offering.
The selling securityholders may use this prospectus in connection with resales of shares of our Class A Common Stock and private placement warrants. This prospectus and any accompanying prospectus supplement will identify the selling securityholders, the terms of our Class A Common Stock or private placement warrants and any material relationships between us and the selling securityholders. The selling securityholders may be deemed to be underwriters under the Securities Act in connection with shares of our Class A Common Stock or private placement warrants they resell and any profits on the sales may be deemed to be underwriting discounts and commissions under the Securities Act. Unless otherwise set forth in a prospectus supplement, the selling securityholders will receive all the net proceeds from the resale of shares of our Class A Common Stock or private placement warrants.
97
A selling securityholder that is an entity may elect to make an
in-kind
distribution of Class A Common Stock or private placement warrants to its members, partners or stockholders pursuant to the registration statement of which this prospectus forms a part by delivering a prospectus. To the extent that such members, partners, or stockholders are not affiliates of ours, such members, partners or stockholders would thereby receive freely tradable shares of Class A Common Stock or warrants pursuant to the distribution through a registration statement.We are required to pay all fees and expenses incident to the registration of shares of our Class A Common Stock and private placement warrants to be offered and sold pursuant to this prospectus.
98
LEGAL MATTERS
Latham & Watkins LLP has passed upon the validity of the securities offered hereby and certain other legal matters related to this prospectus.
EXPERTS
The financial statements of Starry Group Holdings, Inc. as of and for the year ended December 31, 2021 and 2020 included in this prospectus have been audited by Deloitte & Touche LLP, an independent registered public accounting firm, as stated in their report. Such financial statements are included in reliance upon the report of such firm given their authority as experts in accounting and auditing.
99
WHERE YOU CAN FIND MORE INFORMATION
We file annual, quarterly and current reports, proxy statements and other information with the SEC. We have also filed a registration statement on Form
S-1,
including exhibits, under the Securities Act with respect to the securities offered by this prospectus. This prospectus is part of the registration statement, but does not contain all of the information included in the registration statement or the exhibits filed with the registration statement. For further information about us and the securities offered hereby, we refer you to the registration statement and the exhibits filed with the registration statement. Statements contained in this prospectus regarding the contents of any contract or any other document that is filed as an exhibit to the registration statement are not necessarily complete, and each such statement is qualified in all respects by reference to the full text of such contract or other document filed as an exhibit to the registration statement.Our SEC filings are available to the public on the internet at a website maintained by the SEC located at http://www.sec.gov. Those filings are also available to the public on, or accessible through, our website under the heading “SEC Filings” at www.starry.com/investors Information contained on our website is not a part of this prospectus and the inclusion of our website address in this prospectus is an inactive textual reference only.
100
INDEX TO FINANCIAL STATEMENTS
Page | ||||
Starry Group Holdings, Inc. Audited Consolidated Financial Statements | ||||
| F-2 | ||||
| F-3 | ||||
| F-5 | ||||
| F-6 | ||||
| F-7 | ||||
| F-8 | ||||
Starry Group Holdings, Inc. Unaudited Condensed Consolidated Financial Statements | ||||
| F-35 | ||||
| F-36 | ||||
| F-37 | ||||
| F-38 | ||||
| F-39 | ||||
F-1
 | Deloitte & Touche LLP 200 Berkeley Street Boston, MA 02116-5022 USA Tel: +1 617 437 2000 www.deloitte.com |
REPORT OF INDEPENDENT REGISTERED PUBLIC ACCOUNTING FIRM
To the Stockholders and the Audit Committee of Starry Group Holdings, Inc.
Opinion on the Financial Statement
We have audited the accompanying balance sheets of Starry Group Holdings, Inc. (the “Company”) as of December 31, 2021 and December 31, 2020, the related consolidated statements of operations, stockholders’ (deficit) equity, and cash flows, for the years ended December 31, 2021 and 2020, and the related notes (collectively referred to as the “financial statements”). In our opinion, the financial statements present fairly, in all material respects, the financial position of the Company as of December 31, 2021 and December 31, 2020, in conformity with accounting principles generally accepted in the United States of America.
Going Concern
The accompanying financial statements have been prepared assuming that the Company will continue as a going concern. As discussed in Note 1 to the financial statements, the Company has generated losses and negative cash flows from operating activities since inception and may be unable to remain in compliance with certain financial covenants required by its credit agreement that raises substantial doubt about its ability to continue as a going concern. Management’s plans in regards to these matters are also described in Note 1. The financial statements do not include any adjustments that might result from the outcome of this uncertainty.
Basis for Opinion
These financial statements are the responsibility of the Company’s management. Our responsibility is to express an opinion on the Company’s financial statements based on our audit. We are a public accounting firm registered with the Public Company Accounting Oversight Board (United States) (PCAOB) and are required to be independent with respect to the Company in accordance with the U.S. federal securities laws and the applicable rules and regulations of the Securities and Exchange Commission and the PCAOB.
We conducted our audits in accordance with the standards of the PCAOB. Those standards require that we plan and perform the audit to obtain reasonable assurance about whether the financial statements are free of material misstatement, whether due to error or fraud. The Company is not required to have, nor were we engaged to perform, an audit of its internal control over financial reporting. As part of our audits, we are required to obtain an understanding of internal control over financial reporting but not for the purpose of expressing an opinion on the effectiveness of the Company’s internal control over financial reporting. Accordingly, we express no such opinion.
Our audits included performing procedures to assess the risks of material misstatement of the financial statements, whether due to error or fraud, and performing procedures that respond to those risks. Such procedures included examining, on a test basis, evidence regarding the amounts and disclosures in the financial statements. Our audits also included evaluating the accounting principles used and significant estimates made by management, as well as evaluating the overall presentation of the financial statements. We believe that our audits provide a reasonable basis for our opinion.
/s/ Deloitte & Touche LLP
Boston, Massachusetts
March 31, 2022 (June 3, 2022, as to the effects of the retrospective adjustment described in Note 1)
We have served as the Company’s auditor since 2019.
F-2
Starry Group Holdings, Inc.
Consolidated Balance Sheets
(Dollar amounts in thousands, except share and per share data)
December 31, 2021 | December 31, 2020 | |||||||
Assets | ||||||||
Current assets: | ||||||||
Cash and cash equivalents | $ | 29,384 | $ | 25,594 | ||||
Restricted cash | — | 110 | ||||||
Accounts receivable, net | 380 | 264 | ||||||
Deferred costs | 7,049 | — | ||||||
Prepaid expenses and other current assets | 7,079 | 1,840 | ||||||
Total current assets | 43,892 | 27,808 | ||||||
Property and equipment, net | 129,019 | 86,658 | ||||||
Intangible assets | 48,463 | 48,463 | ||||||
Restricted cash and other assets | 1,860 | 1,361 | ||||||
Total assets | $ | 223,234 | $ | 164,290 | ||||
Liabilities and stockholders’ equity (deficit) | ||||||||
Current liabilities: | ||||||||
Accounts payable | $ | 6,832 | $ | 7,457 | ||||
Unearned revenue | 1,630 | 1,169 | ||||||
Current portion of debt | 1,504 | 29,875 | ||||||
Accrued expenses and other current liabilities | 23,177 | 13,073 | ||||||
Total current liabilities | 33,143 | 51,574 | ||||||
Debt, net of current portion | 191,596 | 133,932 | ||||||
Asset retirement obligations | 2,387 | 1,399 | ||||||
Warrant liabilities | 14,773 | — | ||||||
Other liabilities | 12,412 | 3,068 | ||||||
Total liabilities | 254,311 | 189,973 | ||||||
The accompanying notes are an integral part of these consolidated financial statements
F-3
Starry Group Holdings, Inc.
Consolidated Balance Sheets
(Dollar amounts in thousands, except share and per share data)
Year Ended December 31, 2021 | Year Ended December 31, 2020 | |||||||
Commitments and contingencies (Note 12) | 0 | 0 | ||||||
Stockholders’ equity (deficit): | ||||||||
Seed series convertible preferred stock; $0.0001 par value; 9,761,747 shares authorized; 9,761,745 shares issued and outstanding at December 31, 2021 and December 31, 2020 (liquidation preference of $7,000) | 6,990 | 6,990 | ||||||
Series A convertible preferred stock; $0.0001 par value; 16,852,283 shares authorized, issued and outstanding at December 31, 2021 and December 31, 2020 (liquidation preference of $26,000) | 25,946 | 25,946 | ||||||
Series B convertible preferred stock; $0.0001 par value; 10,207,696 shares authorized, issued and outstanding at December 31, 2021 and December 31, 2020 (liquidation preference of $30,000) | 29,910 | 29,910 | ||||||
Series C convertible preferred stock; $0.0001 par value; 19,965,160 shares authorized, issued and outstanding at December 31, 2021 and December 31, 2020 (liquidation preference of $100,000) | 99,989 | 99,989 | ||||||
Series D convertible preferred stock; $0.0001 par value; 16,090,802 shares authorized, issued and outstanding at December 31, 2021 and December 31, 2020 (liquidation preference of $125,000) | 124,915 | 124,915 | ||||||
Series E convertible preferred stock; $0.0001 par value; 19,299,164 shares authorized; 18,751,311 and 0 issued and outstanding at December 31, 2021 and December 31, 2020, respectively (liquidation preference of $162,784) | 165,434 | — | ||||||
Common stock; $0.0001 par value; 150,024,203 shares authorized; 37,178,873 and 36,155,835 issued and outstanding at December 31, 2021 and December 31, 2020, respectively | 14 | 9 | ||||||
Additional paid-in capital | 17,096 | 21,384 | ||||||
Accumulated deficit | (501,371 | ) | (334,826 | ) | ||||
Total stockholders’ (deficit) equity | (31,077 | ) | (25,683 | ) | ||||
Total liabilities and stockholders’ (deficit) equity | $ | 223,234 | $ | 164,290 | ||||
The accompanying notes are an integral part of these consolidated financial statements
F-4
Starry Group Holdings, Inc.
Consolidated Statements of Operations
(Dollar amounts in thousands, except share and per share data)
For the Years Ended December 31, | ||||||||
2021 | 2020 | |||||||
Revenues | $ | 22,263 | $ | 12,826 | ||||
Cost of revenues | (58,363 | ) | (38,529 | ) | ||||
Gross loss | (36,100 | ) | (25,703 | ) | ||||
Operating expenses: | ||||||||
Selling, general and administrative | (67,129 | ) | (55,240 | ) | ||||
Research and development | (26,308 | ) | (22,957 | ) | ||||
Total operating expenses | (93,437 | ) | (78,197 | ) | ||||
Loss from operations | (129,537 | ) | (103,900 | ) | ||||
Other income (expense): | ||||||||
Interest expense | (24,739 | ) | (19,382 | ) | ||||
Other income (expense), net | (12,269 | ) | (1,811 | ) | ||||
Total other expense | (37,008 | ) | (21,193 | ) | ||||
Net loss | $ | (166,545 | ) | $ | (125,093 | ) | ||
Net loss per share of voting and non-voting common stock, basic and diluted | $ | (4.55 | ) | $ | (3.50 | ) | ||
Weighted-average shares outstanding, basic and diluted | 36,569,966 | 35,743,961 | ||||||
The accompanying notes are an integral part of these consolidated financial statements
F-5
Starry Group Holdings, Inc.
Consolidated Statements of Stockholders’ (Deficit) Equity
(Dollar amounts in thousands, except share data)
| Series Seed Convertible Preferred Stock | Series A Convertible Preferred Stock | Series B Convertible Preferred Stock | Series C Convertible Preferred Stock | Series D Convertible Preferred Stock | Series E Convertible Preferred Stock | Common Stock | Additional Paid-In Capital | Accumulated Stockholders’ | ||||||||||||||||||||||||||||||||||||||||||||||||||||||||||||
| Shares | Amount | Shares | Amount | Shares | Amount | Shares | Amount | Shares | Amount | Shares | Amount | Shares | Par Value | Deficit | (Deficit) Equity | |||||||||||||||||||||||||||||||||||||||||||||||||||||
Balance at December 31, 2019 | 53,030,260 | $ | 6,990 | 91,549,300 | $ | 25,946 | 55,452,865 | $ | 29,910 | 108,459,871 | $ | 99,989 | 65,909,090 | $ | 94,177 | — | $ | — | 194,974,082 | $ | 6 | $ | 16,312 | $ | (209,733 | ) | $ | 63,597 | ||||||||||||||||||||||||||||||||||||||||
Retroactive application of Business Combination | (43,268,515 | ) | — | (74,697,017 | ) | — | (45,245,169 | ) | — | (88,497,711 | ) | — | (53,776,625 | ) | — | — | — | (159,083,491 | ) | (2 | ) | $ | 2 | — | — | |||||||||||||||||||||||||||||||||||||||||||
Adjusted Balance, beginning of period | 9,761,745 | $ | 6,990 | 16,852,283 | $ | 25,946 | 10,207,696 | $ | 29,910 | 19,965,160 | $ | 99,989 | 12,132,465 | $ | 94,177 | — | $ | — | 35,890,591 | $ | 4 | $ | 16,314 | $ | (209,733 | ) | $ | 63,597 | ||||||||||||||||||||||||||||||||||||||||
Issuance of Series D convertible preferred stock, net of issuance costs of $12 | — | — | — | — | — | — | — | — | 3,958,337 | 30,738 | — | — | — | — | — | $ | 30,738 | |||||||||||||||||||||||||||||||||||||||||||||||||||
Recognition of beneficial conversion feature on convertible notes | — | — | — | — | — | — | — | — | — | — | — | — | — | — | 3,932 | $ | 3,932 | |||||||||||||||||||||||||||||||||||||||||||||||||||
Issuance of common stock options | — | — | — | — | — | — | — | — | — | — | — | — | 265,244 | — | 183 | — | $ | 183 | ||||||||||||||||||||||||||||||||||||||||||||||||||
Issuance of common stock warrants | — | — | — | — | — | — | — | — | — | — | — | — | — | — | — | — | $ | — | ||||||||||||||||||||||||||||||||||||||||||||||||||
Share-based compensation | — | — | — | — | — | — | — | — | — | — | — | — | — | — | 960 | — | $ | 960 | ||||||||||||||||||||||||||||||||||||||||||||||||||
Net loss | — | — | — | — | — | — | — | — | — | — | — | — | — | — | — | (125,093 | ) | $ | (125,093 | ) | ||||||||||||||||||||||||||||||||||||||||||||||||
Balance at December 31, 2020 | 9,761,745 | 6,990 | 16,852,283 | 25,946 | 10,207,696 | 29,910 | 19,965,160 | 99,989 | 16,090,802 | 124,915 | — | — | 36,155,835 | 4 | 21,389 | (334,826 | ) | (25,683 | ) | |||||||||||||||||||||||||||||||||||||||||||||||||
Balance at December 31, 2020 | 53,030,260 | 6,990 | 91,549,300 | 25,946 | 55,452,865 | 29,910 | 108,459,871 | 99,989 | 87,412,587 | 124,915 | — | — | 196,415,008 | 9 | 21,384 | (334,826 | ) | $ | (25,683 | ) | ||||||||||||||||||||||||||||||||||||||||||||||||
Retroactive application of Business Combination | (43,268,515 | ) | — | (74,697,017 | ) | — | (45,245,169 | ) | — | (88,497,711 | ) | — | (71,321,785 | ) | — | — | — | (160,259,173 | ) | (5 | ) | 5 | — | — | ||||||||||||||||||||||||||||||||||||||||||||
Adjusted Balance, beginning of period | 9,761,745 | 6,990 | 16,852,283 | 25,946 | 10,207,696 | 29,910 | 19,965,160 | 99,989 | 16,090,802 | 124,915 | — | — | 36,155,835 | 4 | 21,389 | (334,826 | ) | (25,683 | ) | |||||||||||||||||||||||||||||||||||||||||||||||||
Recognition of beneficial conversion feature on convertible notes | — | — | — | — | — | — | — | — | — | — | — | — | — | — | — | — | $ | — | ||||||||||||||||||||||||||||||||||||||||||||||||||
Issuance of common stock upon exercise of warrants | — | — | — | — | — | — | — | — | — | — | — | — | 422,095 | — | — | — | $ | — | ||||||||||||||||||||||||||||||||||||||||||||||||||
Issuance of common stock options | — | — | — | — | — | — | — | — | — | — | — | — | 600,943 | — | 752 | — | $ | 752 | ||||||||||||||||||||||||||||||||||||||||||||||||||
Issuance of Series E convertible preferred stock, net of issuance costs of $150 | — | — | — | — | — | — | — | — | — | — | 13,148,484 | 119,850 | — | — | — | — | $ | 119,850 | ||||||||||||||||||||||||||||||||||||||||||||||||||
Conversion of convertible notes payable to Series E convertible preferred stock | — | — | — | — | — | — | — | — | — | — | 5,602,827 | 45,584 | — | — | — | — | $ | 45,584 | ||||||||||||||||||||||||||||||||||||||||||||||||||
Reclassification of 2019 warrants to liabilities | — | — | — | — | — | — | — | — | — | — | — | — | — | — | (6,345 | ) | — | $ | (6,345 | ) | ||||||||||||||||||||||||||||||||||||||||||||||||
Share-based compensation | — | — | — | — | — | — | — | — | — | — | — | — | — | — | 1,310 | — | $ | 1,310 | ||||||||||||||||||||||||||||||||||||||||||||||||||
Net loss | — | — | — | — | — | — | — | — | — | — | — | — | — | — | — | (166,545 | ) | $ | (166,545 | ) | ||||||||||||||||||||||||||||||||||||||||||||||||
Balance at December 31, 2021 | 9,761,745 | 6,990 | 16,852,283 | 25,946 | 10,207,696 | 29,910 | 19,965,160 | 99,989 | 16,090,802 | 124,915 | 18,751,311 | 165,434 | 37,178,873 | 4 | 17,106 | (501,371 | ) | (31,077 | ) | |||||||||||||||||||||||||||||||||||||||||||||||||
The accompanying notes are an integral part of these consolidated financial statements
F-6
Starry Group Holdings, Inc.
Consolidated Statements of Cash Flows
(Dollar amounts in thousands, except share data)
Years Ended December 31, | ||||||||
2021 | 2020 | |||||||
Operating activities: | ||||||||
Net loss | $ | (166,545 | ) | $ | (125,093 | ) | ||
Adjustments to reconcile net loss to net cash used in operating activities: | ||||||||
Depreciation and amortization expense | 29,463 | 19,350 | ||||||
Paid-in-kind interest | 18,203 | 15,427 | ||||||
Amortization of debt discount and deferred charges | 5,438 | 3,820 | ||||||
Conversion of debt discount | 971 | — | ||||||
Loss on extinguishment of debt | 3,727 | — | ||||||
Fair value adjustment of derivative liability | 8,562 | 1,850 | ||||||
Loss on disposal of property and equipment | 2,216 | 1,549 | ||||||
Share-based compensation | 1,310 | 960 | ||||||
Accretion of asset retirement obligations | 205 | 114 | ||||||
Provision for doubtful accounts | 154 | 117 | ||||||
Changes in operating assets and liabilities: | ||||||||
Accounts receivable | (270 | ) | (327 | ) | ||||
Prepaid expenses and other current assets | (5,240 | ) | 162 | |||||
Other assets | (248 | ) | (2 | ) | ||||
Accounts payable | (1,249 | ) | 676 | |||||
Unearned revenue | 461 | 832 | ||||||
Accrued expenses and other current liabilities | 3,477 | 402 | ||||||
Other liabilities | 782 | 1,218 | ||||||
Net cash used in operating activities | (98,583 | ) | (78,945 | ) | ||||
Investing activities: | ||||||||
Purchases of property and equipment | (68,903 | ) | (35,906 | ) | ||||
Net cash used in investing activities | (68,903 | ) | (35,906 | ) | ||||
Financing activities: | ||||||||
Proceeds from the issuance of convertible notes payable and beneficial conversion feature on convertible notes | 11,000 | 31,243 | ||||||
Proceeds from Strategic Partner Arrangement | 3,342 | 1,722 | ||||||
Proceeds from exercise of common stock options | 752 | 183 | ||||||
Proceeds from issuance of Series D preferred stock, net of issuance costs | — | 30,738 | ||||||
Proceeds from the issuance of Series E Preferred Stock, net of issuance costs | 119,850 | — | ||||||
Proceeds from the issuance of term loans, net of issuance costs | 38,500 | — | ||||||
Payments of third-party issuance costs in connection with Term Loans | (264 | ) | — | |||||
Payments of deferred transaction costs | (975 | ) | — | |||||
Repayments of capital lease obligations, net | (788 | ) | (570 | ) | ||||
Net cash provided by financing activities | 171,417 | 63,316 | ||||||
Net increase (decrease) in cash and cash equivalents and restricted cash: | 3,931 | (51,535 | ) | |||||
Cash and cash equivalents and restricted cash, beginning of period | 26,831 | 78,366 | ||||||
Cash and cash equivalents and restricted cash, end of period | $ | 30,762 | $ | 26,831 | ||||
The accompanying notes are an integral part of these consolidated financial statements
F-7
Starry Group Holdings, Inc.
Notes to Consolidated Financial Statements
(Dollar amounts in thousands, except share and per share data)
Note 1. Description of business
Starry Group Holdings, Inc. (“New Starry” and, together with its subsidiaries, “Starry” or “the Company”) was incorporated in Delaware on September 17, 2021 as a wholly owned subsidiary of Starry, Inc. (“Old Starry”). New Starry was formed for the purpose of effectuating the transactions contemplated by the Agreement and Plan of Merger, dated as of October 6, 2021 (as amended, the “Merger Agreement”), by and among FirstMark Horizon Acquisition Corp. (“FirstMark”), Sirius Merger Sub, Inc., a Delaware corporation and wholly owned subsidiary of FirstMark (“Merger Sub”), Old Starry and New Starry.
The Company is in the telecommunications industry and invests in the future of fixed wireless technology. The Company delivers high-quality and affordable broadband access using innovative, proprietary wideband hybrid fiber wireless technology. Active phased arrays are used to amplify wireless signals and optimize service from multiple antennas deployed throughout a region. By using a fixed wireless network, reliance on municipal infrastructure is reduced, extensive installation times are bypassed, and network deployment is increased in comparison to its fiber competitors. Services are provided to customers in Boston, Los Angeles, New York City, Denver, Washington, D.C. and Columbus.
Business Combination
On October 6, 2021, FirstMark Horizon Acquisition Corp (“FirstMark”), Sirius Merger Sub, Inc., a Delaware corporation and wholly owned subsidiary of FirstMark (“Merger Sub”),
Old
Starry and New Starry entered into a merger agreement. Pursuant to the merger agreement, and subject to the terms and conditions contained therein, a business combination will be effected in two steps: (a) FirstMark will merge with and into New Starry, with New Starry surviving the merger as a publicly traded entity and becoming the sole owner of Merger Sub (referred to as the “SPAC Merger”), and (b) Merger Sub will merge with and intoOld
Starry, with Old
Starry surviving the merger as a wholly owned subsidiary of New Starry (referred to as the “Acquisition Merger”) (collectively, referred to as the “Business Combination”).Retrospective Adjustment
Share information for all periods prior to the Business Combination has been retroactively adjusted using the exchange ratio for the equivalent number of shares outstanding immediately after the Business Combination to effect the reverse recapitalization.
PIPE Subscription Agreement
In connection with the execution of the merger agreement, FirstMark and New Starry entered into the PIPE subscription agreements with the PIPE investors, pursuant to which, among other things, the PIPE investors party thereto agreed to purchase an aggregate of 10,900,000 shares of New Starry Class A common stock following the close of the SPAC Merger and immediately prior to the close of the Acquisition Merger at a cash purchase price of $10.00 per share, resulting in aggregate proceeds of $109,000 in the PIPE investment. The PIPE subscription agreements contain customary representations, warranties, covenants and agreements of FirstMark and the PIPE investors and are subject to customary closing conditions and termination rights. The PIPE Investment is expected to close following the close of the SPAC Merger and immediately prior to the close of the Acquisition Merger.
Convertible Notes Subscription Agreement
In connection with the execution of the merger agreement, FirstMark entered into the Convertible Notes subscription agreements with the Convertible Notes investors, pursuant to which, among other things, the Convertible Notes investors agreed to purchase an aggregate of $150,000 principal amount of Convertible Notes immediately prior to or substantially concurrently with the consummation of the Acquisition Merger, resulting in aggregate proceeds of $150,000 in the Convertible Notes investment. The Convertible Notes subscription agreements contain customary representations, warranties, covenants and agreements of FirstMark and the Convertible Notes investors and are subject to customary closing conditions and termination rights. The Convertible Notes investment is expected to close immediately prior to the close of the Acquisition Merger.
Series Z Subscription Agreement
In connection with the execution of the merger agreement, Starry entered into the Series Z Subscription Agreement with the Series Z Investors (affiliates of FirstMark), pursuant to which the Series Z Investors agreed to subscribe and
F-8
purchase, in the aggregate, 2,100,000 shares of Starry Series Z Preferred Stock at $10.00 per share for an aggregate commitment amount of $21,000. The closings under the Series Z Subscription Agreement will occur immediately prior to or substantially concurrently with the closing date of the Acquisition Merger.
Starry shall take all actions necessary to cause each share of Starry Series Z Preferred Stock that is issued and outstanding immediately prior to the effective time of the Acquisition Merger to be converted into the right to receive a number of shares of New Starry Class A Common Stock equal to the number of shares of Starry Series Z Preferred Stock held by each holder of Starry Series Z Preferred Stock as of immediately prior to the effective time of the Acquisition Merger.
On the closing date of the Acquisition Merger and immediately prior to the effective time of the Acquisition Merger, (a) each then-outstanding share of Starry Preferred Stock (excluding the Series Z Preferred Stock, par value $0.0001 per share of Starry (“Starry Series Z Preferred Stock”) will convert automatically into a number of shares of common stock, par value $0.0001 per
share, of Old Starry (“Old Starry Common Stock”) at the then-effective conversion rate as calculated pursuant to the certificate of incorporation of Starry (the “Conversion”); and (b) each then-outstanding and unexercised warrant of Old Starry (the “Old Starry Warrants”) will automatically be exercised in exchange for shares of Old Starry Common Stock pursuant to the terms of such Old Starry Warrants and shall be automatically cancelled, extinguished and retired and cease to exist.
At the effective time of the Acquisition Merger, pursuant to the Acquisition Merger: (a) each then-outstanding share of Old Starry Common Stock, including shares of Old Starry Common Stock resulting from the Conversion, will be canceled and automatically converted into the right to receive (i) with respect to Chaitanya Kanojia, the number of shares of Class X common stock, par value
$0.0001 pershare, of New Starry (the “New Starry Class X Common Stock”) and (ii) with respect to any other persons who hold Old Starry Common Stock, the number of shares of New Starry Class A Common Stock, in each case, equal to the applicable exchange ratio (determined in accordance with the merger agreement and as further described in the proxy statement/prospectus filed with the SEC and dated February 11, 2022); (b) each share of then-outstanding Starry Series Z Preferred Stock will convert automatically into the right to receive shares of New Starry Class A Common Stock on a one-to-one basis (c) each then-outstanding and unexercised option of Old Starry (an “Old Starry Option”) will be converted into an option exercisable for shares of New Starry Class A Common Stock (a “New Starry Option”), on the same terms and conditions as were applicable to such Old Starry Option, based on the exchange ratio (determined in accordance with the merger agreement and as further described in the proxy statement/prospectus filed with the SEC and dated February 11, 2022); and (d) each then-outstanding award of restricted stock units of Old Starry (an “Old Starry RSU Award”) will be converted into an award covering shares of New Starry Class A Common Stock (a “New Starry RSU Award”), on the same terms and conditions as were applicable to such Old Starry RSU Award, based on the exchange ratio (determined in accordance with the merger agreement and as further described in the proxy statement/prospectus filed with the SEC and dated February 11, 2022).
Going concern:
Presentation of Financial Statements,
Substantial doubt about an entity’s ability to continue as a going concern exists when relevant conditions and events, considered in the aggregate, indicate that it is probable that the entity will be unable to meet its obligations as they become due within one year from the financial statement issuance date.
These consolidated financial statements have been prepared on a going concern basis, which contemplates the realization of assets and settlement of liabilities in the normal course of business. The Company is an early-stage growth company and has generated losses and negative cash flows from operating activities since inception. The Company requires additional capital investment to execute the strategic business plan to grow its subscriber base in existing markets from already-deployed network assets and launch services in new markets. Management plans to raise additional capital through a combination of potential options, including but not limited to, equity and debt financings.
Additional equity financing may not be available on favorable terms and could be dilutive to current stockholders. Debt financing, if available, may involve restrictive covenants and dilutive financing instruments.
As of December 31, 2021, the Company was in compliance with the financial covenant required by the Credit Agreement. However, the inherent uncertainties described above may impact the Company’s ability to remain in compliance with this covenant over the next twelve months. If the Company breaches its financial covenant and fails to secure a waiver or forbearance from the third-party lender, such breach or failure could accelerate the repayment of the outstanding borrowing under the Credit Agreement or the exercise of other rights or remedies the third-party lender may have under applicable law. No assurance can be provided that a waiver or forbearance will be granted or the outstanding borrowing under the Credit Agreement will be successfully refinanced on terms that are acceptable to the Company.
F-9
The Company’s ability to access capital when needed is not assured and, if capital is not available to the Company when, and in the amounts needed, the Company could be required to delay, scale back or abandon some or all of its expansion efforts and other operations, which could materially harm the Company’s business, financial condition and results of operations. Because of this uncertainty, there is substantial doubt about the Company’s ability to continue as a going concern for at least one year from the date that these consolidated financial statements are issued, and therefore, whether we realize our assets and settle our liabilities in the normal course of business and at the amounts stated in the accompanying consolidated financial statements. The accompanying consolidated financial statements do not include any adjustments that might result from the outcome of this uncertainty, nor do they include adjustments to reflect the future effects of the recoverability or classification of recorded asset amounts and classification of liabilities that might be necessary should the Company be unable to continue as a going concern.
Note 2. Summary of significant accounting policies
Basis of presentation and principles of consolidation
:
Emerging Growth Company
:
to non-emerging growth
companies but any such election to opt out is irrevocable. The Company has elected not to opt out of such extended transition period which means that when a standard is issued or revised and it has different application dates for public or private companies, the Company, as an emerging growth company, can adopt the new or revised standard at the time private companies adopt the new or revised standard, until such time the Company is no longer considered to be an emerging growth company. At times, the Company may elect to early adopt a new or revised standard.Use of estimates:
Uncertainty of the coronavirus pandemic
:
Coronavirus Aid, Relief and Economic Security Act
As the coronavirus pandemic continues to evolve, the Company believes the extent of the impact to its business, operating results, cash flows, liquidity and financial condition will be primarily driven by the severity and duration of the coronavirus pandemic, the pandemic’s impact on the U.S. and global economies and the timing, scope and effectiveness of federal, state and local governmental responses to the pandemic. Those primary drivers are beyond the Company’s knowledge and control, and as a result, at this time the Company is unable to predict the cumulative
F-10
impact, both in terms of severity and duration, that the coronavirus pandemic will have on its business, operating results, cash flows and financial condition, but it could be material if the current circumstances continue to exist for a prolonged period of time. Although we have made our best estimates based upon current information, actual results could materially differ from the estimates and assumptions developed by management. Accordingly, it is reasonably possible that the estimates made in these consolidated financial statements have been, or will be, materially and adversely impacted in the near term as a result of these conditions, and if so, the Company may be subject to future impairment losses related to long-lived assets as well as changes to recorded reserves and valuations.
Segment information:
Segment Reporting
Concentration of credit risk:
With respect to accounts receivable, the Company routinely assesses the financial strength of its customers and, as a consequence, believes that the receivable credit risk exposure is limited. Substantially all of the Company’s trade accounts receivables are with commercial customers. Concentration of credit risk are limited due to the number of the Company’s customers as well as their dispersion across different geographic regions.
Cash and cash equivalents:
Restricted cash:
or non-current asset
on the Company’s consolidated balance sheets based on the terms of the lease agreement, letter of credit and customs bond.Accounts receivable, net:
Deferred costs:
F-11
As of December 31, 2021, deferred costs also consist of $1,824 in deferred charge assets, primarily comprised of the $1,695 in Delayed Draw Tranche C Warrants contingently issuable in connection with the Fifth Amendment (see Note 4).
Fair value measurements:
Fair Value Measurements and Disclosures
Level
1
Level
2
Level
3
An asset’s or liability’s fair value measurement level within the fair value hierarchy is based on the lowest level of any input that is significant to the fair value measurement. Valuation techniques used need to maximize the use of observable inputs and minimize the use of unobservable inputs.
Assets and liabilities measured at fair value are based on one or more of the following three valuation techniques noted in ASC 820:
| • | Market approach: Prices and other relevant information generated by market transactions involving identical or comparable assets or liabilities. |
| • | Cost approach: Amount that would be required to replace the service capacity of an asset (replacement cost). |
| • | Income approach: Techniques to convert future amounts to a single present value amount based upon market expectations (including present value techniques, option pricing and excess earnings models) |
The Company believes its valuation methods are appropriate and consistent with those used by other market participants, however the use of different methodologies or assumptions to determine the fair value of certain financial instruments could result in a different fair value measurement at the reporting date.
The Company’s financial instruments consist of cash and cash equivalents, restricted cash, accounts receivable, accounts payable, accrued expenses, term loans, convertible notes payable and warrant liabilities. The carrying value of cash and cash equivalents, accounts receivable, accounts payable, accrued expenses and convertible notes payable approximate fair value because of the short-term nature of those instruments. Due to the variable rate nature of the Company’s term loans, the fair value of debt approximates the carrying value of debt.
The warrant liabilities were initially and subsequently measured at fair value using a Black-Scholes model at each measurement date based on Level 3 inputs. As of October 6, 2021 (the issuance date) and December 31, 2021, the fair value of the warrant liabilities was $14,773. The following table provides quantitative information regarding the Level 3 fair value measurement inputs:
As of October 6, 2021 | As of December 31, 2021 | |||||||
Exercise price | $ | 0.05 | $ | 0.05 | ||||
Common stock fair value | $ | 9.83 | $ | 9.83 | ||||
Term (in years) | 10.0 | 9.8 | ||||||
Volatility | 27.56 | % | 27.56 | % | ||||
Risk-free interest rate | 1.53 | % | 1.52 | % | ||||
Expected dividends | 0 | % | 0 | % | ||||
F-12
Prepaid expenses and other current assets:
Property and equipment, net:
Property and equipment are depreciated or amortized using the straight-line method, based upon the following estimated useful lives:
Equipment | 3 years | |
Furniture and fixtures | 3 years | |
Software | 3 years | |
Vehicles | 4 years | |
Leasehold improvements | shorter of lease term or 5 years | |
Site acquisition costs | 5 years | |
Distribution system | 3 -10 years | |
Asset retirement obligation | 10 years | |
Construction-in-process | N/A |
Major renewals and improvements are capitalized while replacements and maintenance and repairs, which do not improve or extend the lives of the respective assets, are expensed as incurred. When property and equipment is retired or otherwise disposed of, the related cost and accumulated depreciation are removed from the accounts, and any gain or loss on the disposition is recorded in the consolidated statements of operations as a component of cost of revenues or selling, general and administrative expenses, depending on the nature of the property and equipment.
Impairment of long-lived assets
ASC 360-10,
Impairment or Disposal of Long-Lived Assets
Intangible assets:
Company re-evaluates the
useful life determination for the FCC licenses, annually, as of October 1 to determine whether events and circumstances continue to support an indefinite useful life.F-13
The FCC licenses are tested for potential impairment annually, as of October 1, or more frequently if impairment indicators are present. ASC 350, (“ASC 350”), provides the option to first perform a qualitative assessment to determine whether it is necessary to perform a quantitative impairment test. ASC 350 permits the Company to elect to bypass the qualitative assessment in any period and proceed directly to performing the quantitative impairment test. The quantitative assessment consists of comparing the estimated fair value of the FCC licenses to the aggregated carrying amount as of the test date. As of October 1, 2021, the Company elected to perform a quantitative assessment using a market-based approach that did not result in impairment. As of October 1, 2020, the Company performed a qualitative assessment that did not identify any indicators of impairment that would require a quantitative assessment to be performed.
Intangibles – Goodwill and Other
Asset retirement obligations:
Asset Retirement and Environmental Obligations
The Company records the net present value of the ARO liability and a related capital asset, in an equal amount, for contracts which result in an ARO. The estimated ARO liability is based on a number of assumptions, including costs to remove deployed equipment, expected life, inflation rates and discount rates. Accretion expense related to the ARO liability is recognized as a component of selling, general and administrative expense in the accompanying consolidated statements of operations. Upon ARO fulfillment, any difference between actual retirement expense incurred and the recorded estimated ARO liability is recognized as a gain or loss in the accompanying consolidated statements of operations as a component of other income (expense).
For the years ended December 31, 2021 and 2020, there were 0 settlements of the ARO liabilities.
Revenues:
Revenue from Contracts with Customers
| • | Identify the contract with a customer |
| • | Identify the performance obligations in the contract |
| • | Determine the transaction price |
| • | Allocate the transaction price to the performance obligations in the contract |
| • | Recognize revenue when or as performance obligations are satisfied |
The Company delivers high-quality and affordable broadband internet access to its customers using innovative, proprietary wideband hybrid fiber wireless technology and related support on a subscription basis. The Company’s subscription rate for such services is a per month fixed price for service without limitations on usage. The majority of customers are individual users who may also receive subsidized internet services through federal subsidies such as the Emergency Broadband Benefit (“EBB”) program, but a small amount are commercial arrangements where a building owner is the party who we contract with and pays for all the units in a building or for the units utilizing the service.
Income taxes:
The Company provides reserves for potential payments of taxes to various tax authorities related to uncertain tax positions. Amounts recognized are based on a determination of whether a tax benefit taken by the Company in its tax filings or positions is “more likely than not” to be sustained on audit. The amount recognized is equal to the largest amount that is more than 50% likely to be sustained. Interest and penalties associated with uncertain tax positions are recorded as a component of income tax expense.
F-14
The Company uses
a two-step approach
for recognizing and measuring tax benefits taken or expected to be taken in a tax return regarding uncertainties in income tax positions. The first step is recognition: the Company determines whether it is more likely than not that a tax position will be sustained upon examination, including resolution of any related appeals or litigation processes, based on the technical merits of the position. In evaluating whether a tax position has metthe more-likely-than-not recognition
threshold, the Company presumes that the position will be examined by the appropriate taxing authority with full knowledge of all relevant information. The second step is measurement: a tax position that meets themore-likely-than-not recognition
threshold is measured to determine the amount of benefit to recognize in the financial statements. The tax position is measured at the largest amount of benefit that is greater than 50 percent likely of being realized upon ultimate settlement. Differences between tax positions taken in a tax return and amounts recognized in the financial statements will generally result in one or more of the following: an increase in a liability for income taxes payable, a reduction of an income tax refund receivable, a reduction in a deferred tax asset or an increase in a deferred tax liability. As of December 31, 2021 and 2020, the Company has 0t identified any uncertain tax positions for which reserves would be required.Share-based compensation:
Compensation – Stock Compensation
The Company or its assignees have the right, but not the obligation, upon the termination of employment of an employee or termination of the service relationship ofTo date, the Company has not exercised its rights to acquire Purchased Shares fromthe Company has determined that it is not probable that it will repurchase Purchased Shares in the future and as a result such options are accounted for as equity awards.
a non-employee, in
either case who holds shares of the Company’s common stock acquired upon exercise of options (“Purchased Shares”) to repurchase from such holder some or all (as determined by the Company) of such Purchased Shares. This repurchase right may be exercised by the Company within the later of six months following the date of termination of employment in the case of an employee, or termination of service relationship in the caseof non-employee, or
seven months after the acquisition of such Purchased Shares upon exercise of the underlying options. The Company assesses the probability of repurchasing shares ona grantee-by-grantee basis.
any ex-employee or non-employee. Therefore,
The Company utilizes the Black-Scholes model, which requires the input of subjective assumptions to determine the fair value of stock-based awards. These assumptions include estimating (a) the length of time grantees will retain their vested stock options before exercising them for employees and the contractual term of the option for nonemployees (“expected term”), (b) the volatility of the Company’s common stock price over the expected term, (c) expected dividends, (d) the fair value of common stock and (e) the risk-free interest rate. The Company has elected to recognize forfeitures in the period in which they occur.
The Company recognizes compensation cost on a straight-line basis over the requisite service period of the awards for employees, which is typically the four-year vesting period of the award, and effective contract period specified in the award agreement
for non-employee.
The assumptions used in the Black-Scholes model are management’s best estimates, but the estimates involve inherent uncertainties and the application of management judgment (see Note 6). As a result, if other assumptions had been used, the recorded share-based compensation expense could have been materially different from that depicted in the consolidated financial statements.
Warrants:
Distinguishing Liabilities from Equity
Derivatives and Hedging
F-15
whether the warrants should be classified as liabilities or equity. Warrants that are determined to require liability classification are measured at fair value upon issuance and are
subsequently re-measured to
their then fair value at each subsequent reporting period, with changes in fair value recorded in current earnings. Warrants that are determined to require equity classification are measured at fair value upon issuance and are not subsequently remeasured unless they are required to be reclassified.For warrants issued to nonemployees for goods or services, the Company follows guidance issued within ASC 718 to determine whether the share-based payments are equity or liability classified, and are measured at fair value on the grant date. The related expense is recognized in the same period and in the same manner as if the Company had paid cash for the goods or services.
Advertising costs:
Research and development expense:
Sale-leasebacks:
Recent accounting pronouncements issued, not yet adopted:
In February 2016, the FASB issued a new accounting standard, ASC 842, (“ASC 842”), to increase transparency and comparability among organizations by requiring the recognition of ROU assets and lease liabilities on the balance sheets. Most significant among the changes in the standard is the recognition of ROU assets and lease liabilities by lessees for those leases classified as operating leases under previous U.S. GAAP. Under the new standard, disclosures are required to meet the objective of enabling users of financial statements to assess the amount, timing and uncertainty of cash flows arising from leases. ASC 842 is effective for the annual period beginning January 1, 2022, and interim periods within the annual period beginning January 1, 2023, with early adoption permitted.
Leases
The Company is currently evaluating the impact the new guidance will have on its financial position and results of operations but expects to recognize lease liabilities and right of use assets at the time of adoption. The extent of the increase to assets and liabilities associated with these amounts remains to be determined pending the Company’s review of its existing lease contracts and service contracts which may contain embedded leases. The Company is currently assessing the potential impact to the financial statements. The Company is continuing to monitor potential changes to ASC 842 that have been proposed by the FASB and will assess any necessary changes to the implementation process as the guidance is updated.
In June 2016, the FASB issued
ASU 2016-13,
Financial Instruments – Credit Losses (Topic 326): Measurement of Credit Losses of Financial Instruments
(“ASU 2016-13”), which,
together with subsequent amendments, amends the requirement on the measurement and recognition of expected credit losses for financial assets held to replace the incurred loss model for financial assets measured at amortized cost and require entities to measure all expected credit losses for financial assets held at the reporting date based on historical experience, current conditions and reasonable and supportable forecasts.ASU 2016-13 is
effective for the Company beginning January 1, 2023, with early adoption permitted. The Company is currently in the process of evaluating the effects of this pronouncement on the Company’s consolidated financial statements.F-16
In August 2020, the FASB issued and Derivatives and Hedging –, which simplifies the accounting for convertible instruments by reducing the number of accounting models available for convertible debt instruments. This guidance removes certain settlement conditions that are required for contracts to qualify for equity classification, eliminates the treasury stock method to calculate diluted earnings per share for convertible instruments and requires the use of
ASU 2020-06,
Debt – Debt with Conversion and Other Options (Subtopic
470-20)
Contracts in Entity’s Own Equity (Subtopic
815-40):
Accounting for Convertible Instruments and Contracts in an Entity’s Own Equity
the if-converted method.
ASU 2021-06 is
effective for the Company beginning January 1, 2024, with early adoption permitted. The Company is currently evaluating the effects of this pronouncement on the Company’s consolidated financial statements and the potential impact on the consolidated financial statements.In October 2020, the FASB issued
ASU 2020-10,
Codification Improvements
(“ASU 2020-10”), which
clarifies and improves the consistency of the Codification by updating various disclosure requirements to align with the SEC’s regulations and ensure all guidance that requires or provides an option for an entity to provide information in the notes to financial statements is codified in the Disclosure Section of the Codification.ASU 2020-10 is
effective for the Company beginning January 1, 2022, and interim periods within the annual period beginning January 1, 2023, with early adoption permitted. The Company is currently evaluating the effects of this pronouncement on the Company’s consolidated financial statements and the potential impact on the consolidated financial statements.Note 3. Revenue recognition
The Company assesses the contract term as the period in which the parties to the contract have presently enforceable rights and obligations. The contract term can differ from the stated term in contracts that include certain termination or renewal rights, depending on whether there are penalties associated with those rights. Although customers are typically billed in advance for a month of service, the majority of the Company’s contracts (with residential customers) allow either party to cancel at any time without penalty and customers are entitled to a pro rata refund for services not yet rendered. However, in some instances the Company enters into
non-cancellable
andnon-refundable
contracts as part of commercial arrangements.Nature of services:
Transaction price:
The Company’s contracts with customers may include service level agreements that entitle the customer to receive service credits, and in certain cases, service refunds, when defined service levels are not met. These arrangements represent a form of variable consideration, which is considered in the calculation of the transaction price. The Company estimates the amount of variable consideration at the expected value based on its assessment of legal enforceability, anticipated performance and a review of specific transactions, historical experience and market and economic conditions. The Company historically has not experienced any significant incidents affecting the defined levels of reliability and performance as required by the contracts.
The Company has elected the practical expedient that permits an entity not to recognize a significant financing component if the time between the transfer of a good or service and payment is one year or less. The Company does
F-17
not enter into contracts in which the period between payment by the customer and the transfer of the promised goods or services to the customer is greater than 12 months. In addition, the Company excludes from revenue sales taxes and other government-assessed and imposed taxes on revenue-generating activities that are invoiced to customers, whenever applicable.
For individual customers who receive subsidized internet services through the EBB program, the transaction price includes the amounts due from the customer as well as the subsidy amount due from the government.
Gift card incentives:
Unearned revenue:
Unearned Revenue | ||||
December 31, 2020 | $ | 1,169 | ||
Change | 461 | |||
December 31, 2021 | $ | 1,630 | ||
Note 4. Debt
At December 31, 2021 and 2020, the carrying value of debt was as follows:
As of | ||||||||
December 31, 2021 | December 31, 2020 | |||||||
Gross term loans | $ | 202,671 | $ | 144,877 | ||||
Convertible notes payable, net of unamortized discount at December 31, 2021 and 2020 of $0 and $2,282, respectively | — | 29,256 | ||||||
Strategic Partner Arrangement (see Note 12) | 5,227 | 1,722 | ||||||
Capital lease obligations | 2,221 | 1,609 | ||||||
| 210,119 | 177,464 | |||||||
Less unamortized debt discount on term loans | (17,019 | ) | (13,657 | ) | ||||
Less current portion of debt | (1,504 | ) | (29,875 | ) | ||||
Debt, net of current portion | $ | 191,596 | $ | 133,932 | ||||
2019 Credit Agreement:
The Term Loans incur interest at a rate equal to the London Interbank Offered Rate (“LIBOR”), subject to a floor of 2.0%, plus an applicable margin of 9.0% (with the interest rate capped at 13.25% per annum) and such interest is
F-18
accrued on a quarterly basis. Such interest rates were approximately 11.0% as of December 31, 2021 and 2020. As allowed in the Credit Agreement, the Company has elected to pay the interest accrued onon the Termis reflected as a component of the carrying value of the Term Loans as the payment of such interest would occur upon the settlement of the Term Loans.
an in-kind basis
by increasing the principal balance outstanding. For the years ending December 31, 2021 and 2020, the Company has incurred $17,794 and $15,132, respectively,of paid-in-kind interest
Loans. Paid-in-kind interest
The principal balance is payable in its entirety at maturity in February 2024. The Company may prepay the Term Loans, in whole or in part, at any time, subject to a premium. In addition, the lenders can require prepayment in certain circumstances, including a change of control, also subject to a premium. The premium for such prepayment ranges from 0% to 10% of the principal based on the timing of prepayment. A change of control is defined as the acquisition of direct or indirect ownership by a person other than existing stockholders of the Company of fifty percent or more of the voting or equity value of the Company.
The Term Loans are senior to all other debt and have a first priority lien on substantially all of the Company’s assets. The Term Loans contain customary conditions related to borrowing, events of default and covenants, including
certain non-financial covenants
and covenants limiting the Company’s ability to dispose of assets, undergo a change in control, merge with or acquire stock, and make investments, in each case subject to certain exceptions. There is a financial covenant with respect to the Term Loans that requires the Company to maintain a minimum cash balance of $15,000 at all times. Upon the occurrence of an event of default, in addition to the lenders being able to declare amounts outstanding under the Term Loans due and payable the lenders can elect to increase the interest rate by 2.0% per annum.On June 2, 2021, the Company entered into a Third Amendment and Waiver to the 2019 Credit Agreement (as amended and restated, the “Credit Agreement”). The Credit Agreement amended and restated two affirmative covenants that the Company was not in compliance with as of December 31, 2020, which include the Company providing audited financial statements without a “going concern” or like qualification, exception or emphasis.
The non-compliance with
covenants is an event of default which would have required the outstanding long-term debt balance to be payable upon demand. The Credit Agreement also waived any events of default in existence on the Third Amendment and Waiver effective date. The lender has retained all other covenant requirements.The Company assessed the embedded features of the Term Loans, including the accelerated repayment (redemption) features and the default rate of interest feature, noting that these features met the definition of a derivative under ASC 815 and were not clearly and closely related to the debt host instrument. The Company is required to remeasure these derivative features to their then fair value at each subsequent reporting period. The Company determined the fair value of these features to be $0 as of the respective issuance dates of the Term Loans. However, based on the previously defined change of control trigger the repayment feature was ascribed a fair value of $10,412 and $1,850, respectively, as of December 31, 2021 and 2020, recorded in other liabilities on the consolidated balance sheets. The change in fair value is based on management’s assumption of the estimated probability that the accelerated repayment would be triggered prior to maturity. Such probability was deemed to be 100% as of December 31, 2021. The change in fair value of $8,562 and $1,850 for the years ended December 31, 2021 and 2020, was recorded in other income (expense) on the consolidated statement of operations.
In connection with entering into the initial agreement in February 2019, the Company issued the lender a warrant to purchase 2,765,887 shares of the
Company’s non-voting common
stock. In addition, in connection with the Company entering into the Credit Agreement in December 2019, the Company issued the new participating lenders a warrant to purchase 3,244,510 shares of theCompany’s non-voting common
stock (see Note 5 for the accounting for these warrants). As the Company concluded the warrants were classified in stockholders’ equity, the Company allocated approximately $6,175 and $8,307 in value to the warrant issuances, respectively, on a relative fair value basis and recorded this allocated value as an increaseto additional-paid-in capital
and as a component of the discount recorded against the outstanding debt. On October 6, 2021, certain lenders who hold 648,902 of such warrants entered into the Convertible Note Subscription Agreement (see Note 16) which provides the lenders an exchange right to net cash settle the outstanding warrants. The Companyre-assessed
the classification of such warrants due to the exchange right and recorded a reclassification of $6,345 fromadditional-paid-in
capital to warrant liabilities. F-19
On October 6, 2021, the Company entered into the Fifth Amendment to the 2019 Credit Agreement (“Fifth Amendment”) with lenders to provide for a total of $40,000 in term loans which the Company immediately drew upon in full (“Tranche C Loan”) and up to an additional $10,000 in delayed draw loans (“Delayed Draw Tranche C Loan”) (together, the “Tranche C Loans”). Two lenders in the Tranche C Loans were also lenders in the Tranche B Loans, lending up to $6,000 and $1,500 respectively. The Fifth Amendment for such lenders was treated as an extinguishment. The Company recorded a loss on extinguishment of $1,366 reflected in other income (expense), net on the consolidated statement of operations for the year ended December 31, 2021.
In conjunction with the Fifth Amendment, the Company entered into the Warrant Purchase Agreement as of October 6, 2021. The Company issued to the lenders warrants to purchase 2,118,687 shares of
nonvoting Old
Starry Common Stock valued at $6,733 (“Initial Tranche C Warrants”) and contingently issuable warrants to purchase 533,275 shares ofnonvoting Old
Starry Common Stock valued at $1,695 (“Delayed Draw Tranche C Warrants”) (together, the “Tranche C Warrants”). The Company concluded the Tranche C Warrants are liability classified and recorded the fair value as an increase to warrant liabilities and as a component of the discount recorded against the outstanding debt (for the Initial Tranche C Warrants) and deferred costs (for the Delayed Draw Tranche C Warrants) as the Delayed Draw Tranche C Loan was not outstanding as of December 31, 2021. The Delayed Draw Tranche C Warrants will be reclassified as a component of the discount recorded against the outstanding debt upon the draw down of the Delayed Draw Tranche C Loan, which subsequently occurred on January 11, 2022.Term Loans debt issuance costs and discount:
de-recognized
$176 of deferred financing costs associated with the Tranche B Loans.The Company is amortizing the debt discounts over the term of the Credit Agreement using the effective interest method (based on an effective interest rate of 16.9%, 11.2%, 14.2% and 19.1%, respectively). The amortization recorded for the years ended December 31, 2021 and 2020 is $3,516 and $2,169, respectively, and is included within interest expense in the consolidated statements of operations. The remaining unamortized debt discount at December 31, 2021 and 2020 is $17,019 and $13,658, respectively, and is reflected net against the debt, net of current portion on the consolidated balance sheets.
2020 Convertible notes payable:
| (a) | Automatic conversion of outstanding principal and unpaid accrued interest upon the closing of the next equity financing. The conversion price will be based on the next equity financing per share price with a 20% discount, provided that the conversion price is not less than the Series D preferred stock price ($7.77 |
| (b) | Automatic conversion of outstanding principal and unpaid accrued interest upon maturity of the 2020 Notes into shares of Series D preferred stock. The number of Series D preferred stock shares to be issued shall be equal to the quotient obtained by dividing (i) the outstanding principal and unpaid accrued interest due by (ii) the Series D preferred stock price. |
F-20
| (c) | Automatic redemption upon the Company closing a corporate transaction, or liquidation event (including an IPO, SPAC transaction or other change in control event). In such scenario, the majority noteholders would elect either (i) the repayment of the outstanding principal and accrued unpaid interest due upon the closing of the corporate transaction or (ii) the conversion of the 2020 Notes into the right to receive a cash payment as though the principal and unpaid accrued interest had converted into conversion shares. The conversion price will be based on the corporate transaction per share price with a 20% discount, provided that the conversion price is not less than the Series D preferred stock price ($7.77 |
| (d) | Automatic conversion of outstanding principal and unpaid accrued interest upon the closing of an initial public offering. The number of conversion shares to be issued shall be equal to the quotient obtained by dividing (i) the outstanding principal and unpaid accrued interest due by (ii) the Series D preferred stock price. |
| (e) | Automatic conversion of outstanding principal and unpaid accrued interest upon an event of default under the Credit Agreement. The number of conversion shares to be issued shall be equal to the quotient obtained by dividing (i) the outstanding principal and unpaid accrued interest due by (ii) the Series D preferred stock price. |
The Company assessed the embedded features within the 2020 Notes as detailed above and determined that the automatic conversion feature upon the next equity financing and the redemption upon a corporate transaction (in both cases, provided that the conversion price is not less than the Series D preferred stock price ($7.77 per share) or greater than $8.53 per share) met the definition of a derivative that would require separate accounting from the
2020 Notes. In estimating the fair value of these bifurcated embedded features, the Company concluded that such fair value was de minimis at issuance of the 2020 Notes. The automatic conversion feature upon maturity was assessed to contain a beneficial conversion feature that was recognized at its intrinsic value at the issuance date as a component ofas a debt discount to the 2020 Notes totaling $3,933.
additional paid-in-capital and
January 2021 Convertible notes payable:
| (a) | Automatic conversion of outstanding principal and unpaid accrued interest upon the closing of the next equity financing. The conversion price will be based on the next equity financing per share price with a 20% discount, as long as it is not greater than $8.53 per share. The number of conversion shares to be issued shall be equal to the quotient obtained by dividing (i) the outstanding principal and unpaid accrued interest due by (ii) the above mentioned conversion price. This feature is effectively made up of 2 separate components, a share-settled redemption feature when the conversion price is not greater than $8.53 per share, and a traditional conversion option when the conversion price is greater than $8.53 per share. |
| (b) | Automatic conversion of outstanding principal and unpaid accrued interest upon maturity of the 2021 Notes into shares of Series D preferred stock. The number of Series D preferred stock shares to be issued shall be equal to the quotient obtained by dividing (i) the outstanding principal and unpaid accrued interest due by (ii) the Series D preferred stock price. |
| (c) | Automatic redemption upon the Company closing a corporate transaction. In such scenario, the majority noteholders would elect either (i) the repayment of the outstanding principal and accrued unpaid interest due upon the closing of the corporate transaction or (ii) the conversion of the 2021 Notes into the right to receive a cash payment as though the principal and unpaid accrued interest had converted into conversion shares. The conversion price will be based on the corporate transaction per share price with a 20% discount, provided it is not greater than $8.53. The number of conversion shares to be issued shall be equal to the quotient obtained by dividing (i) the outstanding principal and unpaid accrued interest due by (ii) the above mentioned conversion price. This feature is effectively made up of 2 separate components, a share-settled redemption feature when the conversion price is not greater than $8.53 per share, and a traditional conversion option when the conversion price is greater than $8.53 per share. |
F-21
| (d) | Automatic conversion of outstanding principal and unpaid accrued interest upon the closing of an initial public offering. The number of conversion shares to be issued shall be equal to the quotient obtained by dividing (i) the outstanding principal and unpaid accrued interest due by (ii) the Series D preferred stock price. |
| (e) | Automatic conversion of outstanding principal and unpaid accrued interest upon an event of default under the Credit Agreement. The number of conversion shares to be issued shall be equal to the quotient obtained by dividing (i) the outstanding principal and unpaid accrued interest due by (ii) the Series D preferred stock price. |
| (f) | In the event of a future non-equity financing prior to the full payment or conversion of the Notes, each lender will have the option to elect for the principal and unpaid accrued interest of each outstanding note to be converted into either (i) the instrument used in the non-equity financing on the same price, or (ii) conversion shares. The number of conversion shares to be issued shall be equal to the quotient obtained by dividing (i) the outstanding principal and unpaid accrued interest due by (ii) the conversion price. |
The Company assessed the embedded features within the 2021 Notes as detailed above and determined that the automatic conversion feature upon the next equity financing and the redemption upon a corporate transaction (in both cases, when settled in shares at a conversion price less than $8.53 per share) met the definition of a derivative that would require separate accounting from the 2021 Notes. In estimating the fair value of these bifurcated embedded features, the Company concluded that such fair value was de minimis at issuance of the 2021 Notes. The automatic conversion feature upon maturity was assessed to contain a beneficial conversion feature that was recognized at its intrinsic value at the issuance date as a component of additional
paid-in
capital and as a debt discount to the 2021 Notes totaling $2,791. Two current shareholders who were related parties contributed $3,000 and $5,000, respectively, of the $11,000 2021 Notes balance.The total amortization recorded for both the 2020 and 2021 Notes for the years ended December 31, 2021 and 2020, was $1,750 and $1,651, respectively, and is included within interest expense in the consolidated statements of operations. For the years ended December 31, 2021 and 2020, the Company incurred $246 and $295as a component of the carrying value of the 2020 Notes and 2021 Notes.
of paid-in-kind interest
On March 31, 2021, the Company completed the initial closing of a new equity financing for its Series E Preferred Stock. As a result of the closing, both the 2020 Notes and 2021 Notes, including accrued cashconverted to shares of
and paid-in-kind interest,
Series E-1 and
Series E-2 Preferred
Stock respectively (see Note 5). The conversion of the 2020 Notes was treated as a conversion in accordance with the original terms of the 2020 Notes, and as such, carrying value of the 2020 Notes was reclassified toSeries E-1 Preferred
Stock. The conversion of the 2021 Notes was treated as an extinguishment of the 2021 Notes, with theSeries E-2 Preferred
Stock being recorded at its fair value (the reacquisition price of the 2021 Notes) and the Company recording a charge to the capital account of $2,791 representing the additional value provided to the holders of the 2021 Notes upon settlement. The Company recorded a loss on extinguishment of $2,361 reflected in the other income (expense), net on the consolidated statement of operations for the year ended December 31, 2020.As a result of the 2020 Notes converting into shares of Series E Preferred Stock, the carrying value of the debt discount on the 2020 Notes was reversed and recognized as interest expense in the amount of $971 for the year ending December 31, 2021.
Capital lease obligations:
F-22
The aggregate future maturities of debt are as follows:
Years Ended December 31, | Term loans | Capital lease obligations | ||||||
2022 | $ | — | $ | 1,092 | ||||
2023 | — | 731 | ||||||
2024 | 202,671 | 452 | ||||||
2025 | — | 146 | ||||||
| 202,671 | 2,421 | |||||||
Less: imputed interest | — | (200 | ) | |||||
Total future maturities | $ | 202,671 | $ | 2,221 | ||||
Note 5. Stockholders’ equity
Convertible preferred stock
The Company has authorized the issuance of 92,637,050 shares of convertible preferred stock (“Preferred Stock”), of which 9,761,747 shares are designated as Series Seed Preferred Stock, 16,852,283 shares are designated as Series A Preferred Stock, 10,207,696 shares are designated as Series B Preferred Stock, 19,965,160 are designated as Series C Preferred Stock, 16,090,802 are designated as Series D Preferred Stock, 19,299,164 are designated as Series E Preferred Stock and 2,500,000 are designated as Series Z Preferred Stock (collectively, the “Preferred Stock”).
In July 2020, the Company issued 3,958,337 shares of Series D Preferred Stock at a purchase price of $7.77 per share, in exchange for gross cash proceeds of $30,750. In connection with this, the Company incurred issuance costs of approximately $12 during the year ended December 31, 2020.
On March 31, 2021, the Company completed a Series E Preferred Stock financing round whereby it issued shares of Series
$9.13 per share, in exchange for gross cash proceeds of $120,000 and incurred issuance costs of $150.
E-1
Preferred Stock, SeriesE-2
Preferred Stock, and SeriesE-3
Preferred Stock. The 2020 Notes had a carrying value of $31,752 and were converted into 4,087,375 shares of SeriesE-1
Preferred Stock, at a price per share of $7.77. The 2021 Notes had a carrying value of $13,832 and were converted into 1,515,452 shares of SeriesE-2
Preferred Stock, at a price per share of $7.28. The Company issued 13,148,484 shares of SeriesE-3
Preferred Stock at a purchase price of$9.13 per share, in exchange for gross cash proceeds of $120,000 and incurred issuance costs of $150.
The following summarizes the rights and preferences of the Preferred Stock (terms specific to each respective series of Preferred Stock are identified where relevant):
Distributions and liquidation preferences
:
The holders of Preferred Stock receive, in the event of a liquidation event and prior to any distribution to common stockholders, an amount equal to (i) the original issuance price per share for the Series Seed, A, B, C, D,E-1,
E-2
andE-3
Preferred Stock equal to $0.72, $1.54, $2.94, $5.01, $7.77, $7.77, $7.28
and $9.13, respectively, adjusted as necessary, and (ii) any dividends declared and/or accrued, but unpaid. The Preferred Stockholders shall be entitled to receive the greater of the Original Issue Price plus any accrued and unpaid dividends or such amount per share that would have been payable had all of the Preferred Stock been converted in Common Stock. After payment of the preferred preference, the remaining proceeds are to be distributed to the holders of the common stock ona pro-rata basis.
Dividends
:
The holders of Preferred Stock are entitled to receive dividends when and if declared by the board of directors (the “Board”) from the Company’s legally available funds. The preferred stock dividends are given preference to any declaration or payment of any dividend on the Company’s common stock. The holders of Preferred Stock also are entitled to participate pro rata in any dividends paid on the Common Stock onan as-if-converted basis.
Conversion:
E-1,
E-2,
E-3
Preferred Stock is $0.72, $1.54, $2.94, $5.01, $7.77, $7.77, $7.28 and $9.13F-23
respectively, subject to adjustment, as defined. Conversion is automatic upon the earlier of (1) the Company’s sale of common stock in a firm commitment underwritten public offering provided that the offering price per share is at least $11.65 per share and the aggregate net proceeds are at least $25,000 or (2) at the election of the majority of preferred stockholders.
The conversion price will also be subject to proportional adjustment for events such as stock splits, stock dividends and recapitalization.
Voting:
Redemption (deemed liquidation events)
:
The Preferred Stock is not mandatorily redeemable. The Preferred Stock is only redeemable in the event of a deemed liquidation event and a majority of the preferred stockholders request such redemption in writing at least five days prior to the effective date of such deemed liquidation event. Shares of Preferred Stock shall be redeemed by the Company out of funds lawfully available at a price per share noted above plus any accrued or declared but unpaid dividends thereon. A deemed liquidation event includes each of the following unless the majority of preferred stockholders elect otherwise:| a) | a merger or consolidation of the Company with or into another entity, unless the shares of stock of the Company continue to represent or are converted into or exchanged for shares of capital stock that represent a majority of voting power of the surviving corporation; or |
| b) | the sale, lease, transfer, exclusive license or other disposition, in a single transaction or series of related transactions, of substantially all the assets of the Company. |
The Company has evaluated the Preferred Stock offerings, its investor registration rights and the rights, preferences and privileges of each series of Preferred Stock and has concluded that there were no embedded features that met the definition of a derivative requiring bifurcation and separate accounting. Additionally, the Company assessed the conversion terms associated with its Preferred Stock and concluded that they did not include beneficial conversion features.
The Company has classified Preferred Stock as permanent equity as all deemed liquidation events are within the control of the Company as the common voting shareholders control four of the seven seats of the board of directors and the CEO holds the majority of the common voting shares. In addition, the Company does not currently believe that the related contingent events and the redemption of the Preferred Stock is probable to occur. Therefore, the Company is not currently accreting the Preferred Stock to redemption value, and will only do so if the Preferred Stock becomes probable of redemption in the future.
The redemption value of the Series Seed, A, B, C, D
E-1,
E-2,
E-3
Preferred Stock at December 31, 2021 was $7,000, $26,000, $30,000, $100,000, $125,000, $31,752, $11,032, and $120,000 respectively. The Company has not declared any dividends related to the Preferred Stock.Common stock
Voting common shares:
Non-voting
common shares:
of Non-Voting Common
Shares, par value $0.0001 of which 2,201,636 and 1,178,598 are issued and outstanding at December 31, 2021 and 2020, respectively.F-24
The following shares of common stock are reserved for future issuance:
| Voting common shares | Non-voting common shares | |||||||
Conversion of redeemable, convertible preferred stock | 91,628,998 | — | ||||||
Warrants issued and outstanding | — | 8,221,123 | ||||||
Stock options issued and outstanding | — | 8,873,981 | ||||||
Authorized for future grant under 2014 Stock Option and Grant Plan | — | 334,056 | ||||||
| 91,628,998 | 17,439,160 | |||||||
Warrants for
non-voting
common stock
In October 2021, the Company issued the Initial Tranche C Warrants to purchase 2,118,687 shares of
non-voting
common stock at an exercise price of $0.05 per share to a syndicate of lenders in connection with the Fifth Amendment to the Credit Agreement as discussed in Note 4. Thesenon-voting
common stock warrants expire in October 2031. Additionally, in connection with the Fifth Amendment to the Credit Agreement the Company had contingently issuable Delayed Draw Tranche C Warrants to purchase 533,275 shares ofnon-voting
common stock (not yet issued or outstanding as of December 31, 2021). The Tranche C Warrants will vest and become exercisable (i) with respect to 25% of the warrant shares, upon issuance thereof, (ii) with respect to 25% of the warrant shares, upon the earlier to occur of (x) termination of the merger agreement in accordance with its terms and (y) April 16, 2022 if thede-SPAC
has not been consummated prior to such date, and (iii) with respect to 50% of the warrant shares, upon the earlier to occur of (1) termination of the merger agreement in accordance with its terms and (2) May 1, 2022 if thede-SPAC
has not been consummated prior to such date. For the avoidance of doubt, if the closing of thede-SPAC
occurs on or prior to April 15, 2022 then the Tranche C Warrants will be exercisable solely with respect to the 25% of the warrant shares that vest immediately upon issuance.The Tranche C Warrants were assessed under ASC 480 and ASC 815 upon issuance and were determined to meet the requirements for liability classification due to the contingent exercisability conditions described above. Accordingly, the Company recorded the grant date fair value for the Tranche C Warrants to warrant liabilities upon the issuance date.
The weighted-average estimated grant date fair value of such Tranche C Warrants was $3.21 per share at issuance date (aggregate fair value of $8,428). For the 25%
non-contingently
exercisable warrant shares, the fair value approximated the estimated fair value of a share of the Company’s common stock on the date of issuance. For the 75% contingently exercisable warrant shares, the fair value approximated the estimated fair value of a share of the Company’s common stock on the date of issuance adjusted for management’s assumption of the probability of thede-SPAC
occurring on or prior to April 15, 2022. The fair value of the Company’s common stock is based on certain factors as discussed further in Note 6. As of December 31, 2021, the Company concluded there was no change in the fair value of the Tranche C Warrants.In February 2019 and December 2019, the Company issued warrants to purchase 2,765,887 and 3,244,510 shares
of non-voting common
stock (the “2019 Warrants”), respectively, at an exercise price of $0.01 per share to a lender in connection with the Credit Agreement discussed in Note 4.These non-voting common
stock warrants expire in February 2029 and December 2029, respectively. The estimated grant date fair value ofthese non-voting common
stock warrants was $2.88 per share at issuance date (aggregate fair value of $14,482), which approximated the estimated fair value of a share of the Company’s common stock on the respective dates of issuance. The fair value of the Company’s common stock is based on certain factors as further discussed in Note 6.In 2018, the Company issued warrants to purchase shares
of non-voting common
stock at an exercise price of $5.01 per share (the “2018 Warrants”).These non-voting common
stock warrants expire in March 2024. The total award could be exercised for 874,374 shares, of which 437,187 warrants were exercisable at issuance and 437,187 shares may become exercisable upon attaining performance requirements. The performance requirements are attained with each 2,000 residential living units in residential buildings, as defined in the warrant purchase agreement, become paying subscribers to the Company’s internet service, whereby 87,437 warrants vest. The estimated grant date fair value of thesenon-voting
common stock warrants of $0.04 per share was recognized atF-25
the issuance date (aggregate fair value of $31). During the year ended December 31, 2020, the performance requirements were met related to an additional 2,000 living units and accordingly, an incremental additional 87,437 warrants vested. In October 2021, the remaining unvested warrants were accelerated and vested in full and immediately exercised. The vesting of such warrants was considered probable both at issuance and at the acceleration date. As a result, no incremental share-based compensation expense was recognized with respect to the 2021 vesting.
In September 2017, the Company issued warrants to purchase 92,039 shares
of non-voting common
stock at an exercise price of $0.92 per share (the “2017 Warrants”).These non-voting common
stock warrants expire in September 2027. The estimated grant date fair value ofthese non-voting common
stock warrants was $0.34 per share at issuance date (aggregate fair value of $31), which approximated the estimated fair value of a share of the Company’s common stock on the respective dates of issuance. The fair value of the Company’s common stock is based on certain factors as further discussed in Note 6.The 2019, 2018 and 2017 Warrants were assessed under ASC 480 and ASC 815 upon each respective issuance and were determined to meet the requirements for equity classification. Accordingly, the Company recorded the grant date fair value for the 2018 Warrants and the allocated fair value for the 2019 Warrants (see Note 4) of each
respective non-voting common
stock warrant to additional paid in capital upon their issuance dates.As of December 31, 2021, the following warrants to
issue non-voting common
shares of the Company remain outstanding:Original issuance date | Expiration date | Exercise price | Warrants issued | Warrants currently exercisable | ||||||||||||
September 2017 | September 2027 | $ | 0.92 | 92,039 | 92,039 | |||||||||||
February 2019 | February 2029 | $ | 0.01 | 2,765,887 | 2,765,887 | |||||||||||
December 2019 | December 2029 | $ | 0.01 | 3,244,510 | 3,244,510 | |||||||||||
October 2021 | October 2031 | $ | 0.05 | 2,118,687 | 529,672 | |||||||||||
| 8,221,123 | 6,632,108 | |||||||||||||||
Note 6. Share-based compensation expense
In December 2014, the Board of directors and stockholders approved the Starry, Inc. 2014 Stock Option and Grant Plan, which was subsequently amended and restated in November 2016. The Amended and Restated 2014 Stock Option and Grant Plan was amended further in December 2017, March 2019 and March 2021 (as amended, the “2014 Plan”), allowing the Company to grant up to 10,813,498 shares of the
Company’s non-voting common
shares. The 2014 Plan permits the granting of various awards including stock options (including both nonqualified options and incentive options) and restricted stock awards to employees, officers, directorsand non-employee consultants
of the Company. An aggregate of 2,201,635non-voting common
shares were available to issue under the 2014 Plan as of December 31, 2021.The 2014 Plan is administered by the Board. The selection of participants, allotment of shares, determination of price and other conditions are determined by the Board at its sole discretion in order to attract and retain personnel instrumental to the success of the Company. As of December 31, 2021 and 2020, only stock options and restricted stock awards have been granted to employees, directors, consultants and advisors.
Under the 2014 Plan, the option exercise price for all grantees equals the stock’s estimated fair value on the date of the grant. The Board determined the fair value of common stock at the time of grant by considering a number of objective and subjective factors, including independent third-party valuations of the Company’s common stock, operating and financial performance, the lack of liquidity of capital stock and general and industry-specific economic outlook, amongst other factors. The Company believes the fair value of stock options granted to nonemployees is more readily determinable than the fair value of services rendered.
F-26
The fair value of the underlying common stock will be determined by the Company’s Board until such time the Company’s common stock is listed on an established exchange or national market system.
The fair value of each option is estimated on the date of the grant using the Black-Scholes option-pricing model in order to measure the compensation cost associated with the award. This model incorporates certain assumptions for inputs including an expected volatility in the market value of the underlying common stock, expected term, a risk-free interest rate and the expected dividend yield of the underlying common stock.
The following assumptions were used for options issued during the years ended December 31, 2021 and 2020:
December 31, | ||||
2021 | 2020 | |||
Expected volatility | 27.8% - 28.2% | 24.0% - 28.1% | ||
Expected term (in years) | 5.4 - 6.1 | 5.0 - 6.1 | ||
Risk-free interest rate | 0.8% - 1.1% | 0.4% - 1.7% | ||
Expected dividend yield | $0.00 | $0.00 | ||
| • | Expected volatility: |
| • | Expected term: Share-Based Payment |
| • | Risk-free interest rate: |
| • | Expected dividend yield: |
Employee and nonemployee stock options generally vest over four years, with a maximum term of ten years from the date of grant. The awards become available to the recipient upon the satisfaction of a vesting condition based upon either a period of service or the achievement of a milestone, either of which may be accelerated at the discretion of the Board. Share-based compensation expense is recognized on a straight-line basis over the applicable vesting period.
Stock options:
Options | Shares | Weighted Average Exercise Price | Weighted Average Remaining Contractual Term | Aggregate Intrinsic Value | ||||||||||||
Outstanding at January 1, 2021 | 8,089,996 | $ | 1.79 | 7.3 | $ | 11,053 | ||||||||||
Expired | (66,616 | ) | 2.39 | |||||||||||||
Granted | 1,295,362 | 7.23 | ||||||||||||||
Exercised | (600,943 | ) | 1.25 | |||||||||||||
Cancelled or forfeited | (660,714 | ) | 3.15 | |||||||||||||
Outstanding at December 31, 2021 | 8,057,085 | $ | 2.55 | 6.5 | $ | 58,469 | ||||||||||
Exercisable at January 1, 2021 | 4,614,863 | $ | 1.14 | 6.2 | $ | 9,371 | ||||||||||
Exercisable at December 31, 2021 | 5,262,716 | $ | 1.47 | 5.4 | $ | 44,060 | ||||||||||
F-27
There were no options with an exercise price greater than the market price on December 31, 2021 to exclude from the intrinsic value computation. The intrinsic value of stock options exercised during the years ended December 31, 2021 and 2020 was $3,174 and $618, respectively, as determined on the date of exercise. There were 0 stock options awarded
to non-employees during
the years ended December 31, 2021.Share-based compensation expense for the years ended December 31, 2021 and 2020 were $1,310 and $960, respectively, and is included within research and development as well as selling, general and administrative expense on the accompanying consolidated statements of operations. As of December 31, 2021, there was approximately $3,236 of unrecognized compensation cost related to unvested stock options which is expected to be recognized over a weighted-average period of 2.4 years.
RSUs:
Note 7. Property and equipment
Property and equipment consisted of the following at December 31, 2021 and 2020:
December 31, | ||||||||
2021 | 2020 | |||||||
Distribution system | $ | 142,202 | $ | 91,719 | ||||
Asset retirement obligation | 2,015 | 1,232 | ||||||
Construction in progress | 28,493 | 12,496 | ||||||
Equipment | 6,051 | 4,814 | ||||||
Vehicles | 3,943 | 2,875 | ||||||
Site acquisition costs | 3,155 | 2,547 | ||||||
Furniture and fixtures | 1,267 | 1,163 | ||||||
Software | 1,452 | 626 | ||||||
Leasehold improvements | 691 | 596 | ||||||
| 189,269 | 118,068 | |||||||
Less: accumulated depreciation | (60,250 | ) | (31,410 | ) | ||||
Property and equipment, net | $ | 129,019 | $ | 86,658 | ||||
Depreciation expense for the years ended December 31, 2021 and 2020 totaled approximately $29,463 and $19,350 respectively, and is included within cost of revenues, selling, general and administrative, and research and development expense on the accompanying consolidated statements of operations. The Company reported $26,372 and $16,676, in 2021 and 2020, respectively, of depreciation related to the deployed assets which comprise its distribution system.
F-28
Note 8. Asset retirement obligations
The following table summarizes changes in the Company’s asset retirement obligations for the years ended December 31, 2021 and 2020:
Balance, January 1, 2020 | $ | 703 | ||
New asset retirement obligations | 582 | |||
Accretion expense | 114 | |||
Balance, December 31, 2020 | 1,399 | |||
New asset retirement obligations | 783 | |||
Accretion expense | 205 | |||
Balance, December 31, 2021 | $ | 2,387 | ||
Accretion expense associated with asset retirement obligations is included within selling, general and administrative expenses on the accompanying consolidated statements of operations.
Note 9. Prepaid expenses and other current assets
Prepaid expenses and other current assets consisted of the following at December 31, 2021 and 2020:
December 31, | ||||||||
2021 | 2020 | |||||||
Receivable from 2021 Strategic Partner Arrangement (see Note 12) | $ | 219 | $ | 259 | ||||
Prepaid inventory | 3,821 | 143 | ||||||
Prepaid software | 797 | 553 | ||||||
Contract Manufacturer | 674 | 565 | ||||||
Prepaid rent | 709 | — | ||||||
Other | 859 | 320 | ||||||
Total | $ | 7,079 | $ | 1,840 | ||||
Note 10. Accrued expenses and other current liabilities
Accrued expenses and other current liabilities consisted of the following at December 31, 2021 and 2020:
December 31, 2021 | December 31, 2020 | |||||||
Accrued compensation and benefits | $ | 4,773 | $ | 3,633 | ||||
Accrued sales and use tax | 5,860 | 3,327 | ||||||
Accrued purchases of property and equipment | 3,339 | 2,257 | ||||||
Accrued transaction costs | 3,693 | — | ||||||
Other | 5,512 | 3,856 | ||||||
Total | $ | 23,177 | $ | 13,073 | ||||
F-29
Note 11. Income taxes
For the years ended December 31, 2021 and 2020, the Company did not record a tax provision or benefit due to current and historical losses incurred by the Company. The Company’s losses before income taxes consist primarily of losses from domestic operations.
The significant components of the Company’s deferred taxes as of December 31, 2021 and 2020 are as follows:
2021 | 2020 | |||||||
Deferred tax assets: | ||||||||
Federal and state net operating loss carryforwards | $ | 134,609 | $ | 86,964 | ||||
Research and development tax credits | 6,531 | 5,269 | ||||||
Debt | 2,884 | — | ||||||
Capitalized research and development costs | 1,588 | 1,911 | ||||||
Payroll tax deferral | 337 | 655 | ||||||
Reserves and accruals | 705 | 354 | ||||||
Other | 104 | 108 | ||||||
Total deferred tax assets | 146,758 | 95,261 | ||||||
Deferred tax liabilities: | ||||||||
Fixed Assets - Depreciation | (3,743 | ) | (1,815 | ) | ||||
Other | (224 | ) | (622 | ) | ||||
Total deferred tax liabilities | (3,967 | ) | (2,437 | ) | ||||
Valuation allowance | (142,791 | ) | (92,824 | ) | ||||
Net deferred tax assets | $ | — | $ | — | ||||
The Company has evaluated the positive and negative evidence bearing upon its ability to realize the deferred tax assets. Management has considered the Company’s history of cumulative net losses incurred since inception and has concluded that it is more likely than not that the Company will not realize the benefits of the Company’s deferred tax assets. As a result, a full valuation allowance of $142,791 and $92,824, respectively, has been established against the deferred tax assets for both years. Management reevaluates the positive and negative evidence at each reporting period. The valuation allowance increased by $49,967 during the year ended December 31, 2021 primarily as a result of increases in the Company’s net operating losses.
The Company has federal net operating loss carryforwards of approximately $485,122 of which $49,477 will begin to expire in 2034 and $435,645 can be carried forward indefinitely. The Company also has state net operating loss carryforwards of approximately $488,824, which will begin to expire in 2034. The Company also has federal and state research and development tax credit carryforwards of $4,326 and $2,792, respectively, which begin to expire in 2034 and 2029, respectively.
A reconciliation of the income tax expense computed using the federal statutory income tax rate to the Company’s effective income tax rate is as follows:
Years Ended December 31, | ||||||||
2021 | 2020 | |||||||
Federal statutory rate of 21% | 21.0 | % | 21.0 | % | ||||
State taxes | 9.0 | 6.8 | ||||||
Research & development credits | 0.5 | 1.0 | ||||||
Other | (0.5 | ) | (1.0 | ) | ||||
Change in valuation allowance | (30.0 | ) | (27.8 | ) | ||||
Effective tax rate | 0.0 | % | 0.0 | % | ||||
F-30
The Company files a U.S. federal income tax return and various state returns. All tax years since inception remain open to examination by the major taxing jurisdictions to which the Company is subject, as carryforward attributes generated in years past may still be adjusted upon examination by the Internal Revenue Service (IRS) or other authorities if they have or will be used in a future period. The Company is not currently under examination by the IRS or any other jurisdictions for any tax years.
The Company’s ability to utilize a portion of its net operating loss and research and development carryforwards is subject to certain limitations under section 382 and 383 of the Internal Revenue Code of 1986, as amended and corresponding provision of state law, due to ownership change that have occurred previously or that could occur in the future. These ownership changes may limit the amount of net operating loss and research and development credit carryforwards that can be utilized annually to offset future taxable income and tax liabilities, respectively. The Company has not completed a study to assess whether a change of ownership has occurred, or whether there have been multiple ownership changes since its formation. Any limitation may result in expiration of a portion of the net operating loss carryforwards or research and development credit carryforward before utilization. Further, until a study is completed by the Company and any limitation is known, no amounts are being presented as an uncertain tax position.
As of December 31, 2021 and 2020, the Company has not identified any uncertain tax positions for which reserves would be required. The Company will recognize interest and penalties, if any, related to uncertain tax positions in income tax expense. As of December 31, 2021, no interest or penalties have been accrued. In response to
the COVID-19 pandemic,
the Coronavirus Aid, Relief and Economic Security Act (“CARES Act”), was signed into law in the United States in March 2020. The CARES Act adjusted a number of provisions of the tax code, including the calculation and eligibility of certain deductions and the treatment of net operating losses and tax credits. The enactment of the CARES Act did not result in any material adjustments to the Company’s income tax provision for the year ended December 31, 2021, or to the Company’s net deferred tax assets as of December 31, 2021.Note 12. Commitments and contingencies
2020 Strategic Partner Arrangement:
As of December 31, 2021, the financing obligation was $5,227, of which $525 and $4,702 was included in the current and
non-current
portion of debt, respectively, on the consolidated balance sheet. As of December 31, 2021, $219 of reimbursable expenses is owed by the third party and is included in prepaid expenses and other current assets on the consolidated balance sheet.Operating leases:
various non-cancelable agreements.
Future minimum rentalF-31
commitments for operating leases
with non-cancelable terms
of one year or more at December 31, 2021, are as follows:2022 | $ | 12,546 | ||
2023 | 10,619 | |||
2024 | 6,784 | |||
2025 | 4,338 | |||
2026 | 2,574 | |||
Thereafter | 1,521 | |||
| $ | 38,382 | |||
Total rent expense for the years ended December 31, 2021 and 2020 were $13,583 and $8,011, respectively.
Purchase Commitments:
into non-cancelable purchase
commitments with various contract manufacturers during the year ended December 31, 2021 to purchase items to be installed in the Company’s distribution system. As of December 31, 2021, these purchase commitments totaled $33,351.Advance deposit payments:
Legal Proceedings:
Letter of intent for Agreement and Planned Merger:
Note 13. Net loss per share
The following table sets forth the computation of the basic and diluted net loss per share:
December 31, | ||||||||
2021 | 2020 | |||||||
| Numerator: | ||||||||
Net loss attributable to common stockholder | $ | (166,545 | ) | $ | (125,093 | ) | ||
| Denominator: | ||||||||
Weighted average shares outstanding, basic and diluted | 36,569,966 | 35,743,961 | ||||||
| Basic and diluted earnings per share: | ||||||||
Voting common stock | $ | (4.55 | ) | $ | (3.50 | ) | ||
Non-voting common stock | $ | (4.55 | ) | $ | (3.50 | ) | ||
The Company’s potential dilutive securities, which include stock options, convertible preferred stock and vested warrants, have been excluded from the computation of diluted net loss per share as the effect would be to reduce the net loss per share. Therefore, the weighted average number of common shares outstanding used to calculate both basic and diluted net loss per share is the same.
F-32
The Company issued warrants that were contingently exercisable into shares
of non-voting common
stock upon meeting certain performance conditions or the occurrence of certain specified future events. The unvested warrants were not included in the computation of dilutive net loss per share for the periods presented as none of the performance conditions or certain specified future events had been satisfied as of December 31, 2021 or 2020. However, had the contingencies been satisfied as of December 31, 2021 or 2020, the warrants would have been excluded from the computation of diluted net loss per share as the effect would be to reduce the net loss per share.The Company issued convertible notes payable during 2020 that were contingently convertible into shares
of non-voting common
stock upon the occurrence of certain specified future events. The Company’s contingently convertible notes payable did not meet the condition to be converted to common stock as of December 31, 2020 and therefore were not included in the computation of dilutive net loss per share for the year ended December 31, 2020. However, had the contingency been satisfied as of December 31, 2020, the notes would have been excluded from the computation of diluted net loss per share as the effect would be to reduce the net loss per share.The number of shares underlying the Company’s outstanding stock options, redeemable, convertible preferred stock and warrants are summarized and disclose in Note 5.
Note 14. Supplemental cash flow information
The following tables provides a reconciliation of cash, cash equivalents and restricted cash reported in the balance sheets as of December 31, 2021 and 2020:
Years Ended December 31, | ||||||||
2021 | 2020 | |||||||
Cash and cash equivalents | $ | 29,384 | $ | 25,594 | ||||
Restricted cash | — | 110 | ||||||
Restricted cash included in restricted cash and other assets | 1,378 | 1,127 | ||||||
Total cash, cash equivalents and restricted cash shown in the consolidated statement of cash flows | $ | 30,762 | $ | 26,831 | ||||
The following table provides supplemental cash flow information for the years ended December 31, 2021 and 2020:
Years Ended December 31, | ||||||||
2021 | 2020 | |||||||
Cash paid for interest | $ | 132 | $ | 136 | ||||
Cash paid for taxes | $ | — | $ | — | ||||
The following table provides supplemental disclosures of noncash investing and financing activities for the years ended December 31, 2021 and 2020:
Years Ended December 31, | ||||||||
2021 | 2020 | |||||||
Purchases of property and equipment included within accounts payable and accrued expenses and other current liabilities | $ | 10,991 | $ | 8,036 | ||||
Unpaid deferred transaction costs included within accounts payable and accrued expenses | $ | 4,250 | $ | — | ||||
Property and equipment acquired through capital lease obligations | $ | 1,399 | $ | 424 | ||||
Asset retirement obligations associated with deployed equipment | $ | 783 | $ | 582 | ||||
Conversion of convertible notes to Series E Preferred Stock | $ | 45,584 | $ | — | ||||
F-33
Note 15. Retirement plan
The Company makes available a 401(k) defined contribution savings plan (the “401(k) Plan”) for its employees. The 401(k) Plan covers substantially all employees who meet minimum age and service requirements and allows participants to defer a portion of their annual compensation on a pretax basis, subject to legal limitations. Under such a plan, employees may make voluntary contributions. For the years ended December 31, 2021 and 2020, there was no employer matching contribution made to the 401(k) Plan.
Note 16. Subsequent events
The Company evaluated all events or transactions that occurred after December 31, 2021 through June 3, 2022, the date the consolidated financial statements were available to be issued.
Fifth Amendment Delayed Draw
On January 11, 2022, the Company received proceeds of $10,000 in connection with the Delayed Draw Tranche C Loan. In conjunction with the Delayed Draw Tranche C Loan, the Company issued the Delayed Draw Tranche C Warrants to the lenders to purchase 533,275 shares of Nonvoting Starry Common Stock.
Merger Agreement Waiver
Pursuant to the terms of the merger agreement, the Business Combination was subject to the satisfaction or waiver of certain customary closing conditions. At the time of the execution of the merger agreement, such closing conditions included, among others, that the amount equal to, as of immediately prior to the effective time of the Acquisition Merger (the “Acquisition Merger Effective Time”): (A) the funds contained in FirstMark’s trust account; plus (B) all other Cash and Cash Equivalents (as defined in the merger agreement) of New Starry; minus (C) the aggregate amount of cash proceeds required to satisfy the redemption of any shares of FirstMark’s Class A common stock pursuant to the redemption offer (to the extent not already paid as of immediately prior to the Acquisition Merger Effective Time); plus (D) the PIPE Investment actually received by FirstMark or Holdings at or prior to the closing of the Acquisition Merger (the “Acquisition Merger Closing”); plus (E) net cash proceeds actually received by Starry in consideration for the issuance of Additional Funding Shares (as defined in the merger agreement) (including pursuant to the Series Z Subscription Agreements) prior to the Acquisition Merger Closing shall be at least $300.0 million (the “Minimum Cash Condition”). At the time of the execution of the merger agreement, the closing of the PIPE Investment and the Series Z Investment was also subject to the satisfaction or waiver of the closing of the offering of the Convertible Notes. Further, the merger agreement provided that Starry will use reasonable best efforts to deliver payoff letters and related documentation with respect to certain of its indebtedness at least two business days prior to the closing date of the Acquisition Merger. In addition, the terms of the merger agreement provide that, unless otherwise approved by Starry, FirstMark shall not permit any amendment or modification to be made to, any waiver of, or provide consent to modify, any provision or remedy under any Subscription Agreements. On March 28, 2022, the parties to the merger agreement entered into a Merger Agreement Waiver (the “Merger Agreement Waiver”), pursuant to which they have agreed to waive such closing conditions. As a result of the Minimum Cash Condition 0t being met, the Convertible Notes (see Note 1) were not issued upon consummation of the Business Combination.
FirstMark Redemptions
Public shareholders redeemed 37,775,801 of FirstMark Class A Common Stock for an aggregate payment of $377,787, resulting in the Company receiving proceeds of $36,245 upon the consummation of the Business Combination on March 29, 2022.
PIPE Subscription Agreement
On March 25, 2022, the PIPE Subscription Agreement was amended such that the aggregate number of New Starry Class A Common Stock to be sold was increased from 10,900,000 to 14,533,334 New Starry Class A Common Stock and the purchase price per share was decreased from $10.00 to $7.50 per share.
On March 29, 2022, the PIPE investors purchased an aggregate of 14,533,334 shares of New Starry Class A Common Stock at $7.50 per share, resulting in aggregate proceeds of $109,000 in the PIPE investment.
Series Z Subscription Agreement
On March 25, 2022, the Series Z Subscription Agreement was amended such that the aggregate number of Series Z Preferred Stock to be sold was increased from 2,100,000 to 2,800,000 Series Z Preferred Stock and the purchase price per share was decreased from $10.00 to $7.50 per share.
In addition, on March 25, 2022, Starry and Tiger Global Private Investment Partners IX, LP (“Tiger”) entered into an additional Series Z Subscription Agreement (the “Tiger Series Z Subscription Agreement”) pursuant to which Tiger agreed to subscribe for 1,333,333 shares of Series Z Preferred Stock at a purchase price per share of $7.50 for a purchase price equal to approximately $10.0 million.
On March 29, 2022, the Series Z Investors purchased an aggregate of 4,133,333 shares of Starry Series Z Preferred Stock at $7.50 per share, resulting in aggregate proceeds of $31,000.
Seventh Amendment to Credit Agreement
On March 26, 2022, the Company entered into a Seventh Amendment to the Credit Agreement. The Seventh Amendment to the Credit Agreement amended and restated an affirmative covenant requiring the Company to provide annual audited financial statements without a “going concern” or like qualification, exception or emphasis. In addition, the Seventh Amendment to the Credit Agreement redefined the term “Change in Control” to exclude the aforementioned Business Combination with respect to contemplating the prepayment penalty. As a result of such amendments, the Company was in compliance with all bank covenants as of December 31, 2021. Without such amendments the Company would have been in default and the outstanding long-term debt balance would be payable upon demand. The lender has retained all other covenant requirements.
Tranche C Warrants
As the Business Combination occurred prior to April 15, 2022, approximately 75% of the Tranche C warrants, or 1,988,971 million warrants, were no longer subject to vest or become exercisable. See Warrants for non-voting common stock within Note 5.
Redeemable Shares
On March 31, 2022, the Company entered into an agreement with certain debt holders who are also shareholders (the “Optionholders”) of 1,209,029 shares of Class A common stock (the “Shares”) that grants and conveys to the Optionholders the option, in their sole discretion, to participate in a refinancing in full (the “Refinancing”) of the outstanding Term Loans, by providing new senior secured term loans and/or notes (including convertible notes), in each case on a first lien and/or junior lien basis as agreed upon by the parties (and such term loans and/or notes, the “New Debt”), to the Company and/or any of its subsidiaries as the borrower(s) in respect of such refinancing indebtedness. For the avoidance of doubt, nothing in the agreement requires the Company to enter into any Refinancing.
Prior to the consummation of any Refinancing, the Optionholders have the option, in their sole discretion, to exchange all or any portion of such Shares at an agreed value of $8.75 (as appropriately adjusted for any stock split, stock dividend, recapitalization or similar transaction affecting such shares) per share (for the avoidance of doubt, irrespective of the price of which the Class A common stock is trading on the New York Stock Exchange) for an equal principal amount of unsubordinated unsecured term loans or notes under a new debt facility (the “Junior Debt”) and not, for the avoidance of doubt, issued or incurred under the Starry Credit Agreement (the “Junior Debt Exchange”). Any Junior Debt shall mature on the earliest of the maturity date of the Starry Credit Agreement, the acceleration of the Term Loans in accordance with the Starry Credit Agreement, or the consummation of a Refinancing, and shall bear interest at a rate equal to Term Secured Overnight Financing Rate (“SOFR”) plus 1.00%. The aggregate principal amount of Junior Debt shall not exceed $15,000 and Starry, Inc. will be the borrower.
In connection with any Refinancing subsequent to the incurrence or issuance of any Junior Debt, the Company grants and conveys to each Optionholder the irrevocable option, in such Optionholder’s sole discretion, to exchange all or any portion of the principal amount of its Junior Debt on a dollar-for-dollar basis for an equal principal amount of New Debt.
F-34
Starry Group Holdings, Inc.
Unaudited Condensed Consolidated Balance Sheets
(Dollar amounts in thousands, except share and per share data)
March 31, 2022 | December 31, 2021 | |||||||
Assets | ||||||||
Current assets: | ||||||||
Cash and cash equivalents | $ | 166,693 | $ | 29,384 | ||||
Accounts receivable, net | 395 | 380 | ||||||
Deferred costs | — | 7,049 | ||||||
Prepaid expenses and other current assets | 6,358 | 7,079 | ||||||
Total current assets | 173,446 | 43,892 | ||||||
Property and equipment, net | 136,756 | 129,019 | ||||||
Intangible assets | 48,463 | 48,463 | ||||||
Restricted cash and other assets | 2,141 | 1,860 | ||||||
Total assets | $ | 360,806 | $ | 223,234 | ||||
Liabilities, redeemable shares and stockholders’ equity (deficit) | ||||||||
Current liabilities: | ||||||||
Accounts payable | $ | 7,401 | $ | 6,832 | ||||
Unearned revenue | 1,633 | 1,630 | ||||||
Current portion of debt | 1,498 | 1,504 | ||||||
Accrued expenses and other current liabilities | 30,099 | 23,177 | ||||||
Total current liabilities | 40,631 | 33,143 | ||||||
Debt, net of current portion | 211,306 | 191,596 | ||||||
Earnout liabilities | 20,881 | — | ||||||
Warrant liabilities | 18,175 | 14,773 | ||||||
Asset retirement obligations | 2,621 | 2,387 | ||||||
Other liabilities | 15,454 | 12,412 | ||||||
Total liabilities | 309,068 | 254,311 | ||||||
Commitments and contingencies (Note 12) | 0 | 0 | ||||||
Redeemable shares (Note 15) | 10,579 | — | ||||||
Stockholders’ equity (deficit): | ||||||||
Convertible Preferred stock (Note 5) | — | 453,184 | ||||||
Old Starry common stock; $0.001 par value; 0 and 150,024,203 shares authorized and 0 and 37,178,873 issued and outstanding at March 31, 2022 and December 31, 2021, respectively | — | 4 | ||||||
Class A common stock; $0.0001 par value; 800,000,000 shares authorized; 152,926,661 and 0 issued and outstanding at March 31, 2022 and December 31, 2021, respectively | 16 | — | ||||||
Class X common stock; $0.0001 par value; 50,000,000 shares authorized; 9,268,335 and 0 issued and outstanding at March 31, 2022 and December 31, 2021, respectively | 1 | — | ||||||
Additional paid-in capital | 596,146 | 17,106 | ||||||
Accumulated deficit | (555,004 | ) | (501,371 | ) | ||||
Total stockholders’ equity (deficit) | 41,159 | (31,077 | ) | |||||
Total liabilities, redeemable shares and stockholders’ equity (deficit) | $ | 360,806 | $ | 223,234 | ||||
The accompanying notes are an integral part of these consolidated financial statements
F-
35
Starry Group Holdings, Inc.
Unaudited Condensed Consolidated Statements of Operations
(Dollar amounts in thousands, except share and per share data)
Three Months Ended March 31, | ||||||||
2022 | 2021 | |||||||
Revenues | $ | 7,370 | $ | 4,523 | ||||
Cost of revenues | (18,191 | ) | (12,504 | ) | ||||
Gross loss | (10,821 | ) | (7,981 | ) | ||||
Operating expenses: | ||||||||
Selling, general and administrative | (25,090 | ) | (14,210 | ) | ||||
Research and development | (8,227 | ) | (5,942 | ) | ||||
Total operating expenses | (33,317 | ) | (20,152 | ) | ||||
Loss from operations | (44,138 | ) | (28,133 | ) | ||||
Other income (expense): | ||||||||
Interest expense | (7,530 | ) | (7,655 | ) | ||||
Other income (expense), net | (1,965 | ) | (5,258 | ) | ||||
Total other expense | (9,495 | ) | (12,913 | ) | ||||
Net loss | $ | (53,633 | ) | $ | (41,046 | ) | ||
Net loss per share of common stock, basic and diluted (Note 13) | $ | (1.29 | ) | $ | (1.13 | ) | ||
Weighted-average shares outstanding, basic and diluted | 41,633,152 | 36,239,733 | ||||||
The accompanying notes are an integral part of these consolidated financial statements
F-
36
Starry Group Holdings, Inc.
Unaudited Condensed Consolidated Statements of Stockholders’ Equity (Deficit) and Temporary Equity
(Dollar amounts in thousands, except share data)
Convertible Preferred Stock | Class A Common Stock | Class X Common Stock | Additional | Accumulated | Stockholders’ | Temporary Equity | ||||||||||||||||||||||||||||||||||
Shares | Par Value | Shares | Par Value | Shares | Par Value | Paid-In Capital | Deficit | Equity (Deficit) | Redeemable Shares | |||||||||||||||||||||||||||||||
Balance at December 31, 2021 | 497,770,570 | $ | 453,184 | 201,972,619 | $ | 14 | — | $ | — | $ | 17,096 | $ | (501,371 | ) | $ | (31,077 | ) | $ | — | |||||||||||||||||||||
Retroactive application of Business Combination (see Note 1) | (406,141,573 | ) | — | (164,793,746 | ) | (10 | ) | — | — | 10 | — | — | — | |||||||||||||||||||||||||||
Adjusted balance, beginning of period | 91,628,997 | $ | 453,184 | 37,178,873 | $ | 4 | — | $ | — | $ | 17,106 | $ | (501,371 | ) | $ | (31,077 | ) | $ | — | |||||||||||||||||||||
Conversion of legacy common stock to Class X common stock in connection with the Business Combination | — | — | (9,268,335 | ) | (1 | ) | 9,268,335 | 1 | — | — | $ | — | — | |||||||||||||||||||||||||||
Issuance of Series Z convertible preferred stock in connection with the Business Combination | 4,133,333 | 31,000 | — | — | — | — | — | — | $ | 31,000 | — | |||||||||||||||||||||||||||||
Conversion of convertible preferred stock into common stock in connection with the Business Combination | (95,762,330 | ) | (484,184 | ) | 95,762,330 | 10 | — | — | 484,174 | — | $ | — | — | |||||||||||||||||||||||||||
Issuance of common stock upon exercise of warrants in connection with the Business Combination | — | — | 6,758,512 | 1 | — | — | 12,548 | — | $ | 12,549 | — | |||||||||||||||||||||||||||||
Business Combination transaction, net of transaction costs and assumed liabilities | — | — | 22,132,385 | 2 | — | — | 110,930 | — | $ | 110,932 | — | |||||||||||||||||||||||||||||
Sponsor Earnout Shares liability (see Note 9) | — | — | — | — | — | — | (26,095 | ) | — | $ | (26,095 | ) | — | |||||||||||||||||||||||||||
Reclassification of redeemable shares from permanent equity to temporary equity (see Note 15) | — | — | — | — | — | — | (10,579 | ) | — | $ | (10,579 | ) | 10,579 | |||||||||||||||||||||||||||
Recognition of distribution to non-redeeming shareholders (see Note 5) | — | — | — | — | — | — | 3,888 | — | $ | 3,888 | — | |||||||||||||||||||||||||||||
Issuance of common upon exercise stock options | — | — | 362,896 | — | — | — | 467 | — | $ | 467 | — | |||||||||||||||||||||||||||||
Share-based compensation | — | — | — | — | — | — | 3,707 | — | $ | 3,707 | — | |||||||||||||||||||||||||||||
Net loss | — | — | — | — | — | — | — | (53,633 | ) | $ | (53,633 | ) | — | |||||||||||||||||||||||||||
Balance at March 31, 2022 | — | $ | — | 152,926,661 | $ | 16 | 9,268,335 | $ | 1 | $ | 596,146 | $ | (555,004 | ) | $ | 41,159 | $ | 10,579 | ||||||||||||||||||||||
Balance at December 31, 2020 | 395,904,883 | $ | 287,750 | 196,415,008 | $ | 9 | — | $ | — | $ | 21,384 | $ | (334,826 | ) | $ | (25,683 | ) | $ | — | |||||||||||||||||||||
Retroactive application of Business Combination (see Note 1) | (323,027,196 | ) | — | (160,259,173 | ) | (5 | ) | — | — | 5 | — | — | — | |||||||||||||||||||||||||||
Adjusted balance, beginning of period | 72,877,686 | $ | 287,750 | 36,155,835 | $ | 4 | — | $ | — | $ | 21,389 | $ | (334,826 | ) | $ | (25,683 | ) | $ | — | |||||||||||||||||||||
Recognition of beneficial conversion feature on convertible notes | — | — | — | — | — | — | — | — | $ | — | — | |||||||||||||||||||||||||||||
Issuance of common upon exercise of stock options | — | — | 172,112 | 1 | — | — | 101 | — | $ | 102 | — | |||||||||||||||||||||||||||||
Issuance of Series E convertible preferred stock, net of issuance costs of $150 | 13,148,484 | 119,850 | — | — | — | — | — | — | $ | 119,850 | — | |||||||||||||||||||||||||||||
Conversion of convertible notes payable to Series E convertible preferred stock | 5,602,827 | 45,584 | — | — | — | — | — | — | $ | 45,584 | — | |||||||||||||||||||||||||||||
Share-based compensation | — | — | — | — | — | — | 220 | — | $ | 220 | — | |||||||||||||||||||||||||||||
Net loss | — | — | — | — | — | — | — | (41,046 | ) | $ | (41,046 | ) | — | |||||||||||||||||||||||||||
Balance at March 31, 2021 | 91,628,997 | $ | 453,184 | 36,327,947 | $ | 5 | — | $ | — | $ | 21,710 | $ | (375,872 | ) | $ | 99,027 | $ | — | ||||||||||||||||||||||
The accompanying notes are an integral part of these consolidated financial statements
F-
37
Starry Group Holdings, Inc.
Unaudited Condensed Consolidated Statements of Cash Flows
(Dollar amounts in thousands, except share data)
Three Months Ended March 31, | ||||||||
2022 | 2021 | |||||||
Operating activities: | ||||||||
Net loss | $ | (53,633 | ) | $ | (41,046 | ) | ||
Adjustments to reconcile net loss to net cash used in operating activities: | ||||||||
Depreciation and amortization expense | 9,332 | 6,095 | ||||||
Paid-in-kind | 5,879 | 4,230 | ||||||
Amortization of debt discount and deferred charges | 1,626 | 2,417 | ||||||
Conversion of debt discount | — | 971 | ||||||
Loss on extinguishment of debt | — | 2,361 | ||||||
Fair value adjustment of derivative liabilities | (1,923 | ) | 2,898 | |||||
Recognition of distribution to non-redeeming shareholders | 3,888 | — | ||||||
Loss on disposal of property and equipment | 722 | 478 | ||||||
Share-based compensation | 3,707 | 220 | ||||||
Transaction costs allocated to warrants and earnout liability instruments | 314 | — | ||||||
Accretion of asset retirement obligations | 69 | 41 | ||||||
Provision for doubtful accounts | 13 | 23 | ||||||
Changes in operating assets and liabilities: | ||||||||
Accounts receivable | (29 | ) | (78 | ) | ||||
Prepaid expenses and other current assets | 742 | (475 | ) | |||||
Deferred cost | (168 | ) | (55 | ) | ||||
Other assets | (280 | ) | (9 | ) | ||||
Accounts payable | 391 | 2,729 | ||||||
Unearned revenue | 3 | 461 | ||||||
Accrued expenses and other current liabilities | 6,953 | 1,472 | ||||||
Other liabilities | 4 | — | ||||||
Net cash used in operating activities | (22,390 | ) | (17,267 | ) | ||||
Investing activities: | ||||||||
Purchases of property and equipment | (16,750 | ) | (10,016 | ) | ||||
Net cash used in investing activities | (16,750 | ) | (10,016 | ) | ||||
Financing activities: | ||||||||
Proceeds from Business Combination, net of transaction costs | 163,775 | — | ||||||
Repayment of note assumed in the Business Combination | (1,200 | ) | — | |||||
Proceeds from the issuance of convertible notes payable and beneficial conversion feature on convertible notes | — | 11,000 | ||||||
Proceeds from Strategic Partner Arrangement | 3,724 | 1,431 | ||||||
Proceeds from exercise of common stock options | 467 | 102 | ||||||
Proceeds from the issuance of Series E Preferred Stock, net of issuance costs | — | 119,850 | ||||||
Proceeds from the issuance of term loans, net of issuance costs | 10,000 | — | ||||||
Payments of third-party issuance costs in connection with Term Loans | (47 | ) | — | |||||
Repayments of capital lease obligations, net | (270 | ) | (193 | ) | ||||
Net cash provided by financing activities | 176,449 | 132,190 | ||||||
Net increase (decrease) in cash and cash equivalents and restricted cash: | 137,309 | 104,907 | ||||||
Cash and cash equivalents and restricted cash, beginning of period | 30,762 | 26,831 | ||||||
Cash and cash equivalents and restricted cash, end of period | $ | 168,071 | $ | 131,738 | ||||
The accompanying notes are an integral part of these consolidated financial statements
F-
38
Starry Group Holdings, Inc.
Notes to Unaudited Condensed Consolidated Financial Statements
(Dollar amounts in thousands, except share and per share data)
Note 1. Description of business
Starry Group Holdings, Inc. (“Starry Group” and, together with its subsidiaries, “Starry” or “the Company”) was incorporated in Delaware on September 17, 2021 as a wholly owned subsidiary of Starry, Inc. (“Old Starry”). Starry Group was formed for the purpose of effectuating the transactions contemplated by the Agreement and Plan of Merger, dated as of October 6, 2021 (as amended, the “Merger Agreement”), by and among FirstMark Horizon Acquisition Corp. (“FirstMark”), Sirius Merger Sub, Inc., a Delaware corporation and wholly owned subsidiary of FirstMark (“Merger Sub”), Old Starry and Starry Group.
The Company is in the telecommunications industry and invests in the future of fixed wireless technology. The Company delivers high-quality and affordable broadband access using innovative, proprietary wideband hybrid fiber wireless technology. Active phased arrays are used to amplify wireless signals and optimize service from multiple antennas deployed throughout a region. By using a fixed wireless network, reliance on municipal infrastructure is reduced, extensive installation times are bypassed, and network deployment is increased in comparison to its fiber competitors. Services are provided to customers in Boston, Los Angeles, New York City, Denver, Washington, D.C. and Columbus.
Business Combination
Merger Agreement Waiver
On March 28, 2022, the parties to the Merger Agreement entered into a Merger Agreement Waiver (the “Merger Agreement Waiver”), pursuant to which they agreed to waive certain closing conditions. Subsequent to waiving such closing conditions, the business combination was effected in two steps:
(a) on March 28, 2022 (the “SPAC Merger Effective Time”), FirstMark merged with and into Starry Group (the “SPAC Merger”), with Starry Group surviving the SPAC Merger as a publicly traded entity and sole owner of Merger Sub; and
(b) on March 29, 2022 (the “Acquisition Merger Effective Date”), Merger Sub merged with and into Old Starry (the “Acquisition Merger”, and, together with the SPAC Merger and all other transactions contemplated by the Merger Agreement, the “Business Combination”), with Old Starry surviving the Acquisition Merger as a wholly owned subsidiary of Starry Group.
Upon consummation of the Business Combination on March 29, 2022, the Company received gross proceeds of $36,282 (consisting of $37 of cash held by FirstMark and $36,245 from the trust account). In addition, 4,921,551 shares of FirstMark common stock held by public stockholders converted to Class A common stock on abasis. The Company also issued common stock warrants in exchange of FirstMark public and private warrants (see Note 9).
1-for-1
The Business Combination was accounted for as a reverse recapitalization in accordance with U.S. GAAP. This determination is primarily based on Old Starry stockholders comprising a relative majority of the voting power of Starry and board composition, Old Starry operations prior to the Business Combination comprising the only ongoing operations of Starry, and Old Starry senior management comprising a majority of the senior management of Starry. Under this method of accounting, FirstMark was treated as the “acquired” company for financial reporting purposes. Accordingly, the financial statements of Starry represent a continuation of the financial statements of Old Starry with the Business Combination being treated as the equivalent of Starry issuing stock for the net assets of FirstMark, accompanied by a recapitalization. The net assets of FirstMark are stated at historical costs, with no goodwill or other intangible assets recorded. Operations prior to the Business Combination are presented as those of Starry. Share information for all periods prior to the Business Combination has been retroactively adjusted using the exchange ratio for the equivalent number of shares outstanding immediately after the Business Combination to effect the reverse recapitalization.
PIPE Subscription Agreements
On March 29, 2022, the PIPE investors purchased an aggregate of 14,533,334 shares of Class A common stock at $7.50 per share, resulting in aggregate proceeds of $109,000 in the PIPE Investment.
Series Z Subscription Agreements
On March 29, 2022, the Series Z investors purchased an aggregate of 4,133,333 shares of Starry Series Z Preferred Stock at $7.50 per share, resulting in aggregate proceeds of $31,000.
F-
39
Recapitalization
On the closing date of the Acquisition Merger and immediately prior to the effective time of the Acquisition Merger, (a) each then-outstanding share of Starry Preferred Stock (excluding the Series Z Preferred Stock, par value $0.001 per share of Starry (“Starry Series Z Preferred Stock”) automatically converted into a number of shares of Old Starry common stock, par value $0.001 per share, on abasis; and (b) each then-outstanding and unexercised warrant of Starry (the “Starry Warrants” - see Note 9) were automatically exercised in exchange for shares of Old Starry common stock (collectively, the “Conversion”).
1-for-1
At the effective time of the Acquisition Merger, pursuant to the Acquisition Merger: (a) each then-outstanding share of Old Starry common stock, including shares of Old Starry common stock resulting from the Conversion, were canceled and automatically converted into (i) with respect to the Company’s Chief Executive Officer and founder, 9,268,335 shares of Class X common stock, par value $0.0001 per share and (ii) with respect to any other persons who hold Old Starry common stock, the number of shares of Class A common stock, par value $0.0001 per share, equal to the exchange ratio of 0.1841; (b) each share of Series Z Preferred Stock automatically converted into Class A common stock on abasis (c) each outstanding and unexercised option to acquire shares of Old Starry common stock (an “Old Starry Option”) was converted into an option to acquire shares of Class A common stock (a “Starry Option”), on the same terms and conditions as were applicable to such Old Starry Option, based on the 0.1841 exchange ratio; and (d) each outstanding award of restricted stock units of Old Starry (an “Old Starry RSU Award”) was converted into an award covering shares of Class A common stock (a “Starry RSU Award”), on the same terms and conditions as were applicable to such Old Starry RSU Award, based on the 0.1841 exchange ratio.
one-to-one
The following summarizes the shares of Class A common stock and Class X common stock issued and outstanding immediately after the Business Combination as of March 29, 2022:
Starry equity holders (1) | 140,062,611 | 86 | % | |||||
FirstMark founder shares (2) (3) | 2,677,500 | 2 | % | |||||
FirstMark public stockholders (3) | 4,921,551 | 3 | % | |||||
PIPE Investors (3) | 14,533,334 | 9 | % | |||||
Starry common stock immediately after Merger | 162,194,996 | 100 | % | |||||
| (1) | Excludes 45,918,159 shares of Class A common stock underlying outstanding stock options and restricted stock units. |
| (2) | Excludes 4,128,113 Earnout Shares subject to forfeiture if certain performance-based vesting conditions are not met (see Note 9). |
| (3) | The FirstMark founder shares, FirstMark public stockholders and PIPE investors are presented combined in the Condensed Consolidated Statements of Stockholders’ Equity (Deficit) on the line item “Business Combination transaction, net of transaction costs and assumed liabilities”. |
In connection with the Business Combination, the Company raised $176,282 of gross proceeds including $36,282 of cash received from FirstMark and $140,000 of cash received in connection with the PIPE financing and Series Z Preferred Stock financing.
The Company incurred $17,532 of transaction costs (net of $967 transaction costs incurred and paid by FirstMark prior to the close of the Business Combination for a total of $18,499 combined company transaction costs), consisting of banking, legal, and other professional fees, of which $17,218 was netted out of proceeds and recorded in additional
paid-in
capital (“APIC”) and the remaining $314 was allocated to warrants and earnout liability instruments. The Company also incurred $2,973 inone-time
incentive payment transaction costs and legal expenses that were recorded in selling, general and administrative expense in the condensed consolidated statements of operations for the three months ended March 31, 2022.F-4
0
In aggregate the amount recorded in APIC was $110,930 as shown below:
Cash - FirstMark trust and cash | $ | 36,282 | ||
Cash - PIPE investors (including Series Z) | 140,000 | |||
Gross proceeds | 176,282 | |||
Less: transaction costs paid during the period | (12,507 | ) | ||
Net proceeds from the Business Combination | 163,775 | |||
Less: Series Z Preferred Stock (1) | (31,000 | ) | ||
Less: warrant liabilities issued | (15,697 | ) | ||
Less: repayment of note assumed in the Business Combination | (1,200 | ) | ||
Less: net transaction costs reclassed to equity, including accrued transaction costs at March 31, 2022 | (4,711 | ) | ||
Less: issuance of non-redemption shares | (42 | ) | ||
Less: non-cash net liabilities assumed from the Business Combination | (195 | ) | ||
Business Combination, net of transaction costs and assumed liabilities on the Statement of Changes in Stockholders’ Equity | $ | 110,930 | ||
(1) | The conversion of Series Z Preferred Stock is reflected separately from the Business Combination on the Statement of Changes in Stockholders’ Equity. |
Going concern:
Presentation of Financial Statements,
Substantial doubt about an entity’s ability to continue as a going concern exists when relevant conditions and events, considered in the aggregate, indicate that it is probable that the entity will be unable to meet its obligations as they become due within one year from the financial statement issuance date.
These condensed consolidated financial statements have been prepared on a going concern basis, which contemplates the realization of assets and settlement of liabilities in the normal course of business. The Company is an early-stage growth company and has generated losses and negative cash flows from operating activities since inception. The Company requires additional capital investment to execute the strategic business plan to grow its subscriber base in existing markets from already-deployed network assets and launch services in new markets. Management plans to raise additional capital through a combination of potential options, including but not limited to, equity and debt financings.
Additional equity financing may not be available, and if it is available, it may not be on terms favorable to the Company and could be dilutive to current stockholders. Debt financing, if available, may involve restrictive covenants and dilutive financing instruments.
As of March 31, 2022, the Company was in compliance with the financial covenants required by the Starry Credit Agreement (see Note 4). However, the inherent uncertainties described above may impact the Company’s ability to remain in compliance with this covenant over the next twelve months. If the Company breaches its financial covenant and fails to secure a waiver or forbearance from the third-party lender, such breach or failure could accelerate the repayment of the outstanding borrowing under the Starry Credit Agreement or the exercise of other rights or remedies the third-party lender may have under applicable law. No assurance can be provided that a waiver or forbearance will be granted or the outstanding borrowing under the Starry Credit Agreement will be successfully refinanced on terms that are acceptable to the Company.
The Company’s ability to access capital when needed is not assured and, if capital is not available to the Company when, and in the amounts needed, the Company could be required to delay, scale back or abandon some or all of its expansion efforts and other operations, which could materially harm the Company’s business, financial condition and results of operations. Because of this uncertainty, there is substantial doubt about the Company’s ability to continue as a going concern for at least one year from the date that these consolidated financial statements are issued, and therefore, whether we realize our assets and settle our liabilities in the normal course of business and at the amounts stated in the accompanying consolidated financial statements. The accompanying consolidated financial statements do not include any adjustments that might result from the outcome of this uncertainty, nor do they include adjustments to reflect the future effects of the recoverability or classification of recorded asset amounts and classification of liabilities that might be necessary should the Company be unable to continue as a going concern.
Note 2. Basis of presentation and summary of significant accounting policies
Basis of presentation and principles of consolidation
:
F-4
1
the year ended December 31, 2021 and related notes, together with management’s discussion and analysis of financial condition and results of operations, contained in the Company’s Annual Report on Form
10-K
(“Annual Report”) filed with the Securities and Exchange Commission (“SEC”) on March 31, 2022.The accompanying unaudited condensed consolidated financial statements have been prepared in conformity with accounting principles generally accepted in the United States of America (“U.S. GAAP”) for interim financial information, pursuant to the rules and regulations of the SEC. Accordingly, they do not include all of the financial information and footnotes required by U.S. GAAP for complete financial statements. In the opinion of management, except for as described below, the unaudited condensed consolidated financial statements and notes have been prepared on the same basis as the audited consolidated financial statements for the year ended December 31, 2021 contained in the Company’s Annual Report on Form
10-K
and include all adjustments, consisting of normal recurring adjustments, necessary for a fair presentation of the Company’s financial position as of March 31, 2022, and for the three months ended March 31, 2022 and 2021. These interim periods are not necessarily indicative of the results to be expected for any other interim period or the full year.During the three months ended March 31, 2022, the Company reevaluated its major asset classes of property and equipment resulting in the reclassification of site acquisition costs to distribution system.
The unaudited condensed consolidated financial statements include the accounts of the Company and its subsidiaries. All intercompany transactions and balances have been eliminated in consolidation.
Accounting Policies:
Emerging Growth Company
:
non-emerging
growth companies but any such election to opt out is irrevocable. The Company has elected not to opt out of such extended transition period which means that when a standard is issued or revised and it has different application dates for public or private companies, the Company, as an emerging growth company, can adopt the new or revised standard at the time private companies adopt the new or revised standard, until such time the Company is no longer considered to be an emerging growth company. At times, the Company may elect to early adopt a new or revised standard.Use of estimates:
Uncertainty of the coronavirus pandemic
:
Coronavirus Aid, Relief and Economic Security Act
As the coronavirus pandemic continues to evolve, the Company believes the extent of the impact to its business, operating results, cash flows, liquidity and financial condition will be primarily driven by the severity and duration of the coronavirus pandemic, the pandemic’s impact on the U.S. and global economies and the timing, scope and effectiveness of federal, state and local governmental responses to the pandemic. Those primary drivers are beyond the Company’s knowledge and control, and as a result, at this time the Company is unable to predict the cumulative impact, both in terms of severity and duration, that the coronavirus pandemic will have on its business, operating results, cash flows and financial condition, but it could be material if the current circumstances continue to exist for a prolonged period of time. Although we have made our best estimates based upon current
F-4
2
information, actual results could materially differ from the estimates and assumptions developed by management. Accordingly, it is reasonably possible that the estimates made in these consolidated financial statements have been, or will be, materially and adversely impacted in the near term as a result of these conditions, and if so, the Company may be subject to future impairment losses related to long-lived assets as well as changes to recorded reserves and valuations.
Warrants:
Distinguishing Liabilities from Equity
Derivatives and Hedging
re-measured
to their then fair value at each subsequent reporting period, with changes in fair value recorded in current earnings. Warrants that are determined to require equity classification are measured at fair value upon issuance and are not subsequently remeasured unless they are required to be reclassified.For warrants issued to nonemployees for goods or services, the Company follows guidance issued within ASC 718 to determine whether the share-based payments are equity or liability classified, and are measured at fair value on the grant date. The related expense is recognized in the same period and in the same manner as if the Company had paid cash for the goods or services.
Earnout shares:
Distinguishing Liabilities from Equity
Derivatives and Hedging
re-measured
to their then fair value at each subsequent reporting period, with changes in fair value recorded in current earnings.Fair value measurements:
Fair Value Measurements and Disclosures
Level
1
Level
2
Level
3
An asset’s or liability’s fair value measurement level within the fair value hierarchy is based on the lowest level of any input that is significant to the fair value measurement. Valuation techniques used need to maximize the use of observable inputs and minimize the use of unobservable inputs.
Assets and liabilities measured at fair value are based on one or more of the following three valuation techniques noted in ASC 820:
| • | Market approach: Prices and other relevant information generated by market transactions involving identical or comparable assets or liabilities. |
| • | Cost approach: Amount that would be required to replace the service capacity of an asset (replacement cost). |
| • | Income approach: Techniques to convert future amounts to a single present value amount based upon market expectations (including present value techniques, option pricing and excess earnings models) |
The Company believes its valuation methods are appropriate and consistent with those used by other market participants, however the use of different methodologies or assumptions to determine the fair value of certain financial instruments could result in a different fair value measurement at the reporting date.
The Company’s financial instruments consist of cash and cash equivalents, restricted cash, accounts receivable, accounts payable, accrued expenses, term loans, warrant liabilities and earnout liabilities. The carrying value of cash and cash equivalents, accounts receivable, accounts payable and accrued expenses approximate fair value because of the short-term nature of those instruments. Due to the variable rate nature of the Company’s term loans, the fair value of debt approximates the carrying value of debt.
F-4
3
Liabilities measured at fair value on a recurring basis consisted of the following as of March 31, 2022 and December 31, 2021:
March 31, 2022 | ||||||||||||||||
Level 1 | Level 2 | Level 3 | Balance | |||||||||||||
Liabilities: | ||||||||||||||||
Warrant Liabilities - Public Warrants | $ | 12,144 | $ | — | $ | — | $ | 12,144 | ||||||||
Warrant Liabilities - Private Warrants | — | 6,031 | — | 6,031 | ||||||||||||
Other Liabilities - Junior Debt Exchange | — | — | 1,986 | 1,986 | ||||||||||||
Earnout Liability - Sponsor Earnout Shares | — | — | 20,881 | 20,881 | ||||||||||||
Total Liabilities: | $ | 12,144 | $ | 6,031 | $ | 22,867 | $ | 41,042 | ||||||||
December 31, 2021 | ||||||||||||||||
Level 1 | Level 2 | Level 3 | Balance | |||||||||||||
Liabilities: | ||||||||||||||||
Warrant Liabilities - Starry Warrants | $ | — | $ | — | $ | 14,773 | $ | 14,773 | ||||||||
Total Liabilities: | $ | — | $ | — | $ | 14,773 | $ | 14,773 | ||||||||
The warrant liability for the Public Warrants (see Note 9) as of March 31, 2022 is included within Level 1 of the fair value hierarchy because they are valued using quoted market prices. The Private Warrants (see Note 9) are included within Level 2 of the fair value hierarchy as the Company determined that the Private Warrants are economically equivalent to the Public Warrants and estimated the fair value of the Private Placement Warrants based on the quoted market price of the Public Warrants.
For the valuation of the Junior Debt Exchange (see Note 15) recognized on March 31, 2022, the fair value was estimated using the Black-Scholes option pricing model for a European put option. The key inputs used in the determination of the fair value included current stock price, volatility and expected term. The initial recognition of the fair value of $1,986 was recorded in other liabilities on the condensed consolidated balance sheet and other income (expense), net on the condensed consolidated statement of operations as the incremental fair value received by the Optionholders (as defined in Note 15) was deemed to be a
non-pro
rata distribution. The Company measured the fair value of the Junior Debt Exchange on March 31, 2022 with the following assumptions:As of March 31, 2022 | ||||
Common stock fair value | $ | 8.26 | ||
Exercise price | 8.75 | |||
Term (in years) | 1.8 | |||
Volatility | 35.00 | % | ||
Risk-free interest rate | 2.16 | % | ||
Expected dividends | 0 | % | ||
For the valuation of the earnout liability, the fair value was estimated using a Monte-Carlo Simulation in which the fair value was based on the simulated stock price of the Company over the term of the sponsor earnout period. The key inputs used in the determination of the fair value included current stock price, volatility, and expected term. The Company measured the fair value of the earnout liability upon the consummation of the Business Combination on March 29, 2022, and as of March 31, 2022. The initial fair value was recorded in APIC within the condensed consolidated statement of stockholders’ equity (deficit) upon consummation of the Business Combination on March 29, 2022 and the subsequent fair value adjustment was recorded to other (expense) income, net on the condensed consolidated statement of operations for the three months ended March 31, 2022.
As of March 31, 2022 and March 29, 2022 the fair value of the earnout liability was $20,881 and $26,095, respectively. The $5,214 reduction in fair value of the earnout liability from March 29, 2022 to March 31, 2022 was recorded in other income (expense), net on the condensed consolidated statement of operations. The Company
re-measured
the earnout liability to its estimated fair value as of March 31, 2022 and March 29, 2022 using the Monte-Carlo Simulation with the following assumptions:F-4
4
As of March 31, 2022 | As of March 29, 2022 | |||||||
Common stock fair value | $ | 8.26 | $ | 9.21 | ||||
Term (in years) | 5.0 | 5.0 | ||||||
Volatility | 35.00 | % | 35.00 | % | ||||
Risk-free interest rate | 2.42 | % | 2.49 | % | ||||
Expected dividends | 0 | % | 0 | % | ||||
The Company previously presented the fair value measurement of the warrant liability for Starry Warrants (see Note 9) as of December 31, 2021 as a Level 3 measurement, relying on unobservable inputs reflecting the Company’s own assumptions. Level 3 measurements, which are not based on quoted prices in active markets, introduce a higher degree of subjectivity and may be more sensitive to fluctuations in stock price, volatility rates, and U.S. Treasury Bond rates.
Immediately prior to the settlement of such Starry Warrants in connection with the consummation of the Business Combination, the Company
re-measured
the warrant liability for Starry Warrants as of March 29, 2022 (the settlement date) and recognized a gain from the fair value adjustment of $2,224 as a component of other income (expense), net on the condensed consolidated statement of operations for the three months ended March 31, 2022.As of March 29, 2022 and December 31, 2021 the fair value of the warrant liability for Starry Warrants was $12,549 and $14,773, respectively. The Company
re-measured
the warrant liability to its estimated fair value as of March 29, 2022 and December 31, 2021 using the Black-Scholes option pricing model with the following assumptions:As of March 29, 2022 | As of December 31, 2021 | |||||||
Exercise price | $ | 0.01 | $ | 0.01 | ||||
Common stock fair value (pre-exchange) | $ | 1.77 | $ | 1.81 | ||||
Term (in years) | 9.5 | 9.8 | ||||||
Volatility | 27.57 | % | 27.56 | % | ||||
Risk-free interest rate | 2.41 | % | 1.52 | % | ||||
Expected dividends | 0 | % | 0 | % | ||||
Upon settlement of such Starry Warrants and issuance of common stock in connection with the consummation of the Business Combination on March 29, 2022, the Company reclassified the warrant liability for Starry Warrants of $12,549 to APIC.
There were 0transfers between Level 1 and Level 2 in the periods reported. Except for the aforementioned settlement of Starry Warrants, there were no transfers into or out of Level 3 in the periods reported.
Recent accounting pronouncements issued, not yet adopted:
In February 2016, the FASB issued a new accounting standard, ASC 842,(“ASC 842”), to increase transparency and comparability among organizations by requiring the recognition of ROU assets and lease liabilities on the balance sheets. Most significant among the changes in the standard is the recognition of ROU assets and lease liabilities by lessees for those leases classified as operating leases under previous U.S. GAAP. Under the new standard, disclosures are required to meet the objective of enabling users of financial statements to assess the amount, timing and uncertainty of cash flows arising from leases. ASC 842 is effective for the annual period beginning January 1, 2022, and interim periods within the annual period beginning January 1, 2023, with early adoption permitted.
Leases
The Company is currently evaluating the impact the new guidance will have on its financial position and results of operations but expects to recognize lease liabilities and right of use assets at the time of adoption. The extent of the increase to assets and liabilities associated with these amounts remains to be determined pending the Company’s review of its existing lease contracts and service contracts which may contain embedded leases. The Company is currently assessing the potential impact to the financial statements. The Company is continuing to monitor potential changes to ASC 842 that have been proposed by the FASB and will assess any necessary changes to the implementation process as the guidance is updated.
In June 2016, the FASB issued ASU(“ASU
2016-13,
Financial Instruments – Credit Losses (Topic 326): Measurement of Credit Losses of Financial Instruments
2016-13”),
which, together with subsequent amendments, amends the requirement on the measurement and recognition of expected credit losses for financial assets held to replace the incurred loss model for financial assets measured at amortized cost and require entities to measure all expected credit losses for financial assets held at the reporting dateF-4
5
based on historical experience, current conditions and reasonable and supportable forecasts. ASU
2016-13
is effective for the Company beginning January 1, 2023, with early adoption permitted. The Company is currently in the process of evaluating the effects of this pronouncement on the Company’s consolidated financial statements.In August 2020, the FASB issued ASUand Derivatives and Hedging –, which simplifies the accounting for convertible instruments by reducing the number of accounting models available for convertible debt instruments. This guidance removes certain settlement conditions that are required for contracts to qualify for equity classification, eliminates the treasury stock method to calculate diluted earnings per share for convertible instruments and requires the use of the
2020-06,
Debt – Debt with Conversion and Other Options (Subtopic
470-20)
Contracts in Entity’s Own Equity (Subtopic
815-40):
Accounting for Convertible Instruments and Contracts in an Entity’s Own Equityif-converted
method. ASU2020-06
is effective for the Company beginning January 1, 2024, with early adoption permitted. The Company is currently evaluating the effects of this pronouncement on the Company’s consolidated financial statements and the potential impact on the consolidated financial statements.In October 2020, the FASB issued ASU(“ASU
2020-10,
Codification Improvements
2020-10”),
which clarifies and improves the consistency of the Codification by updating various disclosure requirements to align with the SEC’s regulations and ensure all guidance that requires or provides an option for an entity to provide information in the notes to financial statements is codified in the Disclosure Section of the Codification. ASU2020-10
is effective for annual periods beginning January 1, 2022, and interim periods within the annual period beginning January 1, 2023, with early adoption permitted. The Company is currently evaluating the effects of this pronouncement on the Company’s consolidated financial statements and the potential impact on the consolidated financial statements.Note 3. Revenue recognition
The Company assesses the contract term as the period in which the parties to the contract have presently enforceable rights and obligations. The contract term can differ from the stated term in contracts that include certain termination or renewal rights, depending on whether there are penalties associated with those rights. Although customers are typically billed in advance for a month of service, the majority of the Company’s contracts (with residential customers) allow either party to cancel at any time without penalty and customers are entitled to a pro rata refund for services not yet rendered. However, in some instances the Company enters into
non-cancellable
andnon-refundable
contracts with commercial customers.Nature of services:
Transaction price:
The Company’s contracts with customers may include service level agreements that entitle the customer to receive service credits, and in certain cases, service refunds, when defined service levels are not met. These arrangements represent a form of variable consideration, which is considered in the calculation of the transaction price. The Company estimates the amount of variable consideration at the expected value based on its assessment of legal enforceability, anticipated performance and a review of specific transactions, historical experience and market and economic conditions. The Company historically has not experienced any significant incidents affecting the defined levels of reliability and performance as required by the contracts.
The Company has elected the practical expedient that permits an entity not to recognize a significant financing component if the time between the transfer of a good or service and payment is one year or less. The Company does not enter into contracts in which the period between payment by the customer and the transfer of the promised goods or services to the customer is greater than 12 months. In addition, the Company excludes from revenue sales taxes and other government-assessed and imposed taxes on revenue-generating activities that are invoiced to customers, whenever applicable.
F-
46
For individual customers who receive subsidized internet services through the EBB program, the transaction price includes the amounts due from the customer as well as the subsidy amount due from the government.
Gift card incentives:
Unearned revenue:
Unearned Revenue | ||||
December 31, 2021 | $ | 1,630 | ||
Change, net | 3 | |||
March 31, 2022 | $ | 1,633 | ||
Note 4. Debt
At March 31, 2022 and December 31, 2021, the carrying value of debt was as follows:
As of | ||||||||
March 31, 2022 | December 31, 2021 | |||||||
Gross term loans | $ | 218,480 | $ | 202,671 | ||||
Strategic Partner Arrangement (see Note 12) | 9,032 | 5,227 | ||||||
Capital lease obligations | 2,509 | 2,221 | ||||||
| 230,021 | 210,119 | |||||||
Less unamortized debt discount on term loans | (17,217 | ) | (17,019 | ) | ||||
Less current portion of debt | (1,498 | ) | (1,504 | ) | ||||
Debt, net of current portion | $ | 211,306 | $ | 191,596 | ||||
Starry Credit Agreement:
On October 6, 2021, the Company entered into the fifth amendment (the “Fifth Amendment”) to the Starry Credit Agreement with lenders to provide for a total of $40,000 in term loans which the Company immediately drew upon in full (the “Tranche C Loan”) and up to an additional $10,000 in delayed draw loans which the Company fully drew upon in January 2022 (the “Delayed Draw Tranche C Loan”) (together, the “Tranche C Loans” and collectively with the Tranche A Loan, Delayed Draw Tranche A Loan and Tranche B Loan, the “Term Loans”).
The Term Loans incur interest at a rate equal to the London Interbank Offered Rate (“LIBOR”), subject to a floor of 2.0%, plus an applicable margin of 9.0% (with the interest rate capped at 13.25% per annum) and such interest is accrued on a quarterly basis. Such interest rates were 11.0% as of March 31, 2022 and December 31, 2021. As allowed in the Starry Credit Agreement, the Company has elected to pay the interest accrued on aninterest on the Term Loans.interest is reflected as a component of the carrying value of the Term Loans as the payment of such interest would occur upon the settlement of the Term Loans.
in-kind
basis by increasing the principal balance outstanding. For the three months ended March 31, 2022 and 2021, the Company incurred $5,809 and $3,985, respectively, ofpaid-in-kind
Paid-in-kind
F-
47
The principal balance is payable in its entirety at maturity in February 2024. The Company may prepay the Term Loans, in whole or in part, at any time, subject to a premium. In addition, the lenders can require prepayment in certain circumstances, including a change of control, also subject to a premium. As of March 31, 2022, the premium for such prepayment is 5% of the principal if prepaid prior to maturity. A change of control is defined as the acquisition of direct or indirect ownership by a person other than existing stockholders of the Company of fifty percent or more of the voting or equity value of the Company.
The Term Loans are senior to all other debt and have a first priority lien on substantially all of the Company’s assets. The Term Loans contain customary conditions related to borrowing, events of default and covenants, including certain
non-financial
covenants and covenants limiting the Company’s ability to dispose of assets, undergo a change in control, merge with or acquire stock, and make investments, in each case subject to certain exceptions. There is a financial covenant with respect to the Term Loans that requires the Company to maintain a minimum cash balance of $15,000 at all times. Upon the occurrence of an event of default, in addition to the lenders being able to declare amounts outstanding under the Term Loans due and payable the lenders can elect to increase the interest rate by 2.0% per annum.The Company assessed the embedded features of the Term Loans, including the accelerated repayment (redemption) features and the default rate of interest feature, noting that these features met the definition of a derivative under ASC 815 and were not clearly and closely related to the debt host instrument. The Company is required to remeasure these derivative features to their then fair value at each subsequent reporting period. Based on the probability of prepayment prior to maturity, the repayment feature was ascribed a fair value of $11,464 and $10,412, respectively, as of March 31, 2022 and December 31, 2021, and recorded in other liabilities on the consolidated balance sheets (the “Prepayment Penalty”). The change in fair value of the Prepayment Penalty is based on management’s assumption of the estimated probability that the accelerated repayment would be triggered prior to maturity. As of March 31, 2022, such probability was deemed to be 100% before maturity of the debt. The change in fair value of $1,052 and $2,898 for the three months ended March 31, 2022 and 2021, respectively, was recorded in other income (expense) on the condensed consolidated statement of operations.
The Company amortizes debt discounts over the term of the Starry Credit Agreement using the effective interest method (based on an effective interest rate of 16.9%, 11.2%, 14.2% and 19.1%, respectively). The amortization recorded for the three months ended March 31, 2022 and 2021 is $1,626 and $667, respectively, and is included within interest expense in the condensed consolidated statements of operations. The remaining unamortized debt discount at March 31, 2022 and December 31, 2021 is $17,217 and $17,019, respectively, and is reflected net against debt, net of current portion on the condensed consolidated balance sheets.
2020 Convertible notes payable:
During the year ended December 31, 2020, the Company issued convertible notes payable (the “2020 Notes”) in exchange for cash totaling $31,243. Such notes incurred interest at 3.0% per annum and had a maturity date of June 4, 2021. One current shareholder who is a related party contributed $2,349 of the 2020 Notes balance.
January 2021 Convertible notes payable:
| (a) | Automatic conversion of outstanding principal and unpaid accrued interest upon the closing of the next equity financing. The conversion price was based on the next equity financing per share price with a 20% discount, as long as it was not greater than $8.53 per share. The number of conversion shares to be issued was equal to the quotient obtained by dividing (i) the outstanding principal and unpaid accrued interest due by (ii) the above-mentioned conversion price. This feature was effectively made up of 2 separate components, a share-settled redemption feature when the conversion price is not greater than $8.53 per share, and a traditional conversion option when the conversion price is greater than $8.53 per share. |
| (b) | Automatic conversion of outstanding principal and unpaid accrued interest upon maturity of the 2021 Notes into shares of Series D preferred stock. The number of Series D Preferred Stock shares to be issued was equal to the quotient obtained by dividing (i) the outstanding principal and unpaid accrued interest due by (ii) the Series D Preferred Stock price. |
| (c) | Automatic redemption upon the Company closing a corporate transaction. In such scenario, the majority noteholders would elect either (i) the repayment of the outstanding principal and accrued unpaid interest due upon the closing of the corporate transaction or (ii) the conversion of the 2021 Notes into the right to receive a cash payment as though the principal and unpaid accrued interest had converted into conversion shares. The conversion price was to be based on the corporate transaction per share price with a 20% discount, provided it was not greater than $8.53. The number of conversion shares to be issued was to be equal to the quotient obtained by dividing (i) the outstanding principal and unpaid accrued interest due by (ii) the above-mentioned conversion price. This feature was effectively made up of 2 separate components, a share- settled redemption feature when the conversion price is not greater than $8.53 per share, and a traditional conversion option when the conversion price is greater than $8.53 per share. |
F-
48
| (d) | Automatic conversion of outstanding principal and unpaid accrued interest upon the closing of an initial public offering. The number of conversion shares to be issued was equal to the quotient obtained by dividing (i) the outstanding principal and unpaid accrued interest due by (ii) the Series D Preferred Stock price. |
| (e) | Automatic conversion of outstanding principal and unpaid accrued interest upon an event of default under the Starry Credit Agreement. The number of conversion shares to be issued was equal to the quotient obtained by dividing (i) the outstanding principal and unpaid accrued interest due by (ii) the Series D Preferred Stock price. |
| (f) | In the event of a future non-equity financing prior to the full payment or conversion of the Notes, each lender had the option to elect for the principal and unpaid accrued interest of each outstanding note to be converted into either (i) the instrument used in thenon-equity financing on the same price, or (ii) conversion shares. The number of conversion shares to be issued was equal to the quotient obtained by dividing (i) the outstanding principal and unpaid accrued interest due by (ii) the conversion price. |
The Company assessed the embedded features within the 2021 Notes as detailed above and determined that the automatic conversion feature upon the next equity financing and the redemption upon a corporate transaction (in both cases, when settled in shares at a conversion price less than $8.53 per share) met the definition of a derivative that would require separate accounting from the 2021 Notes. In estimating the fair value of these bifurcated embedded features, the Company concluded that such fair value was de minimis at issuance of the 2021 Notes. The automatic conversion feature upon maturity was assessed to contain a beneficial conversion feature that was recognized at its intrinsic value at the issuance date as a component of APIC and as a debt discount to the 2021 Notes totaling $2,791. Two current shareholders who were related parties contributed $3,000 and $5,000, respectively, of the $11,000 2021 Notes balance.
The total amortization recorded for the 2021 Notes for the three months ended March 31, 2022 and March 31, 2021 was $0 and $1,750, respectively, and is included within interest expense in the condensed consolidated statements of operations. For the three months ended March 31, 2022 and 2021, the Company incurred $0 and $246, respectively, ofinterest as a component of the carrying value of the 2021 Notes.
paid-in-kind
On March 31, 2021, the Company completed the initial closing of a new equity financing for its Series E Preferred Stock. As a result of the closing, both the 2020 Notes and 2021 Notes, including accrued cash andinterest, converted to shares of Series
paid-in-kind
E-1
and SeriesE-2
Preferred Stock respectively (see Note 5). The conversion of the 2020 Notes was treated as a conversion in accordance with the original terms of the 2020 Notes, and as such, carrying value of the 2020 Notes was reclassified to SeriesE-1
Preferred Stock. The conversion of the 2021 Notes was treated as an extinguishment of the 2021 Notes, with the SeriesE-2
Preferred Stock being recorded at its fair value (the reacquisition price of the 2021 Notes) and the Company recording a charge to the capital account of $2,791 representing the additional value provided to the holders of the 2021 Notes upon settlement. The Company recorded a loss on extinguishment of $2,361 reflected in the other income (expense), net on the condensed consolidated statement of operations for the three months ended March 31, 2021.As a result of the 2020 Notes converting into shares of Series E Preferred Stock, the carrying value of the debt discount on the 2020 Notes was reversed and recognized as interest expense in the amount of $971 for the three months ending March 31, 2021.
Note 5. Stockholders’ equity
Convertible preferred stock (prior to the Business Combination)
Prior to the Acquisition Merger, the Company had authorized the issuance of 505,746,770 shares of convertible preferred stock, of which 53,030,270 shares were designated as Series Seed Preferred Stock, 91,549,300 shares were designated as Series A Preferred Stock, 55,452,865 shares were designated as Series B Preferred Stock, 108,459,871 shares were designated as Series C Preferred Stock, 87,412,587 shares were designated as Series D Preferred Stock, 104,841,877 shares were designated as Series E Preferred Stock (collectively, the “Old Starry Preferred Stock”) and 5,000,000 shares were designated as Series Z Preferred Stock (together with “Old Starry Preferred Stock”, the “Convertible Preferred Stock”).
On March 31, 2021, the Company completed a Series E Preferred Stock financing round whereby it issued shares of Series
E-1
Preferred Stock, SeriesE-2
Preferred Stock, and SeriesE-3
Preferred Stock. The 2020 Notes had a carrying value of $31,752 and were converted into 22,204,490 shares of SeriesE-1
Preferred Stock, at a price per share of $1.43. The 2021 Notes had a carrying value of $13,832 and were converted into 8,232,627 shares of SeriesE-2
Preferred Stock, at a price per share of $1.34. The Company issued 71,428,570 shares of SeriesE-3
Preferred Stock at a purchase price of $1.68 per share, in exchange for gross cash proceeds of $120,000 and incurred issuance costs of $150.F-
49
On March 29, 2022, the Company issued 4,133,333 shares of Series Z Preferred Stock at a purchase price of $7.50 per share, in exchange for gross cash proceeds of $31,000 in connection with the consummation of the Business Combination. Pursuant to the Merger Agreement, such shares of Series Z Preferred Stock converted into shares of Class A common stock on abasis and all outstanding shares of Old Starry Preferred Stock converted into shares of Class A common stock at an exchange ratio of 0.1841 (the “Acquisition Merger Exchange Ratio”).
1-for-1
In connection with the Business Combination, the Convertible Preferred Stock was retroactively adjusted. As of March 31, 2022, there is 0 Convertible Preferred Stock authorized, issued or outstanding. The following table summarizes details of Convertible Preferred Stock authorized, issued and outstanding immediately prior to the Business Combination.
Convertible Preferred Stock | Par Value | Authorized (1) | Issued and Outstanding (1) | Carrying Value | ||||||||||||
Series Seed | $ | 0.001 | 9,761,747 | 9,761,745 | $ | 6,990 | ||||||||||
Series A | 0.001 | 16,852,283 | 16,852,283 | 25,946 | ||||||||||||
Series B | 0.001 | 10,207,696 | 10,207,696 | 29,910 | ||||||||||||
Series C | 0.001 | 19,965,160 | 19,965,160 | 99,989 | ||||||||||||
Series D | 0.001 | 16,090,802 | 16,090,802 | 124,915 | ||||||||||||
Series E | 0.001 | 19,299,164 | 18,751,311 | 165,434 | ||||||||||||
Series Z | 0.001 | 5,000,000 | 4,133,333 | 31,000 | ||||||||||||
| 97,176,852 | 95,762,330 | $ | 484,184 | |||||||||||||
| (1) | Shares of Old Starry Preferred Stock authorized, issued and outstanding have been adjusted to reflect the exchange of Old Starry common stock for Class A common stock at an exchange of 0.1841 as a result of the Business Combination (see Note 1). |
Preferred stock (subsequent to the Business Combination)
The Company has authorized 10,000,000 shares of preferred stock (the “Preferred Stock”), par value $0.0001, of which NaN are issued and outstanding at March 31, 2022. Shares of Preferred Stock may be issued from time to time by the board of directors in one or more series, and in connection with the creation of any such series, by adopting a resolution or resolutions providing for the issuance of the shares thereof and by filing a certificate of designation, to determine and fix the number of shares of such series and such voting powers, full or limited, or no voting powers, and such designations, preferences and relative participating, optional or other special rights, and qualifications, limitations or restrictions thereof, including without limitation thereof, dividend rights, conversion rights, redemption privileges and liquidation preferences, and to increase or decrease (but not below the number of shares of such series then outstanding) the number of shares of any series as shall be stated and expressed in such resolutions.
Class A common stock
The Company has authorized 800,000,000 shares of Class A common stock, par value $0.0001, of which 152,926,661 are issued and outstanding at March 31, 2022. Holders of such shares are entitled to one vote for each share of Class A common stock. Such shares confer upon holders the right to receive the payment of dividends when, as and if declared by the Board of Directors, subject to applicable laws and the rights and preferences of any holders of any outstanding series of Preferred Stock.
Class X common stock
The Company has authorized 50,000,000 shares of Class X common stock, par value $0.0001, of which 9,268,335 are issued and outstanding at March 31, 2022 and held solely by the Company’s Chief Executive Officer and founder. The holder of such shares is entitled to 20 votes for each share of Class X common stock, until the Sunset Date (defined below), and one vote for each share of Class X common stock from and after the Sunset Date. Such shares confer upon the holder the right to receive the payment of dividends when, as and if declared by the Board of Directors, subject to applicable laws and the rights and preferences of any holders of any outstanding series of Preferred Stock.
Each share of Class X common stock will:
| • | Convert into one share of Class A common stock at the option of the holder. |
| • | Automatically convert into one share of Class A common stock upon a transfer of such share, other than to a Qualified Stockholder (as defined in the Amended and Restated Certificate of Incorporation of Starry Group, as filed as an exhibit to the Annual Report on March 31, 2022). |
| • | Automatically convert into one share of Class A common stock upon the earlier of (such date, the “Sunset Date”): (a) the date that is nine months following March 29, 2022 on which the holder (1) is no longer providing services as a member of |
F-5
0
the senior leadership team, officer or director and (2) has not provided any such services for the duration of such nine-month period; and (b) the first date after March 29, 2022 as of which the holder has transferred, in the aggregate, more than 75% of the shares of Class X common stock that were held by the holder immediately following the consummation of the Business Combination. Following such conversion, the reissuance of shares of Class X common stock will be prohibited. |
Non-redemption
agreementsPursuant to the
non-redemption
agreements entered into with certain accredited investors (the“Non-Redeeming
Shareholders”) dated March 9, 2022, theNon-Redeeming
Shareholders agreed to not redeem a certain number of shares of FirstMark Class A common stock. In connection with these agreements, the Company issued 422,108 shares of additional Class A common stock to theNon-Redeeming
Shareholders subsequent to the close of the Business Combination (the“Non-Redemption
Shares”). The Company evaluated theNon-Redeeming
Shareholders’ right to receive the additional shares of Class A common stock and concluded that theNon-Redemption
Shares represented anon-pro
rata distribution to theNon-Redeeming
Shareholders. As a result, the Company recorded $3,888 in other income (expense), net on the condensed consolidated statement of operations and APIC on the condensed consolidated statement of stockholders’ equity (deficit).Note 6. Share-based compensation expense
The Company currently maintains the Starry, Inc. Amended and Restated 2014 Stock Option and Grant Plan (the “Starry Stock Plan”). The Starry Stock Plan provides our employees (including the named executive officers), consultants, directors and other key persons and those of our any subsidiary the opportunity to participate in the equity appreciation of our business through the receipt of stock options to purchase shares of our common stock, restricted stock and restricted stock units. We believe that such awards encourage a sense of proprietorship and stimulate interest in our development and financial success. The Starry Stock Plan is no longer available for use for the grant of future awards, but will continue to govern the terms of awards that were previously granted and that remain outstanding.
In connection with the Business Combination, the Board of Directors adopted the Starry Group Holdings, Inc. 2022 Equity Incentive Plan (“Equity Incentive Plan”), under which the Company may grant cash and equity incentive awards to directors, employees (including named executive officers) and consultants. The Equity Incentive Plan became effective on March 29, 2022 and replaced the Starry Stock Plan, allowing the Company to grant up to 22,775,288 shares of Class A common stock.
The Board of Directors also adopted the Starry Group Holdings, Inc. 2022 Employee Stock Purchase Plan (the “ESPP”) in connection with the Business Combination, under which employees (including named executive officers) may purchase common stock through payroll deductions of up to 20% of their eligible compensation. The ESPP became effective on March 29, 2022 with no activity for the three months ended March 31, 2022.
The Company did
0t
grant any stock options during the three months ended March 31, 2022 and 2021.In May 2021 and September 2021, pursuant to the Starry Stock Plan, the Company granted 736,315 and 82,697 shares of restricted stock units (“RSUs”), respectively, to employees in exchange for employment services. NaN additional RSUs were granted during the three months ended March 31, 2022. The RSUs have a service condition of 4 years and performance condition that is linked to the occurrence of a liquidity event. The liquidity event requirement will be satisfied on the first to occur of: (1) the day following the expiration of the lock up period that is in effect following a listing event (defined below), provided that a termination event has not occurred prior to such time and (2) the consummation of a sale event. A listing event is defined as (i) an initial public offering or direct listing of any class of common stock of the Company or any parent or subsidiary or successor of the Company formed for the purpose of effecting such transaction or (ii) a merger (or similar transaction) with a special purpose acquisition company, the result of which is that any class of common stock of the Company or the parent or successor entity of the Company is listed on the New York Stock Exchange, the Nasdaq Stock Market or other securities exchange. The grant-date fair value of the RSUs was $7.99
per
share. Due to the consummation of the Business Combination on March 29, 2022, the Company has recognized $3,401 of share-based compensation expense for RSUs since the listing event occurred and the satisfaction of the liquidity event will be achieved solely based on the passage of time (i.e., the expiration of the lock up period). As of March 31, 2022, there was approximately $3,271 of unrecognized share-based compensation expense related to RSUs, which is expected to be recognized over a weighted-average period of 1.3 years.Share-based compensation expense related to stock options for the three months ended March 31, 2022 and 2021 was $306 and $220, respectively, and is included within research and development expense and selling, general and administrative expense on the accompanying condensed consolidated statements of operations. As of March 31, 2022, there was approximately $2,895 of unrecognized compensation cost related to stock options which is expected to be recognized over a weighted-average period of 2.3 years.
F-5
1
Note 7. Property and equipment
Property and equipment consisted of the following at March 31, 2022 and December 31, 2021:
March 31, 2022 | December 31, 2021 | |||||||
Distribution system | 157,707 | $ | 145,357 | |||||
Asset retirement obligation | 2,180 | 2,015 | ||||||
Construction in progress | 31,319 | 28,493 | ||||||
Equipment | 6,329 | 6,051 | ||||||
Vehicles | 4,242 | 3,943 | ||||||
Furniture and fixtures | 1,246 | 1,267 | ||||||
Software | 2,405 | 1,452 | ||||||
Leasehold improvements | 790 | 691 | ||||||
| 206,218 | 189,269 | |||||||
Less: accumulated depreciation | (69,462 | ) | (60,250 | ) | ||||
Property and equipment, net | $ | 136,756 | $ | 129,019 | ||||
Depreciation expense for the three months ended March 31, 2022 and 2021 totaled approximately $9,332 and $6,095 respectively, and is included within cost of revenues, selling, general and administrative, and research and development expense on the accompanying condensed consolidated statements of operations. For the three months ended March 31, 2022 and 2021, the Company reported $8,440 and $5,371, respectively, of depreciation related to the deployed assets which comprise its distribution system.
Note 8. Asset retirement obligations
The following table summarizes changes in the Company’s asset retirement obligations for the three months ended March 31, 2022:
Balance, January 1, 2022 | $ | 2,387 | ||
New asset retirement obligations | 165 | |||
Accretion expense | 69 | |||
Balance, March 31, 2022 | $ | 2,621 | ||
Accretion expense associated with asset retirement obligations for the three months ended March 31, 2022 and 2021 totaled approximately $69 and $41, respectively, and is included within selling, general and administrative expense on the accompanying condensed consolidated statements of operations.
Note 9. Warrants and earnout shares
Common stock warrants
Pursuant to the FirstMark initial public offering (“IPO”), FirstMark sold 41,400,000 units, which includes the full exercise by the underwriters of their over-allotment option in the amount of 5,400,000 units, at a purchase price of $10.00 per unit. Each unit consisted of 1share of FirstMark Class A common stock andof one FirstMark warrant (“Public Warrants”). Each Public Warrant entitles the holder to purchase 1share of Common Stock at a price of $11.50 per share. Simultaneously with the closing of the FirstMark IPO on October 8, 2020, FirstMark consummated the sale of 6,853,333 private placement warrants (the “Private Warrants”) to the Sponsor at a price of $1.50 per Private Warrant to FirstMark Horizon Sponsor LLC (the “Sponsor”), generating gross proceeds of $10,300,000. Together, the Public Warrants and Private Placement Warrants are referred to as the “Common Stock Warrants.”
one-third
Public Warrants may only be exercised for a whole number of shares. No fractional warrants will be issued upon separation of the Units and only whole warrants will trade. The Public Warrants became exercisable 12 months from the closing of the Initial Public Offering. The Public and Private Warrants will expire five years after the completion of the Business Combination or earlier upon redemption or liquidation. As a result of the Business Combination, both the 13,800,000 Public Warrants and 6,853,333 Private Warrants are redeemable for shares of Class A common stock subject to the below.
The Company will not be obligated to deliver any shares of Common Stock pursuant to the exercise of a Common Stock Warrant and will have no obligation to settle such warrant exercise unless a registration statement under the Securities Act of 1933, as amended (the “Securities Act”), with respect to the shares of Common Stock underlying the warrants is then effective and a prospectus relating thereto is current, subject to the Company satisfying its obligations with respect to registration.
F-5
2
The Company has agreed to maintain a current prospectus relating to those shares of Class A common stock until the warrants expire or are redeemed, as specified in the warrant agreement; provided that if shares of the Class A common stock are at the time of any exercise of a Public Warrant not listed on a national securities exchange such that they satisfy the definition of a “covered security” under Section 18(b)(1) of the Securities Act, the Company may, at its option, require holders of Public Warrants who exercise their warrants to do so on a “cashless basis” in accordance with Section 3(a)(9) of the Securities Act and, in the event the Company so elects, the Company will not be required to file or maintain in effect a registration statement, but it will use its commercially reasonable efforts to register or qualify the shares under applicable blue sky laws to the extent an exemption is not available.
Public Warrants
Redemption of warrants when the price per share of Class
A common stock equals or exceeds $18.00 (“Reference Value”).
| • | in whole and not in part; |
| • | at a price of $0.01 per warrant; |
| • | upon a minimum of 30 days’ prior written notice of redemption to each warrant holder; and |
| • | if, and only if, the last reported last sale price of the Class A common stock equals or exceeds $18.00 per share (as adjusted for stock splits, stock dividends, reorganizations, recapitalizations and the like) for any 20 trading days within a 30-trading day period ending on the third trading day prior to the date on which the Company sends the notice of redemption to the warrant holders. |
The last of the redemption criterion discussed above was established to prevent a redemption call unless there is at the time of the call a significant premium to the warrant exercise price. If the foregoing conditions are satisfied and the Company issues a notice of redemption of the warrants, each warrant holder will be entitled to exercise his, her or its warrant prior to the scheduled redemption date. However, the price of the shares of Class A common stock may fall below the $18.00 redemption trigger price (as adjusted for adjustments to the number of shares issuable upon exercise price for a warrant) as well as the $11.50 (for whole shares) warrant exercise price after the redemption notice is issued.
Redemption of warrants when the price per share of Class
A common stock equals or exceeds $10.00.
| • | in whole and not in part; |
| • | at $0.10 per warrant upon a minimum of 30 days’ prior written notice of redemption, provided that holders will be able to exercise their warrants on a cashless basis prior to redemption and receive that number of shares determined by reference to the table in the Registration Statement, based on the redemption date and the “fair market value” of shares of Class A common stock, except as otherwise described below; |
| • | if, and only if, the Reference Value equals or exceeds $10.00 per share (as adjusted for adjustments to the number of shares issuable upon exercise or the exercise price of a warrant as described under the heading “— Warrants — Public Stockholders’ Warrants — Anti-dilution Adjustments” in the Registration Statement); and |
| • | if the Reference Value is less than $18.00 per share (as adjusted for adjustments to the number of shares issuable upon exercise or the exercise price of a warrant as described under the heading “— Warrants — Public Stockholders’ Warrants — Anti-dilution Adjustments” in the Registration Statement), the private placement warrants must also be concurrently called for redemption on the same terms as the outstanding public warrants, as described above. |
The exercise price and number of shares of Class A common stock issuable upon exercise of the warrants may be adjusted in certain circumstances, including in the event of a stock dividend, or recapitalization, reorganization, merger or consolidation. However, the warrants will not be adjusted for the issuance of Class A common stock at a price below its exercise price. Additionally, in no event will the Company be required to net cash settle the warrants.
F-5
3
Private Warrants
The Private Warrants are identical to the Public Warrants underlying the units sold in the IPO, except that the Private Warrants and the shares of Class A common stock issuable upon the exercise of the Private Warrants were not transferable, assignable or saleable until 30 days after the completion of the Business Combination. Additionally, the Private Warrants are exercisable on a cashless basis and are
non-redeemable
so long as they are held by the initial purchasers or their permitted transferees. If the Private Warrants are held by someone other than the initial purchasers or their permitted transferees, the Private Warrants will be redeemable by the Company and exercisable by such holders on the same basis as the Public Warrants.The Company evaluated the Private Warrants and the Public Warrants and concluded that they do not meet the criteria to be classified within stockholders’ equity. The Private Warrants and the Public Warrants both contain settlement provisions that preclude them from meeting the derivative exception of being indexed to the Company’s stock. As such, the Company has recorded these warrants as liabilities on the condensed consolidated balance sheet at fair value (see Note 2), with subsequent changes in their respective fair values recognized in the condensed consolidated statements of operations at each reporting date. Upon consummation of the Business Combination on March 29, 2022 the combined fair value of both the Public Warrants and Private Warrants was $15,697 and was recorded in APIC (see Note 1). The remeasurement of such warrants as of March 31, 2022 resulted in an increase of $2,478 in fair value which the Company recorded in other income (expense), net on the condensed consolidated statement of operations.
Starry Warrants
In connection with entering into the Starry Credit Agreement in February 2019, the Company issued the lender warrants to purchase 2,765,887 shares of the Company’s
non-voting
common stock. In addition, in connection with the Company entering into the Starry Credit Agreement in December 2019, the Company issued the new participating lenders warrants to purchase 3,244,510 shares of the Company’snon-voting
common stock. As the Company concluded the warrants were classified in stockholders’ equity, the Company allocated approximately $6,175 and $8,307 in value to the warrant issuances, respectively, on a relative fair value basis and recorded this allocated value as an increase toadditional-paid-in
capital and as a component of the discount recorded against the outstanding debt (the “2019 Equity Warrants”). On October 6, 2021, certain lenders who held 648,902 of such warrants entered into a convertible note subscription agreement in connection with the Merger Agreement, which provided the lenders an exchange right to net cash settle the outstanding warrants. The Companyre-assessed
the classification of such warrants due to the exchange right and recorded a reclassification of $6,345 fromadditional-paid-in
capital to warrant liabilities as of December 31, 2021 (the “2019 Liability Warrants”, and together with the remaining 2019 Equity Warrants, the “2019 Warrants”).In conjunction with the Fifth Amendment, the Company entered into a warrant purchase agreement as of October 6, 2021. The Company issued to the lenders warrants to purchase 2,118,687 shares of the Company’s
non-voting
common stock valued at $6,733 (“Initial Tranche C Warrants”) and contingently issuable warrants to purchase 533,275shares of the Company’s non-voting common stock valued at
$1,695 (“Delayed Draw Tranche C Warrants”) (together, the “Tranche C Warrants”, and collectively with the 2019 Warrants, the “Starry Warrants”). The Company concluded the Tranche C Warrants were liability classified and recorded the fair value as an increase to warrant liabilities and as a component of the discount recorded against the outstanding debt (for the Initial Tranche C Warrants) and deferred costs (for the Delayed Draw Tranche C Warrants) as the Delayed Draw Tranche C Loan was not outstanding as of December 31, 2021. On January 11, 2022, the Delayed Draw Tranche C Warrants were reclassified from deferred costs to a component of the discount recorded against the outstanding debt upon the draw down of the Delayed Draw Tranche C Loan.On March 29, 2022, such Starry Warrants were net exercised in connection with the Business Combination (see Note 1). Immediately prior to being net exercised, the liability-classified Starry Warrants were adjusted to fair value prior to reclassification to APIC (see Note 2).
Earnout Shares
Following the Business Combination, 4,128,113 shares of Class A common stock held by certain former equity holders of FirstMark are subject to vesting and forfeiture conditions (the “Earnout Shares”). Of the 4,128,113 Earnout Shares, 2,224,167 shares will vest at such time as a $12.50 stock price level is achieved, 951,973 shares will vest at such time as a $15.00 stock price level is achieved and 951,973 shares will vest at such time as a $17.50 stock price level is achieved, in each case, on or before the fifth anniversary of the consummation of the Business Combination. The ‘‘stock price level’’ will be considered achieved only (a) when the closing price of a share of Class A common stock on the NYSE is greater than or equal to the applicable price for any 20 trading days within a 30 trading day period or (b) the price per share of Class A common stock paid in certain change of control transactions following the consummation of the Business Combination is greater than or equal to the applicable price. Earnout Shares subject to vesting pursuant to the above terms that do not vest in accordance with such terms shall be forfeited and cancelled for no consideration. The Earnout Shares are not redeemable. The Earnout Shares will be considered outstanding for legal purposes prior to the achievement of the vesting conditions but will not be considered outstanding for accounting purposes until such vesting conditions are achieved. As the vesting event has not yet been achieved, these shares of Class A common stock are treated as contingently recallable and have been excluded from the denominator for the purposes of calculating basic and diluted net loss per share (see Note 13).
F-5
4
The Company evaluated the Earnout Shares and concluded that they do not meet the criteria to be classified within stockholders’ equity. The Earnout Shares contain settlement provisions that preclude them from meeting the derivative exception of being indexed to the Company’s stock. As such, the Company has recorded these Earnout Shares as liabilities on the condensed consolidated balance sheet at fair value (see Note 2), with subsequent changes in their respective fair values recognized in the condensed consolidated statements of operations at each reporting date.
Note 10. Accrued expenses and other current liabilities
Accrued expenses and other current liabilities consisted of the following at March 31, 2022 and December 31, 2021:
March 31, 2022 | December 31, 2021 | |||||||
Accrued compensation and benefits | $ | 9,307 | $ | 4,773 | ||||
Accrued sales and use tax | 6,459 | 5,860 | ||||||
Accrued purchases of property and equipment | 3,004 | 3,339 | ||||||
Accrued transaction costs | 4,050 | 3,693 | ||||||
Other | 7,279 | 5,512 | ||||||
Total | $ | 30,099 | $ | 23,177 | ||||
Note 11. Income taxes
During the three months ended March 31, 2022 and 2021, the Company recorded 0 income tax provision for federal or state income taxes. The Company maintained a full valuation allowance on its net deferred tax assets for the three months ended March 31, 2022 and 2021, due to uncertainty regarding future taxable income.
Note 12. Commitments and contingencies
2020 Strategic Partner Arrangement:
10-year
arrangement with AEPV (the “Strategic Partner Arrangement”) to jointly deploy a fixed wireless broadband network in a new market. AEPV has agreed to fund the equipment necessary to deliver the service in exchange for a revenue sharing arrangement whereby they will be entitled to a percentage of revenue earned by us in the new market. Pursuant to the arrangement, we will sell in exchange for cash consideration the equipment to AEPV and lease the equipment back. The seller-financing portion of the transaction created a form of continuing involvement which precludes sale-leaseback accounting until the related amounts due are paid in full. Accordingly, we accounted for the sale-leaseback as a financing transaction with AEPV, with the equipment remaining on our books at its then carrying value, the net cash proceeds received being reflected as a financing obligation, and the expected future payments under the revenue sharing agreement to the third party being treated as debt service applied to interest and principal over the initial10-year
term. The discount rate is calculated based on expected future payments under the revenue sharing agreement. AEPV has the right to terminate the arrangement for any reason no earlier than June 2023. In the event of an early termination, we are required to repurchase the equipment at a repurchase price equal to the net book value of the equipment as reflected on the third party’s balance sheet at the time of termination. We have made an accounting policy election to use the prospective method to account for changes in actual or estimated cash flows related to the debt service.As of March 31, 2022, the financing obligation was $9,032, of which $412 and $8,620 was included in the current and
non-current
portion of debt, respectively, on the condensed consolidated balance sheet. As of March 31, 2022, $494 of reimbursable expenses is owed by the third party and is included in prepaid expenses and other current assets on the condensed consolidated balance sheet.Operating leases:
non-cancelable
agreements. Total rent expense for the three months ended March 31, 2022 and 2021 was $3,677 and $3,305, respectively.Purchase Commitments:
non-cancelable
purchase commitments with various contract manufacturers during the three months ended March 31, 2022 to purchase items to be installed in the Company’s distribution system. As of March 31, 2022, these purchase commitments totaled $41,365.F-5
5
Advance deposit payments:
Legal Proceedings:
Note 13. Net loss per share
The Company has two classes of common stock authorized: Class A common stock and Class X common stock. The rights of the holders of Class A and Class X common stock are identical, except with respect to voting and conversion. Each share of Class A common stock is entitled to one vote per share and each share of Class X common stock is entitled to twenty votes per share. Each share of Class X common stock is convertible into one share of Class A common stock at the option of the holder at any time or automatically upon certain events described in the Company’s amended and restated certificate of incorporation. The Company allocates undistributed earnings attributable to common stock between the common stock classes on abasis when computing net loss per share. As a result, basic and diluted net income per share of Class A common stock and
one-to-one
per
share of Class X common stock are equivalent.The following table sets forth the computation of the basic and diluted net loss per share:
Three Months Ended March 31, | ||||||||
2022 | 2021 | |||||||
Numerator: | ||||||||
Net loss | $ | (53,633 | ) | $ | (41,046 | ) | ||
Denominator: | ||||||||
Weighted average shares outstanding, basic and diluted | 41,633,152 | 36,239,733 | ||||||
Basic and diluted earnings per share: | ||||||||
Class A common stock | $ | (1.29 | ) | $ | (1.13 | ) | ||
Class X common stock | $ | (1.29 | ) | $ | (1.13 | ) | ||
The Company’s potential dilutive securities, which include stock options, RSUs, convertible preferred stock, Earnout Shares and vested warrants, have been excluded from the computation of diluted net loss per share as the effect would be to reduce the net loss per share. Therefore, the weighted average number of common shares outstanding used to calculate both basic and diluted net loss per share is the same.
The weighted-average common shares and thus the net loss per share calculations and potentially dilutive security amounts for all periods prior to the Business Combination have been retrospectively adjusted to the equivalent number of shares outstanding immediately after the Business Combination to effect the reverse recapitalization. Historically reported weighted average shares outstanding have been multiplied by the exchange ratio of approximately 0.1841 (see Note 1).
Note 14. Supplemental cash flow information
The following tables provides a reconciliation of cash, cash
equivalents
and restrictedcash
reported in the condensed consolidated balance sheets as March 31, 2022 and 2021:Three Months Ended March 31, | ||||||||
2022 | 2021 | |||||||
Cash and cash equivalents | $ | 166,693 | $ | 130,501 | ||||
Restricted cash | — | 110 | ||||||
Restricted cash included in restricted cash and other assets | 1,378 | 1,127 | ||||||
Total cash, cash equivalents and restricted cash shown in the consolidated statement of cash flows | $ | 168,071 | $ | 131,738 | ||||
F-
56
The following table provides supplemental cash flow information for the three months ended March 31, 2022 and 2021:
Three Months Ended March 31, | ||||||||
2022 | 2021 | |||||||
Cash paid for interest | $ | 38 | $ | 35 | ||||
Cash paid for taxes | $ | — | $ | — | ||||
The following table provides supplemental disclosures of noncash investing and financing activities for the three months ended March 31, 2022 and 2021:
Three Months Ended March 31, | ||||||||
2022 | 2021 | |||||||
Purchases of property and equipment included within accounts payable and accrued expenses and other current liabilities | $ | 11,308 | $ | 12,764 | ||||
Unpaid deferred transaction costs included within accounts payable and accrued expenses | $ | 4,050 | $ | 55 | ||||
Property and equipment acquired through capital lease obligations | $ | 558 | $ | 386 | ||||
Asset retirement obligations associated with deployed equipment | $ | 165 | $ | 208 | ||||
Conversion of convertible notes to Series E Preferred Stock | $ | — | $ | 42,784 | ||||
Note 15. Redeemable shares
On March 31, 2022, the Company entered into an agreement with certain debt holders who are also shareholders (the “Optionholders”) of 1,209,029 shares of Class A common stock (the “Shares”) that grants and conveys to the Optionholders the option, in their sole discretion, to participate in a refinancing in full (the “Refinancing”) of the outstanding Term Loans, by providing new senior secured term loans and/or notes (including convertible notes), in each case on a first lien and/or junior lien basis as agreed upon by the parties (and such term loans and/or notes, the “New Debt”), to the Company and/or any of its subsidiaries as the borrower(s) in respect of such refinancing indebtedness (the “New Financing”). For the avoidance of doubt, nothing in the agreement requires the Company to enter into any Refinancing.
The agreement also grants and conveys to each Optionholder the following exchange rights:
New Debt Exchange
In connection with a Refinancing, the Optionholders have the option, in their sole discretion, to exchange all or a portion of their Shares at an agreed value of $8.75 (as appropriately adjusted for any stock split, stock dividend, recapitalization or similar transaction affecting such shares) per share (for the avoidance of doubt, irrespective of the price of which the Class A common stock is trading on the New York Stock Exchange) for an equal principal amount of New Debt (the “New Debt Exchange”).
In the event that (i) an Optionholder has exercised the New Debt Exchange but the other financing sources or the administrative agent for the New Financing choose not to permit such Optionholder from participating in the New Financing for any reason, (ii) an Optionholder has elected not to exercise the New Debt Exchange or has exercised the New Debt Exchange for only a portion of its Shares for New Debt or (iii) the terms and conditions of such New Financing are not reasonable satisfactory to such Optionholder, then such Optionholder may require the Company to purchase from such Optionholder all or any portion of its Shares that are not exchange for New Debt at an agreed value of $8.75 (as appropriately adjusted for any stock split, stock dividend, recapitalization or similar transaction affecting such shares) per share (for the avoidance of doubt, irrespective of the price of which the Class A common stock is trading on the New York Stock Exchange). Such repurchase shall be effected substantially concurrently with or prior to consummation of the Refinancing.
F-
57
In the event any Optionholder does not elect to either (i) exchange any portion of its Shares for New Debt or (ii) require that the Company purchase from such Optionholder any portion of its Shares, in each case in connection with a Refinancing, then the agreement shall terminate and be of no further force and effect as of the consummation of such Refinancing.
Junior Debt Exchange
Prior to the consummation of any Refinancing, the Optionholders have the option, in their sole discretion, to exchange all or any portion of such Shares at an agreed value of $8.75 (as appropriately adjusted for any stock split, stock dividend, recapitalization or similar transaction affecting such shares) per share (for the avoidance of doubt, irrespective of the price of which the Class A common stock is trading on the New York Stock Exchange) for an equal principal amount of unsubordinated unsecured term loans or notes under a new debt facility (the “Junior Debt”) and not, for the avoidance of doubt, issued or incurred under the Starry Credit Agreement (the “Junior Debt Exchange”). Any Junior Debt shall mature on the earliest of the maturity date of the Starry Credit Agreement, the acceleration of the Term Loans in accordance with the Starry Credit Agreement, or the consummation of a Refinancing, and shall bear interest at a rate equal to Term Secured Overnight Financing Rate (“SOFR”) plus 1.00%. The aggregate principal amount of Junior Debt shall not exceed $15,000 and Starry, Inc. will be the borrower.
In connection with any Refinancing subsequent to the incurrence or issuance of any Junior Debt, the Company grants and conveys to each Optionholder the irrevocable option, in such Optionholder’s sole discretion, to exchange all or any portion of the principal amount of its Junior Debt on abasis for an equal principal amount of New Debt.
dollar-for-dollar
Accounting Conclusion
The Company assessed the embedded conversion features within such Shares and determined that the Junior Debt Exchange, which provides the Optionholders with the right to force a cash redemption prior to any Refinancing event, met the definition of a derivative under ASC 815 and would require separate accounting from the Shares. The Company estimated the fair value of the Junior Debt Exchange based on a Black-Scholes option pricing model (see Note 2) and recorded $1,986 in other liabilities on the condensed consolidated balance sheet with the offset recorded in other income (expense), net on the condensed consolidated statement of operations.
With respect to the Junior Debt Exchange, the embedded conversion right where the Optionholders could force a cash redemption of such Shares, such Shares were required to be reclassified from permanent equity to temporary equity at the redemption value of $8.75 per Share as of March 31, 2022. As a result, the redemption value of $10,579 was recorded in APIC on the condensed consolidated statement of stockholders’ equity (deficit). Subsequent measurements, if applicable, will be recorded through APIC.
With respect to the New Debt Exchange, the Company concluded it did not meet the definition of a derivative and would not require separate accounting from the Shares because the Refinancing event that would trigger a cash redemption is within the Company’s control.
Note 16. Subsequent events
The Company evaluated all events or transactions that occurred after March 31, 2022 through May 16, 2022, the date the condensed consolidated financial statements were available to be issued.
On April 25, 2022, Starry Group issued a notice (the “Warrant Adjustment Notice”) to holders of the Public Warrants, notifying holders of the following adjustments (the “Warrant Adjustments”), effective after the close of trading on April 22, 2022:
| • | the adjustment to the warrant price of the Public Warrants from $11.50 per 1.2415 shares to $9.13 per 1.2415 shares of Class A common stock (representing 115% of the Market Value (as described below)); |
| • | the adjustment of the $18.00 per share redemption trigger price described in Sections 6.1 and 6.2 of the Warrant Agreement (as described below) to $14.29 per share of Class A common stock (representing 180% of the Market Value); and |
| • | the adjustment of the $10.00 per share redemption trigger price described in Section 6.2 of the Warrant Agreement to $7.94 per share of Class A common stock (representing the Market Value). |
The Warrant Adjustments were required pursuant to Section 4.4 of the Warrant Agreement, dated as of October 8, 2020, by and between FirstMark, and Continental Stock Transfer & Trust Company, a New York corporation (the “Warrant Agent”), as warrant agent, as amended by that certain Warrant Assignment, Assumption and Amendment Agreement, dated as of March 28, 2022, by and
F-
58
among Starry Group, FirstMark and the Warrant Agent (as amended, the “Warrant Agreement”) as a result of (i) Starry Group issuing shares of its Class A common stock and securities exchangeable for shares of Class A common stock at an issue price of $7.50 per share (the “Newly Issued Price”) for capital raising purposes in connection with the closing the Business Combination, (ii) the aggregate gross proceeds from such issuances representing more than 60% of the total equity proceeds, and interest thereon, available for the funding of the Business Combination on the date of the completion of the Business Combination (net of redemptions) and (iii) the volume-weighted average trading price of the Class A common stock during the 20 trading day period starting on the trading day prior to the day on which the Business Combination was consummated (such price, the “Market Value”) being below $9.20 per share. The Market Value was determined to be $7.94 per share.
F-
59
PART II
INFORMATION NOT REQUIRED IN PROSPECTUS
Item 13. Other Expenses of Issuance and Distribution.
The following table sets forth the estimated expenses to be borne by the registrant in connection with the issuance and distribution of the securities being registered hereby. All of such expenses are estimates, other than the filing fee payable to the U.S. Securities and Exchange Commission (the “SEC”).
SEC registration fee | $ | 117,701.62 | ||
Accounting fees and expenses | * | |||
Legal fees and expenses | * | |||
Financial printing and miscellaneous expenses | * | |||
Total | $ | * |
| * | These fees are calculated based on the securities offered and the number of issuances and accordingly cannot be determined at this time. |
Item 14. Indemnification of Directors and Officers.
Section 145(a) of the General Corporation Law of the State of Delaware (the “DGCL”) provides, in general, that a corporation may indemnify any person who was or is a party to or is threatened to be made a party to any threatened, pending or completed action, suit or proceeding, whether civil, criminal, administrative or investigative (other than an action by or in the right of the corporation), because he or she is or was a director, officer, employee or agent of the corporation, or is or was serving at the request of the corporation as a director, officer, employee or agent of another corporation, partnership, joint venture, trust, or other enterprise, against expenses (including attorneys’ fees), judgments, fines and amounts paid in settlement actually and reasonably incurred by the person in connection with such action, suit, or proceeding, if he or she acted in good faith and in a manner he or she reasonably believed to be in or not opposed to the best interests of the corporation and, with respect to any criminal action or proceeding, had no reasonable cause to believe his or her conduct was unlawful.
Section 145(b) of the DGCL provides, in general, that a corporation may indemnify any person who was or is a party or is threatened to be made a party to any threatened, pending or completed action or suit by or in the right of the corporation to procure a judgment in its favor because the person is or was a director, officer, employee or agent of the corporation, or is or was serving at the request of the corporation as a director, officer, employee or agent of another corporation, partnership, joint venture, trust or other enterprise, against expenses (including attorneys’ fees) actually and reasonably incurred by the person in connection with the defense or settlement of such action or suit if he or she acted in good faith and in a manner he or she reasonably believed to be in or not opposed to the best interests of the corporation, except that no indemnification shall be made with respect to any claim, issue, or matter as to which he or she shall have been adjudged to be liable to the corporation unless and only to the extent that the Court of Chancery or other adjudicating court determines that, despite the adjudication of liability but in view of all of the circumstances of the case, he or she is fairly and reasonably entitled to indemnity for such expenses that the Court of Chancery or other adjudicating court shall deem proper.
Section 145 of the DGCL further provides that to the extent a director or officer of a corporation has been successful on the merits or otherwise in the defense of any action, suit, or proceeding referred to in Section 145(a) or (b) of the DGCL, or in defense of any claim, issue, or matter therein, such person shall be indemnified against expenses (including attorneys’ fees) actually and reasonably incurred by such person in connection therewith; that indemnification provided for by Section 145 of the DGCL shall not be deemed exclusive of any other rights to which the indemnified party may be entitled; and the indemnification provided for by Section 145 of the DGCL shall, unless otherwise provided when authorized or ratified, continue as to a person who has ceased to be a director, officer, employee, or agent and shall inure to the benefit of such person’s heirs, executors, and administrators. Section 145(g) of the DGCL provides, in general, that a corporation may purchase and maintain insurance on behalf of any person who is or was a director, officer, employee, or agent of the corporation, or is or was serving at the request of the corporation as a director, officer, employee or agent of another corporation, partnership, joint venture, trust or other enterprise against any liability asserted against such person and incurred by such person in any such capacity, or arising out of his or her status as such, whether or not the corporation would have the power to indemnify the person against such liability under Section 145 of the DGCL.
Section 102(b)(7) of the DGCL provides that a corporation’s certificate of incorporation may contain a provision eliminating or limiting the personal liability of a director to the corporation or its stockholders for monetary damages for breach of fiduciary duty as a director, provided that such provision shall not eliminate or limit the liability of a director (i) for any breach of the director’s duty of loyalty to the corporation or its stockholders, (ii) for acts or omissions not in good faith or which involve intentional misconduct or a knowing violation of law, (iii) under Section 174 of the DGCL or (iv) for any transaction from which the director derived an improper personal benefit.
II-1
Additionally, the Amended and Restated Certificate of Incorporation of Starry Group Holdings, Inc. (the “Company”) and Bylaws of the Company limit the liability of the Company’s directors to the fullest extent permitted by the DGCL, and provide that the Company will indemnify its directors to the fullest extent permitted by the DGCL. The Company is party to indemnification agreements with each of its directors and executive officers. These agreements provide that the Company will indemnify each of its directors and such officers to the fullest extent permitted by law and the Company’s Amended and Restated Certificate of Incorporation and Bylaws, and will provide for advancement of expenses incurred as a result of any proceeding against them as to which they could be indemnified.
The Company maintains a general liability insurance policy, which covers certain liabilities of the Company’s directors and officers arising out of claims based on acts or omissions in their capacities as directors or officers.
Item 15. Recent Sales of Unregistered Securities.
The following list sets forth information as to all of the Company’s securities sold in the last three years which were not registered under the U.S. Securities Act of 1933, as amended (the “Securities Act”). The descriptions of these issuances are historical and have not been adjusted to give effect to the Business Combination. Capitalized terms used and not defined in this Item 15 have the meaning given to them in the prospectus which forms a part of this registration statement.
| • | On March 29, 2022, in conjunction with the Business Combination, the Company consummated the sale of 14,533,334 shares (the “PIPE Shares”) of Class A Common Stock to certain accredited investors pursuant to subscription agreements entered into on October 6, 2021 in conjunction with the Merger Agreement. The PIPE Shares were sold at a price of $7.50 per share and an aggregate purchase price of $109.0 million. |
| • | On March 29, 2022, in conjunction with the Business Combination, the Company consummated the sale of 4,133,333 shares (the “Series Z Shares”) of Series Z Preferred Stock to certain accredited investors affiliated with the Sponsor, pursuant to a subscription agreement entered into on October 6, 2021 in conjunction with the Merger Agreement and an additional subscription agreement entered into on March 25, 2022. The Series Z Shares were sold at a price of $7.50 per share and an aggregate purchase price of $31.0 million. The Series Z Shares were sold following the SPAC Merger and immediately prior to the Acquisition Merger. Upon the Acquisition Merger, each share of the then-outstanding Series Z Preferred Stock converted automatically into the right to receive shares of our Class A Common Stock on a one-for-one |
We issued the PIPE Shares and the Series Z Shares under Section 4(a)(2) of the Securities Act and/or Rule 506 of Regulation D promulgated under the Securities Act, as a transaction not requiring registration under Section 5 of the Securities Act. The parties receiving the securities represented their intentions to acquire the securities for investment only and not with a view to or for sale in connection with any distribution, and appropriate restrictive legends were affixed to the certificates representing the securities (or reflected in restricted book entry with our transfer agent). The parties also had adequate access, through business or other relationships, to information about the Company.
The Company issued the foregoing securities in transactions not involving an underwriter and not requiring registration under Section 5 of the Securities Act in reliance on the exemption afforded by Section 4(a)(2) thereof.
Item 16. Exhibits and Financial Statement Schedules.
| (a) | Exhibits |
| (b) | Financial Statement Schedules |
Item 17. Undertakings.
| (a) | The undersigned registrant hereby undertakes: |
| (1) | to file, during any period in which offers or sales are being made, a post-effective amendment to this registration statement: |
| (i) | to include any prospectus required by Section 10(a)(3) of the Securities Act; |
II-2
| (ii) | to reflect in the prospectus any facts or events arising after the effective date of the registration statement (or the most recent post-effective amendment thereof) which, individually or in the aggregate, represent a fundamental change in the information set forth in the registration statement (notwithstanding the foregoing, any increase or decrease in volume of securities offered (if the total dollar value of securities offered would not exceed that which was registered) and any deviation from the low or high end of the estimated maximum offering range may be reflected in the form of prospectus filed with the SEC pursuant to Rule 424(b) if, in the aggregate, the changes in volume and price represent no more than a 20% change in the maximum aggregate offering price set forth in the “Calculation of Registration Fee” table in the effective registration statement); and |
| (iii) | to include any material information with respect to the plan of distribution not previously disclosed in the registration statement or any material change to such information in the registration statement; |
provided, however, that clauses (i), (ii) and (iii) do not apply if the registration statement is on Form
S-1
and the information required to be included in a post-effective amendment by those paragraphs is contained in reports filed with or furnished to the SEC by the registrant pursuant to Section 13 or Section 15(d) of the Securities Exchange Act of 1934, as amended, that are incorporated by reference in the registration statement, or is contained in a form of prospectus filed pursuant to Rule 424(b) that is part of the registration statement;| (2) | that, for the purpose of determining any liability under the Securities Act, each such post-effective amendment shall be deemed to be a new registration statement relating to the securities offered therein, and the offering of such securities at that time shall be deemed to be the initial bona fide |
| (3) | to remove from registration by means of a post-effective amendment any of the securities being registered which remain unsold at the termination of the offering; |
| (4) | that, for the purpose of determining liability under the Securities Act to any purchaser, each prospectus filed pursuant to Rule 424(b) as part of a registration statement relating to an offering, other than registration statements relying on Rule 430B or other than prospectuses filed in reliance on Rule 430A, shall be deemed to be part of and included in the registration statement as of the date it is first used after effectiveness; provided, however |
| (5) | that, for the purpose of determining liability of the registrant under the Securities Act to any purchaser in the initial distribution of the securities, the undersigned registrant undertakes that in a primary offering of securities of the undersigned registrant pursuant to this registration statement, regardless of the underwriting method used to sell the securities to the purchaser, if the securities are offered or sold to such purchaser by means of any of the following communications, the undersigned registrant will be a seller to the purchaser and will be considered to offer or sell such securities to such purchaser: |
| (i) | any preliminary prospectus or prospectus of the undersigned registrant relating to the offering required to be filed pursuant to Rule 424; |
| (ii) | any free writing prospectus relating to the offering prepared by or on behalf of the undersigned registrant or used or referred to by the undersigned registrant; |
| (iii) | the portion of any other free writing prospectus relating to the offering containing material information about the undersigned registrant or its securities provided by or on behalf of an undersigned registrant; and |
| (iv) | any other communication that is an offer in the offering made by the undersigned registrant to the purchaser. |
| (b) | Insofar as indemnification for liabilities arising under the Securities Act may be permitted to directors, officers and controlling persons of the registrant pursuant to the foregoing provisions, or otherwise, the registrant has been advised that, in the opinion of the SEC, such indemnification is against public policy as expressed in the Securities Act and is, therefore, unenforceable. In the event that a claim for indemnification against such liabilities (other than the payment by the registrant of expenses incurred or paid by a director, officer or controlling person of the registrant in the successful defense of any action, suit, or proceeding) is asserted by such director, officer or controlling person in connection with the securities being registered, the registrant will, unless in the opinion of its counsel the matter has been settled by controlling precedent, submit to a court of appropriate jurisdiction the question whether such indemnification by it is against public policy as expressed in the Securities Act and will be governed by the final adjudication of such issue. |
II-3
EXHIBIT INDEX
II-4
II-5
| † | Certain of the exhibits and schedules to this exhibit have been omitted in accordance with Regulation S-K Item 601(a)(5). The registrant agrees to furnish a copy of all omitted exhibits and schedules to the SEC upon its request. |
| + | Certain portions of this exhibit (indicated by “[***]”) have been omitted pursuant to Regulation S-K, Item (601)(b)(10). |
II-6
SIGNATURES
Pursuant to the requirements of the Securities Act, the registrant has duly caused this registration statement to be signed on its behalf by the undersigned, thereunto duly authorized, in the City of Boston, Massachusetts, on June 3, 2022.
| STARRY GROUP HOLDINGS, INC. | ||
| By: | /s/ Chaitanya Kanojia | |
| Name: | Chaitanya Kanojia | |
| Title: | Chief Executive Officer | |
Pursuant to the requirements of the Securities Act, as amended, this registration statement has been signed by the following persons in the capacities on June 3, 2022.
| Signature | Title | Date | ||
| /s/ Chaitanya Kanojia | Chief Executive Officer and Director | June 3, 2022 | ||
| Chaitanya Kanojia | (principal executive officer) | |||
| /s/ Komal Misra | Chief Financial Officer | June 3, 2022 | ||
| Komal Misra | (principal financial officer and principal accounting officer) | |||
| * | Director | June 3, 2022 | ||
| James Chiddix | ||||
| * | Director | June 3, 2022 | ||
| Amish Jani | ||||
| * | Director | June 3, 2022 | ||
| Elizabeth A. Graham | ||||
| * | Director | June 3, 2022 | ||
| Robert L. Nabors II | ||||
| By: | /s/ Chaitanya Kanojia | |
| Chaitanya Kanojia | ||
| Attorney-in-fact |
II-7