Interest expense increased by $3.1 million, or 63.2%, for the three months ended June 30, 2022, compared to the three months ended June 30, 2021, primarily driven by an increase in
interest expense of $1.9 million incurred on the Starry Credit Agreement (as defined below) and amortization of debt discounts of $1.0 million.
Other income (expense), net
Total other income (expense), net increased by $20.5 million to other income of $17.6 million for the three months ended June 30, 2022, compared to other expense of $2.9 million for the three months ended June 30, 2021, primarily driven by the fair value adjustments related to derivative liabilities. Such adjustments for the three months ended June 30, 2022 included a $11.6 million gain on change in fair value of Earnout Shares and a $9.7 million gain on change in fair value of Common Stock Warrants, partially offset by a $3.6 million loss on change in fair value of the Junior Debt Exchange. See “Note 2—Basis of presentation and summary of significant accounting policies” and “Note 4—Warrants and earnout shares” in the notes to our unaudited condensed consolidated financial statements included elsewhere in this prospectus.
Net loss decreased by $2.2 million, or 5.8%, for the three months ended June 30, 2022, compared to the three months ended June 30, 2021, primarily driven by the factors described above.
Comparison of the six months ended June 30, 2022 and 2021
The following table summarizes our results of operations on a consolidated basis for the six months ended June 30, 2022 and 2021 (in thousands, except shares and per share data):
| | | | | | | | | | | | | | | | |
| | | Six Months Ended June 30, | | | | | | | |
| | | | | | | | | | | | | |
| | $ | 15,124 | | | $ | 9,614 | | | $ | 5,510 | | | | 57.3 | % |
| | | (38,916 | ) | | | (25,822 | ) | | | (13,094 | ) | | | 50.7 | % |
| | | | | | | | | | | | | | | | |
| | | (23,792 | ) | | | (16,208 | ) | | | (7,584 | ) | | | 46.8 | % |
| | | | | | | | | | | | | | | | |
Selling, general and administrative | | | (50,218 | ) | | | (30,238 | ) | | | (19,980 | ) | | | 66.1 | % |
| | | (16,037 | ) | | | (12,418 | ) | | | (3,619 | ) | | | 29.1 | % |
| | | | | | | | | | | | | | | | |
| | | (66,255 | ) | | | (42,656 | ) | | | (23,599 | ) | | | 55.3 | % |
| | | | | | | | | | | | | | | | |
| | | (90,047 | ) | | | (58,864 | ) | | | (31,183 | ) | | | 53.0 | % |
| | | | | | | | | | | | | | | | |
| | | (15,568 | ) | | | (12,581 | ) | | | (2,987 | ) | | | 23.7 | % |
Other income (expense), net | | | 15,675 | | | | (8,155 | ) | | | 23,830 | | | | 292.2 | % |
| | | | | | | | | | | | | | | | |
Total other income (expense) | | | 107 | | | | (20,736 | ) | | | 20,843 | | | | 100.5 | % |
| | | (89,940 | ) | | | (79,600 | ) | | | (10,340 | ) | | | 13.0 | % |
| | | | | | | | | | | | | | | | |
Net loss per share of common stock, basic and diluted | | $ | (0.88 | ) | | $ | (2.19 | ) | | $ | 1.31 | | | | (59.8 | )% |
| | | | | | | | | | | | | | | | |
Weighted-average shares outstanding, basic and diluted | | | 102,357,494 | | | | 36,325,426 | | | | 66,032,069 | | | | 181.8 | % |
| | | | | | | | | | | | | | | | |
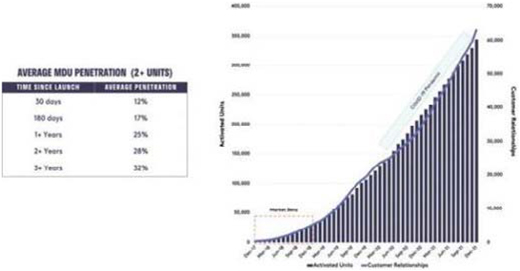
Revenues grew by $5.5 million, or 57.3%, for the six months ended June 30, 2022 compared to the six months ended June 30, 2021, as a result of an increase in our customer relationships from 47,786 to 80,950, partially offset by a decline in ARPU. The increase in our customer relationships is primarily driven by customer acquisition on our deployed network and incremental network expansion.
Cost of revenues increased by $13.1 million, or 50.7%, for the six months ended June 30, 2022 compared to the six months ended June 30, 2021, primarily due to an increase of $6.2 million in deployed equipment depreciation related to our network expansion, with the remainder predominantly due to headcount related expenses and network service costs.
Selling, general and administrative expenses
Selling, general and administrative expenses increased by $20.0 million, or 66.1%, for the six months ended June 30, 2022 compared to the six months ended June 30, 2021, primarily driven by increases of $10.4 million in headcount related expenses including $2.7 million in
one-time
deal incentive payments related to the Business Combination and $2.9 million in stock-based compensation predominantly due to RSUs for which the related performance condition was met upon consummation of the Business Combination, $2.2 million in legal and accounting professional services primarily associated with transaction-related costs and public company costs, $1.4 million in business insurance and $2.2 million in software subscription expenses.
Research and development expenses
Research and development expenses increased by $3.6 million, or 29.1%, for the six months ended June 30, 2022, compared to the six months ended June 30, 2021, primarily driven by increases of $2.9 million in headcount related expenses to support the development of our network and development of next generation equipment, including $1.3 million in stock-based compensation predominantly due to RSUs for which the related performance condition was met upon consummation of the Business Combination.
Interest expense increased by $3.0 million, or 23.7%, for the six months ended June 30, 2022, compared to the six months ended June 30, 2021, primarily driven by an increase in
interest expense of $3.7 million incurred on the Starry Credit Agreement (as defined below) and amortization of debt discounts of $2.0 million, partially offset by a decrease in amortization of $2.7 million and interest expense of $0.2 million related to the beneficial conversion feature on the 2020 Notes and the 2021 Notes (each as defined in “Note 4 — Debt” in the notes to our unaudited condensed consolidated financial statements included elsewhere in this Quarterly Report on Form
10-Q)
that settled in the first quarter 2021.
Other income (expense), net
Total other income (expense), net increased by $23.8 million to other income of $15.7 million for the six months ended June 30, 2022, compared to other expense of $8.2 million for the six months ended June 30, 2021, primarily driven by the $2.4 million loss on extinguishment of debt during the six months ended June 30, 2021 with no corresponding debt extinguishment during the six months ended June 30, 2022, the recognition of $3.9 million in distributions to
Non-Redeeming
Shareholders, and the fair value adjustments related to derivative liabilities. Such adjustments for the six months ended June 30, 2022 included a $16.8 million gain on change in fair value of Earnout Shares, a $2.2 million gain on change in fair value of liability-classified Starry Warrants and a $7.2 million gain on change in fair value of Common Stock Warrants, partially offset by a $5.6 million loss on the recognition and change in fair value of the Junior Debt Exchange and a $1.0 million loss on change in fair value of the Prepayment Penalty. See “Note 2—Basis of presentation and summary of significant accounting policies” and “Note 4—Warrants and earnout shares” in the notes to our unaudited condensed consolidated financial statements included elsewhere in this Quarterly Report on Form
10-Q.
Net loss increased by $10.3 million, or 13.0%, for the six months ended June 30, 2022, compared to the six months ended June 30, 2021, primarily driven by the factors described above.
Comparison for the years ended December 31, 2021 and 2020
The following table summarizes our results of operations on a consolidated basis for the years ended December 31, 2021 and 2020 (in thousands, except shares and per share data):
| | | | | | | | | | | | | | | | |
| | | | | | | | | | |
| | | | | | | | | | | | | |
| | $ | 22,263 | | | $ | 12,826 | | | $ | 9,437 | | | | 73.6 | % |
| | | (58,363 | ) | | | (38,529 | ) | | | (19,834 | ) | | | 51.5 | % |
| | | | | | | | | | | | | | | | |
| | | (36,100 | ) | | | (25,703 | ) | | | (10,397 | ) | | | 40.5 | % |
| | | | | | | | | | | | | | | | |
Selling, general and administrative expenses | | | (67,129 | ) | | | (55,240 | ) | | | (11,889 | ) | | | 21.5 | % |
| | | (26,308 | ) | | | (22,957 | ) | | | (3,351 | ) | | | 14.6 | % |
| | | | | | | | | | | | | | | | |
| | | (93,437 | ) | | | (78,197 | ) | | | (15,240 | ) | | | 19.5 | % |
| | | | | | | | | | | | | | | | |
| | | (129,537 | ) | | | (103,900 | ) | | | (25,637 | ) | | | 24.7 | % |
| | | | | | | | | | | | | | | | |
| | | (24,739 | ) | | | (19,382 | ) | | | (5,357 | ) | | | 27.6 | % |
Other income (expense), net | | | (12,269 | ) | | | (1,811 | ) | | | (10,458 | ) | | | 577.5 | % |
| | | | | | | | | | | | | | | | |
| | | (37,008 | ) | | | (21,193 | ) | | | (15,815 | ) | | | 74.6 | % |
| | $ | (166,545 | ) | | $ | (125,093 | ) | | $ | (41,452 | ) | | | 33.1 | % |
| | | | | | | | | | | | | | | | |
Net loss per share of voting and non-voting common stock, basic and diluted | | $ | (4.55 | ) | | $ | (3.50 | ) | | $ | (1.05 | ) | | | 30.1 | % |
| | | | | | | | | | | | | | | | |
Weighted-average shares outstanding, basic and diluted | | | 36,569,966 | | | | 35,743,961 | | | | 826,005 | | | | 2.3 | % |
| | | | | | | | | | | | | | | | |