UNITED STATES
SECURITIES AND EXCHANGE COMMISSION
Washington, D.C. 20549
FORM N-CSR
CERTIFIED SHAREHOLDER REPORT OF REGISTERED
MANAGEMENT INVESTMENT COMPANIES
| Investment Company Act file number: 811-23742 |
CONNORS FUNDS
(Exact name of registrant as specified in charter)
1210 Broadcasting Road, Suite 200
Wyomissing, Pennsylvania 19610
(Address of principal executive offices) (Zip code)
Peter Connors, President
c/o Connors Investor Services, Inc.
1210 Broadcasting Road, Suite 200
Wyomissing, Pennsylvania 19610
(Name and address of agent for service)
With copy to: Jeffrey T. Skinner, Esq.
Kilpatrick Townsend & Stockton LLP
1001 West Fourth Street
Winston-Salem, NC 27101
| Registrant’s telephone number, including area code: | (610) 376-7418 |
| Date of fiscal year end: | November 30 |
| Date of reporting period: | November 30, 2023 |
Form N-CSR is to be used by management investment companies to file reports with the Commission not later than 10 days after the transmission to stockholders of any report that is required to be transmitted to stockholders under Rule 30e-1 under the Investment Company Act of 1940 (17 CFR 270.30e-1). The Commission may use the information provided on Form N-CSR in its regulatory, disclosure review, inspection and policymaking roles.
A registrant is required to disclose the information specified by Form N-CSR, and the Commission will make this information public. A registrant is not required to respond to the collection of information contained in Form N-CSR unless the Form displays a currently valid Office of Management and Budget ("OMB") control number. Please direct comments concerning the accuracy of the information collection burden estimate and any suggestions for reducing the burden to Secretary, Securities and Exchange Commission, 450 Fifth Street, NW, Washington, DC 20549-0609. The OMB has reviewed this collection of information under the clearance requirements of 44 U.S.C. § 3507.
Item 1. Reports to Stockholders.
| (a) |
 |
| Connors Hedged Equity Fund |
| Annual Report |
| November 30, 2023 |
| Fund Adviser: |
| Connors Investor Services, Inc. 1210 Broadcasting Road, Suite 200 Wyomissing, PA 19610 |
Connors Hedged Equity Fund
Management’s Discussion of Fund Performance
(Unaudited)
November 30, 2023
2023 Review
General George S. Patton was quoted as saying, “Success is how high you bounce when you hit bottom.” Following a challenging year in 2022, the market successfully rebounded in 2023 climbing, the proverbial wall of worry that included a regional bank crisis in March, a debt ceiling crisis along with possible government shutdowns, and a spike in the 10-year Treasury rate. The market was also undeterred by stubborn core inflation, particularly with regard to housing and continued rate hikes by the Federal Reserve. The Federal Funds Rate began the year at 4.25%-4.5% and is currently 5.25%-5.5% following four 25 basis points (“bps”) rate hikes. The market rallied this year in anticipation of an end to the Fed’s current rate hike program and an increasing likelihood of a soft landing rather than a recession, as many expected. A solid employment market helped buoy consumer spending while unemployment remained low, measuring 3.7% in November. Most importantly, inflation continued to moderate as measured by the CPI reaching, 3.1% year-over-year in November, above the Fed’s target rate of 2% but down significantly from June 2022 highs of 9.1%. While the markets rebounded strongly this year, the path was not straight up as the market underwent two notable pullbacks. One in March with the collapse of Silicon Valley Bank and a second in September/October as concern about “higher for longer,” large Federal budget deficits and questions about a supply/demand imbalance for US Treasuries led to a spike in 10-year Treasury rates to nearly 5%. From the October peak through November 30th, 10-year Treasury rates have subsequently declined by over 60 bps as Federal government shutdowns were averted and Fed language regarding inflation and interest rates became more benign. The market rallied on the rate pullback rebounding about 11% since the October lows and gaining about 19% through November as measured by the S&P 500®.
Much of the market upside year to date has been driven by stronger-than-expected earnings. Earnings in 2023 have been resilient, with S&P 500® earnings growing year-over-year in Q3 after only three-quarters of declines. The weakness was a result of declining profit margin due to inflation. This pressure appears to be abating as profit margin improved in Q3, and earnings growth is expected to continue into 2024 with consensus estimates calling for an 11% increase. We see productivity gains driven by technology and AI as potentially allowing for higher GDP growth without pressuring wages and, therefore, increasing inflation. We note that nonfarm productivity grew 4.7% year-over-year in the third quarter, the highest growth in three years. The economy should benefit from investments in AI as well as the trend towards reshoring.
1
Connors Hedged Equity Fund
Management’s Discussion of Fund Performance
(Unaudited) (continued)
November 30, 2023
Positioning and Returns
The Connors Hedged Equity Fund (the “Fund”) returned 7.25% in the latest 12-month period through the fiscal year ended November 30, 2023, compared to 13.84% for the S&P 500® Total Return Index, and 8.27% for the CBOE S&P 500 BuyWrite Index (“BXMSM”). The realities of rising inflation rates and an aggressive Fed hiking policy, supported by Federal Reserve Chair Jay Powell’s comments that the Fed is “far away from our price stability goal,” led the fund managers to maintain a defensive posture into the New Year 2023, continuing to overweight the Healthcare and Consumer Staples sectors while reducing Industrial and Energy exposures. Underweights were maintained in Technology and Communication Services. As the year progressed, the portfolio transitioned to a more neutral stance versus the S&P 500® Total Return Index benchmark on a sector basis, given the safety and stability factors found in the largest of Technology, Consumer Discretion, and Communication Services stocks. In addition, with the perceived end of rate hikes and better likelihood of a moderate economic slowdown given solid labor and federal spending largess, such as the Inflation Reduction Act, the fund moved back to an overweight in cyclical sectors such as Industrials and Materials towards the end of summer. With the focus on quality stocks, those with strong balance sheets, strong free cash flow, and consistent and growing earnings, the fund’s best Individual performers consisted of equities having these characteristics. These included the well-known largest of companies such as Microsoft Corp. (5.70% portfolio weight as of November 30, 2023), Apple (4.25%), Alphabet, Inc. (4.20%) and Amazon.com, Inc. (3.35%). Other top performers in various sectors included Adobe Systems, Inc. (2.72%), one of the first to monetize generative AI capabilities, Palo Alto Networks, Inc. (2.98%), a complete suite of cloud-based security, Eli Lilly & Co. (1.12%); strong pipeline with products like Mounjaro for diabetes and Zepbound for weight loss, and Eaton Corp. (2.48%), secular trend toward electrification. Underperforming holdings included NextEra Energy, Inc. (1.20% at time of sale on October 5, 2023), project pushouts, Raytheon Technologies Corp. (2.05%), manufacturing irregularities with various engine parts, and Chevron Corp. (2.45%), delays in new oil field development and the recent purchase of Hess.
Call Premium Generation
Market volatility, as measured by the CBOE Volatility Index (“VIX”), steadily descended over the latest 12-month period from mid to high 20s to finish below 14 by fiscal year-end. A surge in anxiety with a subsequent market selloff of 9% was experienced in March due to the Silicon Valley Bank and Signature Bank failures. With depositor protections and government guarantees settling the angst, markets looked forward and priced in slowing
2
Connors Hedged Equity Fund
Management’s Discussion of Fund Performance
(Unaudited) (continued)
November 30, 2023
inflation and the possible end to rate hikes, thus, volatility deflated into the summer months. However, October brought new concerns with the relentless move higher in interest rates to 5% on the 10-year Treasury Note. The surge didn’t last as weakening economic and labor numbers with surging productivity data eased rates back to 4.3%, leading to a dramatic collapse in volatility through November. Option premiums thrive in higher volatility environments and thus vary throughout the year depending on the surging and waning volatility level given the market news of the day. Generally, positions were established with a gross premium generation of 1% to 1.3% at the initiation. For every position, the decision is made to maximize return by capturing income through option writes or allowing for more upside participation with less option premium. In general, the fund manager allowed for more upside participation after periods of weakness in the market (exiting March and October) while writing more aggressively as the market moved higher (July and November). Overall, given the predominately lower volatility environment through the majority of the year and the desire by the fund manager to participate with upside after market weakness, the fund generated a net premium return of 2.72%.
Downside Put Protection
Throughout the year, put spreads were implemented to varying degrees, ranging from 15% to 50% of portfolio notional value. A fundamental structural position is maintained in most environments, with additional tactical positions implemented at the manager’s discretion. The tactical application of spreads is based on market technical readings, and general trading ranges moving to support and resistance levels. Given the general consistent upward move in the market, few opportunities were available to monetize existing put spreads. However, March and October market pullbacks provided some ability to record positive returns on several positions. Overall, the protective put positions subtracted from fund performance for the fiscal year ended November 30, 2023, by -1.09%. The fund manager considered this to be an acceptable cost of protection as we attempt to minimize overall costs.
Outlook
For 2024, we expect further upside in the market, though we suspect that the market may be overdue for some retracement early in the year following the recent Q4 rally. The Federal Reserve’s commentary regarding next year suggests a reversal from rate hikes to several rate cuts, though this will be dependent on a further decline in the inflation rate closer to its long-term target of 2%. We suspect that volatility could see an uptick from current levels and expect to utilize spikes in volatility to add premium to the portfolio when appropriate. In terms of protective puts and put spreads, we will look for opportunities to add protection
3
Connors Hedged Equity Fund
Management’s Discussion of Fund Performance
(Unaudited) (continued)
November 30, 2023
while volatility remains low. While the technology sector should continue to benefit from investments in AI, we believe that underperforming sectors such as Healthcare and Financials could outperform next year, and we will look to add exposure to stocks that could benefit from lower rates.
A big question for 2024 will be the resilience of the US consumer. While inflation has declined, prices remain much higher than they were pre-COVID. We have seen evidence of trading down and less spending on discretionary items at retailers. More dollars have been allocated towards travel and leisure versus goods, given pent-up demand following COVID shutdowns. We suspect that the consumer could remain resilient if inflation continues to decline and unemployment remains low. A big potential driver will be further increases in productivity as higher productivity will enable workers to receive wage increases without increasing unit prices. We believe that consensus S&P 500® earnings estimates for 2024 could trend higher helped by reshoring and infrastructure investments as well as a potential rebound in housing that should benefit from lower interest rates. We believe companies with reasonable valuations, strong cash flow, and growing dividends will outperform. We look for opportunities to upgrade our portfolio and could potentially add cyclical exposure if the economy continues to trend towards a soft landing.
4
Investment Results (Unaudited)
Average Annual Total Returns* as of November 30, 2023
| Since | |||
| Inception | |||
| (January 19, | |||
| One Year | 2022) | ||
| Connors Hedged Equity Fund - Institutional Class | 7.25% | 3.04% | |
| S&P 500® Total Return Index(a) | 13.84% | 2.10% |
Total annual operating expenses, based on estimated amounts for the current fiscal year, as disclosed in the Connors Hedged Equity Fund (the “Fund”) prospectus dated March 30, 2023, were 4.05% of average daily net assets (1.15% after fee waivers/expense reimbursements by Connors Investor Services, Inc. (the “Adviser”)). The Adviser has contractually agreed to waive or limit its fees and to assume other expenses of the Fund until March 31, 2025, so that total annual fund operating expenses (excluding brokerage costs, taxes, interest, borrowing costs such as interest and dividend expenses on securities sold short, Acquired Fund Fees and Expenses, extraordinary expenses such as litigation and merger or reorganization costs and other expenses not incurred in the ordinary course of the Fund’s business) do not exceed 1.15% of the Fund’s average daily net assets. This contractual arrangement may only be terminated by the Board of Trustees of the Trust, and it will automatically terminate upon the termination of the investment advisory agreement between the Fund and the Adviser. Each waiver or reimbursement of an expense by the Adviser is subject to repayment by the Fund within the three years following such waiver or reimbursement, provided that the Fund is able to make the repayment without exceeding the expense limitation in place at the time of the waiver or reimbursement and the expense limitation in place at the time of the repayment. Additional information pertaining to the Fund’s expense ratios as of November 30, 2023 can be found in the financial highlights.
The performance quoted represents past performance, which does not guarantee future results. The investment return and principal value of an investment will fluctuate so that an investor’s shares, when redeemed, may be worth more or less than their original cost. The returns shown do not reflect deduction of taxes that a shareholder would pay on Fund distributions or the redemption of Fund shares. Current performance of the Fund may be lower or higher than the performance quoted. The Fund’s investment objective, risks, charges and expenses must be considered carefully before investing. Performance data current to the most recent month end may be obtained by calling (833) 601-2676.
* Total return reflects any change in price per share and assume the reinvestment of all distributions. The Fund’s return reflects any fee reductions during the applicable periods. If such fee reductions had not occurred, the quoted performance would have been lower.
(a) The S&P 500® Total Return Index is a widely recognized unmanaged index of equity prices and is representative of a broader market and range of securities than is found in the Fund’s portfolio. The index is an unmanaged benchmark that assumes reinvestment of all distributions and excludes the effect of taxes and fees. Individuals cannot invest directly in this index; however, an individual can invest in exchange-traded funds or other investment vehicles that attempt to track the performance of a benchmark index.
The Fund’s investment objective, strategies, risks, charges and expenses must be considered carefully before investing. The prospectus contains this and other important information about the Fund and may be obtained by calling (833) 601-2676 or on the Fund’s website www.connorsinvestor.com/mutual-funds. Please read it carefully before investing.
5
Investment Results (Unaudited) (continued)
Comparison of the Growth of a $25,000 Investment in the Connors Hedged Equity Fund and the S&P 500® Total Return Index.
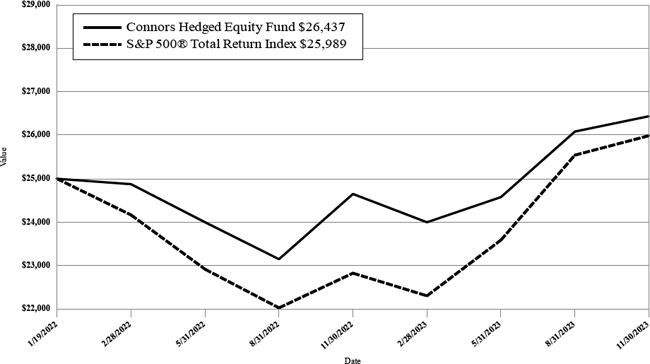
The chart above assumes an initial investment of $25,000 made on January 19, 2022 (commencement of operations) and held through November 30, 2023. THE FUND’S RETURN REPRESENTS PAST PERFORMANCE AND DOES NOT GUARANTEE FUTURE RESULTS. The returns shown do not reflect deduction of taxes that a shareholder would pay on Fund distributions or the redemption of Fund shares. Investment returns and principal values will fluctuate so that your shares, when redeemed, may be worth more or less than their original purchase price.
Current performance may be lower or higher than the performance data quoted. For more information on the Fund, and to obtain performance data current to the most recent month-end, or to request a prospectus, please call (833) 601-2676. You should carefully consider the investment objective, potential risks, management fees, and charges and expenses of the Fund before investing. The Fund’s prospectus contains this and other information about the Fund and should be read carefully before investing.
The Fund is distributed by Ultimus Fund Distributors, LLC, Member FINRA/SIPC.
6
Fund Holdings (Unaudited)
Connors Hedged Equity Fund Holdings as of November 30, 2023*
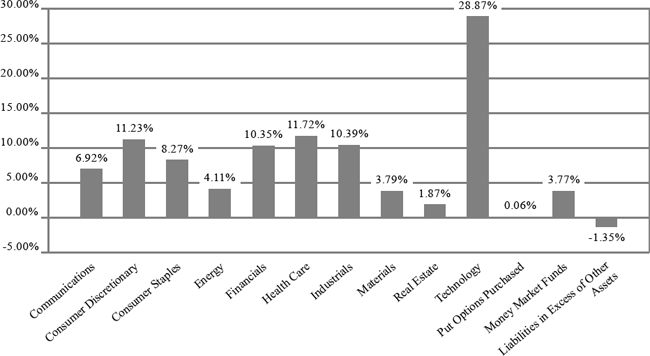
| * | As a percentage of net assets. |
The investment objective of the Fund is to seek to achieve capital appreciation and secondarily income generation, with lower volatility than U.S. equity markets.
AVAILABILITY OF PORTFOLIO SCHEDULE – (Unaudited)
The Fund files its complete schedule of portfolio holdings with the Securities and Exchange Commission (the “SEC”) for the first and third quarters of each fiscal year as an exhibit to its reports on Form N-PORT. The Fund’s Form N-PORT reports are available on the SEC’s website at www. sec.gov and on the Fund’s website at www.connorsinvestor.com/mutual-fund.
7
| Connors Hedged Equity Fund |
| Schedule of Investments |
| November 30, 2023 |
| Shares | Fair Value | |||||||
| COMMON STOCKS — 97.52% | ||||||||
| Communications — 6.92% | ||||||||
| Alphabet, Inc., Class A(a)(b) | 8,000 | $ | 1,060,240 | |||||
| Meta Platforms, Inc., Class A(a)(b) | 2,100 | 687,015 | ||||||
| 1,747,255 | ||||||||
| Consumer Discretionary — 11.23% | ||||||||
| Amazon.com, Inc.(a)(b) | 5,790 | 845,861 | ||||||
| Lowe’s Companies, Inc.(b) | 2,320 | 461,286 | ||||||
| McDonald’s Corp.(b) | 1,735 | 488,992 | ||||||
| Nike, Inc., Class B(b) | 4,400 | 485,188 | ||||||
| TJX Companies, Inc. (The)(b) | 6,300 | 555,093 | ||||||
| 2,836,420 | ||||||||
| Consumer Staples — 8.27% | ||||||||
| Coca-Cola Co. (The) | 7,935 | 463,721 | ||||||
| Costco Wholesale Corp.(b) | 1,065 | 631,268 | ||||||
| PepsiCo, Inc. | 2,830 | 476,261 | ||||||
| Procter & Gamble Co. (The)(b) | 3,360 | 515,827 | ||||||
| 2,087,077 | ||||||||
| Energy — 4.11% | ||||||||
| Chevron Corp.(b) | 4,300 | 617,480 | ||||||
| Schlumberger Ltd.(b) | 8,100 | 421,524 | ||||||
| 1,039,004 | ||||||||
| Financials — 10.35% | ||||||||
| American Express Co.(b) | 3,120 | 532,802 | ||||||
| Chubb Ltd.(b) | 2,470 | 566,692 | ||||||
| JPMorgan Chase & Co.(b) | 3,100 | 483,848 | ||||||
| Morgan Stanley(b) | 6,850 | 543,479 | ||||||
| Wells Fargo & Co.(b) | 10,885 | 485,363 | ||||||
| 2,612,184 | ||||||||
| Health Care — 11.72% | ||||||||
| Abbott Laboratories | 5,620 | 586,110 | ||||||
| AbbVie, Inc.(b) | 3,700 | 526,842 | ||||||
| Eli Lilly & Co. | 480 | 283,699 | ||||||
| Merck & Co., Inc.(b) | 3,845 | 394,036 | ||||||
| Stryker Corp.(b) | 2,300 | 681,559 | ||||||
| Zoetis, Inc., Class A(b) | 2,750 | 485,843 | ||||||
| 2,958,089 | ||||||||
| Industrials — 10.39% | ||||||||
| Eaton Corp. PLC(b) | 2,750 | 626,148 | ||||||
| Emerson Electric Co.(b) | 5,700 | 506,730 | ||||||
| Honeywell International, Inc.(b) | 2,750 | 538,779 | ||||||
| Quanta Services, Inc.(b) | 2,300 | 433,113 | ||||||
| Raytheon Technologies Corp. | 6,360 | 518,213 | ||||||
| 2,622,983 | ||||||||
| Materials — 3.79% | ||||||||
| DuPont de Nemours, Inc.(b) | 6,370 | 455,710 | ||||||
See accompanying notes which are an integral part of these financial statements.
8
| Connors Hedged Equity Fund |
| Schedule of Investments (continued) |
| November 30, 2023 |
| Shares | Fair Value | |||||||
| COMMON STOCKS — 97.52% - continued | ||||||||
| Materials — 3.79% - continued | ||||||||
| Linde PLC(b) | 1,210 | $ | 500,662 | |||||
| 956,372 | ||||||||
| Real Estate — 1.87% | ||||||||
| Welltower, Inc.(b) | 5,300 | 472,230 | ||||||
| Technology — 28.87% | ||||||||
| Adobe, Inc.(a)(b) | 1,125 | 687,386 | ||||||
| Advanced Micro Devices, Inc.(a)(b) | 5,200 | 630,032 | ||||||
| Apple, Inc.(b) | 5,655 | 1,074,166 | ||||||
| Cisco Systems, Inc.(b) | 10,600 | 512,828 | ||||||
| Microsoft Corp.(b) | 3,800 | 1,439,858 | ||||||
| NVIDIA Corp.(b) | 725 | 339,083 | ||||||
| Oracle Corp.(b) | 5,660 | 657,749 | ||||||
| Palo Alto Networks, Inc.(a)(b) | 2,550 | 752,480 | ||||||
| Salesforce, Inc.(a)(b) | 2,700 | 680,130 | ||||||
| Visa, Inc., Class A(b) | 2,010 | 515,927 | ||||||
| 7,289,639 | ||||||||
| Total Common Stocks (Cost $22,264,873) | 24,621,253 | |||||||
| Number of | Notional | Exercise | Expiration | |||||||||||||
| Description | Contracts | Amount | Price | Date | Fair Value | |||||||||||
| PUT OPTIONS PURCHASED — 0.06% | ||||||||||||||||
| S&P 500 Index | 10 | $ | 4,567,800 | $ | 4,300.00 | January 2024 | $ | 16,000 | ||||||||
| Total Options Purchased (Cost $73,220) | 16,000 | |||||||||||||||
| Shares | Fair Value | |||||||
| MONEY MARKET FUNDS - 3.77% | ||||||||
| First American Government Obligations Fund - Class X, 5.29%(c) | 951,193 | 951,193 | ||||||
| Total Money Market Funds (Cost $951,193) | 951,193 | |||||||
| Total Investments — 101.35% (Cost $23,289,286) | 25,588,446 | |||||||
| Liabilities in Excess of Other Assets — (1.35)% | (340,341 | ) | ||||||
| NET ASSETS — 100.00% | $ | 25,248,105 | ||||||
| (a) | Non-income producing security. |
| (b) | All or a portion of the security is held as collateral for written options. |
| (c) | Rate disclosed is the seven day effective yield as of November 30, 2023. |
See accompanying notes which are an integral part of these financial statements.
9
| Connors Hedged Equity Fund |
| Schedule of Open Written Option Contracts |
| November 30, 2023 |
| Number of | Notional | Exercise | Expiration | |||||||||||||
| Description | Contracts | Amount | Price | Date | Fair Value | |||||||||||
| WRITTEN OPTIONS (1.03)% | ||||||||||||||||
| WRITTEN CALL OPTIONS (1.01)% | ||||||||||||||||
| AbbVie, Inc. | (19) | $ | (270,541 | ) | $ | 155.00 | January 2024 | $ | (675 | ) | ||||||
| AbbVie, Inc. | (2) | (28,478 | ) | 165.00 | January 2024 | (12 | ) | |||||||||
| Adobe, Inc. | (5) | (305,505 | ) | 590.00 | January 2024 | (21,013 | ) | |||||||||
| Advanced Micro Devices, Inc. | (8) | (96,928 | ) | 130.00 | January 2024 | (2,480 | ) | |||||||||
| Advanced Micro Devices, Inc. | (23) | (278,668 | ) | 135.00 | January 2024 | (4,301 | ) | |||||||||
| Alphabet, Inc. | (17) | (225,301 | ) | 140.00 | January 2024 | (2,711 | ) | |||||||||
| Alphabet, Inc. | (17) | (225,301 | ) | 150.00 | January 2024 | (451 | ) | |||||||||
| Alphabet, Inc. | (6) | (79,518 | ) | 152.50 | January 2024 | (114 | ) | |||||||||
| Alphabet, Inc. | (3) | (39,759 | ) | 155.00 | January 2024 | (41 | ) | |||||||||
| Alphabet, Inc. | (4) | (53,012 | ) | 150.00 | February 2024 | (552 | ) | |||||||||
| Amazon.com, Inc. | (8) | (116,872 | ) | 155.00 | December 2023 | (356 | ) | |||||||||
| Amazon.com, Inc. | (23) | (336,007 | ) | 150.00 | January 2024 | (8,970 | ) | |||||||||
| American Express Co. | (15) | (256,155 | ) | 175.00 | February 2024 | (7,838 | ) | |||||||||
| American Express Co. | (2) | (34,154 | ) | 185.00 | February 2024 | (396 | ) | |||||||||
| Apple, Inc. | (31) | (588,845 | ) | 205.00 | February 2024 | (6,433 | ) | |||||||||
| Chevron Corp. | (7) | (100,520 | ) | 180.00 | December 2023 | (7 | ) | |||||||||
| Chevron Corp. | (17) | (244,120 | ) | 175.00 | January 2024 | (94 | ) | |||||||||
| Chubb Ltd. | (13) | (298,259 | ) | 230.00 | January 2024 | (6,955 | ) | |||||||||
| Cisco Systems, Inc. | (46) | (222,548 | ) | 60.00 | January 2024 | (92 | ) | |||||||||
| Costco Wholesale Corp. | (4) | (237,096 | ) | 600.00 | January 2024 | (5,560 | ) | |||||||||
| DuPont De Nemours, Inc. | (2) | (14,308 | ) | 80.00 | January 2024 | (20 | ) | |||||||||
| DuPont De Nemours, Inc. | (36) | (257,544 | ) | 82.50 | January 2024 | (180 | ) | |||||||||
See accompanying notes which are an integral part of these financial statements.
10
| Connors Hedged Equity Fund |
| Schedule of Open Written Option Contracts (continued) |
| November 30, 2023 |
| Number of | Notional | Exercise | Expiration | |||||||||||||
| Description | Contracts | Amount | Price | Date | Fair Value | |||||||||||
| WRITTEN OPTIONS (1.03)% (continued) | ||||||||||||||||
| WRITTEN CALL OPTIONS (1.01)% (continued) | ||||||||||||||||
| Eaton Corp. PLC. | (6) | $ | (136,614 | ) | $ | 230.00 | January 2024 | $ | (3,930 | ) | ||||||
| Eaton Corp. PLC. | (8) | (182,152 | ) | 240.00 | January 2024 | (2,080 | ) | |||||||||
| Emerson Electric Co. | (6) | (53,340 | ) | 100.00 | December 2023 | (18 | ) | |||||||||
| Emerson Electric Co. | (26) | (231,140 | ) | 105.00 | January 2024 | (130 | ) | |||||||||
| Honeywell International, Inc. | (15) | (293,880 | ) | 210.00 | January 2024 | (750 | ) | |||||||||
| JPMorgan Chase & Co. | (18) | (280,944 | ) | 160.00 | January 2024 | (4,230 | ) | |||||||||
| Linde PLC | (2) | (82,754 | ) | 400.00 | January 2024 | (3,970 | ) | |||||||||
| Linde PLC | (5) | (206,885 | ) | 410.00 | January 2024 | (6,325 | ) | |||||||||
| Lowe’s Companies, Inc. | (12) | (238,596 | ) | 220.00 | January 2024 | (696 | ) | |||||||||
| McDonald’s Corp. | (2) | (56,368 | ) | 280.00 | January 2024 | (1,520 | ) | |||||||||
| McDonald’s Corp. | (9) | (253,656 | ) | 295.00 | January 2024 | (1,008 | ) | |||||||||
| Merck & Co., Inc. | (14) | (143,472 | ) | 115.00 | December 2023 | (70 | ) | |||||||||
| Merck & Co., Inc. | (9) | (92,232 | ) | 105.00 | January 2024 | (1,404 | ) | |||||||||
| Meta Platforms, Inc. | (5) | (163,575 | ) | 350.00 | December 2023 | (473 | ) | |||||||||
| Meta Platforms, Inc. | (7) | (229,005 | ) | 360.00 | February 2024 | (6,737 | ) | |||||||||
| Microsoft Corp. | (2) | (75,782 | ) | 350.00 | January 2024 | (6,640 | ) | |||||||||
| Microsoft Corp. | (2) | (75,782 | ) | 360.00 | January 2024 | (4,980 | ) | |||||||||
| Microsoft Corp. | (18) | (682,038 | ) | 370.00 | January 2024 | (30,149 | ) | |||||||||
| Morgan Stanley | (10) | (79,340 | ) | 97.50 | January 2024 | (50 | ) | |||||||||
| Nike, Inc. | (20) | (220,540 | ) | 115.00 | January 2024 | (5,220 | ) | |||||||||
| Nike, Inc. | (6) | (66,162 | ) | 120.00 | January 2024 | (765 | ) | |||||||||
| NVIDIA Corp. | (4) | (187,080 | ) | 575.00 | January 2024 | (588 | ) | |||||||||
See accompanying notes which are an integral part of these financial statements.
11
| Connors Hedged Equity Fund |
| Schedule of Open Written Option Contracts (continued) |
| November 30, 2023 |
| Number of | Notional | Exercise | Expiration | |||||||||||||
| Description | Contracts | Amount | Price | Date | Fair Value | |||||||||||
| WRITTEN OPTIONS (1.03)% (continued) | ||||||||||||||||
| WRITTEN CALL OPTIONS (1.01)% (continued) | ||||||||||||||||
| Oracle Corp. | (4) | $ | (46,484 | ) | $ | 120.00 | December 2023 | $ | (836 | ) | ||||||
| Oracle Corp. | (16) | (185,936 | ) | 130.00 | January 2024 | (1,232 | ) | |||||||||
| Oracle Corp. | (15) | (174,315 | ) | 135.00 | March 2024 | (2,430 | ) | |||||||||
| Palo Alto Networks, Inc. | (15) | (442,635 | ) | 270.00 | January 2024 | (46,987 | ) | |||||||||
| Procter And Gamble Co. (The) | (12) | (184,224 | ) | 155.00 | January 2024 | (2,826 | ) | |||||||||
| Quanta Services, Inc. | (13) | (244,803 | ) | 210.00 | February 2024 | (2,275 | ) | |||||||||
| Salesforce, Inc. | (10) | (251,900 | ) | 230.00 | January 2024 | (24,874 | ) | |||||||||
| Salesforce, Inc. | (3) | (75,570 | ) | 240.00 | January 2024 | (4,950 | ) | |||||||||
| Salesforce, Inc. | (3) | (75,570 | ) | 250.00 | February 2024 | (3,930 | ) | |||||||||
| Schlumberger Ltd. | (16) | (83,264 | ) | 70.00 | January 2024 | (96 | ) | |||||||||
| Schlumberger Ltd. | (36) | (187,344 | ) | 65.00 | February 2024 | (702 | ) | |||||||||
| Stryker Corp. | (2) | (59,266 | ) | 300.00 | December 2023 | (530 | ) | |||||||||
| Stryker Corp. | (9) | (266,697 | ) | 320.00 | January 2024 | (945 | ) | |||||||||
| TJX Companies, Inc. (The) | (34) | (299,574 | ) | 97.50 | January 2024 | (255 | ) | |||||||||
| Visa, Inc. | (1) | (25,668 | ) | 260.00 | January 2024 | (458 | ) | |||||||||
| Visa, Inc. | (11) | (282,348 | ) | 270.00 | January 2024 | (1,485 | ) | |||||||||
| Wells Fargo & Co. | (50) | (222,950 | ) | 47.50 | February 2024 | (4,100 | ) | |||||||||
| Welltower, Inc. | (35) | (311,850 | ) | 92.50 | January 2024 | (4,550 | ) | |||||||||
| Zoetis, Inc. | (14) | (247,338 | ) | 190.00 | January 2024 | (1,714 | ) | |||||||||
| Zoetis, Inc. | (3) | (53,001 | ) | 195.00 | January 2024 | (233 | ) | |||||||||
| Total Written Call Options (Premiums Received $231,929) | (256,392 | ) | ||||||||||||||
See accompanying notes which are an integral part of these financial statements.
12
| Connors Hedged Equity Fund |
| Schedule of Open Written Option Contracts (continued) |
| November 30, 2023 |
| Number of | Notional | Exercise | Expiration | |||||||||||||
| Description | Contracts | Amount | Price | Date | Fair Value | |||||||||||
| WRITTEN OPTIONS (1.03)% (continued) | ||||||||||||||||
| WRITTEN PUT OPTIONS (0.02)% | ||||||||||||||||
| S&P 500 Index | (10) | $ | (4,567,800 | ) | $ | 3,900.00 | January 2024 | $ | (4,300 | ) | ||||||
| Total Written Put Options (Premiums Received $17,460) | (4,300 | ) | ||||||||||||||
| Total Written Options (Premiums Received $249,389) | $ | (260,692 | ) | |||||||||||||
See accompanying notes which are an integral part of these financial statements.
13
| Connors Hedged Equity Fund |
| Statement of Assets and Liabilities |
| November 30, 2023 |
| Assets | ||||
| Investments in securities at fair value (cost $23,289,286) | $ | 25,588,446 | ||
| Receivable for fund shares sold | 10,000 | |||
| Receivable for investments sold | 366 | |||
| Dividends and interest receivable | 42,254 | |||
| Receivable from Adviser | 611 | |||
| Prepaid expenses | 10,333 | |||
| Total Assets | 25,652,010 | |||
| Liabilities | ||||
| Options written, at fair value (premium received $249,389) | 260,692 | |||
| Payable for fund shares redeemed | 25,000 | |||
| Payable for investments purchased | 78,738 | |||
| Payable to Administrator | 6,780 | |||
| Payable to trustees | 3,750 | |||
| Other accrued expenses | 28,945 | |||
| Total Liabilities | 403,905 | |||
| Net Assets | $ | 25,248,105 | ||
| Net Assets consist of: | ||||
| Paid-in capital | $ | 23,341,978 | ||
| Accumulated earnings | 1,906,127 | |||
| Net Assets | $ | 25,248,105 | ||
| Institutional Class | ||||
| Shares outstanding (unlimited number of shares authorized, no par value) | 2,398,985 | |||
| Net asset value, offering and redemption price per share | $ | 10.52 |
See accompanying notes which are an integral part of these financial statements.
14
| Connors Hedged Equity Fund |
| Statement of Operations |
| For the year ended November 30, 2023 |
| Investment Income | ||||
| Dividend and interest income | $ | 391,596 | ||
| Total investment income | 391,596 | |||
| Expenses | ||||
| Investment Adviser fees | 155,381 | |||
| Administration fees | 73,980 | |||
| Legal fees | 45,042 | |||
| Compliance fees | 27,000 | |||
| Registration expenses | 17,437 | |||
| Transfer agent fees | 16,286 | |||
| Offering cost | 15,887 | |||
| Audit and tax preparation fees | 15,415 | |||
| Trustee fees | 15,000 | |||
| Printing and postage expenses | 12,207 | |||
| Custodian fees | 11,520 | |||
| Miscellaneous expense | 45,606 | |||
| Total expenses | 450,761 | |||
| Fees contractually waived and expenses reimbursed by Adviser | (227,355 | ) | ||
| Net operating expenses | 223,406 | |||
| Net investment income | 168,190 | |||
| Net Realized and Change in Unrealized Gain (Loss) on Investments | ||||
| Net realized gain (loss) on: | ||||
| Investment securities | (555,460 | ) | ||
| Written options | 535,978 | |||
| Purchased options | (365,460 | ) | ||
| Net change in unrealized appreciation (depreciation) on: | ||||
| Investment securities | 1,739,839 | |||
| Written options | 130,984 | |||
| Purchased options | (24,789 | ) | ||
| Net realized and change in unrealized gain on investments securities and options | 1,461,092 | |||
| Net increase in net assets resulting from operations | $ | 1,629,282 |
See accompanying notes which are an integral part of these financial statements.
15
| Connors Hedged Equity Fund |
| Statements of Changes in Net Assets |
| For the | For the | |||||||
| Year Ended | Period Ended | |||||||
| November 30, | November 30, | |||||||
| 2023 | 2022(a) | |||||||
| Increase (Decrease) in Net Assets due to: | ||||||||
| Operations | ||||||||
| Net investment income | $ | 168,190 | $ | 71,608 | ||||
| Net realized loss on investment securities and options | (384,942 | ) | (158,528 | ) | ||||
| Net change in unrealized appreciation of investment securities and options | 1,846,034 | 441,823 | ||||||
| Net increase in net assets resulting from operations | 1,629,282 | 354,903 | ||||||
| Distributions to shareholders from Earnings | (78,058 | ) | — | |||||
| Total distributions | (78,058 | ) | — | |||||
| Capital Transactions - Institutional Class: | ||||||||
| Proceeds from shares sold | 8,913,853 | 14,622,107 | ||||||
| Reinvestment of distributions | 78,058 | — | ||||||
| Amount paid for shares redeemed | (281,956 | ) | (90,084 | ) | ||||
| Net increase in net assets resulting from capital transactions | 8,709,955 | 14,532,023 | ||||||
| Total Increase in Net Assets | 10,261,179 | 14,886,926 | ||||||
| Net Assets | ||||||||
| Beginning of year | 14,986,926 | 100,000 | ||||||
| End of year | $ | 25,248,105 | $ | 14,986,926 | ||||
| Share Transactions - Institutional Class: | ||||||||
| Shares sold | 899,210 | 1,529,011 | ||||||
| Shares issued in reinvestment of distributions | 8,217 | — | ||||||
| Shares redeemed | (27,938 | ) | (9,515 | ) | ||||
| Net increase in shares | 879,489 | 1,519,496 | ||||||
| (a) | For the period January 19, 2022 (commencement of operations) to November 30, 2022. |
See accompanying notes which are an integral part of these financial statements.
16
| Connors Hedged Equity Fund - Institutional Class |
| Financial Highlights |
(For a share outstanding during each period)
| For the | ||||||||
| For the | Period | |||||||
| Year Ended | Ended | |||||||
| November | November | |||||||
| 30, 2023 | 30, 2022(a) | |||||||
| Selected Per Share Data: | ||||||||
| Net asset value, beginning of period | $ | 9.86 | $ | 10.00 | ||||
| Investment operations: | ||||||||
| Net investment income | 0.07 | 0.05 | ||||||
| Net realized and unrealized gain (loss) | 0.64 | (0.19 | ) | |||||
| Total from investment operations | 0.71 | (0.14 | ) | |||||
| Less distributions to shareholders from: | ||||||||
| Net investment income | (0.05 | ) | — | |||||
| Total distributions | (0.05 | ) | — | |||||
| Net asset value, end of period | $ | 10.52 | $ | 9.86 | ||||
| Total Return(b) | 7.25 | % | (1.40 | )% (c) | ||||
| Ratios and Supplemental Data: | ||||||||
| Net assets, end of period (000 omitted) | $ | 25,248 | $ | 14,987 | ||||
| Ratio of net expenses to average net assets | 1.15 | % | 1.15 | % (d) | ||||
| Ratio of expenses to average net assets before waiver and reimbursement | 2.32 | % | 4.05 | % (d) | ||||
| Ratio of net investment income to average net assets | 0.87 | % | 0.84 | % (d) | ||||
| Portfolio turnover rate | 52 | % | 30 | % (c) | ||||
| (a) | For the period January 19, 2022 (commencement of operations) to November 30, 2022. |
| (b) | Total return represents the rate that the investor would have earned or lost on an investment in the Fund, assuming reinvestment of distributions. |
| (c) | Not annualized. |
| (d) | Annualized. |
See accompanying notes which are an integral part of these financial statements.
17
| Connors Hedged Equity Fund |
| Notes to the Financial Statements |
| November 30, 2023 |
NOTE 1. ORGANIZATION
The Connors Hedged Equity Fund (the “Fund”) is a diversified series of Connors Funds (the “Trust”), which is registered under the Investment Company Act of 1940, as amended (“1940 Act”) as an open-end management investment company. The Trust was organized as a Delaware statutory trust on September 15, 2021. The Fund currently offers one class of shares: Institutional Shares. The Fund commenced investment operations on January 19, 2022. The Fund’s investment adviser is Connors Investor Services, Inc. (the “Adviser”). The investment objective of the Fund is to seek to achieve capital appreciation and secondarily income generation, with lower volatility than U.S. equity markets.
NOTE 2. SIGNIFICANT ACCOUNTING POLICIES
The Fund is an investment company and follows accounting and reporting guidance under Financial Accounting Standards Board Accounting Standards Codification (“ASC”) Topic 946, “Financial Services-Investment Companies”. The following is a summary of significant accounting policies followed by the Fund in the preparation of its financial statements. These policies are in conformity with generally accepted accounting principles in the United States of America (“GAAP”).
Estimates – The preparation of financial statements in conformity with GAAP requires management to make estimates and assumptions that affect the reported amounts of assets and liabilities and disclosure of contingent assets and liabilities at the date of the financial statements and the reported amounts of increases and decreases in net assets from operations during the reporting period. Actual results could differ from those estimates.
Federal Income Taxes – The Fund makes no provision for federal income or excise tax. The Fund has qualified and intends to qualify each year as a regulated investment company (“RIC”) under subchapter M of the Internal Revenue Code of 1986, as amended, by complying with the requirements applicable to RICs and by distributing substantially all of its taxable income. The Fund also intends to distribute sufficient net investment income and net realized capital gains, if any, so that it will not be subject to excise tax on undistributed income and gains. If the required amount of net investment income or gains is not distributed, the Fund could incur a tax expense.
As of and during the fiscal year ended November 30, 2023, the Fund did not have any liabilities for any unrecognized tax benefits. The Fund recognizes interest and penalties, if any, related to unrecognized tax benefits as income tax expense on the Statement of Operations when incurred. During the fiscal year ended November 30, 2023, the Fund did not incur any interest or penalties. Management of the Fund has reviewed tax positions taken in tax years that remain subject to examination by all major tax jurisdictions,
18
| Connors Hedged Equity Fund |
| Notes to the Financial Statements (continued) |
| November 30, 2023 |
including federal (i.e., the last three tax year ends and the interim tax period since then, as applicable). Management believes that there is no tax liability resulting from unrecognized tax benefits related to uncertain tax positions taken.
Security Transactions and Related Income – The Fund follows industry practice and records security transactions on the trade date for financial reporting purposes. The specific identification method is used for determining gains or losses for financial statement and income tax purposes. Dividend income is recorded on the ex-dividend date and interest income is recorded on an accrual basis. Non-cash income, if any, is recorded at the fair market value of the securities received. Withholding taxes on foreign dividends, if any, have been provided for in accordance with the Fund’s understanding of the applicable country’s tax rules and rates.
Dividends and Distributions – The Fund intends to distribute its net investment income and net realized long-term and short-term capital gains, if any, at least annually. Dividends and distributions to shareholders, which are determined in accordance with income tax regulations, are recorded on the ex-dividend date. The treatment for financial reporting purposes of distributions made to shareholders during the period from net investment income or net realized capital gains may differ from their ultimate treatment for federal income tax purposes. These differences are caused primarily by differences in the timing of the recognition of certain components of income, expense or realized capital gain for federal income tax purposes. Where such differences are permanent in nature, they are reclassified among the components of net assets based on their ultimate characterization for federal income tax purposes. Any such reclassifications will have no effect on net assets, results of operations or NAV per share of the Fund.
For the fiscal year ended November 30, 2023, the Fund made the following reclassifications to increase (decrease) the components of net assets:
| Accumulated Earnings | ||||||
| Paid-In Capital | (Deficit) | |||||
| $ | (138 | ) | $ | 138 | ||
Derivative Transactions – The following tables identify the location and fair value of derivative instruments on the Statement of Assets and Liabilities as of November 30, 2023 and the effect of derivative instruments on the Statement of Operations for the fiscal year ended November 30, 2023.
19
| Connors Hedged Equity Fund |
| Notes to the Financial Statements (continued) |
| November 30, 2023 |
As of November 30, 2023:
| Location of Derivatives on Statement of Assets and Liabilities | ||||||||
| Derivatives | Asset Derivatives | Liability Derivatives | Fair Value | |||||
| Equity Price Risk: | ||||||||
| Purchased Options | Investments in securities at fair value | $ | 16,000 | |||||
| Written Options | Options written,at fair value | (260,692 | ) | |||||
For the fiscal year ended November 30, 2023:
| Change in Unrealized | ||||||||||
| Location of Gain (Loss) on | Realized Gain | Appreciation | ||||||||
| Derivatives on Statement of | (Loss) on | (Depreciation) on | ||||||||
| Derivatives | Operations | Derivatives | Derivatives | |||||||
| Equity Price Risk: | Net realized gain and change in unrealized appreciation (depreciation) on investments | |||||||||
| Purchased Options | $ | (365,460 | ) | $ | (24,789 | ) | ||||
| Written Options | 535,978 | 130,984 | ||||||||
The following table summarizes the average ending monthly fair value of derivatives outstanding during the fiscal year ended November 30, 2023:
| Average Ending Monthly | ||||
| Derivatives | Fair Value(a) | |||
| Purchased Options | $ | 64,043 | ||
| Written Options | (233,487 | ) | ||
| (a) | Average based on the 12 months during the period that had activity. |
20
| Connors Hedged Equity Fund |
| Notes to the Financial Statements (continued) |
| November 30, 2023 |
The following table provides a summary of offsetting financial liabilities and derivatives and the effect of derivative instruments on the Statement of Assets and Liabilities as of November 30, 2023:
| Gross Amounts Not Offset | ||||||||||||||||||||||||
| in Statement of Assets and | ||||||||||||||||||||||||
| Liabilities | ||||||||||||||||||||||||
| Net Amounts | ||||||||||||||||||||||||
| Gross Amounts | of Liabilities | |||||||||||||||||||||||
| Offset in | Presented in | |||||||||||||||||||||||
| Gross Amounts | Statement of | Statement of | ||||||||||||||||||||||
| of Recognized | Assets and | Assets and | Financial | Collateral | Net | |||||||||||||||||||
| Liabilities | liabilities | Liabilities | Instruments | Pledged | Amount | |||||||||||||||||||
| Written Options | $ | 260,692 | $ | — | $ | 260,692 | $ | (260,692 | ) | $ | — | $ | — | |||||||||||
NOTE 3. SECURITIES VALUATION AND FAIR VALUE MEASUREMENTS
The Fund values its portfolio securities at fair value as of the close of regular trading on the New York Stock Exchange (“NYSE”) (normally 4:00 p.m. Eastern Time) on each business day the NYSE is open for business. Fair value is defined as the price that the Fund would receive upon selling an investment in a timely transaction to an independent buyer in the principal or most advantageous market of the investment. GAAP establishes a three-tier hierarchy to maximize the use of observable market data and minimize the use of unobservable inputs and to establish classification of fair value measurements for disclosure purposes.
Inputs refer broadly to the assumptions that market participants would use in pricing the asset or liability, including assumptions about risk (the risk inherent in a particular valuation technique used to measure fair value including a pricing model and/or the risk inherent in the inputs to the valuation technique). Inputs may be observable or unobservable. Observable inputs are inputs that reflect the assumptions market participants would use in pricing the asset or liability developed based on market data obtained and available from sources independent of the reporting entity. Unobservable inputs are inputs that reflect the reporting entity’s own assumptions about the assumptions market participants would use in pricing the asset or liability developed based on the best information available in the circumstances.
Various inputs are used in determining the value of the Fund’s investments. These inputs are summarized in the three broad levels listed below.
| ● | Level 1 – unadjusted quoted prices in active markets for identical investments and/or registered investment companies where the value per share is determined and published |
21
| Connors Hedged Equity Fund |
| Notes to the Financial Statements (continued) |
| November 30, 2023 |
and is the basis for current transactions for identical assets or liabilities at the valuation date
| ● | Level 2 – other significant observable inputs (including, but not limited to, quoted prices for an identical security in an inactive market, quoted prices for similar securities, interest rates, prepayment speeds, credit risk, etc.) |
| ● | Level 3 – significant unobservable inputs (including the Fund’s own assumptions in determining fair value of investments based on the best information available) |
The inputs used to measure fair value may fall into different levels of the fair value hierarchy. In such cases, for disclosure purposes, the level in the fair value hierarchy which is reported is determined based on the lowest level input that is significant to the fair value measurement in its entirety.
Equity securities that are traded on any stock exchange are generally valued at the last quoted sale price on the security’s primary exchange. Lacking a last sale price, an exchange-traded security is generally valued at the mean between the most recent quoted bid and ask prices. Securities traded in the Nasdaq over-the-counter market are generally valued at the Nasdaq Official Closing Price. When using market quotations and when the market is considered active, the security is classified as a Level 1 security. In the event that market quotations are not readily available or are considered unreliable due to market or other events, securities are valued in good faith by the Adviser as “Valuation Designee” under the oversight of the Board. The Adviser has adopted written policies and procedures for valuing securities and other assets in circumstances where market quotes are not readily available. In the event that market quotes are not readily available, and the security or asset cannot be valued pursuant to one of the valuation methods, the value of the security or asset will be determined in good faith by the Adviser pursuant to its policies and procedures. On a quarterly basis, the Adviser’s fair valuation determinations will be reviewed by the Board. Under these policies, the securities will be classified as Level 2 or 3 within the fair value hierarchy, depending on the inputs used.
Investments in mutual funds, including money market mutual funds, are generally priced at the ending NAV. These securities are categorized as Level 1 securities.
Option contracts are generally traded on an exchange and are valued at the composite price, using the National Best Bid and Offer quotes (“NBBO”). NBBO consists of the highest bid price and lowest ask price across any of the exchanges on which an option is quoted, thus providing a view across the entire U.S. options marketplace. Composite option pricing calculates the mean of the highest bid price and lowest ask price across the exchanges where the option is traded. Expiring options may be priced at intrinsic value.
22
| Connors Hedged Equity Fund |
| Notes to the Financial Statements (continued) |
| November 30, 2023 |
For options where market quotations are not readily available, fair value shall be determined by the Adviser. Generally, if market quotations are not readily available and the bid price or ask price is not available and, therefore, an option cannot be valued at the composite price, options may be valued at their last quoted sales price.
If the Fund decides that a price provided by the pricing service does not accurately reflect the fair value of the securities, when prices are not readily available from a pricing service, or when restricted or illiquid securities are being valued, securities are valued at fair value as determined by the Adviser, in conformity with policies adopted by the Board. These securities will generally be categorized as Level 2 or 3 within the fair value hierarchy, depending on the inputs used.
In accordance with the Trust’s valuation policies and fair value determinations pursuant to Rule 2a-5 under the 1940 Act, the Valuation Designee, the Investment Adviser, is required to consider all appropriate factors relevant to the value of securities for which it has determined other pricing sources are not available or reliable as described above. No single method exists for determining fair value because fair value depends upon the circumstances of each individual case. As a general principle, the current fair value of a security being valued by the Valuation Designee would be the amount that the Fund might reasonably expect to receive upon the current sale. Methods that are in accordance with this principle may, for example, be based on (i) a multiple of earnings; (ii) a discount from market prices of a similar freely traded security (including a derivative security or a basket of securities traded on other markets, exchanges or among dealers); or (iii) yield to maturity with respect to debt issues, or a combination of these and other methods. Fair-value pricing is permitted if, in the Valuation Designee’s opinion, the validity of market quotations appears to be questionable based on factors such as evidence of a thin market in the security based on a small number of quotations, a significant event occurs after the close of a market but before the Fund’s NAV calculation that may affect a security’s value, or the Valuation Designee is aware of any other data that calls into question the reliability of market quotations. The Valuation Designee may obtain assistance from others in fulfilling its duties. For example, it may seek assistance from pricing services, fund administrators, sub-advisers, accountants, or counsel; it may also consult the Trust’s Fair Value Committee. The Valuation Designee, however, remains responsible for the final fair value determination and may not designate or assign that responsibility to any third party.
23
| Connors Hedged Equity Fund |
| Notes to the Financial Statements (continued) |
| November 30, 2023 |
The following is a summary of the inputs used to value the Fund’s investments as of November 30, 2023:
| Valuation Inputs | ||||||||||||||||
| Assets | Level 1 | Level 2 | Level 3 | Total | ||||||||||||
| Common Stocks (a) | $ | 24,621,253 | $ | — | $ | — | $ | 24,621,253 | ||||||||
| Put Options Purchased | — | 16,000 | — | 16,000 | ||||||||||||
| Money Market Funds | 951,193 | — | — | 951,193 | ||||||||||||
| Total | $ | 25,572,446 | $ | 16,000 | $ | — | $ | 25,588,446 | ||||||||
| Valuation Inputs | ||||||||||||||||
| Liabilities | Level 1 | Level 2 | Level 3 | Total | ||||||||||||
| Written Call Options | $ | — | $ | (256,392 | ) | $ | — | $ | (256,392 | ) | ||||||
| Written Put Options | — | (4,300 | ) | — | (4,300 | ) | ||||||||||
| Total | $ | — | $ | (260,692 | ) | $ | — | $ | (260,692 | ) | ||||||
| (a) | Refer to Schedule of Investments for sector classifications. |
NOTE 4. FEES AND OTHER TRANSACTIONS WITH AFFILIATES AND OTHER SERVICE PROVIDERS
Under the terms of the investment advisory agreement, on behalf of the Fund (the “Agreement”), the Adviser manages the Fund’s investments subject to oversight of the Board. As compensation for its services, the Fund pays the Adviser a fee, computed and accrued daily and paid monthly at an annual rate of 0.80% of the average daily net assets of the Fund. For the fiscal year ended November 30, 2023, the Adviser earned a fee of $155,381 from the Fund before the waivers described below. At November 30, 2023, the Adviser owed the Fund $611.
The Adviser has contractually agreed to waive or limit its fees and to assume other expenses of the Fund until March 31, 2025, so that total annual fund operating expenses (excluding brokerage costs, taxes, interest, borrowing costs such as interest and dividend expenses on securities sold short, Acquired Fund Fees and Expenses, extraordinary expenses such as litigation and merger or reorganization costs and other expenses not incurred in the ordinary course of the Fund’s business) do not exceed 1.15% of the Fund’s average daily net assets. This contractual arrangement may only be terminated by the Board, and it will automatically terminate upon the termination of the investment advisory agreement between the Trust and the Adviser.
Each fee waiver or expense reimbursement by the Adviser is subject to repayment by the Fund within the three years following the date the fee waiver or expense reimbursement occurred, provided that the Fund is able to make the repayment without exceeding the expense limitation that is in effect at the time of the repayment or at the time of the fee waiver or expense reimbursement, whichever is lower. For the fiscal year ended November
24
| Connors Hedged Equity Fund |
| Notes to the Financial Statements (continued) |
| November 30, 2023 |
30, 2023, the Adviser waived fees or reimbursed expenses totaling $227,355. As of November 30, 2023, the Adviser may seek repayment of investment advisory fee waivers and expense reimbursements as follows:
| Recoverable Through | ||||
| November 30, 2025 | $ | 248,401 | ||
| November 30, 2026 | 227,355 | |||
Ultimus Fund Solutions, LLC (“Ultimus”) provides administration, fund accounting and transfer agent services to the Fund. The Fund pays Ultimus fees in accordance with the agreements for such services.
Under the terms of a Distribution Agreement with the Trust, Ultimus Fund Distributors, LLC (the “Distributor”) serves as principal underwriter to the Fund. The Distributor is a wholly-owned subsidiary of Ultimus. The Distributor is compensated by the Adviser (not the Fund) for acting as principal underwriter.
Pursuant to a Compliance Consulting Agreement with Beacon Compliance Consulting, Inc. (“Beacon”), Beacon provides the Chief Compliance Officer and compliance services to the Trust.
The Board supervises the business activities of the Trust. Each Trustee serves as a trustee until termination of the Trust unless the Trustee dies, resigns, retires, or is removed. The Trust pays each Trustee of the Trust who is not an interested person an annual retainer of $5,000. The Trust also reimburses the Trustees for travel and other expenses incurred in attending meetings of the Board. Officers of the Trust and Trustees who are interested persons of the Trust do not receive any direct compensation from the Trust. No other compensation or retirement benefits are received by any Trustee or officer from the Fund.
NOTE 5. ORGANIZATIONAL AND OFFERING COSTS
The Adviser advanced some of the Fund’s organization and initial offering costs and was subsequently reimbursed by the Fund. Costs of $83,995 incurred in connection with the offering and initial registration of the Fund had been deferred and were amortized on a straight-line basis over the first twelve months after commencement of operations.
NOTE 6. PURCHASES AND SALES OF SECURITIES
For the fiscal year ended November 30, 2023, purchases and sales of investment securities, other than short-term investments, were $18,413,014 and $9,619,664, respectively.
25
| Connors Hedged Equity Fund |
| Notes to the Financial Statements (continued) |
| November 30, 2023 |
There were no purchases or sales of long-term U.S. government obligations during the fiscal year ended November 30, 2023.
NOTE 7. SECTOR RISK
If the Fund has significant investments in the securities of issuers within a particular sector, any development affecting that sector will have a greater impact on the value of the net assets of the Fund than would be the case if the Fund did not have significant investments in that sector. In addition, this may increase the risk of loss in the Fund and increase the volatility of the Fund’s NAV per share. For instance, economic or market factors, regulatory changes or other developments may negatively impact all companies in a particular sector, and therefore the value of the Fund’s portfolio will be adversely affected. As of November 30, 2023, the Fund had 28.87% of the value of its net assets invested in stocks within the Technology sector.
NOTE 8. FEDERAL TAX INFORMATION
At November 30, 2023, the net unrealized appreciation (depreciation) and tax cost of investments, including written options, for tax purposes was as follows:
| Gross unrealized appreciation | $ | 2,794,825 | ||
| Gross unrealized depreciation | (516,309 | ) | ||
| Net unrealized appreciation on investments | 2,278,516 | |||
| Tax cost of investments | $ | 23,049,238 |
The tax character of distributions paid for the fiscal years ended November 30, 2023 and November 30, 2022 were as follows:
| 2023 | 2022 | |||||||
| Distributions paid from: | ||||||||
| Ordinary income(a) | $ | 78,058 | $ | — | ||||
| Total distributions paid | $ | 78,058 | $ | — | ||||
| (a) | Short-term capital gain distributions are treated as ordinary income for tax purposes. |
At November 30, 2023, the components of accumulated earnings (deficit) on a tax basis were as follows:
| Undistributed ordinary income | $ | 161,878 | ||
| Accumulated capital and other losses | (534,129 | ) | ||
| Unrealized appreciation on investments | 2,278,516 | |||
| Total accumulated earnings | $ | 1,906,265 |
26
| Connors Hedged Equity Fund |
| Notes to the Financial Statements (continued) |
| November 30, 2023 |
As of November 30, 2023, the Fund had short-term and long-term capital loss carryforwards of $358,953 and long-term capital loss carryforwards $175,175. These capital loss carryforwards, which do not expire, may be utilized in future years to offset net realized capital gains, if any, prior to distributing such gains to shareholders.
NOTE 9. COMMITMENTS AND CONTINGENCIES
The Trust indemnifies its officers and Trustees for certain liabilities that may arise from their performance of their duties to the Trust or the Fund. Additionally, in the normal course of business, the Trust enters into contracts that contain a variety of representations and warranties which provide general indemnifications. The Trust’s maximum exposure under these arrangements is unknown, as this would involve future claims that may be made against the Trust that have not yet occurred.
NOTE 10. REGULATORY UPDATES
On January 24, 2023, the SEC adopted rule and form amendments to require mutual funds and ETFs to transmit concise and visually engaging streamlined annual and semiannual reports to shareholders that highlight key information. Other information, including financial statements, will not appear in a streamlined shareholder report but must be available online, delivered free of charge upon request, and filed on a semiannual basis on Form N-CSR. The rule and form amendments have a compliance date of July 24, 2024. At this time, management is evaluating the impact of these amendments on the shareholder reports for the Fund.
NOTE 11. SUBSEQUENT EVENTS
Management of the Fund has evaluated the need for disclosures and/or adjustments resulting from subsequent events through the date at which these financial statements were issued. Based upon this evaluation, management has determined there were no items requiring adjustment of the financial statements or additional disclosure.
On December 29, 2023 the Fund paid an income distribution of $0.0702 per share to the shareholders of record on December 28, 2023.
27
| Report of Independent Registered Public Accounting Firm |
To the Shareholders of Connors Hedged Equity Fund and
Board of Trustees of Connors Fund
Opinion on the Financial Statements
We have audited the accompanying statement of assets and liabilities, including the schedule of investments, of Connors Hedged Equity Fund (the “Fund”), a series of Connors Funds, as of November 30, 2023, the related statements of operations and changes in net assets, related notes, and the financial highlights for the year then ended (collectively referred to as the “financial statements”). In our opinion, the financial statements present fairly, in all material respects, the financial position of the Fund as of November 30, 2023, the results of its operations, the changes in net assets, and the financial highlights the year then ended, in conformity with accounting principles generally accepted in the United States of America.
The Fund’s financial statements and financial highlights for the period January 19, 2022 (commencement of operations) through November 30, 2022, was audited by other auditors whose report dated January 27, 2023, expressed an unqualified opinion on those financial statements and financial highlights.
Basis for Opinion
These financial statements are the responsibility of the Fund’s management. Our responsibility is to express an opinion on the Fund’s financial statements based on our audit. We are a public accounting firm registered with the Public Company Accounting Oversight Board (United States) (“PCAOB”) and are required to be independent with respect to the Fund in accordance with the U.S. federal securities laws and the applicable rules and regulations of the Securities and Exchange Commission and the PCAOB.
We conducted our audit in accordance with the standards of the PCAOB. Those standards require that we plan and perform the audit to obtain reasonable assurance about whether the financial statements are free of material misstatement whether due to error or fraud.
Our audit included performing procedures to assess the risks of material misstatement of the financial statements, whether due to error or fraud, and performing procedures that respond to those risks. Such procedures included examining, on a test basis, evidence regarding the amounts and disclosures in the financial statements. Our procedures included confirmation of securities owned as of November 30, 2023, by correspondence with the custodian and brokers. Our audit also included evaluating the accounting principles used and significant estimates made by management, as well as evaluating the overall presentation of the financial statements. We believe that our audit provides a reasonable basis for our opinion.
We have served as the Fund’s auditor since 2023.

COHEN & COMPANY, LTD.
Philadelphia, Pennsylvania
January 29, 2024
28
| Summary of Fund Expenses (Unaudited) |
As a shareholder of the Fund, you incur two types of costs: (1) transaction and (2) ongoing costs, including management fees and other Fund expenses. This example is intended to help you understand your ongoing costs (in dollars) of investing in the Fund and to compare these costs with the ongoing costs of investing in other funds. The example is based on an investment of $1,000 invested at the beginning of the period and held for the entire period from June 1, 2023 through November 30, 2023.
Actual Expenses
The first line of the table below provides information about actual account values and actual expenses. You may use the information in this line, together with the amount you invested, to estimate the expenses that you paid over the period. Simply divide your account value by $1,000 (for example, an $8,600 account value divided by $1,000 = 8.6), then multiply the result by the number in the first line under the heading “Expenses Paid During Period” to estimate the expenses you paid on your account during this period.
Hypothetical Example for Comparison Purposes
The second line of the table below provides information about hypothetical account values and hypothetical expenses based on the Fund’s actual expense ratio and an assumed rate of return of 5% per year before expenses, which is not the Fund’s actual return. The hypothetical account values and expenses may not be used to estimate the actual ending account balance or expenses you paid for the period. You may use this information to compare the ongoing costs of investing in the Fund and other funds. To do so, compare this 5% hypothetical example with the 5% hypothetical examples that appear in the shareholder reports of other funds.
Expenses shown in the table are meant to highlight your ongoing costs only and do not reflect any transactional costs. Therefore, the second line of the table below is useful in comparing ongoing costs only and will not help you determine the relative total costs of owning different funds. In addition, if transaction costs were included, your costs would have been higher.
| Beginning | Ending | |||||||||||||
| Account | Account | Expenses | ||||||||||||
| Value | Value | Paid | Annualized | |||||||||||
| June 1, | November | During | Expense | |||||||||||
| 2023 | 30, 2023 | Period(a) | Ratio | |||||||||||
| Actual | $ | 1,000.00 | $ | 1,075.70 | $ | 5.98 | 1.15% | |||||||
| Hypothetical(b) | $ | 1,000.00 | $ | 1,050.00 | $ | 5.91 | 1.15% | |||||||
| (a) | Expenses are equal to the Fund’s annualized expense ratios, multiplied by the average account value over the period, multiplied by 183/365 (to reflect the one-half year period). |
| (b) | Hypothetical assumes 5% annual return before expenses. |
29
| Additional Federal Income Tax Information (Unaudited) |
The Form 1099-DIV you receive in January 2024 will show the tax status of all distributions paid to your account in calendar year 2023. Shareholders are advised to consult their own tax adviser with respect to the tax consequences of their investment in the Fund. As required by the Internal Revenue Code and/or regulations, shareholders must be notified regarding the status of qualified dividend income for individuals and the dividends received deduction for corporations.
Qualified Dividend Income. The Fund designates approximately 100% or up to the maximum amount of such dividends allowable pursuant to the Internal Revenue Code, as qualified dividend income eligible for a reduced tax rate.
Qualified Business Income. The Fund designates approximately 0% of its ordinary income dividends, or up to the maximum amount of such dividends allowable pursuant to the Internal Revenue Code, as qualified business income.
Dividends Received Deduction. Corporate shareholders are generally entitled to take the dividends received deduction on the portion of the Fund’s dividend distribution that qualifies under tax law. For the Fund’s calendar year 2023 ordinary income dividends, 100% qualifies for the corporate dividends received deduction.
30
| Trustees and Officers (Unaudited) |
The Board supervises the business activities of the Trust and is responsible for protecting the interests of shareholders. The Chairman of the Board is Peter J. Connors.
Officers are re-elected annually by the Board. The address of each Trustee and officer is 1210 Broadcasting Road, Suite 200, Wyomissing, PA 19610.
Independent Trustee Background. The following table provides information regarding the Independent Trustees.
| Name, (Age), Position with Trust, Term of Position with Trust | Principal Occupation During Past 5 Years and Other Directorships | |
| Bradford H. Barrett Birth Year: 1949 TRUSTEE Began Serving: January 2022 | Principal Occupation(s): President, Barrett Commercial (Commercial Real Estate Developer) (2010 – Present). | |
| Joni S. Naugle Birth Year: 1959 TRUSTEE Began Serving: January 2022 | Principal Occupation(s): President, Naugle Associates, LLC (Professional Services Company) (2014 – Present). | |
| John R. Morahan Birth Year: 1954 TRUSTEE Began Serving: January 2022 | Principal Occupation(s): Retired (2020 – Present).
Previous Position(s): President, St. Joseph Regional Health Network – Penn State Health (2015 – 2020). |
Interested Trustee Background. The following table provides information regarding the Interested Trustee.
| Name, (Age), Position with Trust, Term of Position with Trust | Principal Occupation During Past 5 Years and Other Directorships | |
| Peter J. Connors* Birth Year: 1965 TRUSTEE AND CHAIRMAN Began Serving: January 2022 | Principal Occupation(s): President, Connors Investor Services, Inc. (2001 – present). |
| * | Peter J. Connors an “interested person” of the Trust because he is the President of the Adviser. |
31
| Trustees and Officers (Unaudited) (continued) |
Officers. The following table provides information regarding the Officers.
| Name, (Age), Position with Trust, Term of Position with Trust | Principal Occupation During Past 5 Years and Other Directorships | |
| Debora M. Covell Birth Year: 1963 TREASURER AND PRINCIPAL FINANCIAL OFFICER Began Serving: January 2022 | Principal Occupation(s): Chief Compliance Officer, Connors Investor Services, Inc. (2017 – Present); Manager, Cemsol, LLC (Consulting Firm) (2017 – Present). | |
| Robert J. Cagliola Birth Year: 1967 SECRETARY Began Serving: January 2022 | Principal Occupation(s): Vice President, Portfolio Manager, Connors Investor Services, Inc. (1999 – Present). | |
| Kyle Bubeck Birth Year: 1955 CHIEF COMPLIANCE OFFICER Began Serving: January 2022 | Principal Occupation(s): President, Beacon Compliance Consulting (2010 – Present). |
| Other Information (Unaudited) |
The Fund’s Statement of Additional Information (“SAI”) includes additional information about the trustees and is available without charge, upon request. You may call toll-free at (833) 601-2676 to request a copy of the SAI or to make shareholder inquiries.
32
| Adviser Agreement Renewal (Unaudited) |
At a meeting held on October 10, 2023 (the “Meeting”), the Board of Trustees (the “Board”) of Connors Funds (the “Trust”), each of whom is not an “interested person” of the Trust (the “Independent Trustees” or the “Trustees”), as such term is defined under Section 2(a)(19) of the Investment Company Act of 1940, as amended (the “1940 Act”), considered the renewal of the investment advisory agreement (the “Advisory Agreement”) between Connors Investor Services, Inc. (“Connors” or the “Adviser”) and the Trust, on behalf of the Connors Hedged Equity Fund (the “Fund”).
In connection with the Board’s consideration of the Advisory Agreement, the Board received written materials in advance of the Meeting, which included information regarding: (i) the investment performance of the Fund and other accounts managed by the Adviser; (ii) the nature, extent and quality of the services to be provided by the Adviser to the Fund; (iii) the costs of the services to be provided and the profits to be realized by the Adviser and its affiliates from the relationship with the Fund; (iv) the extent to which economies of scale will be realized as the Fund grows; and (v) whether the fee levels reflect these economies of scale to the benefit of shareholders. She noted that the Board should also consider any benefits derived or to be derived by the investment adviser from its relationship with the fund such as soft dollar arrangements by which brokers provide research to the fund or its investment adviser in return for allocating the fund’s brokerage.
Throughout the process, including at the Meeting, the Board had numerous opportunities to ask questions of and request additional materials from Connors. The Board was advised by, and met in executive session with, the Board’s independent legal counsel and received a memorandum from such independent counsel regarding their responsibilities under applicable law. The Board also noted that the evaluation process with respect to the Adviser is an ongoing one and that in this regard, the Board took into account discussions with management and information provided to the Board at prior meetings with respect to the services provided by the Adviser, including quarterly performance reports prepared by management. The Board noted that the information received and considered by the Board in connection with the Meeting and throughout the year was both written and oral.
Matters considered by the Board in connection with its approval of the Advisory Agreement with respect to the Fund included, among others, the following:
Nature, Extent and Quality of Services. In this regard, the Board reviewed the services provided by the Adviser to the Fund, including, without limitation, the investment advisory services to be provided to the Fund, the Adviser’s coordination of services for the Fund among the Fund’s service providers, the nature of the Adviser’s operations, the quality of the Adviser’s compliance infrastructure, the experience and background of all key personnel of its Fund management team, including the Fund’s portfolio managers, and the Adviser’s efforts to market the Fund and assist in its distribution. The Board noted that many of the Trust’s executive officers are employees of the Adviser and serve the Trust without additional compensation from the Fund. The Board also evaluated the investment management experience of the Adviser. The Board considered the Adviser’s Form ADV, select financial information of the Adviser, the Advisory Agreement, and a description of the manner in which investment decisions are made and executed. After reviewing the foregoing information and further information in the Adviser Memorandum, the Board concluded that the quality, extent, and nature of the services to be provided by the Adviser were satisfactory.
33
| Adviser Agreement Renewal (Unaudited) (continued) |
Performance. In considering the Fund’s performance, the Board noted that it had reviewed at its regularly scheduled meetings information about the Fund’s performance results on both an absolute basis and in comparison to appropriate securities benchmark indices (the S&P 500 Total Return Index (the “S&P 500”) and the CBOE S&P 500 BuyWrite Index (the “BXM”)) and certain peer funds. The Board considered the performance of the Fund as compared to its benchmarks and peer funds. In reviewing the Fund’s performance the Board also considered the investment objective and strategies of the Fund.
Fees and Expenses. The Board considered the management fee for the Fund and the overall expense ratio. The Board compared the management fee and expenses of the Fund to a peer group of other funds comparable to the Fund in terms of the type of fund, the style of investment management and the nature of the investment strategy and markets invested in, among other factors. The Board noted that the Fund’s management fee and the Fund’s expense ratio are not the highest within the peer group. The Board also compared the fees paid by the Fund as compared to the fees paid by other clients of the Adviser, and considered the similarities and differences in the services received by such other clients as compared to the services received by the Fund. Following these comparisons and upon further consideration and discussion of the foregoing, the Board concluded that the both the advisory fee to be paid to the Adviser by the Fund and the expense ratio are each reasonable in light of the nature and quality of the services to be provided by the Adviser.
Profitability. The Board took into consideration the profitability, if any, of the Adviser with respect to the Fund and the direct and indirect benefits derived by the Adviser from its relationships with the Fund. The Board considered the Adviser’s commitment to contractually limit the Fund’s net operating expenses. The Board also took into account the Adviser’s costs of managing the Fund, information provided by the Adviser regarding its financial condition. The Board was satisfied that the Adviser’s level of profitability from its relationship with the Fund is not excessive and that the Adviser had the financial wherewithal and support to fulfill its obligations during the term of the Advisory Agreement.
Economies of Scale. The Board considered whether the Adviser had realized economies of scale with respect to its management of the Fund. The Trustees noted that economies of scale were not a relevant consideration at this time and the Adviser would consider economies of scale in the future once the Fund has achieved sufficient scale.
Other Benefits. The Board also considered the character and amount of any other direct and incidental benefits received by the Adviser from its association with the Fund and information provided by the Adviser in this regard. The Board noted that the Adviser derives benefits to its reputation and other benefits from its association with the Fund.
Conclusion. The Board, having requested and received such information from the Adviser as it believed reasonably necessary to evaluate the terms of the Advisory Agreement, with the Independent Trustees having met in executive session and with counsel, determined that approval of the continuance of the Advisory Agreement is in the best interests of the Fund and its shareholders. In considering the renewal of the Advisory Agreement, the Board did not identify any one factor as particularly important and each Trustee may have individually given weight to separate factors.
34
| Adviser Agreement Renewal (Unaudited) (continued) |
In considering the renewal of the Advisory Agreement, the Board considered a variety of factors, including those discussed above, and also considered other factors (including conditions and trends prevailing generally in the economy, the securities markets, and the industry). The Board did not identify any one factor as determinative, and each Independent Trustee may have weighed each factor differently. The Board’s conclusions may be based in part on its consideration of the advisory arrangements in prior years and on the Board’s ongoing regular review of Fund performance and operations throughout the year.
35
| FACTS | WHAT DOES CONNORS HEDGED EQUITY FUND (THE “FUND”) DO WITH YOUR PERSONAL INFORMATION? |
| Why? | Financial companies choose how they share your personal information. Federal law gives consumers the right to limit some but not all sharing. Federal law also requires us to tell you how we collect, share, and protect your personal information. Please read this notice carefully to understand what we do. |
| What? | The types of personal information we collect and share depend on the product or service you have with us. This information can include:
■ Social Security number
■ account balances and account transactions
■ transaction or loss history and purchase history
■ checking account information and wire transfer instructions
When you are no longer our customer, we continue to share your information as described in this notice. |
| How? | All financial companies need to share customers’ personal information to run their everyday business. In the section below, we list the reasons financial companies can share their customers’ personal information; the reasons the Funds choose to share; and whether you can limit this sharing. |
| Reasons we can share your personal information | Does the Fund share? |
| For our everyday business purposes— such as to process your transactions, maintain your account(s), respond to court orders and legal investigations, or report to credit bureaus | Yes |
| For our marketing purposes— to offer our products and services to you | No |
| For joint marketing with other financial companies | No |
| For our affiliates’ everyday business purposes— information about your transactions and experiences | No |
| For our affiliates’ everyday business purposes— information about your creditworthiness | No |
| For nonaffiliates to market to you | No |
| Questions? | Call (833) 601-2676 |
36
| Who we are | |
| Who is providing this notice? | Connors Hedged Equity Fund Ultimus Fund Distributors, LLC (Distributor) Ultimus Fund Solutions, LLC (Administrator) |
| What we do | |
| How does the Fund protect my personal information? | To protect your personal information from unauthorized access and use, we use security measures that comply with federal law. These measures include computer safeguards and secured files and buildings. Our service providers are held accountable for adhering to strict policies and procedures to prevent any misuse of your nonpublic personal information. |
| How does the Fund collect my personal information? | We collect your personal information, for example, when you
■ open an account or deposit money
■ buy securities from us or sell securities to us
■ make deposits or withdrawals from your account
■ give us your account information
■ make a wire transfer
■ tell us who receives the money
■ tell us where to send the money
■ show your government-issued ID
■ show your driver’s license |
| Why can’t I limit all sharing? | Federal law gives you the right to limit only
■ sharing for affiliates’ everyday business purposes—information about your creditworthiness
■ affiliates from using your information to market to you
■ sharing for nonaffiliates to market to you
State laws and individual companies may give you additional rights to limit sharing. |
| Definitions | |
| Affiliates | Companies related by common ownership or control. They can be financial and nonfinancial companies. |
| ■ Connors Investor Services, Inc., the investment adviser to the Fund, could be deemed to be an affiliate. | |
| Nonaffiliates | Companies not related by common ownership or control. They can be financial and nonfinancial companies. |
| ■ The Fund does not share your personal information with nonaffiliates so they can market to you | |
| Joint marketing | A formal agreement between nonaffiliated financial companies that together market financial products or services to you. |
| ■ The Fund does not jointly market. | |
37
Proxy Voting
A description of the policies and procedures that the Fund uses to determine how to vote proxies relating to portfolio securities and information regarding how the Fund voted those proxies during the most recent twelve month period ended June 30, are available (1) without charge upon request by calling the Fund at (833) 601-2676 and (2) in Fund documents filed with the SEC on the SEC’s website at www.sec.gov.
| TRUSTEES Peter J. Connors, Chairperson Bradford H. Barrett Joni S. Naugle John R. Morahan | INDEPENDENT REGISTERED PUBLIC ACCOUNTING FIRM Cohen & Company, Ltd. 1835 Market Street, 3rd Floor Philadelphia, PA 19103 |
| OFFICERS Debora M. Covell, Treasurer (Principal Financial Officer) Robert J. Cagliola, Secretary Kyle Bubeck, Chief Compliance Officer | LEGAL COUNSEL Kilpatrick Townsend & Stockton LLP 1001 West Forth Street Winston-Salem, NC 27101 |
| INVESTMENT ADVISER Connors Investor Services, Inc. 1210 Broadcasting Road, Suite 200 Wyomissing, PA 19610 | CUSTODIAN U.S. Bank, N.A. 425 Walnut Street Cincinnati, OH 45202 |
| DISTRIBUTOR Ultimus Fund Distributors, LLC 225 Pictoria Drive, Suite 450 Cincinnati, OH 45246 | ADMINISTRATOR, TRANSFER AGENT AND FUND ACCOUNTANT Ultimus Fund Solutions, LLC 225 Pictoria Drive, Suite 450 Cincinnati, OH 45246 |
This report is intended only for the information of shareholders or those who have received the Fund’s prospectus which contains information about the Fund’s management fee and expenses. Please read the prospectus carefully before investing.
Distributed by Ultimus Fund Distributors, LLC, Member FINRA/SIPC
Connors-AR-23
(b) Not applicable.
Item 2. Code of Ethics.
As of the end of the period covered by this report, the registrant has adopted a code of ethics that applies to the registrant's principal executive officer, principal financial officer, principal accounting officer or controller, or persons performing similar functions, regardless of whether these individuals are employed by the registrant or a third party. Pursuant to Item 13(a)(1), a copy of registrant’s code of ethics is filed as an exhibit to this Form N-CSR. During the period covered by this report, the code of ethics has not been amended, and the registrant has not granted any waivers, including implicit waivers, from the provisions of the code of ethics.
Item 3. Audit Committee Financial Expert.
(a) The registrant’s board of trustees has determined that the registrant does not have an audit committee financial expert. The committee members and the full Board considered a possibility of adding a member that would qualify as an expert. The audit committee determined that, although none of its members meet the technical definition of an audit committee expert, the committee has sufficient financial expertise to adequately perform its duties under the Audit Committee Charter without the addition of a qualified expert.
Item 4. Principal Accountant Fees and Services.
(a) Audit Fees billed to the registrant by its principal accountants for the two most recent fiscal years:
| Connors Hedged Equity Fund | FY 2023 | $12,000 | |
| FY 2022 | $10,000 |
(b) Audit-Related Fees billed to the registrant by its principal accountants for the two most recent fiscal years:
| Connors Hedged Equity Fund | FY 2023 | $0 | |
| FY 2022 | $0 |
(c) Tax Fees billed to the registrant by its principal accountants for the two most recent fiscal years:
| Connors Hedged Equity Fund | FY 2023 | $3,100 | |
| FY 2022 | $3,000 |
Nature of the fees: Preparation of the 1120 RIC and Excise review
(d) All other fees billed to the registrant by its principal accountants for the two most recent fiscal years:
| Connors Hedged Equity Fund | FY 2023 | $0 | |
| FY 2022 | $0 |
(e)(1) Audit Committee’s Pre-Approval Policies
The Audit Committee Charter requires the Audit Committee to be responsible for the selection, retention or termination of auditors and, in connection therewith, to (i) evaluate the proposed fees and other compensation, if any, to be paid to the auditors, (ii) evaluate the independence of the auditors, (iii) pre-approve all audit services and, when appropriate, any non-audit services provided by the independent auditors to the Trust, (iv) pre-approve, when appropriate, any non-audit services provided by the independent auditors to the Trust's investment adviser, or any entity controlling, controlled by, or under common control with the investment adviser and that provides ongoing services to the Trust if the engagement relates directly to the operations and financial reporting of the Trust, and (v) receive the auditors’ specific representations as to their independence;
(2) None of the services described in paragraph (b) through (d) of this Item were approved by the audit committee pursuant to paragraph (c)(7)(i)(C) of Rule 2-01 of Regulation S-X.
(f) During audit of registrant's financial statements for the most recent fiscal year, less than 50 percent of the hours expended on the principal accountant's engagement were attributed to work performed by persons other than the principal accountant's full-time, permanent employees.
(g) The aggregate non-audit fees billed by the registrant's accountant for services rendered to the registrant, and rendered to the registrant's investment adviser (not including any sub-adviser whose role is primarily portfolio management and is subcontracted with or overseen by another investment adviser), and any entity controlling, controlled by, or under common control with the adviser that provides ongoing services to the registrant:
| Registrant | Adviser | |||
| FY 2023 | $15,100 | $0 | ||
| FY 2022 | $13,000 | $0 |
(h) Not applicable. The auditor performed no services for the registrant’s investment adviser or any entity controlling, controlled by, or under common control with the investment adviser that provides ongoing services to the registrant.
(i) Not applicable.
(j) Not applicable.
Item 5. Audit Committee of Listed Registrants.
NOT APPLICABLE – applies to listed companies only
Item 6. Schedule of Investments.
Schedule filed with Item 1.
Item 7. Disclosure of Proxy Voting Policies and Procedures for Closed-End Management Investment Companies.
NOT APPLICABLE – applies to closed-end funds only
Item 8. Portfolio Managers of Closed-End Management Investment Companies.
NOT APPLICABLE – applies to closed-end funds only
Item 9. Purchases of Equity Securities by Closed-End Management Investment Company and Affiliated Purchasers.
NOT APPLICABLE – applies to closed-end funds only
Item 10. Submission of Matters to a Vote of Security Holders.
The guidelines applicable to shareholders desiring to submit recommendations for nominees to the Registrant's board of trustees are contained in the statement of additional information of the Trust with respect to the Fund(s) for which this Form N-CSR is being filed.
Item 11. Controls and Procedures.
(a) Based on their evaluation of the registrant’s disclosure controls and procedures (as defined in Rule 30a-3(c) under the Investment Company Act of 1940, as amended (the “Act”)) as of a date within 90 days of the filing date of this report, the registrant’s principal executive officer and principal financial officer have concluded that such disclosure controls and procedures are reasonably designed and are operating effectively to ensure that material information relating to the registrant is made known to them by others within those entities, particularly during the period in which this report is being prepared, and that the information required in filings on Form N-CSR is recorded, processed, summarized, and reported on a timely basis.
(b) There were no changes in the registrant’s internal control over financial reporting (as defined in Rule 30a-3(d) under the Investment Company Act of 1940) that occurred during the period covered by this report that have materially affected, or are reasonably likely to materially affect, the registrant’s internal control over financial reporting.
Item 12. Disclosure of Securities Lending Activities for Closed-End Management Investment Companies.
NOT APPLICABLE – applies to closed-end funds only
Item 13. Exhibits.
(a)(1) Code is filed herewith.
(a)(3) Not applicable.
SIGNATURES
Pursuant to the requirements of the Securities Exchange Act of 1934 and the Investment Company Act of 1940, the registrant has duly caused this report to be signed on its behalf by the undersigned, thereunto duly authorized.
| (Registrant) | CONNORS FUNDS |
| By (Signature and Title) | /s/ Peter Connors | |
| Peter Connors, President | ||
| Date | 2/05/2024 |
Pursuant to the requirements of the Securities Exchange Act of 1934 and the Investment Company Act of 1940, this report has been signed below by the following persons on behalf of the registrant and in the capacities and on the dates indicated.
| By (Signature and Title) | /s/ Peter Connors | |
| Peter Connors, President | ||
| Date | 2/05/2024 |
| By (Signature and Title) | /s/ Debora M. Covell | |
| Debora M. Covell, Treasurer | ||
| Date | 2/05/2024 |