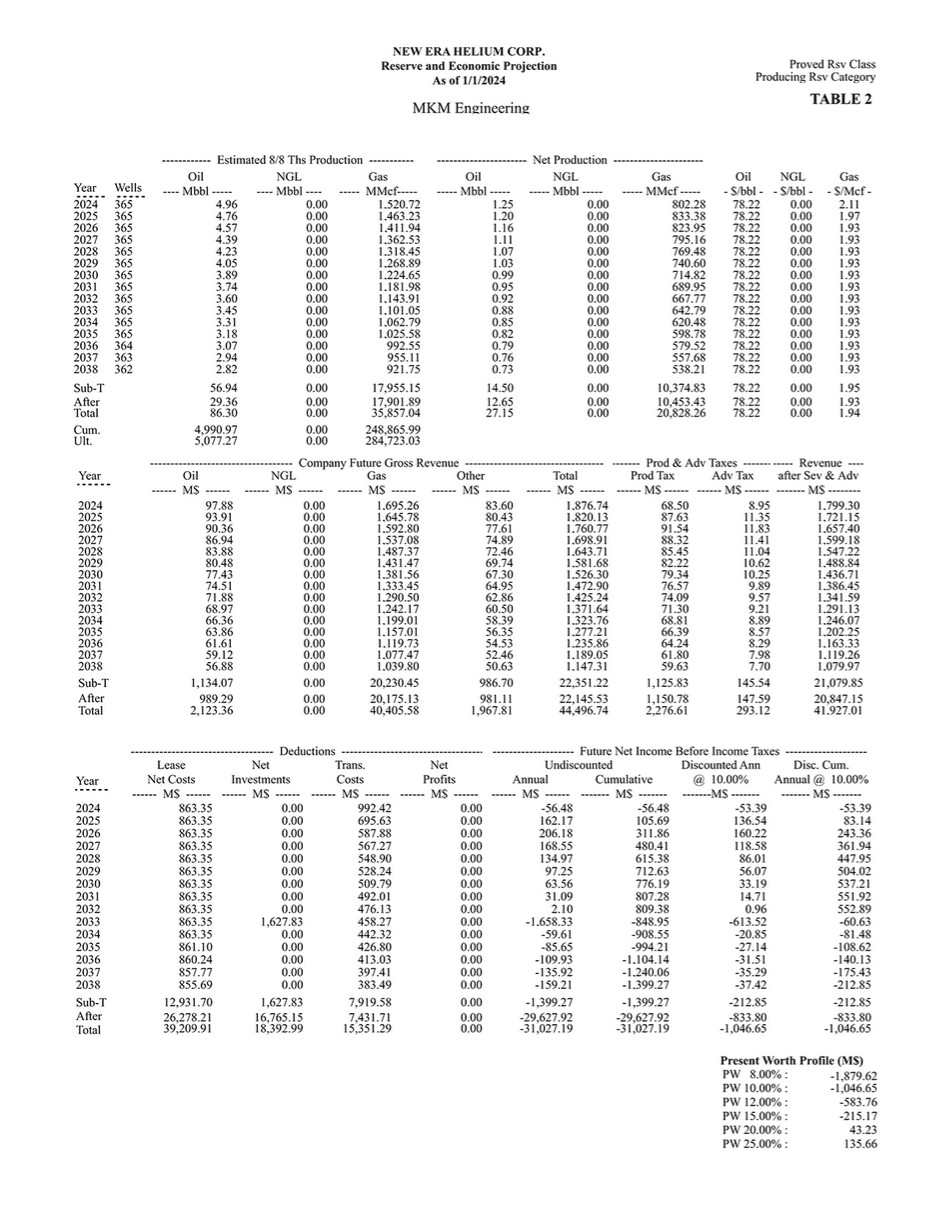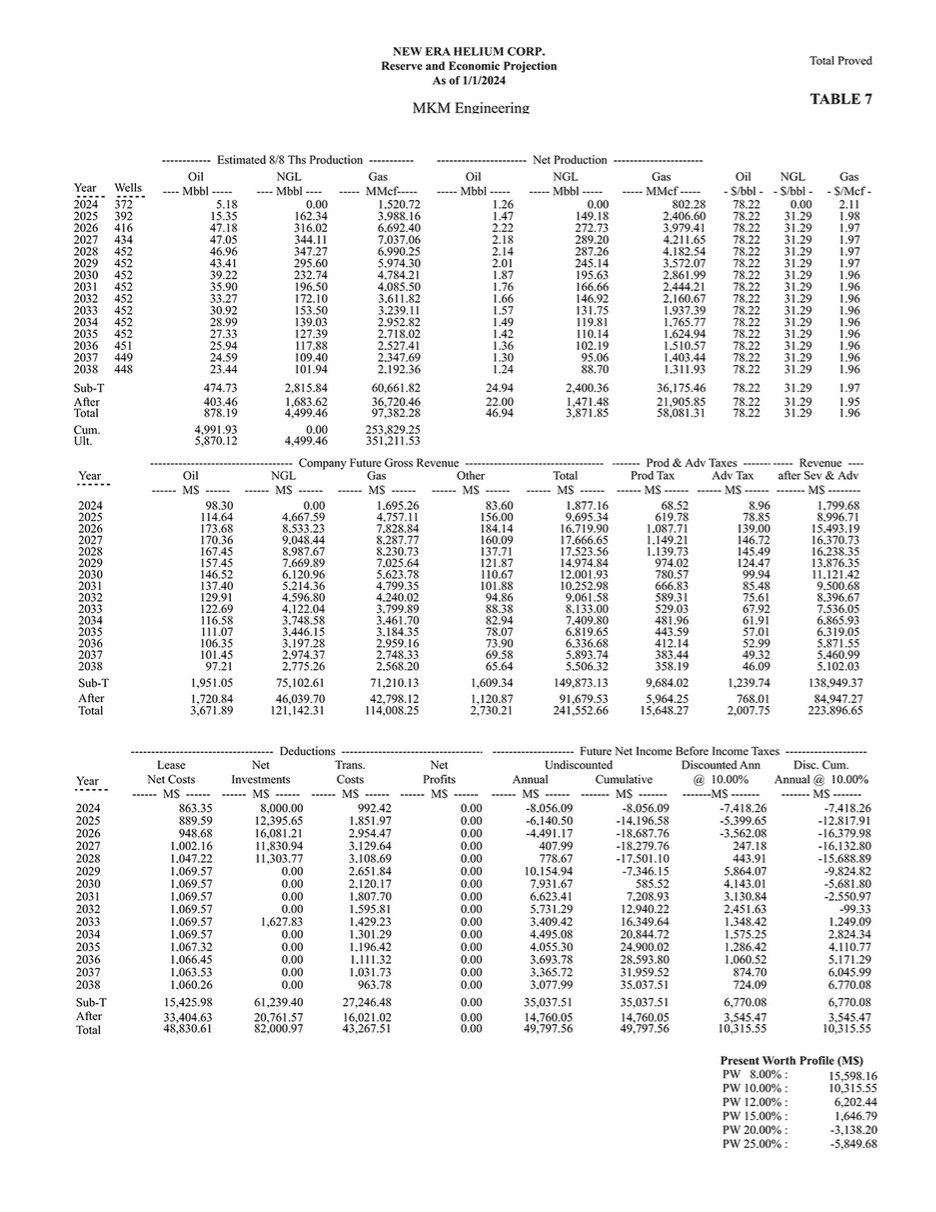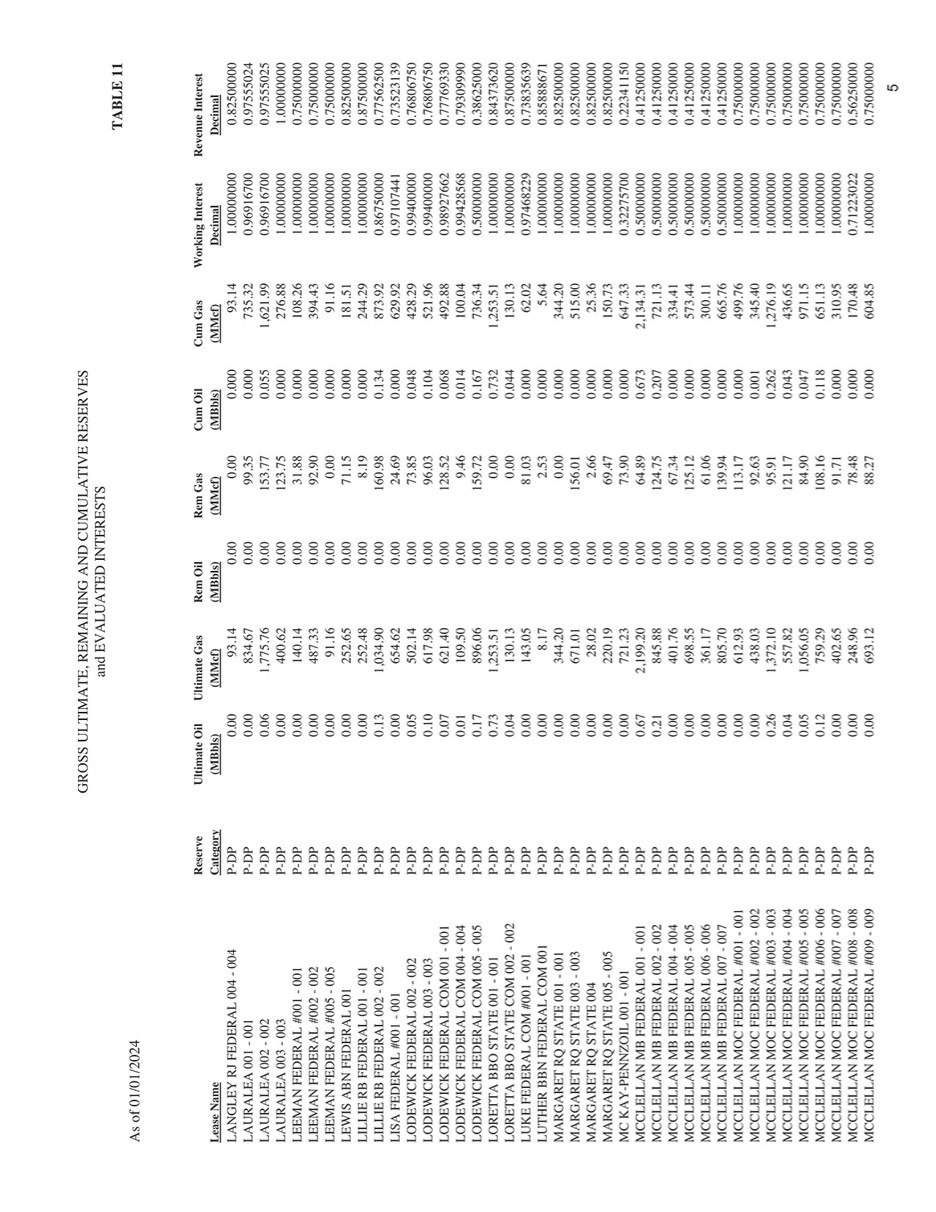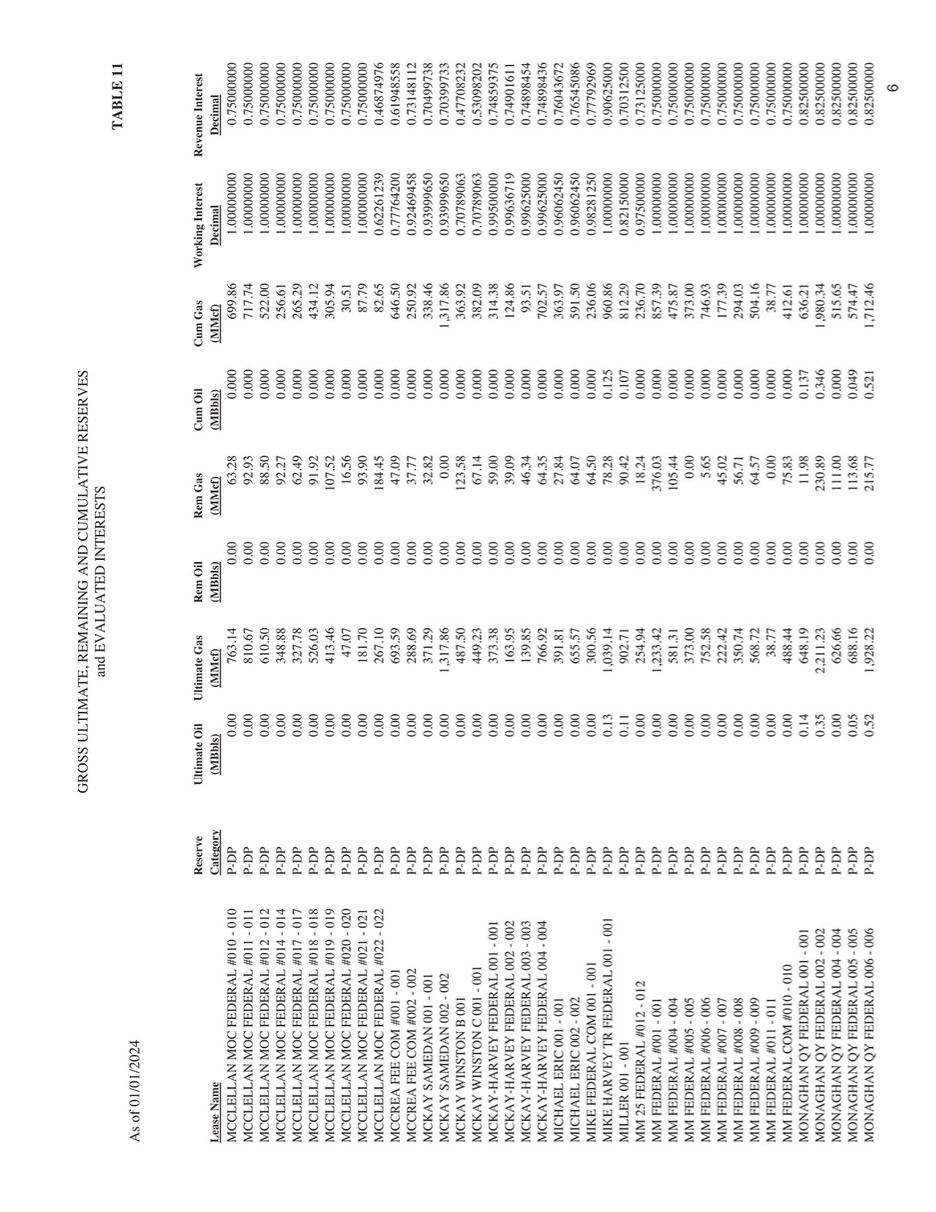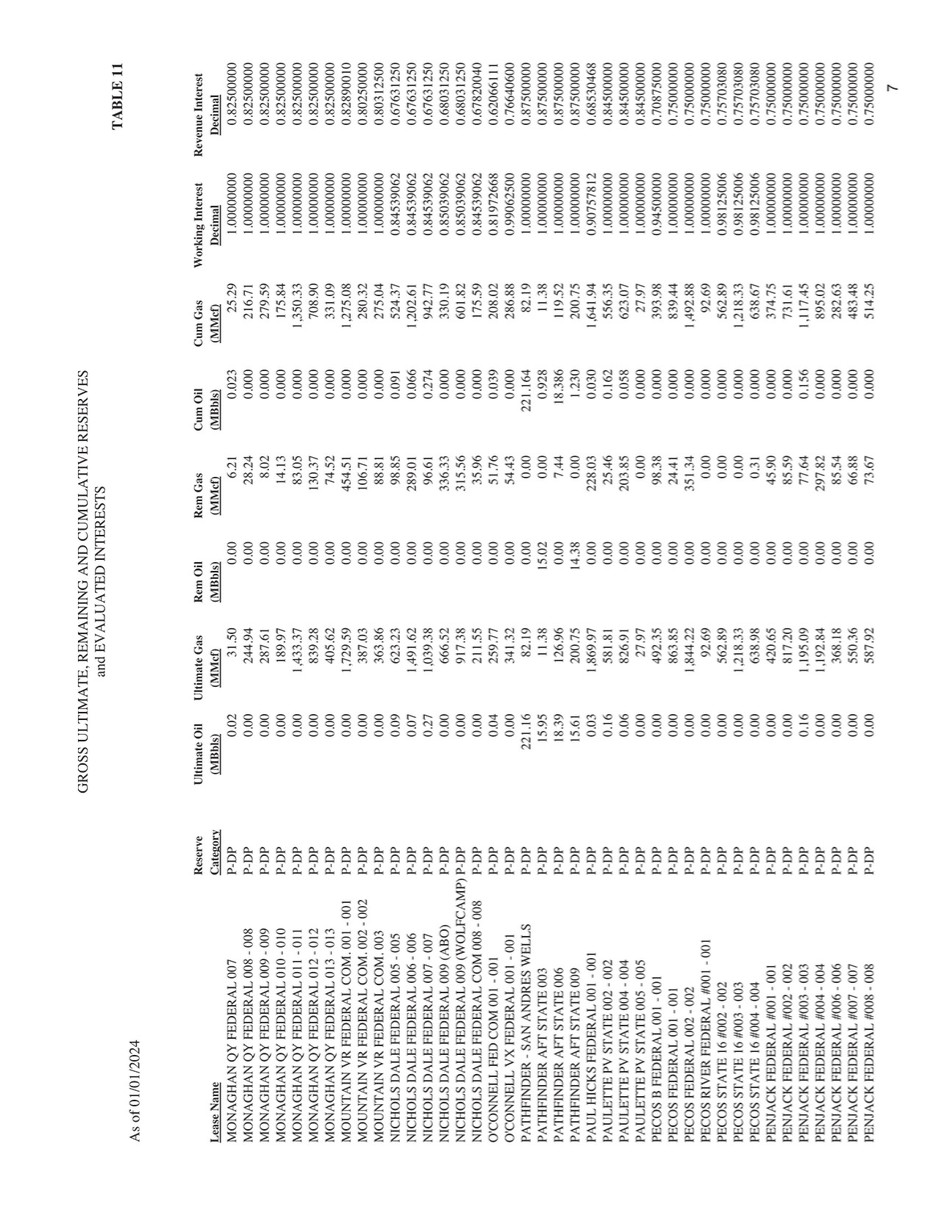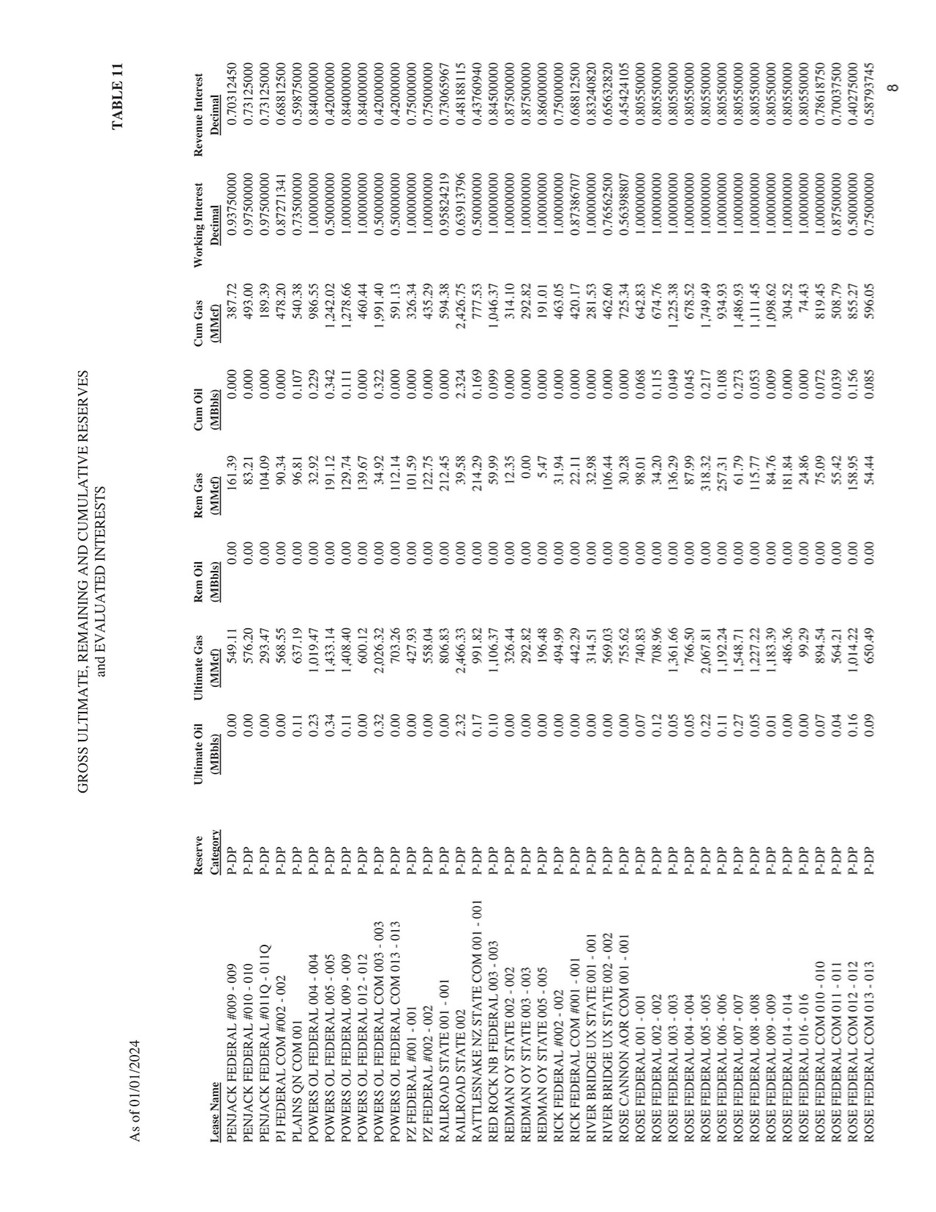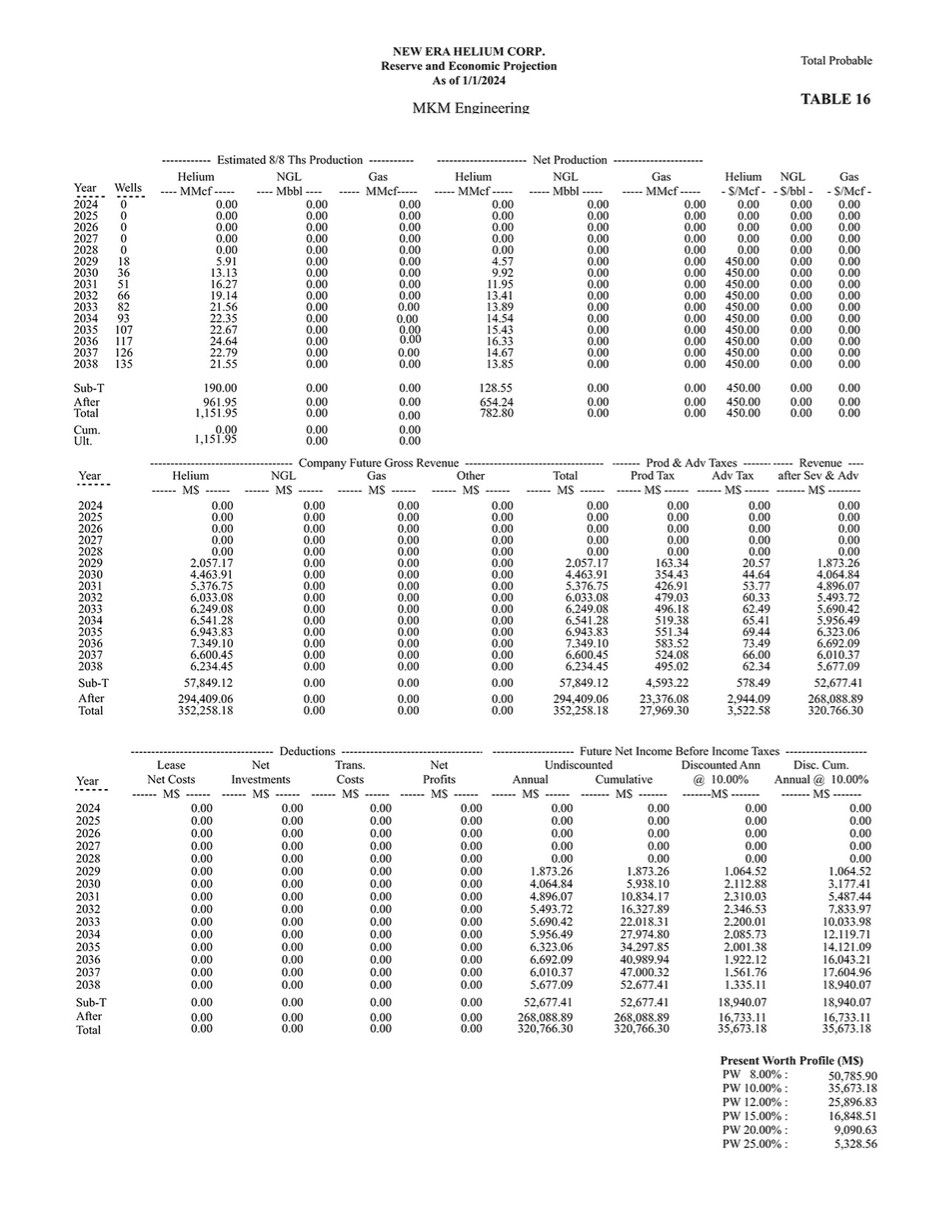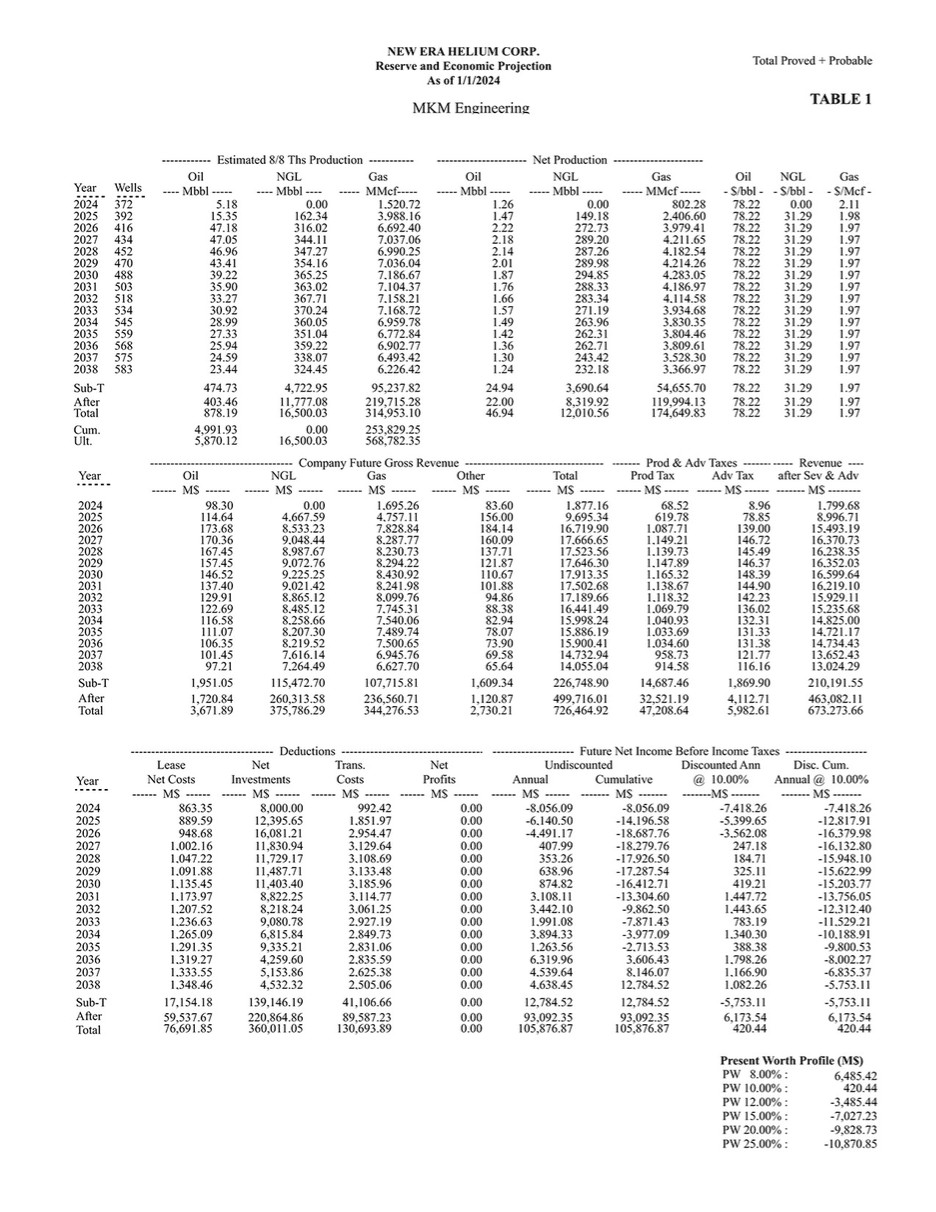
| Year Oil ---- Mbbl ----- Gas ----- MMcf ----- NGL ----- Mbbl ----- Oil ----- Mbbl ----- Gas ----- MMcf----- NGL ---- Mbbl ---- ------------ Estimated 8/8 Ths Production ----------- ---------------------- Net Production ---------------------- NGL - $/bbl - Oil - $/bbl - NEW ERA HELIUM CORP. Reserve and Economic Projection As of 1/1/2024 Wells Gas - $/Mcf - MKM Engineering TABLE 1 Total Proved + Probable 2024 372 5.18 0.00 1,520.72 1.26 0.00 802.28 78.22 0.00 2.11 2025 392 15.35 162.34 3,988.16 1.47 149.18 2,406.60 78.22 31.29 1.98 2026 416 47.18 316.02 6,692.40 2.22 272.73 3,979.41 78.22 31.29 1.97 2027 434 47.05 344.11 7,037.06 2.18 289.20 4,211.65 78.22 31.29 1.97 2028 452 46.96 347.27 6,990.25 2.14 287.26 4,182.54 78.22 31.29 1.97 2029 470 43.41 354.16 7,036.04 2.01 289.98 4,214.26 78.22 31.29 1.97 2030 488 39.22 365.25 7,186.67 1.87 294.85 4,283.05 78.22 31.29 1.97 2031 503 35.90 363.02 7,104.37 1.76 288.33 4,186.97 78.22 31.29 1.97 2032 518 33.27 367.71 7,158.21 1.66 283.34 4,114.58 78.22 31.29 1.97 2033 534 30.92 370.24 7,168.72 1.57 271.19 3,934.68 78.22 31.29 1.97 2034 545 28.99 360.05 6,959.78 1.49 263.96 3,830.35 78.22 31.29 1.97 2035 559 27.33 351.04 6,772.84 1.42 262.31 3,804.46 78.22 31.29 1.97 2036 568 25.94 359.22 6,902.77 1.36 262.71 3,809.61 78.22 31.29 1.97 2037 575 24.59 338.07 6,493.42 1.30 243.42 3,528.30 78.22 31.29 1.97 2038 583 23.44 324.45 6,226.42 1.24 232.18 3,366.97 78.22 31.29 1.97 After 403.46 11,777.08 219,715.28 22.00 119,994.13 8,319.92 Total Ult. 5,870.12 568,782.35 878.19 16,500.03 314,953.10 46.94 12,010.56 174,649.83 Cum. Sub-T 78.22 31.29 1.97 78.22 31.29 1.97 474.73 4,722.95 95,237.82 24.94 3,690.64 54,655.70 78.22 31.29 1.97 16,500.03 4,991.93 0.00 253,829.25 Gas ------ M$ ------ Oil ------ M$ ------ Other ------ M$ ------ Year ----------------------------------- Company Future Gross Revenue ---------------------------------- NGL ------ M$ ------ Total ------ M$ ------ Prod Tax ------ M$ ------ Adv Tax ------ M$ ------ after Sev & Adv ------- M$ -------- ------- Prod & Adv Taxes ------------ Revenue ---- 2024 98.30 0.00 1,695.26 83.60 1,877.16 68.52 8.96 1,799.68 2025 114.64 4,667.59 4,757.11 156.00 9,695.34 619.78 78.85 8,996.71 2026 173.68 8,533.23 7,828.84 184.14 16,719.90 1,087.71 139.00 15,493.19 2027 170.36 9,048.44 8,287.77 160.09 17,666.65 1,149.21 146.72 16,370.73 2028 167.45 8,987.67 8,230.73 137.71 17,523.56 1,139.73 145.49 16,238.35 2029 157.45 9,072.76 8,294.22 121.87 17,646.30 1,147.89 146.37 16,352.03 2030 146.52 9,225.25 8,430.92 110.67 17,913.35 1,165.32 148.39 16,599.64 2031 137.40 9,021.42 8,241.98 101.88 17,502.68 1,138.67 144.90 16,219.10 2032 129.91 8,865.12 8,099.76 94.86 17,189.66 1,118.32 142.23 15,929.11 2033 122.69 8,485.12 7,745.31 88.38 16,441.49 1,069.79 136.02 15,235.68 2034 116.58 8,258.66 7,540.06 82.94 15,998.24 1,040.93 132.31 14,825.00 2035 111.07 8,207.30 7,489.74 78.07 15,886.19 1,033.69 131.33 14,721.17 2036 106.35 8,219.52 7,500.65 73.90 15,900.41 1,034.60 131.38 14,734.43 2037 101.45 7,616.14 6,945.76 69.58 14,732.94 958.73 121.77 13,652.43 2038 97.21 7,264.49 6,627.70 65.64 14,055.04 914.58 116.16 13,024.29 After 1,720.84 236,560.71 Total 3,671.89 375,786.29 344,276.53 1,120.87 2,730.21 260,313.58 Sub-T 726,464.92 499,716.01 47,208.64 32,521.19 5,982.61 4,112.71 673,273.66 463,082.11 1,951.05 115,472.70 107,715.81 1,609.34 226,748.90 14,687.46 1,869.90 210,191.55 Cumulative ------- M$ ------- Annual ------ M$ ------ Disc. Cum. Annual ≅ 10.00% ------- M$ ------- ----------------------------------- Deductions ----------------------------------- -------------------- Future Net Income Before Income Taxes -------------------- Trans. Costs ------ M$ ------ Net Investments ------ M$ ------ Lease Net Costs ------ M$ ------ Net Profits ------ M$ ------ Undiscounted Discounted Ann ≅ 10.00% -------M$ ------- Year 2024 863.35 8,000.00 992.42 0.00 -8,056.09 -8,056.09 -7,418.26 -7,418.26 2025 889.59 12,395.65 1,851.97 0.00 -6,140.50 -14,196.58 -5,399.65 -12,817.91 2026 948.68 16,081.21 2,954.47 0.00 -4,491.17 -18,687.76 -3,562.08 -16,379.98 2027 1,002.16 11,830.94 3,129.64 0.00 407.99 -18,279.76 247.18 -16,132.80 2028 1,047.22 11,729.17 3,108.69 0.00 353.26 -17,926.50 184.71 -15,948.10 2029 1,091.88 11,487.71 3,133.48 0.00 638.96 -17,287.54 325.11 -15,622.99 2030 1,135.45 11,403.40 3,185.96 0.00 874.82 -16,412.71 419.21 -15,203.77 2031 1,173.97 8,822.25 3,114.77 0.00 3,108.11 -13,304.60 1,447.72 -13,756.05 2032 1,207.52 8,218.24 3,061.25 0.00 3,442.10 -9,862.50 1,443.65 -12,312.40 2033 1,236.63 9,080.78 2,927.19 0.00 1,991.08 -7,871.43 783.19 -11,529.21 2034 1,265.09 6,815.84 2,849.73 0.00 3,894.33 -3,977.09 1,340.30 -10,188.91 2035 1,291.35 9,335.21 2,831.06 0.00 1,263.56 -2,713.53 388.38 -9,800.53 2036 1,319.27 4,259.60 2,835.59 0.00 6,319.96 3,606.43 1,798.26 -8,002.27 2037 1,333.55 5,153.86 2,625.38 0.00 4,539.64 8,146.07 1,166.90 -6,835.37 2038 1,348.46 4,532.32 2,505.06 0.00 4,638.45 12,784.52 1,082.26 -5,753.11 220,864.86 93,092.35 6,173.54 76,691.85 59,537.67 130,693.89 89,587.23 360,011.05 105,876.87 420.44 105,876.87 Sub-T After Total 0.00 17,154.18 139,146.19 41,106.66 0.00 12,784.52 -5,753.11 -5,753.11 0.00 420.44 93,092.35 6,173.54 12,784.52 Present Worth Profile (M$) PW 8.00% : PW 10.00% : PW 12.00% : PW 15.00% : PW 20.00% : PW 25.00% : 6,485.42 420.44 -3,485.44 -7,027.23 -9,828.73 -10,870.85 |