The Company generated Other income of $73,115 during the year ended June 30, 2020, due to a one time loan from the U.S. Department of Treasury in respect of the COVID-19 pandemic. This loan was subsequently forgiven and non-taxable. There was $0 of Other income for the year ended June 30, 2021.
The Company generated a loss on foreign exchange of $1,668,514 for the fiscal year ended June 30, 2021, compared to a loss of $97,963 for the fiscal year ended June 30, 2020. The $1,570,551 (1,603%) increase in the loss was due to fluctuations in currency and a declining Australian dollar.
Expenses
Exploration and Evaluation Expenses
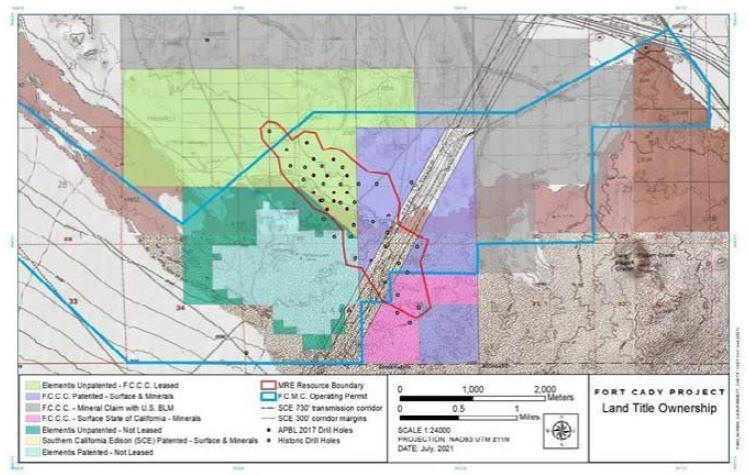
Exploration and evaluation expenses include drilling, site-prep, engineering, consumables, and other expenses associated with the exploration of the Project. The Company incurred exploration and evaluation expenses of $2,287,732 for the fiscal year ended June 30, 2021, compared to $1,819,230 for the fiscal year ended June 30, 2020. The $468,502 (25.8%) increase was due to increased exploration activities relating to the Project.
General & Administrative Expenses
General and administrative expenses include professional fees, costs associated with marketing, press releases, public relations, rent, salaries, sponsorships, share-based compensation and other expenses. The Company incurred general and administrative expenses of $11,636,733 for the fiscal year ended June 30, 2021 versus $4,169,357 for the fiscal year ended June 30, 2020. The $7,467,376 (179.1%) increase was predominantly due to increased share-based compensation, increasing from $2,655,797 in the fiscal year ended June 30, 2020, to $6,375,780 in the fiscal year ended June 30, 2021, with headcount increasing from 7 people in fiscal 2020 to 11 people in fiscal 2021, and associated increases in hiring support.
Environmental and reclamation
Environmental and reclamation expenses include environmental drilling, testing, hydrology, permits, surveys, and other expenses associated with the environmental scope of the Project. The Company incurred $3,678,008 in environmental and reclamation expenses for the fiscal year ended June 30, 2021, compared to $0 for the fiscal year ended June 30, 2020. The $3,678,008 increase in environmental and reclamation expenses was due to approval of the Project’s permit and increased environmental activities to further support the Project.
Depreciation
The Company had $31,050 in depreciation expense for the fiscal year ended June 30, 2021, compared to depreciation expense of $6,470 for the fiscal year ended June 30, 2020. The $24,580 (379.9%) increase was due to assets placed in service.
Income Tax
The Company did not have any income tax expense or benefit for the fiscal year ended June 30, 2021, nor for the fiscal year ended June 30, 2020, as the Company did not generate any net income for either period. As of June 30, 2021 and 2020, there was a full valuation allowance of $7,940,661 and $5,057,510, respectively, which primarily relate to net operating losses. During the years ended June 30, 2021 and 2020, the Company did not record an income tax benefit for net operating losses incurred in each year, due to the uncertainty of realizing a benefit from those items.
Net Losses
The Company incurred a net loss of $19,253,168 for the fiscal year ended June 30, 2021 versus $6,193,088 for the fiscal year ended June 30, 2020. The $13,060,080 (210.9%) increase in net losses was primarily due to increased exploration and evaluation, increased general and administrative expenses and environmental and reclamation expenses to support the Project.
Liquidity and Capital Resources
Liquidity and Capital Resources for the Fiscal Year Ended June 30, 2021, compared to the Fiscal Year Ended June 30, 2020
| | | | | | | | |
| | | Fiscal Year Ended June 30 | |
| | | 2021 | | | 2020 | |
Summary of Cash Flows: | | | | | | | | |
Net cash used by operating activities | | $ | (10,887,990 | ) | | $ | (2,380,752 | ) |
Net cash used by investing activities | | $ | (12,958,314 | ) | | $ | (1,591,555 | ) |
Net cash provided by financing activities | | $ | 37,770,014 | | | $ | 28,602,572 | |
Net increase (decrease) in cash and cash equivalents | | $ | 13,923,710 | | | $ | 24,630,265 | |
Beginning cash and cash equivalents | | $ | 26,639,953 | | | $ | 2,029,955 | |
Ending cash and cash equivalents | | $ | 40,811,269 | | | $ | 26,639,953 | |
57
