UNITED STATES
SECURITIES AND EXCHANGE COMMISSION
Washington, D.C. 20549
________
FORM N-CSRS
________
CERTIFIED SHAREHOLDER REPORT OF REGISTERED MANAGEMENT
INVESTMENT COMPANIES
Investment Company Act file number 811-23754
SEI EXCHANGE TRADED FUNDS
(Exact name of registrant as specified in charter)
________
SEI Investments Company
One Freedom Valley Drive
Oaks, PA 19456
(Address of principal executive offices)
Timothy D. Barto, Esq.
SEI Investments Company
One Freedom Valley Drive
Oaks, PA 19456
(Name and address of agent for service)
Registrant’s telephone number, including area code: 610-676-1000
Date of fiscal year end: March 31, 2024
Date of reporting period: September 30, 2023
Item 1. Reports to Stockholders.

September 30, 2023
SEMI-ANNUAL REPORT
SEI Exchange Traded Funds
❯ | SEI Enhanced U.S. Large Cap Quality Factor ETF |
❯ | SEI Enhanced U.S. Large Cap Momentum Factor ETF |
❯ | SEI Enhanced U.S. Large Cap Value Factor ETF |
❯ | SEI Enhanced Low Volatility U.S. Large Cap ETF |
Paper copies of the Funds’ shareholder reports are no longer sent by mail, unless you specifically request them from the Funds or from your financial intermediary, such as a broker-dealer or bank. Shareholder reports are available online and you will be notified by mail each time a report is posted on the Funds’ website and provided with a link to access the report online.
You may elect to receive all future reports in paper free of charge. If you invest through a financial intermediary, you can contact your financial intermediary to inform it that you wish to continue receiving paper copies of your shareholder reports. If you invest directly with the Funds, you can inform the Funds that you wish to continue receiving paper copies of your shareholder reports by calling 1-800-DIAL-SEI. Your election to receive reports in paper will apply to all funds held with the SEI Funds or your financial intermediary.
seic.com
TABLE OF CONTENTS
Schedules of Investments | 1 |
Statements of Assets and Liabilities | 10 |
Statements of Operations | 11 |
Statements of Changes in Net Assets | 12 |
Financial Highlights | 16 |
Notes to Financial Statements | 17 |
Disclosure of Fund Expenses | 25 |
Shares are bought and sold at market price (not net asset value) and are not individually redeemed from a Fund. Shares may only be redeemed directly from a Fund by Authorized Participants, in very large creation/redemption units. Brokerage commissions will reduce returns.
The Trust files its complete schedule of portfolio holdings with the Securities and Exchange Commission for the first and third quarters of each fiscal year as an exhibit to its reports on Form N-PORT. The Trust’s Form N-PORT reports are available on the Commission’s website at http://www.sec.gov.
A description of the policies and procedures that the Trust uses to determine how to vote proxies relating to portfolio securities, as well as information relating to how a Fund voted proxies relating to portfolio securities during the most recent 12-month period ended June 30, is available (i) without charge, upon request, by calling 1-800-DIAL-SEI; and (ii) on the Commission’s website at http://www.sec.gov.
SCHEDULE OF INVESTMENTS (Unaudited)
September 30, 2023
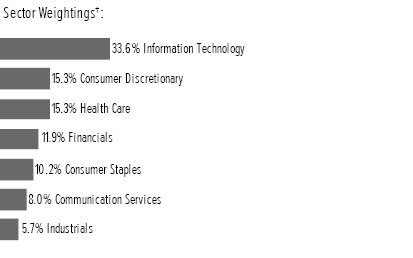
SEI Enhanced U.S. Large Cap Quality Factor ETF
†Percentages based on total investments. Total investments do not include derivatives such as options, futures contracts, forward contracts, and swap contracts, if applicable.
Description | Shares | Market Value | ||||||
COMMON STOCK†† — 99.6% | ||||||||
Communication Services — 8.0% | ||||||||
Alphabet, Cl A * | 7,697 | $ | 1,007 | |||||
Alphabet, Cl C * | 347 | 46 | ||||||
Electronic Arts | 2,223 | 268 | ||||||
| 1,321 | ||||||||
Consumer Discretionary — 15.2% | ||||||||
Amazon.com * | 379 | 48 | ||||||
AutoZone * | 20 | 51 | ||||||
Booking Holdings * | 142 | 438 | ||||||
Domino's Pizza | 722 | 273 | ||||||
Grand Canyon Education * | 339 | 40 | ||||||
H&R Block | 1,281 | 55 | ||||||
McDonald's | 261 | 69 | ||||||
NVR * | 63 | 376 | ||||||
O'Reilly Automotive * | 549 | 499 | ||||||
Ulta Beauty * | 772 | 308 | ||||||
Yum! Brands | 2,906 | 363 | ||||||
| 2,520 | ||||||||
Consumer Staples — 10.2% | ||||||||
Altria Group | 8,548 | 359 | ||||||
Coca-Cola | 5,995 | 336 | ||||||
Colgate-Palmolive | 3,269 | 232 | ||||||
Monster Beverage * | 4,051 | 215 | ||||||
Philip Morris International | 4,569 | 423 | ||||||
Procter & Gamble | 846 | 123 | ||||||
| 1,688 | ||||||||
Financials — 11.9% | ||||||||
American Express | 164 | 24 | ||||||
FactSet Research Systems | 764 | 334 | ||||||
Mastercard, Cl A | 1,224 | 485 | ||||||
Moody's | 917 | 290 | ||||||
MSCI, Cl A | 692 | 355 | ||||||
Description | Shares | Market Value | ||||||
COMMON STOCK†† (continued) | ||||||||
Visa, Cl A | 2,116 | $ | 487 | |||||
| 1,975 | ||||||||
Health Care — 15.2% | ||||||||
Bristol-Myers Squibb | 3,767 | 219 | ||||||
Edwards Lifesciences * | 573 | 40 | ||||||
Eli Lilly | 297 | 159 | ||||||
Hologic * | 4,552 | 316 | ||||||
Johnson & Johnson | 2,449 | 381 | ||||||
Merck & Co | 4,299 | 443 | ||||||
Mettler-Toledo International * | 219 | 243 | ||||||
Pfizer | 8,561 | 284 | ||||||
Vertex Pharmaceuticals * | 1,096 | 381 | ||||||
Waters * | 219 | 60 | ||||||
| 2,526 | ||||||||
Industrials — 5.7% | ||||||||
Fastenal | 6,529 | 357 | ||||||
Paychex | 2,920 | 337 | ||||||
Robert Half | 2,162 | 158 | ||||||
United Parcel Service, Cl B | 174 | 27 | ||||||
Verisk Analytics, Cl A | 264 | 62 | ||||||
| 941 | ||||||||
Information Technology — 33.4% | ||||||||
Adobe * | 466 | 238 | ||||||
Apple | 8,388 | 1,436 | ||||||
Autodesk * | 519 | 107 | ||||||
Broadcom | 491 | 408 | ||||||
Cadence Design Systems * | 2,261 | 530 | ||||||
Cisco Systems | 1,803 | 97 | ||||||
Dolby Laboratories, Cl A | 1,294 | 103 | ||||||
Keysight Technologies * | 2,036 | 269 | ||||||
Manhattan Associates * | 1,260 | 249 | ||||||
Microsoft | 4,302 | 1,358 | ||||||
QUALCOMM | 207 | 23 | ||||||
Texas Instruments | 2,286 | 363 | ||||||
VeriSign * | 1,802 | 365 | ||||||
| 5,546 | ||||||||
Total Common Stock | ||||||||
(Cost $15,551) ($ Thousands) | 16,517 | |||||||
Total Investments in Securities — 99.6% | ||||||||
(Cost $15,551) ($ Thousands) | $ | 16,517 | ||||||
| Percentages are based on Net Assets of $16,581 ($ Thousands). |
* | Non-income producing security. |
†† | Narrow industries are utilized for compliance purposes, whereas broad sectors are utilized for reporting. |
As of September 30, 2023, all of the Fund's investments were considered Level 1, in accordance with the authoritative guidance on fair value measurements and disclosure under U.S. GAAP. |
See “Glossary” for abbreviations.
SEI Exchange Traded Funds
1
SCHEDULE OF INVESTMENTS (Unaudited)
September 30, 2023
SEI Enhanced U.S. Large Cap Quality Factor ETF (Concluded)
For more information on valuation inputs, see Note 2 – Significant Accounting Policies in Notes to Financial Statements.
The accompanying notes are an integral part of the financial statements.
2
SEI Exchange Traded Funds
SCHEDULE OF INVESTMENTS (Unaudited)
September 30, 2023
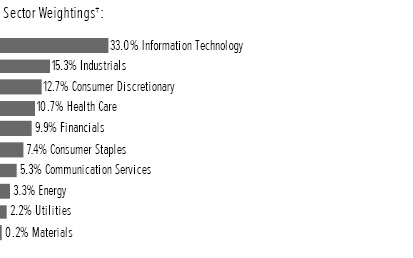
SEI Enhanced U.S. Large Cap Momentum Factor ETF
†Percentages based on total investments. Total investments do not include derivatives such as options, futures contracts, forward contracts, and swap contracts, if applicable.
Description | Shares | Market Value | ||||||
COMMON STOCK†† — 99.0% | ||||||||
Communication Services — 5.3% | ||||||||
Alphabet, Cl C * | 60 | $ | 8 | |||||
Interpublic Group of Cos | 10,846 | 311 | ||||||
Meta Platforms, Cl A * | 3,259 | 978 | ||||||
TKO Group Holdings | 1,501 | 126 | ||||||
| 1,423 | ||||||||
Consumer Discretionary — 12.6% | ||||||||
Amazon.com * | 445 | 57 | ||||||
AutoZone * | 270 | 686 | ||||||
Chipotle Mexican Grill, Cl A * | 107 | 196 | ||||||
Deckers Outdoor * | 228 | 117 | ||||||
DR Horton | 4,728 | 508 | ||||||
Genuine Parts | 3,202 | 462 | ||||||
Lululemon Athletica * | 719 | 277 | ||||||
O'Reilly Automotive * | 690 | 627 | ||||||
PulteGroup | 1,054 | 78 | ||||||
Toll Brothers | 3,700 | 274 | ||||||
Ulta Beauty * | 311 | 124 | ||||||
| 3,406 | ||||||||
Consumer Staples — 7.3% | ||||||||
Archer-Daniels-Midland | 540 | 41 | ||||||
General Mills | 6,943 | 444 | ||||||
Hershey | 2,989 | 598 | ||||||
Lamb Weston Holdings | 5,093 | 471 | ||||||
Mondelez International, Cl A | 6,266 | 435 | ||||||
| 1,989 | ||||||||
Energy — 3.2% | ||||||||
Halliburton | 2,038 | 83 | ||||||
Schlumberger | 11,530 | 672 | ||||||
TechnipFMC | 5,813 | 118 | ||||||
| 873 | ||||||||
Description | Shares | Market Value | ||||||
COMMON STOCK†† (continued) | ||||||||
Financials — 9.8% | ||||||||
Aflac | 1,854 | $ | 142 | |||||
Apollo Global Management | 4,892 | 439 | ||||||
Arch Capital Group * | 7,312 | 583 | ||||||
Blackstone | 132 | 14 | ||||||
Chubb | 78 | 16 | ||||||
Erie Indemnity, Cl A | 890 | 262 | ||||||
FactSet Research Systems | 728 | 318 | ||||||
Shift4 Payments, Cl A * | 1,804 | 100 | ||||||
Unum Group | 2,987 | 147 | ||||||
W R Berkley | 5,299 | 337 | ||||||
WEX * | 1,584 | 298 | ||||||
| 2,656 | ||||||||
Health Care — 10.6% | ||||||||
AbbVie | 790 | 118 | ||||||
Acadia Healthcare * | 1,637 | 115 | ||||||
Cigna | 183 | 52 | ||||||
Dexcom * | 1,461 | 136 | ||||||
GE HealthCare Technologies | 1,717 | 117 | ||||||
Gilead Sciences | 7,460 | 559 | ||||||
Humana | 1,098 | 534 | ||||||
McKesson | 1,554 | 676 | ||||||
Merck & Co | 1,859 | 192 | ||||||
Penumbra * | 1,266 | 306 | ||||||
Stryker | 256 | 70 | ||||||
| 2,875 | ||||||||
Industrials — 15.1% | ||||||||
Axon Enterprise * | 2,421 | 482 | ||||||
Booz Allen Hamilton Holding, Cl A | 4,639 | 507 | ||||||
Builders FirstSource * | 4,334 | 539 | ||||||
Clean Harbors * | 1,862 | 312 | ||||||
General Electric | 535 | 59 | ||||||
Hubbell, Cl B | 1,015 | 318 | ||||||
nVent Electric | 1,863 | 99 | ||||||
Parker-Hannifin | 1,612 | 628 | ||||||
Paylocity Holding * | 1,442 | 262 | ||||||
Republic Services, Cl A | 3,916 | 558 | ||||||
Trane Technologies | 1,599 | 324 | ||||||
| 4,088 | ||||||||
Information Technology — 32.7% | ||||||||
Allegro MicroSystems * | 2,389 | 76 | ||||||
Apple | 13,139 | 2,249 | ||||||
Arista Networks * | 4,511 | 830 | ||||||
Cadence Design Systems * | 2,926 | 686 | ||||||
Fair Isaac * | 100 | 87 | ||||||
First Solar * | 828 | 134 | ||||||
Jabil | 4,644 | 589 | ||||||
Keysight Technologies * | 1,584 | 210 | ||||||
Manhattan Associates * | 2,288 | 452 | ||||||
Microsoft | 3,252 | 1,027 | ||||||
SEI Exchange Traded Funds
3
SCHEDULE OF INVESTMENTS (Unaudited)
September 30, 2023
SEI Enhanced U.S. Large Cap Momentum Factor ETF (Concluded)
Description | Shares | Market Value | ||||||
COMMON STOCK†† (continued) | ||||||||
NVIDIA | 2,812 | $ | 1,223 | |||||
ON Semiconductor * | 8,280 | 770 | ||||||
Palo Alto Networks * | 2,214 | 519 | ||||||
| 8,852 | ||||||||
Materials — 0.2% | ||||||||
Chemours | 1,175 | 33 | ||||||
Reliance Steel & Aluminum | 61 | 16 | ||||||
| 49 | ||||||||
Utilities — 2.2% | ||||||||
National Fuel Gas | 3,122 | 162 | ||||||
NextEra Energy | 7,660 | 439 | ||||||
| 601 | ||||||||
Total Common Stock | ||||||||
(Cost $25,628) ($ Thousands) | 26,812 | |||||||
Total Investments in Securities — 99.0% | ||||||||
(Cost $25,628) ($ Thousands) | $ | 26,812 | ||||||
| Percentages are based on Net Assets of $27,087 ($ Thousands). |
* | Non-income producing security. |
†† | Narrow industries are utilized for compliance purposes, whereas broad sectors are utilized for reporting. |
As of September 30, 2023, all of the Fund's investments were considered Level 1, in accordance with the authoritative guidance on fair value measurements and disclosure under U.S. GAAP. |
See “Glossary” for abbreviations.
For more information on valuation inputs, see Note 2 – Significant Accounting Policies in Notes to Financial Statements.
The accompanying notes are an integral part of the financial statements.
4
SEI Exchange Traded Funds
SCHEDULE OF INVESTMENTS (Unaudited)
September 30, 2023
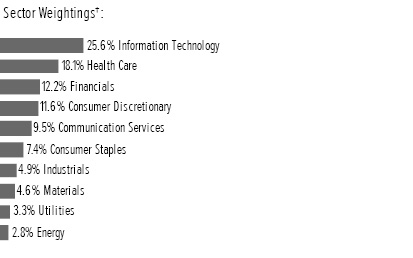
SEI Enhanced U.S. Large Cap Value Factor ETF
†Percentages based on total investments. Total investments do not include derivatives such as options, futures contracts, forward contracts, and swap contracts, if applicable.
Description | Shares | Market Value | ||||||
COMMON STOCK†† — 99.1% | ||||||||
Communication Services — 9.4% | ||||||||
Alphabet, Cl C * | 3,084 | $ | 407 | |||||
AT&T | 40,484 | 608 | ||||||
Comcast, Cl A | 3,041 | 135 | ||||||
Meta Platforms, Cl A * | 2,232 | 670 | ||||||
Omnicom Group | 1,596 | 119 | ||||||
Playtika Holding * | 691 | 7 | ||||||
TripAdvisor * | 3,880 | 64 | ||||||
Verizon Communications | 19,444 | 630 | ||||||
| 2,640 | ||||||||
Consumer Discretionary — 11.5% | ||||||||
Amazon.com * | 520 | 66 | ||||||
eBay | 4,126 | 182 | ||||||
Ford Motor | 14,988 | 186 | ||||||
General Motors | 15,982 | 527 | ||||||
H&R Block | 6,076 | 262 | ||||||
Lennar, Cl A | 4,365 | 490 | ||||||
Lennar, Cl B | 511 | 52 | ||||||
Macy's | 9,307 | 108 | ||||||
Mohawk Industries * | 175 | 15 | ||||||
Penn Entertainment * | 5,328 | 122 | ||||||
PulteGroup | 8,738 | 647 | ||||||
PVH | 2,541 | 195 | ||||||
Thor Industries | 686 | 65 | ||||||
Toll Brothers | 3,851 | 285 | ||||||
| 3,202 | ||||||||
Consumer Staples — 7.3% | ||||||||
Albertsons, Cl A | 5,923 | 135 | ||||||
Altria Group | 14,354 | 604 | ||||||
Ingredion | 679 | 67 | ||||||
Kraft Heinz | 14,091 | 474 | ||||||
Kroger | 14,863 | 665 | ||||||
Description | Shares | Market Value | ||||||
COMMON STOCK†† (continued) | ||||||||
Seaboard | 7 | $ | 26 | |||||
Walgreens Boots Alliance | 2,811 | 62 | ||||||
| 2,033 | ||||||||
Energy — 2.8% | ||||||||
Chesapeake Energy | 2,459 | 212 | ||||||
Chevron | 179 | 30 | ||||||
EQT | 4,474 | 182 | ||||||
Marathon Petroleum | 656 | 99 | ||||||
Occidental Petroleum | 470 | 30 | ||||||
Southwestern Energy * | 5,040 | 33 | ||||||
Valero Energy | 1,313 | 186 | ||||||
| 772 | ||||||||
Financials — 12.1% | ||||||||
Affiliated Managers Group | 1,405 | 183 | ||||||
Ally Financial | 10,621 | 283 | ||||||
American International Group | 9,456 | 573 | ||||||
Brighthouse Financial * | 2,525 | 124 | ||||||
Capital One Financial | 5,883 | 571 | ||||||
Janus Henderson Group | 4,677 | 121 | ||||||
Jefferies Financial Group | 7,203 | 264 | ||||||
MGIC Investment | 10,708 | 179 | ||||||
New York Community Bancorp | 23,825 | 270 | ||||||
Popular | 420 | 26 | ||||||
SLM | 9,067 | 123 | ||||||
Synchrony Financial | 15,339 | 469 | ||||||
Western Union | 14,321 | 189 | ||||||
| 3,375 | ||||||||
Health Care — 17.9% | ||||||||
AbbVie | 859 | 128 | ||||||
Bristol-Myers Squibb | 4,723 | 274 | ||||||
Cardinal Health | 9,383 | 815 | ||||||
Cigna | 819 | 234 | ||||||
CVS Health | 7,706 | 538 | ||||||
DaVita * | 183 | 17 | ||||||
Gilead Sciences | 8,168 | 612 | ||||||
Henry Schein * | 385 | 29 | ||||||
Laboratory Corp of America Holdings | 2,154 | 433 | ||||||
McKesson | 2,103 | 914 | ||||||
Organon | 8,276 | 144 | ||||||
Pfizer | 1,222 | 41 | ||||||
Quest Diagnostics | 3,127 | 381 | ||||||
Tenet Healthcare * | 461 | 30 | ||||||
Viatris, Cl W | 41,263 | 407 | ||||||
| 4,997 | ||||||||
Industrials — 4.8% | ||||||||
Allison Transmission Holdings | 3,780 | 223 | ||||||
American Airlines Group * | 22,178 | 284 | ||||||
Avis Budget Group * | 368 | 66 | ||||||
ManpowerGroup | 402 | 30 | ||||||
Owens Corning | 3,062 | 418 | ||||||
SEI Exchange Traded Funds
5
SCHEDULE OF INVESTMENTS (Unaudited)
September 30, 2023
SEI Enhanced U.S. Large Cap Value Factor ETF (Concluded)
Description | Shares | Market Value | ||||||
COMMON STOCK†† (continued) | ||||||||
Ryder System | 1,487 | $ | 159 | |||||
Schneider National, Cl B | 1,887 | 52 | ||||||
Science Applications International | 1,045 | 110 | ||||||
| 1,342 | ||||||||
Information Technology — 25.4% | ||||||||
Amdocs | 187 | 16 | ||||||
Apple | 6,836 | 1,170 | ||||||
Arrow Electronics * | 2,456 | 308 | ||||||
Avnet | 3,249 | 157 | ||||||
Cognizant Technology Solutions, Cl A | 1,227 | 83 | ||||||
Dell Technologies, Cl C | 2,254 | 155 | ||||||
Dropbox, Cl A * | 8,969 | 244 | ||||||
DXC Technology * | 8,148 | 170 | ||||||
Gen Digital | 2,033 | 36 | ||||||
Hewlett Packard Enterprise | 30,359 | 527 | ||||||
HP | 20,745 | 533 | ||||||
Intel | 8,035 | 286 | ||||||
International Business Machines | 1,980 | 278 | ||||||
Jabil | 5,084 | 645 | ||||||
Micron Technology | 3,956 | 269 | ||||||
Microsoft | 3,201 | 1,011 | ||||||
NCR * | 1,344 | 36 | ||||||
Oracle | 2,196 | 233 | ||||||
Skyworks Solutions | 5,333 | 526 | ||||||
TD SYNNEX | 1,472 | 147 | ||||||
Teradata * | 3,624 | 163 | ||||||
Vontier | 2,927 | 90 | ||||||
| 7,083 | ||||||||
Materials — 4.6% | ||||||||
Berry Global Group | 4,213 | 261 | ||||||
Dow | 1,669 | 86 | ||||||
Huntsman | 6,610 | 161 | ||||||
International Paper | 5,954 | 211 | ||||||
LyondellBasell Industries, Cl A | 4,082 | 387 | ||||||
Steel Dynamics | 1,608 | 172 | ||||||
| 1,278 | ||||||||
Utilities — 3.3% | ||||||||
Consolidated Edison | 3,659 | 313 | ||||||
National Fuel Gas | 3,023 | 157 | ||||||
PG&E * | 6,728 | 109 | ||||||
PPL | 849 | 20 | ||||||
Vistra | 9,589 | 318 | ||||||
| 917 | ||||||||
Total Common Stock | ||||||||
(Cost $26,682) ($ Thousands) | 27,639 | |||||||
Total Investments in Securities — 99.1% | ||||||||
(Cost $26,682) ($ Thousands) | $ | 27,639 | ||||||
| Percentages are based on Net Assets of $27,899 ($ Thousands). |
* | Non-income producing security. |
†† | Narrow industries are utilized for compliance purposes, whereas broad sectors are utilized for reporting. |
As of September 30, 2023, all of the Fund's investments were considered Level 1, in accordance with the authoritative guidance on fair value measurements and disclosure under U.S. GAAP. |
See “Glossary” for abbreviations.
For more information on valuation inputs, see Note 2 – Significant Accounting Policies in Notes to Financial Statements.
The accompanying notes are an integral part of the financial statements.
6
SEI Exchange Traded Funds
SCHEDULE OF INVESTMENTS (Unaudited)
September 30, 2023
SEI Enhanced Low Volatility U.S. Large Cap ETF

†Percentages based on total investments. Total investments do not include derivatives such as options, futures contracts, forward contracts, and swap contracts, if applicable.
Description | Shares | Market Value | ||||||
COMMON STOCK†† — 99.4% | ||||||||
Communication Services — 10.5% | ||||||||
Alphabet, Cl A * | 291 | $ | 38 | |||||
Alphabet, Cl C * | 943 | 124 | ||||||
AT&T | 11,847 | 178 | ||||||
Comcast, Cl A | 4,065 | 180 | ||||||
Fox | 176 | 5 | ||||||
Interpublic Group of Cos | 56 | 2 | ||||||
Omnicom Group | 2,142 | 159 | ||||||
T-Mobile US | 311 | 44 | ||||||
Verizon Communications | 5,267 | 171 | ||||||
| 901 | ||||||||
Consumer Discretionary — 4.7% | ||||||||
Amazon.com * | 152 | 19 | ||||||
AutoZone * | 17 | 43 | ||||||
Genuine Parts | 243 | 35 | ||||||
Grand Canyon Education * | 297 | 35 | ||||||
H&R Block | 1,765 | 76 | ||||||
McDonald's | 458 | 121 | ||||||
Service Corp International | 1,008 | 58 | ||||||
Yum! Brands | 155 | 19 | ||||||
| 406 | ||||||||
Consumer Staples — 10.8% | ||||||||
General Mills | 2,167 | 139 | ||||||
Hershey | 719 | 144 | ||||||
J M Smucker | 1,051 | 129 | ||||||
Kellanova | 392 | 23 | ||||||
Mondelez International, Cl A | 285 | 20 | ||||||
Procter & Gamble | 1,651 | 241 | ||||||
Walmart | 1,410 | 225 | ||||||
| 921 | ||||||||
Energy — 3.5% | ||||||||
Chevron | 1,375 | 232 | ||||||
Description | Shares | Market Value | ||||||
COMMON STOCK†† (continued) | ||||||||
Kinder Morgan | 3,484 | $ | 58 | |||||
Marathon Petroleum | 76 | 11 | ||||||
| 301 | ||||||||
Financials — 7.4% | ||||||||
Allstate | 534 | 60 | ||||||
American Financial Group | 107 | 12 | ||||||
Berkshire Hathaway, Cl B * | 364 | 128 | ||||||
Chubb | 592 | 123 | ||||||
Jack Henry & Associates | 47 | 7 | ||||||
Loews | 298 | 19 | ||||||
Marsh & McLennan | 112 | 21 | ||||||
Travelers | 388 | 63 | ||||||
W R Berkley | 2,429 | 154 | ||||||
White Mountains Insurance Group | 29 | 44 | ||||||
| 631 | ||||||||
Health Care — 18.4% | ||||||||
Bristol-Myers Squibb | 2,341 | 136 | ||||||
Cardinal Health | 1,952 | 170 | ||||||
Chemed | 43 | 22 | ||||||
CVS Health | 954 | 67 | ||||||
Gilead Sciences | 2,405 | 180 | ||||||
Johnson & Johnson | 1,698 | 264 | ||||||
McKesson | 451 | 196 | ||||||
Merck & Co | 2,505 | 258 | ||||||
Pfizer | 5,285 | 175 | ||||||
Quest Diagnostics | 878 | 107 | ||||||
| 1,575 | ||||||||
Industrials — 10.3% | ||||||||
3M | 187 | 17 | ||||||
Expeditors International of Washington | 1,448 | 166 | ||||||
Genpact | 535 | 19 | ||||||
Landstar System | 412 | 73 | ||||||
MSC Industrial Direct, Cl A | 487 | 48 | ||||||
Republic Services, Cl A | 1,326 | 189 | ||||||
Robert Half | 466 | 34 | ||||||
Snap-on | 97 | 25 | ||||||
Verisk Analytics, Cl A | 736 | 174 | ||||||
Waste Management | 893 | 136 | ||||||
| 881 | ||||||||
Information Technology — 25.8% | ||||||||
Accenture, Cl A | 462 | 142 | ||||||
Amdocs | 1,419 | 120 | ||||||
Amphenol, Cl A | 343 | 29 | ||||||
Apple | 2,025 | 347 | ||||||
Arrow Electronics * | 728 | 91 | ||||||
Avnet | 988 | 48 | ||||||
Cisco Systems | 4,359 | 234 | ||||||
Dolby Laboratories, Cl A | 703 | 56 | ||||||
Jabil | 1,443 | 183 | ||||||
Juniper Networks | 2,516 | 70 | ||||||
SEI Exchange Traded Funds
7
SCHEDULE OF INVESTMENTS (Unaudited)
September 30, 2023
SEI Enhanced Low Volatility U.S. Large Cap ETF (Concluded)
Description | Shares | Market Value | ||||||
COMMON STOCK†† (continued) | ||||||||
Manhattan Associates * | 316 | $ | 62 | |||||
Microsoft | 1,046 | 330 | ||||||
Motorola Solutions | 62 | 17 | ||||||
Oracle | 2,560 | 271 | ||||||
Roper Technologies | 424 | 205 | ||||||
Texas Instruments | 41 | 7 | ||||||
| 2,212 | ||||||||
Materials — 1.9% | ||||||||
Reliance Steel & Aluminum | 443 | 116 | ||||||
Silgan Holdings | 979 | 42 | ||||||
| 158 | ||||||||
Utilities — 6.1% | ||||||||
Atmos Energy | 394 | 42 | ||||||
CMS Energy | 88 | 5 | ||||||
Consolidated Edison | 2,083 | 178 | ||||||
DTE Energy | 285 | 28 | ||||||
Duke Energy | 1,762 | 156 | ||||||
Hawaiian Electric Industries | 1,119 | 14 | ||||||
National Fuel Gas | 972 | 50 | ||||||
UGI | 2,169 | 50 | ||||||
| 523 | ||||||||
Total Common Stock | ||||||||
(Cost $8,666) ($ Thousands) | 8,509 | |||||||
Total Investments in Securities — 99.4% | ||||||||
(Cost $8,666) ($ Thousands) | $ | 8,509 | ||||||
| Percentages are based on Net Assets of $8,562 ($ Thousands). |
* | Non-income producing security. |
†† | Narrow industries are utilized for compliance purposes, whereas broad sectors are utilized for reporting. |
As of September 30, 2023, all of the Fund's investments were considered Level 1, in accordance with the authoritative guidance on fair value measurements and disclosure under U.S. GAAP. |
See “Glossary” for abbreviations.
For more information on valuation inputs, see Note 2 – Significant Accounting Policies in Notes to Financial Statements.
The accompanying notes are an integral part of the financial statements.
8
SEI Exchange Traded Funds
Glossary: (abbreviations which may be used in the preceding Schedules of Investments)
Portfolio Abbreviations |
Cl — Class |
The accompanying notes are an integral part of the financial statements.
SEI Exchange Traded Funds
9
STATEMENTS OF ASSETS AND LIABILITIES ($ Thousands)
September 30, 2023 (Unaudited)
SEI Enhanced U.S. Large Cap Quality Factor ETF | SEI Enhanced U.S. Large Cap Momentum Factor ETF | SEI Enhanced U.S. Large Cap Value Factor ETF | SEI Enhanced Low Volatility U.S. Large Cap ETF | |||||||||||||
Assets: | ||||||||||||||||
Investments, at value† | $ | 16,517 | $ | 26,812 | $ | 27,639 | $ | 8,509 | ||||||||
Cash | 45 | 259 | 229 | 44 | ||||||||||||
Dividends receivable | 21 | 19 | 34 | 10 | ||||||||||||
Total Assets | 16,583 | 27,090 | 27,902 | 8,563 | ||||||||||||
Liabilities: | ||||||||||||||||
Investment advisory fees payable | 2 | 3 | 3 | 1 | ||||||||||||
Total Liabilities | 2 | 3 | 3 | 1 | ||||||||||||
Net Assets | $ | 16,581 | $ | 27,087 | $ | 27,899 | $ | 8,562 | ||||||||
† Cost of investments | $ | 15,551 | $ | 25,628 | $ | 26,682 | $ | 8,666 | ||||||||
Net Assets: | ||||||||||||||||
Paid-in capital — (unlimited authorization — no par value) | $ | 15,598 | $ | 27,223 | $ | 27,489 | $ | 8,501 | ||||||||
Total distributable earnings (accumulated losses) | 983 | (136 | ) | 410 | 61 | |||||||||||
Net Assets | $ | 16,581 | $ | 27,087 | $ | 27,899 | $ | 8,562 | ||||||||
Net Asset Value, Offering and Redemption Price Per Share | $ | 27.63 | $ | 25.20 | $ | 25.36 | $ | 24.46 | ||||||||
| ($16,580,867 ÷ 600,000 shares | ) | ($27,086,803 ÷ 1,075,000 shares | ) | ($27,898,932 ÷ 1,100,000 shares | ) | ($8,562,384 ÷ 350,000 shares | ) | |||||||||
The accompanying notes are an integral part of the financial statements.
10
SEI Exchange Traded Funds
STATEMENTS OF OPERATIONS ($ Thousands)
For the six months ended September 30, 2023 (Unaudited)
SEI Enhanced U.S. Large Cap Quality Factor ETF | SEI Enhanced U.S. Large Cap Momentum Factor ETF | SEI Enhanced U.S. Large Cap Value Factor ETF | SEI Enhanced Low Volatility U.S. Large Cap ETF | |||||||||||||
Investment income: | ||||||||||||||||
Dividends | $ | 97 | $ | 128 | $ | 289 | $ | 124 | ||||||||
Total investment income | 97 | 128 | 289 | 124 | ||||||||||||
Expenses: | ||||||||||||||||
Investment advisory fees | 11 | 17 | 18 | 8 | ||||||||||||
Trustee fees | — | — | — | — | ||||||||||||
Total expenses | 11 | 17 | 18 | 8 | ||||||||||||
Net investment income | 86 | 111 | 271 | 116 | ||||||||||||
Net realized gain (loss) on: | ||||||||||||||||
Investments(1) | 220 | (455 | ) | (112 | ) | 377 | ||||||||||
Net realized gain (loss) | 220 | (455 | ) | (112 | ) | 377 | ||||||||||
Net change in unrealized appreciation (depreciation) on: | ||||||||||||||||
Investments | (65 | ) | — | 1,123 | (514 | ) | ||||||||||
Net change in unrealized appreciation (depreciation) | (65 | ) | — | 1,123 | (514 | ) | ||||||||||
Net realized and unrealized gain (loss) | 155 | (455 | ) | 1,011 | (137 | ) | ||||||||||
Net increase (decrease) in net assets resulting from operations | $ | 241 | $ | (344 | ) | $ | 1,282 | $ | (21 | ) | ||||||
(1) Includes realized gains (losses) as a result of in-kind redemptions (see Note 4 in Notes to Financial Statements). Amounts designated as "—" are $0 or have been rounded to $0. |
The accompanying notes are an integral part of the financial statements.
SEI Exchange Traded Funds
11
STATEMENTS OF CHANGES IN NET ASSETS ($ Thousands)
For the six months ended September 30, 2023 (Unaudited) and the period ended March 31, 2023
SEI Enhanced U.S. Large Cap Quality Factor ETF | ||||||||
4/1/2023 to 9/30/2023 | 5/18/2022(1) to 3/31/2023 | |||||||
Operations: | ||||||||
Net investment income | $ | 86 | $ | 114 | ||||
Net realized gain (loss) | 220 | (96 | ) | |||||
Net change in unrealized appreciation (depreciation) | (65 | ) | 1,031 | |||||
Net increase in net assets resulting from operations | 241 | 1,049 | ||||||
Distributions | (82 | ) | (75 | ) | ||||
Capital share transactions: | ||||||||
Proceeds from shares issued | 4,271 | 14,549 | ||||||
Cost of shares redeemed | (1,442 | ) | (1,930 | ) | ||||
Net increase in net assets derived from capital share transactions | 2,829 | 12,619 | ||||||
Net increase in net assets | 2,988 | 13,593 | ||||||
Net assets: | ||||||||
Beginning of period | 13,593 | — | ||||||
End of period | $ | 16,581 | $ | 13,593 | ||||
Share Transactions: | ||||||||
Shares issued | 150 | 575 | ||||||
Shares issued in lieu of dividends and distributions | — | — | ||||||
Shares redeemed | (50 | ) | (75 | ) | ||||
Increase (decrease) in net assets derived from share transactions | 100 | 500 | ||||||
(1) The Fund commenced operations on May 18, 2022. |
Amounts designated as "—" are $0 or have been rounded to $0. |
The accompanying notes are an integral part of the financial statements. |
12
SEI Exchange Traded Funds
STATEMENTS OF CHANGES IN NET ASSETS ($ Thousands)
For the six months ended September 30, 2023 (Unaudited) and the period ended March 31, 2023
SEI Enhanced U.S. Large Cap Momentum Factor ETF | ||||||||
4/1/2023 to 9/30/2023 | 5/18/2022(1) to 3/31/2023 | |||||||
Operations: | ||||||||
Net investment income | $ | 111 | $ | 254 | ||||
Net realized loss | (455 | ) | (430 | ) | ||||
Net change in unrealized appreciation (depreciation) | — | 1,184 | ||||||
Net increase (decrease) in net assets resulting from operations | (344 | ) | 1,008 | |||||
Distributions | (125 | ) | (192 | ) | ||||
Capital share transactions: | ||||||||
Proceeds from shares issued | 7,838 | 25,408 | ||||||
Cost of shares redeemed | (1,329 | ) | (5,177 | ) | ||||
Net increase in net assets derived from capital share transactions | 6,509 | 20,231 | ||||||
Net increase in net assets | 6,040 | 21,047 | ||||||
Net assets: | ||||||||
Beginning of period | 21,047 | — | ||||||
End of period | $ | 27,087 | $ | 21,047 | ||||
Share Transactions: | ||||||||
Shares issued | 300 | 1,025 | ||||||
Shares issued in lieu of dividends and distributions | — | — | ||||||
Shares redeemed | (50 | ) | (200 | ) | ||||
Increase (decrease) in net assets derived from share transactions | 250 | 825 | ||||||
(1) The Fund commenced operations on May 18, 2022. |
Amounts designated as "—" are $0 or have been rounded to $0. |
The accompanying notes are an integral part of the financial statements. |
SEI Exchange Traded Funds
13
STATEMENTS OF CHANGES IN NET ASSETS ($ Thousands) (Concluded)
For the six months ended September 30, 2023 (Unaudited) and the period ended March 31, 2023
SEI Enhanced U.S. Large Cap Value Factor ETF | ||||||||
4/1/2023 to 9/30/2023 | 5/18/2022(1) to 3/31/2023 | |||||||
Operations: | ||||||||
Net investment income | $ | 271 | $ | 411 | ||||
Net realized loss | (112 | ) | (142 | ) | ||||
Net change in unrealized appreciation (depreciation) | 1,123 | (166 | ) | |||||
Net increase in net assets resulting from operations | 1,282 | 103 | ||||||
Distributions | (263 | ) | (281 | ) | ||||
Capital share transactions: | ||||||||
Proceeds from shares issued | 8,293 | 25,113 | ||||||
Cost of shares redeemed | (1,957 | ) | (4,391 | ) | ||||
Net increase in net assets derived from capital share transactions | 6,336 | 20,722 | ||||||
Net increase in net assets | 7,355 | 20,544 | ||||||
Net assets: | ||||||||
Beginning of period | 20,544 | — | ||||||
End of period | $ | 27,899 | $ | 20,544 | ||||
Share Transactions: | ||||||||
Shares issued | 325 | 1,025 | ||||||
Shares issued in lieu of dividends and distributions | — | — | ||||||
Shares redeemed | (75 | ) | (175 | ) | ||||
Increase (decrease) in net assets derived from share transactions | 250 | 850 | ||||||
(1) The Fund commenced operations on May 18, 2022. |
Amounts designated as "—" are $0 or have been rounded to $0. |
The accompanying notes are an integral part of the financial statements. |
14
SEI Exchange Traded Funds
STATEMENTS OF CHANGES IN NET ASSETS ($ Thousands)
For the six months ended September 30, 2023 (Unaudited) and the period ended March 31, 2023
SEI Enhanced Low Volatility U.S. Large Cap ETF | ||||||||
4/1/2023 to 9/30/2023 | 5/18/2022(1) to 3/31/2023 | |||||||
Operations: | ||||||||
Net investment income | $ | 116 | $ | 205 | ||||
Net realized gain (loss) | 377 | (112 | ) | |||||
Net change in unrealized appreciation (depreciation) | (514 | ) | 357 | |||||
Net increase (decrease) in net assets resulting from operations | (21 | ) | 450 | |||||
Distributions | (138 | ) | (139 | ) | ||||
Capital share transactions: | ||||||||
Proceeds from shares issued | 634 | 13,574 | ||||||
Cost of shares redeemed | (3,890 | ) | (1,908 | ) | ||||
Net increase/(decrease) in net assets derived from capital share transactions | (3,256 | ) | 11,666 | |||||
Net increase/(decrease) in net assets | (3,415 | ) | 11,977 | |||||
Net assets: | ||||||||
Beginning of period | 11,977 | — | ||||||
End of period | $ | 8,562 | $ | 11,977 | ||||
Share Transactions: | ||||||||
Shares issued | 25 | 550 | ||||||
Shares issued in lieu of dividends and distributions | — | — | ||||||
Shares redeemed | (150 | ) | (75 | ) | ||||
Increase (decrease) in net assets derived from share transactions | (125 | ) | 475 | |||||
(1) The Fund commenced operations on May 18, 2022. |
Amounts designated as "—" are $0 or have been rounded to $0. |
The accompanying notes are an integral part of the financial statements. |
SEI Exchange Traded Funds
15
FINANCIAL HIGHLIGHTS
For the period ended September 30,2023 (Unaudited) and the period ended March 31, 2023.
For a Share Outstanding Throughout Each Period
Net asset value, beginning of period | Net | Net realized and unrealized gains (losses) on securities | Total from | Distributions from net investment income | Distributions from realized gains | Total dividends | Net asset value, | Total Return† | Net assets, | Ratio of | Ratio of expenses to average net assets (excluding waivers and reimbursements) | Ratio of net investment income to average net assets | Portfolio turnover† | |||||||||||||||||||||||||||||||||||||||||||
SEI Enhanced U.S. Large Cap Quality Factor ETF | ||||||||||||||||||||||||||||||||||||||||||||||||||||||||
2023@ | $ | 27.19 | $ | 0.16 | $ | 0.44 | $ | 0.60 | $ | (0.16 | ) | $ | – | $ | (0.16 | ) | $ | 27.63 | 2.21 | % | $ | 16,581 | 0.15 | % | 0.15 | % | 1.16 | % | 8 | % | ||||||||||||||||||||||||||
2023(2) | 24.91 | 0.30 | 2.19 | 2.49 | (0.21 | ) | – | (0.21 | ) | 27.19 | 10.08 | 13,593 | 0.15 | 0.15 | 1.35 | 40 | ||||||||||||||||||||||||||||||||||||||||
SEI Enhanced U.S. Large Cap Momentum Factor ETF | ||||||||||||||||||||||||||||||||||||||||||||||||||||||||
2023@ | $ | 25.51 | $ | 0.12 | $ | (0.28 | ) | $ | (0.16 | ) | $ | (0.15 | ) | $ | – | $ | (0.15 | ) | $ | 25.20 | (0.65 | )% | $ | 27,087 | 0.15 | % | 0.15 | % | 0.96 | % | 25 | % | ||||||||||||||||||||||||
2023(2) | 25.08 | 0.33 | 0.35 | 0.68 | (0.25 | ) | – | (0.25 | ) | 25.51 | 2.74 | 21,047 | 0.15 | 0.15 | 1.52 | 63 | ||||||||||||||||||||||||||||||||||||||||
SEI Enhanced U.S. Large Cap Value Factor ETF | ||||||||||||||||||||||||||||||||||||||||||||||||||||||||
2023@ | $ | 24.17 | $ | 0.29 | $ | 1.20 | $ | 1.49 | $ | (0.30 | ) | $ | – | $ | (0.30 | ) | $ | 25.36 | 6.19 | % | $ | 27,899 | �� | 0.15 | % | 0.15 | % | 2.29 | % | 20 | % | |||||||||||||||||||||||||
2023(2) | 24.95 | 0.58 | (0.97 | ) | (0.39 | ) | (0.39 | ) | – | (0.39 | ) | 24.17 | (1.52 | ) | 20,544 | 0.15 | 0.15 | 2.74 | 43 | |||||||||||||||||||||||||||||||||||||
SEI Enhanced Low Volatility U.S. Large Cap ETF | ||||||||||||||||||||||||||||||||||||||||||||||||||||||||
2023@ | $ | 25.21 | $ | 0.27 | $ | (0.68 | ) | $ | (0.41 | ) | $ | (0.34 | ) | $ | – | $ | (0.34 | ) | $ | 24.46 | (1.66 | )% | $ | 8,562 | 0.15 | % | 0.15 | % | 2.16 | % | 7 | % | ||||||||||||||||||||||||
2023(2) | 24.79 | 0.48 | 0.25 | 0.73 | (0.31 | ) | – | (0.31 | ) | 25.21 | 3.02 | 11,977 | 0.15 | 0.15 | 2.24 | 24 | ||||||||||||||||||||||||||||||||||||||||
@ | For the six-month period ended September 30, 2023. All ratios for the period have been annualized. |
† | Returns and portfolio turnover rates are for the period indicated and have not been annualized. Returns do not reflect the deduction of taxes that a shareholder would pay on fund distributions or the redemption of fund shares. |
(1) | Per share calculated using average shares. |
(2) | Commenced operations on May 18, 2022. All ratios for the period have been annualized. |
Amounts designated as “—” are either $0 or have been rounded to $0.
The accompanying notes are an integral part of the financial statements.
16
SEI Exchange Traded Funds
NOTES TO FINANCIAL STATEMENTS
September 30, 2023 (Unaudited)
1. ORGANIZATION
SEI Exchange Traded Funds (the “Trust”) was organized as a Delaware statutory trust under a Declaration of Trust dated October 7, 2021.
The Trust is registered under the Investment Company Act of 1940, as amended, as an open-end investment company with four funds: SEI Enhanced U.S. Large Cap Quality Factor ETF, SEI Enhanced U.S. Large Cap Momentum Factor ETF, SEI Enhanced U.S. Large Cap Value Factor ETF and SEI Enhanced Low Volatility U.S. Large Cap ETF (each a “Fund” and together the “Funds”) each of which are diversified Funds. Each Fund’s prospectus provides a description of its investment goal, principal investment strategies and risks. The Funds commenced operations on May 18, 2022. The assets of each Fund are segregated, and an Authorized Participant’s interest is limited to the Fund in which shares are held.
2. SIGNIFICANT ACCOUNTING POLICIES
The following are significant accounting policies, which are consistently followed in the preparation of its financial statements by the Funds. The Funds are investment companies that apply the accounting and reporting guidance issued in Topic 946 by the U.S. Financial Accounting Standards Board (“FASB”).
Use of Estimates — The Funds are investment companies in conformity with accounting principles generally accepted in the United States of America (“U.S. GAAP”). Therefore, the Funds follow the accounting and reporting guidelines for investment companies. The preparation of financial statements, in conformity with U.S. GAAP requires management to make estimates and assumptions that affect the reported amounts of assets and liabilities and disclosure of contingent assets and liabilities as of the date of the financial statements and the reported amounts of increases and decreases in net assets from operations during the reporting period. Actual results could differ from those estimates.
Security Valuation — Effective September 8, 2022, and pursuant to the requirements of the 1940 Act and Rule 2a-5, the administrator, as delegated by the Board of Trustees (the “Board”), has the responsibility for the valuation of Fund investments with readily available market quotations in accordance with the Funds’ Valuation and Pricing Policy. The Trust's Board of Trustees has designated SIMC as the Valuation Designee for the Funds pursuant to Rule 2a-5 (the “Rule”) under the 1940 Act. The Valuation Designee has the responsibility for the fair value determination with respect to all Fund investments that do not have readily available market quotations or quotations that are no longer reliable. SIMC has appointed a Valuation Committee (the “Committee”) and has established a Valuation and Pricing Policy to implement the Rule and the Funds’ Valuation and
Pricing Policy (together the “Policy”). Prior to September 8, 2022, fair-value determinations were performed in accordance with the Trust’s Fair Value Procedures established by the Funds’ Board of Trustees and were implemented through a Fair Value Committee designated by the Board.
When valuing portfolio securities, a Fund values securities listed on a securities exchange, market or automated quotation system for which quotations are readily available (other than securities traded on National Association of Securities Dealers Automated Quotations (NASDAQ) or as otherwise noted below) at the last quoted sale price on an exchange or market (foreign or domestic) on which the securities are traded or, if there is no such reported sale, at the most recent quoted bid price. A Fund values securities traded on NASDAQ at the NASDAQ Official Closing Price. Redeemable securities issued by open-end investment companies are valued at the investment company’s applicable Net Asset Value (“NAV”) per share, with the exception of ETFs, which are priced as equity securities. These open-end investment companies’ shares are offered in separate prospectuses, each of which describes the process by which the applicable investment company’s NAV is determined. The prices of foreign securities are reported in local currency and converted to U.S. dollars using currency exchange rates. If a security’s price cannot be obtained, as noted above, a Fund will value the securities using a bid price from at least one independent broker.
Prices for most securities held by a Fund are provided daily by third-party independent pricing agents. SIMC reasonably believes that prices provided by independent pricing agents are reliable. However, there can be no assurance that such pricing service’s prices will be reliable. SIMC will continuously monitor the reliability of prices obtained from any pricing service and shall promptly notify the Funds’ administrator if it believes that a particular pricing service is no longer a reliable source of prices. The Funds’ administrator, in turn, will notify SIMC, as Valuation Designee, if the Funds’ administrator reasonably believes that a particular pricing service is no longer a reliable source for prices.
The Policy provides that any change in a primary pricing agent or a pricing methodology requires prior approval by the Board. However, when the change would not materially affect the valuation of a Fund’s net assets or involve a material departure in pricing methodology from that of a Fund’s existing pricing agent or pricing methodology, ratification may be obtained at the next regularly scheduled meeting of the Board.
Securities for which market prices are not "readily available" are valued in accordance with Rule 2a-5 and the Policy.
SEI Exchange Traded Funds
17
NOTES TO FINANCIAL STATEMENTS (Continued)
September 30, 2023 (Unaudited)
The Committee must monitor for circumstances that may necessitate that a security be valued using Fair Value Procedures which can include: (i) the security's trading has been halted or suspended, (ii) the security has been de-listed from a national exchange, (iii) the security's primary trading market is temporarily closed at a time when under normal conditions it would be open, (iv) the security has not been traded for an extended period of time, (v) the security's primary pricing source is not able or willing to provide a price, (vi) trading of the security is subject to local government-imposed restrictions; or (vii) a significant event (as defined below). When a security is valued in accordance with the Procedures, the Committee will determine the value after taking into consideration relevant information reasonably available to the Committee. Examples of factors the Committee may consider include: (i) the type of security or asset, (ii) the last trade price, (iii) evaluation of the forces that influence the market in which the security is purchased and sold, (iv) the liquidity of the security, (v) the size of the holding in a Fund or (vi) any other appropriate information.
The Committee is responsible for selecting and applying, in a consistent manner, the appropriate methodologies for determining and calculating the fair value of holdings of the Funds, including specifying the key inputs and assumptions specific to each asset class or holding.
The determination of a security’s fair value price often involves the consideration of a number of subjective factors, and is therefore subject to the unavoidable risk that the value assigned to a security may be higher or lower than the security’s value would be if a reliable market quotation for the security was readily available. As of September 30, 2023, there were no fair valued securities held by the Funds.
In accordance with U.S. GAAP, fair value is defined as the price that a Fund would receive upon selling an investment in an orderly transaction to an independent buyer in the principal or most advantageous market of the investment. A three tier hierarchy has been established to maximize the use of observable and minimize the use of unobservable inputs and to establish classification of fair value measurements for disclosure purposes. Inputs refer broadly to the assumptions that market participants would use in pricing an asset. Inputs may be observable or unobservable. Observable inputs are inputs that reflect the assumptions market participants would use in pricing the asset or liability based on market data obtained from sources independent of the reporting entity. Unobservable inputs are inputs that reflect the reporting entity’s own assumptions about the assumptions market participants would use in pricing the asset or liability based on the best information available in the circumstances.
The three-tier hierarchy of inputs is summarized in the three broad Levels listed below:
Level 1 — quoted prices in active markets for identical investments
Level 2 — other significant observable inputs (including quoted prices for similar investments, interest rates, prepayment speeds, credit risks, etc.)
Level 3 — significant unobservable inputs (including the Fund’s own assumptions in determining the fair value of investments)
Investments are classified within the level of the lowest significant input considered in determining fair value. Investments classified within Level 3 whose fair value measurement considers several inputs may include Level 1 or Level 2 inputs as components of the overall fair value measurement.
The valuation techniques used by the Funds to measure fair value during the six months ended September 30, 2023 maximized the use of observable inputs and minimized the use of unobservable inputs.
For the six months ended September 30, 2023, there have been no significant changes to the inputs or the Trust’s fair valuation methodologies.
Security Transactions and Investment Income — Security transactions are recorded on the trade date. Cost used in determining net realized capital gains and losses on the sale of securities is determined on the basis of specific identification. Dividend income and expense is recognized on the ex-dividend date, and interest income or expense is recognized using the accrual basis of accounting.
Distributions received on securities that represent a return of capital or capital gain are recorded as a reduction of cost of investments and/ or as a realized gain. The Trust estimates the components of distributions received that may be considered nontaxable distributions or capital gain distributions.
Amortization and accretion is calculated using the scientific interest method, which is not materially different from the effective interest method. Amortization of premiums and discounts is included in interest income.
Cash and Cash Equivalents — Idle cash and currency balances may be swept into various overnight sweep accounts and are classified as cash and cash equivalents on the Statement of Assets and Liabilities. These amounts, at times, may exceed United States federally insured limits. Amounts swept are available on the next business day.
Expenses — Expenses that are directly related to one of the Funds are charged directly to that Fund. Other operating
18
SEI Exchange Traded Funds
expenses of the Trust are prorated to the Funds on the basis of relative daily net assets.
Foreign Currency Translation — The books and records of the Funds investing in international securities are maintained in U.S. dollars on the following basis:
(i) market value of investment securities, assets and liabilities at the current rate of exchange; and
(ii) purchases and sales of investment securities, income and expenses at the relevant rates of exchange prevailing on the respective dates of such transactions.
The Funds do not isolate that portion of gains and losses on investments in investment securities that is due to changes in the foreign exchange rates from that which is due to changes in market prices of investment securities.
The Funds report certain foreign-currency-related transactions as components of realized gains for financial reporting purposes, whereas such components are treated as ordinary income for Federal income tax purposes.
Dividends and Distributions to Shareholders — The Funds will distribute substantially all of their net investment income and all net realized capital gains, if any, at least annually. All dividends and distributions are recorded on ex-dividend date.
Investments in Real Estate Investment Trusts (“REITs”) — Dividend income is recorded based on the income included in distributions received from the REIT investments using published REIT reclassifications including management estimates when actual amounts are not available. Distributions received in excess of this estimated amount are recorded as a reduction of the cost of investments or reclassified to capital gains. The actual amounts of income, return of capital, and capital gains are only determined by each REIT after its fiscal year-end, and may differ from the estimated amounts.
Creation Units — The Funds issue and redeem their shares (“Shares”) on a continuous basis at NAV and only in large blocks of Shares referred to as “Creation Units”. Purchasers of Creation Units (“Authorized Participants”) at NAV must pay a standard creation transaction fee per transaction. The fee is a single charge and will be the same regardless of the number of Creation Units purchased by an Authorized Participant on the same day.
3. INVESTMENT ADVISORY, ADMINISTRATION AND DISTRIBUTION AGREEMENTS, AND OTHER TRANSACTIONS WITH AFFILIATES
Investment Advisory, Administration and Distribution Agreements — SIMC serves as investment adviser (the “Adviser”) to each Fund. In connection with serving as Adviser, SIMC is entitled to a fee, which is calculated daily and paid monthly, based on the average daily net assets of
each fund. Pursuant to the Investment Advisory Agreement entered into with the Trust, SIMC has agreed to pay all Fund expenses, except for the fees paid to SIMC for advisory services, interest expenses, dividend and other expenses on securities sold short, taxes, expenses incurred with respect to the acquisition and disposition of portfolio securities and the execution of portfolio transactions (including brokerage commissions), acquired fund fees and expenses, distribution fees or expenses paid by the Trust under any distribution plan adopted pursuant to Rule 12b-1 under the 1940 Act (if any), fees and expenses of the Board of Trustees, litigation expenses and any extraordinary expenses.
SEI Investments Global Funds Services (the “Administrator”) is the administrator for the Funds.
SEI Exchange Traded Funds
19
NOTES TO FINANCIAL STATEMENTS (Continued)
September 30, 2023 (Unaudited)
| SEI Investments Distribution Co. (the “Distributor”) is the distributor of creation units. The Funds have adopted a Distribution and Servicing Plan (the Plan). The Plan permits each Fund to pay the Distributor, or its designee, a fee for the sale and distribution and/or shareholder servicing of the shares at an annual rate of | up to 0.25% of average daily net assets of the shares of the Fund ("12b-1 fee"). However, payment of a 12b-1 fee has not been authorized at this time. |
The following table reflects each Fund’s contractual Advisory Fee (expressed as an annual rate). The rates shown are fixed rates based on each Fund’s daily net assets
Advisory Fee | |
SEI Enhanced U.S. Large Cap Quality Factor ETF | 0.150% |
SEI Enhanced U.S. Large Cap Momentum Factor ETF | 0.150% |
SEI Enhanced U.S. Large Cap Value Factor ETF | 0.150% |
SEI Enhanced Low Volatility U.S. Large Cap ETF | 0.150% |
Brokerage Commissions Paid to Affiliates — The Distributor may receive compensation on fund transactions effected for the Trust in accordance with the rules of the Securities and Exchange Commission (“SEC”). Accordingly, it is expected that fund transactions may result in brokerage commissions being paid to the Distributor. The SEC rules require that such commissions not exceed usual and customary commissions.
There were no such commissions for the six months ended September 30, 2023.
Payment to Affiliates — Certain Officers and Trustees of the Trust are also Officers and/or Directors of the Administrator, Adviser and/or the Distributor.
The Trust pays each unaffiliated Trustee an annual fee for attendance at quarterly, interim, and committee meetings. The Administrator or the Distributor pays compensation of Officers and affiliated Trustees.
A portion of the services provided by the Chief Compliance Officer (“CCO”) and his staff, whom are employees of the Administrator, are paid for by the Trust as incurred. The services include regulatory oversight of the Trust’s Adviser, sub-advisers and service providers.
4. INVESTMENT TRANSACTIONS
The cost of security purchases and the proceeds from the sale of securities, excluding in-kind transactions and short-term securities during the six months ended September 30, 2023, were as follows:
SEI Enhanced U.S. Large Cap Quality Factor ETF | SEI Enhanced U.S. Large Cap Momentum Factor ETF | SEI Enhanced U.S. Large Cap Value Factor ETF | SEI Enhanced Low Volatility U.S. Large Cap ETF | |||||||||||||
Purchases | ||||||||||||||||
U.S. Government | $ | — | $ | — | $ | — | $ | — | ||||||||
Other | 1,254 | 5,797 | 4,631 | 741 | ||||||||||||
Sales | ||||||||||||||||
U.S. Government | — | — | — | — | ||||||||||||
Other | 1,240 | 5,871 | 4,731 | 727 |
For the six months ended September 30, 2023, in-kind transactions associated with creations and redemptions were as follows:
Realized | ||||||||||||
| Purchases | Sales | Gain | ||||||||||
($ Thousands) | ($ Thousands) | ($ Thousands) | ||||||||||
SEI Enhanced U.S. Large Cap Quality Factor ETF | $ | 4,266 | $ | 1,430 | $ | 277 | ||||||
SEI Enhanced U.S. Large Cap Momentum Factor ETF | 7,784 | 1,312 | 181 | |||||||||
SEI Enhanced U.S. Large Cap Value Factor ETF | 8,238 | 1,878 | 406 | |||||||||
SEI Enhanced Low Volatility U.S. Large Cap ETF | 635 | 3,879 | 433 | |||||||||
5. FEDERAL TAX INFORMATION:
It is each Fund's intention to qualify as a regulated investment company under Subchapter M of the Internal Revenue Code and distribute all of its taxable income
(including net capital gains). Accordingly, no provision for Federal income taxes is required.
The Funds may be subject to taxes imposed by countries in which they invest with respect to their
20
SEI Exchange Traded Funds
investments in issuers existing or operating in such countries. Such taxes are generally based on income earned. The Funds accrue such taxes when the related income is earned.
Dividends from net investment income and distributions from net realized capital gains are determined in accordance with U.S. Federal income tax regulations,
which may differ from those amounts determined under U.S. GAAP. These book/tax differences are either temporary or permanent in nature. To the extent these differences are permanent, they are charged or credited to paid-in capital and distributable earnings, as appropriate, in the period that the differences arise.
The tax character of dividends and distributions paid during the fiscal years or periods ended March 31, 2023 were as follows:
Ordinary | Long-Term | Total | ||||||||||
SEI Enhanced U.S. Large Cap Quality Factor ETF | ||||||||||||
2023 | $ | 75 | $ | — | $ | 75 | ||||||
SEI Enhanced U.S. Large Cap Momentum Factor ETF | ||||||||||||
2023 | 192 | — | 192 | |||||||||
SEI Enhanced U.S. Large Cap Value Factor ETF | ||||||||||||
2023 | 281 | — | 281 | |||||||||
SEI Enhanced Low Volatility U.S. Large Cap ETF | ||||||||||||
2023 | 139 | — | 139 | |||||||||
As of March 31, 2023, the components of Distributable Earnings/(Accumulated Losses) were as follows:
Undistributed | Undistributed | Capital | Post | Late Year | Unrealized | Other | Total | |||||||||||||||||||||||||
SEI Enhanced U.S. Large Cap Quality Factor ETF | $ | 40 | $ | — | $ | (185 | ) | $ | — | $ | — | $ | 970 | $ | (1 | ) | $ | 824 | ||||||||||||||
SEI Enhanced U.S. Large Cap Momentum Factor ETF | 63 | — | (858 | ) | — | — | 1,127 | 1 | 333 | |||||||||||||||||||||||
SEI Enhanced U.S. Large Cap Value Factor ETF | 130 | — | (296 | ) | — | — | (443 | ) | — | (609 | ) | |||||||||||||||||||||
SEI Enhanced Low Volatility U.S. Large Cap ETF | 67 | — | (167 | ) | — | — | 321 | (1 | ) | 220 | ||||||||||||||||||||||
For Federal income tax purposes, capital loss carryforwards may be carried forward and applied against future capital gains. Losses carried forward are as follows:
Short-Term | Long-Term | Total | ||||||||||
SEI Enhanced U.S. Large Cap Quality Factor ETF | $ | 185 | $ | — | $ | 185 | ||||||
SEI Enhanced U.S. Large Cap Momentum Factor ETF | 858 | — | 858 | |||||||||
SEI Enhanced U.S. Large Cap Value Factor ETF | 296 | — | 296 | |||||||||
SEI Enhanced Low Volatility U.S. Large Cap ETF | 167 | — | 167 | |||||||||
For Federal income tax purposes, the cost of securities owned at March 31, 2023, and the net realized gains or losses on securities sold for the period were not materially different from amounts reported for financial reporting purposes.
SEI Exchange Traded Funds
21
NOTES TO FINANCIAL STATEMENTS (Continued)
September 30, 2023 (Unaudited)
These differences are primarily due to wash sales which cannot be used for Federal income tax purposes in the current year and have been deferred for use in future years. The aggregate gross unrealized appreciation and depreciation on total investments held by the Funds at September 30, 2023, was as follows:
Federal | Appreciated | Depreciated | Net | |||||||||||||
SEI Enhanced U.S. Large Cap Quality Factor ETF | $ | 15,551 | $ | 1,507 | $ | (541 | ) | $ | 966 | |||||||
SEI Enhanced U.S. Large Cap Momentum Factor ETF | 25,628 | 2,261 | (1,077 | ) | 1,184 | |||||||||||
SEI Enhanced U.S. Large Cap Value Factor ETF | 26,682 | 2,412 | (1,455 | ) | 957 | |||||||||||
SEI Enhanced Low Volatility U.S. Large Cap ETF | 8,666 | 617 | (774 | ) | (157 | ) | ||||||||||
6. CONCENTRATION/RISKS
In the normal course of business, the Trust enters into contracts that provide general indemnifications by the Trust to the counterparty to the contract. The Trust’s maximum exposure under these arrangements is dependent on future claims that may be made against the Trust and, therefore, cannot be estimated; however, management believes that, based on experience, the risk of loss from such claims is considered remote.
To the extent consistent with its Investment Strategy, a Fund may have one of more of the following principal risks:
Equity Securities Risk — Equity securities are subject to changes in value, and their values may be more volatile than those of other asset classes.
Quality Securities Risk— There is no guarantee that the past performance of stocks that SIMC determines are quality will continue. Companies that issue these stocks may experience lower than expected returns or may experience negative growth, as well as increased leverage, resulting in lower than expected or negative returns to Fund shareholders. Many factors can affect a stock’s quality and performance, and the impact of these factors on a stock or its price can be difficult to predict.
Momentum Securities Risk— Stocks that previously exhibited high momentum characteristics may not experience positive momentum or may experience more volatility than the market as a whole.
Value Securities Risk— Securities issued by companies that may be perceived as undervalued may fail to appreciate for long periods of time and may never realize their full potential value. SIMC may be unsuccessful in identifying undervalued securities. Value securities have generally performed better than non-value securities during periods of economic recovery (although there is no assurance that they will continue to do so). Value securities may go in and out of favor over time.
Volatility Risk— Although SIMC seeks to construct a portfolio with lower volatility than the broad U.S. large cap equity market, there is no guarantee that SIMC will be successful. As a result, the Fund may not be any less volatile than the market as a whole, and could be more volatile.
Quantitative Investing Risk— Due to the significant role technology plays in quantitative strategies, they carry the risk of unintended or unrecognized issues or flaws in the design, coding, implementation or maintenance of the computer programs or technology used in the development and implementation of the quantitative strategy. Utility interruptions or other key systems outages
also can impair the performance of quantitative investment strategies.
Large-Capitalization Companies Risk— Large-capitalization companies may be less able than smaller capitalization companies to adapt to changing market conditions, may be more mature and may be subject to more limited growth potential compared with smaller capitalization companies.
Market Risk— The market value of a security may move up and down, sometimes rapidly and unpredictably. Market risk may affect a single issuer, an industry, a sector or the equity or bond market as a whole. The Funds’ market price may deviate from the value of the Funds’ underlying portfolio holdings, particularly in times of market stress, with the result that investors may pay significantly more or receive significantly less than the underlying value of the Fund shares bought or sold. This can be reflected as a spread between the bid and ask prices for a Fund quoted during the day or a premium or discount in the closing price from the Funds’ NAV.
Risk of Investing in the U.S.— Certain changes in the U.S. economy, such as when the U.S. economy weakens or when its financial markets decline, may have an adverse effect on the securities to which the Funds have exposure.
Issuer Risk— The performance of the Funds depends on the performance of individual securities to which the Funds have exposure. Changes in the financial condition or credit rating of an issuer of those securities may cause the value of the Funds to decline.
Market Trading Risk— The Funds face numerous market trading risks, including the potential lack of an active market for Fund shares, losses from trading
22
SEI Exchange Traded Funds
in secondary markets, periods of high volatility and disruptions in the creation/redemption process. Active trading markets for the Funds’ shares may not be developed or maintained by market makers or Authorized Participants (as defined below). Authorized Participants are not obligated to make a market in the Funds’ shares or to submit purchase or redemption orders for Creation Units (as defined below). In times of market stress, market makers or Authorized Participants may step away from their respective roles, which could lead to variances between the market price of the Funds’ shares and its underlying NAV. Trading in shares on an exchange may be halted in certain circumstances. If a trading halt occurs, a shareholder may temporarily be unable to purchase or sell shares of the Funds. Any of these factors could lead the Funds’ shares to trade at a premium or discount to NAV. Thus, you may pay more (or less) than NAV when you buy shares of the Funds in the secondary market, and you may receive less (or more) than NAV when you sell those shares in the secondary market, particularly during times of market stress. SIMC cannot predict whether shares will trade above (premium), below (discount) or at NAV or whether the spread between bid and ask prices will widen. In addition, there can be no assurance that the requirements of the listing exchange necessary to maintain the listing of the Funds will continue to be met.
Convertible and Preferred Securities Risk— Convertible and preferred securities have many of the same characteristics as stocks, including many of the same risks. In addition, convertible bonds may be more sensitive to changes in interest rates than stocks. Convertible bonds may also have credit ratings below investment grade, meaning that they carry a higher risk of failure by the issuer to pay principal and/or interest when due.
Depositary Receipts Risk— Depositary receipts, such as American Depositary Receipts, are certificates evidencing ownership of shares of a foreign issuer that are issued by depositary banks and generally trade on an established market. Depositary receipts are subject to many of the risks associated with investing directly in foreign securities, including, among other things, political, social and economic developments abroad, currency movements and different legal, regulatory, tax, accounting and audit environment.
Warrants and Rights Risk— Warrants and rights may lack a liquid secondary market for resale. The prices of warrants and rights may fluctuate as a result of speculation or other factors. Warrants and rights can provide a greater potential for profit or loss than an equivalent investment in the underlying security. Prices of warrants and rights do not necessarily move in tandem with the prices of their underlying securities and are highly volatile and speculative investments. If a warrant or right expires without being exercised, the Funds will lose any amount paid for the warrant or right.
Liquidity Risk— In stressed market conditions, the market for a Funds’ shares may become less liquid in response to deteriorating liquidity in the markets for the Funds’ underlying portfolio holdings. This adverse effect on liquidity for the Funds’ shares in turn could lead to differences between the market price of the Funds’ shares and its underlying NAV and/or widening the spread between bid and ask prices.
Management Risk— SIMC may not successfully implement the Funds’ investment strategies and, as a result, the Funds may not meet their investment objective and/or underperform other investment vehicles with similar investment objectives and strategies.
Operational Risk— The Funds are exposed to operational risks arising from a number of factors, including, but not limited to, human error, processing and communication errors, errors of the Funds’ service providers, counterparties
or other third-parties, failed or inadequate processes and technology or systems failures.
New Fund Risk— The Funds are new funds, with a limited operating history, which may result in additional risks for investors in the Funds. There can be no assurance that the Funds will grow to an economically viable size, in which case the Funds may cease operations. In such an event, investors may be required to liquidate or transfer their investments at an inopportune time.
Authorized Participant Concentration Risk— Only broker-dealers (referred to as “Authorized Participants” or “APs”) that have executed authorized participation agreements with respect to the Trust may engage in creation or redemption transactions directly with the Funds, and no AP is obligated to engage in creation and/or redemption transactions. To the extent that APs exit the business or are unable to proceed with orders, Fund shares may be more likely to trade at a premium or discount to NAV, have wider spreads between bid and ask prices or face trading halts or delisting.
Cybersecurity Risk— Failures or breaches of the electronic systems of the Funds, SIMC, the Fund’s distributor, and other service providers, market makers, APs or the issuers of securities in which the Funds invest have the ability to cause disruptions, negatively impact the Funds’ business operations and/or potentially result in financial losses to the Funds and their shareholders.
7. SUBSEQUENT EVENTS
Management has evaluated the need for disclosures and/or adjustments resulting from subsequent events
SEI Exchange Traded Funds
23
NOTES TO FINANCIAL STATEMENTS (CONCLUDED)
September 30, 2023 (Unaudited)
through the date the financial statements were issued. Based on this evaluation, no disclosure and/or adjustments were required to the financial statements as of September 30, 2023.
24
SEI Exchange Traded Funds
DISCLOSURE OF FUND EXPENSES (Unaudited)
September 30, 2023
All exchange traded funds (“ETFs”) have operating expenses. As a shareholder of an ETF, your investment is affected by these ongoing costs, which include (among others) costs for, ETF management, portfolio management, administrative services, and shareholder reports like this one. It is important for you to understand the impact of these costs on your investment returns. In addition, a shareholder is responsible for brokerage fees as a result of their investment in an ETF.
Operating expenses such as these are deducted from the ETF’s gross income and directly reduce your final investment return. These expenses are expressed as a percentage of the ETF’s average net assets; this percentage is known as the ETF’s expense ratio.
The following examples use the expense ratio and are intended to help you understand the ongoing costs (in dollars) of investing in your ETF and to compare these costs with those of other mutual funds. The examples are based on an investment of $1,000 made at the beginning of the period shown and held for the entire period April 1, 2023 to September 30, 2023.
The table on this page illustrates your ETF’s costs in two ways:
● Actual ETF return. This section helps you to estimate the actual expenses after fee waivers that your ETF incurred over the period. The “Expenses Paid During Period” column shows the actual dollar expense cost incurred by a $1,000 investment in the ETF, and the “Ending Account Value” number is derived from deducting that expense cost from the ETF’s gross investment return.
You can use this information, together with the actual amount you invested in the ETF, to estimate the expenses you paid over that period. Simply divide your actual account value by $1,000 to arrive at a ratio (for example, an $8,600 account value divided by $1,000 = 8.6), then multiply that ratio by the number shown for your ETF under “Expenses Paid During Period”.
● Hypothetical 5% return. This section helps you compare your ETF’s costs with those of other mutual funds. It assumes that the ETF had an annual 5% return before expenses during the period, but that the expense ratio (Column 3) for the period is unchanged. This example is useful in making comparisons because the Securities and Exchange Commission requires all mutual funds to make this 5% calculation. You can assess your ETF’s comparative cost by comparing the hypothetical result for your ETF in the “Expense Paid During Period” column with those that appear in the same charts in the shareholder reports for other funds.
NOTE: Because the return is set at 5% for comparison purposes — NOT your ETF’s actual return — the account values shown may not apply to your specific investment.
Beginning | Ending | Annualized | Expenses | |||||||||||||
SEI Enhanced U.S. Large Cap Quality Factor ETF | ||||||||||||||||
Actual Fund Return | ||||||||||||||||
| $ | 1,000.00 | $ | 1,022.10 | 0.15 | % | $ | 0.76 | |||||||||
Hypothetical 5% Return | ||||||||||||||||
| $ | 1,000.00 | $ | 1,024.25 | 0.15 | % | $ | 0.76 | |||||||||
SEI Enhanced U.S. Large Cap Momentum Factor ETF | ||||||||||||||||
Actual Fund Return | ||||||||||||||||
| $ | 1,000.00 | $ | 993.50 | 0.15 | % | $ | 0.75 | |||||||||
Hypothetical 5% Return | ||||||||||||||||
| $ | 1,000.00 | $ | 1,024.25 | 0.15 | % | $ | 0.76 | |||||||||
Beginning | Ending | Annualized | Expenses | |||||||||||||
SEI Enhanced U.S. Large Cap Value Factor ETF | ||||||||||||||||
Actual Fund Return | ||||||||||||||||
| $ | 1,000.00 | $ | 1,061.90 | 0.15 | % | $ | 0.78 | |||||||||
Hypothetical 5% Return | ||||||||||||||||
| $ | 1,000.00 | $ | 1,024.25 | 0.15 | % | $ | 0.76 | |||||||||
SEI Enhanced Low Volatility U.S. Large Cap ETF | ||||||||||||||||
Actual Fund Return | ||||||||||||||||
| $ | 1,000.00 | $ | 983.40 | 0.15 | % | $ | 0.75 | |||||||||
Hypothetical 5% Return | ||||||||||||||||
| $ | 1,000.00 | $ | 1,024.25 | 0.15 | % | $ | 0.76 | |||||||||
* Expenses are equal to the Fund’s annualized expense ratio multiplied by the average account value over the period, multiplied by 183/366 (to reflect a full one-half year period).
SEI Exchange Traded Funds
25
(This page intentionally left blank)
(This page intentionally left blank)
(This page intentionally left blank)
SEI Exchange Traded Funds / Semi-Annual Report / September 30, 2023
Trustees
Robert A. Nesher, Chairman
William M. Doran
Nina Lesavoy
James M. Williams
Hubert L. Harris, Jr.
Susan C. Cote
James B. Taylor
Christine Reynolds
Thomas Melendez
Officers
Robert A. Nesher
President and Chief Executive Officer
Glenn R. Kurdziel
Controller and Chief Financial Officer
Stephen Panner
Chief Compliance Officer
Timothy D. Barto
Vice President, Secretary
David F. McCann
Vice President, Assistant Secretary
Katherine Mason
Vice President, Assistant Secretary
Stephen G. MacRae
Vice President
Donald Duncan
Anti-Money Laundering Compliance Officer
Privacy Officer
Investment Adviser
SEI Investments Management Corporation
Administrator
SEI Investments Global Funds Services
Distributor
SEI Investments Distribution Co.
Legal Counsel
Morgan, Lewis & Bockius LLP
Independent Registered Public Accounting Firm
KPMG LLP
This report and the financial statements contained herein are submitted for the general information of the shareholders of the Trust and must be preceded or accompanied by a current prospectus. Shares of the Funds are not deposits or obligations of, or guaranteed or endorsed by, any bank. The shares are not federally insured by the Federal Deposit Insurance Corporation (FDIC), the Federal Reserve Board, or any other government agency. Investment in the shares involves risk, including the possible loss of principal.
For more information call
1 800 DIAL SEI
(1 800 342 5734)

SEI-ETF (9/23)
Item 2. Code of Ethics.
Not applicable for semi-annual report.
Item 3. Audit Committee Financial Expert.
Not applicable for semi-annual report.
Item 4. Principal Accountant Fees and Services.
Not applicable for semi-annual report.
Item 5. Audit Committee of Listed Registrants.
Not applicable for semi-annual report.
Item 6. Investments
The Schedule of Investments is included as part of the Report to Shareholders filed under Item 1 of this form.
Item 7. Disclosure of Proxy Voting Policies and Procedures for Closed-End Management Investment Companies.
Not applicable.
Item 8. Portfolio Managers of Closed-End Management Investment Companies
Not applicable.
Item 9. Purchases of Equity Securities by Closed-End Management Investment Company and Affiliated Purchasers.
Not applicable.
Item 10. Submission of Matters to a Vote of Security Holders.
There have been no material changes to the procedures by which shareholders may recommend nominees to the Registrant’s Board of Trustees (the “Board”). The Registrant has a standing Governance Committee (the “Committee”) currently consisting of the independent trustees. The Committee is responsible for evaluating and recommending nominees for election to the Board. Pursuant to the Committee’s Charter, adopted on June 18th 2004, as amended, the Committee will review all shareholder recommendations for nominations to fill vacancies on the Board if such recommendations are submitted in writing and addressed to the Committee at the Registrant’s office.
Item 11. Controls and Procedures.
(a) The Registrant’s principal executive and principal financial officers, or persons performing similar functions, have concluded that the Registrant’s disclosure controls and procedures (as defined in Rule 30a-3(c) under the Investment Company Act of 1940 (the “1940 Act”)) are effective, based on the evaluation of these controls and procedures required by Rule 30a-3(b) under the 1940 Act and Rules 13a-15(b) or 15d-15(b) under the Securities Exchange Act of 1934 as of a date within 90 days of the filing date of this report.
(b) There were no changes in the Registrant’s internal control over financial reporting (as defined in Rule 30a-3(d) under the 1940 Act) that occurred during the period covered by this report that have materially affected, or are reasonably likely to materially affect, the Registrant’s internal control over financial reporting.
Item 12. Disclosure of Securities Lending Activities for Closed-End Management Investment Companies.
Not applicable.
Item 13. Exhibits.
(a)(1) Not applicable for semi-annual report.
SIGNATURES
Pursuant to the requirements of the Securities Exchange Act of 1934 and the Investment Company Act of 1940, the Registrant has duly caused this report to be signed on its behalf by the undersigned, thereunto duly authorized.
SEI Exchange Traded Funds
| By: | /s/ Robert A. Nesher | |
| Robert A. Nesher, President and CEO | ||
| Date: | December 6, 2023 |
Pursuant to the requirements of the Securities Exchange Act of 1934 and the Investment Company Act of 1940, this report has been signed below by the following persons on behalf of the Registrant and in the capacities and on the dates indicated.
| By: | /s/ Robert A. Nesher | |
| Robert A. Nesher, President and CEO | ||
| Date: | December 6, 2023 |
| By: | /s/ Glenn Kurdziel | |
| Glenn Kurdziel, Controller and CFO | ||
| Date: | December 6, 2023 |