UNITED STATES
SECURITIES AND EXCHANGE COMMISSION
Washington, D.C. 20549
FORM N-CSR
CERTIFIED SHAREHOLDER REPORT OF REGISTERED MANAGEMENT
INVESTMENT COMPANIES
Investment Company Act File Number 811-23754
SEI EXCHANGE TRADED FUNDS
(Exact name of registrant as specified in charter)
SEI Investments
One Freedom Valley Drive
Oaks, PA 19456
(Address of principal executive offices)
Timothy D. Barto, Esq.
SEI Investments
One Freedom Valley Drive
Oaks, PA 19456
(Name and address of agent for service)
Registrant’s telephone number, including area code: 610-676-1000
Date of fiscal year end: March 31, 2024
Date of reporting period: March 31, 2024
Item 1. Reports to Stockholders.

March 31, 2024
ANNUAL REPORT
SEI Exchange Traded Funds
> | SEI Enhanced U.S. Large Cap Quality Factor ETF |
> | SEI Enhanced U.S. Large Cap Momentum Factor ETF |
> | SEI Enhanced U.S. Large Cap Value Factor ETF |
> | SEI Enhanced Low Volatility U.S. Large Cap ETF |
Paper copies of the Funds’ shareholder reports are no longer sent by mail, unless you specifically request them from the Funds or from your financial intermediary, such as a broker-dealer or bank. Shareholder reports are available online and you will be notified by mail each time a report is posted on the Funds’ website and provided with a link to access the report online.
You may elect to receive all future reports in paper free of charge. If you invest through a financial intermediary, you can contact your financial intermediary to inform it that you wish to continue receiving paper copies of your shareholder reports. If you invest directly with the Funds, you can inform the Funds that you wish to continue receiving paper copies of your shareholder reports by calling 1-800-DIAL-SEI. Your election to receive reports in paper will apply to all funds held with the SEI Funds or your financial intermediary.
seic.com
TABLE OF CONTENTS
| Letter to Shareholders | 1 |
| Management’s Discussion and Analysis of Fund Performance | 5 |
| Schedules of Investments | 13 |
| Statements of Assets and Liabilities | 22 |
| Statements of Operations | 23 |
| Statements of Changes in Net Assets | 24 |
| Financial Highlights | 28 |
| Notes to Financial Statements | 29 |
| Report of Independent Registered Public Accounting Firm | 37 |
| Trustees and Officers of the Trust | 39 |
| Disclosure of Fund Expenses | 42 |
| Liquidity Risk Management Program | 43 |
| Board of Trustees Considerations in Approving the Advisory Agreement | 44 |
| Notice to Shareholders | 46 |
Shares are bought and sold at market price (not net asset value) and are not individually redeemed from a Fund. Shares may only be redeemed directly from a Fund by Authorized Participants, in very large creation/redemption units. Brokerage commissions will reduce returns.
The Trust files its complete schedule of portfolio holdings with the Securities and Exchange Commission for the first and third quarters of each fiscal year as an exhibit to its reports on Form N-PORT. The Trust’s Form N-PORT reports are available on the Commission’s website at http://www.sec.gov.
A description of the policies and procedures that the Trust uses to determine how to vote proxies relating to portfolio securities, as well as information relating to how a Fund voted proxies relating to portfolio securities during the most recent 12-month period ended June 30, is available (i) without charge, upon request, by calling 1-800-DIAL-SEI; and (ii) on the Commission’s website at http://www.sec.gov.
LETTER TO SHAREHOLDERS
March 31, 2024 (Unaudited)
To Our Shareholders:
During the one-year reporting period ending March 31, 2024, global financial markets gyrated in response to concerns about central bank monetary policy, the strength of the global economy, and growing geopolitical tensions. Late in the period, global markets rallied in response to generally positive corporate results and investors’ hopes that the Federal Reserve (Fed) and other global monetary policy-makers would pivot to cutting interest rates as inflation subsided.
The Fed slowed the pace of its interest rate-hiking cycle over the first several months of the reporting period as inflation cooled. The central bank raised the federal funds rate in two 25-basis point (0.25%) increments following its meetings in May and July 2023, to a range of 5.25% to 5.50%. However, the Fed left its benchmark rate unchanged for the remainder of the period, ending a rate-hiking cycle that had begun in March 2022. In a statement announcing its rate decision following its meeting in March 2024, the Federal Open Market Committee (FOMC) noted, “Inflation has eased over the past year but remains elevated. The Committee does not expect it will be appropriate to reduce the target range until it has gained greater confidence that inflation is moving sustainably toward 2 percent.” The Fed’s so-called dot plot of economic projections, issued in March 2024, indicated a median federal-funds rate of 4.6% at the end of the year, unchanged from its previous estimate issued in December 2023, signaling that the central bank still may reduce the federal-funds rate by roughly 75 basis points—most likely in three increments of 25 basis points—by the end of this year. The dot plot also projected that core personal-consumption-expenditures (PCE) inflation could rise from its most recent annual increase of 2.4% in January to 2.6% by the end of 2024. The PCE price index is the Fed’s preferred gauge of inflation, as it tracks the change in prices paid by or on behalf of consumers for a more comprehensive set of goods and services than that of the consumer-price index (CPI).
Geopolitical Events
The geopolitical news during the reporting period was dominated by the ongoing Russia-Ukraine war, and later, escalating tensions in the Middle East. Russia’s invasion of Ukraine marked its second anniversary on February 24, 2024, with little hope for a resolution in the near term. Republican Party leaders in the U.S. House of Representatives rejected a bipartisan bill approved in the Senate that would have provided $95 billion in military aid for Ukraine, Israel, and Taiwan. In mid-March, the administration of President Joe Biden announced a plan to send $300 million more in ammunition and other weapons to Ukraine while the U.S. Congress debated a new aid package.
Long-simmering tensions in the Middle East escalated to war following a surprise attack on Israel by Hamas in early October 2023. Hamas, a militant Palestinian nationalist group based in the West Bank and Gaza Strip, seeks to establish an independent Islamic state in Palestine. In addition to the casualties resulting from Hamas’ initial incursion into Israel, the militant group and some of its allies abducted more than 200 soldiers and civilians. A one-week ceasefire in the military conflict between Israel and Hamas expired on November 30, 2023, after the two sides could not reach an agreement on an extension. The truce had led to several hostage and prisoner exchanges between Israel and Hamas. Each side blamed the other for the failure to extend the ceasefire, and fighting resumed following the expiration of the truce. Towards the end of the reporting period, 14 of the 15 countries comprising the United Nations Security Council, which is responsible for maintaining international peace and security, approved a resolution calling for another ceasefire between Israel and Hamas. The U.S. abstained from the vote, angering President Benjamin Netanyahu of Israel, a U.S. ally, who opposed the resolution.
In late January 2024, the U.S. and U.K. (with support from Australia, Bahrain, Canada, and the Netherlands) conducted airstrikes on several targets in Yemen. The military action was in response to Houthi rebel attacks on commercial shipping in the Red Sea off the coast of Yemen. The Houthi movement is an Iran-backed militant group that seized Sanaa, Yemen’s capital, in 2014. The group has attacked U.S. military bases in Iraq and Syria, as well as numerous commercial ships in the Red Sea, forcing international shipping companies to reroute their vessels around the Cape of Good Hope in South Africa, putting upward pressure on freight costs. In late January 2024, an Iran-backed militia group conducted a drone attack at a U.S. military base in Jordan, killing three U.S. troops. The coalition subsequently conducted a retaliatory strike on 18 Houthi military targets in Yemen. In late March, the Houthis reached agreements with China and Russia to allow safe passage for their ships through the Red Sea and Gulf of Aden.
SEI Exchange Traded Funds
1
LETTER TO SHAREHOLDERS (Continued)
March 31, 2024 (Unaudited)
Economic Performance
The U.S. Department of Labor reported that the CPI advanced 0.4% in February 2024, following a 0.3% upturn in January. The 3.2% year-over-year advance in the index modestly exceeded market expectations, and was up slightly from the 3.1% annual increase in January. Housing and gasoline prices accounted for approximately 60% of the month-over-month rise in the CPI. Costs for utility gas services were up 2.3% month-over-month in February, but fell 8.8% over the previous year. Food prices were flat in February and rose 2.2% year-over-year, down from the 2.6% annual upturn in January. The 3.8% rolling 12-month rise in core inflation, as measured by the CPI for all items less food and energy, was down 0.1% from the 3.9% year-over-year increase in January.
According to the third estimate from the Department of Commerce, U.S. gross domestic product (GDP) grew at an annualized rate of 3.4% in the fourth quarter of 2023, slightly higher than the second estimate of 3.2% but down from the 4.9% rise in the third quarter. The U.S. economy expanded by 2.5% for the 2023 calendar year, topping 2022’s 1.9% annual rise, bolstered mainly by increases in consumer spending—which comprises more than two-thirds of U.S. GDP—and nonresidential fixed investment (purchases of both nonresidential structures and equipment and software). The largest contributors to GDP growth for the fourth quarter included consumer spending, state and local government spending, and exports. The government attributed the lower economic growth rate in the fourth quarter relative to the previous three-month period primarily to slowdowns in private inventory investment (a measure of the changes in values of inventories from one time period to the next) and federal government spending.
It appears that the U.K. economy slipped into recession—defined as two consecutive quarters of negative GDP growth—at the end of last year. The Office for National Statistics (ONS) estimated that U.K. GDP fell 0.3% over the fourth quarter of 2023, following a 0.1% dip during the third quarter. However, the economy rebounded somewhat in January 2024, expanding 0.2%. According to Eurostat, eurozone GDP was flat in the fourth quarter of 2023, a slight uptick from the 0.1% decline in the third quarter, and grew 0.5% for the 2023 calendar year. The economies of Denmark, Croatia, and Slovenia were the strongest performers for the fourth quarter, expanding 2.0%, 1.3% and 1.1%, respectively. Conversely, Ireland’s GDP fell 3.4%, while the economies of Estonia and Finland each contracted by 0.7% during the quarter.
Inflation in the U.K. and the eurozone slowed considerably over the reporting period. The ONS reported that inflation in the U.K., as measured by the CPI, rose 3.4% year-over-year in February 2024 (the most recent data available), down sharply from the 9.2% annual increase in February 2023. Core inflation, which excludes volatile food prices, rose at an annual rate of 4.5% in February, down from the 5.1% year-over-year increase in January. Eurostat pegged the inflation rate for the eurozone at 2.6% for the 12-month period ending in February, modestly lower than the 2.8% annual increase in January. Core inflation rose at an annual rate of 3.1% in February, down 0.2% from the 3.3% year-over-year increase in January.
Market Developments
Global equity markets, as measured by the MSCI ACWI Index, gained 23.2% over the reporting period despite numerous bouts of volatility. North America was the top-performing region among the developed markets for the reporting period due mainly to strength in the U.S., while the Far East region benefited largely from a strong rally in Japan. The Pacific ex Japan region posted a relatively small positive return and was the most notable laggard among developed markets over the period, attributable mainly to substantial weakness in Hong Kong and New Zealand. The top performers among emerging markets included Eastern Europe (particularly Hungary, Greece, and Poland) and Europe (mainly Colombia and Peru). Conversely, the Far East region posted a modest gain and was the primary laggard among the emerging markets for the period, attributable to notable weakness in China.
Global fixed-income assets, as represented by the Bloomberg Global Aggregate Bond Index, returned 0.5% for the reporting period. Global high-yield bonds outperformed their investment-grade corporate and government counterparts. In the U.S., high-yield bonds ended the period with substantial gains, outperforming investment-grade corporate bonds, U.S. Treasurys, and mortgage-backed securities (MBS). The U.S. Treasury yield curve remained inverted during the period, as yields on shorter-term bonds exceeded those on longer-dated securities. The yield on the 10-year U.S. Treasury note moved higher for most of the reporting period, crossing 5% in overnight trading on late October—its highest level since July 2007. The 10-year yield subsequently dropped to a low of 3.79% in late December 2023, then rebounded to end the reporting period at 4.20%—up 0.72% year-over-year (bond prices move inversely to interest rates). Yields rose across the Treasury curve over the period. Yields on 2-, 3-, 5- and 10-year
2
SEI Exchange Traded Funds
Treasury notes rose 0.53%, 0.59%, 0.61%, and 0.72%, respectively, during the period. The yield spread between 10- and 2-year notes narrowed from -0.58% to -0.39% over the period.
Global commodity prices, as measured by the Bloomberg Commodity Total Return Index, dipped 0.6% in U.S. dollar terms during the reporting period. Prices for West Texas Intermediate crude oil and Brent crude moved higher over the period as ongoing geopolitical tensions in the Middle East spurred investors’ worries about a disruption in oil exports. The gold price ended the period in positive territory as the Fed slowed and subsequently paused its rate-hiking cycle. The New York Mercantile Exchange (NYMEX) natural gas price fell over the reporting period due to an increase in inventories and falling demand due to above-average temperatures in the U.S. for much of the winter of 2023-2024. Wheat prices declined during the reporting period, hampered by Russia’s shipments of large quantities of cheaply priced grain. The downturn more than offset a rebound in the wheat price in the fourth quarter of 2023, due mainly to a reduction in exports from Ukraine due to the nation’s ongoing conflict with Russia.
Our View
U.S. interest-rate expectations have converged thus far in 2024, as stubborn inflation data and a mixed employment picture have led investors to back away from predictions of aggressive interest-rate reductions from the Fed. As of the end of the first quarter, roughly three rate cuts were priced in, most likely starting in June, putting market expectations only slightly ahead of our own. Nonetheless, risks to this view are, in our opinion, clearly on the side of fewer rate cuts.
We would not be surprised to see mild weakness in the jobs data seize the attention of policy-makers and serve as a catalyst for the first rate cut in early summer, even if inflation remains above target. We believe inflation will remain stickier than expected on a slower decline in service inflation and a continued rebound in goods inflation.
U.S. equity investors are starting the quarter from what can only be described as “elevated levels” in the market. The S&P 500 Index currently trades at a forward price-to-earnings (P/E) ratio of 21. That is well above the historical average of roughly 16 and a good distance away from the rest of the world at just under 14. While it is true that equity market performance has broadened thus far in 2024—Japanese stocks are enjoying a strong rally and, in the U.S., the Magnificent Seven” mega-cap technology stocks are ending their run in favor of the “Fab Four” or maybe the “Terrific Trio”—quite a bit of good news is already priced into the U.S. market. Starting from here, the bar has been set fairly high for earnings to outperform expectations and drive prices higher. We acknowledge that P/E multiples can still expand from these heights, especially if they’re helped along by a pivot to easier monetary policy via interest-rate cuts from the Fed.
The 10-year U.S. Treasury yield is down from the 16-year high of 5% reached in October 2023, but well above where it started the year. We see additional room for bond yields to move higher, not only on the aforementioned sticky inflation data, but also on the substantial budget funding pressures and the lack of term premium priced into the yield curve. We would not be surprised to see the 10-year Treasury yield retest the 5% level even with the prospect of rate cuts on the horizon.
Sincerely,

James Smigiel
Chief Investment Officer
SEI Exchange Traded Funds
3
LETTER TO SHAREHOLDERS (Concluded)
March 31, 2024 (Unaudited)
Index Definitions
The MSCI ACWI Index is a market capitalization-weighted index that tracks the performance of over 2,000 companies, and is representative of the market structure of 48 developed and emerging-market countries in North and South America, Europe, Africa, and the Pacific Rim. The index is calculated with net dividends reinvested in U.S. dollars.
The MSCI North America Index tracks the performance of the large- and mid-cap segments of the U.S. and Canada markets. The index covers approximately 85% of the free float-adjusted (i.e., including only shares that are available for public trading) market capitalization in the U.S. and Canada.
The MSCI USA Index tracks the performance of the large- and mid-cap segments of the U.S. equity market. The index’s 624 constituents comprise approximately 85% of the free float-adjusted (i.e., including only shares that are available for public trading) market capitalization in the U.S.
The MSCI Pacific ex Japan Index tracks the performance of large- and mid-cap sticks across four of five developed-market countries in the Pacific region (excluding Japan).
The MSCI Emerging Markets Eastern Europe Index tracks the performance of large- and mid-cap stocks in the Czech Republic, Greece, Hungary, Poland and Turkey.
The MSCI Emerging Markets Latin America Index is a free float-adjusted (i.e., including only shares that are available for public trading) market capitalization-weighted index that tracks the performance of large- and mid-cap stocks across five emerging markets countries in Latin America.
The Bloomberg Global Aggregate Bond Index is a market capitalization-weighted index that tracks the performance of investment-grade (rated BBB- or higher by S&P Global Ratings/Fitch Ratings or Baa3 or higher by Moody’s Investors Service) fixed-income securities denominated in 13 currencies. The index reflects reinvestment of all distributions and changes in market prices.
The Bloomberg Global High Yield Index tracks the performance of U.S. dollar-denominated high-yield, fixed-rate corporate bonds. Securities are classified as high yield if the rating of Moody's, Fitch Ratings, and S&P Global Ratings is Ba1/BB+/BB+ or below.
The Bloomberg Global Aggregate - Corporate Index tracks the performance of global investment- grade, fixed-rate corporate debt.
The Bloomberg Global Treasury Index tracks fixed-rate, local-currency government debt of investment-grade countries, including both developed and emerging markets.
The Bloomberg U.S. Corporate High Yield Bond Index tracks the performance of fixed-rate, publicly issued, non-investment-grade (rated BB+ or lower by S&P Global Ratings and Fitch Ratings or Ba1 or lower by Moody’s Investors Service) bonds.
The Bloomberg U.S. Corporate Investment Grade Index is a broad-based benchmark that tracks the performance of the investment-grade (rated BBB- or higher by S&P Global Ratings and Fitch Ratings or Baa3 or higher by Moody’s Investors Service), fixed-rate, taxable corporate bond market.
The Bloomberg U.S. Treasuries Index tracks the performance of U.S. dollar-denominated, fixed-rate, nominal debt issued by the U.S. Treasury.
The Bloomberg U.S. Mortgage Backed Securities Index tracks the performance of fixed-rate agency mortgage-backed securities (MBS) guaranteed by the Government National Mortgage Association (GNMA), Federal National Mortgage Association (FNMA), and Freddie Mac (FHLMC).
The Bloomberg Commodity Total Return Index comprises futures contracts and tracks the performance of a fully collateralized investment in the index. This combines the returns of the index with the returns on cash collateral invested in 13-week (three-month) U.S. Treasury bills.
4
SEI Exchange Traded Funds
MANAGEMENT’S DISCUSSION AND ANALYSIS OF FUND PERFORMANCE
March 31, 2024 (Unaudited)
SEI Enhanced U.S. Large Cap Quality Factor ETF
I. Objective
SEI Enhanced U.S. Large Cap Quality Factor ETF (the “Fund”) seeks to provide long-term capital appreciation.
II. Investment Approach
SIMC uses a quantitative-based, active stock selection investment strategy combined with portfolio optimization to construct the Fund’s portfolio. SIMC’s quantitative model evaluates all of the securities in the investment universe of U.S. large-capitalization stocks based on various quality, profitability and risk factors, which may include various sales-based profitability ratios such as profit margins, and investment-based metrics, such as return on assets.
III. Return vs. Benchmark
For the one-year period ending March 31, 2024, the Fund returned 19.60%. The Fund’s primary benchmark–the Russell 1000 Index, which tracks the performance of 1000 of the largest U.S. equity securities based on market capitalization–returned 29.87%.
IV. Fund Attribution
The U.S. large-cap equity market experienced strong performance over the reporting period as investor sentiment rotated from concerns of a high interest-rate environment to one with signs of inflation being brought under control, recession avoided, and interest-rate cuts in the year ahead. Despite persistent geopolitical unrest stemming from the wars in Ukraine and the Middle East, equity markets demonstrated little to no negative repercussions over the period.
The Fund underperformed its benchmark, the Russell 1000 Index, during the reporting period due primarily to a challenging environment for diversified portfolios amid narrow market leadership, as well as headwinds to quality factors.
Bullish investor sentiment generally boosted risk assets, though market leadership for much of the reporting period was narrowly focused in the so-called “Magnificent Seven” mega-cap technology stocks. This concentration created headwinds for actively managed portfolios, the relative performance of which hinged on their exposure—or lack thereof—to these stocks. This was the main contributor to adverse stock selection within the Fund for the period. Among the Magnificent Seven, shares of semiconductor manufacturer Nvidia Corp. more than tripled over the period as a primary beneficiary of artificial intelligence (AI) hype in the market. The Fund had no position
in Nvidia during the period, and had underweight allocations to Meta Platforms Inc. (the parent company of Facebook) and e-commerce giant Amazon.com due to risk considerations. The positive contributions to performance of the Fund’s holdings in Alphabet Inc. (the parent company of Google) and software provider Microsoft Corp. only partially offset the negative impact of the relatively lower exposure to the three other Magnificent Seven stocks as noted.
From the factor perspective, quality underperformed during the reporting as the relatively strong performance of near-term measures of profitability was offset by long-term profitability measures and accounting quality, which lagged amid the “risk-on” market environment. Portfolio characteristics tilted toward stable-quality stocks resulted in a defensive profile, which also detracted from Fund performance in the sharply rising market. These headwinds were insufficiently offset by positive contributors within the consumer discretionary sector, including restaurant chain operator Domino’s Pizza and homebuilder NVR, as both companies benefited from strength in consumer spending in the U.S.
Investing is subject to risk, including the possible loss of principal. Past performance is no indication of future results.
SEI Exchange Traded Funds
5
MANAGEMENT’S DISCUSSION AND ANALYSIS OF FUND PERFORMANCE
March 31, 2024 (Unaudited)
SEI Enhanced U.S. Large Cap Quality Factor ETF (Concluded)
AVERAGE ANNUAL TOTAL RETURN(1) | ||||||||
| One Year Return | Annualized | |||||||
SEI Enhanced U.S. Large Cap Quality Factor ETF | 19.60% | 15.83% | ||||||
Russell 1000® Index | 29.87% | 18.72% | ||||||
Comparison of Change in the Value of a $10,000 Investment in the SEI Enhanced U.S. Large Cap Quality Factor ETF, versus the Russell 1000® Index
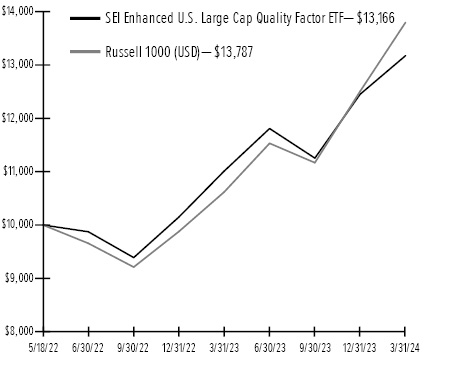
1 | For the year ended March 31, 2024. The Fund commenced operations on May 18, 2022. The performance data quoted herein represents past performance and the return and value of an investment in the Fund will fluctuate so that shares, when redeemed or sold in the market, may be worth more or less than their original cost. Past performance is no guarantee of future performance and should not be considered as a representation of the future results of the Fund. The Fund’s performance assumes the reinvestment of all dividends and all capital gains. Index returns assume reinvestment of dividends and, unlike the Fund’s returns, do not reflect any fees or expenses. If such fees and expenses were included in the index returns, the performance would have been lower. Please note that one cannot invest directly in an unmanaged index. |
6
SEI Exchange Traded Funds
MANAGEMENT’S DISCUSSION AND ANALYSIS OF FUND PERFORMANCE
March 31, 2024 (Unaudited)
SEI Enhanced U.S. Large Cap Momentum Factor ETF
I. Objective
SEI Enhanced U.S. Large Cap Momentum Factor ETF (the “Fund”) seeks to provide long-term capital appreciation.
II. Investment Approach
Under normal circumstances, the Fund will invest at least 80% of its net assets (plus the amount of any borrowings for investment purposes) in equity and equity-related securities (such as convertible bonds, convertible preferred stock, depositary receipts, warrants and rights) issued by large U.S. companies. Momentum investing is a trend-following investment strategy that is based on acquiring assets with recent improvement in their price, earnings or other relevant fundamentals. SIMC uses a quantitative-based, active stock selection investment strategy combined with portfolio optimization to construct the Fund’s portfolio.
III. Return vs. Benchmark
For the one-year period ending March 31, 2024, the Fund returned 27.08%. The Fund’s primary benchmark–the Russell 1000 Index–which tracks the performance of 1000 of the largest U.S. equity securities based on market capitalization–returned 29.87%.
IV. Fund Attribution
The U.S. large-cap equity market experienced strong performance over the reporting period as investor sentiment rotated from concerns of a high interest-rate environment to one with signs of inflation being brought under control, recession avoided, and interest-rate cuts in the year ahead. Despite persistent geopolitical unrest stemming from the wars in Ukraine and the Middle East, equity markets demonstrated little to no negative repercussions over the period.
The Fund’s performance lagged the benchmark Russell 1000 Index for the reporting period due predominantly to poor stock selection and diversification away from large-cap stocks, where the strongest momentum opportunities presented themselves. Momentum investing was generally in favor over the period, though sharp rotations among the strongest-performing stocks made the momentum difficult to capture.
Stock selection in the health care sector and the semiconductor segment of the information technology sector weighed on Fund performance for the reporting period. Amazon.com was one of the largest detractors from Fund performance. In the food and beverages segment of the consumer staples sector, shares of
Hershey Co. declined despite favorable earnings momentum.
Fund performance for the reporting period benefited from stock selection in homebuilders and related companies in the industrials sector which experienced more persistent positive trends underpinned by increased housing demand and a strong underlying economy.
Investing is subject to risk, including the possible loss of principal. Past performance is no indication of future results.
SEI Exchange Traded Funds
7
MANAGEMENT’S DISCUSSION AND ANALYSIS OF FUND PERFORMANCE
March 31, 2024 (Unaudited)
SEI Enhanced U.S. Large Cap Momentum Factor ETF (Concluded)
AVERAGE ANNUAL TOTAL RETURN(1) | ||||||||
| One Year Return | Annualized | |||||||
SEI Enhanced U.S. Large Cap Momentum Factor ETF | 27.08% | 15.32% | ||||||
Russell 1000® Index | 29.87% | 18.72% | ||||||
Comparison of Change in the Value of a $10,000 Investment in the SEI Enhanced U.S. Large Cap Momentum Factor ETF, versus the Russell 1000® Index
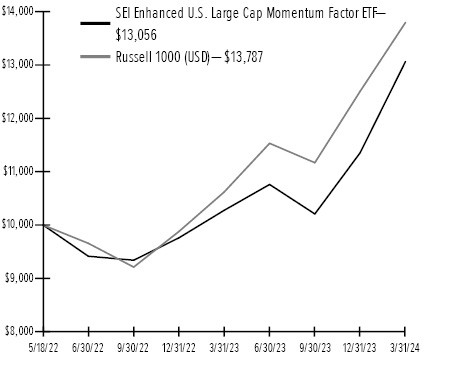
1 | For the year ended March 31, 2024. The Fund commenced operations on May 18, 2022. The performance data quoted herein represents past performance and the return and value of an investment in the Fund will fluctuate so that shares, when redeemed or sold in the market, may be worth more or less than their original cost. Past performance is no guarantee of future performance and should not be considered as a representation of the future results of the Fund. The Fund’s performance assumes the reinvestment of all dividends and all capital gains. Index returns assume reinvestment of dividends and, unlike the Fund’s returns, do not reflect any fees or expenses. If such fees and expenses were included in the index returns, the performance would have been lower. Please note that one cannot invest directly in an unmanaged index. |
8
SEI Exchange Traded Funds
MANAGEMENT’S DISCUSSION AND ANALYSIS OF FUND PERFORMANCE
March 31, 2024 (Unaudited)
SEI Enhanced U.S. Large Cap Value Factor ETF
I. Objective
SEI Enhanced U.S. Large Cap Value Factor ETF (the “Fund”) seeks to provide long-term capital appreciation.
II. Investment Approach
Under normal circumstances, the Fund will invest at least 80% of its net assets (plus the amount of any borrowings for investment purposes) in equity and equity-related securities (such as convertible bonds, convertible preferred stock, depositary receipts, warrants and rights) issued by large U.S. companies. Value investing is a mean-reverting investment strategy that is based on acquiring assets at a discount to their fair valuation. SIMC uses a quantitative-based, active stock selection investment strategy to construct the Fund’s portfolio.
III. Return vs. Benchmark
For the one-year period ending March 31, 2024, the Fund returned 31.11%. The Fund’s primary benchmark–the Russell 1000 Index–which tracks the performance of 1000 of the largest U.S. equity securities based on market capitalization–returned 29.87%.
IV. Fund Attribution
The U.S. large-cap equity market experienced strong performance over the reporting period as investor sentiment rotated from concerns of a high interest-rate environment to one with signs of inflation being brought under control, recession avoided, and interest-rate cuts in the year ahead. Despite persistent geopolitical unrest stemming from the wars in Ukraine and the Middle East, equity markets demonstrated little to no negative repercussions over the period.
The Fund outperformed its benchmark, the Russell 1000 Index, over the reporting period despite a difficult backdrop for value investing. Bullish investor sentiment generally boosted riskier growth stocks, with leadership narrowly focused in the so-called “Magnificent Seven” mega-cap technology stocks. This concentration created headwinds, as the relative performance of portfolios hinged on their exposure—or lack thereof—to these stocks over the period.
The Fund’s performance was bolstered by favorable stock selection in other sectors outside of information technology, including positions in homebuilders Pulte Group Inc., Toll Brothers Inc., and Lennar Corp. each of which experienced outsized gains attributable to increased housing demand supported by a strong underlying economy. Stock selection in the health care sector also enhanced Fund performance, most notably
holdings in Cardinal Health Inc., and McKesson Corp. In the utilities sector, shares of the Fund’s holding in Texas-based Vistra Corp. rallied sharply toward the end of the reporting period as investors took a favorable view of the company’s capabilities in nuclear generation and clean energy.
The Fund’s underweight allocation to semiconductor stocks posed a key challenge during the reporting period. In particular, shares of Nvidia Corp. more than tripled over the period, benefiting from increasing interest in artificial intelligence (AI). Given Nvidia’s speculative nature, the Fund did not hold a position in the company during the period, resulting in a significant drag on otherwise favorable Fund performance.
Investing is subject to risk, including the possible loss of principal. Past performance is no indication of future results.
SEI Exchange Traded Funds
9
MANAGEMENT’S DISCUSSION AND ANALYSIS OF FUND PERFORMANCE
March 31, 2024 (Unaudited)
SEI Enhanced U.S. Large Cap Value Factor ETF (Concluded)
AVERAGE ANNUAL TOTAL RETURN(1) | ||||||||
| One Year Return | Annualized | |||||||
SEI Enhanced U.S. Large Cap Value Factor ETF | 31.11% | 14.64% | ||||||
Russell 1000® Index | 29.87% | 18.72% | ||||||
Comparison of Change in the Value of a $10,000 Investment in the SEI Enhanced U.S. Large Cap Value Factor ETF, versus the Russell 1000® Index

1 | For the year ended March 31, 2024. The Fund commenced operations on May 18, 2022. The performance data quoted herein represents past performance and the return and value of an investment in the Fund will fluctuate so that shares, when redeemed or sold in the market, may be worth more or less than their original cost. Past performance is no guarantee of future performance and should not be considered as a representation of the future results of the Fund. The Fund’s performance assumes the reinvestment of all dividends and all capital gains. Index returns assume reinvestment of dividends and, unlike the Fund’s returns, do not reflect any fees or expenses. If such fees and expenses were included in the index returns, the performance would have been lower. Please note that one cannot invest directly in an unmanaged index. |
10
SEI Exchange Traded Funds
MANAGEMENT’S DISCUSSION AND ANALYSIS OF FUND PERFORMANCE
March 31, 2024 (Unaudited)
SEI Enhanced Low Volatility U.S. Large Cap ETF
I. Objective
SEI Enhanced Low Volatility U.S. Large Cap ETF (the “Fund”) seeks to provide long-term capital appreciation with lower volatility relative to the broad U.S. large cap equity market.
II. Investment Approach
The Fund seeks to provide long-term capital appreciation by investing primarily in U.S. common stocks, while aiming to experience lower volatility compared to the broad U.S. large cap equity market. SIMC uses a quantitative-based, active stock selection investment process to construct the Fund's portfolio, utilizing a combination of factor scoring model, risk model and optimization.
III. Return vs. Benchmark
For the one-year period ending March 31, 2024, the Fund returned 12.47%. The Fund’s primary benchmark–the Russell 1000 Index–which tracks the performance of 1000 of the largest U.S. equity securities based on market capitalization–returned 29.87%.
IV. Fund Attribution
The U.S. large-cap equity market experienced strong performance over the reporting period as investor sentiment rotated from concerns of a high interest-rate environment to one with signs of inflation being brought under control, recession avoided, and interest-rate cuts in the year ahead. Despite persistent geopolitical unrest stemming from the wars in Ukraine and the Middle East, equity markets demonstrated little to no negative repercussions over the period.
Such market conditions typically are challenging to low-volatility strategies, and the Fund’s performance for the reporting period was broadly consistent with this economic environment. Low-volatility stocks significantly lagged the overall U.S. equity market consequently, the Fund underperformed its benchmark, the Russell 1000 Index, for the period.
Bullish investor sentiment generally boosted risk assets, though market leadership for much of the reporting period was narrowly focused in the so-called “Magnificent Seven” mega-cap technology stocks. This concentration created headwinds for active management, and portfolios’ exposure—or lack thereof—to those stocks was the key determinant of their relative performance over the period.
At the sector level, Fund performance was hampered primarily by stock selection within information technology and communication services, as the Fund did not hold significant positions in the market-leading Magnificent Seven stocks. The Fund’s intentional underweight exposure to these riskier stocks resulted in limited participation in the market rally over the period.
Conversely, the Fund’s overweight positions in defensive sectors such as consumer staples, health care, and utilities saw comparably muted performance over the reporting period. The holding in pharmaceutical firm Pfizer Inc. was the largest detractor from Fund performance due to relatively weak earnings guidance for the company’s 2024 fiscal year on the back of waning COVID-related treatments and vaccines. Fund performance also was hampered by positions in the food and beverage segment of the consumer staples sector, including Hershey Co., General Mills, Inc., and J.M. Smucker Co. Fund performance was further limited by its additional focus on what we viewed as attractively valued securities, which lagged behind those with high valuations and growth.
On a positive note, the Fund implemented meaningful risk reduction while posting a positive total returns over the reporting period, albeit lagging the broader U.S. equity market due to its defensive objective. The Fund is characterized by a below-market beta (a measure of the volatility relative to a benchmark) of approximately .70, and by design, will typically lag capitalization-weighted benchmarks during sharp market upswings.
Investing is subject to risk, including the possible loss of principal. Past performance is no indication of future results.
SEI Exchange Traded Funds
11
MANAGEMENT’S DISCUSSION AND ANALYSIS OF FUND PERFORMANCE
March 31, 2024 (Unaudited)
SEI Enhanced Low Volatility U.S. Large Cap ETF (Concluded)
AVERAGE ANNUAL TOTAL RETURN(1) | ||||||||
| One Year Return | Annualized | |||||||
SEI Enhanced Low Volatility U.S. Large Cap ETF | 12.47% | 8.19% | ||||||
Russell 1000® Index | 29.87% | 18.72% | ||||||
Comparison of Change in the Value of a $10,000 Investment in the SEI Enhanced Low Volatility U.S. Large Cap ETF, versus the Russell 1000® Index

1 | For the year ended March 31, 2024. The Fund commenced operations on May 18, 2022. The performance data quoted herein represents past performance and the return and value of an investment in the Fund will fluctuate so that shares, when redeemed or sold in the market, may be worth more or less than their original cost. Past performance is no guarantee of future performance and should not be considered as a representation of the future results of the Fund. The Fund’s performance assumes the reinvestment of all dividends and all capital gains. Index returns assume reinvestment of dividends and, unlike the Fund’s returns, do not reflect any fees or expenses. If such fees and expenses were included in the index returns, the performance would have been lower. Please note that one cannot invest directly in an unmanaged index. |
12
SEI Exchange Traded Funds
SCHEDULE OF INVESTMENTS
March 31, 2024
SEI Enhanced U.S. Large Cap Quality Factor ETF

†Percentages based on total investments. Total investments do not include derivatives such as options, futures contracts, forward contracts, and swap contracts, if applicable.
Description | Shares | Market Value | ||||||
COMMON STOCK†† — 99.5% | ||||||||
Communication Services — 8.9% | ||||||||
Alphabet, Cl A * | 89,338 | $ | 13,484 | |||||
Alphabet, Cl C * | 4,071 | 620 | ||||||
Electronic Arts | 25,833 | 3,427 | ||||||
Meta Platforms, Cl A | 5,097 | 2,475 | ||||||
| 20,006 | ||||||||
Consumer Discretionary — 15.9% | ||||||||
Amazon.com * | 5,681 | 1,025 | ||||||
AutoZone * | 222 | 700 | ||||||
Booking Holdings | 1,645 | 5,968 | ||||||
Domino's Pizza | 8,421 | 4,184 | ||||||
H&R Block | 35,829 | 1,760 | ||||||
Home Depot | 1,248 | 479 | ||||||
McDonald's | 9,493 | 2,676 | ||||||
NVR * | 714 | 5,783 | ||||||
O'Reilly Automotive * | 6,394 | 7,218 | ||||||
Ulta Beauty * | 2,969 | 1,552 | ||||||
Yum! Brands | 33,710 | 4,674 | ||||||
| 36,019 | ||||||||
Consumer Staples — 10.9% | ||||||||
Altria Group | 104,788 | 4,571 | ||||||
Coca-Cola | 69,650 | 4,261 | ||||||
Colgate-Palmolive | 55,452 | 4,993 | ||||||
Monster Beverage * | 20,820 | 1,234 | ||||||
PepsiCo | 7,848 | 1,374 | ||||||
Philip Morris International | 53,043 | 4,860 | ||||||
Procter & Gamble | 20,444 | 3,317 | ||||||
| 24,610 | ||||||||
Financials — 11.7% | ||||||||
FactSet Research Systems | 8,864 | 4,028 | ||||||
Mastercard, Cl A | 14,199 | 6,838 | ||||||
Moody's | 10,688 | 4,201 | ||||||
Description | Shares | Market Value | ||||||
COMMON STOCK†† (continued) | ||||||||
MSCI, Cl A | 8,001 | $ | 4,484 | |||||
Visa, Cl A | 24,565 | 6,855 | ||||||
| 26,406 | ||||||||
Health Care — 10.4% | ||||||||
AbbVie | 1,820 | 332 | ||||||
Bristol-Myers Squibb | 43,690 | 2,369 | ||||||
Hologic * | 40,341 | 3,145 | ||||||
Johnson & Johnson | 38,476 | 6,087 | ||||||
Merck & Co | 23,085 | 3,046 | ||||||
Mettler-Toledo International * | 3,260 | 4,340 | ||||||
Vertex Pharmaceuticals * | 9,905 | 4,140 | ||||||
| 23,459 | ||||||||
Industrials — 8.2% | ||||||||
Fastenal | 75,818 | 5,849 | ||||||
Illinois Tool Works | 7,157 | 1,920 | ||||||
Paychex | 33,942 | 4,168 | ||||||
Robert Half | 25,082 | 1,988 | ||||||
Verisk Analytics, Cl A | 19,012 | 4,482 | ||||||
| 18,407 | ||||||||
Information Technology — 33.5% | ||||||||
Adobe * | 10,193 | 5,143 | ||||||
Apple | 97,402 | 16,703 | ||||||
Autodesk * | 6,101 | 1,589 | ||||||
Broadcom | 3,035 | 4,023 | ||||||
Cadence Design Systems * | 23,247 | 7,236 | ||||||
Cisco Systems | 41,970 | 2,095 | ||||||
Dolby Laboratories, Cl A | 15,061 | 1,262 | ||||||
Fair Isaac * | 3,603 | 4,502 | ||||||
Manhattan Associates * | 14,692 | 3,676 | ||||||
Microsoft | 50,160 | 21,103 | ||||||
QUALCOMM | 16,834 | 2,850 | ||||||
Texas Instruments | 8,237 | 1,435 | ||||||
VeriSign * | 21,589 | 4,091 | ||||||
| 75,708 | ||||||||
Total Common Stock | ||||||||
(Cost $216,105) ($ Thousands) | 224,615 | |||||||
Total Investments in Securities — 99.5% | ||||||||
(Cost $216,105) ($ Thousands) | $ | 224,615 | ||||||
| Percentages are based on Net Assets of $225,819 ($ Thousands). |
* | Non-income producing security. |
†† | Narrow industries are utilized for compliance purposes, whereas broad sectors are utilized for reporting. |
As of March 31, 2024, all of the Fund's investments were considered Level 1, in accordance with the authoritative guidance on fair value measurements and disclosure under U.S. GAAP. |
See “Glossary” for abbreviations.
SEI Exchange Traded Funds
13
SCHEDULE OF INVESTMENTS
March 31, 2024
SEI Enhanced U.S. Large Cap Quality Factor ETF (Concluded)
For more information on valuation inputs, see Note 2 – Significant Accounting Policies in Notes to Financial Statements.
The accompanying notes are an integral part of the financial statements.
14
SEI Exchange Traded Funds
SCHEDULE OF INVESTMENTS
March 31, 2024
SEI Enhanced U.S. Large Cap Momentum Factor ETF

†Percentages based on total investments. Total investments do not include derivatives such as options, futures contracts, forward contracts, and swap contracts, if applicable.
Description | Shares | Market Value | ||||||
COMMON STOCK†† — 99.6% | ||||||||
Communication Services — 5.0% | ||||||||
Alphabet, Cl C * | 593 | $ | 90 | |||||
Meta Platforms, Cl A | 43,945 | 21,339 | ||||||
TKO Group Holdings, Cl A | 20,156 | 1,742 | ||||||
| 23,171 | ||||||||
Consumer Discretionary — 15.4% | ||||||||
Amazon.com * | 9,089 | 1,640 | ||||||
AutoZone * | 3,648 | 11,497 | ||||||
Chipotle Mexican Grill, Cl A * | 1,413 | 4,107 | ||||||
Deckers Outdoor * | 11,505 | 10,829 | ||||||
DR Horton | 63,756 | 10,491 | ||||||
Lululemon Athletica * | 16,906 | 6,604 | ||||||
O'Reilly Automotive * | 9,310 | 10,510 | ||||||
PulteGroup | 14,387 | 1,735 | ||||||
Toll Brothers | 49,571 | 6,413 | ||||||
Ulta Beauty * | 4,170 | 2,181 | ||||||
Wingstop | 13,822 | 5,065 | ||||||
| 71,072 | ||||||||
Consumer Staples — 2.9% | ||||||||
General Mills | 590 | 41 | ||||||
Lamb Weston Holdings | 68,557 | 7,304 | ||||||
Mondelez International, Cl A | 84,130 | 5,889 | ||||||
| 13,234 | ||||||||
Energy — 0.4% | ||||||||
TechnipFMC | 77,817 | 1,954 | ||||||
Financials — 12.2% | ||||||||
Aflac | 24,773 | 2,127 | ||||||
Apollo Global Management | 65,689 | 7,387 | ||||||
Arch Capital Group * | 98,612 | 9,116 | ||||||
Blackstone | 1,731 | 227 | ||||||
Brown & Brown | 44,092 | 3,860 | ||||||
Description | Shares | Market Value | ||||||
COMMON STOCK†† (continued) | ||||||||
Cboe Global Markets | 44,372 | $ | 8,152 | |||||
Chubb | 1,144 | 296 | ||||||
Erie Indemnity, Cl A | 12,088 | 4,854 | ||||||
FactSet Research Systems | 9,796 | 4,451 | ||||||
Fiserv * | 13,810 | 2,207 | ||||||
Shift4 Payments, Cl A * | 1,412 | 93 | ||||||
Unum Group | 39,764 | 2,134 | ||||||
W R Berkley | 70,901 | 6,271 | ||||||
WEX * | 21,318 | 5,064 | ||||||
| 56,239 | ||||||||
Health Care — 11.4% | ||||||||
AbbVie | 10,391 | 1,892 | ||||||
Acadia Healthcare * | 21,891 | 1,734 | ||||||
Cencora | 39,327 | 9,556 | ||||||
Cigna | 2,459 | 893 | ||||||
Dexcom * | 19,583 | 2,716 | ||||||
Eli Lilly | 4,993 | 3,884 | ||||||
Gilead Sciences | 94,442 | 6,918 | ||||||
McKesson | 20,929 | 11,236 | ||||||
Medpace Holdings * | 1,191 | 481 | ||||||
Merck & Co | 24,786 | 3,271 | ||||||
Stryker | 28,752 | 10,290 | ||||||
| 52,871 | ||||||||
Industrials — 17.2% | ||||||||
Axon Enterprise * | 32,621 | 10,206 | ||||||
Booz Allen Hamilton Holding, Cl A | 62,564 | 9,287 | ||||||
Builders FirstSource * | 58,200 | 12,138 | ||||||
Clean Harbors * | 24,786 | 4,990 | ||||||
General Electric | 6,939 | 1,218 | ||||||
Hubbell, Cl B | 13,814 | 5,733 | ||||||
nVent Electric | 24,782 | 1,868 | ||||||
Parker-Hannifin | 21,878 | 12,160 | ||||||
Republic Services, Cl A | 52,806 | 10,109 | ||||||
Trane Technologies | 21,598 | 6,484 | ||||||
Vertiv Holdings, Cl A | 65,138 | 5,320 | ||||||
| 79,513 | ||||||||
Information Technology — 33.5% | ||||||||
Apple | 177,168 | 30,381 | ||||||
Arista Networks * | 51,280 | 14,870 | ||||||
Cadence Design Systems * | 39,474 | 12,287 | ||||||
Crowdstrike Holdings, Cl A * | 31,504 | 10,100 | ||||||
Fair Isaac * | 1,339 | 1,673 | ||||||
Guidewire Software * | 35,160 | 4,104 | ||||||
Jabil | 62,638 | 8,390 | ||||||
Manhattan Associates * | 30,834 | 7,716 | ||||||
Microsoft | 43,788 | 18,422 | ||||||
NVIDIA | 37,922 | 34,265 | ||||||
Palo Alto Networks * | 29,948 | 8,509 | ||||||
Synopsys * | 7,492 | 4,282 | ||||||
| 154,999 | ||||||||
SEI Exchange Traded Funds
15
SCHEDULE OF INVESTMENTS
March 31, 2024
SEI Enhanced U.S. Large Cap Momentum Factor ETF (Concluded)
Description | Shares | Market Value | ||||||
COMMON STOCK†† (continued) | ||||||||
Materials — 1.6% | ||||||||
Packaging Corp of America | 38,589 | $ | 7,323 | |||||
Reliance | 817 | 273 | ||||||
| 7,596 | ||||||||
Total Common Stock | ||||||||
(Cost $425,056) ($ Thousands) | 460,649 | |||||||
Total Investments in Securities — 99.6% | ||||||||
(Cost $425,056) ($ Thousands) | $ | 460,649 | ||||||
| Percentages are based on Net Assets of $462,385 ($ Thousands). |
* | Non-income producing security. |
†† | Narrow industries are utilized for compliance purposes, whereas broad sectors are utilized for reporting. |
As of March 31, 2024, all of the Fund's investments were considered Level 1, in accordance with the authoritative guidance on fair value measurements and disclosure under U.S. GAAP. |
See “Glossary” for abbreviations.
For more information on valuation inputs, see Note 2 – Significant Accounting Policies in Notes to Financial Statements.
The accompanying notes are an integral part of the financial statements.
16
SEI Exchange Traded Funds
SCHEDULE OF INVESTMENTS
March 31, 2024
SEI Enhanced U.S. Large Cap Value Factor ETF

†Percentages based on total investments. Total investments do not include derivatives such as options, futures contracts, forward contracts, and swap contracts, if applicable.
Description | Shares | Market Value | ||||||
COMMON STOCK†† — 99.5% | ||||||||
Communication Services — 13.5% | ||||||||
Alphabet, Cl A * | 65,223 | $ | 9,844 | |||||
Alphabet, Cl C * | 69,072 | 10,517 | ||||||
AT&T | 548,448 | 9,653 | ||||||
Comcast, Cl A | 86,340 | 3,743 | ||||||
Meta Platforms, Cl A | 30,342 | 14,733 | ||||||
Omnicom Group | 21,663 | 2,096 | ||||||
Playtika Holding | 9,450 | 67 | ||||||
TripAdvisor * | 52,696 | 1,464 | ||||||
Verizon Communications | 263,352 | 11,050 | ||||||
| 63,167 | ||||||||
Consumer Discretionary — 9.9% | ||||||||
Amazon.com * | 7,068 | 1,275 | ||||||
eBay | 56,074 | 2,960 | ||||||
Ford Motor | 202,902 | 2,695 | ||||||
General Motors | 217,155 | 9,848 | ||||||
H&R Block | 82,353 | 4,044 | ||||||
Lennar, Cl A | 18,282 | 3,144 | ||||||
Lennar, Cl B | 6,221 | 959 | ||||||
PulteGroup | 118,678 | 14,315 | ||||||
Toll Brothers | 52,311 | 6,767 | ||||||
| 46,007 | ||||||||
Consumer Staples — 7.5% | ||||||||
Albertsons, Cl A | 80,241 | 1,721 | ||||||
Altria Group | 194,288 | 8,475 | ||||||
Bunge Global | 39,058 | 4,004 | ||||||
Ingredion | 9,388 | 1,097 | ||||||
Kraft Heinz | 190,861 | 7,043 | ||||||
Kroger | 201,946 | 11,537 | ||||||
Seaboard | 76 | 245 | ||||||
Walgreens Boots Alliance | 39,386 | 854 | ||||||
| 34,976 | ||||||||
Description | Shares | Market Value | ||||||
COMMON STOCK†† (continued) | ||||||||
Energy — 1.9% | ||||||||
Chesapeake Energy | 33,299 | $ | 2,958 | |||||
Chevron | 2,305 | 363 | ||||||
Marathon Petroleum | 8,912 | 1,796 | ||||||
Occidental Petroleum | 6,374 | 414 | ||||||
Southwestern Energy * | 70,594 | 535 | ||||||
Valero Energy | 17,820 | 3,042 | ||||||
| 9,108 | ||||||||
Financials — 14.6% | ||||||||
Affiliated Managers Group | 19,125 | 3,203 | ||||||
American International Group | 128,510 | 10,046 | ||||||
Brighthouse Financial * | 34,231 | 1,764 | ||||||
Capital One Financial | 79,721 | 11,870 | ||||||
Citigroup | 160,238 | 10,134 | ||||||
Corebridge Financial | 42,479 | 1,220 | ||||||
Janus Henderson Group | 38,407 | 1,263 | ||||||
Jefferies Financial Group | 97,862 | 4,316 | ||||||
MGIC Investment | 145,055 | 3,244 | ||||||
New York Community Bancorp | 323,103 | 1,040 | ||||||
Reinsurance Group of America | 17,896 | 3,452 | ||||||
Synchrony Financial | 208,400 | 8,986 | ||||||
Unum Group | 92,180 | 4,946 | ||||||
Western Union | 193,946 | 2,711 | ||||||
| 68,195 | ||||||||
Health Care — 14.8% | ||||||||
AbbVie | 11,675 | 2,126 | ||||||
Bristol-Myers Squibb | 63,938 | 3,467 | ||||||
Cardinal Health | 114,530 | 12,816 | ||||||
Cigna | 11,098 | 4,031 | ||||||
CVS Health | 104,396 | 8,327 | ||||||
DaVita * | 2,504 | 346 | ||||||
Gilead Sciences | 105,684 | 7,741 | ||||||
Henry Schein * | 5,225 | 395 | ||||||
Laboratory Corp of America Holdings | 3,755 | 820 | ||||||
McKesson | 26,194 | 14,062 | ||||||
Pfizer | 202,141 | 5,609 | ||||||
Quest Diagnostics | 19,147 | 2,549 | ||||||
Viatris, Cl W | 560,596 | 6,693 | ||||||
| 68,982 | ||||||||
Industrials — 4.6% | ||||||||
Allison Transmission Holdings | 51,253 | 4,160 | ||||||
American Airlines Group * | 301,347 | 4,626 | ||||||
Core & Main, Cl A * | 19,740 | 1,130 | ||||||
FedEx | 1,588 | 460 | ||||||
ManpowerGroup | 5,645 | 438 | ||||||
Owens Corning | 31,957 | 5,330 | ||||||
PACCAR | 3,916 | 485 | ||||||
Ryder System | 20,136 | 2,420 | ||||||
Schneider National, Cl B | 26,845 | 608 | ||||||
SEI Exchange Traded Funds
17
SCHEDULE OF INVESTMENTS
March 31, 2024
SEI Enhanced U.S. Large Cap Value Factor ETF (Concluded)
Description | Shares | Market Value | ||||||
COMMON STOCK†† (continued) | ||||||||
Science Applications International | 14,209 | $ | 1,853 | |||||
| 21,510 | ||||||||
Information Technology — 26.1% | ||||||||
Amdocs | 56,383 | 5,095 | ||||||
Apple | 92,602 | 15,879 | ||||||
AppLovin, Cl A * | 38,945 | 2,696 | ||||||
Arrow Electronics * | 33,241 | 4,303 | ||||||
Avnet | 44,170 | 2,190 | ||||||
Cisco Systems | 30,085 | 1,502 | ||||||
Crane NXT | 22,583 | 1,398 | ||||||
Dell Technologies, Cl C | 17,205 | 1,963 | ||||||
Dropbox, Cl A * | 121,435 | 2,951 | ||||||
DXC Technology * | 110,334 | 2,340 | ||||||
F5 * | 25,808 | 4,893 | ||||||
Gen Digital | 28,735 | 644 | ||||||
Hewlett Packard Enterprise | 411,157 | 7,290 | ||||||
HP | 299,955 | 9,065 | ||||||
Intel | 108,805 | 4,806 | ||||||
International Business Machines | 26,884 | 5,134 | ||||||
Jabil | 19,205 | 2,573 | ||||||
Microsoft | 43,479 | 18,292 | ||||||
NCR Voyix * | 18,764 | 237 | ||||||
NetApp | 84,882 | 8,910 | ||||||
Oracle | 29,716 | 3,733 | ||||||
Skyworks Solutions | 72,436 | 7,846 | ||||||
Teradata * | 49,080 | 1,898 | ||||||
Vontier | 74,432 | 3,376 | ||||||
Zoom Video Communications, Cl A * | 43,323 | 2,832 | ||||||
| 121,846 | ||||||||
Materials — 2.9% | ||||||||
Berry Global Group | 57,067 | 3,451 | ||||||
International Paper | 80,648 | 3,147 | ||||||
LyondellBasell Industries, Cl A | 55,287 | 5,655 | ||||||
Steel Dynamics | 8,836 | 1,310 | ||||||
| 13,563 | ||||||||
Utilities — 3.7% | ||||||||
Consolidated Edison | 49,540 | 4,499 | ||||||
National Fuel Gas | 40,970 | 2,201 | ||||||
PPL | 11,879 | 327 | ||||||
Vistra | 144,872 | 10,090 | ||||||
| 17,117 | ||||||||
Total Common Stock | ||||||||
(Cost $423,111) ($ Thousands) | 464,471 | |||||||
Total Investments in Securities — 99.5% | ||||||||
(Cost $423,111) ($ Thousands) | $ | 464,471 | ||||||
| Percentages are based on Net Assets of $467,011 ($ Thousands). |
* | Non-income producing security. |
†† | Narrow industries are utilized for compliance purposes, whereas broad sectors are utilized for reporting. |
As of March 31, 2024, all of the Fund's investments were considered Level 1, in accordance with the authoritative guidance on fair value measurements and disclosure under U.S. GAAP. |
See “Glossary” for abbreviations.
For more information on valuation inputs, see Note 2 – Significant Accounting Policies in Notes to Financial Statements.
The accompanying notes are an integral part of the financial statements.
18
SEI Exchange Traded Funds
SCHEDULE OF INVESTMENTS
March 31, 2024
SEI Enhanced Low Volatility U.S. Large Cap ETF
†Percentages based on total investments. Total investments do not include derivatives such as options, futures contracts, forward contracts, and swap contracts, if applicable.
Description | Shares | Market Value | ||||||
COMMON STOCK†† — 99.5% | ||||||||
Communication Services — 11.2% | ||||||||
Alphabet, Cl A * | 3,860 | $ | 582 | |||||
Alphabet, Cl C * | 12,336 | 1,878 | ||||||
AT&T | 166,480 | 2,930 | ||||||
Comcast, Cl A | 53,097 | 2,302 | ||||||
Fox | 2,285 | 65 | ||||||
Omnicom Group | 27,952 | 2,705 | ||||||
T-Mobile US | 4,060 | 663 | ||||||
Verizon Communications | 77,144 | 3,237 | ||||||
| 14,362 | ||||||||
Consumer Discretionary — 4.1% | ||||||||
Amazon.com * | 2,019 | 364 | ||||||
AutoZone * | 214 | 674 | ||||||
Genuine Parts | 3,167 | 491 | ||||||
Grand Canyon Education * | 3,874 | 528 | ||||||
H&R Block | 22,978 | 1,128 | ||||||
McDonald's | 5,989 | 1,689 | ||||||
Service Corp International | 1,086 | 81 | ||||||
Yum! Brands | 2,028 | 281 | ||||||
| 5,236 | ||||||||
Consumer Staples — 11.0% | ||||||||
Colgate-Palmolive | 18,077 | 1,628 | ||||||
General Mills | 28,343 | 1,983 | ||||||
Hershey | 7,085 | 1,378 | ||||||
J M Smucker | 13,718 | 1,727 | ||||||
Kellanova | 5,158 | 296 | ||||||
Mondelez International, Cl A | 3,697 | 259 | ||||||
Procter & Gamble | 21,592 | 3,503 | ||||||
Walmart | 55,466 | 3,337 | ||||||
| 14,111 | ||||||||
Energy — 3.0% | ||||||||
Chevron | 17,953 | 2,832 | ||||||
Description | Shares | Market Value | ||||||
COMMON STOCK†† (continued) | ||||||||
Kinder Morgan | 45,364 | $ | 832 | |||||
Marathon Petroleum | 1,084 | 218 | ||||||
| 3,882 | ||||||||
Financials — 9.1% | ||||||||
Allstate | 4,797 | 830 | ||||||
Berkshire Hathaway, Cl B * | 4,788 | 2,013 | ||||||
Chubb | 7,759 | 2,011 | ||||||
Loews | 3,910 | 306 | ||||||
Markel Group * | 1,027 | 1,562 | ||||||
Marsh & McLennan | 1,474 | 304 | ||||||
Travelers | 5,083 | 1,170 | ||||||
W R Berkley | 31,816 | 2,814 | ||||||
White Mountains Insurance Group | 382 | 685 | ||||||
| 11,695 | ||||||||
Health Care — 17.6% | ||||||||
Bristol-Myers Squibb | 30,556 | 1,657 | ||||||
Cardinal Health | 25,492 | 2,852 | ||||||
Cencora | 6,394 | 1,554 | ||||||
Chemed | 553 | 355 | ||||||
CVS Health | 12,402 | 989 | ||||||
Gilead Sciences | 31,445 | 2,303 | ||||||
Johnson & Johnson | 22,187 | 3,510 | ||||||
McKesson | 5,899 | 3,167 | ||||||
Merck & Co | 32,723 | 4,318 | ||||||
Pfizer | 27,355 | 759 | ||||||
Quest Diagnostics | 8,517 | 1,134 | ||||||
| 22,598 | ||||||||
Industrials — 10.4% | ||||||||
3M | 2,420 | 257 | ||||||
Expeditors International of Washington | 18,879 | 2,295 | ||||||
Genpact | 7,016 | 231 | ||||||
Landstar System | 5,366 | 1,034 | ||||||
MSC Industrial Direct, Cl A | 6,305 | 612 | ||||||
Republic Services, Cl A | 17,342 | 3,320 | ||||||
Robert Half | 6,108 | 484 | ||||||
Snap-on | 1,287 | 381 | ||||||
Verisk Analytics, Cl A | 9,612 | 2,266 | ||||||
Waste Management | 11,653 | 2,484 | ||||||
| 13,364 | ||||||||
Information Technology — 25.5% | ||||||||
Accenture, Cl A | 6,037 | 2,092 | ||||||
Amdocs | 18,504 | 1,672 | ||||||
Amphenol, Cl A | 7,565 | 873 | ||||||
Apple | 26,440 | 4,534 | ||||||
Arrow Electronics * | 9,466 | 1,225 | ||||||
Avnet | 12,919 | 641 | ||||||
Cisco Systems | 56,962 | 2,843 | ||||||
Dolby Laboratories, Cl A | 9,227 | 773 | ||||||
Jabil | 2,775 | 372 | ||||||
Juniper Networks | 26,268 | 974 | ||||||
SEI Exchange Traded Funds
19
SCHEDULE OF INVESTMENTS
March 31, 2024
SEI Enhanced Low Volatility U.S. Large Cap ETF (Concluded)
Description | Shares | Market Value | ||||||
COMMON STOCK†† (continued) | ||||||||
Manhattan Associates * | 4,151 | $ | 1,039 | |||||
Microsoft | 19,352 | 8,142 | ||||||
Motorola Solutions | 787 | 279 | ||||||
Oracle | 33,512 | 4,209 | ||||||
Roper Technologies | 5,543 | 3,109 | ||||||
| 32,777 | ||||||||
Materials — 2.4% | ||||||||
NewMarket | 834 | 529 | ||||||
Reliance | 5,797 | 1,937 | ||||||
Silgan Holdings | 12,762 | 620 | ||||||
| 3,086 | ||||||||
Utilities — 5.2% | ||||||||
Atmos Energy | 6,344 | 754 | ||||||
CMS Energy | 1,120 | 68 | ||||||
Consolidated Edison | 27,250 | 2,475 | ||||||
DTE Energy | 3,703 | 415 | ||||||
Duke Energy | 23,002 | 2,224 | ||||||
National Fuel Gas | 12,619 | 678 | ||||||
| 6,614 | ||||||||
Total Common Stock | ||||||||
(Cost $121,063) ($ Thousands) | 127,725 | |||||||
Total Investments in Securities — 99.5% | ||||||||
(Cost $121,063) ($ Thousands) | $ | 127,725 | ||||||
| Percentages are based on Net Assets of $128,408 ($ Thousands). |
* | Non-income producing security. |
†† | Narrow industries are utilized for compliance purposes, whereas broad sectors are utilized for reporting. |
As of March 31, 2024, all of the Fund's investments were considered Level 1, in accordance with the authoritative guidance on fair value measurements and disclosure under U.S. GAAP. |
See “Glossary” for abbreviations.
For more information on valuation inputs, see Note 2 – Significant Accounting Policies in Notes to Financial Statements.
The accompanying notes are an integral part of the financial statements.
20
SEI Exchange Traded Funds
Glossary: (abbreviations which may be used in the preceding Schedules of Investments)
Portfolio Abbreviations |
Cl — Class |
The accompanying notes are an integral part of the financial statements.
SEI Exchange Traded Funds
21
STATEMENTS OF ASSETS AND LIABILITIES ($ Thousands)
March 31, 2024
SEI Enhanced U.S. Large Cap Quality Factor ETF | SEI Enhanced U.S. Large Cap Momentum Factor ETF | SEI Enhanced U.S. Large Cap Value Factor ETF | SEI Enhanced Low Volatility U.S. Large Cap ETF | |||||||||||||
Assets: | ||||||||||||||||
Investments, at value† | $ | 224,615 | $ | 460,649 | $ | 464,471 | $ | 127,725 | ||||||||
Cash | 979 | 1,642 | 2,045 | 582 | ||||||||||||
Dividends receivable | 253 | 148 | 553 | 116 | ||||||||||||
Receivable for fund shares sold | — | — | — | 1,388 | ||||||||||||
Foreign tax reclaim receivable | — | 4 | — | 1 | ||||||||||||
Total Assets | 225,847 | 462,443 | 467,069 | 129,812 | ||||||||||||
Liabilities: | ||||||||||||||||
Investment advisory fees payable | 28 | 58 | 58 | 16 | ||||||||||||
Payable for investment securities purchased | — | — | — | 1,388 | ||||||||||||
Total Liabilities | 28 | 58 | 58 | 1,404 | ||||||||||||
Net Assets | $ | 225,819 | $ | 462,385 | $ | 467,011 | $ | 128,408 | ||||||||
† Cost of investments | $ | 216,105 | $ | 425,056 | $ | 423,111 | $ | 121,063 | ||||||||
Net Assets: | ||||||||||||||||
Paid-in capital — (unlimited authorization — no par value) | $ | 217,327 | $ | 429,195 | $ | 426,172 | $ | 122,016 | ||||||||
Total distributable earnings | 8,492 | 33,190 | 40,839 | 6,392 | ||||||||||||
Net Assets | $ | 225,819 | $ | 462,385 | $ | 467,011 | $ | 128,408 | ||||||||
Net Asset Value, Offering and Redemption Price Per Share | $ | 32.15 | $ | 32.11 | $ | 30.98 | $ | 27.76 | ||||||||
| ($225,818,927 ÷ 7,025,000 shares | ) | ($462,384,551 ÷ 14,400,000 shares | ) | ($467,010,757 ÷ 15,075,000 shares | ) | ($128,407,955 ÷ 4,625,000 shares | ) | |||||||||
The accompanying notes are an integral part of the financial statements.
22
SEI Exchange Traded Funds
STATEMENTS OF OPERATIONS ($ Thousands)
For the year ended March 31, 2024
SEI Enhanced U.S. Large Cap Quality Factor ETF | SEI Enhanced U.S. Large Cap Momentum Factor ETF | SEI Enhanced U.S. Large Cap Value Factor ETF | SEI Enhanced Low Volatility U.S. Large Cap ETF | |||||||||||||
Investment income: | ||||||||||||||||
Dividends | $ | 670 | $ | 680 | $ | 2,069 | $ | 644 | ||||||||
Total investment income | 670 | 680 | 2,069 | 644 | ||||||||||||
Expenses: | ||||||||||||||||
Investment advisory fees | 63 | 120 | 120 | 44 | ||||||||||||
Trustee fees | — | 1 | 1 | — | ||||||||||||
Total expenses | 63 | 121 | 121 | 44 | ||||||||||||
Net investment income | 607 | 559 | 1,948 | 600 | ||||||||||||
Net realized gain (loss) on: | ||||||||||||||||
Investments(1) | 773 | (1,702 | ) | 695 | 755 | |||||||||||
Net realized gain (loss) | 773 | (1,702 | ) | 695 | 755 | |||||||||||
Net change in unrealized appreciation (depreciation) on: | ||||||||||||||||
Investments | 7,479 | 34,409 | 41,526 | 6,305 | ||||||||||||
Net change in unrealized appreciation | 7,479 | 34,409 | 41,526 | 6,305 | ||||||||||||
Net realized and unrealized gain | 8,252 | 32,707 | 42,221 | 7,060 | ||||||||||||
Net increase in net assets resulting from operations | $ | 8,859 | $ | 33,266 | $ | 44,169 | $ | 7,660 | ||||||||
(1) Includes realized gains (losses) as a result of in-kind redemptions (see Note 4 in Notes to Financial Statements). Amounts designated as "—" are $0 or have been rounded to $0. |
The accompanying notes are an integral part of the financial statements.
SEI Exchange Traded Funds
23
STATEMENTS OF CHANGES IN NET ASSETS ($ Thousands)
For the year ended March 31, 2024 and the period ended March 31, 2023
SEI Enhanced U.S. Large Cap Quality Factor ETF | ||||||||
| 4/1/2023 to 3/31/2024 | 5/18/2022(1) to 3/31/2023 | |||||||
Operations: | ||||||||
Net investment income | $ | 607 | $ | 114 | ||||
Net realized gain (loss) | 773 | (96 | ) | |||||
Net change in unrealized appreciation (depreciation) | 7,479 | 1,031 | ||||||
Net increase in net assets resulting from operations | 8,859 | 1,049 | ||||||
Distributions | (184 | ) | (75 | ) | ||||
Capital share transactions: | ||||||||
Proceeds from shares issued | 212,940 | 14,549 | ||||||
Cost of shares redeemed | (9,389 | ) | (1,930 | ) | ||||
Net increase in net assets derived from capital share transactions | 203,551 | 12,619 | ||||||
Net increase in net assets | 212,226 | 13,593 | ||||||
Net assets: | ||||||||
Beginning of year/period | 13,593 | — | ||||||
End of year/period | $ | 225,819 | $ | 13,593 | ||||
Share Transactions: | ||||||||
Shares issued | 6,825 | 575 | ||||||
Shares redeemed | (300 | ) | (75 | ) | ||||
Increase in net assets derived from share transactions | 6,525 | 500 | ||||||
(1) The Fund commenced operations on May 18, 2022. |
Amounts designated as "—" are $0 or have been rounded to $0. |
The accompanying notes are an integral part of the financial statements. |
24
SEI Exchange Traded Funds
STATEMENTS OF CHANGES IN NET ASSETS ($ Thousands)
For the year ended March 31, 2024 and the period ended March 31, 2023
SEI Enhanced U.S. Large Cap Momentum Factor ETF | ||||||||
| 4/1/2023 to 3/31/2024 | 5/18/2022(1) to 3/31/2023 | |||||||
Operations: | ||||||||
Net investment income | $ | 559 | $ | 254 | ||||
Net realized loss | (1,702 | ) | (430 | ) | ||||
Net change in unrealized appreciation (depreciation) | 34,409 | 1,184 | ||||||
Net increase in net assets resulting from operations | 33,266 | 1,008 | ||||||
Distributions | (238 | ) | (192 | ) | ||||
Capital share transactions: | ||||||||
Proceeds from shares issued | 409,639 | 25,408 | ||||||
Cost of shares redeemed | (1,329 | ) | (5,177 | ) | ||||
Net increase in net assets derived from capital share transactions | 408,310 | 20,231 | ||||||
Net increase in net assets | 441,338 | 21,047 | ||||||
Net assets: | ||||||||
Beginning of year/period | 21,047 | — | ||||||
End of year/period | $ | 462,385 | $ | 21,047 | ||||
Share Transactions: | ||||||||
Shares issued | 13,625 | 1,025 | ||||||
Shares redeemed | (50 | ) | (200 | ) | ||||
Increase (decrease) in net assets derived from share transactions | 13,575 | 825 | ||||||
(1) The Fund commenced operations on May 18, 2022. |
Amounts designated as "—" are $0 or have been rounded to $0. |
The accompanying notes are an integral part of the financial statements. |
SEI Exchange Traded Funds
25
STATEMENTS OF CHANGES IN NET ASSETS ($ Thousands) (Concluded)
For the year ended March 31, 2024 and the period ended March 31, 2023
SEI Enhanced U.S. Large Cap Value Factor ETF | ||||||||
| 4/1/2023 to 3/31/2024 | 5/18/2022(1) to 3/31/2023 | |||||||
Operations: | ||||||||
Net investment income | $ | 1,948 | $ | 411 | ||||
Net realized gain (loss) | 695 | (142 | ) | |||||
Net change in unrealized appreciation (depreciation) | 41,526 | (166 | ) | |||||
Net increase in net assets resulting from operations | 44,169 | 103 | ||||||
Distributions | (593 | ) | (281 | ) | ||||
Capital share transactions: | ||||||||
Proceeds from shares issued | 423,105 | 25,113 | ||||||
Cost of shares redeemed | (20,214 | ) | (4,391 | ) | ||||
Net increase in net assets derived from capital share transactions | 402,891 | 20,722 | ||||||
Net increase in net assets | 446,467 | 20,544 | ||||||
Net assets: | ||||||||
Beginning of year/period | 20,544 | — | ||||||
End of year/period | $ | 467,011 | $ | 20,544 | ||||
Share Transactions: | ||||||||
Shares issued | 14,925 | 1,025 | ||||||
Shares redeemed | (700 | ) | (175 | ) | ||||
Increase (decrease) in net assets derived from share transactions | 14,225 | 850 | ||||||
(1) The Fund commenced operations on May 18, 2022. |
Amounts designated as "—" are $0 or have been rounded to $0. |
The accompanying notes are an integral part of the financial statements. |
26
SEI Exchange Traded Funds
STATEMENTS OF CHANGES IN NET ASSETS ($ Thousands)
For the year ended March 31, 2024 and the period ended March 31, 2023
SEI Enhanced Low Volatility U.S. Large Cap ETF | ||||||||
| 4/1/2023 to 3/31/2024 | 5/18/2022(1) to 3/31/2023 | |||||||
Operations: | ||||||||
Net investment income | $ | 600 | $ | 205 | ||||
Net realized gain (loss) | 755 | (112 | ) | |||||
Net change in unrealized appreciation (depreciation) | 6,305 | 357 | ||||||
Net increase in net assets resulting from operations | 7,660 | 450 | ||||||
Distributions | (263 | ) | (139 | ) | ||||
Capital share transactions: | ||||||||
Proceeds from shares issued | 118,168 | 13,574 | ||||||
Cost of shares redeemed | (9,134 | ) | (1,908 | ) | ||||
Net increase in net assets derived from capital share transactions | 109,034 | 11,666 | ||||||
Net increase in net assets | 116,431 | 11,977 | ||||||
Net assets: | ||||||||
Beginning of year/period | 11,977 | — | ||||||
End of year/period | $ | 128,408 | $ | 11,977 | ||||
Share Transactions: | ||||||||
Shares issued | 4,500 | 550 | ||||||
Shares redeemed | (350 | ) | (75 | ) | ||||
Increase (decrease) in net assets derived from share transactions | 4,150 | 475 | ||||||
(1) The Fund commenced operations on May 18, 2022. |
Amounts designated as "—" are $0 or have been rounded to $0. |
The accompanying notes are an integral part of the financial statements. |
SEI Exchange Traded Funds
27
FINANCIAL HIGHLIGHTS
For the year ended March 31, 2024 and the period ended March 31, 2023.
For a Share Outstanding Throughout Each Year/Period
| Net asset value, beginning of year | Net | Net realized and unrealized gains (losses) on securities | Total from | Distributions from net investment income | Distributions from realized gains | Total dividends | Net asset value, end of year | Total Return† | Net assets, | Ratio of | Ratio of expenses to average net assets (excluding waivers and reimbursements) | Ratio of net investment income to average net assets | Portfolio turnover† | |||||||||||||||||||||||||||||||||||||||||||
SEI Enhanced U.S. Large Cap Quality Factor ETF | ||||||||||||||||||||||||||||||||||||||||||||||||||||||||
2024 | $ | 27.19 | $ | 0.44 | $ | 4.85 | $ | 5.29 | $ | (0.33 | ) | $ | – | $ | (0.33 | ) | $ | 32.15 | 19.60 | % | $ | 225,819 | 0.15 | % | 0.15 | % | 1.44 | % | 23 | % | ||||||||||||||||||||||||||
2023(2) | 24.91 | 0.30 | 2.19 | 2.49 | (0.21 | ) | – | (0.21 | ) | 27.19 | 10.08 | 13,593 | 0.15 | 0.15 | 1.35 | 40 | ||||||||||||||||||||||||||||||||||||||||
SEI Enhanced U.S. Large Cap Momentum Factor ETF | ||||||||||||||||||||||||||||||||||||||||||||||||||||||||
2024 | $ | 25.51 | $ | 0.21 | $ | 6.64 | $ | 6.85 | $ | (0.25 | ) | $ | – | $ | (0.25 | ) | $ | 32.11 | 27.08 | % | $ | 462,385 | 0.15 | % | 0.15 | % | 0.70 | % | 40 | % | ||||||||||||||||||||||||||
2023(2) | 25.08 | 0.33 | 0.35 | 0.68 | (0.25 | ) | – | (0.25 | ) | 25.51 | 2.74 | 21,047 | 0.15 | 0.15 | 1.52 | 63 | ||||||||||||||||||||||||||||||||||||||||
SEI Enhanced U.S. Large Cap Value Factor ETF | ||||||||||||||||||||||||||||||||||||||||||||||||||||||||
2024 | $ | 24.17 | $ | 0.69 | $ | 6.70 | $ | 7.39 | $ | (0.58 | ) | $ | – | $ | (0.58 | ) | $ | 30.98 | 31.11 | % | $ | 467,011 | 0.15 | % | 0.15 | % | 2.44 | % | 32 | % | ||||||||||||||||||||||||||
2023(2) | 24.95 | 0.58 | (0.97 | ) | (0.39 | ) | (0.39 | ) | – | (0.39 | ) | 24.17 | (1.52 | ) | 20,544 | 0.15 | 0.15 | 2.74 | 43 | |||||||||||||||||||||||||||||||||||||
SEI Enhanced Low Volatility U.S. Large Cap ETF | ||||||||||||||||||||||||||||||||||||||||||||||||||||||||
2024 | $ | 25.21 | $ | 0.54 | $ | 2.54 | $ | 3.08 | $ | (0.53 | ) | $ | – | $ | (0.53 | ) | $ | 27.76 | 12.47 | % | $ | 128,408 | 0.15 | % | 0.15 | % | 2.04 | % | 13 | % | ||||||||||||||||||||||||||
2023(2) | 24.79 | 0.48 | 0.25 | 0.73 | (0.31 | ) | – | (0.31 | ) | 25.21 | 3.02 | 11,977 | 0.15 | 0.15 | 2.24 | 24 | ||||||||||||||||||||||||||||||||||||||||
† | Returns and portfolio turnover rates are for the period indicated and have not been annualized. Returns do not reflect the deduction of taxes that a shareholder would pay on fund distributions or the redemption of fund shares. |
(1) | Per share calculated using average shares. |
(2) | Commenced operations on May 18, 2022. All ratios for the period have been annualized. |
Amounts designated as “—” are either $0 or have been rounded to $0.
The accompanying notes are an integral part of the financial statements.
28
SEI Exchange Traded Funds
NOTES TO FINANCIAL STATEMENTS
March 31, 2024
1. ORGANIZATION
SEI Exchange Traded Funds (the “Trust”) was organized as a Delaware statutory trust under a Declaration of Trust dated October 7, 2021.
The Trust is registered under the Investment Company Act of 1940, as amended, as an open-end investment company with four funds: SEI Enhanced U.S. Large Cap Quality Factor ETF, SEI Enhanced U.S. Large Cap Momentum Factor ETF, SEI Enhanced U.S. Large Cap Value Factor ETF and SEI Enhanced Low Volatility U.S. Large Cap ETF (each a “Fund” and together the “Funds”) each of which are diversified Funds. Each Fund’s prospectus provides a description of its investment goal, principal investment strategies and risks. The Funds commenced operations on May 18, 2022. The assets of each Fund are segregated, and an Authorized Participant’s interest is limited to the Fund in which shares are held.
2. SIGNIFICANT ACCOUNTING POLICIES
The following are significant accounting policies, which are consistently followed in the preparation of its financial statements by the Funds. The Funds are investment companies that apply the accounting and reporting guidance issued in Topic 946 by the U.S. Financial Accounting Standards Board (“FASB”).
Use of Estimates — The Funds are investment companies in conformity with accounting principles generally accepted in the United States of America (“U.S. GAAP”). Therefore, the Funds follow the accounting and reporting guidelines for investment companies. The preparation of financial statements, in conformity with U.S. GAAP requires management to make estimates and assumptions that affect the reported amounts of assets and liabilities and disclosure of contingent assets and liabilities as of the date of the financial statements and the reported amounts of increases and decreases in net assets from operations during the reporting period. Actual results could differ from those estimates.
Security Valuation — Pursuant to the requirements of the 1940 Act and Rule 2a-5, the administrator, as delegated by the Board of Trustees (the “Board”), has the responsibility for the valuation of Fund investments with readily available market quotations in accordance with the Funds’ Valuation and Pricing Policy. The Trust's Board of Trustees has designated SIMC as the Valuation Designee for the Funds pursuant to Rule 2a-5 (the “Rule”) under the 1940 Act. The Valuation Designee has the responsibility for the fair value determination with respect to all Fund investments that do not have readily available market quotations or quotations that are no longer reliable. SIMC has appointed a Valuation Committee (the “Committee”) and has established a
Valuation and Pricing Policy to implement the Rule and the Funds’ Valuation and Pricing Policy (together the “Policy”). Securities listed on a securities exchange, market or automated quotation system for which quotations are readily available (other than securities traded on National Association of Securities Dealers Automated Quotations (NASDAQ) or as otherwise noted below) at the last quoted sale price on an exchange or market (foreign or domestic) on which the securities are traded or, if there is no such reported sale, at the most recent quoted bid price. A Fund values securities traded on NASDAQ at the NASDAQ Official Closing Price. Redeemable securities issued by open-end investment companies are valued at the investment company’s applicable Net Asset Value (“NAV”) per share, with the exception of ETFs, which are priced as equity securities. These open-end investment companies’ shares are offered in separate prospectuses, each of which describes the process by which the applicable investment company’s NAV is determined. The prices of foreign securities are reported in local currency and converted to U.S. dollars using currency exchange rates. If a security’s price cannot be obtained, as noted above, a Fund will value the securities using a bid price from at least one independent broker.
Prices for most securities held by a Fund are provided daily by third-party independent pricing agents. SIMC reasonably believes that prices provided by independent pricing agents are reliable. However, there can be no assurance that such pricing service’s prices will be reliable. SIMC will continuously monitor the reliability of prices obtained from any pricing service and shall promptly notify the Funds’ administrator if it believes that a particular pricing service is no longer a reliable source of prices. The Funds’ administrator, in turn, will notify SIMC, as Valuation Designee, if the Funds’ administrator reasonably believes that a particular pricing service is no longer a reliable source for prices.
The Policy provides that any change in a primary pricing agent or a pricing methodology requires prior approval by the Board. However, when the change would not materially affect the valuation of a Fund’s net assets or involve a material departure in pricing methodology from that of a Fund’s existing pricing agent or pricing methodology, ratification may be obtained at the next regularly scheduled meeting of the Board.
Securities for which market prices are not "readily available" are valued in accordance with Rule 2a-5 and the Policy.
The Committee must monitor for circumstances that may necessitate that a security be valued using Fair Value Procedures which can include: (i) the security's trading
SEI Exchange Traded Funds
29
NOTES TO FINANCIAL STATEMENTS (Continued)
March 31, 2024
has been halted or suspended, (ii) the security has been de-listed from a national exchange, (iii) the security's primary trading market is temporarily closed at a time when under normal conditions it would be open, (iv) the security has not been traded for an extended period of time, (v) the security's primary pricing source is not able or willing to provide a price, (vi) trading of the security is subject to local government-imposed restrictions; or (vii) a significant event (as defined below). When a security is valued in accordance with the Procedures, the Committee will determine the value after taking into consideration relevant information reasonably available to the Committee. Examples of factors the Committee may consider include: (i) the type of security or asset, (ii) the last trade price, (iii) evaluation of the forces that influence the market in which the security is purchased and sold, (iv) the liquidity of the security, (v) the size of the holding in a Fund or (vi) any other appropriate information.
The Committee is responsible for selecting and applying, in a consistent manner, the appropriate methodologies for determining and calculating the fair value of holdings of the Funds, including specifying the key inputs and assumptions specific to each asset class or holding.
The determination of a security’s fair value price often involves the consideration of a number of subjective factors, and is therefore subject to the unavoidable risk that the value assigned to a security may be higher or lower than the security’s value would be if a reliable market quotation for the security was readily available. As of March 31, 2024, there were no fair valued securities held by the Funds.
In accordance with U.S. GAAP, fair value is defined as the price that a Fund would receive upon selling an investment in an orderly transaction to an independent buyer in the principal or most advantageous market of the investment. A three tier hierarchy has been established to maximize the use of observable and minimize the use of unobservable inputs and to establish classification of fair value measurements for disclosure purposes. Inputs refer broadly to the assumptions that market participants would use in pricing an asset. Inputs may be observable or unobservable. Observable inputs are inputs that reflect the assumptions market participants would use in pricing the asset or liability based on market data obtained from sources independent of the reporting entity. Unobservable inputs are inputs that reflect the reporting entity’s own assumptions about the assumptions market participants would use in pricing the asset or liability based on the best information available in the circumstances.
The three-tier hierarchy of inputs is summarized in the three broad Levels listed below:
Level 1 — quoted prices in active markets for identical investments
Level 2 — other significant observable inputs (including quoted prices for similar investments, interest rates, prepayment speeds, credit risks, etc.)
Level 3 — significant unobservable inputs (including the Fund’s own assumptions in determining the fair value of investments)
Investments are classified within the level of the lowest significant input considered in determining fair value. Investments classified within Level 3 whose fair value measurement considers several inputs may include Level 1 or Level 2 inputs as components of the overall fair value measurement.
The valuation techniques used by the Funds to measure fair value during the year ended March 31, 2024 maximized the use of observable inputs and minimized the use of unobservable inputs.
For the year ended March 31, 2024, there have been no significant changes to the inputs or the Trust’s fair valuation methodologies.
Security Transactions and Investment Income — Security transactions are recorded on the trade date. Cost used in determining net realized capital gains and losses on the sale of securities is determined on the basis of specific identification. Dividend income and expense is recognized on the ex-dividend date, and interest income or expense is recognized using the accrual basis of accounting.
Distributions received on securities that represent a return of capital or capital gain are recorded as a reduction of cost of investments and/ or as a realized gain. The Trust estimates the components of distributions received that may be considered nontaxable distributions or capital gain distributions.
Amortization and accretion is calculated using the scientific interest method, which is not materially different from the effective interest method. Amortization of premiums and discounts is included in interest income.
Cash and Cash Equivalents — Idle cash and currency balances may be swept into various overnight sweep accounts and are classified as cash and cash equivalents on the Statement of Assets and Liabilities. These amounts, at times, may exceed United States federally insured limits. Amounts swept are available on the next business day.
Expenses — Expenses that are directly related to one of the Funds are charged directly to that Fund. Other
30
SEI Exchange Traded Funds
operating expenses of the Trust are prorated to the Funds on the basis of relative daily net assets.
Foreign Currency Translation — The books and records of the Funds investing in international securities are maintained in U.S. dollars on the following basis:
(i) market value of investment securities, assets and liabilities at the current rate of exchange; and
(ii) purchases and sales of investment securities, income and expenses at the relevant rates of exchange prevailing on the respective dates of such transactions.
The Funds do not isolate that portion of gains and losses on investments in investment securities that is due to changes in the foreign exchange rates from that which is due to changes in market prices of investment securities.
The Funds report certain foreign-currency-related transactions as components of realized gains for financial reporting purposes, whereas such components are treated as ordinary income for Federal income tax purposes.
Dividends and Distributions to Shareholders — The Funds will distribute substantially all of their net investment income and all net realized capital gains, if any, at least annually. All dividends and distributions are recorded on ex-dividend date.
Investments in Real Estate Investment Trusts (“REITs”) — Dividend income is recorded based on the income included in distributions received from the REIT investments using published REIT reclassifications including management estimates when actual amounts are not available. Distributions received in excess of this estimated amount are recorded as a reduction of the cost of investments or reclassified to capital gains. The actual amounts of income, return of capital, and capital gains are only determined by each REIT after its fiscal year-end, and may differ from the estimated amounts.
Creation Units — The Funds issue and redeem their shares (“Shares”) on a continuous basis at NAV and only in large blocks of Shares referred to as “Creation Units”. Purchasers of Creation Units (“Authorized Participants”) at NAV must pay a standard creation transaction fee per transaction. The fee is a single charge and will be the same regardless of the number of Creation Units purchased by an Authorized Participant on the same day.
3. INVESTMENT ADVISORY, ADMINISTRATION AND DISTRIBUTION AGREEMENTS, AND OTHER TRANSACTIONS WITH AFFILIATES
Investment Advisory, Administration and Distribution Agreements — SIMC serves as investment adviser (the “Adviser”) to each Fund. In connection with serving as
Adviser, SIMC is entitled to a fee, which is calculated daily and paid monthly, based on the average daily net assets of each fund. Pursuant to the Investment Advisory Agreement entered into with the Trust, SIMC has agreed to pay all Fund expenses, except for the fees paid to SIMC for advisory services, interest expenses, dividend and other expenses on securities sold short, taxes, expenses incurred with respect to the acquisition and disposition of portfolio securities and the execution of portfolio transactions (including brokerage commissions), acquired fund fees and expenses, distribution fees or expenses paid by the Trust under any distribution plan adopted pursuant to Rule 12b-1 under the 1940 Act (if any), fees and expenses of the Board of Trustees, litigation expenses and any extraordinary expenses.
SEI Investments Global Funds Services (the “Administrator”) is the administrator for the Funds.
SEI Exchange Traded Funds
31
NOTES TO FINANCIAL STATEMENTS (Continued)
March 31, 2024
SEI Investments Distribution Co. (the “Distributor”) is the distributor of creation units. The Funds have adopted a Distribution and Servicing Plan (the Plan). The Plan permits each Fund to pay the Distributor, or its designee, a fee for the sale and distribution and/or shareholder
servicing of the shares at an annual rate of up to 0.25% of average daily net assets of the shares of the Fund ("12b-1 fee"). However, payment of a 12b-1 fee has not been authorized at this time.
The following table reflects each Fund’s contractual Advisory Fee (expressed as an annual rate). The rates shown are fixed rates based on each Fund’s daily net assets.
Advisory Fee | |
SEI Enhanced U.S. Large Cap Quality Factor ETF | 0.150% |
SEI Enhanced U.S. Large Cap Momentum Factor ETF | 0.150% |
SEI Enhanced U.S. Large Cap Value Factor ETF | 0.150% |
SEI Enhanced Low Volatility U.S. Large Cap ETF | 0.150% |
Brokerage Commissions Paid to Affiliates — The Distributor may receive compensation on fund transactions effected for the Trust in accordance with the rules of the Securities and Exchange Commission (“SEC”). Accordingly, it is expected that fund transactions may result in brokerage commissions being paid to the Distributor. The SEC rules require that such commissions not exceed usual and customary commissions.
There were no such commissions for the year ended March 31, 2024.
Payment to Affiliates — Certain Officers and Trustees of the Trust are also Officers and/or Directors of the Administrator, Adviser and/or the Distributor.
The Trust pays each unaffiliated Trustee an annual fee for attendance at quarterly, interim, and committee meetings. The Administrator or the Distributor pays compensation of Officers and affiliated Trustees.
A portion of the services provided by the Chief Compliance Officer (“CCO”) and his staff, whom are employees of the Administrator, are paid for by the Trust as incurred. The services include regulatory oversight of the Trust’s Adviser, sub-advisers and service providers.
Interfund Lending — The SEC has granted an exemption that permits the Trust to participate in an interfund lending program (“the Program”) with existing or future investment companies registered under the 1940 Act that are advised by SIMC (the “SEI Funds”). The Program allows the SEI Funds to lend money to and borrow money from each other for temporary or emergency purposes. Participation in the Program is voluntary for both borrowing and lending funds. Interfund loans may be made only when the rate of interest to be charged is more favorable to the lending fund than an investment in overnight repurchase agreements (“Repo Rate”), and more favorable to the borrowing fund than the rate of interest that would be charged by a bank for short-term borrowings (“Bank Loan Rate”). The Bank Loan Rate will be determined using a formula reviewed annually by the SEI Funds’ Board of Trustees. The interest rate imposed on interfund loans is the average of the Repo Rate and the Bank Loan Rate.
As of, and during the year ended March 31, 2024, the Trust had not participated in the Program.
4. INVESTMENT TRANSACTIONS
The cost of security purchases and the proceeds from the sale of securities, excluding in-kind transactions and short-term securities during the year ended March 31, 2024, were as follows:
SEI Enhanced U.S. Large Cap Quality Factor ETF | SEI Enhanced U.S. Large Cap Momentum Factor ETF | SEI Enhanced U.S. Large Cap Value Factor ETF | SEI Enhanced Low Volatility U.S. Large Cap ETF | |||||||||||||
Purchases | ||||||||||||||||
U.S. Government | $ | — | $ | — | $ | — | $ | — | ||||||||
Other | 11,507 | 39,628 | 29,827 | 4,757 | ||||||||||||
Sales | ||||||||||||||||
U.S. Government | — | — | — | — | ||||||||||||
Other | 11,136 | 36,315 | 29,390 | 4,000 | ||||||||||||
32
SEI Exchange Traded Funds
For the year ended March 31, 2024, in-kind transactions associated with creations and redemptions were as follows:
Realized | ||||||||||||
| Purchases | Sales | Gain | ||||||||||
($ Thousands) | ($ Thousands) | ($ Thousands) | ||||||||||
SEI Enhanced U.S. Large Cap Quality Factor ETF | $ | 211,881 | $ | 9,401 | $ | 1,025 | ||||||
SEI Enhanced U.S. Large Cap Momentum Factor ETF | 405,074 | 1,312 | 181 | |||||||||
SEI Enhanced U.S. Large Cap Value Factor ETF | 419,853 | 18,416 | 2,180 | |||||||||
SEI Enhanced Low Volatility U.S. Large Cap ETF | 117,098 | 9,064 | 1,250 | |||||||||
5. FEDERAL TAX INFORMATION:
It is each Fund’s intention to qualify as a regulated investment company under Subchapter M of the Internal Revenue Code and distribute all of its taxable income (including net capital gains). Accordingly, no provision for Federal income taxes is required.
The Funds may be subject to taxes imposed by countries in which they invest with respect to their investments in issuers existing or operating in such countries. Such taxes are generally based on income earned. The Funds accrue such taxes when the related income is earned.
Dividends from net investment income and distributions from net realized capital gains are determined in accordance with U.S. Federal income tax regulations, which may differ from those amounts determined under U.S. GAAP. These book/tax differences are either temporary or permanent in nature. To the extent these differences are permanent, they are charged or credited to paid-in capital and distributable earnings, as appropriate, in the period that the differences arise. The permanent differences are primarily attributable to non-taxable in-kind redemptions.
Paid-in- | Distributable Earnings (Accumulated | |||||||
SEI Enhanced U.S. Large Cap Quality Factor ETF | $ | 1,007 | $ | (1,007 | ) | |||
SEI Enhanced U.S. Large Cap Momentum Factor ETF | 171 | (171 | ) | |||||
SEI Enhanced U.S. Large Cap Value Factor ETF | 2,128 | (2,128 | ) | |||||
SEI Enhanced Low Volatility U.S. Large Cap ETF | 1,225 | (1,225 | ) | |||||
The tax character of dividends and distributions paid during the fiscal years ended March 31, 2024 were as follows:
| Ordinary Income ($ Thousands) | Long-Term Capital Gain ($ Thousands) | Total ($ Thousands) | |||||||||||
| SEI Enhanced U.S. Large Cap Quality Factor ETF | |||||||||||||
| 2024 | $ | 184 | $ | — | $ | 184 | |||||||
| 2023 | 75 | — | 75 | ||||||||||
| SEI Enhanced U.S. Large Cap Momentum Factor ETF | |||||||||||||
| 2024 | 238 | — | 238 | ||||||||||
| 2023 | 192 | — | 192 | ||||||||||
| SEI Enhanced U.S. Large Cap Value Factor ETF | |||||||||||||
| 2024 | 593 | — | 593 | ||||||||||
| 2023 | 281 | — | 281 | ||||||||||
| SEI Enhanced Low Volatility U.S. Large Cap ETF | |||||||||||||
| 2024 | 263 | — | 263 | ||||||||||
| 2023 | 139 | — | 139 | ||||||||||
SEI Exchange Traded Funds
33
NOTES TO FINANCIAL STATEMENTS (Continued)
March 31, 2024
As of March 31, 2024, the components of Distributable Earnings/(Accumulated Losses) were as follows:
Undistributed | Undistributed | Capital | Post | Late Year | Unrealized | Other | Total | |||||||||||||||||||||||||
SEI Enhanced U.S. Large Cap Quality Factor ETF | $ | 462 | $ | — | $ | (195 | ) | $ | — | $ | — | $ | 8,225 | $ | — | $ | 8,492 | |||||||||||||||
SEI Enhanced U.S. Large Cap Momentum Factor ETF | 383 | — | (2,647 | ) | — | — | 35,453 | 1 | 33,190 | |||||||||||||||||||||||
SEI Enhanced U.S. Large Cap Value Factor ETF | 1,484 | — | (721 | ) | — | — | 40,075 | 1 | 40,839 | |||||||||||||||||||||||
SEI Enhanced Low Volatility U.S. Large Cap ETF | 403 | — | (338 | ) | — | — | 6,327 | — | 6,392 | |||||||||||||||||||||||
For Federal income tax purposes, capital loss carryforwards may be carried forward and applied against future capital gains. Losses carried forward are as follows:
Short-Term | Long-Term | Total | ||||||||||
SEI Enhanced U.S. Large Cap Quality Factor ETF | $ | 128 | $ | 67 | $ | 195 | ||||||
SEI Enhanced U.S. Large Cap Momentum Factor ETF | 2,203 | 444 | 2,647 | |||||||||
SEI Enhanced U.S. Large Cap Value Factor ETF | 462 | 259 | 721 | |||||||||
SEI Enhanced Low Volatility U.S. Large Cap ETF | 245 | 93 | 338 | |||||||||
For Federal income tax purposes, the cost of securities owned at March 31, 2024, and the net realized gains or losses on securities sold for the period were different from amounts reported for financial reporting purposes. These differences are primarily due to wash sales which cannot be used for Federal income tax purposes in the current year and have been deferred for use in future years. The aggregate gross unrealized appreciation and depreciation on total investments held by the Funds at March 31, 2024, was as follows:
Federal | Appreciated | Depreciated | Net | |||||||||||||
SEI Enhanced U.S. Large Cap Quality Factor ETF | $ | 216,390 | $ | 10,808 | $ | (2,583 | ) | $ | 8,225 | |||||||
SEI Enhanced U.S. Large Cap Momentum Factor ETF | 425,196 | 41,111 | (5,658 | ) | 35,453 | |||||||||||
SEI Enhanced U.S. Large Cap Value Factor ETF | 424,396 | 43,996 | (3,921 | ) | 40,075 | |||||||||||
SEI Enhanced Low Volatility U.S. Large Cap ETF | 121,398 | 7,312 | (985 | ) | 6,327 | |||||||||||
6. CONCENTRATION/RISKS
In the normal course of business, the Trust enters into contracts that provide general indemnifications by the Trust to the counterparty to the contract. The Trust’s maximum exposure under these arrangements is dependent on future claims that may be made against the Trust and, therefore, cannot be estimated; however, management believes that, based on experience, the risk of loss from such claims is considered remote.
To the extent consistent with its Investment Strategy, a Fund may have one of more of the following principal risks:
Equity Securities Risk — Equity securities are subject to changes in value, and their values may be more volatile than those of other asset classes.
Quality Securities Risk — There is no guarantee that the past performance of stocks that SIMC determines are quality will continue. Companies that issue these stocks may experience lower than expected returns or may experience negative growth, as well as increased leverage, resulting in lower than expected or negative returns to Fund shareholders. Many factors can affect a stock’s quality and performance, and the impact of these factors on a stock or its price can be difficult to predict.
Momentum Securities Risk — Stocks that previously exhibited high momentum characteristics may not
34
SEI Exchange Traded Funds
experience positive momentum or may experience more volatility than the market as a whole.
Value Securities Risk — Securities issued by companies that may be perceived as undervalued may fail to appreciate for long periods of time and may never realize their full potential value. SIMC may be unsuccessful in identifying undervalued securities. Value securities have generally performed better than non-value securities during periods of economic recovery (although there is no assurance that they will continue to do so). Value securities may go in and out of favor over time.
Volatility Risk — Although SIMC seeks to construct a portfolio with lower volatility than the broad U.S. large cap equity market, there is no guarantee that SIMC will be successful. As a result, the Fund may not be any less volatile than the market as a whole, and could be more volatile.
Quantitative Investing Risk — Due to the significant role technology plays in quantitative strategies, they carry the risk of unintended or unrecognized issues or flaws in the design, coding, implementation or maintenance of the computer programs or technology used in the development and implementation of the quantitative strategy. Utility interruptions or other key systems outages also can impair the performance of quantitative investment strategies.
Large-Capitalization Companies Risk — Large-capitalization companies may be less able than smaller capitalization companies to adapt to changing market conditions, may be more mature and may be subject to more limited growth potential compared with smaller capitalization companies.
Market Risk — The market value of a security may move up and down, sometimes rapidly and unpredictably. Market risk may affect a single issuer, an industry, a sector or the equity or bond market as a whole. The Funds’ market price may deviate from the value of the Funds’ underlying portfolio holdings, particularly in times of market stress, with the result that investors may pay significantly more or receive significantly less than the underlying value of the Fund shares bought or sold. This can be reflected as a spread between the bid and ask prices for a Fund quoted during the day or a premium or discount in the closing price from the Funds’ NAV.
Risk of Investing in the U.S. — Certain changes in the U.S. economy, such as when the U.S. economy weakens or when its financial markets decline, may have an adverse effect on the securities to which the Funds have exposure.
Issuer Risk — The performance of the Funds depends on the performance of individual securities to which the
Funds have exposure. Changes in the financial condition or credit rating of an issuer of those securities may cause the value of the Funds to decline.
Market Trading Risk — The Funds face numerous market trading risks, including the potential lack of an active market for Fund shares, losses from trading in secondary markets, periods of high volatility and disruptions in the creation/redemption process. Active trading markets for the Funds’ shares may not be developed or maintained by market makers or Authorized Participants (as defined below). Authorized Participants are not obligated to make a market in the Funds’ shares or to submit purchase or redemption orders for Creation Units (as defined below). In times of market stress, market makers or Authorized Participants may step away from their respective roles, which could lead to variances between the market price of the Funds’ shares and its underlying NAV. Trading in shares on an exchange may be halted in certain circumstances. If a trading halt occurs, a shareholder may temporarily be unable to purchase or sell shares of the Funds. Any of these factors could lead the Funds’ shares to trade at a premium or discount to NAV. Thus, you may pay more (or less) than NAV when you buy shares of the Funds in the secondary market, and you may receive less (or more) than NAV when you sell those shares in the secondary market, particularly during times of market stress. SIMC cannot predict whether shares will trade above (premium), below (discount) or at NAV or whether the spread between bid and ask prices will widen. In addition, there can be no assurance that the requirements of the listing exchange necessary to maintain the listing of the Funds will continue to be met.
Convertible and Preferred Securities Risk — Convertible and preferred securities have many of the same characteristics as stocks, including many of the same risks. In addition, convertible bonds may be more sensitive to changes in interest rates than stocks. Convertible bonds may also have credit ratings below investment grade, meaning that they carry a higher risk of failure by the issuer to pay principal and/or interest when due.
Depositary Receipts Risk — Depositary receipts, such as American Depositary Receipts, are certificates evidencing ownership of shares of a foreign issuer that are issued by depositary banks and generally trade on an established market. Depositary receipts are subject to many of the risks associated with investing directly in foreign securities, including, among other things, political, social and economic developments abroad,
SEI Exchange Traded Funds
35
NOTES TO FINANCIAL STATEMENTS (Concluded)
March 31, 2024
currency movements and different legal, regulatory, tax, accounting and audit environment.
Warrants and Rights Risk — Warrants and rights may lack a liquid secondary market for resale. The prices of warrants and rights may fluctuate as a result of speculation or other factors. Warrants and rights can provide a greater potential for profit or loss than an equivalent investment in the underlying security. Prices of warrants and rights do not necessarily move in tandem with the prices of their underlying securities and are highly volatile and speculative investments. If a warrant or right expires without being exercised, the Funds will lose any amount paid for the warrant or right.
Liquidity Risk — In stressed market conditions, the market for a Funds’ shares may become less liquid in response to deteriorating liquidity in the markets for the Funds’ underlying portfolio holdings. This adverse effect on liquidity for the Funds’ shares in turn could lead to differences between the market price of the Funds’ shares and its underlying NAV and/or widening the spread between bid and ask prices.
Management Risk — SIMC may not successfully implement the Funds’ investment strategies and, as a result, the Funds may not meet their investment objective and/or underperform other investment vehicles with similar investment objectives and strategies.
Operational Risk — The Funds are exposed to operational risks arising from a number of factors, including, but not limited to, human error, processing and communication errors, errors of the Funds’ service providers, counterparties or other third-parties, failed or inadequate processes and technology or systems failures.
New Fund Risk — The Funds are new funds, with a limited operating history, which may result in additional risks for investors in the Funds. There can be no assurance that the Funds will grow to an economically viable size, in which case the Funds may cease operations. In such an event, investors may be required to liquidate or transfer their investments at an inopportune time.
Authorized Participant Concentration Risk — Only broker-dealers (referred to as “Authorized Participants” or “APs”) that have executed authorized participation agreements with respect to the Trust may engage in creation or redemption transactions directly with the Funds, and no AP is obligated to engage in creation and/or redemption transactions. To the extent that APs exit the business or are unable to proceed with orders, Fund shares may be more likely to trade at a premium or
discount to NAV, have wider spreads between bid and ask prices or face trading halts or delisting.
Cybersecurity Risk — Failures or breaches of the electronic systems of the Funds, SIMC, the Fund’s distributor, and other service providers, market makers, APs or the issuers of securities in which the Funds invest have the ability to cause disruptions, negatively impact the Funds’ business operations and/or potentially result in financial losses to the Funds and their shareholders.
7. SUBSEQUENT EVENTS
Management has evaluated the need for disclosures and/or adjustments resulting from subsequent events through the date the financial statements were issued. Based on this evaluation, no disclosure and/or adjustments were required to the financial statements as of March 31, 2024.
36
SEI Exchange Traded Funds
REPORT OF INDEPENDENT REGISTERED PUBLIC ACCOUNTING FIRM
To the Shareholders of the Funds and Board of Trustees SEI Exchange Traded Funds:
Opinion on the Financial Statements
We have audited the accompanying statements of assets and liabilities of the SEI Exchange Traded Funds, comprised of SEI Enhanced U.S. Large Cap Quality Factor ETF, SEI Enhanced U.S. Large Cap Momentum Factor ETF, SEI Enhanced U.S. Large Cap Value Factor ETF, and SEI Enhanced Low Volatility U.S. Large Cap ETF (collectively, the Funds), including the schedules of investments, as of March 31, 2024, the related statements of operations for the year then ended, the statements of changes in net assets for the year then ended and period from May 18, 2022 (commencement of operations) to March 31, 2023, and the related notes (collectively, the financial statements) and the financial highlights for the year then ended and period from May 18, 2022 to March 31, 2023. In our opinion, the financial statements and financial highlights present fairly, in all material respects, the financial position of the Funds as of March 31, 2024, the results of their operations for the year then ended, the changes in their net assets for the year then ended and period from May 18, 2022 to March 31, 2023, and the financial highlights for the year then ended and period from May 18, 2022 to March 31, 2023, in conformity with U.S. generally accepted accounting principles.
Basis for Opinion
These financial statements and financial highlights are the responsibility of the Funds' management. Our responsibility is to express an opinion on these financial statements and financial highlights based on our audits. We are a public accounting firm registered with the Public Company Accounting Oversight Board (United States) (PCAOB) and are required to be independent with respect to the Funds in accordance with the U.S. federal securities laws and the applicable rules and regulations of the Securities and Exchange Commission and the PCAOB.
We conducted our audits in accordance with the standards of the PCAOB. Those standards require that we plan and perform the audit to obtain reasonable assurance about whether the financial statements and financial highlights are free of material misstatement, whether due to error or fraud. Our audits included performing procedures to assess the risks of material misstatement of the financial statements and financial highlights, whether due to error or fraud, and performing procedures that respond to those risks. Such procedures included examining, on a test basis, evidence regarding the amounts and disclosures in the financial statements and financial highlights. Such procedures also included confirmation of securities owned as of March 31, 2024, by correspondence with the custodian or by other appropriate auditing procedures. Our audits also included evaluating the accounting principles used and significant estimates made by management, as well as evaluating the overall presentation of the financial statements and financial highlights. We believe that our audits provide a reasonable basis for our opinion.
/s/ KPMG LLP
We have served as the auditor of one or more SEI Funds investment companies since 2005.
Philadelphia, Pennsylvania
May 24, 2024
SEI Exchange Traded Funds
37
(This page intentionally left blank)
TRUSTEES AND OFFICERS OF THE TRUST (Unaudited)
The following chart lists Trustees and Officers as of March 31, 2024.
Set forth below are the names, addresses, ages, position with the Trust, Term of Office and Length of Time Served, the principal occupations for the last five years, number of positions in fund complex overseen by trustee, and other directorships outside the fund complex of each of the persons currently serving as Trustees and Officers of the Trust. The Trust's Statement of Additional Information ("SAI") includes additional information about the Trustees and Officers. The SAI may be obtained without charge by calling 1-800-342-5734.
Name | Position(s) | Term of | Principal Occupation(s) | Number of | Other Directorships |
INTERESTED TRUSTEES | |||||
Robert A. Nesher | Chairman | since 2022 | Currently performs various services on behalf | 98 | President and Director of SEI Structured Credit Fund, LP. Director of SEI Global Master Fund plc, SEI Global Assets Fund plc, SEI Global Investments Fund plc, SEI Investments—Global Funds Services, Limited, SEI Investments Global, Limited, SEI Investments (Europe) Ltd., SEI Multi-Strategy Funds PLC, SEI Global Nominee Ltd and SEI Investments—Unit Trust Management (UK) Limited. President, Director and Chief Executive Officer of SEI Alpha Strategy Portfolios, LP from 2007 to 2013. President, Chief Executive Officer and Trustee of SEI Liquid Asset Trust from 1989 to 2016. President, Chief Executive Officer and Trustee of SEI Insurance Products Trust from 2013 to 2020. Trustee of The KP Funds from 2013 to 2020. Vice Chairman of O'Connor EQUUS (closed-end investment company) from 2014 to 2016. Vice Chairman of Winton Series Trust from 2014 to 2017. Vice Chairman of The Advisors' Inner Circle Fund III and Winton Diversified Opportunities Fund (closed-end investment company) from 2014 to 2018. Vice Chairman of Gallery Trust from 2015 to 2018. Vice Chairman of Schroder Series Trust and Schroder Global Series Trust from 2017 to 2018. Trustee of The Advisors’ Inner Circle Fund, The Advisors’ Inner Circle Fund II, Bishop Street Funds, Frost Family of Funds and Catholic Responsible Investments Funds. President, Chief Executive Officer and Trustee of SEI Asset Allocation Trust, SEI Daily Income Trust, SEI Institutional Managed Trust, SEI Institutional International Trust, SEI Institutional Investments Trust, SEI Tax Exempt Trust, Adviser Managed Trust, New Covenant Funds, SEI Catholic Values Trust and SEI Exchange Traded Funds. |
William M. Doran | Trustee* | since 2022 | Self-employed consultant since 2003. Partner, Morgan, Lewis & Bockius LLP (law firm) from 1976 to 2003). Counsel to the Trust, SEI Investments, SIMC, the Administrator and the Distributor. | 98 | Director of SEI Investments since 1985; Secretary of SEI Investments since 1978. Director of SEI Investments Distribution Co. since 2003. Director of SEI Investments—Global Funds Services, Limited, SEI Investments Global, Limited, SEI Investments (Europe), Limited, SEI Investments (Asia) Limited, SEI Global Nominee Ltd. and SEI Investments—Unit Trust Management (UK) Limited. Trustee of SEI Liquid Asset Trust from 1982 to 2016. Trustee of O'Connor EQUUS (closed-end investment company) from 2014 to 2016. Director of SEI Alpha Strategy Portfolios, LP from 2007 to 2013. Trustee of Winton Series Trust from 2014 to 2017. Trustee of The Advisors’ Inner Circle Fund and The Advisors’ Inner Circle Fund II from 1991 to 2018. Trustee of Bishop Street Funds from 2006 to 2018. Trustee of The KP Funds from 2013 to 2018. Trustee of Winton Diversified Opportunities Fund (closed-end investment company) from 2014 to 2018. Trustee of SEI Insurance Products Trust from 2013 to 2020. Trustee of Schroder Series Trust and Schroder Global Series Trust from 2017 to 2021. Trustee of The Advisors’ Inner Circle Fund III, Gallery Trust, Delaware Wilshire Private Markets Fund, Delaware Wilshire Private Markets Master Fund, Delaware Wilshire Private Markets Tender Fund, SEI Asset Allocation Trust, SEI Daily Income Trust, SEI Institutional Managed Trust, SEI Institutional International Trust, SEI Institutional Investments Trust, SEI Tax Exempt Trust, Adviser Managed Trust, New Covenant Funds, SEI Catholic Values Trust and SEI Exchange Traded Funds. |
* | Messrs. Nesher and Doran are Trustees who may be deemed as “interested” persons of the Trust as that term is defined in the 1940 Act by virtue of their affiliation with SIMC and the Trust’s Distributor. |
1 | Each trustee shall hold office during the lifetime of this Trust until the election and qualification of his or her successor, or until he or she sooner dies, resigns or is removed in accordance with the Trust’s Declaration of Trust. |
2 | The Fund Complex includes the following Trusts: SEI Asset Allocation Trust, SEI Daily Income Trust, SEI Institutional Investments Trust, Adviser Managed Trust, SEI Institutional International Trust, SEI Institutional Managed Trust, SEI Tax Exempt Trust, SEI Catholic Values Trust, New Covenant Funds and SEI Exchange Traded Funds. |
SEI Exchange Traded Funds
39
TRUSTEES AND OFFICERS OF THE TRUST (Unaudited) (Concluded)
Name | Position(s) | Term of | Principal Occupation(s) | Number of | Other Directorships |
TRUSTEES | |||||
Nina Lesavoy | Trustee | since 2022 | Founder and Managing Director, Avec Capital (strategic fundraising firm) since 2008. Managing Director, Cue Capital (strategic fundraising firm) from March 2002-March 2008. | 98 | Director of SEI Alpha Strategy Portfolios, LP from 2007 to 2013. Trustee of SEI Liquid Asset Trust from 2003 to 2016. Trustee of SEI Insurance Products Trust from 2013 to 2020. Trustee/Director of SEI Structured Credit Fund, L.P., SEI Asset Allocation Trust, SEI Daily Income Trust, SEI Institutional Managed Trust, SEI Institutional International Trust, SEI Institutional Investments Trust, SEI Tax Exempt Trust, New Covenant Funds, Adviser Managed Trust, SEI Catholic Values Trust and SEI Exchange Traded Funds. |
James M. Williams | Trustee | since 2022 | Vice President and Chief Investment Officer, J. Paul Getty Trust, Non-Profit Foundation for Visual Arts, since December 2002. President, Harbor Capital Advisors and Harbor Mutual Funds, 2000-2002. Manager, Pension Asset Management, Ford Motor Company, 1997-1999. | 98 | Director of SEI Alpha Strategy Portfolios, LP from 2007 to 2013. Trustee of SEI Liquid Asset Trust from 2004 to 2016. Trustee of SEI Insurance Products Trust from 2013 to 2020. Trustee/Director of Ariel Mutual Funds, SEI Structured Credit Fund, LP, SEI Asset Allocation Trust, SEI Daily Income Trust, SEI Institutional Managed Trust, SEI Institutional International Trust, SEI Institutional Investments Trust, SEI Tax Exempt Trust, New Covenant Funds, Adviser Managed Trust, SEI Catholic Values Trust and SEI Exchange Traded Funds. |
Susan C. Cote | Trustee | since 2022 | Retired since July 2015. Treasurer and Chair of Finance, Investment and Audit Committee of the New York Women's Foundation from 2012 to 2017. Member of the Ernst & Young LLP Retirement Investment Committee, 2009-2015. Global Asset Management Assurance Leader, Ernst & Young LLP from 2006-2015. Partner, Ernst & Young LLP from 1997-2015. Americas Director of Asset Management, Ernst & Young LLP from 2006-2013. Prudential, 1983-1997. | 98 | Trustee of SEI Insurance Products Trust from 2015 to 2020. Trustee/Director of SEI Structured Credit Fund, LP, SEI Tax Exempt Trust, SEI Daily Income Trust, SEI Institutional International Trust, SEI Institutional Managed Trust, SEI Asset Allocation Trust, SEI Institutional Investments Trust, New Covenant Funds, Adviser Managed Trust, SEI Catholic Values Trust and SEI Exchange Traded Funds. |
James B. Taylor | Trustee | since 2022 | Retired since December 2017. Chief | 98 | Trustee of SEI Insurance Products Trust from 2018 to 2020. Trustee of SEI Daily Income Trust, SEI Tax Exempt Trust, SEI Institutional Managed Trust, SEI Institutional International Trust, SEI Institutional Investments Trust, SEI Asset Allocation Trust, Adviser Managed Trust, New Covenant Funds, SEI Catholic Values Trust and SEI Exchange Traded Funds. |
Christine Reynolds | Trustee | since 2022 | Retired since December 2016. Executive Vice President, Fidelity Investments from 2014-2016. President, Fidelity Pricing and Cash Management Services and Chief Financial Officer of Fidelity Funds from 2008-2014. Chief Operating Officer, Fidelity Pricing and Cash Management Services from 2007-2008. President and Treasurer, Fidelity Funds from 2004-2007. Anti-Money Laundering Officer, Fidelity Funds in 2004. Executive Vice President, Fidelity Funds from 2002-2004. Audit Partner, PricewaterhouseCoopers from 1992-2002. | 98 | Trustee of SEI Insurance Products Trust from 2019 to 2020. Trustee of SEI Daily Income Trust, SEI Tax Exempt Trust, SEI Institutional Managed Trust, SEI Institutional International Trust, SEI Institutional Investments Trust, SEI Asset Allocation Trust, Adviser Managed Trust, New Covenant Funds, SEI Catholic Values Trust and SEI Exchange Traded Funds. |
Thomas Melendez | Trustee | since 2022 | Retired since 2019. Investment Officer and Institutional Equity Portfolio Manager at MFS Investment Management from 2002 to 2019. Director of Emerging Markets Group, General Manager of Operations in Argentina and Portfolio Manager for Latin America at Schroders Investment Management from 1994 to 2002. | 92 | Trustee of Boston Children’s Hospital, The Partnership Inc. and Brae Burn Country Club (non-profit organizations). Trustee of SEI Daily Income Trust, SEI Tax Exempt Trust, SEI Institutional Managed Trust, SEI Institutional International Trust, SEI Institutional Investments Trust, SEI Asset Allocation Trust, SEI Exchange Traded Funds and Adviser Managed Trust. Independent Consultant of New Covenant Funds and SEI Catholic Values Trust. |
1 | Each trustee shall hold office during the lifetime of this Trust until the election and qualification of his or her successor, or until he or she sooner dies, resigns or is removed in accordance with the Trust’s Declaration of Trust. |
2 | The Fund Complex includes the following Trusts: SEI Asset Allocation Trust, SEI Daily Income Trust, SEI Institutional Investments Trust, Adviser Managed Trust, SEI Institutional International Trust, SEI Institutional Managed Trust, SEI Tax Exempt Trust, SEI Catholic Values Trust, New Covenant Funds and SEI Exchange Traded Funds. |
40
SEI Exchange Traded Funds
Name | Position(s) Held with Trusts | Term of Office and Length of Time Served1 | Principal Occupation(s) | Number of Portfolios in Fund Complex Overseen by Trustee | Other Directorships |
OFFICERS | |||||
Robert A. Nesher | President | since 2022 | Currently performs various services on behalf of SEI for which Mr. Nesher is compensated. | N/A | N/A |
Glenn R. Kurdziel | Controller and Chief Financial Officer | since 2023 | Controller and Chief Financial Officer of SEI Daily Income Trust, SEI Tax Exempt Trust, SEI Institutional Managed Trust, SEI Institutional International Trust, SEI Asset Allocation Trust, SEI Institutional Investments Trust, Adviser Managed Trust, New Covenant Funds, SEI Catholic Values Trust and SEI Exchange Traded Funds since August 2023. Assistant Controller of SEI Daily Income Trust, SEI Tax Exempt Trust, SEI Institutional Managed Trust, SEI Institutional International Trust, SEI Asset Allocation Trust, SEI Institutional Investments Trust, Adviser Managed Trust, New Covenant Funds and SEI Catholic Values Trust from 2017 to 2023. Assistant Controller of SEI Exchange Traded Funds from 2022 to 2023. Senior Manager, Funds Accounting, SEI Investments Global Funds Services from 2005-2023. | N/A | N/A |
Stephen Panner | Chief Compliance Officer | since 2022 | Chief Compliance Officer of SEI Asset Allocation Trust, SEI Daily Income Trust, SEI Institutional Investments Trust, SEI Institutional International Trust, SEI Institutional Managed Trust, SEI Tax Exempt Trust, Adviser Managed Trust, New Covenant Funds, SEI Catholic Values Trust, SEI Exchange Traded Funds, SEI Structured Credit Fund, L.P., The Advisors' Inner Circle Fund, The Advisors' Inner Circle Fund II, The Advisors' Inner Circle Fund III, Bishop Street Funds, Frost Family of Funds, Gallery Trust, Delaware Wilshire Private Markets Fund, Delaware Wilshire Private Markets Master Fund, Delaware Wilshire Private Markets Tender Fund and Catholic Responsible Investments Funds since September 2022. Fund Compliance Officer of SEI Investments Company from February 2011 to September 2022. Fund Accounting Director and CFO and Controller for the SEI Funds from July 2005 to February 2011. | N/A | N/A |
Timothy D. Barto | Vice | since 2022 | Vice President and Secretary of SEI Institutional Transfer Agent, Inc. since 2009. General Counsel and Secretary of SIMC since 2004. Vice President of SIMC and the Administrator since 1999. Vice President and Assistant Secretary of SEI since 2001. | N/A | N/A |
David F. McCann | Vice President and Assistant Secretary | since 2022 | General Counsel and Secretary of SEI Institutional Transfer Agent, Inc. since 2020. Vice President and Assistant Secretary of SEI Institutional Transfer Agent, Inc. from 2009-2020. Vice President and Assistant Secretary of SIMC since 2008. Attorney, Drinker Biddle & Reath, LLP (law firm), May 2005 - October 2008. | N/A | N/A |
Katherine Mason | Vice President and Assistant Secretary | since 2022 | Consulting Attorney, Hirtle, Callaghan & Co. from October 2021 – June 2022. Attorney, Stradley Ronon Stevens & Young from September 2007 – July 2012. | N/A | N/A |
Stephen G. MacRae | Vice | since 2022 | Director of Global Investment Product Management since January 2004. | N/A | N/A |
Bridget Sudall | Anti-Money | since 2024 | Anti-Money Laundering Compliance Officer and Privacy Officer. Senior Associate and AML Officer, Morgan Stanley Alternative Investment Partners, April 2011-March 2015, Investor Services Team Lead, Morgan Stanley Alternative Investment Partners, July 2007-April 2011. | N/A | N/A |
1 | Each trustee shall hold office during the lifetime of this Trust until the election and qualification of his or her successor, or until he or she sooner dies, resigns or is removed in accordance with the Trust’s Declaration of Trust. |
2 | The Fund Complex includes the following Trusts: SEI Asset Allocation Trust, SEI Daily Income Trust, SEI Institutional Investments Trust, Adviser Managed Trust, SEI Institutional International Trust, SEI Institutional Managed Trust, SEI Tax Exempt Trust, SEI Catholic Values Trust, New Covenant Funds and SEI Exchange Traded Funds. |
SEI Exchange Traded Funds
41
DISCLOSURE OF FUND EXPENSES (Unaudited)
March 31, 2024
All exchange traded funds (“ETFs”) have operating expenses. As a shareholder of an ETF, your investment is affected by these ongoing costs, which include (among others) costs for, ETF management, portfolio management, administrative services, and shareholder reports like this one. It is important for you to understand the impact of these costs on your investment returns. In addition, a shareholder is responsible for brokerage fees as a result of their investment in an ETF.
Operating expenses such as these are deducted from the ETF’s gross income and directly reduce your final investment return. These expenses are expressed as a percentage of the ETF’s average net assets; this percentage is known as the ETF’s expense ratio.
The following examples use the expense ratio and are intended to help you understand the ongoing costs (in dollars) of investing in your ETF and to compare these costs with those of other mutual funds. The examples are based on an investment of $1,000 made at the beginning of the period shown and held for the entire period October 1, 2023 to March 31, 2024.
The table on this page illustrates your ETF’s costs in two ways:
● Actual ETF return. This section helps you to estimate the actual expenses after fee waivers that your ETF incurred over the period. The “Expenses Paid During Period” column shows the actual dollar expense cost incurred by a $1,000 investment in the ETF, and the “Ending Account Value” number is derived from deducting that expense cost from the ETF’s gross investment return.
You can use this information, together with the actual amount you invested in the ETF, to estimate the expenses you paid over that period. Simply divide your actual account value by $1,000 to arrive at a ratio (for example, an $8,600 account value divided by $1,000 = 8.6), then multiply that ratio by the number shown for your ETF under “Expenses Paid During Period”.
● Hypothetical 5% return. This section helps you compare your ETF’s costs with those of other mutual funds. It assumes that the ETF had an annual 5% return before expenses during the period, but that the expense ratio (Column 3) for the period is unchanged. This example is useful in making comparisons because the Securities and Exchange Commission requires all mutual funds to make this 5% calculation. You can assess your ETF’s comparative cost by comparing the hypothetical result for your ETF in the “Expense Paid During Period” column with those that appear in the same charts in the shareholder reports for other funds.
NOTE: Because the return is set at 5% for comparison purposes — NOT your ETF’s actual return — the account values shown may not apply to your specific investment.
Beginning | Ending | Annualized | Expenses | |||||||||||||
SEI Enhanced U.S. Large Cap Quality Factor ETF | ||||||||||||||||
Actual Fund Return | ||||||||||||||||
| $ | 1,000.00 | $ | 1,170.20 | 0.15 | % | $ | 0.81 | |||||||||
Hypothetical 5% Return | ||||||||||||||||
| $ | 1,000.00 | $ | 1,024.25 | 0.15 | % | $ | 0.76 | |||||||||
SEI Enhanced U.S. Large Cap Momentum Factor ETF | ||||||||||||||||
Actual Fund Return | ||||||||||||||||
| $ | 1,000.00 | $ | 1,279.10 | 0.15 | % | $ | 0.85 | |||||||||
Hypothetical 5% Return | ||||||||||||||||
| $ | 1,000.00 | $ | 1,024.25 | 0.15 | % | $ | 0.76 | |||||||||
Beginning | Ending | Annualized | Expenses | |||||||||||||
SEI Enhanced U.S. Large Cap Value Factor ETF | ||||||||||||||||
Actual Fund Return | ||||||||||||||||
| $ | 1,000.00 | $ | 1,234.70 | 0.15 | % | $ | 0.84 | |||||||||
Hypothetical 5% Return | ||||||||||||||||
| $ | 1,000.00 | $ | 1,024.25 | 0.15 | % | $ | 0.76 | |||||||||
SEI Enhanced Low Volatility U.S. Large Cap ETF | ||||||||||||||||
Actual Fund Return | ||||||||||||||||
| $ | 1,000.00 | $ | 1,143.70 | 0.15 | % | $ | 0.80 | |||||||||
Hypothetical 5% Return | ||||||||||||||||
| $ | 1,000.00 | $ | 1,024.25 | 0.15 | % | $ | 0.76 | |||||||||
* Expenses are equal to the Fund’s annualized expense ratio multiplied by the average account value over the period, multiplied by 183/366 (to reflect a full one-half year period). |
42
SEI Exchange Traded Funds
LIQUIDITY RISK MANAGEMENT PROGRAM (Unaudited)
March 31, 2024
Pursuant to Rule 22e-4 under the 1940 Act, the Trust, on behalf of the Funds, has adopted a liquidity risk management program (the “Program”) to govern the Trust’s approach to managing liquidity risk. The Program is overseen by the SIMC Liquidity Risk Oversight Committee, and the Program’s principal objectives include assessing, managing and periodically reviewing each Fund’s liquidity risk, based on factors specific to the circumstances of the Fund.
At a meeting of the Board held on January 31, 2024, the Trustees received a report from the SIMC Liquidity Risk Oversight Committee addressing the operations of the Program and assessing its adequacy and effectiveness of implementation. The SIMC Liquidity Risk Oversight Committee determined, and reported to the Board, that the Program remains reasonably designed to assess and manage each Fund’s liquidity risk and that the Program adequately and effectively managed each Fund’s liquidity risk during the 2023 calendar year. The SIMC Liquidity Risk Oversight Committee also reported that with respect to the Trust there were no reportable liquidity events during the period.
There can be no assurance that the Program will achieve its objectives in the future. Please refer to the prospectus for more information regarding a Fund’s exposure to liquidity risk and other principal risks to which an investment in the Funds may be subject.
SEI Exchange Traded Funds
43
BOARD OF TRUSTEES’ CONSIDERATIONS IN APPROVING THE ADVISORY AGREEMENT (Unaudited)
SEI Exchange Traded Funds (the “Trust”) and SEI Investments Management Corporation (“SIMC”) have entered into an investment advisory agreement (the “Advisory Agreement”), pursuant to which SIMC provides investment advisory services to the series of the Trust (the “Funds”). The management and affairs of the Trust are supervised by the Board of Trustees (each member, a “Trustee” and, collectively, the “Trustees” or the “Board”).
The Investment Company Act of 1940, as amended (the “1940 Act”), requires that the initial approval of an advisory agreement be specifically approved by the vote of a majority of the outstanding shareholders of the Funds and the vote of a majority of the Trustees who are not parties to the Advisory Agreement or “interested persons” of any party (the “Independent Trustees”) cast in person (or otherwise, as consistent with applicable laws, regulations and related guidance and relief) at a meeting called for such purpose. In addition, the 1940 Act requires that the continuation or renewal of the Advisory Agreement be approved at least annually (after an initial period of up to two years), which also requires the vote of a majority of the Board, including a majority of the Independent Trustees. In connection with their consideration of the initial approval and such renewals, the Funds’ Trustees must request and evaluate, and SIMC is required to furnish, such information as may be reasonably necessary to evaluate the terms of the Advisory Agreement. In addition, the Securities and Exchange Commission takes the position that, as part of their fiduciary duties with respect to a mutual fund’s fees, mutual fund boards are required to evaluate the material factors applicable to a decision to renew the Advisory Agreement.
Consistent with these responsibilities, the Board calls and holds meetings each year to consider whether to approve the existing Advisory Agreement between the Trust and SIMC with respect to the Funds of the Trust. In preparation for these meetings, the Board requests and reviews a wide variety of materials provided by SIMC, including information relating to its affiliates, personnel and operations and the services provided pursuant to the Advisory Agreement. The Board also receives data from third parties. This information is provided in addition to the detailed information about the Funds that the Board reviews during the course of each year, including information that relates to Fund operations and Fund performance. The Trustees also receive a memorandum from counsel regarding the responsibilities of Trustees in connection with their consideration of whether to renew the Trust’s Advisory Agreement. Finally, the Independent Trustees receive advice from independent counsel to the Independent Trustees, meet in executive sessions outside the presence of Fund management and participate in question and answer sessions with representatives of SIMC.
Specifically, during the course of the Trust’s fiscal year, the Board requested and received written materials from SIMC regarding: (i) the quality of SIMC’s investment management and other services; (ii) SIMC’s investment management personnel; (iii) SIMC’s operations and financial condition; (iv) SIMC’s brokerage practices and investment strategies; (v) the level of the advisory fees that SIMC charges the Funds compared with fees charged to comparable accounts; (vi) the advisory fees charged by SIMC and the Funds’ overall fees and operating expenses compared with peer groups of mutual funds prepared by Broadridge, an independent provider of investment company data; (vii) the level of SIMC’s profitability from its Fund-related operations; (viii) SIMC’s compliance program, including a description of material compliance matters and material compliance violations; (ix) SIMC’s potential economies of scale; (x) SIMC’s policies on and compliance procedures for personal securities transactions; (xi) SIMC’s expertise and resources in domestic and/or international financial markets; and (xii) the Funds’ performance over various periods of time compared with peer groups of mutual funds prepared by Broadridge and the Funds’ benchmark indexes.
At the December 4–6, 2023 meeting of the Board, the Trustees, including a majority of the Independent Trustees, approved a brief extension of the Advisory Agreement to accommodate a revised Spring meeting schedule. Typically, the Trustees renew the Advisory Agreement at the first quarterly in-person meeting of the calendar year in March. Agreements regularly renewed at the March meeting expire on April 1 of the following year. Because the first quarterly in-person meeting of the Board in calendar year 2024 was held on April 2-4, the Advisory Agreement would have expired prior to the meeting, without the extension. Accordingly, the Board voted in-person at the December 4-6, 2023 meeting to extend the Advisory Agreement until the April 2-4, 2024 meeting. In evaluating whether to approve the extension of the Advisory Agreement, the Board considered the information made available to it throughout the course of the year by representatives of the SEI investment and compliance teams. At the April 2-4, 2024 meeting, the Board evaluated the Advisory Agreement in accordance with the renewal process that it typically applies during the annual contract renewal each Spring. Although outside the scope of the period covered by this report, the Board’s renewal of the Advisory Agreement at the April 2-4, 2024 meeting of the Board is discussed herein, consistent with prior shareholder reports of the Funds. The Board’s approval was based on its
44
SEI Exchange Traded Funds
consideration and evaluation of the factors described above, as discussed at the meeting and at prior meetings, such as the December 4-6, 2023 meeting. The following discusses some, but not all, of the factors that were considered by the Board in connection with its assessment of the Advisory Agreement.
Nature, Extent and Quality of Services. The Board considered the nature, extent and quality of the services provided by SIMC to the Funds and the resources of SIMC and its affiliates dedicated to the Funds. In this regard, the Trustees evaluated, among other things, SIMC’s personnel, experience, track record and compliance program. Following evaluation, the Board concluded that, within the context of its full deliberations, the nature, extent and quality of services provided by SIMC to the Funds and the resources of SIMC and its affiliates dedicated to the Funds were sufficient to support the renewal of the Advisory Agreement.
Performance. In determining whether to renew the Advisory Agreement, the Trustees considered the Funds’ performance relative to their peer groups and appropriate indexes/benchmarks. The Trustees reviewed performance information for each Fund, noting that they receive performance reports that permit them to monitor each Fund’s performance at board meetings throughout the year. As part of this review, the Trustees considered the composition of each peer group and selection of criteria. In assessing Fund performance, the Trustees considered the Broadridge Report. The Broadridge Report included metrics on net total return for the Funds and a universe of comparable funds. Based on the materials considered and discussed at the meeting, the Trustees found Fund performance satisfactory, or, where performance was materially below the benchmark and/or peer group, the Trustees were satisfied with the reasons provided to explain such performance. Following evaluation, the Board concluded that, within the context of its full deliberations, the performance of the Funds was sufficient to support the renewal of the Advisory Agreement.
Fees. With respect to the Funds’ expenses under the Advisory Agreement, the Trustees reviewed the annual management fee of 0.15% for each Fund, noting that SIMC, in addition to providing advisory services to the Funds, pays all of the operating expenses of the Funds, except the management fees, interest expenses, dividend and other expenses on securities sold short, taxes, expenses incurred with respect to the acquisition and disposition of portfolio securities and the execution of portfolio transactions (including brokerage commissions), acquired fund fees and expenses, distribution fees or expenses paid by the Trust under any distribution plan adopted pursuant to Rule 12b-1 under the 1940 Act (if any), fees and expenses of the Board, litigation expenses and any extraordinary expenses. Based on discussion at the meeting, the Trustees determined that the fees and expenses were below the average for the respective comparison peer group. Following evaluation, the Board concluded that, within the context of its full deliberations, the expenses of the Funds are reasonable and supported the renewal of the Advisory Agreement.
Profitability. With regard to profitability, the Trustees considered the compensation flowing to SIMC and its affiliates, directly or indirectly. The Trustees considered whether the levels of compensation and profitability were reasonable. Based on this evaluation, the Board concluded that, within the context of its full deliberations, the profitability of SIMC is reasonable and supported the renewal of the Advisory Agreement.
Economies of Scale. With respect to the Advisory Agreement, the Trustees considered whether any economies of scale were being realized by SIMC and its affiliates and, if so, whether the benefits of such economies of scale were passed along to the Funds’ shareholders through a graduated investment advisory fee schedule or other means, including any fee waivers by SIMC and its affiliates. The Trustees recognized that economies of scale are difficult to identify and quantify and are rarely identifiable on a fund-by-fund basis. Based on this evaluation, the Board determined that the fees were reasonable in light of the information that was provided by SIMC with respect to economies of scale.
Based on the Trustees’ deliberation and their evaluation of the information described above, the Board, including all of the Independent Trustees, with the assistance of Fund counsel and Independent Trustees’ counsel, unanimously approved the renewal of the Advisory Agreement and concluded that the compensation under the Advisory Agreement is fair and reasonable in light of such services and expenses and such other matters as the Trustees considered to be relevant in the exercise of their reasonable judgment. In the course of its deliberations, the Board did not identify any particular factor (or conclusion with respect thereto) or single piece of information that was all-important, controlling or determinative of its decision, but considered all of the factors together, and each Trustee may have attributed different weights to the various factors (and conclusions with respect thereto) and information.
SEI Exchange Traded Funds
45
NOTICE TO SHAREHOLDERS (Unaudited)
For shareholders who do not have a March 31, 2024, taxable year end, this notice is for informational purposes only. For shareholders with a March 31, 2024, taxable year end, please consult your tax adviser as to the pertinence of this notice.
For the fiscal year ended March 31, 2024, the Funds are designating long term and qualifying dividend income with regard to distributions paid during the year as follows:
| (A) | (B) | (C) | (D) | (E) | (F) | (G) | (H) | (I) | (J) |
SEI Enhanced U.S. Large Cap Quality Factor ETF | 0.00% | 0.00% | 100.00% | 100.00% | 100.00% | 49.76% | 0.00% | 0.00% | 0.00% | 0.00% |
SEI Enhanced U.S. Large Cap Momentum Factor ETF | 0.00% | 0.00% | 100.00% | 100.00% | 96.87% | 55.06% | 0.00% | 0.00% | 0.00% | 4.03% |
SEI Enhanced U.S. Large Cap Value Factor ETF | 0.00% | 0.00% | 100.00% | 100.00% | 94.72% | 48.07% | 0.00% | 0.00% | 0.00% | 1.66% |
SEI Enhanced Low Volatility U.S. Large Cap ETF | 0.00% | 0.00% | 100.00% | 100.00% | 97.30% | 71.40% | 0.00% | 0.00% | 0.00% | 0.00% |
(1) “Dividends Received Deduction” represent dividends which qualify for the corporate dividends received deduction.
(2) “Qualifying Dividend Income” represent qualifying dividends as created by the Jobs and Growth Tax Relief Reconciliation Act of 2003. It is the intention of the Fund to designate the max amount permitted by law.
(3) “U.S. Government Interest” represent the amount of interest that was derived from direct U.S. Government obligations and distributed during the fiscal year. Generally, interest from direct U.S. Government obligations is exempt from state income tax. However, for shareholders who are residents of California, Connecticut or New York, the statutory threshold requirements were not satisfied to permit exemption of these amounts from state income.
(4) The percentage in this column represents the amount of “Interest Related Dividend” is reflected as a percentage of ordinary income distribution. Interest related dividends is exempted from U.S. withholding tax when paid to foreign investors.
(5) The percentage of this column represents the amount of “Short Term Capital Gain Dividend” is reflected as a percentage of short term capital gain distribution that is exempted from U.S. withholding tax when paid to foreign investors.
(6) The percentage of this column represents the amount of ordinary dividend income that qualifies for 20% Business Income Deduction.
Items (A), (B), (C) and (D) are based on the percentage of each fund’s total distribution.
Items (E), (F) and (J) are based on the percentage of “Ordinary Income Distributions.”
Item (G) is based on the percentage of gross income of each Fund.
Item (H) is based on the percentage of net investment income distributions.
Item (I) is based on the percentage of short-term capital gains distributions.
Please consult your tax adviser for proper treatment of this information. This notification should be kept with your permanent tax records.
46
SEI Exchange Traded Funds
(This page intentionally left blank)
(This page intentionally left blank)
SEI Exchange Traded Funds / Annual Report / March 31, 2024
Trustees
Robert A. Nesher, Chairman
William M. Doran
Nina Lesavoy
James M. Williams
Susan C. Cote
James B. Taylor
Christine Reynolds
Thomas Melendez
Officers
Robert A. Nesher
President and Chief Executive Officer
Glenn R. Kurdziel
Controller and Chief Financial Officer
Stephen Panner
Chief Compliance Officer
Timothy D. Barto
Vice President, Secretary
David F. McCann
Vice President, Assistant Secretary
Katherine Mason
Vice President, Assistant Secretary
Stephen G. MacRae
Vice President
Bridget Sudall
Anti-Money Laundering Compliance Officer
Privacy Officer
Investment Adviser
SEI Investments Management Corporation
Administrator
SEI Investments Global Funds Services
Distributor
SEI Investments Distribution Co.
Legal Counsel
Morgan, Lewis & Bockius LLP
Independent Registered Public Accounting Firm
KPMG LLP
This report and the financial statements contained herein are submitted for the general information of the shareholders of the Trust and must be preceded or accompanied by a current prospectus. Shares of the Funds are not deposits or obligations of, or guaranteed or endorsed by, any bank. The shares are not federally insured by the Federal Deposit Insurance Corporation (FDIC), the Federal Reserve Board, or any other government agency. Investment in the shares involves risk, including the possible loss of principal.
For more information call
1 800 DIAL SEI
(1 800 342 5734)

SEI-ETF (3/24)
Item 2. Code of Ethics.
The Registrant has adopted a code of ethics that applies to the Registrant’s principal executive officer, principal financial officer, principal accounting officer or controller, or persons performing similar functions.
Item 3. Audit Committee Financial Expert.
(a) (1) The Registrant’s Board of Trustees has determined that the Registrant has one audit committee financial expert serving on the audit committee.
(a) (2) The audit committee financial expert is Susan C. Cote. Ms. Cote is independent as defined in Form N-CSR Item 3 (a) (2).
Item 4. Principal Accountant Fees and Services.
Fees billed by KPMG LLP (“KPMG”) related to the Registrant.
KPMG billed the Registrant aggregate fees for services rendered to the Registrant for the fiscal years 2024 and 2023 as follows:
| Fiscal Year 2024 | Fiscal Year 2023 | ||||||
| All fees and services to the Registrant that were pre-approved | All fees and services to service affiliates that were pre-approved | All other fees and services to service affiliates that did not require pre-approval | All fees and services to the Registrant that were pre-approved | All fees and services to service affiliates that were pre-approved | All other fees and services to service affiliates that did not require pre-approval | ||
| (a) | Audit Fees(1) | $60,000 | N/A | $0 | $60,000 | N/A | $0 |
| (b) | Audit-Related Fees | $0 | $0 | $0 | $0 | $0 | $0 |
| (c) | Tax Fees (2) | $0 | $0 | $0 | $0 | $0 | $0 |
| (d) | All Other Fees(3) | $0 | $315,759 | $0 | $0 | $287,250 | $0 |
Notes:
| (1) | Audit fees include amounts related to the audit of the Registrant’s annual financial statements and services normally provided by the accountant in connection with statutory and regulatory filings. |
| (2) | Tax fees include amounts related to tax compliance and consulting services. |
| (3) | See Item 4(g) for a description of the services comprising the fees disclosed under this category. |
(e)(1) The Registrant’s Audit Committee has adopted and the Board of Trustees has ratified an Audit and Non-Audit Services Pre-Approval Policy (the “Policy”), which sets forth the procedures and the conditions pursuant to which services proposed to be performed by the independent auditor of the Registrant may be pre-approved. In any instance where services require pre-approval, the Audit Committee will consider whether such services are consistent with SEC’s rules on auditor independence and whether the provision of such services would compromise the auditor’s independence.
The Policy provides that all requests or applications for proposed services to be provided by the independent auditor must be submitted to the Registrant’s Chief Financial Officer (“CFO”) and must include a detailed description of the services proposed to be rendered. The CFO will determine whether such services: (1) require specific pre-approval; (2) are included within the list of services that have received the general pre-approval of the Audit Committee pursuant to the Policy; or (3) have been previously pre-approved in connection with the independent auditor’s annual engagement letter for the applicable year or otherwise.
Requests or applications to provide services that require specific pre-approval by the Audit Committee will be submitted to the Audit Committee by the CFO. The Audit Committee has delegated specific pre-approval authority to either the Audit Committee Chair or financial experts, provided that the estimated fee for any such proposed pre-approved service does not exceed $100,000 and any pre-approval decisions are reported to the Audit Committee at its next regularly scheduled meeting.
Services that have received the general pre-approval of the Audit Committee are identified and described in the Policy. In addition, the Policy sets forth a maximum fee per engagement with respect to each identified service that has received general pre-approval. The Audit Committee will annually review and pre-approve the services that may be provided by the independent auditor during the following twelve months without obtaining specific pre-approval from the Audit Committee.
The Audit Committee will be informed by the CFO on a quarterly basis of all services rendered by the independent auditor.
All services to be provided by the independent auditor shall be provided pursuant to a signed written engagement letter with the Registrant, the investment advisor or applicable control affiliate (except that matters as to which an engagement letter would be impractical because of timing issues or because the matter is small may not be the subject of an engagement letter) that sets forth both the services to be provided by the independent auditor and the total fees (or the manner of their determination) to be paid to the independent auditor for those services.
In addition, the Audit Committee has determined to take additional measures on an annual basis to meet its responsibility to oversee the work of the independent auditor and to assure the auditor's independence from the Registrant, such as reviewing a formal written statement from the independent auditor delineating all relationships between the independent auditor and the Registrant, and discussing with the independent auditor its methods and procedures for ensuring independence.
(e)(2) Percentage of fees billed applicable to non-audit services pursuant to waiver of pre-approval requirement were as follows:
| Fiscal 2024 | Fiscal 2023 | |
Audit-Related Fees | 0% | 0% |
| Tax Fees | 0% | 0% |
All Other Fees | 0% | 0% |
(f) Not Applicable.
(g)(1) The aggregate non-audit fees and services billed by KPMG for the fiscal years 2024 and 2023 were $315,789 and $287,250, respectively. Non-audit fees consist of a SSAE No. 16 review of fund accounting and administration operations.
(h) During the past fiscal year, the Registrant’s principal accountant provided certain non-audit services to the Registrant’s investment adviser or to entities controlling, controlled by, or under common control with the Registrant’s investment adviser that provide ongoing services to the Registrant that were not subject to pre-approval pursuant to paragraph (c)(7)(ii) of Rule 2-01 of Regulation S-X. The Audit Committee of the Registrant’s Board of Trustees reviewed and considered these non-audit services provided by the Registrant’s principal accountant to the Registrant’s affiliates, including whether the provision of these non-audit services is compatible with maintaining the principal accountant’s independence.
(i) Not Applicable.
(j) Not Applicable.
Item 5. Audit Committee of Listed Registrants.
Not applicable.
Item 6. Schedule of Investments.
Included in Item 1.
Item 7. Reserved.
Item 8. Reserved.
Item 9. Reserved.
Item 10. Reserved.
Item 11. Reserved.
Item 12. Disclosure of Proxy Voting Policies and Procedures for Closed-End Management Investment Companies.
Not applicable.
Item 13. Portfolio Managers of Closed-End Management Investment Companies.
Not applicable.
Item 14. Purchases of Equity Securities by Closed-End Management Investment Company and Affiliated Purchasers.
Not applicable.
Item 15. Submission of Matters to a Vote of Security Holders.
There have been no material changes to the procedures by which shareholders may recommend nominees to the Registrant’s Board of Trustees (the “Board”). The Registrant has a standing Governance Committee (the "Committee") currently consisting of the Independent Trustees. The Committee is responsible for evaluating and recommending nominees for election to the Board. Pursuant to the Committee's Charter, adopted on June 18, 2004, as amended, the Committee will review all shareholder recommendations for nominations to fill vacancies on the Board if such recommendations are submitted in writing and addressed to the Committee at the Registrant’s office.
Item 16. Controls and Procedures.
(a) The Registrant’s principal executive and principal financial officers, or persons performing similar functions, have concluded that the Registrant’s disclosure controls and procedures (as defined in Rule 30a-3(c) under the Investment Company Act of 1940 (the “1940 Act”)) are effective, based on the evaluation of these controls and procedures required by Rule 30a-3(b) under the 1940 Act and Rules 13a-15(b) or 15d-15(b) under the Securities Exchange Act of 1934 as of a date within 90 days of the filing date of this report.
(b) There were no changes in the Registrant’s internal control over financial reporting (as defined in Rule 30a-3(d) under the 1940 Act) that occurred during the period covered by this report that have materially affected, or are reasonably likely to materially affect, the Registrant’s internal control over financial reporting.
Item 17. Disclosure of Securities Lending Activities for Closed-End Management Investment Companies.
Not applicable.
Item 18. Recovery of Erroneously Awarded Compensation.
(a) Not applicable.
(b) Not applicable.
Item 19. Exhibits.
(a)(1) Code of Ethics attached hereto.
(a)(2) Not applicable.
SIGNATURES
Pursuant to the requirements of the Securities Exchange Act of 1934 and the Investment Company Act of 1940, the Registrant has duly caused this report to be signed on its behalf by the undersigned, thereunto duly authorized.
| SEI Exchange Traded Funds | ||
| By | /s/ Robert A. Nesher | |
| Robert A. Nesher | ||
| President and Chief Executive Officer |
Date: June 7, 2024
Pursuant to the requirements of the Securities Exchange Act of 1934 and the Investment Company Act of 1940, this report has been signed below by the following persons on behalf of the Registrant and in the capacities and on the dates indicated.
| By | /s/ Robert A. Nesher | |
| Robert A. Nesher | ||
| President and Chief Executive Officer |
Date: June 7, 2024
| By | /s/ Glenn Kurdziel | |
| Glenn Kurdziel | ||
| Controller and Chief Financial Officer |
Date: June 7, 2024