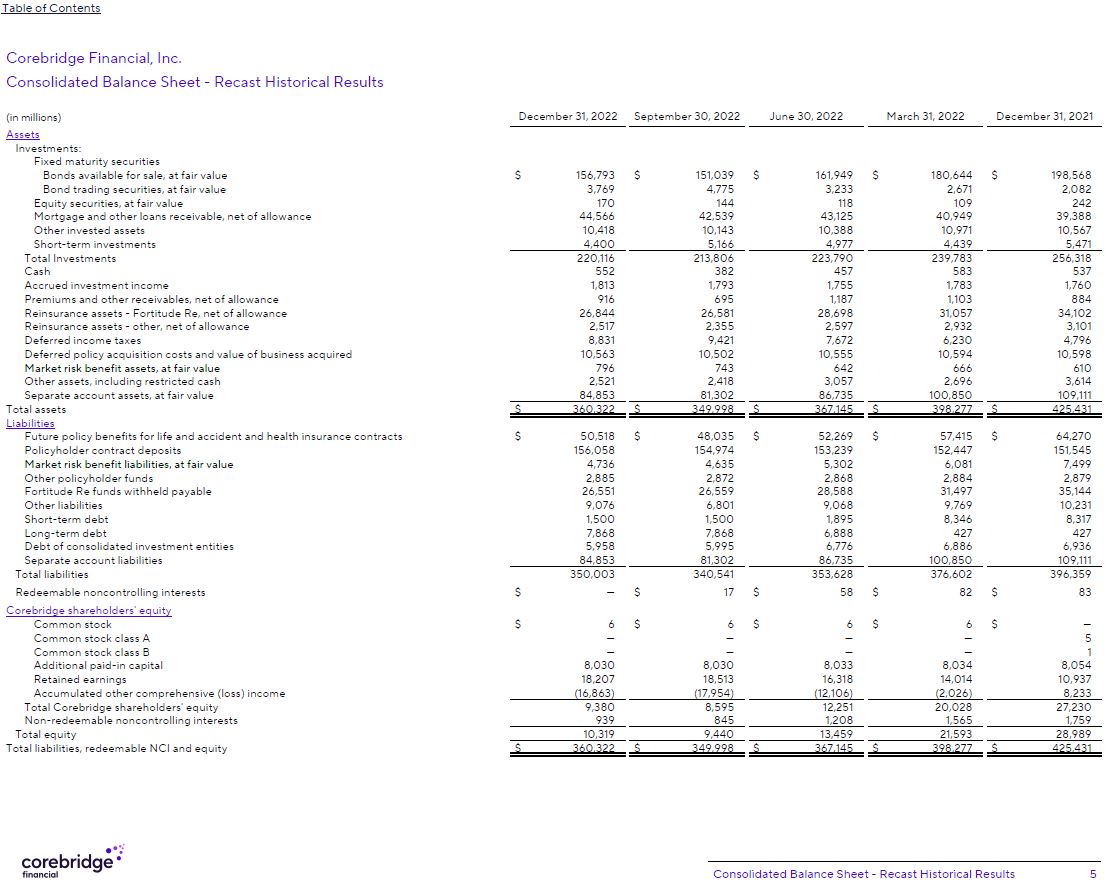
December 31, 2022 September 30, 2022 June 30, 2022 March 31, 2022 December 31, 2021 (in millions) Assets Investments: Fixed maturity securities Bonds available for sale, at fair value $ 156,793 $ 151,039 $ 161,949 $ 180,644 $ 198,568 Bond trading securities, at fair value 3,769 4,775 3,233 2,671 2,082 Equity securities, at fair value 170 144 118 109 242 Mortgage and other loans receivable, net of allowance 44,566 42,539 43,125 40,949 39,388 Other invested assets 10,418 10,143 10,388 10,971 10,567 Short-term investments 4,400 5,166 4,977 4,439 5,471 Total Investments 220,116 213,806 223,790 239,783 256,318 Cash 552 382 457 583 537 Accrued investment income 1,813 1,793 1,755 1,783 1,760 Premiums and other receivables, net of allowance 916 695 1,187 1,103 884 Reinsurance assets - Fortitude Re, net of allowance 26,844 26,581 28,698 31,057 34,102 Reinsurance assets - other, net of allowance 2,517 2,355 2,597 2,932 3,101 Deferred income taxes 8,831 9,421 7,672 6,230 4,796 Deferred policy acquisition costs and value of business acquired 10,563 10,502 10,555 10,594 10,598 Market risk benefit assets, at fair value 796 743 642 666 610 Other assets, including restricted cash 2,521 2,418 3,057 2,696 3,614 Separate account assets, at fair value 84,853 81,302 86,735 100,850 109,111 Total assets $ 360,322 $ 349,998 $ 367,145 $ 398,277 $ 425,431 Liabilities Future policy benefits for life and accident and health insurance contracts $ 50,518 $ 48,035 $ 52,269 $ 57,415 $ 64,270 Policyholder contract deposits 156,058 154,974 153,239 152,447 151,545 Market risk benefit liabilities, at fair value 4,736 4,635 5,302 6,081 7,499 Other policyholder funds 2,885 2,872 2,868 2,884 2,879 Fortitude Re funds withheld payable 26,551 26,559 28,588 31,497 35,144 Other liabilities 9,076 6,801 9,068 9,769 10,231 Short-term debt 1,500 1,500 1,895 8,346 8,317 Long-term debt 7,868 7,868 6,888 427 427 Debt of consolidated investment entities 5,958 5,995 6,776 6,886 6,936 Separate account liabilities 84,853 81,302 86,735 100,850 109,111 Total liabilities 350,003 340,541 353,628 376,602 396,359 Redeemable noncontrolling interests $ — $ 17 $ 58 $ 82 $ 83 Corebridge shareholders' equity Common stock $ 6 $ 6 $ 6 $ 6 $ — Common stock class A — — — — 5 Common stock class B — — — — 1 Additional paid-in capital 8,030 8,030 8,033 8,034 8,054 Retained earnings 18,207 18,513 16,318 14,014 10,937 Accumulated other comprehensive (loss) income (16,863) (17,954) (12,106) (2,026) 8,233 Total Corebridge shareholders' equity 9,380 8,595 12,251 20,028 27,230 Non-redeemable noncontrolling interests 939 845 1,208 1,565 1,759 Total equity 10,319 9,440 13,459 21,593 28,989 Total liabilities, redeemable NCI and equity $ 360,322 $ 349,998 $ 367,145 $ 398,277 $ 425,431 Table of Contents Corebridge Financial, Inc. Consolidated Balance Sheet - Recast Historical Results Consolidated Balance Sheet - Recast Historical Results 5