Bluerock High Income Institutional Credit Fund
Filed: 6 Dec 23, 5:20pm
UNITED STATES
SECURITIES AND EXCHANGE COMMISSION
Washington, D.C. 20549
FORM N-CSR
CERTIFIED SHAREHOLDER REPORT OF REGISTERED
MANAGEMENT INVESTMENT COMPANIES
Investment Company Act file number: 811-23772
Bluerock High Income Institutional Credit Fund
(Exact name of registrant as specified in charter)
1345 Avenue of the Americas, 32nd Floor, New York, NY 10105
(Address of principal executive offices) (Zip code)
1-844-819-8287
(Registrant’s telephone number, including area code)
Jason Emala, Esq.
Bluerock Credit Fund Advisor, LLC
1345 Avenue of the Americas, 32nd Floor
New York, NY 10105
(Name and address of agent for service)
Date of fiscal year end: September 30
Date of reporting period: September 30, 2023
Item 1. Reports to Stockholders.
| (a) |
TABLE OF CONTENTS
| Shareholder Letter | 1 |
| Portfolio Review | 7 |
| Index to Financial Statements | |
| Portfolio of Investments | 9 |
| Statement of Assets and Liabilities | 11 |
| Statement of Operations | 12 |
| Statements of Changes in Net Assets | 13 |
| Statement of Cash Flows | 15 |
| Financial Highlights | 16 |
| Notes to Financial Statements | 20 |
| Report of Independent Registered Public Accounting Firm | 30 |
| Additional Information | 31 |
| Supplemental Information | 32 |
| Privacy Policy | 34 |
 | Annual Report 9.30.2023 |
ANNUAL REPORT: (4Q 2022 - 3Q 2023) (UNAUDITED)
Letter from the Credit Fund Advisors
To Our Valued Shareholders:
We are pleased to present an update for the Bluerock High Income Institutional Credit Fund (“the Fund,” or “High Income Fund”) as of September 30, 2023.
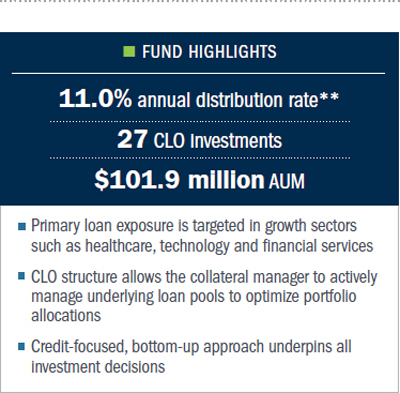
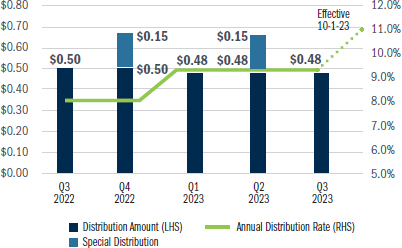
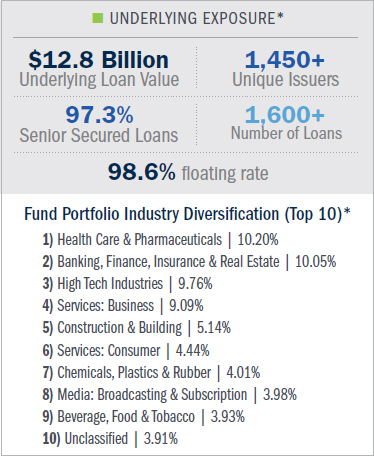
Since inception, the High Income Fund has generated positive returns in a challenging economic environment, while also declaring seven distributions (five quarterly and two special) totaling $2.74 per share. The Fund announced an increase to its annual distribution rate to 11.0%, effective October 1, 2023. The increase is a result of the strong performance of the underlying portfolio, which has generated substantial income due to the floating rate nature of the assets and active portfolio management. The Fund has strategically diversified the portfolio year-to-date, investing higher in the Collateralized Loan Obligation (CLO) capital stack, effectively reducing potential risk while simultaneously generating a double-digit underlying yield from the CLO securities, thus increasing the risk-adjusted return profile of the Fund.
* Underlying portfolio subject to change at any time and should not be considered in-vestment advice. Underlying data as of September 2023. Diversification does not ensure profits.
High Income Fund Historical Distribution
(Inception through Q3 2023)
CORPORATE HEADQUARTERS | 1345 AVENUE OF THE AMERICAS | 32ND FLOOR | NEW YORK, NY 10105 | 877.826.BLUE (2583) | BLUEROCK.COM
1
 | ANNUAL REPORT (9.30.2023) | BLUEROCK HIGH INCOME INSTITUTIONAL CREDIT FUND | (UNAUDITED) |
 | Why Invest in Collateralized Loan Obligations? |
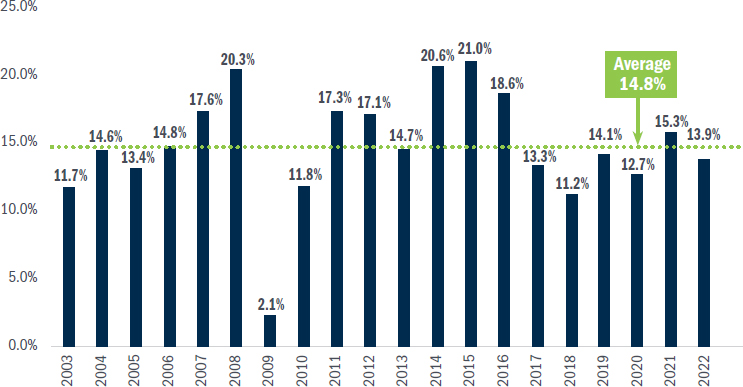
In our view, it is more advantageous to access senior secured loans through CLOs for several reasons. First and foremost, equity investments in collateralized loan obligations (CLOs) have historically generated meaningful yields of nearly 15% annually over the past 20 years, a significant premium to most other yield-generating investments.
CLO Equity Annual Distribution Yields
Additionally, CLOs are structured through their decade-long lifecycles to have the potential for strong relative performance across an entire economic cycle, including both an economic expansion and contraction. Third, CLOs have mandated structural protections and investment guidelines that may help to reduce certain types of risk. Other reasons are equally important: required diversification of the underlying senior secured loan pool, lower interest rate risk compared to fixed-rate securities, and their long-term structure with non-recourse financing.
CLO Equity (or CLO equity tranche): The tranche within a CLO that is paid any excess spread. The equity tranche payment is prioritized after all the debt and subordinated tranches.
Source: Kanerai, Intex, Markit, Barclays Research, includes CLO 1.0 and 2.0 broadly syndicated loans. Yields do not include return of principal. Data thru December 2022. Does not represent total return experienced by investor. Past Performance is not a guarantee of future results.
** The Fund accrues distributions daily. The current annualized distribution rate is calculated by annualizing the daily accrual rate of the Fund as of October 1, 2023. The Fund’s distribution policy is to make quarterly distributions to its shareholders, but the amount of such distributions is not fixed. There is no assurance that the Fund will continue to declare distributions or that they will continue at the current rate. All or a portion of the distributions may consist of a return of capital based on the character of the distributions received from the underlying holdings, primarily CLO junior debt and equity tranches. Shareholders should not assume that the source of a distribution from the Fund is net profit. The final determination of the source and tax characteristics of all distributions will be made after the end of the year. Shareholders should note that return of capital will reduce the tax basis of their shares and potentially increase the taxable gain, if any, upon disposition of their shares.
Underlying portfolio subject to change at any time and should not be considered investment advice. Diversification does not ensure profits.
2
| | ANNUAL REPORT (9.30.2023) | BLUEROCK HIGH INCOME INSTITUTIONAL CREDIT FUND | (UNAUDITED) |
| Market Overview & Outlook |
While traditional fixed income investments have struggled in the rising interest rate environment, senior secured loans have performed well on a relative basis, primarily due to their floating rate nature. Investment grade bonds, an asset class viewed as stable by many investors, dropped approximately -20% from their peak in July 2020. Senior secured loans, on the other hand, have significantly outperformed the Bloomberg U.S. Aggregate Bond Index by over 2,700 basis points and are up nearly 14% since the start of 2021.
Hypothetical Growth of $100,000
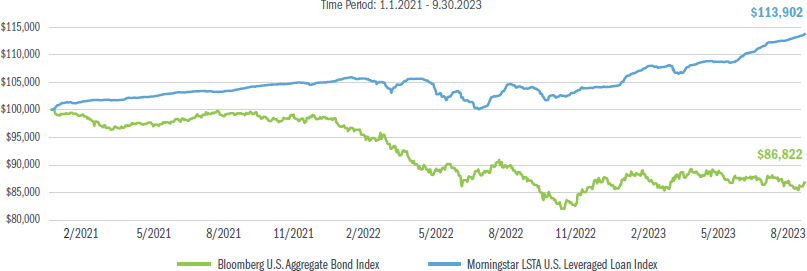
Source: Morningstar Direct
We are optimistic about the Fund as CLO market conditions have continued to present opportunities. In particular, CLO debt yields have become more attractive allowing investors to move up the capital stack and potentially reduce risk, while maintaining double digit yields.
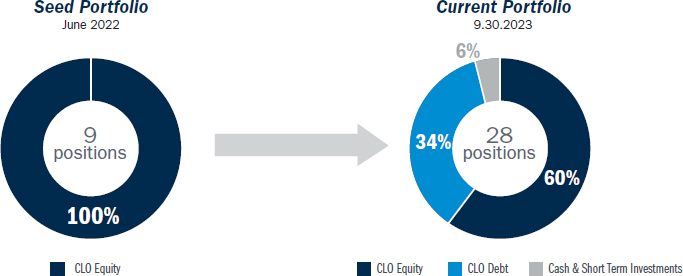
In these changing environments, active management stands out as a crucial differentiator for the Fund. The Fund’s subadvisor, Whitestar, has diversified and strategically allocated the Fund’s holdings given higher yields in CLO debt tranches. As the chart below shows, Whitestar has expanded the Fund’s CLO holdings from 9 positions to 27 positions since inception, with a primary focus on adding CLO debt that may generate mid-teens expected cash yields.
As market conditions continue to evolve, we are confident in Bluerock's and Whitestar's ability to capitalize on attractive opportunities and to continue creating value for our shareholders.
3
| | ANNUAL REPORT (9.30.2023) | BLUEROCK HIGH INCOME INSTITUTIONAL CREDIT FUND | (UNAUDITED) |
| About WhiteStar |
The Fund is subadvised by WhiteStar, a structured credit specialist and CLO sponsor who underwrites each senior secured loan and also purchases CLOs on the secondary market to find those with the most attractive risk-reward profiles.
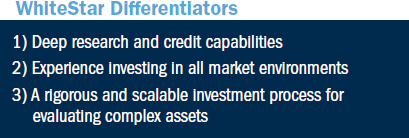
The attributes described above contribute to WhiteStar’s focus on generating “alpha by avoidance,” or by avoiding investments with a higher default probability and instead investing in loans with a high likelihood of repayment through maturity. As a result, WhiteStar has historically performed as a top quartile CLO manager with low loss and default rates of underlying loans.
Despite the continued broader market uncertainty, we believe the Fund is well-positioned to effectively navigate the current investment environment, given CLOs structural characteristics and long-term floating-rate structure. More specifically, we believe the Bluerock High Income Institutional Credit Fund offers investors access to an institutional asset class that has historically delivered high-income returns throughout changing economic cycles, with lower correlation to broader markets in a daily priced format.
On behalf of the entire Bluerock and WhiteStar investment management teams, we thank you for your support in the Fund.
Bluerock Credit Fund Advisor | WhiteStar Asset Management
Fund Performance: Total Return Periods as of 9.30.20231
| AS OF 9.30.2023 | |||
| ONE YEAR | SINCE INCEPTION | ||
| Class A (IIMAX) | No Load | 6.58% | 7.12% |
| Load with Max Sales Charge2 | 0.46% | 2.25% | |
| Class C (IIMCX) | No Load | 6.63% | 7.12% |
| Load with Early Withdrawal Charge2 | 5.65% | 7.12% | |
| Class I (IIMWX) | 6.67% | 7.15% | |
| 1 | Inception date of the Fund is June 21, 2022. |
| 2 | The maximum sales charge is 5.75% for A-share. Class C shares that have been held less than one year (365 days) from the purchase date will be subject to an early withdrawal charge of 1.00% of the original purchase price. Investors may be eligible for a reduction in sales charges. Please see the Fund Prospectus for details. |
The total annual fund operating expense ratio, gross of any fee waivers or expense reimbursements is 3.75% for Class A share, 4.50% for C share and 3.50% for the I share. The performance data quoted here represents past performance. Current performance may be lower or higher than the performance data quoted. Past performance is no guarantee of future results. Investment return and principal value will fluctuate, so that shares, when redeemed, may be worth more or less than their original cost. The Fund’s investment adviser has contractually agreed to reduce its fees and/or absorb expenses of the fund, at least until January 31, 2024, to ensure that the net annual fund operating expenses will not exceed 2.60% for A share, 3.35% for C share and 2.35% for the I share, subject to possible recoupment from the Fund in future years. In addition to the contractual obligations under its expense limitation agreement, the Adviser, on a purely voluntary basis, has borne all of the operating expenses of the Fund and waived its entire management fee since inception. Such operating expenses and management fees voluntarily paid or waived during this period are not subject to recoupment from the Fund in future years. Without such waiver of fees and payment of expenses by the Adviser, expenses of the Fund would have been higher and the Fund’s returns would have been lower.
4
| | ANNUAL REPORT (9.30.2023) | BLUEROCK HIGH INCOME INSTITUTIONAL CREDIT FUND | (UNAUDITED) |
Definitions
Asset Backed Securities (ABS): Pools of familiar asset types that represent that security’s contractual obligation to pay a distribution.
Collateralized Loan Obligations (CLOs): Structurally, CLOs are actively managed special purpose vehicles that are formed to manage a portfolio of Senior Secured Loans. The loans within a CLO are predominately limited to Senior Secured Loans which meet specified credit and diversity criteria and are subject to concentration limitations in order to create an investment portfolio that is strategically diversified across different loans, borrowers, and industries, with limitations on non-U.S. borrowers.
CLO Equity (or CLO equity tranche): The tranche within a CLO that is paid any excess spread. The equity tranche is paid after all the CLO debt and subordinated tranches.
Commercial Mortgage-Backed Securities (CMBS): An asset backed security that’s backed by mortgages on commercial properties.
Investment Grade Bonds (IG Bonds): Bonds that are believed to have a lower risk of default and receive higher ratings by the credit rating agencies namely bonds rated Baa (by Moody’s) or BBB (by S&P and Fitch) or above. These bonds tend to be issued at lower yields than less creditworthy bonds.
Senior Secured Loans (SSLs): Senior Secured Loans are floating rate credit instruments structured primarily with first-priority liens on the assets of the borrower, including, but not limited to cash, receivables, inventory and PP&E, that serve as collateral in support of the repayment of such debt. Senior Secured Loans are predominately used to fund a company’s growth, financing their business, M&A-related transactions or capital expenditures. Senior Secured Loans typically have the highest priority in receiving payments, ahead of both bondholders and preferred stockholders.
Morningstar LSTA US Leveraged Loan Index: The index is a market-value weighted index designed to measure the performance of the U.S. leveraged loan market. Investors cannot invest directly in an index or benchmark
Bloomberg U.S. Aggregate Bond Index: measures the performance of the U.S. investment grade bond market. The index invests in a wide spectrum of public, investment-grade, taxable, fixed income securities in the United States – including government, corporate, and international dollar-denominated bonds, as well as mortgage-backed and asset-backed securities, all with maturities of more than 1 year. Risks include rising interest rates, credit quality of the issuers and general economic conditions.
5

Risk Disclosures
Not FDIC Insured | No Bank Guarantee | May Lose Value
Investing in the Fund involves risks, including the risk that you may receive little or no return on your investment, and that you may lose part or all of your investment. This is neither an offer to sell nor a solicitation to purchase any security.
Investors should carefully consider the investment objectives, risks, sales charges and expenses of the Bluerock High Income Institutional Credit Fund (the “Fund”). This and other important information about the Fund is contained in the prospectus, which can be obtained online by visiting bluerock.com/hi-fund/ documents. The prospectus should be read carefully before investing.
Past performance is not a guarantee of future results. The ability of the Fund to achieve its investment objective depends, in part, on the ability of the Advisor and Sub-Advisor to allocate effectively the assets of the Fund among the various available investment opportunities. There can be no assurance that the actual allocations will be effective in achieving the Fund’s investment objective or delivering positive returns. There is no guarantee that the Fund’s investment strategies will work under all market conditions. Statements relating to the performance of the Fund contained herein are historical and the Fund’s performance subsequent to the date as of which such statements were made may differ materially. Updated performance data for the Fund is available at bluerockfunds.com/performance.
Please note that the performance data relating to various indices included herein is for informational purposes only. You cannot invest directly in an index. Index performance does not represent actual fund or portfolio performance. Performance of a fund or portfolio may differ significantly from the performance of index holding the same securities. Index performance assumes reinvestment of dividends but does not reflect any management fees, transaction costs or other expenses that would be incurred by a fund or portfolio, or brokerage commissions on transactions in fund shares. Such fees, expenses, and commissions would likely reduce returns.
The Fund is a closed-end interval fund, the shares have no history of public trading, nor is it intended that the shares will be listed on a public exchange at this time. No secondary market is expected to develop for the Fund’s shares. Limited liquidity is provided to shareholders only through the Fund’s quarterly repurchase offers for no less than 5% of the Fund’s shares outstanding at net asset value. There is no guarantee that shareholders will be able to sell all of the shares they desire in a quarterly repurchase offer. Quarterly repurchases by the Fund of its shares typically will be funded from available cash or sales of portfolio securities. The sale of securities to fund repurchases could reduce the market price of those securities, which in turn would reduce the Fund’s net asset value. The Fund is suitable only for investors who can bear the risks associated with the limited liquidity of the Fund and should be viewed as a long-term investment.
Investors in the Fund should understand that the net asset value (“NAV”) of the Fund will fluctuate, which means the value of your shares at any point in time may be worth less than the value of your original investment, even after taking into account any reinvestment of dividends and distributions. An investment in shares represents an indirect investment in the securities owned by the Fund. The value of these securities, like other market investments, may move up or down, sometimes rapidly and unpredictably. The Fund is “non-diversified” under the Investment Company Act of 1940 and therefore may invest more than 5% of its total assets in the securities of one or more issuers. As such, changes in the financial condition or market value of a single issuer may cause a greater fluctuation in the Fund’s net asset value than in a “diversified” fund. The Fund is not intended to be a complete investment program.
Because the Fund invests primarily in debt-anchored instruments and securities, the value of your investment in the Fund may fluctuate with changes in interest rates. The Fund may invest in senior secured debt and CLOs. Substantial increases in interest rates may cause an increase in loan defaults and the value of the Fund’s assets may also be affected by other uncertainties such as economic developments affecting the market for senior secured term loans or uncertainties affecting borrowers generally. There is a risk that the borrowers under the Senior Secured Loans may not make scheduled interest and/or principal payments on their loans and/or debt securities, which may result in losses or reduced cash flow to the Fund, either or both of which may cause the NAV of, or the distributions by, the Fund to decrease. CLOs carry additional risks, including but not limited to (i) the possibility that distributions from collateral will not be adequate to make interest or other payments; (ii) the quality of the collateral may decline in value or default; (iii) the possibility that the Fund’s investments in CLOs are subordinate to other classes or tranches thereof; and (iv) the complex structure of the CLO investment may not be fully understood at the time of investment and may produce disputes with the issuer, holders of senior tranches or other unexpected investment results. In addition, the nature of the Fund’s investment strategy also subjects it to various risks, including credit risk (the debtor may default), liquidity risk (the investment may not be able to be sold at an advantageous time or price) and prepayment risk (the debtor may pay its obligation early, reducing the amount of interest payments). All potential investors should read the Risk Factors section of the prospectus for additional information related to the risks associated with an investment in the Fund.
The Bluerock High Income Institutional Credit Fund is distributed by ALPS Distributors, Inc (ALPS). Bluerock Credit Fund Advisor, LLC is not affiliated with ALPS, or WhiteStar Asset Management.
This material is provided for informational purposes only and should not be considered as investment advice or a recommendation of any particular security, strategy or investment product or be relied upon for any other purpose. Certain information contained herein has been obtained from sources deemed to be reliable, but has not been independently verified. This material represents views as of its date and is subject to change without notice of any kind.
This report may contain certain forward-looking statements. Such forward-looking statements can generally be identified by our use of forward-looking terminology such as “may,” “will,” “expect,” “intend,” “anticipate,” “estimate,” “believe,” “continue,” or other similar words. Because such statements include risks, uncertainties and contingencies, actual results may differ materially from the expectations, intentions, beliefs, plans or predictions of the future expressed or implied by such forward-looking statements. These risks, uncertainties and contingencies include, but are not limited to: uncertainties relating to changes in general economic and real estate conditions; uncertainties relating to the implementation of our investment strategy; uncertainties relating to capital proceeds; and other risk factors as outlined in the Fund’s prospectuses, statement of additional information, annual report and semi-annual report filed with the Securities and Exchange Commission.

| Bluerock High Income Institutional Credit Fund | Portfolio Review |
| September 30, 2023 (Unaudited) |
Comparison of the Change in Value of a $10,000 Investment
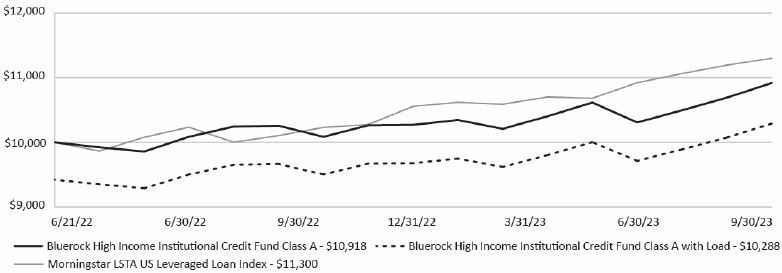
Performance figures for certain periods ended September 30, 2023:
| Bluerock High Income Institutional Credit Fund: | 1 Year | Since Inception* |
| Class A | ||
| Without Load | 6.58% | 7.12% |
| With Load(a) | 0.46% | 2.25% |
| Class C | ||
| Without Load | 6.63% | 7.12% |
| With Load(b) | 5.65% | 7.12% |
| Class F | 6.63% | 7.12% |
| Class I | 6.67% | 7.15% |
| Morningstar LSTA US Leveraged Loan Index | 12.98% | 10.05% |
| * | Class A, Class C, Class F and Class I commenced operations June 21, 2022. |
| (a) | Adjusted for initial maximum sales charge of 5.75%. |
| (b) | Adjusted for early withdrawal charge of 1.00%. |
The Morningstar LSTA US Leveraged Loan Index is a market-value weighted index designed to measure the performance of the U.S. leveraged loan market. Investors cannot invest directly in an index or benchmark.
Total returns are calculated using closing Net Asset Value as of September 30, 2023, and may not match returns presented in the Financial Highlights due to adjustments under accounting principles generally accepted in the United States of America.
The performance data quoted is historical. Past performance is no guarantee of future results. The investment return and principal value of an investment will fluctuate. An investor’s shares, when redeemed, may be worth more or less than the original cost. Total returns are calculated using closing Net Asset Value as of September 30, 2023. Total returns are calculated assuming reinvestment of all dividends and distributions. Total returns would have been lower had the Advisor not waived its fees. Returns greater than one year are annualized. The Advisor and the Fund have entered into an expense limitation and reimbursement agreement (the “Expense Limitation Agreement”) under which the Advisor has contractually agreed to waive the base management fees and/or reimburse the Fund for ordinary operating expenses the Fund incurs but only to the extent necessary to maintain the Fund's total annual operating expenses after fee waivers and/or reimbursement (exclusive of any incentive fee, taxes, interest, brokerage commissions, and extraordinary expenses, such as litigation or reorganization costs, but inclusive of organizational costs and offering costs), to the extent that such expenses exceed 2.60%, 3.35%, 1.75% and 2.35% per annum of the Fund's average daily net assets attributable to Class A, Class C, Class F and Class I shares, respectively. For the avoidance of doubt, acquired fund fees and expenses are not operating costs and are therefore excluded from the Expense Limitation. In consideration of the Advisor’s agreement to limit the Fund's expenses, the Fund has agreed to repay the Advisor in the amount of any fees waived and Fund expenses paid or absorbed, subject to the limitations that: any waiver or reimbursement by the Advisor is subject to repayment by the Fund within the three years following the date the waiver or reimbursement occurred (provided the Advisor continues to serve as investment advisor to the Fund), if the Fund is able to make the repayment without exceeding the expense limitation then in effect or in effect at the time of the waiver and the repayment is approved by the Board of Trustees (the “Board”). The Expense Limitation Agreement will remain in effect at least until January 31, 2024, unless and until the Board approves its modification or termination. After January 31, 2024, the Expense Limitation Agreement may be renewed at the Advisor’s and Board's discretion. Additionally, on a purely voluntary basis, the Advisor has borne all of the operating expenses of the Fund and waived its entire management fee since inception. The Advisor shall not seek to recoup the voluntary operating expenses reimbursed and voluntary management fees waived during this period. Without such waiver of fees and payment of expenses by the Advisor, expenses of the Fund would have been higher and the Fund's returns would have been lower.
| Annual Report | September 30, 2023 | 7 |
| Bluerock High Income Institutional Credit Fund | Portfolio Review |
| September 30, 2023 (Unaudited) |
The Fund’s total gross annual operating expenses, including the expenses of underlying funds and before any fee waiver, are 3.75%, 4.50%, 3.50% and 3.50% for Class A, Class C, Class F and I, respectively, per the February 1, 2023 prospectus and may differ from the ratios presented in the Financial Highlights. Class A shares are subject to a maximum sales charge imposed on purchases of 5.75%. Class A shareholders who tender for repurchase Class A shares that were purchased in amounts of $ 1,000,000 or more that have been held less than one year (365 days) from the purchase date will be subject to an early withdrawal charge of 1.00% of the original purchase price. Class C shares are subject to an early withdrawal charge of 1.00% if redeemed less than 365 days after the purchase. The above performance figures do not reflect the deduction of taxes that a shareholder would have to pay on Fund distributions or the redemption of the Fund shares. For performance information current to the most recent month-end, please call 1-844-819-8287.
Portfolio Composition as of September 30, 2023
| Percent of Net Assets | |||
| Collaterized Loan Obligations Equity | 62.55% | ||
| Collaterized Loan Obligations Debt | 35.45% | ||
| Short-Term Investments | 5.63% | ||
| TOTAL INVESTMENTS | 103.63% | ||
| Liabilities in Excess of Other Assets | -3.63% | ||
| TOTAL NET ASSETS | 100.00% | ||
8
| Bluerock High Income Institutional Credit Fund | Portfolio of Investments |
| September 30, 2023 |
| Security(a) | Estimated Yield/Interest Rate | Acquisition Date(b) | Maturity Date | Principal | Cost(c) | Value(d) | ||||||||||||
| COLLATERALIZED LOAN OBLIGATIONS (98.00%)(e) | ||||||||||||||||||
| Collateralized Loan Obligations Equity (62.55%)(f) | ||||||||||||||||||
| CIFC Funding 2022-II, Ltd., Class SUBB | 19.42% | 6/21/2022 | 4/19/2035 | $ | 2,500,000 | $ | 2,098,763 | $ | 1,978,560 | |||||||||
| CIFC Funding 2022-IV, Ltd., Class SUB | 19.41% | 6/21/2022 | 7/16/2035 | 3,500,000 | 2,928,558 | 2,788,867 | ||||||||||||
| Trinitas CLO VI, Ltd., Class SUB | 14.25% | 6/21/2022 | 1/25/2034 | 35,421,178 | 24,874,478 | 21,726,287 | ||||||||||||
| Trinitas CLO VII, Ltd., Class SUB | 13.04% | 6/21/2022 | 1/25/2035 | 9,450,000 | 5,808,475 | 4,803,444 | ||||||||||||
| Trinitas CLO IX, Ltd., Class SUB | 5.46% | 6/21/2022 | 1/20/2032 | 13,000,000 | 7,393,956 | 5,872,593 | ||||||||||||
| Trinitas CLO X, Ltd., Class SUB | 15.60% | 6/21/2022 | 1/15/2035 | 22,900,000 | 18,168,329 | 15,980,856 | ||||||||||||
| Trinitas CLO XII, Ltd., Class SUB | 18.74% | 6/21/2022 | 4/25/2033 | 11,820,000 | 10,457,922 | 10,621,557 | ||||||||||||
| TOTAL Collateralized Loan Obligations Equity (Cost $71,730,481) | 63,772,164 | |||||||||||||||||
| Collateralized Loan Obligations Debt (35.45%) | ||||||||||||||||||
| 1988 CLO 1, Ltd., Class E | 3M SOFR + 8.05% | 4/14/2023 | 10/15/2037 | 2,950,000 | 2,811,146 | 2,908,299 | ||||||||||||
| 1988 CLO 2, Ltd., Class E | 3M SOFR + 8.27% | 8/2/2023 | 4/15/2038 | 3,000,000 | 2,988,791 | 3,016,089 | ||||||||||||
| 37 Capital CLO II, Class E | 3M SOFR + 8.32% | 7/14/2023 | 7/15/2034 | 500,000 | 476,435 | 479,089 | ||||||||||||
| Bridge Street CLO III, Ltd., Class E | 3M SOFR + 8.04% | 6/2/2023 | 10/20/2034 | 700,000 | 660,225 | 681,510 | ||||||||||||
| Capital Four US CLO II, Ltd., Class E | 3M SOFR + 8.08% | 7/24/2023 | 10/20/2030 | 2,900,000 | 2,867,867 | 2,886,095 | ||||||||||||
| Crown City CLO IV, Class D | 3M SOFR + 7.90% | 7/24/2023 | 10/20/2033 | 1,000,000 | 986,367 | 991,070 | ||||||||||||
| Elmwood CLO XII, Ltd., Class F | 3M SOFR + 8.54% | 8/9/2023 | 1/20/2035 | 2,000,000 | 1,906,450 | 1,923,328 | ||||||||||||
| Empower CLO 2022-1, Ltd., Class E | 3M SOFR + 8.55% | 3/29/2023 | 10/20/2034 | 3,730,000 | 3,631,261 | 3,754,700 | ||||||||||||
| Flatiron CLO 20, Ltd., Class E | 3M SOFR + 8.11% | 8/23/2023 | 11/20/2033 | 500,000 | 501,742 | 504,544 | ||||||||||||
| Fortress Credit Bsl X, Ltd., Class E | 3M SOFR + 7.40% | 7/18/2023 | 4/20/2033 | 2,000,000 | 1,796,927 | 1,825,042 | ||||||||||||
| Generate CLO 12, Ltd., Class E | 3M SOFR + 8.40% | 9/28/2023 | 7/20/2036 | 3,000,000 | 3,015,000 | 3,015,000 | ||||||||||||
| LCM 40, Ltd., Class E | 3M SOFR + 8.15% | 8/1/2023 | 1/15/2036 | 2,000,000 | 1,980,101 | 1,995,996 | ||||||||||||
| Madison Park Funding XXIX, Ltd., Class F | 3M SOFR + 7.83% | 9/5/2023 | 10/18/2030 | 1,500,000 | 1,403,016 | 1,406,645 | ||||||||||||
| MAN GLG US CLO 2021-1, Ltd., Class D | 3M SOFR + 7.65% | 9/6/2023 | 7/15/2034 | 477,500 | 440,584 | 441,865 | ||||||||||||
| Park Avenue Institutional Advisers CLO, Ltd. 2021-1, Class D | 3M SOFR + 7.56% | 7/20/2023 | 1/20/2034 | 500,000 | 460,936 | 464,490 | ||||||||||||
| Park Avenue Institutional Advisers CLO, Ltd. 2022-2, Class D | 3M SOFR + 9.08% | 4/27/2023 | 1/20/2035 | 1,500,000 | 1,495,935 | 1,509,060 | ||||||||||||
| Trimaran CAVU 2022-1, Ltd., Class E | 3M SOFR + 9.08% | 6/28/2023 | 10/22/2035 | 1,400,000 | 1,396,527 | 1,409,201 | ||||||||||||
| Trinitas CLO VI, Ltd., Class ER | 3M SOFR + 7.08% | 11/21/2022 | 1/25/2034 | 1,880,000 | 1,580,750 | 1,677,701 | ||||||||||||
| TSTAT 2022-1, Ltd., Class F | 3M SOFR + 10.00% | 7/27/2022 | 7/20/2031 | 2,500,000 | 2,500,000 | 2,482,540 | ||||||||||||
| Wellfleet CLO 2022-2, Ltd., Class E | 3M SOFR + 8.56% | 7/24/2023 | 10/18/2035 | 2,750,000 | 2,731,108 | 2,769,979 | ||||||||||||
| TOTAL Collateralized Loan Obligations Debt (Cost $35,631,168) | 36,142,243 | |||||||||||||||||
| The accompanying notes are an integral part of these financial statements. | |
| Annual Report | September 30, 2023 | 9 |
Bluerock High Income Institutional Credit Fund Portfolio of Investments (Continued)
September 30, 2023
| Security(a) | Estimated Yield/Interest Rate | Acquisition Date(b) | Maturity Date | Principal | Cost(c) | Value(d) | ||||||||||||||
| TOTAL COLLATERALIZED LOAN OBLIGATIONS (Cost $107,361,649) | $ | 99,914,407 | ||||||||||||||||||
| SHORT TERM INVESTMENT (5.63%) | ||||||||||||||||||||
| Fidelity Government Portfolio, 5.22%(g) (Cost $5,735,929) | $ | 5,735,929 | 5,735,929 | |||||||||||||||||
| TOTAL INVESTMENTS (103.63%) (Cost $113,097,578) | $ | 105,650,336 | ||||||||||||||||||
| LIABILITIES IN EXCESS OF OTHER ASSETS (-3.63%) | (3,698,945 | ) | ||||||||||||||||||
| NET ASSETS (100.00%) | $ | 101,951,391 | ||||||||||||||||||
Investment Abbreviations:
SOFR - Secured Overnight Financing Rate
Reference Rates:
3M SOFR - 3 Month SOFR as of September 30, 2023 was 5.40%
| (a) | The Fund does not "control" nor is an "affiliate" of any of the portfolio investments, each term as defined in the Investment Company Act of 1940, as amended (the "1940 Act"). In general, under the 1940 Act, the Fund would be presumed to "control" a portfolio company if the Fund owned more than 25% of its voting securities and would be an "affiliate" of a portfolio company if the Fund owned 5% or more of its voting securities. |
| (b) | Acquisition date represents the initial purchase trade date, or the date the investment was contributed to the Fund at inception. |
| (c) | Cost represents the GAAP amortized cost, defined as the initial cost minus any return of principal and/or adjusted for the accretion(amortization) of discounts(premiums). |
| (d) | Fair value is determined in good faith in accordance with valuation principles pursuant to FASB ASC Topic 820 "Fair Value Measurement". The fair value of the CLO investments was determined using significant unobservable inputs. See “Note 2.A.1. Valuation of Collateralized Loan Obligations.” |
| (e) | Securities exempt from registration under Rule 144A of the Securities Act of 1933. These securities may be sold in the ordinary course of business in transactions exempt from registration, normally to qualified institutional buyers. As of September 30, 2023, the aggregate market value of those securities was $99,914,407, representing 98.00% of net assets. |
| (f) | The CLO subordinated notes are considered equity positions in the CLO funds. Equity investments are entitled to recurring distributions which are generally equal to the remaining cash flow of the payments made by the underlying fund’s securities less contractual payments to CLO debt tranche holders and CLO expenses. The estimated yield indicated is based upon a current projection of the amount and timing of these recurring distributions, and the estimated amount of repayment of principal upon termination. Such projections are periodically reviewed and adjusted, and the estimated yield may not ultimately be realized. |
| (g) | The rate shown is the 7-day effective yield as of September 30, 2023. |
The accompanying notes are an integral part of these financial statements.
10
| Bluerock High Income Institutional Credit Fund | Statement of Assets and Liabilities |
| September 30, 2023 |
| ASSETS | ||||
| Investments, at value (Cost $113,097,578) | $ | 105,650,336 | ||
| Cash | 212,987 | |||
| Receivable for shares sold | 377,984 | |||
| Dividends and Interest receivable | 1,079,503 | |||
| Prepaid expenses and other assets | 52,505 | |||
| Total Assets | 107,373,315 | |||
| LIABILITIES | ||||
| Payable for investments purchased | 3,015,000 | |||
| Payable for distributions | 1,973,742 | |||
| Due to advisor | 134,740 | |||
| Administration fees payable | 39,095 | |||
| Transfer agency fees payable | 24,507 | |||
| Shareholder servicing fees payable | 1,148 | |||
| Distribution fees payable | 330 | |||
| Accrued expenses and other liabilities | 233,362 | |||
| Total Liabilities | 5,421,924 | |||
| Commitments and Contingencies (See Note 3) | ||||
| NET ASSETS | $ | 101,951,391 | ||
| NET ASSETS CONSIST OF | ||||
| Paid-in capital | $ | 100,921,731 | ||
| Total distributable earnings | 1,029,660 | |||
| NET ASSETS | $ | 101,951,391 | ||
| PRICING OF SHARES | ||||
| Class A: | ||||
| Net asset value, per share | $ | 24.41 | ||
| Net assets | $ | 5,378,036 | ||
| Shares of beneficial interest outstanding (unlimited number of shares, no par value common stock authorized) | 220,324 | |||
| Maximum offering price per share ((NAV/0.9425), based on maximum sales charge of 5.75% of the offering price) | $ | 25.90 | ||
| Class C: | ||||
| Net asset value, per share | $ | 24.41 | ||
| Net assets | $ | 558,517 | ||
| Shares of beneficial interest outstanding (unlimited number of shares, no par value common stock authorized) | 22,879 | |||
| Class F: | ||||
| Net asset value, per share | $ | 24.41 | ||
| Net assets | $ | 88,359,104 | ||
| Shares of beneficial interest outstanding (unlimited number of shares, no par value common stock authorized) | 3,619,797 | |||
| Class I: | ||||
| Net asset value, per share | $ | 24.42 | ||
| Net assets | $ | 7,655,734 | ||
| Shares of beneficial interest outstanding (unlimited number of shares, no par value common stock authorized) | 313,549 | |||
The accompanying notes are an integral part of these financial statements.
| Annual Report | September 30, 2023 | 11 |
| Bluerock High Income Institutional Credit Fund | Statement of Operations |
| For the Year Ended September 30, 2023 |
INVESTMENT INCOME
| Interest income | $ | 14,845,424 | ||
| Total Investment Income | 14,845,424 | |||
| EXPENSES | ||||
| Investment Advisory fees | 1,574,272 | |||
| Incentive Fees | 2,452,902 | |||
| Administrative fees | 161,005 | |||
| Transfer Agency fees | 58,731 | |||
| Shareholder servicing fees: | ||||
| Class A | 5,305 | |||
| Class C | 537 | |||
| Distribution fees: | ||||
| Class C | 1,613 | |||
| Legal fees | 66,831 | |||
| Audit and tax fees | 327,805 | |||
| Reports to shareholders and printing fees | 37,157 | |||
| Custody fees | 13,342 | |||
| Chief compliance officer fees | 31,875 | |||
| Offering cost (See Note 2) | 205,550 | |||
| Trustees' fees | 35,000 | |||
| Other expenses | 61,892 | |||
| Total Expenses | 5,033,817 | |||
| Less: Fees waived/expenses reimbursed by Advisor (See Note 3) | (5,033,817 | ) | ||
| Net Expenses | – | |||
| Net Investment Income | 14,845,424 | |||
| NET REALIZED AND UNREALIZED GAIN/(LOSS) ON INVESTMENTS | ||||
| Net realized gain/(loss) on investments | (2,888,644 | ) | ||
| Net change in unrealized appreciation/(depreciation) on investments | (5,839,581 | ) | ||
| NET REALIZED AND UNREALIZED GAIN/(LOSS) ON INVESTMENTS | (8,728,225 | ) | ||
| NET INCREASE IN NET ASSETS RESULTING FROM OPERATIONS | $ | 6,117,199 |
The accompanying notes are an integral part of these financial statements.
12
Bluerock High Income Institutional Credit Fund Statements of Changes in Net Assets
| For the Year Ended September 30, 2023 | For the Period June 21, 2022(a) to September 30, 2022 | |||||||
| OPERATIONS: | ||||||||
| Net investment income | $ | 14,845,424 | $ | 3,614,359 | ||||
| Net realized loss on investments | (2,888,644 | ) | – | |||||
| Net change in unrealized depreciation on investments | (5,839,581 | ) | (1,607,661 | ) | ||||
| Net Increase in Net Assets Resulting from Operations | 6,117,199 | 2,006,698 | ||||||
| DISTRIBUTIONS TO SHAREHOLDERS: | ||||||||
| Class A | ||||||||
| From distributable earnings | (168,060 | ) | (32 | ) | ||||
| From return of capital | (31,334 | ) | (624 | ) | ||||
| Class C | ||||||||
| From distributable earnings | (16,970 | ) | (24 | ) | ||||
| From return of capital | (3,164 | ) | (474 | ) | ||||
| Class F | ||||||||
| From distributable earnings | (6,648,128 | ) | (81,025 | ) | ||||
| From return of capital | (1,239,529 | ) | (1,588,649 | ) | ||||
| Class I | ||||||||
| From distributable earnings | (179,963 | ) | (38 | ) | ||||
| From return of capital | (33,554 | ) | (736 | ) | ||||
| Total Distributions to Shareholders | (8,320,702 | ) | (1,671,602 | ) | ||||
| CAPITAL SHARE TRANSACTIONS: | ||||||||
| Class A | ||||||||
| Shares sold | 5,473,955 | 141,808 | ||||||
| Distributions reinvested | 143,033 | – | ||||||
| Shares redeemed | (22,298 | ) | – | |||||
| Shares transferred out(b) | (432,002 | ) | – | |||||
| Class C | ||||||||
| Shares sold | 524,375 | 25,000 | ||||||
| Distributions reinvested | 6,735 | – | ||||||
| Class F | ||||||||
| Shares sold | 2,500,000 | 83,773,460 | ||||||
| Distributions reinvested | 4,129,361 | – | ||||||
| Class I | ||||||||
| Shares sold | 7,054,746 | 50,300 | ||||||
| Distributions reinvested | 67,352 | – | ||||||
| Shares redeemed | (48,029 | ) | – | |||||
| Shares transferred in(c) | 432,002 | – | ||||||
| Net Increase in Net Assets Derived from Capital Share Transactions | 19,829,230 | 83,990,568 | ||||||
| Net increase in net assets | 17,625,727 | 84,325,664 | ||||||
| NET ASSETS: | ||||||||
| Beginning of Year/Period | 84,325,664 | – | ||||||
| End of Year/Period | $ | 101,951,391 | $ | 84,325,664 | ||||
The accompanying notes are an integral part of these financial statements.
| Annual Report | September 30, 2023 | 13 |
Bluerock High Income Institutional Credit Fund Statements of Changes in Net Assets
| For the Year Ended September 30, 2023 | For the Period June 21, 2022(a) to September 30, 2022 | |||||||
| Other Information | ||||||||
| Share Transactions: | ||||||||
| Class A | ||||||||
| Beginning shares | 5,642 | – | ||||||
| Shares sold | 227,293 | 5,642 | ||||||
| Distributions reinvested | 5,965 | – | ||||||
| Shares redeemed | (929 | ) | – | |||||
| Shares transferred out(b) | (17,647 | ) | – | |||||
| Net increase in shares outstanding | 214,682 | 5,642 | ||||||
| Ending shares | 220,324 | 5,642 | ||||||
| Class C | ||||||||
| Beginning shares | 1,000 | – | ||||||
| Shares sold | 21,600 | 1,000 | ||||||
| Distributions reinvested | 279 | – | ||||||
| Net increase in shares outstanding | 21,879 | 1,000 | ||||||
| Ending shares | 22,879 | 1,000 | ||||||
| Class F | ||||||||
| Beginning shares | 3,350,938 | – | ||||||
| Shares sold | 101,709 | 3,350,938 | ||||||
| Distributions reinvested | 167,150 | – | ||||||
| Net increase in shares outstanding | 268,859 | 3,350,938 | ||||||
| Ending shares | 3,619,797 | 3,350,938 | ||||||
| Class I | ||||||||
| Beginning shares | 2,015 | – | ||||||
| Shares sold | 293,097 | 2,015 | ||||||
| Distributions reinvested | 2,811 | – | ||||||
| Shares redeemed | (2,014 | ) | – | |||||
| Shares transferred in(c) | 17,640 | – | ||||||
| Net increase in shares outstanding | 311,534 | 2,015 | ||||||
| Ending shares | 313,549 | 2,015 | ||||||
| (a) | The Fund commenced operations on June 21, 2022. |
| (b) | Shares transferred out - net reduction in shares of a particular class resulting from transfer to other share classes. |
| (c) | Shares transferred in - net increase in shares of a particular class resulting from transfers from other share classes. |
The accompanying notes are an integral part of these financial statements.
14
| Bluerock High Income Institutional Credit Fund | Statement of Cash Flows |
| For the Year Ended September 30, 2023 | ||||
| Cash Flows from Operating Activities: | ||||
| Net increase in net assets resulting from operations | $ | 6,117,199 | ||
| Adjustments to reconcile net increase in net assets resulting from operations to net cash used in operating activities: | ||||
| Purchase of investment securities | (39,686,374 | ) | ||
| Proceeds from disposition of investment securities | 20,308,750 | |||
| Net purchases of short-term investment securities | (5,459,878 | ) | ||
| Net realized loss on investments | 2,888,644 | |||
| Net change in unrealized appreciation/(depreciation) on investments | 5,839,581 | |||
| Discount and premiums amortized | (584,926 | ) | ||
| (Increase)/Decrease in Assets: | ||||
| Dividends and interest receivable | (1,033,320 | ) | ||
| Prepaid expenses and other assets | (40,452 | ) | ||
| Receivable due from advisor | 175,838 | |||
| Prepaid offering costs | 205,759 | |||
| Increase/(Decrease) in Liabilities: | ||||
| Due to advisor | 134,740 | |||
| Administrative fees payable | 6,704 | |||
| Transfer agency fees payable | 14,040 | |||
| Shareholder servicing fees payable | 1,148 | |||
| Distribution fees payable | 330 | |||
| Accrued expenses and other liabilities | (107,480 | ) | ||
| Trustees' fees payable | (5,000 | ) | ||
| Net Cash Used in Operating Activities | (11,224,697 | ) | ||
| Cash Flows from Financing Activities: | ||||
| Proceeds from shares sold | 15,180,092 | |||
| Payment on shares redeemed | (70,327 | ) | ||
| Cash distributions paid | (3,672,081 | ) | ||
| Net Cash Provided by Financing Activities | 11,437,684 | |||
| Net Change in Cash | 212,987 | |||
| Cash Beginning of Year | $ | – | ||
| Cash End of Year | $ | 212,987 | ||
| Non-cash financing activities not included herein consist of reinvestment of distributions of: | $ | 4,346,481 | ||
The accompanying notes are an integral part of these financial statements.
| Annual Report | September 30, 2023 | 15 |
| Bluerock High Income Institutional Credit Fund - Class A | Financial Highlights |
The table below sets forth financial data for one share of beneficial interest outstanding throughout the periods presented.
| For the Year | For the Period | |||||||
| Ended | Ended | |||||||
| September 30, | September 30, | |||||||
| 2023 | 2022(a) | |||||||
| Net asset value, beginning of year/period | $ | 25.11 | $ | 25.00 | ||||
| INCOME FROM INVESTMENT OPERATIONS: | ||||||||
| Net investment income(b) | 4.01 | 1.09 | ||||||
| Net change in realized and unrealized gain/(loss) on investments | (2.47 | ) | (0.48 | ) | ||||
| Total from investment operations | 1.54 | 0.61 | ||||||
| DISTRIBUTIONS: | ||||||||
| From net investment income | (1.89 | ) | (0.02 | ) | ||||
| Return of capital | (0.35 | ) | (0.48 | ) | ||||
| Total distributions | (2.24 | ) | (0.50 | ) | ||||
| Net asset value, end of year/period | $ | 24.41 | $ | 25.11 | ||||
| TOTAL RETURN(c) | 6.58 | % | 2.43 | %(d) | ||||
| RATIOS/SUPPLEMENTAL DATA: | ||||||||
| Net assets, end of year/period (000s) | $ | 5,378 | $ | 142 | ||||
| Ratios to Average Net Assets | ||||||||
| Ratio of expenses to average net assets excluding fee waivers and reimbursements(e) | 5.72 | % | 7.61 | %(f) | ||||
| Ratio of expenses to average net assets including fee waivers and reimbursements(g) | 0.00 | % | 0.00 | %(f) | ||||
| Ratio of net investment income to average net assets | 16.68 | % | 15.94 | %(f) | ||||
| Portfolio turnover rate | 23 | % | 0 | %(d) | ||||
| (a) | Class A inception date was June 21, 2022. |
| (b) | Per share amounts are calculated using the average shares method. |
| (c) | Total returns are historical in nature and assumes changes in net asset value per share, reinvestment of dividends and capital gains distributions, if any, and does not reflect the impact of sales charges. Had the Advisor not absorbed a portion of the Fund expenses, total returns would have been lower. |
| (d) | Not annualized. |
| (e) | Represents the ratio of expenses to average net assets absent fee waivers expense reimbursement and/or recoupment by the Advisor. |
| (f) | Annualized. |
| (g) | In addition to the Expense Limitation Agreement, the Advisor voluntarily absorbed all of the operating expenses of the Fund since the commencement of the Fund's operations, resulting in 5.33% and 5.86% voluntarily waived during the year/period ended September 30, 2023 and September 30, 2022 respectively. In the absence of the election by the Fund's investment advisor to bear all of the Fund's operating expenses, the ratio of expenses to average net assets including fee waivers and reimbursements would have been higher. |
The accompanying notes are an integral part of these financial statements.
16
| Bluerock High Income Institutional Credit Fund - Class C | Financial Highlights |
The table below sets forth financial data for one share of beneficial interest outstanding throughout the periods presented.
| For the Year | For the Period | |||||||
| Ended | Ended | |||||||
| September 30, | September 30, | |||||||
| 2023 | 2022(a) | |||||||
| Net asset value, beginning of year/period | $ | 25.10 | $ | 25.00 | ||||
| INCOME FROM INVESTMENT OPERATIONS: | ||||||||
| Net investment income(b) | 3.87 | 1.08 | ||||||
| Net change in realized and unrealized gain/(loss) on investments | (2.32 | ) | (0.48 | ) | ||||
| Total from investment operations | 1.55 | 0.60 | ||||||
| DISTRIBUTIONS: | ||||||||
| From net investment income | (1.89 | ) | (0.02 | ) | ||||
| Return of capital | (0.35 | ) | (0.48 | ) | ||||
| Total distributions | (2.24 | ) | (0.50 | ) | ||||
| Net asset value, end of year/period | $ | 24.41 | $ | 25.10 | ||||
| TOTAL RETURN(c) | 6.63 | % | 2.39 | %(d) | ||||
| RATIOS/SUPPLEMENTAL DATA: | ||||||||
| Net assets, end of year/period (000s) | $ | 559 | $ | 25 | ||||
| Ratios to Average Net Assets | ||||||||
| Ratio of expenses to average net assets excluding fee waivers and reimbursements(e) | 6.45 | % | 7.31 | %(f) | ||||
| Ratio of expenses to average net assets including fee waivers and reimbursements(g) | 0.00 | % | 0.00 | %(f) | ||||
| Ratio of net investment income to average net assets | 16.09 | % | 15.76 | %(f) | ||||
| Portfolio turnover rate | 23 | % | 0 | %(d) | ||||
| (a) | Class C inception date was June 21, 2022. |
| (b) | Per share amounts are calculated using the average shares method. |
| (c) | Total returns are historical in nature and assumes changes in net asset value per share, reinvestment of dividends and capital gains distributions, if any. Had the Advisor not absorbed a portion of the Fund expenses, total returns would have been lower. |
| (d) | Not annualized. |
| (e) | Represents the ratio of expenses to average net assets absent fee waivers expense reimbursement and/or recoupment by the Advisor. |
| (f) | Annualized. |
| (g) | In addition to the Expense Limitation Agreement, the Advisor voluntarily absorbed all of the operating expenses of the Fund since the commencement of the Fund's operations, resulting in 6.08% and 5.56% voluntarily waived during the year/period ended September 30, 2023 and September 30, 2022 respectively. In the absence of the election by the Fund's investment advisor to bear all of the Fund's operating expenses, the ratio of expenses to average net assets including fee waivers and reimbursements would have been higher. |
The accompanying notes are an integral part of these financial statements.
| Annual Report | September 30, 2023 | 17 |
| Bluerock High Income Institutional Credit Fund - Class F | Financial Highlights |
The table below sets forth financial data for one share of beneficial interest outstanding throughout the periods presented.
| For the Year | For the Period | |||||||
| Ended | Ended | |||||||
| September 30, | September 30, | |||||||
| 2023 | 2022(a) | |||||||
| Net asset value, beginning of year/period | $ | 25.10 | $ | 25.00 | ||||
| INCOME FROM INVESTMENT OPERATIONS: | ||||||||
| Net investment income(b) | 4.00 | 1.08 | ||||||
| Net change in realized and unrealized gain/(loss) on investments | (2.45 | ) | (0.48 | ) | ||||
| Total from investment operations | 1.55 | 0.60 | ||||||
| DISTRIBUTIONS: | ||||||||
| From net investment income | (1.89 | ) | (0.02 | ) | ||||
| Return of capital | (0.35 | ) | (0.48 | ) | ||||
| Total distributions | (2.24 | ) | (0.50 | ) | ||||
| Net asset value, end of year/period | $ | 24.41 | $ | 25.10 | ||||
| TOTAL RETURN(c) | 6.63 | % | 2.39 | %(d) | ||||
| RATIOS/SUPPLEMENTAL DATA: | ||||||||
| Net assets, end of year/period (000s) | $ | 88,359 | $ | 84,108 | ||||
| Ratios to Average Net Assets | ||||||||
| Ratio of expenses to average net assets excluding fee waivers and reimbursements(e) | 5.59 | % | 6.31 | %(f) | ||||
| Ratio of expenses to average net assets including fee waivers and reimbursements(g) | 0.00 | % | 0.00 | %(f) | ||||
| Ratio of net investment income to average net assets | 16.51 | % | 15.75 | %(f) | ||||
| Portfolio turnover rate | 23 | % | 0 | %(d) | ||||
| (a) | Class F inception date was June 21, 2022. |
| (b) | Per share amounts are calculated using the average shares method. |
| (c) | Total returns are historical in nature and assumes changes in net asset value per share, reinvestment of dividends and capital gains distributions, if any. Had the Advisor not absorbed a portion of the Fund expenses, total returns would have been lower. |
| (d) | Not annualized. |
| (e) | Represents the ratio of expenses to average net assets absent fee waivers expense reimbursement and/or recoupment by the Advisor. |
| (f) | Annualized. |
| (g) | In addition to the Expense Limitation Agreement, the Advisor voluntarily absorbed all of the operating expenses of the Fund since the commencement of the Fund's operations, resulting in 4.48% and 4.56% voluntarily waived during the year/period ended September 30, 2023 and September 30, 2022 respectively. In the absence of the election by the Fund's investment advisor to bear all of the Fund's operating expenses, the ratio of expenses to average net assets including fee waivers and reimbursements would have been higher. |
The accompanying notes are an integral part of these financial statements.
18
| Bluerock High Income Institutional Credit Fund - Class I | Financial Highlights |
The table below sets forth financial data for one share of beneficial interest outstanding throughout the periods presented.
| For the Year | For the Period | |||||||
| Ended | Ended | |||||||
| September 30, | September 30, | |||||||
| 2023 | 2022(a) | |||||||
| Net asset value, beginning of year/period | $ | 25.10 | $ | 25.00 | ||||
| INCOME FROM INVESTMENT OPERATIONS: | ||||||||
| Net investment income(b) | 3.82 | 1.08 | ||||||
| Net change in realized and unrealized gain/(loss) on investments | (2.26 | ) | (0.48 | ) | ||||
| Total from investment operations | 1.56 | 0.60 | ||||||
| DISTRIBUTIONS: | ||||||||
| From net investment income | (1.89 | ) | (0.02 | ) | ||||
| Return of capital | (0.35 | ) | (0.48 | ) | ||||
| Total distributions | (2.24 | ) | (0.50 | ) | ||||
| Net asset value, end of year/period | $ | 24.42 | $ | 25.10 | ||||
| TOTAL RETURN(c) | 6.67 | % | 2.39 | %(d) | ||||
| RATIOS/SUPPLEMENTAL DATA: | ||||||||
| Net assets, end of year/period (000s) | $ | 7,656 | $ | 51 | ||||
| Ratios to Average Net Assets | ||||||||
| Ratio of expenses to average net assets excluding fee waivers and reimbursements(e) | 5.44 | % | 6.22 | %(f) | ||||
| Ratio of expenses to average net assets including fee waivers and reimbursements(g) | 0.00 | % | 0.00 | %(f) | ||||
| Ratio of net investment income to average net assets | 15.91 | % | 15.78 | %(f) | ||||
| Portfolio turnover rate | 23 | % | 0 | %(d) | ||||
| (a) | Class I inception date was June 21, 2022. |
| (b) | Per share amounts are calculated using the average shares method. |
| (c) | Total returns are historical in nature and assumes changes in net asset value per share, reinvestment of dividends and capital gains distributions, if any. Had the Advisor not absorbed a portion of the Fund expenses, total returns would have been lower. |
| (d) | Not annualized. |
| (e) | Represents the ratio of expenses to average net assets absent fee waivers expense reimbursement and/or recoupment by the Advisor. |
| (f) | Annualized. |
| (g) | In addition to the Expense Limitation Agreement, the Advisor voluntarily absorbed all of the operating expenses of the Fund since the commencement of the Fund's operations, resulting in 5.08% and 4.47% voluntarily waived during the year/period ended September 30, 2023 and September 30, 2022 respectively. In the absence of the election by the Fund's investment advisor to bear all of the Fund's operating expenses, the ratio of expenses to average net assets including fee waivers and reimbursements would have been higher. |
The accompanying notes are an integral part of these financial statements.
| Annual Report | September 30, 2023 | 19 |
| Bluerock High Income Institutional Credit Fund | Notes to Financial Statements |
| September 30, 2023 |
1. ORGANIZATION
The Bluerock High Income Institutional Credit Fund (the "Fund" or the "Trust") was organized as a Delaware statutory trust on August 19, 2021 and is registered under the Investment Company Act of 1940, as amended (the "1940 Act"), as a closed-end management investment company that operates as an interval fund with a continuous offering of Fund shares. The Fund is non-diversified. The Fund's investment advisor is Bluerock Credit Fund Advisor, LLC (the "Advisor"). WhiteStar Asset Management LLC (the "Sub-Advisor" and/or "WhiteStar") serves as the Fund's investment sub-advisor, pursuant to the Sub-Advisor Agreement with the Advisor. The Fund's primary investment objective is to generate high current income, while secondarily seeking attractive, long-term risk-adjusted returns with low correlation to the broader markets.
The Fund pursues its investment objective by investing, directly or indirectly, in senior secured loans ("Senior Secured Loans"). The Fund may purchase Senior Secured Loans directly in the primary or secondary market and will invest in them indirectly by purchasing various tranches, including senior, junior and equity tranches, of entities that own a diversified pool of Senior Secured Loans known as Collateralized Loan Obligations, or "CLOs", (collectively with Senior Secured Loans, "Target Securities"). The Fund may invest in any structure where the primary collateral or assets are Target Securities. The Fund will generally focus its investment activities on U.S. dollar -denominated loans that (i) are broadly syndicated and made to U.S. companies, (ii) are senior in the capital structure with a priority claim on assets and cash flow of the underlying borrower, (iii) are primarily secured by first priority liens on assets of the underlying borrowers, (iv) are rated BB+ or below, known as "below investment grade" or "junk", or are unrated (v) are floating rate to provide some protection against rising interest rates, (vi) have loan to value ratios generally in the 40 – 60% range at origination, and (vii) in CLOs that own such loans and additionally (a) are diversified by issuer, industry and geography, (b) have senior tranches with high credit ratings in order to maximize excess spread, (c) have attractive risk-adjusted spreads, and (d) are actively managed by experienced CLO collateral managers, including Trinitas Capital Management, LLC ("Trinitas") or other advisors who may also be associated with the Sub-Advisor. Securities which are "below investment grade" or "junk" are predominantly speculative in nature.
The Fund commenced operations on June 21, 2022. The Fund currently offers Class A, Class C, Class F and Class I shares. Class A shares are offered at net asset value plus a maximum sales charge of 5.75%. Class C shares, Class F shares and Class I shares are not subject to sales charges. The minimum initial investment by a shareholder for Class A shares is $2,500 for regular accounts and $1,000 for retirement plan accounts, and a minimum subsequent investment of at least $100 for regular accounts and $50 for retirement plan accounts. Class A shares that were purchased in amounts of $1,000,000 or more that have been held less than one year (365 days) from the purchase date will be subject to an early withdrawal charge of 1.00% of the original purchase price. The minimum initial investment by a shareholder for Class C shares is $2,500 for regular accounts and $1,000 for retirement plan accounts, and a minimum subsequent investment of at least $100 for regular accounts and retirement plan accounts. Class C shares that have been held less than one year (365 days) from the purchase date will be subject to an early withdrawal charge of 1.00% of the original purchase price. The minimum initial investment for Class I shares is $1,000,000, while subsequent investments may be made with any amount. There is no minimum initial investment amount for Class F shares. Class F shares are not publicly available for purchase.
2. SUMMARY OF SIGNIFICANT ACCOUNTING POLICIES
The following is a summary of significant accounting policies followed by the Fund in preparation of its financial statements. These policies are governed by accounting principles generally accepted in the United States of America ("GAAP"). The preparation of financial statements requires management to make estimates and assumptions that affect the reported amounts of assets and liabilities and disclosure of contingent assets and liabilities at the date of the financial statements and the reported amounts of income, expenses and unrealized gain/(loss) on investments for the period. Actual results could differ from those estimates. The Fund is an investment company and accordingly follows the investment company accounting and reporting guidance of the Financial Accounting Standards Board ("FASB") Accounting Standard Codification ("ASC") Topic 946 "Financial Services – Investment Companies.”
A. Valuation of Investments – Fund investments are recognized at fair value, and subsequent changes in fair value are recognized in unrealized appreciation/(depreciation) on investments in the Statement of Operations. Fund investments are valued in accordance with FASB ASC Topic 820 "Fair Value Measurement", and governed by the Fund's valuation policies. The Fund's Board of Trustees (the "Board") has named the Advisor as its valuation designee. As the valuation designee, the Advisor executes the Fund's valuation policies. The Board reviews the execution of this process at least annually to assure the process produces reliable results. Fair valuation involves subjective judgments, and it is possible that the fair value determined for a security may differ materially from the value that could be realized upon the sale of the security. There is no single standard for determining fair value of a security. Rather, in determining the fair value of a security for which there are no readily available market quotations, several factors may be considered, including fundamental analytical data relating to the investment in the security, the nature and duration of any restriction on the disposition of the security, the cost of the security at the date of purchase, the liquidity of the market for the security and the recommendation of the Fund's third-party valuation consultants. The Advisor will attempt to obtain current information to value all fair valued securities.
20
| Bluerock High Income Institutional Credit Fund | Notes to Financial Statements |
| September 30, 2023 |
Fair valuation procedures may be used to value a substantial portion of the assets of the Fund, including the Fund's investments in CLOs. The Fund may use the fair value of a security to calculate its NAV when, for example, (1) a portfolio security is not traded in a public market or the principal market in which the security trades is closed, (2) trading in a portfolio security is suspended and not resumed prior to the normal market close, (3) a portfolio security is not traded in significant volume for a substantial period, or (4) the Advisor determines that the quotation or price for a portfolio security provided by a broker-dealer or independent pricing service is inaccurate.
The fair value of securities may be difficult to determine and thus judgment plays a greater role in the valuation process. The fair valuation methodology may include or consider the following guidelines, as appropriate: (1) evaluation of all relevant factors, including but not limited to, pricing history, current market level, supply and demand of the respective security; (2) comparison to the values and current pricing of securities that have comparable characteristics; (3) knowledge of historical market information with respect to the security; (4) other factors relevant to the security which would include, but not be limited to, duration, yield, fundamental analytical data, the Treasury yield curve, and credit quality.
The values assigned to fair valued investments are based on available information and do not necessarily represent amounts that might ultimately be realized, since such amounts depend on future developments inherent in long-term investments. Changes in the fair valuation of portfolio securities may be less frequent and of greater magnitude than changes in the price of portfolio securities valued at their last sale price, by an independent pricing service, or based on market quotations. Imprecision in estimating fair value can also impact the amount of unrealized appreciation or depreciation recorded for a particular portfolio security and differences in the assumptions used could result in a different determination of fair value, and those differences could be material.
The Fund utilizes various methods to measure the fair value of its investments in accordance with FASB ASC Topic 820 "Fair Value Measurement". The framework establishes a hierarchy that prioritizes inputs to valuation methods, which the Fund utilizes on a recurring basis. The three levels of input are:
| Level 1 – | Unadjusted quoted prices in active markets for identical assets and liabilities that the Fund has the ability to access. |
| Level 2 – | Observable inputs other than quoted prices included in Level 1 that are observable for the asset or liability, either directly or indirectly. These inputs may include quoted prices for the identical instrument on an inactive market, prices for similar instruments, interest rates, prepayment speeds, credit risk, yield curves, default rates and similar data. |
| Level 3 – | Unobservable inputs for the asset or liability, to the extent relevant observable inputs are not available, representing the Fund's own assumptions about the assumptions a market participant would use in valuing the asset or liability, and would be based on the best information available. |
The availability of observable inputs can vary from security to security and is affected by a wide variety of factors, including, for example, the type of security, whether the security is new and not yet established in the marketplace, the liquidity of markets, and other characteristics particular to the security. To the extent that valuation is based on models or inputs that are less observable or unobservable in the market, the determination of fair value requires more judgment. Accordingly, the degree of judgment exercised in determining fair value is greatest for instruments categorized in Level 3.
The inputs used to measure fair value may fall into different levels of the fair value hierarchy. In such cases, for disclosure purposes, the level in the fair value hierarchy within which the fair value measurement falls in its entirety, is determined based on the lowest level input that is significant to the fair value measurement in its entirety. The valuation techniques used by the Fund to measure fair value during the year ended September 30, 2023, maximized the use of observable inputs and minimized the use of unobservable inputs. The inputs or methodology used for valuing securities are not necessarily an indication of the risk associated with investing in those securities. The following tables summarize the inputs used as of September 30, 2023 for the Fund's investments measured at fair value:
| Investments in Securities at Value | Level 1 | Level 2 | Level 3 | Total | ||||||||||||
| Collateralized Loan Obligations | $ | – | $ | – | $ | 99,914,407 | $ | 99,914,407 | ||||||||
| Short Term Investments | 5,735,929 | – | – | 5,735,929 | ||||||||||||
| TOTAL | $ | 5,735,929 | $ | – | $ | 99,914,407 | $ | 105,650,336 | ||||||||
| Annual Report | September 30, 2023 | 21 |
| Bluerock High Income Institutional Credit Fund | Notes to Financial Statements |
| September 30, 2023 |
The following table shows the aggregate changes in fair value of the Fund's Level 3 investments during the year ended September 30, 2023.
| Asset Type | Balance as of September 30, 2022 | Discount/ Premium | Realized Gain/ (Loss) | Change in Unrealized Appreciation/ Depreciation | Purchases | Sales Proceeds | Balance as of September 30, 2023 | Net Change in Unrealized Appreciation/ (Depreciation) Included in the Statements of Operations Attributable to Level 3 Investments Held at September 30, 2023 | ||||||||||||||||||||||||
| Collateralized Loan Obligations | $ | 85,859,582 | $ | 584,926 | $ | (2,888,644 | ) | $ | (5,839,581 | ) | $ | 42,506,874 | $ | (20,308,750 | ) | $ | 99,914,407 | $ | (6,742,314 | ) | ||||||||||||
A.1. Valuation of Collateralized Loan Obligations – The Fund primarily invests in junior debt and equity tranches of CLOs. With respect to CLOs, the Fund has engaged an independent third-party valuation specialist to assist in estimating fair value for such securities in circumstances where a market price is not readily available. The factors that may be considered with respect to the valuation of CLOs include: loan terms and covenants, loan duration, contract (coupon) rate, rate structure, quality of collateral, debt service coverage ratio, prevailing interest rates, borrower's ability to adequately service its debt, loan prepayment rate, loan default rate, loan default recovery percentage, recent loan ratings migration, average loan prices in secondary market, pipeline of new issue CLO issuance, environment of high-yield bond markets, market interest rate sentiment, and other factors deemed applicable. All of these factors may be subject to adjustments based upon the particular circumstances of a security or the Fund's actual investment position. In addition, the Advisor considers the operating metrics of the specific investment vehicle, including compliance with collateralization tests, defaulted and restructured securities, payment defaults, if any, and covenant cushions. In periods of illiquidity and volatility, the Advisor may rely more heavily on other qualities and metrics, including, but not limited to, the collateral manager, time left in the reinvestment period, and expected cash flows and overcollateralization ratios.
The Advisor categorizes CLO investments as a Level 3 investment. Certain pricing inputs may be unobservable. An active market may exist, but not necessarily for CLO investments in which the Fund invests. The Advisor incorporates the prices from a third-party valuation specialist to estimate the fair value of CLO investments. Estimates are based on detailed information on the characteristics of each CLO, including recent information about the underlying senior secured loans and CLO debt liabilities from data sources such as trustee reports, in order to project future cash flows in a consistent and transparent manner.
The following table summarizes the quantitative inputs and assumptions used for investments categorized as Level 3 of the fair value hierarchy as of September 30, 2023. In addition to the technique and inputs noted in the table below, the Advisor may use other valuation techniques and methodologies when determining the Fund's fair value measurements as provided for in the valuation policy approved by the Board. The table below is not intended to be all-inclusive, but rather provides information on the significant Level 3 inputs as they relate to the Fund's fair value measurements as of September 30, 2023. Unobservable inputs and assumptions are periodically reviewed and updated as necessary to reflect current market conditions.
| Asset Class | Fair Value at September 30, 2023 | Valuation Technique/Methodologies | Unobservable Inputs | Range/Weighted Average(1) | |||||
| Collateralized Loan Obligations | $ | 99,914,407 | Discounted Cash Flows | Annual Default Rate | 1.57% - 2.00% / 1.91% | ||||
| Annual Prepayment Rate | 25.00% | ||||||||
| Reinvestment Price | $95.50 - $99.50 / $98.63 | ||||||||
| Recovery Rate | 70.00% | ||||||||
| Expected Yield | 12.48% - 27.71% / 17.36% | ||||||||
| (1) | Weighted average calculations are based on the fair value of investments as of September 30, 2023. In the cases where no range is provided, a single assumption is being utilized. |
Increases (decreases) in the annual default rate, reinvestment price and expected yield in isolation would result in a lower (higher) fair value measurement. Increases (decreases) in recovery rate in isolation would result in a higher (lower) fair value measurement. Changes in the annual prepayment rate may result in a higher (or lower) fair value, depending on the circumstances. Generally, a change in the assumption used for the annual default rate may be accompanied by a directionally opposite change in the assumption used for the annual prepayment rate and recovery rate.
22
| Bluerock High Income Institutional Credit Fund | Notes to Financial Statements |
| September 30, 2023 |
A.2. Valuation of Other Investments – Debt securities, including restricted securities, are valued based on evaluated prices received from a third party pricing vendor or from brokers who make markets in such securities. Debt securities are valued by pricing vendors who utilize matrix pricing which considers yield or price of bonds of comparable quality, coupon, maturity and type or by broker-supplied prices. When independent prices are unavailable or unreliable, debt securities may be valued utilizing pricing methodologies which consider similar factors that would be used by third party pricing vendors. Debt securities are generally categorized as Level 2 in the hierarchy but may be Level 3 depending on the circumstances. The Fund will generally focus its investments in below investment grade securities. The value of these securities can be more volatile due to changes in the credit quality of the issuer and is sensitive to changes in economic, market and regulatory conditions. The Fund currently invests a portion of its assets, including excess cash, in a short term money market fund, which is valued at NAV on a daily basis and categorized as Level 1 in the hierarchy. Short-term investments that mature in 60 days or less may be valued at amortized cost, provided such valuations represent fair value.
B. Security Transaction, Investment Income Recognition and Expenses – Investment security transactions are accounted for on a trade date basis. Cost is determined and gains and losses are based upon the specific identification method for both financial statement and federal income tax purposes. Dividend income from short term money market investments is recorded on an accrual basis. Interest income from investments in CLO debt is recorded using the accrual basis of accounting to the extent such amounts are expected to be collected. Interest income on investments in CLO debt is generally expected to be received in cash. Amortization of premium or accretion of discount is recognized using the effective interest method. Generally, if the Fund does not expect the borrower to be able to service its debt and other obligations, the Fund will, on a discretionary basis, place the debt investment on non-accrual status and will generally cease recognizing interest income on that investment for financial reporting purposes until all principal and interest have been brought current through payment or due to restructuring such that the interest income is deemed to be collectible. The Fund generally restores non-accrual debt investments to accrual status when past due principal and interest is paid and, in the Fund's judgment, the payments are likely to remain current. As of September 30, 2023, the Fund had no non-accrual debt investments in its portfolio. Interest income from investments in CLO equity is recorded based on an estimation of an effective yield to expected maturity utilizing estimated future cash flows. Interest income from CLO equity investments is monitored on an ongoing basis and is updated periodically to account for any change in expected future cash flows. Any difference between the actual cash received from CLO equity investments and the income recognized by the Fund is recorded as an adjustment to the cost basis of the investment.
C. Organizational and Offering Costs – All costs incurred by the Fund in connection with its organization and offering that have been paid by the Advisor will be subject to reimbursement as described in Note 3. Offering costs incurred by the Fund are treated as deferred charges until operations commence and thereafter amortized over a 12 month period using the straight line method. For the year ended September 30, 2023, the Fund amortized $205,550.
D. Federal Income Taxes – The Fund intends to comply with the requirements of Subchapter M of the Internal Revenue Code applicable to regulated investment companies and will distribute all of its taxable income, if any to shareholders. Accordingly, no provision for Federal income taxes is required in the financial statements.
The Fund recognizes the tax benefits of uncertain tax positions only when the position is “more likely than not” to be sustained assuming examination by tax authorities. Management has reviewed the tax positions and has concluded that no liability for unrecognized tax benefits is expected to be taken in the Fund’s 2023 tax returns. The Fund identifies its major tax jurisdiction as U.S. Federal. The Fund recognizes interest and penalties, if any, related to unrecognized tax benefits as income tax expense in the Statement of Operations. During the year ended September 30, 2023, the Fund did not incur any interest or penalties. Generally tax authorities can examine tax returns filed for the last three years.
E. Distributions to Shareholders – Distributions from investment income are declared daily and paid quarterly. Distributions from net realized capital gains, if any, are declared and paid annually and are recorded on the ex-dividend date. The character of income and gains to be distributed is determined in accordance with income tax regulations, which may differ from GAAP.
F. Cash and Cash Equivalents – Cash and cash equivalents are held with a financial institution. The asset of the Funds may be placed in deposit accounts at U.S. banks and such deposits generally exceed Federal Deposit Insurance Corporation (“FDIC”) insurance limits. The Fund currently invests excess cash in a short term money market fund, which is valued at NAV on a daily basis and categorized as Level 1 in the hierarchy. The FDIC insures deposit accounts up to $250,000 for each account holder. At September 30, 2023, the Fund held $212,987 with the Custodian.
G. Indemnification – The Trust indemnifies its officers, trustees and distributor for certain liabilities that may arise from the performance of their duties to the Trust. Additionally, in the normal course of business, the Fund enters into contracts that contain a variety of representations and warranties and which provide general indemnities. The Fund’s maximum exposure under these arrangements is unknown, as this would involve future claims that may be made against the Fund that have not yet occurred. However, based on experience, the Trust expects the risk of loss due to these warranties and indemnities to be remote.
| Annual Report | September 30, 2023 | 23 |
| Bluerock High Income Institutional Credit Fund | Notes to Financial Statements |
| September 30, 2023 |
H. Recent Accounting Pronouncements – In March 2020, the FASB issued Accounting Standards Update ("ASU") 2020-04, Reference Rate Reform (Topic 848): Facilitation of the Effects of Reference Rate Reform on Financial Reporting ("ASU 2020-04"). The amendments in ASU 2020-04 provide optional expedients and exceptions for applying GAAP to certain contracts, hedging relationships, and other transactions that reference LIBOR or another reference rate expected to be discontinued due to reference rate reform. In January 2021, the FASB issued ASU No. 2021-01, "Reference Rate Reform (Topic 848)," which expanded the scope of Topic 848 to include derivative instruments impacted by discounting transition. ASU 2020-04 and ASU 2021-01, as updated by ASU 2022-06, are effective as of March 12, 2020 through December 31, 2024. The Fund adopted the standard and it had no material effect on the Fund's financial statements.
3. RELATED-PARTY TRANSACTIONS, SERVICE PROVIDERS AND TRUSTEE COMPENSATION
A. Related Party Transactions
Investment Advisory Agreement– Pursuant to an investment management agreement between the Trust and the Advisor, (the “Advisory Agreement”), investment advisory services are provided to the Fund by the Advisor. Under the terms of the Advisory Agreement, the Advisor is entitled to receive a fee consisting of two components — a base management fee and an incentive fee. The base management fee is calculated and payable monthly in arrears at the annual rate of 1.75% of the average value of the Fund’s daily net assets during such period. The incentive fee is calculated and payable quarterly in arrears in an amount equal to 20% of the Fund’s “pre-incentive fee net investment income” for the immediately preceding quarter, and is subject to a hurdle rate, expressed as a rate of return on the Fund’s daily net assets, equal to 2.0% per quarter (or an annualized hurdle rate of 8.0%), subject to a “catch-up” feature, which allows the Advisor to recover foregone incentive fees that were previously limited by the hurdle rate. For these purposes, “pre-incentive fee net investment income” means interest income, dividend income and any other income accrued during the calendar quarter, minus the Fund’s quarterly operating expenses (including the base management fee, expenses reimbursed to the Advisor or Sub-Advisor and any interest expenses and distributions paid on any issued and outstanding preferred shares, but excluding the incentive fee). For the year ended September 30, 2023, the Advisor earned a base management fee of $1,574,272 and incentive fees of $2,452,902. No management fees and incentive fees were paid by the Fund during the period as the Advisor voluntarily waived or absorbed all fees during the year. As of September 30, 2023, the due to advisor amount of $134,740, represents amounts paid by the Advisor to the Fund for payments of Fund expenses.
Sub-advisory services are provided to the Fund pursuant to the Sub-Advisor Agreement between the Advisor and WhiteStar. Under the terms of the Sub-Advisor Agreement, the Sub-Advisor is paid 50% of the net investment advisory fees paid to the Advisor by the Fund pursuant to the Advisor Agreement between the Fund and the Advisor. The compensation is not an expense of the Fund.
Expense Limitation Agreement – The Advisor and the Fund have entered into an expense limitation agreement (the “Expense Limitation Agreement”) under which the Advisor has contractually agreed to waive its base management fees and to pay or absorb the ordinary operating expenses of the Fund (including offering and organizational expenses, but excluding taxes, interest, brokerage commissions, acquired fund fees and expenses, incentive fees, and extraordinary expenses), to the extent that such expenses exceed 2.60%, 3.35%, 1.75% and 2.35% per annum of the Fund's average daily net assets attributable to Class A shares, Class C shares, Class F shares and Class I shares, respectively (the “Expense Limitation”). In consideration of the Advisor’s agreement to limit the Fund's expenses, the Fund has agreed to repay the Advisor in the amount of any fees waived and Fund expenses paid or absorbed, subject to the limitations that: (1) the reimbursement for fees and expenses will be made only if payable not more than three years from the date which they were occurred; (2) the reimbursement may not be made if it would cause the current, or then in effect Expense Limitation to be exceeded; and (3) the reimbursement is approved by the Board. The Expense Limitation Agreement will be effective from the date of the Fund’s registration, which was effective June 21, 2022, until January 31, 2024, unless and until the Board approves its modification or termination. After January 31, 2024, the Expense Limitation Agreement may be renewed at the Advisor’s and Board's discretion. The Advisor’s ability to recover organizational and offering costs, subject to the terms of the Expense Limitation Agreement, will expire within the three years following the date the waiver or reimbursement occurred. For the year ended September 30, 2023, the Advisor waived $970,956 pursuant to the Expense Limitation Agreement, which is subject to recoupment per the terms aforementioned. As of September 30, 2023, it is not probable that the Fund will be able to recoup this amount. Including amounts waived during the year ended September 30, 2023, cumulative fees and/or expenses subject to recapture pursuant to the aforementioned conditions amounted to $1,372,688 and will expire during the fiscal years indicated below:
| 2025 | 2026 | |||||||
| Bluerock High Income Institutional Credit Fund | $ | 401,732 | $ | 970,956 | ||||
24
| Bluerock High Income Institutional Credit Fund | Notes to Financial Statements |
| September 30, 2023 |
In addition to the Expense Limitation Agreement described above, the Advisor voluntarily waived or absorbed all of the operating expenses of the Fund for the year ended September 30, 2023, which amounted to $4,062,861. Operating expenses voluntarily waived or absorbed by the Advisor during the aforementioned period are not subject to recoupment by the Advisor. The Advisor may continue to bear such expenses on a going forward basis in its discretion and is under no obligation to continue to do so for any specified period of time.
B. Service Providers – ALPS Fund Services, Inc. (“ALPS”) provides administrative, fund accounting, compliance and other services to the Fund for a monthly administration fee based on the greater of an annual minimum fee or an asset based fee, which scales downward based upon average daily net assets.
UMB Bank, N.A (“Custodian”), with principal offices at 1010 Grand Boulevard, Kansas City, Missouri 64106, serves as the Fund’s custodian.
DST Systems, Inc. ("DST"), serves as the Transfer Agent to the Fund. Under the Transfer Agency Agreement, DST is responsible for maintaining all shareholder records of the Fund.
The distributor of the Fund is ALPS Distributors, Inc. (the “Distributor”). The Distributor acts as an agent for the Fund and the distributor of its shares. The Board has adopted, on behalf of the Fund, a Shareholder Services Plan and a Distribution Plan under which the Fund may compensate financial industry professionals for providing ongoing services in respect to clients with whom they have distributed shares of the Fund. Under the Shareholder Services Plan, the Fund pays up to 0.25% per year of the average daily net assets of each of Class A and Class C shares for such services. Class F shares and Class I shares are not subject to a shareholder servicing fee. Under the Distribution Plan, the Fund pays 0.75% per year of its average daily net assets for such services for Class C shares. Class A Shares, Class F shares, and Class I shares are not subject to a distribution fee. Fees under the Shareholder Services Plan and Distribution Plan are disclosed in the Statement of Operations for the year ended September 30, 2023.
The Distributor acts as the Fund's principal underwriter in a continuous public offering of the Fund's shares. For the year ended September 30, 2023, the Distributor paid $195,680 in underwriting commissions for sales of Class A shares, of which $33,387 was retained by the principal underwriter. For the year ended September 30, 2023, the Distributor paid $5,244 in advanced underwriting commissions for sales of Class C.
The Distributor has entered into a wholesale marketing agreement with Bluerock Capital Markets, LLC (“BCM”), a registered broker-dealer affiliate of the Advisor. Pursuant to the terms of the wholesale marketing agreement, BCM will seek to market and otherwise promote the Fund through various “wholesale” distribution channels, including regional and independent retail broker-dealers. BCM will receive a portion of the sales load from the sale of certain classes of Fund shares for its services provided under these agreements. For the year ended September 30, 2023, BCM received $29,839.
C. Trustee Compensation – Each Trustee who is not affiliated with the Trust or the Advisor receives an annual fee of $10,000, paid quarterly, of which $5,000 is paid in cash and the remaining is paid in the equivalent amount of the Fund shares, as well as reimbursement for any reasonable expenses incurred attending the meetings.
4. INVESTMENT TRANSACTIONS
The cost of purchases and proceeds from the sale of securities, other than short-term securities, for the year ended September 30, 2023, amounted to $42,506,874 and $20,308,750 respectively.
5. REPURCHASE OFFERS / SHARES OF BENEFICIAL INTEREST
Pursuant to Rule 23c-3 under the 1940 Act, the Fund offers shareholders on a quarterly basis the option of redeeming shares, at NAV, of no less than 5% and no more than 25% of the shares outstanding on the Repurchase Request Deadline which is the date the repurchase off ends (as defined in the Fund’s prospectus). The Board shall determine the quarterly repurchase offer amount. There is no guarantee that shareholders will be able to sell all of the shares they desire in a quarterly repurchase offer, although each shareholder will have the right to require the Fund to purchase up to and including 5% of such shareholder's shares in each quarterly repurchase. Limited liquidity will be provided to shareholders only through the Fund's quarterly repurchases.
| Annual Report | September 30, 2023 | 25 |
| Bluerock High Income Institutional Credit Fund | Notes to Financial Statements |
| September 30, 2023 |
During the year ended September 30, 2023, the Fund completed four quarterly repurchase offers. The Fund offered to repurchase up to 5% of the number of its outstanding shares as of the Repurchase Pricing Dates. The results of the repurchase offers were as follows:
| Repurchase Offer | Repurchase Offer | Repurchase Offer | Repurchase Offer | |||||||||||||
| Commencement Date | September 26, 2022 | December 29, 2022 | March 30, 2023 | June 29, 2023 | ||||||||||||
| Repurchase Request Deadline | November 7, 2022 | February 9, 2023 | May 9, 2023 | August 8, 2023 | ||||||||||||
| Repurchase Pricing Date | November 7, 2022 | February 9, 2023 | May 9, 2023 | August 8, 2023 | ||||||||||||
| Net Asset Value as of Repurchase Offer Date: | ||||||||||||||||
| Class A | $ | 24.77 | $ | 24.44 | $ | 24.24 | $ | 23.83 | ||||||||
| Class C | $ | 24.77 | $ | 24.44 | $ | 24.25 | $ | 23.84 | ||||||||
| Class F | $ | 24.77 | $ | 24.44 | $ | 24.24 | $ | 23.83 | ||||||||
| Class I | $ | 24.77 | $ | 24.45 | $ | 24.25 | $ | 23.84 | ||||||||
| Amount Repurchased: | ||||||||||||||||
| Class A | $ | - | $ | - | $ | 9,716 | $ | 12,582 | ||||||||
| Class C | $ | - | $ | - | $ | - | $ | - | ||||||||
| Class F | $ | - | $ | - | $ | - | $ | - | ||||||||
| Class I | $ | - | $ | - | $ | 597 | $ | 47,432 | ||||||||
| Total Number of Shares Tendered: | - | - | 425 | 2,518 | ||||||||||||
| Percentage of Shares Tendered that were Repurchased: | NA | NA | 100.00 | % | 100.00 | % | ||||||||||
6. DISTRIBUTIONS TO SHAREHOLDERS AND TAX COMPONENTS OF CAPITAL
The Fund's distribution policy is to make quarterly distributions to shareholders. The level of quarterly distributions is not fixed (and all or a portion of a distribution may consist of a return of capital), but is expected to represent an annual rate of approximately 8.0% of the Fund's current net asset value per share. Such distributions are accrued daily (Saturdays, Sundays and holidays included) and paid quarterly. This distribution policy is subject to change. Unless a shareholder elects otherwise, the shareholder's distributions will be reinvested in additional shares of the same class under the Fund's dividend reinvestment policy. Shareholders who elect not to participate in the Fund's dividend reinvestment policy will receive all distributions in cash paid to the shareholder of record (or, if the shares are held in street or other nominee name, then to such nominee). Distributions are made at the class level, so they may vary from class to class within the Fund. For the year ended September 30, 2023, the Fund accrued dividends of $8,320,702, of which $4,346,481 was reinvested in shares.
The tax character of Fund distributions for the following years was as follows:
| Year | Ordinary Income | Long-Term Capital Gain | Return of Capital | ||||||||||
| 2023 | $ | 7,013,121 | $ | – | $ | 1,307,581 | |||||||
| 2022 | 81,119 | – | 1,590,483 | ||||||||||
As of September 30, 2023, the aggregate costs of investments, gross unrealized appreciation/(depreciation) and net unrealized appreciation for Federal tax purposes were as follows:
| Gross Appreciation (excess of value over tax cost) | Gross Depreciation (excess of tax cost over value) | Net Unrealized Appreciation | Cost of Investments for Income Tax Purposes | |||||||||||||||
| $ | 3,635,360 | $ | (764,053 | ) | $ | 2,871,307 | $ | 102,779,029 | ||||||||||
The difference between book basis and tax basis distributable earnings and unrealized appreciation/(depreciation) is primarily attributable to Qualified Electing Funds and partnerships.
Under current law, capital losses maintain their character as short-term or long-term and are carried forward to the next tax year without expiration. As of the current fiscal year end, the following amounts are available as carry forwards to the next tax year:
| Fund Name | Short Term | Long Term | ||||||
| Bluerock High Income Institutional Credit Fund | $ | – | $ | 1,841,650 | ||||
| 26 |
| Bluerock High Income Institutional Credit Fund | Notes to Financial Statements |
| September 30, 2023 |
As of September 30, 2023, the components of accumulated earnings/(deficit) on a tax basis were as follows:
| Accumulated net realized loss on investments | Other cumulative effect of timing differences | Net unrealized appreciation on investments | Total | |||||||||||||||
| $ | (1,841,650 | ) | $ | – | $ | 2,871,307 | $ | 1,029,657 | ||||||||||
7. EARLY WITHDRAWAL CHARGE
Class A shareholders and Class C shareholders who tender for repurchase shares that have been held less than one year (365 days) from the purchase date will be subject to an early withdrawal charge of 1.00% of the original purchase price with respect to such shares. The early withdrawal change does not apply to shares that were acquired through reinvestment of distributions or in connection with the death or disability of the shareholder. The early withdrawal change is paid directly to the Fund. For the year ended September 30, 2023, the Fund did not receive any such fees.
8. RISKS AND UNCERTAINTIES
In the normal course of business, the Fund faces certain risks and uncertainties. Set forth below is a summary of certain principal risks associated with the Fund. The following is not intended to be a complete list of all the potential risks associated with the Fund. For a more comprehensive list of potential risks the Fund may be subject to, please refer to the Fund’s Prospectus and Statement of Additional Information.
Collateralized Loan Obligation (CLO) Risk – In addition to the general risks associated with investments in debt instruments and securities discussed herein, CLOs carry additional risks, including, but not limited to (i) the possibility that distributions from collateral will not be adequate to make interest or other payments; (ii) the quality of the collateral may decline in value or default; (iii) the possibility that the Fund’s investments in CLOs are subordinate to other classes or tranches thereof; and (iv) the complex structure of the CLO investment may not be fully understood at the time of investment and may produce disputes with the issuer, holders of senior tranches or other unexpected investment results.
In addition, CLOs and other structured products are often governed by a complex series of legal documents and contracts, which define the class or tranche of each investment, and may also increase the risk of dispute over the interpretation and enforceability of such documents relative to other types of investments. In a typical CLO, the capital structure would include approximately 90% debt, of which over 85% is generally investment grade, with the remainder comprising the junior most CLO securities, typically referred to as the CLO’s junior debt tranche and equity tranche. The Fund may acquire CLO investments in such equity and junior debt securities, which are subordinate to more senior tranches of the CLO. Such CLO equity and junior debt securities are therefore subject to increased risk of default relative to the holders of more senior tranches of the CLO. The Fund’s investment in equity tranches of CLO securities will be in the first loss position and junior debt tranches typically will be subordinate to more senior positions with respect to realized losses on the assets of the CLOs in which it is invested.
In connection with a primary issuance of a CLO, the structure of the CLO allows the CLO manager to purchase additional collateral (loans) for the CLO after the closing date of the Fund’s investment (the “Warehouse Period”). During the Warehouse Period, the price and availability of additional collateral may be adversely affected by a number of market factors, including price volatility and availability of investments suitable for the CLO, which could hamper the ability of the collateral manager to acquire additional collateral that will satisfy specified concentration limitations and allow the CLO to reach the initial par amount of collateral prior to its effective date. An inability or delay in reaching the target initial par amount of collateral may adversely affect the timing and amount of interest or principal payments received by the holders of the CLO debt securities and distributions of the CLO on equity securities and could result in early redemptions which may cause CLO debt and equity investors to receive less than face value of their investment, resulting in a loss.
The failure by a CLO in which the Fund invests to satisfy financial covenants, including with respect to adequate collateralization and/or interest coverage tests, could lead to a reduction in the CLO’s payments to the Fund. In the event that a CLO fails certain tests, holders of CLO senior debt may be entitled to additional payments that would, in turn, reduce the payments the holders of the junior debt tranche and the equity tranche would otherwise be entitled to receive. Separately, the Fund may incur expenses to the extent necessary to seek recovery upon default or to negotiate new terms, which may include the waiver of certain financial covenants, in connection with a defaulting CLO or any other investment the Fund may make. If any of these occur, it could adversely affect the Fund’s operating results and cash flows.
The Fund’s investments in Senior Secured Loans in CLOs may be riskier and less transparent to the Sub-Advisor than direct investments in the underlying companies. The Sub-Advisor cannot be certain that due diligence investigations with respect to any investment opportunity for the Fund will reveal or highlight all relevant facts (including fraud) that may be necessary or helpful in evaluating such investment opportunity, or that its due diligence investigations will result in investments for the Fund being successful. There is limited control of the administration and amendment of Senior Secured Loans in CLOs. Senior Secured Loans in CLOs may be sold and replaced resulting in a loss to the Fund.
| Annual Report | September 30, 2023 | 27 |
| Bluerock High Income Institutional Credit Fund | Notes to Financial Statements |
| September 30, 2023 |
The Fund’s CLO investments are exposed to leveraged credit risk. If certain minimum collateral value ratios and/or interest coverage ratios are not met by a CLO, primarily due to defaults under the Senior Secured Loans in which the CLO has invested, then cash flow that otherwise would have been available to pay distributions to the Fund on its CLO investments may instead be used to redeem senior tranches or to purchase additional collateral for all tranches, until the ratios again exceed the minimum required levels or any the senior tranches of CLO debt are repaid in full. The Fund’s investments in CLOs or Senior Secured Loans may prepay more quickly than expected, which could have an adverse impact on the Fund’s net assets and/or returns.
The Fund may recognize “phantom” taxable income (due to allocations of profits or cancellation of debt, which results in recognition of taxable income regardless of whether a corresponding amount of cash is actually received) from its investments in these subordinated tranches of CLOs and structured notes. The CLOs in which the Fund invests may constitute Passive Foreign Investment Companies (“PFICs”). If the Fund acquires shares in a PFIC (including in CLOs that are PFICs), the Fund may be subject to U.S. federal income tax on a portion of any “excess distribution” or gain from the disposition of such shares even if such income is distributed as a taxable dividend by the Fund to its shareholders. Certain elections may be available to mitigate or eliminate such tax on excess distributions, but such elections (if available) will generally require the Fund to recognize its share of the PFICs income for each year regardless of whether it receives any distributions from such PFICs. The Fund must nonetheless distribute such income to maintain its status as a Regulated Investment Company ("RIC").
Market Risk – An investment in the Fund's shares is subject to investment risk, including the possible loss of the entire principal amount invested. The value of Fund investments, like other market investments, may move up or down, sometimes rapidly and unpredictably, which will subject shareholders to risk. In addition, the Fund is subject to the risk that geopolitical and other similar events will disrupt the economy on a national or global level. For instance, war, terrorism, market manipulation, government defaults, government shutdowns, political changes or diplomatic developments, public health emergencies (such as the spread of infectious diseases, pandemics and epidemics) and natural/environmental disasters can all negatively impact the securities markets.
Debt Securities and Interest Rate Risks – Because the Fund invests primarily in debt-anchored instruments and securities, the value of your investment in the Fund may fluctuate with changes in interest rates. Typically, a rise in market interest rates will cause a decline in the value of fixed rate or other debt instruments. If market interest rates increase, there is a significant risk that the value of the Fund’s investment in fixed rate debt securities may fall, and that it may be more difficult for the Fund to raise capital. Related risks include credit risk (the debtor may default) and prepayment risk (the debtor may pay its obligation early, reducing the amount of interest payments).
Credit Risk – It is possible that the borrowers under the Senior Secured Loans may not make scheduled interest and/or principal payments on their loans and/or debt securities, which may result in losses or reduced cash flow to the Fund, either or both of which may cause the Net Asset Value of, or the distributions by, the Fund to decrease. In addition, the credit quality of securities held by the Fund may fall if the underlying borrowers’ financial condition deteriorates. This also may negatively impact the value of and the Fund’s returns on its investment in such securities.
Prepayment Risk – Debt securities may be subject to prepayment risk because borrowers are typically able to repay their debt obligations prior to maturity principal. Consequently, a debt security's maturity may be longer or shorter than anticipated. When interest rates fall, debt obligations tend to be refinanced or otherwise paid off more quickly than originally anticipated. If that occurs with respect to the Fund’s investments, the Fund may have to invest the prepaid proceeds in securities with lower yields. When interest rates rise, obligations will tend to be paid off by the obligor more slowly than anticipated, preventing the Fund from reinvesting at higher comparable or yields. For certain investments, lower-than-expected prepayment rates may expose investments in the junior tranches of CLOs to credit risks for longer periods of time.
LIBOR Risk – The Fund invests in Target Securities that may have floating or variable rate calculations for payment obligations or financing terms based on the London Interbank Offered Rate (LIBOR), which historically has been the benchmark interest rate at which major global banks lend to one another in the international interbank market for short-term loans. It was originally anticipated that LIBOR would be discontinued by the end of 2021 and would cease to be published after that time. Although many LIBOR rates were phased out at the end of 2021 as originally intended, a selection of widely used USD LIBOR rates were published until June 2023 in order to assist with the transition to an alternative rate. The U.S. Federal Reserve, based on the recommendations of the New York Federal Reserve’s Alternative Reference Rate Committee (comprised of major derivative market participants and their regulators), has begun publishing the Secured Overnight Financing Rate (“SOFR”), which is intended to replace U.S. dollar LIBOR. Alternative reference rates for other currencies have also been announced or have already begun publication. Markets are slowly developing in response to these new rates. Neither the effect of the LIBOR transition process nor its ultimate success can yet be known. Although the transition away from LIBOR has become increasingly well-defined, any potential effects of the transition away from LIBOR and other benchmark rates on financial markets, a fund or the financial instruments in which a fund invests can be difficult to ascertain. Not all existing LIBOR-based instruments may have alternative rate-setting provisions and there remains uncertainty regarding the willingness and ability of issuers to add alternative rate-setting provisions in certain existing instruments. Global regulators have advised market participants to cease entering into new contracts using LIBOR as a reference rate, and it is possible that investments in LIBOR-based instruments could invite regulatory scrutiny. In addition, a liquid market for newly-issued instruments that use a reference rate other than LIBOR still may be developing. The impact of transition to an alternative rate on the Fund's portfolio remains uncertain. There can be no guarantee that financial instruments that transition to an alternative reference rate will retain the same value or liquidity as they would otherwise have had. All of the aforementioned may adversely affect the Fund’s performance or NAV.
28
| Bluerock High Income Institutional Credit Fund | Notes to Financial Statements |
| September 30, 2023 |
SOFR Risk – SOFR is intended to be a broad measure of the cost of borrowing funds overnight in transactions that are collateralized by U.S. Treasury securities. SOFR is calculated based on transaction-level repo data collected from various sources. For each trading day, SOFR is calculated as a volume- weighted median rate derived from such data. SOFR is calculated and published by the Federal Reserve Bank of New York (“FRBNY”). Because SOFR is a financing rate based on overnight secured funding transactions, it differs fundamentally from LIBOR. LIBOR is intended to be an unsecured rate that represents interbank funding costs for different short-term maturities or tenors. It is a forward-looking rate reflecting expectations regarding interest rates for the applicable tenor. Thus, LIBOR is intended to be sensitive, in certain respects, to bank credit risk and to term interest rate risk. In contrast, SOFR is a secured overnight rate reflecting the credit of U.S. Treasury securities as collateral. Thus, it is largely insensitive to credit-risk considerations and to short-term interest rate risks. SOFR is a transaction-based rate, and it has been more volatile than other benchmark or market rates, such as three- month LIBOR, during certain periods. For these reasons, among others, there is no assurance that SOFR, or rates derived from SOFR, will perform in the same or similar way as LIBOR would have performed at any time, and there is no assurance that SOFR-based rates will be a suitable substitute for LIBOR. SOFR has a limited history, having been first published in April 2018. The future performance of SOFR, and SOFR-based reference rates, cannot be predicted based on SOFR’s history or otherwise. Levels of SOFR in the future, including following the discontinuation of LIBOR, may bear little or no relation to historical levels of SOFR, LIBOR or other rates.
Below Investment Grade Risk – Lower-quality debt investments, known as “below investment grade” or “junk”, are speculative and present greater risk than investments of higher quality, including an increased risk of default. An economic downturn or period of rising interest rates could adversely affect the market for these investments and reduce the Fund’s ability to sell its investments. Additionally, high yield issuers may seek bankruptcy protection which will delay resolution of creditor claims and may eliminate or materially reduce liquidity. The Sub-Advisor’s assessment of an issuer’s credit quality may prove incorrect and the Fund could suffer losses.
Liquidity Risk – Underlying Investments – The Fund's investments, such as in Target Securities, are subject to liquidity risk. This liquidity risk exists because particular investments of the Fund may be difficult to sell, possibly preventing the Fund from selling them at an advantageous time or price, or possibly requiring the Fund to dispose of other investments at unfavorable times or prices, in order to satisfy its 5% quarterly repurchase obligations.
Leveraging Risk – The Fund is authorized to use leverage for investment purposes and to satisfy redemption requests. The use of leverage will cause the Fund to incur additional expenses and may significantly magnify the Fund's losses in the event of adverse performance of the Fund’s underlying investments.
9. SUBSEQUENT EVENTS
The Fund completed a quarterly repurchase offer on November 7, 2023, which resulted in 100.00% of the shares tendered being repurchased for $2,805,966.
Subsequent events after the date of the Statement of Assets and Liabilities have been evaluated through the date the financial statements were issued. Except as stated above, management has concluded that there is no impact requiring adjustment or disclosure in the financial statements.
| Annual Report | September 30, 2023 | 29 |
| Bluerock High Income | Report of Independent Registered |
| Institutional Credit Fund | Public Accounting Firm |
Shareholders and Board of Trustees
Bluerock High Income Institutional Credit Fund
New York, NY
Opinion on the Financial Statements
We have audited the accompanying statement of assets and liabilities of Bluerock High Income Institutional Credit Fund (the “Fund”), including the portfolio of investments, as of September 30, 2023, the related statements of operations and cash flows for the year then ended, the statements of changes in net assets for each of the two years in the period then ended, and the related notes (collectively referred to as the “financial statements”) and the financial highlights for each of the two years in the period then ended. In our opinion, the financial statements and financial highlights present fairly, in all material respects, the financial position of the Fund as of September 30, 2023, the results of its operations and its cash flows for the year then ended, the changes in net assets for each of the two years in the period then ended, and the financial highlights for each of the two years in the period then ended, in conformity with accounting principles generally accepted in the United States of America.
Basis for Opinion
These financial statements and financial highlights are the responsibility of the Fund’s management. Our responsibility is to express an opinion on the Fund’s financial statements and financial highlights based on our audits. We are a public accounting firm registered with the Public Company Accounting Oversight Board (United States) (“PCAOB”) and are required to be independent with respect to the Fund in accordance with the U.S. federal securities laws and the applicable rules and regulations of the Securities and Exchange Commission and the PCAOB.
We conducted our audits in accordance with the standards of the PCAOB. Those standards require that we plan and perform the audit to obtain reasonable assurance about whether the financial statements and financial highlights are free of material misstatement, whether due to error or fraud.
Our audits included performing procedures to assess the risks of material misstatement of the financial statements and financial highlights, whether due to error or fraud, and performing procedures that respond to those risks. Such procedures included examining, on a test basis, evidence regarding the amounts and disclosures in the financial statements and financial highlights. Our procedures included confirmation of securities owned as of September 30, 2023, by correspondence with the custodian and broker; when reply was not received from broker, we performed other auditing procedures. Our audits also included evaluating the accounting principles used and significant estimates made by management, as well as evaluating the overall presentation of the financial statements and financial highlights. We believe that our audits provide a reasonable basis for our opinion.

We have served as the Fund's auditor since 2022.
New York, NY
November 29, 2023
BDO USA, P.C., a Virginia professional corporation, is the U.S. member of BDO International Limited, a UK company limited by guarantee, and forms part of the international BDO network of independent member firms.
BDO is the brand name for the BDO network and for each of the BDO Member Firms.
30
| Bluerock High Income Institutional Credit Fund | Additional Information |
| September 30, 2023 (Unaudited) |
PROXY VOTING POLICIES AND VOTING RECORD
A description of the policies and procedures that the Fund uses to vote proxies relating to its portfolio securities is available without charge upon request by calling toll-free 1-844-819-8287 or on the Securities and Exchange Commission’s (“SEC”) website at http://www.sec.gov. Information regarding how the Fund voted proxies relating to underlying portfolio securities during the most recent 12-month period ended June 30th is available without charge upon request by calling toll-free 1-844-819-8287, or on the SEC’s website at http://www.sec.gov.
QUARTERLY PORTFOLIO HOLDINGS
The Fund files a monthly portfolio investments report with the SEC on Form N-PORT within 60 days after the end of the first and third quarters of each fiscal year. The filings are available upon request by calling 1-844-819-8287. Furthermore, you may obtain a copy of the filings on the SEC’s website at https://www.sec.gov.
| Annual Report | September 30, 2023 | 31 |
| Bluerock High Income Institutional Credit Fund | Supplemental Information |
| September 30, 2023 (Unaudited) |
The following is a list of the Trustees and executive officers of the Trust and each person’s principal occupation over the last five years.
INDEPENDENT TRUSTEES
| Name, Year of Birth | Position/ Term of Office* | Principal Occupation During the Past Five Years | Number of Portfolios in Fund Complex** Overseen by Trustee | Other Directorships Held By Trustee During Last Five Years |
| Bobby Majumder, 1968 | Trustee Since March, 2022 | Partner, Frost Brown Todd, LLP (2021 to present), Partner, Reed Smith LLP (May 2019- 2021); Partner, Perkins Coie LLP (2013 – May 2019); Partner. | 2 | Bluerock Residential Growth REIT, Inc. (2009 – 2022); Bluerock Total Income+ Real Estate Fund (2012 – Present); Bluerock Homes Trust, Inc. (2021 - Present). |
| Sori Farsheed, 1956 | Trustee Since May, 2022 | Managing Director, Head of Distribution, iCap Equity (financial services company) (June 2022 - May 2023); Executive Director of Strategic Partnerships, Institute for Portfolio Alternatives (financial services company) (January 2020 – November 2020); Executive Vice President, Head of Business Development, AXIO Financial, Inc. (financial services company) (May 2018 –August 2019); Executive Vice President, Head of Relationship Management, Bluerock Capital Markets, LLC (April 2012 – February 2018). | 1 | n/a |
| Kamal Jafarnia, 1966 | Trustee Since March, 2022 | General Counsel for Opto Investments, Inc. (fintech and investment management firm) (2021-present); General Counsel and CCO for Artivest Holdings and Altegris Investment Management (fintech enablement platform) (2018- 2021); Attorney at Law at Kamal Jafarnia (2018 - 2018); Managing Director for Legal and Business Development for Provasi Capital Partners, LP (investment management firm) (2017 –2018); General Counsel and CCO for WP Carey, Inc. (investment management firm) (2014 – 2017). | 2 | Ashford Hospitality Trust, Inc. (2013 - Present); Bluerock Residential Growth REIT, Inc. (2019 – 2022); Bluerock Total Income+ Real Estate Fund (2021 – Present); Bluerock Homes Trust, Inc. (2021 - Present) |
| Romano Tio, 1960 | Trustee Since March, 2022 | Senior Managing Director, Greystone (real estate lending, investment and advisory company) (2021 – present); Senior Managing Director, Ackman-Ziff Real Estate Capital Advisors (2017 – 2021); Co-Founder and Managing Director, RM Capital Management LLC (2009 – 2017). | 2 | Bluerock Residential Growth REIT, Inc. (2009 – 2022); Bluerock Total Income+ Real Estate Fund (2012 – Present); Bluerock Homes Trust, Inc. (2021 - Present) |
INTERESTED TRUSTEES AND OFFICERS
| Name, Year of Birth | Position/ Term of Office* | Principal Occupation During the Past Five Years | Number of Portfolios in Fund Complex** Overseen by Trustee | Other Directorships Held By Trustee During Last 5 Years |
| Ramin Kamfar, 1963 | Trustee Since August, 2021 | Chairman, Bluerock Real Estate, LLC (2002 – Present); Chairman, Bluerock Fund Advisor, LLC (2012 – Present), Bluerock Asset Management, LLC (2018-present) and Bluerock Credit Fund Advisor, LLC (2018 – Present). | 2 | Bluerock Residential Growth REIT (2008 – 2022); Bluerock Total Income+ Real Estate Fund (2012 – Present); Bluerock Homes Trust, Inc. (2021 - Present). |
| Gibran Mahmud, 1975 | Trustee Since March, 2022 | Chief Executive Officer and Chief Investment Officer, WhiteStar Asset Management, LLC (2013 – Present) | 1 | n/a |
32
| Bluerock High Income Institutional Credit Fund | Supplemental Information |
| September 30, 2023 (Unaudited) |
INTERESTED TRUSTEES AND OFFICERS (CONTINUED)
| Name, Year of Birth | Position/ Term of Office* | Principal Occupation During the Past Five Years | Number of Portfolios in Fund Complex Overseen by Trustee | Other Directorships held by Trustee During Last 5 Years |
| Simon Adamiyatt, 1962 | Treasurer Since December, 2021 | Executive Director, Bluerock Real Estate, LLC (2018 – Present); Executive Director and Chief Financial Officer of Earthport, Plc (financial technology company) (May 2015 – January 2018). | 1 | Bluerock Total Income+ Real Estate Fund (2019 - Present). |
| Jordan Ruddy, 1963 | President Since December, 2021 | Chief Operating Officer, Bluerock Real Estate, LLC (2002 – Present); President, Bluerock Fund Advisor, LLC (2013 – Present); President, Bluerock Asset Management, LLC (2018-present); President, Bluerock Credit Fund Advisor, LLC (2018-Present). | n/a | n/a |
| Jason Emala, 1978 | Secretary Since December, 2021 | General Counsel/Chief Legal Officer of the Advisor and various Bluerock entities (2018 – Present); VP and Asst. General Counsel, Cantor Fitzgerald (2016-2018). | n/a | n/a |
| Lucas Foss, 1977 | Chief Compliance Officer Since March, 2022 | Vice President and Deputy Chief Compliance Officer, ALPS (November 2017- present); CCO of X-Square Balanced Fund, Goehring & Rozencwajg Investment Funds, Broadstone Real Estate Access Fund, Inc., Clough Global Funds; Clough Funds Trust; SPDR® S&P 500® ETF Trust, SPDR® Dow Jones® Industrial Average ETF Trust, SPDR® S&P MIDCAP 400® ETF Trust, ALPS Series Trust, 1WS Credit Income Fund and Bluerock Total Income + Real Estate Fund. | n/a | n/a |
| * | The term of office for each Trustee and officer listed above will continue indefinitely. The Fund’s Statement of Additional Information includes additional information about the Trustees and is available upon request, free of charge, by calling toll-free 1-844-819-8287. |
| ** | The Fund Complex currently includes the Trust and the Bluerock Total Income+ Real Estate Fund. |
| Annual Report | September 30, 2023 | 33 |
| Bluerock High Income Institutional Credit Fund | Privacy Policy |
| September 30, 2023 (Unaudited) |
| FACTS | WHAT DOES THE BLUEROCK HIGH INCOME INSTITUTIONAL CREDIT FUND DO WITH YOUR PERSONAL INFORMATION? | |
| Why? | Financial companies choose how they share your personal information. Federal law gives consumers the right to limit some but not all sharing. Federal law also requires us to tell you how we collect, share, and protect your personal information. Please read this notice carefully to understand what we do. | |
| What? | The types of personal information we collect and share depend on the product or service you have with us. This information can include: | |
| ● Social Security number | ● Purchase History | |
| ● Assets | ● Account Balances | |
| ● Retirement Assets | ● Account Transactions | |
| ● Transaction History | ● Wire Transfer Instructions | |
| ● Checking Account Information | ||
| When you are no longer our customer, we may continue to share your personal information as described in this notice. | ||
| How? | All financial companies need to share customers’ personal information to run their everyday business. In the section below, we list the reasons financial companies can share their customers’ personal information; the reasons the Fund chooses to share; and whether you can limit this sharing. | |
| Reasons we can share your personal information | Does Bluerock High Income Institutional Credit Fund share? | Can you limit this sharing? |
| For our everyday business purposes – such as to process your transactions, maintain your account(s), respond to court orders and legal investigations, or report to credit bureaus | Yes | No |
| For our marketing purposes – to offer our products and services to you | No | We don't share |
| For joint marketing with other financial companies | No | We don't share |
| For our affiliates' everyday business purposes – information about your transactions and experiences | No | We don't share |
| For our affiliates' everyday business purposes – information about your creditworthiness | No | We don't share |
| For nonaffiliates to market to you | No | We don't share |
| Questions? | Call 1-844-819-8287 |
34
| Bluerock High Income Institutional Credit Fund | Privacy Policy |
| September 30, 2023 (Unaudited) |
| Who We Are | |
| Who is providing this notice? | Bluerock High Income Institutional Credit Fund |
| What We Do | |
How does Bluerock High Income Institutional Credit Fund protect my personal information? | To protect your personal information from unauthorized access and use, we use security measures that comply with federal law. These measures include computer safeguards and secured files and buildings. |
| Our service providers are held accountable for adhering to strict policies and procedures to prevent any misuse of your nonpublic personal information. | |
How does Bluerock High Income Institutional Credit Fund collect my personal information? | We collect your personal information, for example, when you |
| ● Open an account | |
| ● Provide account information | |
| ● Give us your contact information | |
| ● Make deposits or withdrawals from your account | |
| ● Make a wire transfer | |
| ● Tell us where to send the money | |
| ● Tells us who receives the money | |
| ● Show your government-issued ID | |
| ● Show your driver's license | |
| We also collect your personal information from other companies. | |
| Why can't I limit all sharing? | Federal law gives you the right to limit only |
| ● Sharing for affiliates' everyday business purposes - information about your creditworthiness | |
| ● Affiliates from using your information to market to you | |
| ● Sharing for nonaffiliates to market to you | |
| State laws and individual companies may give you additional rights to limit sharing. | |
| Definitions | |
| Affiliates | Companies related by common ownership or control. They can be financial and nonfinancial companies. |
| ● Bluerock High Income Institutional Credit Fund does not share with our affiliates. | |
| Nonaffiliates | Companies not related by common ownership or control. They can be financial and nonfinancial companies |
| ● Bluerock High Income Institutional Credit Fund does not share with nonaffiliates so they can market to you. | |
| Joint marketing | A formal agreement between nonaffiliated financial companies that together market financial products or services to you. |
| ● Bluerock High Income Institutional Credit Fund doesn’t jointly market. |
| Annual Report | September 30, 2023 | 35 |
Investment Advisor
Bluerock Credit Fund Advisor, LLC
1345 Avenue of the Americas, 32nd Floor
New York, NY 10105
Distributor
ALPS Distributors, Inc.
1290 Broadway, Suite 1000
Denver, CO 80203
Legal Counsel
Thompson Hine LLP
41 South High Street, Suite 1700
Columbus, OH 43215
Independent Registered Public Accounting Firm
BDO USA, P.C.
200 Park Avenue
New York, NY 10166
How to Obtain Proxy Voting Information
Information regarding how the Fund votes proxies relating to portfolio securities for the 12 month period ended June 30th as well as a description of the policies and procedures that the Fund used to determine how to vote proxies is available without charge, upon request, by calling 1-844-819-8287 or by referring to the Securities and Exchange Commission’s (“SEC”) website at http://www.sec.gov.
How to Obtain 1st and 3rd Fiscal Quarter Portfolio Holdings
The Fund files a monthly portfolio investments report with the SEC on Form N-PORT within 60 days after the end of the first and third quarters of each fiscal year. The filings are available upon request by calling 1-844-819-8287. Furthermore, you may obtain a copy of the filings on the SEC’s website at http://www.sec.gov.
| (b) | Not applicable. |
Item 2. Code of Ethics.
| (a) | As of the end of the period covered by this report, the registrant has adopted a code of ethics that applies to the registrant's principal executive officer, principal financial officer, principal accounting officer or controller, or persons performing similar functions, regardless of whether these individuals are employed by the registrant or a third party. |
| (b) | For purposes of this item, “code of ethics” means written standards that are reasonably designed to deter wrongdoing and to promote: |
| (1) | Honest and ethical conduct, including the ethical handling of actual or apparent conflicts of interest between personal and professional relationships; |
| (2) | Full, fair, accurate, timely, and understandable disclosure in reports and documents that a registrant files with, or submits to, the Commission and in other public communications made by the registrant; |
| (3) | Compliance with applicable governmental laws, rules, and regulations; |
| (4) | The prompt internal reporting of violations of the code to an appropriate person or persons identified in the code; and |
| (5) | Accountability for adherence to the code. |
| (c) | During the period covered by this report, there were no amendments to the Fund’s Code of Ethics. |
| (d) | Waivers: During the period covered by the report, the registrant has not granted any express or implicit waivers from the provisions of the code of ethics. |
| (e) | Not applicable. |
| (f) | The Registrant’s code of ethics referred to in Item 2(a) above is attached as an Exhibit 13(a)(1), hereto. |
Item 3. Audit Committee Financial Expert.
| (a) | The registrant’s board of directors has determined that the registrant has at least one audit committee financial expert serving on its audit committee. The registrant’s board of directors has determined that Kamal Jafarnia is an audit committee financial expert. Mr. Jafarnia is “independent” as defined in paragraph (a)(2) of Item 3 to Form N-CSR. |
Item 4. Principal Accountant Fees and Services.
| (a) | Audit Fees |
September 30, 2023 - $248,000
September 30, 2022 – $180,500
Audit fees represent the aggregate fees billed for the fiscal years ended September 30, 2023 and September 30, 2022 for professional services rendered by the principal accountant for the audit of the Registrant’s annual financial statements or services that are normally provided by the accountant in connection with statutory and regulatory filings or engagements.
- 2 -
| (b) | Audit-Related Fees |
September 30, 2023 - $0
September 30, 2022 - $0
The registrant was not billed for any fees for the fiscal years ended September 30, 2023 and September 30, 2022 for assurance and related services that were reasonably related to the performance of the audit of the registrant’s financial statement and not otherwise included under “Audit Fees” above.
| (c) | Tax Fees |
September 30, 2023 - $12,500
September 30, 2022 - $8,500
“Tax fees” shown above were for the preparation of Federal & State income tax returns, assistance with calculation of required income, capital gain and excise distributions and preparation of Federal excise tax returns.
| (d) | All Other Fees |
September 30, 2023 - $3,388
September 30, 2022 - $0
“All Other Fees” for the fiscal year ended September 30, 2023 were for tax consulting and planning. The registrant was not billed any fees for products and services not otherwise included in items (a) - (c) shown above for the fiscal year ended September 30, 2022.
| (e) | (1) Audit Committee’s Pre-Approval Policies and Procedures |
The registrant’s Audit Committee is required to pre-approve all audit services and, when appropriate, any non-audit services (including audit-related, tax and all other services) to the registrant. The registrant’s Audit Committee also is required to pre-approve, when appropriate, any non-audit services (including audit-related, tax and all other services) to its adviser, or any entity controlling, controlled by or under common control with the adviser that provides ongoing services to the registrant, to the extent that the services may be determined to have an impact on the operations or financial reporting of the registrant. Services are reviewed on an engagement by engagement basis by the Audit Committee.
| (2) | Percentages of Services Approved by the Audit Committee pursuant to paragraph (c)(7)(i)(C) of Rule 2-01 of Regulation S-X. |
| 2023 | 2022 | |
| Audit Related | 0% | 0% |
| Tax Fees | 0% | 0% |
| Other Fees | N/A | N/A |
| (f) | During the audit of registrant's financial statements for the most recent fiscal year, less than 50 percent of the hours expended on the principal accountant's engagement were attributed to work performed by persons other than the principal accountant's full-time, permanent employees. |
| (g) | The aggregate non-audit fees billed by the registrant's accountant for services rendered to the registrant, and rendered to the registrant's investment adviser (not including any sub-adviser whose role is primarily portfolio management and is subcontracted with or overseen by another investment adviser), and any entity controlling, controlled by, or under common control with the adviser that provides ongoing services to the registrant: |
September 30, 2023 - $0
September 30, 2022 - $0
(h) The registrant's audit committee has considered whether the provision of non-audit services to the registrant's investment adviser (not including any sub-adviser whose role is primarily portfolio management and is subcontracted with or overseen by another investment adviser), and any entity controlling, controlled by, or under common control with the investment adviser that provides ongoing services to the registrant, that were not pre-approved pursuant to paragraph (c)(7)(ii) of Rule 2-01 of Regulation S-X, is compatible with maintaining the principal accountant's independence
- 3 -
Item 5. Audit Committee of Listed Companies.
Not applicable.
Item 6. Schedule of Investments.
Schedule of investments in securities of unaffiliated issuers is included under Item 1.
Item 7. Disclosure of Proxy Voting Policies and Procedures for Closed-End Funds.
See attached Appendix A for the Adviser’s proxy voting policies and Appendix B Sub-Adviser’s proxy voting policies and procedures.
Item 8. Portfolio Managers of Closed-End Management Investment Companies.
(a)(1) Portfolio Managers
Portfolio Managers
The following are the portfolio managers as of the date of the filing of this report
Gibran Mahmud, Mr. Mahmud serves as Chief Executive Officer and Chief Investment Officer at the Sub-Advisor. Prior to joining the Sub-Advisor, Mr. Mahmud was a Senior Vice President and Head of Mergers, Acquisitions and Business Strategy for a private family office. Previously Mr. Mahmud served as Senior Portfolio Manager and Head of Structured Products at Highland Capital Management, L.P. While at Highland Capital Management, L.P., he served as the Head of the Structured Product Credit Committee and the Senior Structured Products Trader. Mr. Mahmud structured, marketed, negotiated, managed and monitored over 30 collateralized debt obligations (“CDO”) totaling over $28 billion backed by a variety of asset types. Mr. Mahmud managed a team of professionals that was responsible for the day to day management of all CDOs including portfolio management, asset surveillance, cash management, portfolio structuring, monthly trustee reporting, and quarterly waterfall and cashflow calculations. He also marketed related CDO investment strategies globally to pension funds, endowments, hedge funds, insurance companies and money managers. Additionally, Mr. Mahmud managed and invested a portfolio of over $6 billion of structured credit paper that was primarily backed by senior secured bank loan collateral and traded over $10 billion of structured credit paper overall during his time at Highland Capital Management, L.P. Prior to joining Highland Capital Management, L.P., he served as a Senior Analyst at Fleet Capital where he was involved in originating, structuring, modeling and credit analysis for clients primarily in the manufacturing, retail and services industries. Formerly, he was a Senior Auditor at Arthur Andersen LLP. Mr. Mahmud received a Master of Business Administration in Finance and a Bachelor of Business Administration in Accounting from Baylor University. He is a Certified Public Accountant.
Philip Braner, Mr. Braner serves as Chief Operating Officer at the Sub-Advisor and has extensive experience in the structured product and capital markets. Prior to joining the Sub-Advisor, he was a Managing Director in the structured products group with Highland Capital Management, L.P. and was responsible for structuring, marketing and business development of its structured products business and foreign funds effort with a focus on emerging markets, primarily Latin America. During his time at Highland Capital Management, L.P., he was COO of the Structured Products Group, as well as head of the Deal Team within Highland Capital Management, L.P.’s Structured Products Group, and was responsible for the origination of structured finance transactions and separate investment accounts. Mr. Braner has structured over 30 CDOs and separate accounts totaling over $25 billion, including U.S. and Euro cash CLOs, CDO Squareds, middle market CLOs, real estate CDOs and a Brazilian securitization. Previously, Mr. Braner served as a Senior Accountant at KPMG in Dallas, Texas serving clients primarily in the Telecommunications industry. Mr. Braner received both a master’s in accountancy and a BBA from Baylor University. Mr. Braner is a licensed Certified Public Accountant.
- 4 -
Neil Desai, Mr. Desai is a Managing Director at the Sub-Advisor. He is responsible for the Sub-Advisor's CLO investment business and also facilitating in the structuring, syndication and strategic planning of the Trinitas Capital Management, LLC new issue CLO platform. Prior to joining the Sub-Advisor, Mr. Desai was a Managing Director at Highland Capital Management, L.P. where he oversaw credit trading and managed approximately $2 billion of CLO investments across Highland Capital Management, L.P.’s hedge funds, UCITS funds, mutual funds, and separate accounts; and traded over $10 billion of CLO tranche volume during his tenure. Previously, Mr. Desai built and ran the structured credit business for Pfizer Inc.’s Treasury organization and prior to that spent several years in various structuring and trading roles at Credit Suisse and Barclays Capital. Mr. Desai received both a Bachelor’s and Master’s degree in Computer Science and Electrical Engineering from Massachusetts Institute of Technology.
(a)(2)
Portfolio Managers
As of September 30, 2023, the Portfolio Managers listed above are also responsible for the day-to-day management of the following types of accounts in addition to the Fund:
Gibran Mahmud
Other Accounts By Type | Total Number of Accounts by Account Type | Total Assets By Account Type | Number of Accounts by Type Subject to a Performance Fee | Total Assets By Account Type Subject to a Performance Fee |
| Registered Investment Companies | 1 | $101,000,000 | 0 | $0 |
| Other Pooled Investment Vehicles | 39 | $15,500,000,000 | 39 | $15,500,000,000 |
| Other Accounts | 2 | $30,400,000 | 0 | $0 |
Philip Braner
Other Accounts By Type | Total Number of Accounts by Account Type | Total Assets By Account Type | Number of Accounts by Type Subject to a Performance Fee | Total Assets By Account Type Subject to a Performance Fee |
| Registered Investment Companies | 0 | $0 | 0 | $0 |
| Other Pooled Investment Vehicles | 1 | $59,700,000 | 1 | $59,700,000 |
| Other Accounts | 2 | $30,400,000 | 0 | $0 |
Neil Desai
Other Accounts By Type | Total Number of Accounts by Account Type | Total Assets By Account Type | Number of Accounts by Type Subject to a Performance Fee | Total Assets By Account Type Subject to a Performance Fee |
| Registered Investment Companies | 0 | $0 | 0 | $0 |
| Other Pooled Investment Vehicles | 1 | $59,700,000 | 1 | $59,700,000 |
| Other Accounts | 2 | $30,400,000 | 0 | $0 |
Because the Portfolio Managers may manage assets for other pooled investment vehicles and/or other accounts (including institutional clients, pension plans and certain high net worth individuals) (collectively “Client Accounts”), or may be affiliated with such Client Accounts, there may be an incentive to favor one Client Account over another, resulting in conflicts of interest. For example, the Advisor may, directly or indirectly, receive fees from Client Accounts that are higher than the fee it receives from the Fund, or it may, directly or indirectly, receive a performance-based fee on a Client Account. In those instances, a portfolio manager may have an incentive to not favor the Fund over the Client Accounts. The Advisor has adopted trade allocation and other policies and procedures that it believes are reasonably designed to address these and other conflicts of interest.
- 5 -
As of September 30, 2023, the Portfolio Managers’ ownership of the Fund was as follows:
| Portfolio Managers | Dollar Range of Shares Owned |
| Gibran Mahmud | $100,001-$500,000 |
| Philip Braner | $10,001-$50,000 |
| Neil Desai | None |
Each Portfolio Manager has direct equity ownership interests in the Sub-Advisor and related long-term incentives. Each Portfolio Manager also receives a fixed base salary.
Item 9. Purchases of Equity Securities by Closed-End Funds.
None.
Item 10. Submission of Matters to a Vote of Security Holders.
None.
Item 11. Controls and Procedures.
| (a) | Based on an evaluation of the Registrant’s disclosure controls and procedures as of a date within 90 days of filing date of this Form N-CSR, the principal executive officer and principal financial officer of the Registrant have concluded that the disclosure controls and procedures of the Registrant are reasonably designed to ensure that the information required in filings on Form N-CSR is recorded, processed, summarized, and reported by the filing date, including that information required to be disclosed is accumulated and communicated to the Registrant’s management, including the Registrant’s principal executive officer and principal financial officer, as appropriate to allow timely decisions regarding required disclosure. |
| (b) | There were no significant changes in the registrant’s internal control over financial reporting that occurred during the period covered by this report that has materially affected, or are reasonably likely to materially affect, the registrant’s internal control over financial reporting. |
Item 12. Disclosure of Securities Lending Activities for Closed-End Management Investment Companies.
None.
Item 13. Exhibits.
| (a)(1) | Registrant’s Code of Ethics for Senior Financial Officers, which is the subject of the disclosure required by Item 2 of Form N-CSR, is attached hereto as Exhibit 13(a)(1) Ex99.Code of Ethics. |
| (a)(2) | The certifications required by Rule 30a-2(a) of the Investment Company Act of 1940, as amended, are attached hereto as Ex99.Cert. |
| (a)(3) | None. |
| (a)(4) | None. |
| (b) | The certifications for the Registrant’s Principal Executive Officer and Principal Financial Officer, as required by Rule 30a-2(b) of the Investment Company Act of 1940, as amended, and Section 906 of the Sarbanes-Oxley Act of 2002 are attached hereto as Ex99.906Cert. |
- 6 -
APPENDIX A
BLUEROCK CREDIT FUND ADVISOR, LLC
PROXY VOTING POLICIES AND PROCEDURES
Proxy Voting Policy
Background: Pursuant to Rule 206(4)-6 and Rule 204-2 under the Advisers Act, it is a fraudulent, deceptive, or manipulative act, practice or course of business, within the meaning of Section 206(4) of the Advisers Act, for an investment adviser to exercise voting authority with respect to client securities, unless (i) the adviser has adopted and implemented written policies and procedures that are reasonably designed to ensure that the adviser votes proxies in the best interests of its clients, (ii) the adviser describes its proxy voting procedures to its clients and provides copies on request, and (iii) the adviser discloses to clients how they may obtain information on how the adviser voted their proxies.
Policy: The Advisor will vote proxies on behalf of its individual clients. In order to fulfill its responsibilities under the Advisors Act, the Advisor has adopted the following policies and procedures for proxy voting with regard to companies in the investment portfolio of the Fund(s).
Voting Proxies
| 1. | All proxies sent to clients that are actually received by the Advisor (to vote on behalf of the client) will be provided to the Operations Unit. |
| 2. | The Operations Unit will generally adhere to the following procedures (subject to limited exception): |
| (a) | A written record of each proxy received by the Advisor (on behalf of its clients) will be kept in the Advisor’s files; |
| (b) | The Operations Unit will determine which of the Advisor holds the security to which the proxy relates; |
| (c) | Prior to voting any proxies, the Operations Unit will determine if there are any conflicts of interest related to the proxy in question in accordance with the general guidelines set forth below. If a conflict is identified, the Operations Unit will then make a determination (which may be in consultation with outside legal counsel) as to whether the conflict is material. |
| (d) | If no material conflict is identified pursuant to these procedures, the Operations Unit will vote the proxy in accordance with the guidelines set forth below. The Operations Unit will deliver the proxy in accordance with instructions related to such proxy in a timely and appropriate manner |
Conflicts of Interest
| 1. | As stated above, in evaluating how to vote a proxy, the Operations Unit will first determine whether there is a conflict of interest related to the proxy in question between Advisor and its Advisory Clients. This examination will include (but will not be limited to) an evaluation of whether the Advisor (or any affiliate of the Advisor) has any relationship with the company (or an affiliate of the company) to which the proxy relates outside of an investment in such company by a client of the Advisor. |
| 2 | If a conflict is identified and deemed “material” by the Operations Unit, the Advisor will determine whether voting in accordance with the proxy voting guidelines outlined below is in the best interests of the client (which may include utilizing an independent third party to vote such proxies). |
- 7 -
| 3 | With respect to material conflicts, the Advisor will determine whether it is appropriate to disclose the conflict to affected clients give such clients the opportunity to vote the proxies in question themselves. However, with respect to ERISA clients whose advisory contract reserves the right to vote proxies when the Advisor has determined that a material conflict exists that affects its best judgment as a fiduciary to the ERISA client, the Advisor will: |
| (a) | Give the ERISA client the opportunity to vote the proxies in question themselves; or |
| (b) | Follow designated special proxy voting procedures related to voting proxies pursuant to the terms of the investment management agreement with such ERISA clients (if any). |
Proxy Voting Guidelines
| 1. | The Advisor, when acting on behalf of the Fund, must comply with the following voting restrictions unless it is determined that the Fund is not relying on Section 12(d)(1)(F) and or Rule 12d1-3: |
| a. | when the Fund exercises voting rights, by proxy or otherwise, with respect to any investment company owned by the Fund, the Fund will either |
| i. | seek instruction from the Fund’s shareholders with regard to the voting of all proxies and vote in accordance with such instructions, or |
| ii. | vote the shares held by the Fund in the same proportion as the vote of all other holders of such security. |
Disclosure of Procedures
A summary of above these proxy voting procedures will be included in Part 2 of the Advisor’s Form ADV (if applicable) and a Fund client’s statement of additional information, as applicable, and will be updated whenever these policies and procedures are updated. Clients will be provided with contact information as to how they can obtain information about:
(a) the Advisor’s proxy voting procedures (i.e., a copy of these procedures); and (b) how the Advisor voted proxies that are relevant to the affected client. Form N-PX will be filed with the SEC annually for each Fund client.
Record-keeping Requirements
The Operations Unit will be responsible for maintaining files relating to the Advisor’s proxy voting procedures. Records will be maintained and preserved for five years from the end of the fiscal year during which the last entry was made on a record, with records for the first two years kept in the offices of the Advisor. Records of the following will be included in the files:
| 1. | Copies of these proxy voting policies and procedures, and any amendments thereto; |
| 2. | A copy of each proxy statement that the Advisor actually received; provided, however, that the Advisor may rely on obtaining a copy of proxy statements from the SEC’s EDGAR system for those proxy statements that are so available; |
- 8 -
| 3. | A record of each vote that the Advisor casts; |
| 4. | A copy of any document that the Advisor created that was material to making a decision how to vote the proxies, or memorializes that decision (if any); and |
| 5. | A copy of each written request for information on how the Advisor voted such client’s proxies and a copy of any written response to any request for information on how the Advisor voted proxies on behalf of clients. |
- 9 -
APPENDIX B
WHITESTAR
PROXY VOTING POLICY
| 1. | General |
Rule 206(4)-6 of the Advisers Act requires an adviser that exercises voting authority over Client proxies to vote proxies in the best interests of its Clients. In furtherance of such objective, the Company has established policies and procedures to address voting procedures and any conflicts of interests involved in a proxy vote between the Company and a Client. Additionally, the Company will maintain certain records required to be maintained by Rule 206(4)-6 relating to all voted proxies.
| 2. | Determination of Vote |
The Company’s proxy voting procedures are designed to ensure that proxies are voted in a manner that is in the best interest of the Client.
The majority of proxy-related issues generally fall within the following five categories:
| ● | corporate governance |
| ● | takeover defenses |
| ● | compensation plans |
| ● | capital structure |
| ● | social responsibility |
The Company will generally vote in favor of matters that follow an agreeable corporate strategic direction, support an ownership structure that enhances shareholder value without diluting management’s accountability to shareholders and/or present compensation plans that are commensurate with enhanced manager performance and market practices.
While proxy voting on all issues presented should be considered, voting on all issues is not required. Some issues presented for a proxy vote of security holders are not deemed relevant to the Company’s voting objective, or it is not reasonably possible to ascertain what effect, if any, a vote on a given issue may have on a Client’s investment. Additionally, the Company may decide that avoiding further expense and investigation and not voting at all on a presented proposal may be in the best interest of a Client. Accordingly, the Company may abstain from voting in certain circumstances.
| 3. | Conflicts of Interest |
Conflicts of interest involved in a proxy vote shall be addressed though the following three-step process:
Identification of all potential conflicts of interest
Examples of potential conflicts of interest include:
| ● | The Company or an affiliate manages a pension plan, administers Employee benefit plans, or provides brokerage, underwriting, insurance, or banking services to a Company whose management is soliciting proxies; |
- 10 -
| ● | The Company or an affiliate has a substantial business relationship (separate from the Company’s investment strategy) with a portfolio company or a proponent of a proxy proposal and this business relationship may influence how the proxy vote is cast; |
| ● | The Company or an affiliate has a business relationship (separate from the Company’s investment strategy) or personal relationship with participants in a proxy contest, corporate directors or candidates for directorships; or |
| ● | An officer or Employee of the Company or an affiliate may have a familial relationship to a portfolio company (e.g. a spouse or other relative who serves as a director of a public company). |
Determination of material conflicts
The SEC has not provided any specific guidance as to how an investment adviser should analyze or determine whether a conflict is “material” for purposes of proxy voting. Thus, traditional analysis of questions of materiality under the federal securities laws should be used.
Establishment of procedures to address material conflicts
If a material conflict of interest with respect to a particular vote is encountered, contact the CCO to determine how to vote the proxy consistent with the best interests of a Client and in a manner not affected by any conflicts of interest.
| 4. | Recordkeeping |
Pursuant to Rule 204-2, the Company shall retain the following five types of records relating to proxy voting:
| ● | Proxy voting policy and procedures; |
| ● | Proxy statements received for Client securities; |
| ● | Records of votes cast on behalf of Clients; |
| ● | Written Client requests for proxy voting information and written adviser responses to any Client request (whether oral or written) for proxy voting information; and |
| ● | Any documents prepared by the Company that were material to making a proxy voting decision or that memorialized the basis for the decision. |
| 5. | Policy Statement and Requests |
The Advisers Act requires that the Company must inform Client on how they can obtain information about how the Company has voted Client proxies and Client may obtain a copy of the Company’s proxy voting policy upon request. Questions related to this Policy, the proxy voting process and/or information regarding how the Company voted proxies relating to the Client’s portfolio securities may be obtained by Clients, free of charge, by contacting the CCO at (214) 420-4418 or via email at MMurray@whitestaram.com.
With respect to the Fund, the COO or appointed designee will periodically provide the Fund’s investment adviser, a certification of compliance and completion in connection with the proxies voted on behalf of the Fund.
- 11 -
SIGNATURES
Pursuant to the requirements of the Securities Exchange Act of 1934 and the Investment Company Act of 1940, the registrant has duly caused this report to be signed on its behalf by the undersigned, thereunto duly authorized.
Bluerock High Income Institutional Credit Fund
| By: | /s/ Jordan B. Ruddy | |
| Jordan B. Ruddy | ||
President | ||
| Date: | December 6, 2023 |
Pursuant to the requirements of the Securities Exchange Act of 1934 and the Investment Company Act of 1940, this report has been signed below by the following persons on behalf of the registrant and in the capacities and on the dates indicated.
| By: | /s/ Jordan B. Ruddy | |
| Jordan B. Ruddy | ||
President | ||
| Date: | December 6, 2023 | |
| By: | /s/ Simon Adamiyatt | |
| Simon Adamiyatt | ||
Treasurer | ||
| Date: | December 6, 2023 |
- 12 -