Table of Contents
| OMB APPROVAL | ||||
| OMB Number: | 3235-0059 | |||
| Expires: | January 31, 2008 | |||
| Estimated average burden hours per response | 14. | |||
UNITED STATES
SECURITIES AND EXCHANGE COMMISSION
Washington, D.C. 20549
SCHEDULE 14A
Proxy Statement Pursuant to Section 14(a) of the Securities
Exchange Act of 1934
| Filed by the Registrant þ | |
| Filed by a Party other than the Registrant o | |
| Check the appropriate box: |
| o Preliminary Proxy Statement | |
| o Confidential, for Use of the Commission Only (as permitted by Rule 14a-6(e)(2)) | |
| þ Definitive Proxy Statement | |
| o Definitive Additional Materials | |
| o Soliciting Material Pursuant to §240.14a-12 |
CenturyTel, Inc.
(Name of Registrant as Specified In Its Charter)
(Name of Person(s) Filing Proxy Statement, if other than the Registrant)
Payment of Filing Fee (Check the appropriate box):
| þ No fee required. | |
| o Fee computed on table below per Exchange Act Rules 14a-6(i)(1) and 0-11. |
| 1) Title of each class of securities to which transaction applies: |
| 2) Aggregate number of securities to which transaction applies: |
| 3) Per unit price or other underlying value of transaction computed pursuant to Exchange Act Rule 0-11 (set forth the amount on which the filing fee is calculated and state how it was determined): |
| 4) Proposed maximum aggregate value of transaction: |
| 5) Total fee paid: |
| o Fee paid previously with preliminary materials. |
| o Check box if any part of the fee is offset as provided by Exchange Act Rule 0-11(a)(2) and identify the filing for which the offsetting fee was paid previously. Identify the previous filing by registration statement number, or the Form or Schedule and the date of its filing. |
| 1) Amount Previously Paid: |
| 2) Form, Schedule or Registration Statement No.: |
| 3) Filing Party: |
| 4) Date Filed: |
Table of Contents

2007 Notice of Annual Meeting
and Proxy Statement
and
Annual Financial Report
Thursday, May 10, 2007
2:00 p.m. local time
100 CenturyTel Drive
Monroe, Louisiana
2:00 p.m. local time
100 CenturyTel Drive
Monroe, Louisiana
Table of Contents

April 4, 2007
Dear Shareholder:
It is a pleasure to invite you to our 2007 Annual Meeting of Shareholders on Thursday, May 10, beginning at 2:00 p.m. local time, at our headquarters in Monroe, Louisiana. I hope you will be able to attend.
As in the past, this booklet includes our formal notice of the meeting, our proxy statement and our annual financial report.
Most of you have received with this booklet a proxy card that indicates the number of votes that you will be entitled to cast at the meeting according to the records of CenturyTel or your broker or other nominee. Each CenturyTel share that you have “beneficially owned” continuously since May 30, 1987 generally entitles you to ten votes; each other share entitles you to one vote. Shares held through a broker or other nominee are presumed to have one vote per share. In lieu of receiving a proxy card, participants in our benefit plans have been furnished with voting instruction cards. The reverse side of this letter describes our voting provisions in greater detail.
Regardless of how many shares you own or whether you plan to attend the meeting in person, it is important that your shares be voted at the meeting. At your earliest convenience, please vote by telephone or the Internet, or by completing and returning your proxy or voting instruction card in the enclosed return envelope.
Thank you for your interest and continued support.
| Sincerely, | ||
 | ||
| Glen F. Post, III | ||
| Chairman of the Board and | ||
| Chief Executive Officer |
Table of Contents
VOTING PROVISIONS
Shareholders
Record Shareholders. In general, shares registered in the name of any natural person or estate that are represented by certificates dated as of or prior to May 30, 1987 are presumed to have ten votes per share and all other shares are presumed to have one vote per share. However, the Company’s articles of incorporation (the relevant provisions of which are reproduced below) set forth a list of circumstances in which the foregoing presumptions may be refuted. If you believe that the voting information set forth on your proxy card is incorrect or a presumption made with respect to your shares should not apply, please send a letter to the Company briefly describing the reasons for your belief. Marking the proxy card or contacting us in any other manner will not be sufficient notification to the Company that you believe the voting information thereon is incorrect.
Beneficial Shareholders. All shares held through a broker, bank or other nominee are presumed to have one vote per share. The Company’s articles of incorporation set forth a list of circumstances in which this presumption may be refuted by the person who has held since May 30, 1987 all of the attributes of beneficial ownership referred to in Article III(C)(2) reproduced below. If you believe that some or all of your shares are entitled to ten votes, you may follow one of two procedures. First, you may write a letter to the Company describing the reasons for your belief. The letter should contain your name (unless you prefer to remain anonymous), the name of the brokerage firm, bank or other nominee holding your shares, your account number with such nominee and the number of shares you have beneficially owned continuously since May 30, 1987. Alternatively, you may ask your broker, bank or other nominee to write a letter to the Company on your behalf stating your account number and indicating the number of shares that you have beneficially owned continuously since May 30, 1987. In either case, your letter should indicate how you wish to have your shares voted.
Other. The Company will consider all letters received prior to the date of the Annual Meeting and, when a return address is provided in the letter, will advise the party furnishing such letter of its decision, although in many cases the Company will not have time to inform an owner or nominee of its decision prior to the time the shares are voted. In limited circumstances, the Company may require additional information before a determination will be made. If you have any questions about the Company’s voting procedures, please call the Company at (318) 388-9500.
Participants in Benefit Plans
Participants in the Company’s Dollars & Sense Plan or Union 401(k) Plan have received voting instruction cards in lieu of a proxy card. Only the trustees of these plans, in their capacity as directed trustees, can vote the plan shares at the Annual Meeting. However, if you are a participating current or former CenturyTel employee, you are designated as a “Named Fiduciary” for voting purposes, which entitles you, on a confidential basis, to instruct the trustees how to cast the votes attributable to the shares allocated to your plan account, as well as a proportionate number of plan shares for which properly executed instructions are not timely received. By signing and returning your voting instruction card, you are accepting your designation under the plans as a “Named Fiduciary,” and you therefore are required to exercise your voting rights prudently and in the interest of all plan participants. If you elect not to vote the shares allocated to your accounts, your shares will be voted in accordance with voting instructions received by the trustees from those plan participants who do vote.
* * * *
Excerpts from the Company’s Articles of Incorporation
Paragraph C of Article III of the Company’s articles of incorporation provides as follows:
(1) Each share of Common Stock . . . which has been beneficially owned continuously by the same person since May 30, 1987 will entitle such person to ten votes with respect to such share on each matter properly submitted to the shareholders of the Corporation for their vote, consent, waiver, release or other action . . .
(2) (a) For purposes of this paragraph C, a change in beneficial ownership of a share of the Corporation’s stock will be deemed to have occurred whenever a change occurs in any person or group of persons who, directly or indirectly, through any contract, arrangement, understanding, relationship or otherwise has or shares (i) voting power, which includes the power to vote, or to direct the voting of such share; (ii) investment power, which includes the power to direct the sale or other disposition of such share; (iii) the right to receive or retain the proceeds of any sale or other disposition of such share; or (iv) the right to receive distributions, including cash dividends, in respect to such share.
(b) In the absence of proof to the contrary provided in accordance with the procedures referred to in subparagraph (4) of this paragraph C, a change in beneficial ownership will be deemed to have occurred whenever a share of stock is transferred of record into the name of any other person.
(c) In the case of a share of Common Stock . . . held of record in the name of a corporation, general partnership, limited partnership, voting trustee, bank, trust company, broker, nominee or clearing agency, or in any other name except a natural person, if it has not been established pursuant to the procedures referred to in subparagraph (4) that such share was beneficially owned continuously since May 30, 1987 by the person who possesses all of the attributes of beneficial ownership referred to in clauses (i) through (iv) of subparagraph (2)(a) of this paragraph C with respect to such share of Common Stock . . . then such share of Common Stock . . . will carry with it only one vote regardless of when record ownership of such share was acquired.
(d) In the case of a share of stock held of record in the name of any person as trustee, agent, guardian or custodian under the Uniform Gifts to Minors Act, the Uniform Transfers to Minors Act or any comparable statute as in effect in any state, a change in beneficial ownership will be deemed to have occurred whenever there is a change in the beneficiary of such trust, the principal of such agent, the ward of such guardian or the minor for whom such custodian is acting.
(3) Notwithstanding anything in this paragraph C to the contrary, no change in beneficial ownership will be deemed to have occurred solely as a result of:
(a) any event that occurred prior to May 30, 1987, including contracts providing for options, rights of first refusal and similar arrangements, in existence on such date to which any holder of shares of stock is a party;
(b) any transfer of any interest in shares of stock pursuant to a bequest or inheritance, by operation of law upon the death of any individual, or by any other transfer without valuable consideration, including a gift that is made in good faith and not for the purpose of circumventing this paragraph C;
(c) any change in the beneficiary of any trust, or any distribution of a share of stock from trust, by reason of the birth, death, marriage or divorce of any natural person, the adoption of any natural person prior to age 18 or the passage of a given period of time or the attainment by any natural person of a specified age, or the creation or termination of any guardianship or custodian arrangement; or
(d) any appointment of a successor trustee, agent, guardian or custodian with respect to a share of stock.
(4) For purposes of this paragraph C, all determinations concerning changes in beneficial ownership, or the absence of any such change, will be made by the Corporation. Written procedures designed to facilitate such determinations will be established by the Corporation and refined from time to time. Such procedures will provide, among other things, the manner of proof of facts that will be accepted and the frequency with which such proof may be required to be renewed. The Corporation and any transfer agent will be entitled to rely on all information concerning beneficial ownership of a share of stock coming to their attention from any source and in any manner reasonably deemed by them to be reliable, but neither the Corporation nor any transfer agent will be charged with any other knowledge concerning the beneficial ownership of a share of stock.
* * * *
(8) Shares of Common Stock held by the Corporation’s employee benefit plans will be deemed to be beneficially owned by such plans regardless of how such shares are allocated to or voted by participants, until the shares are actually distributed to participants.
* * * *
Table of Contents
CenturyTel, Inc.
100 CenturyTel Drive
Monroe, Louisiana 71203
(318) 388-9500
100 CenturyTel Drive
Monroe, Louisiana 71203
(318) 388-9500
Notice of Annual Meeting of Shareholders
| TIME AND DATE | 2:00 p.m. CST on Thursday, May 10, 2007 | |
| PLACE | Corporate Conference Room | |
| CenturyTel Headquarters | ||
| 100 CenturyTel Drive | ||
| Monroe, Louisiana |
| ITEMS OF BUSINESS | (1 | ) | To elect four Class I directors for three-year terms | |||
| (2 | ) | To ratify the appointment of KPMG LLP as our independent auditor for 2007 | ||||
| (3 | ) | To act upon a shareholder proposal if properly presented at the annual meeting | ||||
| (4 | ) | To transact such other business as may properly come before the annual meeting and any adjournment. |
| RECORD DATE | You can vote if you are a shareholder of record on March 23, 2007. | |
| ANNUAL REPORT | Our 2006 annual report is in two parts: |
| (1 | ) | our 2006 Financial Report, which is contained inAppendix Ato this proxy statement | ||||
| (2 | ) | our 2006 Summary Annual Report, which appears at the beginning of this booklet. |
| Neither of these documents are a part of our proxy soliciting materials. | ||
| PROXY VOTING | Shareholders are invited to attend the annual meeting in person. Even if you expect to attend, it is important that you vote by telephone or the Internet, or by completing and returning your enclosed proxy card. | |
| Stacey W. Goff | ||
| Secretary | ||
| April 4, 2007 |
Table of Contents
| Page | ||||
| 1 | ||||
| 2 | ||||
| 7 | ||||
| 7 | ||||
| 10 | ||||
| 10 | ||||
| 11 | ||||
| 12 | ||||
| 13 | ||||
| 13 | ||||
| 14 | ||||
| 15 | ||||
| 15 | ||||
| 17 | ||||
| 19 | ||||
| 19 | ||||
| 20 | ||||
| 21 | ||||
| 33 | ||||
| 33 | ||||
| 33 | ||||
| 35 | ||||
| 41 | ||||
| 42 | ||||
| 48 | ||||
| 49 | ||||
| 49 | ||||
| 49 | ||||
| 50 | ||||
| 50 | ||||
| 50 | ||||
| 51 | ||||
| 51 | ||||
| A-1 | ||||
Table of Contents
CenturyTel, Inc.
100 CenturyTel Drive
Monroe, Louisiana 71203
(318) 388-9500
100 CenturyTel Drive
Monroe, Louisiana 71203
(318) 388-9500
PROXY STATEMENT
April 4, 2007
Our Board of Directors is soliciting proxies for use at the CenturyTel, Inc. Annual Meeting of Shareholders to be held at the time and place described in the accompanying notice, and at any adjournments thereof. Beginning on or about April 9, 2007, we are mailing this proxy statement to our shareholders of record as of March 23, 2007.
You can ensure that your shares are voted at the Annual Meeting by submitting your instructions by telephone or the Internet, or by completing, signing, dating and returning the enclosed proxy card in the envelope provided. Submitting your instructions or proxy by any of these methods will not affect your right to attend the meeting and vote.
If you are a participant in our Automatic Dividend Reinvestment and Stock Purchase Service or our Employee Stock Purchase Plans, our enclosed proxy card covers shares credited to your account under each plan, as well as any shares directly registered in your name. You should not, however, use the proxy card to vote any shares held for you in our Dollars & Sense Plan (which we refer to below as our qualified 401(k) plan) or Union 401(k) Plan. Instead, participants in these plans will receive from the plan trustees separate voting instruction cards covering these shares. Plan participants should complete and return these voting instruction cards in the manner provided by such cards and the instructions appearing on the reverse side of the chairman’s letter above.
As of March 23, 2007, the record date for determining shareholders entitled to notice of and to vote at the Annual Meeting, we had outstanding 110,537,455 shares of common stock and 297,996 shares of Series L preferred stock that vote together with the common stock as a single class on all matters. In this proxy statement, we refer to these shares as our “Common Shares” and “Preferred Shares,” respectively, and as our “Voting Shares,” collectively. Our restated Articles of Incorporation generally provide that holders of Common Shares that have been beneficially owned continuously since May 30, 1987 are entitled to cast ten votes per share, subject to compliance with certain procedures. Article III of our Articles and the voting procedures that we have adopted thereunder contain several provisions governing the voting power of Common Shares, including a presumption that each Common Share held by nominees or by any holder other than a natural person or estate entitles such holder to one vote, unless the holder furnishes us with proof to the contrary. Applying the presumptions described in Article III and information known to us, our records indicate that 161,932,111 votes are entitled to be cast at the Annual Meeting, of which 161,634,115 (99.8%) are attributable to the Common
1
Table of Contents
Shares. Unless otherwise indicated, we have calculated all percentages of voting power in this proxy statement based on this number of votes.
We will pay all expenses of soliciting proxies for the Annual Meeting. Proxies may be solicited personally, by mail, by telephone or by facsimile by our directors, officers and employees, who will not be additionally compensated therefor. We will also request persons holding Voting Shares in their names for others, such as brokers, banks and other nominees, to forward proxy materials to their principals and request authority for the execution of proxies, and we will reimburse them for their expenses incurred in connection therewith. We have retained Innisfree M&A Incorporated, New York, New York, to assist in the solicitation of proxies, for which we will pay Innisfree fees anticipated to be $12,000 and will reimburse Innisfree for certain of its out-of-pocket expenses.
ELECTION OF DIRECTORS
(Item 1 on Proxy or Voting Instruction Card)
The Board of Directors has fixed the number of directors at 12 members, which are divided under our Articles of Incorporation into three classes. Members of the respective classes hold office for staggered terms of three years, with one class elected at each annual shareholders’ meeting. The shareholders will elect four Class I directors at the Annual Meeting. Acting upon the recommendation of its Nominating and Corporate Governance Committee, the Board of Directors has nominated the four individuals listed below to serve as Class I directors. Unless authority is withheld, all votes attributable to the shares represented by each duly executed and delivered proxy will be cast for the election of each of these below-named nominees. Under our bylaw nominating procedures, these nominees are the only individuals who may be elected at the Annual Meeting. For additional information on our nomination process, see “Corporate Governance- Director Nomination Process.” If for any reason any such nominee should decline or become unable to stand for election as a director, which we do not anticipate, votes will be cast instead for another candidate designated by the Board, without resoliciting proxies.
The following provides certain information with respect to each nominee, each other director whose term will continue after the Annual Meeting, and each of our executive officers named in the compensation tables appearing elsewhere herein. Unless otherwise indicated, each person has been engaged in the principal occupation shown for more than the past five years.
2
Table of Contents
Class I Directors (for terms expiring in 2010):
| (PHOTO OF WILLIAM R. BOLES, Jr.) | William R. Boles, Jr., age 50; a director since 1992; an attorney with The Boles Law Firm, as to which Mr. Boles is an executive officer, director and co-owner. | |
| Committee Memberships: Risk Evaluation | ||
| (PHOTO OF W. BRUCE HANKS) | W. Bruce Hanks, age 52; a director since 1992; a consultant with Graham, Bordelon and Co., Inc., an investment management and financial planning company, since December 1, 2005; Athletic Director of the University of Louisiana at Monroe from March 2001 to June 2004; a senior or executive officer of CenturyTel with operational or strategic development responsibilities for several years prior to such time; an advisory director of IberiaBank Corporation. | |
| Committee Membership: Risk Evaluation (Chairman); Audit | ||
| (PHOTO OF C. G. MELVILLE, Jr.) | C. G. Melville, Jr., age 66; a director since 1968; private investor since 1992; retired executive officer of an equipment distributor. | |
| Committee Memberships: Compensation (Chairman); Nominating and Corporate Governance | ||
| (PHOTO OF GLEN F. POST, III) | Glen F. Post, III, age 54; a director since 1985; Chairman of the Board of CenturyTel since June 2002 and Chief Executive Officer of CenturyTel since 1993. Mr. Post also served as Vice Chairman of the Board from 1993 to 2002 and President from 1990 to 2002. | |
| Committee Membership: Executive (Chairman) |
The Board unanimously recommends a vote FOR each of these nominees.
3
Table of Contents
Class II Directors (term expires in 2008):
| (PHOTO OF VIRGINIA BOULET) | Virginia Boulet, age 53; a director since 1995; Special Counsel at Adams and Reese LLP, a law firm; President and Chief Operating Officer of IMDiversity, Inc., an on-line recruiting company, from March 2002 to February 2004; a director of W&T Offshore, Inc. | |
| Committee Memberships: Nominating and Corporate Governance (Chairperson); Audit | ||
| (PHOTO OF CALVIN CZESCHIN) | Calvin Czeschin, age 71; a director since 1975; President and Chief Executive Officer of Yelcot Telephone Company and Ultimate Auto Group. | |
| Committee Memberships: Executive; Risk Evaluation | ||
| (PHOTO OF JAMES B. GARDNER) | James B. Gardner, age 72; a director since 1981; Senior Managing Director of Samco Capital Markets, Inc., a financial services firm, since May 17, 2006; Managing Director or Senior Managing Director of the capital markets division of such company for 12 years prior to such date; a director of Ennis, Inc. | |
| Committee Memberships: Audit (Chairman); Executive; Compensation | ||
| (PHOTO OF GREGORY J. MCCRAY) | Gregory J. McCray, age 44; a director since May 2005; Chief Executive Officer of Antenova Limited, a British company which develops and markets wireless components, since January 2003; President of McCray Consulting, a technology consulting company, from March 2002 to December 2002. | |
| Committee Memberships: Risk Evaluation |
4
Table of Contents
Class III Directors (term expires in 2009):
| (PHOTO OF FRED R. NICHOLS) | Fred R. Nichols, age 60; a director since May 2003; retired in 2000 after serving as an executive officer of Cox Communications, Inc. or TCA Cable TV, Inc. for several years prior to his retirement. | |
| Committee Membership: Audit; Compensation | ||
| (PHOTO OF HARVEY P. PERRY) | Harvey P. Perry, age 62; a director since 1990; non-executive Vice Chairman of the Board of Directors of CenturyTel since January 1, 2004; retired from CenturyTel on December 31, 2003 after serving as Executive Vice President and Chief Administrative Officer for almost five years, as Secretary for 18 years and as General Counsel for 20 years. | |
| Committee Membership: Executive | ||
| (PHOTO OF JIM D. REPPOND) | Jim D. Reppond, age 65; a director since 1986; retired from CenturyTel in 1996 after serving as President-Telephone Group (or a comparable predecessor position) for several years. | |
| Committee Memberships: Executive; Nominating and Corporate Governance | ||
| (PHOTO OF JOSEPH R. ZIMMEL) | Joseph R. Zimmel, age 53; a director since January 2003; retired in 2002 after serving as a managing director of the investment banking division of The Goldman Sachs Group, Inc. from 1996 to 2001; a director of FactSet Research Systems Inc. | |
| Committee Membership: Audit |
5
Table of Contents
Executive Officers Who Are Not Directors:
| (PHOTO OF KAREN A. PUCKETT) | Karen A. Puckett, age 46; President and Chief Operating Officer since August 2002; Executive Vice President and Chief Operating Officer from July 2000 to August 2002. | |
| (PHOTO OF R. STEWART EWING, Jr.) | R. Stewart Ewing, Jr., age 55; Executive Vice President and Chief Financial Officer. | |
| (PHOTO OF MICHAEL E. MASLOWSKI) | Michael E. Maslowski,age 59; Senior Vice President and Chief Information Officer. | |
| (PHOTO OF DAVID D. COLE) | David D. Cole,age 49; Senior Vice President — Operations. | |
| (PHOTO OF STACEY W. GOFF) | Stacey W. Goff, age 41; Senior Vice President, General Counsel and Secretary since August 2003; Vice President and Assistant General Counsel from 2000 to July 2003. |
6
Table of Contents
CORPORATE GOVERNANCE
Governance Guidelines
Listed below are excerpts from our corporate governance guidelines, which the Board reviews at least annually. For information on how you can obtain a complete copy of these guidelines, see “- Access to Information” below.
| 1. | Director Qualifications |
| • | The Board of Directors will have a majority of independent directors. The Nominating and Corporate Governance Committee is responsible for reviewing with the Board, on an annual basis, the requisite skills and characteristics of new Board members as well as the composition of the Board as a whole. This assessment will include members’ independence qualifications, as well as consideration of diversity, age, character, judgment, skills and experience in the context of the needs of the Board. It is the general sense of the Board that no more than two management directors should serve on the Board. | ||
| • | The Board expects directors who change the job or responsibility they held when they were elected to the Board to volunteer to resign from the Board. It is not the sense of the Board that in every such instance the director should necessarily leave the Board. There should, however, be an opportunity for the Board, through the Nominating and Corporate Governance Committee, to review the continued appropriateness of Board membership under the circumstances. | ||
| • | No director may serve on more than two other unaffiliated public company boards, unless this prohibition is waived by the Board. No director may be appointed or nominated to a new term if he or she would be age 72 or older at the time of the election or appointment. | ||
| • | The Nominating and Corporate Governance Committee will review each director’s continuation on the Board at least once every three years. | ||
| • | Directors will be deemed to be “independent” if (i) the Board affirmatively confirms that neither the director nor any organization with which the director is affiliated receives any payments from the Company other than Permissible Directors Compensation (as defined below) and (ii) none of the disqualifying events or conditions specified in Rule 303A(2)(b) of the NYSE Listed Company Manual apply to the director. For purposes hereof, “Permissible Directors Compensation” means (i) director and committee fees, (ii) reimbursement for an annual physical, continuing education, travel and other out-of-pocket expenses in accordance with the Company’s applicable policies and (iii) a pension or other form of deferred compensation for prior service, provided such compensation is not contingent in any way on continued service. The Board may make |
7
Table of Contents
| determinations or interpretations under this paragraph, provided that they are consistent with the foregoing standards. | |||
| • | Once the Board has determined that a director is independent, the director may not engage in any transaction with the Company, either directly or indirectly through an immediate family member or related entity, without such transaction being approved by the Board. |
| 2. | Director Responsibilities |
| • | The Chairman will establish the agenda for each Board meeting. Each Board member is free to suggest the inclusion of items on the agenda. Each Board member is free to raise at any Board meeting subjects that are not on the agenda for that meeting. The Board will review the Company’s long-term strategic plans and the principal issues that the Company will face in the future during at least one Board meeting each year. | ||
| • | The non-management directors will meet in executive session at least quarterly. The director who presides at these meetings will be an independent director chosen annually by the non-management directors, and his or her name will be disclosed in the annual proxy statement. |
| 3. | Board Committees |
| • | The Board will have at all times an Audit Committee, a Compensation Committee and a Nominating and Corporate Governance Committee. All of the members of these committees will be independent directors, as defined in Section 1 above. | ||
| • | The Chair of each committee, in consultation with the committee members, will determine the frequency and length of the committee meetings consistent with any requirements set forth in the committee’s charter. The Chair of each committee, in consultation with members of the committee and others specified in the committee’s charter, will develop the committee’s agenda. | ||
| • | The Board and each committee have the power to hire independent legal, financial or other advisors as they may deem necessary, without consulting or obtaining the approval of any officer of the Company in advance. | ||
| • | Each committee may meet in executive session as often as it deems appropriate. |
| 4. | Director Access to Officers and Employees |
| • | Directors have full and free access to officers and employees of the Company. | ||
| • | The Board welcomes regular attendance at each Board meeting of senior officers of the Company. |
8
Table of Contents
| 5. | Director Compensation |
| • | The form and amount of director compensation will be determined by the Nominating and Corporate Governance Committee on the terms and conditions (and subject to the exceptions) set forth in its charter, and such Committee will review director compensation annually. |
| 6. | Director Orientation and Continuing Education |
| • | The Nominating and Corporate Governance Committee shall maintain an Orientation Program for new directors. All new directors must participate in the Company’s Orientation Program, which should be conducted as soon as practicable after new directors are elected or appointed. | ||
| • | The Company will also maintain a Continuing Education Program for directors, pursuant to which it will endeavor to periodically update directors on industry, technological and regulatory developments, and to provide adequate resources to support directors in understanding the Company’s business and matters to be acted upon at board and committee meetings. |
| 7. | CEO Evaluation and Management Succession |
| • | The Nominating and Corporate Governance Committee will conduct an annual review of the CEO’s performance. The Nominating and Corporate Governance Committee will provide a report of its findings to the Board of Directors (with appropriate recusals of the CEO and other management directors, as necessary) to enable the Board to ensure that the CEO is providing the best leadership for the Company in the long- and short-term. | ||
| • | The Nominating and Corporate Governance Committee should report periodically to the Board on succession planning. The entire Board will consult periodically with the Nominating and Corporate Governance Committee regarding potential successors to the CEO. The CEO should at all times make available his or her recommendations and evaluations of potential successors, along with a review of any development plans recommended for such individuals. |
| 8. | Annual Evaluation |
| • | The Board of Directors will conduct an annual self-evaluation to determine whether it and its committees are functioning effectively. The Nominating and Corporate Governance Committee will receive comments from all directors and report annually to the Board with an assessment of the Board’s performance, which will be discussed with the full Board. The assessment will focus on the Board’s contribution to the Company and specifically focus on areas in which the Board or management believes that the Board could improve. |
9
Table of Contents
| 9. | Standards of Business Conduct and Ethics |
| • | All of the Company’s directors, officers and employees are required to abide by the Company’s long-standing Corporate Compliance Program, which includes standards of business conduct and ethics. The Company’s program and related procedures cover all areas of professional conduct, including employment policy, conflicts of interests, protection of confidential information, as well as strict adherence to all laws and regulations applicable to the conduct of the Company’s business. | ||
| • | Any waiver of the Company’s policies, principles or guidelines relating to business conduct or ethics for executive officers or directors may be made only by the Audit Committee and will be promptly disclosed as required by applicable law or stock exchange regulations. |
Independence
Based on the information made available to it, the Board of Directors has affirmatively determined that Virginia Boulet, James B. Gardner, W. Bruce Hanks, C. G. Melville, Jr., Gregory J. McCray, Fred R. Nichols, Jim D. Reppond and Joseph R. Zimmel qualify as independent directors under the standards referred to above under “– Governance Guidelines.” In making these determinations, the Board, with assistance from counsel, evaluated responses to a questionnaire completed by each director regarding relationships and possible conflicts of interest. In its review of director independence, the Board considered all commercial, consulting, legal, accounting, charitable, and familial relationships any director may have with CenturyTel or its management.
Committees of the Board
During 2006, the Board of Directors held four regular meetings, six special meetings, and a three-day strategic planning session.
During 2006, the Board’s Audit Committee held nine meetings. The Audit Committee is currently composed of five independent directors, four of whom (James B. Gardner, W. Bruce Hanks, Fred R. Nichols and Joseph R. Zimmel) the Board has determined to be audit committee financial experts, as defined under the federal securities laws. The Audit Committee’s functions are described further below under “Audit Committee Report.”
The Board’s Compensation Committee held two meetings during 2006. The Compensation Committee is composed of three directors, all of whom qualify as independent directors under our corporate governance guidelines, as “non-employee directors” under Rule 16b-3 promulgated under the Securities Exchange Act of 1934, and as “outside directors” under Section 162(m) of the Internal Revenue Code. The Compensation Committee is described further below under “Compensation Discussion and Analysis.”
The Board’s Nominating and Corporate Governance Committee (which we refer to below as the “Nominating Committee”) met four times during 2006. The Nominating
10
Table of Contents
Committee is responsible for, among other things, (i) recommending to the Board nominees to serve as directors and officers, (ii) monitoring the composition and size of the Board and its committees, (iii) periodically reassessing our corporate governance guidelines described above, (iv) leading the Board in its annual review of the Board’s performance and (v) reviewing annually the Chief Executive Officer’s performance and reporting to the Board on succession planning for senior executive officers. For information on the director nomination process, see “- Director Nomination Process” below.
Each of the committees listed above is composed solely of independent directors under the standards referred to above under “- Governance Guidelines.”
If you would like additional information on the responsibilities of the committees listed above, please refer to the committees’ respective charters, which can be obtained in the manner described below under “- Access to Information.”
We expect all of our directors to attend our annual shareholders meetings. Each director attended the 2006 annual shareholders meeting, except for one director who was unable to attend due to poor health.
Director Nomination Process
Nominations for the election of directors at our annual shareholder meetings may be made by the Board (upon the receipt of recommendations of the Nominating Committee) or by any shareholder of record who complies with our bylaws. Under our bylaws, any shareholder of record interested in making a nomination generally must deliver written notice to CenturyTel’s secretary not more than 180 days and not less than 90 days in advance of the first anniversary of the preceding year’s annual shareholder’s meeting. For the Annual Meeting this year, the Board has nominated the four nominees listed above under “Election of Directors” to stand for election as Class I directors, and no shareholders submitted any nominations. For further information on deadlines for submitting nominations for our 2008 annual shareholders meeting, see “Other Matters — Shareholder Nominations and Proposals.”
The written notice required to be sent by any nominating shareholder must include (i) the name, age, business address and residential address of the nominating shareholder and any other person acting in concert with such shareholder, (ii) a representation that the nominating shareholder is a record holder of Voting Shares, and intends to make his nomination in person, (iii) a description of all agreements among the nominating shareholder, any person acting in concert with him, each proposed nominee and any other person pursuant to which the nomination or nominations are to be made and (iv) various biographical information about each proposed nominee, including principal occupation, holdings of Voting Shares and other information required to be disclosed in our proxy statement. The notice must also be accompanied by the written consent of each proposed nominee to serve as a director if elected, and an affidavit certifying that the proposed nominee meets the qualifications for service specified in the bylaws and summarized below. We may require a proposed nominee to furnish other reasonable information or certifications. Shareholders interested in bringing before a shareholders meeting any matter other than a director nomination should consult our bylaws for
11
Table of Contents
additional procedures governing such requests. We may disregard any nomination or submission of any other matter that fails to comply with these bylaw procedures.
The Nominating Committee will consider candidates nominated by shareholders in accordance with our bylaws. Upon receipt of any such nominations, the Committee will review the submission for compliance with our bylaws, including determining if the proposed nominee meets the bylaw qualifications for service as a director. These provisions disqualify any person who fails to respond satisfactorily to any inquiry for information to enable us to make certifications required by the Federal Communications Commission under the Anti-Drug Abuse Act of 1988, or who has been arrested or convicted of certain specified drug offenses or engaged in actions that could lead to such an arrest or conviction.
In the past, the Nominating Committee has considered director candidates suggested by Committee members, other directors, senior management and shareholders. In the recent past, the Nominating Committee has retained, on an as-needed basis and at our expense, national search firms to help identify potential director candidates. Each of our three newest directors were initially identified or screened by national search firms retained by the Nominating Committee. With respect to this year’s annual meeting, all of the nominees are incumbent directors with at least 15 years of prior service. Although the Nominating Committee did not retain a search firm in connection with this year’s meeting, it expects to do so to assist in identifying future directors.
Under our corporate governance guidelines, the Nominating Committee assesses director candidates based on their independence, diversity, age, character, skills and experience in the context of the needs of the Board. Although the guidelines permit the Nominating Committee to adopt additional selection guidelines or criteria, it has chosen not to do so. Instead, the Nominating Committee periodically assesses skills and characteristics then required by the Board based on its membership and needs at the time of the assessment. In evaluating the needs of the Board, the Nominating Committee considers the qualification of incumbent directors and consults with other members of the Board and senior management. The Nominating Committee believes this flexible approach enables it to respond to changes caused by director retirements and industry developments.
Although we do not have a history of receiving director nominations from shareholders, the Nominating Committee envisions that it would evaluate any such candidate on the same terms as other proposed nominees, but would place a substantial premium on retaining incumbent directors who are familiar with our management, operations, business, industry, strategies and competitive position, and who have previously demonstrated a proven ability to provide valuable contributions to the Board and CenturyTel.
Presiding Director
As indicated above, the non-management directors meet in executive session at least quarterly. The non-management directors have selected Fred R. Nichols to preside over such meetings during 2007. As explained further on our website, you may contact Mr. Nichols by writing a letter to the Presiding Director, c/o Post Office Box 5061, Monroe, Louisiana 71211.
12
Table of Contents
Access to Information
The following documents are filed as exhibits to our Annual Report on Form 10-K for the year ended December 31, 2006, and are posted on our website atwww.centurytel.com:
| • | Corporate governance guidelines | ||
| • | Charters of the Audit Committee, Compensation Committee and Nominating and Corporate Governance Committee | ||
| • | Corporate compliance program (which includes our code of ethics) |
We will furnish printed copies of these materials upon the request of any shareholder.
RATIFICATION OF THE SELECTION OF THE INDEPENDENT AUDITOR
(Item 2 on Proxy or Voting Instruction Card)
The Audit Committee of the Board has appointed KPMG LLP as our independent auditor for the fiscal year ending December 31, 2007, and we are submitting that appointment to our shareholders for ratification at the Annual Meeting. Although shareholder ratification of KPMG’s appointment is not legally required, we are submitting this matter to the shareholders, as in the past, as a matter of good corporate practice.
If the shareholders fail to vote on an advisory basis in favor of the appointment, the Audit Committee will reconsider whether to retain KPMG LLP, and may appoint that firm or another without re-submitting the matter to the shareholders. Even if the shareholders ratify the appointment, the Audit Committee may, in its discretion, select a different independent auditor at any time during the year if it determines that such a change would be in the best interests of the Company and its shareholders. In connection with selecting the independent auditor, the Audit Committee reviews the auditor’s qualifications, control procedures, cost, proposed staffing, prior performance and other relevant factors.
In connection with the audit of the 2007 financial statements, we entered into an engagement letter with KPMG LLP which sets forth the terms by which KPMG will provide audit services to us. That agreement is subject to alternative dispute resolution procedures and excludes punitive damage claims.
The following table lists the aggregate fees and costs billed to us by KPMG and its affiliates for the 2005 and 2006 services identified below:
| Amount Billed | ||||||||
| 2005 | 2006 | |||||||
Audit Fees (1) | $ | 3,044,000 | $ | 2,745,000 | ||||
Audit-Related Fees(2) | 83,000 | 107,000 | ||||||
Tax Fees(3) | 528,000 | 509,000 | ||||||
| Total Fees | $ | 3,655,000 | $ | 3,361,000 | ||||
13
Table of Contents
| (1) | Includes the cost of (i) services rendered in connection with auditing our annual consolidated financial statements, (ii) auditing our internal control over financial reporting and management’s assessment of its review of internal control over financial reporting in accordance with Section 404 of the Sarbanes-Oxley Act of 2002, (iii) reviewing our quarterly financial statements, (iv) auditing the financial statements of several of our telephone subsidiaries, and (v) services rendered in connection with reviewing our registration statements and issuing related comfort letters. | |
| (2) | Includes the cost of auditing our benefit plans and general accounting consulting services. | |
| (3) | Includes costs associated with (i) assistance in preparing income tax returns (which were approximately $209,000 in 2005 and $239,000 in 2006); (ii) assistance with various tax audits (which were approximately $237,000 in 2005 and $194,000 in 2006); and (iii) general income tax planning, consultation and compliance (which were approximately $82,000 in 2005 and $76,000 in 2006). |
The Audit Committee maintains written procedures that require it to annually review and pre-approve the scope of all services to be performed by our independent auditor. This review includes an evaluation of whether the provision of non-audit services by our independent auditor is compatible with maintaining the auditor’s independence in providing audit and audit-related services. The Committee’s procedures prohibit the independent auditor from providing any non-audit services unless the service is permitted under applicable law and is pre-approved by the Audit Committee or its Chairman. The Chairman is authorized to pre-approve projects expected to cost no more than $75,000, provided the total cost of all projects pre-approved by the Chairman during any fiscal quarter does not exceed $125,000. The Audit Committee has pre-approved the Company’s independent auditor to provide up to $40,000 per quarter of miscellaneous tax services that do not constitute discrete and separate projects. The Chief Financial Officer is required periodically to advise the full Committee of the scope and cost of services not pre-approved by the full Committee. Although applicable regulations waive these pre-approval requirements in certain limited circumstances, the Audit Committee did not use these waiver provisions in either 2005 or 2006.
KPMG has advised us that one or more of its partners will be present at the Annual Meeting. We understand that these representatives will be available to respond to appropriate questions and will have an opportunity to make a statement if they desire to do so.
Ratification of KPMG’s appointment as our independent auditor for 2007 will require the affirmative vote of at least a majority of the voting power present or represented at the Annual Meeting.
The Board unanimously recommends a vote FOR this proposal.
AUDIT COMMITTEE REPORT
Management is responsible for our internal controls and the financial reporting process. Our independent auditor is responsible for performing an independent audit of our consolidated financial statements and the effectiveness of our internal control over financial reporting, and to issue reports thereon. The Committee’s responsibility is to monitor and oversee these processes, and, subject to shareholder ratification, to appoint the independent auditor.
In this context, the Committee has met and held discussions with management and our internal auditors and independent auditor for 2006, KPMG LLP. Management represented to the Committee that our consolidated financial statements were prepared in accordance with
14
Table of Contents
generally accepted U.S. accounting principles. The Committee has reviewed and discussed with management and KPMG the consolidated financial statements, and management’s report and KPMG’s report and attestation on internal control over financing reporting in accordance with Section 404 of the Sarbanes-Oxley Act of 2002. The Committee also discussed with KPMG matters required to be discussed by Statements on Auditing Standards No. 61 and 90 (Communication with Audit Committees).
KPMG also provided to the Committee the written disclosures required by Independence Standards Board Standard No. 1 (Independence Discussions with Audit Committees). The Committee discussed with KPMG that firm’s independence, and considered the effects that the provision of non-audit services may have on KPMG’s independence.
Based on and in reliance upon the reviews and discussions referred to above, and subject to the limitations on the role and responsibilities of the Committee referred to in its charter, the Committee recommended that the Board of Directors include the audited consolidated financial statements in our Annual Report on Form 10-K for the year ended December 31, 2006.
If you would like additional information on the responsibilities of the Audit Committee, please refer to its charter, which you can obtain in the manner described above under “Corporate Governance — Access to Information.”
Submitted by the Audit Committee of the Board of Directors.
| James B. Gardner (Chairman) | Fred R. Nichols | |||
| Virginia Boulet | Joseph R. Zimmel | |||
| W. Bruce Hanks* |
| * | Committee Member since November 15, 2006. |
SHAREHOLDER PROPOSAL REGARDING EXECUTIVE COMPENSATION
(Item 3 on Proxy or Voting Instruction Card)
Background
We periodically receive suggestions from our shareholders, some as formal shareholder proposals. We give careful consideration to all suggestions, and assess whether they promote the best interests of CenturyTel and its shareholders.
The Communications Workers of America Members’ General Fund, located at 501 Third Street, N.W., Washington, D.C. 20001, has informed us that it owns 65 Common Shares and that it intends to present for consideration at the Annual Meeting the following proposal (and has furnished the following statement in support of the proposal).
15
Table of Contents
Shareholder Proposal
RESOLVED, that shareholders of CenturyTel, Inc. request that the Board of Directors (“Board”) adopt a policy of submitting the following question to a shareholders’ vote at each annual meeting in the future: “Is the compensation of CenturyTel’s named executive officers as set forth in the proxy statement’s Summary Compensation Table: (a) excessive; (b) appropriate; or (c) too low?”
Supporting Statement
We believe the compensation of CenturyTel’s senior executives is excessive.
According to proxy statements from 2002 through 2006, the executives named in the Summary Compensation Table (five individuals for most years, six for 2002) received “Total Annual Compensation” of $23.0 million from 2001 through 2005. The “Total Annual Compensation” of Glen F. Post, III, Chairman and CEO of CenturyTel, accounted for more than $8.4 million of that sum.
The named officers also received $8.8 million in “long-term compensation” in the form of restricted stock and long-term incentive plan payouts. These officers then exercised stock options to realize a gain of another $29.3 million.
The named officers received an additional $2.3 million over the same period in “All Other Compensation” (401(k) and ESOP contributions; use of airplane; tax reimbursements; cash stipends to cover perquisites).
These named officers received a total of over $63.4 million for the period from 2001 through 2005. Mr. Post alone received over $22.4 million for those five years.
Finally, the 2006 proxy statement reports that the named officers held $10.6 million in unexercised “in-the-money” options.
In our view, this amount is excessive for a company this size.
The major stock exchanges have adopted rules requiring public companies to submit equity-based compensation plans for shareholder approval. According to a recent academic analysis, however, these rules have failed to provide shareholders “with substantial influence” because the plans tend to be “broadly worded” (Lucian Bebchuk and Jesse Fried, Pay Without Performance, 2004, p. 196). Shareholders can withhold votes for members of the Compensation Committee who stand for reelection, but we view that option as a blunt and insufficient instrument for registering dissatisfaction with senior executive compensation.
In contrast, public companies in the United Kingdom allow shareholders to cast an advisory vote on the “directors’ remuneration report,” which discloses executive
16
Table of Contents
compensation. Such a vote isn’t binding, but gives shareholders a clear voice that could help shape senior executive compensation.
We are proposing that the shareholders be permitted to give the Compensation Committee a “report card.” Through voting on the question that is set forth in the Proposal, shareholders could express their views, in an advisory referendum, on the question of whether the Company’s senior executives are being compensated at levels that are appropriate in amount. This approach would provide the opportunity to express dissatisfaction with the amount of compensation that has been awarded to senior executives, and of focusing media attention on the issue in a manner that could assist in bringing about change, while preserving the discretion of the Board to make such changes as may be appropriate.
Board Statement in Opposition
The Board of Directors Recommends that You Vote AGAINST this Proposal for the Reasons Set Forth Below:
We believe ensuring that executive compensation is appropriate is an important issue for all shareholders, and we share that goal. Nonetheless, we believe this proposal is unnecessary, unworkable and potentially harmful.
The proposal is unnecessary.The proposal is unnecessary because we already employ a thorough process designed to pay appropriate levels of executive compensation to attract and retain the managerial talent necessary to maintain our competitiveness. As explained in greater detail under the heading “Compensation Discussion and Analysis,” the Board has delegated its powers to set executive compensation to its Compensation Committee, which is composed solely of independent directors who have a fiduciary duty to establish programs that are in the best interests of the shareholders. Each year the Committee works with its independent consultant to establish compensation programs designed to match those of comparable companies and to create incentives to maintain and increase shareholder value. In connection with performing its duties, the Committee spends a substantial amount of time reviewing a wide range of information impacting executive compensation, including trends in executive compensation and detailed benchmarking data on prevailing compensation levels at comparable companies. In accordance with the federal proxy rules, we explain in detail the Committee’s processes and conclusions in our annual proxy statements. In short, we believe our current structure is appropriately designed and balanced to achieve and communicate our executive compensation goals.
The proposal is unworkable.We believe that complying with the proposal as submitted could force us to violate the federal proxy rules. The federal proxy rules permit us to distribute proxies soliciting shareholders to vote for or against a proposal (or to abstain from voting), but preclude us from distributing proxies soliciting multiple choice opinions such as those requested under the proposal. In addition, we believe it is unrealistic to expect this proposal would enable shareholders to provide meaningful input on decisions that entail a thorough understanding of a wide variety of factors, including prevailing compensation philosophies and practices nationwide and in our industry. Establishing appropriate executive compensation arrangements is a complex
17
Table of Contents
process involving balancing numerous business considerations against competitive pressures. We believe this balancing should continue to be the responsibility of disinterested independent fiduciaries who have the time, experience, expertise and resources to design and administer effective programs. We believe the proposal is a blunt instrument that would not provide us with meaningful insight into specific shareholder concerns regarding our programs, and could lead to confusion about what prompted the shareholders’ vote. For instance, if the shareholders express the view that compensation is too high or too low, we would be unable to determine the magnitude of the shareholders’ concerns or the compensation components that give rise to the concerns, and, as such, we would be unable to react in a meaningful fashion. We believe it would be far more helpful if shareholder concerns are specifically addressed, and we already have processes in place to facilitate effective shareholder communications. See “Corporate Governance – Presiding Director.”
The proposal is potentially harmful.Finally, the proposal is potentially harmful in several respects, including the following:
| • | by requiring a practice not followed by most other U.S. companies, the proposal could harm our ability to retain or attract talented managers to the extent that they perceive this new practice as a threat to our long-standing commitment to pay competitive compensation | ||
| • | by creating the risk that the good faith judgments of our disinterested independent directors could be “second-guessed,” the proposal could negatively impact the willingness of members of our Compensation Committee to continue to serve | ||
| • | by requiring us to provide new disclosures, implement new processes, and incur new legal risks, the proposal would require us to incur unnecessary legal and proxy solicitation expenses and could increase our expenditures on directors’ fees and insurance | ||
| • | by creating a blunt instrument of shareholder input, the proposal could result in unclear directives that create confusion over corporate goals, distract management, and interfere with more effective means of facilitating useful shareholder communications. |
In summary, we do not believe the proposal will enhance our governance practices or improve our shareholder communications, nor is it in the best interests of shareholders.The Board therefore unanimously recommends that you vote AGAINST this proposal.
Adoption of this proposal requires the affirmative vote of at least a majority of the voting power present or represented at the Annual Meeting.
18
Table of Contents
OWNERSHIP OF OUR SECURITIES
Principal Shareholders
The following table sets forth information regarding ownership of our Common Shares by each person known to us to have beneficially owned more than 5% of the outstanding Common Shares or to have controlled more than 5% of the total voting power on December 31, 2006.
| Amount and | ||||||||||||
| Nature of | ||||||||||||
| Beneficial | Percent of | Percent | ||||||||||
| Ownership of | Outstanding | of Voting | ||||||||||
| Name and Address | Common Shares(1) | Common Shares(1) | Power(2) | |||||||||
| Goldman Sachs Asset Management, L.P. | 9,663,891 | (3) | 8.5 | % | 6.1 | % | ||||||
| 32 Old Slip New York, New York 10005 | ||||||||||||
| JPMorgan Chase & Co. | 7,693,777 | (4) | 6.8 | % | 4.9 | % | ||||||
| 270 Park Avenue New York, New York 10017 | ||||||||||||
| State Street Bank and Trust Company | 7,569,591 | (5) | 6.7 | % | 4.8 | % | ||||||
| 225 Franklin Street Boston, Massachusetts 02110 | ||||||||||||
| LSV Asset Management | 6,064,150 | (6) | 5.4 | % | 3.8 | % | ||||||
| 1 N. Wacker Street, Suite 4000 Chicago, Illinois 60606 | ||||||||||||
| Trustees of CenturyTel benefit plans | 5,051,679 | (7) | 4.5 | % | 23.3 | % | ||||||
| c/o T. Rowe Price Retirement Plan Services T. Rowe Price Investment Services, Inc. 4515 Painters Mill Road Owings Mills, Maryland 21117-4903 | ||||||||||||
| (1) | Determined in accordance with Rule 13d-3 of the Securities and Exchange Commission based upon information furnished by the persons listed. In addition to Common Shares, we have outstanding Preferred Shares that vote together with the Common Shares as a single class on all matters. One or more persons beneficially own more than 5% of the Preferred Shares; however, the percentage of total voting power held by such persons is immaterial. For additional information regarding the Preferred Shares, see page 1 of this proxy statement. | |
| (2) | Based on our records and, with respect to all shares held of record by our benefit plan trustees, based on information the trustees periodically provide to us to establish that certain of these shares entitle the trustees to cast ten votes per share. | |
| (3) | Based on information contained in a Schedule 13G/A Report dated as of February 7, 2007 that this investor filed with the Securities and Exchange Commission. In this report, the investor indicated that, as of December 31, 2006, it held sole voting power with respect to 6,908,031 of these shares. | |
| (4) | Based on information contained in a Schedule 13G/A Report dated as of February 2, 2007 that this investor filed with the Securities and Exchange Commission. In this report, the investor indicated that, as of December 29, 2006, it and its affiliates collectively held sole voting power with respect to 6,286,854 of these shares, shared voting power with respect to 1,130,167 of these shares, sole dispositive power with respect to 6,511,090 of these shares, and shared dispositive power with respect to 1,162,199 of these shares. | |
| (5) | Based on information contained in a Schedule 13G Report dated as of February 12, 2007 that this investor filed with the Securities and Exchange Commission. In this report, the investor indicated that, as of December 31, 2006, it held shared dispositive power with respect to all of these shares. | |
| (6) | Based on information contained in a Schedule 13G Report dated as of February 12, 2007 that this investor filed with the Securities and Exchange Commission. |
19
Table of Contents
| (7) | Consists of shares held by the trustees of our qualified 401(k) plan and union 401(k) plan. All of the voting power attributable to these shares is directed by the plan participants, each of whom is deemed to tender such instructions as a “named fiduciary” for all shares under each such plan, which requires the participants to direct their votes in a manner that they believe to be prudent and in the best interests of the plan participants. |
Executive Officers and Directors
The following table sets forth information, as of the Record Date, regarding the beneficial ownership of Common Shares by our executive officers and directors. Except as otherwise noted, (i) none of the persons named below beneficially owns more than 1% of the outstanding Common Shares or is entitled to cast more than 1% of the total voting power and (ii) all beneficially owned shares are held with sole voting and investment power and are not pledged to third parties.
| Components of Total Shares Owned | ||||||||||||||||
| Options | ||||||||||||||||
| Shares | Unvested | Exercisable | Total Shares | |||||||||||||
| Beneficially | Restricted | Within 60 | Beneficially | |||||||||||||
| Name | Owned(1) | Stock(2) | Days(3) | Owned | ||||||||||||
Executive Officers: | ||||||||||||||||
| Glen F. Post, III | 198,586 | 187,200 | 1,066,668 | 1,452,454 | (4) | |||||||||||
| Karen A. Puckett | 17,849 | (5) | 74,800 | 203,900 | 296,549 | |||||||||||
| R. Stewart Ewing, Jr. | 29,298 | 62,220 | 84,334 | 175,852 | ||||||||||||
| Michael E. Maslowski | 6,124 | 40,800 | 32,642 | 79,566 | ||||||||||||
| David D. Cole | 43,592 | (6) | 40,800 | 247,001 | 331,393 | |||||||||||
| Stacey W. Goff | 5,838 | 40,800 | 63,500 | 110,138 | ||||||||||||
Outside Directors: | ||||||||||||||||
| William R. Boles, Jr. | 7,195 | 4,834 | 16,000 | 28,029 | ||||||||||||
| Virginia Boulet | 5,646 | (7) | 4,834 | 6,000 | 16,480 | |||||||||||
| Calvin Czeschin | 57,994 | (8) | 4,834 | — | 62,828 | |||||||||||
| James B. Gardner | 4,585 | 4,834 | 16,000 | 25,419 | ||||||||||||
| W. Bruce Hanks | 1,770 | 4,834 | 46,000 | 52,604 | ||||||||||||
| Gregory J. McCray | 1,085 | 4,834 | — | 5,919 | ||||||||||||
| C.G. Melville, Jr. | 8,707 | 4,834 | — | 13,541 | ||||||||||||
| Fred R. Nichols | 3,085 | 4,834 | 12,000 | 19,919 | ||||||||||||
| Harvey P. Perry | 35,318 | 4,834 | — | 40,152 | ||||||||||||
| Jim D. Reppond | 46,085 | 4,834 | 16,000 | 66,919 | ||||||||||||
| Joseph R. Zimmel | 6,085 | 4,834 | 13,667 | 24,586 | ||||||||||||
| All directors and executive officers as a group (17 persons) | 478,842 | (9) | 499,794 | 1,823,712 | 2,802,348 | |||||||||||
| (1) | This column includes the following number of shares allocated to the person’s account under our qualified 401(k) plan: 84,107 — Mr. Post; 2,127 — Ms. Puckett; 19,711 — Mr. Ewing; 370 – Mr. Maslowski; 29,155 — Mr. Cole; and 3,018 — Mr. Goff. Participants in this plan are entitled to direct the voting of their plan shares, as described in greater detail elsewhere herein. |
20
Table of Contents
| (2) | Constitutes unvested shares of Restricted Stock over which the person holds sole voting power but no investment power. | |
| (3) | Constitutes shares that the person has the right to acquire within 60 days of the Record Date pursuant to options granted under our incentive compensation plans. | |
| (4) | Constitutes 1.3% of the outstanding Common Shares and entitles Mr. Post to cast .6% of the total voting power. | |
| (5) | Includes 200 shares held by Ms. Puckett as custodian for the benefit of her children. | |
| (6) | Includes 4,957 plan shares beneficially held by Mr. Cole’s wife as one of our former employees in her accounts under the qualified 401(k) plan, as to which Mr. Cole disclaims beneficial ownership. | |
| (7) | Includes 955 shares held by Ms. Boulet as custodian for the benefit of her children. | |
| (8) | Includes 11,997 shares owned by Mr. Czeschin’s wife, as to which he disclaims beneficial ownership. | |
| (9) | Includes (i) 16,954 shares held of record or beneficially by the spouses of certain of these individuals, as to which beneficial ownership is disclaimed, and (ii) 1,155 shares held as custodian for the benefit of children of such individuals. |
COMPENSATION DISCUSSION AND ANALYSIS
General Compensation Philosophy
We compensate our senior management through a mix of salary, annual bonuses, long-term equity compensation and employee benefits designed to be competitive with the compensation of comparable officers and to reward annual and long-term performance that correlates with maintaining and increasing shareholder value. With respect to each component of compensation, we generally seek to match the compensation of comparable employees at other companies, although we typically provide our executive officers with above-average salaries if justified by corporate and individual performance. We generally seek to base our executives’ annual cash incentive compensation principally upon our company-wide performance and secondarily upon the executives’ individual performance. Officers and managers with lower levels of responsibility typically receive incentive compensation that places a greater emphasis on individual, departmental or divisional goals. We seek to align the interests of our executives with the long-term interests of shareholders through award opportunities that can result in ownership of our Common Shares, with top executives receiving a greater proportion of their total compensation in the form of equity grants compared to more junior officers. We have a long-standing practice of not providing employment agreements to our officers, but do provide customary change of control, pension and welfare benefits to our key personnel.
Allocation of Compensation
We do not use fixed ratios to allocate total compensation between cash and non-cash compensation or among the various compensation components. Instead, we seek to pay our executives the target levels of salary and bonus discussed further below, all of which are set in relation to compensation levels paid to comparable executives at other companies. We believe
21
Table of Contents
this allows us to maintain competitive compensation packages, and adjust quickly to changes in prevailing compensation practices.
We seek to design our incentive compensation programs to reward annual and long-term performance that correlates as highly as possible to maintaining and increasing shareholder value, while at the same time providing incentives that are equitable, realistic and reasonably within the control of the award recipient. We believe that our top executives have the greatest opportunity to directly impact our performance, and therefore believe it is appropriate to provide a greater portion of their total compensation in the form of long-term incentives that focus solely on company-wide performance. On the other hand, because our less senior officers have less control over our company-wide performance, we award them a relatively higher percentage of their total compensation in the form of salary and annual bonuses that frequently focus on individual, departmental or divisional goals within their control.
Although we favor the use of incentive compensation, we believe it is necessary and prudent to pay a portion of total compensation in the form of a competitive fixed salary. We believe the payment of a fixed salary to our officers helps maintain productivity by alleviating concerns that an economic or industry downturn could undercut their personal and family planning. Equally importantly, our failure to pay a competitive salary could harm our ability to recruit and retain management.
Implementation of our compensation practices has generally resulted in our CEO receiving a higher percentage of his total compensation in the form of long-term equity incentives, and a smaller percentage in salary and cash bonuses. On the other hand, less senior officers have typically received a relatively smaller percentage of their total compensation in the form of long-term equity incentives, and a higher percentage in salary and cash bonuses. This allocation is illustrated in the table below, which shows the percentage of 2006 compensation attributable to our three main components of compensation:
| Equity | ||||||||||||
| Cash Compensation | Compensation | |||||||||||
| % from | % from | % from Long-Term | ||||||||||
| Salary | Annual Bonus | Bonus | ||||||||||
| CEO | 22.7 | % | 16.0 | % | 61.3 | % | ||||||
| President and Executive VP | 30.0 | 16.3 | 53.7 | |||||||||
| Senior Vice Presidents | 37.3 | 18.0 | 44.7 | |||||||||
We expect that these allocations will change from year to year, as we adjust to changes in prevailing compensation practices.
Salary
We generally seek to compensate our long-standing executives with cash salaries equivalent to the 75th percentile of salaries paid to similarly-situated executives at comparable companies, if justified by corporate and individual performance. We believe this gives us the flexibility to pay above-market salaries to talented executives who could be viewed as attractive targets by other companies, many of whom are larger than us with far greater resources. The
22
Table of Contents
Compensation Committee of our Board uses these percentile targets as starting points in its analysis, which we describe below under the heading “- Our Compensation Decision-Making Process.” After applying the other factors described under that heading, and considering the recommendations of the CEO, the Committee sets each executive’s annual cash salary, typically prospectively in February of each year following the completion of our performance review process. We also periodically adjust salaries at other times of the year if necessary to reflect promotions or other changes in job responsibilities.
Annual Incentive Bonuses
Our practice is to award annual cash bonuses to key employees based on performance objectives that, if attained, can reasonably be expected to maintain or increase our value. We strive to award bonus opportunities that can reasonably be expected to result in our total cash compensation (consisting of salary and cash bonuses) to equal or exceed the 50% percentile of total cash compensation paid to similarly-situated executives at comparable companies. We currently offer annual incentive bonuses to approximately 685 of our employees.
To administer our annual bonus program, we maintain (i) a shareholder-approved short-term incentive plan for certain of the executive officers and (ii) an annual incentive bonus plan for other officers and managers. In connection with both of these bonus plans, in February of each year our Compensation Committee
| • | establishes performance objectives, and for each determines a “target” level of performance, as well as “minimum” and “maximum” levels of performance | ||
| • | determines the relative weight each performance objective should receive in connection with calculating aggregate bonus payments | ||
| • | establishes the amount of bonus payable if the “target” level of performance is attained, which is typically defined in terms of a percentage of each officer’s salary. |
Upon completion of the fiscal year, the CFO adjusts our actual operating results in accordance with the Committee’s long-standing written procedures designed to eliminate the effects of extraordinary or non-recurring transactions that were not known or anticipated on the date the performance goals were established. The CFO then compares our adjusted operating results to the pre-determined minimum, target and maximum levels for each performance objective, and calculates a blended rate of our attainment of the performance objectives. These determinations and calculations are provided in writing to the Committee for its review and approval.
For 2006, the Committee elected to base 60% of the executives’ potential bonuses upon CenturyTel attaining targeted levels of operating cash flow and the remaining 40% upon attaining targeted levels of end-user revenue. For 2006, the executive officers were granted an opportunity to earn a specified percentage (ranging between 40% to 65%) of their respective salaries if “target” performance levels were met, with up to triple these amounts if the “maximum” levels of performance were met and no bonuses if the “minimum” performance
23
Table of Contents
levels were not attained. For both of the 2006 performance measures, the executives were entitled to receive
• no payment | if we failed to achieve the minimum performance level | |||||
• a prorated payment of at least 50% but less than 100% of the target award | if we attained or exceeded the minimum performance level but not the target performance level | |||||
• a prorated payment of at least 100% but less than 300% of the target award | if we attained or exceeded the target performance level but not the maximum performance level | |||||
• a payment of 300% of the target award | if we attained or exceeded the maximum performance target. |
The bonus payable to the CEO in accordance with these procedures is subject to the “negative discretion” of the Committee to reduce the calculated bonus payment. The bonuses payable to each other executive officer in accordance with these procedures is subject to the “negative discretion” of the CEO to reduce the calculated bonus payment based on his assessment of the officer’s performance during the prior year, including an assessment of the degree to which such officer attained his or her individual performance goals for such year. Neither the CEO nor the Committee exercised his or its negative discretion to reduce awards based upon 2006 performance. Finally-determined awards made to our executives on February 26, 2007 for 2006 performance are reflected in the Summary Compensation Table appearing below under the column “Non-Equity Incentive Plan Compensation.” For additional information, see “Executive Compensation – Incentive Compensation – 2006 Awards.”
Compared to our executive officers, the remainder of our senior officers have more diverse performance goals. When an officer or manager has responsibility for a particular business unit, division or region, the performance goals are typically heavily weighted toward the operational performance of those units or areas. Other individuals may receive individual performance goals. Depending on the level of seniority, these individuals may also receive a portion of their bonus based on overall corporate performance. As discussed below under the heading “- Our Compensation Decision-Making Process,” the CEO approves the performance goals of the non-executive officers under the general supervision of the Compensation Committee.
Under our annual bonus programs, the Committee may pay the annual bonuses in cash or stock. Since 2000, the Committee has paid these bonuses entirely in cash. The Committee believes paying annual bonuses to our executives in cash is appropriate because:
24
Table of Contents
| • | the executives are already receiving well over half of their overall compensation in the form of equity grants | ||
| • | the executive has fully earned his bonus, which we do not believe should be subject to the further risk of loss associated with equity grants, and | ||
| • | use of cash diversifies the compensation mix and prevents us from over-reliance on equity grants. |
Long-Term Equity Incentive Programs
Our shareholder-approved long-term incentive compensation programs authorize the Compensation Committee to grant stock options, restricted stock, and various other stock-based incentives to key personnel. We believe stock incentive awards (i) encourage key personnel to focus on our long-term performance, (ii) strengthen the relationship between compensation and growth in the market price of the Common Shares and thereby align management’s financial interests with those of the shareholders and (iii) help attract and retain talented personnel. We currently offer long-term incentive compensation awards to approximately 520 of our employees.
Incentives granted under these programs become exercisable based upon criteria established by the Committee. The Committee generally determines the size of equity grants based on the recipient’s responsibilities and duties, and on information furnished by the Committee’s consultants regarding equity incentive practices among comparable companies. The Committee’s general philosophy is to provide long-term incentive compensation valued at the 50th percentile of that paid to similarly-situated officers at comparable companies. Since 2001, the Committee has elected to award annual incentive grants as opposed to larger, multi-year grants. The Committee believes annual grants provide us with greater flexibility than multi-year grants to respond to changes in compensation practices.
We strive to pay equity compensation in forms that create appropriate incentives to optimize performance at reasonable cost, and are competitive with incentives offered by other companies. For several years prior to 2004, we paid all long-term equity compensation in the form of stock options. We selected this form because of favorable accounting and tax treatments, and the near universal expectation of officers nationwide that they would receive stock options. For the last several years, however, it has been clear that the favorable accounting treatment of stock options was subject to change, and beginning in 2006 the adoption of Statement of Financial Accounting Standards No. 123(R) (which we frequently refer to as SFAS 123(R)) has eliminated the favorable accounting treatment of options. Moreover, many experts in the field of executive compensation have advised companies to avoid over-reliance on stock options. As a result, many experts, including ours, began to recommend other forms of equity compensation.
Since 2004, the Compensation Committee has paid the executives’ long-term compensation with a combination of stock options and restricted stock. The Committee believes that restricted stock, when compared to stock option grants, provides us an opportunity to provide similar performance incentives to increase share prices with the issuance of fewer
25
Table of Contents
Common Shares, thereby reducing potential dilution. Moreover, unlike options, restricted stock still affords motivation to increase stock prices even if the share price becomes substantially depressed. On the other hand, the Committee believes stock options, when granted in higher multiples than restricted stock, can provide executives with enhanced performance incentives by increasing the profitability of share appreciation. In addition, all compensation expense associated with options issued under our plans is deductible by us for tax purposes under Section 162(m) of the Internal Revenue Code. Based on this, the Committee currently believes that paying equity incentives jointly in the form of restricted stock and stock options is consistent with the goal of creating appropriate incentives at reasonable costs. Using a ratio that values a share of restricted stock 337.5% higher than an option to purchase a share, we have paid half of the value of recent long-term incentive awards in restricted stock and half in options. You should note, however, that other valuation methods (including those that we are required to use under the federal proxy rules) may assign different relative or aggregate valuations to our grants.
Currently, all of our stock options vest over a two- or three-year period, and all restricted stock generally vests over a five-year period, provided the recipient remains employed by us. We have in the past issued restricted stock with vesting periods that accelerate upon the attainment of performance goals, and periodically review the possibility of granting future restricted stock awards that vest partly or wholly upon our performance. Because of the enhanced likelihood of forfeiture, these types of awards are typically granted in higher share multiples and subject the issuing company to greater dilution. Although we may elect to grant such instruments in the future, we currently believe that our use of annual incentive bonuses and long-term stock options appropriately motivates our officers to increase shareholder value. For additional information on the vesting terms of our equity awards, see “Executive Compensation – Incentive Compensation – Outstanding Awards.”
In establishing equity award levels, we review the equity ownership levels of the recipients and prior awards, but do not place great weight on this factor. We believe each annual grant of long-term compensation should match prevailing practices in order for our compensation packages to remain competitive from year to year. Otherwise, reducing current equity grants based on prior grants could increase the risk of competitors offering compensation packages to our executives that have superior long-term incentives. Moreover, the accumulation of substantial awards (awarded in reasonable annual increments) significantly increases each executive’s motivation to increase our share price and remained employed by us, and could deter executives from accepting job offers that trigger equity forfeitures. For these reasons, we do not place great weight on equity ownership levels or prior grants in connection with granting new awards.
Under our plans, the exercise price of all stock options awarded by us must equal or exceed the closing price of our stock on the date of grant (or, if the markets are closed on such date, the immediately preceding trading date). As explained further below, annual awards of stock options to executives are made at the Committee’s regularly scheduled meeting in February. Grants of stock options to newly hired executive officers who are eligible to receive them are made at the next regularly scheduled Committee meeting following their hire date. We have recently developed policies that clarify our practices for pricing options issued to all other employees. Under these policies, (i) employees receive their options as of the fifth business day of the month that follows immediately after the month in which we complete our annual merit
26
Table of Contents
review process (typically in February or March) and (ii) newly hired or promoted employees receive their award of stock options on the fifth business day of the month that follows immediately after the month in which they are hired or promoted.
In early 2005, a subcommittee of the Compensation Committee awarded equity incentive grants for the first year of a three-year program developed and approved by the Committee, with assistance from its consultant, PricewaterhouseCoopers LLP. Based on data compiled by PricewaterhouseCoopers, the Subcommittee determined that the target amount of long-term compensation proposed for 2005, 2006 and 2007 was consistent with its goal of granting long-term incentive awards with a value commensurate with those paid to similarly-situated executives at comparable companies. In both February 2006 and 2007, the Committee confirmed that the amount of long-term compensation targeted for 2006 and 2007 was still appropriate, and approved grants to the executive officers in such amounts. For the reasons discussed above, the Committee split these awards between stock options and restricted stock. For more information, see the tables included under the heading “Executive Compensation.”
Other Benefits
As a final component of executive compensation, we provide a broad array of benefits designed to be competitive, in the aggregate, with similar benefits provided by our peers. We summarize these additional benefits below.
Retirement Plans.We maintain a traditional qualified defined benefit retirement plan for most of our employees who have completed at least five years of service, plus a traditional qualified defined contribution 401(k) plan for a similar group of our employees. With respect to both of these qualified plans, we maintain nonqualified plans that permit our officers to receive or defer supplemental amounts in excess of federally-imposed caps that limit the amount of benefits highly-compensated employees are entitled to receive under qualified plans. We also maintain a nonqualified supplemental executive retirement plan which offers additional benefits to a select group of our senior officers who have served for at least five years. When we review overall compensation levels for our senior management, we factor in the benefits expected to be received under these retirement plans. Additional information regarding these plans is provided in the tables and accompanying discussion included below under the heading “Executive Compensation.”
Change of Control Arrangements.As described in more detail under “Executive Compensation - Potential Termination Payments – Payments Made Upon a Change of Control,” we have agreed to pay each of our executive officers who is terminated without cause or resigns under certain specified circumstances within three years of any change of control of CenturyTel (i) a lump sum cash severance payment equal to three times the sum of such officer’s annual salary and bonus, (ii) the officer’s currently pending bonus, (iii) additional tax gross-up cash payments described further below and (iv) certain welfare benefits for three years.
We believe these benefits enhance shareholder value because
| • | prior to a takeover, these protections (i) help us recruit and retain talented officers by providing assurances that their compensation and benefits will |
27
Table of Contents
| not be reduced or eliminated upon a takeover and (ii) help maintain the productivity of our workforce by alleviating day-to-day concerns over economic security, and | |||
| • | during or after a takeover, these protections (i) help our personnel, when evaluating a possible business combination, to focus on the best interest of CenturyTel and its shareholders, rather than being distracted by personal concerns, and (ii) reduce the risk that personnel will accept job offers from competitors during takeover discussions. |
We monitor the aggregate amount of payments that could potentially be made to our executives if they are terminated following a change of control, and believe these potential payments are relatively small in relation to our current aggregate equity value. We further believe our change of controls benefits are substantially consistent with the general practice among our peers, although we have not commissioned a study to confirm this.
The change of control benefits are payable following a change in control if the officer is terminated without cause or resigns with “good reason,” which is defined to include a diminution of responsibilities, an assignment of inappropriate duties, an increase in responsibilities or duties without a commensurate increase in compensation, and a transfer of the employee exceeding 35 miles. For the CEO’s agreement only, any failure of the CEO to be named the chief executive officer of the parent company surviving the change of control transaction is deemed to be diminution of responsibilities entitling the CEO to resign with “good reason.” All of these provisions are designed to assure our officers that they will retain a job with responsibilities, stature and career opportunities consistent with those enjoyed by them prior to the takeover. In addition, change-of-control benefits are payable to our executive and senior officers if the officer resigns for any reason during the 30-day period immediately following the first anniversary of the change of control. We believe this latter provision would help assure the acquiror of the services of our management team for at least one year following the change of control, while at the same time hastening the acquiror’s incentive to deal quickly and fairly in offering our officers appropriate career and compensation opportunities.
If change of control benefits become payable, the cash payment to our key employees is based on the following multiples of salary and bonus, and the right to health and welfare benefits continues for the following number of years:
| Multiple of | Years of | |||
| Salary and | Welfare | |||
| Bonus | Benefits | |||
| Executive Officers | 3 times | 3 years | ||
| Senior Officers (Job Grades 66 or 67) | 2 times | 2 years | ||
| Other Officers (Job Grades 64 or 65) | 1.5 times | 1.5 years | ||
| Other Key Personnel (Job Grades 61-63) | 1.0 times | 1.0 year |
28
Table of Contents
We have agreed to reimburse only our executive and senior officers for any taxes imposed as a result of change in control benefits. For the remainder of management, we cap their change in control benefits so that no taxes will be imposed.
For more information on our change of control arrangements, see “Executive Compensation - Potential Termination Payments — Payments Made Upon a Change of Control.”
Reduction in Force Benefits.We pay severance benefits to non-union full-time employees who are terminated in connection with a reduction in force. Benefits are not paid if the employee voluntarily resigns or is terminated for performance reasons or in connection with the sale of a business unit or in a transaction that gives rise to the change-of-control payments described above. The amount of any applicable severance payment is based on the terminated employee’s tenure with us and willingness to waive claims, and can range from two to 65 weeks of the terminated employee’s base salary or wages.
Perquisites.Since 1999, we have made cash payments to our officers in lieu of previously-offered perquisites, many of which continue to be offered by our peers. During 2006, these payments to our executives ranged from $27,950 to $34,320.
Officers are entitled to be reimbursed for the cost of an annual physical examination, plus related travel expenses.
Under our aircraft usage policy, the CEO may use our aircraft for personal travel without reimbursing us, and each other executive officer may use our aircraft for up to $10,000 per year in personal travel without reimbursing us (calculated in accordance with applicable guidelines of the Securities and Exchange Commission). In all such cases, personal travel is permitted only if aircraft is available and not needed for superseding business purposes.
As explained in greater detail in our 2006 proxy statement, prior to the Sarbanes-Oxley Act of 2002, we funded supplemental life insurance benefits to our officers in excess of those generally afforded to employees. These benefits were provided pursuant to endorsement “split-dollar” insurance agreements between us and our officers in which CenturyTel and the officer’s beneficiaries would share death benefits payable under life insurance policies procured by us. In 2002, we suspended payment of further premiums under the “split-dollar” policies insuring the lives of our executive officers, but resumed paying premiums in 2006 under restructured arrangements approved by the Compensation Committee. These restructured arrangements, among other things, obligate us to pay premiums on the executive officers’ respective insurance policies sufficient to provide the same death benefits available under the prior agreements, and entitle the executive officers to purchase additional post-retirement coverage at their cost and to receive related tax gross-up cash payments in amounts sufficient to compensate them for income and employment taxes incurred as a result of our premium payments.
For more information on each of the items under this heading, see the Summary Compensation Table appearing below under the heading “Executive Compensation.”
Other Employee Benefits.We maintain certain broad-based employee welfare benefit plans in which the executive officers are generally permitted to participate on terms that are either substantially similar to those provided to all other participants or which provide our
29
Table of Contents
executives with enhanced benefits upon their death or disability. We also maintain a supplemental disability plan designed to ensure disability payments to our officers in the event payments are unavailable from our disability insurer. The Board has elected to invest CenturyTel’s matching contribution under the 401(k) Plan in Common Shares so as to further align employees’ and shareholders’ financial interests.
Our Compensation Decision-Making Process
Compensation Committee.The Compensation Committee of our Board establishes, implements, administers and monitors our programs for compensating executive officers. The Committee engages its own consultants. As described in more detail below under “- Trienniel Review Process,” the consultants assist the Committee to design executive compensation programs, to determine whether the Committee’s philosophy and practices are compatible with prevailing practices, to gather data on the compensation paid to executives at other companies, and to provide guidance on specific compensation levels based on industry trends and practices.
The Compensation Committee also establishes, implements, administers and monitors our director equity compensation programs. The Nominating and Corporate Governance Committee of the Board is responsible for approving cash compensation of our directors, and typically works closely with the Compensation Committee and its consultants to review prevailing director compensation trends and practices.
Trienniel Review Process. Over the past decade, the Committee has retained independent consulting firms every three years to conduct a detailed review of compensation philosophy, practices and programs, including the structure of our annual and long-term incentive compensation programs. During these comprehensive triennial reviews, the Committee has typically sought to confirm that its philosophy and practices are comparable to those of similar companies, to reconfigure our executive compensation programs if necessary to improve them or conform them to prevailing practices, to set annual salaries, and to establish target levels of incentive compensation to be granted to each executive officer during the upcoming three-year period. During the second and third year of each of these three-year periods, the Committee consults with its independent consultants to determine if changes to the three-year program are necessary or appropriate, and to establish the specific salary and annual incentive compensation payable to the executives for the upcoming year.
For several years, the Committee has completed its triennial or annual review in February in conjunction with the first regularly scheduled board meeting of the year. This enables the Committee to approve in February all executive salary adjustments and bonus awards shortly following the completion of our performance review process and the release of our financial results for the previously-completed calendar year.
Since late 2004, the Committee has engaged PricewaterhouseCoopers LLP as its compensation consultant. In February 2005, the Committee, following several months of work with PricewaterhouseCoopers, adopted a three-year executive compensation program covering 2005, 2006 and 2007. In connection with this triennial review, the Committee and PricewaterhouseCoopers compared our officer compensation to the following three benchmarks:
30
Table of Contents
| • | broad-based compensation data for top executives from telecommunications companies and from other companies with revenues comparable to ours, all of which was derived from various national surveys and adjusted for aging | ||
| • | a 14-company “financial” peer group of communications companies with median revenues comparable to ours | ||
| • | a 10-company “industry” peer group of S&P 500 telecommunications companies. |
Although the Committee reviews all three of these benchmarks, it affords the greatest weight to the broad-based survey data, and the next greatest weight to the “financial” peer group. The “industry” peer group is used principally to confirm the relevancy of the first two benchmarks to our industry.
In connection with our review of executive compensation in early 2006, we compared our officer compensation to the same 10- and 14-company peer groups (as adjusted to reflect mergers or split-off transactions). As so adjusted, the 10-company “industry” peer group for 2006 consisted of Citizens Communications, Alltel, Nextel Communications, Qwest Communications, Cingular Wireless, BellSouth Corp., Sprint, AT&T Corp., SBC Communications, and Verizon Communications, and the 14-member “financial” peer group consisted of Alltel, Primus Telecomm Group, Univision Communications, Western Wireless, Cincinnati Bell, IDT Corporation, UnitedGlobalCom, Citizens Communications, Puget Energy, US Cellular, Telephone & Data Corporation, Level 3 Communications, Cablevision Systems and Nextel Communications.
In both 2005 and 2006, the Committee and PricewaterhouseCoopers used the benchmarking data to determine median amounts of salary, annual bonuses and equity compensation paid to executives comparable to ours. In determining how much to compensate each officer, the Committee also extensively reviewed a wide range of other factors, including the officer’s individual performance and particular set of skills, the anticipated degree of difficulty of replacing the officer with someone of comparable experience and skill, the role the officer plays in maintaining a cohesive management team and improving the performance of others, the role the officer may have played in any recent extraordinary corporate achievements, the officer’s tenure with us and within the telecommunications industry, the officer’s pay relative to other officers and employees, the officer’s prior compensation in recent years, the financial community’s assessment of management’s performance, and the recent performance of CenturyTel. In assessing our performance, we typically review how our actual revenues, cash flows, net income and other measures of financial performance relate to amounts previously projected by us or market participants, as well as the results of peer telecommunications companies. We also assess operational benchmarks, such as our access line losses or customer growth in relation to our competitors. Although we assess each officer’s individual performance in connection with establishing all components of compensation, we typically weigh this factor more heavily for salary determinations and less heavily for bonuses, which tend to be allocated among the officers primarily on the basis of their level of responsibility and pay grade.
Role of CEO in Compensation Decisions. Although the Compensation Committee approves all compensation decisions for the executive officers, each year it receives the CEO’s
31
Table of Contents
recommendations, particularly with respect to executive salaries. The Committee believes the CEO is better able than it to assess:
| • | the relative strengths and weakness of the other executives and their recent performance | ||
| • | the possibility that differences in compensation among similarly situated executives could negatively impact morale, cohesion, teamwork or the overall viability of the executive group, and | ||
| • | the relative vulnerability of executives to job solicitations from competitors. |
The Committee considers the CEO’s recommendations as one of the many factors it uses to establish compensation levels for each executive.
In addition, the CEO is responsible for approving the annual salaries and bonuses of our non-executive officers, including approval of appropriate annual performance goals for such officers. The CEO also approves all equity compensation awards to the non-executive officers, acting under authority delegated by the Compensation Committee in accordance with our long-term incentive plans. The Committee oversees these processes and receives an annual report from the CEO.
Forfeiture of Prior Compensation
Our officers have agreed to forfeit their equity compensation awards (and to return to us any cash, securities or other assets received by them upon the sale of Common Shares they acquired through a prior award) if at any time during their employment with us or within 18 months after termination of employment they engage in activity contrary or harmful to our interests. The Compensation Committee is authorized to waive these forfeiture provisions if it determines in its sole discretion that such action is in our best interests. We have filed with the Securities and Exchange Commission copies of our form of incentive agreements containing these forfeiture provisions.
We have never to our knowledge restated our financial statements, and currently have no formal policies regarding whether we would adjust previously-awarded annual incentive bonuses in the event we restated the financial statements upon which such bonuses were based. Under certain circumstances, however, equity awards to culpable executives could be subject to forfeiture under the provisions summarized in the preceding paragraph. In addition, certain laws would require our CEO and CFO to reimburse us for incentive compensation paid or trading profits earned following the release of financial statements that are subsequently restated due to material noncompliance with SEC reporting requirements caused by misconduct.
Other Compensation Matters
To the extent that it is practicable and consistent with our executive compensation objectives, we seek to comply with Section 162(m) of the Internal Revenue Code and the regulations adopted thereunder in order to preserve the tax deductibility of performance-based
32
Table of Contents
compensation in excess of $1 million per taxable year to each of our officers. If compliance with Section 162(m) conflicts with our compensation objectives or is contrary to the best interests of the shareholders, we will pursue those objectives, regardless of the attendant tax implications. In each of the last several years, we granted Restricted Stock that did not qualify as performance-based compensation under Section 162(m).
We believe that our compensation programs create an appropriate incentive for our senior managers to benefit from appreciation in the value of our stock. Although we have reviewed the merits of imposing mandatory security ownership requirements, we have chosen not to do so, primarily because such requirements could cause hardships for officers with less tenure or lower net worth, and because we saw no compelling need to mandate rigid requirements. Similarly, we have not adopted any formal prohibition against our officers hedging the economic risk of their holdings of our Common Shares. Although we believe that excessive use of such hedging could undercut the benefits of our equity incentive programs, we do not believe that our officers have acted in such manner. We plan to continue to periodically assess the merits of adopting ownership requirements or hedging prohibitions in the future.
COMPENSATION COMMITTEE REPORT
The Compensation Committee has reviewed and discussed with management the report included above under the heading “Compensation Discussion and Analysis.” Based on this review and discussion, the Compensation Committee recommended to the Board that the Compensation Discussion and Analysis report be included in this proxy statement and incorporated into our Annual Report on Form 10-K for the year ended December 31, 2006.
Submitted by the Compensation Committee of the Board of Directors.
C. G. Melville, Jr. (Chairman) James B. Gardner Fred R. Nichols
EXECUTIVE COMPENSATION
Overview
The following table sets forth certain information regarding the compensation of (i) our principal executive and financial officers and (ii) each of our four most highly compensated executive officers other than our principal executive and financial officers. In this proxy statement, we sometimes refer to these six executive officers as the “named officers.” Following this table is additional information regarding incentive compensation, pension benefits, deferred compensation and potential termination payments pertaining to the named officers. For additional information on the compensation summarized below and other benefits, see “Compensation Discussion and Analysis.”
33
Table of Contents
Summary Compensation Table
| Name and | Restricted | Stock | Non-Equity | Change in | ||||||||||||||||||||||||||
| Principal | Stock | Option | Incentive Plan | Pension | All Other | |||||||||||||||||||||||||
| Position | Year | Salary | Awards(1) | Awards(1) | Compensation(2) | Value(3) | Compensation(4) | Total | ||||||||||||||||||||||
Glen F. Post, III Chairman of the Board and Chief Executive Officer | 2006 | $ | 1,000,000 | $ | 1,244,231 | $ | 1,449,394 | (5) | $ | 702,000 | $ | 497,552 | $ | 586,051 | $ | 5,479,228 | ||||||||||||||
Karen A. Puckett President and Chief Operating Officer | 2006 | 602,384 | 492,855 | 287,062 | 357,816 | 180,781 | 252,838 | 2,173,736 | ||||||||||||||||||||||
R. Stewart Ewing, Jr. Executive Vice President and Chief Financial Officer | 2006 | 540,448 | 409,966 | 852,500 | (5) | 262,658 | 359,134 | 110,561 | 2,535,267 | |||||||||||||||||||||
Michael E. Maslowski Senior Vice President and Chief Information Officer | 2006 | 332,524 | 268,830 | 155,013 | 143,650 | 294,977 | 201,346 | 1,396,340 | ||||||||||||||||||||||
David D. Cole Senior Vice President — Operations Support | 2006 | 388,020 | 268,830 | 155,013 | 188,578 | 172,849 | 170,419 | 1,343,709 | ||||||||||||||||||||||
Stacey W. Goff Senior Vice President, General Counsel and Secretary | 2006 | 339,184 | 268,830 | 155,013 | 178,848 | 110,675 | 142,492 | 1,195,042 | ||||||||||||||||||||||
| (1) | The amounts shown in this column reflect the dollar amount recognized with respect to these awards for financial statement reporting purposes for 2006 under SFAS 123(R), which requires us to spread the compensation cost of the award of each recipient proportionately over the requisite service period. See footnote 14 entitled “Stock Compensation Programs” of the notes to our audited financial statements included inAppendix Afor an explanation of material assumptions that we used to calculate the fair value of these stock awards. | |
| (2) | The amounts shown in this column reflect cash payments made under our annual incentive bonus plans for 2006 performance. For additional information, see “- Incentive Compensation — 2006 Awards” below. | |
| (3) | Reflects the net change during 2006 of the present value of the executives’ accumulated benefits under the three defined benefit plans discussed under “- Pension Benefits.” | |
| (4) | The amounts shown in this column are comprised of (i) the payment of cash in lieu of previously-offered perquisites, (ii) reimbursements for the cost of an annual physical examination, (iii) personal use of our aircraft, (iv) contributions or other allocations to our defined contribution plans, (v) the payment of premiums on life insurance policies, (vi) cash payments to compensate the executives for taxes incurred by such life insurance premium payments and (vii) the value of dividends paid on the executives’ unvested restricted stock, in each case for and on behalf of the named officers during 2006 as follows: |
| Insurance | ||||||||||||||||||||||||||||
| Insurance | Premium Tax | Restricted | ||||||||||||||||||||||||||
| Cash | Physical | Aircraft | Contributions | Premiums | Reimbursement | Stock | ||||||||||||||||||||||
| Name | Allowance | Exam | Use | to Plans | Paid | Payments | Dividends | |||||||||||||||||||||
| Mr. Post | $ | 34,320 | $ | 2,103 | $ | 5,350 | $ | 144,386 | $ | 215,854 | $ | 146,013 | $ | 38,025 | ||||||||||||||
| Ms. Puckett | 27,950 | 1,670 | — | 80,619 | 75,874 | 51,325 | 15,400 | |||||||||||||||||||||
| Mr. Ewing | 27,950 | 2,697 | 825 | 66,279 | — | — | 12,810 | |||||||||||||||||||||
| Mr. Maslowski | 27,950 | 3,378 | — | 36,971 | 74,352 | 50,295 | 8,400 | |||||||||||||||||||||
| Mr. Cole | 27,950 | — | 2,275 | 47,997 | 49,985 | 33,812 | 8,400 | |||||||||||||||||||||
| Mr. Goff | 27,950 | — | 6,422 | 42,840 | 33,929 | 22,951 | 8,400 | |||||||||||||||||||||
34
Table of Contents
| For additional information on these payments and benefits, see “Compensation Discussion and Analysis — Other Benefits — Perquisites.” |
| (5) | Because Mr. Post and Mr. Ewing are eligible to retire early (which would accelerate the vesting of all of their stock options) before the end of the award’s vesting period, related compensation costs associated with their 2006 option grants have been recognized over the period from date of grant through their respective retirement eligible dates. Approximately 53% of Mr. Post’s grant date fair value related to his 2006 option grant was recognized as 2006 compensation expense. All of Mr. Ewing’s grant date fair value related to his 2006 option grant was recognized as 2006 compensation expense. For all other named officers, the compensation cost is spread proportionately over the full length of the award’s multi-year vesting period. See Note 1 above. |
Incentive Compensation
2006 Awards.The table and discussion below summarizes (i) the range of potential payouts under the annual incentive bonus awards granted in February 2006 (and paid in February 2007), (ii) grants of nonqualified options made on February 20, 2006 and (iii) grants of restricted stock made on February 20, 2006.
Grants of Plan-Based Awards
| Estimated | ||||||||||||||||
| Future Share | Grant Date | |||||||||||||||
| Payouts Under | Exercise | Fair Value of | ||||||||||||||
| Range of Payouts Under 2006 Non- | Equity Incentive | Price of | Stock and | |||||||||||||
| Type of Award and | Equity Incentive Plan Awards(1) | Plan Awards | Option | Option | ||||||||||||
Name | Grant Date | Threshold | Target | Maximum | Target | Awards | Awards(2) | |||||||||
| Glen F. Post, III | Annual Bonus (N/A) | $325,000 | $650,000 | $1,950,000 | — | — | — | |||||||||
| Stock Options (2/20/06) | — | — | — | 200,000 | $35.41 | $ | 2,728,000 | |||||||||
| Restricted Stock (2/20/06) | — | — | — | 58,500 | — | 2,071,485 | ||||||||||
| Karen A. Puckett | Annual Bonus (N/A) | 165,656 | 331,311 | 993,934 | — | — | — | |||||||||
| Stock Options (2/20/06) | — | — | — | 75,000 | 35.41 | 1,023,000 | ||||||||||
| Restricted Stock (2/20/06) | — | — | — | 22,000 | — | 779,020 | ||||||||||
| R. Stewart Ewing, Jr. | Annual Bonus (N/A) | 121,601 | 243,202 | 729,605 | — | — | — | |||||||||
| Stock Options (2/20/06) | — | — | — | 62,500 | 35.41 | 852,500 | ||||||||||
| Restricted Stock (2/20/06) | — | — | — | 18,300 | — | 648,003 | ||||||||||
| Michael E. Maslowski | Annual Bonus (N/A) | 66,505 | 133,010 | 399,029 | — | — | — | |||||||||
| Stock Options (2/20/06) | — | — | — | 40,500 | 35.41 | 552,420 | ||||||||||
| Restricted Stock (2/20/06) | — | — | — | 12,000 | — | 424,920 | ||||||||||
| David D. Cole | Annual Bonus (N/A) | 87,305 | 174,609 | 523,827 | — | — | — | |||||||||
| Stock Options (2/20/06) | — | — | — | 40,500 | 35.41 | 552,420 | ||||||||||
| Restricted Stock (2/20/06) | — | — | — | 12,000 | — | 424,920 | ||||||||||
| Stacey W. Goff | Annual Bonus (N/A) | 76,316 | 152,633 | 457,898 | — | — | — | |||||||||
| Stock Options (2/20/06) | — | — | — | 40,500 | 35.41 | 552,420 | ||||||||||
| Restricted Stock (2/20/06) | — | — | — | 12,000 | — | 424,920 | ||||||||||
35
Table of Contents
| (1) | These columns provide information on the potential bonus payouts approved with respect to 2006 performance. For information on the actual amounts paid based on 2006 performance criteria, see the column of the Summary Compensation Table labeled “Non-Equity Incentive Plan Compensation.” | |
| (2) | Calculated in accordance with SFAS 123(R). |
In February 2006, the Compensation Committee of our Board elected to base the amount of the senior officers’ 2006 annual incentive bonuses on whether we attained “threshold,” “target” or “outstanding” levels of 2006 operating cash flow (established at $1.135, $1.195 and $1.255 billion, respectively) and 2006 end-user revenues (established at $1.264, $1.330 and $1.397 billion, respectively). In each case, attainment of less than 95% of the target amount was designed to result in no bonus payment, and attainment of more than 105% of the target amount was designed to result in three times the bonus payable for attaining the target level of performance. For these purposes, “operating cash flow” meant our operating income plus depreciation and amortization, and “end-user revenues” meant our total operating revenues less “net access” revenues and certain other smaller revenue components included in the category described as “other” revenue inAppendix Ato this proxy statement. In both cases, we adjusted these amounts to eliminate the effects of extraordinary or non-recurring transactions in accordance with procedures described further elsewhere herein. For purposes of calculating the aggregate bonus payment, attainment of the operating cash flow and end-user revenue targets were weighed 60% and 40%, respectively. As reported in the Summary Compensation Table above, these awards resulted in cash payments to our named officers ranging from $143,650 to $702,000. For additional information, see “Compensation Discussion and Analysis — Annual Incentive Bonuses.”
Each of the options granted to our executive officers on February 20, 2006 has a term of ten years and vests over a three-year period, with one-third of the options having become exercisable on March 15, 2007, and one-third becoming exercisable on each of March 15, 2008 and March 15, 2009.
The restricted stock issued to our executive officers vest over a five-year period, with one-fifth of the shares having vested on March 15, 2007 and one-fifth vesting on March 15, 2008, March 15, 2009, March 15, 2010, and March 15, 2011, respectively. The holders of these shares of restricted stock are recognized as the owners of such shares, and, accordingly, receive dividends with respect thereto.
The vesting of the above-described options and restricted stock will accelerate if the officer dies, becomes disabled or retires, and upon the occurrence of a change of control of CenturyTel, as described further in our shareholder-approved 2005 Management Incentive Compensation Plan, a copy of which we have filed with the Securities and Exchange Commission. All of these awards are subject to forfeiture if the officer competes with us or engages in certain other activities harmful to us, all as specified further in the forms of incentive agreements that we have filed with the Securities and Exchange Commission. See “- Potential Termination Payments.”
36
Table of Contents
Outstanding Awards. The table below summarizes information on stock options and unvested restricted stock outstanding at December 31, 2006.
Outstanding Equity Awards at December 31, 2006(1)
| Option Awards | Stock Awards | |||||||||||||||||||||||||
| Number of Securities Underlying | Option | Option | Number of Shares | Market Value | ||||||||||||||||||||||
| Unexercised Options | Exercise | Expiration | That Have Not | of Shares That | ||||||||||||||||||||||
| Name | Exercisable | Unexercisable(2) | Price | Date | Vested(3) | Have Not Vested | ||||||||||||||||||||
| Glen F. Post, III | 320,000 | — | $ | 34.625 | 2/21/2010 | 46,800 | (4) | $ | 2,043,288 | |||||||||||||||||
| 236,200 | — | 28.030 | 5/21/2011 | 46,800 | 2,043,288 | |||||||||||||||||||||
| 320,000 | — | 32.990 | 2/25/2012 | 58,500 | 2,554,110 | |||||||||||||||||||||
| 160,000 | — | 28.340 | 2/25/2014 | |||||||||||||||||||||||
| 200,000 | — | 33.400 | 2/17/2015 | |||||||||||||||||||||||
| — | 200,000 | 35.410 | 2/20/2016 | |||||||||||||||||||||||
| Karen A. Puckett | 120,000 | — | 32.990 | 2/25/2012 | 22,000 | (4) | 960,520 | |||||||||||||||||||
| 75,000 | — | 33.400 | 2/17/2015 | 17,600 | 768,416 | |||||||||||||||||||||
| — | 75,000 | 35.410 | 2/20/2016 | 22,000 | 960,520 | |||||||||||||||||||||
| R. Stewart Ewing, Jr. | 85,000 | — | 34.625 | 2/21/2010 | 18,300 | (4) | 798,978 | |||||||||||||||||||
| 81,000 | (5) | — | 32.990 | 2/25/2012 | 14,640 | 639,182 | ||||||||||||||||||||
| 62,500 | (5) | — | 28.340 | 2/25/2014 | 18,300 | 798,978 | ||||||||||||||||||||
| 62,500 | (5) | — | 33.400 | 2/17/2015 | ||||||||||||||||||||||
| — | 62,500 | 35.410 | 2/20/2016 | |||||||||||||||||||||||
| Michael E. Maslowski | 19,142 | — | 45.540 | 3/24/2009 | 12,000 | (4) | 523,920 | |||||||||||||||||||
| 13,500 | — | 33.400 | 2/17/2015 | 9,600 | 419,136 | |||||||||||||||||||||
| — | 40,500 | 35.410 | 2/20/2016 | 12,000 | 523,920 | |||||||||||||||||||||
| David D. Cole | 85,000 | — | 34.625 | 2/21/2010 | 12,000 | (4) | 523,920 | |||||||||||||||||||
| 81,000 | — | 32.990 | 2/25/2012 | 9,600 | 419,136 | |||||||||||||||||||||
| 27,001 | — | 28.340 | 2/25/2014 | 12,000 | 523,920 | |||||||||||||||||||||
| 40,500 | — | 33.400 | 2/17/2015 | |||||||||||||||||||||||
| — | 40,500 | 35.410 | 2/20/2016 | |||||||||||||||||||||||
| Stacey W. Goff | 9,400 | — | 34.625 | 2/21/2010 | 12,000 | (4) | 523,920 | |||||||||||||||||||
| 18,000 | — | 32.990 | 2/25/2012 | 9,600 | 419,136 | |||||||||||||||||||||
| 50,000 | — | 34.200 | 8/26/2013 | 12,000 | 523,920 | |||||||||||||||||||||
| 40,500 | — | 33.400 | 2/17/2015 | |||||||||||||||||||||||
| — | 40,500 | 35.410 | 2/20/2016 | |||||||||||||||||||||||
37
Table of Contents
| (1) | All information on exercisability, vesting and market value is solely as of December 31, 2006. Some of the options or restricted stock listed above may have vested, become exercisable or been exercised since such date. | |
| (2) | Our options generally vest at a rate of one-third per year over the first three years of the ten-year option term. Our options expiring in 2014 and 2015 vested one-third immediately with the remainder vesting over the following two years. Also, in late 2005, the Company accelerated the vesting of all then-outstanding options. In addition, our options accelerate and become immediately exercisable in full upon a change of control of CenturyTel or if the recipient dies, becomes disabled or retires. | |
| (3) | Except as noted in footnote 4, all shares listed under this column are shares of restricted stock that generally vest as a rate of 20% per year during the first five years after their grant date. In addition, vesting of our restricted stock accelerates upon a change of control of CenturyTel or upon termination of the officer’s employment as a result of death or disability, or, if permitted by the Compensation Committee, retirement or termination by CenturyTel. | |
| (4) | All of these shares of restricted stock will vest in full on February 25, 2009. | |
| (5) | Pursuant to a qualified domestic relations order entered into in 2006, Mr. Ewing transferred all of his options expiring in 2012 and 2014 and two-thirds of his options expiring in 2015 (relating to 185,000 Common Shares in the aggregate), none of which have been exercised. |
2006 Exercises and Vesting.The following table provides information on Common Shares acquired by the named officers during 2006 in connection with the exercise of options and the vesting of restricted stock.
Option Exercises and Stock Vested
| Option Awards(1) | Stock Awards | |||||||||||||||||
| Number of | Number of | |||||||||||||||||
| Shares | Shares | |||||||||||||||||
| Acquired | Value Realized | Acquired | Value Realized | |||||||||||||||
| Name | on Exercise | On Exercise | on Vesting | on Vesting(2) | ||||||||||||||
| Glen F. Post, III | 501,783 | $ | 7,848,325 | 13,520 | $ | 508,893 | ||||||||||||
| Karen A. Puckett | 274,999 | 3,043,762 | 5,613 | 211,273 | ||||||||||||||
| R. Stewart Ewing, Jr. | 162,000 | 2,065,198 | 4,873 | 183,420 | ||||||||||||||
| Michael E. Maslowski | 198,498 | 1,474,244 | 3,310 | 124,588 | ||||||||||||||
| David D. Cole | 210,115 | 3,091,040 | 3,310 | 124,588 | ||||||||||||||
| Stacey W. Goff | 23,165 | 283,704 | 2,400 | 90,336 | ||||||||||||||
| (1) | Excludes options transferred by Mr. Ewing during 2006 pursuant to a qualified domestic relations order. | |
| (2) | Based on the closing price of the Common Shares on the vesting date. |
Pension Benefits
The following table and discussion summarizes pension benefits payable to the named officers under (i) our retirement plan qualified under Internal Revenue Code Section 401(a),
38
Table of Contents
which permits most of our employees (including officers) who have completed at least five years of service to receive pension benefits upon attaining early or normal retirement age, (ii) our nonqualified supplemental plan, which is designed to pay supplemental retirement benefits to officers in amounts equal to the benefits such officers would otherwise forego due to federal limitations on compensation and benefits under qualified plans, and (iii) our nonqualified supplemental executive retirement plan, which offers additional retirement benefits to a select group of our senior officers who have completed at least five years of service. We refer to these defined benefit plans below as our qualified plan, our supplemental plan and our SERP, respectively.
Pension Benefits
| Present | ||||||||
| Numbers of | Value of | |||||||
| Years Credited | Accumulated | |||||||
| Name | Plan Name | Service(1) | Benefit(2) | |||||
| Glen F. Post, III | Qualified Plan | 8 | $ | 810,373 | ||||
| Supplemental Plan | 8 | 283,729 | ||||||
| SERP | 25 | 5,727,177 | ||||||
| Karen A. Puckett | Qualified Plan | 6 | 423,010 | |||||
| Supplemental Plan | 6 | 103,676 | ||||||
| SERP | 6 | 735,516 | ||||||
| R. Stewart Ewing, Jr. | Qualified Plan | 8 | 869,544 | |||||
| Supplemental Plan | 8 | 130,505 | ||||||
| SERP | 24 | 2,107,882 | ||||||
| Michael E. Maslowski | Qualified Plan | 7 | 1,074,266 | |||||
| Supplemental Plan | 7 | 58,262 | ||||||
| SERP | 7 | 235,710 | ||||||
| David D. Cole | Qualified Plan | 8 | 614,180 | |||||
| Supplemental Plan | 8 | 51,753 | ||||||
| SERP | 24 | 933,021 | ||||||
| Stacey W. Goff | Qualified Plan | 8 | 246,732 | |||||
| Supplemental Plan | 8 | 22,082 | ||||||
| SERP | 4 | 181,063 | ||||||
| (1) | In accordance with our plans and practices, these figures correspond to the named officers’ tenure at CenturyTel, unless otherwise noted in the discussion below. | |
| (2) | These figures represent accumulated benefits as of December 31, 2006 (assuming the executive remains employed by us and begins receiving retirement benefits at the normal retirement age of 65), discounted from the normal retirement age to December 31, 2006 using a discount rate of 5.8%. See Note 11 entitled “Defined Benefit and Other Retirement Plans” of the notes to our audited financial statements included inAppendix Afor additional information. |
The aggregate amount of a participant’s total monthly pension payment under the qualified and supplemental plans is equal to the participant’s years of service since 1999 (up to a maximum of 30 years) multiplied by the sum of (i) 0.5% of his final average pay plus (ii) 0.5%
39
Table of Contents
of his final average pay in excess of his compensation subject to Social Security taxes. For these purposes, “final average pay” means the participant’s average monthly compensation during the 60 consecutive month period within his last ten years of employment in which he received his highest compensation.
Participants in the SERP receive a retirement benefit equal to (i) 3% of the officer’s “average monthly compensation” (defined below) times the officer’s years of service with us (not to exceed ten years) plus (ii) 1% of the officer’s “average monthly compensation” times his years of service in excess of ten years of service with us (up to 15 additional years), minus (iii) 4% of his estimated monthly Social Security benefits times his years of service with us (up to a maximum of 25 years). Payments to retired officers under this formula are increased by 3% per year to reflect cost of living increases. “Average monthly compensation” means the officer’s average monthly compensation during the 36 consecutive month period within his last ten years of employment in which he received his highest compensation. Participants added to the plan after January 1, 2000 receive credit only for service while a plan participant.
Under all three retirement plans, the compensation upon which benefits are based equals the aggregate amount of the participant’s salary and annual cash incentive bonus. Although the pension benefits described above are provided through three separate plans, the Company reserves the right to transfer benefits from the supplemental plan or the SERP to the qualified plan to the extent allowed under Treasury regulations and other guidance. The value of benefits transferred to the qualified plan directly offsets the value of benefits in the supplemental plan or the SERP. In 2005 and 2006, we transferred benefits from the supplemental plan and the SERP to the qualified plan, the incremental value of which will be payable to the recipients in the form of enhanced annuities or supplemental benefits.
The normal form of benefit payment under all three retirement plans is (i) in the case of unmarried participants, a monthly annuity payable for the life of the participant, and (ii) in the case of married participants, an actuarially equivalent monthly annuity payable for the lifetime of the participant and a survivor annuity payable for the lifetime of the spouse upon the participant’s death. Participants may elect optional forms of annuity benefits under all three plans and, in the case of the qualified plan, an annuity that guarantees ten years of benefits, all of which are actuarially equivalent in value to the normal form of benefit. The enhanced annuities described in the prior paragraph may be paid in the form of a lump sum, at the participant’s election.
The normal retirement age under all three of the above-described plans is 65. Participants may receive benefits under all three plans upon “early retirement,” which is defined as attaining age 55 with either five years of service (with respect to the qualified and supplemental plans) or 10 years of service (with respect to the SERP). Under our qualified and supplemental plans, the benefit payable upon early termination is calculated under formulas that pay between 60% to 100% of the base plan benefit and 48% to 92% of the excess plan benefit, in each case with the lowest percentage applying to early retirement at age 55 and proportionately higher percentages applying to early retirement after age 55. The early termination benefit under the SERP is equal to 50%, 70% or 80% of the full normal retirement benefit (depending on the retiree’s years of service) for early retirement at age 55, and is equal to higher percentages that proportionately escalate up to 100% with each additional year of age up to age 65. For
40
Table of Contents
additional information on early retirement benefits, please see the early retirement provisions of our pension plans, copies of which are filed with the Securities and Exchange Commission.
Stewart Ewing is currently eligible for early retirement under all three of the pension plans described above.
Deferred Compensation
The following table and discussion provides information on our supplemental dollars & sense plan, which is designed to permit officers to defer amounts in excess of the amounts that may be deferred under federal law governing qualified 401(k) plans.
Non-Qualified Deferred Compensation
| Executive | CenturyTel | Aggregate | ||||||||||||||||||
| Contributions | Contributions | Aggregate | Aggregate | Balance at | ||||||||||||||||
| in | in | Earnings in | Withdrawals/ | December 31, | ||||||||||||||||
| Name | 2006(1) | 2006(2) | 2006 | Distributions(3) | 2006(4) | |||||||||||||||
| Glen F. Post, III | $ | 126,980 | $ | 128,222 | $ | 19,475 | $ | 10,532 | $ | 264,145 | ||||||||||
| Karen A. Puckett | 56,279 | 69,178 | 9,719 | 15,684 | 119,492 | |||||||||||||||
| R. Stewart Ewing, Jr. | 42,693 | 53,357 | 6,997 | 14,070 | 88,977 | |||||||||||||||
| Michael E. Maslowski | 16,970 | 23,135 | 3,039 | 13,072 | 30,072 | |||||||||||||||
| David D. Cole | 30,448 | 32,075 | 4,376 | 10,796 | 56,103 | |||||||||||||||
| Stacey W. Goff | 57,973 | 30,970 | 7,696 | 15,215 | 81,424 | |||||||||||||||
| (1) | All of these amounts in this column reflect contributions by the officer of salary paid in 2006 and reported as 2006 salary compensation in the Summary Compensation Table. | |
| (2) | We have reflected all of the amounts included in this column as 2006 compensation in the column of the Summary Compensation Table labeled “All Other Compensation.” | |
| (3) | The amounts in this column reflect transfers of benefits from the supplemental dollars & sense plan to our qualified 401(k) plan. | |
| (4) | As indicated in notes 1 and 2 above, most of this balance has been disclosed as compensation in this proxy statement. |
Under our supplemental dollars & sense plan, certain of our senior officers may defer up to (i) up to 25% of their salary in excess of the federal limit on annual contributions to qualified 401(k) plans (which was $220,000 for 2006) and (ii) 25% of the restricted stock portion of their annual incentive bonus award (which is deducted from the cash portion of such bonus). (The latter deferral has been unavailable since 1999, which was the last year that our annual bonuses included a restricted stock portion.) For every dollar that participants contribute to this plan up to 6% of their excess salary, we add an amount equal to the total matching percentage then in effect for matching contributions made by us under our qualified 401(k) plan (which was 60% for 2006). All amounts contributed under this supplemental plan by the participants or us may be invested by the participants in the same broad array of money market and mutual funds offered under our qualified 401(k) plan. Participants may change their investments in these funds at any time. We reserve the right to transfer benefits from the supplemental dollars &
41
Table of Contents
sense plan to our qualified 401(k) or retirement plans to the extent allowed under Treasury regulations and other guidance. The value of benefits transferred to our qualified plans directly offsets the value of benefits in the supplemental dollars & sense plan. We made transfers of this type in both 2005 and 2006. Participants in the supplemental dollars & sense plan normally receive payment of their account balances in a lump sum once they cease working fulltime for us.
Potential Termination Payments
The materials below discuss payments and benefits that our officers are eligible to receive if they (i) resign or retire, (ii) are terminated by us, with or without cause, (iii) die or become disabled or (iv) become entitled to termination benefits following a change of control of CenturyTel.
Notwithstanding the information appearing below, you should be aware that our officers have agreed to forfeit their equity compensation awards (and profits derived therefrom) if they compete with us or engage in other activity harmful to our interests while employed with us or within 18 months after termination. Certain other compensation might also be recoverable by us under certain circumstances after termination of employment. See “Compensation Discussion and Analysis – Forfeiture of Awards” for more information.
Payments Made Upon All Terminations.Regardless of the manner in which our employees’ employment terminates prior to a change of control, they are entitled to receive amounts earned during their term of employment (subject to the potential forfeitures discussed above). With respect to each such terminated employee, such amounts include his or her:
| • | salary and unused vacation pay through the date of termination, payable immediately in cash | ||
| • | restricted stock that has vested | ||
| • | benefits accrued and vested under our qualified and supplemental defined benefit pension plans, with payouts generally occurring at early or normal retirement age | ||
| • | benefits held in our qualified and supplemental defined contribution plans, which the employee is generally free to receive at the time of termination | ||
| • | rights to continued health care benefits to the extent required by law. |
Payments Made Upon Voluntary or Involuntary Terminations.In addition to benefits described under the heading immediately above, employees terminated by us without cause prior to a change of control are also entitled to:
| • | exercise all vested options within 190 days of the termination date | ||
| • | keep all unvested restricted stock if approved by our Compensation Committee | ||
| • | if the termination qualifies as a layoff, (i) a cash severance payment in the amount described under “Compensation Discussion and Analysis – Other Benefits – Reduction in Force Benefits,” (ii) receipt of their annual target incentive bonus, and (iii) out placement assistance benefits |
42
Table of Contents
None of the benefits listed immediately above are payable if the employee resigns or is terminated for cause, except that resigning employees are entitled to exercise their vested options within 190 days and employees terminated for cause could request the Compensation Committee to accelerate their unvested restricted stock (which is unlikely to be granted).
Payments Made Upon Retirement.Employees who retire in conformity with our retirement policies are entitled to:
| • | exercise all of their options, all of which accelerate upon retirement, within three years of their retirement date | ||
| • | keep all unvested restricted stock if approved by our Compensation Committee (which traditionally has been granted) | ||
| • | payment of their annual target incentive bonus | ||
| • | post-retirement life, health and welfare benefits | ||
| • | all of the benefits described under the heading “- Payments Made Upon All Terminations” |
Payments Made Upon Death or Disability.Upon death or disability, officers (or their estates) are entitled to (without duplication of benefits):
| • | payments under our disability or life insurance plans, as applicable | ||
| • | exercise all of their options, all of which accelerate upon death or disability, within two years | ||
| • | keep all of their restricted stock, whether vested or unvested | ||
| • | payment of their annual target incentive bonus | ||
| • | continued rights to receive (i) life, health and welfare benefits at early or normal retirement age, in the event of disabilities of employees with ten years of prior service, or (ii) health and welfare benefits payable to surviving eligible dependents, in the event of death of employees meeting certain age and service requirements | ||
| • | all of the benefits described under the heading “- Payments Made Upon All Terminations,” except that (i) upon death benefits under our retirement plans are generally available only to surviving spouses and (ii) benefits payable to mentally disabled employees under our nonqualified defined benefit retirement plans may be paid prior to retirement age. |
Payments Made Upon a Change of Control.We have entered into agreements that entitle each of our executive officers who are terminated without cause or resigns under certain specified circumstances within three years of any change in control of CenturyTel to (i) receive a lump sum cash severance payment equal to three times the sum of such officer’s annual salary and bonus, (ii) receive such officer’s currently pending bonus, (iii) receive any such additional tax gross-up cash payments as may be necessary to compensate him or her for any federal excise taxes, penalties or interest imposed upon contingent change in control payments and (iv) continue to receive certain welfare benefits for three years.
Under the above-referenced agreements, a “change in control” of CenturyTel would be deemed to occur upon (i) any person (as defined in the Securities Exchange Act of 1934)
43
Table of Contents
becoming the beneficial owner of 30% or more of the outstanding Common Shares or 30% or more of combined voting power of our voting securities, (ii) a majority of our directors being replaced, (iii) consummation of certain mergers, substantial asset sales or similar business combinations, or (iv) approval by the shareholders of a liquidation or dissolution of CenturyTel.
All of the above-referenced agreements provide the benefits described above if the officer resigns with “good reason,” which we describe further under the heading “Compensation Discussion and Analysis – Change-in-Control Arrangements.” Except as otherwise described under such heading, all of the change in control agreements for our executives are substantially similar. We have filed forms of these agreements with the Securities and Exchange Commission.
In the event of a change in control of CenturyTel, our benefit plans provide, among other things, that all restrictions on outstanding restricted stock will lapse and all outstanding stock options will become fully exercisable. In addition, participants in the Supplemental Executive Retirement Plan and the Supplemental Defined Benefit Plan whose service is terminated within three years of the change in control will receive a cash payment equal to the present value of their plan benefits (after providing age and service credits of up to three years), determined in accordance with actuarial assumptions specified in the plan. Upon the earlier of the date that a change of control transaction is completed, announced or proposed, post-retirement life, health and welfare benefits will vest with respect to (i) former employees receiving such benefits on such date and (ii) current employees who have completed ten years of service and attained age 53 as of such date.
Estimated Potential Termination Payments.The table below provides estimates of the value of payments and benefits that would become payable if the named officers were terminated in the manner described below, in each case based on the assumption described in the table’s notes.
Potential Termination Payments
| Type of Termination of Employment(1) | ||||||||||||||||||
| Involuntary | ||||||||||||||||||
| Type of | Termination | Termination | ||||||||||||||||
| Termination | Without | Upon a Change | ||||||||||||||||
| Name | Payment(2) | Cause(3) | Disability | Death | of Control(4) | |||||||||||||
| Glen F. Post, III | Annual Bonus | $ | 702,000 | $ | 702,000 | $ | 702,000 | $ | 947,567 | |||||||||
| Equity Awards(5) | — | 8,290,686 | 8,290,686 | 8,290,686 | ||||||||||||||
| Pension and Welfare(6) | 10,000 | — | — | 12,966,950 | ||||||||||||||
| Cash Severance(7) | 1,000,000 | — | — | 15,445,812 | ||||||||||||||
| $ | 1,712,000 | $ | 8,992,686 | $ | 8,992,686 | $ | 37,651,015 | |||||||||||
| Karen A. Puckett | Annual Bonus | $ | 357,816 | $ | 357,816 | $ | 357,816 | $ | 481,163 | |||||||||
| Equity Awards(5) | — | 3,308,206 | 3,308,206 | 3,308,206 | ||||||||||||||
| Pension and Welfare(6) | 10,000 | — | — | 2,290,707 | ||||||||||||||
| Cash Severance(7) | 117,060 | — | — | 6,320,817 | ||||||||||||||
| $ | 484,876 | $ | 3,666,022 | $ | 3,666,022 | $ | 12,400,893 | |||||||||||
44
Table of Contents
| Type of Termination of Employment(1) | ||||||||||||||||||
| Involuntary | ||||||||||||||||||
| Type of | Termination | Termination | ||||||||||||||||
| Termination | Without | Upon a Change | ||||||||||||||||
| Name | Payment(2) | Cause(3) | Disability | Death | of Control(4) | |||||||||||||
R. Stewart Ewing, Jr.(8) | Annual Bonus | $ | 262,657 | $ | 262,657 | $ | 262,657 | $ | 357,452 | |||||||||
| Equity Awards(5) | — | 2,752,763 | 2,752,763 | 2,752,763 | ||||||||||||||
| Pension and Welfare(6) | 10,000 | — | — | 3,143,371 | ||||||||||||||
| Cash Severance(7) | 546,104 | — | — | 5,507,154 | ||||||||||||||
| $ | 818,761 | $ | 3,015,420 | $ | 3,015,420 | $ | 11,760,740 | |||||||||||
| Michael A. Maslowski | Annual Bonus | $ | 161,607 | $ | 161,607 | $ | 161,607 | $ | 198,249 | |||||||||
| Equity Awards(5) | — | 1,801,101 | 1,801,101 | 1,801,101 | ||||||||||||||
| Pension and Welfare(6) | 10,000 | — | — | 1,833,285 | ||||||||||||||
| Cash Severance(7) | 71,082 | — | — | 3,462,272 | ||||||||||||||
| $ | 242,689 | $ | 1,962,708 | $ | 1,962,708 | $ | 7,294,907 | |||||||||||
| David D. Cole | Annual Bonus | $ | 188,578 | $ | 188,578 | $ | 188,578 | $ | 262,498 | |||||||||
| Equity Awards(5) | — | 1,801,101 | 1,801,101 | 1,801,101 | ||||||||||||||
| Pension and Welfare(6) | 10,000 | — | — | 1,565,598 | ||||||||||||||
| Cash Severance(7) | 392,080 | — | — | 3,678,504 | ||||||||||||||
| $ | 590,658 | $ | 1,989,679 | $ | 1,989,679 | $ | 7,307,701 | |||||||||||
| Stacey W. Goff | Annual Bonus | $ | 164,843 | $ | 164,843 | $ | 164,843 | $ | 182,815 | |||||||||
| Equity Awards(5) | — | 1,801,101 | 1,801,101 | 1,801,101 | ||||||||||||||
| Pension and Welfare(6) | 10,000 | — | — | 902,105 | ||||||||||||||
| Cash Severance(7) | 93,652 | — | — | 3,190,809 | ||||||||||||||
| $ | 268,495 | $ | 1,965,944 | $ | 1,965,944 | $ | 6,076,830 | |||||||||||
| (1) | All data in the table reflects estimates of the value of payments and benefits assuming the named officer was terminated on December 29, 2006. The closing price of the Common Shares on such data was $43.66. The table reflects only estimates of amounts earned or payable through or at such date. Actual amounts can be determined only at the time of termination. No information is provided in the table for retirement, because none of the named officers were eligible for early or normal retirement at December 29, 2006, except for R. Stewart Ewing, Jr. (See footnote 8 to this table.) If a named officer voluntary resigns or is terminated with cause, he or she will not be entitled to any special or accelerated benefits, but will be entitled to receive various payouts of benefits that vested before the termination date. The table reflects potential payments based upon a physical disability; additional benefits may be payable in the event of a mental disability. | |
| (2) | As further described above, upon termination of employment, the named officers may become entitled to receive certain special, accelerated or enhanced benefits, including the right to receive payment of their annual cash incentive bonus, an acceleration of the vesting of their outstanding equity awards, current or enhanced pension and welfare benefits, or cash severance payments. The table excludes (i) payments or benefits made under broad-based plans or arrangements generally available to all salaried full-time employees and (ii) benefits, awards or amounts that the officer was entitled to receive prior to termination of employment. | |
| (3) | The information in this column assumes the officer’s termination qualifies as a layoff under CenturyTel’s reduction in force policies. The amounts listed in this column will not be payable if the officer voluntarily resigns or is terminated for cause. | |
| (4) | The information in this column assumes the named officer became entitled at December 29, 2006 to the benefits described above under “- Payments Made Upon a Change of Control.” As described further under |
45
Table of Contents
| such heading, some of these benefits will accrue immediately upon a change of control, regardless of whether the officer’s employment terminates. | ||
| (5) | The information in this column (i) reflects the incremental benefit to the named officer arising of the accelerated vesting of his or her stock options and restricted stock caused by the termination of employment, based upon the intrinsic method of valuation, and (ii) assumes that the Compensation Committee will not approve the acceleration of the named officer’s restricted stock in the event of an involuntary termination. | |
| (6) | The information in this column reflects only the incremental benefits that accrue upon an event of termination, and excludes benefits that were vested on December 29, 2006. For information on the present value of the named officers’ accumulated benefits under our defined benefit pension plans, see “- Pension Benefits,” and for information on the aggregate balances of the named officers’ non-qualified deferred compensation, see “- Deferred Compensation.” As indicated above, the named officer would also be entitled to receive a distribution of his or her 401(k) benefits and various other broad-based benefits. | |
| (7) | The information in this column (i) includes, in the case of payments made in connection with terminations following a change of control, payments to compensate the recipient for any federal excise taxes, penalties or interest payable as a result of receiving change of control benefits (which in all cases approximated or exceeded the amount of the cash severance payment included among such change of control benefits), and (ii) excludes, in the case of disability or death, payments made by insurance companies. | |
| (8) | In the event Mr. Ewing had elected to retire early on December 29, 2006, he or his designees would have been entitled to (i) lifetime annuity payments of approximately $285,000 per year, (ii) payment of his 2006 bonus in the amount of $262,657, (iii) accelerated vesting of his stock options and, assuming the Compensation Committee approves such action, accelerated vesting of his restricted stock (with an aggregate value of $2,752,763 determined in the manner described in footnote 5), and (iv) post-retirement health, life and welfare benefits (valued at $58,000). |
DIRECTOR COMPENSATION
Overview. The table and the discussion below summarizes how we compensated our outside directors in 2006.
2006 Compensation of Outside Directors
| Fees | ||||||||||||||||
| Earned | ||||||||||||||||
| or | ||||||||||||||||
| Paid in | Stock | All Other | ||||||||||||||
| Name | Cash | Awards(1) | Compensation(2) | Total | ||||||||||||
| William R. Boles, Jr. | $ | 87,000 | $ | 62,500 | $ | 2,868 | $ | 152,368 | ||||||||
| Virginia Boulet | 116,500 | 62,500 | 1,110 | 180,110 | ||||||||||||
| Calvin Czeschin | 86,500 | 62,500 | 1,110 | 150,110 | ||||||||||||
| James B. Gardner | 119,500 | 62,500 | 1,110 | 183,110 | ||||||||||||
| W. Bruce Hanks | 99,000 | 62,500 | 3,850 | 165,350 | ||||||||||||
| Gregory J. McCray | 91,500 | 62,500 | 1,110 | 155,110 | ||||||||||||
| C. G. Melville, Jr. | 114,000 | 62,500 | 1,110 | 177,610 | ||||||||||||
| Fred R. Nichols | 97,000 | 62,500 | 1,110 | 160,610 | ||||||||||||
46
Table of Contents
| Fees | ||||||||||||||||
| Earned | ||||||||||||||||
| or | ||||||||||||||||
| Paid in | Stock | All Other | ||||||||||||||
| Name | Cash | Awards(1) | Compensation(2) | Total | ||||||||||||
| Harvey P. Perry | 185,500 | 62,500 | 4,039 | 252,039 | ||||||||||||
| Jim D. Reppond | 96,000 | 62,500 | 1,110 | 159,610 | ||||||||||||
| Joseph R. Zimmel | 94,000 | 62,500 | 1,110 | 157,610 | ||||||||||||
| (1) | The amounts shown in this column reflect the dollar amount recognized for financial statement reporting purposes with respect to 2006 in accordance with SFAS 123(R) relating to grants of restricted stock on May 13, 2005 and May 12, 2006. These grants vest over three-year periods. The fair value of each award granted on May 12, 2006 was approximately $100,000, computed in accordance with SFAS 123(R). As of December 31, 2006, each of the above-listed directors held 16,000 options and 4,834 shares of restricted stock, except for the following directors who held the following number of options: Mr. Hanks, 46,000 options; Mr. Zimmel, 13,667 options; Mr. Nichols, 12,000 options; Ms. Boulet, 6,000 options; and Messrs. Czeschin, McCray, Melville and Perry, 0 options each. | |
| (2) | Represents (i) for all directors, $1,110 of dividends paid on their unvested restricted stock, and (ii) for Messrs. Boles, Hanks and Perry, $1,758, $2,740 and $2,929, respectively, of reimbursements for the cost of an annual physical examination and related travel expenses. For information on transactions with certain of our directors, see “Related Party Transactions.” |
Cash and Stock Payments. Each director who is not employed (which we refer to as outside directors or non-management directors) is paid an annual fee of $50,000 plus $2,000 for attending each regular board meeting, $2,500 for attending each special board meeting and each day of the Board’s annual planning session, and $1,500 for attending each meeting of a board committee. Outside directors who attend a director education program are credited with attending an extra special board meeting (and are reimbursed for their related expenses).
Currently the Vice Chairman of the Board is paid supplemental board fees at the rate of $100,000 per year. The Vice Chairman’s duties include (i) assisting the Chairman by facilitating communications among the directors and monitoring the activities of the Board’s committees, (ii) serving at the Chairman’s request on the board of any company in which we have an investment, (iii) monitoring our strategies and (iv) performing certain executive succession functions.
Currently (i) the chair of the Audit Committee is paid supplemental board fees at the rate of $20,000 per year and (ii) the chair of the Compensation Committee, the chair of the Nominating Committee and the chair of the Risk Evaluation Committee are each paid supplemental board fees at the rate of $10,000 per year.
During 2006, the Compensation Committee authorized each outside director to receive 2,663 shares of Restricted Stock (which were valued under the 2005 Directors Stock Plan at $100,000 based on the average closing price of the Common Shares during the 15 trading day period preceding our 2006 annual meeting). In early 2007, the Compensation Committee authorized a similar grant payable to each outside director serving on the day after our 2007
47
Table of Contents
annual meeting. All of these shares of Restricted Stock will vest over a three-year period, and the total value of these awards will generally be allocated over these three-year vesting periods (as explained further in the footnotes to the table above).
Other Benefits.Each outside director is entitled to be reimbursed (i) for expenses incurred in attending board and committee meetings, (ii) for expenses incurred in attending director education programs and (iii) up to $5,000 per year for the cost of an annual physical examination, plus related travel expenses and the estimated income taxes incurred by the director in connection with receiving these medical reimbursement payments.
Our bylaws require us to indemnify our directors and officers to the fullest extent permitted by law so that they will be free from undue concern about personal liability in connection with their service to CenturyTel. We have signed agreements with each of those individuals contractually obligating us to provide these indemnification rights. We also provide our directors with customary directors and officers liability insurance.
Under our aircraft usage policy, neither directors nor their families may use our aircraft for personal trips (except on terms generally available to all of our employees in connection with a medical emergency). We have arranged a charter service that our outside directors can use at their cost for their personal air travel needs. None of our directors used this charter service during 2005 or 2006.
PERFORMANCE GRAPH
The graph below compares the cumulative total shareholder return on the Common Shares with the cumulative total return of the S&P 500 Index and the S&P Integrated Telecommunications Index for the period from December 31, 2001 to December 31, 2006, in each case assuming (i) the investment of $100 on January 1, 2002 at closing prices on December 31, 2001, and (ii) reinvestment of dividends.
48
Table of Contents
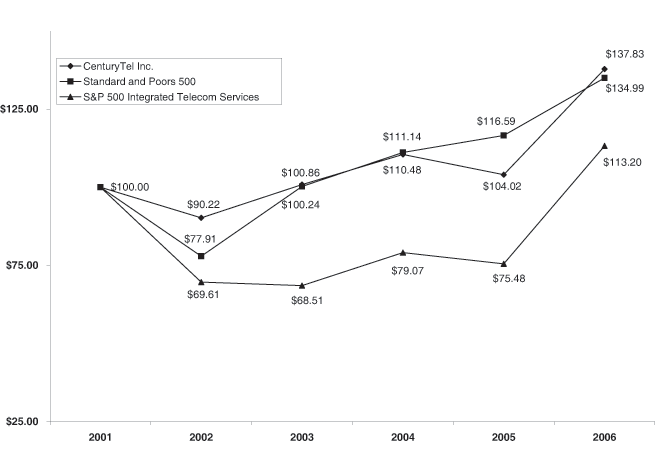
| December 31, | ||||||||||||||||||||||||
| 2001 | 2002 | 2003 | 2004 | 2005 | 2006 | |||||||||||||||||||
| CenturyTel, Inc. | $ | 100.00 | $ | 90.22 | $ | 100.86 | $ | 110.48 | $ | 104.02 | $ | 137.83 | ||||||||||||
| S&P 500 Index | 100.00 | 77.91 | 100.24 | 111.14 | 116.59 | 134.99 | ||||||||||||||||||
S&P Telecom Index(1) | 100.00 | 69.61 | 68.51 | 79.07 | 75.48 | 113.20 | ||||||||||||||||||
| (1) | The S&P Integrated Telecommunications Index consists of AT&T Corporation, CenturyTel, Inc., Citizens Communications Company, Embarq Corporation, Qwest Communications International Inc., Verizon Communications Inc. and Windstream Corporation. The index is publicly available. |
TRANSACTIONS WITH RELATED PARTIES
Recent Transactions
In exchange for legal services rendered to us in 2006, we paid fees of $527,500 to The Boles Law Firm, a law firm owned by William R. Boles, Jr. Mr. Boles, a director of CenturyTel since 1992, is President and a director and practicing attorney with such firm, which has provided legal services to us since 1968.
Review Procedures
Early each year, our director of internal audit distributes to the audit committee a written report listing our payments to vendors, including a list of transactions with our directors, officers or employees. This annual report permits the independent directors to assess and discuss our
49
Table of Contents
related party transactions. Although we have no formal written pre-approval procedure governing related party transactions, our CEO typically seeks approval of the board before engaging in any new related party transaction involving significant sums or risks.
SECTION 16(A) BENEFICIAL OWNERSHIP REPORTING COMPLIANCE
The Securities Exchange Act of 1934 requires our executive officers and directors, among others, to file certain beneficial ownership reports with the Securities and Exchange Commission. During 2006, David Cole filed late one Form 4 report.
OTHER MATTERS
Quorum and Voting of Proxies
The presence, in person or by proxy, of a majority of the total voting power of the Voting Shares is necessary to constitute a quorum to organize the Annual Meeting. Shareholders voting or abstaining from voting on any issue will be counted as present for purposes of constituting a quorum to organize the Annual Meeting.
If a quorum to organize the Annual Meeting is present, directors will be elected by plurality vote and, as such, withholding authority to vote in the election of directors will not affect whether the nominees named herein are elected. Assuming a quorum to organize the Annual Meeting is present, the affirmative vote of the holders of a majority of the voting power present or represented at the Annual Meeting will be required to ratify the appointment of KPMG as our independent auditor for 2007 and to approve the shareholder proposal described further above. Shares as to which the proxy holders have been instructed to abstain from voting will be treated under the Company’s bylaws as not being present or represented for purposes of such vote, and will therefore not affect the outcome of the vote with respect to either of these matters.
Under the rules of the New York Stock Exchange, brokers who hold shares in street name for customers may, subject to certain exceptions, vote in their discretion on matters when they have not received voting instructions from beneficial owners. Under these rules, brokers who do not receive such instructions will be entitled to vote in their discretion with respect to the election of directors and the ratification of the appointment of the independent auditor. If brokers who do not receive voting instructions do not exercise discretionary voting power (a “broker non-vote”) with respect to any matter to be considered at the Annual Meeting, shares that are not voted will be treated as present for purposes of constituting a quorum to organize the Annual Meeting but not present or cast with respect to considering such matter. Because the election of directors must be approved by plurality vote and ratification of the independent auditor and approval of the shareholder proposal must be approved by a majority of the voting power present or represented at the Annual Meeting, broker non-votes with respect to these matters will not affect the outcome of the voting.
Valid voting instructions or properly executed proxies received in time for the Annual Meeting will be voted at the Annual Meeting. You may revoke your instructions or proxy at any time before your votes are cast by filing with our Secretary a written revocation or by duly submitting voting instructions or an executed proxy at a later date, or by attending the Annual
50
Table of Contents
Meeting and voting in person. Unless revoked, all validly submitted voting instructions or properly executed proxies will be voted as specified and, if no specifications are made, will be voted in favor of the nominees, in favor of the ratification of the independent auditor, and against the shareholder proposal.
Management has not timely received any notice that a shareholder desires to present any matter for action at the Annual Meeting in accordance with our bylaws (which are described below) other than the shareholder proposal described above, and is otherwise unaware of any matter for action by shareholders at the Annual Meeting other than those matters specified in the Notice of the Meeting. Our proxy and voting instruction cards, however, will confer discretionary voting authority with respect to any other matter that may properly come before the Annual Meeting. It is the intention of the persons named therein to vote in accordance with their best judgment on any such matter.
Shareholder Nominations and Proposals
In order to be eligible for inclusion in our 2008 proxy materials pursuant to the federal proxy rules, any shareholder proposal to take action at such meeting must be received at our principal executive offices by December 6, 2007, and must comply with applicable federal proxy rules. In addition, our bylaws require shareholders to furnish timely written notice of their intent to nominate a director or bring any other matter before a shareholders’ meeting, whether or not they wish to include their proposal in our proxy materials. In general, notice must be received by our Secretary between November 12, 2007 and February 10, 2008 and must contain specified information concerning, among other things, the matters to be brought before such meeting and concerning the shareholder proposing such matters. (If the date of the 2008 annual meeting is more than 30 days earlier or later than May 10, 2008, notice must be received by our Secretary within 15 days of the earlier of the date on which notice of such meeting is first mailed to shareholders or public disclosure of the meeting date is made.) For additional information on these procedures, see “Corporate Governance – Director Nomination Process.”
Annual Financial Report
Appendix Aincludes our Annual Financial Report, which is excerpted from portions of our Annual Report on Form 10-K for the year ended December 31, 2006 that we filed with the Securities and Exchange Commission on March 1, 2007. Our summary annual report for the year ended December 31, 2006 precedes this proxy statement at the beginning of this booklet.
In connection with filing our Form 10-K report for the year ended December 31, 2006, our chief executive officer and chief financial officer made the certifications regarding our financial disclosures required under the Sarbanes-Oxley Act of 2002, and the regulations promulgated thereunder. In addition, during 2006 our chief executive officer certified to the New York Stock Exchange that he was unaware of any violation by us of the New York Stock Exchange’s corporate governance listing standards.
You may obtain a copy of our Form 10-K report without charge by writing to Stacey W. Goff, Secretary, CenturyTel, Inc., 100 CenturyTel Drive, Monroe, LA 71203, or by visiting our website atwww.centurytel.com.
51
Table of Contents
NeitherAppendix Anor our summary annual report is to be regarded as proxy soliciting material.
By Order of the Board of Directors

Stacey W. Goff
Secretary
Secretary
Dated: April 4, 2007
52
Table of Contents
INDEX TO FINANCIAL ANNUAL REPORT
December 31, 2006
December 31, 2006
The materials included in this Appendix A are excerpted from Items 5, 6, 7 and 8 of our Annual Report onForm 10-K for the year ended December 31, 2006, which we filed with the Securities and Exchange Commission on March 1, 2007. Please see theForm 10-K for additional information about our business and operations.
| Page | ||||
| A-3 | ||||
| A-4 | ||||
| A-5 | ||||
| A-27 | ||||
| A-28 | ||||
| A-29 | ||||
| A-31 | ||||
| A-32 | ||||
| A-33 | ||||
| A-34 | ||||
| A-35 | ||||
| A-36 | ||||
| A-65 | ||||
| * | All references to “Notes” in thisAppendix Arefer to these Notes. |
A-2
Table of Contents
INFORMATION ON OUR TRADING PRICE AND DIVIDENDS
Our common stock is listed on the New York Stock Exchange and is traded under the symbol CTL. The following table sets forth the high and low sales prices, along with the quarterly dividends, for each of the quarters indicated.
| Sales prices | Dividend per | |||||||||||||||
| High | Low | common share | ||||||||||||||
| 2006: | ||||||||||||||||
| First quarter | $ | 39.90 | 32.54 | .0625 | ||||||||||||
| Second quarter | $ | 40.00 | 34.79 | .0625 | ||||||||||||
| Third quarter | $ | 40.14 | 35.38 | .0625 | ||||||||||||
| Fourth quarter | $ | 44.11 | 39.34 | .0625 | ||||||||||||
| 2005: | ||||||||||||||||
| First quarter | $ | 35.47 | 32.31 | .06 | ||||||||||||
| Second quarter | $ | 35.00 | 29.55 | .06 | ||||||||||||
| Third quarter | $ | 36.50 | 33.20 | .06 | ||||||||||||
| Fourth quarter | $ | 35.28 | 31.14 | .06 | ||||||||||||
Common stock dividends during 2006 and 2005 were paid each quarter. As of February 15, 2007, there were approximately 5,600 shareholders of record of our common stock.
A-3
Table of Contents
SELECTED FINANCIAL DATA
The following table presents certain selected consolidated financial data (from continuing operations) as of and for each of the years ended in the five-year period ended December 31, 2006:
Selected Income Statement Data:
| Year ended December 31, | ||||||||||||||||||||
| 2006 | 2005 | 2004 | 2003 | 2002 | ||||||||||||||||
| (Dollars, except per share amounts, and shares expressed in thousands) | ||||||||||||||||||||
| Operating revenues | $ | 2,447,730 | 2,479,252 | 2,407,372 | 2,367,610 | 1,971,996 | ||||||||||||||
| Operating income | $ | 665,538 | 736,403 | 753,953 | 750,396 | 575,406 | ||||||||||||||
| Income from continuing operations | $ | 370,027 | 334,479 | 337,244 | 344,707 | 193,533 | ||||||||||||||
| Basic earnings per share from continuing operations | $ | 3.17 | 2.55 | 2.45 | 2.40 | 1.36 | ||||||||||||||
| Diluted earnings per share from continuing operations | $ | 3.07 | 2.49 | 2.41 | 2.35 | 1.35 | ||||||||||||||
| Dividends per common share | $ | .25 | .24 | .23 | .22 | .21 | ||||||||||||||
| Average basic shares outstanding | 116,671 | 130,841 | 137,215 | 143,583 | 141,613 | |||||||||||||||
| Average diluted shares outstanding | 122,229 | 136,087 | 142,144 | 148,779 | 144,408 | |||||||||||||||
Selected Balance Sheet Data:
| December 31, | ||||||||||||||||||||
| 2006 | 2005 | 2004 | 2003 | 2002 | ||||||||||||||||
| (Dollars in thousands) | ||||||||||||||||||||
| Net property, plant and equipment | $ | 3,109,277 | 3,304,486 | 3,341,401 | 3,455,481 | 3,531,645 | ||||||||||||||
| Goodwill | $ | 3,431,136 | 3,432,649 | 3,433,864 | 3,425,001 | 3,427,281 | ||||||||||||||
| Total assets | $ | 7,441,007 | 7,762,707 | 7,796,953 | 7,895,852 | 7,770,408 | ||||||||||||||
| Long-term debt | $ | 2,412,852 | 2,376,070 | 2,762,019 | 3,109,302 | 3,578,132 | ||||||||||||||
| Stockholders’ equity | $ | 3,190,951 | 3,617,273 | 3,409,765 | 3,478,516 | 3,088,004 | ||||||||||||||
Selected Consolidated Operating Data:
| December 31, | ||||||||||||||||||||
| 2006 | 2005 | 2004 | 2003 | 2002 | ||||||||||||||||
| Telephone access lines (1) | 2,094,000 | 2,214,000 | 2,314,000 | 2,376,000 | 2,415,000 | |||||||||||||||
| High-speed Internet customers | 369,000 | 249,000 | 143,000 | 83,000 | 53,000 | |||||||||||||||
| (1) | Excluding adjustments during 2006 to reflect (i) the removal of test lines, (ii) database conversion and clean-up and (iii) the sale of our Arizona properties, access line losses for 2006 were approximately 107,000. |
A-4
Table of Contents
MANAGEMENT’S DISCUSSION AND ANALYSIS OF FINANCIAL
CONDITION AND RESULTS OF OPERATIONS
CONDITION AND RESULTS OF OPERATIONS
RESULTS OF OPERATIONS
Overview
CenturyTel, Inc., together with its subsidiaries, is an integrated communications company engaged primarily in providing an array of communications services, including local and long distance voice, Internet access and broadband services, to customers in 25 states. We currently derive our revenues from providing (i) local exchange and long distance voice services, (ii) network access services, (iii) data services, which includes both high-speed (“DSL”) and dial-up Internet services, as well as special access and private line services, (iv) fiber transport, competitive local exchange and security monitoring services and (v) other related services.
Our results of operations in 2006 were adversely impacted as a result of (i) lower Universal Service Fund and intrastate access revenues, (ii) declines in access lines, (iii) the recognition of stock option expense in accordance with SFAS 123(R) and (iv) expenses associated with expanding our new video and wireless service offerings. See below for additional information.
On June 30, 2005, we acquired fiber assets in 16 metropolitan markets from KMC Telecom Holdings, Inc. (“KMC”) for approximately $75.5 million cash.
On March 1 and August 31, 2006, we announced workforce reductions involving an aggregate of approximately 400 jobs and, in connection therewith, incurred a net pre-tax charge of approximately $7.5 million (consisting of a $9.4 million charge to operating expenses, net of a $1.9 million favorable revenue impact related to such expenses) for severance and related costs. See Note 8 for additional information.
In the second quarter of 2006, we (i) recorded a one-time pre-tax gain of approximately $117.8 million upon redemption of our investment in the stock of the Rural Telephone Bank (“RTB”) and (ii) sold our local exchange operations in Arizona. See Note 15 for additional information.
Our net income for 2006 was $370.0 million, compared to $334.5 million during 2005 and $337.2 million during 2004. Diluted earnings per share for 2006 was $3.07 compared to $2.49 in 2005 and $2.41 in 2004. The increase in diluted earnings per share is primarily attributable to lower average shares outstanding in 2006 compared to prior years due to share repurchases that have occurred during the past two years and to the gain recorded upon redemption of our investment in RTB stock.
A-5
Table of Contents
| Year ended December 31, | 2006 | 2005 | 2004 | |||||||||
| (Dollars, except per share amounts, and shares in thousands) | ||||||||||||
| Operating income | $ | 665,538 | 736,403 | 753,953 | ||||||||
| Interest expense | (195,957 | ) | (201,801 | ) | (211,051 | ) | ||||||
| Other income (expense) | 121,568 | 3,168 | 4,470 | |||||||||
| Income tax expense | (221,122 | ) | (203,291 | ) | (210,128 | ) | ||||||
| Net income | $ | 370,027 | 334,479 | 337,244 | ||||||||
| Basic earnings per share | $ | 3.17 | 2.55 | 2.45 | ||||||||
| Diluted earnings per share | $ | 3.07 | 2.49 | 2.41 | ||||||||
| Average basic shares outstanding | 116,671 | 130,841 | 137,215 | |||||||||
| Average diluted shares outstanding | 122,229 | 136,087 | 142,144 | |||||||||
Operating income decreased $70.9 million in 2006 due to a $31.5 million decrease in operating revenues and a $39.3 million increase in operating expenses. Operating income decreased $17.6 million in 2005 as a $71.9 million increase in operating revenues was more than offset by an $89.4 million increase in operating expenses.
In addition to historical information, this management’s discussion and analysis includes certain forward-looking statements that are based on current expectations only, and are subject to a number of risks, uncertainties and assumptions, many of which are beyond our control. Actual events and results may differ materially from those anticipated, estimated or projected if one or more of these risks or uncertainties materialize, or if underlying assumptions prove incorrect. Factors that could affect actual results include but are not limited to: the timing, success and overall effects of competition from a wide variety of competitive providers; the risks inherent in rapid technological change; the effects of ongoing changes in the regulation of the communications industry; our ability to effectively manage our expansion opportunities, including successfully financing, consummating and integrating pending acquisitions and retaining and hiring key personnel; possible changes in the demand for, or pricing of, our products and services; our ability to successfully introduce new product or service offerings on a timely and cost-effective basis; our ability to collect our receivables from financially troubled communications companies; our ability to successfully negotiate collective bargaining agreements on reasonable terms without work stoppages; the effects of adverse weather; other risks referenced from time to time in this report or other of our filings with the Securities and Exchange Commission; and the effects of more general factors such as changes in interest rates, in tax rates, in accounting policies or practices, in operating, medical or administrative costs, in general market, labor or economic conditions, or in legislation, regulation or public policy. These and other uncertainties related to our business are described in greater detail in Item 1A of our Annual Report onForm 10-K for the year ended December 31, 2006. You should be aware that new factors may emerge from time to time and it is not possible for us to identify all such factors nor can we predict the impact of each such factor on the business or the extent to which any one or more factors may cause actual results to differ from those reflected in any forward-looking statements. You are further
A-6
Table of Contents
cautioned not to place undue reliance on these forward-looking statements, which speak only as of the date of this report. We undertake no obligation to update any of our forward-looking statements for any reason.
Operating Revenues
| Year ended December 31, | 2006 | 2005 | 2004 | |||||||||
| (Dollars in thousands) | ||||||||||||
| Voice | $ | 860,741 | 892,272 | 903,025 | ||||||||
| Network access | 878,702 | 959,838 | 966,011 | |||||||||
| Data | 351,495 | 318,770 | 275,777 | |||||||||
| Fiber transport and CLEC | 149,088 | 115,454 | 74,409 | |||||||||
| Other | 207,704 | 192,918 | 188,150 | |||||||||
| Operating revenues | $ | 2,447,730 | 2,479,252 | 2,407,372 | ||||||||
As a result of increased bundling of our local exchange and long distance service offerings, beginning in 2006, we have combined the revenues of such offerings into a category entitled “Voice.” We have restated prior periods to insure comparability.
Voice revenues.We derive voice revenues by providing local exchange telephone services and retail long distance services to customers in our service areas. The $31.5 million (3.5%) decrease in voice revenues in 2006 is primarily due to (i) a $22.3 million decrease due a 4.8% decline in the number of access lines served and (ii) a $26.1 million decline as a result of a decrease in minutes of use in extended area calling plans in certain areas. Such decreases were partially offset by (i) a $12.6 million increase in long distance revenues primarily attributable to an increase in the number of long distance lines and increased long distance minutes of use, both of which were partially offset by a decline in the average rate we charged our long distance customers and (ii) a $9.9 million increase due to providing custom calling features to more customers. The $10.8 million (1.2%) decrease in voice revenues in 2005 is primarily due to (i) a $16.5 million decrease due to a decrease in the average rate we charged our long distance customers, (ii) a $16.1 million decrease due a 3.3% decline in the average number of access lines served, and (iii) a $7.5 million decline as a result of a decrease in minutes of use in extended area calling plans in certain areas. Such decreases were partially offset by (i) a $21.2 million increase in long distance revenues attributable to a 12.0% increase in the average number of long distance lines served and a 12.8% increase in minutes of use and (ii) an $8.7 million increase due to providing custom calling features to more customers.
Excluding (i) the sale of our Arizona telephone operations in May 2006 and (ii) the net impact of removing test lines from our access line counts and adding lines as a result of converting and correcting our databases during 2006, access lines declined 107,000 (4.8%) during 2006 compared to a decline of 99,500 (4.3%) in 2005. We believe the decline in the number of access lines during the past few years is primarily due to the displacement of traditional wireline telephone services by other competitive services. We expect access lines to decline between 4.5% and 6.0% during 2007.
A-7
Table of Contents
Network access revenues.We derive our network access revenues primarily from (i) providing services to various carriers and customers in connection with the use of our facilities to originate and terminate their interstate and intrastate voice and data transmissions and (ii) receiving universal support funds which allows us to recover a portion of our costs under federal and state cost recovery mechanisms. Certain of our interstate network access revenues are based on tariffed access charges filed directly with the Federal Communications Commission (“FCC”); the remainder of such revenues (except for DSL-related revenues) are derived under revenue sharing arrangements with other local exchange carriers (“LECs”) administered by the National Exchange Carrier Association. Intrastate network access revenues are based on tariffed access charges filed with state regulatory agencies or are derived under revenue sharing arrangements with other LECs.
Network access revenues decreased $81.1 million (8.5%) in 2006 and decreased $6.2 million (0.6%) in 2005 due to the following factors:
| 2006 | 2005 | |||||||
| increase | increase | |||||||
| (decrease) | (decrease) | |||||||
| (Dollars in thousands) | ||||||||
| Recovery from the federal Universal Service | ||||||||
| High Cost Loop support program | $ | (11,637 | ) | (13,065 | ) | |||
| Intrastate revenues due to decreased minutes of use, decreased access rates in certain states and recovery from state support funds | (16,326 | ) | (13,392 | ) | ||||
| Partial recovery of operating costs through revenue sharing arrangements with other telephone companies, interstate access revenues and return on rate base | (16,825 | ) | 6,819 | |||||
| Rate changes in certain jurisdictions | (2,875 | ) | (3,457 | ) | ||||
| Prior year revenue settlement agreements | (31,219 | ) | 15,947 | |||||
| Other, net | (2,254 | ) | 975 | |||||
| $ | (81,136 | ) | (6,173 | ) | ||||
Our revenues from the Universal Service High Cost Loop Fund decreased approximately $11.6 million in 2006 and $13.1 million in 2005, primarily due to an increase in the nationwide average cost per loop factor used by the FCC to allocate funds among all recipients. We anticipate our 2007 revenues from the federal Universal Service High Cost Loop support program will be approximately the same as 2006 levels.
In 2006, we experienced a reduction in our intrastate revenues of approximately $16.3 million primarily due to a reduction in intrastate minutes (partially due to the displacement of minutes by wireless, electronic mail and other optional calling services). The corresponding decrease in 2005 compared to 2004 was $13.4 million. We believe intrastate minutes will continue to decline in 2007, although the magnitude of such decrease is uncertain.
A-8
Table of Contents
Prior year revenue settlement agreements for 2005 included the recognition of approximately $35.9 million of revenue settlements for prior periods that did not recur in 2006. Of the $35.9 million recognized, $24.5 million was reflected in network access revenues and $11.4 million was reflected in data revenues.
Data revenues. We derive our data revenues primarily by providing Internet access services (both DSL and dial-up services) and data transmission services over special circuits and private lines. Data revenues increased $32.7 million (10.3%) in 2006 and $43.0 million (15.6%) in 2005. The 2006 increase was substantially due to a $54.0 million increase in DSL-related revenues primarily due to growth in the number of high-speed Internet customers. Such increase was partially offset by a decrease in prior year revenue settlements due to the above-described recognition of approximately $11.4 million of revenue in the third quarter of 2005 and a $4.9 million decrease due to a reduced number of dial-up Internet customers.
The $43.0 million increase in 2005 was primarily due to (i) a $24.8 million increase in Internet revenues due primarily to growth in the number of high-speed Internet customers, partially offset by a decrease in the number of dial-up customers, (ii) a $10.8 million increase in special access revenues due to an increase in the number of special circuits provided and an increase in the partial recovery of our increased operating expenses through revenue sharing arrangements with other telephone companies, and (iii) an $8.6 million net increase in revenues related to prior year settlement agreements driven principally by the above-described non-recurring increase in the third quarter of 2005.
Fiber transport and CLEC.Our fiber transport and CLEC revenues include revenues from our fiber transport, competitive local exchange carrier (“CLEC”) and security monitoring businesses. Fiber transport and CLEC revenues increased $33.6 million (29.1%) in 2006, of which $24.4 million was due to revenues from the fiber assets acquired on June 30, 2005 from KMC and $8.5 million was attributable to growth in our incumbent fiber transport business. Fiber transport and CLEC revenues increased $41.0 million (55.2%) in 2005, of which $27.7 million was due to revenue from the June 30, 2005 acquisition of fiber assets from KMC and $12.4 million was attributable to growth in our incumbent fiber transport business.
Other revenues.We derive other revenues primarily by (i) leasing, selling, installing and maintaining customer premise telecommunications equipment and wiring, (ii) providing billing and collection services for third parties, (iii) participating in the publication of local directories and (iv) providing new service offerings, principally consisting of our new video and wireless reseller services. Other revenues increased $14.8 million (7.7%) during 2006 primarily due to a $12.1 million increase in revenues of our video and wireless reseller offerings and $2.5 million increase in directory revenues. Other revenues increased $4.8 million (2.5%) during 2005 primarily due to a $4.5 million increase in directory revenues.
A-9
Table of Contents
Operating Expenses
| Year ended December 31, | 2006 | 2005 | 2004 | |||||||||
| (Dollars in thousands) | ||||||||||||
| Cost of services and products (exclusive of depreciation and amortization) | $ | 888,414 | 821,929 | 755,413 | ||||||||
| Selling, general and administrative | 370,272 | 388,989 | 397,102 | |||||||||
| Depreciation and amortization | 523,506 | 531,931 | 500,904 | |||||||||
| Operating expenses | $ | 1,782,192 | 1,742,849 | 1,653,419 | ||||||||
Cost of services and products.Cost of services and products increased $66.5 million (8.1%) in 2006 primarily due to (i) an $18.9 million increase in expenses incurred by the properties acquired from KMC; (ii) an $18.3 million increase in costs associated with growth in our long distance business; (iii) a $14.3 million increase in expenses associated with our video and wireless reseller service offerings; (iv) an $11.5 million increase in Internet operating expenses primarily due to growth in the number of high-speed Internet customers; and (v) $8.6 million of severance and related costs associated with our workforce reduction (see Note 8).
Cost of services and products increased $66.5 million (8.8%) in 2005 primarily due to (i) a $21.9 million increase in expenses incurred by the properties acquired from KMC in June 2005; (ii) a $16.4 million increase in expenses associated with our Internet operations primarily due to an increase in the number of high-speed Internet customers; (iii) a $10.6 million increase in costs associated with growth in our fiber transport business; (iv) a $9.0 million increase in salaries and benefits; (v) an $8.2 million increase in access expenses; (vi) a $5.3 million increase due to start-up costs associated with our new video and wireless reseller services; and (vii) a $4.3 million increase in costs associated with growth in our long distance business. Such increases were partially offset by (i) a $3.9 million decrease in expenses caused by us settling certain pole attachment disputes in 2005 for amounts less than those previously accrued and (ii) a $3.4 million decrease in customer service expense.
Selling, general and administrative.Selling, general and administrative expenses decreased $18.7 million (4.8%) in 2006 primarily due to an $11.0 million decrease in marketing expenses; a $10.6 million reduction in information technology expenses; an $8.7 million reduction in bad debt expense; and a $5.8 million decrease in operating taxes. These decreases were partially offset by a $9.9 million increase in salaries and benefits and a $5.5 million increase in expenses incurred from the properties acquired from KMC.
Selling, general and administrative expenses decreased $8.1 million (2.0%) in 2005 primarily due to (i) a $12.4 million decrease in operating taxes (primarily due to an $8.6 million one-time charge in the third quarter of 2004); (ii) an $11.2 million reduction in bad debt expense, and (iii) a $4.6 million decrease in expenses attributable to our Sarbanes-Oxley internal controls compliance effort. Such decreases were
A-10
Table of Contents
partially offset by (i) $7.9 million of expenses incurred by the properties acquired from KMC; (ii) a $5.9 million increase in customer service and marketing costs associated with growth in our Internet business and (iii) a $2.8 million increase in sales and marketing costs associated with our new video and wireless reseller services.
Depreciation and amortization. Depreciation and amortization decreased $8.4 million (1.6%) in 2006, primarily due to a $25.3 million reduction in depreciation expense due to certain assets becoming fully depreciated. Such decreases were partially offset by (i) a $16.6 million increase due to higher levels of plant in service and (ii) a $3.1 million increase due to depreciation and amortization of the properties acquired from KMC.
Depreciation and amortization increased $31.0 million (6.2%) in 2005. The year 2004 included a one-time reduction in depreciation expense of $13.2 million to adjust the balances of certain over-depreciated property, plant and equipment accounts. The remaining $17.8 million increase in 2005 is primarily due to (i) a $19.0 million increase due to higher levels of plant in service, (ii) a $6.1 million increase associated with amortization of our new billing system and (iii) a $2.8 million increase due to depreciation and amortization incurred by the properties acquired from KMC. Such increases were partially offset by (i) a $7.8 million reduction in depreciation expense due to certain assets becoming fully depreciated and (ii) the non-recurrence in 2005 of a $3.1 million one-time increase recorded in 2004 related to the depreciation of fixed assets associated with our new billing system.
Other.For additional information regarding certain matters that have impacted or may impact our operations, see “Regulation and Competition.”
Interest Expense
Interest expense decreased $5.8 million (2.9%) in 2006 compared to 2005 as a $10.5 million decrease due primarily to a decrease in average debt outstanding was partially offset by a $7.1 million increase due to higher average interest rates.
Interest expense decreased $9.3 million (4.4%) in 2005 compared to 2004 as a $16.1 million decrease due primarily to a decrease in average debt outstanding was partially offset by a $7.7 million increase due to higher average interest rates.
Other Income (Expense)
Other income (expense) includes the effects of certain items not directly related to our core operations, including gains/losses from asset dispositions and impairments, our share of income from our 49% interest in a cellular partnership, interest income and allowance for funds used during construction.
A-11
Table of Contents
Other income (expense) was $121.6 million in 2006, $3.2 million in 2005 and $4.5 million in 2004. The years 2006, 2005 and 2004 were impacted by certain charges and credits that are not expected to occur in the future. Included in 2006 were pre-tax gains of approximately $118.6 million, substantially all of which related to the redemption of our RTB stock upon dissolution of the RTB, which were partially offset by pre-tax charges of approximately $11.7 million due to the impairment of certain non-operating investments. Included in 2005 was (i) a $16.2 million pre-tax charge due to the impairment of a non-operating investment; (ii) a $4.8 million debt extinguishment expense related to purchasing and retiring approximately $400 million of our Senior J notes; (iii) $3.2 million of non-recurring interest income related to the settlement of various income tax audits; and (iv) a $3.5 million gain from the sale of a non-operating investment. Included in 2004 was a $3.6 million prepayment expense paid in connection with the redemption of $100 million aggregate principal amount of our Series B senior notes in May 2004 and a $2.5 million charge related to the impairment of a non-operating investment.
Income Tax Expense
Our effective income tax rate was 37.4%, 37.8% and 38.4% in 2006, 2005 and 2004, respectively. Income tax expense was reduced by approximately $6.4 million in 2006 due to the resolution of various income tax audit issues. Income tax expense for 2005 was increased by $19.5 million as a result of increasing the valuation allowance related to net state operating loss carryforwards. This increase was primarily due to changes in state income tax laws and other factors which impacted the projections of future taxable income. This tax expense increase was more than offset by (i) a reduction of state income tax reserves ($11.6 million, net of federal income tax benefit); (ii) a reduction in our composite state income tax rate due to more income being apportioned to states with lower state tax rates ($8.5 million); and (iii) the favorable settlement of various federal income tax audits ($1.3 million).
Accounting Pronouncements
In June 2006, the Financial Accounting Standards Board issued Interpretation No. 48, “Accounting for Uncertainty in Income Taxes” (“FIN 48”), which clarifies the accounting for uncertainty in income taxes recognized in financial statements. FIN 48 prescribes a comprehensive model for recognizing, measuring, presenting and disclosing in the financial statements tax positions taken or expected to be taken on a tax return. FIN 48 is effective for fiscal years beginning after December 15, 2006. We do not expect the impact of adopting FIN 48 to have a material adverse effect on our consolidated financial position or results of operations.
In September 2006, the Financial Accounting Standards Board issued Statement of Financial Accounting Standards No. 157, “Fair Value Measurements” (“SFAS 157”). SFAS 157 defines fair value, establishes a framework for measuring fair value and expands disclosures about fair value measurements required or
A-12
Table of Contents
permitted under other accounting pronouncements. SFAS 157 is effective for fiscal years beginning after November 15, 2007. We are currently evaluating the impact of adopting SFAS 157.
In September 2006, the Financial Accounting Standards Board issued Statement of Financial Accounting Standards No. 158, “Employers’ Accounting for Defined Benefit Plans and Other Postretirement Plans” (“SFAS 158”). SFAS 158 was effective for our December 31, 2006 balance sheet and requires us to recognize the overfunded or underfunded status of our defined benefit and postretirement plans as an asset or liability on our balance sheet and to recognize changes in that funded status in the year in which the changes occur through adjustments to other comprehensive income (loss) and to stockholders’ equity, reflected in accumulated other comprehensive loss. As a result of the implementation of SFAS 158, our non-current assets decreased $64.7 million, our current liabilities decreased $898,000, our non-current liabilities (excluding deferred income taxes) increased approximately $99.5 million, our deferred income taxes decreased approximately $65.4 million and our stockholders’ equity (reflected in accumulated other comprehensive loss) decreased approximately $97.9 million. See Note 1 for additional information.
In September 2006, the Securities and Exchange Commission issued Staff Accounting Bulletin No. 108, “Considering the Effects of Prior Year Misstatements when Quantifying Misstatements in Current Year Financial Statements” (“SAB 108”). SAB 108 addresses how the effects of prior year uncorrected misstatements should be considered when quantifying misstatements in current year financial statements. SAB 108 requires companies to quantify misstatements using both a balance sheet approach and income statement approach and to evaluate whether either approach results in quantifying an error that is material in light of the relevant quantitative and qualitative factors. We adopted SAB 108 in the fourth quarter of 2006. Upon the implementation of SAB 108, we recognized a net $9.7 million increase to beginning of the year retained earnings for the cumulative effect of correcting prior year uncorrected misstatements. See Note 1 for additional information.
On January 1, 2003, we adopted Statement of Financial Accounting Standards No. 143, “Accounting for Asset Retirement Obligations” (“SFAS 143”), which addresses financial accounting and reporting for legal obligations associated with the retirement of tangible long-lived assets and requires that the fair value of a liability for an asset retirement obligation be recognized in the period in which it is incurred and be capitalized as part of the book value of the long-lived asset. Although we generally have no legal obligation to remove obsolete assets, depreciation rates of certain assets established by regulatory authorities for our telephone operations subject to Statement of Financial Accounting Standards No. 71, “Accounting for the Effects of Certain Types of Regulation” (“SFAS 71”), have historically included a component for removal costs in excess of the related estimated salvage value. Notwithstanding the adoption of SFAS 143, SFAS 71 requires us to continue to reflect this accumulated liability for removal costs in excess of salvage value even though there is no legal obligation to remove the assets. Therefore, we did not adopt the provisions of SFAS 143 for our telephone operations subject to SFAS 71. For our telephone operations acquired from Verizon in 2002 (which are not subject to SFAS 71) and our other non-
A-13
Table of Contents
regulated operations, we have not accrued a liability for anticipated removal costs related to tangible long-lived assets through an adjustment to our depreciation rates for these assets. For these reasons, the adoption of SFAS 143 did not have a material effect on our financial statements.
On March 31, 2005, the Financial Accounting Standards Board issued Interpretation No. 47, “Accounting for Conditional Asset Retirement Obligations” (“FIN 47”), an interpretation of SFAS 143. FIN 47, which was effective for fiscal years ending after December 15, 2005, clarifies that the recognition and measurement provisions of SFAS 143 apply to asset retirement obligations in which the timing or method of settlement may be conditional on a future event that may or may not be within control of the entity. We identified conditional asset retirement obligations for (i) asbestos removal in buildings, (ii) removal of underground storage tanks, (iii) our property located on public and private rights-of way and (iv) our property that is attached to poles owned by other utilities and municipalities. Due to a lack of historical experience from which to reasonably estimate a settlement date or range of settlement dates, we concluded that an asset retirement obligation associated with our property located on rights-of-way is indeterminate. We also concluded that our conditional asset retirement obligations related to the removal of asbestos, underground storage tanks and our property that is attached to other entities’ poles was immaterial to our financial condition and results of operations and therefore has not been recognized.
Critical Accounting Policies
Our financial statements are prepared in accordance with accounting principles that are generally accepted in the United States. The preparation of these financial statements requires management to make estimates and assumptions that affect the reported amounts of assets, liabilities, revenues and expenses. We continually evaluate our estimates and assumptions including those related to (i) revenue recognition, (ii) allowance for doubtful accounts, (iii) pension and postretirement benefits, (iv) long-lived assets and (v) income taxes. Actual results may differ from these estimates and assumptions. We believe these critical accounting policies discussed below involve a higher degree of judgment or complexity.
Revenue recognition.Certain of our interstate network access and data revenues are based on tariffed access charges filed directly with the FCC; the remainder of such revenues is derived from revenue sharing arrangements with other LECs administered by the National Exchange Carrier Association, with the exception of DSL-related revenues which were removed from our pooled interstate tariff filing effective July 1, 2006 and are now recognized as revenues when billed. During 2004, we began generally recognizing such interstate network access revenues at the authorized rate of return, unless the actual achieved or projected rate of return was lower than authorized.
The Telecommunications Act of 1996 allows local exchange carriers to file access tariffs on a streamlined basis and, if certain criteria are met, deems those tariffs lawful. Tariffs that have been “deemed
A-14
Table of Contents
lawful” in effect nullify an interexchange carrier’s ability to seek refunds should the earnings from the tariffs ultimately result in earnings above the authorized rate of return prescribed by the FCC. Certain of our telephone subsidiaries file interstate tariffs with the FCC using this streamlined filing approach. Since July 2004, we have recognized billings from our tariffs as revenue since we believe such tariffs are “deemed lawful.” There is no assurance that our future tariff filings will be “deemed lawful.” For those billings from tariffs prior to July 2004, we initially recorded as a liability our earnings in excess of the authorized rate of return, and may thereafter recognize as revenue some or all of these amounts at the end of the applicable settlement period or as our legal entitlement thereto becomes certain. We recorded approximately $35.9 million as revenue in the third quarter of 2005 as the settlement period related to the 2001/2002 monitoring period lapsed on September 30, 2005. The amount of our earnings in excess of the authorized rate of return reflected as a liability on the balance sheet as of December 31, 2006 for the 2003/2004 monitoring period aggregated approximately $43 million. The settlement period related to the 2003/2004 monitoring period lapses on September 30, 2007.
Allowance for doubtful accounts. In evaluating the collectibility of our accounts receivable, we assess a number of factors, including a specific customer’s or carrier’s ability to meet its financial obligations to us, the length of time the receivable has been past due and historical collection experience. Based on these assessments, we record both specific and general reserves for uncollectible accounts receivable to reduce the related accounts receivable to the amount we ultimately expect to collect from customers and carriers. If circumstances change or economic conditions worsen such that our past collection experience is no longer relevant, we may need to increase our reserves from the levels reflected in our accompanying consolidated balance sheet.
Pension and postretirement benefits.The amounts recognized in our financial statements related to pension and postretirement benefits are determined on an actuarial basis, which utilizes many assumptions in the calculation of such amounts. A significant assumption used in determining our pension and postretirement expense is the expected long-term rate of return on plan assets. For 2006 and 2005, we utilized an expected long-term rate of return on plan assets of 8.25%, which we believe reflects the expected long-term rates of return in the financial markets.
Another assumption used in the determination of our pension and postretirement benefit plan obligations is the appropriate discount rate. Our discount rate at December 31, 2006 ranged from 5.75-5.80% compared to 5.5% at December 31, 2005, which we believe is the appropriate rate at which the pension and postretirement benefits could be effectively settled. Such rates were determined based on a discounted cash flow analysis of our expected cash outflows of our benefit plans. A 25 basis point decrease in the assumed discount rate would increase annual combined pension and postretirement expense approximately $3.0 million.
A-15
Table of Contents
Intangible and long-lived assets.We are subject to testing for impairment of long-lived assets under two accounting standards, Statement of Financial Accounting Standards No. 142, “Goodwill and Other Intangible Assets” (“SFAS 142”), and Statement of Financial Accounting Standards No. 144, “Accounting for the Impairment or Disposal of Long-Lived Assets” (“SFAS 144”).
SFAS 142 requires goodwill recorded in business combinations to be reviewed for impairment at least annually and requires write-downs only in periods in which the recorded amount of goodwill exceeds the fair value. Under SFAS 142, impairment of goodwill is tested by comparing the fair value of the reporting unit to its carrying value (including goodwill). Estimates of the fair value of the reporting unit are based on valuation models using techniques such as multiples of earnings (before interest, taxes and depreciation and amortization). If the fair value of the reporting unit is less than the carrying value, a second calculation is required in which the implied fair value of goodwill is compared to its carrying value. If the implied fair value of goodwill is less than its carrying value, goodwill must be written down to its implied fair value. We completed the required annual test of goodwill impairment (as of September 30, 2006) under SFAS 142 and determined our goodwill was not impaired as of such date.
Under SFAS 144, the carrying value of long-lived assets other than goodwill is reviewed for impairment whenever events or circumstances indicate that such carrying amount cannot be recoverable by assessing the recoverability of the carrying value through estimated undiscounted net cash flows expected to be generated by the assets. If the undiscounted net cash flows are less than the carrying value, an impairment loss would be measured as the excess of the carrying value of a long-lived asset over its fair value.
Income taxes.We estimate our current and deferred income taxes based on our assessment of the future tax consequences of transactions that have been reflected in our financial statements or applicable tax returns. Actual income taxes paid could vary from these estimates due to future changes in income tax law or the resolution of audits by federal and state taxing authorities. We maintain income tax contingency reserves for potential assessments from the various taxing authorities. These reserves are estimated based on our judgment of the probable outcome of the tax contingencies and are adjusted periodically based on changing facts and circumstances. Changes to the tax contingency reserves could materially affect operating results in the period of change.
For additional information on our critical accounting policies, see “Accounting Pronouncements” and “Regulation and Competition – Other Matters” below, and the footnotes to our consolidated financial statements included elsewhere herein.
A-16
Table of Contents
Inflation
Historically, we have mitigated the effects of increased costs by recovering over time certain costs applicable to our regulated telephone operations through the rate-making process. However, LECs operating over 65% of our total access lines are now governed by state alternative regulation plans, some of which restrict or delay our ability to recover increased costs. Additional future regulatory changes may further alter our ability to recover increased costs in our regulated operations. For the properties acquired from Verizon in 2002, which are regulated under price-cap regulation for interstate purposes, price changes are limited to the rate of inflation, minus a productivity offset. As operating expenses in our nonregulated lines of business increase as a result of inflation, we, to the extent permitted by competition, attempt to recover the costs by increasing prices for our services and equipment.
MARKET RISK
We are exposed to market risk from changes in interest rates on our long-term debt obligations. We have estimated our market risk using sensitivity analysis. Market risk is defined as the potential change in the fair value of a fixed-rate debt obligation due to a hypothetical adverse change in interest rates. Fair value of long-term debt obligations is determined based on a discounted cash flow analysis, using the rates and maturities of these obligations compared to terms and rates currently available in the long-term financing markets. The results of the sensitivity analysis used to estimate market risk are presented below, although the actual results may differ from these estimates.
At December 31, 2006, the fair value of our long-term debt was estimated to be $2.5 billion based on the overall weighted average rate of our long-term debt of 6.9% and an overall weighted maturity of 8 years compared to terms and rates available on such date in long-term financing markets. Market risk is estimated as the potential decrease in fair value of our long-term debt resulting from a hypothetical increase of 69 basis points in interest rates (ten percent of our overall weighted average borrowing rate). Such an increase in interest rates would result in approximately an $89.6 million decrease in the fair value of our long-term debt. As of December 31, 2006, after giving effect to interest rate swaps currently in place, approximately 80% of our long-term and short-term debt obligations were fixed rate.
We seek to maintain a favorable mix of fixed and variable rate debt in an effort to limit interest costs and cash flow volatility resulting from changes in rates. From time to time, we use derivative instruments to (i) lock-in or swap our exposure to changing or variable interest rates for fixed interest rates or (ii) to swap obligations to pay fixed interest rates for variable interest rates. We have established policies and procedures for risk assessment and the approval, reporting and monitoring of derivative instrument activities. We do not hold or issue derivative financial instruments for trading or speculative purposes. We periodically review our exposure to interest rate fluctuations and implement strategies to manage the exposure.
A-17
Table of Contents
At December 31, 2006, we had outstanding four fair value interest rate hedges associated with the full $500 million aggregate principal amount of our Series L senior notes, due 2012, that pay interest at a fixed rate of 7.875%. These hedges are “fixed to variable” interest rate swaps that effectively convert our fixed rate interest payment obligations under these notes into obligations to pay variable rates that range from the six-month London InterBank Offered Rate (“LIBOR”) plus 3.229% to the six-month LIBOR plus 3.67%, with settlement and rate reset dates occurring each six months through the expiration of the hedges in August 2012. During 2006, we realized an average interest rate under these hedges of 9.03%. Interest expense was increased by $5.8 million during 2006 as a result of these hedges. The aggregate fair market value of these hedges was $20.6 million at December 31, 2006 and is reflected both as a liability and as a decrease in our underlying long-term debt on the December 31, 2006 balance sheet. With respect to each of these hedges, market risk is estimated as the potential change in the fair value of the hedge resulting from a hypothetical 10% increase in the forward rates used to determine the fair value. A hypothetical 10% increase in the forward rates would result in a $13.3 million decrease in the fair value of these hedges at December 31, 2006, and would also increase our interest expense.
Certain shortcomings are inherent in the method of analysis presented in the computation of fair value of financial instruments. Actual values may differ from those presented if market conditions vary from assumptions used in the fair value calculations. The analysis above incorporates only those risk exposures that existed as of December 31, 2006.
LIQUIDITY AND CAPITAL RESOURCES
Excluding cash used for acquisitions, we rely on cash provided by operations to provide for our cash needs. Our operations have historically provided a stable source of cash flow which has helped us continue our long-term program of capital improvements.
Operating activities.Net cash provided by operating activities was $840.7 million, $964.7 million and $955.8 million in 2006, 2005 and 2004, respectively. Our accompanying consolidated statements of cash flows identify major differences between net income and net cash provided by operating activities for each of those years. As relief from the effects of Hurricane Katrina, certain of our affected subsidiaries were granted a deferral from making their remaining 2005 estimated federal income and excise tax payments until 2006. During 2006, we made payments of approximately $75 million to satisfy our remaining 2005 estimated payments. For additional information relating to our operations, see “Results of Operations” above.
Investing activities.Net cash used in investing activities was $193.7 million, $481.4 million and $413.3 million in 2006, 2005 and 2004, respectively. We received approximately $122.8 million cash from the redemption of our RTB stock upon dissolution of the RTB during 2006. See Note 15 for additional
A-18
Table of Contents
information. Cash used for acquisitions was $75.5 million in 2005 (due to the acquisition of fiber assets in 16 metropolitan markets from KMC). Capital expenditures during 2006, 2005 and 2004 were $314.1 million, $414.9 million and $385.3 million, respectively.
Financing activities.Net cash used in financing activities was $780.2 million in 2006, $491.7 million in 2005 and $578.5 million in 2004. Payments of debt were $82.0 million in 2006, $693.3 million in 2005 and $179.4 million in 2004. In accordance with previously announced stock repurchase programs, we repurchased 21.4 million shares (for $802.2 million), 16.4 million shares (for $551.8 million), and 13.4 million shares (for $401.0 million) in 2006, 2005 and 2004, respectively. The 2006 repurchases include 14.36 million shares repurchased (for an aggregate final price of approximately $528.4 million) under accelerated share repurchase agreements with investment banks (see Note 9 for additional information). We initially funded purchases under these agreements principally through borrowings under our $750 million credit facility and cash on hand and subsequently refinanced the credit facility borrowings through the issuance of short-term commercial paper. The 2005 repurchases include 12.9 million shares repurchased (for an aggregate final price of $437.5 million) under accelerated share repurchase agreements (see below and Note 9 to the accompanying financial statements for additional information).
In February 2005, we remarketed substantially all of our $500 million of outstanding Series J senior notes due 2007 at an interest rate of 4.628%. We received no proceeds in connection with the remarketing as all proceeds were held in trust to secure the obligation of our equity unit holders to purchase common stock from us on May 16, 2005. In connection with the remarketing, we purchased and retired approximately $400 million of the notes, resulting in approximately $100 million remaining outstanding. We incurred a pre-tax charge of approximately $6 million in the first quarter of 2005 related to purchasing and retiring the notes. We purchased such notes with proceeds from the February 2005 issuance of $350 million of 5% senior notes, Series M, due 2015 and cash on hand.
On May 16, 2005, upon settlement of 15.9 million of our outstanding equity units, we received proceeds of approximately $398.2 million and issued approximately 12.9 million common shares. In late May 2005, we entered into accelerated share repurchase agreements with investment banks whereby we repurchased and retired 12.9 million shares of common stock for an aggregate final price of $437.5 million, the proceeds of which came from the settlement of the equity units mentioned above and cash on hand.
Other.For 2007, we have budgeted $325 million for capital expenditures. In 2006, we concluded that our prior extensive capital investment in our wireline network permitted us to reduce network capital spending to maintenance levels. We expect this to be the case for the foreseeable future. Our 2007 capital expenditure budget also includes amounts for expanding our new service offerings and expanding our data networks.
A-19
Table of Contents
The following table contains certain information concerning our material contractual obligations as of December 31, 2006.
| Payments due by period | ||||||||||||||||||||
| Contractual | After | |||||||||||||||||||
| obligations | Total | 2007 | 2008-2009 | 2010-2011 | 2011 | |||||||||||||||
| (Dollars in thousands) | ||||||||||||||||||||
| Long-term debt, including current maturities and capital lease obligations (1) | $ | 2,567,864 | 155,012 | 296,100 | 691,268 | (2) | 1,425,484 | |||||||||||||
| Interest on long- term debt obligations | $ | 1,549,609 | 169,565 | 301,167 | 251,086 | 827,791 | ||||||||||||||
| MRCC purchase price obligation (3) | $ | 336,000 | 336,000 | — | — | — | ||||||||||||||
| (1) | For additional information on the terms of our outstanding debt instruments, see Note 5 to the consolidated financial statements included below. | |
| (2) | Includes $165 million aggregate principal amount of our convertible debentures, Series K, due 2032, which can be put to us at various dates beginning in 2010. | |
| (3) | This amount represents an estimated purchase price based on MRCC’s net indebtedness as of September 30, 2006 (see below for additional information). |
In December 2006, we entered into a stock purchase agreement with Madison River Communications Corp. (“MRCC”) and its owner, Madison River Telephone Company, LLC. Under this agreement, we agreed to purchase all of the capital stock of MRCC in exchange for $830 million less MRCC’s net indebtedness on the transaction’s closing date (which was approximately $494 million at September 30, 2006), subject to certain closing adjustments. We expect to initially fund this acquisition using borrowings under our existing credit facility and are currently reviewing our longer term options for repaying or refinancing these borrowings.
We continually evaluate the possibility of acquiring additional communications operations and expect to continue our long-term strategy of pursuing the acquisition of attractively-priced communications properties in exchange for cash, securities or both. At any given time, we may be engaged in discussions or negotiations regarding additional acquisitions. We generally do not announce our acquisitions or dispositions until we have entered into a preliminary or definitive agreement. We may require additional financing in connection with any such acquisitions, the consummation of which could have a material impact on our financial condition or operations. Approximately 4.1 million shares of our common stock and 200,000 shares of our preferred stock remain available for future issuance in connection with acquisitions under our acquisition shelf registration statement. We also have access to debt and equity capital markets.
A-20
Table of Contents
In December 2006, we secured a new five-year, $750 million revolving credit facility. The credit facility contains financial covenants that require us to meet a consolidated leverage ratio (as defined in the facility) not exceeding 4 to 1 and a minimum interest coverage ratio (as defined in the facility) of at least 1.5 to 1. The interest rate on revolving loans under the facility is based on our choice of several prevailing commercial lending rates plus an additional margin that varies depending on our credit ratings and aggregate borrowings under the facility. We must pay a quarterly commitment fee on the unutilized portion of the facility, the amount of which varies based on our credit ratings. Up to $150 million of the credit facility can be used for letters of credit, which reduces the amount available for other extensions of credit. Available borrowings under our credit facility are also effectively reduced by any outstanding borrowings under our commercial paper program. Our commercial paper program borrowings in turn are effectively limited to the total amount available under our credit facility. As of December 31, 2006, we had no amounts outstanding under our new credit facility but did have $23 million outstanding under our commercial paper program.
Moody’s Investors Service (“Moody’s”) rates our long-term debt Baa2 (with a stable outlook) and Standard & Poor’s (“S&P”) rates our long-term debt BBB (with a negative outlook). Our commercial paper program is rated P2 by Moody’s and A3 by S&P. Any downgrade in our credit ratings will increase our borrowing costs and commitment fees under our $750 million revolving credit facility. Downgrades could also restrict our access to the capital markets, accelerate the conversion rights of holders of our outstanding convertible securities, increase our borrowing costs under new or replacement debt financings, or otherwise adversely affect the terms of future borrowings by, among other things, increasing the scope of our debt covenants and decreasing our financial or operating flexibility.
The following table reflects our debt to total capitalization percentage and ratio of earnings to fixed charges and preferred stock dividends as of and for the years ended December 31:
| 2006 | 2005 | 2004 | ||||||||||
| Debt to total capitalization | 44.8 | % | 42.3 | 46.9 | ||||||||
| Ratio of earnings to fixed charges and preferred stock dividends* | 3.97 | 3.60 | 3.57 | |||||||||
| * | For purposes of the chart above, “earnings” consist of income before income taxes and fixed charges, and “fixed charges” include our interest expense, including amortized debt issuance costs, and our preferred stock dividend costs. |
A-21
Table of Contents
REGULATION AND COMPETITION
The communications industry continues to undergo various fundamental regulatory, legislative, competitive and technological changes. These changes may have a significant impact on the future financial performance of all communications companies.
Events affecting the communications industry.Wireless telephone services increasingly constitute a significant source of competition with LEC services, especially since wireless carriers have begun to compete effectively on the basis of price with more traditional telephone services. As a result, some customers have chosen to completely forego use of traditional wireline phone service and instead rely solely on wireless service for voice services. We anticipate this trend will continue, particularly if wireless service providers continue to expand their coverage areas, reduce their rates, improve the quality of their services, and offer enhanced new services.
In 1996, the United States Congress enacted the Telecommunications Act of 1996 (the “1996 Act”), which obligates LECs to permit competitors to interconnect their facilities to the LEC’s network and to take various other steps that are designed to promote competition. Under the 1996 Act’s rural telephone company exemption, approximately 50% of our telephone access lines are exempt from certain of these interconnection requirements unless and until the appropriate state regulatory commission overrides the exemption upon receipt from a competitor of a bona fide request meeting certain criteria.
Prior to and since the enactment of the 1996 Act, the FCC and a number of state legislative and regulatory bodies have also taken steps to foster local exchange competition. Coincident with this recent movement toward increased competition has been the reduction of regulatory oversight of LECs. These cumulative changes, coupled with various technological developments, have led to the continued growth of various companies providing services that compete with LECs’ services.
Federal USF programs have recently undergone substantial changes, and are expected to experience more changes in the coming years. As mandated by the 1996 Act, in May 2001 the FCC modified its existing universal service support mechanism for rural telephone companies by adopting an interim mechanism for a five-year period based on embedded, or historical, costs that provides relatively predictable levels of support to many LECs, including substantially all of our LECs. In May 2006, the FCC extended this interim mechanism until such time that new high-cost support rules are adopted for rural telephone companies. Wireless and other competitive service providers continue to seek eligible telecommunications carrier status in order to receive USF support, which, coupled with changes in usage of telecommunications services, have placed stress on the funding mechanism of the USF, which is subject to annual caps on disbursements. These developments have placed additional financial pressure on the
A-22
Table of Contents
amount of money that is necessary to provide support to all eligible service providers, including support payments we receive from the USF High Cost Loop support program. Increases in the nationwide average cost per loop factor used to allocate funds among all USF recipients caused our revenues from the USF High Cost Loop support program to decrease in 2005 and 2006 from the amounts received in the prior year. However, based on recent FCC filings, we anticipate our 2007 revenues from the USF High Cost Loop support program will approximate our 2006 levels.
During 2004, a joint board named by the FCC released a notice requesting comments on the FCC’s current rules for the provision of high-cost support for rural companies, including comments on whether eligibility requirements should be amended in a manner that would adversely affect larger rural LECs such as us. In addition, the FCC has taken various other steps in anticipation of restructuring universal service support mechanisms, which in the aggregate could substantially impact these support payments. In August 2005, the joint board sought comments on four separate proposals to modify the distribution of High Cost Loop support funds. In August 2006, the joint board sought comment on the viability of using competitive bidding to determine the amount of high-cost funding for all eligible carriers. We anticipate that the joint board will make reform suggestions to the FCC by mid-2007, at which time the FCC would be required to seek comments. Due to the pending nature of these proposals, we cannot estimate the impact that such proposals would have on our operations.
Recent technological developments have led to the development of new services that compete with traditional LEC services. Technological improvements have enabled cable television companies to provide traditional circuit-switched telephone service over their cable networks, and several national cable companies have aggressively pursued this opportunity. Recently several large electric utilities have announced plans to offer communications services that compete with LECs. Recent improvements in the quality of “Voice-over-Internet Protocol” (“VoIP”) service have led several cable, Internet, data and other communications companies, as well as start-up companies, to substantially increase their offerings of VoIP service to business and residential customers. VoIP providers frequently use existing broadband networks to deliver flat-rate, all distance calling plans that may offer features that cannot readily be provided by traditional LECs and may be priced below those currently charged for traditional local and long distance telephone services. Beginning in late 2003, the FCC initiated rulemaking proceedings to address the regulation of VoIP, and has adopted orders establishing some initial broad regulatory guidelines. There can be no assurance that future rulemaking will be on terms favorable to ILECs, or that VoIP providers will not successfully compete for our customers.
In 2003, the FCC opened a broad intercarrier compensation proceeding with the ultimate goal of creating a uniform mechanism to be used by the entire telecommunications industry for payments between carriers originating, terminating, carrying or delivering telecommunications traffic. The FCC has received intercarrier compensation proposals from several industry groups, and industry negotiations are continuing with the goal of developing a consensus plan that addresses the concerns of carriers from all industry
A-23
Table of Contents
segments. Until the FCC’s proceeding concludes and the changes, if any, to the existing rules are established, we cannot estimate the impact this proceeding will have on our results of operations.
Many cable, entertainment, technology or other communication companies that previously offered a limited range of services are now, like us, offering diversified bundles of services. As such, a growing number of companies are competing to serve the communications needs of the same customer base. Several of these companies started offering full service bundles before us, which could give them an advantage in building customer loyalty.
Recent events affecting us.During the last few years, all of the states in which we provide telephone services have taken legislative or regulatory steps to further introduce competition into the LEC business. The number of companies which have requested authorization to provide local exchange service in our service areas has increased in recent years, especially in the markets acquired from Verizon in 2002 and 2000, and it is anticipated that similar action may be taken by others in the future.
State alternative regulation plans recently adopted by certain of our LECs have also affected revenue growth recently. These alternative regulation plans now govern over 65% of our access lines.
Certain long distance carriers continue to request that certain of our LECs reduce their intrastate access tariffed rates. In addition, we have recently experienced reductions in intrastate traffic, partially due to the displacement of minutes by wireless, electronic mail and other optional calling services. In 2006 we incurred a reduction in our intrastate revenues of approximately $16.3 million compared to 2005 primarily due to these factors. The corresponding decrease in 2005 compared to 2004 was $13.4 million. We believe this trend of decreased intrastate minutes will continue in 2007, although the magnitude of such decrease is uncertain.
While we expect our operating revenues in 2007 to continue to experience downward pressure primarily due to continued access line losses and reduced network access revenues, we expect such declines to be partially offset by increased demand for our fiber transport, high-speed Internet and other nonregulated product offerings (including our new video and wireless initiatives).
For a more complete description of regulation and competition impacting our operations and various attendant risks, please see Items 1 and 1A of our Annual Report on Form 10-K for the year ended December 31, 2006.
Other matters.Our regulated telephone operations (except for the properties acquired from Verizon in 2002) are subject to the provisions of Statement of Financial Accounting Standards No. 71, “Accounting for the Effects of Certain Types of Regulation” (“SFAS 71”). Actions by regulators can provide reasonable assurance of the recognition of an asset, reduce or eliminate the value of an asset and impose a liability on a
A-24
Table of Contents
regulated enterprise. Such regulatory assets and liabilities are required to be recorded and, accordingly, reflected in the balance sheet of an entity subject to SFAS 71. We are monitoring the ongoing applicability of SFAS 71 to our regulated telephone operations due to the changing regulatory, competitive and legislative environments, and it is possible that changes in regulation, legislation or competition or in the demand for regulated services or products could result in our telephone operations no longer being subject to SFAS 71 in the near future.
Statement of Financial Accounting Standards No. 101, “Regulated Enterprises – Accounting for the Discontinuance of Application of FASB Statement No. 71” (“SFAS 101”), specifies the accounting required when an enterprise ceases to meet the criteria for application of SFAS 71. SFAS 101 requires the elimination of the effects of any actions of regulators that have been recognized as assets and liabilities in accordance with SFAS 71 but would not have been recognized as assets and liabilities by nonregulated enterprises. Depreciation rates of certain assets established by regulatory authorities for our telephone operations subject to SFAS 71 have historically included a component for removal costs in excess of the related estimated salvage value. Notwithstanding the adoption of SFAS 143, SFAS 71 requires us to continue to reflect this accumulated liability for removal costs in excess of salvage value even though there is no legal obligation to remove the assets. Therefore, we did not adopt the provisions of SFAS 143 for our telephone operations subject to SFAS 71. SFAS 101 further provides that the carrying amounts of property, plant and equipment are to be adjusted only to the extent the assets are impaired and that impairment shall be judged in the same manner as for nonregulated enterprises.
Our consolidated balance sheet as of December 31, 2006 included regulatory liabilities of approximately $186.4 million related to estimated removal costs embedded in accumulated depreciation (as described above). Net deferred income tax assets related to the regulatory assets and liabilities quantified above were $71.3 million.
When and if our regulated operations no longer qualify for the application of SFAS 71, we currently do not expect to record any impairment charge related to the carrying value of the property, plant and equipment of our regulated telephone operations. Additionally, upon the discontinuance of SFAS 71, we would be required to revise the lives of our property, plant and equipment to reflect the estimated useful lives of the assets. We currently do not expect such revisions in asset lives will have a material impact on our results of operations. Upon the discontinuance of SFAS 71, we also would be required to eliminate certain intercompany transactions with regulated affiliates that currently are not eliminated under the application of SFAS 71. For the year ended December 31, 2006, approximately $120 million of revenues (and related costs) would have been eliminated had we not been subject to the provisions of SFAS 71. Such elimination would have had no impact on total operating income. For regulatory purposes, the accounting and reporting of our telephone subsidiaries will not be affected by the discontinued application of SFAS 71.
A-25
Table of Contents
We have certain obligations based on federal, state and local laws relating to the protection of the environment. Costs of compliance through 2006 have not been material, and we currently do not believe that such costs will become material.
A-26
Table of Contents
FINANCIAL STATEMENTS AND SUPPLEMENTARY DATA
Report of Management
The Shareholders
CenturyTel, Inc.:
CenturyTel, Inc.:
Management has prepared and is responsible for the integrity and objectivity of our consolidated financial statements. The consolidated financial statements have been prepared in accordance with accounting principles generally accepted in the United States of America and necessarily include amounts determined using our best judgments and estimates.
Our consolidated financial statements have been audited by KPMG LLP, an independent registered public accounting firm, who have expressed their opinion with respect to the fairness of the consolidated financial statements. Their audit was conducted in accordance with standards of the Public Company Accounting Oversight Board (United States).
Management is responsible for establishing and maintaining adequate internal controls over financial reporting, a process designed to provide reasonable assurance regarding the reliability of financial reporting and the preparation of financial statements for external purposes in accordance with generally accepted accounting principles. Under the supervision and with the participation of management, including our principal executive officer and principal financial officer, we conducted an evaluation of the effectiveness of our internal control over financial reporting based on the framework inInternal Control – Integrated Frameworkissued by the Committee of Sponsoring Organizations of the Treadway Commission (“COSO”). Based on our evaluation under the framework of COSO,management concluded that our internal control over financial reporting was effective as of December 31, 2006. Management’s assessment of the effectiveness of our internal control over financial reporting as of December 31, 2006 has been audited by KPMG LLP, as stated in their report which is included herein.
Because of its inherent limitations, internal control over financial reporting may not prevent or detect misstatements. Also, projections of any evaluation of effectiveness to future periods are subject to the risk that controls may become inadequate because of changes in conditions, or that the degree of compliance with the policies or procedures may deteriorate.
The Audit Committee of the Board of Directors is composed of independent directors who are not officers or employees. The Committee meets periodically with the external auditors, internal auditors and management. The Committee considers the independence of the external auditors and the audit scope and discusses internal control, financial and reporting matters. Both the external and internal auditors have free access to the Committee.
/s/ R. Stewart Ewing, Jr. | ||
| Executive Vice President and Chief Financial Officer | ||
| March 1, 2007 |
A-27
Table of Contents
Report of Independent Registered Public Accounting Firm
The Board of Directors and Stockholders
CenturyTel, Inc.:
CenturyTel, Inc.:
We have audited the accompanying consolidated balance sheets of CenturyTel, Inc. and subsidiaries as of December 31, 2006 and 2005, and the related consolidated statements of income, comprehensive income, cash flows and stockholders’ equity for each of the years in the three-year period ended December 31, 2006. These consolidated financial statements are the responsibility of the Company’s management. Our responsibility is to express an opinion on these consolidated financial statements based on our audits.
We conducted our audits in accordance with the standards of the Public Company Accounting Oversight Board (United States). Those standards require that we plan and perform the audit to obtain reasonable assurance about whether the financial statements are free of material misstatement. An audit includes examining, on a test basis, evidence supporting the amounts and disclosures in the financial statements. An audit also includes assessing the accounting principles used and significant estimates made by management, as well as evaluating the overall financial statement presentation. We believe that our audits provide a reasonable basis for our opinion.
In our opinion, the consolidated financial statements referred to above present fairly, in all material respects, the financial position of CenturyTel, Inc. and subsidiaries as of December 31, 2006 and 2005, and the results of their operations and their cash flows for each of the years in the three-year period ended December 31, 2006, in conformity with U.S. generally accepted accounting principles.
As discussed in Note 1 to the consolidated financial statements, effective January 1, 2006, the Company changed its method of accounting for share-based payments. In addition, as discussed in Note 1 to the consolidated financial statements, the Company changed its method of accounting for pension and postretirement benefits as of December 31, 2006.
We also have audited, in accordance with the standards of the Public Company Accounting Oversight Board (United States), the effectiveness of the Company’s internal control over financial reporting as of December 31, 2006, based on criteria established inInternal Control—Integrated Frameworkissued by the Committee of Sponsoring Organizations of the Treadway Commission (COSO), and our report dated March 1, 2007 expressed an unqualified opinion on management’s assessment of, and the effective operation of, internal control over financial reporting.
/s/ KPMG LLP
Shreveport, Louisiana
March 1, 2007
Shreveport, Louisiana
March 1, 2007
A-28
Table of Contents
Report of Independent Registered Public Accounting Firm
The Board of Directors and Stockholders
CenturyTel, Inc.:
CenturyTel, Inc.:
We have audited management’s assessment, included in the accompanyingReport of Management, that CenturyTel, Inc. maintained effective internal control over financial reporting as of December 31, 2006, based on criteria established inInternal Control—Integrated Frameworkissued by the Committee of Sponsoring Organizations of the Treadway Commission (COSO).The Company’s management is responsible for maintaining effective internal control over financial reporting and for its assessment of the effectiveness of internal control over financial reporting. Our responsibility is to express an opinion on management’s assessment and an opinion on the effectiveness of the Company’s internal control over financial reporting based on our audit.
We conducted our audit in accordance with the standards of the Public Company Accounting Oversight Board (United States). Those standards require that we plan and perform the audit to obtain reasonable assurance about whether effective internal control over financial reporting was maintained in all material respects. Our audit included obtaining an understanding of internal control over financial reporting, evaluating management’s assessment, testing and evaluating the design and operating effectiveness of internal control, and performing such other procedures as we considered necessary in the circumstances. We believe that our audit provides a reasonable basis for our opinion.
A company’s internal control over financial reporting is a process designed to provide reasonable assurance regarding the reliability of financial reporting and the preparation of financial statements for external purposes in accordance with generally accepted accounting principles. A company’s internal control over financial reporting includes those policies and procedures that (1) pertain to the maintenance of records that, in reasonable detail, accurately and fairly reflect the transactions and dispositions of the assets of the company; (2) provide reasonable assurance that transactions are recorded as necessary to permit preparation of financial statements in accordance with generally accepted accounting principles, and that receipts and expenditures of the company are being made only in accordance with authorizations of management and directors of the company; and (3) provide reasonable assurance regarding prevention or timely detection of unauthorized acquisition, use, or disposition of the company’s assets that could have a material effect on the financial statements.
Because of its inherent limitations, internal control over financial reporting may not prevent or detect misstatements. Also, projections of any evaluation of effectiveness to future periods are subject to the risk that controls may become inadequate because of changes in conditions, or that the degree of compliance with the policies or procedures may deteriorate.
A-29
Table of Contents
In our opinion, management’s assessment that CenturyTel, Inc. maintained effective internal control over financial reporting as of December 31, 2006, is fairly stated, in all material respects, based on criteria established inInternal Control—Integrated Frameworkissued by the Committee of Sponsoring Organizations of the Treadway Commission (COSO).Also, in our opinion, CenturyTel, Inc. maintained, in all material respects, effective internal control over financial reporting as of December 31, 2006, based on criteria established inInternal Control—Integrated Frameworkissued by the Committee of Sponsoring Organizations of the Treadway Commission (COSO).
We also have audited, in accordance with the standards of the Public Company Accounting Oversight Board (United States), the consolidated balance sheets of CenturyTel, Inc. and subsidiaries as of December 31, 2006 and 2005, and the related consolidated statements of income, comprehensive income, cash flows and stockholders’ equity for each of the years in the three-year period ended December 31, 2006, and our report dated March 1, 2007 expressed an unqualified opinion on those consolidated financial statements. Such report includes an explanatory paragraph regarding the Company’s change in the method of accounting for share-based payments and pension and postretirement benefits in 2006.
/s/ KPMG LLP
Shreveport, Louisiana
March 1, 2007
March 1, 2007
A-30
Table of Contents
CENTURYTEL, INC.
Consolidated Statements of Income
| Year ended December 31, | ||||||||||||
| 2006 | 2005 | 2004 | ||||||||||
| (Dollars, except per share amounts, | ||||||||||||
| and shares in thousands) | ||||||||||||
| OPERATING REVENUES | $ | 2,447,730 | 2,479,252 | 2,407,372 | ||||||||
| OPERATING EXPENSES | ||||||||||||
| Cost of services and products (exclusive of depreciation and amortization) | 888,414 | 821,929 | 755,413 | |||||||||
| Selling, general and administrative | 370,272 | 388,989 | 397,102 | |||||||||
| Depreciation and amortization | 523,506 | 531,931 | 500,904 | |||||||||
| Total operating expenses | 1,782,192 | 1,742,849 | 1,653,419 | |||||||||
| OPERATING INCOME | 665,538 | 736,403 | 753,953 | |||||||||
| OTHER INCOME (EXPENSE) | ||||||||||||
| Interest expense | (195,957 | ) | (201,801 | ) | (211,051 | ) | ||||||
| Other income (expense) | 121,568 | 3,168 | 4,470 | |||||||||
| Total other income (expense) | (74,389 | ) | (198,633 | ) | (206,581 | ) | ||||||
| INCOME BEFORE INCOME TAX EXPENSE | 591,149 | 537,770 | 547,372 | |||||||||
| Income tax expense | 221,122 | 203,291 | 210,128 | |||||||||
| NET INCOME | $ | 370,027 | 334,479 | 337,244 | ||||||||
| BASIC EARNINGS PER SHARE | $ | 3.17 | 2.55 | 2.45 | ||||||||
| DILUTED EARNINGS PER SHARE | $ | 3.07 | 2.49 | 2.41 | ||||||||
| DIVIDENDS PER COMMON SHARE | $ | .25 | .24 | .23 | ||||||||
| AVERAGE BASIC SHARES OUTSTANDING | 116,671 | 130,841 | 137,215 | |||||||||
| AVERAGE DILUTED SHARES OUTSTANDING | 122,229 | 136,087 | 142,144 | |||||||||
See accompanying notes to consolidated financial statements.
A-31
Table of Contents
CENTURYTEL, INC.
Consolidated Statements of Comprehensive Income
| Year ended December 31, | ||||||||||||
| 2006 | 2005 | 2004 | ||||||||||
| (Dollars in thousands) | ||||||||||||
| NET INCOME | $ | 370,027 | 334,479 | 337,244 | ||||||||
| OTHER COMPREHENSIVE INCOME, NET OF TAXES | ||||||||||||
| Minimum pension liability adjustment: | ||||||||||||
| Minimum pension liability adjustment, net of $965, $1,438 and ($5,916) tax | 1,548 | 2,307 | (9,491 | ) | ||||||||
| Unrealized holding gain: | ||||||||||||
| Unrealized holding gains related to marketable securities arising during the period, net of $411, $165 and $940 tax | 659 | 264 | 1,508 | |||||||||
| Derivative instruments: | ||||||||||||
| Net losses on derivatives hedging variability of cash flows, net of ($0), ($2,606) and ($219) tax | — | (4,180 | ) | (351 | ) | |||||||
| Reclassification adjustment for losses included in net income, net of $234 and $202 tax | 375 | 324 | — | |||||||||
| Net change in other comprehensive income (loss) (net of reclassification adjustment), net of taxes | 2,582 | (1,285 | ) | (8,334 | ) | |||||||
| COMPREHENSIVE INCOME | $ | 372,609 | 333,194 | 328,910 | ||||||||
See accompanying notes to consolidated financial statements.
A-32
Table of Contents
CENTURYTEL, INC.
Consolidated Balance Sheets
| December 31, | ||||||||
| 2006 | 2005 | |||||||
| (Dollars in thousands) | ||||||||
| ASSETS | ||||||||
| CURRENT ASSETS | ||||||||
| Cash and cash equivalents | $ | 25,668 | 158,846 | |||||
| Accounts receivable | ||||||||
| Customers, less allowance of $11,321 and $11,312 | 150,892 | 154,367 | ||||||
| Interexchange carriers and other, less allowance of $9,584 and $10,409 | 76,454 | 82,347 | ||||||
| Materials and supplies, at average cost | 6,628 | 6,998 | ||||||
| Other | 30,475 | 20,458 | ||||||
| Total current assets | 290,117 | 423,016 | ||||||
| NET PROPERTY, PLANT AND EQUIPMENT | 3,109,277 | 3,304,486 | ||||||
| GOODWILL AND OTHER ASSETS | ||||||||
| Goodwill | 3,431,136 | 3,432,649 | ||||||
| Other | 610,477 | 602,556 | ||||||
| Total goodwill and other assets | 4,041,613 | 4,035,205 | ||||||
| TOTAL ASSETS | $ | 7,441,007 | 7,762,707 | |||||
| LIABILITIES AND EQUITY | ||||||||
| CURRENT LIABILITIES | ||||||||
| Current maturities of long-term debt | $ | 155,012 | 276,736 | |||||
| Short-term debt | 23,000 | — | ||||||
| Accounts payable | 129,350 | 104,444 | ||||||
| Accrued expenses and other current liabilities | ||||||||
| Salaries and benefits | 54,100 | 60,521 | ||||||
| Income taxes | 60,522 | 110,521 | ||||||
| Other taxes | 46,890 | 58,660 | ||||||
| Interest | 73,725 | 71,580 | ||||||
| Other | 23,352 | 14,851 | ||||||
| Advance billings and customer deposits | 51,614 | 48,917 | ||||||
| Total current liabilities | 617,565 | 746,230 | ||||||
| LONG-TERM DEBT | 2,412,852 | 2,376,070 | ||||||
| DEFERRED CREDITS AND OTHER LIABILITIES | 1,219,639 | 1,023,134 | ||||||
| STOCKHOLDERS’ EQUITY | ||||||||
| Common stock, $1.00 par value, authorized 350,000,000 shares, issued and outstanding 113,253,889 and 131,074,399 shares | 113,254 | 131,074 | ||||||
| Paid-in capital | 24,256 | 129,806 | ||||||
| Accumulated other comprehensive loss, net of tax | (104,942 | ) | (9,619 | ) | ||||
| Retained earnings | 3,150,933 | 3,358,162 | ||||||
| Preferred stock — non-redeemable | 7,450 | 7,850 | ||||||
| Total stockholders’ equity | 3,190,951 | 3,617,273 | ||||||
| TOTAL LIABILITIES AND EQUITY | $ | 7,441,007 | 7,762,707 | |||||
See accompanying notes to consolidated financial statements.
A-33
Table of Contents
CENTURYTEL, INC.
Consolidated Statements of Cash Flows
| Year ended December 31, | ||||||||||||
| 2006 | 2005 | 2004 | ||||||||||
| (Dollars in thousands) | ||||||||||||
| OPERATING ACTIVITIES | ||||||||||||
| Net income | $ | 370,027 | 334,479 | 337,244 | ||||||||
| Adjustments to reconcile net income to net cash provided by operating activities | ||||||||||||
| Depreciation and amortization | 523,506 | 531,931 | 500,904 | |||||||||
| Gain on asset dispositions | (118,649 | ) | (3,500 | ) | — | |||||||
| Deferred income taxes | 49,685 | 69,530 | 74,374 | |||||||||
| Income from unconsolidated cellular entity | (5,861 | ) | (4,910 | ) | (7,067 | ) | ||||||
| Changes in current assets and current liabilities | ||||||||||||
| Accounts receivable | 7,909 | (685 | ) | 2,937 | ||||||||
| Accounts payable | 24,906 | (37,174 | ) | 15,514 | ||||||||
| Accrued taxes | (49,735 | ) | 72,971 | 27,040 | ||||||||
| Other current assets and other current liabilities, net | 10,269 | (8,111 | ) | 12,831 | ||||||||
| Retirement benefits | 5,963 | (16,815 | ) | 26,954 | ||||||||
| Excess tax benefits from share-based compensation | (12,034 | ) | — | — | ||||||||
| (Increase) decrease in noncurrent assets | 9,078 | 1,973 | (34,740 | ) | ||||||||
| Increase (decrease) in other noncurrent liabilities | 709 | 2,638 | (6,220 | ) | ||||||||
| Other, net | 24,946 | 22,412 | 6,060 | |||||||||
| Net cash provided by operating activities | 840,719 | 964,739 | 955,831 | |||||||||
| INVESTING ACTIVITIES | ||||||||||||
| Payments for property, plant and equipment | (314,071 | ) | (414,872 | ) | (385,316 | ) | ||||||
| Proceeds from redemption of Rural Telephone Bank stock | 122,819 | — | — | |||||||||
| Proceeds from sale of assets | 5,865 | 4,000 | — | |||||||||
| Acquisitions, net of cash acquired | — | (75,453 | ) | (2,000 | ) | |||||||
| Investment in debt security | — | — | (25,000 | ) | ||||||||
| Distributions from unconsolidated cellular entity | — | 2,339 | 8,219 | |||||||||
| Investment in unconsolidated cellular entity | (5,222 | ) | — | — | ||||||||
| Other, net | (3,122 | ) | 2,594 | (9,214 | ) | |||||||
| Net cash used in investing activities | (193,731 | ) | (481,392 | ) | (413,311 | ) | ||||||
| FINANCING ACTIVITIES | ||||||||||||
| Payments of debt | (81,995 | ) | (693,345 | ) | (179,393 | ) | ||||||
| Proceeds from issuance of debt | 23,000 | 344,173 | — | |||||||||
| Repurchase of common stock | (802,188 | ) | (551,759 | ) | (401,013 | ) | ||||||
| Settlement of equity units | — | 398,164 | — | |||||||||
| Proceeds from issuance of common stock | 97,803 | 50,374 | 29,485 | |||||||||
| Settlements of interest rate hedge contracts | — | (7,357 | ) | — | ||||||||
| Excess tax benefits from share-based compensation | 12,034 | — | — | |||||||||
| Cash dividends | (29,203 | ) | (31,862 | ) | (31,861 | ) | ||||||
| Other, net | 383 | (104 | ) | 4,296 | ||||||||
| Net cash used in financing activities | (780,166 | ) | (491,716 | ) | (578,486 | ) | ||||||
| Net increase (decrease) in cash and cash equivalents | (133,178 | ) | (8,369 | ) | (35,966 | ) | ||||||
| Cash and cash equivalents at beginning of year | 158,846 | 167,215 | 203,181 | |||||||||
| CASH AND CASH EQUIVALENTS AT END OF YEAR | $ | 25,668 | 158,846 | 167,215 | ||||||||
See accompanying notes to consolidated financial statements.
A-34
Table of Contents
CENTURYTEL, INC.
Consolidated Statements of Stockholders’ Equity
| Year ended December 31, | ||||||||||||
| 2006 | 2005 | 2004 | ||||||||||
| (Dollars, except per share amounts, | ||||||||||||
| and shares in thousands) | ||||||||||||
| COMMON STOCK (represents dollars and shares) | ||||||||||||
| Balance at beginning of year | $ | 131,074 | 132,374 | 144,364 | ||||||||
| Repurchase of common stock | (21,432 | ) | (16,409 | ) | (13,396 | ) | ||||||
| Issuance of common stock upon settlement of equity units | — | 12,881 | — | |||||||||
| Conversion of preferred stock into common stock | 22 | 7 | — | |||||||||
| Issuance of common stock through dividend reinvestment, incentive and benefit plans | 3,590 | 2,221 | 1,406 | |||||||||
| Balance at end of year | 113,254 | 131,074 | 132,374 | |||||||||
| PAID-IN CAPITAL | ||||||||||||
| Balance at beginning of year | 129,806 | 222,205 | 576,515 | |||||||||
| Repurchase of common stock | (222,998 | ) | (535,350 | ) | (387,617 | ) | ||||||
| Issuance of common stock upon settlement of equity units | — | 385,283 | — | |||||||||
| Issuance of common stock through dividend reinvestment, incentive and benefit plans | 94,213 | 48,153 | 28,079 | |||||||||
| Conversion of preferred stock into common stock | 378 | 118 | — | |||||||||
| Excess tax benefits from share-based compensation | 12,034 | — | — | |||||||||
| Share based compensation and other | 10,823 | 9,397 | 5,228 | |||||||||
| Balance at end of year | 24,256 | 129,806 | 222,205 | |||||||||
| ACCUMULATED OTHER COMPREHENSIVE LOSS, NET OF TAX | ||||||||||||
| Balance at beginning of year | (9,619 | ) | (8,334 | ) | — | |||||||
| Effect of adoption of SFAS 158, net of tax (see Note 1) | (97,905 | ) | — | — | ||||||||
| Net change in other comprehensive income (loss) (net of reclassification adjustment), net of tax | 2,582 | (1,285 | ) | (8,334 | ) | |||||||
| Balance at end of year | (104,942 | ) | (9,619 | ) | (8,334 | ) | ||||||
| RETAINED EARNINGS | ||||||||||||
| Balance at beginning of year | 3,358,162 | 3,055,545 | 2,750,162 | |||||||||
| Net income | 370,027 | 334,479 | 337,244 | |||||||||
| Repurchase of common stock | (557,758 | ) | — | — | ||||||||
| Cumulative effect of adoption of SAB 108 (see Note 1) | 9,705 | — | — | |||||||||
| Cash dividends declared | ||||||||||||
| Common stock — $.25, $.24 and $.23 per share | (28,823 | ) | (31,466 | ) | (31,462 | ) | ||||||
| Preferred stock | (380 | ) | (396 | ) | (399 | ) | ||||||
| Balance at end of year | 3,150,933 | 3,358,162 | 3,055,545 | |||||||||
| UNEARNED ESOP SHARES | ||||||||||||
| Balance at beginning of year | — | — | (500 | ) | ||||||||
| Release of ESOP shares | — | — | 500 | |||||||||
| Balance at end of year | — | — | — | |||||||||
| PREFERRED STOCK — NON-REDEEMABLE | ||||||||||||
| Balance at beginning of year | 7,850 | 7,975 | 7,975 | |||||||||
| Conversion of preferred stock into common stock | (400 | ) | (125 | ) | — | |||||||
| Balance at end of year | 7,450 | 7,850 | 7,975 | |||||||||
| TOTAL STOCKHOLDERS’ EQUITY | $ | 3,190,951 | 3,617,273 | 3,409,765 | ||||||||
See accompanying notes to consolidated financial statements.
A-35
Table of Contents
CENTURYTEL, INC.
Notes to Consolidated Financial Statements
December 31, 2006
December 31, 2006
(1) SUMMARY OF SIGNIFICANT ACCOUNTING POLICIES
Principles of consolidation– Our consolidated financial statements include the accounts of CenturyTel, Inc. and its majority-owned subsidiaries.
Regulatory accounting– Our regulated telephone operations (except for the properties acquired from Verizon in 2002) are subject to the provisions of Statement of Financial Accounting Standards No. 71, “Accounting for the Effects of Certain Types of Regulation” (“SFAS 71”). Actions by regulators can provide reasonable assurance of the recognition of an asset, reduce or eliminate the value of an asset and impose a liability on a regulated enterprise. Such regulatory assets and liabilities are required to be recorded and, accordingly, reflected in the balance sheet of an entity subject to SFAS 71. We are monitoring the ongoing applicability of SFAS 71 to our regulated telephone operations due to the changing regulatory, competitive and legislative environments, and it is possible that changes in regulation, legislation or competition or in the demand for regulated services or products could result in our telephone operations no longer being subject to SFAS 71 in the near future. Our consolidated balance sheet as of December 31, 2006 included regulatory liabilities of approximately $186.4 million related to estimated removal costs embedded in accumulated depreciation (as required to be recorded by regulators). Net deferred income tax assets related to the regulatory assets and liabilities quantified above were $71.3 million.
Estimates– The preparation of financial statements in conformity with generally accepted accounting principles requires management to make estimates and assumptions that affect the reported amounts of assets and liabilities and disclosure of contingent assets and liabilities at the date of the financial statements and the reported amounts of revenues and expenses during the reporting period. Actual results may differ from those estimates.
Revenue recognition– Revenues are generally recognized when services are provided or when products are delivered to customers. Revenue that is billed in advance includes monthly recurring network access services, special access services and monthly recurring local line charges. The unearned portion of this revenue is initially deferred as a component of advanced billings and customer deposits on our balance sheet and recognized as revenue over the period that the services are provided. Revenue that is billed in arrears includes nonrecurring network access services, nonrecurring local services and long distance services. The earned but unbilled portion of this revenue is recognized as revenue in the period that the services are provided. Revenues from installation activities (along with the related costs) are deferred and amortized over the estimated life of the customer relationship.
A-36
Table of Contents
Certain of our telephone subsidiaries’ revenues are based on tariffed access charges filed directly with the Federal Communications Commission; the remainder of our telephone subsidiaries participate in revenue sharing arrangements with other telephone companies for interstate revenue (except for broadband related revenues) and for certain intrastate revenue. Such sharing arrangements are funded by toll revenue and/or access charges within state jurisdictions and by access charges in the interstate market. Revenues earned through the various sharing arrangements are initially recorded based on our estimates.
Allowance for doubtful accounts. In evaluating the collectibility of our accounts receivable, we assess a number of factors, including a specific customer’s or carrier’s ability to meet its financial obligations to us, the length of time the receivable has been past due and historical collection experience. Based on these assessments, we record both specific and general reserves for uncollectible accounts receivable to reduce the stated amount of applicable accounts receivable to the amount we ultimately expect to collect.
Property, plant and equipment– Telephone plant is stated at original cost. Normal retirements of telephone plant are charged against accumulated depreciation, along with the costs of removal, less salvage, with no gain or loss recognized. Renewals and betterments of plant and equipment are capitalized while repairs, as well as renewals of minor items, are charged to operating expense. Depreciation of telephone plant is provided on the straight line method using class or overall group rates acceptable to regulatory authorities; such average rates range from 2% to 20%.
Non-telephone property is stated at cost and, when sold or retired, a gain or loss is recognized. Depreciation of such property is provided on the straight line method over estimated service lives ranging from two to 35 years.
Intangible assets– Statement of Financial Accounting Standards No. 142, “Goodwill and Other Intangible Assets” (“SFAS 142”), requires goodwill recorded in a business combination to be reviewed for impairment and to be written down only in periods in which the recorded amount of goodwill exceeds its fair value. We test impairment of goodwill at least annually by comparing the fair value of the reporting unit to its carrying value (including goodwill). We base our estimates of the fair value of the reporting unit on valuation models using criterion such as multiples of earnings.
Long-lived assets– Statement of Financial Accounting Standards No. 144, “Accounting for the Impairment or Disposal of Long-Lived Assets” (“SFAS 144”), addresses financial accounting and reporting for the impairment or disposal of long-lived assets (exclusive of goodwill) and also broadens the reporting of discontinued operations to include all components of an entity with operations that can be distinguished from the rest of the entity and that will be eliminated from the ongoing operations of the entity in a disposal transaction.
A-37
Table of Contents
Affiliated transactions– Certain of our service subsidiaries provide installation and maintenance services, materials and supplies, and managerial, operational, technical, accounting and administrative services to other subsidiaries. In addition, CenturyTel provides and bills management services to subsidiaries and in certain instances makes interest bearing advances to finance construction of plant and purchases of equipment. These transactions are recorded by our telephone subsidiaries at their cost to the extent permitted by regulatory authorities. Intercompany profit on transactions with regulated affiliates is limited to a reasonable return on investment and has not been eliminated in connection with consolidating the results of operations of CenturyTel and its subsidiaries. Intercompany profit on transactions with affiliates not subject to SFAS 71 has been eliminated.
Income taxes– We file a consolidated federal income tax return with our eligible subsidiaries. We use the asset and liability method of accounting for income taxes under which deferred tax assets and liabilities are established for the future tax consequences attributable to differences between the financial statement carrying amounts of assets and liabilities and their respective tax bases.
Postretirement and pension plans– We adopted the provisions of Statement of Financial Accounting Standards No. 158, “Employers’ Accounting for Defined Benefit Plans and Other Postretirement Plans” (“SFAS 158”) as of December 31, 2006. SFAS 158 requires us to recognize the overfunded or underfunded status of our defined benefit and postretirement plans as an asset or a liability on our balance sheet, with an adjustment to stockholders’ equity (reflected as an increase or decrease in accumulated other comprehensive income or loss). The incremental effect of applying SFAS 158 on individual line items of our balance sheet as of December 31, 2006 were as follows:
| Before | After | |||||||||||||
| Application of | Application of | |||||||||||||
| SFAS 158 | Adjustments | SFAS 158 | ||||||||||||
| (Dollars in thousands) | ||||||||||||||
| Other assets | $ | 675,215 | (64,738 | ) | 610,477 | |||||||||
| Total assets | $ | 7,505,745 | (64,738 | ) | 7,441,007 | |||||||||
| Accrued expenses and other current liabilities | $ | 259,487 | (898 | ) | 258,589 | |||||||||
| Deferred credits and other liabilities (excluding deferred income taxes) | $ | 447,066 | 99,512 | 546,578 | ||||||||||
| Deferred income taxes | $ | 738,508 | (65,447 | ) | 673,061 | |||||||||
| Total liabilities | $ | 4,216,889 | 33,167 | 4,250,056 | ||||||||||
| Accumulated other comprehensive loss, net of tax | $ | (7,037 | ) | (97,905 | ) | (104,942 | ) | |||||||
| Total stockholders’ equity | $ | 3,288,856 | (97,905 | ) | 3,190,951 | |||||||||
Cumulative effect adjustment– In September 2006, the Securities and Exchange Commission issued Staff Accounting Bulletin No. 108, “Considering the Effect of Prior Year Misstatements when Quantifying Misstatements in Current Year Financial Results” (“SAB 108”). SAB 108 addresses how the effects of
A-38
Table of Contents
prior year uncorrected misstatements should be considered when quantifying misstatements in current year financial statements. SAB 108 requires companies to quantify misstatements using both a balance sheet approach and income statement approach and to evaluate whether either approach results in quantifying an error that is material in light of the relevant quantitative and qualitative factors.
We identified two misstatements that previously were deemed immaterial using the income statement approach that are now deemed material upon application of the balance sheet approach. Such misstatements relate to (i) the failure to capitalize interest in connection with the development of our billing system, which began in the late 1990’s; and (ii) the failure to defer the revenues and costs associated with installation activities related to our service offerings. Using the guidance of SAB 108, we have recorded a net cumulative effect adjustment to retained earnings (as of January 1, 2006), which increased retained earnings approximately $9.7 million (presented on an after-tax basis). Of the $9.7 million net increase to retained earnings, approximately $14.0 million related to the capitalized interest adjustment, which was partially offset by a reduction to retained earnings of approximately $4.3 million related to the installation activities adjustment. We have adjusted our results of operations for the first, second and third quarters of 2006 to reflect the ongoing application of the above. Such adjustments were immaterial to each quarter.
Stock-based compensation– Effective January 1, 2006, we adopted the provisions of Statement of Financial Accounting Standards No. 123 (Revised 2004), “Share-Based Payment,” which requires us to measure our cost of awarding employees with equity instruments based upon the fair value of the award on the grant date. Prior to January 1, 2006, we accounted for our stock compensation plans using the intrinsic value method in accordance with Accounting Principles Board Opinion No. 25. See Note 14 for additional information.
Derivative financial instruments– We account for derivative instruments and hedging activities in accordance with Statement of Financial Accounting Standards No. 133, “Accounting for Derivative Instruments and Hedging Activities” (“SFAS 133”), as amended. SFAS 133, as amended, requires that all derivative instruments, such as interest rate swaps, be recognized in the financial statements and measured at fair value regardless of the purpose or intent of holding them. On the date a derivative contract is entered into, we designate the derivative as either a fair value or cash flow hedge. A hedge of the fair value of a recognized asset or liability or of an unrecognized firm commitment is a fair value hedge. A hedge of a forecasted transaction or the variability of cash flows to be received or paid related to a recognized asset or liability is a cash flow hedge. We also formally assess, both at the hedge’s inception and on an ongoing basis, whether the derivatives that are used in hedging transactions are highly effective in offsetting changes in fair values or cash flows of hedged items. If we determine that a derivative is not, or is no longer, highly effective as a hedge, we would discontinue hedge accounting prospectively. We recognize all derivatives on the balance sheet at their fair value. Changes in the fair value of derivative financial instruments are either recognized in income or stockholders’ equity (as a component of accumulated other comprehensive income (loss)), depending on whether the derivative is being used to hedge changes in the
A-39
Table of Contents
fair value or cash flows. We do not hold or issue derivative financial instruments for trading or speculative purposes. Management periodically reviews our exposure to interest rate fluctuations and implements strategies to manage the exposure.
Earnings per share– Basic earnings per share amounts are determined on the basis of the weighted average number of common shares outstanding during the applicable accounting period. Diluted earnings per share gives effect to all potential dilutive common shares that were outstanding during the period. See Note 13 for additional information.
Cash equivalents– We consider short-term investments with a maturity at date of purchase of three months or less to be cash equivalents.
(2) ACQUISITION
On June 30, 2005, we acquired fiber assets in 16 metropolitan markets from KMC Telecom Holdings, Inc. (“KMC”) for approximately $75.5 million. The assets acquired and liabilities assumed have been reflected in our consolidated balance sheet based on a purchase price allocation determined by independent third parties. The vast majority of the purchase price was allocated to property, plant and equipment. See Note 3 for information concerning amounts allocated to certain intangible assets as a result of the KMC acquisition. The results of operations of the KMC properties are included in our results of operations from and after the acquisition date.
(3) GOODWILL AND OTHER ASSETS
Goodwill and other assets at December 31, 2006 and 2005 were composed of the following:
| December 31, | 2006 | 2005 | ||||||
| (Dollars in thousands) | ||||||||
| Goodwill | $ | 3,431,136 | 3,432,649 | |||||
| Billing system development costs, less accumulated amortization of $26,752 and $14,899 | 204,597 | 193,579 | ||||||
| Cash surrender value of life insurance contracts | 94,788 | 94,801 | ||||||
| Deferred costs associated with installation activities | 73,256 | — | ||||||
| Pension asset | 16,187 | 73,360 | ||||||
| Intangible assets not subject to amortization | 36,690 | 36,690 | ||||||
| Marketable securities | 32,235 | 29,195 | ||||||
| Deferred interest rate hedge contracts | 23,134 | 25,624 | ||||||
| Investment in debt security | 22,209 | 21,611 | ||||||
| Intangible assets subject to amortization | ||||||||
| Customer base, less accumulated amortization of $7,022 and $5,349 | 18,072 | 19,745 | ||||||
| Contract rights, less accumulated amortization of $3,256 and $1,861 | 930 | 2,326 | ||||||
| Other | 88,379 | 105,625 | ||||||
| $ | 4,041,613 | 4,035,205 | ||||||
A-40
Table of Contents
Our goodwill was derived from numerous previous acquisitions whereby the purchase price exceeded the fair value of the net assets acquired. We test for goodwill impairment annually under SFAS 142 and, based on our analysis performed as of September 30, 2006, determined our goodwill was not impaired.
We accounted for the costs to develop an integrated billing and customer care system in accordance with Statement of Position 98-1, “Accounting for the Costs of Computer Software Developed or Obtained for Internal Use.” Aggregate capitalized costs (before accumulated amortization) totaled $231.3 million and are being amortized over a twenty-year period. We adjusted the aggregate capitalized costs as of January 1, 2006 to include previously unrecognized capitalized interest. See Note 1 – Cumulative effect adjustment for additional information.
In connection with the application of SAB 108 (see Note 1), we established deferred revenues and costs associated with installation activities effective as of January 1, 2006.
In the third quarter of 2004, we entered into a three-year agreement with EchoStar Communications Corporation (“EchoStar”) to provide co-branded satellite television services to our customers. As part of the transaction, we invested $25 million in an EchoStar convertible subordinated debt security, which had a fair value at date of issuance of approximately $20.8 million and matures in 2011. The remaining $4.2 million paid was established as an intangible asset attributable to our contractual right to provide video service and is being amortized over a three-year period.
In connection with the acquisitions of properties from Verizon Communications, Inc. (“Verizon”) in 2002, we assigned $35.3 million of the purchase price as an intangible asset associated with franchise costs (which includes amounts necessary to maintain eligibility to provide telecommunications services in its licensed service areas). In 2005, we assigned $1.4 million of the purchase price of our acquisition of KMC fiber assets as an intangible asset. Such assets have an indefinite life and therefore are not subject to amortization currently.
We assigned $22.7 million of the purchase price to a customer base intangible asset in connection with the acquisitions of Verizon properties in 2002. In 2005, $2.4 million of the purchase price of our acquisition of KMC fiber assets was assigned to a customer base intangible asset. Such assets are being amortized over 15 years. In addition, as mentioned above, in 2004 we established an intangible asset related to the contractual rights to provide video service. Total amortization expense for these customer base and contractual right intangible assets for 2006, 2005 and 2004 was $3.1 million, $3.0 million and $2.0 million, respectively, and is expected to be $2.6 million in 2007 and $1.7 million annually thereafter through 2010.
A-41
Table of Contents
(4) PROPERTY, PLANT AND EQUIPMENT
Net property, plant and equipment at December 31, 2006 and 2005 was composed of the following:
| December 31, | 2006 | 2005 | ||||||
| (Dollars in thousands) | ||||||||
| Cable and wire | $ | 4,224,453 | 4,123,805 | |||||
| Central office | 2,522,940 | 2,532,034 | ||||||
| General support | 760,170 | 768,972 | ||||||
| Fiber transport | 222,595 | 188,451 | ||||||
| Information origination/termination | 62,060 | 59,838 | ||||||
| Construction in progress | 59,198 | 81,532 | ||||||
| Other | 42,344 | 46,745 | ||||||
| 7,893,760 | 7,801,377 | |||||||
| Accumulated depreciation | (4,784,483 | ) | (4,496,891 | ) | ||||
| Net property, plant and equipment | $ | 3,109,277 | 3,304,486 | |||||
Depreciation expense was $520.4 million, $528.9 million and $498.9 million in 2006, 2005 and 2004, respectively.
A-42
Table of Contents
(5) LONG-TERM DEBT
Our long-term debt as of December 31, 2006 and 2005 was as follows:
| December 31, | 2006 | 2005 | ||||||
| (Dollars in thousands) | ||||||||
| CenturyTel | ||||||||
| Senior notes and debentures: | ||||||||
| 7.20% Series D, due 2025 | $ | 100,000 | 100,000 | |||||
| 6.30% Series F, due 2008 | 240,000 | 240,000 | ||||||
| 6.875% Series G, due 2028 | 425,000 | 425,000 | ||||||
| 8.375% Series H, due 2010 | 500,000 | 500,000 | ||||||
| 6.02% Series J, due 2007 | 100,908 | 100,908 | ||||||
| 4.75% Series K, due 2032 | 165,000 | 165,000 | ||||||
| 7.875% Series L, due 2012 | 500,000 | 500,000 | ||||||
| 5.0% Series M, due 2015 | 350,000 | 350,000 | ||||||
| Unamortized net discount | (5,640 | ) | (6,578 | ) | ||||
| Net fair value of derivative instruments: | ||||||||
| Series H senior notes | 10,853 | 13,716 | ||||||
| Series L senior notes | (20,593 | ) | (17,645 | ) | ||||
| Other | — | 39 | ||||||
| Total CenturyTel | 2,365,528 | 2,370,440 | ||||||
| Subsidiaries | ||||||||
| First mortgage debt | ||||||||
| 5.34%* notes, payable to agencies of the U. S. government and cooperative lending associations, due in installments through 2028 | 133,738 | 146,905 | ||||||
| 7.98% notes, due through 2016 | 4,420 | 4,700 | ||||||
| Other debt | ||||||||
| 6.6%* unsecured medium-term notes, due through 2008 | 61,499 | 122,499 | ||||||
| 9.40%* notes, due in installments through 2028 | 971 | 4,931 | ||||||
| 5.55%* capital lease obligations, due through 2008 | 1,708 | 3,331 | ||||||
| Total subsidiaries | 202,336 | 282,366 | ||||||
| Total long-term debt | 2,567,864 | 2,652,806 | ||||||
| Less current maturities | 155,012 | 276,736 | ||||||
| Long-term debt, excluding current maturities | $ | 2,412,852 | 2,376,070 | |||||
| * | Weighted average interest rate at December 31, 2006 |
The approximate annual debt maturities for the five years subsequent to December 31, 2006 are as follows: 2007 — $155.0 million; 2008 — $280.6 million; 2009 — $15.5 million; 2010 — $679.2 million; and 2011 — $12.1 million.
Certain of our loan agreements contain various restrictions, among which are limitations regarding issuance of additional debt, payment of cash dividends, reacquisition of capital stock and other matters. In addition, the transfer of funds from certain consolidated subsidiaries to CenturyTel is restricted by various loan agreements. Subsidiaries which have loans from government agencies and cooperative lending associations, or have issued first mortgage bonds, generally may not loan or advance any funds to CenturyTel, but may pay dividends if certain financial ratios are met. At December 31, 2006, restricted net assets of subsidiaries were $145.8 million and subsidiaries’ retained earnings in excess of amounts restricted by debt covenants totaled $1.6 billion. At December 31, 2006, approximately $2.2 billion of our
A-43
Table of Contents
consolidated retained earnings reflected on the balance sheet was available under our loan agreements for the declaration of dividends.
The senior notes and debentures of CenturyTel referred to above were issued under an indenture dated March 31, 1994. This indenture does not contain any financial covenants, but does include restrictions that limit our ability to (i) incur, issue or create liens upon its property and (ii) consolidate with or merge into, or transfer or lease all or substantially all of its assets to, any other party. The indenture does not contain any provisions that are impacted by our credit ratings, or that restrict the issuance of new securities in the event of a material adverse change to us.
Approximately 15% of our property, plant and equipment is pledged to secure the long-term debt of subsidiaries.
In May 2002, we issued and sold in an underwritten public offering $500 million of equity units, each of which were priced at $25 and consisted initially of a beneficial interest in a CenturyTel senior unsecured note (Series J, due 2007 and remarketable in 2005) with a principal amount of $25 and a contract to purchase shares of CenturyTel common stock no later than May 2005. Each purchase contract generally required the holder to purchase between .6944 and .8741 of a share of CenturyTel common stock on May 16, 2005 in exchange for $25, subject to certain adjustments and exceptions.
In February 2005, we remarketed substantially all of our $500 million of outstanding Series J senior notes due 2007 (the notes described above), at an interest rate of 4.628%. We received no proceeds in connection with the remarketing as all net proceeds were held in trust to secure the equity unit holders’ obligation to purchase common stock from us on May 16, 2005. In connection with the remarketing, we purchased and retired approximately $400 million of the notes, resulting in approximately $100 million remaining outstanding. We incurred a pre-tax charge of approximately $6.0 million in the first quarter of 2005 related to purchasing and retiring the notes. Proceeds to purchase such notes came from the February 2005 issuance of $350 million of 5% senior notes, Series M, due 2015 and cash on hand.
Between April 15, 2005 and May 4, 2005, we repurchased and cancelled an aggregate of approximately 4.1 million of our equity units in privately-negotiated transactions with six institutional holders at an average price of $25.18 per unit. The remaining 15.9 million equity units outstanding on May 16, 2005 were settled in stock in accordance with the terms and conditions of the purchase contract that formed a part of such unit. Accordingly, on May 16, 2005, we received proceeds of approximately $398.2 million and issued approximately 12.9 million common shares in the aggregate. See Note 9 for information on our accelerated share repurchase program which mitigated the dilutive impact of issuing these 12.9 million shares.
A-44
Table of Contents
As of December 31, 2006, we had available a $750 million five-year revolving credit facility, which had no amounts outstanding at December 31, 2006. Our commercial paper program had $23 million outstanding as of December 31, 2006.
In 2002, we issued $165 million of convertible senior debentures, Series K, due 2032 (which bear interest at 4.75% and which may be converted under certain specified circumstances into shares of CenturyTel common stock at a conversion price of $40.455 per share). Holders of the convertible senior debentures will have the right to require us to purchase all or a portion of the debentures on August 1, 2010 and August 1, 2017. In each case, the purchase price payable will be equal to 100% of the principal amount of the debentures to be purchased plus any accrued and unpaid interest to the purchase date. For purchases on or after August 1, 2010, we may choose to pay the purchase price in cash or shares of our common stock, or any combination thereof (except that we will pay any accrued and unpaid interest in cash).
(6) DERIVATIVE INSTRUMENTS
In 2003, we entered into four separate fair value interest rate hedges associated with the full $500 million principal amount of our Series L senior notes, due 2012, that pay interest at a fixed rate of 7.875%. These hedges are “fixed to variable” interest rate swaps that effectively convert our fixed rate interest payment obligations under these notes into obligations to pay variable rates that range from the six-month London InterBank Offered Rate (“LIBOR”) plus 3.229% to the six-month LIBOR plus 3.67%, with settlement and rate reset dates occurring each six months through the expiration of the hedges in August 2012. During 2006, we realized an average interest rate under these hedges of 9.03%. Interest expense was increased by $5.8 million during 2006 as a result of these hedges. The aggregate fair value of such hedges at December 31, 2006 was $20.6 million and is reflected on the accompanying balance sheet as both a liability (included in “Deferred credits and other liabilities”) and as a decrease to our underlying long-term debt.
In late 2004 and early 2005, we entered into several cash flow hedges that effectively locked in the interest rate on a majority of certain anticipated debt transactions that we ultimately completed in February 2005. We locked in the interest rate on (i) $100 million of 2.25-year debt (remarketed in February 2005) at 3.9%; (ii) $75 million of 10-year debt (issued in February 2005) at 5.4%; and (iii) $225 million of 10-year debt (issued in February 2005) at 5.5%. In February 2005, upon settlement of such hedges, we (i) received $366,000 related to the 2.25-year debt remarketing, which is being amortized as a reduction of interest expense over the remaining term of the debt, and (ii) paid $7.7 million related to the 10-year debt issuance, which is being amortized as an increase in interest expense over the 10-year term of the debt.
A-45
Table of Contents
(7) DEFERRED CREDITS AND OTHER LIABILITIES
Deferred credits and other liabilities at December 31, 2006 and 2005 were composed of the following:
| December 31, | 2006 | 2005 | ||||||
| (Dollars in thousands) | ||||||||
| Deferred federal and state income taxes | $ | 673,061 | 670,420 | |||||
| Accrued postretirement benefit costs | 327,337 | 241,153 | ||||||
| Deferred revenue | 99,669 | 19,554 | ||||||
| Accrued pension costs | 36,784 | — | ||||||
| Fair value of interest rate swap | 20,593 | 17,645 | ||||||
| Additional minimum pension liability | — | 11,662 | ||||||
| Minority interest | 9,226 | 8,372 | ||||||
| Other | 52,969 | 54,328 | ||||||
| $ | 1,219,639 | 1,023,134 | ||||||
In connection with the application of SAB 108 (see Note 1), we established deferred revenues and costs associated with installation activities effective as of January 1, 2006.
(8) REDUCTION IN WORKFORCE
On March 1, 2006 and August 30, 2006, we announced workforce reductions involving an aggregate of approximately 400 jobs, or 6% of our workforce, primarily due to increased competitive pressures and the loss of access lines over the last several years. For 2006, we incurred a net pre-tax charge of approximately $7.5 million (consisting of a $9.4 million charge to operating expenses, net of a $1.9 million favorable revenue impact related to such expenses) in connection with severance and related costs. Of the $9.4 million charged to operating expenses, approximately $8.6 million was reflected in cost of services and products and $845,000 was reflected in selling, general and administrative expenses. The following table reflects additional information regarding the severance-related liability for 2006 (in thousands):
| Balance at December 31, 2005 | $ | — | ||
| Amount accrued to expense | 9,431 | |||
| Adjustments to accrual amounts | (529 | ) | ||
| Amount paid | (8,445 | ) | ||
| Balance at December 31, 2006 | $ | 457 | ||
A-46
Table of Contents
(9) STOCKHOLDERS’ EQUITY
Common stock– Unissued shares of CenturyTel common stock were reserved as follows:
| December 31, | 2006 | |||
| (In thousands) | ||||
| Incentive compensation programs | 7,669 | |||
| Acquisitions | 4,064 | |||
| Employee stock purchase plan | 4,552 | |||
| Dividend reinvestment plan | 315 | |||
| Conversion of convertible preferred stock | 406 | |||
| Other employee benefit plans | 1,505 | |||
| 18,511 | ||||
In accordance with previously announced stock repurchase programs, we repurchased 21.4 million shares (for $802.2 million), 16.4 million shares (for $551.8 million) and 13.4 million shares (for $401.0 million) in 2006, 2005 and 2004, respectively. The 2006 and 2005 repurchases included 14.36 million and 12.9 million shares, respectively, repurchased (for a total price of $528.4 and $437.5 million, respectively) under accelerated share repurchase agreements (see below for additional information).
On February 21, 2006, our Board of Directors approved a stock repurchase program authorizing us to repurchase up to $1.0 billion of our common stock and terminated the approximately $13 million remaining balance of our existing $200 million share repurchase program approved in February 2005. In February 2006, we repurchased the first $500 million of common stock through accelerated share repurchase agreements entered into with various investment banks, repurchasing and retiring approximately 14.36 million shares of common stock at an average initial price of $34.83 per share. We funded repurchases under these agreements through short-term borrowings and cash on hand. As part of the accelerated share repurchase transactions, we simultaneously entered into forward contracts with the investment banks whereby the investment banks purchased an aggregate of 14.36 million shares of our common stock during the terms of the contracts. At the end of the repurchase period in mid-July 2006, we paid an aggregate of approximately $28.4 million cash to the investment banks to compensate them for the difference between their weighted average purchase price during the repurchase period and the initial average price. We reflected such settlement amount as an adjustment to retained earnings in our financial statements during 2006.
In late May 2005, we entered into accelerated share repurchase agreements with three investment banks whereby we repurchased and retired approximately 12.9 million shares of our common stock for an aggregate of $416.5 million cash (or an initial average price of $32.34 per share). We funded this purchase using the proceeds received from the settlement of the equity units mentioned in Note 5 and from cash on hand. As part of the accelerated share repurchase transactions, we simultaneously entered into forward
A-47
Table of Contents
contracts with the investment banks whereby the investment banks purchased an aggregate of 12.9 million shares of our common stock during the term of the contracts. At the end of the repurchase period, we paid an aggregate of approximately $21.0 million cash to the investment banks to compensate them for the difference between their weighted average purchase price during the repurchase period and the initial average price. We reflected such settlement amount as an adjustment to paid-in capital.
During 2006, our stockholders’ equity was reduced by approximately $97.9 million upon the adoption of SFAS 158 and increased approximately $9.7 million upon the application of SAB 108. See Note 1 for additional information.
Under CenturyTel’s Articles of Incorporation each share of common stock beneficially owned continuously by the same person since May 30, 1987 generally entitles the holder thereof to ten votes per share. All other shares entitle the holder to one vote per share. At December 31, 2006, the holders of 5.0 million shares of common stock were entitled to ten votes per share.
Preferred stock– As of December 31, 2006, we had 2.0 million shares of authorized preferred stock, $25 par value per share. At December 31, 2006 and 2005, there were 298,000 and 314,000 shares, respectively, of outstanding convertible preferred stock. Holders of outstanding CenturyTel preferred stock are entitled to receive cumulative dividends, receive preferential distributions equal to $25 per share plus unpaid dividends upon CenturyTel’s liquidation and vote as a single class with the holders of common stock.
Shareholders’ Rights Plan– On November 1, 2006, our 1996 rights agreement (and each preference share purchase right issued thereunder) lapsed in accordance with its stated terms.
(10) POSTRETIREMENT BENEFITS
We sponsor health care plans (which use a December 31 measurement date) that provide postretirement benefits to all qualified retired employees.
In May 2004, the Financial Accounting Standards Board issued Financial Statement Position FAS 106-2, which provides accounting guidance to sponsors of postretirement health care plans that are impacted by the Medicare Prescription Drug, Improvement and Modernization Act of 2003 (the “Act”). We believe that certain drug benefits offered under our postretirement health care plans will qualify for subsidy under Medicare Part D. In the third quarter of 2004, we estimated that the effect of the Act on us would not be material and reflected the effects of the Act as of the December 31, 2004 measurement date. As of this date, we estimated that the reduction in our accumulated benefit obligation attributable to prior service cost was approximately $7 million and reflected such amount as an actuarial gain.
A-48
Table of Contents
In 2005, in connection with negotiating certain union contracts, we amended certain retiree contribution and retirement eligibility provisions of our plan.
The following is a reconciliation of the beginning and ending balances for the benefit obligation and the plan assets.
| December 31, | 2006 | 2005 | 2004 | |||||||||
| (Dollars in thousands) | ||||||||||||
| Change in benefit obligation | ||||||||||||
| Benefit obligation at beginning of year | $ | 353,942 | 305,720 | 311,421 | ||||||||
| Service cost | 6,982 | 6,289 | 6,404 | |||||||||
| Interest cost | 18,980 | 16,718 | 17,585 | |||||||||
| Participant contributions | 1,583 | 1,637 | 1,362 | |||||||||
| Plan amendments | (7,978 | ) | 23,289 | 2,529 | ||||||||
| Direct subsidy receipts | 717 | — | — | |||||||||
| Actuarial (gain) loss | 319 | 16,391 | (18,185 | ) | ||||||||
| Benefits paid | (17,128 | ) | (16,102 | ) | (15,396 | ) | ||||||
| Benefit obligation at end of year | $ | 357,417 | 353,942 | 305,720 | ||||||||
| Change in plan assets | ||||||||||||
| Fair value of plan assets at beginning of year | $ | 29,545 | 29,570 | 29,877 | ||||||||
| Return on assets | 3,280 | 1,440 | 2,377 | |||||||||
| Employer contributions | 12,800 | 13,000 | 11,350 | |||||||||
| Participant contributions | 1,583 | 1,637 | 1,362 | |||||||||
| Benefits paid | (17,128 | ) | (16,102 | ) | (15,396 | ) | ||||||
| Fair value of plan assets at end of year | $ | 30,080 | 29,545 | 29,570 | ||||||||
Net periodic postretirement benefit cost for 2006, 2005 and 2004 included the following components:
| Year ended December 31, | 2006 | 2005 | 2004 | |||||||||
| (Dollars in thousands) | ||||||||||||
| Service cost | $ | 6,982 | 6,289 | 6,404 | ||||||||
| Interest cost | 18,980 | 16,718 | 17,585 | |||||||||
| Expected return on plan assets | (2,437 | ) | (2,440 | ) | (2,465 | ) | ||||||
| Amortization of unrecognized actuarial loss | 3,719 | 2,916 | 3,611 | |||||||||
| Amortization of unrecognized prior service credit | (855 | ) | (1,876 | ) | (3,648 | ) | ||||||
| Net periodic postretirement benefit cost | $ | 26,389 | 21,607 | 21,487 | ||||||||
The following table sets forth the amounts recognized as liabilities for postretirement benefits at December 31, 2006, 2005 and 2004.
| December 31, | 2006 | 2005 | 2004 | |||||||||
| (Dollars in thousands) | ||||||||||||
| Benefit obligation | $ | (357,417 | ) | (353,942 | ) | (305,720 | ) | |||||
| Fair value of plan assets | 30,080 | 29,545 | 29,570 | |||||||||
| Unamortized prior service credit | — | (1,726 | ) | (26,891 | ) | |||||||
| Unrecognized net actuarial loss | — | 82,660 | 68,185 | |||||||||
| Accrued benefit cost | $ | (327,337 | ) | (243,463 | ) | (234,856 | ) | |||||
A-49
Table of Contents
In accordance with SFAS 158, the unamortized prior service credit ($8.8 million as of December 31, 2006) and unrecognized net actuarial loss ($78.4 million as of December 31, 2006) components have been reflected as a $69.6 million net reduction ($40.1 million after-tax) to accumulated other comprehensive loss within stockholders’ equity. The estimated amount of amortization expense (income) of the above unrecognized items that will be amortized from accumulated other comprehensive loss and reflected as a component of net periodic pension cost during 2007 are (i) ($2.0 million) for the prior service credit and (ii) $3.2 million for the net actuarial loss. See Note 1 for additional information.
Assumptions used in accounting for postretirement benefits as of December 31, 2006 and 2005 were:
| 2006 | 2005 | |||||||
| Determination of benefit obligation | ||||||||
| Discount rate | 5.75 | % | 5.5 | |||||
| Healthcare cost increase trend rates (Medical/Prescription Drug) | ||||||||
| Following year | 8.0/11.0 | % | 9.0/14.0 | |||||
| Rate to which the cost trend rate is assumed to decline (the ultimate cost trend rate) | 5.0/5.0 | % | 5.0/5.0 | |||||
| Year that the rate reaches the ultimate cost trend rate | 2010/2013 | 2010/2015 | ||||||
| Determination of benefit cost | ||||||||
| Discount rate | 5.50 | % | 5.75 | |||||
| Expected return on plan assets | 8.25 | % | 8.25 | |||||
We employ a total return investment approach whereby a mix of equities and fixed income investments are used to maximize the long-term return of plan assets for a prudent level of risk. The intent of this strategy is to minimize plan expenses by outperforming plan liabilities over the long term. Risk tolerance is established through careful consideration of plan liabilities, plan funded status and corporate financial condition. We measure and monitor investment risk on an ongoing basis through annual liability measurements, periodic asset studies and periodic portfolio reviews.
Our postretirement benefit plan weighted-average asset allocations at December 31, 2006 and 2005 by asset category are as follows:
| 2006 | 2005 | |||||||
| Equity securities | 60.1 | % | 60.2 | |||||
| Debt securities | 27.9 | 31.4 | ||||||
| Other | 12.0 | 8.4 | ||||||
| Total | 100.0 | % | 100.0 | |||||
In determining the expected return on plan assets, we study historical markets and apply the widely-accepted capital market principle that assets with higher volatility and risk generate a greater return over the long term. We evaluate current market factors such as inflation and interest rates before determining long-term capital market assumptions. We also review peer data and historical returns to check for reasonableness.
A-50
Table of Contents
Assumed health care cost trends have a significant effect on the amounts reported for postretirement benefit plans. A one-percentage-point change in assumed health care cost rates would have the following effects:
| 1-Percentage | 1-Percentage | |||||||
| Point Increase | Point Decrease | |||||||
| (Dollars in thousands) | ||||||||
| Effect on annual total of service and interest cost components | $ | 243 | (312 | ) | ||||
| Effect on postretirement benefit obligation | $ | 3,775 | (4,729 | ) | ||||
We expect to contribute approximately $16.7 million to our postretirement benefit plan in 2007.
Our estimated future projected benefit payments under our postretirement benefit plan are as follows:
| Before Medicare | Medicare | Net of | ||||||||||
| Year | Subsidy | Subsidy | Medicare Subsidy | |||||||||
| (Dollars in thousands) | ||||||||||||
| 2007 | $ | 18,067 | (1,327 | ) | 16,740 | |||||||
| 2008 | $ | 20,120 | (1,576 | ) | 18,544 | |||||||
| 2009 | $ | 22,242 | (1,814 | ) | 20,428 | |||||||
| 2010 | $ | 24,393 | (1,801 | ) | 22,592 | |||||||
| 2011 | $ | 26,152 | (1,533 | ) | 24,619 | |||||||
| 2012-2016 | $ | 141,920 | (2,781 | ) | 139,139 | |||||||
A-51
Table of Contents
(11) DEFINED BENEFIT AND OTHER RETIREMENT PLANS
We sponsor defined benefit pension plans for substantially all employees. We also sponsor a Supplemental Executive Retirement Plan to provide certain officers with supplemental retirement, death and disability benefits. We use a December 31 measurement date for all our plans.
The following is a reconciliation of the beginning and ending balances for the aggregate benefit obligation and the plan assets for our above-referenced defined benefit plans.
| December 31, | 2006 | 2005 | 2004 | |||||||||
| (Dollars in thousands) | ||||||||||||
| Change in benefit obligation | ||||||||||||
| Benefit obligation at beginning of year | $ | 460,599 | 418,630 | 390,833 | ||||||||
| Service cost | 17,679 | 15,332 | 14,175 | |||||||||
| Interest cost | 25,935 | 23,992 | 23,156 | |||||||||
| Plan amendments | (3,827 | ) | 31 | 428 | ||||||||
| Actuarial loss | 6,789 | 28,016 | 16,304 | |||||||||
| Settlements | (13,232 | ) | — | — | ||||||||
| Benefits paid | (19,641 | ) | (25,402 | ) | (26,266 | ) | ||||||
| Benefit obligation at end of year | $ | 474,302 | 460,599 | 418,630 | ||||||||
| Change in plan assets | ||||||||||||
| Fair value of plan assets at beginning of year | $ | 407,367 | 363,981 | 348,308 | ||||||||
| Return on plan assets | 46,297 | 25,453 | 35,892 | |||||||||
| Employer contributions | 31,503 | 43,335 | 6,047 | |||||||||
| Benefits paid | (32,874 | ) | (25,402 | ) | (26,266 | ) | ||||||
| Fair value of plan assets at end of year | $ | 452,293 | 407,367 | 363,981 | ||||||||
Net periodic pension expense for 2006, 2005 and 2004 included the following components:
| Year ended December 31, | 2006 | 2005 | 2004 | |||||||||
| (Dollars in thousands) | ||||||||||||
| Service cost | $ | 17,679 | 15,332 | 14,175 | ||||||||
| Interest cost | 25,935 | 23,992 | 23,156 | |||||||||
| Expected return on plan assets | (32,706 | ) | (29,225 | ) | (28,195 | ) | ||||||
| Settlements | 3,344 | — | 1,093 | |||||||||
| Recognized net losses | 9,670 | 6,328 | 5,525 | |||||||||
| Net amortization and deferral | 19 | 289 | 279 | |||||||||
| Net periodic pension expense | $ | 23,941 | 16,716 | 16,033 | ||||||||
A-52
Table of Contents
The following table sets forth the combined plans’ funded status and amounts recognized in our consolidated balance sheet at December 31, 2006, 2005 and 2004.
| December 31, | 2006 | 2005 | 2004 | |||||||||
| (Dollars in thousands) | ||||||||||||
| Benefit obligation | $ | (474,302 | ) | (460,599 | ) | (418,630 | ) | |||||
| Fair value of plan assets | 452,293 | 407,367 | 363,981 | |||||||||
| Unrecognized transition asset | — | (396 | ) | (648 | ) | |||||||
| Unamortized prior service cost | — | 3,109 | 3,618 | |||||||||
| Unrecognized net actuarial loss | — | 123,879 | 98,479 | |||||||||
| Net amount recognized | $ | (22,009 | ) | 73,360 | 46,800 | |||||||
In accordance with SFAS 158, the unrecognized transition asset ($144,000 as of December 31, 2006), unamortized prior service credit ($989,000 as of December 31, 2006) and unrecognized net actuarial loss ($104.1 million as of December 31, 2006) components have been reflected as a $102.9 million net reduction ($63.4 million after-tax) to accumulated other comprehensive loss within stockholders’ equity. The estimated amount of amortization expense (income) of the above unrecognized amounts that will be amortized from accumulated other comprehensive loss and reflected as a component of net periodic pension cost for 2007 are (i) ($144,000) for the transition asset; (ii) $165,000 for the prior service cost and (iii) $5.9 million for the net actuarial loss.
Amounts recognized on the balance sheet consist of:
| December 31, | 2006 | 2005 | ||||||
| (Dollars in thousands) | ||||||||
| Pension asset (reflected in Other Assets)* | $ | 16,187 | 73,360 | |||||
| Accrued expenses and other current liabilities* | (1,412 | ) | — | |||||
| Other deferred credits* | (36,784 | ) | — | |||||
| Additional minimum pension liability (reflected in Deferred Credits and Other Liabilities) | — | (11,662 | ) | |||||
| Accumulated Other Comprehensive Loss | — | 11,662 | ||||||
| Net amount recognized | $ | (22,009 | ) | 73,360 | ||||
| * | For 2006, in accordance with SFAS 158, those plans that are overfunded are reflected as assets; those plans that are underfunded are reflected as liabilities. |
Our aggregate accumulated benefit obligation as of December 31, 2006 and 2005 was $407.2 million and $392.3 million, respectively.
A-53
Table of Contents
Assumptions used in accounting for the pension plans as of December 2006 and 2005 were:
| 2006 | 2005 | |||||||
| Determination of benefit obligation | ||||||||
| Discount rate | 5.8 | % | 5.5 | |||||
| Weighted average rate of compensation increase | 4.0 | % | 4.0 | |||||
| Determination of benefit cost | ||||||||
| Discount rate | 5.5 | % | 5.75 | |||||
| Weighted average rate of compensation increase | 4.0 | % | 4.0 | |||||
| Expected long-term rate of return on assets | 8.25 | % | 8.25 | |||||
We employ a total return investment approach whereby a mix of equities and fixed income investments are used to maximize the long-term return of plan assets for a prudent level of risk. The intent of this strategy is to minimize plan expenses by outperforming plan liabilities over the long term. Risk tolerance is established through careful consideration of plan liabilities, plan funded status and corporate financial condition. We measure and monitor investment risk on an ongoing basis through annual liability measurements, periodic asset studies and periodic portfolio reviews.
Our pension plans weighted-average asset allocations at December 31, 2006 and 2005 by asset category are as follows:
| 2006 | 2005 | |||||||
| Equity securities | 71.7 | % | 69.5 | |||||
| Debt securities | 25.8 | 28.0 | ||||||
| Other | 2.5 | 2.5 | ||||||
| Total | 100.0 | % | 100.0 | |||||
In determining the expected return on plan assets, we study historical markets and apply the widely-accepted capital market principle that assets with higher volatility and risk generate a greater return over the long term. We evaluate current market factors such as inflation and interest rates before determining long-term capital market assumptions. We also review peer data and historical returns to check for reasonableness.
The amount of the 2007 contribution will be determined based on a number of factors, including the results of the 2007 actuarial valuation report. At this time, the amount of the 2007 contribution is not known.
Our estimated future projected benefit payments under our defined benefit pension plans are as follows: 2007 — $24.3 million; 2008 — $27.1 million; 2009 — $29.0 million; 2010 — $31.4 million; 2011 — $33.9 million; and 2012-2016 — $199.5 million.
Through December 31, 2006, we also sponsored an Employee Stock Ownership Plan (“ESOP”) which covers most employees with one year of service and is funded by our contributions determined annually by the
A-54
Table of Contents
Board of Directors. Our expense related to the ESOP during 2006, 2005 and 2004 was $7.9 million, $7.3 million, and $8.1 million, respectively. At December 31, 2006, the ESOP owned an aggregate of 3.4 million shares of CenturyTel common stock. After 2006, our contribution to the ESOP will be discontinued.
We also sponsor qualified profit sharing plans pursuant to Section 401(k) of the Internal Revenue Code (the “401(k) Plans”) which are available to substantially all employees. Our matching contributions to the 401(k) Plans were $8.6 million in 2006, $8.5 million in 2005 and $9.1 million in 2004. Our matching contribution to the 401(k) Plans will increase in 2007, but such increase will be less than the reduction from the discontinuance of the ESOP contributions mentioned above.
(12) INCOME TAXES
Income tax expense included in the Consolidated Statements of Income for the years ended December 31, 2006, 2005 and 2004 was as follows:
| Year ended December 31, | 2006 | 2005 | 2004 | |||||||||
| (Dollars in thousands) | ||||||||||||
| Federal | ||||||||||||
| Current | $ | 146,201 | 139,836 | 121,374 | ||||||||
| Deferred | 37,687 | 35,499 | 59,973 | |||||||||
| State | ||||||||||||
| Current | 25,236 | (6,075 | ) | 14,380 | ||||||||
| Deferred | 11,998 | 34,031 | 14,401 | |||||||||
| $ | 221,122 | 203,291 | 210,128 | |||||||||
Income tax expense was allocated as follows:
| Year ended December 31, | 2006 | 2005 | 2004 | |||||||||
| (Dollars in thousands) | ||||||||||||
| Income tax expense in the consolidated statements of income | $ | 221,122 | 203,291 | 210,128 | ||||||||
| Stockholders’ equity: | ||||||||||||
| Compensation expense for tax purposes in excess of amounts recognized for financial reporting purposes | (12,034 | ) | (6,261 | ) | (3,244 | ) | ||||||
| Tax effect of the change in accumulated other comprehensive income (loss) | (63,837 | ) | (801 | ) | (5,195 | ) | ||||||
The following is a reconciliation from the statutory federal income tax rate to our effective income tax rate:
| Year ended December 31, | 2006 | 2005 | 2004 | |||||||||
| (Percentage of pre-tax income) | ||||||||||||
| Statutory federal income tax rate | 35.0 | % | 35.0 | 35.0 | ||||||||
| State income taxes, net of federal income tax benefit | 4.1 | 3.4 | 3.4 | |||||||||
| Other, net | (1.7 | ) | (.6 | ) | — | |||||||
| Effective income tax rate | 37.4 | % | 37.8 | 38.4 | ||||||||
A-55
Table of Contents
The tax effects of temporary differences that gave rise to significant portions of the deferred tax assets and deferred tax liabilities at December 31, 2006 and 2005 were as follows:
| December 31, | 2006 | 2005 | ||||||
| (Dollars in thousands) | ||||||||
| Deferred tax assets | ||||||||
| Postretirement and pension benefit costs | $ | 131,890 | 65,318 | |||||
| Net state operating loss carryforwards | 61,875 | 56,506 | ||||||
| Other employee benefits | 24,907 | 21,176 | ||||||
| Other | 45,628 | 42,657 | ||||||
| Gross deferred tax assets | 264,300 | 185,657 | ||||||
| Less valuation allowance | (61,049 | ) | (54,412 | ) | ||||
| Net deferred tax assets | 203,251 | 131,245 | ||||||
| Deferred tax liabilities | ||||||||
| Property, plant and equipment, primarily due to depreciation differences | (334,521 | ) | (334,011 | ) | ||||
| Goodwill | (503,126 | ) | (447,850 | ) | ||||
| Other | (27,010 | ) | (19,804 | ) | ||||
| Gross deferred tax liabilities | (864,657 | ) | (801,665 | ) | ||||
| Net deferred tax liability | $ | (661,406 | ) | (670,420 | ) | |||
Of the $661.4 million net deferred tax liability as of December 31, 2006, approximately $673.1 million is reflected as a net long-term liability (in “Other deferred credits”) and approximately $11.7 million is reflected as a net current deferred tax asset (in “Other current assets”).
We establish valuation allowances when necessary to reduce the deferred tax assets to amounts we expect to realize. As of December 31, 2006, we had available tax benefits associated with net state operating loss carryforwards, which expire through 2026, of $61.9 million. The ultimate realization of the benefits of the carryforwards is dependent upon the generation of future taxable income during the periods in which those temporary differences become deductible. We consider our scheduled reversal of deferred tax liabilities, projected future taxable income, and tax planning strategies in making this assessment. As a result of such assessment, we reserved $61.0 million through the valuation allowance as of December 31, 2006 as it is more likely than not that this amount of net operating loss carryforwards will not be utilized prior to expiration. Income tax expense was reduced by approximately $6.4 million in 2006 due to the resolution of various income tax audit issues. Income tax expense for 2005 was increased by $19.5 million as a result of increasing the valuation allowance related to net state operating loss carryforwards. This increase was primarily due to changes in state income tax laws and other factors which impacted the projections of future taxable income.
A-56
Table of Contents
(13) EARNINGS PER SHARE
The following is a reconciliation of the numerators and denominators of the basic and diluted earnings per share computations:
| Year ended December 31, | 2006 | 2005 | 2004 | |||||||||
| (Dollars, except per share | ||||||||||||
| amounts, and shares in thousands) | ||||||||||||
| Income (Numerator): | ||||||||||||
| Net income | $ | 370,027 | 334,479 | 337,244 | ||||||||
| Dividends applicable to preferred stock | (380 | ) | (396 | ) | (399 | ) | ||||||
| Net income applicable to common stock for computing basic earnings per share | 369,647 | 334,083 | 336,845 | |||||||||
| Interest on convertible debentures, net of tax | 4,828 | 4,875 | 4,829 | |||||||||
| Dividends applicable to preferred stock | 380 | 396 | 399 | |||||||||
| Net income as adjusted for purposes of computing diluted earnings per share | $ | 374,855 | 339,354 | 342,073 | ||||||||
| Shares (Denominator): | ||||||||||||
| Weighted average number of shares: | ||||||||||||
| Outstanding during period | 117,363 | 131,044 | 137,225 | |||||||||
| Nonvested restricted stock | (692 | ) | (203 | ) | — | |||||||
| Employee Stock Ownership Plan shares not committed to be released | — | — | (10 | ) | ||||||||
| Weighted average number of shares outstanding during period for computing basic earnings per share | 116,671 | 130,841 | 137,215 | |||||||||
| Incremental common shares attributable to dilutive securities: | ||||||||||||
| Shares issuable under convertible securities | 4,493 | 4,511 | 4,514 | |||||||||
| Shares issuable upon settlement of accelerated share repurchase agreements | 365 | 378 | — | |||||||||
| Shares issuable under incentive compensation plans | 700 | 357 | 415 | |||||||||
| Number of shares as adjusted for purposes of computing diluted earnings per share | 122,229 | 136,087 | 142,144 | |||||||||
| Basic earnings per share | $ | 3.17 | 2.55 | 2.45 | ||||||||
| Diluted earnings per share | $ | 3.07 | 2.49 | 2.41 | ||||||||
In connection with calculating our diluted earnings per share for our accelerated share repurchase program discussed in Note 9, we assumed the accelerated share repurchase market price adjustment would be settled through our issuance of additional shares of common stock, which was allowed (at our discretion) in the agreement. Accordingly, the estimated shares issuable based on the fair value of the forward contract was included in the weighted average shares outstanding for the computation of diluted earnings per share.
The weighted average number of shares of common stock subject to issuance under outstanding options that were excluded from the computation of diluted earnings per share because the exercise price of the option was greater than the average market price of the common stock was 1.0 million for 2006, 1.8 million for 2005 and 2.4 million for 2004.
A-57
Table of Contents
(14) STOCK COMPENSATION PROGRAMS
Effective January 1, 2006, we adopted the provisions of Statement of Financial Accounting Standards No. 123 (Revised 2004), “Share-Based Payment” (“SFAS 123(R)”). SFAS 123(R) requires us to measure our cost of awarding employees with equity instruments based upon the fair value of the award on the grant date. Such cost will be recognized as compensation expense over the period during which the employee is required to provide service in exchange for the award. Compensation cost is also recognized over the applicable remaining vesting period for any outstanding options that were not fully vested as of January 1, 2006. We did not have any unvested outstanding options as of January 1, 2006 since our Board of Directors accelerated the vesting of all unvested options effective as of December 31, 2005, as described below. We elected the modified prospective transition method as permitted by SFAS 123(R); accordingly, we did not restate prior period results.
We currently maintain programs which allow the Board of Directors, through its Compensation Committee, to grant incentives to certain employees and our outside directors in any one or a combination of several forms, including incentive and non-qualified stock options; stock appreciation rights; restricted stock; and performance shares. As of December 31, 2006, we had reserved approximately 7.7 million shares of common stock which may be issued in connection with incentive awards made in the future under our current incentive programs. We also offer an Employee Stock Purchase Plan whereby employees can purchase our common stock at a 15% discount based on the lower of the beginning or ending stock price during recurring six-month periods stipulated in such program.
As of December 31, 2005, we had approximately 6.0 million options outstanding from prior grants, all of which were issued with exercise prices either equal to or exceeding the then-current market price. All of these options were exercisable as a result of actions taken by our Board of Directors in December 2005 to accelerate the vesting of all unvested options outstanding, effective as of December 31, 2005, in order to eliminate the recognition of compensation expense which otherwise would have been required upon the effectiveness of SFAS 123(R).
During 2006 we granted 1,007,175 stock options with exercise prices at market value. All of these options expire ten years after the date of grant and have a three-year vesting period. The weighted average fair value of each option was estimated as of the date of grant to be $12.75 using a Black-Scholes option pricing model using the following assumptions: dividend yield-.7%; expected volatility-30%; weighted average risk free interest rate-4.65% (rates ranged from 4.28% to 5.22%); and expected term-7 years (executive officers) and 5 years (all other employees).
During 2005 we granted 1,015,025 stock options with exercise prices at market value. The weighted average fair value of each of the 2005 options was estimated as of the date of grant to be $12.68 using an
A-58
Table of Contents
option-pricing model with the following assumptions: dividend yield-.7%; expected volatility - 30%; weighted average risk-free interest rate-4.2%; and expected option life-seven years.
During 2004 we granted 952,975 stock options with exercise prices at market value. The weighted average fair value of each of the 2004 options was estimated as of the date of grant to be $10.25 using an option-pricing model with the following assumptions: dividend yield-.7%; expected volatility-30%; weighted average risk-free interest rate-3.6%; and expected option life-seven years.
The expected volatility was based on the historical volatility of our common stock over the 7- and 5- year terms mentioned above. The expected term was determined based on the historical exercise and forfeiture rates for similar grants.
Stock option transactions during 2006, 2005 and 2004 were as follows:
| Remaining | Aggregate | |||||||||||||||
| Number | Average | contractual | intrinsic | |||||||||||||
| of options | price | term (in years) | value | |||||||||||||
| Outstanding December 31, 2003 | 6,734,572 | $ | 28.14 | |||||||||||||
| Granted | 952,975 | 22.96 | ||||||||||||||
| Exercised | (827,486 | ) | 28.22 | |||||||||||||
| Forfeited/Cancelled | (146,503 | ) | 27.90 | |||||||||||||
| Outstanding December 31, 2004 | 6,713,558 | $ | 28.79 | |||||||||||||
| Granted | 1,015,025 | 25.04 | ||||||||||||||
| Exercised | (1,664,625 | ) | 33.69 | |||||||||||||
| Forfeited/Cancelled | (68,500 | ) | 31.40 | |||||||||||||
| Outstanding December 31, 2005 | 5,995,458 | $ | 30.63 | |||||||||||||
| Granted | 1,007,175 | 35.98 | ||||||||||||||
| Exercised | (3,047,918 | ) | 29.15 | |||||||||||||
| Forfeited/Cancelled | (58,916 | ) | 32.54 | |||||||||||||
| Outstanding December 31, 2006 | 3,895,799 | $ | 33.14 | 6.5 | $ | 40,967,000 | ||||||||||
| Exercisable December 31, 2006 | 2,918,724 | $ | 32.20 | 5.7 | $ | 33,452,000 | ||||||||||
In addition, during 2006, we issued 293,943 shares of restricted stock to certain employees and our outside directors at a weighted-average price of $36.02 per share. During 2005, we issued 286,123 shares of restricted stock at a weighted-average price of $33.47 per share, and during 2004, we issued 227,075 shares of restricted stock at a weighted-average price of $27.63 per share. Such restricted stock vests over a five-year period (for employees) and a three-year period (for outside directors). Nonvested restricted stock transactions during 2006 were as follows:
| Number | Average grant | |||||||
| of shares | date fair value | |||||||
| Nonvested at January 1, 2006 | 511,919 | $ | 30.92 | |||||
| Granted | 293,943 | 36.02 | ||||||
| Vested | (80,641 | ) | 32.58 | |||||
| Forfeited | (13,133 | ) | 30.70 | |||||
| Nonvested at December 31, 2006 | 712,088 | $ | 32.84 | |||||
A-59
Table of Contents
The total compensation cost for share-based payment arrangements in 2006, 2005 and 2004 was $11.9 million, $4.7 million and $1.3 million, respectively. We recognized a tax benefit related to such arrangements of approximately $4.5 million in 2006, $1.8 million in 2005 and $491,000 in 2004. As of December 31, 2006, there was $22.0 million of total unrecognized compensation cost related to the share-based payment arrangements, which is expected to be recognized over a weighted-average period of 3.0 years.
We received net cash proceeds of $88.8 million during 2006 in connection with option exercises. The total intrinsic value of options exercised (the amount by which the market price of the stock on the date of exercise exceeded the market price of the stock on the date of grant) was $31.0 million during 2006, $16.3 million during 2005 and $8.6 million during 2004. The excess tax benefit realized from stock options exercised and restricted stock released during 2006 was $12.0 million. The total fair value of restricted stock that vested during 2006, 2005 and 2004 was $2.6 million, $208,000 and $1.3 million, respectively.
Prior to January 1, 2006, we accounted for stock compensation plans using the intrinsic value method in accordance with Accounting Principles Board Opinion No. 25, “Accounting for Stock Issued to Employees,” as allowed by Statement of Financial Accounting Standards No. 123, “Accounting for Stock-Based Compensation” (“SFAS 123”). Options have been granted at a price either equal to or exceeding the then-current market price. Accordingly, we did not recognize compensation cost in connection with issuing stock options prior to January 1, 2006. If compensation cost for our options had been determined consistent with SFAS 123(R), our net income and earnings per share on a pro forma basis for 2005 and 2004 would have been as follows:
| Year ended December 31, | 2005 | 2004 | ||||||
| (Dollars in thousands, | ||||||||
| except per share amounts) | ||||||||
| Net income, as reported | $ | 334,479 | 337,244 | |||||
| Add: Stock-based compensation expense reflected in net income, net of tax | 96 | — | ||||||
| Less: Total stock-based compensation expense determined under fair value based method, net of tax | (12,537 | ) | (9,767 | ) | ||||
| Pro forma net income | $ | 322,038 | 327,477 | |||||
| Basic earnings per share | ||||||||
| As reported | $ | 2.55 | 2.45 | |||||
| Pro forma | $ | 2.46 | 2.38 | |||||
| Diluted earnings per share | ||||||||
| As reported | $ | 2.49 | 2.41 | |||||
| Pro forma | $ | 2.40 | 2.34 | |||||
A-60
Table of Contents
(15) GAIN ON ASSET DISPOSITIONS
In April 2006, upon dissolution of the Rural Telephone Bank (“RTB”), we received $122.8 million in cash for redemption of our investment in stock of the RTB and recorded a pre-tax gain of approximately $117.8 million in the second quarter of 2006 related to this transaction. In May 2006, we sold the assets of our local exchange operations in Arizona for approximately $5.9 million cash and recorded a pre-tax gain of approximately $866,000 in the second quarter of 2006. Such gains are included in “Other income (expense)” on our Consolidated Statements of Income.
(16) SUPPLEMENTAL CASH FLOW DISCLOSURES
The amount of interest actually paid, net of amounts capitalized of $1.9 million, $2.8 million and $762,000 during 2006, 2005 and 2004, respectively, was $191.9 million, $194.8 million and $207.2 million during 2006, 2005 and 2004, respectively. Income taxes paid were $212.4 million in 2006, $88.8 million in 2005 and $129.9 million in 2004. Income tax refunds totaled $3.0 million in 2006, $4.9 million in 2005 and $8.9 million in 2004.
We have consummated the acquisitions of various operations, along with certain other assets, during the three years ended December 31, 2006. In connection with these acquisitions, the following assets were acquired and liabilities assumed:
| Year ended December 31, | 2006 | 2005 | 2004 | |||||||||
| (Dollars in thousands) | ||||||||||||
| Property, plant and equipment, net | $ | — | 66,450 | — | ||||||||
| Goodwill | — | — | 5,274 | |||||||||
| Deferred credits and other liabilities | — | — | (3,381 | ) | ||||||||
| Other assets and liabilities, excluding cash and cash equivalents | 5,222 | 9,003 | 107 | |||||||||
| Decrease in cash due to acquisitions | $ | 5,222 | 75,453 | 2,000 | ||||||||
A-61
Table of Contents
(17) FAIR VALUE OF FINANCIAL INSTRUMENTS
The following table presents the carrying amounts and estimated fair values of certain of our financial instruments at December 31, 2006 and 2005.
| Carrying | Fair | |||||||
| Amount | value | |||||||
| (Dollars in thousands) | ||||||||
| December 31, 2006 | ||||||||
| Financial assets | $ | 110,134 | 110,134 | (2) | ||||
| Financial liabilities | ||||||||
| Long-term debt (including current maturities) | $ | 2,567,864 | 2,522,347 | (1) | ||||
| Interest rate swaps | $ | 20,593 | 20,593 | (2) | ||||
| Other | $ | 51,614 | 51,614 | (2) | ||||
| December 31, 2005 | ||||||||
| Financial assets | $ | 110,912 | 228,651 | (2) | ||||
| Financial liabilities | ||||||||
| Long-term debt (including current maturities) | $ | 2,652,806 | 2,648,843 | (1) | ||||
| Interest rate swaps | $ | 17,645 | 17,645 | (2) | ||||
| Other | $ | 48,917 | 48,917 | (2) | ||||
| (1) | Fair value was estimated by discounting the scheduled payment streams to present value based upon rates currently available to us for similar debt. | |
| (2) | Fair value was estimated by us to approximate carrying value or is based on current market information (see below for further information). |
Included in Financial Assets at December 31, 2005 was our investment in stock of the RTB. The carrying value of our investment in RTB stock ($5.1 million) was reflected on the balance sheet on the cost basis and did not include the cumulative stock dividends earned. In 2006, upon dissolution of the RTB, we received $122.8 million in cash for redemption of our investment in stock of the RTB and recorded a pre-tax gain of approximately $117.8 million in 2006 related to this transaction.
We believe the carrying amount of cash and cash equivalents, accounts receivable, short-term debt, accounts payable and accrued expenses approximates the fair value due to the short maturity of these instruments and have not been reflected in the above table.
A-62
Table of Contents
(18) BUSINESS SEGMENTS
We are an integrated communications company engaged primarily in providing an array of communications services to our customers, including local exchange, long distance, Internet access and broadband services. We strive to maintain our customer relationships by, among other things, bundling our service offerings to provide our customers with a complete offering of integrated communications services. As a result of increased bundling of our local exchange and long distance service offerings, beginning in 2006, we have combined the revenues of such offerings into a category entitled “Voice.” Prior periods have been restated to insure comparability.
Our operating revenues for our products and services include the following components:
| Year ended December 31, | 2006 | 2005 | 2004 | |||||||||
| (Dollars in thousands) | ||||||||||||
| Voice | $ | 860,741 | 892,272 | 903,025 | ||||||||
| Network access | 878,702 | 959,838 | 966,011 | |||||||||
| Data | 351,495 | 318,770 | 275,777 | |||||||||
| Fiber transport and CLEC | 149,088 | 115,454 | 74,409 | |||||||||
| Other | 207,704 | 192,918 | 188,150 | |||||||||
| Total operating revenues | $ | 2,447,730 | 2,479,252 | 2,407,372 | ||||||||
For a description of each of the sources of revenues, see Management’s Discussion and Analysis of Financial Condition and Results of Operations — Operating Revenues.
Interexchange carriers and other accounts receivable on the balance sheets are primarily amounts due from various long distance carriers, principally AT&T, and several large local exchange operating companies.
(19) COMMITMENTS AND CONTINGENCIES
Construction expenditures and investments in vehicles, buildings and equipment during 2007 are estimated to be $325 million. We generally do not enter into firm, committed contracts for such activities.
InBarbrasue Beattie and James Sovis, on behalf of themselves and all others similarly situated, v. CenturyTel, Inc., filed on October 28, 2002, in the United States District Court for the Eastern District of Michigan (Case No. 02-10277), the plaintiffs allege that we unjustly and unreasonably billed customers for inside wire maintenance services, and seek unspecified monetary damages and injunctive relief under various legal theories on behalf of a purported class of over two million customers in our telephone markets. On March 10, 2006, the Court certified a class of plaintiffs and issued a ruling that the billing descriptions we used for these services during an approximately 18-month period between October 2000 and May 2002 were legally insufficient. We have appealed this class certification decision, although we cannot predict the length of time
A-63
Table of Contents
before this appeal will be adjudicated. Our preliminary analysis indicates that we billed less than $9 million for inside wire maintenance services under the billing descriptions and time periods specified in the District Court ruling described above. Should other billing descriptions be determined to be inadequate or if claims are allowed for additional time periods, the amount of our potential exposure could increase significantly. The Court’s order does not specify the award of damages, the scope and amounts of which, if any, remain subject to additional fact-finding and resolution of what we believe are valid defenses to plaintiff’s claims. Accordingly, we cannot reasonably estimate the amount or range of possible loss at this time. However, considering the one-time nature of any adverse result, we do not believe that the ultimate outcome of this litigation will have a material adverse effect on our financial position or on-going results of operations.
The Telecommunications Act of 1996 allows local exchange carriers to file access tariffs on a streamlined basis and, if certain criteria are met, deems those tariffs lawful. Tariffs that have been “deemed lawful” in effect nullify an interexchange carrier’s ability to seek refunds should the earnings from the tariffs ultimately result in earnings above the authorized rate of return prescribed by the FCC. Certain of our telephone subsidiaries file interstate tariffs with the FCC using this streamlined filing approach. Since July 2004, we have recognized billings from our tariffs as revenue since we believe such tariffs are “deemed lawful.” For those billings from tariffs prior to July 2004, we initially recorded as a liability our earnings in excess of the authorized rate of return, and may thereafter recognize as revenue some or all of these amounts at the end of the applicable settlement period or as our legal entitlement thereto becomes certain. As of December 31, 2006, the amount of our earnings in excess of the authorized rate of return reflected as a liability on the balance sheet for the 2003/2004 monitoring period aggregated approximately $43 million. The settlement period related to the 2003/2004 monitoring period lapses on September 30, 2007.
As discussed above in Note 15, we received approximately $122.8 million in cash from the dissolution of the Rural Telephone Bank (“RTB”). Some portion of the gain recognized in connection with the receipt of these proceeds, while not estimable at this time, is currently or may be subject to review by regulatory authorities which may result in us recording a regulatory liability.
In March 2006, we filed a complaint against AT&T Corp. and AT&T Communications, Inc. (collectively, “AT&T”) in the United States District Court for the District of New Jersey. This lawsuit currently includes 24 other local exchange company plaintiffs. Our complaint seeks recovery from AT&T of unpaid and underpaid access charges for calls made using AT&T’s prepaid calling cards and calls that used Internet Protocol (“IP”) for a portion of their transmission. We believe AT&T improperly classified certain of the prepaid calling card calls as interstate traffic rather than intrastate traffic, thereby depriving us of the higher access rates associated with intrastate calls. We also believe that AT&T improperly classified the calls that used IP for a portion of their transmission as local calls, thereby depriving us of access rates entirely. AT&T has filed a counterclaim against us, asserting that we improperly billed AT&T terminating intrastate access
A-64
Table of Contents
charges on certain wireless roaming traffic. At this time, the likely outcome of these cases cannot be predicted, nor can a reasonable estimate of the amount of recovery or payment, if any, be made. Accordingly, we have not recognized any amounts with respect to these matters in our consolidated financial statements.
From time to time, we are involved in other proceedings incidental to our business, including administrative hearings of state public utility commissions relating primarily to rate making, actions relating to employee claims, occasional grievance hearings before labor regulatory agencies and miscellaneous third party tort actions. The outcome of these other proceedings is not predictable. However, we do not believe that the ultimate resolution of these other proceedings, after considering available insurance coverage, will have a material adverse effect on our financial position, results of operations or cash flows.
* * * * * * * * *
CENTURYTEL, INC.
Consolidated Quarterly Income Statement Information
(Unaudited)
(Unaudited)
| First | Second | Third | Fourth | |||||||||||||
| quarter | quarter | quarter | quarter | |||||||||||||
| (Dollars in thousands, except per share amounts) | ||||||||||||||||
| (unaudited) | ||||||||||||||||
| 2006 | ||||||||||||||||
| Operating revenues | $ | 611,291 | 608,907 | 619,837 | 607,695 | |||||||||||
| Operating income | $ | 157,924 | 164,993 | 168,942 | 173,679 | |||||||||||
| Net income | $ | 69,260 | 152,210 | 76,324 | 72,233 | |||||||||||
| Basic earnings per share | $ | .57 | 1.32 | .66 | .63 | |||||||||||
| Diluted earnings per share | $ | .55 | 1.26 | .64 | .62 | |||||||||||
| 2005 | ||||||||||||||||
| Operating revenues | $ | 595,282 | 606,413 | 657,085 | 620,472 | |||||||||||
| Operating income | $ | 176,860 | 185,882 | 201,242 | 172,419 | |||||||||||
| Net income | $ | 79,616 | 85,118 | 91,411 | 78,334 | |||||||||||
| Basic earnings per share | $ | .60 | .65 | .70 | .60 | |||||||||||
| Diluted earnings per share | $ | .59 | .64 | .68 | .59 | |||||||||||
| 2004 | ||||||||||||||||
| Operating revenues | $ | 593,704 | 603,555 | 603,879 | 606,234 | |||||||||||
| Operating income | $ | 183,557 | 189,911 | 190,869 | 189,616 | |||||||||||
| Net income | $ | 83,279 | 83,284 | 86,192 | 84,489 | |||||||||||
| Basic earnings per share | $ | .58 | .60 | .64 | .63 | |||||||||||
| Diluted earnings per share | $ | .57 | .59 | .63 | .62 | |||||||||||
The first, second and third quarters of 2006 have been adjusted to reflect the application of SAB 108 (see Note 1 for additional information).
A-65
Table of Contents
The fourth quarter of 2006 included an $11.7 million pre-tax charge related to the impairment of certain non-operating investments.
The second quarter of 2006 included a $117.8 million pre-tax gain recorded upon the redemption of Rural Telephone Bank stock and a $6.4 million net tax benefit due to the resolution of various income tax audit issues.
The fourth quarter of 2005 included a $6.3 million pre-tax charge related to the impairment of a non-operating investment.
The third quarter of 2005 included the following amounts presented on a pre-tax basis: (i) the recognition of $35.9 million of revenue as the settlement period related to the 2001/2002 monitoring period lapsed; (ii) $5.8 million of expenses related to Hurricanes Katrina and Rita; (iii) a $9.9 million charge related to the impairment of a non-operating investment; and (iv) a $3.5 million gain on the sale of a separate non-operating investment.
* * * * * * * * *
A-66
Table of Contents
 | ||||||
| [BARCODE GRAPHIC] | MR A SAMPLE | 000004 | ||||
| DESIGNATION (IF ANY) | ||||||
| ADD 1 | ||||||
| ADD 2 | ||||||
| ADD 3 | ||||||
| ADD 4 | ||||||
| ADD 5 | ||||||
| ADD 6 | ||||||
| [BARCODE GRAPHIC] | ||||||
Using ablack ink pen, mark your votes with anX as shown in this example. Please do not write outside the designated areas. | x | |
[BARCODE GRAPHIC]
| 000000000.000000 ext | 000000000.000000 ext | |
| 000000000.000000 ext | 000000000.000000 ext | |
| 000000000.000000 ext | 000000000.000000 ext |
Electronic Voting Instructions
You can vote by Internet or telephone!
Available 24 hours a day, 7 days a week!
Available 24 hours a day, 7 days a week!
Instead of mailing your proxy, you may choose one of the two voting methods outlined below to vote your proxy.
VALIDATION DETAILS ARE LOCATED BELOW IN THE TITLE BAR.
Proxies submitted by the Internet or telephone must be received by
1:00 a.m., Central Time, on May 10, 2007.
1:00 a.m., Central Time, on May 10, 2007.
 | Vote by Internet | |||
| • | Log on to the Internet and go to | |||
| www.investorvote.com | ||||
| • | Follow the steps outlined on the secured website. | |||
 | Vote by telephone | |||
| • | Call toll free 1-800-652-VOTE (8683) within the United States, Canada & Puerto Rico any time on a touch tone telephone. There isNO CHARGEto you for the call. | |||
| • | Follow the instructions provided by the recorded message. | |||
Annual Meeting Proxy Card | 123456 | C0123456789 | 12345 | ||||
6IF YOU HAVE NOT VOTED VIA THE INTERNETOR TELEPHONE, FOLD ALONG THE PERFORATION, DETACH AND RETURN THE BOTTOM PORTION IN THE ENCLOSED ENVELOPE.6
A | To elect four Class I Directors — The Board of Directors recommends a vote FOR all the nominees listed. |
| 1. Nominees: | For | Withhold | For | Withhold | For | Withhold | + | |||||||||||
| 01 — William R. Boles, Jr. | o | o | 02 — W. Bruce Hanks | o | o | 03 — C.G. Melville, Jr. | o | o | ||||||||||
| 04 — Glen F. Post, III | o | o |
B | Proposals — The Board of Directors recommends a vote FOR Item 2 and AGAINST Item 3. |
| For | Against | Abstain | For | Against | Abstain | |||||||||
| 2. To ratify the selection of KPMG LLP as the Company’s independent auditor for 2007. | o | o | o | 3. To act upon a shareholder proposal regarding executive compensation. | o | o | o | |||||||
| 4. In their discretion to vote upon such other business as may properly come before the Meeting. |
C | Non-Voting Items | |
| Change of Address— Please print new address below. | ||
D | Authorized Signatures — This section must be completed for your vote to be counted. — Date and Sign Below |
Please sign exactly as name appears on the certificate or certificates representing shares to be voted by this proxy. When signing as executor, administrator, attorney, trustee or guardian, please give full title as such. If a corporation, please sign in full corporate name by president or other authorized officer. If a partnership, please sign in partnership name by authorized persons.
| Date (mm/dd/yyyy) — Please print date below. | Signature 1 — Please keep signature within the box. | Signature 2 — Please keep signature within the box. | ||
| / / |
| [BARCODE GRAPHIC] | C 1234567890 JNT |  | ||||||
| 4 2 A V 0 1 2 2 5 7 1 | + |
Table of Contents
KEY FOR EXPLANATION OF VOTING RIGHTS TVS —TOTAL VOTING SECURITIES, INCLUDING DIVIDEND REINVESTMENT AND/OR EMPLOYEE STOCK PURCHASE PLAN(S) 1VT— ONE-VOTE TOTAL 10VT— TEN-VOTE TOTAL VOTE— TOTAL VOTES TO WHICH YOU ARE ENTITLED NOTE: TO DETERMINE THE TOTAL NUMBER OF 10-VOTE SHARES, DIVIDE THE 10VT AMOUNT BY TEN (10). | ||||
6IF YOU HAVE NOT VOTED VIA THE INTERNETOR TELEPHONE, FOLD ALONG THE PERFORATION, DETACH AND RETURN THE BOTTOM PORTION IN THE ENCLOSED ENVELOPE.6
Proxy — CenturyTel, Inc.
THIS PROXY IS SOLICITED ON BEHALF OF THE BOARD OF DIRECTORS
The undersigned hereby constitutes and appoints Glen F. Post, III or Stacey W. Goff, or either of them, proxies for the undersigned, with full power of substitution, to represent the undersigned and to cast the number of votes attributable to all of the shares of common stock and voting preferred stock (collectively, the “Voting Shares”) of CenturyTel, Inc. (the “Company”) that the undersigned is entitled to vote at the annual meeting of shareholders of the Company to be held on May 10, 2007, and at any and all adjournments thereof (the “Meeting”).
The Board of Directors recommends that you vote FOR the Items 1 and 2 and AGAINST Item 3 listed on the reverse side hereof. In addition to serving as a Proxy, this card will also serve as instructions to Computershare Investor Services, LLC (the “Agent”) to cast in the manner designated on the reverse side hereof the number of votes allocable to the undersigned, if any, that are attributable to shares of the Company’s common stock held as of March 23, 2007 in the name of the Agent and credited to any plan account of the undersigned in accordance with the Company’s dividend reinvestment plan. Upon timely receipt of this Proxy, properly executed, all of the votes attributable to your Voting Shares, including any held in the name of the Agent, will be voted as specified. If this Proxy is properly executed but no specific directions are given, all of your votes will be voted for items 1 and 2 and against item 3.
(Please See Reverse Side)