

Disclaimer These materials serve as a limited supplement to a verbal presentation at the 2017 Sohn Investment Conference. This document is not an investment recommendation or an offer to sell, nor a solicitation of an offer to buy any security of Corvex Management LP or any other investment product or service. The information and opinions contained in this document are for the purpose of providing background information only, do not purport to be full or complete and do not constitute investment advice. No reliance should be placed, for any purpose, on the information or opinions contained in this document or their accuracy or completeness. No representation, warranty or undertaking, express or implied, is given as to the accuracy or completeness of the information or opinions contained in this document by Corvex or by its directors, officers, partners, employees or affiliates and no liability is accepted by any of the foregoing for the accuracy or completeness of any such information or opinions.Securities or investment ideas are presented to illustrate Corvex’s typical research process and not to suggest or show profitability of any or all transactions. There should be no assumption that any specific securities identified and described herein were or will be profitable. Corvex owns or may own, or has or may have short positions in, securities of or related to issuers mentioned herein, and Corvex may initiate, increase, decrease, exit, or otherwise hedge positions in such securities. Except where otherwise indicated herein, the information provided herein is based on matters as they exist as of the date of preparation, and may not be updated or otherwise revised to reflect information that subsequently becomes available, or circumstances existing or changes occurring after the date hereof. Figures provided are rounded as applicable. Information contained herein is believed to be substantially accurate and/or derived from sources which Corvex believes to be reliable; however Corvex disclaims any and all liability as to the completeness or accuracy of the information contained herein and for any omissions of material facts. Certain statements in these materials are forward-looking and based on expectations, estimates and assumptions regarding business and performance of the issuers mentioned herein. Therefore such statements are inherently susceptible to change and actual results of the issuers may vary materially from the statements made due to factors including, without limitation, government regulation, competition from other businesses, economic, strategic, social and political conditions and other unforeseen circumstances. Trade names, trademarks, service marks and logos herein are the property of their respective owners who retain all proprietary rights over their use.

Corvex Background Concentrated, value‐based investing strategy across the capital structureActive investing to create asymmetric risk / reward opportunitiesFocus on investing in high quality businesses undergoing change in industries with positive secular tailwindsLong‐term investment horizon, concentrated portfolio, and industry expertise enable us to conduct heavy diligence and focus our full energy on each investmentKnowledge‐based and experienced approach to partnering with management and other constituents to create shareholder value

Historical Context First Corvex 13D: AboveNet, Inc. (ABVT) in December 2011ABVT acquired by Zayo in March 2012 for $84.00 per share in cash, +40.6% from 13D filing2013 Sohn Investment Conference: presented tw telecom, inc. (TWTC) and Level 3 Communications, Inc. (LVLT)TWTC acquired by LVLT in June 2014 for $40.86 in stock, +50.3% from Ira Sohn 2013LVLT stock had appreciated to $44.09 the day prior to TWTC deal announcement, +90.0% from Ira Sohn 2013October 2016: CenturyLink, Inc. (CTL) announces acquisition of LVLT for $66.50 in cash and stock, +186.5% from Ira Sohn 2013

RegionalNetworks: Looking Glass Source: Company filings, Capital IQ, news reports, and Zayo Investor Presentation dated 3/12/13. National Networks: Industry Landscape – 2005

Source: Company filings, Capital IQ, news reports and Zayo Investor Presentation dated 3/12/13. Industry Landscape – Ira Sohn 2013 RegionalNetworks: National Networks: Net consolidation of over 45 standalone companies since 2005…
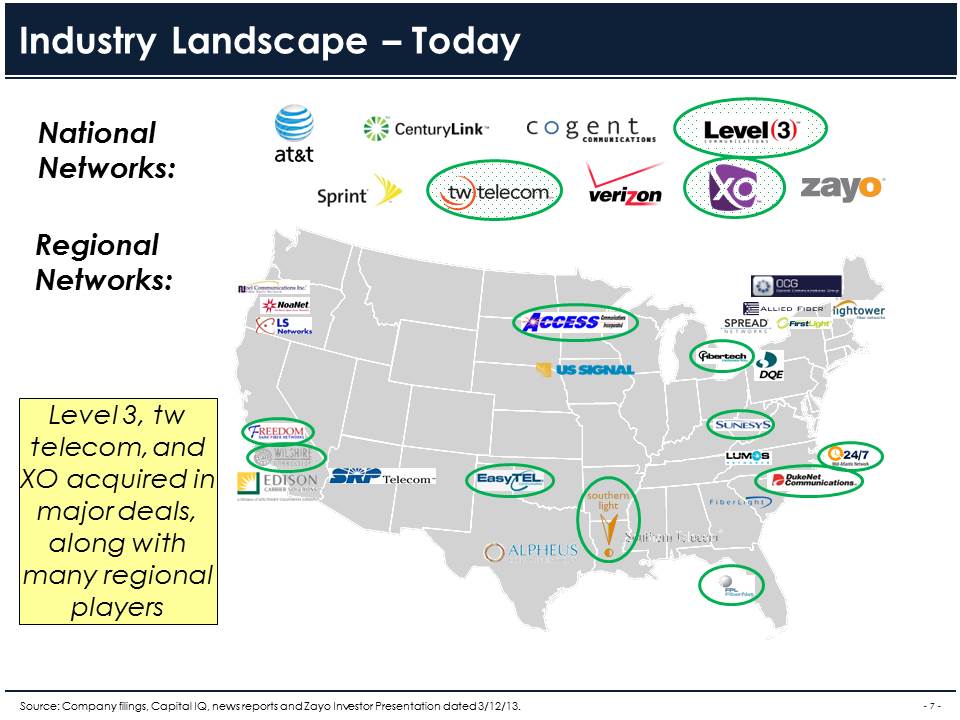
Source: Company filings, Capital IQ, news reports and Zayo Investor Presentation dated 3/12/13. Industry Landscape – Today RegionalNetworks: National Networks: Level 3, tw telecom, and XO acquired in major deals, along with many regional players

Significant Growth in Demand for Data Source: Cisco VNI. 1000x Traffic Per Internet User Over The Last 20 Years 4x IP Traffic Growth2010-2015 7x Mobile Traffic Growth2016-2021 (47% CAGR) 2x Business IP Traffic Growth2015-2020 (18% CAGR) 2016 annual run-rate (1 Zettabyte) of Global IP Traffic took ~40 years to achieve – projected to more than double by 2020 ’14E(in ’09) ‘14 ‘15 ’20E

Company CenturyLink, Inc. (CTL) Level 3 Communications, Inc. (LVLT) Business Description Integrated communications company providing services to residential and business customers Leading global facilities-based provider of integrated communications services Customer Mix 64% enterprise & wholesale, 36% consumer 100% enterprise & wholesale Strategic Mix ~46% ~68% CEO Glen Post, III Jeff Storey HQ Monroe, LA Denver, CO Company Overview Source: Bloomberg, company filings, Corvex estimates. Strategic revenue mix as of 2016 (estimated for LVLT, which does not disclose Strategic and Legacy revenue categories) and based on total revenues. Corvex owns >28mm shares and share equivalents of CTL (>5% of the company), making us its largest non-index fund shareholder
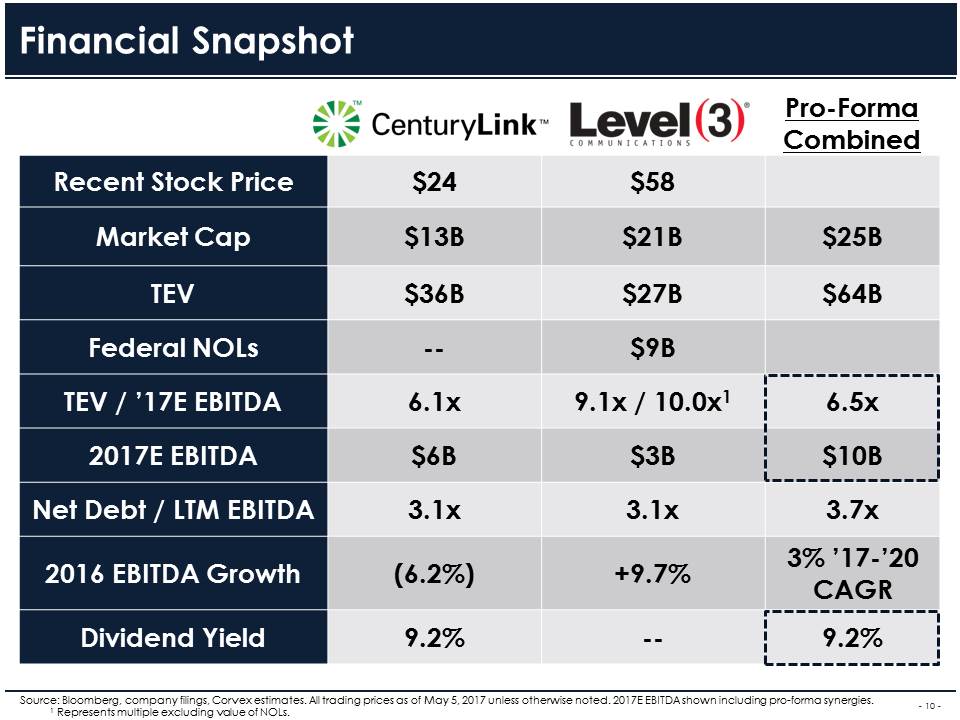
Pro-FormaCombined Recent Stock Price $24 $58 Market Cap $13B $21B $25B TEV $36B $27B $64B Federal NOLs -- $9B TEV / ’17E EBITDA 6.1x 9.1x / 10.0x1 6.5x 2017E EBITDA $6B $3B $10B Net Debt / LTM EBITDA 3.1x 3.1x 3.7x 2016 EBITDA Growth (6.2%) +9.7% 3% ’17-’20 CAGR Dividend Yield 9.2% -- 9.2% Financial Snapshot Source: Bloomberg, company filings, Corvex estimates. All trading prices as of May 5, 2017 unless otherwise noted. 2017E EBITDA shown including pro-forma synergies. 1 Represents multiple excluding value of NOLs.

Both Companies Have a Rich M&A History Source: Bloomberg, company filings.

Investment Thesis Level 3 merger creates: (i) free cash flow accretion and a secure dividend payout, (ii) an enhanced EBITDA outlook including growth through cost synergies, and (iii) an improved revenue trajectoryFurther, we see an opportunity for a stronger combined management team and Board of Directors befitting a global leader with unique scale in enterprise communicationsAttractive entry point now due to stock overhangs which should continue to ease in the coming monthsLong-term path of improving business mix, financial growth profile, and management strength should lead to multiple expansionCompany benefits from increasing U.S. business confidence, new infrastructure spending, and corporate tax reform With a 9.2% dividend yield and >130% coverage (and rising), we see CenturyLink as a credit investment with equity upside

Returns Summary We see 40% returns in a base case including dividends, with ~50-70% upside potential including the benefits of corporate tax reform +43% ~70% Source: Bloomberg, Corvex estimates.

Put Your Best Athletes on the Field Glen Post has grown CTL from a local access line provider into a diversified global communications leader through large-scale M&A, culminating in the Level 3 merger – he brings a deep understanding of the company, its history, and its successful evolutionJeff Storey brings large enterprise expertise and operational experience managing a mix of growing and legacy businesses with the goal of maximizing FCF per share and net present valueWe believe both Glen Post and Jeff Storey need to be executive officers of the new companyWe commend the CTL Board of Directors for this transaction, and call on all stakeholders to come up with a plan that makes this happen and ultimately guarantees thoughtful succession After the closing of a transformational merger for both CenturyLink and Level 3, shareholders are counting on management and the board to nail the execution of a large, complex integration process

Summary Deal Terms Source: CenturyLink / Level 3 merger presentation, Bloomberg, Corvex estimates. Multiples shown at announcement. Consideration@ Announcement $66.50 per LVLT Share (60% Stock / 40% Cash); Fixed Exchange Ratio - 1.4286x PF Ownership 51% CenturyLink / 49% Level 3 Board of Directors CTL to appoint 4 LVLT directors at close x’16A EBITDA 11.7x / 10.8x incl. NOL x’17E EBITDA 11.2x / 10.3x incl. NOL PF Net Leverage 3.7x Expected Close Third Quarter 2017

Attractive Merger CenturyLink / Level 3 merger creates unique scale and focus in the enterprise communications space, with strong strategic rationale, significant operating and capital synergies, and unique tax benefits Source: CenturyLink / Level 3 merger presentation.

Merger Creates Long-Term Dividend Security for CTL The Level 3 merger secures CenturyLink’s dividend for the long-term, with a sustainable payout ratio in the 70% range Source: Company filings, Corvex estimates. Absent a deal, we believe CTL’s payout ratio could have exceeded 100% as soon 2018, with further deterioration over time

Free Cash Flow Accretion Source: Company filings, Corvex estimates. Dividend payout ratio improves dramatically due to massive free cash flow accretion, driven by operating cost and capital synergies, and accelerated utilization of LVLT’s $9 billion of Federal NOLs $850mm of operating cost savings, which we believe could exceed $1B based on precedent transactions$125mm of capital synergies, with additional revenue growth benefit from avoidance of duplicative capex$9B of NOLs, with ~$650mm free cash flow benefit each year

Enhanced EBITDA Growth Source: Company filings, Corvex estimates. Growth rates pro-forma for recent data center sale. EBITDA growth improves from declines at legacy CTL to low single-digit growth at the new pro-forma company, driven by LVLT’s stronger business mix and significant synergies between the two companies Investors do not need to believe in change in underlying business driversCTL mgmt projects MSD EBITDA growth per proxy, but has missed guidance repeatedly

Improved Revenue Trajectory Similarly, revenue trajectory improves from declines to stabilization, and ultimately we believe the pro-forma company can inflect to positive growth in the next three years as legacy products attrit and next generation revenue streams continue to grow Source: Company filings, Corvex estimates. 2017 and 2018 growth rates pro-forma for recent data center sale. Revenue mix figures do not sum to 100% due to Data Integration and Other.

Long-Term Multiple Expansion Long-term path of improving business mix, a more attractive financial growth profile, and an enhanced management team and board should lead to multiple expansion over time Source: Bloomberg, company filings, Corvex estimates. Transaction values shown represent values at announcement per companies. Other telecommunications companies trade at significantly higher multiples, driven in part by stronger growth prospects ($34B) ($3B) ($7B) ($3B)

Dividend Coverage Shaky Strong 2018E Dividend Payout Ratio 108% and rising 77% and declining Revenue Trajectory Declining Stable and inflecting EBITDA Trajectory Declining Growing Enterprise & Wholesale Mix 64% 76% Federal NOLs Minimal ~$9 billion Management, Board of Directors, and Succession Plan Deficiencies Opportunities Pre-Deal vs. Post-Deal Comparison Source: Bloomberg, company filings, Corvex estimates, CenturyLink / Level 3 merger presentation.

Level 3 Shareholder Returns Since Jeff Storey became CEO of Level 3 in April 2013, shareholders have earned a total return of ~175% (28% IRR / 2.7x MOIC) and outperformed the S&P 500 index by 125% Source: Bloomberg. May ‘13: Corvex at Ira Sohn June ‘14: TWTC Acquisition Oct. ‘16: CenturyLink Merger

Total Revenue $6,313mm $8,270mm +$2.0bn Adjusted EBITDA $1,624mm $2,970mm $1.3bn EBITDA % Margin 25.7% 35.9% +1019bps Free Cash Flow ($47mm) $1,130mm $1.2bn Enterprise Mix 57% 70%+ Share Price $21.00 $66.50 +3x Market Cap $4.8bn $24.2bn +5x Jeff Storey’s Track Record 2013 2017E Source: Bloomberg, company filings. ’13-’17 ∆

“Profitable Growth” Playbook Jeff Storey’s promise to shareholders since becoming CEO of Level 3 in April 2013 has been to drive “profitable growth” and maximize free cash flow per share on a risk-adjusted basis “Across the company we remain focused on developing and delivering the right products and services to meet enterprise customers' needs, enhancing our operational efficiency, and continually improving the customer experience, all as a part of our objective to drive profitable growth…While we continue to be disciplined in managing costs, we are also investing in initiatives to improve our operational efficiency as well as in key products and services to drive future revenue growth. In summary we continue to focus our attention on profitable growth, driving adjusted EBITDA, and generating free cash flow.” – Jeff Storey, April 2014

Level 3 Shareholder Returns Source: Bloomberg. CTL includes dividends. LVLT:+174.5% CTL:(12.7%)
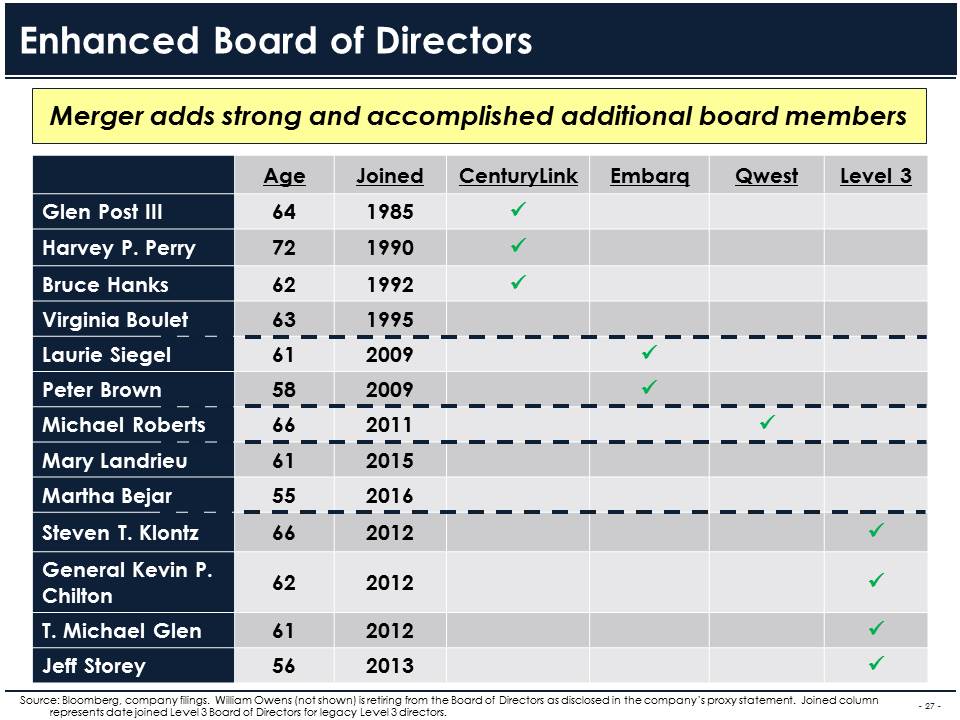
Age Joined CenturyLink Embarq Qwest Level 3 Glen Post III 64 1985 Harvey P. Perry 72 1990 Bruce Hanks 62 1992 Virginia Boulet 63 1995 Laurie Siegel 61 2009 Peter Brown 58 2009 Michael Roberts 66 2011 Mary Landrieu 61 2015 Martha Bejar 55 2016 Steven T. Klontz 66 2012 General Kevin P. Chilton 62 2012 T. Michael Glen 61 2012 Jeff Storey 56 2013 Enhanced Board of Directors Merger adds strong and accomplished additional board members Source: Bloomberg, company filings. William Owens (not shown) is retiring from the Board of Directors as disclosed in the company’s proxy statement. Joined column represents date joined Level 3 Board of Directors for legacy Level 3 directors.

WHAT IS IT WORTH?

Telco Yield Comparison CTL’s spread to the U.S. ten year is at all-time wides with improving fundamentals and coverage pro-forma for LVLT, whereas VZ and T are at tights with worsening growth and free cash flow Source: Bloomberg.

CTL Stock Price $23.60 ~$31.50 + $2.16 div. EV / ’18E PF EBITDA 6.6x 7.5x ‘18E FCF Multiple 8.4x 11.2x ‘18E Dividend Yield 9.2% 6.9% ‘18E Dividend Spread to 10yr ~680bps ~450bps ‘18E Dividend Spread to Bells ~415bps ~185bps What Is It Worth? We see 40% returns in a base case including dividends, with ~50-70% upside potential including the benefits of corporate tax reform Today Price Target Source: Bloomberg, Corvex estimates.

Tackling the Bear Case Legacy revenue exposuresIncremental / decremental marginsNetwork asset qualityMissed financial guidanceIntegration risk Software Defined Networking (“SDN”) / VirtualizationFrontier We are familiar with the industry bear case, having been negatively pre-disposed to RLECs in the past

Conclusion Credit investment with equity upsideLevel 3 transaction creates: (i) free cash flow accretion and strong dividend coverage, (ii) an enhanced EBITDA outlook including growth through cost synergies, and (iii) improved revenue trajectoryStock overhangs should continue to ease in the coming months, providing near-term catalysts along the wayCompany may be able to unlock additional shareholder value over time through additional M&A, asset optimization, and dark fiber salesCorporate tax reform offers an additional ~10-30% return potential, equating to 50-70% total upside for a relatively predictable business We see 40% upside driven by a secure dividend with growing EBITDA, and long-term multiple expansion through improving business mix and enhanced management and Board leadership

APPENDIX
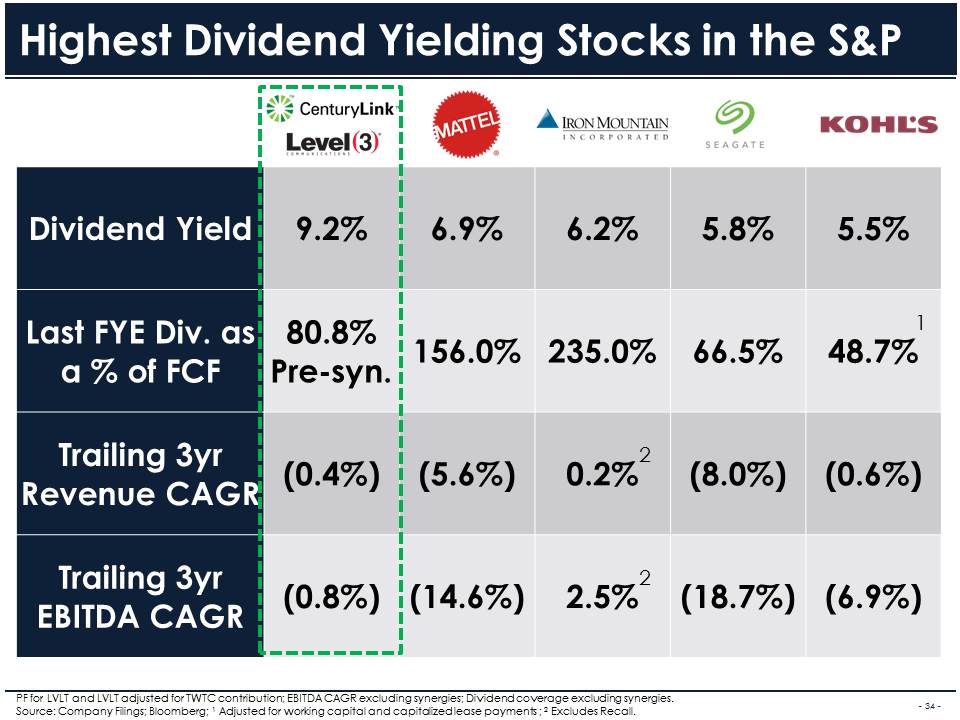
Highest Dividend Yielding Stocks in the S&P Dividend Yield 9.2% 6.9% 6.2% 5.8% 5.5% Last FYE Div. as a % of FCF 80.8%Pre-syn. 156.0% 235.0% 66.5% 48.7% Trailing 3yr Revenue CAGR (0.4%) (5.6%) 0.2% (8.0%) (0.6%) Trailing 3yr EBITDA CAGR (0.8%) (14.6%) 2.5% (18.7%) (6.9%) 1 PF for LVLT and LVLT adjusted for TWTC contribution; EBITDA CAGR excluding synergies; Dividend coverage excluding synergies.Source: Company Filings; Bloomberg; 1 Adjusted for working capital and capitalized lease payments ; 2 Excludes Recall. 2 2

What about the Bells? Dividend Yield 9.2% 5.1% 4.9% ’18E Payout Ratio 76.9% 63.6% 73.3% ’16 – ’19 Revenue CAGR (1.4%) 0.9% (0.2%) ’16 – ’19 EBITDA CAGR 0.5% 1.9% 1.4% ‘18 FCF Yield ~11.5% ~8% ~7% PF for LVLT and LVLT adjusted for TWTC contribution; EBITDA CAGR excluding synergies; Dividend coverage assumes run-rate synergies. Source: Company Filings; Bloomberg; 1 Adjusted for Frontier. 1 1 1

Market Reaction Pre-Deal Post-Deal Since deal announcement on October 31st CTL stock has sold off to a ~$23-$26 per share range, down ~10%-25% from a ~$27-$31 range pre-deal, despite over 20% free cash flow per share accretion Source: Bloomberg. 1Q17Earnings

Frontier Contagion Investors see Frontier’s stock down 57% YTD and 72% in the last year –driven by a disastrous integration process which has resulted in residential customers leaving the company in droves,culminating in a 62% dividend cut last week Source: Bloomberg.

PF TEV / EBITDA 6.5x 6.0x PF Net Debt / EBITDA 3.7x 4.9x ’17-’19 EBITDA CAGR +3% -3% Network Footprint National & Global Regional Enterprise Mix 76% 42% Acquisition Type Corporate Merger Hard Cutover Integration History Strong Poor CEO Tenure 25 years / 4 years 2 years CenturyLink vs. Frontier Comparison Pro-forma CenturyLink / Level 3 differs significantly from Frontier in several key areas, including scale, enterprise mix, financial growth profile, leverage, and integration track record Source: Bloomberg, company filings, Corvex estimates. PF EBITDA based on 2017 figures. EBITDA growth rate pro-forma for data center sale.

Level 3: An Ira Sohn Then And Now Stor(e)y In 2013, we argued Level 3 was transforming from an over-levered, money-losing wholesale provider into a cash flow generative enterprise business with unique network real estate and massive NOLs Source: Corvex Presentation at 2013 Sohn Investment Conference (5/8/13), company filings. Level 3’s multiple expanded from ~6.5x TEV/EBITDA in 2013 to >10x Today (’16A) $27B 3.2x $1.89 $2,343M Valuable Asset