. T
UNITED STATES
SECURITIES AND EXCHANGE COMMISSION
WASHINGTON, DC 20549
FORM 10-Q
(Mark One)
| |
☒ | QUARTERLY REPORT PURSUANT TO SECTION 13 OR 15(d) OF THE SECURITIES EXCHANGE ACT OF 1934 |
For the quarterly period ended September 30, 2023
OR
| |
☐ | TRANSITION REPORT PURSUANT TO SECTION 13 OR 15(d) OF THE SECURITIES EXCHANGE ACT OF 1934 |
For the transition period from ______ to ______
Commission File Number: 333-265588
J.P. Morgan Real Estate Income Trust, Inc.
(Exact Name of Registrant as Specified in its Charter)
| |
Maryland | 87-3439916 |
(State or other jurisdiction of incorporation or organization) | (I.R.S. Employer
Identification No.) |
277 Park Avenue 9th Floor New York, New York | 10172 |
(Address of principal executive offices) | (Zip Code) |
Registrant’s telephone number, including area code: (212) 270-6000
Securities registered pursuant to Section 12(b) of the Act:
| | | | |
Title of each class | | Trading Symbol(s) | | Name of each exchange on which registered |
None | | N/A | | N/A |
Indicate by check mark whether the registrant (1) has filed all reports required to be filed by Section 13 or 15(d) of the Securities Exchange Act of 1934 during the preceding 12 months (or for such shorter period that the registrant was required to file such reports), and (2) has been subject to such filing requirements for the past 90 days. Yes ☒ No ☐
Indicate by check mark whether the registrant has submitted electronically every Interactive Data File required to be submitted pursuant to Rule 405 of Regulation S-T (§232.405 of this chapter) during the preceding 12 months (or for such shorter period that the registrant was required to submit such files). Yes ☒ No ☐
Indicate by check mark whether the registrant is a large accelerated filer, an accelerated filer, a non-accelerated filer, smaller reporting company, or an emerging growth company. See the definitions of “large accelerated filer,” “accelerated filer,” “smaller reporting company,” and “emerging growth company” in Rule 12b-2 of the Exchange Act.
| | | | | | |
Large accelerated filer |
| ☐ |
| Accelerated filer |
| ☐ |
Non-accelerated filer |
| ☒ |
| Smaller reporting company |
| ☒ |
Emerging growth company | | ☒ | | | | |
If an emerging growth company, indicate by check mark if the registrant has elected not to use the extended transition period for complying with any new or revised financial accounting standards provided pursuant to Section 13(a) of the Exchange Act. ☒
Indicate by check mark whether the registrant is a shell company (as defined in Rule 12b-2 of the Exchange Act). Yes ☐ No ☒
As of November 9, 2023, the registrant had 426,458 shares of Class D common stock, 5,144,522 shares of Class I common stock, 54,212 shares of Class S common stock and 6,949,873 shares of Class E common stock $0.01 par value per share. There were no outstanding shares of Class T common stock.
Table of Contents
i
Item 1. Financial Statements.
J.P. Morgan Real Estate Income Trust, Inc.
Consolidated Balance Sheets (Unaudited)
(in thousands, except per share data)
| | | | | | | | |
| | September 30, | | | December 31, | |
| | 2023 | | | 2022 | |
ASSETS | | | | | | |
Investments in real estate, net | | $ | 263,727 | | | $ | 199,429 | |
Investment in real estate debt | | | 16,825 | | | | 16,825 | |
Investments in real estate-related and other securities | | | 2,163 | | | | 1,842 | |
Intangible assets, net | | | 9,693 | | | | 3,767 | |
Cash and cash equivalents | | | 23,601 | | | | 5,660 | |
Restricted cash | | | 197 | | | | 128 | |
Deposits on real estate | | | — | | | | 5,494 | |
Other assets, net | | | 902 | | | | 1,167 | |
Total assets | | $ | 317,108 | | | $ | 234,312 | |
LIABILITIES AND EQUITY | | | | | | |
Credit facility | | $ | — | | | $ | 40,200 | |
Mortgage notes, net | | | 113,624 | | | | 113,760 | |
Intangible liabilities, net | | | 1,714 | | | | 1,800 | |
Mandatorily redeemable instruments | | | 97,079 | | | | 45,784 | |
Due to affiliate | | | 14,054 | | | | 9,970 | |
Accounts payable, accrued expenses and other liabilities | | | 3,863 | | | | 4,852 | |
Total liabilities | | $ | 230,334 | | | $ | 216,366 | |
| | | | | | |
Commitments and Contingencies (Note 17) | | | | | | |
| | | | | | |
Equity | | | | | | |
Common stock- Class D shares, $0.01 par value per share, 600,000 shares authorized, and 324 and 0 issued and outstanding as of September 30, 2023 and December 31, 2022, respectively | | $ | 3 | | | $ | — | |
Common stock- Class I shares, $0.01 par value per share, 600,000 shares authorized, and 4,334 and 57 issued and outstanding as of September 30, 2023 and December 31, 2022, respectively | | | 43 | | | | 1 | |
Common stock- Class S shares, $0.01 par value per share, 600,000 shares authorized, and 54 and 0 issued and outstanding as of September 30, 2023 and December 31, 2022, respectively | | | 1 | | | | — | |
Common stock- Class T shares, $0.01 par value per share, 600,000 shares authorized, and 0 issued and outstanding as of September 30, 2023 and December 31, 2022, respectively | | | — | | | | — | |
Common stock- Class E shares, $0.01 par value per share, 600,000 shares authorized, and 5,640 and 2,361 issued and outstanding as of September 30, 2023 and December 31, 2022, respectively | | | 56 | | | | 24 | |
Preferred stock- $0.01 par value per share, 100,000 shares authorized, 0 issued and outstanding as of September 30, 2023 and December 31, 2022, respectively | | | — | | | | — | |
Additional paid-in capital | | | 101,742 | | | | 19,427 | |
Accumulated deficit | | | (17,204 | ) | | | (3,814 | ) |
Total stockholders' equity | | $ | 84,641 | | | $ | 15,638 | |
Non-controlling interests in consolidated joint ventures | | | 2,133 | | | | 2,308 | |
Total equity | | $ | 86,774 | | | $ | 17,946 | |
Total liabilities and equity | | $ | 317,108 | | | $ | 234,312 | |
The accompanying notes are an integral part of these consolidated financial statements.
2
J.P. Morgan Real Estate Income Trust, Inc.
Consolidated Statements of Operations (Unaudited)
(in thousands, except per share data)
| | | | | | | | | | | | | | | | |
| | Three Months Ended | | | Nine Months Ended | |
| | September 30, | | | September 30, | |
| | 2023 | | | 2022 | | | 2023 | | | 2022 | |
Revenues | | | | | | | | | | | | |
Rental revenue | | $ | 4,774 | | | $ | — | | | $ | 12,634 | | | $ | — | |
Total revenues | | | 4,774 | | | | — | | | | 12,634 | | | | — | |
Expenses | | | | | | | | | | | | |
Rental property operating | | | 1,468 | | | | — | | | | 3,826 | | | | — | |
General and administrative | | | 989 | | | | 1,527 | | | | 3,274 | | | | 1,528 | |
Depreciation and amortization | | | 1,674 | | | | 4 | | | | 6,044 | | | | 4 | |
Total expenses | | | 4,131 | | | | 1,531 | | | | 13,144 | | | | 1,532 | |
Other income (expense), net | | | | | | | | | | | | |
Income from investment in real estate debt | | | 447 | | | | 105 | | | | 1,287 | | | | 105 | |
Loss from investments in real estate-related and other securities | | | (318 | ) | | | — | | | | (366 | ) | | | — | |
Mandatorily redeemable instruments interest costs | | | (1,376 | ) | | | (27 | ) | | | (6,045 | ) | | | (27 | ) |
Interest expense | | | (1,708 | ) | | | (55 | ) | | | (5,632 | ) | | | (55 | ) |
Other income (expenses), net | | | 114 | | | | (152 | ) | | | (11 | ) | | | (153 | ) |
Total other income (expense), net | | | (2,841 | ) | | | (129 | ) | | | (10,767 | ) | | | (130 | ) |
Net loss | | $ | (2,198 | ) | | $ | (1,660 | ) | | $ | (11,277 | ) | | $ | (1,662 | ) |
Net loss attributable to non-controlling interests in consolidated joint ventures | | | (10 | ) | | | — | | | | (89 | ) | | | — | |
Net loss attributable to JPMREIT stockholders | | $ | (2,188 | ) | | $ | (1,660 | ) | | $ | (11,188 | ) | | $ | (1,662 | ) |
Net loss per share of common stock - basic and diluted | | $ | (0.23 | ) | | $ | (1.79 | ) | | $ | (1.63 | ) | | $ | (4.74 | ) |
Weighted-average shares of common stock outstanding - basic and diluted | | | 9,488 | | | | 928 | | | | 6,860 | | | | 351 | |
The accompanying notes are an integral part of these consolidated financial statements.
3
J.P. Morgan Real Estate Income Trust, Inc.
Consolidated Statement of Changes in Equity (Unaudited)
(in thousands, except per share data)
| | | | | | | | | | | | | | | | | | | | | | | | | | | | | | |
| Par Value | | | | | | | | | | | |
| Common Stock Class D | | Common Stock Class I | | Common Stock Class S | | Common Stock Class T | | Common Stock Class E | | Additional Paid-In Capital | | Accumulated Deficit | | Total Stockholder's Equity | | Non-Controlling Interests | | Total Equity | |
Balance at December 31, 2022 | $ | — | | $ | 1 | | $ | — | | $ | — | | $ | 24 | | $ | 19,426 | | $ | (3,813 | ) | $ | 15,638 | | $ | 2,308 | | $ | 17,946 | |
Net loss | | — | | | — | | | — | | | — | | | — | | | — | | | (6,418 | ) | | (6,418 | ) | | (53 | ) | | (6,471 | ) |
Common stock issued | | 1 | | | 17 | | | — | | | — | | | 7 | | | 24,827 | | | — | | | 24,852 | | | — | | | 24,852 | |
Distributions declared on common stock | | — | | | — | | | — | | | — | | | — | | | — | | | (400 | ) | | (400 | ) | | — | | | (400 | ) |
Distribution reinvestments | | — | | | — | | | — | | | — | | | — | | | 60 | | | — | | | 60 | | | — | | | 60 | |
Distributions to non-controlling interests | | — | | | — | | | — | | | — | | | — | | | — | | | — | | | — | | | (4 | ) | | (4 | ) |
Offering costs | | — | | | — | | | — | | | — | | | — | | | (200 | ) | | — | | | (200 | ) | | — | | | (200 | ) |
Stock based compensation | | — | | | — | | | — | | | — | | | — | | | 25 | | | — | | | 25 | | | — | | | 25 | |
Balance at March 31, 2023 | $ | 1 | | $ | 18 | | $ | — | | $ | — | | $ | 31 | | $ | 44,138 | | $ | (10,631 | ) | $ | 33,557 | | $ | 2,251 | | $ | 35,808 | |
Net loss | | — | | | — | | | — | | | — | | | — | | | — | | | (2,582 | ) | | (2,582 | ) | | (26 | ) | | (2,608 | ) |
Common stock issued | | 1 | | | 12 | | | — | | | — | | | 13 | | | 29,104 | | | — | | | 29,130 | | | — | | | 29,130 | |
Distributions declared on common stock | | — | | | — | | | — | | | — | | | — | | | — | | | (760 | ) | | (760 | ) | | — | | | (760 | ) |
Distribution reinvestments | | — | | | — | | | — | | | — | | | — | | | 104 | | | — | | | 104 | | | — | | | 104 | |
Distributions to non-controlling interests | | — | | | — | | | — | | | — | | | — | | | — | | | — | | | — | | | (43 | ) | | (43 | ) |
Offering costs | | — | | | — | | | — | | | — | | | — | | | (326 | ) | | — | | | (326 | ) | | — | | | (326 | ) |
Stock based compensation | | — | | | — | | | — | | | — | | | — | | | 25 | | | — | | | 25 | | | — | | | 25 | |
Balance at June 30, 2023 | $ | 2 | | $ | 30 | | $ | — | | $ | — | | $ | 44 | | $ | 73,045 | | $ | (13,973 | ) | $ | 59,148 | | $ | 2,182 | | $ | 61,330 | |
Net loss | | — | | | — | | | — | | | — | | | — | | | — | | | (2,188 | ) | | (2,188 | ) | | (10 | ) | | (2,198 | ) |
Common stock issued | | 1 | | | 14 | | | 1 | | | — | | | 12 | | | 28,898 | | | — | | | 28,926 | | | — | | | 28,926 | |
Distributions declared on common stock | | — | | | — | | | — | | | — | | | — | | | — | | | (1,043 | ) | | (1,043 | ) | | — | | | (1,043 | ) |
Distribution reinvestments | | — | | | — | | | — | | | — | | | — | | | 176 | | | — | | | 176 | | | — | | | 176 | |
Distributions to non-controlling interests | | — | | | — | | | — | | | — | | | — | | | — | | | — | | | — | | | (39 | ) | | (39 | ) |
Common stock repurchased | | — | | | (1 | ) | | — | | | — | | | — | | | (98 | ) | | — | | | (99 | ) | | — | | | (99 | ) |
Offering costs | | — | | | — | | | — | | | — | | | — | | | (298 | ) | | — | | | (298 | ) | | — | | | (298 | ) |
Stock based compensation | | — | | | — | | | — | | | — | | | — | | | 19 | | | — | | | 19 | | | — | | | 19 | |
Balance at September 30, 2023 | $ | 3 | | $ | 43 | | $ | 1 | | $ | — | | $ | 56 | | $ | 101,742 | | $ | (17,204 | ) | $ | 84,641 | | $ | 2,133 | | $ | 86,774 | |
4
| | | | | | | | | | | | | | | | | | | | | | | | | | | | | | |
| Par Value | | | | | | | | | | | |
| Common Stock Class D | | Common Stock Class I | | Common Stock Class S | | Common Stock Class T | | Common Stock Class E | | Additional Paid-In Capital | | Accumulated Deficit | | Total Stockholder's Equity | | Non-Controlling Interests | | Total Equity | |
Balance at December 31, 2021 | $ | — | | $ | — | | $ | — | | $ | — | | $ | — | | $ | 200 | | $ | — | | $ | 200 | | $ | — | | $ | 200 | |
Net loss(1) | | — | | | — | | | — | | | — | | | — | | | — | | | — | | | — | | | — | | | — | |
Balance at March 31, 2022 | $ | — | | $ | — | | $ | — | | $ | — | | $ | — | | $ | 200 | | $ | — | | $ | 200 | | $ | — | | $ | 200 | |
Net loss(1) | | — | | | — | | | — | | | — | | | — | | | — | | | (2 | ) | | (2 | ) | | — | | | (2 | ) |
Common stock issued | | — | | | — | | | — | | | — | | | 9 | | | 9,073 | | | — | | | 9,082 | | | — | | | 9,082 | |
Balance at June 30, 2022 | $ | — | | $ | — | | $ | — | | $ | — | | $ | 9 | | $ | 9,273 | | $ | (2 | ) | $ | 9,280 | | $ | — | | $ | 9,280 | |
Net loss | | — | | | — | | | — | | | — | | | — | | | — | | | (1,660 | ) | | (1,660 | ) | | — | | | (1,660 | ) |
Offering costs | | — | | | — | | | — | | | — | | | — | | | (4,820 | ) | | — | | | (4,820 | ) | | — | | | (4,820 | ) |
Stock based compensation | | — | | | — | | | — | | | — | | | — | | 19 | | | — | | | 19 | | | — | | | 19 | |
Balance at September 30, 2022 | $ | — | | $ | — | | $ | — | | $ | — | | $ | 9 | | $ | 4,472 | | $ | (1,662 | ) | $ | 2,819 | | $ | — | | $ | 2,819 | |
(1) J.P. Morgan Real Estate Income Trust, Inc. was formed on November 5, 2021 and commenced operations on September 2, 2022, accordingly, there were minimal operations during the three months ended March 31, 2022 and June 30, 2022.
The accompanying notes are an integral part of these consolidated financial statements.
5
J.P. Morgan Real Estate Income Trust, Inc.
Consolidated Statement of Cash Flows (Unaudited) (in thousands)
| | | | | | | | |
| | Nine Months Ended September 30, | |
| | 2023 | | | 2022 | |
Cash flow from operating activities: | | | | | | |
Net loss | | $ | (11,277 | ) | | $ | (1,662 | ) |
| | | | | | |
Adjustments to reconcile net loss to net cash provided by operating activities: | | | | | | |
Depreciation and amortization | | | 6,044 | | | | — | |
Amortization of above market lease | | | 59 | | | | — | |
Amortization of below market lease | | | (89 | ) | | | — | |
Amortization of deferred financing costs | | | 570 | | | | 39 | |
Stock based compensation | | | 69 | | | | 19 | |
Amortization of deferred expense | | | — | | | | 4 | |
Realized loss on sale of real estate related and other securities | | | 654 | | | | — | |
Unrealized loss on treasury note futures contracts | | | 209 | | | | — | |
Unrealized gain on real estate-related and other securities | | | (80 | ) | | | — | |
Redemption value adjustment on mandatorily redeemable instruments | | | 4,138 | | | | 27 | |
Change in assets and liabilities: | | | | | | |
Increase in other assets | | | (280 | ) | | | (354 | ) |
Increase in due to affiliates | | | 3,212 | | | | 1,727 | |
Increase/(decrease) in accounts payable, accrued expenses and other liabilities | | | (2,307 | ) | | | 275 | |
Net cash provided by operating activities | | | 922 | | | | 75 | |
| | | | | | |
Cash flow from investing activities: | | | | | | |
Acquisitions of real estate | | | (67,312 | ) | | | — | |
Capital improvements on real estate | | | (891 | ) | | | — | |
Deposits on real estate acquisition | | | (3,054 | ) | | | (9,436 | ) |
Return of deposits on real estate acquisition | | | 1,800 | | | | — | |
Purchase of investment in real estate debt | | | — | | | | (16,825 | ) |
Variation margin payments | | | (249 | ) | | | — | |
Proceeds from real estate-related and other securities | | | 4,438 | | | | — | |
Purchases of real-estate related and other securities | | | (5,332 | ) | | | — | |
Net cash used in investing activities | | | (70,600 | ) | | | (26,261 | ) |
| | | | | | |
Cash flows from financing activities: | | | | | | |
Proceeds from issuance of common stock | | | 82,869 | | | | 9,082 | |
Repurchase of common stock | | | (99 | ) | | | — | |
Proceeds from issuance of mandatorily redeemable instruments | | | 47,157 | | | | 15,768 | |
Distributions paid on common stock | | | (1,551 | ) | | | — | |
Distributions to non-controlling interests | | | (86 | ) | | | — | |
Proceeds from credit facility | | | — | | | | 4,000 | |
Repayments of credit facility | | | (40,200 | ) | | | — | |
Payment of deferred financing costs on secured credit facility | | | (29 | ) | | | (130 | ) |
Principal repayments of mortgage notes | | | (366 | ) | | | — | |
Payment of deferred financing costs on mortgage notes | | | (7 | ) | | | — | |
Net cash provided by financing activities | | | 87,688 | | | | 28,720 | |
| | | | | | |
Net change in cash, cash equivalents and restricted cash: | | | 18,010 | | | | 2,534 | |
Cash, cash equivalents and restricted cash, at the beginning of the period | | | 5,788 | | | | 200 | |
Cash, cash equivalents and restricted cash, at the end of the period | | $ | 23,798 | | | $ | 2,734 | |
6
J.P. Morgan Real Estate Income Trust, Inc.
Consolidated Statement of Cash Flows (Unaudited) (in thousands)
| | | | | | | | |
| | Nine Months Ended September 30, | |
| | 2023 | | | 2022 | |
Reconciliation of cash, cash equivalents and restricted cash to the Consolidated Balance Sheets: | | | | | | |
Cash and cash equivalents | | $ | 23,601 | | | $ | 2,734 | |
Restricted cash | | | 197 | | | | — | |
Total cash, cash equivalents and restricted cash | | $ | 23,798 | | | $ | 2,734 | |
| | | | | | |
Supplemental disclosure of cash flow information: | | | | | | |
Cash paid for interest | | $ | 5,274 | | | $ | — | |
| | | | | | |
Supplemental disclosure of non-cash investing and financing activities: | | | | | | |
Assumption of working capital in conjunction with acquisition in real estate | | $ | 1,568 | | | $ | — | |
Accrued offering costs due to affiliate | | $ | 785 | | | $ | 4,820 | |
Accrued loan costs due to affiliate | | $ | 7 | | | $ | 354 | |
Accrued distributions | | $ | 312 | | | $ | — | |
Distribution re-investments | | $ | 340 | | | $ | — | |
Accrued acquisition costs | | $ | 36 | | | $ | 1,369 | |
Accrued deposits on real estate acquisitions | | $ | — | | | $ | 250 | |
Accrued capex | | $ | 118 | | | $ | — | |
Reclassification of deposits of real estate to investments in real estate, net | | $ | 6,748 | | | $ | — | |
Reclassfication of pre-acquisition costs to investments in real estate, net | | $ | 216 | | | $ | — | |
Accrued stockholder servicing fee due to affiliate | | $ | 37 | | | $ | — | |
The accompanying notes are an integral part of these consolidated financial statements.
7
J.P. Morgan Real Estate Income Trust, Inc.
Notes to Consolidated Financial Statements (Unaudited)
September 30, 2023
1. Organization and Business Purpose
J.P. Morgan Real Estate Income Trust, Inc. (the “Company” or "JPMREIT") was formed on November 5, 2021 as a Maryland corporation and intends to qualify as a real estate investment trust (“REIT”) for U.S. federal income tax purposes. The Company invests primarily in stabilized, income-generating real estate properties, and to a lesser extent, real estate debt, real estate-related securities and other securities. The Company is the sole general partner of J.P. Morgan REIT Operating Partnership, L.P., a Delaware limited partnership (“JPMREIT OP” or “Operating Partnership”). J.P. Morgan REIT OP Special Limited Partner, L.P. (the “Special Limited Partner”), an affiliate of J.P. Morgan Investment Management Inc. (the “Adviser” or “JPMIM” and together with its affiliates “J.P. Morgan”), owns a special limited partner interest in JPMREIT OP. Substantially all of the Company’s business is conducted through JPMREIT OP. The Company and JPMREIT OP are externally managed by JPMIM.
As of September 30, 2023, the Company owned five real estate properties consisting of three multifamily properties and two industrial properties. The Company also owned one position in a real estate debt investment, an investment in a real estate-related security as well as an investment in a U.S Treasury bond. The Company currently operates in three reportable segments: multifamily, industrial, and investments in real estate debt, real estate-related and other securities. See Note 15 for a description of the Company's segment reporting.
2. Capitalization
On July 6, 2022, the Company filed a Registration Statement on Form S-11 to register with the Securities and Exchange Commission ("SEC") an offering of up to $5.0 billion in shares of common stock, consisting of up to $4.0 billion in shares in its primary offering and up to $1 billion in shares pursuant to its distribution reinvestment plan (the “Offering”). The Registration Statement on Form S-11 related to the Offering was declared effective by the SEC on July 22, 2022. The Company is selling any combination of four classes of shares of its common stock, Class D shares, Class I shares, Class S shares and Class T shares, with a dollar value up to the maximum offering amount. The share classes have different upfront selling commissions and ongoing stockholder servicing fees. The initial per share purchase price for the Company’s shares of common stock sold in its primary offering will be equal to the most recently determined net asset value (“NAV”) per share for the Class E common stock sold in the Company’s private offering (which is deemed to be $10.00 until the last calendar day of the month during which the Company makes its first investment), plus, for Class T shares, Class S shares and Class D shares only, applicable upfront selling commissions and dealer manager fees. Thereafter, the purchase price per share for each class of the Company’s common stock will vary and will generally equal the prior month’s NAV of the Company per share for such class, as determined monthly, plus any applicable upfront selling commissions and dealer manager fees.
On November 15, 2021, the Company was capitalized with a $0.2 million investment by the Adviser in exchange for 20,000 shares of the Company’s Class E common stock. The Adviser has agreed to not sell, transfer or dispose of the shares to any party other than an affiliate of the Adviser for so long as the Adviser or its affiliate performs an advisory function for the Company.
Pursuant to a separate private offering, JPMIM agreed to purchase $25 million in Class E common stock, par value $0.01 per share (“Class E shares”) or Class E units of the Operating Partnership (“Class E units”), or a combination thereof, and up to an additional $75 million in Class E shares or Class E units. JPMIM's commitment to purchase such Class E shares and Class E units from the Company expired in August 2023 and as of September 30, 2023, JPMIM has purchased 369,693 Class E shares and 8,515,771 Class E units. As of September 30, 2023, the Company has received $162.1 million in commitments to purchase shares of its common stock and units in the Operating Partnership (“Operating Partnership units”), including the shares and units to be purchased by JPMIM, and has sold $53.2 million in Class E shares and $88.7 million in Class E units from such commitments (collectively, the “Initial Capitalization”). The Company is not required to call all of the capital commitments made by investors pursuant to the Initial Capitalization prior to their expiration. In addition, the Company sold $2.6 million in Class E shares to employees of the Adviser.
8
JPMIM has agreed to hold all of the Class E shares and Class E units it purchases pursuant to its capital commitment as part of the Initial Capitalization (the “JPM Initial Capitalization”) until the earlier of (i) the first date that the Company’s NAV reaches $1.5 billion and (ii) July 22, 2025, the third anniversary of the commencement of the Offering. Following such date, each month the Company will repurchase, without further action by JPMIM (each, a “JPM Mandatory Repurchase”) (see Note 13), a number of Class E shares or Class E units from JPMIM in an amount equal to the amount available under the Company’s share repurchase plan’s 2% monthly and 5% quarterly caps after satisfying repurchase requests from investors who purchase shares pursuant to the Offering and other holders of shares that are otherwise subject to repurchase under the Company’s share repurchase plan, until such time as the JPM Initial Capitalization has been fully repurchased; provided, that the number of shares subject to each JPM Mandatory Repurchase may be reduced where other holders of the Company’s Class E shares that were issued pursuant to the Initial Capitalization and are not subject to repurchase under the Company’s share repurchase plan request repurchase of their shares, in which case the Class E shares held by JPMIM and such other investors will be repurchased on a pro rata basis based on their respective percentage ownership in the Company immediately prior to such repurchase (not to exceed an aggregate number of shares equal to the amount available under the Company’s share repurchase plan’s 2% monthly and 5% quarterly caps). Notwithstanding the foregoing, the Company will not affect any JPM Mandatory Repurchase during any month in which the full amount of all shares requested to be repurchased by stockholders other than JPMIM under the Company’s share repurchase plan is not repurchased or when the Company’s share repurchase plan has been suspended.
In addition, subject to certain exceptions, where the shares of the Company’s common stock and Operating Partnership units owned by the Adviser, together with any such shares and units owned by the Adviser and its affiliates, including any shares or units issued in lieu of cash management fees payable to the Adviser or the performance participation payable to the Special Limited Partner (such aggregate ownership, the “JPM Interest”) represent a 24.99% or lesser interest in the Company, the Company will, or will cause the JPMREIT OP to, automatically and without further action by the Adviser, repurchase or redeem, as applicable, an amount of shares or units from the Adviser as may be necessary to cause the JPM Interest to remain equal to or less than 24.99% (each such repurchase or redemption, a “JPM Regulatory Repurchase”). To the extent the Adviser elects to receive its management fee in shares of the Company’s common stock or Operating Partnership units, the Company may repurchase those shares or units without regard to the limitations described above or the early repurchase deduction.
On May 26, 2022, JPMIM’s Subscription Agreement dated February 23, 2022 for Class E shares or Class E units was amended to provide that, if the Company receives capital commitments from investors in the private placement of Class E shares exceeding $100 million (“Other Seed Investor Commitments”), JPMIM’s commitment may, in JPMIM’s discretion, be reduced by an amount equal to (i) the aggregate amount of Other Seed Investor Commitments, minus (ii) $100 million, provided that such reduction amount will not exceed $75 million. The amendment to the Subscription Agreement also provided that the expiration of the JPMIM commitment was August 23, 2023, which was the 18-month anniversary of the date of the Subscription Agreement; provided, that following such date JPMIM may, in its discretion, elect to purchase additional Class E shares or Class E units until the earlier to occur of (i) July 22, 2025, the three-year anniversary of the date that the Company’s Registration Statement on Form S-11 with respect to the Offering was declared effective by the SEC and (ii) the date that the Company’s NAV is at least $1.5 billion.
3. Summary of Significant Accounting Policies
Basis of Presentation
The accompanying unaudited consolidated financial statements include the accounts of the Company, and in the opinion of management, include all necessary adjustments, consisting of only normal and recurring items, necessary for a fair statement of the Company’s financial position and results of operations for the interim period. These financial statements have been prepared by the Company in accordance with accounting principles generally accepted in the United States of America (“GAAP”) for interim financial information and the applicable rules and regulations of the SEC. The accompanying unaudited consolidated interim financial statements should be read in conjunction with the Company’s Annual Report on Form 10-K for the year ended December 31, 2022 filed with the SEC on March 29, 2023.
Certain amounts on the Company's three and nine months ended September 30, 2022 Consolidated Statements of Operations have been reclassified to conform to the current period presentation. Such reclassifications had no effect on net loss or previously reported totals or subtotals on the Consolidated Statements of Operations.
All intercompany balances and transactions have been eliminated in consolidation. The preparation of the financial statements in conformity with GAAP requires management to make estimates and assumptions that affect the reported amounts of assets and liabilities and disclosures of contingent assets and liabilities at the date of the balance sheet. Actual results could differ from those estimates.
There is no other comprehensive income (loss) for the three and nine months ended September 30, 2023 and 2022, resulting in comprehensive loss equaling net loss. Accordingly, the statement of other comprehensive income (loss) is not presented.
9
From November 15, 2021 (date of the initial capitalization) through June 30, 2022, the Company had not commenced its principal operations and was focused on its formation and the registration of the Offering. The Offering commenced on July 22, 2022 and the Company commenced principal operations on September 2, 2022 with the acquisition of its first investment.
Principles of Consolidation
The accompanying consolidated financial statements include the accounts of the Company and the Company’s subsidiaries in which the Company has a controlling interest. For consolidated joint ventures, the non-controlling partner’s share of the assets, liabilities and operations of the joint ventures is included in non-controlling interests on the Company's Consolidated Balance Sheets and Consolidated Statements of Operations. The non-controlling partner’s interest is generally computed as the joint venture partner’s ownership percentage.
In determining whether the Company has a controlling financial interest in a partially owned entity and the requirement to consolidate the accounts of that entity, the Company considers whether the entity is a variable interest entity ("VIE") and whether it is the primary beneficiary. The Company is the primary beneficiary of a VIE when it has (i) the power to direct the most significant activities impacting the economic performance of the VIE and (ii) the obligation to absorb losses or receive benefits significant to the VIE. Entities that do not qualify as VIEs are generally considered voting interest entities ("VOEs”) and are evaluated for consolidation under the voting interest model. VOEs are consolidated when the Company controls the entity through a majority voting interest or other means. When the requirements for consolidation are not met and the Company has significant influence over the operations of the entity, the investment is accounted for under the equity method of accounting. Equity method investments for which the Company has not elected a fair value option ("FVO”) are initially recorded at cost and subsequently adjusted for the Company’s pro-rata share of net income, contributions and distributions. When the Company elects the FVO, the Company records its share of net asset value of the entity and any related unrealized gains and losses.
The Operating Partnership is considered to be a VIE. The Company consolidates the Operating Partnership because it has the ability to direct the most significant activities of the entities such as purchases, dispositions, financings, budgets, and overall operating plans. Where the Company does not have the power to direct the activities of the VIE that most significantly impact its economic performance, the Company’s interest for those partially owned entities is accounted for using the equity method of accounting.
The Company holds an interest in two joint ventures that are each considered to be a VIE. The Company consolidated these entities because it has the ability to direct the most significant activities of the joint venture. The total assets and liabilities of the Company’s consolidated VIEs were $129.7 million and $87.6 million and $135.7 million and $89.5 million as of September 30, 2023 and December 31, 2022, respectively. Such amounts are included on the Company’s Consolidated Balance Sheets.
Cash and Cash Equivalents
Cash and cash equivalents represents cash held in banks, cash on hand, cash held in money market funds and liquid investments with original maturities of three months or less. The Company may have bank balances in excess of federally insured amounts; however, the Company deposits its cash and cash equivalents with high credit-quality institutions to minimize credit risk exposure. The Company held $21.9 million in cash equivalents (see Note 9) as of September 30, 2023 and did not hold any cash equivalents as of December 31, 2022.
Restricted Cash
Restricted cash primarily consists of amounts in escrow related to real estate taxes, insurance and utilities in connection with mortgages at certain of the Company’s properties.
Investments in Real Estate
The Company determines whether the acquisition of a property qualifies as a business combination, which requires that the assets acquired and liabilities assumed constitute a business. If the property acquired is not a business, the Company accounts for the transaction as an asset acquisition. All property acquisitions to date have been accounted for as asset acquisitions.
Whether the acquisition of a property acquired is considered a business combination or asset acquisition, the Company recognizes the identifiable tangible and intangible assets acquired, the liabilities assumed, and any non-controlling interest in the acquired entity. In addition, for transactions that are business combinations, the Company evaluates the existence of goodwill or a gain from a bargain purchase. The Company expenses acquisition-related costs associated with business combinations as they are incurred and capitalizes acquisition-related costs associated with asset acquisitions.
10
Upon the acquisition of a property deemed to be an asset acquisition, the Company assesses the fair value of acquired tangible and intangible assets (including land, buildings, tenant improvements, above-market and below-market leases, acquired in-place leases, other identified intangible assets and assumed liabilities) and allocates the purchase price to the acquired assets and assumed liabilities. The Company assesses and considers fair value based on estimated cash flow projections that utilize discount and/or capitalization rates that it deems appropriate, as well as other available market information. Estimates of future cash flows are based on a number of factors including the historical operating results, known and anticipated trends and market and economic conditions.
The fair value of the tangible assets of an acquired property considers the value of the property as if it were vacant. The Company also considers an allocation of purchase price of other acquired intangibles, including acquired in-place leases that may have a customer relationship intangible value, including (but not limited to) the nature and extent of the existing relationship with the tenants, the tenants’ credit quality and expectations of lease renewals.
The cost of buildings and improvements includes the purchase price of the Company’s properties and any acquisition-related costs, along with any subsequent capitalized improvements to such properties.
The Company’s investments in real estate are stated at cost and are generally depreciated on a straight-line basis over the estimated useful lives of the assets as follows:
| | |
Description | | Depreciable Life |
Buildings | | 40 years |
Site improvements - buildings and land | | 4-20 years |
Furniture, fixtures and equipment | | 6-11 years |
Lease intangibles | | Over lease term |
Repairs and maintenance are expensed to operations as incurred and are included in property operating expenses on the Company’s Consolidated Statement of Operations. Significant improvements to properties are capitalized. When assets are sold or retired, their costs and related accumulated depreciation are removed from the accounts with the resulting gains or losses reflected in net income or loss for the period.
The Company records acquired above-market and below-market leases at their fair values (using a discount rate which reflects the risks associated with the leases acquired) equal to the difference between (1) the contractual amounts to be received pursuant to each in-place lease and (2) management’s estimate of fair market lease rates for each corresponding in-place lease, measured over a period equal to the remaining term of the lease for above-market leases and the initial term plus the term of any below-market fixed rate renewal options for below-market leases. Other intangible assets acquired include amounts for in-place lease values that are based on the Company’s evaluation of the specific characteristics of each tenant’s lease. Factors to be considered include estimates of carrying costs during hypothetical expected lease-up periods considering current market conditions, and costs to execute similar leases. In estimating carrying costs, the Company includes real estate taxes, insurance and other operating expenses and estimates of lost rentals at market rates during the expected lease-up periods, depending on local market conditions.
In estimating costs to execute similar leases, the Company considers leasing commissions, legal and other related expenses. The amortization of acquired above-market and below-market leases is recorded as an adjustment to rental revenue on the Company’s Consolidated Statements of Operations. The amortization of in-place leases is recorded as an adjustment to depreciation and amortization expense on the Company’s Consolidated Statements of Operations.
The Company’s management reviews its real estate properties for impairment when there is an event or change in circumstances that indicates an impaired value. Since cash flows on real estate properties considered to be "long-lived assets to be held and used" are considered on an undiscounted basis to determine whether an asset has been impaired, the Company’s strategy of holding properties over the long term decreases the likelihood of recording an impairment loss. If the Company’s strategy changes or market conditions otherwise dictate an earlier sale date, an impairment loss may be recognized and such loss could be material to the Company’s results. If the Company determines that an impairment has occurred, the affected assets must be reduced to their estimated fair value. During the three and nine months ended September 30, 2023, no such impairments occurred.
Investments in Real Estate Debt
The Company’s investment in real estate debt consisted of the Mezzanine Loan (defined below) secured by real estate. The Company elected the FVO for its real estate debt investment. As such, the resulting unrealized gains and losses of such loan is recorded as a component of income from investment in real estate debt on the Company’s Consolidated Statements of Operations. No unrealized gain or loss was recognized for the three and nine months ended September 30, 2023.
11
Interest income from the Company’s investment in real estate debt is recognized over the life of each investment using the effective interest method and is recorded on the accrual basis. Recognition of premiums and discounts associated with these investments is deferred and recorded over the term of the investment as an adjustment to yield. Upfront costs and fees related to items for which the FVO is elected shall be recognized in earnings as incurred and not deferred. Interest income of $0.4 million and $1.3 million was recognized for the three and nine months ended September 30, 2023. Such items are recorded as components of income (loss) from investments in real estate debt on the Company’s Consolidated Statements of Operations.
Investments in Real Estate-Related and Other Securities
The Company’s investments in real estate-related and other securities consist of one commercial mortgage backed security ("CMBS") investment and one United States Government Treasury security ("U.S. Treasury"). The Company has elected to classify its real estate-related and other securities as trading securities, which are recorded at fair value. As such, the Company records changes in fair value and interest income as a component of loss from investments in real estate-related and other securities on the Company’s Consolidated Statements of Operations. An unrealized gain of $0.3 million and $0.08 million and interest income of $0.08 million and $0.2 million was recognized for the three and nine months ended September 30, 2023, respectively. A realized loss of $0.7 million was recognized for the three and nine months ended September 30, 2023 (see Note 6). Accrued interest of less than $0.01 million and less than $0.01 million was recorded in other assets on the Company's Consolidated Balance Sheets as of September 30, 2023 and December 31, 2022, respectively.
Mandatorily Redeemable Instruments
The Company reports its mandatorily redeemable Class E shares and Class E units (collectively the "Mandatorily Redeemable Instruments") as a liability on its Consolidated Balance Sheets at JPMIM’s cash redemption value. JPMIM’s cash redemption value is determined based on the Company's NAV per Class E share or Class E unit as of the Company's balance sheet date. For purposes of determining the Company's NAV, the Company's investments in real estate are recorded at fair value based on third party valuations prepared by licensed appraisers in accordance with standard industry practice. These fair value estimates of the Company's investments in real estate are particularly important as they are used for the calculation of NAV, which determines the adjustment to the carrying value of the Company's Mandatorily Redeemable Instruments. Significant differences in the fair value of the Company's Mandatorily Redeemable Instruments may result from changes in market conditions that cause the Company's NAV, and thus JPMIM’s redemption value, to increase or decrease during the period and is recorded as a component of mandatorily redeemable instruments interest cost on the Company's Consolidated Statements of Operations. Distributions declared on the Mandatorily Redeemable Instruments are recorded as a component of mandatorily redeemable instruments interest cost on the Company's Consolidated Statements of Operations. Declared but unpaid distributions as of September 30, 2023 and December 31, 2022, respectively, were recorded as a liability within accounts payable, accrued expenses and other liabilities on the Company's Consolidated Balance Sheets.
Fair Value Measurements
Under normal market conditions, the fair value of an investment is the amount that would be received to sell an asset or transfer a liability in an orderly transaction between market participants at the measurement date (i.e., the exit price). Additionally, there is a hierarchical framework that prioritizes and ranks the level of market price observability used in measuring investments at fair value. Market price observability is impacted by a number of factors, including the type of investment and the characteristics specific to the investment and the state of the marketplace, including the existence and transparency of transactions between market participants. Investments with readily available active quoted prices or for which fair value can be measured from actively quoted prices generally will have a higher degree of market price observability and a lesser degree of judgment used in measuring fair value. Investments measured and reported at fair value are classified and disclosed in one of the following levels within the fair value hierarchy:
Level 1 — quoted prices are available in active markets for identical investments as of the measurement date. The Company does not adjust the quoted price for these investments.
Level 2 — quoted prices are available in markets that are not active, or model inputs are based on inputs that are either directly or indirectly observable as of the measurement date.
Level 3 — pricing inputs are unobservable and include instances where there is minimal, if any, market activity for the investment.
These inputs require significant judgment or estimation by management or third parties when determining fair value and generally represent anything that does not meet the criteria of Levels 1 and 2. Due to the inherent uncertainty of these estimates, these values may differ materially from the values that would have been used had a ready market for these investments existed.
12
Valuation of assets and liabilities measured at fair value
The Company’s investments in real estate debt, real estate-related and other securities and derivatives are recorded at fair value. The Company generally determines the fair value of its investments by utilizing third-party pricing service providers. In determining the value of a particular real estate-related security, the pricing service providers may use broker-dealer quotations, reported trades or valuation estimates from their internal pricing models to determine the reported price. The pricing service providers’ internal models for real estate-related securities usually consider the attributes applicable to a particular class of security (e.g., credit rating, seniority), current market data, and estimated cash flows for each class and incorporate deal collateral performance such as prepayment speeds and default rates, as available.
Certain of the Company’s investments in real estate debt include loans secured by real estate, such as its mezzanine loan, are unlikely to have readily available market quotations. In such cases, the Company will generally determine the initial value based on the origination amount or acquisition price of such investment if acquired by the Company or the par value of such investment if originated by the Company. Following the initial measurement, the Company will determine fair value by utilizing or reviewing certain of the following inputs (i) market yield data, (ii) discounted cash flow modeling, (iii) collateral asset performance, (iv) local or macro real estate performance, (v) capital market conditions, (vi) debt yield or loan-to-value ratios and (vii) borrower financial condition and performance.
The Company's derivative financial instruments consist of treasury note futures contracts. The fair value of the Company's treasury futures contracts is based on quoted market prices for identical instruments.
The Mandatorily Redeemable Instruments are carried at their cash redemption value as if the units were repurchased or redeemable at the reporting date, which equals NAV per unit at the reporting date.
The carrying amounts of financial instruments such as other assets, accounts payable, accrued expenses and other liabilities approximate their fair values due to the short-term maturities and market rates of interest of these instruments.
The following table details the Company’s assets and liabilities measured at fair value on a recurring basis ($ in thousands):
| | | | | | | | | | | | | | | | | | | | | | | | | | | | | | | | |
| | September 30, 2023 | | | December 31, 2022 | |
| | Level 1 | | | Level 2 | | | Level 3 | | | Total | | | Level 1 | | | Level 2 | | | Level 3 | | | Total | |
Assets: | | | | | | | | | | | | | | | | | | | | | | | | |
Investment in real estate debt | | $ | — | | | $ | — | | | $ | 16,825 | | | $ | 16,825 | | | $ | — | | | $ | — | | | $ | 16,825 | | | $ | 16,825 | |
Investments in real estate-related and other securities | | | 410 | | | | 1,753 | | | | — | | | | 2,163 | | | | — | | | | 1,842 | | | | — | | | | 1,842 | |
Treasury note futures contracts(1) | | | 40 | | | | — | | | | — | | | | 40 | | | | — | | | | — | | | | — | | | | — | |
Total | | $ | 450 | | | $ | 1,753 | | | $ | 16,825 | | | $ | 19,028 | | | $ | — | | | $ | 1,842 | | | $ | 16,825 | | | $ | 18,667 | |
| | | | | | | | | | | | | | | | | | | | | | | | |
Liabilities: | | | | | | | | | | | | | | | | | | | | | | | | |
Mandatorily Redeemable Instruments | | $ | — | | | $ | — | | | $ | 97,079 | | | $ | 97,079 | | | $ | — | | | $ | — | | | $ | 45,784 | | | $ | 45,784 | |
Total | | $ | — | | | $ | — | | | $ | 97,079 | | | $ | 97,079 | | | $ | — | | | $ | — | | | $ | 45,784 | | | $ | 45,784 | |
(1) Included in other assets, net in the Company's Consolidated Balance Sheets.
The following table details the Company’s assets and liabilities measured at fair value on a recurring basis using Level 3 inputs ($ in thousands):
| | | | | | | | |
| | Investment in Real Estate Debt (asset) | | | Mandatorily Redeemable Instruments (liability) | |
Balance at December 31, 2022 | | $ | 16,825 | | | $ | 45,784 | |
Proceeds | | | — | | | | 47,157 | |
Distributions declared | | | — | | | | (1,907 | ) |
Reclassify to distributions payable/paid | | | — | | | | 1,907 | |
Redemption value adjustment | | | — | | | | 4,138 | |
Balance at September 30, 2023 | | $ | 16,825 | | | $ | 97,079 | |
13
The following table contains the quantitative inputs and assumptions used for items categorized in Level 3 of the fair value hierarchy ($ in thousands):
| | | | | | | | | | | | |
| | September 30, 2023 |
| | Fair Value | | | Valuation Technique | | Unobservable Inputs | | Weighted Average Rate | | Impact to Valuation from an Increase in Input |
Assets: | | | | | | | | | | | |
Investment in real estate debt | | $ | 16,825 | | | Discounted cash flow | | Market credit spread | | SOFR(1) + 5.22% | | Decrease |
| | | | | | | | | | | |
Liabilities: | | | | | | | | | | | |
Mandatorily redeemable instruments(2) | | $ | 97,079 | | | Discounted cash flow | | Discount rate/
Exit capitalization rate/Market yield | | 5.26%/
6.79%/
5.96% | | Decrease |
(1) "SOFR" refers to the Secured Overnight Financing Rate. 30-day SOFR at September 30, 2023 was 5.32% per annum.
(2) Mandatorily Redeemable Instruments are carried at the NAV of the Class E units or Class E shares which is determined monthly in accordance with the Company's valuation guidelines.
Valuation of assets and liabilities not measured at fair value
The fair value of the Company’s financial instruments (other than mortgage notes), including cash and cash equivalents and other financial instruments, approximate their carrying or contract value. The fair value of the Company’s indebtedness is estimated by modeling the cash flows required by the Company’s debt agreements and discounting them back to the present value using an appropriate discount rate. Additionally, the Company considers current market rates and conditions by evaluating similar borrowing agreements with comparable loan-to-value ratios and credit profiles. The inputs used in determining the fair value of the Company’s indebtedness are considered Level 3.
The following table presents the carrying value and fair value of financial instruments that are not carried at fair value on the Consolidated Balance Sheets:
| | | | | | | | | | | | | | | | |
| | September 30, 2023 | | | December 31, 2022 | |
| | Carrying Value | | | Fair Value | | | Carrying Value | | | Fair Value | |
Credit Facility | | $ | — | | | $ | — | | | $ | 40,200 | | | $ | 40,200 | |
Mortgage notes(1) | | | 115,471 | | | | 112,995 | | | | 115,838 | | | | 115,838 | |
Total | | $ | 115,471 | | | $ | 112,995 | | | $ | 156,038 | | | $ | 156,038 | |
(1) Mortgage notes carrying value excludes deferred financing costs and mortgage discounts.
Deposits on Real Estate
Deposits paid on real estate purchase contracts are recorded and classified as deposits on real estate on the Company’s Consolidated Balance Sheets until the related real estate purchase is completed. Deposits are reclassified as a component of real estate at the time the deposit is used to offset the acquisition price of the real estate based on the terms of the underlying agreement. To the extent a deposit is non-refundable and the real estate purchase is terminated, the deposit is expensed to other income (expense), net on the Consolidated Statements of Operations. There were no deposits that were written off during the three and nine months ended September 30, 2023. The Company's deposits on real estate totaled $0 million and $5.5 million as of September 30, 2023 and December 31, 2022, respectively. In addition, the Company made a deposit of $1.8 million as a result of entering into an agreement to acquire a property. That agreement was terminated on June 30, 2023, during the due diligence period, and the deposit of $1.8 million was returned during the three months ended September 30, 2023. On July 17, 2023, the Company acquired a pre-leased truck transload facility located within the Savannah, Georgia metropolitan area (the "Truck Transload Facility") at which time total deposits of $6.7 million were reclassified as a component of investments in real estate, net on the Company's Consolidated Balance Sheets.
14
The Company’s deferred charges include financing and leasing costs. Deferred financing costs include legal, structuring and other loan costs incurred by the Company for its financing agreements. Deferred financing costs related to the Company’s mortgage notes are recorded as an offset to the related liability and amortized over the term of the applicable financing instruments as interest expense. Deferred financing costs related to the Company’s Credit Facility (Note 8) are recorded as a component of other assets on the Company’s Consolidated Balance Sheets and amortized over the term of the applicable financing agreement. Deferred leasing costs incurred in connection with new leases, consisting primarily of brokerage and legal fees, are recorded as a component of other assets on the Company’s Consolidated Balance Sheets and amortized over the term of the related lease.
Income Taxes
The Company intends to make an election to be taxed as a REIT under Sections 856 through 860 of the Internal Revenue Code effective January 1, 2023. If the Company qualifies for taxation as a REIT, the Company generally will not be subject to federal corporate income tax to the extent it distributes 90% of its taxable income to its stockholders. REITs are subject to a number of other organizational and operational requirements. Even if the Company qualifies for taxation as a REIT, it may be subject to certain state and local taxes on its income and property, and federal income and excise taxes on its undistributed income.
Revenue Recognition
The Company commences revenue recognition on its leases based on a number of factors, including the initial determination that the contract is or contains a lease. Generally, all of the Company’s contracts are, or contain leases, and therefore revenue is recognized when the lessee takes possession of or controls the physical use of the leased assets. In most instances this occurs on the lease commencement date. At the inception or acquisition of a lease, including new leases that arise from amendments, the Company assesses the terms and conditions of the lease to determine the proper lease classification.
A lease is classified as an operating lease if none of the following criteria are met: (i) ownership transfers to the lessee at the end of the lease term, (ii) the lessee has a purchase option that is reasonably expected to be exercised, (iii) the lease term is for a major part of the economic life of the leased property, (iv) the present value of the future lease payments and any residual value guaranteed by the lessee that is not already reflected in the lease payments equals or exceeds substantially all of the fair value of the leased property, and (v) the leased property is of such a specialized nature that it is expected to have no future alternative use to the Company at the end of the lease term. If one or more of these criteria are met, the lease will generally be classified as a sales-type lease, unless the lease contains a residual value guarantee from a third party other than the lessee, in which case it would be classified as a financing lease under certain circumstances in accordance with ASC 842.
The Company’s rental revenue primarily consists of fixed contractual base rent arising from tenant leases at the Company’s properties under operating leases. Revenue under operating leases that are deemed probable of collection, is recognized as revenue on a straight-line basis over the terms of the related leases. For leases that have fixed and measurable rent escalations, the difference between such rental income earned and the cash rent due under the provisions of the lease is recorded in the Company’s Consolidated Balance Sheets. Management exercises judgment in assessing collectability of leases with revenue for any leases deemed not probable of collection being recognized when cash is collected.
Certain of the Company’s contracts contain non-lease components (e.g., charges for management fees, common area maintenance, reimbursement of third-party maintenance expenses, real estate taxes and insurance) in addition to lease components (i.e., monthly rental charges). Services related to non-lease components are provided over the same period of time as, and billed in the same manner as, monthly rental charges. The Company elected to apply the practical expedient available under ASC 842, for all classes of assets, not to segregate the lease components from the non-lease components when accounting for operating leases. Since the lease component is the predominant component under each of these leases, combined revenues from both the lease and non-lease components are accounted for in accordance with ASC 842 and reported as rental revenues in the Company’s Consolidated Statements of Operations.
Organization and Offering Costs
Organization costs are expensed as incurred and recorded as a component of general and administrative expenses on the Company’s Consolidated Statements of Operations. The Company recognized no organization costs for either the three or nine months ended September 30, 2023. Offering costs are charged to equity as such amounts are incurred. Since inception, the Company recognized $5.6 million and $4.8 million of offering costs as of September 30, 2023 and December 31, 2022, respectively.
The Adviser will advance the Company’s organization and offering costs on behalf of the Company (including legal, accounting, and other expenses attributable to the Company’s organization, but excluding upfront selling commissions, dealer manager fees and stockholder servicing fees) through July 22, 2024, the second anniversary of the commencement of the Offering. The Company will reimburse the Adviser for all such advanced costs ratably over a 60-month period following the second anniversary of the commencement of the Offering.
15
The Adviser and its affiliates incurred organization and offering costs, since inception, on the Company’s behalf of $6.3 million and $5.5 million as of September 30, 2023 and December 31, 2022, respectively. These organization and offering costs were recorded as a component of due to affiliates in the accompanying Consolidated Balance Sheets as of September 30, 2023 and December 31, 2022, respectively. Such costs became the Company’s liability on July 22, 2022, the date on which the Offering commenced.
Operating Expenses
The Adviser will advance on our behalf certain of the Company’s operating expenses through the earlier of (i) the first date that the Company’s NAV reaches $500 million and (ii) December 31, 2024. The Company will reimburse the Adviser for all such advanced operating expenses ratably over the 60 months following such date. Operating expenses incurred directly by the Company are expensed in the period incurred.
The Adviser and its affiliates incurred, since inception, operating expenses on the Company’s behalf totaling $7.3 million and $4.4 million as of September 30, 2023 and December 31, 2022, respectively. These operating expenses were recorded as a component of due to affiliates in the accompanying Consolidated Balance Sheets.
Share Repurchases
The Company has adopted a share repurchase plan, whereby on a monthly basis, stockholders may request that the Company repurchase all or any portion of their shares. The Company may choose to repurchase all, some or none of the shares that have been requested to be repurchased at the end of any particular month, in its discretion, subject to any limitations in the share repurchase plan. The total amount of aggregate repurchases of Class D, Class I, Class S, Class T and Class E shares is limited to 2% of the aggregate NAV per month and 5% of the aggregate NAV per calendar quarter. Shares are repurchased at a price equal to the transaction price on the applicable repurchase date, subject to any early repurchase deduction. Shares that have not been outstanding for at least one year are repurchased at 98% of the transaction price. In the event the Company determines to repurchase some but not all of the shares submitted for repurchase during any month, shares submitted for repurchase during such month will be repurchased on a pro rata basis based on the amount requested after the Company has repurchased all shares for which repurchase was requested due to death, disability or divorce and other limited exceptions. All unsatisfied repurchase requests must be resubmitted after the start of the next month or quarter, or upon the recommencement of the share repurchase plan, as applicable.
Due to the illiquid nature of investments in real estate, the Company may not have sufficient liquid resources to fund repurchase requests and has established limitations on the amount of funds the Company may use for repurchases during any calendar month and quarter. Should repurchase requests, in the Company's judgment, place an undue burden on the Company's liquidity, adversely affect the Company's operations or risk having an adverse impact on the Company as a whole, or should the Company otherwise determine that investing its liquid assets in real properties or other investments rather than repurchasing its shares is in the best interests of the Company as a whole, the Company may choose to repurchase fewer shares in any particular month than have been requested to be repurchased, or none at all. Further, the Company's board of directors may make exceptions to, modify or suspend the Company's share repurchase plan if in its reasonable judgment it deems such action to be in the Company's best interest and the best interests of the Company's stockholders.
Class E share repurchase rights
The Class E shares issued in the Initial Capitalization are not eligible for repurchase pursuant to the share repurchase plan. The Class E shares issued in the Initial Capitalization will only be eligible for repurchase following the earlier to occur of (i) July 22, 2025, the third anniversary of the date the Company commenced the Offering, and (ii) the date that the Company's aggregate NAV is at least $1.5 billion. Following such period, holders of Class E shares (other than the Class E shares and Class E units purchased by JPMIM as part of the Initial Capitalization, which are subject to special terms discussed below) may request that the Company repurchase such holder’s Class E shares on a monthly basis. The Company will repurchase Class E shares at a price per share equal to the most recently determined NAV per Class E share as of the repurchase date.
The aggregate amount of Class E shares that the Company is required to repurchase in any month will be limited to an amount equal to any remaining availability for share repurchases pursuant to the terms and conditions of the share repurchase plan for the Company's Class D, Class I, Class S and Class T shareholders, after the Company has fulfilled all repurchase requests submitted pursuant to the share repurchase plan. In addition, the Company will not repurchase any Class E shares during any period that the share repurchase plan has been suspended.
16
JPMIM class E share and unit repurchases
JPMIM has agreed to hold all of the Class E shares and Class E units it purchased as part of the Initial Capitalization until the earlier of (i) the first date that the Company's NAV reaches $1.5 billion and (ii) July 22, 2025, three years from the commencement of the Offering. Following such date, each month the Company will repurchase, without further action by JPMIM, a number of Class E shares or Class E units from JPMIM in an amount equal to the amount available under the share repurchase plan’s 2% monthly and 5% quarterly caps after satisfying repurchase requests from investors, until such time as the JPM Initial Capitalization has been fully repurchased; provided, that the number of shares subject to each mandatory repurchase may be reduced where other holders of Class E shares that were issued pursuant to the Initial Capitalization and are not subject to repurchase under the share repurchase plan request repurchase of their shares, in which case the Class E shares and Class E units held by JPMIM and such other investors will be repurchased on a pro rata basis based on their respective percentage ownership immediately prior to such repurchase (not to exceed an aggregate number of shares equal to the amount available under the share repurchase plan’s 2% monthly and 5% quarterly caps). Notwithstanding the foregoing, the Company will not affect any mandatory repurchases during any month in which the full amount of all shares requested to be repurchased by stockholders other than JPMIM under the Company's share repurchase plan is not repurchased or when the Company's share repurchase plan has been suspended.
Derivative Instruments
The Company uses derivative financial instruments such as treasury note futures contracts to manage on-going risks from fluctuations in interest rates. The Company records its derivative instruments at fair value and such instruments are reflected in other assets, net or accounts payable, accrued expenses and other liabilities on the Company's Consolidated Balance Sheets. Any changes in the fair value of these derivative instruments are recorded within other income (expenses), net on the Company's Consolidated Statements of Operations (see Note 16).
Earnings Per Share
Basic net loss per share is computed by dividing net loss for the period by the weighted average number of shares of common stock outstanding during the period. Diluted loss per share is computed by dividing net loss for the period by the weighted average number of shares of common stock and common stock equivalents outstanding (unless their effect is anti-dilutive) for the period. For the three and nine months ended September 30, 2023 and 2022, unvested Class E common shares awarded to the Company's independent directors are excluded from the calculation of diluted earnings per share as the inclusion of such potential common shares in the calculation would be anti-dilutive. There were no other potentially dilutive, unissued common shares for the three and nine months ended September 30, 2023 and 2022. The weighted average number of shares of common stock outstanding is identical for both basic and diluted shares.
4. Investments in Real Estate
Investments in real estate, net consisted of the following ($ in thousands):
| | | | | | | | |
| | September 30, 2023 | | | December 31, 2022 | |
Building and building improvements | | $ | 191,201 | | | $ | 147,629 | |
Land and land improvements | | | 73,693 | | | | 49,359 | |
Furniture, fixtures and equipment | | | 3,010 | | | | 2,965 | |
Total | | | 267,904 | | | | 199,953 | |
Accumulated depreciation | | | (4,177 | ) | | | (524 | ) |
Investments in real estate, net | | $ | 263,727 | | | $ | 199,429 | |
Acquisitions
During the nine months ended September 30, 2023, the Company acquired one property, a truck transload facility.
The following table provides details of the property acquired during the nine months ended September 30, 2023 ($ in thousands):
| | | | | | | | | | | | | | |
Property Type | | Purchase Price(1) | | | Number of Transactions | | | Number of Properties | | | Sq. Ft. (in thousands)/Units |
Industrial property | | $ | 75,231 | | | | 1 | | | | 1 | | | 136 sq ft |
(1) Purchase price is inclusive of acquisition-related costs including in-place lease intangible assets, above-market lease intangible assets and tenant improvements.
On July 17, 2023, the Company acquired the Truck Transload Facility for $75.2 million, inclusive of closing costs. The Truck Transload Facility, constructed in 2023, is a Class A logistics facility encompassing 136,240 square feet with 134 doors situated on an approximately 50-acre site.
17
The following table details the purchase price allocation for the property acquired during the nine months ended September 30, 2023 ($ in thousands):
| | | | |
| | For the Nine Months Ended September 30, 2023 | |
Building and building improvements | | $ | 49,663 | |
Land | | | 16,534 | |
In-place lease intangibles | | | 6,323 | |
Above-market lease intangibles | | | 2,037 | |
Tenant Improvements | | | 674 | |
Total purchase price | | | 75,231 | |
Net working capital assumed | | | (1,568 | ) |
Acquisition costs paid by JPMIM | | | (213 | ) |
Net purchase price | | $ | 73,450 | |
5. Investment in Real Estate Debt
The following table details the Company’s investment in real estate debt ($ in thousands):
| | | | | | | | | | | | | | | | | | | | | | | | | | |
| | | | | | | | | | | September 30, 2023 | | | December 31, 2022 | |
Real Estate Debt | | Number of Positions | | | Credit Rating | | Coupon | | Maturity Date | | Cost Basis | | | Fair Value | | | Cost Basis | | | Fair Value | |
Mezzanine loan | | | 1 | | | Not Rated | | SOFR + 5.22% | | September 7, 2024 | | $ | 16,825 | | | $ | 16,825 | | | $ | 16,825 | | | $ | 16,825 | |
On September 2, 2022, the Company acquired a $26.8 million mezzanine loan ("Mezzanine Loan") and, concurrent with the acquisition, sold a $10 million pari passu participation interest to an affiliate of the Adviser. The sale of the participating interest met the criteria to be classified as an accounting sale, and not a financing, as the Company did not retain a controlling interest in the loan. The loan financed the acquisition of a garden-style multifamily property located in Murfreesboro, Tennessee. The Mezzanine Loan is an interest only loan and was fully funded as of the acquisition date. The loan has a stated maturity of September 7, 2024 and includes up to three one-year extension options.
The following table details the amounts recognized for the Company's investment in real estate debt ($ in thousands):
| | | | | | | | | | | | | | | | |
| | Three Months Ended | | | Nine Months Ended | |
| | September 30, | | | September 30, | |
| | 2023 | | | 2022 | | | 2023 | | | 2022 | |
Interest income | | $ | 450 | | | $ | 106 | | | $ | 1,293 | | | $ | 106 | |
Other income (expense), net | | | (3 | ) | | | (1 | ) | | | (6 | ) | | | (1 | ) |
Total income from investment in real estate debt | | $ | 447 | | | $ | 105 | | | $ | 1,287 | | | $ | 105 | |
6. Investments in Real Estate-Related and Other Securities
The following table details the Company’s investments in real estate-related and other securities ($ in thousands):
| | | | | | | | | | | | | | | | | | | | | | | | | | | | |
| | | | | | September 30, 2023 | | | December 31, 2022 | |
Real Estate-Related and Other Securities | | Coupon | | Maturity Date | | Face Amount | | | Cost Basis | | | Fair Value | | | Face Amount | | | Cost Basis | | | Fair Value | |
CMBS | | SOFR + 0.75% | | April 30, 2024 | | $ | 1,812 | | | $ | 1,671 | | | $ | 1,753 | | | $ | 2,000 | | | $ | 1,840 | | | $ | 1,842 | |
U.S. Treasury(1) | | N/A | | March 14, 2024 | | | 420 | | | | 410 | | | | 410 | | | | — | | | | — | | | | — | |
Total real estate-related and other securities | | | | | | $ | 2,232 | | | $ | 2,081 | | | $ | 2,163 | | | $ | 2,000 | | | $ | 1,840 | | | $ | 1,842 | |
18
(1) Includes $0.4 million of securities pledged as collateral related to the treasury note futures contracts.
The following table details the amounts recognized for the Company's investments in real estate-related and other securities ($ in thousands):
| | | | | | | | | | | | | | | | |
| | Three Months Ended | | | Nine Months Ended | |
| | September 30, | | | September 30, | |
| | 2023 | | | 2022 | | | 2023 | | | 2022 | |
Interest income | | $ | 76 | | | $ | — | | | $ | 208 | | | $ | — | |
Unrealized gain | | | 260 | | | | — | | | | 80 | | | | — | |
Realized loss | | | (654 | ) | | | — | | | | (654 | ) | | | — | |
Total loss from investments in real estate-related and other securities | | $ | (318 | ) | | $ | — | | | $ | (366 | ) | | $ | — | |
For the three and nine months period ended September 30, 2023, the Company received proceeds of $4.2 million from a sale of a U.S.Treasury bond with a costs basis of $4.9 million resulting in a realized loss of $0.7 million.
7. Intangibles
The gross carrying amount and accumulated amortization of the Company’s intangible assets and liabilities, not fully amortized, consisted of the following ($ in thousands):
| | | | | | | | |
| | September 30, 2023 | | | December 31, 2022 | |
Intangible assets: | | | | | | |
In-place lease intangibles | | $ | 8,007 | | | $ | 4,311 | |
Above-market lease intangibles | | | 2,037 | | | | — | |
Total intangible assets | | | 10,044 | | | | 4,311 | |
Accumulated amortization: | | | | | | |
In-place lease amortization | | | (292 | ) | | | (544 | ) |
Above-market lease amortization | | | (59 | ) | | | — | |
Total accumulated amortization | | | (351 | ) | | | (544 | ) |
Intangible assets, net | | $ | 9,693 | | | $ | 3,767 | |
Intangible liabilities: | | | | | | |
Below-market lease intangibles | | $ | (1,830 | ) | | $ | (1,828 | ) |
Accumulated amortization: | | | | | | |
Below-market lease amortization | | | 116 | | | | 28 | |
Intangible liabilities, net | | $ | (1,714 | ) | | $ | (1,800 | ) |
The estimated future amortization on the Company’s intangibles for each of the next five years and thereafter as of September 30, 2023 is as follows ($ in thousands):
| | | | | | | | | | | |
| In-place Lease Intangibles | | | Above-market Lease Intangibles | | | Below-market Lease Intangibles | |
2023 (remainder) | $ | 252 | | | $ | 72 | | | $ | (30 | ) |
2024 | | 1,007 | | | | 289 | | | | (118 | ) |
2025 | | 1,007 | | | | 289 | | | | (118 | ) |
2026 | | 1,007 | | | | 289 | | | | (118 | ) |
2027 | | 1,007 | | | | 289 | | | | (118 | ) |
Thereafter | | 3,435 | | | | 750 | | | | (1,212 | ) |
Total | $ | 7,715 | | | $ | 1,978 | | | $ | (1,714 | ) |
The in-place lease intangible amortization is recorded in depreciation and amortization while the above-market intangible amortization and below-market intangible amortization are recorded in rental revenue on the Company's Consolidated Statements of Operations.
As of September 30, 2023, the weighted-average amortization period for both the acquired in-place lease intangibles and above-market lease intangibles was 7 years.
19
8. Mortgage Notes and Credit Facility
Mortgage notes
The following is a summary of the fixed-rate mortgage notes secured by the Company’s properties ($ in thousands):
| | | | | | | | | | | | | | |
| | | | | | | Principal Balance Outstanding | |
Indebtedness | | Interest Rate | | | Maturity Date | | September 30, 2023 | | | December 31, 2022 | |
Caroline West Gray | | | 5.44 | % | | 12/1/2029 | | $ | 45,911 | | | $ | 45,911 | |
Caroline Post Oak | | | 5.44 | % | | 12/1/2029 | | | 40,528 | | | | 40,528 | |
Coda on Centre | | | 4.28 | % | | 5/30/2029 | | | 29,032 | | | | 29,399 | |
Total fixed-rate loans | | | | | | | | 115,471 | | | | 115,838 | |
Deferred financing costs, net | | | | | | | | (1,075 | ) | | | (1,202 | ) |
Mortgage discount, net | | | | | | | | (772 | ) | | | (876 | ) |
Total mortgage notes | | | | | | | $ | 113,624 | | | $ | 113,760 | |
Credit facility
The following is a summary of the Company's Credit Facility (defined below) ($ in thousands):
| | | | | | | | | | | | | | | | |
| | | | | | | | | Principal Balance Outstanding | |
Indebtedness | | Interest Rate | | Maturity Date | | Maximum Facility Size | | | September 30, 2023 | | | December 31, 2022 | |
Credit Facility(1) | | SOFR + 2.45% | | 8/29/2024 | | $ | 8,000 | | | $ | — | | | $ | 40,200 | |
(1) The Credit Facility has a one-year extension of the maturity date at the Company's request.
During 2022, the Company, as initial guarantor, and the Operating Partnership, as initial borrower, entered into a credit agreement (“Credit Agreement”) with U.S. Bank National Association (“U.S. Bank”). The Credit Agreement provided for aggregate commitments of up to $65 million for secured revolving loans and letter of credit issuances, with an accordion feature pursuant to which the Operating Partnership may increase the aggregate commitments up to $150 million, subject to the satisfaction of certain conditions (the "Credit Facility").
Loans outstanding under the Credit Facility bear interest and line of credit fees, at the Operating Partnership's option, at either a relevant Secured Overnight Financing Rate ("SOFR") plus an applicable margin or a "base rate" equal to the higher of (i) zero and (ii) the sum of the Federal Funds Effective Rate plus 0.5% per annum, plus the applicable margin. The applicable margin ranges from 1.55% to 1.65% for borrowings at a relevant SOFR rate determined under the terms of the Credit Facility, 1.55% to 1.65% for borrowings at a relevant "base rate" determined under the terms of the Credit Facility, or 1.55% to 1.65% for lines of credit, in each case, based on the borrowing as defined in the Credit Facility. Loans under the Credit Facility will mature on the earliest of (i) August 31, 2023, (ii) the date an earlier termination pursuant to an event of default specified in the Credit Agreement occurs or (iii) the date of occurrence of other maturity date events specified in the Credit Agreement, unless extended pursuant to the terms of the Credit Agreement. Borrowings under the Credit Facility are secured by the unfunded commitments under the Initial Capitalization.
The Company may extend the maturity date to a business day that is not later than 12 months after the then-effective stated maturity date, no more than twice, upon: (a) delivery by the Company of an extension request at least 30 days, but no more than 60 days, prior to the stated maturity date then in effect; (b) payment of a facility extension fee equal to 0.15% on the then-existing maximum commitment; (c) confirmation that the right to make capital calls of the unfunded commitments under the Initial Capitalization to pay the Credit Facility through and immediately following the extended stated maturity date is in full force and effect; and (d) payment by the Company of all reasonable and documented fees and out-of-pocket expenses to the extent then due.
During the three and nine months ended September 30, 2023, the Company repaid $0 and $40.2 million, respectively, on the Credit Facility. There were $0.0 million and $40.2 million of borrowings outstanding on the Credit Facility as of September 30, 2023 and December 31, 2022, respectively. The carrying value of the Credit Facility approximates the fair value. For the three and nine months ended September 30, 2023, the Company incurred $0.1 million and $0.9 million of interest expense on the Credit Facility,
20
respectively. Net deferred financing costs totaled $0.03 million and $0.3 million as of September 30, 2023 and December 31, 2022, respectively.
On August 25, 2023, the Credit Agreement was amended to (i) extend the maturity date to August 29, 2024, (ii) decrease the aggregate commitments from up to $65 million to up to $8 million and (iii) increase the applicable margin to 2.45%. All other material terms of the Credit Facility remain the same.
Mortgage notes and Credit Facility
The following table details the future principal payments due under the Company’s mortgage notes and Credit Facility as of September 30, 2023 ($ in thousands):
| | | | | | | | | | | | |
Year | | Mortgage Notes | | | Credit Facility | | | Total | |
2023 (remainder) | | $ | 126 | | | $ | — | | | $ | 126 | |
2024 | | | 510 | | | | — | | | | 510 | |
2025 | | | 536 | | | | — | | | | 536 | |
2026 | | | 560 | | | | — | | | | 560 | |
2027 | | | 585 | | | | — | | | | 585 | |
Thereafter | | | 113,154 | | | | — | | | | 113,154 | |
Total future commitments | | $ | 115,471 | | | $ | — | | | $ | 115,471 | |
The Company is subject to various financial and operational covenants under certain of its mortgage notes and the Credit Facility. These covenants require the Company to maintain certain financial ratios, which may include leverage, debt yield, and debt service coverage, among others. As of September 30, 2023, the Company was in compliance with all of its loan covenants that could result in a default under such agreements.
9. Related Party Transactions
The Company and the Operating Partnership entered into an advisory agreement with the Adviser on May 31, 2022, which was amended and restated on May 12, 2023 (the "Advisory Agreement"). Pursuant to the Advisory Agreement, the Adviser is responsible for sourcing, evaluating and monitoring the Company’s investment opportunities and making decisions related to the acquisition, management, financing and disposition of the Company’s assets, in accordance with the Company’s investment objectives, guidelines, policies and limitations, subject to oversight by the Company’s board of directors.
The Adviser and certain of its Affiliates will receive fees and compensation in connection with the ongoing management of the assets of the Company. The Adviser will be paid a management fee equal to 1.00% of NAV per annum, payable monthly. The management fee will be paid, at the Adviser’s election, in cash, Class E Shares, or Class E Operating Partnership units. The Class E shares are not subject to the management fee. The Adviser waived its management fee through December 31, 2022.
The Company, as general partner, and Special Limited Partner entered into the Limited Partnership Agreement of JPMREIT OP on June 3, 2022 as amended on September 20, 2022.
The Special Limited Partner holds a performance participation interest in JPMREIT OP that entitles it to receive an allocation from JPMREIT OP equal to 12.5% of the annual Total Return, subject to a 5% annual Hurdle Amount and a High-Water Mark, with a Catch-Up (each term as defined in the JPMREIT OP limited partnership agreement). Such allocation will be measured on a calendar year basis, made quarterly and accrued monthly. The performance participation interest will not be paid on the Class E Operating Partnership units. For the three and nine months ended September 30, 2023, the Company accrued $0.1 million and $0.2 million relating to the performance participation allocation, respectively, which is disclosed in the due to affiliates table below as accrued performance participation allocation.
See Note 2 for a discussion on the Adviser's investment in the Company.
J.P. Morgan Institutional Investments Inc. (the “Dealer Manager”) serves as the dealer manager for the Offering. The Dealer Manager is a registered broker-dealer affiliated with the Adviser. The Company entered into an agreement (the “Dealer Manager Agreement”) on June 8, 2022 with the Dealer Manager in connection with the Offering.
The Dealer Manager is entitled to receive upfront selling commissions of up to 3.0%, and upfront dealer manager fees of up to 0.5%, of the transaction price of each Class T share sold in the primary offering, however such amounts may vary at certain participating broker-dealers provided that the sum will not exceed 3.5% of the transaction price. The Dealer Manager is entitled to receive upfront selling commissions of up to 3.5% of the transaction price of each Class S share sold in the primary offering. The Dealer Manager is entitled to receive upfront selling commissions of up to 1.5% of the transaction price of each Class D share sold in the primary offering. No upfront selling commissions or dealer manager fees will be paid with respect to purchases of Class I shares or shares of any class sold pursuant to the Company’s distribution reinvestment plan.
21
The Dealer Manager also receives a stockholder servicing fee of 0.25%, 0.85% and 0.85% per annum of the aggregate NAV of the Company’s outstanding Class D shares, Class S shares and Class T shares, respectively. The Company will cease paying the stockholder servicing fee with respect to any Class D share, Class S share or Class T share sold in the primary offering at the end of the month in which the total selling commissions, dealer manager fees and stockholder servicing fees paid with respect to such share would exceed 8.75% (or, in the case of Class T shares sold through certain participating broker-dealers, a lower limit as set forth in any applicable agreement between the Dealer Manager and a participating broker-dealer) of the gross proceeds from the sale of such share (including the gross proceeds of any shares issued under the Company’s distribution reinvestment plan with respect thereto). At the end of such month, such Class D share, Class S share or Class T share (and any shares issued under the Company’s distribution reinvestment plan with respect thereto) will convert into a number of Class I shares (including any fractional shares) with an equivalent aggregate NAV of such share. The Company will accrue the cost of the stockholder servicing fee as an offering cost at the time each Class D, Class S and Class T share is sold during the primary offering. There is no stockholder servicing fee with respect to Class I shares. The Company’s obligations to pay stockholder servicing fees with respect to the Class D, Class S and Class T shares distributed in the Offering shall survive until such shares are no longer outstanding (including because such shares converted into Class I shares).
The Company may retain certain of the Adviser’s affiliates for necessary services relating to the Company’s investments or its operations, including any administrative services, construction, special servicing, leasing, development, property oversight and other property management services, as well as services related to mortgage servicing, group purchasing, healthcare, consulting/brokerage, capital markets/credit origination, loan servicing, property, title or other types of insurance, management consulting and other similar operational matters.
During the year ended December 31, 2022, the Company sold 4,548,588 Class E Operating Partnership units to the Adviser for an aggregate purchase price of $45.6 million (see Note 13). For both the three and nine months ended September 30, 2023, the Company sold 3,967,183 Class E Operating Partnership units and 369,693 Class E shares to the Adviser for an aggregate purchase price of $43.1 million and $4.0 million, respectively (see Note 2).
On September 2, 2022, the Company acquired a $26.8 million Mezzanine Loan and, concurrent with the acquisition, sold a $10.0 million pari passu participation interest to an affiliate of the Adviser (see Note 5).
As of September 30, 2023, the Company held $21.9 million in a money market fund managed by the Adviser.
Due to Affiliates
The following table details the components of due to affiliates ($ in thousands):
| | | | | | | | |
| | September 30, 2023 | | | December 31, 2022 | |
Organization and offering costs | | $ | 6,324 | | | $ | 5,539 | |
Operating expenses | | | 7,318 | | | | 4,431 | |
Accrued performance participation allocation | | | 212 | | | | — | |
Management fee | | | 163 | | | | — | |
Stockholder servicing fee | | | 37 | | | | — | |
Total | | $ | 14,054 | | | $ | 9,970 | |
Organization and offering costs
The Adviser has advanced $6.3 million and $5.5 million of organization and offering costs (including legal, accounting, and other expenses attributable to the Company’s organization, but excluding upfront selling commissions, dealer manager fees and stockholder servicing fees) on behalf of the Company through September 30, 2023 and December 31, 2022, respectively. The Adviser will advance the Company’s organization and offering costs on behalf of the Company (including legal, accounting, and other expenses attributable to the Company’s organization, but excluding upfront selling commissions, dealer manager fees and stockholder servicing fees) through July 22, 2024, the second anniversary of the commencement of the Offering. The Company will reimburse the Adviser for all such advanced costs ratably over a 60-month period following the second anniversary of the commencement of the Offering.
Operating expenses
The Adviser has advanced $7.3 million and $4.4 million of operating expenses on the Company’s behalf as of September 30, 2023 and December 31, 2022, respectively. The Company will reimburse the Adviser for all advanced operating expenses ratably over the 60 months starting the earlier of (i) the first date that the Company’s NAV reaches $500 million and (ii) December 31, 2024.
22
10. Other Assets and Liabilities
The following table summarizes the components of other assets ($ in thousands):
| | | | | | | | |
| | September 30, 2023 | | | December 31, 2022 | |
Deferred financing costs, net | | $ | 33 | | | $ | 331 | |
Receivables | | | 124 | | | | 250 | |
Acquisition costs | | | — | | | | 216 | |
Prepaid expenses | | | 353 | | | | 187 | |
Interest receivable | | | 108 | | | | 102 | |
Straight-line rent receivable | | | 209 | | | | 32 | |
Other | | | 75 | | | | 49 | |
Total | | $ | 902 | | | $ | 1,167 | |
The following table summarizes the components of accounts payable, accrued expenses and other liabilities ($ in thousands):
| | | | | | | | |
| | September 30, 2023 | | | December 31, 2022 | |
Real estate taxes payable | | $ | 14 | | | $ | 2,159 | |
Accrued expenses | | | 1,370 | | | | 1,155 | |
Accounts payable | | | 285 | | | | 867 | |
Distributions payable(1) | | | 731 | | | | 234 | |
Tenant security deposits | | | 1,404 | | | | 183 | |
Other | | | 59 | | | | 254 | |
Total | | $ | 3,863 | | | $ | 4,852 | |
(1) Included in distributions payable is $0.3 million and $0.2 million as of September 30, 2023 and December 31, 2022, respectively, relating to distributions declared on Class E units and Class E shares held by the Adviser.
11. Leases
Lessor
The Company’s rental revenue primarily consists of rent earned from operating leases at the Company’s multifamily and net lease industrial properties. Leases at the Company’s industrial properties include a fixed base rent, and a variable rent component. The variable component of the Company’s operating leases at its industrial properties consist of the reimbursement of operating expenses such as real estate taxes, insurance, and common area maintenance costs. Rental revenue earned from leases at the Company’s multifamily properties primarily consists of a fixed base rent, and certain leases contain a variable component that allows for the pass-through of certain operating expenses such as utilities.
The leases at the Company’s net lease industrial properties are longer term and contain extension and termination options at the lessee’s election. The leases do not have material variable payments, material residual value guarantees or material restrictive covenants. Leases at the Company’s multifamily properties are short term in nature, generally not greater than 12 months in length.
The following table details the components of operating lease income from the Company's industrial properties ($ in thousands). The leases at the Company’s multifamily properties are short term, generally 12 months or less, and are therefore not included.
| | | | | | | | | | | | | | | | |
| | Three Months Ended | | | Nine Months Ended | |
| | September 30, | | | September 30, | |
| | 2023 | | | 2022 | | | 2023 | | | 2022 | |
Fixed lease payments | | $ | 958 | | | $ | — | | | $ | 1,401 | | | $ | — | |
Total fixed lease payments | | $ | 958 | | | $ | — | | | $ | 1,401 | | | $ | — | |
23
The following table presents the future minimum rents the Company expects to receive from its industrial properties as of September 30, 2023 ($ in thousands). The leases at the Company’s multifamily properties are short term, generally 12 months or less, and are therefore not included.
| | | | |
Year | | September 30, 2023 | |
2023 (remainder) | | $ | 1,111 | |
2024 | | | 4,509 | |
2025 | | | 4,659 | |
2026 | | | 4,814 | |
2027 | | | 4,975 | |
Thereafter | | | 21,879 | |
Total | | $ | 41,947 | |
12. Equity
Authorized capital
The Company is authorized to issue preferred stock and five classes of common stock consisting of Class D shares, Class I shares, Class S shares, Class T shares, and Class E shares. The differences among the common share classes relate to upfront selling commissions and ongoing stockholder servicing fees. See Note 2 for additional detail of each share class.
As of September 30, 2023, in accordance with the Company's charter, the Company had authority to issue 3.1 billion shares, consisting of the following (shares in thousands):
| | | | | | | | |
Classification | | Number of Shares | | | Par Value | |
Class D Shares | | | 600,000 | | | $ | 0.01 | |
Class I Shares | | | 600,000 | | | | 0.01 | |
Class S Shares | | | 600,000 | | | | 0.01 | |
Class T Shares | | | 600,000 | | | | 0.01 | |
Class E Shares | | | 600,000 | | | | 0.01 | |
Preferred Stock | | | 100,000 | | | | 0.01 | |
Total | | | 3,100,000 | | | | |
Common Stock
The following tables detail the movement in the Company’s outstanding shares of common stock (in thousands). There were no outstanding Class T shares as of September 30, 2023:
| | | | | | | | | | | | | | | | | | | | | | | | |
| | Three Months Ended September 30, 2023 | |
| | Class D | | | Class I | | | Class S | | | Class T | | | Class E | | | Total | |
Beginning balance, June 30, 2023: | | | 214 | | | | 3,014 | | | | — | | | | — | | | | 4,401 | | | | 7,629 | |
Common stock issued | | | 110 | | | | 1,329 | | | | 54 | | | | — | | | | 1,238 | | | | 2,731 | |
Common stock repurchased | | | — | | | | (9 | ) | | | — | | | | — | | | | — | | | | (9 | ) |
Ending balance, September 30, 2023 | | | 324 | | | | 4,334 | | | | 54 | | | | — | | | | 5,640 | | | | 10,351 | |
| | | | | | | | | | | | | | | | | | | | | | | | |
| | Nine Months Ended September 30, 2023 | |
| | Class D | | | Class I | | | Class S | | | Class T | | | Class E | | | Total | |
Beginning balance, December 31, 2022: | | | — | | | | 57 | | | | — | | | | — | | | | 2,361 | | | | 2,418 | |
Common stock issued | | | 324 | | | | 4,286 | | | | 54 | | | | — | | | | 3,278 | | | | 7,942 | |
Common stock repurchased | | | — | | | | (9 | ) | | | — | | | | — | | | | — | | | | (9 | ) |
Ending balance, September 30, 2023 | | | 324 | | | | 4,334 | | | | 54 | | | | — | | | | 5,640 | | | | 10,351 | |
24
Share repurchases
The Company has adopted a share repurchase plan, whereby on a monthly basis, stockholders may request that the Company repurchase all or any portion of their shares. The Company may choose to repurchase all, some or none of the shares that have been requested to be repurchased at the end of any particular month, in its discretion, subject to any limitations in the share repurchase plan. The total amount of aggregate repurchases of Class D, Class I, Class S, Class T and Class E shares is limited to 2% of the aggregate NAV per month and 5% of the aggregate NAV per calendar quarter. Shares are repurchased at a price equal to the transaction price on the applicable repurchase date, subject to any early repurchase deduction. Shares that have not been outstanding for at least one year are repurchased at 98% of the transaction price. In the event the Company determines to repurchase some but not all of the shares submitted for repurchase during any month, shares submitted for repurchase during such month will be repurchased on a pro rata basis based on the amount requested after the Company has repurchased all shares for which repurchase was requested due to death, disability or divorce and other limited exceptions. All unsatisfied repurchase requests must be resubmitted after the start of the next month or quarter, or upon the recommencement of the share repurchase plan, as applicable.
For the three and nine months ended September 30, 2023, the Company repurchased shares of its common stock for $0.1 million. The Company had no unfilled repurchase requests during the three months ended September 30, 2023.
Class E share repurchase rights
The Class E shares issued in the Initial Capitalization are not eligible for repurchase pursuant to the share repurchase plan. The Class E shares issued in the Initial Capitalization will only be eligible for repurchase following the earlier to occur of (i) July 22, 2025, the third anniversary of the date the Company commenced this public offering, and (ii) the date that the Company's aggregate NAV is at least $1.5 billion. Following such period, holders of Class E shares (other than the Class E shares purchased by JPMIM as part of the Initial Capitalization, which are subject to special terms discussed in Note 13) may request that the Company repurchase such holder’s Class E shares on a monthly basis. The Company will repurchase Class E shares at a price per share equal to the most recently determined NAV per Class E share as of the repurchase date.
The aggregate amount of Class E shares that the Company is required to repurchase in any month will be limited to an amount equal to any remaining availability for share repurchases pursuant to the terms and conditions of the share repurchase plan (as described in the prospectus), after the Company has fulfilled all repurchase requests submitted pursuant to the share repurchase plan. In addition, the Company will not repurchase any Class E shares during any period that the share repurchase plan has been suspended.
Distribution reinvestment plan
The Company has adopted a distribution reinvestment plan whereby holders of shares of common stock will have the cash distributions attributable to the shares they own reinvested in additional shares; provided, however, that clients of certain participating broker-dealers that do not permit automatic enrollment in the distribution reinvestment plan and stockholders that are residents of certain states that do not permit automatic enrollment in the distribution reinvestment plan will automatically receive their distributions in cash unless they elect to participate in the distribution reinvestment plan.
The purchase price for shares of the Company's common stock purchased pursuant to the distribution reinvestment plan will be equal to the transaction price for the applicable class of shares at the time the distribution is payable (which will generally be equal to the Company’s prior month’s NAV per share). Stockholders will not pay upfront selling commissions or dealer manager fees when purchasing shares of common stock pursuant to the distribution reinvestment plan. The stockholder servicing fees with respect to Class D shares, Class S shares and Class T shares are calculated based on our NAV for those shares and may reduce the NAV or, alternatively, the distributions payable with respect to shares of each such class, including shares issued in respect of distributions on such shares under the distribution reinvestment plan. Shares acquired under the distribution reinvestment plan will entitle the participant to the same rights and be treated in the same manner as shares purchased in the Offering.
Distributions
The Company generally intends to distribute substantially all of its taxable income, which does not necessarily equal net income as calculated in accordance with GAAP, to its stockholders each year to comply with the REIT provisions of the Internal Revenue Code. Each class of common stock receives the same gross distribution per share. The net distribution varies for each class based on the applicable stockholder servicing fee, which is deducted from the monthly distribution per share and paid directly to the applicable distributor.
25
The following tables detail the aggregate distributions declared for each applicable class of common stock:
| | | | | | | | | | | | | | | | | | | | |
| | Three Months Ended September 30, 2023 | |
| | Class D | | | Class I | | | Class S | | | Class T | | | Class E | |
Aggregate gross distributions declared per share of common stock | | $ | 0.1088 | | | $ | 0.1088 | | | $ | 0.0734 | | | $ | — | | | $ | 0.1088 | |
Stockholder servicing fee per share of common stock(1) | | | — | | | | — | | | | (0.0155 | ) | | | — | | | | — | |
Net distributions declared per share of common stock | | $ | 0.1088 | | | $ | 0.1088 | | | $ | 0.0579 | | | $ | — | | | $ | 0.1088 | |
| | | | | | | | | | | | | | | | | | | | |
| | Nine Months Ended September 30, 2023 | |
| | Class D | | | Class I | | | Class S | | | Class T | | | Class E | |
Aggregate gross distributions declared per share of common stock | | $ | 0.3155 | | | $ | 0.3155 | | | $ | 0.0734 | | | $ | — | | | $ | 0.3155 | |
Stockholder servicing fee per share of common stock(1) | | | — | | | | — | | | | (0.0155 | ) | | | — | | | | — | |
Net distributions declared per share of common stock | | $ | 0.3155 | | | $ | 0.3155 | | | $ | 0.0579 | | | $ | — | | | $ | 0.3155 | |
(1) Stockholder servicing fees only apply to Class D, Class S and Class T shares. For purposes of NAV, the Company recognizes the stockholder servicing fee as a reduction of NAV on a monthly basis as such fee is paid. Under GAAP, the Company accrues the full cost of the stockholder servicing fee as an offering cost at the time Class D, Class S and Class T shares are sold. As of September 30, 2023, the Company had incurred stockholder servicing fees of $0.04 million.
13. Mandatorily Redeemable Instruments
During the year ended December 31, 2022, the Company sold 4,548,588 Class E Operating Partnership units to the Adviser for an aggregate purchase price of $45.6 million. For both the three and nine months ended September 30, 2023, the Company sold 3,967,183 Class E Operating Partnership units and 369,693 Class E shares to the Adviser for an aggregate purchase price of $43.1 million and $4.0 million, respectively (see Note 2).
As the sole investor in Class E units of the Operating Partnership, JPMIM's interest does not have any voting rights but is entitled to receive distributions at the same rate applicable to other classes of units.
Operating Partnership units also carry a protective exchange feature whereby in a liquidation, dilution or winding up, each unit will convert into a number of Class I units (or fraction thereof) with an equivalent NAV. Such feature is designed to carry over NAV into a new form of security immediately prior to liquidation and is not deemed a substantive conversion feature as it is only applicable upon liquidation or upon a listing event which is not the intent of this non-listed REIT structure.
The Class E units and Class E shares held by JPMIM are mandatorily redeemable, and only subject to delays to the continuous obligation to ultimately redeem the instruments once sufficient availability exists under share repurchase agreements. Therefore, the Mandatorily Redeemable Instruments held by JPMIM are classified as a liability pursuant to Topic 480 — Distinguishing Liabilities from Equity and are presented as mandatorily redeemable instruments at the initial funding amount received, which is equivalent to fair value at the issuance dates. Subsequently, the Mandatorily Redeemable Instruments are carried at their cash redemption value as if the unit were repurchased or redeemable at the reporting date, which equals NAV per unit. The change in carrying value (changes in NAV per unit) is classified as mandatorily redeemable instruments interest costs along with any cash distributions declared in the Consolidated Statements of Operations. During the three and nine months ended September 30, 2023, the Company recorded $1.4 million and $6.0 million of mandatorily redeemable instruments interest costs in the Consolidated Statements of Operations, which consisted of a redemption value adjustment loss of $0.4 million and $4.0 million and $1.0 million and $1.9 million of distribution expenses, respectively.
The following table details the Mandatorily Redeemable Instruments activity for the nine months ended September 30, 2023 ($ in thousands):
26
| | | | |
| | Nine Months Ended September 30, 2023 | |
Balance at the beginning of the year | | $ | 45,784 | |
Issuance of mandatorily redeemable interests | | | 47,157 | |
Distributions declared | | | (1,907 | ) |
Reclassification to distributions payable/paid | | | 1,907 | |
Redemption value adjustment | | | 4,138 | |
Ending balance | | $ | 97,079 | |
The following table details the future payments due under the Company’s Mandatorily Redeemable Instruments as of September 30, 2023 ($ in thousands):
| | | | |
Year | | Total | |
2023 (remainder) | | $ | — | |
2024 | | | — | |
2025 | | | 97,079 | |
2026 | | | — | |
2027 | | | — | |
Thereafter | | | — | |
Total future commitments | | $ | 97,079 | |
Redemption features
JPMIM has agreed to hold all of the Class E shares and Class E units it purchases pursuant to its capital commitment as part of the Initial Capitalization until the earlier of (i) the first date that the Company's NAV reaches $1.5 billion and (ii) July 22, 2025, three years from the commencement of this offering. Following such date, each month the Company will repurchase, without further action by JPMIM, a number of Class E shares or Class E units from JPMIM in an amount equal to the amount available under the share repurchase plan’s 2% monthly and 5% quarterly caps after satisfying repurchase requests from investors, until such time as the JPM Initial Capitalization has been fully repurchased; provided, that the number of shares subject to each mandatory repurchase may be reduced where other holders of Class E shares that were issued pursuant to the Initial Capitalization and are not subject to repurchase under the share repurchase plan request repurchase of their shares, in which case the Class E shares and Class E units held by JPMIM and such other investors will be repurchased on a pro rata basis based on their respective percentage ownership immediately prior to such repurchase (not to exceed an aggregate number of shares equal to the amount available under the share repurchase plan’s 2% monthly and 5% quarterly caps). Notwithstanding the foregoing, the Company will not effect any mandatory repurchases during any month in which the full amount of all shares requested to be repurchased by stockholders other than JPMIM under the Company's share repurchase plan is not repurchased or when the Company's share repurchase plan has been suspended.
Distributions
The Company generally intends to distribute substantially all of its taxable income, which does not necessarily equal net income as calculated in accordance with GAAP, to its stockholders each year to comply with the REIT provisions of the Internal Revenue Code. The Mandatorily Redeemable Instruments receive the same gross distribution per share as the Class E common stock. For the three and nine months ended September 30, 2023, the Company declared distributions of $0.1088 and $0.3155 for each Class E unit which totaled $1.0 million and $1.9 million, respectively. When a distribution is declared, the Company records a distribution expense as a component of mandatorily redeemable instruments interest cost in the Consolidated Statements of Operations. A distribution payable is also recorded within accounts payable, accrued expenses and other liabilities on the Company's Consolidated Balance Sheets until the distribution is paid. The distribution payable for Mandatorily Redeemable Instruments was $0.3 million and $0.2 million as of September 30, 2023 and December 31, 2022, respectively.
14. Earnings Per Share
The Company's net loss and weighted average number of shares outstanding for the three and nine months ended September 30, 2023 and 2022 consists of the following ($ and shares in thousands):
| | | | | | | | | | | | | | | | |
| | Three Months Ended | | | Nine Months Ended | |
| | September 30, | | | September 30, | |
| | 2023 | | | 2022 | | | 2023 | | | 2022 | |
Net loss attributable to JPMREIT stockholders | | $ | (2,188 | ) | | $ | (1,660 | ) | | $ | (11,188 | ) | | $ | (1,662 | ) |
Weighted-average shares of common stock outstanding, basic and diluted | | | 9,488 | | | | 928 | | | | 6,860 | | | | 351 | |
27
The calculation of basic and diluted net loss per share amounts for the three and nine months ended September 30, 2023 and 2022 consists of the following ($ and shares in thousands except per share numbers):
| | | | | | | | | | | | | | | | |
| | Three Months Ended | | | Nine Months Ended | |
| | September 30, | | | September 30, | |
| | 2023 | | | 2022 | | | 2023 | | | 2022 | |
Basic and Diluted Net Loss per Share Attributable to JPMREIT Stockholders | | | | | | | | | | | | |
Numerator: | | | | | | | | | | | | |
Net loss attributable to JPMREIT stockholders | | $ | (2,188 | ) | | $ | (1,660 | ) | | $ | (11,188 | ) | | $ | (1,662 | ) |
Denominator: | | | | | | | | | | | | |
Weighted-average shares of common stock outstanding | | | 9,488 | | | | 928 | | | | 6,860 | | | | 351 | |
Basic and diluted net loss per share of common stock | | $ | (0.23 | ) | | $ | (1.79 | ) | | $ | (1.63 | ) | | $ | (4.74 | ) |
For the three and nine months ended September 30, 2023, unvested Class E common shares awarded to the Company's independent directors are excluded from the calculation of diluted earnings per share as the inclusion of such potential common shares in the calculation would be anti-dilutive. There were no other potentially dilutive, unvested common shares for the three and nine months ended September 30, 2023.
15. Segment Reporting
The Company operates in three reportable segments: multifamily, industrial, and investments in real estate debt, real estate-related and other securities. The Company allocates resources and evaluates results based on the performance of each segment individually. The Company believes that segment net operating income is the key performance metric that captures the unique operating characteristics of each segment.
The following table details the total assets by segment ($ in thousands):
| | | | | | | | |
Segment | | September 30, 2023 | | | December 31, 2022 | |
Multifamily | | $ | 178,675 | | | $ | 185,792 | |
Industrial | | | 96,765 | | | | 22,222 | |
Investment in real estate debt, real estate-related and other securities | | | 19,331 | | | | 18,779 | |
Other (corporate) | | | 22,337 | | | | 7,519 | |
Total assets | | $ | 317,108 | | | $ | 234,312 | |
28
The following table details the financial results by segment for the three months ended September 30, 2023 ($ in thousands):
| | | | | | | | | | | | | | | | |
| | Three Months Ended September 30, 2023 | |
| | Multifamily | | | Industrial | | | Investments in real estate debt, real estate-related and other securities | | | Total | |
Revenues | | | | | | | | | | | | |
Rental revenue | | $ | 3,613 | | | $ | 1,161 | | | $ | — | | | $ | 4,774 | |
Total revenues | | | 3,613 | | | | 1,161 | | | | — | | | | 4,774 | |
Expenses | | | | | | | | | | | | |
Rental property operating | | | 1,334 | | | | 134 | | | | — | | | | 1,468 | |
Total expenses | | | 1,334 | | | | 134 | | | | — | | | | 1,468 | |
Income from investment in real estate debt | | | — | | | | — | | | | 447 | | | | 447 | |
Loss from investments in real estate-related and other securities | | | — | | | | — | | | | (318 | ) | | | (318 | ) |
Segment net operating income | | $ | 2,279 | | | $ | 1,027 | | | $ | 129 | | | $ | 3,435 | |
Depreciation and amortization | | $ | (1,081 | ) | | $ | (589 | ) | | $ | — | | | $ | (1,674 | ) |
General and administrative | | | | | | | | | | | | (989 | ) |
Mandatorily redeemable instruments interest costs | | | | | | | | | | | | (1,376 | ) |
Interest expense | | | | | | | | | | | | (1,708 | ) |
Other income (expense), net | | | | | | | | | | | | 114 | |
Net loss | | | | | | | | | | | $ | (2,198 | ) |
Net loss attributable to non-controlling interests in consolidated joint ventures | | | | | | | | | | | | (10 | ) |
Net loss attributable to JPMREIT stockholders | | | | | | | | | | | $ | (2,188 | ) |
The following table details the financial results by segment for the nine months ended September 30, 2023 ($ in thousands):
| | | | | | | | | | | | | | | | |
| | Nine Months Ended September 30, 2023 | |
| | Multifamily | | | Industrial | | | Investments in real estate debt, real estate-related and other securities | | | Total | |
Revenues | | | | | | | | | | | | |
Rental revenue | | $ | 10,926 | | | $ | 1,708 | | | $ | — | | | $ | 12,634 | |
Total revenues | | | 10,926 | | | | 1,708 | | | | — | | | | 12,634 | |
Expenses | | | | | | | | | | | | |
Rental property operating | | | 3,690 | | | | 136 | | | | — | | | | 3,826 | |
Total expenses | | | 3,690 | | | | 136 | | | | — | | | | 3,826 | |
Income from investment in real estate debt | | | — | | | | — | | | | 1,287 | | | | 1,287 | |
Loss from investments in real estate-related securities | | | — | | | | — | | | | (366 | ) | | | (366 | ) |
Segment net operating income | | $ | 7,236 | | | $ | 1,572 | | | $ | 921 | | | $ | 9,729 | |
Depreciation and amortization | | $ | (5,281 | ) | | $ | (750 | ) | | $ | — | | | $ | (6,044 | ) |
General and administrative | | | | | | | | | | | | (3,274 | ) |
Mandatorily redeemable instruments interest costs | | | | | | | | | | | | (6,045 | ) |
Interest expense | | | | | | | | | | | | (5,632 | ) |
Other income (expense), net | | | | | | | | | | | | (11 | ) |
Net loss | | | | | | | | | | | $ | (11,277 | ) |
Net loss attributable to non-controlling interests in consolidated joint ventures | | | | | | | | | | | | (89 | ) |
Net loss attributable to JPMREIT stockholders | | | | | | | | | | | $ | (11,188 | ) |
29
There was only one reportable segment for the three and nine months ended September 30, 2022, and therefore no comparable table is presented.
16. Derivatives
The Company uses derivative financial instruments to minimize the risks and/or costs associated with the Company's investments and financing transactions. The Company has not designated any of its derivative financial instruments as hedges as defined under GAAP. Derivatives not designated as hedges are not speculative and are used to manage the Company's exposure to interest rate movements and other identified risks.
The use of derivative financial instruments involves certain risks, including the risk that the counterparties to these contractual arrangements do not perform as agreed. To mitigate this risk, the Company enters into derivative financial instruments with counterparties it believes to have appropriate credit ratings and that are major financial institutions with which the Company and its affiliates may also have other financial relationships.
Treasury note futures contracts
Certain of the Company's transactions expose the Company to interest rate risk on loans secured by the Company's real estate. The Company uses derivative financial instruments, which includes treasury note futures contracts, to limit the Company's exposure to interest rate fluctuations.
The following table details the Company's outstanding treasury note futures contracts that were non-designated hedges of interest rate risk (notional amount in thousands):
| | | | | | | | | | | | |
| | September 30, 2023 |
Treasury note futures contracts | | Number of Contracts | | | Notional Amount | | | Commencement Date | | Maturity Date |
5-year treasury note futures | | | 257 | | | $ | 27,286 | | | September 11, 2023 | | December 29, 2023 |
The following table details the fair value of the Company's derivative financial instruments ($ in thousands):
| | | | | | | | |
| | Fair Value of Derivatives in an Asset Position(1) | |
| | September 30, 2023 | | | December 31, 2022 | |
5-year treasury note futures | | $ | 40 | | | $ | — | |
(1) Included in other assets, net on the Company's Consolidated Balance Sheets.
For both the three and nine months ended September 30, 2023, the Company recorded an unrealized loss related to changes in the fair value of its derivative financial instrument of $0.2 million. Changes in fair value of the Company's derivative financial instrument is recorded within other income (expenses), net on the Consolidated Statements of Operations.
Treasury note futures are centrally cleared by the Chicago Mercantile Exchange ("CME") through a futures commission merchant. Treasury note futures that are governed by an International Swaps and Derivatives Association ("ISDA") agreement provide for bilateral collateral pledging based on the counterparties' market value. The counterparties have the right to repledge the collateral posted but have the obligation to return the pledged collateral, or substantially the same collateral, if agreed to by us, as the market value of the treasury note futures change.
The Company is required to post initial margin and daily variation margin for its treasury note futures that are centrally cleared by the CME. The CME determines the fair value of the Company's centrally cleared futures, including daily variation margin. Variation margin settled on the Company's centrally cleared treasury note futures is netted against the unrealized results of these futures.
17. Commitments and Contingencies
Litigation
From time to time, the Company may be involved in various claims and legal actions arising in the ordinary course of business. As of September 30, 2023, the Company was not involved in any material legal proceedings.
18. Economic Dependency
The Company is dependent on the Adviser and its affiliates for certain services that are essential to it, including the distribution of the Company’s shares of common stock, acquisition and disposition decisions, and certain other responsibilities. In the event that the Adviser and its affiliates are unable or unwilling to provide such services, the Company would be required to find alternative service providers.
30
19. Subsequent Events
The Company evaluated subsequent events through the issuance date of the financial statements, and determined that except as otherwise disclosed herein there were no additional material subsequent events requiring disclosure.
Distributions
The Company declared distributions on all outstanding shares of common stock and Operating Partnership units as of the close of business on the record date of October 31, 2023. The Company paid or reinvested these distributions amounting to $0.7 million on November 3, 2023.
Capital raising and financing
As part of the Offering, subsequent to September 30, 2023 through November 9, 2023, the Company sold 102,925 Class D, 680,157 Class I and 300 Class S shares of common stock for net proceeds of $1.1 million, $7.2 million and $0.003 million respectively, which is inclusive of distributions reinvested in accordance with the Company's distribution reinvestment plan.
As part of a private offering, subsequent to September 30, 2023 through November 9, 2023, the Company issued 130,035 and 931,253 shares of Class I and Class E common stock for net proceeds of $1.4 million and $10.2 million, respectively, which is inclusive of distributions reinvested in accordance with the Company's distribution reinvestment plan. Additionally, the Company sold 500,533 Class E units for net proceeds of $5.5 million.
31
Item 2. Management’s Discussion and Analysis of Financial Condition and Results of Operations.
References herein to “Company,” “we,” “us,” or “our” refer to J.P. Morgan Real Estate Income Trust, Inc. unless the context specifically requires otherwise.
The following discussion should be read in conjunction with the unaudited consolidated financial statements and notes thereto appearing elsewhere in this quarterly report on Form 10-Q.
Forward-Looking Statements
This quarterly report on Form 10-Q contains forward-looking statements about our business, including, in particular, statements about our plans, strategies and objectives. You can generally identify forward-looking statements by our use of forward-looking terminology such as “may,” “will,” “expect,” “intend,” “anticipate,” “estimate,” “believe,” “continue,” or other similar words. These statements include our plans and objectives for future operations, including plans and objectives relating to future growth and availability of funds, and are based on current expectations that involve numerous risks and uncertainties. Assumptions relating to these statements involve judgments with respect to, among other things, future economic, competitive and market conditions and future business decisions, all of which are difficult or impossible to accurately predict and many of which are beyond our control. Such forward-looking statements are inherently uncertain and there are or may be important factors that could cause actual outcomes or results to differ materially from those indicated in such statements. We believe these factors also include but are not limited to those described under the section entitled “Item IA. Risk Factors” in our Annual Report on Form 10-K for the year ended December 31, 2022, which is accessible on the SEC’s website at www.sec.gov. These factors should not be construed as exhaustive and should be read in conjunction with the other cautionary statements that are included in this document (or our prospectus and other filings). Except as otherwise required by federal securities laws, we undertake no obligation to publicly update or revise any forward-looking statements, whether as a result of new information, future developments or otherwise.
Overview
We are a Maryland corporation formed on November 5, 2021. We were formed to invest primarily in stabilized, income-generating real properties. We are an externally advised, perpetual-life REIT formed to pursue the following investment objectives:
•provide attractive current income in the form of regular, stable cash distributions;
•preserve and protect invested capital;
•realize appreciation in NAV from proactive investment management and asset management; and
•provide an investment alternative for stockholders seeking to allocate a portion of their long-term investment portfolios to real estate.
We cannot assure you that we will achieve our investment objectives. In particular, we note that our NAV may be subject to volatility related to changes in the values of our assets.
We intend to qualify as a REIT for federal income tax purposes. We own all or substantially all of our assets through the Operating Partnership, of which we are the sole general partner.
Our board of directors at all times has ultimate oversight and policy-making authority over us, including responsibility for governance, financial controls, compliance and disclosure. Pursuant to the Advisory Agreement, however, we have delegated to the Adviser the authority to source, evaluate and monitor our investment opportunities and make decisions related to the acquisition, management, financing and disposition of our assets, in accordance with our investment objectives, guidelines, policies and limitations, subject to oversight by our board of directors.
Our initial public offering of our common stock commenced on July 22, 2022. We acquired our first investment on September 2, 2022.
We intend to contribute the net proceeds from the Offering which are not used or retained to pay the fees and expenses attributable to our operations to the Operating Partnership. The Operating Partnership will use the net proceeds received from us to make investments in accordance with our investment strategy and policies.
The number and type of properties or real estate-related and other investments that we acquire will depend upon real estate market conditions, the amount of proceeds we raise in the Offering and other circumstances existing at the time we are acquiring such assets.
We are not aware of any material trends or uncertainties, favorable or unfavorable, other than national economic conditions affecting real estate generally, that may be reasonably anticipated to have a material impact on either capital resources or the revenues or income to be derived from acquiring properties, real estate debt and real estate-related or other securities.
32
Q3 2023 Highlights
Capital raising and distributions
•Raised net proceeds of $76.2 million (inclusive of proceeds raised from the sale of Class E shares and Class E units to the Adviser) from the sale of shares of our common stock during the three months ended September 30, 2023.
•Declared distributions totaling $2.0 million for the three months ended September 30, 2023, including $1.0 million related to Class E units.
Investing
•Acquired a pre-leased truck transload facility located within the Savannah, Georgia metropolitan area for $75.2 million, inclusive of closing costs.
•Invested $11.3 million, net of redemptions, in a money market fund managed by an affiliate of the Adviser during the three months ended September 30, 2023.
Portfolio
The following chart outlines the percentage of our assets across investments in real estate, investment in real estate debt and investments in real estate-related and other securities based on fair value by category as of September 30, 2023:
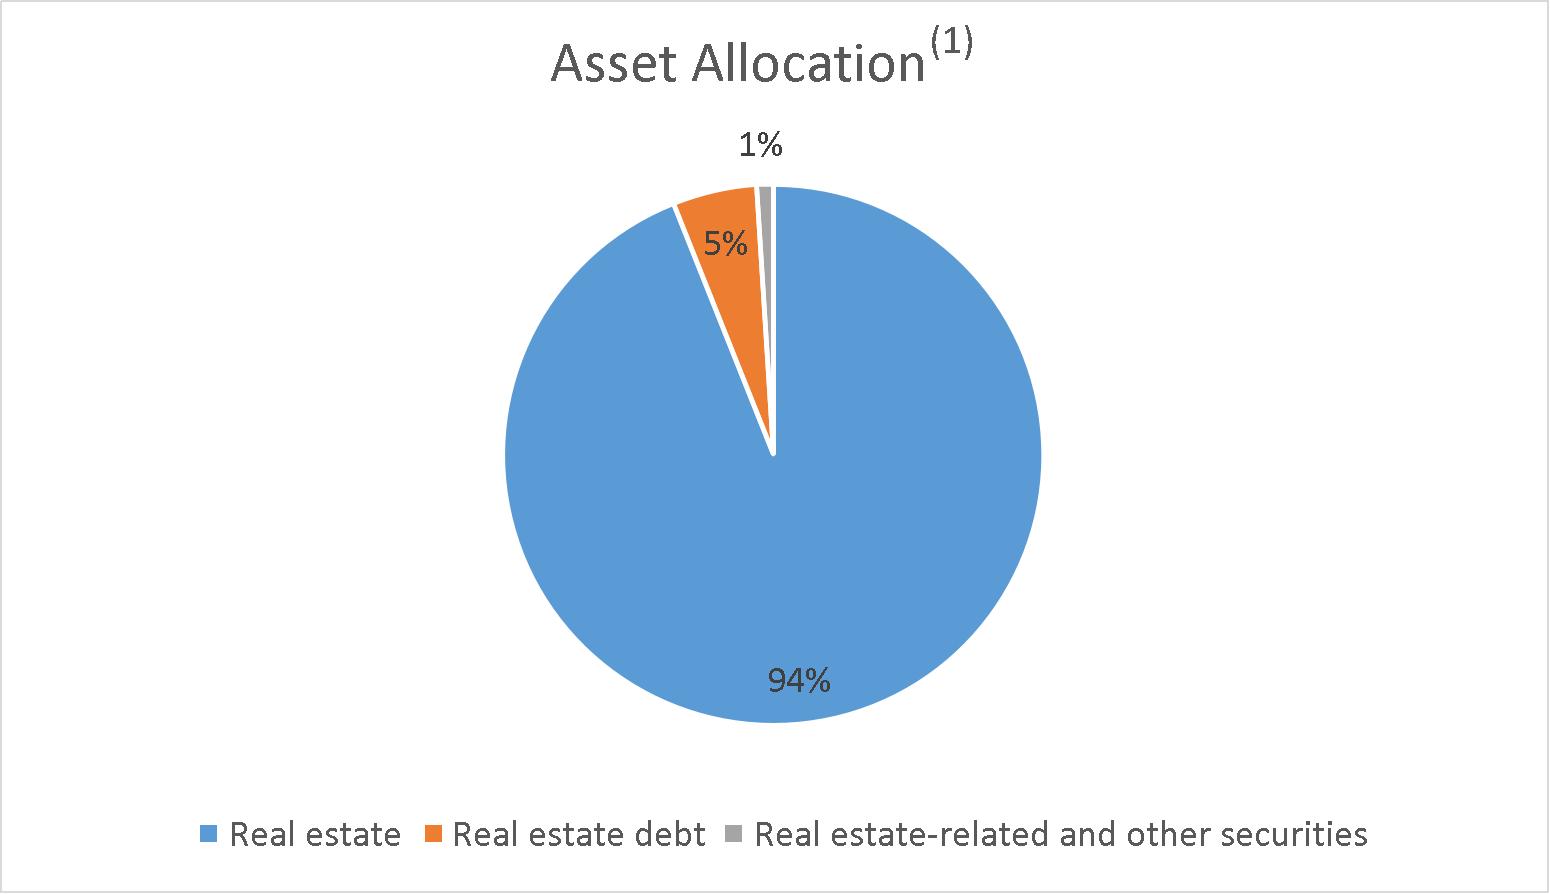
(1) Real estate includes our direct property investments; real estate debt is our Mezzanine Loan; and real estate-related and other securities consists of our CMBS and U.S. Treasury investments.
The following charts further describe the composition of our investments in real estate based on estimated fair value as of September 30, 2023:
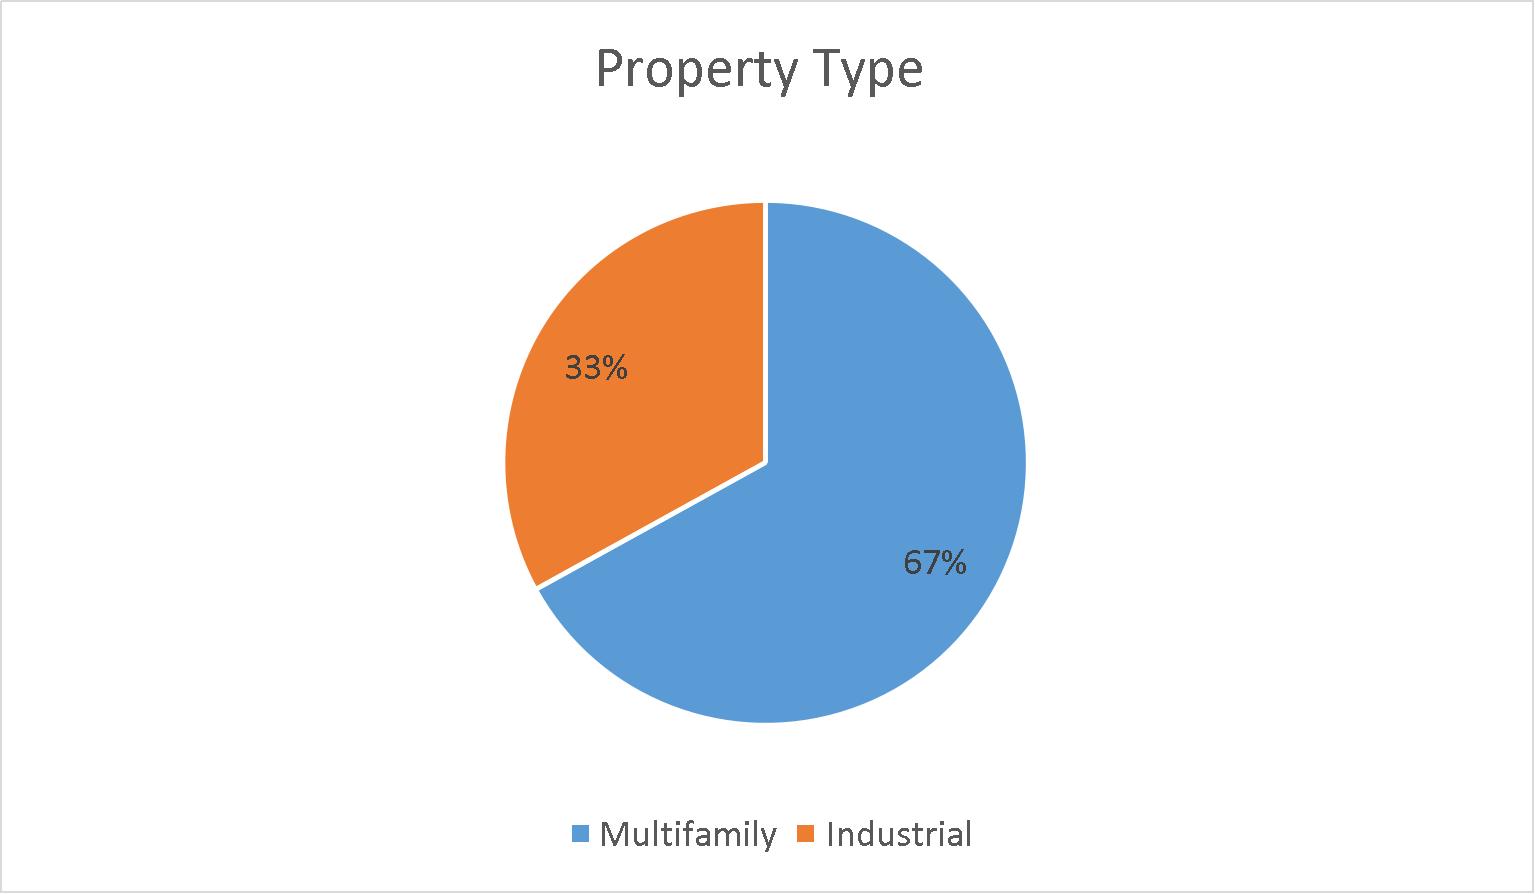
33
Investments in real estate
As of September 30, 2023, we owned five real estate properties which are summarized in the following table ($ in thousands):
| | | | | | | | | | | | | | | | | | | | | | | |
Property type | | Number of Properties | | | Sq. Ft. (in thousands)/Number of Units | | | Occupancy Rate(1) | | | Gross Asset
Value(2) | | | Revenue(3) | | | Percent of Revenue | |
Multifamily | | | 3 | | | 688 units | | | | 94 | % | | $ | 195,650 | | | $ | 14,568 | | | | 86.5 | % |
Industrial | | | 2 | | | 560sq. ft. | | | | 100 | % | | | 94,535 | | | | 2,277 | | | | 13.5 | % |
Total | | | 5 | | | | | | | | | $ | 290,185 | | | $ | 16,845 | | | | 100.0 | % |
(1) Occupancy for our multifamily properties is measured monthly by dividing property market rent for occupied units by the gross market rent potential of all units. Gross market rent potential is the average monthly market rent of all units at the property. Occupancy is weighted by the total real estate asset fair value of all investments in real estate.
(2) Based on fair value as of September 30, 2023.
(3) Revenue is calculated as annualized revenue inclusive of tenant recoveries, straight-line rent, above-market lease amortization and below-market lease amortization.
The following table provides information regarding our real estate properties as of September 30, 2023:
| | | | | | | | | | | | | | | | | | | | |
Property Type and Investment | | Number of Properties | | | Location(3) | | Acquisition Date | | Ownership
Interest(1) | | | Sq. Feet (in thousands)/Number of Units | | | Occupancy(2) | |
Multifamily: | | | | | | | | | | | | | | | | |
Caroline West Gray | | | 1 | | | Houston, TX | | November 2022 | | | 95 | % | | | 275 | | | | 97 | % |
Caroline Post Oak | | | 1 | | | Houston, TX | | November 2022 | | | 95 | % | | | 238 | | | | 90 | % |
Coda on Centre | | | 1 | | | Pittsburgh, PA | | December 2022 | | | 100 | % | | | 175 | | | | 98 | % |
Total multifamily | | | 3 | | | | | | | | | | | 688 | | | | |
Industrial: | | | | | | | | | | | | | | | | |
6200 Bristol | | | 1 | | | Philadelphia, PA | | October 2022 | | | 100 | % | | | 424 | | | | 100 | % |
Savannah Truck Terminal | | | 1 | | | Savannah, GA | | July 2023 | | | 100 | % | | | 136 | | | | 100 | % |
Total industrial | | | 2 | | | | | | | | | | | 560 | | | | |
(1) Certain of the joint venture agreements entered into by us provide the other partner a profits interest based on certain internal rate of return hurdles being achieved. Such investments are consolidated by us and any profits interest due to the other partner will be reported within non-controlling interests in consolidated joint ventures on our Consolidated Balance Sheets.
(2) Occupancy for our multifamily properties is measured monthly by dividing property market rent for occupied units by the gross market rent potential of all units. Gross market rent potential is the average monthly market rent of all units at the property. Occupancy is weighted by the total real estate asset value of all investments in real estate.
(3) Refers to the metropolitan statistical area.
34
Lease expirations
The following table details the expiring leases at our industrial properties by annualized base rent as of September 30, 2023 ($ in thousands). The table below excludes our multifamily properties as substantially all leases at such properties expire within 12 months:
| | | | | | | | | | | | |
| | Industrial | |
Year | | Number of Expiring Leases | | | Annualized Base Rent(1) | | | % of Total Annualized Based Rent Expiring | |
2023 | | | — | | | $ | — | | | | 0 | % |
2024 | | | — | | | | — | | | | 0 | % |
2025 | | | — | | | | — | | | | 0 | % |
2026 | | | — | | | | — | | | | 0 | % |
2027 | | | — | | | | — | | | | 0 | % |
2028 | | | — | | | | — | | | | 0 | % |
2029 | | | — | | | | — | | | | 0 | % |
2030 | | | 1 | | | | 3,972 | | | | 80 | % |
2031 | | | — | | | | — | | | | 0 | % |
2032 | | | — | | | | — | | | | 0 | % |
Thereafter | | | 1 | | | | 1,008 | | | | 20 | % |
Total | | | 2 | | | $ | 4,980 | | | | 100 | % |
(1) Annualized base rent is determined from the annualized straight-line rent due to expire in the year of lease expiration and excludes tenant recoveries, above-market lease amortization and below-market lease amortization.
Investment in real estate debt
The following table summarizes our investment in real estate debt as of September 30, 2023 and December 31, 2022 ($ in thousands):
| | | | | | | | | | | | | | | | | | | | | | | | | | |
| | | | | | | | | | | September 30, 2023 | | | December 31, 2022 | |
Real Estate Debt | | Number of Positions | | | Credit Rating | | Coupon | | Maturity Date | | Cost Basis | | | Fair Value | | | Cost Basis | | | Fair Value | |
Mezzanine loan | | | 1 | | | Not Rated | | SOFR + 5.22% | | September 7, 2024 | | $ | 16,825 | | | $ | 16,825 | | | $ | 16,825 | | | $ | 16,825 | |
Investments in real estate-related and other securities
The following table summarizes our investments in real estate-related and other securities as of September 30, 2023 and December 31, 2022 ($ in thousands):
| | | | | | | | | | | | | | | | | | | | | | | | | | | | |
| | | | | | September 30, 2023 | | | December 31, 2022 | |
Real Estate-Related and Other Securities | | Coupon | | Maturity Date | | Face Amount | | | Cost Basis | | | Fair Value | | | Face Amount | | | Cost Basis | | | Fair Value | |
CMBS | | SOFR + 0.75% | | April 30, 2024 | | $ | 1,812 | | | $ | 1,671 | | | $ | 1,753 | | | $ | 2,000 | | | $ | 1,840 | | | $ | 1,842 | |
U.S. Treasury(1) | | N/A | | March 14, 2024 | | | 420 | | | | 410 | | | | 410 | | | | — | | | | — | | | | — | |
Total real estate-related and other securities | | | | | | $ | 2,232 | | | $ | 2,081 | | | $ | 2,163 | | | $ | 2,000 | | | $ | 1,840 | | | $ | 1,842 | |
(1)Includes $0.4 million of securities pledged as collateral related to the treasury note futures contracts.
35
Results of Operations
The following table sets forth information regarding our consolidated results of operations ($ in thousands):
| | | | | | | | | | | | | | | | |
| | Three Months Ended | | | Nine Months Ended | |
| | September 30, | | | September 30, | |
| | 2023 | | | 2022 | | | 2023 | | | 2022 | |
Revenues | | | | | | | | | | | | |
Rental revenue | | $ | 4,774 | | | $ | — | | | $ | 12,634 | | | $ | — | |
Total revenues | | | 4,774 | | | | — | | | | 12,634 | | | | — | |
Expenses | | | | | | | | | | | | |
Rental property operating | | | 1,468 | | | | — | | | | 3,826 | | | | — | |
General and administrative | | | 989 | | | | 1,527 | | | | 3,274 | | | | 1,528 | |
Depreciation and amortization | | | 1,674 | | | | 4 | | | | 6,044 | | | | 4 | |
Total expenses | | | 4,131 | | | | 1,531 | | | | 13,144 | | | | 1,532 | |
Other income (expense), net | | | | | | | | | | | | |
Income from investment in real estate debt | | | 447 | | | | 105 | | | | 1,287 | | | | 105 | |
Loss from investments in real estate-related and other securities | | | (318 | ) | | | — | | | | (366 | ) | | | — | |
Mandatorily redeemable instruments interest costs | | | (1,376 | ) | | | (27 | ) | | | (6,045 | ) | | | (27 | ) |
Interest expense | | | (1,708 | ) | | | (55 | ) | | | (5,632 | ) | | | (55 | ) |
Other income (expenses), net | | | 114 | | | | (152 | ) | | | (11 | ) | | | (153 | ) |
Total other income (expense), net | | | (2,841 | ) | | | (129 | ) | | | (10,767 | ) | | | (130 | ) |
Net loss | | $ | (2,198 | ) | | $ | (1,660 | ) | | $ | (11,277 | ) | | $ | (1,662 | ) |
Net loss attributable to non-controlling interests in consolidated joint ventures | | | (10 | ) | | | — | | | | (89 | ) | | | — | |
Net loss attributable to JPMREIT stockholders | | $ | (2,188 | ) | | $ | (1,660 | ) | | $ | (11,188 | ) | | $ | (1,662 | ) |
Net loss per share of common stock - basic and diluted | | $ | (0.23 | ) | | $ | (1.79 | ) | | $ | (1.63 | ) | | $ | (4.74 | ) |
Weighted-average shares of common stock outstanding - basic and diluted | | | 9,488 | | | | 928 | | | | 6,860 | | | | 351 | |
Rental revenue
Due to acquisitions of real estate we have made since September 30, 2022, our rental revenue for the three and nine months ended September 30, 2023 and September 30, 2022 are not comparable. Rental revenue primarily consists of base rent arising from tenant leases at our multifamily and industrial properties. Rental revenue, aside from short term leases generally less than one year in term, is recognized on a straight-line basis over the life of the lease, including any fixed and measurable rent escalations and abatements.
Rental property operating expenses
Rental property operating expenses consist of the costs of ownership and operation of the real estate investments. Examples of rental property operating expenses include insurance, utilities, real estate taxes and repair and maintenance expenses. Rental property operating expenses also include general and administrative expenses unrelated to the operations of the properties. Due to acquisitions of real estate we have made since September 30, 2022, our rental property operating expenses for the three and nine months ended September 30, 2023 and September 30, 2022 are not comparable.
General and administrative expenses
During the three and nine months ended September 30, 2023, general and administrative expenses decreased by $0.5 million and increased by $1.7 million, respectively, in comparison to the corresponding periods in 2022. The decrease in general and administrative expenses for the three months ended September 30, 2023 as compared to the three months ended September 30, 2022 was primarily driven by our Registration Statement on Form S-11 being declared effective during the three months ended September 30, 2022, at which time all general and administrative expenses incurred on our behalf by the Advisor were recorded as a liability on our Consolidated Balance Sheets. For the nine months ended September 30, 2023, the increase in general and administrative expenses was driven by an increase of $1.2 million related to general corporate costs, such as professional fees, legal fees and insurance premiums, an increase in accrued asset management fees of $0.2 million, an increase in director compensation expense of $0.2 million and an increase in amortization of restricted stock awards of $0.1 million.
36
Depreciation and amortization expenses
Depreciation and amortization expenses are impacted by the fair values assigned to buildings, personal property and in-place lease assets as part of the initial purchase price allocation. For the nine months ended September 30, 2022, we owned no investments in real estate. During the three and nine months ended September 30, 2023, depreciation and amortization expenses increased by $1.7 million and $6.0 million, respectively. For the three and nine months ended September 30, 2023, the increase in depreciation and amortization expenses were driven by depreciation of $1.5 million and $3.6 million as well as amortization of in-place lease intangibles of $0.2 million and $2.4 million, respectively. Due to acquisitions of real estate we have made since September 30, 2022, our depreciation and amortization expenses for the three and nine months ended September 30, 2023 are not comparable.
Income from investment in real estate debt
During the three and nine months ended September 30, 2023, income from investment in real estate debt increased by $0.3 million and $1.2 million, respectively, in comparison to the corresponding periods in 2022. For the three and nine months ended September 30, 2023, the increase in income from investment in real estate debt was primarily due to our acquisition of our investment in real estate debt on September 2, 2022, as well as an increase in interest rates.
Loss from investments in real estate-related and other securities
During the three and nine months ended September 30, 2023, loss from investments in real estate-related and other securities increased by $0.3 million, and $0.4 million, respectively, in comparison to the corresponding periods in 2022. The loss from our investments in real estate-related and other securities primarily consisted of interest income of $0.1 million and $0.2 million, unrealized gains of $0.3 million and $0.1 million, and realized losses of $0.7 million and $0.7 million, respectively. For the three and nine months ended September 30, 2022, we owned no investments in real estate-related and other securities.
Mandatorily redeemable instruments interest costs
During the three and nine months ended September 30, 2023, costs related to our Mandatorily Redeemable Instruments increased by $1.3 million and $6.0 million, respectively, in comparison to the corresponding periods in 2022 due to an increase in allocation of appreciation of $0.3 million and $4.1 million relating to the loss on the redemption value adjustment of the Mandatorily Redeemable Instruments and an increase in distribution expense of $1.0 million and $1.9 million.
Interest expense
During the three and nine months ended September 30, 2023, interest expense increased by $1.7 million and $5.6 million, respectively, in comparison to the corresponding periods in 2022. Interest expense primarily consists of interest expense incurred on our mortgage notes and Credit Facility. For the three and nine months ended September 30, 2023, interest expense incurred on our mortgage notes and Credit Facility increased by $1.5 million and $5.0 million, respectively. For the three and nine months ended September 30, 2023, the increase in interest expense was primarily due to our entering into the Credit Facility during the three months ended September 30, 2022 and entering into the mortgage notes in conjunction with our acquisitions of real estate investments during the three months ended December 31, 2022.
Other income (expense), net
Other income (expense), net went from an expense of $0.2 million for the three months ended September 30, 2022 to income of $0.1 million for the three months ended September 30, 2023 primarily due to an increase in interest and dividend income of $0.3 million and a decrease in other expenses, offset by an unrealized loss on treasury note futures contracts of $0.2 million. For the nine months ended September 30, 2023, other income (expense), net decreased by $0.1 million in comparison to the corresponding periods in 2022 primarily due to an increase in interest and dividend income of $0.3 million, offset by an unrealized loss on treasury note futures contracts of $0.2 million.
Net loss attributable to non-controlling interests in consolidated joint ventures
During the three and nine months ended September 30, 2023, net loss attributable to non-controlling interests in consolidated joint ventures was less than $0.1 million and $0.1 million, respectively, due to the 5% non-controlling interest in the Caroline West Gray and Caroline Post Oak properties held by our joint venture partner.
37
Liquidity and Capital Resources
Our primary needs for liquidity and capital resources are to fund our investments, to make distributions to our stockholders, to repurchase shares of our common stock pursuant to our share repurchase plan, to pay our offering and operating fees and expenses and to pay interest on any outstanding indebtedness we may incur. We anticipate our offering and operating fees and expenses will include, among other things, the management fee we will pay to the Adviser, the performance participation allocation that the Operating Partnership will pay to the Special Limited Partner, stockholder servicing fees we will pay to the Dealer Manager, legal, audit, tax and valuation expenses, federal and state filing fees, printing expenses, administrative fees, transfer agent fees, marketing and distribution expenses and fees related to acquiring, financing, appraising and managing our properties. We do not have any office or personnel expenses as we do not have any employees.
The Adviser will advance our organization and offering expenses on our behalf (other than upfront selling commissions, dealer manager fees and stockholder servicing fees) through July 22, 2024, the second anniversary of the commencement of the Offering. We will reimburse the Adviser for such advanced expenses ratably over the 60 months following July 22, 2024, the second anniversary of the commencement of the Offering. We accrued approximately $6.3 million and $5.5 million of organization and offering expenses payable to the Adviser which are included in due to affiliate on our Consolidated Balance Sheets as of September 30, 2023 and December 31, 2022, respectively. In addition, the Adviser will advance on our behalf certain of our operating expenses through the earlier of (i) the first date that our NAV reaches $500 million and (ii) December 31, 2024 at which point we will reimburse the Adviser for all such advanced expenses ratably over the 60 months following such date. The Adviser advanced, and we accrued, approximately $7.3 million and $4.4 million of operating expenses which are included in due to affiliate on our Consolidated Balance Sheets as of September 30, 2023 and December 31, 2022, respectively.
We intend to elect to be taxed as a REIT under Sections 856 through 860 of the Code. In order to maintain our qualification as a REIT, we are required to, among other things, distribute as dividends at least 90% of our REIT taxable income, determined without regard to the dividends-paid deduction and excluding net capital gains, to our stockholders and meet certain tests regarding the nature of our income and assets.
On November 15, 2021, we were capitalized with a $0.2 million investment by the Adviser in exchange for 20,000 shares of our Class E common stock. The Adviser has agreed to not sell, transfer or dispose of the shares to any party other than an affiliate of the Adviser for so long as the Adviser or its affiliate performs an advisory function for us.
Pursuant to a private offering, JPMIM agreed to purchase $25.0 million in Class E shares or Class E units, or a combination thereof, and up to an additional $75.0 million in Class E shares or Class E units. JPMIM's commitment to purchase such Class E shares or Class E units from us expired in August 2023. As of September 30, 2023, we received $162.1 million in commitments to purchase shares of our common stock and Class E units, including the shares and units to be purchased by JPMIM, and have sold $53.2 million in Class E shares and $88.7 million in Class E units from such commitments. We are not required to call all of the capital commitments made by investors pursuant to the Initial Capitalization prior to their expiration. In addition, we sold $2.6 million Class E shares to employees of the Adviser.
Over time, we generally intend to fund our cash needs for items other than asset acquisitions from operations. Our cash needs for acquisitions will be funded primarily from the sale of shares of our common stock and through the assumption or incurrence of secured or unsecured financings from banks or other lenders and proceeds from the sales of assets. If necessary, we may use financings or other sources of capital in the event of unforeseen significant capital expenditures.
If we are unable to raise substantial funds, we will make fewer investments resulting in less diversification in terms of the type, number and size of investments we make and the value of an investment in us will fluctuate with the performance of the specific assets we acquire. Further, we have certain fixed operating expenses, including certain expenses as a publicly offered REIT, regardless of whether we are able to raise substantial funds. Our inability to raise substantial funds would increase our fixed operating expenses as a percentage of gross income, reducing our net income and limiting our ability to make distributions.
On August 31, 2022, we entered into a Credit Facility with U.S. Bank. The Credit Facility may be used to fund acquisitions, to repurchase shares pursuant to our share repurchase plan or for any other corporate purpose. Funds available under the Credit Facility may be reduced at any given time if we use borrowings under the Credit Facility to fund share repurchases, distributions, investments, or for other corporate purposes. We amended the Credit Facility on August 25, 2023 to (i) extend the maturity date to August 29, 2024, (ii) decrease the aggregate commitments from up to $65 million to up to $8 million and (iii) increase the applicable margin to 2.45%.
38
The following table is a summary of our mortgage note indebtedness as of September 30, 2023 and December 31, 2022 ($ in thousands):
| | | | | | | | | | | | | | |
| | | | | | | Principal Balance Outstanding | |
Indebtedness | | Interest Rate | | | Maturity Date | | September 30, 2023 | | | December 31, 2022 | |
Caroline West Gray | | | 5.44 | % | | 12/1/2029 | | $ | 45,911 | | | $ | 45,911 | |
Caroline Post Oak | | | 5.44 | % | | 12/1/2029 | | | 40,528 | | | | 40,528 | |
Coda on Centre | | | 4.28 | % | | 5/30/2029 | | | 29,032 | | | | 29,399 | |
Total fixed-rate loans | | | | | | | | 115,471 | | | | 115,838 | |
Deferred financing costs, net | | | | | | | | (1,075 | ) | | | (1,202 | ) |
Mortgage discount, net | | | | | | | | (772 | ) | | | (876 | ) |
Total mortgage notes | | | | | | | $ | 113,624 | | | $ | 113,760 | |
The following table is a summary of our indebtedness under our Credit Facility as of September 30, 2023 and December 31, 2022 ($ in thousands):
| | | | | | | | | | | | | | | | |
| | | | | | | | | Principal Balance Outstanding | |
Indebtedness | | Interest Rate | | Maturity Date | | Maximum Facility Size | | | September 30, 2023 | | | December 31, 2022 | |
Credit Facility(1) | | SOFR + 2.45% | | 8/29/2024 | | $ | 8,000 | | | $ | — | | | $ | 40,200 | |
(1) The Credit Facility has a one-year extension of the maturity date at our request. See Note 8 — "Mortgage Notes and Credit Facility" to our consolidated financial statements in this Quarterly Report on Form 10-Q.
Cash Flows
The following table provides a breakdown of the net change in our cash and cash equivalents and restricted cash ($ in thousands):
| | | | | | | |
| For the Nine Months Ended | | | For the Nine Months Ended | |
| September 30, 2023 | | | September 30, 2022 | |
Net cash provided by operating activities | $ | 922 | | | $ | 75 | |
Net cash used in investing activities | | (70,600 | ) | | | (26,261 | ) |
Net cash provided by financing activities | | 87,688 | | | | 28,720 | |
Net change in cash and cash equivalents | $ | 18,010 | | | $ | 2,534 | |
Cash flows provided by operating activities increased by $0.8 million for the nine months ended September 30, 2023 compared to the corresponding period in 2022. The increase was due to the growth of our portfolio.
Cash flows used in investing activities increased by $44.3 million for the nine months ended September 30, 2023 compared to the corresponding period in 2022 due primarily to an increase in acquisitions of real estate of $67.3 million, a decrease in purchases of investments in real estate debt of $16.8 million and a net decrease in deposits on real estate of $4.6 million.
Cash flows provided by financing activities increased by $59.0 million for the nine months ended September 30, 2023 compared to the corresponding periods in 2022 due primarily to an increase in proceeds from issuance of common stock of $73.8 million, an increase in proceeds from issuance of Mandatorily Redeemable Instruments of $31.4 million, net repayments on our Credit Facility of $36.2 million, and an increase in distributions of common stock of $1.6 million.
Distributions
We generally intend to distribute substantially all of our taxable income, which does not necessarily equal net income as calculated in accordance with GAAP, to our stockholders each year to comply with the REIT provisions of the Internal Revenue Code. Each class of common stock receives the same gross distribution per share. The net distribution varies for each class based on the applicable stockholder servicing fee, which is deducted from the monthly distribution per share.
39
The following table details the aggregate distributions declared for each applicable class of common stock for the three months ended September 30, 2023:
| | | | | | | | | | | | | | | | | | | | |
| | Three Months Ended September 30, 2023 | |
| | Class D | | | Class I | | | Class S | | | Class T | | | Class E | |
Aggregate gross distributions declared per share of common stock | | $ | 0.1088 | | | $ | 0.1088 | | | $ | 0.0734 | | | $ | — | | | $ | 0.1088 | |
Stockholder servicing fee per share of common stock(1) | | | — | | | | — | | | | (0.0155 | ) | | | — | | | | — | |
Net distributions declared per share of common stock | | $ | 0.1088 | | | $ | 0.1088 | | | $ | 0.0579 | | | $ | — | | | $ | 0.1088 | |
The following table details the aggregate distributions declared for each applicable class of common stock for the nine months ended September 30, 2023:
| | | | | | | | | | | | | | | | | | | | |
| | Nine Months Ended September 30, 2023 | |
| | Class D | | | Class I | | | Class S | | | Class T | | | Class E | |
Aggregate gross distributions declared per share of common stock | | $ | 0.3155 | | | $ | 0.3155 | | | $ | 0.0734 | | | $ | — | | | $ | 0.3155 | |
Stockholder servicing fee per share of common stock(1) | | | — | | | | — | | | | (0.0155 | ) | | | — | | | | — | |
Net distributions declared per share of common stock | | $ | 0.3155 | | | $ | 0.3155 | | | $ | 0.0579 | | | $ | — | | | $ | 0.3155 | |
(1) Stockholder servicing fees only apply to Class D, Class S and Class T shares. The stockholder servicing fee is a reduction of the gross declared distribution. Under GAAP, we accrue the full cost of the stockholder servicing fee as an offering cost at the time we sell Class D, Class S and Class T shares. As of September 30, 2023, we had accrued under GAAP $0.04 million of stockholder servicing fees.
The following table summarizes our distributions declared and paid on our shares of common stock during the three months ended September 30, 2023 ($ in thousands):
| | | | | | | | |
| | Three Months Ended September 30, 2023 | |
| | Amount | | | Percentage | |
Distributions | | | | | | |
Paid in cash | | $ | 744 | | | | 81 | % |
Reinvested in shares | | | 176 | | | | 19 | % |
Total distributions | | $ | 920 | | | | 100 | % |
Source of Distributions | | | | | | |
Cash flows from operating activities | | $ | 920 | | | | 100 | % |
Offering proceeds(1) | | | — | | | | 0 | % |
Total sources of distributions | | $ | 920 | | | | 100 | % |
Cash flows from operating activities(2) | | $ | 1,288 | | | | |
The following table summarizes our distributions declared and paid on our shares of common stock declared and paid during the nine months ended September 30, 2023 ($ in thousands):
| | | | | | | | |
| | Nine Months Ended September 30, 2023 | |
| | Amount | | | Percentage | |
Distributions | | | | | | |
Paid in cash | | $ | 1,551 | | | | 82 | % |
Reinvested in shares | | | 340 | | | | 18 | % |
Total distributions | | $ | 1,891 | | | | 100 | % |
Source of Distributions | | | | | | |
Cash flows from operating activities | | $ | 922 | | | | 49 | % |
Offering proceeds(1) | | | 969 | | | | 51 | % |
Total sources of distributions | | $ | 1,891 | | | | 100 | % |
Cash flows from operating activities(2) | | $ | 922 | | | | |
(1) Includes proceeds from the sale of Class E units, Class E shares, Class D shares, Class I shares and Class S shares.
40
(2) During the three months ended September 30, 2023, we received cash flows from operating activities in the amount of $1.3 million. However, during the nine months ended September 30, 2023 cash flows from operating activities was $0.9 million. Accordingly, proceeds from our offerings and cash flows from operating activities were used to pay distributions for the nine months ended September 30, 2023. The cash flows from operating activities were impacted by a settlement of approximately $2.1 million of real estate tax liabilities that were assumed as part of our acquisition of Caroline West Gray and Caroline Post Oak multifamily investments during the three months ended December 31, 2022. In conjunction with the acquisition of Caroline West Gray and Caroline Post Oak, and as a result of agreeing to assume the real estate tax liabilities of the seller of approximately $2.1 million, we reduced the cash consideration to the seller by approximately $2.1 million. During the first quarter of 2023, the tax payment was made directly to the taxing authority and not the seller. The payment is included within operating activities on the statement of cash flows during the nine months ended September 30, 2023.
In addition to the distributions declared and paid on our common stock, we declared and paid $1.0 million and $1.9 million for Mandatorily Redeemable Instruments during the three and nine months ended September 30, 2023. Such amounts are recorded in mandatorily redeemable instruments interest costs on the Consolidated Statements of Operations and accounts payable, accrued expenses and other liabilities on the Consolidated Balance Sheets, respectively.
Net Asset Value
Our board of directors, including a majority of our independent directors, has adopted valuation guidelines that contain a comprehensive set of methodologies to be used by the Adviser and our independent valuation advisor in connection with estimating the values of our assets and liabilities for purposes of our NAV calculation. The overarching principle of these guidelines is to produce a valuation that represents a fair and accurate estimate of the value of our investments or the price that would be received for our investments in an arm’s-length transaction between a willing buyer and a willing seller in possession of all material information about our investments. These valuation guidelines are largely based upon standard industry practices used by private, open-end real estate funds and other public, non-listed REITs, and are administered by the Adviser.
As a public company, we are required to issue financial statements based on historical cost in accordance with GAAP, which are subject to an independent audit. To calculate our NAV for purposes of establishing a purchase and repurchase price for our shares, we have adopted a model, as explained below, that adjusts the value of our assets from historical cost to fair value in accordance with the GAAP principles set forth in FASB Accounting Standards Codification Topic 820, Fair Value Measurements and Disclosures. However, our valuation procedures and our NAV are not subject to GAAP and are not subject to independent audit. Our NAV may differ from equity reflected on our audited financial statements, even if we are required to adopt a fair value basis of accounting for GAAP financial statement purposes in the future. Because these fair value calculations involve significant professional judgment in the application of both observable and unobservable attributes, the calculated fair value of our assets may differ from their actual realizable value or future fair value. Furthermore, no rule or regulation requires that we calculate NAV in a certain way. While we believe our NAV calculation methodologies are consistent with standard industry practices, there is no rule or regulation that requires we calculate NAV in a certain way. As a result, other public, non-listed REITs may use different methodologies or assumptions to determine NAV.
The following valuation methods are used for purposes of calculating our NAV:
•Investments in real property are valued by our independent valuation advisor, and independent third-party appraisal firms using the income approach’s discounted cash flow method. The discounted cash flow method takes into consideration all contractual rent payments over the life of the lease term offset by any capitalized expenditures. Our independent valuation advisor and independent third-party appraisers may supplement the discounted cash flow analysis with a sales comparison approach and the income approach’s direct capitalization method, but typically reconcile exclusively to the discounted cash flow method.
•Investments in real estate debt are valued by an independent debt valuation services firm using the discounted cash flow method. Our independent debt valuation services firm calculates the fair value of loans by considering all relevant calculations and scenarios that a market participant would consider in evaluating the financial instrument. Most loans held as an investment are valued by discounting debt service cash flows using a market yield.
•Investments in real estate-related and other securities consists of investments in CMBS and one U.S. Treasury bond. We classify real estate-related and other securities as trading securities which the Adviser generally values on the basis of publicly available market quotations or at fair value determined in accordance with GAAP. We generally determine the fair value of our investments in real estate-related and other securities by utilizing third-party service providers whenever available.
41
•Liabilities include the fees payable to the Adviser and the Dealer Manager, accounts payable, accrued operating expenses, property-level mortgages, any portfolio-level credit facilities and other liabilities, where applicable. Other than property-level mortgages, we include the cost basis of our liabilities as part of NAV, which approximates fair value. These carrying amounts are meant to reasonably approximate fair value due to the liquid and short-term nature of the instruments. We include as part of NAV the fair value of our property-level mortgages, which are valued monthly by an independent valuation services firm. For most loans valued from the borrower’s perspective, our independent debt valuation services firm utilizes a discounted cash flow analysis in evaluating its fair value conclusions. Additional inputs or adjustments to fair value conclusions may be applicable based on observations of market participant behavior.
At the beginning of each calendar year, the Adviser develops a valuation plan with the objective of having each of our operating properties appraised each quarter, except for newly acquired properties as described below. Each operating property is appraised by an independent third-party appraisal firm other than the independent valuation adviser at least annually, and the independent valuation adviser performs the appraisal for each property that is not subject to such an independent third-party appraisal during any given fiscal quarter for each of the other three fiscal quarters. Our independent valuation advisor and the other independent third-party appraisal firms will take into account customary and accepted financial and commercial procedures and considerations as they deem relevant, which may include, without limitation, the review of documents, materials and information relevant to valuing the property that are provided by the Adviser, such as (i) historical or forecasted operating revenues and expenses of the property; (ii) lease agreements on the property; (iii) the revenues and expenses of the property; (iv) information regarding recent or planned estimated capital expenditures; and (v) any other information relevant to valuing the real estate property. Appraisals are performed in accordance with the Code of Ethics and the Uniform Standards of Professional Appraisal Practices, the real estate appraisal industry standards created by The Appraisal Foundation, or the similar industry standard for the country where the property appraisal is conducted. Each appraisal must be reviewed, approved and signed by an individual with the professional designation of MAI (Member of the Appraisal Institute) or similar designation or, for international appraisals, a public or other certified expert for real estate valuations. Upon conclusion of the appraisal, the independent valuation advisor or the independent third-party appraisal firm prepares a written report with an estimated gross fair value of the property. Any appraisal provided by a firm other than our independent valuation advisor is performed in accordance with our valuation guidelines and is not considered in the Adviser’s valuation of the applicable property until our independent valuation advisor has confirmed the reasonableness of such appraisal.
In accordance with the valuation guidelines, our fund administrator calculates our NAV per share for each class of our common stock as of the last calendar day of each month, using a process that reflects several components (each as described above), including the estimated fair value of (1) each of our properties based upon individual appraisal reports provided quarterly by third party independent valuation firms or our independent valuation advisor, (2) our real estate-related assets for which third-party market quotes are available, (3) our other real estate-related assets, if any, and (4) our other assets and liabilities. The NAV per share for the share classes we are offering to the public may differ because stockholder servicing fees, management fees and the performance participation allocable to a specific class of shares are only included in the NAV calculation for that class.
At the end of each month, before taking into consideration additional issuances of shares of capital stock, share repurchases or class-specific expense accruals for that month, any change in our aggregate NAV (whether an increase or decrease) is allocated among each class of shares based on each class’s relative percentage of the previous aggregate NAV plus issuances of shares that were effective on the first calendar day of such month. The NAV calculation is available generally within 15 calendar days after the end of the applicable month. Changes in our monthly NAV include, without limitation, accruals of our net portfolio income, interest expense, the management fee, any accrued performance participation, distributions, unrealized/realized gains and losses on assets, any applicable organization and offering costs and any expense reimbursements. Changes in our monthly NAV also include material non-recurring events, such as capital expenditures and material property acquisitions and dispositions occurring during the month. Notwithstanding anything herein to the contrary, the Adviser may in its discretion consider material market data and other information that becomes available after the end of the applicable month in valuing our assets and liabilities and calculating our NAV for a particular month. On an ongoing basis, the Adviser will adjust the accruals to reflect actual operating results and the outstanding receivable, payable and other account balances resulting from the accumulation of monthly accruals for which financial information is available.
The Adviser has advanced, and will continue to advance, our organization and offering expenses on our behalf (other than upfront selling commissions, dealer manager fees and stockholder servicing fees) through July 22, 2024, the second anniversary of the commencement of the Offering. We will reimburse the Adviser for such advanced expenses ratably over the 60 months following July 22, 2024. For purposes of calculating our NAV, the organization and offering expenses paid by the Adviser through July 22, 2024 are not recognized as expenses or as a component of equity and reflected in our NAV until we reimburse the Adviser for these expenses. In addition, the operating expenses paid by the Adviser through the earlier of (i) the first date that our NAV reaches $500 million and (ii) December 31, 2024 are not recognized as expenses or as a component of equity and reflected in our NAV until we reimburse the Adviser for these expenses.
42
Following the aggregation of the net asset values of our investments, the addition of any other assets (such as cash on hand) and the deduction of any other liabilities, our fund administrator incorporates any class-specific adjustments to our NAV, including additional issuances and repurchases of our common stock and accruals of class-specific stockholder servicing fees, management fees and any accrued performance participation. For each applicable class of shares, each of the stockholder servicing fee and the management fee is calculated as a percentage of the aggregate NAV for such class of shares. At the close of business of each record date for any declared distribution, our NAV for each class will be reduced to reflect the accrual of our liability to pay any distribution to our stockholders of record of such class. NAV per share for each class is calculated by dividing such class’s NAV at the end of each month by the number of shares outstanding for that class at the end of such month.
We calculate NAV per share in accordance with the valuation guidelines that have been approved by our board of directors. We believe our NAV is a meaningful supplemental non-GAAP operating metric. The following table provides a breakdown of the major components of our NAV as of September 30, 2023 ($ and shares in thousands):
| | | | |
Components of NAV | | September 30, 2023 | |
Investments in real estate | | $ | 290,185 | |
Investment in real estate debt | | | 16,825 | |
Investments in real estate-related and other securities | | | 2,163 | |
Cash and cash equivalents | | | 23,601 | |
Restricted cash | | | 197 | |
Other assets | | | 457 | |
Debt obligations | | | (112,995 | ) |
Other liabilities | | | (4,014 | ) |
Accrued performance participation allocation | | | (212 | ) |
Stockholder servicing fees payable the following month(1) | | | — | |
Non-controlling interests in joint ventures | | | (7,898 | ) |
JPMIM mandatorily redeemable instruments(2) | | | (97,079 | ) |
Net asset value | | $ | 111,230 | |
Number of outstanding shares | | | 10,351 | |
(1) Stockholder servicing fees only apply to Class D, Class S and Class T shares. For purposes of NAV, we recognize the stockholder servicing fee as a reduction of NAV on a monthly basis as such fee is paid. Under GAAP, we accrue the full cost of the stockholder servicing fee as an offering cost at the time we sell Class D, Class S and Class T shares. As of September 30, 2023, we had accrued under GAAP $0.04 million of stockholder servicing fees.
(2) Represents Class E Shares and Class E units in the Operating Partnership held by the Adviser that are mandatorily redeemable and only subject to delays to the continuous obligation to ultimately redeem the Class E shares and units once sufficient availability exists under the share repurchase agreements. Therefore, the Class E shares and Class E units held by JPMIM are classified as a liability pursuant to ASC 480 Distinguishing Liabilities From Equity and are presented as mandatorily redeemable instruments at the initial funding amount received, which is equivalent to fair value at the issuance dates. Subsequently, the Mandatorily Redeemable Instruments are carried at their cash redemption value as if the units were repurchased or redeemable at the reporting date, which equals NAV per Class E share and Class E unit of $10.93.
The following table provides a breakdown of our total NAV and NAV per share by share class as of September 30, 2023 ($ and shares in thousands except per share data):
| | | | | | | | | | | | | | | | | | | | | | | | |
NAV Per Share | | Class D
Shares | | | Class I
Shares | | | Class S
Shares | | | Class T
Shares | | | Class E
Shares | | | Total | |
Net asset value attributable to common stockholders | | $ | 3,392 | | | $ | 45,634 | | | $ | 587 | | | $ | — | | | $ | 61,617 | | | $ | 111,230 | |
Number of outstanding shares | | | 324 | | | | 4,334 | | | | 54 | | | | — | | | | 5,640 | | | | 10,351 | |
NAV Per Share | | $ | 10.48 | | | $ | 10.53 | | | $ | 10.90 | | | $ | — | | | $ | 10.93 | | | | |
Set forth below are the weighted averages of the key assumptions in the discounted cash flow methodology used in the September 30, 2023 valuations, based on property types.
| | | | | | | | |
Property Type | | Discount Rate | | | Exit Capitalization Rate | |
Multifamily | | | 6.56 | % | | | 5.13 | % |
Industrial | | | 7.25 | % | | | 5.55 | % |
43
These assumptions are determined by our independent valuation advisor and reviewed by the Adviser. A change in these assumptions would impact the calculation of the value of our property investments. For example, assuming all other factors remain unchanged, the changes listed below would result in the following effects on our investment values:
| | | | | | | | | | |
Input | | Hypothetical Change | | Industrial Investment Values | | | Multifamily Investment Values | |
Discount Rate | | 0.25% decrease | | | 1.90 | % | | | 2.05 | % |
(Weighted average) | | 0.25% increase | | | (2.01 | )% | | | (1.89 | )% |
Exit Capitalization Rate | | 0.25% decrease | | | 3.07 | % | | | 3.22 | % |
(Weighted average) | | 0.25% increase | | | (2.75 | )% | | | (2.97 | )% |
The following table reconciles stockholders’ equity per our Consolidated Balance Sheet to our NAV ($ in thousands):
| | | | |
Reconciliation of Stockholders’ Equity to NAV | | September 30, 2023 | |
Stockholders’ equity under GAAP | | $ | 84,641 | |
Adjustments: | | | |
Organization, offering costs and operating expenses(1) | | | 10,048 | |
Accrued stockholder servicing fees(2) | | | 37 | |
Unrealized real estate appreciation(3) | | | 9,131 | |
Accumulated depreciation and amortization(4) | | | 7,582 | |
Straight-line rent receivable(5) | | | (209 | ) |
NAV | | $ | 111,230 | |
(1) The Adviser has agreed to advance our organization and offering expenses on our behalf (other than upfront selling commissions and stockholder servicing fees) through the second anniversary of the commencement of the Offering. We will reimburse the Adviser for such advanced expenses ratably over the 60-months following July 22, 2024, the second anniversary of the commencement of the Offering. In addition, the Adviser has agreed to advance on our behalf certain of our operating expenses through the earlier of (i) the first date that our NAV reaches $500 million and (ii) December 31, 2024 at which point we will reimburse the Adviser for all such advanced expenses ratably over the 60 months following such date. Under GAAP, organization costs are expensed as incurred and offering costs are charged to equity as such amounts are incurred. For the purposes of calculating NAV, such costs will be recognized as a reduction to NAV as they are reimbursed ratably over the 60 month reimbursement period.
(2) Stockholder servicing fees only apply to Class D, Class S and Class T shares. For purposes of NAV, we recognize the stockholder servicing fee as a reduction of NAV on a monthly basis as such fee is paid. Under GAAP, we accrue the full cost of the stockholder servicing fee as an offering cost at the time we sell Class D, Class S and Class T shares.
(3) Our investments in real estate are presented under historical cost in our GAAP consolidated financial statements. As such, any changes in the fair market value of our investments in real estate are not included in our GAAP results. For purposes of determining our NAV, our investments in real estate are recorded at fair value.
(4) In accordance with GAAP, we depreciate our investments in real estate and amortize certain other assets and liabilities. Such depreciation and amortization is not recorded for purposes of determining our NAV.
(5) We record straight-line rent in accordance with GAAP. Any resulting straight-line rent receivable or liability is excluded for purposes of determining our NAV.
Critical Accounting Policies
The preparation of the financial statements in accordance with GAAP involves significant judgments and assumptions and requires estimates about matters that are inherently uncertain. These judgments will affect our reported amounts of assets and liabilities and our disclosure of contingent assets and liabilities at the dates of the financial statements and the reported amounts of revenue and expenses during the reporting periods. With different estimates or assumptions, materially different amounts could be reported in our financial statements.
Purchase price allocation of acquired investments in real estate
Upon the acquisition of a property, we assess the fair value of acquired tangible and intangible assets and liabilities (including land, buildings, tenant improvements, above-market and below-market leases, acquired in-place leases, other identified intangible assets and assumed liabilities) and allocate the purchase price to the acquired assets and assumed liabilities on a relative fair value basis in accordance with Accounting Standard Codification 805, Business Combinations. All expenses related to the acquisition are capitalized and allocated among the identified assets. Generally, the most significant portion of the allocation is to the building and land and requires the use of market-based estimates and assumptions.
We assess and consider fair value based on estimated cash flow projections that utilize appropriate discount and/or capitalization rates, as well as other available market information. Estimates of future cash flows are based on a number of factors including the historical operating results, known and anticipated trends, and market and economic conditions. The fair value of the tangible assets of an acquired property considers the value of the property as if it were vacant.
44
Acquired above-market and below-market leases are recorded at their fair values (using a discount rate which reflects the risks associated with the leases acquired) equal to the difference between (1) the contractual amounts to be paid pursuant to each in-place lease and (2) management’s estimate of fair market lease rates for each corresponding in-place lease, measured over a period equal to the remaining term of the lease for above-market leases and the initial term plus the term of any below-market fixed rate renewal options for below-market leases. Other intangible assets acquired include amounts for in place lease values that are based on our evaluation of the specific characteristics of each tenant’s lease. Factors to be considered include estimates of carrying costs during hypothetical expected lease-up periods considering current market conditions, and costs to execute similar leases. In estimating carrying costs, we include real estate taxes, insurance and other operating expenses and estimates of lost rentals at market rates during the expected lease-up periods, depending on local market conditions. In estimating costs to execute similar leases, we consider leasing commissions, legal and other related expenses. A change in any of the assumptions above, which are subjective, could have a material impact on our results of operations.
The allocation of the purchase price directly affects the following in our consolidated financial statements:
•the amount of purchase price allocated to the various tangible and intangible assets and liabilities on our Consolidated Balance Sheets;
•the amounts allocated to the value of above-market and below-market lease values are amortized to rental income over the remaining non-cancelable terms of the respective leases. The amounts allocated to all other tangible and intangible assets are amortized to depreciation or amortization expense. Thus, depending on the amounts allocated between land and other depreciable assets, changes in the purchase price allocation among our assets could have a material impact on our net income; and
•the period of time over which tangible and intangible assets are depreciated varies greatly, and thus, changes in the amounts allocated to these assets will have a direct impact on our results of operations. Intangible assets are generally amortized over the respective life of the leases. Also, we depreciate our buildings over a maximum of 40 years, but do not depreciate our land. These differences in timing could have a material impact on our results of operations.
Mandatorily Redeemable Instruments
We report our Mandatorily Redeemable Instruments as a liability on our Consolidated Balance Sheets at JPMIM’s cash redemption value. JPMIM’s cash redemption value is determined based on our NAV per Class E share or Class E unit as of our balance sheet date. For purposes of determining our NAV, our investments in real estate are recorded at fair value based on independent third-party valuations prepared by licensed appraisers in accordance with standard industry practice or in the case of real estate-related and other securities using readily available actively quoted prices.
These fair value estimates of our investments in real estate are particularly important as they are used for the calculation of NAV, which determines the adjustment to the carrying value of our Mandatorily Redeemable Instruments. Significant differences in the fair value of our Mandatorily Redeemable Instruments may result from changes in market conditions that cause our NAV, and thus JPMIM’s redemption value, to increase or decrease during the period which is recorded as a component of mandatorily redeemable instruments interest costs on our Consolidated Statements of Operations.
Investment in real estate debt
Our investment in real estate debt consists of an investment in the Mezzanine Loan. Our investment in real estate debt is carried at fair value as we elected the fair value option. Investments with readily available, actively quoted prices or for which fair value can be measured from actively quoted prices generally will have a higher degree of market price observability and a lesser degree of judgment used in measuring fair value.
Our real estate debt investment is unlikely to have readily available market quotations. As such, we determine fair value by utilizing or reviewing certain of the following (i) market yield data, (ii) discounted cash flow modeling, (iii) collateral asset performance, (iv) local or macro real estate performance, (v) capital market conditions, (vi) debt yield or loan-to-value ratios and (vii) borrower financial condition and performance. We classify these investments as Level 3 within the valuation hierarchy. Judgments used to determine fair value of Level 3 instruments are more significant than those required when determining the fair value of instruments classified as Level 1 or 2 due to the inherent uncertainty of the estimates and judgments used. These values may differ materially from the values that would have been used had a ready market for these investments existed. External factors may cause those values and the values of those investments for which readily observable inputs exists, to increase or decrease over time, impacting the value of our investment which is recorded in income from investments in real estate debt on the Consolidated Statements of Operations.
45
Contractual Obligations
The following table aggregates our contractual obligations and commitments with payments due subsequent to September 30, 2023 ($ in thousands):
| | | | | | | | | | | | | | | | | | | | |
Obligations | | Total | | | Less than 1 year | | | 1-3 years | | | 3-5 years | | | More than 5 years | |
Indebtedness(1) | | $ | 152,157 | | | $ | 1,628 | | | $ | 13,063 | | | $ | 13,051 | | | $ | 124,415 | |
Credit Facility(2) | | | — | | | | — | | | | — | | | | — | | | | — | |
Organizational, offering and operating costs | | | 13,642 | | | | — | | | | 3,361 | | | | 5,457 | | | | 4,824 | |
Mandatorily redeemable instruments(3) | | | 97,079 | | | | — | | | | 97,079 | | | | — | | | | — | |
Total | | $ | 262,878 | | | $ | 1,628 | | | $ | 113,503 | | | $ | 18,508 | | | $ | 129,239 | |
(1) The allocation of our indebtedness includes both principal and interest payments.
(2) The Credit Facility indebtedness includes both principal and interest payments based on the interest rate in effect at September 30, 2023.
(3) We will be required to repurchase Mandatorily Redeemable Instruments owned by JPMIM starting at the earliest of (i) the first date that our NAV reaches $1.5 billion or (ii) July 22, 2025, three years from the commencement of the Offering. See Note 13 — “Mandatorily Redeemable Instruments” to our consolidated financial statement in this Quarterly Report on Form 10-Q.
Off-Balance Sheet Arrangements
We have no off-balance sheet arrangements.
Item 3. Quantitative and Qualitative Disclosures About Market Risk.
Interest rate risk
We are exposed to interest rate risk with respect to our variable-rate indebtedness, whereas an increase in interest rates would directly result in higher interest expense costs. We may seek to manage or mitigate our risk to the exposure of interest risk through interest rate protection agreements to fix or cap a portion of our variable rate debt. As of September 30, 2023, the outstanding principal balance of our variable rate indebtedness was $0.0 million from our Credit Facility, which is indexed to the one-month forward-looking term rate based on SOFR as maintained by CME Group Benchmark Administration Ltd. (the "Reference Rate"). For the three and nine months ended September 30, 2023, a 10% increase the Reference Rate would have resulted in increased interest expense of $0.0 million and $0.05 million, respectively.
We have invested a portion of our portfolio in floating rate investments in real estate debt and real estate-related and other securities and intend to invest in both fixed and floating rate real estate debt investments and securities in the future. On floating-rate investments in real estate debt and real estate-related and other securities, our net income will increase or decrease depending on interest rate movements. For the three and nine months ended September 30, 2023, a 10% decrease in the Reference Rate would have resulted in decreased interest income from our floating rate investments in real estate debt of $0.02 million and $0.06 million, respectively, and a decrease in interest income from our floating rate investments in real estate-related and other securities of less than $0.01 million for both the three and nine months ended September 30, 2023. Additionally, interest rate movement can impact the valuation of real estate debt and real estate-related and other securities depending on various aspects of the instrument, including, but not limited to, the credit rating, duration and structure of the interest rate payments.
Market risk
Market risk is the adverse effect on the value of a financial instrument that results from a change in interest rates. The market risk associated with interest-rate contracts is managed by establishing and monitoring parameters that limit the types and degree of market risk that may be undertaken. With regard to variable rate financing, we will assess our interest rate cash flow risk by continually identifying and monitoring changes in interest rate exposures that may adversely impact expected future cash flows and by evaluating hedging opportunities. We will maintain risk management control systems to monitor interest rate cash flow risk attributable to both our outstanding and forecasted debt obligations as well as our potential offsetting hedge positions. While this hedging strategy will be designed to minimize the impact on our net income from changes in interest rates, the overall returns on your investment may be reduced.
Credit risk
We are exposed to credit risk with respect to the tenants that occupy properties we own. To mitigate this risk, we undertake a credit evaluation of major tenants prior to making an investment. This analysis includes extensive due diligence of a potential tenant’s creditworthiness and business, as well as an assessment of the strategic importance of the property to the tenant’s core business operations.
46
Additionally, we are exposed to credit risk in the real estate-related debt investments that we make with respect to a borrower’s ability to make required interest and principal payments on scheduled due dates. We manage this risk by conducting a credit analysis prior to making an investment and by actively monitoring our portfolio and the underlying credit quality. In addition, we re-evaluate the credit risk inherent in our investments on a regular basis under fundamental considerations such as gross domestic product, unemployment, interest rates, retail sales, store closing/openings, corporate earnings, housing inventory, affordability and regional home price trends.
Real estate market value risk
Real estate property values are subject to volatility and may be adversely affected by a number of factors, including but not limited to national, regional and local economic conditions (which may be adversely affected by industry slowdowns and other factors); local real estate conditions; changes or continued weakness in specific industry segments; construction quality, age and design; demographic factors; and retroactive changes to building or similar codes.
Item 4. Controls and Procedures.
Evaluation of Disclosure Controls and Procedures
An evaluation of the effectiveness of the design and operation of our “disclosure controls and procedures” (as defined in Rule 13a-15(e) under the Securities Exchange Act of 1934, as amended (the “Exchange Act”)), as of the end of the period covered by this Quarterly Report on Form 10-Q was made under the supervision and with the participation of our management, including our Chief Executive Officer (“CEO”) and Chief Financial Officer (“CFO”). Based upon this evaluation, our CEO and CFO have concluded that our disclosure controls and procedures (a) are effective to ensure that information required to be disclosed by us in reports filed or submitted under the Exchange Act is recorded, processed, summarized and reported within the time periods specified by SEC rules and forms and (b) include, without limitation, controls and procedures designed to ensure that information required to be disclosed by us in reports filed or submitted under the Exchange Act is accumulated and communicated to our management, including our CEO and CFO, as appropriate to allow timely decisions regarding required disclosure.
Changes in Internal Controls over Financial Reporting
There have been no changes in our “internal control over financial reporting” (as defined in Rule 13a-15(f) of the Exchange Act) that occurred during the period covered by this Quarterly Report on Form 10-Q that have materially affected, or are reasonably likely to materially affect, our internal control over financial reporting.
47
PART II—OTHER INFORMATION
Item 1. Legal Proceedings.
The Company is not currently involved in any material litigation.
Item 1A. Risk Factors.
In addition to the other information set forth in this report, you should carefully consider the risk factors discussed in Part I, Item1A,"Risk Factors" of our Annual Report on Form 10-K for the year ended December 31, 2022 ("2022 Form 10-K") and Part I, Item 1A of our Quarterly Report on Form 10-Q for the quarterly period ended June 30, 2023 ("2023 Q2 Form 10-Q"), which could materially affect our business, financial condition, and/or future results. The risks described in our 2022 Form 10-K and 2023 Q2 Form 10-Q are not the only risks facing us. Additional risks and uncertainties not currently known to us or that we currently deem to be immaterial also may materially adversely affect our business, financial condition, and/or operating results. There have been no material changes to the risk factors disclosed in our 2022 Form 10-K and our 2023 Q2 Form 10-Q.
Item 2. Unregistered Sales of Equity Securities and Use of Proceeds.
Unregistered sales of equity securities
On September 1, 2023, we issued 196,388 and 203,283 of unregistered Class E and Class I shares at a price per share of $10.90 and $10.53 to accredited investors in a private placement for an aggregate purchase price of $2.1 million and $2.1 million, respectively.
On September 1, 2023, pursuant to our distribution reinvestment plan, we issued 1,488 and 648.466 Class E and Class I shares at a price per share of $10.90 and $10.53 to accredited investors for an aggregate purchase price of $0.02 million and $0.01 million, respectively.
The transactions described above were exempt from the registration provisions of the Securities Act of 1933, as amended, by virtue of Section 4(a)(2) and Regulation D thereof because they were not part of any public offering and did not involve any general solicitation or general advertising.
Share repurchase plan
We adopted a share repurchase plan, whereby on a monthly basis, stockholders may request that we repurchase all or any portion of their shares. We may choose to repurchase all, some or none of the shares that have been requested to be repurchased at the end of any particular month, in its discretion, subject to any limitations in the share repurchase plan. The total amount of aggregate repurchases of Class T, Class S, Class D, Class E, and Class I shares is limited to 2% of the aggregate NAV per month and 5% of the aggregate NAV per calendar quarter. Shares are repurchased at a price equal to the transaction price on the applicable repurchase date, subject to any early repurchase deduction. Shares that have not been outstanding for at least one year are repurchased at 98% of the transaction price. In the event we determine to repurchase some but not all of the shares submitted for repurchase during any month, shares submitted for repurchase during such month will be repurchased on a pro rata basis based on the amount requested after we have repurchased all shares for which repurchase was requested due to death, disability or divorce and other limited exceptions. All unsatisfied repurchase requests must be resubmitted after the start of the next month or quarter, or upon the recommencement of the share repurchase plan, as applicable. Due to the illiquid nature of investments in real estate, we may not have sufficient liquid resources to fund repurchase requests and has established limitations on the amount of funds we may use for repurchase during any calendar month and quarter.
During the three months ended September 30, 2023, we repurchased shares of our common stock in the following amounts, which represented all of the share repurchase requests received for the same period.
| | | | | | | | | | | | | | | |
Period | Total number of shares (or Units) repurchased | | Repurchases as a percentage of NAV | | Average Price Paid Per Share (or Unit) | | Total Number of Shares (or Units) Repurchased as Part of Publicly Announced Plans or Programs | | Maximum Number (or Approximate Dollar Value) of Shares (or Units) that May Yet be Repurchased Under the Publicly Announced Plans or Programs | |
July 2023 | | — | | | — | | $ | — | | | — | | | — | |
August 2023 | | 9,352 | | | 0.05 | % | | 10.53 | | | 9,352 | | | — | |
September 2023 | | — | | | — | | | — | | | — | | | — | |
48
Use of proceeds
On July 22, 2022, our Registration Statement on Form S-11 (File No. 333-265588), covering our public offering of up to $5 billion of common stock, was declared effective under the Securities Act. The offering price for each class of our common stock is determined monthly and is made available on our website and in prospectus supplement filings.
As of September 30, 2023, we received gross proceeds of $42.4 million from the Offering. The following table presents information about the Offering and use of proceeds therefrom ($ in thousands):
| | | | | | | | | | | | | | | | | | | | |
| | Class D
Shares | | | Class I
Shares | | | Class S
Shares | | | Class T
Shares | | | Total | |
Offering proceeds: | | | | | | | | | | | | | | | |
Shares sold(1) | | | 324 | | | | 3,726 | | | | 54 | | | | — | | | | 4,104 | |
Gross offering proceeds | | $ | 3,376 | | | $ | 38,452 | | | $ | 601 | | | $ | — | | | $ | 42,429 | |
Selling commissions and other dealer manager fees | | | — | | | | — | | | | (15 | ) | | | — | | | | (15 | ) |
Accrued stockholder servicing fees | | | — | | | | — | | | | (37 | ) | | | — | | | | (37 | ) |
Net offering proceeds | | $ | 3,376 | | | $ | 38,452 | | | $ | 549 | | | $ | — | | | $ | 42,377 | |
(1) Shares sold includes shares issued under our distribution reinvestment plan.
As of September 30, 2023, we had primarily used the net proceeds from the unregistered sales along with the proceeds received from the Offering toward the acquisition of $277.5 million of real estate, an investment in real estate debt of $16.8 million and investments of $2.1 million in real estate-related and other securities. In addition to the net proceeds from the Offering, we financed our investments with $21.3 million of financing from the Credit Facility, which was subsequently repaid in full, and $113.6 million from mortgage notes, including an assumed loan of $28.2 million. In addition, we may from time to time use proceeds from the Offering to pay down our Credit Facility if there are no acquisitions at the time proceeds are received. See Item 2—“Management’s Discussion and Analysis of Financial Condition and Results of Operations— Liquidity and Capital Resources” for additional details on our borrowings.
Item 3. Defaults Upon Senior Securities.
None.
Item 4. Mine Safety Disclosures.
Not applicable.
Item 5. Other Information.
Unregistered sales of equity securities
On October 2, 2023, we issued 57,405 and 59,487 of unregistered Class E and Class I shares of common stock at a price per share of $10.89 and $10.51 to accredited investors in a private placement for an aggregate purchase price of $0.6 million and $0.6 million, respectively.
On October 2, 2023, pursuant to our distribution reinvestment plan, we issued 1,969 and 1,091 Class E and Class I shares at a price per share of $10.89 and $10.51 to accredited investors for an aggregate purchase price of $0.02 million and $0.01 million, respectively.
On November 1, 2023, we issued 65,671 and 68,148 of unregistered Class E and Class I shares of common stock at a price per share of $10.93 and $10.53 to accredited investors in a private placement for an aggregate purchase price of $0.7 million and $0.7 million, respectively.
On November 1, 2023, pursuant to our distribution reinvestment plan, we issued 2,173 and 1,308 Class E and Class I shares at a price per share of $10.93 and $10.53 to accredited investors for an aggregate purchase price of $0.02 million and $0.01 million, respectively.
On November 9, 2023, we issued 802,812 of unregistered Class E shares of common stock at a price per share of $10.93 to accredited investors in a private placement for an aggregate purchase price of $8.8 million.
The transactions described above were exempt from the registration provisions of the Securities Act of 1933, as amended, by virtue of Section 4(a)(2) and Regulation D thereof as they were not part of any public offering and did not involve any general solicitation or general advertising.
49
Item 6. Exhibits.
Furnish the exhibits required by Item 601 of Regulation S-K (§ 229.601 of this chapter).
| | |
Exhibit Number |
| Description |
3.1 | | Articles of Amendment and Restatement of J.P. Morgan Real Estate Income Trust, Inc., dated June 2, 2022 (filed as Exhibit 3.1 to the Registrant’s Registration Statement on Form S-11 (File No. 333-265588) filed on June 14, 2022 and incorporated herein by reference). |
3.2 | | Certificate of Correction of Articles of Amendment and Restatement of J.P. Morgan Real Estate Income Trust, Inc., dated June 2, 2022 (filed as Exhibit 3.2 to the Registrant’s Registration Statement on Form S-11 (File No. 333-265588) filed on June 14, 2022 and incorporated herein by reference). |
3.3 | | Bylaws of J.P. Morgan Real Estate Income Trust, Inc. (filed as Exhibit 3.3 to the Registrant’s Registration Statement on Form S-11 (File No. 333-265588) filed on June 14, 2022 and incorporated herein by reference). |
10.1 | | First Amendment to Revolving Credit Agreement dated August 25, 2023, by and among J.P. Morgan REIT Operating Partnership, L.P., J.P. Morgan Real Estate Income Trust, Inc. and U.S. Bank National Association (filed as Exhibit 10.1 to the Registrant’s Current Report on Form 8-K filed on August 30, 2023 and incorporated herein by reference). |
31.1* |
| Certification of Principal Executive Officer Pursuant to Rules 13a-14(a) and 15d-14(a) under the Securities Exchange Act of 1934, as Adopted Pursuant to Section 302 of the Sarbanes-Oxley Act of 2002. |
31.2* |
| Certification of Principal Financial Officer Pursuant to Rules 13a-14(a) and 15d-14(a) under the Securities Exchange Act of 1934, as Adopted Pursuant to Section 302 of the Sarbanes-Oxley Act of 2002. |
32.1** |
| Certification of Principal Executive Officer Pursuant to 18 U.S.C. Section 1350, as Adopted Pursuant to Section 906 of the Sarbanes-Oxley Act of 2002. |
32.2** |
| Certification of Principal Financial Officer Pursuant to 18 U.S.C. Section 1350, as Adopted Pursuant to Section 906 of the Sarbanes-Oxley Act of 2002. |
101.INS |
| Inline XBRL Instance Document – the instance document does not appear in the Interactive Data File because XBRL tags are embedded within the Inline XBRL document. |
101.SCH | | Inline XBRL Taxonomy Extension Schema Document |
101.CAL | | Inline XBRL Taxonomy Extension Calculation Linkbase Document |
101.DEF | | Inline XBRL Taxonomy Extension Definition Linkbase Document |
101.LAB | | Inline XBRL Taxonomy Extension Label Linkbase Document |
101.PRE | | Inline XBRL Taxonomy Extension Presentation Linkbase Document |
104 | | Cover Page Interactive Data File (embedded within the Inline XBRL document) |
| | |
* Filed herewith.
** Furnished herewith.
50
SIGNATURES
Pursuant to the requirements of the Securities Exchange Act of 1934, the registrant has duly caused this report to be signed on its behalf by the undersigned thereunto duly authorized.
| | | |
|
| J.P. Morgan Real Estate Income Trust, Inc. |
|
|
|
|
Date: November 9, 2023 |
| By: | /s/ Michael P. Kelly |
|
|
| Michael P. Kelly |
|
|
| Chairperson of the Board and Chief Executive Officer |
|
|
|
|
Date: November 9, 2023 |
| By: | /s/ Lawrence A. Goodfield, Jr. |
| | | Lawrence A. Goodfield, Jr. |
| | | Chief Financial Officer and Treasurer |
51